Sickle Cell Anemia: A Case Study Approach to Teaching High School Genetics Developers : Jeanne Ting Chowning (original author and creator) Northwest Association for Biomedical Research Megan Brown, Ph.D. & Maureen Munn, Ph.D. (revisions and additions) Education Outreach Department of Genome Sciences University of Washington Contents: • Sickle Cell Anemia Case Study: Summary • Sickle Cell Anemia and Genetics: Background Information • Sickle Cell Disease at the Molecular Level: Questions and Translation Practice Worksheet • Sickle Cell Anemia: Diagnosis Using Simulated Restriction Analysis of DNA. PreLab Reading and Questions • Sickle Cell Disease Diagnosis Lab. Student Instructions and Questions • Sickle Cell Anemia Lab: Diagnosis Using Simulated Restriction Analysis of DNA. Teacher Information • Sickle Cell Anemia: Modeling RFLP Diagnosis (Teacher Directions) • Exploring Sickle Cell Disease, Student information & datasheet • Allele Frequencies and Sickle Cell Anemia Lab. Student instructions • Using AlleleA1 Program to Mimic the Sickle Cell Bean Activity • A Few Sickle Cell Resources Download this document at: http://chroma.gs.washington.edu/outreach/genetics/download.html version: 052107

Welcome message from author
This document is posted to help you gain knowledge. Please leave a comment to let me know what you think about it! Share it to your friends and learn new things together.
Transcript
Sickle Cell Anemia: A Case Study Approach to Teaching High School Genetics Developers : Jeanne Ting Chowning (original author and creator) Northwest Association for Biomedical Research Megan Brown, Ph.D. & Maureen Munn, Ph.D. (revisions and additions) Education Outreach Department of Genome Sciences University of Washington
Contents: • Sickle Cell Anemia Case Study: Summary • Sickle Cell Anemia and Genetics: Background Information • Sickle Cell Disease at the Molecular Level: Questions and Translation Practice
Worksheet • Sickle Cell Anemia: Diagnosis Using Simulated Restriction Analysis of DNA.
PreLab Reading and Questions • Sickle Cell Disease Diagnosis Lab. Student Instructions and Questions • Sickle Cell Anemia Lab: Diagnosis Using Simulated Restriction Analysis of
DNA. Teacher Information • Sickle Cell Anemia: Modeling RFLP Diagnosis (Teacher Directions) • Exploring Sickle Cell Disease, Student information & datasheet • Allele Frequencies and Sickle Cell Anemia Lab. Student instructions • Using AlleleA1 Program to Mimic the Sickle Cell Bean Activity • A Few Sickle Cell Resources Download this document at: http://chroma.gs.washington.edu/outreach/genetics/download.html version: 052107
http://gsoutreach.gs.washington.edu Genome Sciences Education Outreach, University of Washington
2
Sickle Cell Anemia Case Study: Summary Teacher: Jeanne Ting Chowning, Teacher Grade Level: 10-12 Summary: Sickle cell anemia is an example of a genetic disease that can serve as a vehicle for teaching many biology concepts. Using a case study approach, opportunities arise to make connections not only to various aspects of genetics and molecular biology, but to physiology, evolution, and societal and ethical issues as well. Instructional Materials (included with this Case Study): • Sickle Cell Anemia and Genetics: Background Information. • Allele Frequencies and Sickle Cell Anemia Lab. Student instructions, data sheet, analysis
questions, overhead master. • Sickle Cell Disease at the Molecular Level: Questions and Translation Practice Worksheet. • Sickle Cell Lab: Diagnosis Using Simulated Restriction Analysis of DNA. --PreLab reading and questions --Student instructions and questions --Teacher information List of Classroom Activities: • Mystery of the Crooked Cell PreLab Activities (includes viewing slides of normal and
sickled red blood cells). • Viewing Blood is Life video. • Sickle Cell Disease at the Molecular Level: Questions and Translation Practice Worksheet. • Sickle Cell Anemia: Diagnosis Using Simulated Restriction Analysis of DNA. • Viewing Children by Design video. • Bioethical Decision-Making. • Allele Frequencies and Sickle Cell Anemia Lab. Description: Before beginning the unit, briefly review the circulatory system and the normal functions of its components, which were covered earlier in the semester. Then begin the sickle cell unit with the prelab activities described in “Mystery of the Crooked Cell.” Students are presented with the symptoms of a patient with an “unknown” disease and must hypothesize its cause after completing four 10–20 minute prelab exercises, which include: examining slides of diseased and normal red blood cells (RBCs), modeling the occlusion of capillaries by sickled RBCs with hands-on manipulatives, using balloons and beads to build simple models of RBCs containing either normal or mutant hemoglobin, and determining the inheritance pattern of the disease based on the patient’s family history. Extending the analysis of blood and hemoglobin in the prelab activities, students view the three-dimensional structure of hemoglobin on the Internet. Students watch Blood is Life, a video that teaches about blood from the perspective of a young school teacher with sickle cell
http://gsoutreach.gs.washington.edu Genome Sciences Education Outreach, University of Washington
3
anemia. Students complete the Sickle Cell Disease at the Molecular Level: Questions and Translation Practice Worksheet, which reviews key concepts in the video and provides practice in conceptual transcription and translation of the β globin gene, both normal and mutant. Sickle cell disease provides a clear example of how changes in DNA can result in an altered protein. Dry labs or exercises such as the Translation Practice Worksheet can be used to illustrate this connection. How can the disease be diagnosed? How can people with a family history of the disease learn whether they carry the trait? Discuss how the answers to these questions can be found by using restriction enzymes to analyze the DNA that codes for β globin and how hemoglobin itself can be analyzed by protein electrophoresis. Students can simulate a restriction analysis of wildtype and mutant β globin genes by eletrophoresing dyes through an agarose gel, as described in Sickle Cell Anemia: Diagnosis Using Simulated Restriction Analysis of DNA. These activities lead naturally to the topic of genetic testing and a discussion of the ethical concerns that surround such testing. Use current newspaper and magazine articles related to genetics issues to get students thinking and stimulate discussion. Or watch one of several videos that deal with these issues, such as Children By Design, which includes segments on genetic testing, gene therapy, and medical selection of disease-free early embryos for implantation. To make decisions about genetics-related ethical issues, such as denying a person insurance coverage or employment based on his or her genotype, an ethical decision-making model like that developed by the Hastings Center can be used (see references). Sickle cell anemia, which is inherited as an autosomal codominant, also provides the opportunity to discuss classical Mendelian genetics. Further connections can be made to meiosis, gamete formation, and environmental influences that can affect phenotype. Lastly, sickle cell anemia provides an outstanding opportunity to build a connection between genetics and evolution. Students learn the mechanisms by which allele frequencies in a population change over time in response to selective forces (such as malaria) by using laboratory simulations and analyzing disease distribution data. In the Allele Frequencies and Sickle Cell Anemia Lab, students randomly draw red and white beans from “gene pool” containers to model the changes in β globin allele frequencies in a population in response to the selective pressure of malaria. Genetics Concepts: A number of genetics concepts are covered by state and national science standards. This unit addresses the following concepts: • Classical Genetics/Central Dogma:
Genotype gives rise to phenotype. The two inherited alleles for a gene determine the phenotype for the trait. The DNA information provides instructions for building proteins.
• Molecular Biology The genetic information is encoded in DNA.
• Evolution:
http://gsoutreach.gs.washington.edu Genome Sciences Education Outreach, University of Washington
4
Changes in DNA, or mutations, cause new alleles to arise, leading to variation among organisms within a population.
• Applications: Genetics research has applications in many different fields.
• Ethics: Genetics research raises many ethical, legal, and social issues.
References: *“Teaching Biology Around Themes: Teach Proteins and DNA Together,” S. Offner, American Biology Teacher 54, #2 (1992). *“Making the Chromosome-Gene-Protein Connection,” C. Mulvihill, American Biology Teacher 58, #6 (1996). *“Mystery of the Crooked Cell: An Investigation and Laboratory Activity About Sickle-Cell Anemia,” D. A. DeRosa and B. L. Wolfe, American Biology Teacher 61, #2, 137-148. Slides of normal and sickled red blood cells. Order from Triarch Inc. (800-848-0810). Three-dimensional Hemoglobin on the Internet. (Requires the Chime plug-in.) http://info.bio.cmu.edu/Courses/BiochemMols/BuildBlocks/Hb.html. Blood is Life. 45 min. video. Order from Films for the Humanities & Sciences (800-257-5126). Children By Design. Video, Secret of Life series. New Choices, New Responsibilities: Ethical Issues in the Life Sciences. B. Jennings, K. Nolan, C. Campbell, S. Donnelley, E. Parens, L. Turner, E. DeVaro, 1997. Decision-making framework for bioethical issues. Note: a review of this resource and ordering information can be found at: http://genetics-education-partnership.mbt.washington.edu/rev/resource_reviews/newch.html. A brief description of the decision making template can be found at: http://genetics-education-partnership.mbt.washington.edu/Cool/tools/ethics.html. *Note: American Biology Teacher has agreed to send out reprints of these articles upon request. To contact ABT, visit their website at: http://www.nabt.org/publications_journals.html.
http://gsoutreach.gs.washington.edu Genome Sciences Education Outreach, University of Washington
5
Sickle Cell Anemia and Genetics: Background Information Background information to accompany the labs: Allele Frequencies and Sickle Cell Anemia Lab and Sickle Cell Anemia: Diagnosis Using Restriction Analysis of DNA Genetics of Sickle Cell Anemia Sickle cell anemia was the first genetic disease to be characterized at the molecular level. The mutation responsible for sickle cell anemia is small—just ONE nucleotide of DNA out of the three billion in each human cell. Yet it is enough to change the chemical properties of hemoglobin, the iron and protein complex that carries oxygen within red blood cells. There are approximately 280 million hemoglobin molecules in each red blood cell (RBC). The protein portion of hemoglobin consists of four globin subunits: two alpha (α) and two beta (β). These two types of subunits are encoded by the α and β globin genes, respectively. While the binding of oxygen actually occurs at the iron sites, all four globin chains must work together in order for the process to function well. Sickle cell anemia, also known as sickle cell disease, is caused by a point mutation in the β globin gene. As a result of this mutation, valine (a non-polar amino acid) is inserted into the β globin chain instead of glutamic acid (an electrically charged amino acid). The mutation causes the RBCs to become stiff and sometimes sickle-shaped when they release their load of oxygen. The sickle cell mutation produces a “sticky” patch on the surface of the β chains when they are not complexed with oxygen. Because other molecules of sickle cell hemoglobin also develop the sticky patch, they adhere to each other and polymerize into long fibers that distort the RBC into a sickle shape. The sickled cells tend to get stuck in narrow blood vessels, blocking the flow of blood. As a result, those with the disease suffer painful “crises” in their joints and bones. They may also suffer strokes, blindness, or damage to the lungs, kidneys, or heart. They must often be hospitalized for blood transfusions and are at risk for a life-threatening complication called acute chest syndrome. Although many sufferers of sickle cell disease die before the age of 20, modern medical treatments can sometimes prolong these individuals’ lives into their 40s and 50s. There are two β globin alleles important for the inheritance of sickle cell anemia: A and S. Individuals with two normal A alleles (AA) have normal hemoglobin, and therefore normal RBCs. Those with two mutant S alleles (SS) develop sickle cell anemia. Those who are heterozygous for the sickle cell allele (AS) produce both normal and abnormal hemoglobin. Heterozygous individuals are usually healthy, but they may suffer some symptoms of sickle cell anemia under conditions of low blood oxygen, such as high elevation. Heterozygous (AS) individuals are said to be “carriers” of the sickle cell trait. Because both forms of hemoglobin are made in heterozygotes, the A and S alleles are codominant. About 2.5 million African-Americans (1 in 12) are carriers (AS) of the sickle cell trait. People who are carriers may not even be aware that they are carrying the S allele!
http://gsoutreach.gs.washington.edu Genome Sciences Education Outreach, University of Washington
6
Sickle Cell Anemia and Malaria In the United States, about 1 in 500 African-Americans develops sickle cell anemia. In Africa, about 1 in 100 individuals develops the disease. Why is the frequency of a potentially fatal disease so much higher in Africa? The answer is related to another potentially fatal disease, malaria. Malaria is characterized by chills and fever, vomiting, and severe headaches. Anemia and death may result. Malaria is caused by a protozoan parasite (Plasmodium) that is transmitted to humans by the Anopheles mosquito. When malarial parasites invade the bloodstream, the red cells that contain defective hemoglobin become sickled and die, trapping the parasites inside them and reducing infection. Compared to AS heterozygotes, people with the AA genotype (normal hemoglobin) have a greater risk of dying from malaria. Death of AA homozygotes results in removal of A alleles from the gene pool. Individuals with the AS genotype do not develop sickle cell anemia and have less chance of contracting malaria. They are able to survive and reproduce in malaria-infected regions. Therefore, BOTH the A and S alleles of these people remain in the population. SS homozygotes have sickle cell anemia, which usually results in early death. In this way, S alleles are removed from the gene pool. In a region where malaria is prevalent, the S allele confers a survival advantage on people who have one copy of the allele, and the otherwise harmful S allele is therefore maintained in the population at a relatively high frequency. This phenomenon will be examined in the Allele Frequencies and Sickle Cell Anemia Lab, which relates the change in allele frequency in a population to evolution. The frequency of the S allele in malaria-infected regions of Africa is 16%. The sickle cell allele is also widespread in the Mediterranean and other areas where malaria is or used to be a major threat to life. In contrast, the S allele frequency is only 4% in the United States, where malaria has been virtually eliminated. Malaria was once common in the United States, but effective mosquito control caused the number of cases to drop. Recently, however, there has been an increase in the number of malarial cases because of increased travel, immigration, and resistance to medication. In Southern California there was a 1986 outbreak of nearly 30 cases of malaria transmitted by local mosquitos! Sickle Cell Anemia and Current Research The oxygen requirements of a fetus differ from those of an adult, and so perhaps not surprisingly, prenatal blood contains a special hemoglobin. Fetal hemoglobin contains two gamma (γ) globin polypeptide chains instead of two adult β chains. After birth, the genes encoding γ globin switch off, and the ones encoding β globin switch on. Understanding how this genetic switch works could allow researchers to understand much about the control of genes in general and sickle cell anemia in particular. Indian and Saudi Arabian people have a milder variation of sickle cell anemia, sometimes with no symptoms. In this population twenty-five percent of each person’s hemoglobin is the
http://gsoutreach.gs.washington.edu Genome Sciences Education Outreach, University of Washington
7
fetal kind. Similarly, the blood of adults with an inherited condition called “hereditary persistence of fetal hemoglobin” also contains fetal hemoglobin and these individuals are healthy. Some people with this condition completely lack adult hemoglobin and still show no ill effects. Biochemical experiments have demonstrated that, in a test tube, fetal hemoglobin inhibits polymerization of sickle cell hemoglobin. These observations suggest that increasing fetal hemoglobin levels may be an effective treatment for sickle cell anemia. There are a number of lines of research related to activation of fetal hemoglobin as a therapy for sickle cell anemia: • Some infants whose mothers suffered from diabetes during pregnancy have unusually high
concentrations of the biochemical butyrate in their blood plasma. Butyrate is a natural fatty acid that stimulates RBCs to differentiate from their precursors (reticulocytes). Butyrate also prevents the γ globin gene from switching off and the β globin gene from switching on in these infants, who are healthy despite lacking adult hemoglobin. When butyrate is given to patients with sickle cell anemia, the γ globin mRNA levels in reticulocytes increase significantly. Perhaps butyrate or other chemicals that stimulate fetal hemoglobin production could be used to treat sickle cell anemia.
• In 1983, a drug called hydroxyurea (HU) was first used on sickle cell patients to try to
activate their fetal globin genes. By 1995, clinical trials had demonstrated that HU could increase fetal hemoglobin levels in patients’ RBCs and prevent the cells from sickling. Patients treated with HU experienced less frequent and severe painful crises. However, hydroxyurea can be quite toxic when used continuously to maintain elevated levels of fetal hemoglobin and can increase the risk of leukemia.
• In 1992, it was found that alternating hydroxyurea with erythropoiten and providing dietary
iron raised the percentage of RBCs with fetal hemoglobin and relieved the joint and bone pain of sickle cell disease. Erythropoiten is made in the kidneys and helps anemic patients replenish their RBCs. It can be manufactured for therapeutic use with recombinant DNA technology.
• Mice that have been genetically engineered to contain a defective human β globin gene have
symptoms typical of sickle cell anemia, making them an ideal model for laboratory experimentation. In 2000, these mice were mated to another transgenic mouse line expressing human fetal hemoglobin. When compared to their sickle cell parents, the offspring had greatly reduced numbers of abnormal and sickled RBCs, increased numbers of RBCs overall (reduced anemia), and longer lifespans. These experiments established that only 9-16% of hemoglobin need be the fetal type in order to ameliorate the sickle cell symptoms, and are an important first step in a gene therapy solution to sickle cell disease.
Disclaimer: As with many “home-grown” resources teachers use in their classrooms, this background material was culled from a variety of sources and has been written, rewritten, and adapted by several people and then passed on to the next user. The exact, original source material is not at
http://gsoutreach.gs.washington.edu Genome Sciences Education Outreach, University of Washington
8
all clear, but some of the references below were used. We apologize if a source has been unwittingly plagiarized. References: Karlsson, S. The first steps on the gene therapy pathway to anti-sickling success. Nature Medicine 6, 139-140, 2000. Blouin, M.-J., Beauchemin, H., Wright, A., De Paepe, M., Sorette, M., Bleau, A.-M., Nakamoto, B., Ou, C.-N., Stamatoyannopoulos, G., and Trudel, M. Genetic correction of sickle cell disease: Insights using transgenic mouse models. Nature Medicine 6, 177-182. Keeton, W., and J. Gould. Biological Science, W.W. Norton and Co., NY, NY, 1986. Leary, W. Sickle Cell Trial Called Success, Halted Early, NY Times, January 31, 1995. pp. B5, B8. Lewis, R. Human Genetics: Concepts and Applications, 3rd ed., pp. 334-335, WCB/McGraw-Hill, Boston, 1999. Lewis, R. Case Workbook in Human Genetics, pp. 113-114, Wm C. Brown Publishers, Dubuque, IA, 1994. Micklos, D., and G. Freyer. DNA Science, Cold Spring Harbor Laboratory Press, Burlington, NC, 1990. Modern Biology Inc. Catalog, Dayton, Indiana, 1995. National Heart, Lung, and Blood Institute. Clinical Alert - Drug Treatment for Sickle Cell Anemia. January 30. 1995. National Heart, Lung, and Blood Institute, http://www.nlm.nih.gov/databases/alerts/sickle_cell.html Pines, M. Blood: The Bearer of Life and Death, Howard Hughes Medical Institute, Chevy Chase, MD, 1993. Tortora, G., B. Funke, and C. Case. Microbiology, Benjamin Cummings Publishing Co., Inc., Redwood City, CA, 1992. Sickle Cell Disease at the Molecular Level: Questions and Translation Practice Worksheet I. Sickle Cell Background After reading the handout Sickle Cell Anemia and Genetics: Background Information and/or completing the Mystery of the Crooked Cell activities, answer the following questions. 1. Describe the symptoms of sickle cell disease. 2. Describe the structure of hemoglobin. (How many chains are there? What types? Why is
iron necessary for blood?) 3. How does sickle hemoglobin differ from normal hemoglobin?
http://gsoutreach.gs.washington.edu Genome Sciences Education Outreach, University of Washington
9
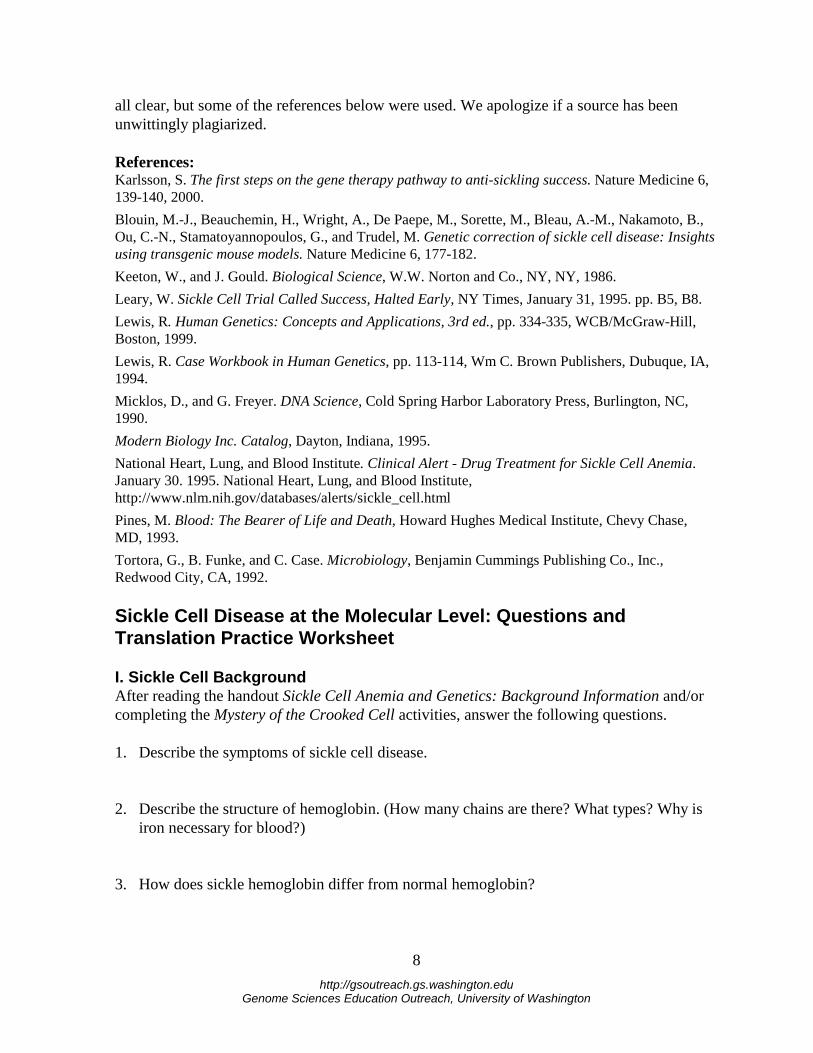
II. Sickle Cell at the Molecular Level In sickle cell anemia, there is a mutation in the gene that encodes the β chain of hemoglobin. Within this gene (located on Chromosome 11), ONE BASE in the DNA is replaced with another base, and this mutation causes the normal amino acid #6 to be replaced by another amino acid. 1. Making a Normal Beta Chain of Hemoglobin The DNA sequence below is the first part of the gene for the β chain of normal hemoglobin. The bottom strand of DNA is copied to make messenger RNA. Step 1: Show the sequence of the mRNA, using the RNA base-pairing rules (same as DNA but use U instead of T). Step 2: Using the Genetic Code chart in your textbook, translate this mRNA into a sequence of amino acids. 5’-GTG CAC CTG ACT CCT GAG GAG template strand → 3’-CAC GTG GAC TGA GGA CTC CTC mRNA sequence → 5’-___ ___ ___ ___ ___ ___ ___ amino acids → ___ ___ ___ ___ ___ ___ ___
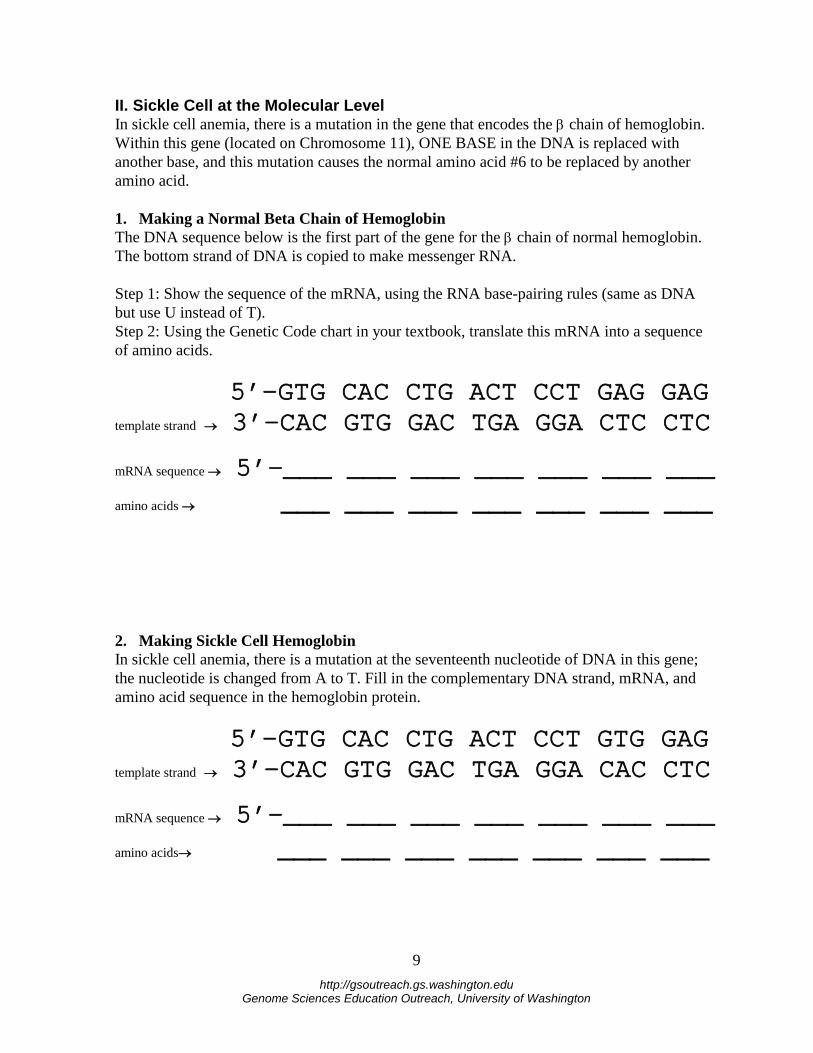
2. Making Sickle Cell Hemoglobin In sickle cell anemia, there is a mutation at the seventeenth nucleotide of DNA in this gene; the nucleotide is changed from A to T. Fill in the complementary DNA strand, mRNA, and amino acid sequence in the hemoglobin protein. 5’-GTG CAC CTG ACT CCT GTG GAG template strand → 3’-CAC GTG GAC TGA GGA CAC CTC mRNA sequence → 5’-___ ___ ___ ___ ___ ___ ___ amino acids→ ___ ___ ___ ___ ___ ___ ___
http://gsoutreach.gs.washington.edu Genome Sciences Education Outreach, University of Washington
10
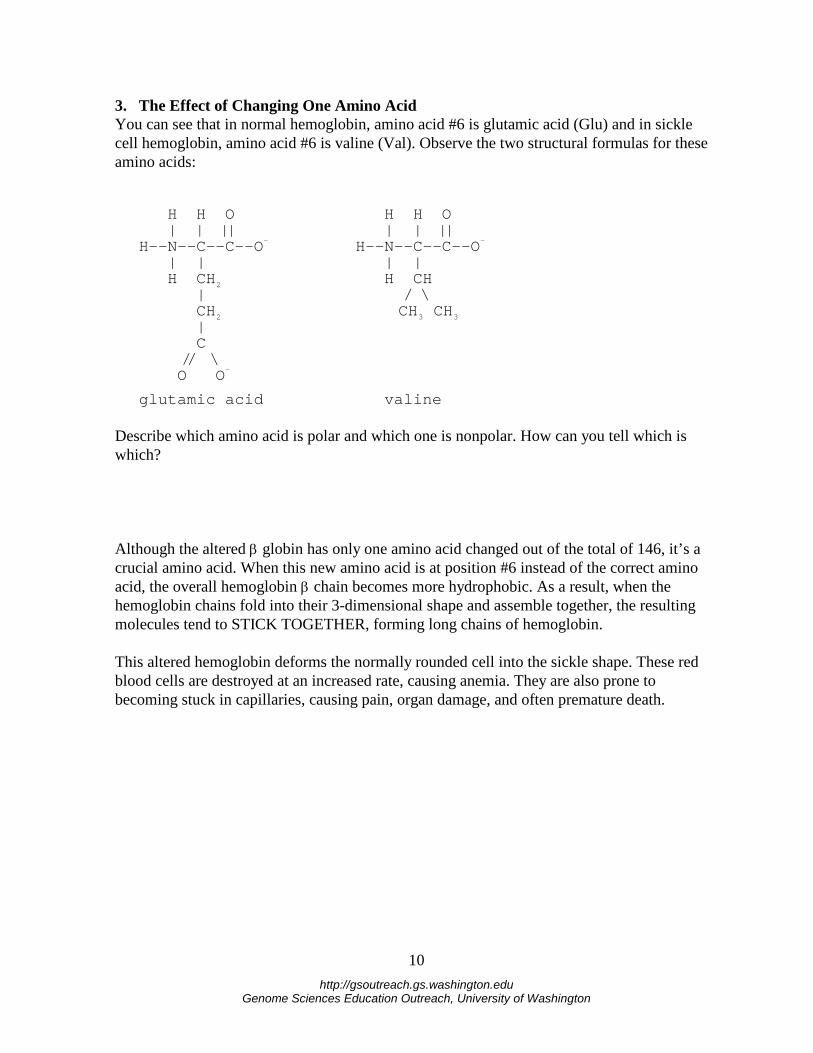
3. The Effect of Changing One Amino Acid You can see that in normal hemoglobin, amino acid #6 is glutamic acid (Glu) and in sickle cell hemoglobin, amino acid #6 is valine (Val). Observe the two structural formulas for these amino acids: H H O | | || H——N——C——C——O | |
-
H CH |
2
CH |
2
C // \ O O
glutamic acid
-
H H O | | || H——N——C——C——O | |
-
H CH / \ CH3 CH
3
valine Describe which amino acid is polar and which one is nonpolar. How can you tell which is which? Although the altered β globin has only one amino acid changed out of the total of 146, it’s a crucial amino acid. When this new amino acid is at position #6 instead of the correct amino acid, the overall hemoglobin β chain becomes more hydrophobic. As a result, when the hemoglobin chains fold into their 3-dimensional shape and assemble together, the resulting molecules tend to STICK TOGETHER, forming long chains of hemoglobin. This altered hemoglobin deforms the normally rounded cell into the sickle shape. These red blood cells are destroyed at an increased rate, causing anemia. They are also prone to becoming stuck in capillaries, causing pain, organ damage, and often premature death.
http://gsoutreach.gs.washington.edu Genome Sciences Education Outreach, University of Washington
11
Summary 1. How does sickle cell hemoglobin differ from normal hemoglobin at the primary level of
protein structure (order of amino acids)? 2. How does sickle cell hemoglobin differ from normal hemoglobin at the fourth level of
protein structure (the sum of all the folded protein chains)? 3. What is the effect on the red cell containing this altered hemoglobin? Genetics review Let A=allele for normal hemoglobin and S=allele for sickle hemoglobin. 1. What inheritance pattern does sickle cell anemia follow? (dominant, recessive, or other?) 2. What is the genotype of someone with sickle cell disease? 3. If a woman with sickle cell disease has a child, what are the chances the child would have
sickle cell anemia if the father was a sickle cell carrier? Show using a Punnett square.
http://gsoutreach.gs.washington.edu Genome Sciences Education Outreach, University of Washington
12
Sickle Cell Anemia: Diagnosis Using Simulated Restriction Analysis of DNA. PreLab Reading and Questions Background, Sickle Cell Anemia: Read the background information provided in the handout, Sickle Cell Anemia and Genetics: Background Information. Background, DNA Restriction Analysis as a Diagnostic Tool: DNA obviously differs from one individual to another. These DNA sequence variations may be due to point mutations, deletions, insertions, and repetitions. DNA sites where more than one sequence variation has been observed are said to be polymorphic regions (or “many-form places”). Alleles of a gene are a familiar example of a polymorphism, for example, the A and S alleles of the β globin gene. Polymorphic sites can be within genes, as for the β globin alleles, but are often found outside of protein coding regions.
If polymorphisms occur at the recognition sites for restriction enzymes, new recognition sites can be created or old sites eliminated. This difference would result in a different pattern of restriction fragments when one person’s DNA is digested with a particular restriction enzyme and compared to a digest of another person’s DNA. The difference in size of a particular DNA fragment from one person to the next is called a RFLP (pronounced “riflip”, meaning “restriction fragment length polymorphism” -whew!) Following restriction enzyme digestion, the DNA fragments are separated by gel electrophoresis. In a technique called Southern Analysis, special probes are then used to bind to these fragments. (A probe is a molecule that can help you find the molecule you are interested in by binding to it. Often, probes are ‘tagged’ with a radioactive label or a non-radioactive dye.) The DNA patterns observed on the gel can be used to identify criminals or settle paternity cases. They can also be used in captive breeding programs of endangered species (e.g., cheetahs and California condors) to identify genetically similar potential parents and avoid inbreeding.
Another use of RFLP analysis is diagnosis of genetic diseases and identification of disease carriers. If a polymorphic site is close to the area responsible for a disease, they are said to be linked. Sometimes the polymorphic region that is capable of being cut with a restriction enzyme is known WITHIN the gene responsible for a disease. This is the case with sickle cell anemia. In 1978, Yuet Wai Kan and Andrees Dozy of the University of California-San Francisco showed that the restriction enzyme Mst II, which cuts normal β globin DNA at a particular site, will not recognize (and therefore will not cut) DNA that contains the sickle cell mutation.
Mst II recognized the sequence CCTNAGG (where N = any nucleotide). Sickle cell disease is due to a single point mutation in the β globin gene on chromosme 11 that changes CCTGAGG to CCTGTGG. Therefore, the A to T mutation that causes sickle cell anemia also causes the loss of the recognition site for the restriction enzyme Mst II!
Thus, the DNA from normal homozygous individuals (AA), heterozygous carriers of the trait (AS), and homozygous sickle cell patients (SS) produces different sizes of restriction
http://gsoutreach.gs.washington.edu Genome Sciences Education Outreach, University of Washington
13
fragments when cut with Mst II. In Southern blot analysis, these RFLPs are detected as characteristic banding patterns, using a radioactive β globin gene probe. PreLab Questions: 1. What are RFLPs and how are they used?
2. How can a restriction enzyme help identify carriers of sickle cell anemia?
3. If a person has sickle cell anemia and his or her beta globin DNA is cut with Mst II, will the fragments be longer or shorter than those from an individual without the disease? Explain!
http://gsoutreach.gs.washington.edu Genome Sciences Education Outreach, University of Washington
14
Sickle Cell Disease Diagnosis Lab Student Instructions and Questions Objective: To simulate the diagnosis of sickle cell anemia with DNA restriction analysis. Background: The “DNA” you will receive has, in this simulation, already been “cut” by the Mst II restriction enzyme. You will separate the resulting fragments of DNA by gel electrophoresis in order to diagnose the genotypes of all members of a family. Families 1 and 2 each have a mother, father, teenager, and fetus. Family 3 has a mother, and her two children, who are fraternal twins. Known samples will also be run for comparison. In this family, the mother’s husband, now deceased, had a brother with sickle cell anemia. DNA and dyes are ‘charged’ molecules that can be separated by gel electrophoresis. The dyes we will use are charged in solution, just as DNA is. They will therefore move from the BLACK cathode (- end) to the RED anode (+ end). (Remember, negatively charged molecules such as DNA “run towards the red.”) Procedure: 1. Get tubes containing the “DNA” samples from your teacher. Record whether you have
Family #1, #2, or #3 in your lab notebook. The tubes are coded as follows (Note: each group will not necessarily receive all tubes shown below).
Mother M Fetus O Father F Known Normal N Teenager T Known Carrier C Twin 1 (Sondra) T1 Known Sickle Cell Patient S Twin 2 (Jason) T2 2. Slide the gel into the box, wells facing up and closest to the black electrode. 3. Using a P-20 micropipet set to 8 µl, load each well in the gel with the samples. Take turns
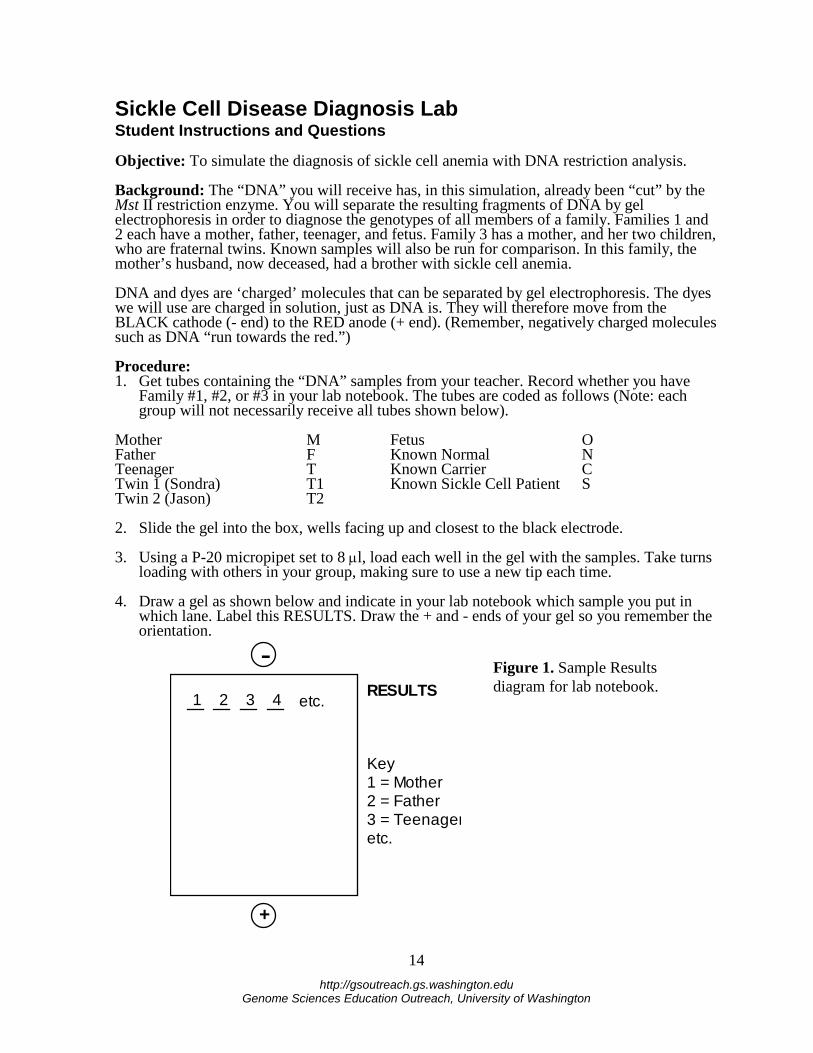
loading with others in your group, making sure to use a new tip each time. 4. Draw a gel as shown below and indicate in your lab notebook which sample you put in
which lane. Label this RESULTS. Draw the + and - ends of your gel so you remember the orientation.
1 2 3 4 etc.
Key1 = Mother2 = Father3 = Teenageretc.
-
+
RESULTS
Figure 1. Sample Results diagram for lab notebook.
http://gsoutreach.gs.washington.edu Genome Sciences Education Outreach, University of Washington
15
5. If necessary, add more 1X TAE Buffer to the gel box so that the gel is adequately covered. (The buffer should cover the gel by about 1-2 mm.) Connect the electrodes to the gel box and to the power supply (red to red, black to black).
6. Turn on the power supply and set it at about 120V. Run the gel for at least 10 minutes.
While your gel is running, make a second drawing of a gel showing what results you expect for the three known samples. Label this PREDICTIONS.
7. Turn off the power supply, unplug the electrodes, and open the gel box. Lift the gel and
deck and slide the gel back into the dish, pouring off extra buffer. For better viewing, place the dish on white paper. Color the pattern observed into your RESULTS drawing.
8. If desired, preserve an image of your gel by transferring the dyes to Whatman blotter
paper. Place gel on plastic wrap on bench. Place one piece of Whatman paper cut to fit gel on top of gel. Place one piece of acetate (overhead transparencies work great) cut to fit gel on top of Whatman paper. Place a book on top to provide weight. Wait about 10 minutes for transfer.
9. Throw away the gel and pour back buffer!! Put all equipment back into the supply box. Analysis: 1. Intrepret the results of the tests: • Which family members have the sickle cell genotype (SS)? • Which family members have the carrier genotype (AS)? • Which family members have the normal genotype (AA)? 2. Draw a pedigree showing inheritance of sickle cell anemia in the family you analyzed. 3. Make a Punnett Square and explain the probabilities of various genotypes and phenotypes
for offspring given the parents’ genotypes. (Be sure that your square includes a key; A=normal allele, S=sickle allele).
4. Imagine that you are a genetic counselor. Based on your results, write a brief dialog (2–3
minutes) between you and the parents of your family as you present them with the results of their genetic testing. Include what the results say about the inheritance of sickle cell in the family, and explain what the family members’ health situation and options are, both now and in the future. Use an understanding tone, and be aware of sensitive issues. Be prepared to enact your scene in front of the class if asked to do so.
5. Should genetic changes that cause hereditary problems be diagnosed before birth? What
are the pros and cons? (For your information, scientists estimate that each of us carries one copy of at least six lethal recessive genes.)
6. What are some possible sources of error in this lab?
http://gsoutreach.gs.washington.edu Genome Sciences Education Outreach, University of Washington
16
Sickle Cell Anemia Lab: Diagnosis Using Teacher Information Simulated Restriction Analysis of DNA. Materials, per team: •gel electrophoresis box with casting tray and comb
•power supply •P-20 micropipet and tips •rack for tubes •250 ml beaker for used tips •permanent marker •agarose (1%)
•“DNA” samples (dye mixtures of xylene cyanole and napthol blue black)*
•1X TAE buffer, 150 ml (more if making a gel also)
•Whatman blotter paper •acetate sheet (overhead transparency) •plastic wrap •gloves and goggles
*To make dye mixtures, dissolve 0.025 grams xylene cyanole or napthol blue black in 10 ml water and 1 ml glycerol. For the heterozygote mixture, mix together equal amounts of each dye solution. (Note: Napthol blue black is also known as amido black 10B.)
In most cases, you should pour and set up gels before class starts. However, depending on the length of your class period, you may be able to make and run the gels on the same day. For this lab, it is assumed that students have prior knowledge of the principles behind electrophoresis and restriction enzymes.
Napthol blue black and xylene cyanole are dyes that are similar in color yet run differently enough through the gel such that two distinct bands can be seen. They are both negatively charged and thus ‘run towards the red’ as DNA does. The dyes will diffuse quickly so make sure students record their results right away!
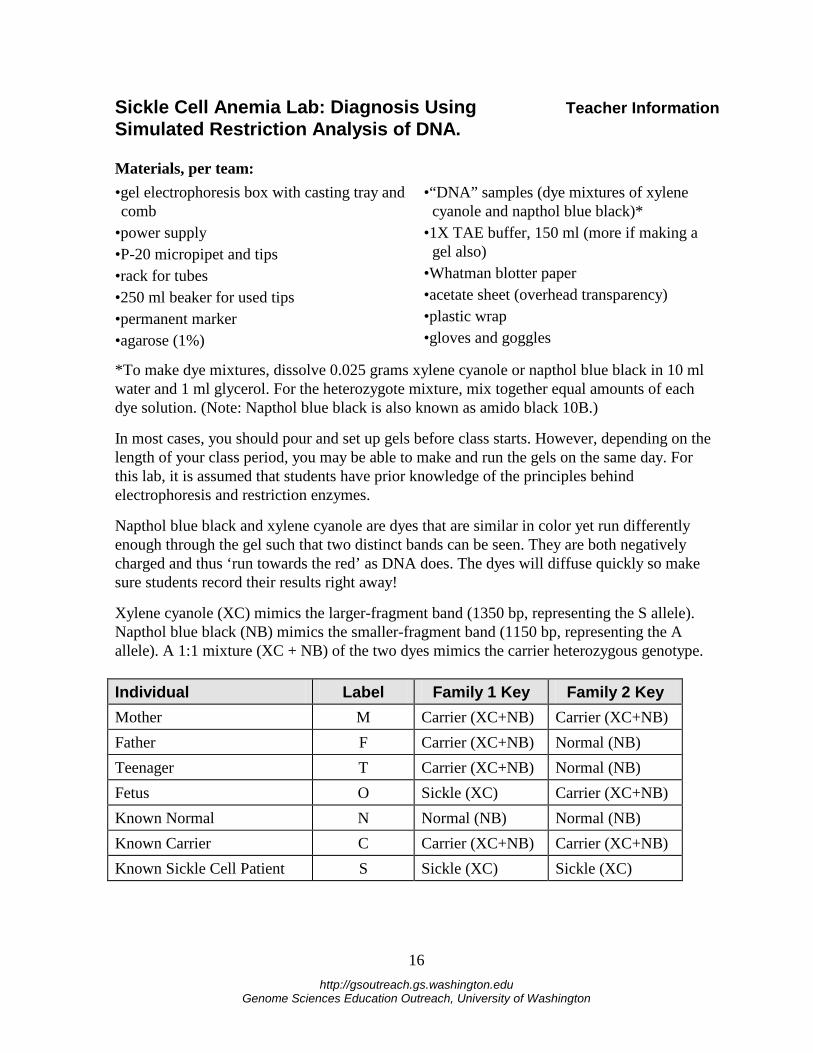
Xylene cyanole (XC) mimics the larger-fragment band (1350 bp, representing the S allele). Napthol blue black (NB) mimics the smaller-fragment band (1150 bp, representing the A allele). A 1:1 mixture (XC + NB) of the two dyes mimics the carrier heterozygous genotype. Individual Label Family 1 Key Family 2 Key Mother M Carrier (XC+NB) Carrier (XC+NB) Father F Carrier (XC+NB) Normal (NB) Teenager T Carrier (XC+NB) Normal (NB) Fetus O Sickle (XC) Carrier (XC+NB) Known Normal N Normal (NB) Normal (NB) Known Carrier C Carrier (XC+NB) Carrier (XC+NB) Known Sickle Cell Patient S Sickle (XC) Sickle (XC)
http://gsoutreach.gs.washington.edu Genome Sciences Education Outreach, University of Washington
17
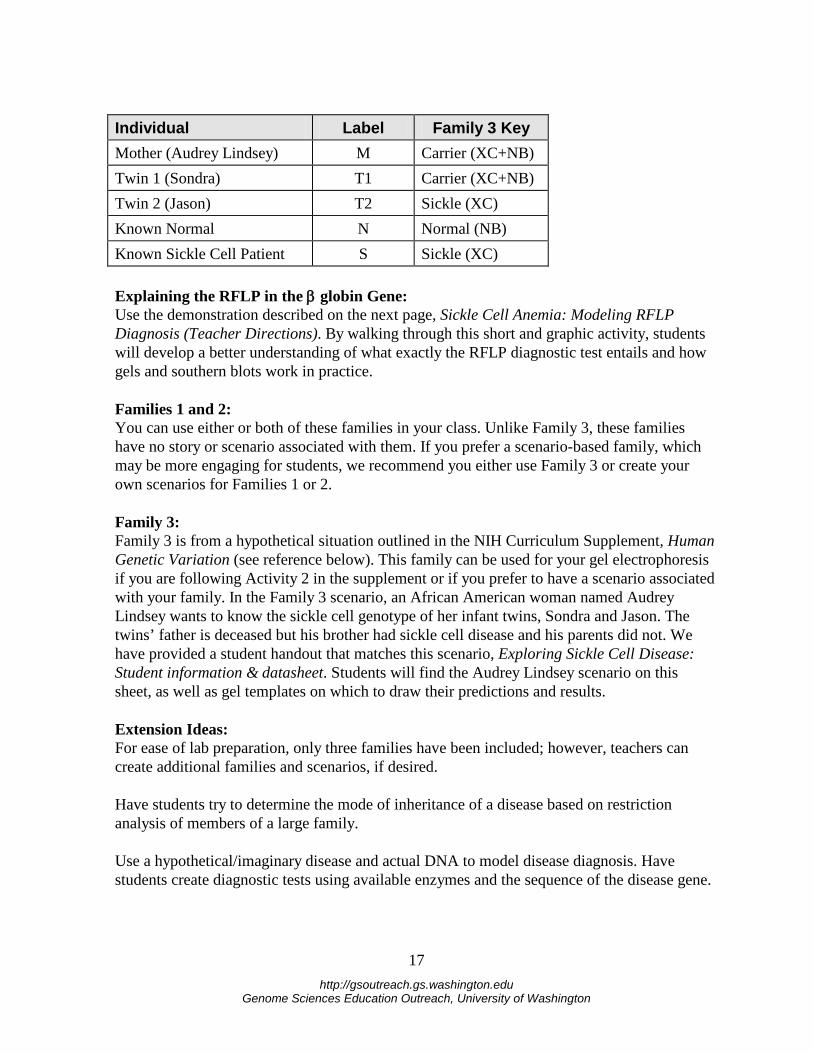
Individual Label Family 3 Key Mother (Audrey Lindsey) M Carrier (XC+NB) Twin 1 (Sondra) T1 Carrier (XC+NB) Twin 2 (Jason) T2 Sickle (XC) Known Normal N Normal (NB) Known Sickle Cell Patient S Sickle (XC) Explaining the RFLP in the β globin Gene: Use the demonstration described on the next page, Sickle Cell Anemia: Modeling RFLP Diagnosis (Teacher Directions). By walking through this short and graphic activity, students will develop a better understanding of what exactly the RFLP diagnostic test entails and how gels and southern blots work in practice. Families 1 and 2: You can use either or both of these families in your class. Unlike Family 3, these families have no story or scenario associated with them. If you prefer a scenario-based family, which may be more engaging for students, we recommend you either use Family 3 or create your own scenarios for Families 1 or 2. Family 3: Family 3 is from a hypothetical situation outlined in the NIH Curriculum Supplement, Human Genetic Variation (see reference below). This family can be used for your gel electrophoresis if you are following Activity 2 in the supplement or if you prefer to have a scenario associated with your family. In the Family 3 scenario, an African American woman named Audrey Lindsey wants to know the sickle cell genotype of her infant twins, Sondra and Jason. The twins’ father is deceased but his brother had sickle cell disease and his parents did not. We have provided a student handout that matches this scenario, Exploring Sickle Cell Disease: Student information & datasheet. Students will find the Audrey Lindsey scenario on this sheet, as well as gel templates on which to draw their predictions and results. Extension Ideas: For ease of lab preparation, only three families have been included; however, teachers can create additional families and scenarios, if desired. Have students try to determine the mode of inheritance of a disease based on restriction analysis of members of a large family. Use a hypothetical/imaginary disease and actual DNA to model disease diagnosis. Have students create diagnostic tests using available enzymes and the sequence of the disease gene.
http://gsoutreach.gs.washington.edu Genome Sciences Education Outreach, University of Washington
18
Sources: Human Genetic Variation, a curriculum supplement produced by the NIH, BSCS, and Videodiscovery, 1999. Order your free copy from http://science-education.nih.gov. Keeton, W., and J. Gould, Biological Science, W.W. Norton and Co., NY, NY, 1986. Leary, W., Sickle Cell Trial Called Success, Halted Early, New York Times, January 31, 1995. pp. B5, B8. Lewis, R., Case Workbook in Human Genetics, Wm C. Brown Publishers, Dubuque, IA, 1994. Micklos, D., and G. Freyer, DNA Science, Cold Spring Harbor Laboratory Press, Burlington, NC, 1990. Modern Biology Inc. Catalog, Dayton Indiana, 1995. Pines, M., Blood: The Bearer of Life and Death, Howard Hughes Medical Institute, Chevy Chase, MD, 1993. Tortora, G., B. Funke, and C. Case, Microbiology, Benjamin Cummings Publishing Co., Inc., Redwood City, CA, 1992.
http://gsoutreach.gs.washington.edu Genome Sciences Education Outreach, University of Washington
19
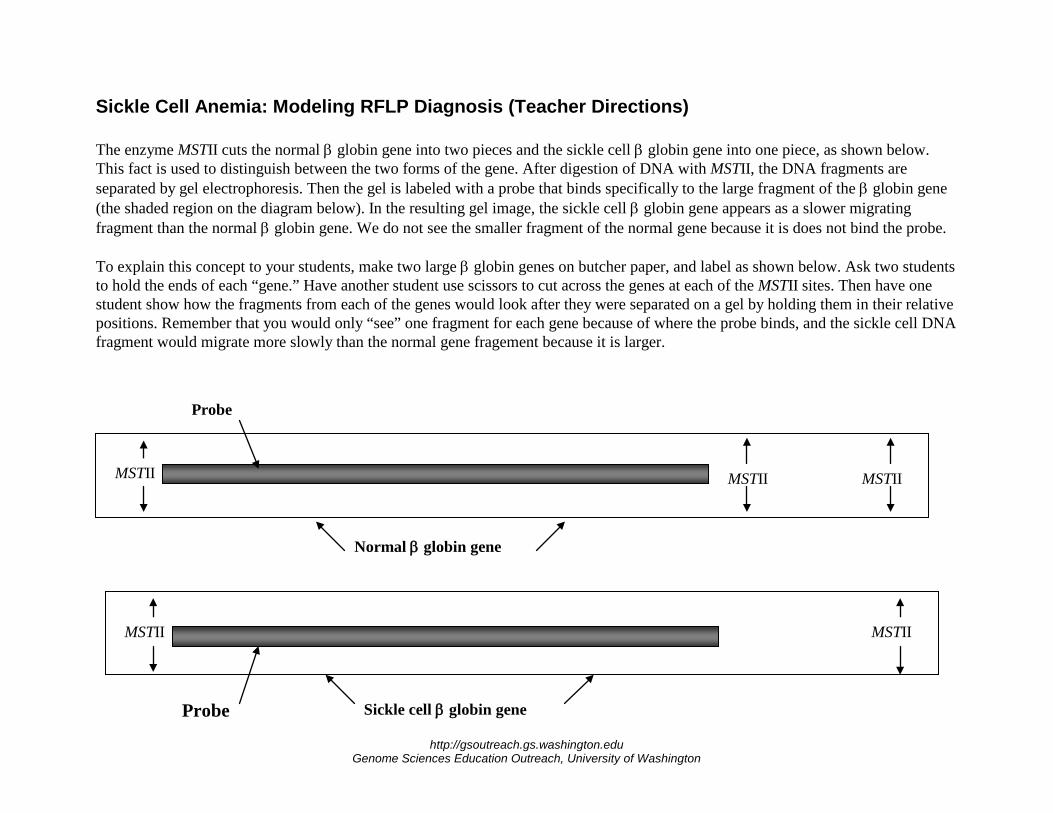
Sickle Cell Anemia: Modeling RFLP Diagnosis (Teacher Directions) The enzyme MSTII cuts the normal β globin gene into two pieces and the sickle cell β globin gene into one piece, as shown below. This fact is used to distinguish between the two forms of the gene. After digestion of DNA with MSTII, the DNA fragments are separated by gel electrophoresis. Then the gel is labeled with a probe that binds specifically to the large fragment of the β globin gene (the shaded region on the diagram below). In the resulting gel image, the sickle cell β globin gene appears as a slower migrating fragment than the normal β globin gene. We do not see the smaller fragment of the normal gene because it is does not bind the probe. To explain this concept to your students, make two large β globin genes on butcher paper, and label as shown below. Ask two students to hold the ends of each “gene.” Have another student use scissors to cut across the genes at each of the MSTII sites. Then have one student show how the fragments from each of the genes would look after they were separated on a gel by holding them in their relative positions. Remember that you would only “see” one fragment for each gene because of where the probe binds, and the sickle cell DNA fragment would migrate more slowly than the normal gene fragement because it is larger.
Probe
MSTII MSTII MSTII
Normal β globin gene
Sickle cell β globin gene MSTII MSTII
Sickle cell β globin gene Probe
http://gsoutreach.gs.washington.edu Genome Sciences Education Outreach, University of Washington
20
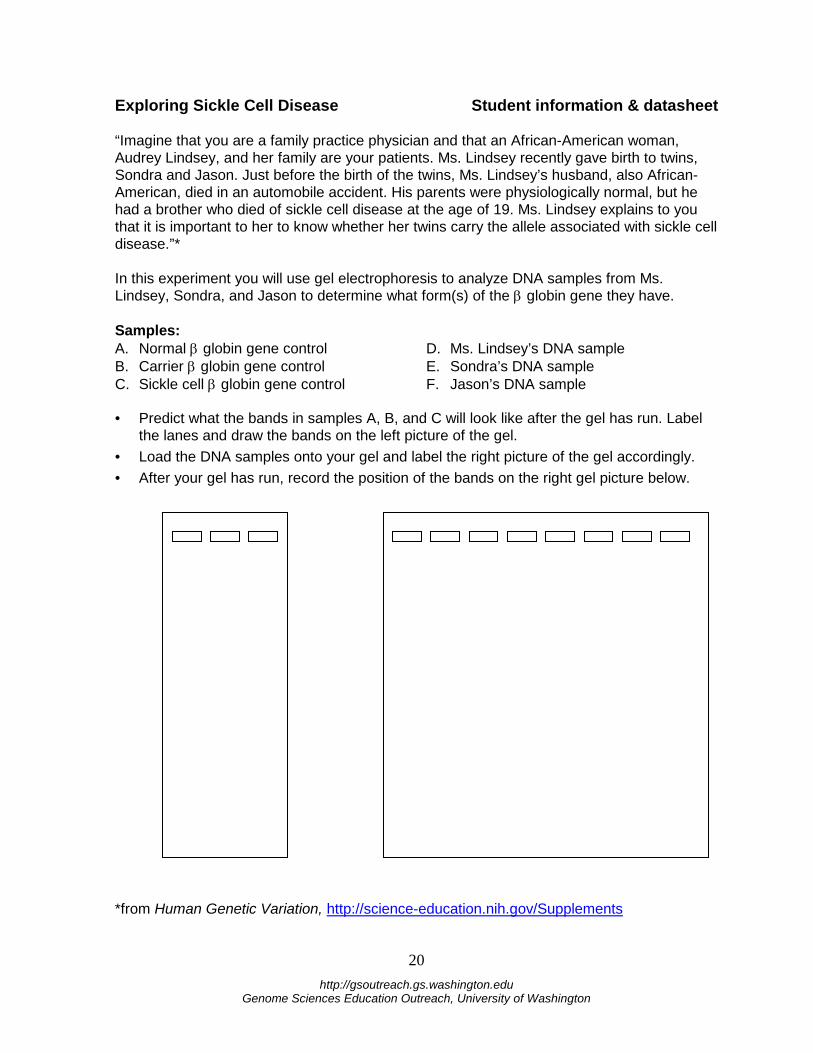
Exploring Sickle Cell Disease Student information & datasheet “Imagine that you are a family practice physician and that an African-American woman, Audrey Lindsey, and her family are your patients. Ms. Lindsey recently gave birth to twins, Sondra and Jason. Just before the birth of the twins, Ms. Lindsey’s husband, also African-American, died in an automobile accident. His parents were physiologically normal, but he had a brother who died of sickle cell disease at the age of 19. Ms. Lindsey explains to you that it is important to her to know whether her twins carry the allele associated with sickle cell disease.”* In this experiment you will use gel electrophoresis to analyze DNA samples from Ms. Lindsey, Sondra, and Jason to determine what form(s) of the β globin gene they have. Samples: A. Normal β globin gene control D. Ms. Lindsey’s DNA sample B. Carrier β globin gene control E. Sondra’s DNA sample C. Sickle cell β globin gene control F. Jason’s DNA sample • Predict what the bands in samples A, B, and C will look like after the gel has run. Label
the lanes and draw the bands on the left picture of the gel. • Load the DNA samples onto your gel and label the right picture of the gel accordingly. • After your gel has run, record the position of the bands on the right gel picture below. *from Human Genetic Variation, http://science-education.nih.gov/Supplements
http://gsoutreach.gs.washington.edu Genome Sciences Education Outreach, University of Washington
21
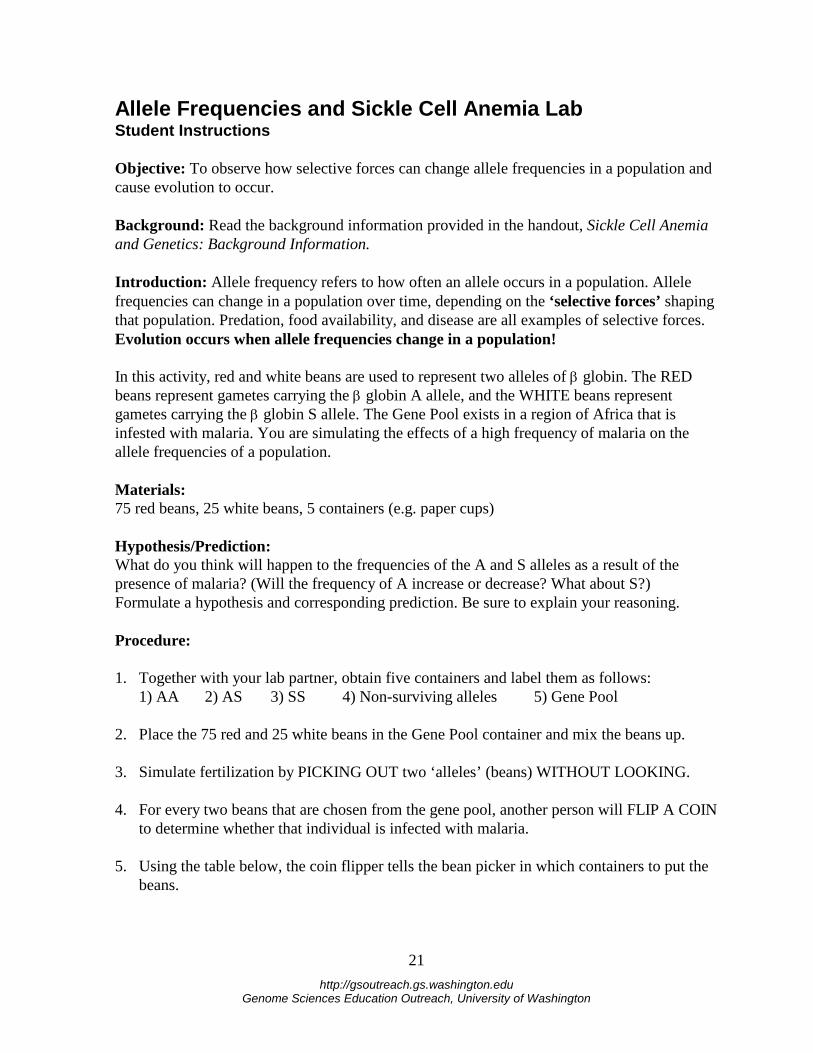
Allele Frequencies and Sickle Cell Anemia Lab Student Instructions Objective: To observe how selective forces can change allele frequencies in a population and cause evolution to occur. Background: Read the background information provided in the handout, Sickle Cell Anemia and Genetics: Background Information. Introduction: Allele frequency refers to how often an allele occurs in a population. Allele frequencies can change in a population over time, depending on the ‘selective forces’ shaping that population. Predation, food availability, and disease are all examples of selective forces. Evolution occurs when allele frequencies change in a population! In this activity, red and white beans are used to represent two alleles of β globin. The RED beans represent gametes carrying the β globin A allele, and the WHITE beans represent gametes carrying the β globin S allele. The Gene Pool exists in a region of Africa that is infested with malaria. You are simulating the effects of a high frequency of malaria on the allele frequencies of a population. Materials: 75 red beans, 25 white beans, 5 containers (e.g. paper cups) Hypothesis/Prediction: What do you think will happen to the frequencies of the A and S alleles as a result of the presence of malaria? (Will the frequency of A increase or decrease? What about S?) Formulate a hypothesis and corresponding prediction. Be sure to explain your reasoning. Procedure: 1. Together with your lab partner, obtain five containers and label them as follows: 1) AA 2) AS 3) SS 4) Non-surviving alleles 5) Gene Pool 2. Place the 75 red and 25 white beans in the Gene Pool container and mix the beans up. 3. Simulate fertilization by PICKING OUT two ‘alleles’ (beans) WITHOUT LOOKING. 4. For every two beans that are chosen from the gene pool, another person will FLIP A COIN
to determine whether that individual is infected with malaria. 5. Using the table below, the coin flipper tells the bean picker in which containers to put the
beans.
http://gsoutreach.gs.washington.edu Genome Sciences Education Outreach, University of Washington
22
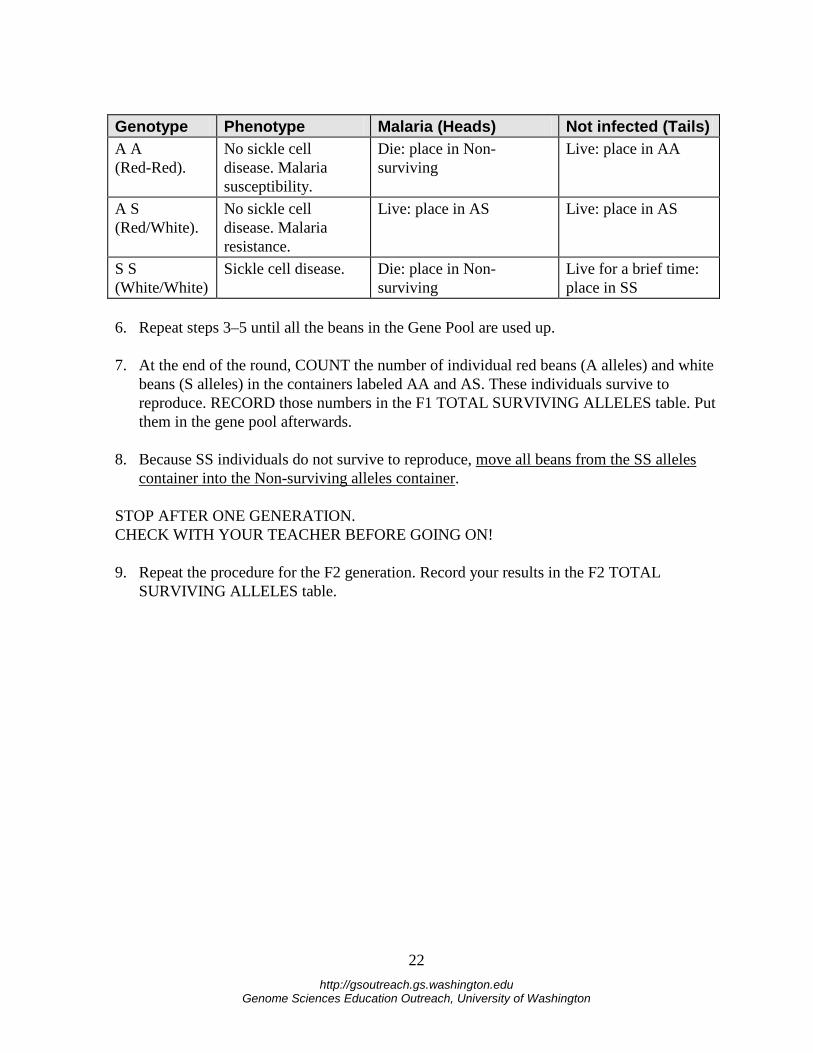
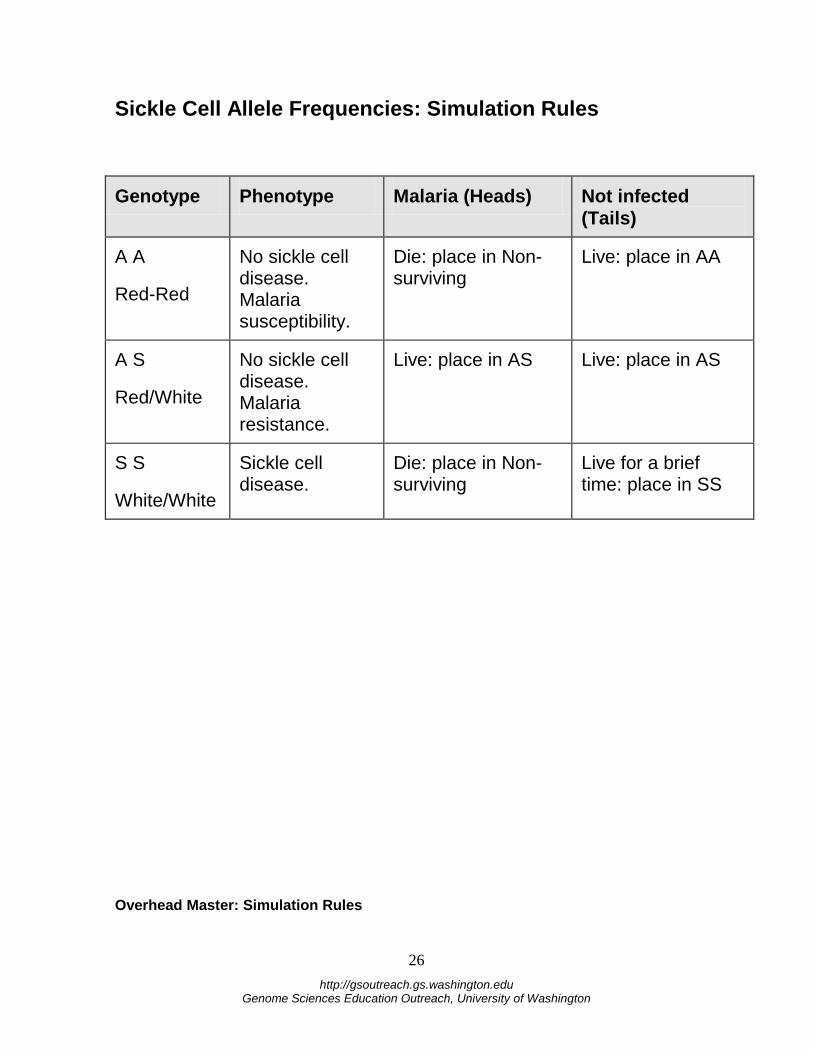
Genotype Phenotype Malaria (Heads) Not infected (Tails) A A (Red-Red).
No sickle cell disease. Malaria susceptibility.
Die: place in Non-surviving
Live: place in AA
A S (Red/White).
No sickle cell disease. Malaria resistance.
Live: place in AS Live: place in AS
S S (White/White)
Sickle cell disease. Die: place in Non-surviving
Live for a brief time: place in SS
6. Repeat steps 3–5 until all the beans in the Gene Pool are used up. 7. At the end of the round, COUNT the number of individual red beans (A alleles) and white
beans (S alleles) in the containers labeled AA and AS. These individuals survive to reproduce. RECORD those numbers in the F1 TOTAL SURVIVING ALLELES table. Put them in the gene pool afterwards.
8. Because SS individuals do not survive to reproduce, move all beans from the SS alleles
container into the Non-surviving alleles container. STOP AFTER ONE GENERATION. CHECK WITH YOUR TEACHER BEFORE GOING ON! 9. Repeat the procedure for the F2 generation. Record your results in the F2 TOTAL
SURVIVING ALLELES table.
http://gsoutreach.gs.washington.edu Genome Sciences Education Outreach, University of Washington
23
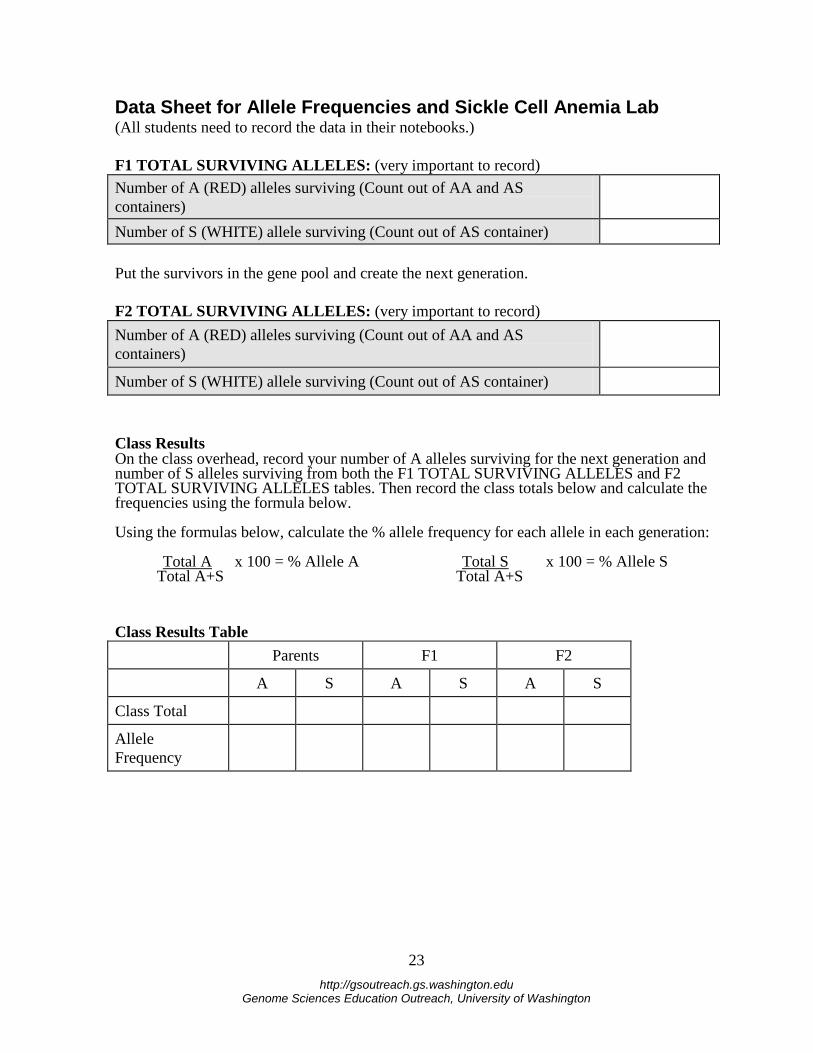
Data Sheet for Allele Frequencies and Sickle Cell Anemia Lab (All students need to record the data in their notebooks.) F1 TOTAL SURVIVING ALLELES: (very important to record) Number of A (RED) alleles surviving (Count out of AA and AS containers)
Number of S (WHITE) allele surviving (Count out of AS container) Put the survivors in the gene pool and create the next generation. F2 TOTAL SURVIVING ALLELES: (very important to record) Number of A (RED) alleles surviving (Count out of AA and AS containers)
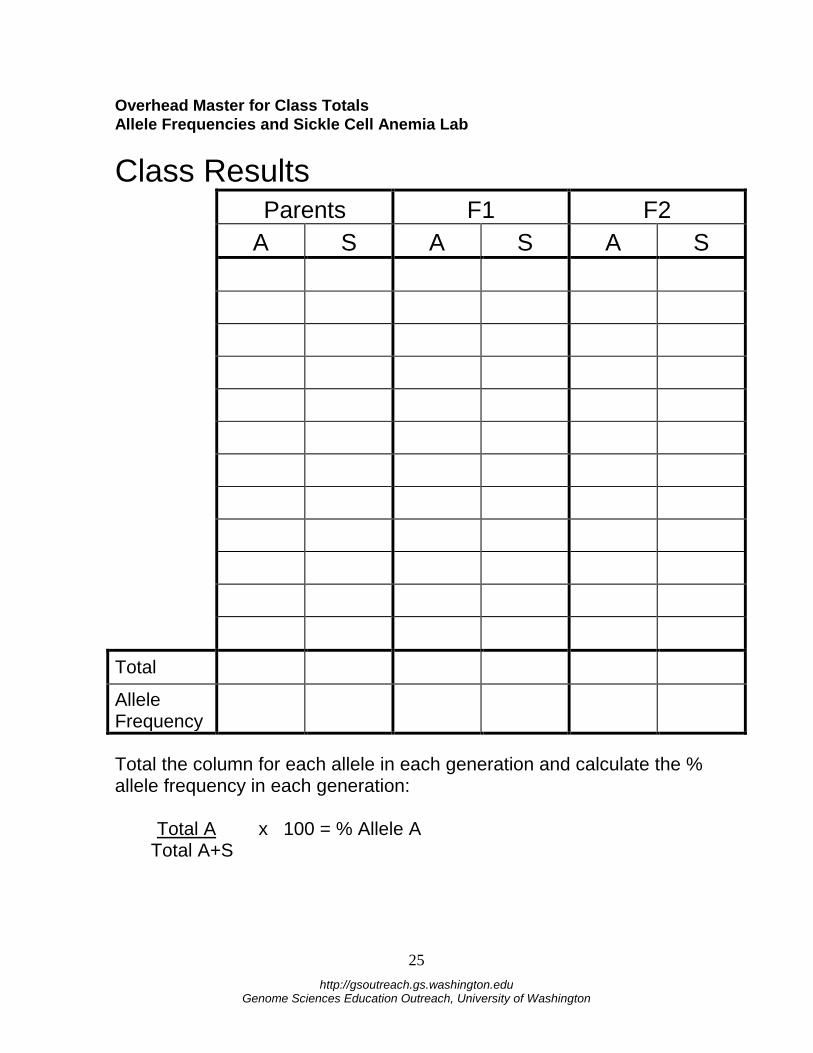
Number of S (WHITE) allele surviving (Count out of AS container) Class Results On the class overhead, record your number of A alleles surviving for the next generation and number of S alleles surviving from both the F1 TOTAL SURVIVING ALLELES and F2 TOTAL SURVIVING ALLELES tables. Then record the class totals below and calculate the frequencies using the formula below. Using the formulas below, calculate the % allele frequency for each allele in each generation: Total A x 100 = % Allele A Total S x 100 = % Allele S Total A+S Total A+S Class Results Table Parents F1 F2
A S A S A S
Class Total
Allele Frequency
http://gsoutreach.gs.washington.edu Genome Sciences Education Outreach, University of Washington
24
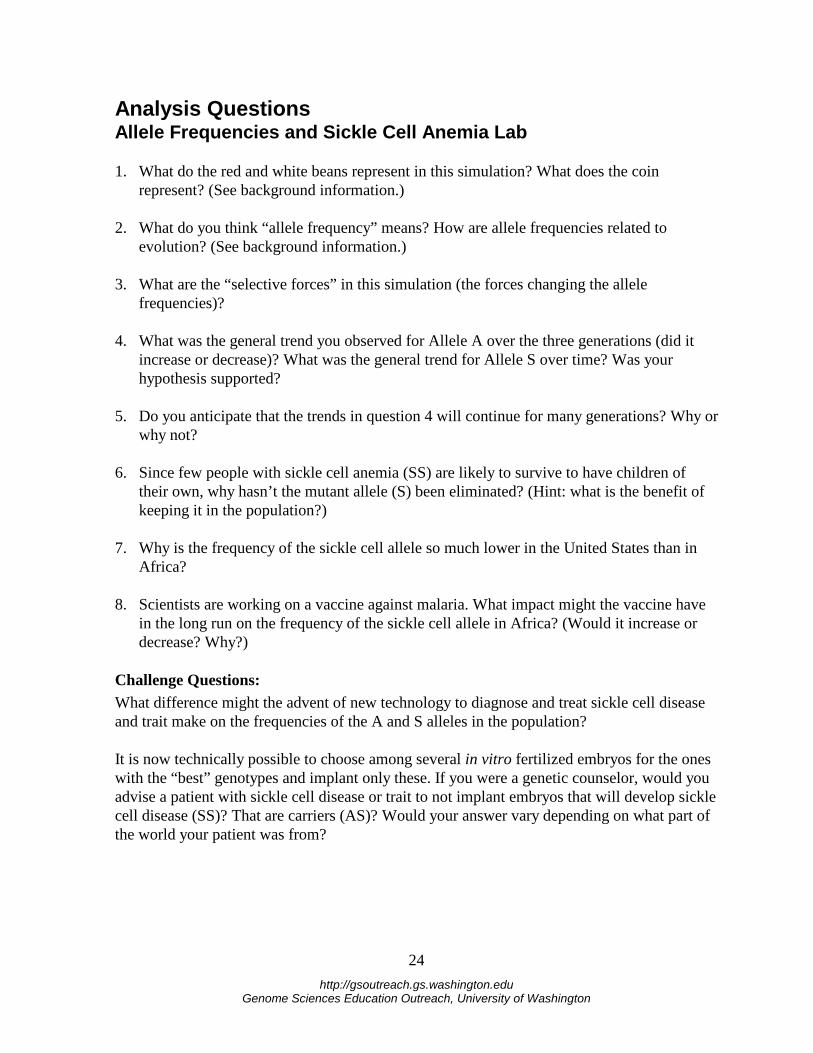
Analysis Questions Allele Frequencies and Sickle Cell Anemia Lab 1. What do the red and white beans represent in this simulation? What does the coin
represent? (See background information.) 2. What do you think “allele frequency” means? How are allele frequencies related to
evolution? (See background information.) 3. What are the “selective forces” in this simulation (the forces changing the allele
frequencies)? 4. What was the general trend you observed for Allele A over the three generations (did it
increase or decrease)? What was the general trend for Allele S over time? Was your hypothesis supported?
5. Do you anticipate that the trends in question 4 will continue for many generations? Why or
why not? 6. Since few people with sickle cell anemia (SS) are likely to survive to have children of
their own, why hasn’t the mutant allele (S) been eliminated? (Hint: what is the benefit of keeping it in the population?)
7. Why is the frequency of the sickle cell allele so much lower in the United States than in
Africa? 8. Scientists are working on a vaccine against malaria. What impact might the vaccine have
in the long run on the frequency of the sickle cell allele in Africa? (Would it increase or decrease? Why?)
Challenge Questions: What difference might the advent of new technology to diagnose and treat sickle cell disease and trait make on the frequencies of the A and S alleles in the population? It is now technically possible to choose among several in vitro fertilized embryos for the ones with the “best” genotypes and implant only these. If you were a genetic counselor, would you advise a patient with sickle cell disease or trait to not implant embryos that will develop sickle cell disease (SS)? That are carriers (AS)? Would your answer vary depending on what part of the world your patient was from?
http://gsoutreach.gs.washington.edu Genome Sciences Education Outreach, University of Washington
25
Overhead Master for Class Totals Allele Frequencies and Sickle Cell Anemia Lab
Class Results
Parents F1 F2 A S A S A S Total Allele Frequency
Total the column for each allele in each generation and calculate the % allele frequency in each generation: Total A x 100 = % Allele A Total A+S
http://gsoutreach.gs.washington.edu Genome Sciences Education Outreach, University of Washington
26
Sickle Cell Allele Frequencies: Simulation Rules
Genotype Phenotype Malaria (Heads) Not infected (Tails)
A A
Red-Red
No sickle cell disease. Malaria susceptibility.
Die: place in Non-surviving
Live: place in AA
A S
Red/White
No sickle cell disease. Malaria resistance.
Live: place in AS Live: place in AS
S S
White/White
Sickle cell disease.
Die: place in Non-surviving
Live for a brief time: place in SS
Overhead Master: Simulation Rules
http://gsoutreach.gs.washington.edu Genome Sciences Education Outreach, University of Washington
27
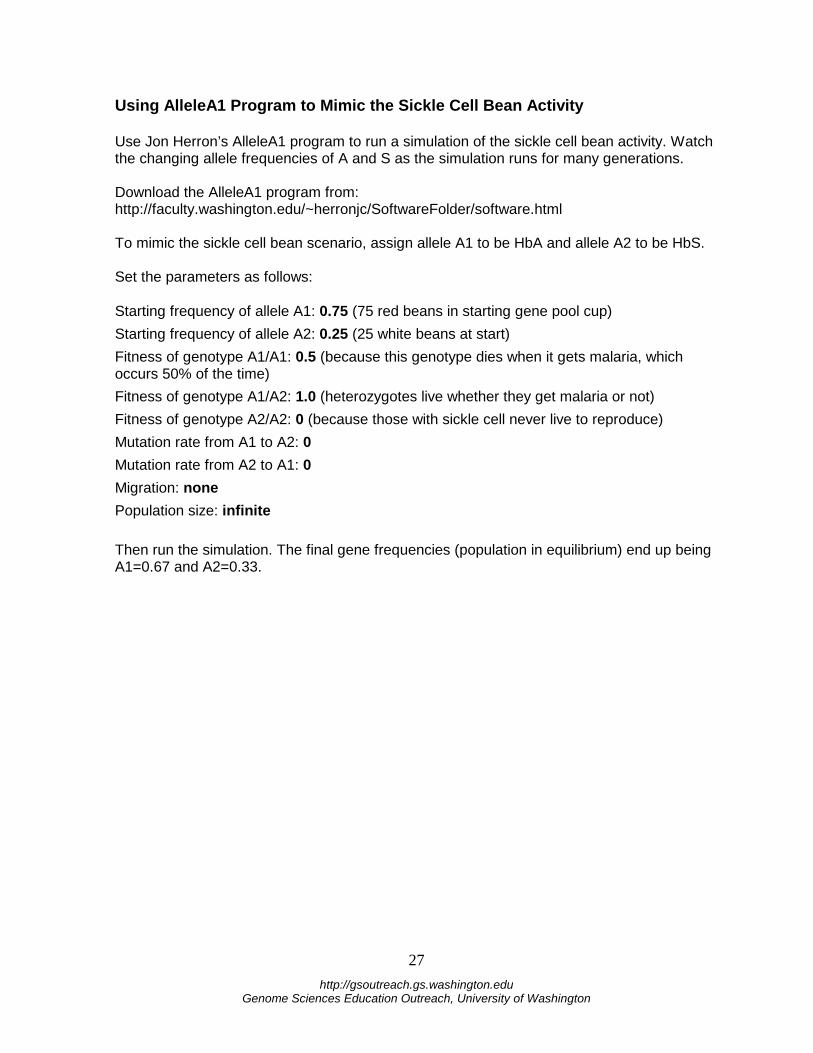
Using AlleleA1 Program to Mimic the Sickle Cell Bean Activity Use Jon Herron’s AlleleA1 program to run a simulation of the sickle cell bean activity. Watch the changing allele frequencies of A and S as the simulation runs for many generations. Download the AlleleA1 program from: http://faculty.washington.edu/~herronjc/SoftwareFolder/software.html To mimic the sickle cell bean scenario, assign allele A1 to be HbA and allele A2 to be HbS. Set the parameters as follows: Starting frequency of allele A1: 0.75 (75 red beans in starting gene pool cup) Starting frequency of allele A2: 0.25 (25 white beans at start) Fitness of genotype A1/A1: 0.5 (because this genotype dies when it gets malaria, which occurs 50% of the time) Fitness of genotype A1/A2: 1.0 (heterozygotes live whether they get malaria or not) Fitness of genotype A2/A2: 0 (because those with sickle cell never live to reproduce) Mutation rate from A1 to A2: 0 Mutation rate from A2 to A1: 0 Migration: none Population size: infinite Then run the simulation. The final gene frequencies (population in equilibrium) end up being A1=0.67 and A2=0.33.
http://gsoutreach.gs.washington.edu Genome Sciences Education Outreach, University of Washington
28
A Few Sickle Cell Resources 3D Animations of Sickle Cell http://depts.washington.edu/hsasf/graphics/portfolio/3d_index.html CSHL Sickle Cell Educational Site, Your Genes, Your Health http://www.yourgenesyourhealth.org Human Genetic Variation CD-ROM (contains sickle cell movie) Obtain from this website or use new online version of movie http://science-education.nih.gov/supplements Sickle Cell Protein Models (animations) Models how mutant B-globin forms aberrant fibers in red blood cells, causing sickling. Also contains great still electron micrograph of a bursting sickled red blood cell http://gingi.uchicago.edu/hbs3.html
Related Documents