Show Me The Money! Cost & Resource Tracking for Hadoop & Storm Hadoop Summit June 30, 2016 Kendall Thrapp

Welcome message from author
This document is posted to help you gain knowledge. Please leave a comment to let me know what you think about it! Share it to your friends and learn new things together.
Transcript
Show Me The Money! Cost & Resource Tracking for Hadoop & Storm
Hadoop Summit June 30, 2016
Kendall Thrapp

• 3000+ grid users • ~600 distinct projects • Running 1.2M+
apps/day
… all focused on meeting their own SLAs but not necessarily on how their grid usage impacts
YAHOO PROPRIETARY
Hadoop @ Yahoo Scale
2
Tracking resource usage and cost is cri0cal to manage capacity and ensure fairness
Image by b k @ h3ps://flic.kr/p/4EjNgb (CC BY-‐SA 2.0)
YAHOO PROPRIETARY
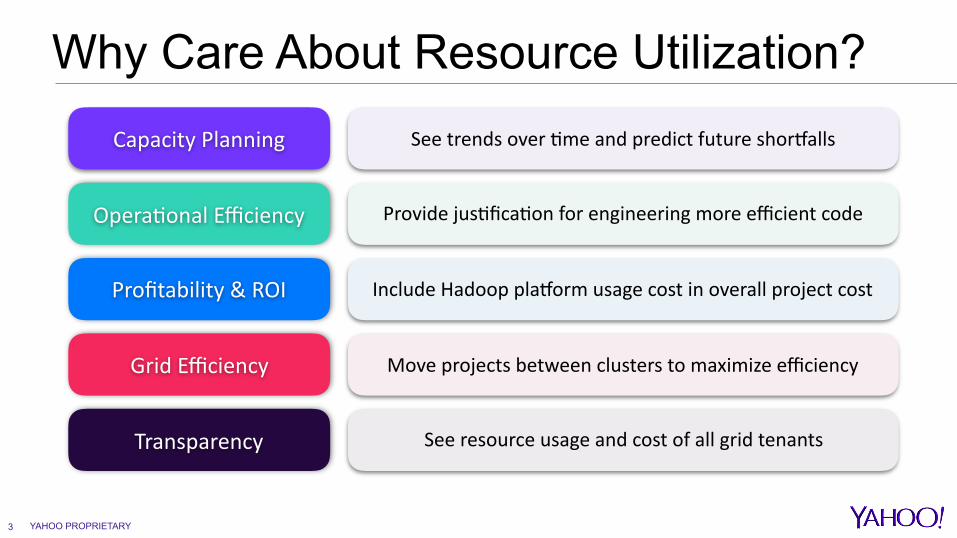
Why Care About Resource Utilization?
3
Capacity Planning
OperaLonal Efficiency
Profitability & ROI
Grid Efficiency
Transparency
See trends over Lme and predict future shorValls
Provide jusLficaLon for engineering more efficient code
Include Hadoop plaVorm usage cost in overall project cost
Move projects between clusters to maximize efficiency
See resource usage and cost of all grid tenants
YAHOO PROPRIETARY
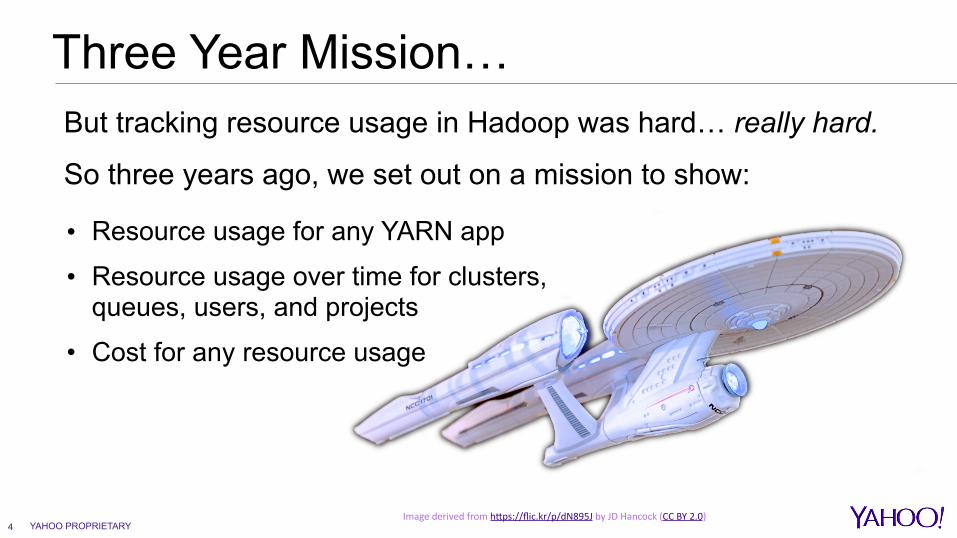
Three Year Mission…
4
But tracking resource usage in Hadoop was hard… really hard.
So three years ago, we set out on a mission to show:
Image derived from h3ps://flic.kr/p/dN895J by JD Hancock (CC BY 2.0)
• Resource usage for any YARN app
• Resource usage over time for clusters, queues, users, and projects
• Cost for any resource usage
YAHOO PROPRIETARY
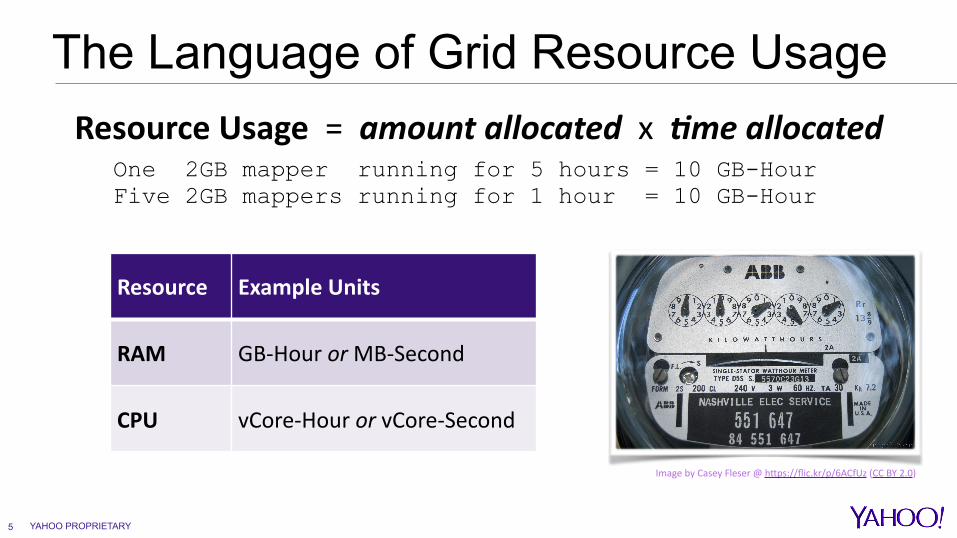
The Language of Grid Resource Usage
5
Resource Usage = amount allocated x 0me allocatedOne 2GB mapper running for 5 hours = 10 GB-Hour Five 2GB mappers running for 1 hour = 10 GB-Hour
Resource Example Units
RAM GB-‐Hour or MB-‐Second
CPU vCore-‐Hour or vCore-‐Second
Image by Casey Fleser @ h3ps://flic.kr/p/6ACfUz (CC BY 2.0)

• 28 months from JIRA to full deployment • First time getting resource usage for non-
MR applications, like Spark, TEZ, or Slider. • Available through the Hadoop UI, even
while the app is still running. • Stored long term by Grid UI team and made
available through a REST API. • Can benchmark apps to see how code &
config changes affect resource usage. • Can convert this to a $ cost using TCO
method described later.
YAHOO PROPRIETARY
Introducing YARN-415
6
Capture aggregate resource allocation at the app-level in MB-secs & vCore-secs
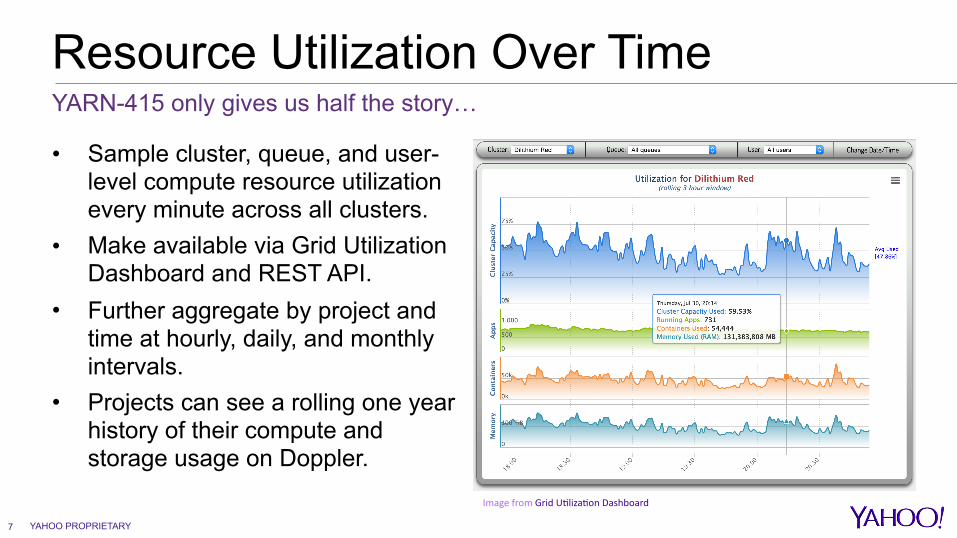
• Sample cluster, queue, and user-level compute resource utilization every minute across all clusters.
• Make available via Grid Utilization Dashboard and REST API.
• Further aggregate by project and time at hourly, daily, and monthly intervals.
• Projects can see a rolling one year history of their compute and storage usage on Doppler.
YAHOO PROPRIETARY
Resource Utilization Over Time
7
YARN-415 only gives us half the story…
Image from Grid ULlizaLon Dashboard

YAHOO PROPRIETARY8
Viewing Project Compute Utilization In the Doppler web application
Monthly average RAM & CPU usage for the current month and past three months, as well as quotas
Zoom by time window or date range
Rolling one-year historical charts for RAM & CPU ● Central solid line is daily average ● Inner (darker) band is average ± 1 SD ● Outer (lighter) band is daily min/max ● Dashed line is approved quota
Hover over chart to see exact values for dates
When zoomed in, use scrollbar to see other dates
Flags to indicate major events, like upgrade to Hadoop 2.6
Click name in legend to show or hide series. Chart axes will dynamically resize to maximize detail.
Webpage has additional panels like this for each queue ever used by the project
YAHOO PROPRIETARY9
Viewing Project
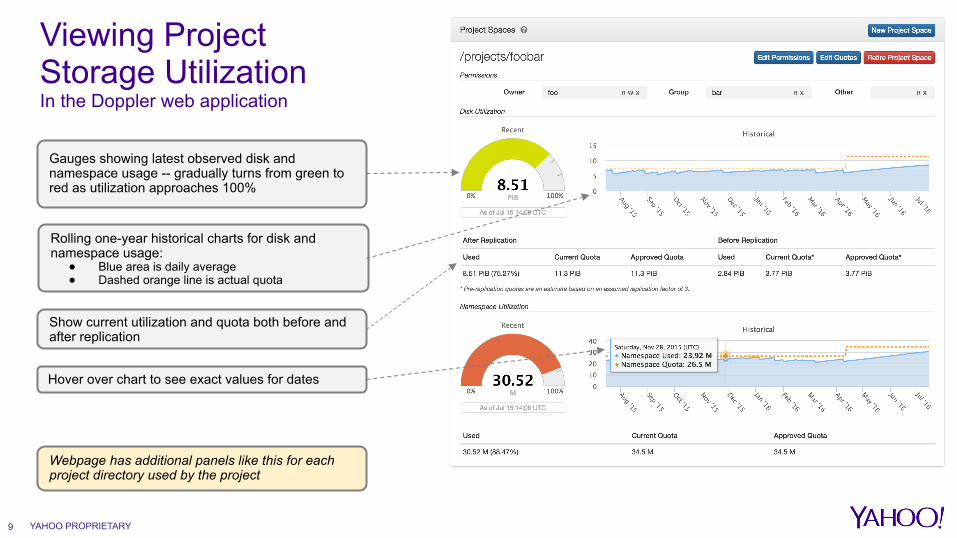
Storage Utilization In the Doppler web application
Rolling one-year historical charts for disk and namespace usage:
● Blue area is daily average ● Dashed orange line is actual quota
Show current utilization and quota both before and after replication
Webpage has additional panels like this for each project directory used by the project
Gauges showing latest observed disk and namespace usage -- gradually turns from green to red as utilization approaches 100%
Hover over chart to see exact values for dates
YAHOO PROPRIETARY
Show Me the Money!
10
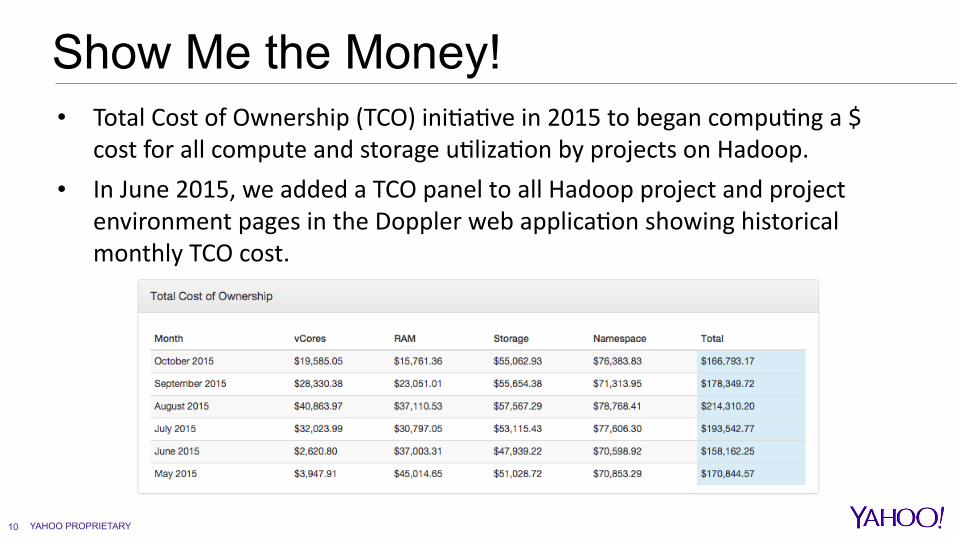
• Total Cost of Ownership (TCO) iniLaLve in 2015 to began compuLng a $ cost for all compute and storage uLlizaLon by projects on Hadoop.
• In June 2015, we added a TCO panel to all Hadoop project and project environment pages in the Doppler web applicaLon showing historical monthly TCO cost.
YAHOO PROPRIETARY
How is Project TCO Calculated?
11
Total Hadoop TCO
Disk NamespaceCPURAM
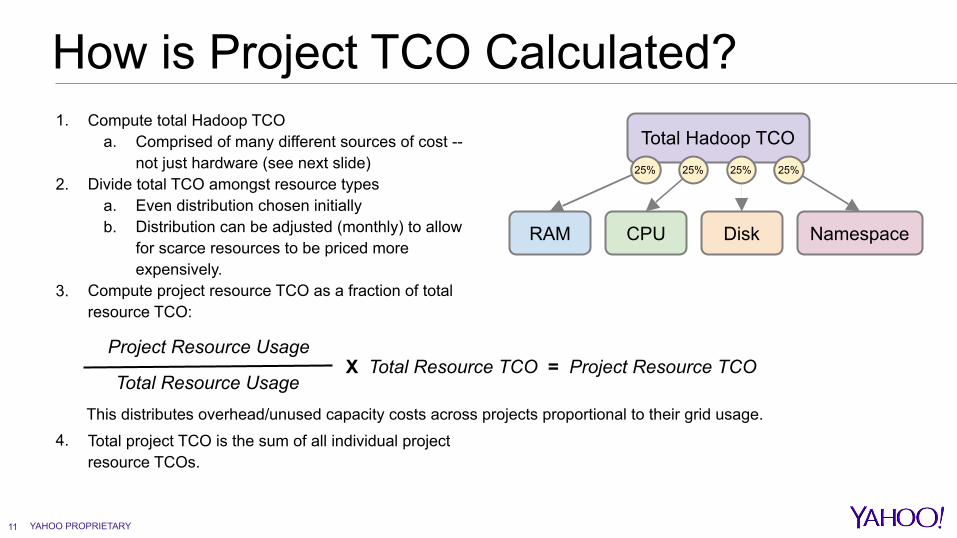
1. Compute total Hadoop TCO a. Comprised of many different sources of cost --
not just hardware (see next slide) 2. Divide total TCO amongst resource types
a. Even distribution chosen initially b. Distribution can be adjusted (monthly) to allow
for scarce resources to be priced more expensively.
3. Compute project resource TCO as a fraction of total resource TCO:
4. Total project TCO is the sum of all individual project resource TCOs.
25% 25% 25%25%
Project Resource Usage
Total Resource UsageX Total Resource TCO = Project Resource TCO
This distributes overhead/unused capacity costs across projects proportional to their grid usage.
YAHOO PROPRIETARY12
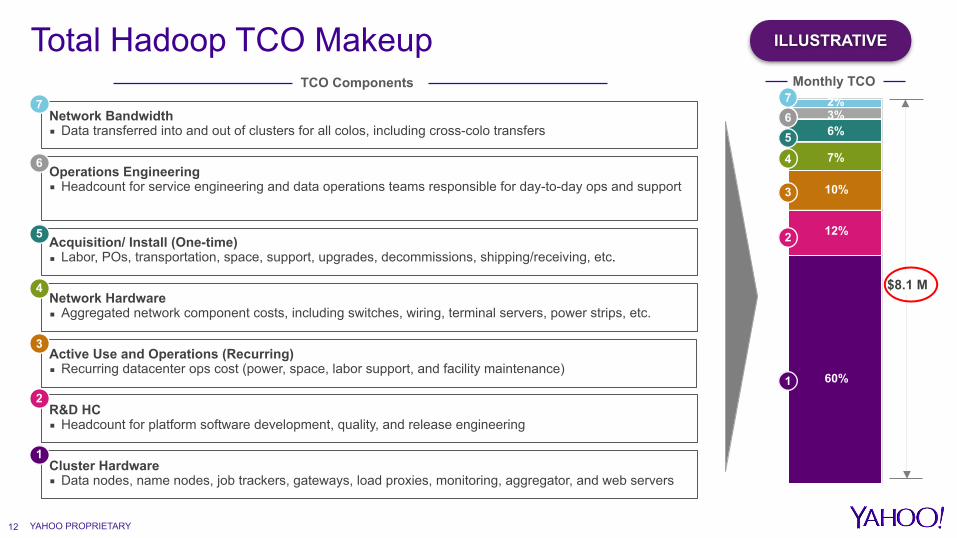
Total Hadoop TCO Makeup
$8.1 M
60%
12%
7%
6%3%2%
6
5
4
3
2
1
7
10%Operations Engineering ▪ Headcount for service engineering and data operations teams responsible for day-to-day ops and support
66
Acquisition/ Install (One-time) ▪ Labor, POs, transportation, space, support, upgrades, decommissions, shipping/receiving, etc.
5
Network Hardware ▪ Aggregated network component costs, including switches, wiring, terminal servers, power strips, etc.
4
Active Use and Operations (Recurring) ▪ Recurring datacenter ops cost (power, space, labor support, and facility maintenance)
3
R&D HC ▪ Headcount for platform software development, quality, and release engineering
2
Cluster Hardware ▪ Data nodes, name nodes, job trackers, gateways, load proxies, monitoring, aggregator, and web servers
1
Monthly TCOTCO Components
Network Bandwidth ▪ Data transferred into and out of clusters for all colos, including cross-colo transfers
7
6
6
ILLUSTRATIVE
YAHOO PROPRIETARY13
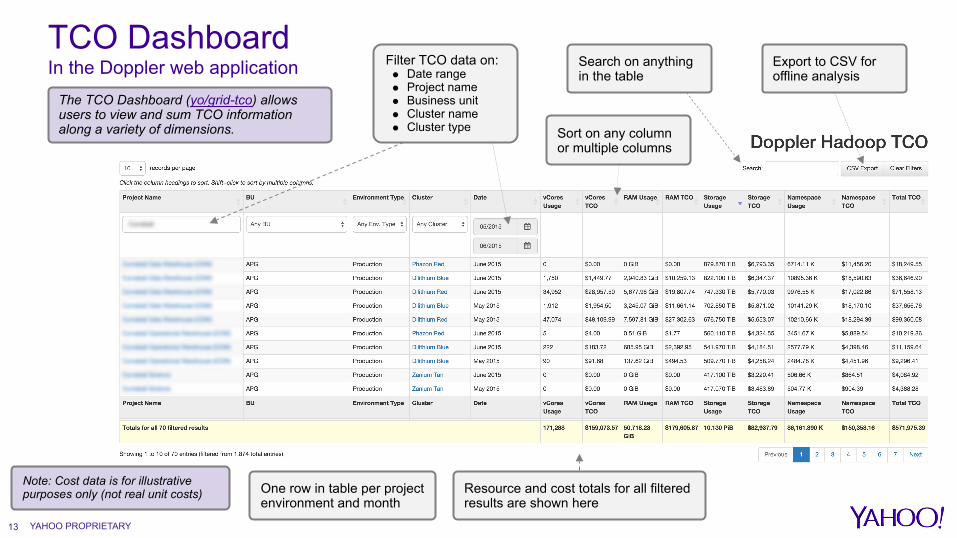
TCO Dashboard In the Doppler web application Filter TCO data on:
● Date range ● Project name ● Business unit ● Cluster name ● Cluster type
Search on anything in the table
Export to CSV for offline analysis
One row in table per project environment and month
The TCO Dashboard (yo/grid-tco) allows users to view and sum TCO information along a variety of dimensions.
Resource and cost totals for all filtered results are shown here
Sort on any column or multiple columns
Note: Cost data is for illustrative purposes only (not real unit costs)

• Unmasked hidden issues, like: – Projects using far more compute resources than they were ever
approved for – Projects requesting more resources when they were
underutilizing what they already had – Projects launching apps in queues they weren’t supposed to be
using – Zombie projects that were cancelled/retired but continuing to
consume grid resources • Helped teams verify a significant reduction in their compute usage
after some major efficiency improvements
YAHOO PROPRIETARY
Results!
14
YAHOO PROPRIETARY15
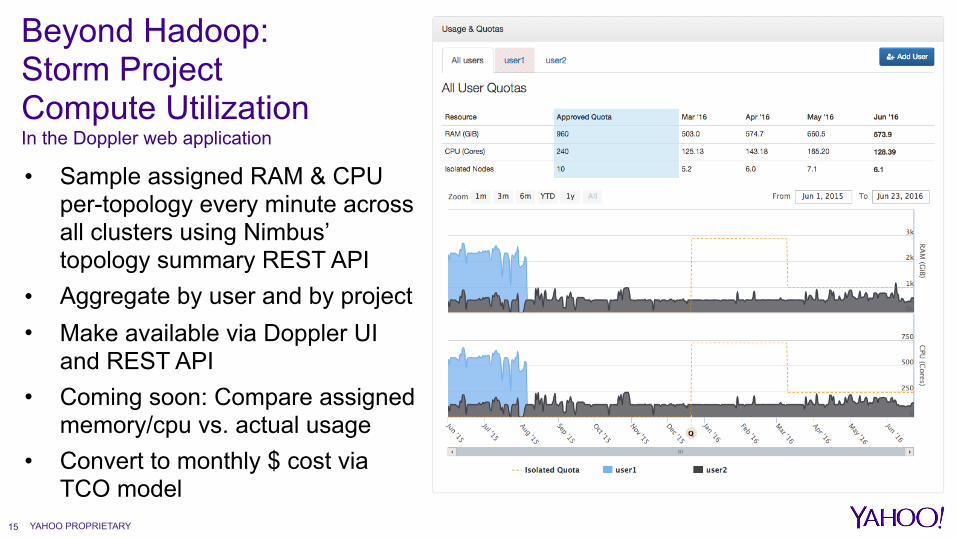
Beyond Hadoop: Storm Project Compute Utilization In the Doppler web application
• Sample assigned RAM & CPU per-topology every minute across all clusters using Nimbus’ topology summary REST API
• Aggregate by user and by project • Make available via Doppler UI
and REST API • Coming soon: Compare assigned
memory/cpu vs. actual usage • Convert to monthly $ cost via
TCO model
● Get compute resource usage for all Hadoop apps through YARN-415
● Store historical Hadoop resource utilization at the cluster, queue, user, and project levels
● Store historical Storm resource utilization at the topology, user and project levels
● Developed a cost model and applied to it compute monthly cost for all Hadoop and Storm projects
● Make utilization and cost data and charts available web apps and REST APIs
YAHOO PROPRIETARY
Recap
16
Resource and cost tracking for Hadoop & Storm
• Visibility and cost for NameNode operations
• Visibility and cost for network utilization in Storm
• Identify waste when there are large gaps between allocated and peak used container memory (Downsizer)
• Move to an OPEX model for where teams just pay for what they use
YAHOO PROPRIETARY
The mission continues…
17
Image by Reinhard Kuchenbäcker @ h3ps://flic.kr/p/naFkFH (CC BY 2.0)

Q&AAuthors:
• Kendall Thrapp • Shawna Martell • Alessandro Bellina • Eric Payne • Sumeet Singh
Related Documents