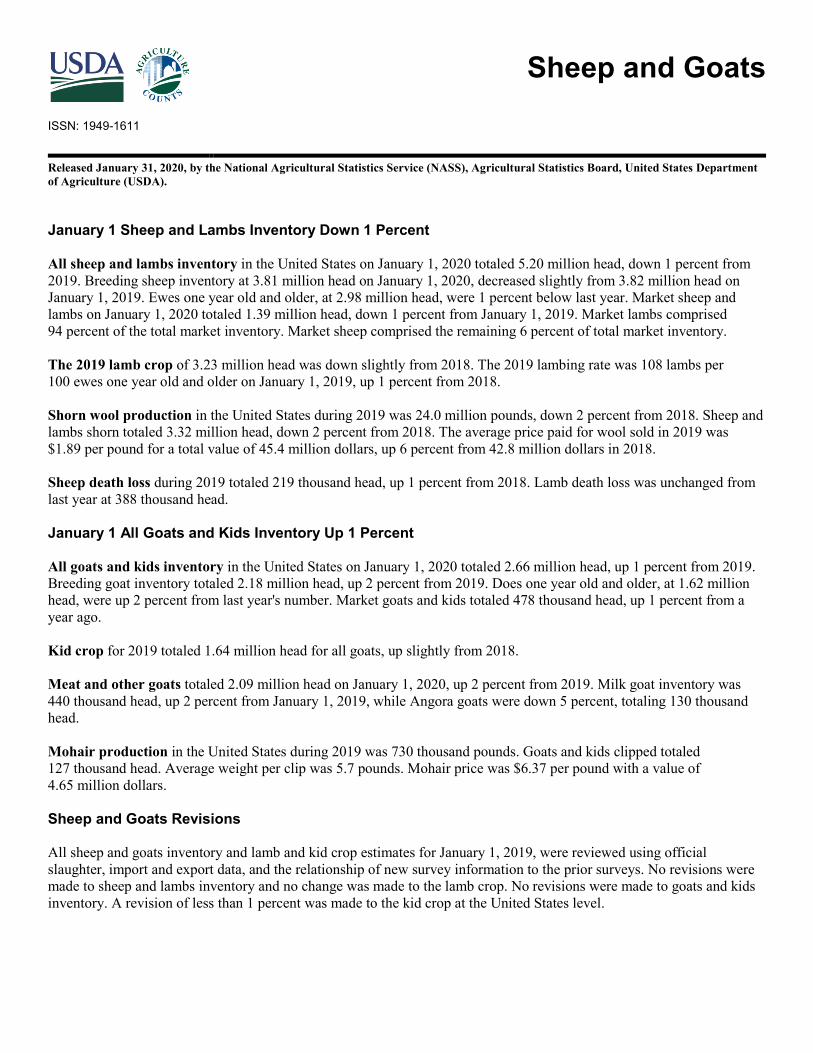
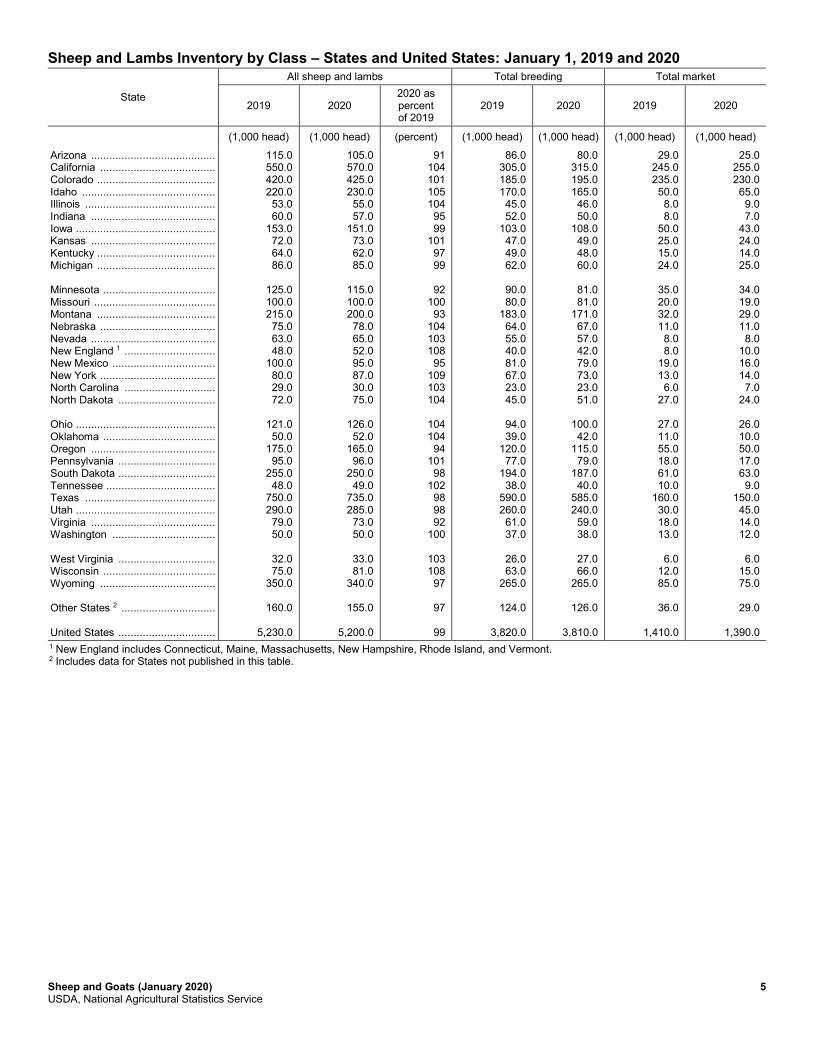
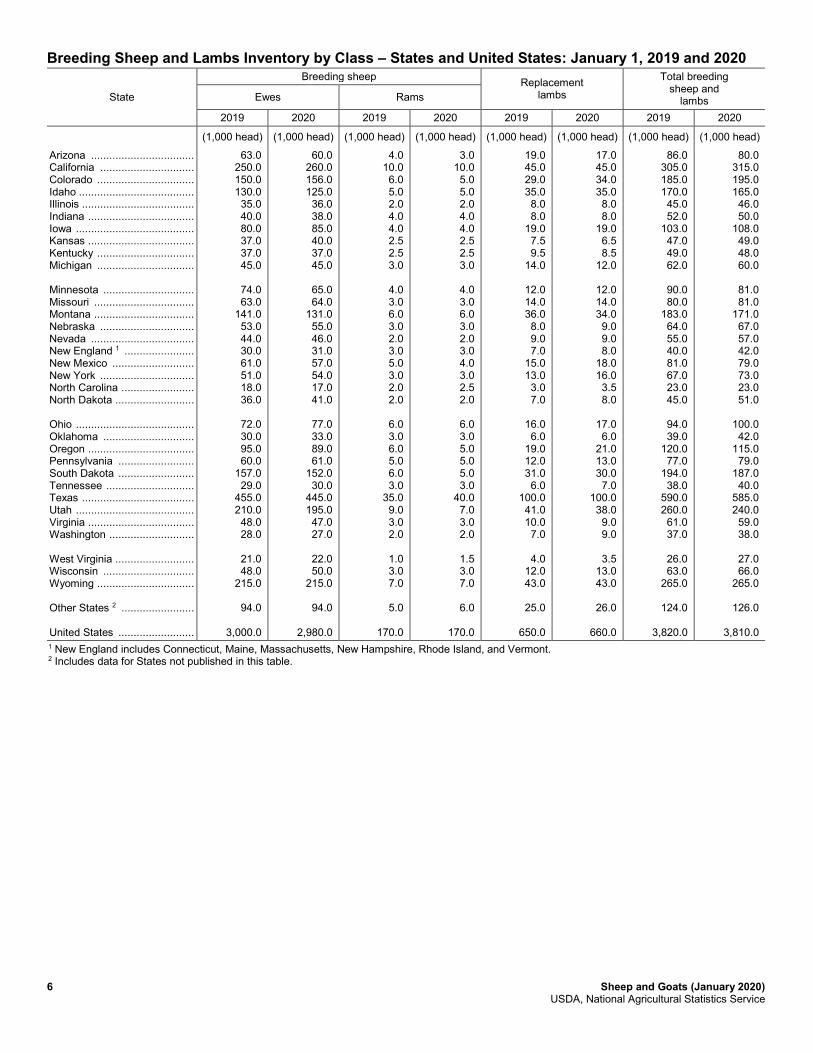
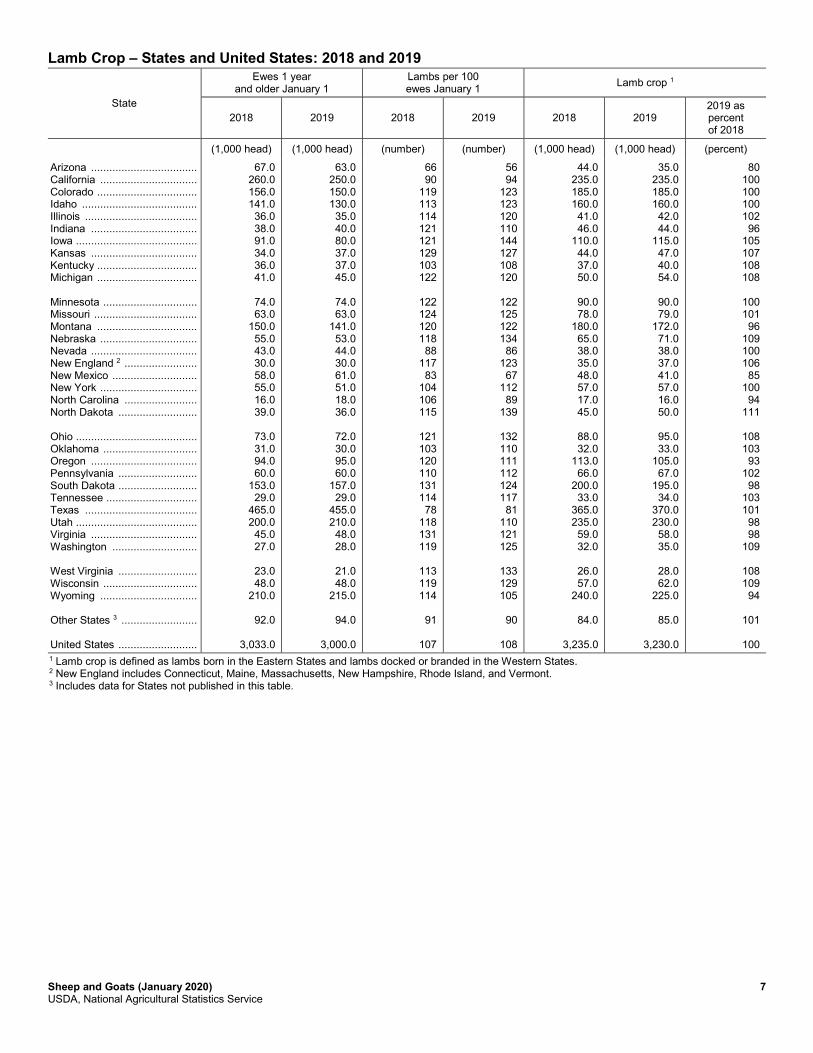
Sheep and Goats ISSN: 1949-1611 Released January 31, 2020, by the National Agricultural Statistics Service (NASS), Agricultural Statistics Board, United States Department of Agriculture (USDA). January 1 Sheep and Lambs Inventory Down 1 Percent All sheep and lambs inventory in the United States on January 1, 2020 totaled 5.20 million head, down 1 percent from 2019. Breeding sheep inventory at 3.81 million head on January 1, 2020, decreased slightly from 3.82 million head on January 1, 2019. Ewes one year old and older, at 2.98 million head, were 1 percent below last year. Market sheep and lambs on January 1, 2020 totaled 1.39 million head, down 1 percent from January 1, 2019. Market lambs comprised 94 percent of the total market inventory. Market sheep comprised the remaining 6 percent of total market inventory. The 2019 lamb crop of 3.23 million head was down slightly from 2018. The 2019 lambing rate was 108 lambs per 100 ewes one year old and older on January 1, 2019, up 1 percent from 2018. Shorn wool production in the United States during 2019 was 24.0 million pounds, down 2 percent from 2018. Sheep and lambs shorn totaled 3.32 million head, down 2 percent from 2018. The average price paid for wool sold in 2019 was $1.89 per pound for a total value of 45.4 million dollars, up 6 percent from 42.8 million dollars in 2018. Sheep death loss during 2019 totaled 219 thousand head, up 1 percent from 2018. Lamb death loss was unchanged from last year at 388 thousand head. January 1 All Goats and Kids Inventory Up 1 Percent All goats and kids inventory in the United States on January 1, 2020 totaled 2.66 million head, up 1 percent from 2019. Breeding goat inventory totaled 2.18 million head, up 2 percent from 2019. Does one year old and older, at 1.62 million head, were up 2 percent from last year's number. Market goats and kids totaled 478 thousand head, up 1 percent from a year ago. Kid crop for 2019 totaled 1.64 million head for all goats, up slightly from 2018. Meat and other goats totaled 2.09 million head on January 1, 2020, up 2 percent from 2019. Milk goat inventory was 440 thousand head, up 2 percent from January 1, 2019, while Angora goats were down 5 percent, totaling 130 thousand head. Mohair production in the United States during 2019 was 730 thousand pounds. Goats and kids clipped totaled 127 thousand head. Average weight per clip was 5.7 pounds. Mohair price was $6.37 per pound with a value of 4.65 million dollars. Sheep and Goats Revisions All sheep and goats inventory and lamb and kid crop estimates for January 1, 2019, were reviewed using official slaughter, import and export data, and the relationship of new survey information to the prior surveys. No revisions were made to sheep and lambs inventory and no change was made to the lamb crop. No revisions were made to goats and kids inventory. A revision of less than 1 percent was made to the kid crop at the United States level.

Welcome message from author
This document is posted to help you gain knowledge. Please leave a comment to let me know what you think about it! Share it to your friends and learn new things together.
Transcript
Sheep and Goats
ISSN: 1949-1611
Released January 31, 2020, by the National Agricultural Statistics Service (NASS), Agricultural Statistics Board, United States Department of Agriculture (USDA). January 1 Sheep and Lambs Inventory Down 1 Percent All sheep and lambs inventory in the United States on January 1, 2020 totaled 5.20 million head, down 1 percent from 2019. Breeding sheep inventory at 3.81 million head on January 1, 2020, decreased slightly from 3.82 million head on January 1, 2019. Ewes one year old and older, at 2.98 million head, were 1 percent below last year. Market sheep and lambs on January 1, 2020 totaled 1.39 million head, down 1 percent from January 1, 2019. Market lambs comprised 94 percent of the total market inventory. Market sheep comprised the remaining 6 percent of total market inventory. The 2019 lamb crop of 3.23 million head was down slightly from 2018. The 2019 lambing rate was 108 lambs per 100 ewes one year old and older on January 1, 2019, up 1 percent from 2018. Shorn wool production in the United States during 2019 was 24.0 million pounds, down 2 percent from 2018. Sheep and lambs shorn totaled 3.32 million head, down 2 percent from 2018. The average price paid for wool sold in 2019 was $1.89 per pound for a total value of 45.4 million dollars, up 6 percent from 42.8 million dollars in 2018. Sheep death loss during 2019 totaled 219 thousand head, up 1 percent from 2018. Lamb death loss was unchanged from last year at 388 thousand head. January 1 All Goats and Kids Inventory Up 1 Percent All goats and kids inventory in the United States on January 1, 2020 totaled 2.66 million head, up 1 percent from 2019. Breeding goat inventory totaled 2.18 million head, up 2 percent from 2019. Does one year old and older, at 1.62 million head, were up 2 percent from last year's number. Market goats and kids totaled 478 thousand head, up 1 percent from a year ago. Kid crop for 2019 totaled 1.64 million head for all goats, up slightly from 2018. Meat and other goats totaled 2.09 million head on January 1, 2020, up 2 percent from 2019. Milk goat inventory was 440 thousand head, up 2 percent from January 1, 2019, while Angora goats were down 5 percent, totaling 130 thousand head. Mohair production in the United States during 2019 was 730 thousand pounds. Goats and kids clipped totaled 127 thousand head. Average weight per clip was 5.7 pounds. Mohair price was $6.37 per pound with a value of 4.65 million dollars. Sheep and Goats Revisions All sheep and goats inventory and lamb and kid crop estimates for January 1, 2019, were reviewed using official slaughter, import and export data, and the relationship of new survey information to the prior surveys. No revisions were made to sheep and lambs inventory and no change was made to the lamb crop. No revisions were made to goats and kids inventory. A revision of less than 1 percent was made to the kid crop at the United States level.

2 Sheep and Goats (January 2020) USDA, National Agricultural Statistics Service
This page intentionally left blank
Sheep and Goats (January 2020) 3 USDA, National Agricultural Statistics Service
Contents
Sheep and Lambs Inventory by Class – United States: January 1, 2019 and 2020................................................................. 4
All Sheep and Lambs Inventory – United States: January 1 ................................................................................................... 4
Wool Production, Price, and Value – United States: 2018 and 2019 ...................................................................................... 4
Sheep and Lambs Inventory by Class – States and United States: January 1, 2019 and 2020 ............................................... 5
Breeding Sheep and Lambs Inventory by Class – States and United States: January 1, 2019 and 2020 ................................ 6
Lamb Crop – States and United States: 2018 and 2019 .......................................................................................................... 7
Market Sheep and Lambs Inventory by Weight Group – States and United States: January 1, 2019 .................................... 8
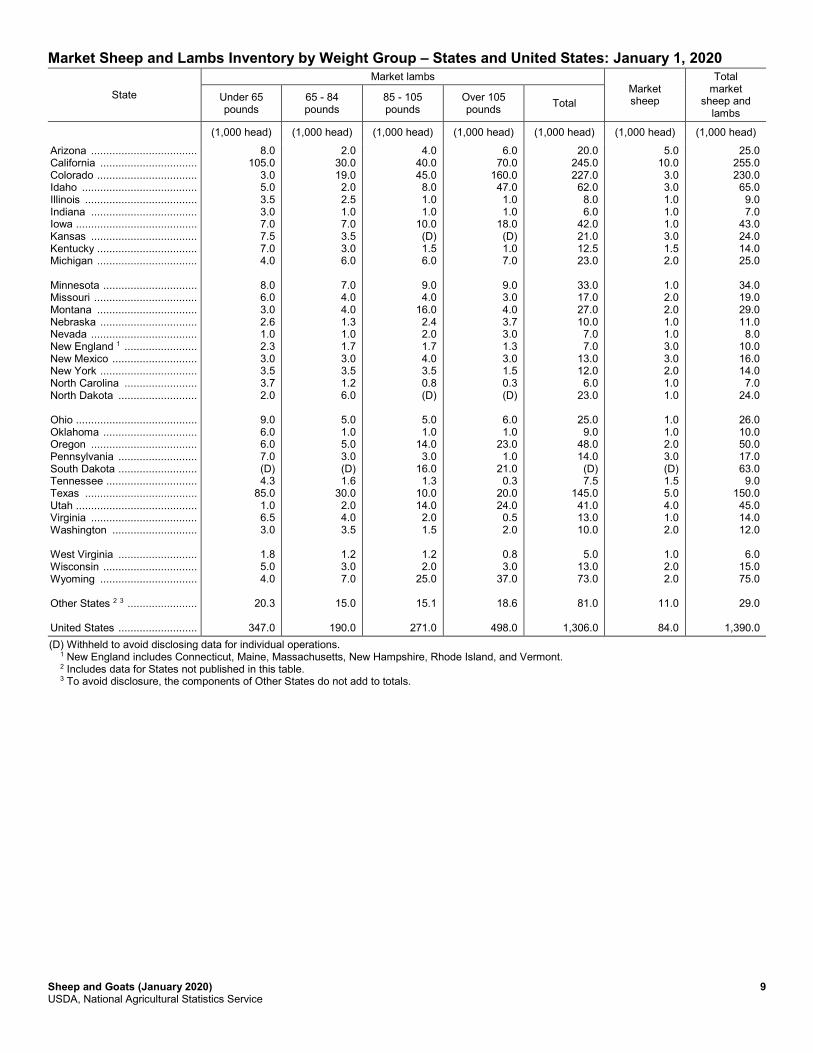
Market Sheep and Lambs Inventory by Weight Group – States and United States: January 1, 2020 .................................... 9
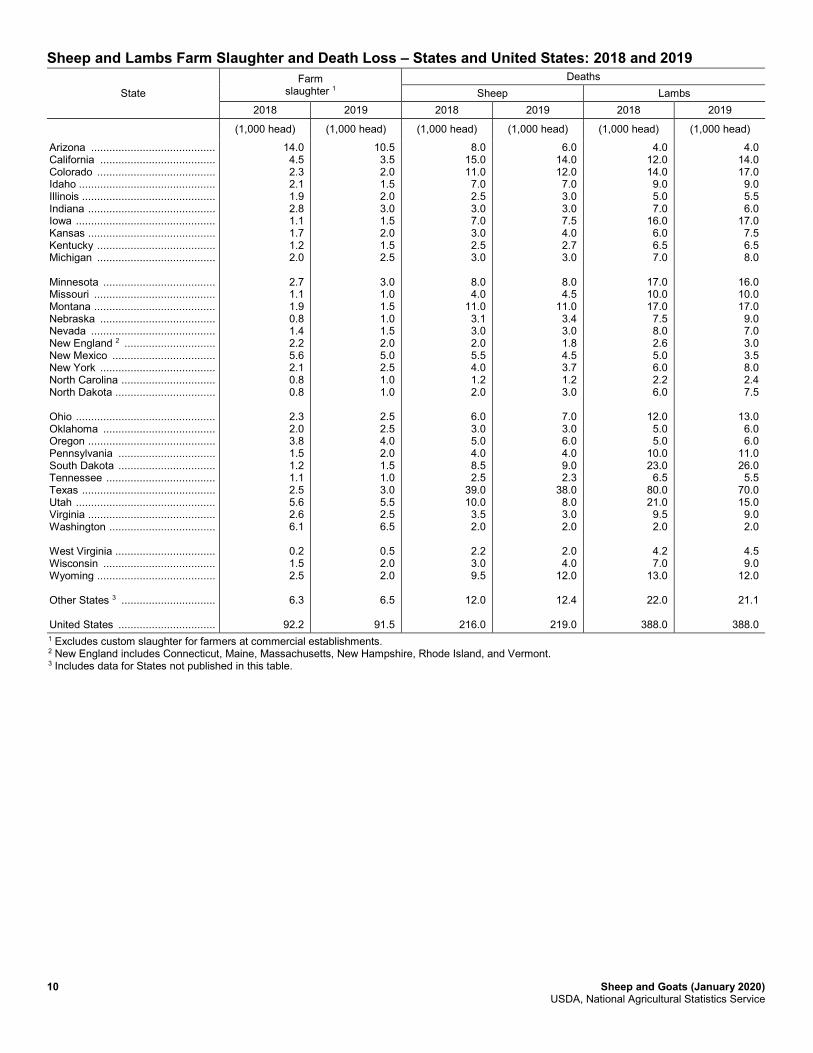
Sheep and Lambs Farm Slaughter and Death Loss – States and United States: 2018 and 2019 .......................................... 10
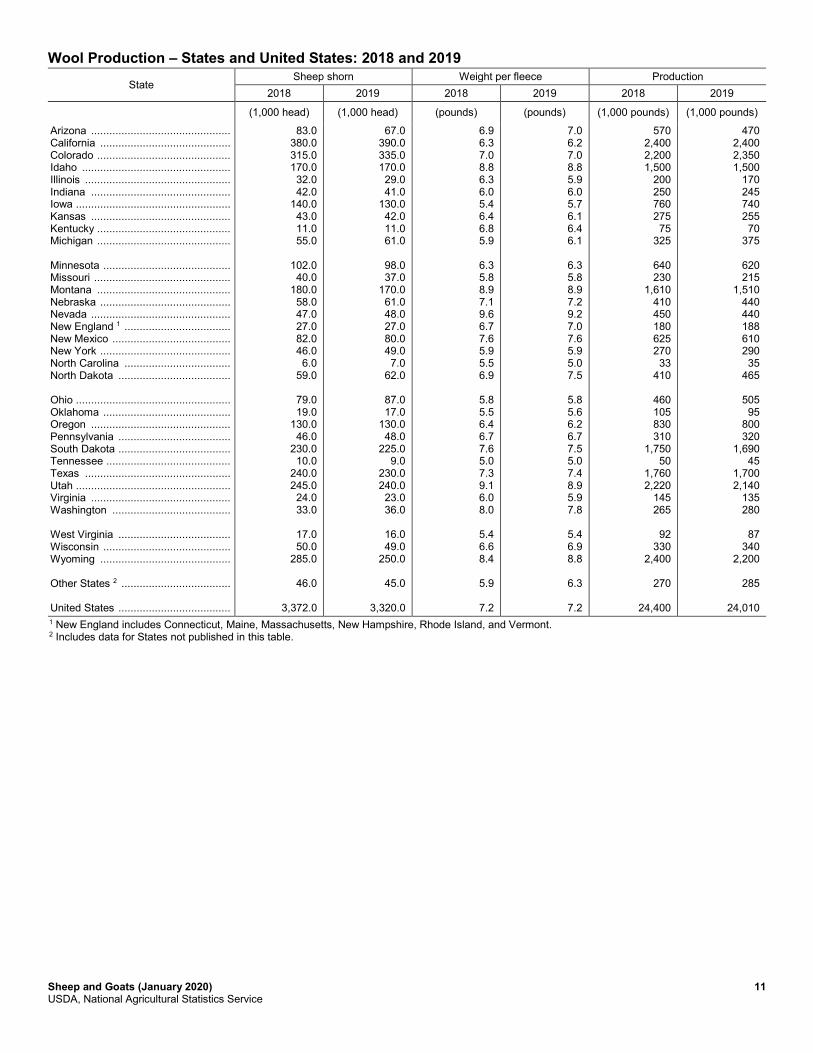
Wool Production – States and United States: 2018 and 2019 ............................................................................................... 11
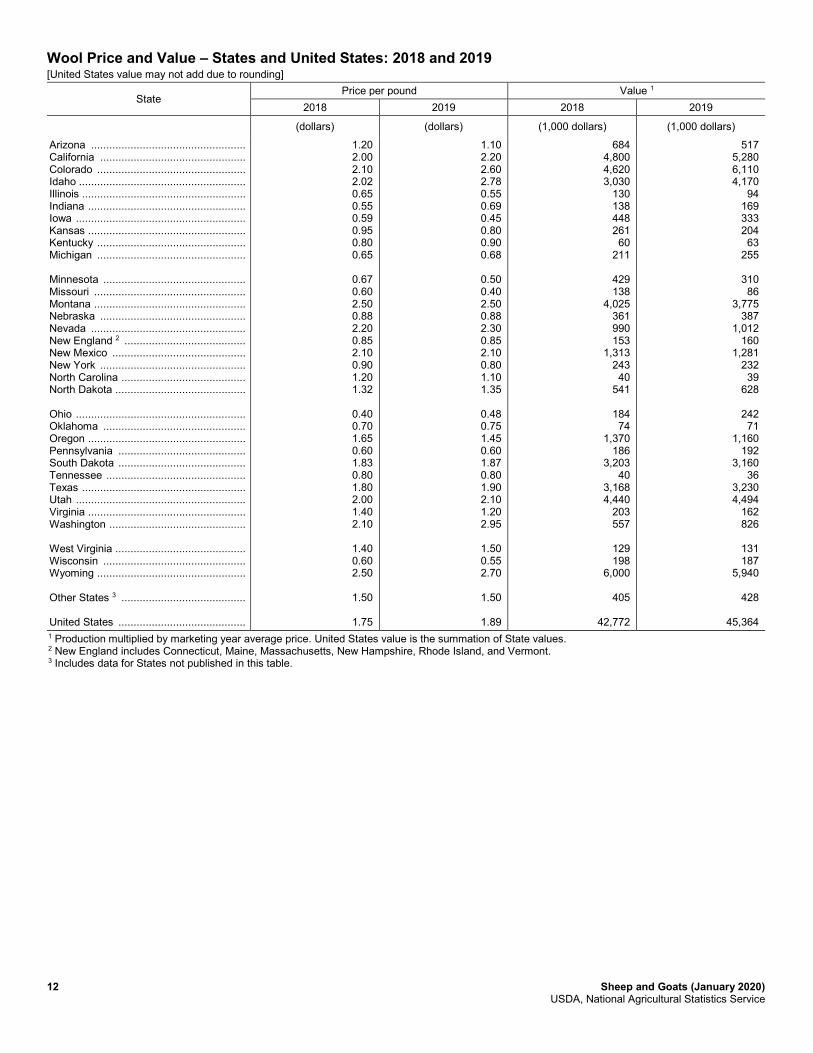
Wool Price and Value – States and United States: 2018 and 2019 ....................................................................................... 12
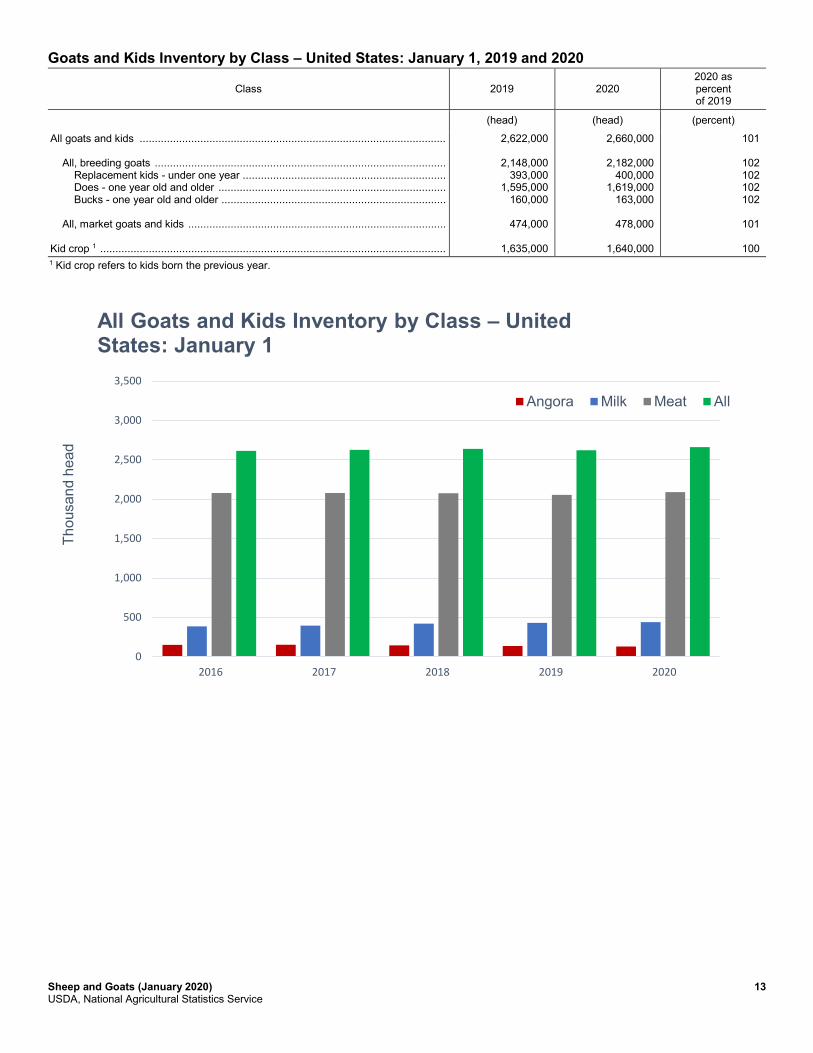
Goats and Kids Inventory by Class – United States: January 1, 2019 and 2020 .................................................................. 13
All Goats and Kids Inventory by Class – United States: January 1 ...................................................................................... 13
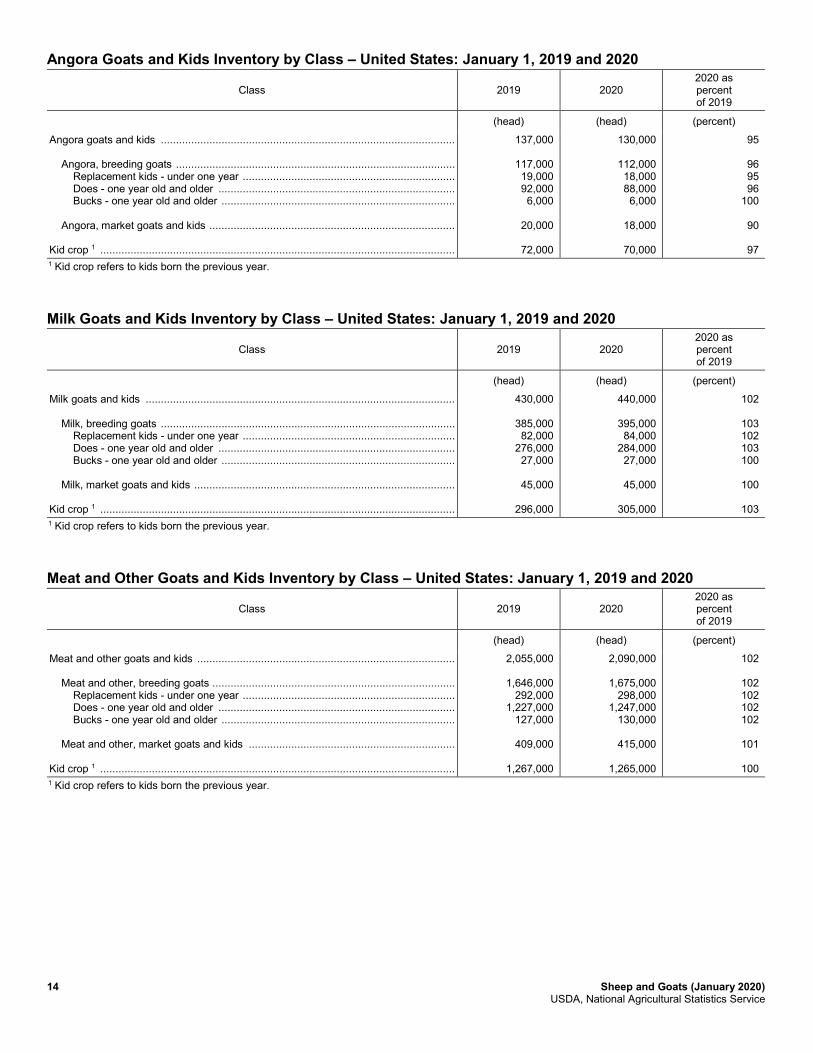
Angora Goats and Kids Inventory by Class – United States: January 1, 2019 and 2020 ..................................................... 14
Milk Goats and Kids Inventory by Class – United States: January 1, 2019 and 2020.......................................................... 14
Meat and Other Goats and Kids Inventory by Class – United States: January 1, 2019 and 2020 ........................................ 14
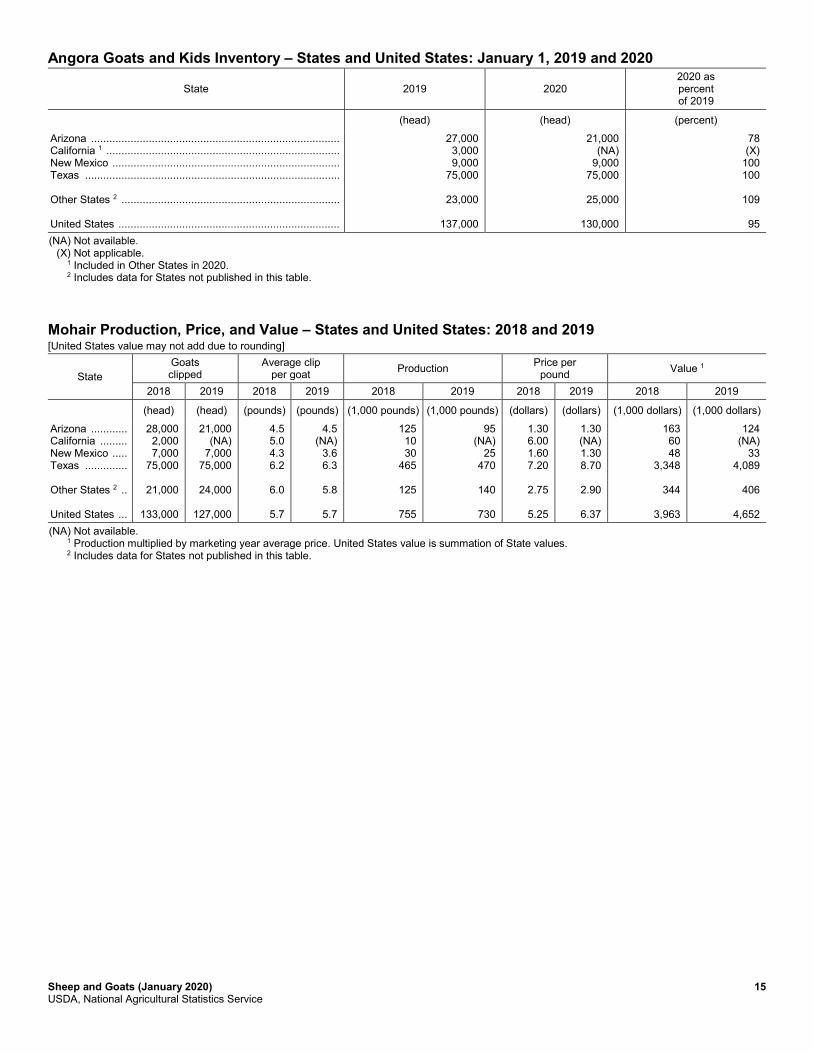
Angora Goats and Kids Inventory – States and United States: January 1, 2019 and 2020 ................................................... 15
Mohair Production, Price, and Value – States and United States: 2018 and 2019 ............................................................... 15
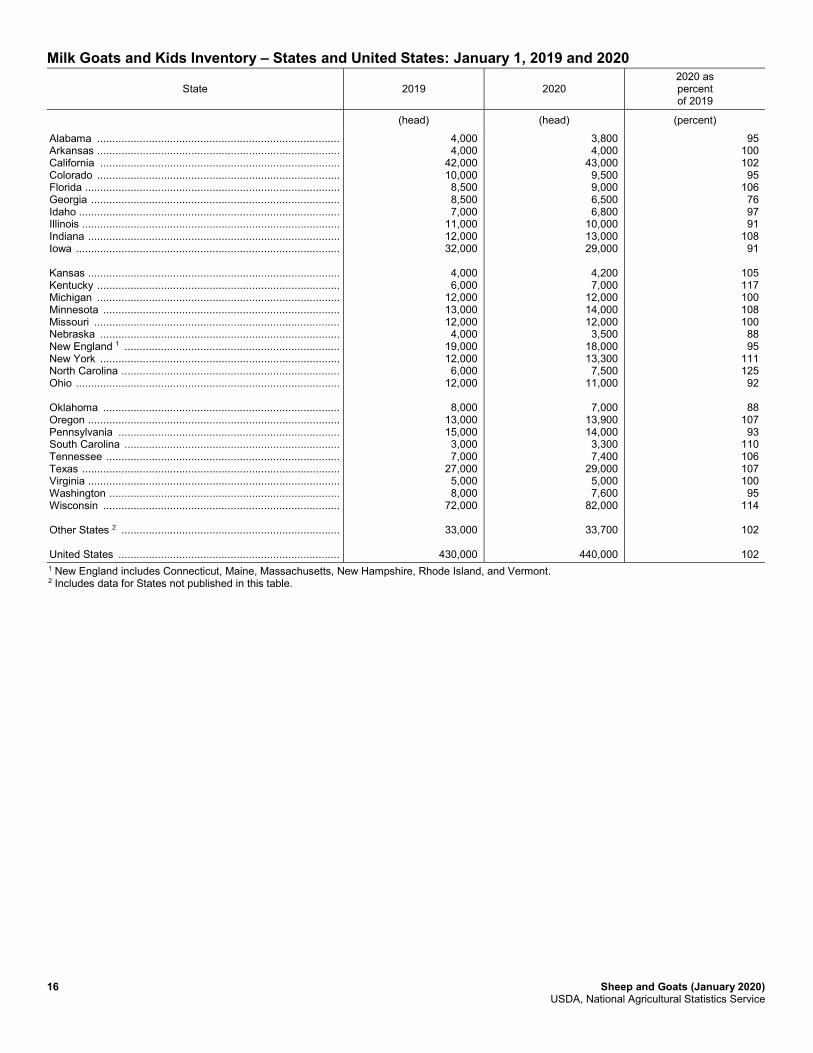
Milk Goats and Kids Inventory – States and United States: January 1, 2019 and 2020 ....................................................... 16
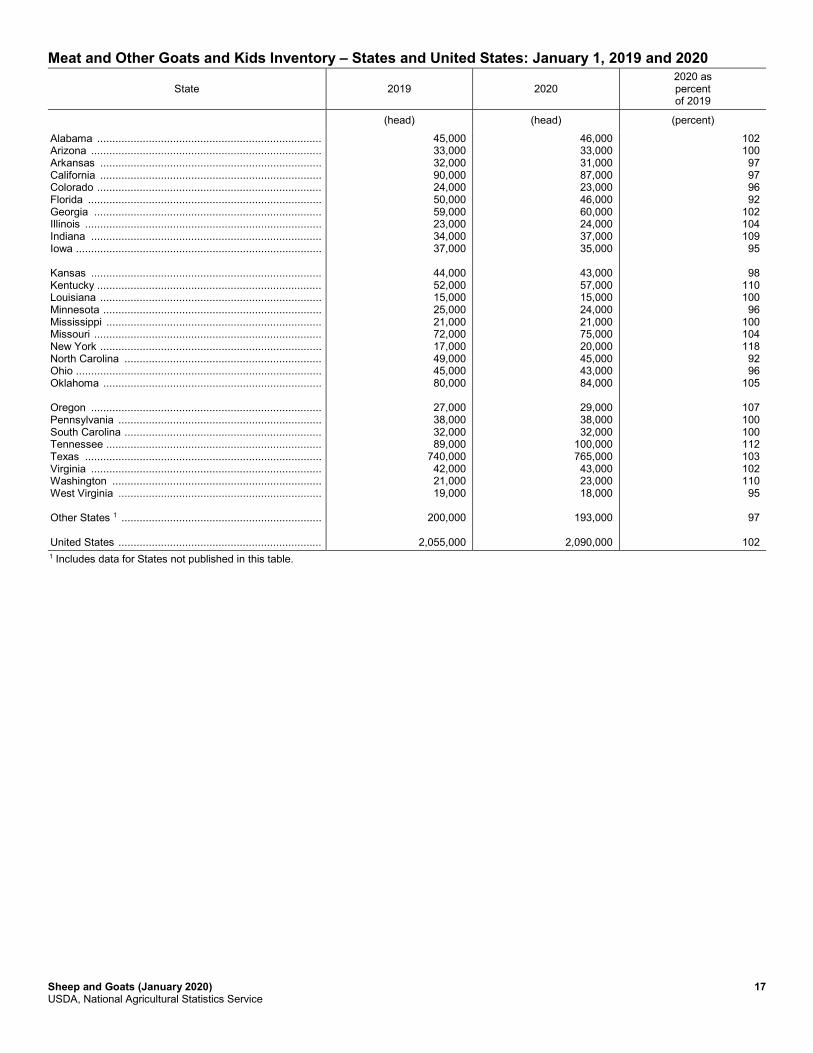
Meat and Other Goats and Kids Inventory – States and United States: January 1, 2019 and 2020 ...................................... 17
Statistical Methodology ........................................................................................................................................................ 18
Reliability of January 1 Sheep and Lambs Estimates ........................................................................................................... 19
Information Contacts ............................................................................................................................................................ 19

4 Sheep and Goats (January 2020) USDA, National Agricultural Statistics Service
Sheep and Lambs Inventory by Class – United States: January 1, 2019 and 2020
Class 2019 2020 2020 as percent of 2019
(1,000 head) (1,000 head) (percent)
All sheep and lambs ........................................................................................ Breeding sheep and lambs .......................................................................... Replacement lambs under one year old .................................................. Ewes - one year old and older ................................................................. Rams - one year old and older ................................................................ Market sheep and lambs .............................................................................
5,230.0
3,820.0
650.0
3,000.0
170.0
1,410.0
5,200.0
3,810.0
660.0
2,980.0
170.0
1,390.0
99
100
102
99
100
99
Wool Production, Price, and Value – United States: 2018 and 2019 Year Sheep
shorn 1 Weight
per fleece Shorn wool production
Price per pound Value 2
(1,000 head) (pounds) (1,000 pounds) (dollars) (1,000 dollars)
2018 .............................. 2019 ..............................
3,372 3,320
7.2 7.2
24,400 24,010
1.75 1.89
42,772 45,364
1 Includes shearing at commercial feeding yards. 2 Production multiplied by marketing year average price. United States value is the summation of State values.
1,000
2,000
3,000
4,000
5,000
6,000
7,000
2006 2008 2010 2012 2014 2016 2018 2020
Thou
sand
hea
d
All Sheep and Lambs Inventory – United States: January 1
Total Breeding Market
Sheep and Goats (January 2020) 5 USDA, National Agricultural Statistics Service
Sheep and Lambs Inventory by Class – States and United States: January 1, 2019 and 2020
State
All sheep and lambs Total breeding Total market
2019 2020 2020 as percent of 2019
2019 2020 2019 2020
(1,000 head) (1,000 head) (percent) (1,000 head) (1,000 head) (1,000 head) (1,000 head)
Arizona ......................................... California ...................................... Colorado ....................................... Idaho ............................................ Illinois ........................................... Indiana ......................................... Iowa .............................................. Kansas ......................................... Kentucky ....................................... Michigan ....................................... Minnesota ..................................... Missouri ........................................ Montana ....................................... Nebraska ...................................... Nevada ......................................... New England 1 .............................. New Mexico .................................. New York ...................................... North Carolina .............................. North Dakota ................................ Ohio .............................................. Oklahoma ..................................... Oregon ......................................... Pennsylvania ................................ South Dakota ................................ Tennessee .................................... Texas ........................................... Utah .............................................. Virginia ......................................... Washington .................................. West Virginia ................................ Wisconsin ..................................... Wyoming ...................................... Other States 2 ............................... United States ................................
115.0 550.0 420.0 220.0 53.0 60.0
153.0 72.0 64.0 86.0
125.0 100.0 215.0 75.0 63.0 48.0
100.0 80.0 29.0 72.0
121.0 50.0
175.0 95.0
255.0 48.0
750.0 290.0 79.0 50.0
32.0 75.0
350.0
160.0
5,230.0
105.0 570.0 425.0 230.0 55.0 57.0
151.0 73.0 62.0 85.0
115.0 100.0 200.0 78.0 65.0 52.0 95.0 87.0 30.0 75.0
126.0 52.0
165.0 96.0
250.0 49.0
735.0 285.0 73.0 50.0
33.0 81.0
340.0
155.0
5,200.0
91 104 101 105 104 95 99
101 97 99
92
100 93
104 103 108 95
109 103 104
104 104 94
101 98
102 98 98 92
100
103 108 97
97
99
86.0 305.0 185.0 170.0 45.0 52.0
103.0 47.0 49.0 62.0
90.0 80.0
183.0 64.0 55.0 40.0 81.0 67.0 23.0 45.0
94.0 39.0
120.0 77.0
194.0 38.0
590.0 260.0 61.0 37.0
26.0 63.0
265.0
124.0
3,820.0
80.0 315.0 195.0 165.0 46.0 50.0
108.0 49.0 48.0 60.0
81.0 81.0
171.0 67.0 57.0 42.0 79.0 73.0 23.0 51.0
100.0 42.0
115.0 79.0
187.0 40.0
585.0 240.0 59.0 38.0
27.0 66.0
265.0
126.0
3,810.0
29.0 245.0 235.0 50.0 8.0 8.0
50.0 25.0 15.0 24.0
35.0 20.0 32.0 11.0 8.0 8.0
19.0 13.0 6.0
27.0
27.0 11.0 55.0 18.0 61.0 10.0
160.0 30.0 18.0 13.0
6.0
12.0 85.0
36.0
1,410.0
25.0 255.0 230.0 65.0 9.0 7.0
43.0 24.0 14.0 25.0
34.0 19.0 29.0 11.0 8.0
10.0 16.0 14.0 7.0
24.0
26.0 10.0 50.0 17.0 63.0 9.0
150.0 45.0 14.0 12.0
6.0
15.0 75.0
29.0
1,390.0
1 New England includes Connecticut, Maine, Massachusetts, New Hampshire, Rhode Island, and Vermont. 2 Includes data for States not published in this table.
6 Sheep and Goats (January 2020) USDA, National Agricultural Statistics Service
Breeding Sheep and Lambs Inventory by Class – States and United States: January 1, 2019 and 2020
State
Breeding sheep Replacement lambs
Total breeding sheep and
lambs Ewes Rams
2019 2020 2019 2020 2019 2020 2019 2020
(1,000 head) (1,000 head) (1,000 head) (1,000 head) (1,000 head) (1,000 head) (1,000 head) (1,000 head)
Arizona .................................. California ............................... Colorado ................................ Idaho ...................................... Illinois ..................................... Indiana ................................... Iowa ....................................... Kansas ................................... Kentucky ................................ Michigan ................................ Minnesota .............................. Missouri ................................. Montana ................................. Nebraska ............................... Nevada .................................. New England 1 ....................... New Mexico ........................... New York ............................... North Carolina ........................ North Dakota .......................... Ohio ....................................... Oklahoma .............................. Oregon ................................... Pennsylvania ......................... South Dakota ......................... Tennessee ............................. Texas ..................................... Utah ....................................... Virginia ................................... Washington ............................ West Virginia .......................... Wisconsin .............................. Wyoming ................................ Other States 2 ........................ United States .........................
63.0 250.0 150.0 130.0 35.0 40.0 80.0 37.0 37.0 45.0
74.0 63.0
141.0 53.0 44.0 30.0 61.0 51.0 18.0 36.0
72.0 30.0 95.0 60.0
157.0 29.0
455.0 210.0 48.0 28.0
21.0 48.0
215.0
94.0
3,000.0
60.0 260.0 156.0 125.0 36.0 38.0 85.0 40.0 37.0 45.0
65.0 64.0
131.0 55.0 46.0 31.0 57.0 54.0 17.0 41.0
77.0 33.0 89.0 61.0
152.0 30.0
445.0 195.0 47.0 27.0
22.0 50.0
215.0
94.0
2,980.0
4.0 10.0 6.0 5.0 2.0 4.0 4.0 2.5 2.5 3.0
4.0 3.0 6.0 3.0 2.0 3.0 5.0 3.0 2.0 2.0
6.0 3.0 6.0 5.0 6.0 3.0
35.0 9.0 3.0 2.0
1.0 3.0 7.0
5.0
170.0
3.0 10.0 5.0 5.0 2.0 4.0 4.0 2.5 2.5 3.0
4.0 3.0 6.0 3.0 2.0 3.0 4.0 3.0 2.5 2.0
6.0 3.0 5.0 5.0 5.0 3.0
40.0 7.0 3.0 2.0
1.5 3.0 7.0
6.0
170.0
19.0 45.0 29.0 35.0 8.0 8.0
19.0 7.5 9.5
14.0
12.0 14.0 36.0 8.0 9.0 7.0
15.0 13.0 3.0 7.0
16.0 6.0
19.0 12.0 31.0 6.0
100.0 41.0 10.0 7.0
4.0
12.0 43.0
25.0
650.0
17.0 45.0 34.0 35.0 8.0 8.0
19.0 6.5 8.5
12.0
12.0 14.0 34.0 9.0 9.0 8.0
18.0 16.0 3.5 8.0
17.0 6.0
21.0 13.0 30.0 7.0
100.0 38.0 9.0 9.0
3.5
13.0 43.0
26.0
660.0
86.0 305.0 185.0 170.0 45.0 52.0
103.0 47.0 49.0 62.0
90.0 80.0
183.0 64.0 55.0 40.0 81.0 67.0 23.0 45.0
94.0 39.0
120.0 77.0
194.0 38.0
590.0 260.0 61.0 37.0
26.0 63.0
265.0
124.0
3,820.0
80.0 315.0 195.0 165.0 46.0 50.0
108.0 49.0 48.0 60.0
81.0 81.0
171.0 67.0 57.0 42.0 79.0 73.0 23.0 51.0
100.0 42.0
115.0 79.0
187.0 40.0
585.0 240.0 59.0 38.0
27.0 66.0
265.0
126.0
3,810.0 1 New England includes Connecticut, Maine, Massachusetts, New Hampshire, Rhode Island, and Vermont. 2 Includes data for States not published in this table.
Sheep and Goats (January 2020) 7 USDA, National Agricultural Statistics Service
Lamb Crop – States and United States: 2018 and 2019
State
Ewes 1 year and older January 1
Lambs per 100 ewes January 1 Lamb crop 1
2018 2019 2018 2019 2018 2019 2019 as percent of 2018
(1,000 head) (1,000 head) (number) (number) (1,000 head) (1,000 head) (percent)
Arizona ................................... California ................................ Colorado ................................. Idaho ...................................... Illinois ..................................... Indiana ................................... Iowa ........................................ Kansas ................................... Kentucky ................................. Michigan ................................. Minnesota ............................... Missouri .................................. Montana ................................. Nebraska ................................ Nevada ................................... New England 2 ........................ New Mexico ............................ New York ................................ North Carolina ........................ North Dakota .......................... Ohio ........................................ Oklahoma ............................... Oregon ................................... Pennsylvania .......................... South Dakota .......................... Tennessee .............................. Texas ..................................... Utah ........................................ Virginia ................................... Washington ............................ West Virginia .......................... Wisconsin ............................... Wyoming ................................ Other States 3 ......................... United States ..........................
67.0 260.0 156.0 141.0 36.0 38.0 91.0 34.0 36.0 41.0
74.0 63.0
150.0 55.0 43.0 30.0 58.0 55.0 16.0 39.0
73.0 31.0 94.0 60.0
153.0 29.0
465.0 200.0 45.0 27.0
23.0 48.0
210.0
92.0
3,033.0
63.0 250.0 150.0 130.0 35.0 40.0 80.0 37.0 37.0 45.0
74.0 63.0
141.0 53.0 44.0 30.0 61.0 51.0 18.0 36.0
72.0 30.0 95.0 60.0
157.0 29.0
455.0 210.0 48.0 28.0
21.0 48.0
215.0
94.0
3,000.0
66 90
119 113 114 121 121 129 103 122
122 124 120 118 88
117 83
104 106 115
121 103 120 110 131 114 78
118 131 119
113 119 114
91
107
56 94
123 123 120 110 144 127 108 120
122 125 122 134 86
123 67
112 89
139
132 110 111 112 124 117 81
110 121 125
133 129 105
90
108
44.0 235.0 185.0 160.0 41.0 46.0
110.0 44.0 37.0 50.0
90.0 78.0
180.0 65.0 38.0 35.0 48.0 57.0 17.0 45.0
88.0 32.0
113.0 66.0
200.0 33.0
365.0 235.0 59.0 32.0
26.0 57.0
240.0
84.0
3,235.0
35.0 235.0 185.0 160.0 42.0 44.0
115.0 47.0 40.0 54.0
90.0 79.0
172.0 71.0 38.0 37.0 41.0 57.0 16.0 50.0
95.0 33.0
105.0 67.0
195.0 34.0
370.0 230.0 58.0 35.0
28.0 62.0
225.0
85.0
3,230.0
80 100 100 100 102 96
105 107 108 108
100 101 96
109 100 106 85
100 94
111
108 103 93
102 98
103 101 98 98
109
108 109 94
101
100
1 Lamb crop is defined as lambs born in the Eastern States and lambs docked or branded in the Western States. 2 New England includes Connecticut, Maine, Massachusetts, New Hampshire, Rhode Island, and Vermont. 3 Includes data for States not published in this table.

8 Sheep and Goats (January 2020) USDA, National Agricultural Statistics Service
Market Sheep and Lambs Inventory by Weight Group – States and United States: January 1, 2019
State
Market lambs Market sheep
Total market
sheep and lambs
Under 65 pounds
65 - 84 pounds
85 - 105 pounds
Over 105 pounds Total
(1,000 head) (1,000 head) (1,000 head) (1,000 head) (1,000 head) (1,000 head) (1,000 head)
Arizona ................................... California ................................ Colorado ................................. Idaho ....................................... Illinois ...................................... Indiana .................................... Iowa ........................................ Kansas .................................... Kentucky ................................. Michigan ................................. Minnesota ............................... Missouri .................................. Montana .................................. Nebraska ................................ Nevada ................................... New England 1 ........................ New Mexico ............................ New York ................................ North Carolina ......................... North Dakota ........................... Ohio ........................................ Oklahoma ............................... Oregon .................................... Pennsylvania .......................... South Dakota .......................... Tennessee .............................. Texas ...................................... Utah ........................................ Virginia .................................... Washington ............................. West Virginia ........................... Wisconsin ............................... Wyoming ................................. Other States 2 3 ....................... United States ..........................
11.0 100.0
5.0 3.0 3.0 3.0 7.0
10.0 6.0 3.0
9.0 6.0 2.0 2.7 1.0 2.0 5.0 3.0 2.8 2.0
8.0 7.0 7.0 8.0 (D) 5.5
95.0 2.0 7.0 3.0
2.0 3.0 1.0
23.0
358.0
2.0 30.0 20.0 4.0 2.0 2.0 6.0 1.7 3.0 6.0
6.0 5.0 8.0 1.7 1.0 1.4 6.0 4.0 1.4 8.0
6.0 1.0 7.0 3.0 (D) 1.8
25.0 2.0 6.0 3.0
1.0 2.0
12.0
16.0
205.0
5.0 40.0 60.0 9.0 1.0 1.0
14.0 (D) 2.0 5.0
8.0 4.0
13.0 2.6 2.0 1.6 4.0 3.0 0.7 9.0
5.0 1.0
10.0 2.0
16.0 1.3
10.0 11.0 2.0 2.0
1.0 2.0
32.0
9.8
290.0
7.0 65.0
148.0 31.0 1.0 1.0
20.0 (D) 2.0 8.0
11.0 3.0 7.0 3.0 3.0 1.0 2.0 1.0 0.1 7.0
7.0 1.0
28.0 1.0
25.0 0.4
20.0 13.0 1.0 3.0
1.0 4.0
38.0
11.5
475.0
25.0 235.0 233.0 47.0 7.0 7.0
47.0 (D)
13.0 22.0
34.0 18.0 30.0 10.0 7.0 6.0
17.0 11.0 5.0
26.0
26.0 10.0 52.0 14.0 59.0 9.0
150.0 28.0 16.0 11.0
5.0
11.0 83.0
54.0
1,328.0
4.0 10.0 2.0 3.0 1.0 1.0 3.0 (D) 2.0 2.0
1.0 2.0 2.0 1.0 1.0 2.0 2.0 2.0 1.0 1.0
1.0 1.0 3.0 4.0 2.0 1.0
10.0 2.0 2.0 2.0
1.0 1.0 2.0
7.0
82.0
29.0 245.0 235.0 50.0 8.0 8.0
50.0 25.0 15.0 24.0
35.0 20.0 32.0 11.0 8.0 8.0
19.0 13.0 6.0
27.0
27.0 11.0 55.0 18.0 61.0 10.0
160.0 30.0 18.0 13.0
6.0
12.0 85.0
36.0
1,410.0
(D) Withheld to avoid disclosing data for individual operations. 1 New England includes Connecticut, Maine, Massachusetts, New Hampshire, Rhode Island, and Vermont. 2 Includes data for States not published in this table. 3 To avoid disclosure, the components of Other States do not add to totals.
Sheep and Goats (January 2020) 9 USDA, National Agricultural Statistics Service
Market Sheep and Lambs Inventory by Weight Group – States and United States: January 1, 2020
State
Market lambs Market sheep
Total market
sheep and lambs
Under 65 pounds
65 - 84 pounds
85 - 105 pounds
Over 105 pounds Total
(1,000 head) (1,000 head) (1,000 head) (1,000 head) (1,000 head) (1,000 head) (1,000 head)
Arizona ................................... California ................................ Colorado ................................. Idaho ...................................... Illinois ..................................... Indiana ................................... Iowa ........................................ Kansas ................................... Kentucky ................................. Michigan ................................. Minnesota ............................... Missouri .................................. Montana ................................. Nebraska ................................ Nevada ................................... New England 1 ........................ New Mexico ............................ New York ................................ North Carolina ........................ North Dakota .......................... Ohio ........................................ Oklahoma ............................... Oregon ................................... Pennsylvania .......................... South Dakota .......................... Tennessee .............................. Texas ..................................... Utah ........................................ Virginia ................................... Washington ............................ West Virginia .......................... Wisconsin ............................... Wyoming ................................ Other States 2 3 ....................... United States ..........................
8.0 105.0
3.0 5.0 3.5 3.0 7.0 7.5 7.0 4.0
8.0 6.0 3.0 2.6 1.0 2.3 3.0 3.5 3.7 2.0
9.0 6.0 6.0 7.0 (D) 4.3
85.0 1.0 6.5 3.0
1.8 5.0 4.0
20.3
347.0
2.0 30.0 19.0 2.0 2.5 1.0 7.0 3.5 3.0 6.0
7.0 4.0 4.0 1.3 1.0 1.7 3.0 3.5 1.2 6.0
5.0 1.0 5.0 3.0 (D) 1.6
30.0 2.0 4.0 3.5
1.2 3.0 7.0
15.0
190.0
4.0 40.0 45.0 8.0 1.0 1.0
10.0 (D) 1.5 6.0
9.0 4.0
16.0 2.4 2.0 1.7 4.0 3.5 0.8 (D)
5.0 1.0
14.0 3.0
16.0 1.3
10.0 14.0 2.0 1.5
1.2 2.0
25.0
15.1
271.0
6.0 70.0
160.0 47.0 1.0 1.0
18.0 (D) 1.0 7.0
9.0 3.0 4.0 3.7 3.0 1.3 3.0 1.5 0.3 (D)
6.0 1.0
23.0 1.0
21.0 0.3
20.0 24.0 0.5 2.0
0.8 3.0
37.0
18.6
498.0
20.0 245.0 227.0 62.0 8.0 6.0
42.0 21.0 12.5 23.0
33.0 17.0 27.0 10.0 7.0 7.0
13.0 12.0 6.0
23.0
25.0 9.0
48.0 14.0 (D) 7.5
145.0 41.0 13.0 10.0
5.0
13.0 73.0
81.0
1,306.0
5.0 10.0 3.0 3.0 1.0 1.0 1.0 3.0 1.5 2.0
1.0 2.0 2.0 1.0 1.0 3.0 3.0 2.0 1.0 1.0
1.0 1.0 2.0 3.0 (D) 1.5 5.0 4.0 1.0 2.0
1.0 2.0 2.0
11.0
84.0
25.0 255.0 230.0 65.0 9.0 7.0
43.0 24.0 14.0 25.0
34.0 19.0 29.0 11.0 8.0
10.0 16.0 14.0 7.0
24.0
26.0 10.0 50.0 17.0 63.0 9.0
150.0 45.0 14.0 12.0
6.0
15.0 75.0
29.0
1,390.0
(D) Withheld to avoid disclosing data for individual operations. 1 New England includes Connecticut, Maine, Massachusetts, New Hampshire, Rhode Island, and Vermont. 2 Includes data for States not published in this table. 3 To avoid disclosure, the components of Other States do not add to totals.
10 Sheep and Goats (January 2020) USDA, National Agricultural Statistics Service
Sheep and Lambs Farm Slaughter and Death Loss – States and United States: 2018 and 2019
State Farm
slaughter 1 Deaths
Sheep Lambs 2018 2019 2018 2019 2018 2019
(1,000 head) (1,000 head) (1,000 head) (1,000 head) (1,000 head) (1,000 head)
Arizona ......................................... California ...................................... Colorado ....................................... Idaho ............................................. Illinois ............................................ Indiana .......................................... Iowa .............................................. Kansas .......................................... Kentucky ....................................... Michigan ....................................... Minnesota ..................................... Missouri ........................................ Montana ........................................ Nebraska ...................................... Nevada ......................................... New England 2 .............................. New Mexico .................................. New York ...................................... North Carolina ............................... North Dakota ................................. Ohio .............................................. Oklahoma ..................................... Oregon .......................................... Pennsylvania ................................ South Dakota ................................ Tennessee .................................... Texas ............................................ Utah .............................................. Virginia .......................................... Washington ................................... West Virginia ................................. Wisconsin ..................................... Wyoming ....................................... Other States 3 ............................... United States ................................
14.0 4.5 2.3 2.1 1.9 2.8 1.1 1.7 1.2 2.0
2.7 1.1 1.9 0.8 1.4 2.2 5.6 2.1 0.8 0.8
2.3 2.0 3.8 1.5 1.2 1.1 2.5 5.6 2.6 6.1
0.2 1.5 2.5
6.3
92.2
10.5 3.5 2.0 1.5 2.0 3.0 1.5 2.0 1.5 2.5
3.0 1.0 1.5 1.0 1.5 2.0 5.0 2.5 1.0 1.0
2.5 2.5 4.0 2.0 1.5 1.0 3.0 5.5 2.5 6.5
0.5 2.0 2.0
6.5
91.5
8.0 15.0 11.0 7.0 2.5 3.0 7.0 3.0 2.5 3.0
8.0 4.0
11.0 3.1 3.0 2.0 5.5 4.0 1.2 2.0
6.0 3.0 5.0 4.0 8.5 2.5
39.0 10.0 3.5 2.0
2.2 3.0 9.5
12.0
216.0
6.0 14.0 12.0 7.0 3.0 3.0 7.5 4.0 2.7 3.0
8.0 4.5
11.0 3.4 3.0 1.8 4.5 3.7 1.2 3.0
7.0 3.0 6.0 4.0 9.0 2.3
38.0 8.0 3.0 2.0
2.0 4.0
12.0
12.4
219.0
4.0 12.0 14.0 9.0 5.0 7.0
16.0 6.0 6.5 7.0
17.0 10.0 17.0 7.5 8.0 2.6 5.0 6.0 2.2 6.0
12.0 5.0 5.0
10.0 23.0 6.5
80.0 21.0 9.5 2.0
4.2 7.0
13.0
22.0
388.0
4.0 14.0 17.0 9.0 5.5 6.0
17.0 7.5 6.5 8.0
16.0 10.0 17.0 9.0 7.0 3.0 3.5 8.0 2.4 7.5
13.0 6.0 6.0
11.0 26.0 5.5
70.0 15.0 9.0 2.0
4.5 9.0
12.0
21.1
388.0 1 Excludes custom slaughter for farmers at commercial establishments. 2 New England includes Connecticut, Maine, Massachusetts, New Hampshire, Rhode Island, and Vermont. 3 Includes data for States not published in this table.
Sheep and Goats (January 2020) 11 USDA, National Agricultural Statistics Service
Wool Production – States and United States: 2018 and 2019 State
Sheep shorn Weight per fleece Production 2018 2019 2018 2019 2018 2019
(1,000 head) (1,000 head) (pounds) (pounds) (1,000 pounds) (1,000 pounds)
Arizona .............................................. California ........................................... Colorado ............................................ Idaho ................................................. Illinois ................................................ Indiana .............................................. Iowa ................................................... Kansas .............................................. Kentucky ............................................ Michigan ............................................ Minnesota .......................................... Missouri ............................................. Montana ............................................ Nebraska ........................................... Nevada .............................................. New England 1 ................................... New Mexico ....................................... New York ........................................... North Carolina ................................... North Dakota ..................................... Ohio ................................................... Oklahoma .......................................... Oregon .............................................. Pennsylvania ..................................... South Dakota ..................................... Tennessee ......................................... Texas ................................................ Utah ................................................... Virginia .............................................. Washington ....................................... West Virginia ..................................... Wisconsin .......................................... Wyoming ........................................... Other States 2 .................................... United States .....................................
83.0 380.0 315.0 170.0 32.0 42.0
140.0 43.0 11.0 55.0
102.0 40.0
180.0 58.0 47.0 27.0 82.0 46.0 6.0
59.0
79.0 19.0
130.0 46.0
230.0 10.0
240.0 245.0 24.0 33.0
17.0 50.0
285.0
46.0
3,372.0
67.0 390.0 335.0 170.0 29.0 41.0
130.0 42.0 11.0 61.0
98.0 37.0
170.0 61.0 48.0 27.0 80.0 49.0 7.0
62.0
87.0 17.0
130.0 48.0
225.0 9.0
230.0 240.0 23.0 36.0
16.0 49.0
250.0
45.0
3,320.0
6.9 6.3 7.0 8.8 6.3 6.0 5.4 6.4 6.8 5.9
6.3 5.8 8.9 7.1 9.6 6.7 7.6 5.9 5.5 6.9
5.8 5.5 6.4 6.7 7.6 5.0 7.3 9.1 6.0 8.0
5.4 6.6 8.4
5.9
7.2
7.0 6.2 7.0 8.8 5.9 6.0 5.7 6.1 6.4 6.1
6.3 5.8 8.9 7.2 9.2 7.0 7.6 5.9 5.0 7.5
5.8 5.6 6.2 6.7 7.5 5.0 7.4 8.9 5.9 7.8
5.4 6.9 8.8
6.3
7.2
570 2,400 2,200 1,500
200 250 760 275 75
325
640 230
1,610 410 450 180 625 270 33
410
460 105 830 310
1,750 50
1,760 2,220
145 265
92
330 2,400
270
24,400
470 2,400 2,350 1,500
170 245 740 255 70
375
620 215
1,510 440 440 188 610 290 35
465
505 95
800 320
1,690 45
1,700 2,140
135 280
87
340 2,200
285
24,010
1 New England includes Connecticut, Maine, Massachusetts, New Hampshire, Rhode Island, and Vermont. 2 Includes data for States not published in this table.
12 Sheep and Goats (January 2020) USDA, National Agricultural Statistics Service
Wool Price and Value – States and United States: 2018 and 2019 [United States value may not add due to rounding]
State Price per pound Value 1
2018 2019 2018 2019
(dollars) (dollars) (1,000 dollars) (1,000 dollars)
Arizona ................................................... California ................................................ Colorado ................................................. Idaho ....................................................... Illinois ...................................................... Indiana .................................................... Iowa ........................................................ Kansas .................................................... Kentucky ................................................. Michigan ................................................. Minnesota ............................................... Missouri .................................................. Montana .................................................. Nebraska ................................................ Nevada ................................................... New England 2 ........................................ New Mexico ............................................ New York ................................................ North Carolina ......................................... North Dakota ........................................... Ohio ........................................................ Oklahoma ............................................... Oregon .................................................... Pennsylvania .......................................... South Dakota .......................................... Tennessee .............................................. Texas ...................................................... Utah ........................................................ Virginia .................................................... Washington ............................................. West Virginia ........................................... Wisconsin ............................................... Wyoming ................................................. Other States 3 ......................................... United States ..........................................
1.20 2.00 2.10 2.02 0.65 0.55 0.59 0.95 0.80 0.65
0.67 0.60 2.50 0.88 2.20 0.85 2.10 0.90 1.20 1.32
0.40 0.70 1.65 0.60 1.83 0.80 1.80 2.00 1.40 2.10
1.40 0.60 2.50
1.50
1.75
1.10 2.20 2.60 2.78 0.55 0.69 0.45 0.80 0.90 0.68
0.50 0.40 2.50 0.88 2.30 0.85 2.10 0.80 1.10 1.35
0.48 0.75 1.45 0.60 1.87 0.80 1.90 2.10 1.20 2.95
1.50 0.55 2.70
1.50
1.89
684 4,800 4,620 3,030
130 138 448 261 60
211
429 138
4,025 361 990 153
1,313 243 40
541
184 74
1,370 186
3,203 40
3,168 4,440
203 557
129 198
6,000
405
42,772
517 5,280 6,110 4,170
94 169 333 204 63
255
310 86
3,775 387
1,012 160
1,281 232 39
628
242 71
1,160 192
3,160 36
3,230 4,494
162 826
131 187
5,940
428
45,364 1 Production multiplied by marketing year average price. United States value is the summation of State values. 2 New England includes Connecticut, Maine, Massachusetts, New Hampshire, Rhode Island, and Vermont. 3 Includes data for States not published in this table.
Sheep and Goats (January 2020) 13 USDA, National Agricultural Statistics Service
Goats and Kids Inventory by Class – United States: January 1, 2019 and 2020
Class 2019 2020 2020 as percent of 2019
(head) (head) (percent)
All goats and kids ..................................................................................................... All, breeding goats ................................................................................................ Replacement kids - under one year ................................................................... Does - one year old and older ........................................................................... Bucks - one year old and older .......................................................................... All, market goats and kids ..................................................................................... Kid crop 1 ..................................................................................................................
2,622,000
2,148,000 393,000
1,595,000 160,000
474,000
1,635,000
2,660,000
2,182,000 400,000
1,619,000 163,000
478,000
1,640,000
101
102 102 102 102
101
100
1 Kid crop refers to kids born the previous year.
0
500
1,000
1,500
2,000
2,500
3,000
3,500
2016 2017 2018 2019 2020
Thou
sand
hea
d
All Goats and Kids Inventory by Class – United States: January 1
Angora Milk Meat All
14 Sheep and Goats (January 2020) USDA, National Agricultural Statistics Service
Angora Goats and Kids Inventory by Class – United States: January 1, 2019 and 2020
Class 2019 2020 2020 as percent of 2019
(head) (head) (percent)
Angora goats and kids ................................................................................................. Angora, breeding goats ............................................................................................ Replacement kids - under one year ...................................................................... Does - one year old and older .............................................................................. Bucks - one year old and older ............................................................................. Angora, market goats and kids ................................................................................. Kid crop 1 .....................................................................................................................
137,000
117,000 19,000 92,000 6,000
20,000
72,000
130,000
112,000 18,000 88,000 6,000
18,000
70,000
95
96 95 96
100
90
97 1 Kid crop refers to kids born the previous year. Milk Goats and Kids Inventory by Class – United States: January 1, 2019 and 2020
Class 2019 2020 2020 as percent of 2019
(head) (head) (percent)
Milk goats and kids ...................................................................................................... Milk, breeding goats ................................................................................................. Replacement kids - under one year ...................................................................... Does - one year old and older .............................................................................. Bucks - one year old and older ............................................................................. Milk, market goats and kids ...................................................................................... Kid crop 1 .....................................................................................................................
430,000
385,000 82,000
276,000 27,000
45,000
296,000
440,000
395,000 84,000
284,000 27,000
45,000
305,000
102
103 102 103 100
100
103
1 Kid crop refers to kids born the previous year. Meat and Other Goats and Kids Inventory by Class – United States: January 1, 2019 and 2020
Class 2019 2020 2020 as percent of 2019
(head) (head) (percent)
Meat and other goats and kids ..................................................................................... Meat and other, breeding goats ................................................................................ Replacement kids - under one year ...................................................................... Does - one year old and older .............................................................................. Bucks - one year old and older ............................................................................. Meat and other, market goats and kids .................................................................... Kid crop 1 .....................................................................................................................
2,055,000
1,646,000 292,000
1,227,000 127,000
409,000
1,267,000
2,090,000
1,675,000 298,000
1,247,000 130,000
415,000
1,265,000
102
102 102 102 102
101
100
1 Kid crop refers to kids born the previous year.
Sheep and Goats (January 2020) 15 USDA, National Agricultural Statistics Service
Angora Goats and Kids Inventory – States and United States: January 1, 2019 and 2020
State 2019 2020 2020 as percent of 2019
(head) (head) (percent)
Arizona .................................................................................. California 1 ............................................................................. New Mexico ........................................................................... Texas .................................................................................... Other States 2 ........................................................................ United States .........................................................................
27,000 3,000 9,000
75,000
23,000
137,000
21,000 (NA)
9,000 75,000
25,000
130,000
78 (X)
100 100
109
95
(NA) Not available. (X) Not applicable. 1 Included in Other States in 2020. 2 Includes data for States not published in this table. Mohair Production, Price, and Value – States and United States: 2018 and 2019 [United States value may not add due to rounding]
State Goats clipped
Average clip per goat Production Price per
pound Value 1
2018 2019 2018 2019 2018 2019 2018 2019 2018 2019
(head) (head) (pounds) (pounds) (1,000 pounds) (1,000 pounds) (dollars) (dollars) (1,000 dollars) (1,000 dollars)
Arizona ............ California ......... New Mexico ..... Texas .............. Other States 2 .. United States ...
28,000 2,000 7,000
75,000
21,000
133,000
21,000 (NA)
7,000 75,000
24,000
127,000
4.5 5.0 4.3 6.2
6.0
5.7
4.5 (NA)
3.6 6.3
5.8
5.7
125 10 30
465
125
755
95 (NA)
25 470
140
730
1.30 6.00 1.60 7.20
2.75
5.25
1.30 (NA) 1.30 8.70
2.90
6.37
163 60 48
3,348
344
3,963
124 (NA)
33 4,089
406
4,652
(NA) Not available. 1 Production multiplied by marketing year average price. United States value is summation of State values. 2 Includes data for States not published in this table.
16 Sheep and Goats (January 2020) USDA, National Agricultural Statistics Service
Milk Goats and Kids Inventory – States and United States: January 1, 2019 and 2020
State 2019 2020 2020 as percent of 2019
(head) (head) (percent)
Alabama ................................................................................ Arkansas ................................................................................ California ............................................................................... Colorado ................................................................................ Florida .................................................................................... Georgia .................................................................................. Idaho ...................................................................................... Illinois ..................................................................................... Indiana ................................................................................... Iowa ....................................................................................... Kansas ................................................................................... Kentucky ................................................................................ Michigan ................................................................................ Minnesota .............................................................................. Missouri ................................................................................. Nebraska ............................................................................... New England 1 ....................................................................... New York ............................................................................... North Carolina ........................................................................ Ohio ....................................................................................... Oklahoma .............................................................................. Oregon ................................................................................... Pennsylvania ......................................................................... South Carolina ....................................................................... Tennessee ............................................................................. Texas ..................................................................................... Virginia ................................................................................... Washington ............................................................................ Wisconsin .............................................................................. Other States 2 ........................................................................ United States .........................................................................
4,000 4,000
42,000 10,000 8,500 8,500 7,000
11,000 12,000 32,000
4,000 6,000
12,000 13,000 12,000 4,000
19,000 12,000 6,000
12,000
8,000 13,000 15,000 3,000 7,000
27,000 5,000 8,000
72,000
33,000
430,000
3,800 4,000
43,000 9,500 9,000 6,500 6,800
10,000 13,000 29,000
4,200 7,000
12,000 14,000 12,000 3,500
18,000 13,300 7,500
11,000
7,000 13,900 14,000 3,300 7,400
29,000 5,000 7,600
82,000
33,700
440,000
95 100 102 95
106 76 97 91
108 91
105 117 100 108 100 88 95
111 125 92
88
107 93
110 106 107 100 95
114
102
102 1 New England includes Connecticut, Maine, Massachusetts, New Hampshire, Rhode Island, and Vermont. 2 Includes data for States not published in this table.
Sheep and Goats (January 2020) 17 USDA, National Agricultural Statistics Service
Meat and Other Goats and Kids Inventory – States and United States: January 1, 2019 and 2020
State 2019 2020 2020 as percent of 2019
(head) (head) (percent)
Alabama .......................................................................... Arizona ............................................................................ Arkansas ......................................................................... California ......................................................................... Colorado .......................................................................... Florida ............................................................................. Georgia ........................................................................... Illinois .............................................................................. Indiana ............................................................................ Iowa ................................................................................. Kansas ............................................................................ Kentucky .......................................................................... Louisiana ......................................................................... Minnesota ........................................................................ Mississippi ....................................................................... Missouri ........................................................................... New York ......................................................................... North Carolina ................................................................. Ohio ................................................................................. Oklahoma ........................................................................ Oregon ............................................................................ Pennsylvania ................................................................... South Carolina ................................................................. Tennessee ....................................................................... Texas .............................................................................. Virginia ............................................................................ Washington ..................................................................... West Virginia ................................................................... Other States 1 .................................................................. United States ...................................................................
45,000 33,000 32,000 90,000 24,000 50,000 59,000 23,000 34,000 37,000
44,000 52,000 15,000 25,000 21,000 72,000 17,000 49,000 45,000 80,000
27,000 38,000 32,000 89,000
740,000 42,000 21,000 19,000
200,000
2,055,000
46,000 33,000 31,000 87,000 23,000 46,000 60,000 24,000 37,000 35,000
43,000 57,000 15,000 24,000 21,000 75,000 20,000 45,000 43,000 84,000
29,000 38,000 32,000
100,000 765,000 43,000 23,000 18,000
193,000
2,090,000
102 100 97 97 96 92
102 104 109 95
98
110 100 96
100 104 118 92 96
105
107 100 100 112 103 102 110 95
97
102
1 Includes data for States not published in this table.
18 Sheep and Goats (January 2020) USDA, National Agricultural Statistics Service
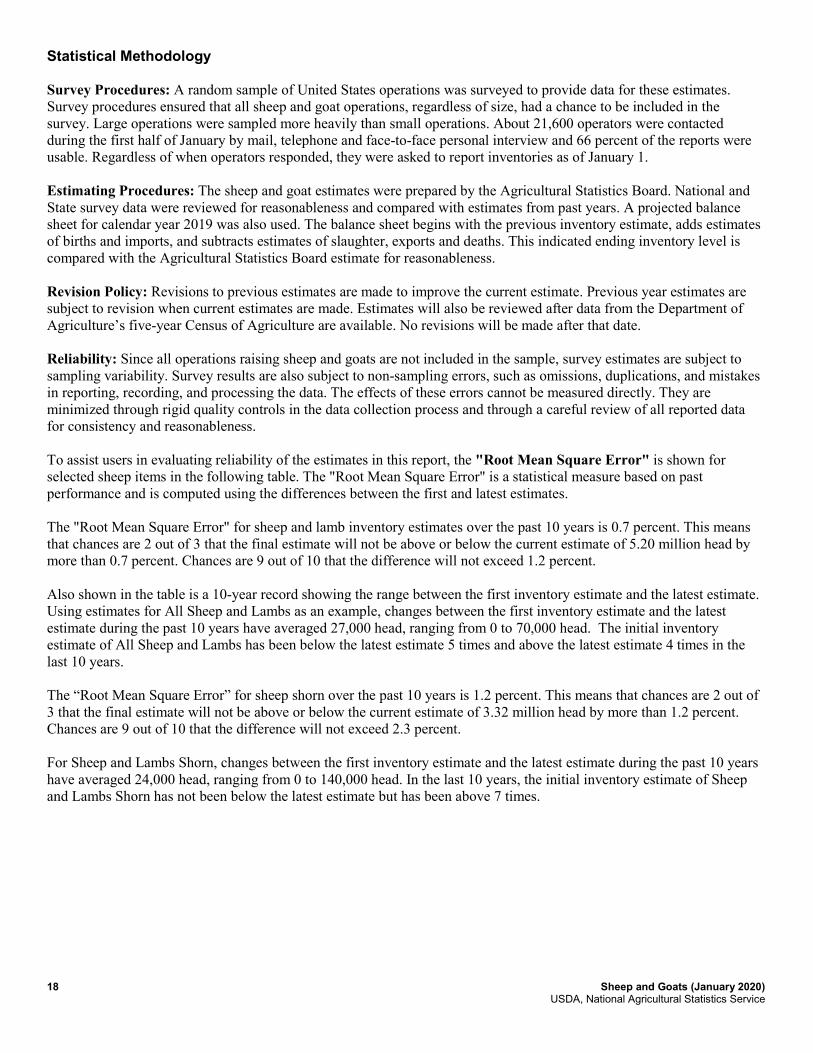
Statistical Methodology Survey Procedures: A random sample of United States operations was surveyed to provide data for these estimates. Survey procedures ensured that all sheep and goat operations, regardless of size, had a chance to be included in the survey. Large operations were sampled more heavily than small operations. About 21,600 operators were contacted during the first half of January by mail, telephone and face-to-face personal interview and 66 percent of the reports were usable. Regardless of when operators responded, they were asked to report inventories as of January 1. Estimating Procedures: The sheep and goat estimates were prepared by the Agricultural Statistics Board. National and State survey data were reviewed for reasonableness and compared with estimates from past years. A projected balance sheet for calendar year 2019 was also used. The balance sheet begins with the previous inventory estimate, adds estimates of births and imports, and subtracts estimates of slaughter, exports and deaths. This indicated ending inventory level is compared with the Agricultural Statistics Board estimate for reasonableness. Revision Policy: Revisions to previous estimates are made to improve the current estimate. Previous year estimates are subject to revision when current estimates are made. Estimates will also be reviewed after data from the Department of Agriculture’s five-year Census of Agriculture are available. No revisions will be made after that date. Reliability: Since all operations raising sheep and goats are not included in the sample, survey estimates are subject to sampling variability. Survey results are also subject to non-sampling errors, such as omissions, duplications, and mistakes in reporting, recording, and processing the data. The effects of these errors cannot be measured directly. They are minimized through rigid quality controls in the data collection process and through a careful review of all reported data for consistency and reasonableness. To assist users in evaluating reliability of the estimates in this report, the "Root Mean Square Error" is shown for selected sheep items in the following table. The "Root Mean Square Error" is a statistical measure based on past performance and is computed using the differences between the first and latest estimates. The "Root Mean Square Error" for sheep and lamb inventory estimates over the past 10 years is 0.7 percent. This means that chances are 2 out of 3 that the final estimate will not be above or below the current estimate of 5.20 million head by more than 0.7 percent. Chances are 9 out of 10 that the difference will not exceed 1.2 percent. Also shown in the table is a 10-year record showing the range between the first inventory estimate and the latest estimate. Using estimates for All Sheep and Lambs as an example, changes between the first inventory estimate and the latest estimate during the past 10 years have averaged 27,000 head, ranging from 0 to 70,000 head. The initial inventory estimate of All Sheep and Lambs has been below the latest estimate 5 times and above the latest estimate 4 times in the last 10 years. The “Root Mean Square Error” for sheep shorn over the past 10 years is 1.2 percent. This means that chances are 2 out of 3 that the final estimate will not be above or below the current estimate of 3.32 million head by more than 1.2 percent. Chances are 9 out of 10 that the difference will not exceed 2.3 percent. For Sheep and Lambs Shorn, changes between the first inventory estimate and the latest estimate during the past 10 years have averaged 24,000 head, ranging from 0 to 140,000 head. In the last 10 years, the initial inventory estimate of Sheep and Lambs Shorn has not been below the latest estimate but has been above 7 times.
Sheep and Goats (January 2020) 19 USDA, National Agricultural Statistics Service
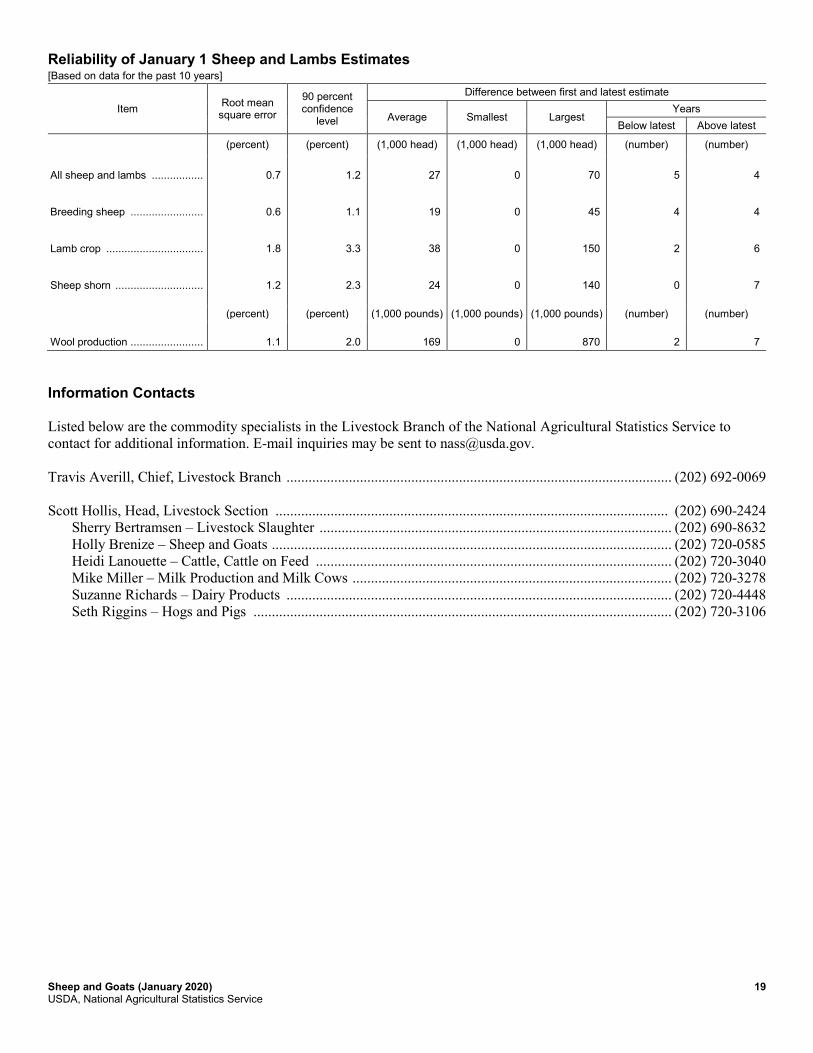
Reliability of January 1 Sheep and Lambs Estimates [Based on data for the past 10 years]
Item Root mean square error
90 percent confidence
level
Difference between first and latest estimate
Average Smallest Largest Years
Below latest Above latest
(percent) (percent) (1,000 head) (1,000 head) (1,000 head) (number) (number)
All sheep and lambs ................. Breeding sheep ........................ Lamb crop ................................ Sheep shorn .............................
0.7
0.6
1.8
1.2
1.2
1.1
3.3
2.3
27
19
38
24
0
0
0
0
70
45
150
140
5
4
2
0
4
4
6
7
(percent) (percent) (1,000 pounds) (1,000 pounds) (1,000 pounds) (number) (number) Wool production ........................
1.1
2.0
169
0
870
2
7
Information Contacts Listed below are the commodity specialists in the Livestock Branch of the National Agricultural Statistics Service to contact for additional information. E-mail inquiries may be sent to [email protected]. Travis Averill, Chief, Livestock Branch ......................................................................................................... (202) 692-0069 Scott Hollis, Head, Livestock Section ........................................................................................................... (202) 690-2424 Sherry Bertramsen – Livestock Slaughter ................................................................................................ (202) 690-8632 Holly Brenize – Sheep and Goats ............................................................................................................. (202) 720-0585 Heidi Lanouette – Cattle, Cattle on Feed ................................................................................................. (202) 720-3040 Mike Miller – Milk Production and Milk Cows ....................................................................................... (202) 720-3278 Suzanne Richards – Dairy Products ......................................................................................................... (202) 720-4448 Seth Riggins – Hogs and Pigs .................................................................................................................. (202) 720-3106
Access to NASS Reports For your convenience, you may access NASS reports and products the following ways:
All reports are available electronically, at no cost, on the NASS web site: www.nass.usda.gov
Both national and state specific reports are available via a free e-mail subscription. To set-up this free
subscription, visit www.nass.usda.gov and click on “National” or “State” in upper right corner above “search” box to create an account and select the reports you would like to receive.
Cornell’s Mann Library has launched a new website housing NASS’s and other agency’s archived reports. The new website, https://usda.library.cornell.edu. All email subscriptions containing reports will be sent from the new website, https://usda.library.cornell.edu. To continue receiving the reports via e-mail, you will have to go to the new website, create a new account and re-subscribe to the reports. If you need instructions to set up an account or subscribe, they are located at: https://usda.library.cornell.edu/help. You should whitelist [email protected] in your email client to avoid the emails going into spam/junk folders.
For more information on NASS surveys and reports, call the NASS Agricultural Statistics Hotline at (800) 727-9540, 7:30 a.m. to 4:00 p.m. ET, or e-mail: [email protected].
The U.S. Department of Agriculture (USDA) prohibits discrimination against its customers, employees, and applicants for employment on the basis of race, color, national origin, age, disability, sex, gender identity, religion, reprisal, and where applicable, political beliefs, marital status, familial or parental status, sexual orientation, or all or part of an individual's income is derived from any public assistance program, or protected genetic information in employment or in any program or activity conducted or funded by the Department. (Not all prohibited bases will apply to all programs and/or employment activities.)
If you wish to file a Civil Rights program complaint of discrimination, complete the USDA Program Discrimination Complaint Form (PDF), found online at www.ascr.usda.gov/filing-program-discrimination-complaint-usda-customer, or at any USDA office, or call (866) 632-9992 to request the form. You may also write a letter containing all of the information requested in the form. Send your completed complaint form or letter to us by mail at U.S. Department of Agriculture, Director, Office of Adjudication, 1400 Independence Avenue, S.W., Washington, D.C. 20250-9410, by fax (202) 690-7442 or email at [email protected].

The 2020 Agricultural Outlook Forum
“Program at a Glance” Join us February 20-21, 2020
Crystal Gateway Marriott Hotel Arlington, Virginia
Register Here
For More Information, please contact the Forum Coordinator Mirvat Sewadeh at 202-720-5447
Related Documents