SHAPE FEATURE EXTRACTION AND CLASSIFICATION OF FOOD MATERIAL USING COMPUTER VISION K. Ding, S. Gunasekaran ABSTRACT. Food material shape is often closely related to its quality. Due to the demands of high quality, automated food shape inspection has become an important need for the food industry. Currently, accuracy and speed are two major problems for food shape inspection with computer vision. Therefore, in this study, a fast and accurate computer-vision based feature extraction and classification system was developed. In the feature extraction stage, a statistical model- basedfeature extractor (SMB) and a multi-index active model-based (MAM) feature extractor were developed to improve the accuracy of classifications. In the classification stage, first the back-propagation neural network was applied as a multi-index classifier. Then, to speed up training, some minimum indeterminate zone (MIZ) classifiers were developed. Corn kernels, almonds, and animal-shaped crackers were used to test the above techniques. The results showed that accuracy and speed were greatly improved when the MAM feature extractor was used in conjunction with the MIZ classifier. Keywords. Corn, Crackers, Almonds, Image processing. Machine learning. Neural network. Feature extractors. Classifiers. M any foods, such as grains, fruits, and vegetables, have certain shape features that signify their overall quality. Thus damage to these foods usually causes some kind of profile or shape change. Therefore, shape inspection is widely used for food quality evaluation. Currently, shapes of many food products are inspected by human vision. It is slow and often difficult. Machine vision is a powerful tool for automated food shape inspection. It can provide objective, consistent, and quantitative information. However, accuracy and speed are still two major problems. Therefore, in this study, some new shape feature extraction and classification methods have been developed to improve the speed and accuracy of machine vision systems for automated food shape inspection. FEATURE EXTRACTION WITH COMPUTER VISION Gunasekaran et al. (1987 and 1988) developed some image processing algorithms for detecting stress cracks and other physical damage in com kernels and soybeans. Zayas et al. (1985, 1986 and 1989) were able to distinguish different wheat varieties using algorithms that compared kernel dimensions and shape characteristics. Tao et al. (1990) applied the fast Fourier transform (FFT) analysis in conjunction with a machine vision system for shape inspection of potatoes. Berlage et al. (1988) reported an 85% success rate in identifying different types of rye grass seed with computer vision. Lai et al. (1986) were able to distinguish among six different grain varieties by using image analysis and pattern recognition. Zamfira et al. Article was submitted for publication in November 1993; reviewed and approved for publication by the Food and Process Engineering Inst, of ASAE in July 1994. The authors are Kexiang Ding, ASAE Student Member Engineer, Graduate Research Assistant, and Sundaram Gunasekaran, ASAE Member Engineer, Associate Professor, Agricultural Engineering Dept., University of Wisconsin, Madison. (1991) applied the neural network system for grain classification. Sapirstein et al. (1987) used size and shape features such as kernel length, width, projected area, aspect ratio to classify several cereal grains with a success rate of better than 96%. Zayas et al. (1990) reported an accuracy of 94% in discriminating whole from broken com kernels using shape and size features in image analysis in conjunction with statistical pattern recognition. Liao et al. (1992) applied back-propagation neural network for com kemel shape inspection. The accuracy was reported to be over 90%. In most of the above studies, conventional invariant (invariant of position, orientation, and scale) feature extraction methods were applied to obtain such features as area, length, width, aspect ratio, perimeter, etc. These features can be obtained with commercial image- processing software. Due to large inhomogeneities of food materials, however, such invariant shape features cannot be used to detect local defects. In many cases, therefore, the invariant feature extraction methods cannot accurately distinguish between damaged and undamaged categories. In the past few years, the (position, orientation, and scale) variant shape extraction methods are gaining popularity for food material shape inspection (Lai et al., 1986; Shyy and Misra, 1989; Liao et al., 1992). In the variant method, the edge contour of the inspected object is transformed to a given position, orientation, and scale. Then the shape features are extracted from every local edge point. Ding et al. (1990) presented a statistical model-based variant feature extraction method for shape inspection of com kemels. This was based on a reference shape—a transformed average shape of some undamaged com kemels. After the reference shape was obtained, the shape of kernels being inspected was compared with the reference shape. Because the local shape defects can be obtained by such comparison, this method can separate broken and unbroken kemels more accurately than the invariant methods. VOL. 37(5): 1537-1545 Transactions of the ASAE © 1994 American Society of Agricultural Engineers 0001-2351 / 94/ 3705-1537 1537

Welcome message from author
This document is posted to help you gain knowledge. Please leave a comment to let me know what you think about it! Share it to your friends and learn new things together.
Transcript

SHAPE FEATURE EXTRACTION AND CLASSIFICATION OF FOOD
MATERIAL USING COMPUTER VISION
K. Ding, S. Gunasekaran
ABSTRACT. Food material shape is often closely related to its quality. Due to the demands of high quality, automated food shape inspection has become an important need for the food industry. Currently, accuracy and speed are two major problems for food shape inspection with computer vision. Therefore, in this study, a fast and accurate computer-vision based feature extraction and classification system was developed. In the feature extraction stage, a statistical model-basedfeature extractor (SMB) and a multi-index active model-based (MAM) feature extractor were developed to improve the accuracy of classifications. In the classification stage, first the back-propagation neural network was applied as a multi-index classifier. Then, to speed up training, some minimum indeterminate zone (MIZ) classifiers were developed. Corn kernels, almonds, and animal-shaped crackers were used to test the above techniques. The results showed that accuracy and speed were greatly improved when the MAM feature extractor was used in conjunction with the MIZ classifier. Keywords. Corn, Crackers, Almonds, Image processing. Machine learning. Neural network. Feature extractors. Classifiers.
Many foods, such as grains, fruits, and vegetables, have certain shape features that signify their overall quality. Thus damage to these foods usually causes some kind of
profile or shape change. Therefore, shape inspection is widely used for food quality evaluation. Currently, shapes of many food products are inspected by human vision. It is slow and often difficult. Machine vision is a powerful tool for automated food shape inspection. It can provide objective, consistent, and quantitative information. However, accuracy and speed are still two major problems. Therefore, in this study, some new shape feature extraction and classification methods have been developed to improve the speed and accuracy of machine vision systems for automated food shape inspection.
FEATURE EXTRACTION WITH COMPUTER VISION Gunasekaran et al. (1987 and 1988) developed some
image processing algorithms for detecting stress cracks and other physical damage in com kernels and soybeans. Zayas et al. (1985, 1986 and 1989) were able to distinguish different wheat varieties using algorithms that compared kernel dimensions and shape characteristics. Tao et al. (1990) applied the fast Fourier transform (FFT) analysis in conjunction with a machine vision system for shape inspection of potatoes. Berlage et al. (1988) reported an 85% success rate in identifying different types of rye grass seed with computer vision. Lai et al. (1986) were able to distinguish among six different grain varieties by using image analysis and pattern recognition. Zamfira et al.
Article was submitted for publication in November 1993; reviewed and approved for publication by the Food and Process Engineering Inst, of ASAE in July 1994.
The authors are Kexiang Ding, ASAE Student Member Engineer, Graduate Research Assistant, and Sundaram Gunasekaran, ASAE Member Engineer, Associate Professor, Agricultural Engineering Dept., University of Wisconsin, Madison.
(1991) applied the neural network system for grain classification. Sapirstein et al. (1987) used size and shape features such as kernel length, width, projected area, aspect ratio to classify several cereal grains with a success rate of better than 96%. Zayas et al. (1990) reported an accuracy of 94% in discriminating whole from broken com kernels using shape and size features in image analysis in conjunction with statistical pattern recognition. Liao et al. (1992) applied back-propagation neural network for com kemel shape inspection. The accuracy was reported to be over 90%.
In most of the above studies, conventional invariant (invariant of position, orientation, and scale) feature extraction methods were applied to obtain such features as area, length, width, aspect ratio, perimeter, etc. These features can be obtained with commercial image-processing software. Due to large inhomogeneities of food materials, however, such invariant shape features cannot be used to detect local defects. In many cases, therefore, the invariant feature extraction methods cannot accurately distinguish between damaged and undamaged categories. In the past few years, the (position, orientation, and scale) variant shape extraction methods are gaining popularity for food material shape inspection (Lai et al., 1986; Shyy and Misra, 1989; Liao et al., 1992). In the variant method, the edge contour of the inspected object is transformed to a given position, orientation, and scale. Then the shape features are extracted from every local edge point.
Ding et al. (1990) presented a statistical model-based variant feature extraction method for shape inspection of com kemels. This was based on a reference shape—a transformed average shape of some undamaged com kemels. After the reference shape was obtained, the shape of kernels being inspected was compared with the reference shape. Because the local shape defects can be obtained by such comparison, this method can separate broken and unbroken kemels more accurately than the invariant methods.
VOL. 37(5): 1537-1545
Transactions of the ASAE
© 1994 American Society of Agricultural Engineers 0001-2351 / 94/ 3705-1537 1537
Although the statistical model-based method improves the accuracy of the shape feature extraction, the accuracy is greatly affected by the position, orientation, and scale errors. Kass et al. (1988) developed a new multi-index active computer vision model called "snakes". Williams and Shah (1992) presented an algorithm for the model. They defined several shape energies (the difference between the object and a reference in terms of some shape indices; all energies for the reference shape being zero), such as the energies of continuity, curvature, and image. The algorithm starts with an approximate object edge contour, and finally converges to the real object edge contour that has local total minimum energy. This is an edge detection algorithm which can be used to adjust object location, orientation, and scale. Because of its ability for adjustments, this algorithm is termed "active". By applying this multi-index active computer vision method in reverse, a multi-index active model-based (MAM) shape feature extraction method was developed in this study.
CLASSIFIERS
Classification of objects based on certain criteria can be accomplished with a variety of classifiers. Five of some of the common classifiers are described below with specific reference to their applicability to food shape classification.
1. Bayes classifier can classify two-class problems. However, the assumption is that the two classes are normally distributed. This can be used very well for single-index problems. For multi-dimensional problems, only when we know that the covariances or the means of the classes are equal (i.e., Covl = Cov2; jxl = .2) can the classification be performed very quickly (Tou and Gonzalez, 1981). Otherwise, the algorithm is very difficult and very slow. For food shape inspection problems, the distribution of each class is generally unknown: Covl ^ Cov2 and p,l ^ |Li2. Therefore, the Bayes classifier does not satisfy the unique requirements of multi-index food shape inspection.
2. Perceptron is the simplest neural network. It contains only input and output layers (Lippmann, 1987). The perceptron can be trained faster, but it can only solve linear-separable problems. Unfortunately, food shape inspection cannot be assumed to be a linear separable problem.
3. Windrow-Hoff classifier is a linear LMS (least mean square) error classifier. It can solve linear nonseparable problems, but the offset from origin has to be known (Windrow, 1985). For food shape inspection, the offset is unknown. Therefore, this method is unsuitable.
4. Ho-Kashyap classifier is a recursive, trainable classifier. Each iteration is based on the entire data set. It could be used to determine the best linear classifier and to judge whether the problem is linear separable or not, but for linear nonseparable problems, it does not converge to the final solution of the classification (Ho and Kashyap, 1965).
5. Back-propagation neural network classifier (BP net) can solve linear nonseparable problems and classify the food shape accurately, but it is too slow for training. Some neural nets need several hours for training (Ding and Gunasekaran, 1992; Zhang et al.,
1992), sometimes even several days (Liao et al., 1992).
Therefore, it is necessary to develop some quickly trainable classifiers that can solve linear nonseparable problems. In this study, several minimum indeterminate zone (MIZ) classifiers were developed. The MIZ was the termination criterion rather than the conventional LMS error. Because the MIZ classifiers allow for some indeterminate zone to exist between two adjacent classes, they can converge in any linear-separable and nonseparable cases. They are also much faster than the BP net during training.
OBJECTIVES The objectives of this study were to: • Develop a computer vision based multi-index active
food shape feature extractor to minimize errors resulting from positioning, orienting, and scaling.
• Apply the back-propagation neural classifier for food shape classification.
• Develop some new machine learning classifiers to speed up the classifier training.
FEATURE EXTRACTORS SMB FEATURE EXTRACTOR
In the statistical model-based (SMB) feature extractor, an average reference shape of an undamaged object is obtained by averaging a set of objects. The position (center), orientation, and scale of the reference shape are normalized with respect to the corresponding standard deviations. The normalized shape of the object under inspection is compared to the normalized reference shape for calculating various shape indices. This method is further described in Ding et al. (1990). The object's center, orientation, and scale are determined as follows:
Center of Object. The intersection of lines representing average x- and y-coordinate values of the edge points was considered to be the object center.
Orientation Angle (([)). Tilt of major axis from horizontal.
-tan-21
xy
where
Ix - l y
^ ^ 2
(1)
Ix="2 (Xi-X)
iv=E(yi-yP
Ixy=^X(Xi -x ) (y i -y )
Scaling. The actual dimensions (xi, yi) of the object are scaled to new dimensions (xj, yj) based on the respective standard deviation (SD^ , SDy)of the reference shape.
1538 TRANSACTIONS OF THE ASAE
Xj , y. x . = — ^ ; y .^- i i -sa su.
(2)
MAM FEATURE EXTRACTOR
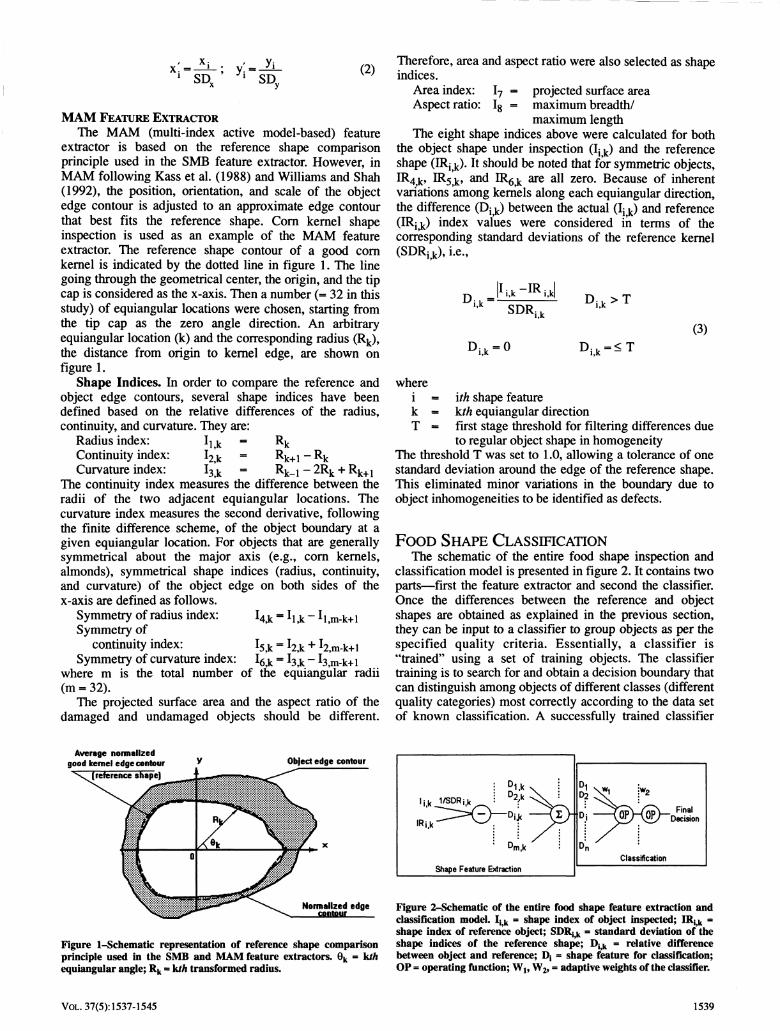
The MAM (multi-index active model-based) feature extractor is based on the reference shape comparison principle used in the SMB feature extractor. However, in MAM following Kass et al. (1988) and WilHams and Shah (1992), the position, orientation, and scale of the object edge contour is adjusted to an approximate edge contour that best fits the reference shape. Com kemel shape inspection is used as an example of the MAM feature extractor. The reference shape contour of a good com kemel is indicated by the dotted line in figure 1. The line going through the geometrical center, the origin, and the tip cap is considered as the x-axis. Then a number (= 32 in this study) of equiangular locations were chosen, starting from the tip cap as the zero angle direction. An arbitrary equiangular location (k) and the corresponding radius (%), the distance from origin to kemel edge, are shown on figure 1.
Shape Indices. In order to compare the reference and object edge contours, several shape indices have been defined based on the relative differences of the radius, continuity, and curvature. They are:
Ii Rv Radius index: ij j^ Continuity index: 12^ = Rk+i - Rk Curvature index: l3*j == Rj _i - 2Rj + Rj +i
The continuity index measures the difference between the radii of the two adjacent equiangular locations. The curvature index measures the second derivative, following the finite difference scheme, of the object boundary at a given equiangular location. For objects that are generally symmetrical about the major axis (e.g., com kemels, almonds), symmetrical shape indices (radius, continuity, and curvature) of the object edge on both sides of the X-axis are defined as follows.
Symmetry of radius index: Symmetry of
continuity index: Symmetry of curvature index:
where m is the total number of the equiangular radii (m = 32).
The projected surface area and the aspect ratio of the damaged and undamaged objects should be different.
hx^^i}^"^ l,m-k+l
I 5M '• l2Jc + l2,m-k+l hx'^h^^'h.m-k+l
Therefore, area and aspect ratio were also selected as shape indices.
Area index: I7 « projected surface area Aspect ratio: Ig = maximum breadth/
maximum length The eight shape indices above were calculated for both
the object shape under inspection (l^^) and the reference shape (IRi k)-1^ should be noted that for symmetric objects, IR4^, IR5 k» aiid IR^j^ are all zero. Because of inherent variations among kemels along each equiangular direction, the difference (D^^) between the actual (\^) and reference (IRj]^) index values were considered in terms of the corresponding standard deviations of the reference kemel (SDRj^), i.e..
D; I ; . - I R .
SDR i.k
D u = 0
D i , k > T
Di,w=^T (3)
where i = ith shape feature k = kth equiangular direction T = first stage threshold for filtering differences due
to regular object shape in homogeneity The threshold T was set to 1.0, allowing a tolerance of one standard deviation around the edge of the reference shape. This eliminated minor variations in the boundary due to object inhomogeneities to be identified as defects.
FOOD SHAPE CLASSIFICATION The schematic of the entire food shape inspection and
classification model is presented in figure 2. It contains two parts—first the feature extractor and second the classifier. Once the differences between the reference and object shapes are obtained as explained in the previous section, they can be input to a classifier to group objects as per the specified quality criteria. Essentially, a classifier is "trained" using a set of training objects. The classifier training is to search for and obtain a decision boundary that can distinguish among objects of different classes (different quality categories) most correctly according to the data set of known classification. A successfully trained classifier
Average normalized good kemel edge contour Object edge contour
Figure 1-Schematic representation of reference shape comparison principle used in the SMB and MAM feature extractors. \ - kth equiangular angle; Ri - kth transformed radius.
Dm.k
Shape Feature Extraction
Dn Classification
Figure 2-Schematic of the entire food shape feature extraction and classification model. Ij i - shape index of object inspected; IRi i » shape index of reference object; SDRj^ » standard deviation of the shape indices of the reference shape; Dj i - relative difference between object and reference; Df - shape feature for classification; OP = operating function; W|, W2, =" adaptive weights of the classifier.
VOL. 37(5): 1537-1545 1539

input layer Hidden layer
Output layer
^ Y, m
Figure 3-Schematic of a three-layer back-propagation neural network. Xi ^^^ = inputs; yi ,...,m = outputs; Wi, W2 = adaptive weights.
can use this decision boundary to classify other unknown data sets. Some of the classifiers we investigated and/or developed are described below.
BACK-PROPAGATION NEURAL CLASSIFIER Back-propagation neural net (BP net) can be applied for
classifications. A brief description of training of the BP net (fig. 3) is as follows:
• Initialize all weights and node offsets to small random values
• WHILE (error > desired error) DO • Present input vector and desired output vector • Calculate actual output vector • Adjust weights for all patterns (input/output pairs) After training, the shape features obtained from the
feature extractors can be input to the neural network. Although BP net is applicable for food shape classification, it is too slow for training. Therefore, we developed some new classifiers to speed up the training.
MIZ CLASSIFIERS The MIZ or minimum indeterminate zone classifiers
allow for a region between the two groups being classified. This region is known as indeterminate zone because it may
contain data representing both classes. The following is a description of several such MIZ classifiers.
Linear MIZ Classifier. The linear MIZ classifier is similar to a perceptron (i.e., the simplest neural network that only has input and output layers). For two-class problems, geometrically, the perceptron starts with an arbitrary hyperplane as an initial decision boundary that is used to separate the two classes. A hyperplane is an (n-1)-dimensional subspace of an n-dimensional vector space; i.e., in a two-feature input case, the hyperplane is a straight line, and in a three-feature input case, it is a plane surface, etc. The perceptron checks every point to see whether it is on the correct side of the decision boundary or not. Whenever a point is located on the wrong side of the decision boundary (misclassified point), the decision boundary will be adjusted to the position where the point becomes correctiy classified, i.e., the misclassified point is switched to the correct side of the decision boundary (fig. 4a). The perceptron adjusts the decision boundary only according to one point each time. Therefore, sometimes, when a misclassified point is switched to the correct side, some other correctly classified points are switched to the wrong side of the decision boundary. If the two classes are not linear-separable, then some points will be switched back and forth forever, which causes the algorithm not to converge.
Keeping the basic idea of the decision boundary adjustment, a linear MIZ classifier was developed. This classifier uses two parallel hyperplanes to envelop the indeterminate points (i.e., points neither classified to be of class 1 nor of class 2), and reduces the width of this indeterminate zone by rotation and translation (fig. 4b). The decision boundary is another parallel hyperplane between the two parallel indeterminate zone boundaries. A brief description of the linear MIZ classifier algorithm is as follows.
Start with two hyperplanes that are between two classes and pass through the farthest point of each class respectively in an initially chosen direction of the feature space.
Rotate the two parallel hyperplanes under the point-exchange algorithm (Powell, 1981) until the indeterminate
Feature 2 Feature 2
1
Initial decision boundary .^
^ Initial miscalssified point ^ ^^<S^
Initial indeterminate zone
Adjusted decisiorp*' boundalv ^ ^
^ New misclassified point
Feature 1 0 Feature 1 (a) (b)
Figure 4-Decision boundary adjustment of: (a) the perceptron, and (b) the linear MIZ classifier. • = points of class 1; x - points of class 2.
1540 TRANSACTIONS OF THE A S A E
zone between the two hyperplanes converges to a minimum.
The point-exchange algorithm always keeps the two indeterminate zone boundaries to touch the farthest point of each class. According to the approximation theory, the n-dimensional linear indeterminate boundaries are determined by n+1 boundary touching points. Finally, the algorithm converges to n+1 alternative touching points that determine the minimum indeterminate zone. Since the farthest points of each class always touch the indeterminate boundaries, there is not a correctly classified point to switch back to the wrong side of the boundaries. Thus, it saves much computational time compared to the perceptron. The second advantage is that the MIZ classifier can solve linear nonseparable and totally nonseparable problems.
The structure of the linear MIZ classifier is very similar to that of a perceptron (fig. 5). The operating function of the linear MIZ classifier is:
Feature 2
OPi; linear = S w i D i (4)
where Wi = Wj, W2, . . ., w^, vector of the input weights (w
also the normal vector of the parallel hyperplanes) Dj « ith input shape feature
Hence, the input weights are adaptive with the changing of the two parallel hyperplanes as they are rotated. After the final parallel hyperplanes are found, the indeterminate zone between these two hyperplanes converge to be the narrowest possible. A hyperplane of the decision boundary can be set in between and parallel to the final two indeterminate zone boundaries.
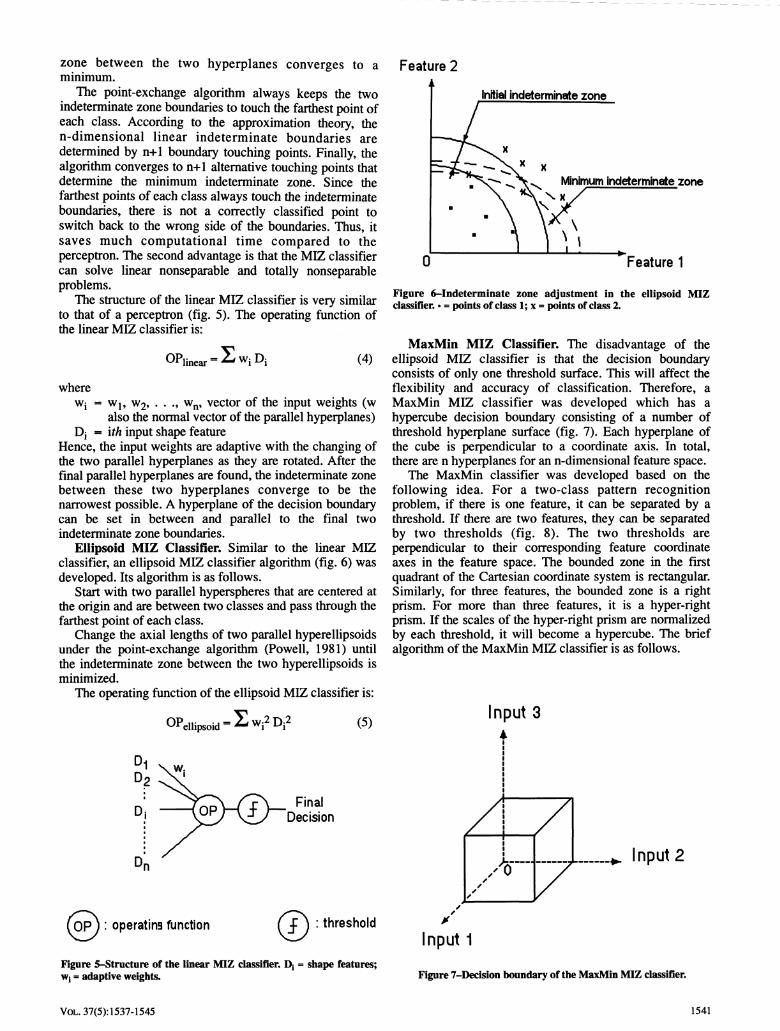
Ellipsoid MIZ Classifier. Similar to the linear MIZ classifier, an ellipsoid MIZ classifier algorithm (fig. 6) was developed. Its algorithm is as follows.
Start with two parallel hyperspheres that are centered at the origin and are between two classes and pass through the farthest point of each class.
Change the axial lengths of two parallel hyperellipsoids under the point-exchange algorithm (Powell, 1981) until the indeterminate zone between the two hyperellipsoids is minimized.
The operating function of the ellipsoid MIZ classifier is:
OPellipsoid-^Wi2Di2 (5)
Final Decision
O P ) : operatina function (D-: threshold
Figure 5-Structure of the linear MIZ classifier. Dj - shape features; Wj = adaptive weights.
Initial indeterminate zone
Minimum indeterminate zone
Feature 1
Figure 6~Indeterminate zone adjustment in the ellipsoid MIZ classifier. • = points of class 1; x = points of class 2.
MaxMin MIZ Classifier. The disadvantage of the ellipsoid MIZ classifier is that the decision boundary consists of only one threshold surface. This will affect the flexibility and accuracy of classification. Therefore, a MaxMin MIZ classifier was developed which has a hypercube decision boundary consisting of a number of threshold hyperplane surface (fig. 7). Each hyperplane of the cube is perpendicular to a coordinate axis. In total, there are n hyperplanes for an n-dimensional feature space.
The MaxMin classifier was developed based on the following idea. For a two-class pattern recognition problem, if there is one feature, it can be separated by a threshold. If there are two features, they can be separated by two thresholds (fig. 8). The two thresholds are perpendicular to their corresponding feature coordinate axes in the feature space. The bounded zone in the first quadrant of the Cartesian coordinate system is rectangular. Similarly, for three features, the bounded zone is a right prism. For more than three features, it is a hyper-right prism. If the scales of the hyper-right prism are normalized by each threshold, it will become a hypercube. The brief algorithm of the MaxMin MIZ classifier is as follows.
Input 3
^ Input 2
Figure 7-Decision boundary of the MaxMin MIZ classifier.
VOL. 37(5): 1537-1545 1541
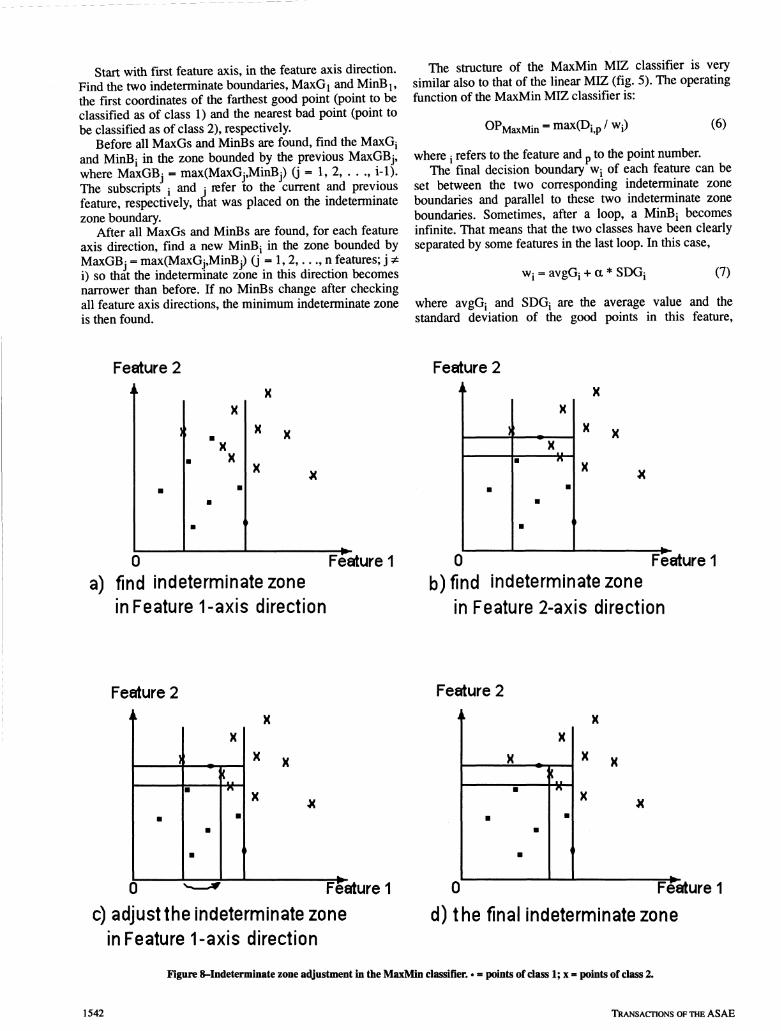
Start with first feature axis, in the feature axis direction. Find the two indeterminate boundaries, MaxG^ and MinB^, the first coordinates of the farthest good point (point to be classified as of class 1) and the nearest bad point (point to be classified as of class 2), respectively.
Before all MaxGs and MinBs are found, find the MaxGj and MinBj in the zone bounded by the previous MaxGBj, where MaxGBj - max(MaxGj,MinBj) (j = 1, 2, . . ., i-l). The subscripts j and j refer to the current and previous feature, respectively, that was placed on the indeterminate zone boundary.
After all MaxGs and MinBs are found, for each feature axis direction, find a new MinBj in the zone bounded by MaxGBj = max(MaxGj,MinBj) (j = 1, 2 , . . . , n features; j ^ i) so that the indeterminate zone in this direction becomes narrower than before. If no MinBs change after checking all feature axis directions, the minimum indeterminate zone is then found.
The structure of the MaxMin MIZ classifier is very similar also to that of the linear MIZ (fig. 5). The operating function of the MaxMin MIZ classifier is:
OPMaxMin = max(Di,p/Wi) (6)
where j refers to the feature and p to the point number. The final decision boundary Wj of each feature can be
set between the two corresponding indeterminate zone boundaries and parallel to these two indeterminate zone boundaries. Sometimes, after a loop, a MinBj becomes infinite. That means that the two classes have been clearly separated by some features in the last loop. In this case.
Wi - avgGi + a * SDGj (7)
where avgGj and SDGj are the average value and the standard deviation of the good points in this feature.
Feature 2 Feature 2
Feature 1 a) find indeterminate zone
in Feature 1-axis direction
X
I ^ I
—h H X
• •
I ' I
. I 1 1 r* 0 Feature 1
b)find indeterminate zone in Feature 2-axis direction
Feature 2 Feature 2
X
\ • •
—T—M I ' I I
\ \
0 ' — ^ Feature 1
c) adjust the indeterminate zone in Feature 1-axis direction
X
X I X . , X X
• rx X
• • • I I
I ' — I =-K
0 Feature 1
d) the final indeterminate zone
Figure S-Indeterminate zone adjustment in the MaxMin classifier. •« points of class 1; x » points of class 2.
1542 TRANSACTIONS OF THE AS AE
Input 3
Output ,^ Input 2
(a) (b)
Figure 9-Stnicture of the multflayer (three-layer) MIZ classifier (a), and the decision boundary (b). Wj, Wj = adaptive weights.
respectively. The a is a constant (set to 5) for a confidence because it is almost impossible that the good points are distributed farther than avgGj + a * SDGj.
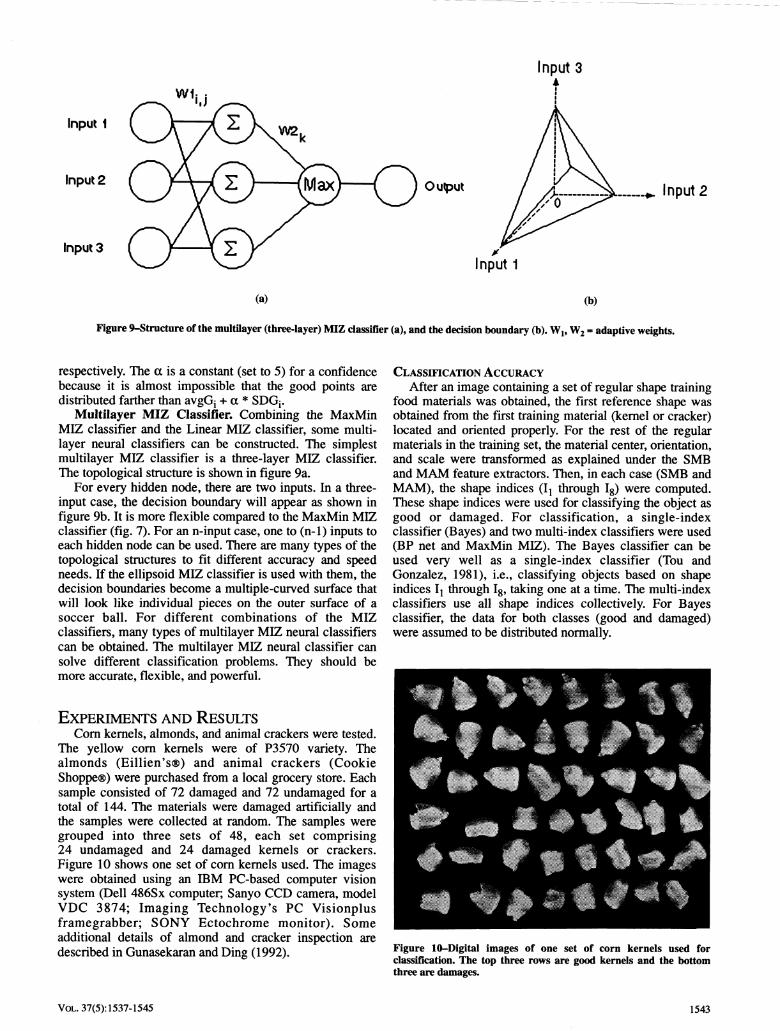
Multilayer MIZ Classifier. Combining the MaxMin MIZ classifier and the Linear MIZ classifier, some multilayer neural classifiers can be constructed. The simplest multilayer MIZ classifier is a three-layer MIZ classifier. The topological structure is shown in figure 9a.
For every hidden node, there are two inputs. In a three-input case, the decision boundary will appear as shown in figure 9b. It is more flexible compared to tiie MaxMin MIZ classifier (fig. 7). For an n-input case, one to (n-1) inputs to each hidden node can be used. There are many types of the topological structures to fit different accuracy and speed needs. If the ellipsoid MIZ classifier is used with them, the decision boundaries become a multiple-curved surface that will look like individual pieces on the outer surface of a soccer ball. For different combinations of the MIZ classifiers, many types of multilayer MIZ neural classifiers can be obtained. The multilayer MIZ neural classifier can solve different classification problems. They should be more accurate, flexible, and powerful.
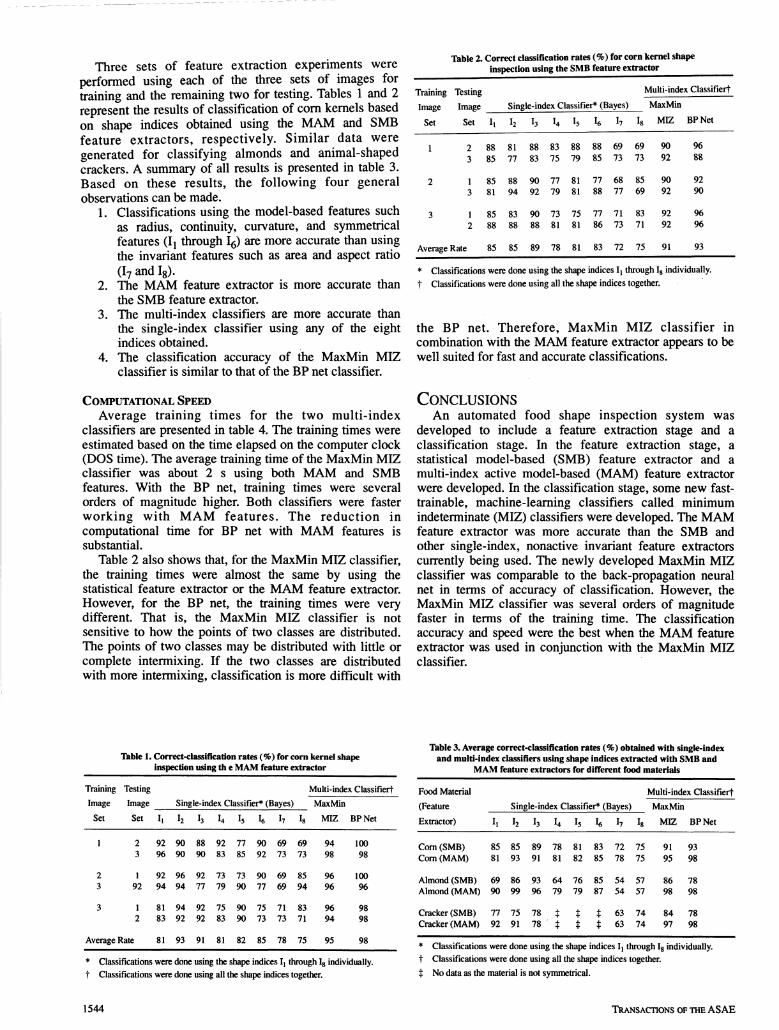
EXPERIMENTS AND RESULTS Com kernels, almonds, and animal crackers were tested.
The yellow com kemels were of P3570 variety. The almonds (Eillien's®) and animal crackers (Cookie Shoppe®) were purchased from a local grocery store. Each sample consisted of 72 damaged and 72 undamaged for a total of 144. The materials were damaged artificially and the samples were collected at random. The samples were grouped into three sets of 48, each set comprising 24 undamaged and 24 damaged kemels or crackers. Figure 10 shows one set of com kemels used. The images were obtained using an IBM PC-based computer vision system (Dell 486Sx computer; Sanyo CCD camera, model VDC 3874; Imaging Technology's PC Visionplus framegrabber; SONY Ectochrome monitor). Some additional details of almond and cracker inspection are described in Gunasekaran and Ding (1992).
CLASSIFICATION ACCURACY After an image containing a set of regular shape training
food materials was obtained, the first reference shape was obtained from the first training material (kemel or cracker) located and oriented properly. For the rest of the regular materials in the training set, the material center, orientation, and scale were transformed as explained under the SMB and MAM feature extractors. Then, in each case (SMB and MAM), the shape indices (Ij through Ig) were computed. These shape indices were used for classifying the object as good or damaged. For classification, a single-index classifier (Bayes) and two multi-index classifiers were used (BP net and MaxMin MIZ). The Bayes classifier can be used very well as a single-index classifier (Tou and Gonzalez, 1981), i.e., classifying objects based on shape indices Ij through Ig, taking one at a time. The multi-index classifiers use all shape indices collectively. For Bayes classifier, the data for both classes (good and damaged) were assumed to be distributed normally.
Figure 10~Digital images of one set of corn kernels used for classification. The top three rows are good kemels and the bottom three are damages.
VOL. 37(5): 1537-1545 1543
Three sets of feature extraction experiments were performed using each of the three sets of images for training and the remaining two for testing. Tables 1 and 2 represent the results of classification of com kernels based on shape indices obtained using the MAM and SMB feature extractors, respectively. Similar data were generated for classifying almonds and animal-shaped crackers. A summary of all results is presented in table 3. Based on these results, the following four general observations can be made.
1. Classifications using the model-based features such as radius, continuity, curvature, and symmetrical features (I through I5) are more accurate than using the invariant features such as area and aspect ratio (I7 and Ig).
2. The MAM feature extractor is more accurate than the SMB feature extractor.
3. The multi-index classifiers are more accurate than the single-index classifier using any of the eight indices obtained.
4. The classification accuracy of the MaxMin MIZ classifier is similar to that of the BP net classifier.
COMPUTATIONAL SPEED
Average training times for the two multi-index classifiers are presented in table 4. The training times were estimated based on the time elapsed on the computer clock (DOS time). The average training time of the MaxMin MIZ classifier was about 2 s using both MAM and SMB features. With the BP net, training times were several orders of magnitude higher. Both classifiers were faster working with MAM features. The reduction in computational time for BP net with MAM features is substantial.
Table 2 also shows that, for the MaxMin MIZ classifier, the training times were almost the same by using the statistical feature extractor or the MAM feature extractor. However, for the BP net, the training times were very different. That is, the MaxMin MIZ classifier is not sensitive to how the points of two classes are distributed. The points of two classes may be distributed with little or complete intermixing. If the two classes are distributed with more intermixing, classification is more difficult with
T^ble 2. Correct classification rates (%) for corn kernel shape inspection using the SMB feature extractor
Training Testing Multi-index Classifierf
Image Image Single-index Classifier* (Bayes) MaxMin
Set Set Ii h I3 I4 h h h h MIZ BPNet
1 2 88 81 88 83 88 88 69 69 90 96 3 85 77 83 75 79 85 73 73 92 88
1 85 88 90 77 81 77 68 85 90 92 3 81 94 92 79 81 88 77 69 92 90
1 85 83 90 73 75 77 71 83 92 96 2 88 88 88 81 81 86 73 71 92 96
Average Rate 85 85 89 78 81 83 72 75 91 93
* Classifications were done using the shape indices Ii through Ig individually. t Classifications were done using all the shape indices together.
the BP net. Therefore, MaxMin MIZ classifier in combination with the MAM feature extractor appears to be well suited for fast and accurate classifications.
CONCLUSIONS An automated food shape inspection system was
developed to include a feature extraction stage and a classification stage. In the feature extraction stage, a statistical model-based (SMB) feature extractor and a multi-index active model-based (MAM) feature extractor were developed. In the classification stage, some new fast-trainable, machine-learning classifiers called minimum indeterminate (MIZ) classifiers were developed. The MAM feature extractor was more accurate than the SMB and other single-index, nonactive invariant feature extractors currently being used. The newly developed MaxMin MIZ classifier was comparable to the back-propagation neural net in terms of accuracy of classification. However, the MaxMin MIZ classifier was several orders of magnitude faster in terms of the training time. The classification accuracy and speed were the best when the MAM feature extractor was used in conjunction with the MaxMin MIZ classifier.
Table 1. Correct-classification rates (%) for com kernel shape inspection using th e MAM feature extractor
Training Testing
Image Image
Set Set Ii
Multi-index Classifierf
Single-index Classifier* (Bayes) MaxMin
I2 I3 I4 I5 l6 h h MIZ BPNet
2 92 90 88 92 77 90 69 69 94 100 3 96 90 90 83 85 92 73 73 98 98
1 92 96 92 73 73 90 69 85 96 100 92 94 94 77 79 90 77 69 94 96 96
1 81 94 92 75 90 75 71 83 96 98 2 83 92 92 83 90 73 73 71 94 98
Average Rate 81 93 91 81 82 85 78 75 95 98
* Classifications were done using the shape indices Ij through Ig individually.
t Classifications were done using all the shape indices together.
Table 3. Average correct-classification rates (%) obtained with single-index and multi-index classifiers using shape indices extracted with SMB and
MAM feature extractors for different food materials
Food Material
(Feature
Extractor)
Multi-index Classifierf
Single-index Classifier* (Bayes) MaxMin
Ii h h I4 I5 h h h M E BPNet
Com (SMB) 85 85 89 78 81 83 72 75 91 93 Com (MAM) 81 93 91 81 82 85 78 75 95 98
Almond (SMB) 69 86 93 64 76 85 54 57 86 78 Almond (MAM) 90 99 96 79 79 87 54 57 98 98
Cracker (SMB) 77 75 78 $ $ $ 63 74 84 78 Cracker (MAM) 92 91 78 $ $ $ 63 74 97 98
* Classifications were done using the shape indices Ii through Ig individually.
t Classifications were done using all the shape indices together.
t No data as the material is not symmetrical.
1544 TRANSACTIONS OF THE ASAE
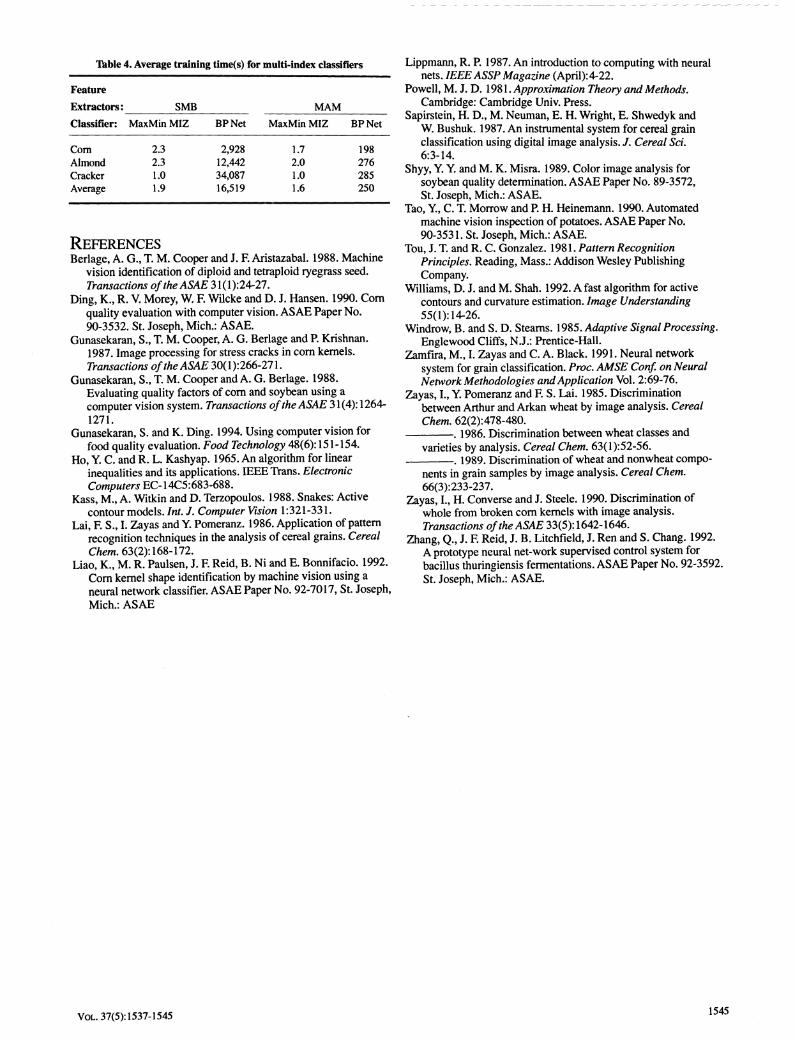
Table 4. Average training time(s) for multi-index classifiers
Feature Extractors: SMB MAM Classifier:
Com Almond Cracker Average
MaxMin MIZ
2.3 2.3 1.0 1.9
BPNet
2,928 12,442 34,087 16,519
MaxMin MIZ
1.7 2.0 1.0 1.6
BPNet
198 276 285 250
REFERENCES Berlage, A. G., T. M. Cooper and J. F. Aristazabal. 1988. Machine
vision identification of diploid and tetraploid ryegrass seed. Transactions of the ASAE 3l(\):24-27.
Ding, K., R. V. Morey, W. F. Wilcke and D. J. Hansen. 1990. Com quality evaluation with computer vision. ASAE Paper No. 90-3532. St. Joseph, Mich.: ASAE.
Gunasekaran, S., T. M. Cooper, A. G. Berlage and R Krishnan. 1987. Image processing for stress cracks in com kemels. Transactions of the ASAE 30(1): 266-271.
Gunasekaran, S., T. M. Cooper and A. G. Berlage. 1988. Evaluating quality factors of com and soybean using a computer vision system. Transactions of the ASAE 31(4): 1264-1271.
Gunasekaran, S. and K. Ding. 1994. Using computer vision for food quality evaluation. Food Technology 48(6): 151-154.
Ho, Y. C. and R. L. Kashyap. 1965. An algorithm for linear inequalities and its applications. IEEE Trans. Electronic Computers EC-14C5:683-688.
Kass, M., A. Witkin and D. Terzopoulos. 1988. Snakes: Active contour models. Int. J. Computer Vision 1:321-331.
Lai, F. S., I. Zayas and Y. Pomeranz. 1986. Application of pattem recognition techniques in the analysis of cereal grains. Cereal Chem. 63(2):16S-112.
Liao, K., M. R. Paulsen, J. F. Reid, B. Ni and E. Bonnifacio. 1992. Com kemel shape identification by machine vision using a neural network classifier. ASAE Paper No. 92-7017, St. Joseph, Mich.: ASAE
Lippmann, R. P. 1987. An introduction to computing with neural nets. IEEE ASSP Magazine (April):4-22.
Powell, M. J. D. \9S\. Approximation Theory and Methods. Cambridge: Cambridge Univ. Press.
Sapirstein, H. D., M. Neuman, E. H. Wright, E. Shwedyk and W. Bushuk. 1987. An instmmental system for cereal grain classification using digital image analysis. J. Cereal Sci. 6:3-14.
Shyy, Y. Y. and M. K. Misra. 1989. Color image analysis for soybean quality determination. ASAE Paper No. 89-3572, St. Joseph, Mich.: ASAE.
Tao, Y, C. T. Morrow and P. H. Heinemann. 1990. Automated machine vision inspection of potatoes. ASAE Paper No. 90-3531. St. Joseph, Mich.: ASAE.
Tou, J. T. and R. C. Gonzalez. 1981. Pattern Recognition Principles. Reading, Mass.: Addison Wesley Publishing Company.
Williams, D. J. and M. Shah. 1992. A fast algorithm for active contours and curvature estimation. Image Understanding 55(1): 14-26.
Windrow, B. and S. D. Steams. 1985. Adaptive Signal Processing. Englewood Cliffs, N.J.: Prentice-Hall.
Zamfira, M., I. Zayas and C. A. Black. 1991. Neural network system for grain classification. Proc. AMSE Conf. on Neural Network Methodologies and Application Vol. 2:69-76.
Zayas, I., Y Pomeranz and F. S. Lai. 1985. Discrimination between Arthur and Arkan wheat by image analysis. Cereal Chem. 62(2):478-480.
. 1986. Discrimination between wheat classes and varieties by analysis. Cereal Chem. 63(l):52-56.
-. 1989. Discrimination of wheat and nonwheat components in grain samples by image analysis. Cereal Chem. 66(3):233-237.
Zayas, I., H. Converse and J. Steele. 1990. Discrimination of whole from broken com kemels with image analysis. Transactions of the ASAE 33(5): 1642-1646.
Zhang, Q., J. E Reid, J. B. Litchfield, J. Ren and S. Chang. 1992. A prototype neural net-work supervised control system for bacillus thuringiensis fermentations. ASAE Paper No. 92-3592. St. Joseph, Mich.: ASAE.
VOL. 37(5): 1537-1545 1545
Related Documents