Sex Differences in Morbidity and Mortality Case, Anne, 1958- Paxson, Christina H. Demography, Volume 42, Number 2, May 2005, pp. 189-214 (Article) Published by Population Association of America DOI: 10.1353/dem.2005.0011 For additional information about this article Access Provided by Princeton University at 02/09/11 7:04PM GMT http://muse.jhu.edu/journals/dem/summary/v042/42.2case.html

Welcome message from author
This document is posted to help you gain knowledge. Please leave a comment to let me know what you think about it! Share it to your friends and learn new things together.
Transcript
Sex Differences in Morbidity and Mortality
Case, Anne, 1958-Paxson, Christina H.
Demography, Volume 42, Number 2, May 2005, pp. 189-214 (Article)
Published by Population Association of AmericaDOI: 10.1353/dem.2005.0011
For additional information about this article
Access Provided by Princeton University at 02/09/11 7:04PM GMT
http://muse.jhu.edu/journals/dem/summary/v042/42.2case.html
Sex Differences in Morbidity and Mortality 189
Demography, Volume 42-Number 2, May 2005: 189–214 189
R
SEX DIFFERENCES IN MORBIDITY AND MORTALITY*
ANNE CASE AND CHRISTINA PAXSON
Women have worse self-rated health and more hospitalization episodes than men from earlyadolescence to late middle age, but are less likely to die at each age. We use 14 years of data fromthe U.S. National Health Interview Survey to examine this paradox. Our results indicate that thedifference in self-assessed health between women and men can be entirely explained by differencesin the distribution of the chronic conditions they face. This is not true, however, for hospital episodesand mortality. Men with several smoking-related conditions—including cardiovascular disease andcertain lung disorders—are more likely to experience hospital episodes and to die than women whosuffer from the same chronic conditions, implying that men may experience more-severe forms ofthese conditions. While some of the difference in mortality can be explained by differences in thedistribution of chronic conditions, an equally large share can be attributed to the larger adverseeffects of these conditions on male mortality. The greater effects of smoking-related conditions onmen’s health may be due to their higher rates of smoking throughout their lives.
esearch on sex differences in health in a large number of countries has brought tolight an important paradox: women use more health services and report worse self-ratedhealth than men, but women are less likely to die than same-aged men throughout life,indicating that they may, in fact, be healthier. This paradox has been the subject of earlierarticles, starting with that by Nathanson (1975) and followed by numerous others (see,e.g., Idler 2003; MacIntyre, Ford, and Hunt 1999; Molarius and Janson 2002; Verbrugge1989). In this article, we revisit this issue using more recent and larger data sets thatcontain information on both mortality and morbidity.
There are several possible explanations for the worse self-rated health but lower mor-tality of women. First, there may be sex differences in the distributions of chronic condi-tions, driven by biological, behavioral, or psychosocial factors (Lawlor, Ebrahim, andDavey Smith 2001; Molarius and Janson 2002; Verbrugge 1989). Women may be morelikely than men to suffer from health conditions, such as arthritis or headaches, that resultin poorer self-rated health but contribute relatively little to the risk of mortality, whereasmen may be more likely to have conditions such as cardiovascular disease (CVD) or res-piratory conditions that not only contribute to worse self-rated health but also have rela-tively large effects on the probability of death. Although this explanation does not addresswhy women and men have different distributions of health conditions, it may account forthe sex differences in self-rated health and mortality that have been observed.
Second, women may be healthier than men (as evidenced by their lower mortality),but simply report worse health on surveys. A commonly held view is that since womenare less stoical than men, they are more likely to factor less-serious ailments into theirreports of poor health (Spiers et al. 2003). A twist on the same idea is that women aremore accurate reporters of health than are men: they know more about their own health,
*Anne Case and Christina Paxson, Center for Health and Wellbeing, Princeton University. Address corre-spondence to Christina Paxson, Center for Health and Wellbeing, Princeton University, 316 Wallace Hall,Princeton, NJ 08544; E-mail: [email protected]. We thank Angus Deaton, Noreen Goldman, Burt Singer,and the seminar participants at the RAND Summer Institute, Princeton University, the University of Pennsylva-nia, and the University of Michigan for their useful comments and suggestions, and the National Institute onAging for support for this research through Grant R01 AG20275-01.
Derek Young
muse stamp
190 Demography, Volume 42-Number 2, May 2005
perhaps because of their greater use of health care, and are more willing to discuss theirhealth and admit health problems to interviewers (Idler 2003; Verbrugge 1989). Althoughthese ideas have been expressed in many articles, they are not uncontroversial. Some evi-dence that is contrary to this view was reported in a study that asked men and womenopen-ended questions about health problems, followed by probes for specific health con-ditions, and found that men provided more complete information than women in responseto the open-ended questions (MacIntyre et al. 1999). Although this evidence was notpaired with “objective” data on health that could be used to assess the accuracy of re-ports, it suggests that men are not less forthcoming than women in interviews.
Third, the “facts” underlying the paradox may be incorrect. Although the higher mor-tality of men is not in dispute, some researchers have questioned whether women haveworse self-rated health and, more generally, higher rates of many measures of morbiditythan do men (Hunt and Annandale 1999). For example, MacIntyre, Hunt, and Sweeting(1996) found evidence from two (relatively small) British samples that sex differences inreports of fair or poor health are significant only in early adulthood and that althoughwomen have higher rates of psychological distress than men, they do not have higherrates of many specific physical conditions. Some researchers have found that sex differ-ences in self-rated health become smaller at older ages (Case and Deaton 2003), and oth-ers have found that sex differences in self-rated health disappear in old age (Arber andCooper 1999; Leinonen, Heikkinen, and Jylha 1997).
The first explanation of the paradox—that sex differences in self-rated health andmortality are driven by differences across women and men in the distributions of chronicconditions—is consistent with women having higher rates of some illnesses than men,but lower rates of others. In fact, this explanation requires that sex differences in preva-lence rates vary across health conditions. Much of the literature that has disputed whetherwomen have higher rates of morbidity than men has been concerned with establishingthat women do not suffer from excess levels of all measures of ill health—a point withwhich we agree and that we later provide evidence in support of. We are concerned withthe more precise issue of why women have worse self-rated health but lower mortalitythan men. As part of our investigation of sex differences in self-rated health and mortal-ity, we also examine sex differences in hospital episodes. Decisions about overnight hos-pital stays typically require the participation, if not the assent, of physicians. Measures ofhospital episodes may therefore be more likely than self-rated health status to indicate thepresence of a serious illness, rather than factors such as the lack of “stoicism” or thewillingness of individuals to discuss their health with interviewers.1
The work we present here is related to but distinct from a large body of literature thathas investigated sex differences in the relationship between self-rated health and subse-quent mortality (for reviews of studies on this topic through the mid-1990s, see Idler andBenyamini 1997; for more-recent evidence, see Deeg and Kriegsman 2003, Idler 2003).These studies have examined whether the association between self-rated health and mor-tality, adjusted for sociodemographic characteristics and chronic health conditions, variesacross men and women. A general (although not universal) finding has been that with fewcontrols included, the association between self-rated health and subsequent mortality islarger for men than for women. This finding has been taken as evidence that women havedifferent health-reporting behaviors or different health knowledge than men. However, inmuch of this literature, as more controls for health conditions are added, the associationsbetween self-rated health and mortality decline for both women and men, and the gapbetween men and women becomes small and often insignificant. This finding suggests
1. Sex differences in hospitalization episodes could partly reflect women’s greater willingness to be hospi-talized or to seek medical care that results in hospital stays. We discuss this possibility in more detail later.
Sex Differences in Morbidity and Mortality 191
that differences in the distributions of health conditions across men and women may playa large part in resolving the paradox of higher morbidity but lower mortality amongwomen—something we explore here.
Our analyses are based on 14 years of U.S. data from the National Health InterviewSurvey (NHIS 1986–1994, 1997–2001) and its associated Multiple Cause of Death file,which provides information on the deaths of those who were interviewed between 1986and 1994. The surveys are ideal for our purpose because they contain information on self-rated health, hospital episodes, and mortality, as well as detailed information on chronichealth conditions that may contribute to both self-rated health and mortality. In addition,the survey covers a large number of men and women: our analyses of self-rated healthand hospitalization use a sample of 147,996 men and women who were surveyed between1997 and 2001, and our analyses of mortality use a sample of 237,140 men and womenaged 45–84 who were surveyed from 1986 to 1994. These large samples make it possiblefor us to obtain precise estimates of the sex differences in health measures at eachage and of the effects of (sometimes rare) chronic health conditions on self-rated healthand mortality.
In the next section, we discuss the data and show that they are consistent with thebasic facts of the puzzle: women have worse self-rated health and more hospitalizationepisodes than men from early adolescence to late middle age, but they are less likely todie at each age. We then examine the validity of the explanations offered for this para-dox. Our results indicate that the difference in self-assessed health between women andmen can be entirely explained by differences in the distribution of conditions. Althoughwomen have, on average, worse self-rated health than men, women and men with thesame sets of chronic conditions have the same self-rated health. The results for hospitalepisodes are somewhat different. While the effect of poor health on hospital episodes isthe same for men and women, men with respiratory cancer, CVD, and bronchitis aremore likely to experience hospital episodes than women with the same conditions, im-plying that men may experience more-severe forms of these conditions. The same is truefor mortality. Although the effects of many chronic conditions on the probability ofdeath are the same for women and men, men who report having CVD and certain lungdisorders are significantly more likely to die than women with these conditions. Whilesome of the sex difference in mortality can be explained by differences in the distribu-tion of chronic conditions, an equally large share can be attributed to the larger adverseeffects of these conditions on male mortality.
Our results move us some distance toward understanding the paradox between self-assessed health and mortality. That men and women with the same health conditions reportthe same self-rated health status and that poor health is equally predictive of hospitaliza-tion episodes for men and women cast doubt on the idea that women and men use differentstandards for assessing self-rated health. However, our mortality results cannot be ex-plained solely by differences in the distribution of chronic conditions. Men with smoking-related conditions are significantly more likely to die within two years than are womenwith the same conditions. These men will, on average, have had longer exposure to smok-ing in their lives, and their reports of, say, emphysema may indicate more advanced casesthan do women’s reports.
Our findings and their interpretation are important for several reasons. Self-reportedhealth status is a tool that is often used to assess well-being. If women and men takedifferent aspects of health into account, or weight them differently in their self assess-ments, it is important to understand why and how they do so. In addition, if historicallyhigher rates of smoking are responsible for the higher mortality rates that men face inmiddle age, then we anticipate that the gap in age-adjusted mortality rates will close,given the changes that have been observed in women’s and men’s smoking patterns overthe past century.
192 Demography, Volume 42-Number 2, May 2005
DATA AND PRELIMINARY EVIDENCE
Data
The data for this study are drawn from the NHIS from 1986 to 2001, and from the associ-ated NHIS Multiple Cause of Death Public Use Data File, which contains information onthe deaths (as of 1997) of individuals who were surveyed between 1986 and 1994. TheNHIS is a cross-sectional household interview survey that covers the civiliannoninstitutionalized population of the United States. The survey collects information onself-rated health, chronic health conditions, the use of health care services, and socio-demographic characteristics.
Between 1986 and 1996, health information was collected for each member of thesampled households. Although all households were administered the same basic ques-tionnaire, each household was randomly assigned to one of six “Condition Lists,” andinformation was collected only on household members’ experience with the chronic con-ditions that were included in the assigned list. The structure of the survey changed inimportant ways in 1997. While basic health information continued to be collected for allhousehold members, information on chronic conditions among adults was collected onlyfrom a single “sample adult” in each household, who was asked about a full range ofchronic conditions.
Because of the redesign and the timing of the Multiple Cause of Death File, we relymainly on two distinct samples to study self-rated health and mortality. The 1997–2001sample, consisting of 147,996 “sample adults” (men and women) aged 18–84, is usedmainly for our analyses of self-rated health. We remove women who were either pregnantor had a child aged 1 or younger, to focus on non-pregnancy-related health and hospital-izations. The fact that we have a complete set of information on chronic conditions on allsample adults is an advantage, since it permits us to deal more easily with comorbiditiesacross chronic conditions. We use the 1986–1994 sample primarily for our analyses ofmortality. That sample includes men and women whose vital status can be identified fromthe Multiple Cause of Death File. Because there are so few deaths among younger adults,we restrict our sample to 237,140 men and women aged 45–84 whose vital status isknown. Details on the definitions of the variables are included in Appendix A.
Sex Differences in Self-Rated Health and Mortality
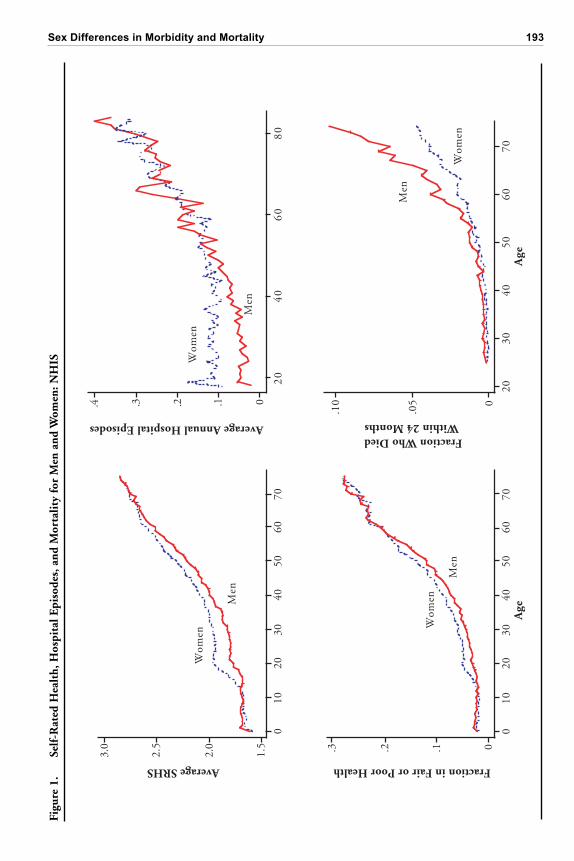
The NHIS data can be used to illustrate the paradox that we discussed in the previoussection. The two left-hand panels of Figure 1 present data on self-rated health status(SRHS), which was coded on a 5-point scale (1 = excellent, 2 = very good, 3 = good, 4 =fair, and 5 = poor). The figure, which is based on data on all household members from thecombined 1986–2001 surveys, shows the average SRHS and the proportions of men andwomen who rated themselves in fair or poor health, by exact age.2 These measures yieldsimilar patterns of changes in health status with age. Boys have somewhat worse healthstatus than girls prior to adolescence, but the health status of girls becomes worse than thatof boys at about age 14. The sex gap in self-rated health status is greatest at age 20 and thenslowly declines. By age 65 (using the mean SRHS) or age 60 (using the indicator of fair orpoor health), the female disadvantage in self-rated health status has vanished.
The top right panel shows the average number of hospitalization episodes over theprevious 12 months, by age, for women and men. Between ages 20 and 60, women’snumber of hospitalizations is roughly constant, at 0.10 episodes per year. Only after age60 does the average number of episodes rise with age for women. In contrast, men’s
2. These results are based on data for 1,602,650 individuals. Sample weights are used in the calculations.The health of those aged 16 and younger was rated by adult respondents, but children aged 17 had the option ofreporting for themselves.
Sex Differences in Morbidity and Mortality 193
Figu
re 1
.Se
lf-R
ated
Hea
lth,
Hos
pita
l Epi
sode
s, a
nd M
orta
lity
for
Men
and
Wom
en: N
HIS
Age
Fraction in Fair or Poor Health
0.1.2.3
Men
Wom
en
Average SRHS
1.5
2.0
2.5
3.0
Men
Wom
en
2030
4050
6070
0
.05
.10
Wom
en
Fraction Who DiedWithin 24 Months
Age
Men
Wom
en
Average Annual Hospital Episodes
20
40
60
80
0.1.2.3.4
Men
0 10
20
30
40
50
60
70
0 10
20
30
40
50
60
70
194 Demography, Volume 42-Number 2, May 2005
reports of hospitalizations rise with age from age 20. The pattern here mirrors what weobserved for self-assessed health: women’s excess hospitalizations are greatest at age 20,but men’s and women’s reported hospitalizations equalize by late middle age.
The bottom right panel of the figure presents the proportion of respondents in the1986–1994 surveys (aged 25–74 at the time of the survey) who died within 24 months oftheir interviews.3 It shows the well-known pattern of excess mortality among men at allages. However, the scale of the figure, with low mortality at the youngest ages, makes itdifficult to discern how the ratio of male-to-female mortality changes with age. A graphof the ratio of male-to-female mortality (not shown) indicates that the “excess” of malemortality is the greatest at the youngest ages and is fairly flat after age 40, increasingslightly at the oldest ages.
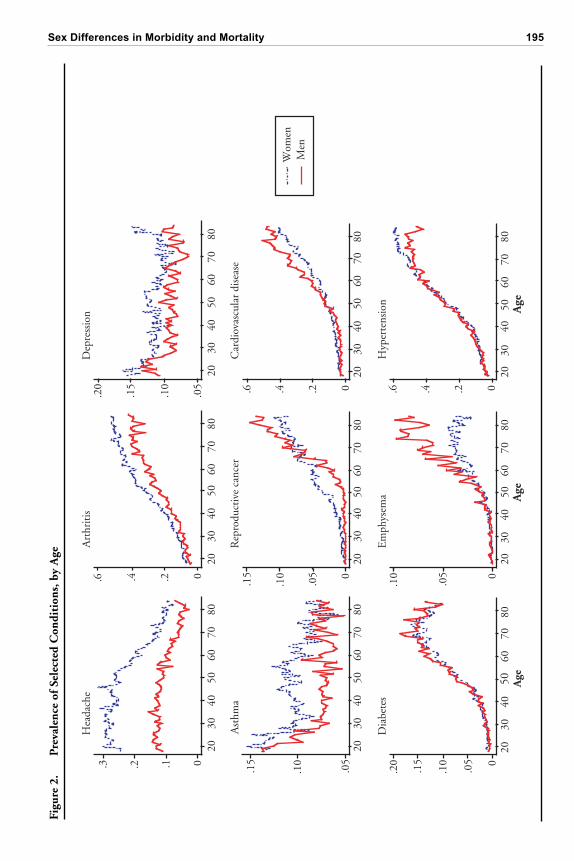
Although women report worse health than men at all but the oldest ages, they are notuniformly more likely to report that they have all chronic health conditions. Figure 2presents the prevalence rates for a selection of chronic health conditions for women andmen by exact age. These chronic conditions were chosen to illustrate the diversity ofpatterns that appear in the data. Several chronic conditions, including frequent headaches,arthritis, and depression, are more prevalent for women at all ages. For others, such asasthma, there is a higher prevalence among women than among men in middle age but notat the oldest ages. Yet others, such as reproductive cancers and CVD, are more prevalentamong women at younger ages but become more prevalent among men at older ages.Diabetes is equally prevalent for men and women at all ages. Emphysema and, to someextent, hypertension are equally prevalent among younger men and women but are moreprevalent among men older than age 60. These varied patterns confirm the view that womenare not uniformly more likely than men to suffer from all types of ailments. However, theyalso suggest that women are more likely than men to suffer from conditions, such asarthritis and frequent headaches, that are not life threatening but could lead to poor self-rated health and that men are more likely, at least at older ages when most deaths occur, tosuffer from diseases, such as CVD and emphysema, that are risk factors for mortality.
CHRONIC CONDITIONS, SELF-RATED HEALTH, AND MORTALITY
Self-Rated Health
Methods. To assess the routes to women’s poorer health, we examine the relationshipbetween reports of chronic conditions and self-rated health using the 1997–2001 surveys.Here, we present Oaxaca-like decompositions of the sex difference in health status intothree components: a “prevalence effect,” which is due to sex differences in the distribu-tions of chronic conditions; a “severity effect,” which is due to sex differences in theimpact of these conditions; and a remainder, which is due to differences in a set of otherobservable characteristics (age, education, and race) and to unobserved factors. The mea-sure of self-rated health is a binary indicator for whether self-rated health is fair or poor,which we hereafter refer to as “poor” health.
Our analysis uses the 18 chronic conditions listed in Table 1. We rule out conditionsthat are benign enough to pose little health hazard (e.g., hay fever), and restrict our atten-tion to conditions for which a consistent definition was used in all the years. These 18conditions fall into six broad categories: pain (headache; arthritis; and “other,” includingneck, back, and joint pain that is not due to arthritis), respiratory conditions (bronchitis,emphysema, asthma, and lung problems), circulatory conditions (CVD, diabetes, hyper-tension, and circulatory problems), cancers (skin, stomach, reproductive, and respiratory),chronic vision and hearing problems, and depression. The list of conditions is made up of
3. This figure is based on 586,703 respondents of all ages whose vital status could be determined.
Sex Differences in Morbidity and Mortality 195
Age
Age
Age
0.1.2.3
2030
4050
6070
80
Hea
dach
e
2030
4050
6070
800.2.4.6
Art
hrit
is
.05
.10
.15
.20
2030
4050
6070
80
Dep
ress
ion
.05
.10
.15
2030
4050
6070
80
Ast
hma
Wom
enM
en
0
.05
.10
.15
2030
4050
6070
80
Rep
rodu
ctiv
e ca
ncer
0.2.4.6
2030
4050
6070
80
Car
diov
ascu
lar
dise
ase
0.2.4.6
2030
4050
6070
80
Hyp
erte
nsio
n
0
.05
.10
.15
.20
2030
4050
6070
80
Dia
bete
s
0
.05
.10
2030
4050
6070
80
Em
phys
ema
Figu
re 2
.P
reva
lenc
e of
Sel
ecte
d C
ondi
tion
s, b
y A
ge
196 Demography, Volume 42-Number 2, May 2005
both diseases (e.g., emphysema) and illnesses that may be symptoms of diseases (e.g.,vision problems may be due to diseases of the eye or may be a by-product of diabetes).
We model the probability of being in poor health as a linear function of indicators forthe presence of a set of N chronic conditions (denoted as Ci, i = 1 . . . N); indicatorvariables for age, race, and survey year; and a control for education (X). The coefficientsin the model are assumed to differ across women (W) and men (M):
P
i
j
i
N
( ) ,H C Xi
j= + + j = W, M. (1)
We estimate (1) separately for women and men, using linear probability models.4 Esti-mates of W and M provide information on sex differences in how reports of chronicconditions map into reports of poor health. In addition, the parameter estimates, togetherwith information on the prevalence of the chronic conditions, can be used to construct
4. We use ordinary least squares (OLS) to estimate Eq. (1) because doing so results in an exact lineardecomposition of sex differences into three additive components. However, marginal effects from estimates ofprobit models are extremely similar to the OLS estimates we present.
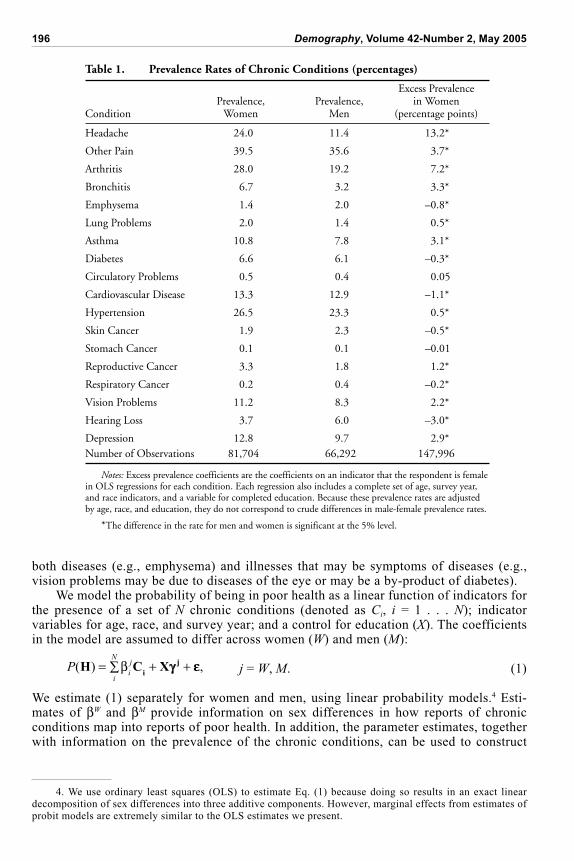
Table 1. Prevalence Rates of Chronic Conditions (percentages)
Excess PrevalencePrevalence, Prevalence, in Women
Condition Women Men (percentage points)
Headache 24.0 11.4 13.2*
Other Pain 39.5 35.6 3.7*
Arthritis 28.0 19.2 7.2*
Bronchitis 6.7 3.2 3.3*
Emphysema 1.4 2.0 –0.8*
Lung Problems 2.0 1.4 0.5*
Asthma 10.8 7.8 3.1*
Diabetes 6.6 6.1 –0.3*
Circulatory Problems 0.5 0.4 0.05
Cardiovascular Disease 13.3 12.9 –1.1*
Hypertension 26.5 23.3 0.5*
Skin Cancer 1.9 2.3 –0.5*
Stomach Cancer 0.1 0.1 –0.01
Reproductive Cancer 3.3 1.8 1.2*
Respiratory Cancer 0.2 0.4 –0.2*
Vision Problems 11.2 8.3 2.2*
Hearing Loss 3.7 6.0 –3.0*
Depression 12.8 9.7 2.9*Number of Observations 81,704 66,292 147,996
Notes: Excess prevalence coefficients are the coefficients on an indicator that the respondent is femalein OLS regressions for each condition. Each regression also includes a complete set of age, survey year,and race indicators, and a variable for completed education. Because these prevalence rates are adjustedby age, race, and education, they do not correspond to crude differences in male-female prevalence rates.
*The difference in the rate for men and women is significant at the 5% level.
Sex Differences in Morbidity and Mortality 197
severity and prevalence effects. The severity effect is measured as the sum of differencesin the coefficients for women’s and men’s chronic conditions, multiplied by the averageprevalence rate of each condition over both men and women (denoted as Ci):
severity effect = ( ) .i
W
ii
M
iC
The prevalence effect is measured as the sum over conditions of differences in prevalencerates between women and men, multiplied by the condition’s (averaged between the estimated for men and women):
prevalence effect = ( ) .C Ci
W
ii
M
i
The residual difference in women’s and men’s self-assessed health—the portion that isunexplained by the severity and prevalence effects just presented—combines differencesthat are produced by sex differences in average values of X (age, education, and race),sex differences in the effects of these variables on health (e.g., in ), and unexplaineddifferences.
We estimate two variants of Eq. (1) that differ in their measures of chronic condi-tions. In the first variant, each of the N indicators of chronic conditions measures thepresence or absence of one of the 18 ailments in our list (e.g., arthritis or asthma). Thisspecification is parsimonious, but does not account for the fact that health status may beinfluenced by the specific combination of conditions an individual has. In other words,the probability of poor health, given two chronic conditions, may not be the simple sumof the probability of poor health for each chronic condition observed individually. In ourdata, 45% of the respondents suffer from more than one chronic condition. The secondvariant allows for a large number of combinations of chronic conditions. In theory, wecould incorporate the presence of multiple conditions by redefining our chronic condi-tions to measure each unique combination of ailments. In practice, it is not possible toallow for all possible combinations of the 18 ailments we measure. There are, for ex-ample, 153 different ways in which a person could suffer from exactly 2 of the 18 ail-ments and 816 different ways in which a person could suffer from exactly 3 ailments.Instead, we capture the first-order interactions between conditions by defining “condi-tions” as single chronic ailments and all possible combinations of 2 chronic ailments.Individuals who suffer from CVD and emphysema have a “CVD-emphysema” condition.To avoid double counting, we do not assign these individuals to the “CVD only” or “em-physema only” conditions. We thus define 171 new conditions: 18 singletons plus 153pairs of ailments (so that N = 171). For the 73% of the individuals who reported 2 orfewer ailments, the conditions we identify provide a complete accounting of the combina-tions of ailments that they have. For the remainder, the estimation yields an approxima-tion of the effects of their combinations of conditions on health.
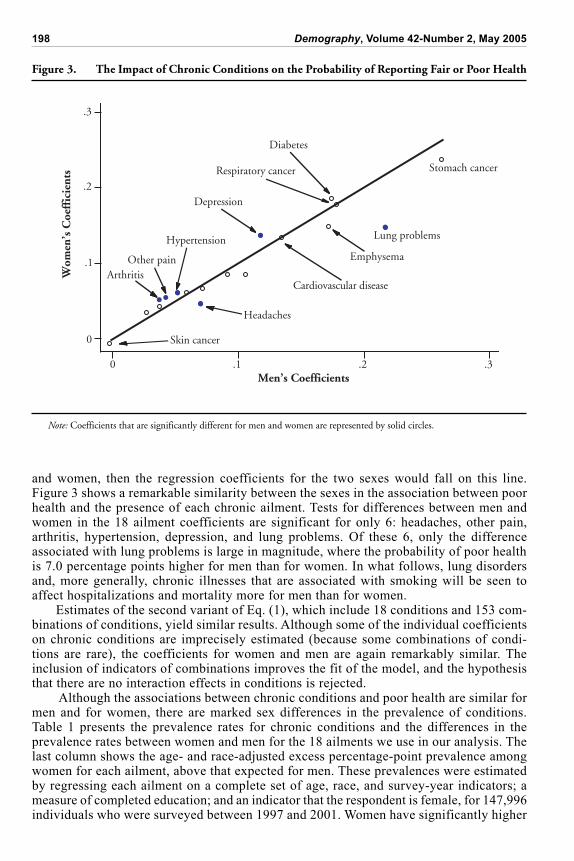
Results. Figure 3 graphs estimates of W (on the y-axis) against estimates of M (onthe x-axis) from the first variant of Eq. (1), in which the list of conditions consists of the18 conditions and no combinations of conditions. For both men and women, the conditionthat has the largest effect on self-assessed health is stomach cancer, which is associatedwith an increased probability of reporting poor health of roughly 25 percentage points.Respiratory cancer and diabetes are each associated with an 18-percentage-point increasein the probability of reporting poor health, for both men and women; depression and CVD,with a 15-percentage-point increase; and other pain, with a 5-percentage-point increase.Only one condition—skin cancer—is not significantly associated with poor health; thecoefficient for this condition is small and negative for both men and women.
The solid line in Figure 3 marks the 45-degree line: if the increase in the probabilityof reporting poor health in the presence of a given chronic condition were equal for men
198 Demography, Volume 42-Number 2, May 2005
Figure 3. The Impact of Chronic Conditions on the Probability of Reporting Fair or Poor Health
0
.1
.2
.3
Stomach cancer
Lung problems
Skin cancer
Hypertension
Diabetes
Respiratory cancer
Cardiovascular disease
Emphysema
Depression
Headaches
Other painArthritisW
omen
’s C
oeff
icie
nts
Men’s Coefficients0 .1 .2 .3
Note: Coefficients that are significantly different for men and women are represented by solid circles.
and women, then the regression coefficients for the two sexes would fall on this line.Figure 3 shows a remarkable similarity between the sexes in the association between poorhealth and the presence of each chronic ailment. Tests for differences between men andwomen in the 18 ailment coefficients are significant for only 6: headaches, other pain,arthritis, hypertension, depression, and lung problems. Of these 6, only the differenceassociated with lung problems is large in magnitude, where the probability of poor healthis 7.0 percentage points higher for men than for women. In what follows, lung disordersand, more generally, chronic illnesses that are associated with smoking will be seen toaffect hospitalizations and mortality more for men than for women.
Estimates of the second variant of Eq. (1), which include 18 conditions and 153 com-binations of conditions, yield similar results. Although some of the individual coefficientson chronic conditions are imprecisely estimated (because some combinations of condi-tions are rare), the coefficients for women and men are again remarkably similar. Theinclusion of indicators of combinations improves the fit of the model, and the hypothesisthat there are no interaction effects in conditions is rejected.
Although the associations between chronic conditions and poor health are similar formen and for women, there are marked sex differences in the prevalence of conditions.Table 1 presents the prevalence rates for chronic conditions and the differences in theprevalence rates between women and men for the 18 ailments we use in our analysis. Thelast column shows the age- and race-adjusted excess percentage-point prevalence amongwomen for each ailment, above that expected for men. These prevalences were estimatedby regressing each ailment on a complete set of age, race, and survey-year indicators; ameasure of completed education; and an indicator that the respondent is female, for 147,996individuals who were surveyed between 1997 and 2001. Women have significantly higher
Sex Differences in Morbidity and Mortality 199
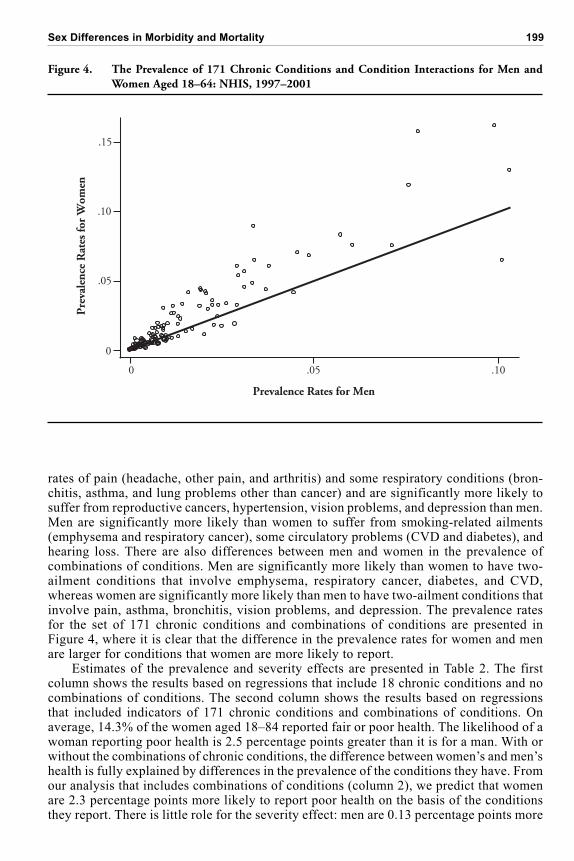
rates of pain (headache, other pain, and arthritis) and some respiratory conditions (bron-chitis, asthma, and lung problems other than cancer) and are significantly more likely tosuffer from reproductive cancers, hypertension, vision problems, and depression than men.Men are significantly more likely than women to suffer from smoking-related ailments(emphysema and respiratory cancer), some circulatory problems (CVD and diabetes), andhearing loss. There are also differences between men and women in the prevalence ofcombinations of conditions. Men are significantly more likely than women to have two-ailment conditions that involve emphysema, respiratory cancer, diabetes, and CVD,whereas women are significantly more likely than men to have two-ailment conditions thatinvolve pain, asthma, bronchitis, vision problems, and depression. The prevalence ratesfor the set of 171 chronic conditions and combinations of conditions are presented inFigure 4, where it is clear that the difference in the prevalence rates for women and menare larger for conditions that women are more likely to report.
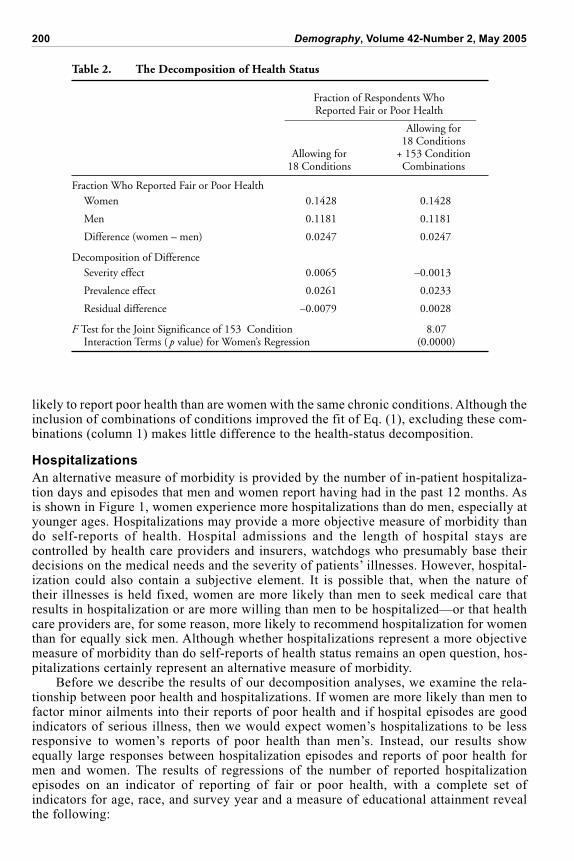
Estimates of the prevalence and severity effects are presented in Table 2. The firstcolumn shows the results based on regressions that include 18 chronic conditions and nocombinations of conditions. The second column shows the results based on regressionsthat included indicators of 171 chronic conditions and combinations of conditions. Onaverage, 14.3% of the women aged 18–84 reported fair or poor health. The likelihood of awoman reporting poor health is 2.5 percentage points greater than it is for a man. With orwithout the combinations of chronic conditions, the difference between women’s and men’shealth is fully explained by differences in the prevalence of the conditions they have. Fromour analysis that includes combinations of conditions (column 2), we predict that womenare 2.3 percentage points more likely to report poor health on the basis of the conditionsthey report. There is little role for the severity effect: men are 0.13 percentage points more
Figure 4. The Prevalence of 171 Chronic Conditions and Condition Interactions for Men andWomen Aged 18–64: NHIS, 1997–2001
Pre
vale
nce
Rat
es fo
r W
omen
Prevalence Rates for Men
0
.05
.10
.15
0 .05 .10
200 Demography, Volume 42-Number 2, May 2005
likely to report poor health than are women with the same chronic conditions. Although theinclusion of combinations of conditions improved the fit of Eq. (1), excluding these com-binations (column 1) makes little difference to the health-status decomposition.
Hospitalizations
An alternative measure of morbidity is provided by the number of in-patient hospitaliza-tion days and episodes that men and women report having had in the past 12 months. Asis shown in Figure 1, women experience more hospitalizations than do men, especially atyounger ages. Hospitalizations may provide a more objective measure of morbidity thando self-reports of health. Hospital admissions and the length of hospital stays arecontrolled by health care providers and insurers, watchdogs who presumably base theirdecisions on the medical needs and the severity of patients’ illnesses. However, hospital-ization could also contain a subjective element. It is possible that, when the nature oftheir illnesses is held fixed, women are more likely than men to seek medical care thatresults in hospitalization or are more willing than men to be hospitalized—or that healthcare providers are, for some reason, more likely to recommend hospitalization for womenthan for equally sick men. Although whether hospitalizations represent a more objectivemeasure of morbidity than do self-reports of health status remains an open question, hos-pitalizations certainly represent an alternative measure of morbidity.
Before we describe the results of our decomposition analyses, we examine the rela-tionship between poor health and hospitalizations. If women are more likely than men tofactor minor ailments into their reports of poor health and if hospital episodes are goodindicators of serious illness, then we would expect women’s hospitalizations to be lessresponsive to women’s reports of poor health than men’s. Instead, our results showequally large responses between hospitalization episodes and reports of poor health formen and women. The results of regressions of the number of reported hospitalizationepisodes on an indicator of reporting of fair or poor health, with a complete set ofindicators for age, race, and survey year and a measure of educational attainment revealthe following:
Table 2. The Decomposition of Health Status
Fraction of Respondents WhoReported Fair or Poor Health____________________________________
Allowing for18 Conditions
Allowing for + 153 Condition18 Conditions Combinations
Fraction Who Reported Fair or Poor HealthWomen 0.1428 0.1428
Men 0.1181 0.1181
Difference (women – men) 0.0247 0.0247
Decomposition of DifferenceSeverity effect 0.0065 –0.0013
Prevalence effect 0.0261 0.0233
Residual difference –0.0079 0.0028
F Test for the Joint Significance of 153 Condition 8.07Interaction Terms ( p value) for Women’s Regression (0.0000)
Sex Differences in Morbidity and Mortality 201
Women: Number of episodes = 0.341 Fair or Poor Health(0.006)
Men: Number of episodes = 0.338 Fair or Poor Health(0.007)
For both women and men, a report of fair or poor health translates, on average, into onethird of an extra hospitalization episode per year.
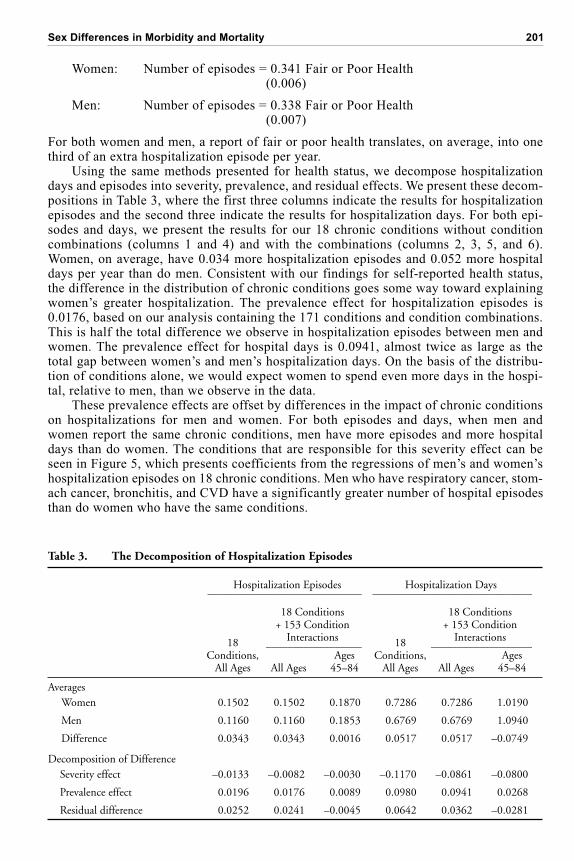
Using the same methods presented for health status, we decompose hospitalizationdays and episodes into severity, prevalence, and residual effects. We present these decom-positions in Table 3, where the first three columns indicate the results for hospitalizationepisodes and the second three indicate the results for hospitalization days. For both epi-sodes and days, we present the results for our 18 chronic conditions without conditioncombinations (columns 1 and 4) and with the combinations (columns 2, 3, 5, and 6).Women, on average, have 0.034 more hospitalization episodes and 0.052 more hospitaldays per year than do men. Consistent with our findings for self-reported health status,the difference in the distribution of chronic conditions goes some way toward explainingwomen’s greater hospitalization. The prevalence effect for hospitalization episodes is0.0176, based on our analysis containing the 171 conditions and condition combinations.This is half the total difference we observe in hospitalization episodes between men andwomen. The prevalence effect for hospital days is 0.0941, almost twice as large as thetotal gap between women’s and men’s hospitalization days. On the basis of the distribu-tion of conditions alone, we would expect women to spend even more days in the hospi-tal, relative to men, than we observe in the data.
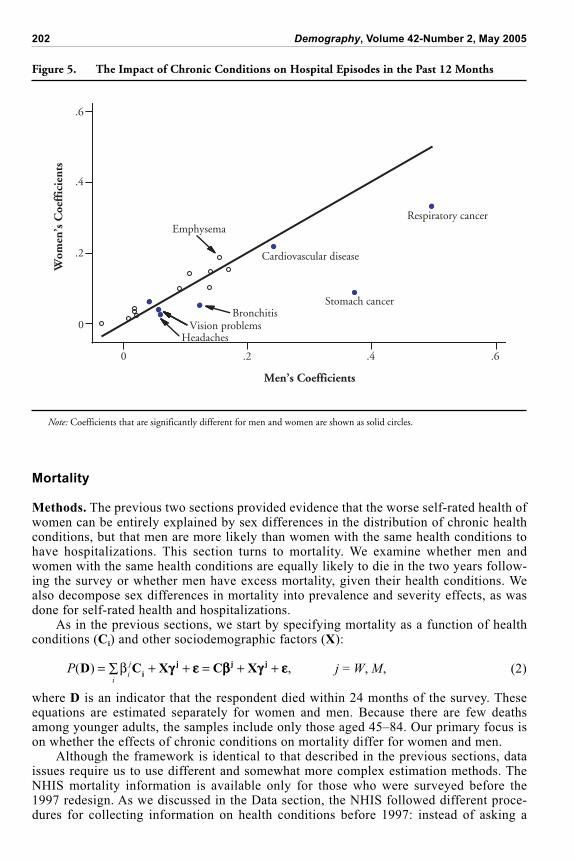
These prevalence effects are offset by differences in the impact of chronic conditionson hospitalizations for men and women. For both episodes and days, when men andwomen report the same chronic conditions, men have more episodes and more hospitaldays than do women. The conditions that are responsible for this severity effect can beseen in Figure 5, which presents coefficients from the regressions of men’s and women’shospitalization episodes on 18 chronic conditions. Men who have respiratory cancer, stom-ach cancer, bronchitis, and CVD have a significantly greater number of hospital episodesthan do women who have the same conditions.
Table 3. The Decomposition of Hospitalization Episodes
Hospitalization Episodes Hospitalization Days_____________________________ ______________________________
18 Conditions 18 Conditions
18
+ 153 Condition
18
+ 153 Condition
Conditions,
Interactions
Conditions,
Interactions__________________ ___________________Ages Ages
All Ages All Ages 45–84 All Ages All Ages 45–84
AveragesWomen 0.1502 0.1502 0.1870 0.7286 0.7286 1.0190
Men 0.1160 0.1160 0.1853 0.6769 0.6769 1.0940
Difference 0.0343 0.0343 0.0016 0.0517 0.0517 –0.0749
Decomposition of DifferenceSeverity effect –0.0133 –0.0082 –0.0030 –0.1170 –0.0861 –0.0800
Prevalence effect 0.0196 0.0176 0.0089 0.0980 0.0941 0.0268
Residual difference 0.0252 0.0241 –0.0045 0.0642 0.0362 –0.0281
202 Demography, Volume 42-Number 2, May 2005
Mortality
Methods. The previous two sections provided evidence that the worse self-rated health ofwomen can be entirely explained by sex differences in the distribution of chronic healthconditions, but that men are more likely than women with the same health conditions tohave hospitalizations. This section turns to mortality. We examine whether men andwomen with the same health conditions are equally likely to die in the two years follow-ing the survey or whether men have excess mortality, given their health conditions. Wealso decompose sex differences in mortality into prevalence and severity effects, as wasdone for self-rated health and hospitalizations.
As in the previous sections, we start by specifying mortality as a function of healthconditions (Ci) and other sociodemographic factors (X):
P
i
j
i
( ) ,D C X C Xi
j j j= + + = + + j = W, M, (2)
where D is an indicator that the respondent died within 24 months of the survey. Theseequations are estimated separately for women and men. Because there are few deathsamong younger adults, the samples include only those aged 45–84. Our primary focus ison whether the effects of chronic conditions on mortality differ for women and men.
Although the framework is identical to that described in the previous sections, dataissues require us to use different and somewhat more complex estimation methods. TheNHIS mortality information is available only for those who were surveyed before the1997 redesign. As we discussed in the Data section, the NHIS followed different proce-dures for collecting information on health conditions before 1997: instead of asking a
0
.2
.4
.6
Wom
en’s
Coe
ffic
ient
s
Men’s Coefficients
Stomach cancer
Respiratory cancer
Vision problemsHeadaches
Bronchitis
Emphysema
Cardiovascular disease
0 .2 .4 .6
Figure 5. The Impact of Chronic Conditions on Hospital Episodes in the Past 12 Months
Note: Coefficients that are significantly different for men and women are shown as solid circles.
Sex Differences in Morbidity and Mortality 203
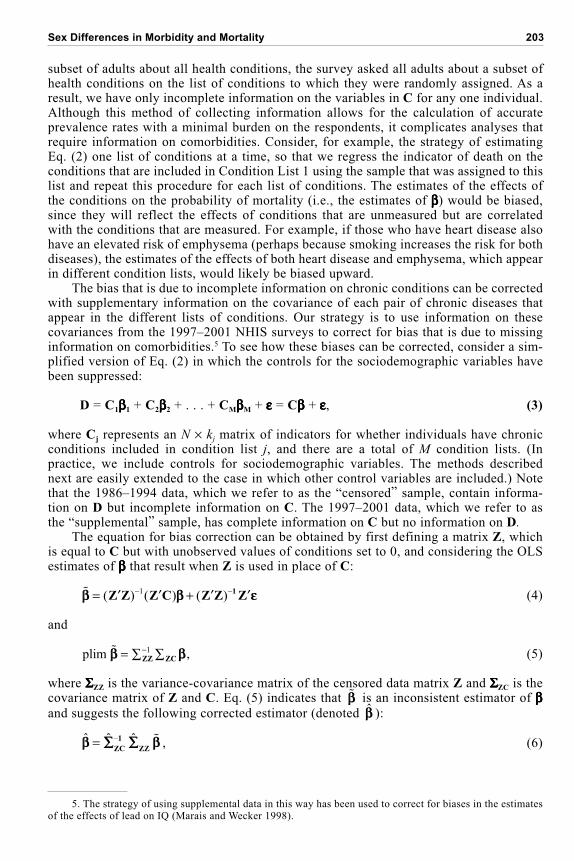
subset of adults about all health conditions, the survey asked all adults about a subset ofhealth conditions on the list of conditions to which they were randomly assigned. As aresult, we have only incomplete information on the variables in C for any one individual.Although this method of collecting information allows for the calculation of accurateprevalence rates with a minimal burden on the respondents, it complicates analyses thatrequire information on comorbidities. Consider, for example, the strategy of estimatingEq. (2) one list of conditions at a time, so that we regress the indicator of death on theconditions that are included in Condition List 1 using the sample that was assigned to thislist and repeat this procedure for each list of conditions. The estimates of the effects ofthe conditions on the probability of mortality (i.e., the estimates of ) would be biased,since they will reflect the effects of conditions that are unmeasured but are correlatedwith the conditions that are measured. For example, if those who have heart disease alsohave an elevated risk of emphysema (perhaps because smoking increases the risk for bothdiseases), the estimates of the effects of both heart disease and emphysema, which appearin different condition lists, would likely be biased upward.
The bias that is due to incomplete information on chronic conditions can be correctedwith supplementary information on the covariance of each pair of chronic diseases thatappear in the different lists of conditions. Our strategy is to use information on thesecovariances from the 1997–2001 NHIS surveys to correct for bias that is due to missinginformation on comorbidities.5 To see how these biases can be corrected, consider a sim-plified version of Eq. (2) in which the controls for the sociodemographic variables havebeen suppressed:
D = C1 1 + C2 2 + . . . + CM M + = C + , (3)
where Cj represents an N × kj matrix of indicators for whether individuals have chronicconditions included in condition list j, and there are a total of M condition lists. (Inpractice, we include controls for sociodemographic variables. The methods describednext are easily extended to the case in which other control variables are included.) Notethat the 1986–1994 data, which we refer to as the “censored” sample, contain informa-tion on D but incomplete information on C. The 1997–2001 data, which we refer to asthe “supplemental” sample, has complete information on C but no information on D.
The equation for bias correction can be obtained by first defining a matrix Z, whichis equal to C but with unobserved values of conditions set to 0, and considering the OLSestimates of that result when Z is used in place of C:
� = +( ) ( ) ( )Z Z Z C Z Z Z
11 (4)
and
plim � = ZCZZ
1 , (5)
where ZZ is the variance-covariance matrix of the censored data matrix Z and ZC is thecovariance matrix of Z and C. Eq. (5) indicates that
� is an inconsistent estimator of and suggests the following corrected estimator (denoted
ˆ ):
ˆ ˆ ˆ–=
ZC
1
ZZ� , (6)
5. The strategy of using supplemental data in this way has been used to correct for biases in the estimatesof the effects of lead on IQ (Marais and Wecker 1998).
204 Demography, Volume 42-Number 2, May 2005
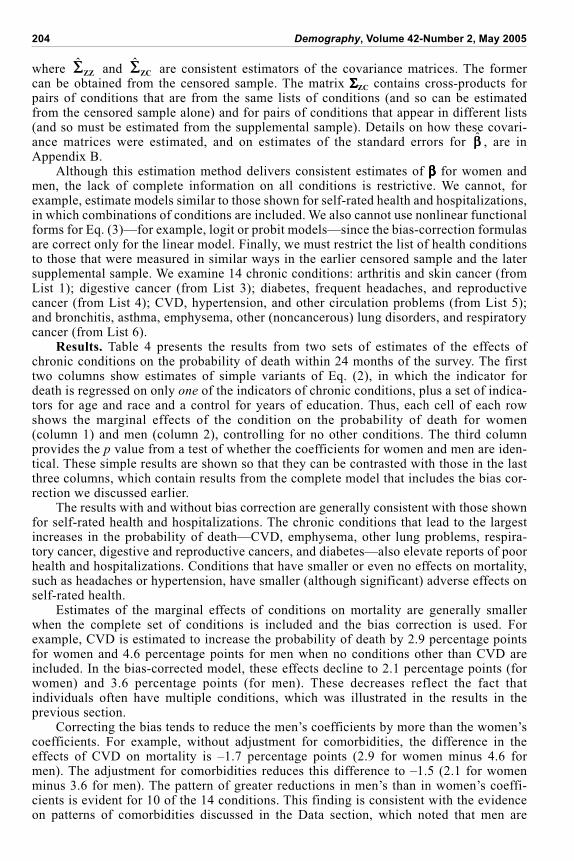
where ˆ
ZZ and ˆ
ZC are consistent estimators of the covariance matrices. The formercan be obtained from the censored sample. The matrix ZC contains cross-products forpairs of conditions that are from the same lists of conditions (and so can be estimatedfrom the censored sample alone) and for pairs of conditions that appear in different lists(and so must be estimated from the supplemental sample). Details on how these covari-ance matrices were estimated, and on estimates of the standard errors for
ˆ , are inAppendix B.
Although this estimation method delivers consistent estimates of for women andmen, the lack of complete information on all conditions is restrictive. We cannot, forexample, estimate models similar to those shown for self-rated health and hospitalizations,in which combinations of conditions are included. We also cannot use nonlinear functionalforms for Eq. (3)—for example, logit or probit models—since the bias-correction formulasare correct only for the linear model. Finally, we must restrict the list of health conditionsto those that were measured in similar ways in the earlier censored sample and the latersupplemental sample. We examine 14 chronic conditions: arthritis and skin cancer (fromList 1); digestive cancer (from List 3); diabetes, frequent headaches, and reproductivecancer (from List 4); CVD, hypertension, and other circulation problems (from List 5);and bronchitis, asthma, emphysema, other (noncancerous) lung disorders, and respiratorycancer (from List 6).
Results. Table 4 presents the results from two sets of estimates of the effects ofchronic conditions on the probability of death within 24 months of the survey. The firsttwo columns show estimates of simple variants of Eq. (2), in which the indicator fordeath is regressed on only one of the indicators of chronic conditions, plus a set of indica-tors for age and race and a control for years of education. Thus, each cell of each rowshows the marginal effects of the condition on the probability of death for women(column 1) and men (column 2), controlling for no other conditions. The third columnprovides the p value from a test of whether the coefficients for women and men are iden-tical. These simple results are shown so that they can be contrasted with those in the lastthree columns, which contain results from the complete model that includes the bias cor-rection we discussed earlier.
The results with and without bias correction are generally consistent with those shownfor self-rated health and hospitalizations. The chronic conditions that lead to the largestincreases in the probability of death—CVD, emphysema, other lung problems, respira-tory cancer, digestive and reproductive cancers, and diabetes—also elevate reports of poorhealth and hospitalizations. Conditions that have smaller or even no effects on mortality,such as headaches or hypertension, have smaller (although significant) adverse effects onself-rated health.
Estimates of the marginal effects of conditions on mortality are generally smallerwhen the complete set of conditions is included and the bias correction is used. Forexample, CVD is estimated to increase the probability of death by 2.9 percentage pointsfor women and 4.6 percentage points for men when no conditions other than CVD areincluded. In the bias-corrected model, these effects decline to 2.1 percentage points (forwomen) and 3.6 percentage points (for men). These decreases reflect the fact thatindividuals often have multiple conditions, which was illustrated in the results in theprevious section.
Correcting the bias tends to reduce the men’s coefficients by more than the women’scoefficients. For example, without adjustment for comorbidities, the difference in theeffects of CVD on mortality is –1.7 percentage points (2.9 for women minus 4.6 formen). The adjustment for comorbidities reduces this difference to –1.5 (2.1 for womenminus 3.6 for men). The pattern of greater reductions in men’s than in women’s coeffi-cients is evident for 10 of the 14 conditions. This finding is consistent with the evidenceon patterns of comorbidities discussed in the Data section, which noted that men are
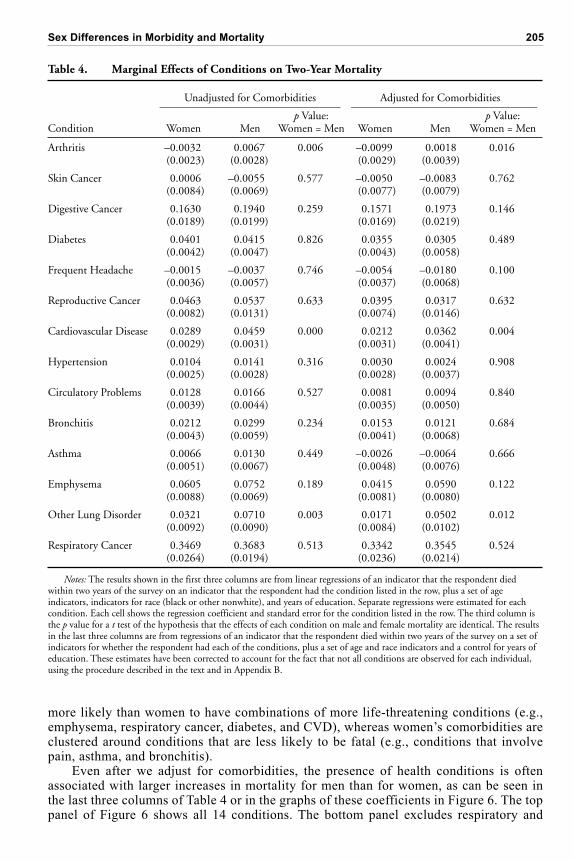
Sex Differences in Morbidity and Mortality 205
more likely than women to have combinations of more life-threatening conditions (e.g.,emphysema, respiratory cancer, diabetes, and CVD), whereas women’s comorbidities areclustered around conditions that are less likely to be fatal (e.g., conditions that involvepain, asthma, and bronchitis).
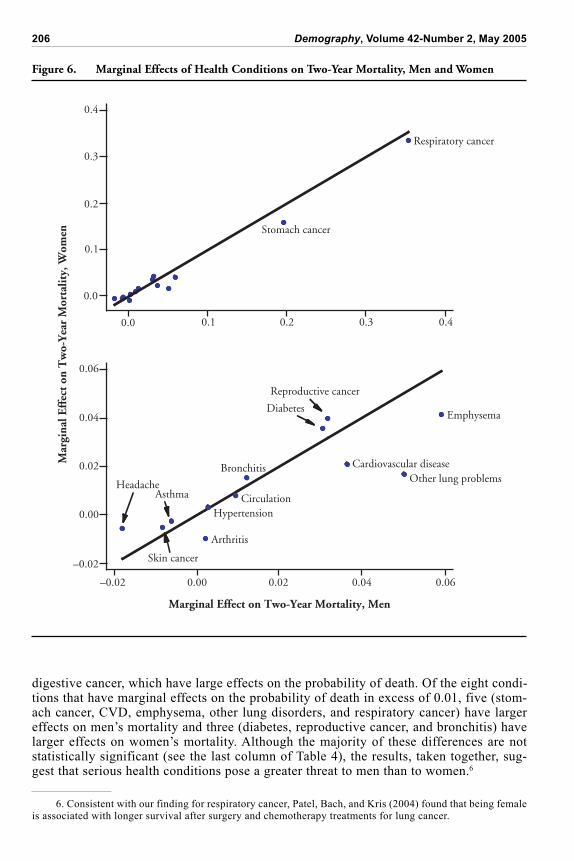
Even after we adjust for comorbidities, the presence of health conditions is oftenassociated with larger increases in mortality for men than for women, as can be seen inthe last three columns of Table 4 or in the graphs of these coefficients in Figure 6. The toppanel of Figure 6 shows all 14 conditions. The bottom panel excludes respiratory and
Table 4. Marginal Effects of Conditions on Two-Year Mortality
Unadjusted for Comorbidities Adjusted for Comorbidities__________________________________ ___________________________________p Value: p Value:
Condition Women Men Women = Men Women Men Women = Men
Arthritis –0.0032 0.0067 0.006 –0.0099 0.0018 0.016(0.0023) (0.0028) (0.0029) (0.0039)
Skin Cancer 0.0006 –0.0055 0.577 –0.0050 –0.0083 0.762(0.0084) (0.0069) (0.0077) (0.0079)
Digestive Cancer 0.1630 0.1940 0.259 0.1571 0.1973 0.146(0.0189) (0.0199) (0.0169) (0.0219)
Diabetes 0.0401 0.0415 0.826 0.0355 0.0305 0.489(0.0042) (0.0047) (0.0043) (0.0058)
Frequent Headache –0.0015 –0.0037 0.746 –0.0054 –0.0180 0.100(0.0036) (0.0057) (0.0037) (0.0068)
Reproductive Cancer 0.0463 0.0537 0.633 0.0395 0.0317 0.632(0.0082) (0.0131) (0.0074) (0.0146)
Cardiovascular Disease 0.0289 0.0459 0.000 0.0212 0.0362 0.004(0.0029) (0.0031) (0.0031) (0.0041)
Hypertension 0.0104 0.0141 0.316 0.0030 0.0024 0.908(0.0025) (0.0028) (0.0028) (0.0037)
Circulatory Problems 0.0128 0.0166 0.527 0.0081 0.0094 0.840(0.0039) (0.0044) (0.0035) (0.0050)
Bronchitis 0.0212 0.0299 0.234 0.0153 0.0121 0.684(0.0043) (0.0059) (0.0041) (0.0068)
Asthma 0.0066 0.0130 0.449 –0.0026 –0.0064 0.666(0.0051) (0.0067) (0.0048) (0.0076)
Emphysema 0.0605 0.0752 0.189 0.0415 0.0590 0.122(0.0088) (0.0069) (0.0081) (0.0080)
Other Lung Disorder 0.0321 0.0710 0.003 0.0171 0.0502 0.012(0.0092) (0.0090) (0.0084) (0.0102)
Respiratory Cancer 0.3469 0.3683 0.513 0.3342 0.3545 0.524(0.0264) (0.0194) (0.0236) (0.0214)
Notes: The results shown in the first three columns are from linear regressions of an indicator that the respondent diedwithin two years of the survey on an indicator that the respondent had the condition listed in the row, plus a set of ageindicators, indicators for race (black or other nonwhite), and years of education. Separate regressions were estimated for eachcondition. Each cell shows the regression coefficient and standard error for the condition listed in the row. The third column isthe p value for a t test of the hypothesis that the effects of each condition on male and female mortality are identical. The resultsin the last three columns are from regressions of an indicator that the respondent died within two years of the survey on a set ofindicators for whether the respondent had each of the conditions, plus a set of age and race indicators and a control for years ofeducation. These estimates have been corrected to account for the fact that not all conditions are observed for each individual,using the procedure described in the text and in Appendix B.
206 Demography, Volume 42-Number 2, May 2005
digestive cancer, which have large effects on the probability of death. Of the eight condi-tions that have marginal effects on the probability of death in excess of 0.01, five (stom-ach cancer, CVD, emphysema, other lung disorders, and respiratory cancer) have largereffects on men’s mortality and three (diabetes, reproductive cancer, and bronchitis) havelarger effects on women’s mortality. Although the majority of these differences are notstatistically significant (see the last column of Table 4), the results, taken together, sug-gest that serious health conditions pose a greater threat to men than to women.6
Figure 6. Marginal Effects of Health Conditions on Two-Year Mortality, Men and Women
0.0 0.1 0.2 0.3 0.4
0.0
0.1
0.2
0.3
0.4
–0.02 0.00 0.02 0.04 0.06
–0.02
0.00
0.02
0.04
0.06
Asthma
Bronchitis
Emphysema
Other lung problems
Circulation
Cardiovascular disease
Hypertension
Reproductive cancer
Diabetes
Headache
Skin cancer
Respiratory cancer
Stomach cancer
Arthritis
Marginal Effect on Two-Year Mortality, Men
Mar
gina
l Eff
ect
on T
wo-
Yea
r M
orta
lity,
Wom
en
6. Consistent with our finding for respiratory cancer, Patel, Bach, and Kris (2004) found that being femaleis associated with longer survival after surgery and chemotherapy treatments for lung cancer.
Sex Differences in Morbidity and Mortality 207
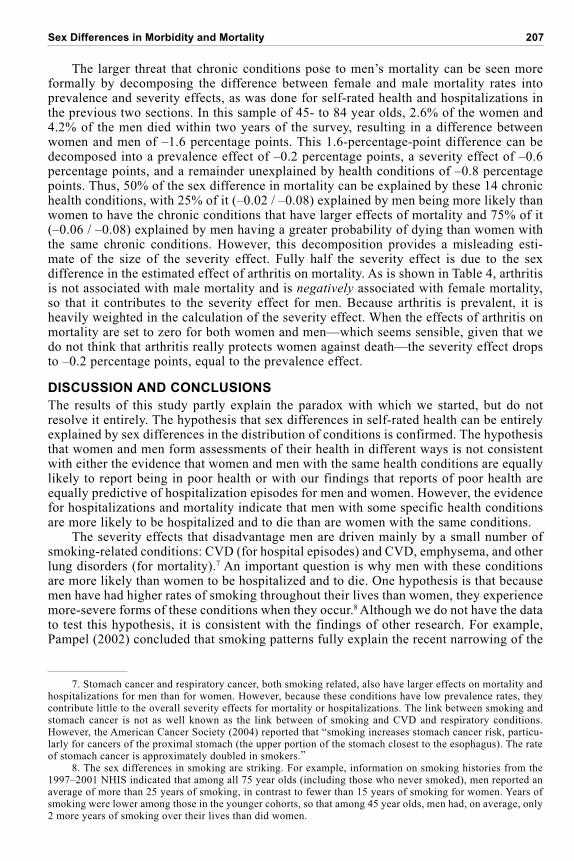
The larger threat that chronic conditions pose to men’s mortality can be seen moreformally by decomposing the difference between female and male mortality rates intoprevalence and severity effects, as was done for self-rated health and hospitalizations inthe previous two sections. In this sample of 45- to 84 year olds, 2.6% of the women and4.2% of the men died within two years of the survey, resulting in a difference betweenwomen and men of –1.6 percentage points. This 1.6-percentage-point difference can bedecomposed into a prevalence effect of –0.2 percentage points, a severity effect of –0.6percentage points, and a remainder unexplained by health conditions of –0.8 percentagepoints. Thus, 50% of the sex difference in mortality can be explained by these 14 chronichealth conditions, with 25% of it (–0.02 / –0.08) explained by men being more likely thanwomen to have the chronic conditions that have larger effects of mortality and 75% of it(–0.06 / –0.08) explained by men having a greater probability of dying than women withthe same chronic conditions. However, this decomposition provides a misleading esti-mate of the size of the severity effect. Fully half the severity effect is due to the sexdifference in the estimated effect of arthritis on mortality. As is shown in Table 4, arthritisis not associated with male mortality and is negatively associated with female mortality,so that it contributes to the severity effect for men. Because arthritis is prevalent, it isheavily weighted in the calculation of the severity effect. When the effects of arthritis onmortality are set to zero for both women and men—which seems sensible, given that wedo not think that arthritis really protects women against death—the severity effect dropsto –0.2 percentage points, equal to the prevalence effect.
DISCUSSION AND CONCLUSIONS
The results of this study partly explain the paradox with which we started, but do notresolve it entirely. The hypothesis that sex differences in self-rated health can be entirelyexplained by sex differences in the distribution of conditions is confirmed. The hypothesisthat women and men form assessments of their health in different ways is not consistentwith either the evidence that women and men with the same health conditions are equallylikely to report being in poor health or with our findings that reports of poor health areequally predictive of hospitalization episodes for men and women. However, the evidencefor hospitalizations and mortality indicate that men with some specific health conditionsare more likely to be hospitalized and to die than are women with the same conditions.
The severity effects that disadvantage men are driven mainly by a small number ofsmoking-related conditions: CVD (for hospital episodes) and CVD, emphysema, and otherlung disorders (for mortality).7 An important question is why men with these conditionsare more likely than women to be hospitalized and to die. One hypothesis is that becausemen have had higher rates of smoking throughout their lives than women, they experiencemore-severe forms of these conditions when they occur.8 Although we do not have the datato test this hypothesis, it is consistent with the findings of other research. For example,Pampel (2002) concluded that smoking patterns fully explain the recent narrowing of the
7. Stomach cancer and respiratory cancer, both smoking related, also have larger effects on mortality andhospitalizations for men than for women. However, because these conditions have low prevalence rates, theycontribute little to the overall severity effects for mortality or hospitalizations. The link between smoking andstomach cancer is not as well known as the link between of smoking and CVD and respiratory conditions.However, the American Cancer Society (2004) reported that “smoking increases stomach cancer risk, particu-larly for cancers of the proximal stomach (the upper portion of the stomach closest to the esophagus). The rateof stomach cancer is approximately doubled in smokers.”
8. The sex differences in smoking are striking. For example, information on smoking histories from the1997–2001 NHIS indicated that among all 75 year olds (including those who never smoked), men reported anaverage of more than 25 years of smoking, in contrast to fewer than 15 years of smoking for women. Years ofsmoking were lower among those in the younger cohorts, so that among 45 year olds, men had, on average, only2 more years of smoking over their lives than did women.
208 Demography, Volume 42-Number 2, May 2005
mortality differences between men and women, and Valkonen and van Poppel (1997) con-cluded that 40% of the total sex differences in life expectancy at age 35 could be explainedby smoking. If sex differences in the lifetime use of tobacco are generating excess malemortality, then the smaller sex gap in smoking among these younger cohorts may reduceexcess male mortality through both the prevalence effect and the severity effect.
The remaining question is why, if smoking-related conditions are more likely to re-sult in hospitalizations and death for men, do they not also result in greater reports ofpoor health for men? A partial answer to this question is that some of these conditions doproduce both excess male mortality and higher reports of poor health for men than forwomen. The results presented in Figure 3 indicate that among those with emphysema and“other lung” problems, men are more likely than women to report poor health. Althoughsex differences in these coefficients are statistically significant only for lung problems,not for emphysema, they point to the possibility that men experience more-severe formsof these conditions—a possibility that is consistent with the evidence of greater rates ofsmoking among men presented earlier. However, it is more difficult to explain the findingthat men with CVD are equally likely to report poor health but are more likely to experi-ence hospitalizations and to die than are women with CVD.
Another possible answer is that men tend to report health conditions only when theyare at more-severe or more-advanced stages of these conditions. For example, a womanwith mild angina may report that she has CVD, whereas a man may not do so until hehas had a heart attack. This possibility would explain why reported CVD has a largereffect on male than on female mortality. However, for the results for self-rated health tobe reconciled with those for mortality, women with milder forms of CVD would have tobe as likely to report poor health as men with more-severe forms of CVD. In otherwords, women would have to be more likely than men to report less-severe forms ofconditions and to factor milder forms of conditions into their reports of poor health.Although this answer logically possible, we do not think that it is plausible. If womensystematically reported milder forms of all conditions, we would expect to see theseconditions having smaller effects on women’s mortality. For many of the health condi-tions we examined, there were no sex differences in the effects on either self-rated healthor mortality. This was the case even for conditions, such as diabetes and bronchitis, thatcan have various degrees of severity.
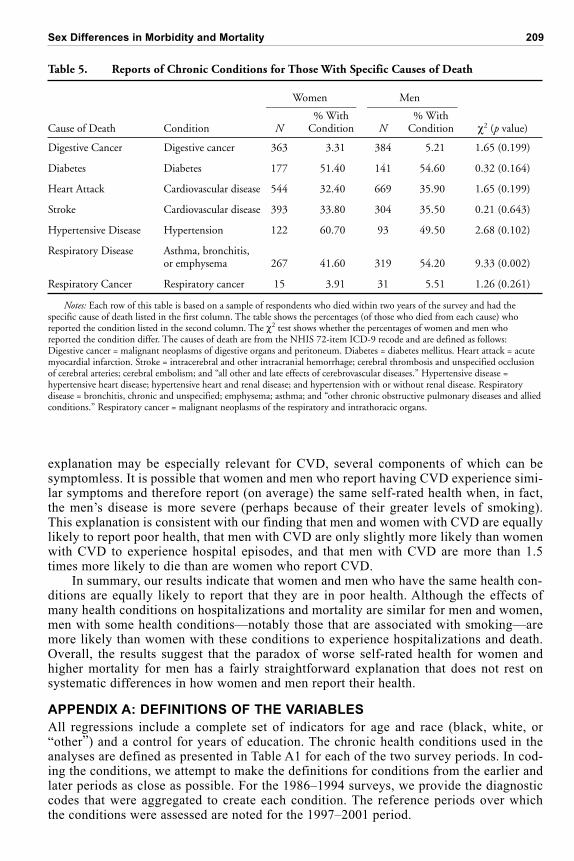
Additional evidence comes from looking at samples of individuals who died fromspecific causes (e.g., acute myocardial infarction or stroke) within two years of the sur-vey and examining whether these individuals reported conditions that were associatedwith those causes of death. If men are more likely than women to underreport condi-tions, then men who died should have been less likely than women who died to havereported that they had the condition that resulted in their death. The results in Table 5indicate that this is not the case. Women and men whose causes of death were digestivecancer, diabetes, heart attack, stroke, hypertensive disease, and respiratory cancer wereequally likely to have reported the relevant condition in the preceding interview. Menwho died of respiratory disease (bronchitis, asthma, emphysema, or chronic obstructivepulmonary disease) were more likely than women who died from respiratory disease tohave reported one or more of the conditions leading up to this cause of death. It shouldbe noted that reports of the relevant conditions are often low for both men and women,indicating that chronic conditions may be underreported because of either an unwilling-ness to disclose health conditions or a lack of knowledge about those conditions (foradditional evidence of the underreporting of health conditions in Canada, see Baker,Stabile, and Deri 2004). However, we found no evidence that men report conditions lessoften than women.
The final explanation is that, for at least some conditions, the symptoms that indi-viduals experience may convey little information about the severity of the disease. This
Sex Differences in Morbidity and Mortality 209
explanation may be especially relevant for CVD, several components of which can besymptomless. It is possible that women and men who report having CVD experience simi-lar symptoms and therefore report (on average) the same self-rated health when, in fact,the men’s disease is more severe (perhaps because of their greater levels of smoking).This explanation is consistent with our finding that men and women with CVD are equallylikely to report poor health, that men with CVD are only slightly more likely than womenwith CVD to experience hospital episodes, and that men with CVD are more than 1.5times more likely to die than are women who report CVD.
In summary, our results indicate that women and men who have the same health con-ditions are equally likely to report that they are in poor health. Although the effects ofmany health conditions on hospitalizations and mortality are similar for men and women,men with some health conditions—notably those that are associated with smoking—aremore likely than women with these conditions to experience hospitalizations and death.Overall, the results suggest that the paradox of worse self-rated health for women andhigher mortality for men has a fairly straightforward explanation that does not rest onsystematic differences in how women and men report their health.
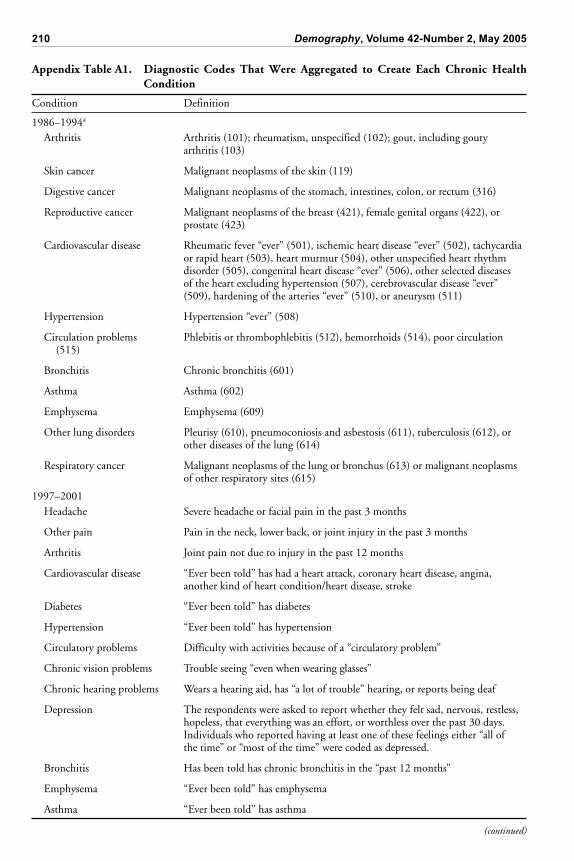
APPENDIX A: DEFINITIONS OF THE VARIABLES
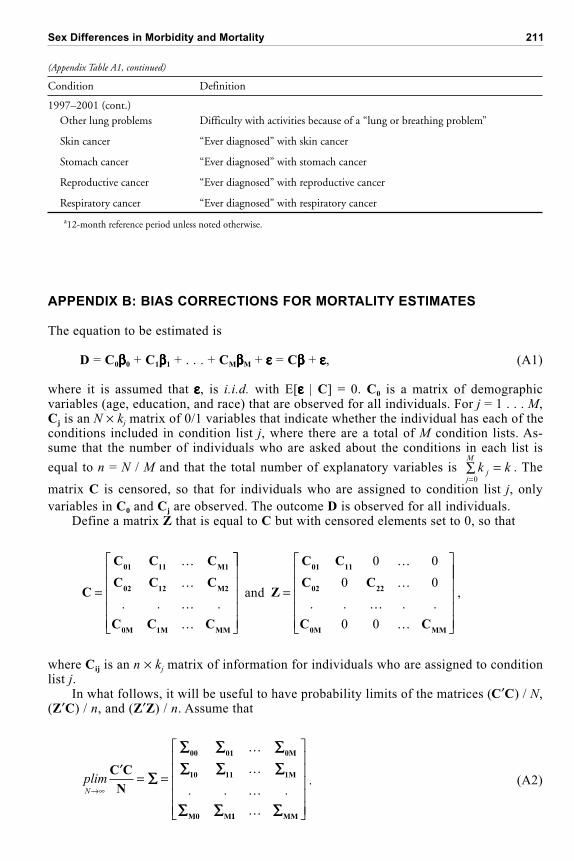
All regressions include a complete set of indicators for age and race (black, white, or“other”) and a control for years of education. The chronic health conditions used in theanalyses are defined as presented in Table A1 for each of the two survey periods. In cod-ing the conditions, we attempt to make the definitions for conditions from the earlier andlater periods as close as possible. For the 1986–1994 surveys, we provide the diagnosticcodes that were aggregated to create each condition. The reference periods over whichthe conditions were assessed are noted for the 1997–2001 period.
Table 5. Reports of Chronic Conditions for Those With Specific Causes of Death
Women Men_________________ _________________% With % With
Cause of Death Condition N Condition N Condition 2 (p value)
Digestive Cancer Digestive cancer 363 3.31 384 5.21 1.65 (0.199)
Diabetes Diabetes 177 51.40 141 54.60 0.32 (0.164)
Heart Attack Cardiovascular disease 544 32.40 669 35.90 1.65 (0.199)
Stroke Cardiovascular disease 393 33.80 304 35.50 0.21 (0.643)
Hypertensive Disease Hypertension 122 60.70 93 49.50 2.68 (0.102)
Respiratory Disease Asthma, bronchitis,or emphysema 267 41.60 319 54.20 9.33 (0.002)
Respiratory Cancer Respiratory cancer 15 3.91 31 5.51 1.26 (0.261)
Notes: Each row of this table is based on a sample of respondents who died within two years of the survey and had thespecific cause of death listed in the first column. The table shows the percentages (of those who died from each cause) whoreported the condition listed in the second column. The 2 test shows whether the percentages of women and men whoreported the condition differ. The causes of death are from the NHIS 72-item ICD-9 recode and are defined as follows:Digestive cancer = malignant neoplasms of digestive organs and peritoneum. Diabetes = diabetes mellitus. Heart attack = acutemyocardial infarction. Stroke = intracerebral and other intracranial hemorrhage; cerebral thrombosis and unspecified occlusionof cerebral arteries; cerebral embolism; and “all other and late effects of cerebrovascular diseases.” Hypertensive disease =hypertensive heart disease; hypertensive heart and renal disease; and hypertension with or without renal disease. Respiratorydisease = bronchitis, chronic and unspecified; emphysema; asthma; and “other chronic obstructive pulmonary diseases and alliedconditions.” Respiratory cancer = malignant neoplasms of the respiratory and intrathoracic organs.
210 Demography, Volume 42-Number 2, May 2005
Appendix Table A1. Diagnostic Codes That Were Aggregated to Create Each Chronic HealthCondition
Condition Definition
1986–1994a
Arthritis Arthritis (101); rheumatism, unspecified (102); gout, including goutyarthritis (103)
Skin cancer Malignant neoplasms of the skin (119)
Digestive cancer Malignant neoplasms of the stomach, intestines, colon, or rectum (316)
Reproductive cancer Malignant neoplasms of the breast (421), female genital organs (422), orprostate (423)
Cardiovascular disease Rheumatic fever “ever” (501), ischemic heart disease “ever” (502), tachycardiaor rapid heart (503), heart murmur (504), other unspecified heart rhythmdisorder (505), congenital heart disease “ever” (506), other selected diseasesof the heart excluding hypertension (507), cerebrovascular disease “ever”(509), hardening of the arteries “ever” (510), or aneurysm (511)
Hypertension Hypertension “ever” (508)
Circulation problems Phlebitis or thrombophlebitis (512), hemorrhoids (514), poor circulation(515)
Bronchitis Chronic bronchitis (601)
Asthma Asthma (602)
Emphysema Emphysema (609)
Other lung disorders Pleurisy (610), pneumoconiosis and asbestosis (611), tuberculosis (612), orother diseases of the lung (614)
Respiratory cancer Malignant neoplasms of the lung or bronchus (613) or malignant neoplasmsof other respiratory sites (615)
1997–2001Headache Severe headache or facial pain in the past 3 months
Other pain Pain in the neck, lower back, or joint injury in the past 3 months
Arthritis Joint pain not due to injury in the past 12 months
Cardiovascular disease “Ever been told” has had a heart attack, coronary heart disease, angina,another kind of heart condition/heart disease, stroke
Diabetes “Ever been told” has diabetes
Hypertension “Ever been told” has hypertension
Circulatory problems Difficulty with activities because of a “circulatory problem”
Chronic vision problems Trouble seeing “even when wearing glasses”
Chronic hearing problems Wears a hearing aid, has “a lot of trouble” hearing, or reports being deaf
Depression The respondents were asked to report whether they felt sad, nervous, restless,hopeless, that everything was an effort, or worthless over the past 30 days.Individuals who reported having at least one of these feelings either “all ofthe time” or “most of the time” were coded as depressed.
Bronchitis Has been told has chronic bronchitis in the “past 12 months”
Emphysema “Ever been told” has emphysema
Asthma “Ever been told” has asthma
(continued)
Sex Differences in Morbidity and Mortality 211
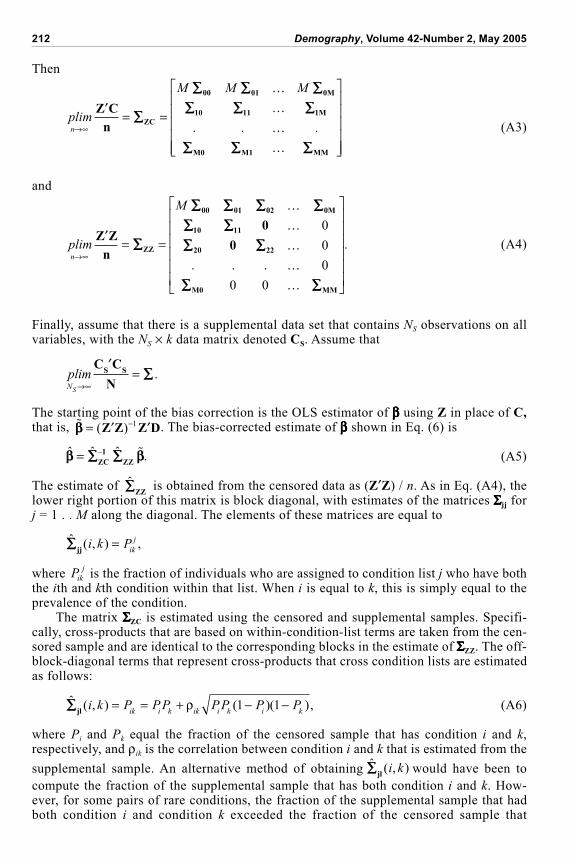
APPENDIX B: BIAS CORRECTIONS FOR MORTALITY ESTIMATES
The equation to be estimated is
D = C0 0 + C1 1 + . . . + CM M + = C + , (A1)
where it is assumed that , is i.i.d. with E[ | C] = 0. C0 is a matrix of demographicvariables (age, education, and race) that are observed for all individuals. For j = 1 . . . M,Cj is an N × kj matrix of 0/1 variables that indicate whether the individual has each of theconditions included in condition list j, where there are a total of M condition lists. As-sume that the number of individuals who are asked about the conditions in each list is
equal to n = N / M and that the total number of explanatory variables is
k kjj
M
==0
. The
matrix C is censored, so that for individuals who are assigned to condition list j, only
variables in C0 and Cj are observed. The outcome D is observed for all individuals.Define a matrix Z that is equal to C but with censored elements set to 0, so that
C
C C C
C C C
C C C
01 11 M1
02 12 M2
0M 1M MM
=
…
…
…
…
. . . and
Z
C C
C C
C C
01 11
02 22
0M MM
=
0 0
0 0
0 0
…
…
…
…
. . . .,
where Cij is an n × kj matrix of information for individuals who are assigned to conditionlist j.
In what follows, it will be useful to have probability limits of the matrices (C C) / N,(Z C) / n, and (Z Z) / n. Assume that
plimN
= =C C
N
00 01 0M
10 11 1M
M0 M
…
…
…. . .
11 MM…
. (A2)
(Appendix Table A1, continued)
Condition Definition
1997–2001 (cont.)Other lung problems Difficulty with activities because of a “lung or breathing problem”
Skin cancer “Ever diagnosed” with skin cancer
Stomach cancer “Ever diagnosed” with stomach cancer
Reproductive cancer “Ever diagnosed” with reproductive cancer
Respiratory cancer “Ever diagnosed” with respiratory cancer
a12-month reference period unless noted otherwise.
212 Demography, Volume 42-Number 2, May 2005
Then
plim
M M M
n
= =Z C
nZC
00 01 0M
10 11 1M
M0 M1 MM
…
…
…
…
. . . (A3)
and
plim
M
n
= =Z Z
nZZ
00 01 02 0M
10 11
20 22
M0 MM
0
0
…
…
…
…
…
0
0
0
0 0
. . .
. (A4)
Finally, assume that there is a supplemental data set that contains NS observations on allvariables, with the NS × k data matrix denoted CS. Assume that
plimNS
=C C
N
S S .
The starting point of the bias correction is the OLS estimator of using Z in place of C,that is,
� = ( )Z Z Z D
1 . The bias-corrected estimate of shown in Eq. (6) is
ˆ ˆ ˆ .–=
ZC
1
ZZ� (A5)
The estimate of ˆ
ZZ is obtained from the censored data as (Z Z) / n. As in Eq. (A4), the
lower right portion of this matrix is block diagonal, with estimates of the matrices jj forj = 1 . . M along the diagonal. The elements of these matrices are equal to
ˆ ( , ) ,
jji k P
ik
j=
where Pik
j is the fraction of individuals who are assigned to condition list j who have both
the ith and kth condition within that list. When i is equal to k, this is simply equal to theprevalence of the condition.
The matrix ZC is estimated using the censored and supplemental samples. Specifi-cally, cross-products that are based on within-condition-list terms are taken from the cen-sored sample and are identical to the corresponding blocks in the estimate of ZZ. The off-block-diagonal terms that represent cross-products that cross condition lists are estimatedas follows:
ˆ ( , ) ( )( ),
jli k P PP PP P P
ik i k ik i k i k= = + 1 1 (A6)
where Pi and Pk equal the fraction of the censored sample that has condition i and k,respectively, and ik is the correlation between condition i and k that is estimated from the
supplemental sample. An alternative method of obtaining ˆ ( , )
jli k would have been to
compute the fraction of the supplemental sample that has both condition i and k. How-ever, for some pairs of rare conditions, the fraction of the supplemental sample that hadboth condition i and condition k exceeded the fraction of the censored sample that
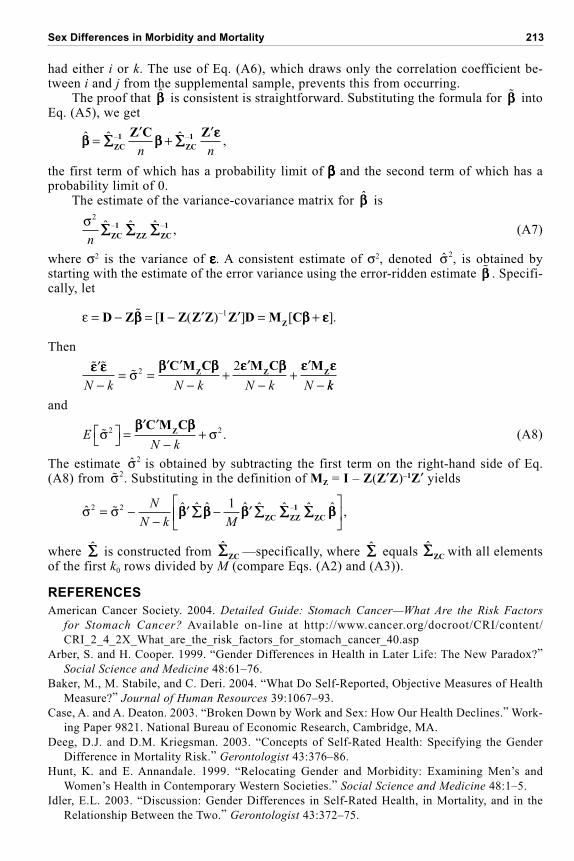
Sex Differences in Morbidity and Mortality 213
had either i or k. The use of Eq. (A6), which draws only the correlation coefficient be-tween i and j from the supplemental sample, prevents this from occurring.
The proof that ˆ is consistent is straightforward. Substituting the formula for
� intoEq. (A5), we get
ˆ ˆ ˆ ,– –= +ZC
1
ZC
1Z C Z
n n
the first term of which has a probability limit of and the second term of which has aprobability limit of 0.
The estimate of the variance-covariance matrix for ˆ is
2
nˆ ˆ ˆ ,– –
ZC
1
ZZ ZC
1 (A7)
where 2 is the variance of . A consistent estimate of 2, denoted ˆ2, is obtained by
starting with the estimate of the error variance using the error-ridden estimate
� . Specifi-cally, let
= = = +D Z I Z Z Z Z D M C
Z� [ ( ) ] [ ].1
Then
� ��= = + +
N k N k N k N
2 2C M C M C MZ Z Z
kk
and
E
N k�
2 2= +C M C
Z . (A8)
The estimate ˆ2 is obtained by subtracting the first term on the right-hand side of Eq.
(A8) from �2. Substituting in the definition of MZ = I – Z(Z Z)–1Z yields
ˆ ˆ ˆ ˆ ˆ ˆ ˆ ˆ ˆ–2 2 1= �N
N k M∑∑ ∑∑
ZC ZZ
1
ZC,
where ˆ is constructed from
ˆ
ZC —specifically, where ˆ equals
ˆ
ZC with all elementsof the first k0 rows divided by M (compare Eqs. (A2) and (A3)).
REFERENCES
American Cancer Society. 2004. Detailed Guide: Stomach Cancer—What Are the Risk Factors
for Stomach Cancer? Available on-line at http://www.cancer.org/docroot/CRI/content/CRI_2_4_2X_What_are_the_risk_factors_for_stomach_cancer_40.asp
Arber, S. and H. Cooper. 1999. “Gender Differences in Health in Later Life: The New Paradox?”Social Science and Medicine 48:61–76.
Baker, M., M. Stabile, and C. Deri. 2004. “What Do Self-Reported, Objective Measures of HealthMeasure?” Journal of Human Resources 39:1067–93.
Case, A. and A. Deaton. 2003. “Broken Down by Work and Sex: How Our Health Declines.” Work-ing Paper 9821. National Bureau of Economic Research, Cambridge, MA.
Deeg, D.J. and D.M. Kriegsman. 2003. “Concepts of Self-Rated Health: Specifying the GenderDifference in Mortality Risk.” Gerontologist 43:376–86.
Hunt, K. and E. Annandale. 1999. “Relocating Gender and Morbidity: Examining Men’s andWomen’s Health in Contemporary Western Societies.” Social Science and Medicine 48:1–5.
Idler, E.L. 2003. “Discussion: Gender Differences in Self-Rated Health, in Mortality, and in theRelationship Between the Two.” Gerontologist 43:372–75.
214 Demography, Volume 42-Number 2, May 2005
Idler, E.L. and Y. Benyamini. 1997. “Self-Rated Health and Mortality: A Review of Twenty-SevenCommunity Studies.” Journal of Health and Social Behavior 38(1):21–37.
Lawlor, D.H., S. Ebrahim, and G. Davey Smith. 2001. “Sex Matters: Secular and GeographicalTrends in Sex Differences in Coronary Heart Disease Mortality.” British Medical Journal
323:541–45.Leinonen, R., E. Heikkinen, and M. Jylha. 1997. “Self-Rated Health and Self-Assessed Change in
Health in Elderly Men and Women—A Five-Year Longitudinal Study.” Social Science and Medi-
cine 46(4–5):591–97.MacIntyre, S., G. Ford, and K. Hunt. 1999. “Do Women ‘Over-Report’ Morbidity? Men’s and
Women’s Responses to Structured Prompting on a Standard Question on Long Standing Ill-ness.” Social Science and Medicine 48:89–98.
MacIntyre, S., K. Hunt, and H. Sweeting. 1996. “Gender Differences in Health: Are Things Reallyas Simple as They Seem?” Social Science and Medicine 42:617–24.
Marais, L.M. and W.E. Wecker. 1998. “Correcting for Omitted-Variables and Measurement-ErrorBias in Regression With an Application to the Effect of Lead in IQ.” Journal of the American
Statistical Association 93(442):494–505.Molarius, A. and S. Janson. 2002. “Self-Rated Health, Chronic Diseases, and Symptoms Among
Middle-Aged and Elderly Men and Women.” Journal of Clinical Epidemiology 55:364–70.Nathanson, C. 1975. “Illness and the Feminine Role: A Theoretical Review.” Social Science and
Medicine 9:57–62.Pampel, F.C. 2002. “Cigarette Use and the Narrowing Sex Differentials in Mortality.” Population
and Development Review 28:77–104.Patel, J.D., P.B. Bach, and M.G. Kris. 2004. “Lung Cancer in Women: A Contemporary Epidemic.”
Journal of the American Medical Association 291(14):1763–68.Spiers, N., C. Jagger, M. Clarke, and A. Arthur. 2003. “Are Gender Differences in the Relationship
Between Self-Rated Health and Mortality Enduring? Results From Three Birth Cohorts inMelton Mowbray, United Kingdom.” Gerontologist 43:406–11.
Valkonen, T. and F. van Poppel. 1997. “The Contribution of Smoking to Sex Differences in LifeExpectancy: Four Nordic Countries and The Netherlands 1970–1989.” European Journal of
Public Health 7:302–10.Verbrugge, L.M. 1989. “The Twain Meet: Empirical Explanations of Sex Differences in Health and
Mortality.” Journal of Health and Social Behavior 30:282–304.
Related Documents