Security Market Imperfections In World Wide Equity Markets Name: Filip Vojnic-Zelic (e1052190) Seminarleiter: Privatdoz. Dipl.-Ing. Dr.techn. Stefan Gerhold Institut: Institut f¨ ur Finanz und Versicherungsmathematik

Welcome message from author
This document is posted to help you gain knowledge. Please leave a comment to let me know what you think about it! Share it to your friends and learn new things together.
Transcript

Security Market Imperfections InWorld Wide Equity Markets
Name: Filip Vojnic-Zelic (e1052190)Seminarleiter: Privatdoz. Dipl.-Ing. Dr.techn. Stefan GerholdInstitut: Institut fur Finanz und Versicherungsmathematik

Contents
1 Introduction 31.1 Predicting the future . . . . . . . . . . . . . . . . . . . . . . . . . . . . . 3
2 Imperfections of the CAPM 52.1 The Size Effect . . . . . . . . . . . . . . . . . . . . . . . . . . . . . . . . 52.2 The Earnings-Yield Effect . . . . . . . . . . . . . . . . . . . . . . . . . . 72.3 Cash Flow to Price Ratio . . . . . . . . . . . . . . . . . . . . . . . . . . . 82.4 Price to book effect . . . . . . . . . . . . . . . . . . . . . . . . . . . . . . 92.5 The Prior Return Effect - Reversal vs. Momentum . . . . . . . . . . . . 102.6 One or many effects? . . . . . . . . . . . . . . . . . . . . . . . . . . . . . 112.7 Possible explanations . . . . . . . . . . . . . . . . . . . . . . . . . . . . . 13
3 The Three Factor Model 143.1 CAPM vs. The three factor model . . . . . . . . . . . . . . . . . . . . . 143.2 Alternative Models . . . . . . . . . . . . . . . . . . . . . . . . . . . . . . 15
4 Market Imperfections caused by Investor’s Behavior 154.1 Introduction . . . . . . . . . . . . . . . . . . . . . . . . . . . . . . . . . . 154.2 Reference class forecasting . . . . . . . . . . . . . . . . . . . . . . . . . . 164.3 Reaction to news on stock markets . . . . . . . . . . . . . . . . . . . . . 164.4 Overreaction to news - The Reversal Strategy . . . . . . . . . . . . . . . 174.5 Underreaction to news - The Momentum Strategy . . . . . . . . . . . . . 184.6 Are these effect contradictory? . . . . . . . . . . . . . . . . . . . . . . . . 19
5 The future of predicting returns 20
2
1 Introduction
Ever since the stock market exists investors are seeking for the most profitable invest-ments that would give abnormally high returns either in the short or the long run.Abnormally high returns are usually achieved by insider informations or by very accu-rate predictions of stock movements. In this seminar we will first shortly introduce themathematical model (CAPM) which is used to predict the return on stock markets andthe efficient market hypothesis (EMH). The EMH and CAPM are fundamental theoriesof an efficient market and since we will be discussing market imperfections (i.e. ineffi-ciencies) it makes sense to use them as an introduction. Then, we will take a closer lookat the empirical evidence of the anomalies concerning the model and show an alternativeto the existing model. We will also discuss anomalies of the EMH caused by investorsbehavior and the last section will include my views of the issues which were covered.
1.1 Predicting the future
The most attracting area of research in financial economics generating the most ex-citement and attention over the last three decades concerns the predictability of stockreturns. Before we introduce the Capital Asset Pricing Model (hereinafter: CAPM), letus first define an efficient market.
• Efficient Market Hypothesis
The Efficient Market Hypothesis (hereinafter: EMH) maintains that market pricesfully reflect all available information. The idea is widely used in theoretical modelsand empirical studies of security prices, generating some controversy as well asfundamental insights into the price discovery process. Most of the critique comesfrom psychologists and behavioral economists who argue that the EMH is based oncounterfactual assumptions regarding human behavior, that is, rationality. Whatthe EMH basically states, is that an investor can not outperform the market andachieve constantly above average returns, given the information available at themoment of the trade.
• Capital Asset Pricing Model
The Capital Asset Pricing Model, given certain simplifying assumptions, statesthat the rate of return of any security is linearly related to that security’s system-atic risk called beta.
Ra = Rf + βa(Rm −Rf )
Where:
Ra is the Return Rate of the AssetRf is the Risk Free Return RateRm is the Market Return Rate
3

βa is the Security’s Systematic Risk of the Asset a
If the model is correct and security markets are informationally efficient, securitiesshould on average conform to the above equation. Departures from the relationrepresent violations of the joint hypothesis that both the EMH and the CAPM arecorrect.
• Beta - the systematic risk factor
From the CAPM it is obvious that as the only parameter used to predict the futurereturn of an asset is the factor beta (Rf is usually the return rate of AAA ratedgovernment bond and Rm is the return rate of the stock index). Therefore, we willtake a closer look at how the factor beta is calculated.
βa =Cov(Ra, Rm)
V ar(Rm)
Some remarks on beta:
1. Beta is a measure of a stock’s volatility in relation to the overall market.
2. Obviously, the market has a beta of 1.0
3. If a stock moves less than the market, the stock’s beta coefficient is less than1.0.
4. High-beta stocks are riskier, but provide a potential for higher returns, con-sequently low-beta stocks pose less risk but also lower returns.
Some negative aspects of beta:
1. Beta does not incorporate new information.
2. Past price movements are poor predictors of the future (this we will showlater on in this paper). Betas are actually reflective pools of the past. Theyare based on the past and therefore will not tell us what is ahead.
3. Betas on a single stock tend to flip over time, which makes it unreliable.Therefore it has a stronger application in day-trading than in long-term in-vestments.
In other words, volatility refers to the amount of uncertainty or risk about thedegree of changes in a stock’s value.
Since the 1980s a growing number of empirical studies suggest that betas of commonstocks do not adequately explain cross-sectional differences in stock returns. Insteadseveral other variables such as size(measured by market capitalization of the firm’s com-mon stock), ratio of book to market, earning to price ratio, which did not have any basisin existing models seem to have more significant predictive ability. These finding maybe attributed as evidence of market inefficiency or on the other hand as evidence thatthe CAPM is an incomplete description of equilibrium price formation.
4
Therefore we will first take a look at the imperfections which can be explained by theincompleteness of the CAPM and then on imperfections which are caused by the psy-chology and behavior of traders on the market.
2 Imperfections of the CAPM
Already in the 1970s the first ad hoc alternatives to the CAPM were introduced. Re-searchers found that the price-to-earnings and the market capitalization of commonequity(size) provided more explanatory power for future returns than the beta factordid. Later on, several other studies introduced even more predictive factors, such asratio of book to market value, price per share and prior return performance, to theCAPM. Jointly, these studies represented a big challenge to the CAPM as they haveproven to have a higher predictive ability in terms of cross-sectional return predictability.
An extended model which would incorporate also other factors than beta would havethe following form:
Ri = a0 + a1βi + a2
n∑j=1
cij + ei
Where:cij represents the characteristics j for the underlying stock iei represents the error term
In the following chapter when analyzing the cross sectional return predictability usingadditional factors such as the above mentioned, we will use some basic summary statisticsthat document the finding with a common data set for the same time period using thesame empirical methods. This way we will ensure that the data sets are comparableand contribute to the significants of the results. We will form portfolios based on thevarious factors(size, price to earnings ratio...) and reports the findings using monthlyvalue weighted portfolio returns.
2.1 The Size Effect
First we will examine how the size of a company traded on the stock market affects therate of return. We will form 10 portfolios based on their size and examine the weightedmonthly returns of the portfolios over a fixed time period.
5
Portfolio Size Return Beta1 $10 1.56 1.11
2 $26 1.41 1.14
3 $48 1.25 1.10
4 $83 1.23 1.15
5 $104 1.22 1.10
6 $239 1.12 1.04
7 $402 1.09 1.06
8 $715 1.09 1.05
9 $1, 341 1, 03 1.03
10 $5, 820 0, 83 0, 95
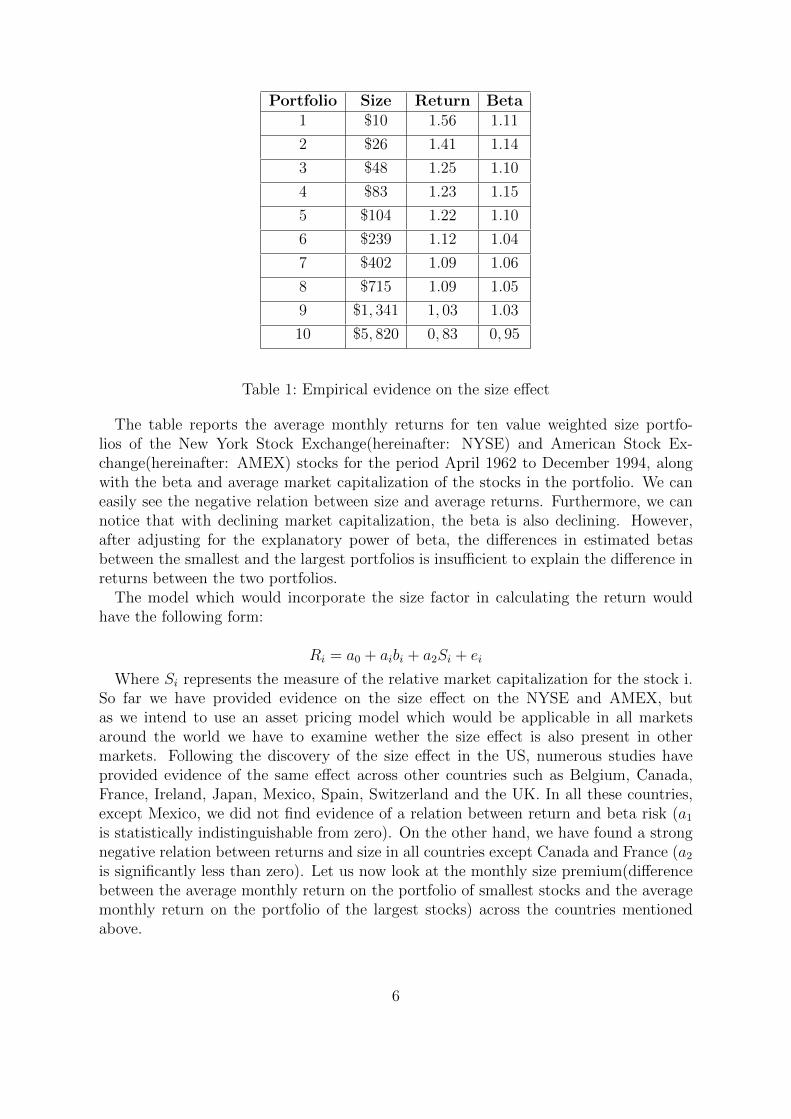
Table 1: Empirical evidence on the size effect
The table reports the average monthly returns for ten value weighted size portfo-lios of the New York Stock Exchange(hereinafter: NYSE) and American Stock Ex-change(hereinafter: AMEX) stocks for the period April 1962 to December 1994, alongwith the beta and average market capitalization of the stocks in the portfolio. We caneasily see the negative relation between size and average returns. Furthermore, we cannotice that with declining market capitalization, the beta is also declining. However,after adjusting for the explanatory power of beta, the differences in estimated betasbetween the smallest and the largest portfolios is insufficient to explain the difference inreturns between the two portfolios.
The model which would incorporate the size factor in calculating the return wouldhave the following form:
Ri = a0 + aibi + a2Si + ei
Where Si represents the measure of the relative market capitalization for the stock i.So far we have provided evidence on the size effect on the NYSE and AMEX, butas we intend to use an asset pricing model which would be applicable in all marketsaround the world we have to examine wether the size effect is also present in othermarkets. Following the discovery of the size effect in the US, numerous studies haveprovided evidence of the same effect across other countries such as Belgium, Canada,France, Ireland, Japan, Mexico, Spain, Switzerland and the UK. In all these countries,except Mexico, we did not find evidence of a relation between return and beta risk (a1is statistically indistinguishable from zero). On the other hand, we have found a strongnegative relation between returns and size in all countries except Canada and France (a2is significantly less than zero). Let us now look at the monthly size premium(differencebetween the average monthly return on the portfolio of smallest stocks and the averagemonthly return on the portfolio of the largest stocks) across the countries mentionedabove.
6

Country Monthly Size Premium Test Period Number of PortfoliosAustralia 1.21% 1958 − 81 10
Belgium 0.52% 1969 − 83 5
Canada 0.44% 1973 − 80 5
Finland 0.76% 1970 − 81 10
France 0.90% 1977 − 88 5
Germany 0.49% 1954 − 90 9
Ireland 0.47% 1977 − 86 5
Japan 1.20% 1965 − 87 10
Korea −0.40% 1984 − 88 10
Mexico 4.16% 1982 − 87 6
New Zeeland 0.51% 1977 − 84 5
Singapore 0.41% 1975 − 85 3
Spain 0.56% 1963 − 82 10
Switzerland 0.52% 1973 − 88 6
Taiwan 0.57% 1979 − 86 5
UK 0.40% 1973 − 92 10
US 0.61% 1951 − 94 10
Table 2: International evidence on the size effect
From Table 2 we can see that in all countries, except Korea, the size premium ispositive during the sample periods. Also, the size premium varies across markets; itis most pronounced in Australia and Mexico, and least significant in Canada and theUK. As it is the case with US, the differences in beta across size portfolios cannotexplain differences in returns. However, across the fifteen observed countries there aresignificant differences between the size of the largest and the smallest portfolios. Due tothe differences in the sample periods and different portfolios sizes we can not give anyfinal conclusions on the size effect on other markets, whereas the beta factor is consistentacross all markets.
2.2 The Earnings-Yield Effect
Earnings-related strategies have a long tradition in the investment community. Themost popular of these strategies is the one that calls for buying stocks that sell lowmultiples of earnings, for example: A prudent investor should never pay as much as 20times earnings and a suitable multiplier should be 12 or less. We will now group theportfolios like in table 1, not according to their size but E/P ratios.
7
Portfolio E/P Ratio Return Beta1 19.39 1.21 1.01
2 12.88 1.25 0.93
3 11.26 1.08 0.88
4 10.09 1.02 0.95
5 9.08 0.96 0.94
6 8.14 0.77 0.99
7 7.19 0.83 0.96
8 6.13 0.89 1.04
9 4.78 0.88 1.06
10 2.49 0.82 1, 08
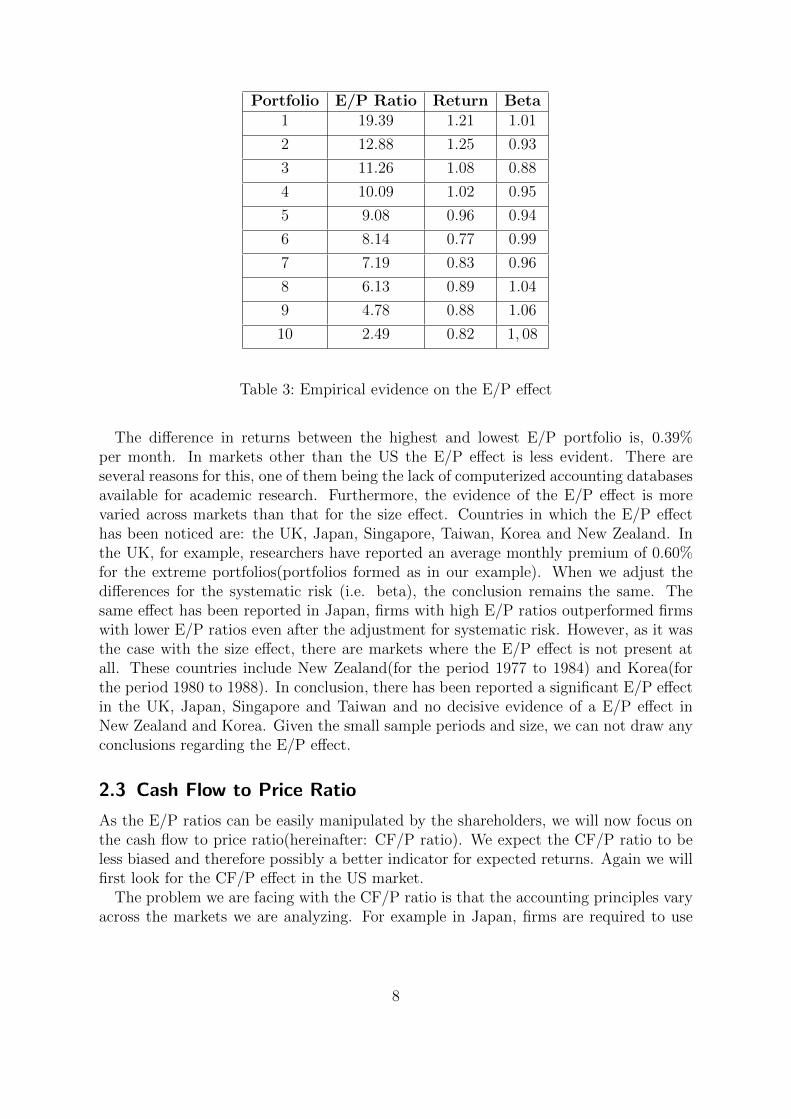
Table 3: Empirical evidence on the E/P effect
The difference in returns between the highest and lowest E/P portfolio is, 0.39%per month. In markets other than the US the E/P effect is less evident. There areseveral reasons for this, one of them being the lack of computerized accounting databasesavailable for academic research. Furthermore, the evidence of the E/P effect is morevaried across markets than that for the size effect. Countries in which the E/P effecthas been noticed are: the UK, Japan, Singapore, Taiwan, Korea and New Zealand. Inthe UK, for example, researchers have reported an average monthly premium of 0.60%for the extreme portfolios(portfolios formed as in our example). When we adjust thedifferences for the systematic risk (i.e. beta), the conclusion remains the same. Thesame effect has been reported in Japan, firms with high E/P ratios outperformed firmswith lower E/P ratios even after the adjustment for systematic risk. However, as it wasthe case with the size effect, there are markets where the E/P effect is not present atall. These countries include New Zealand(for the period 1977 to 1984) and Korea(forthe period 1980 to 1988). In conclusion, there has been reported a significant E/P effectin the UK, Japan, Singapore and Taiwan and no decisive evidence of a E/P effect inNew Zealand and Korea. Given the small sample periods and size, we can not draw anyconclusions regarding the E/P effect.
2.3 Cash Flow to Price Ratio
As the E/P ratios can be easily manipulated by the shareholders, we will now focus onthe cash flow to price ratio(hereinafter: CF/P ratio). We expect the CF/P ratio to beless biased and therefore possibly a better indicator for expected returns. Again we willfirst look for the CF/P effect in the US market.
The problem we are facing with the CF/P ratio is that the accounting principles varyacross the markets we are analyzing. For example in Japan, firms are required to use
8
Portfolio E/P Ratio Return Beta1 52.08 1.47 1.00
2 27.75 1.32 0.90
3 23.02 1.17 0.91
4 19.91 0.94 0.99
5 17.37 1.14 1.01
6 15.05 0.87 0.99
7 12.96 1.12 1.03
8 10.85 1.05 1.08
9 8.40 0.89 1.06
10 4.77 0.80 1.07
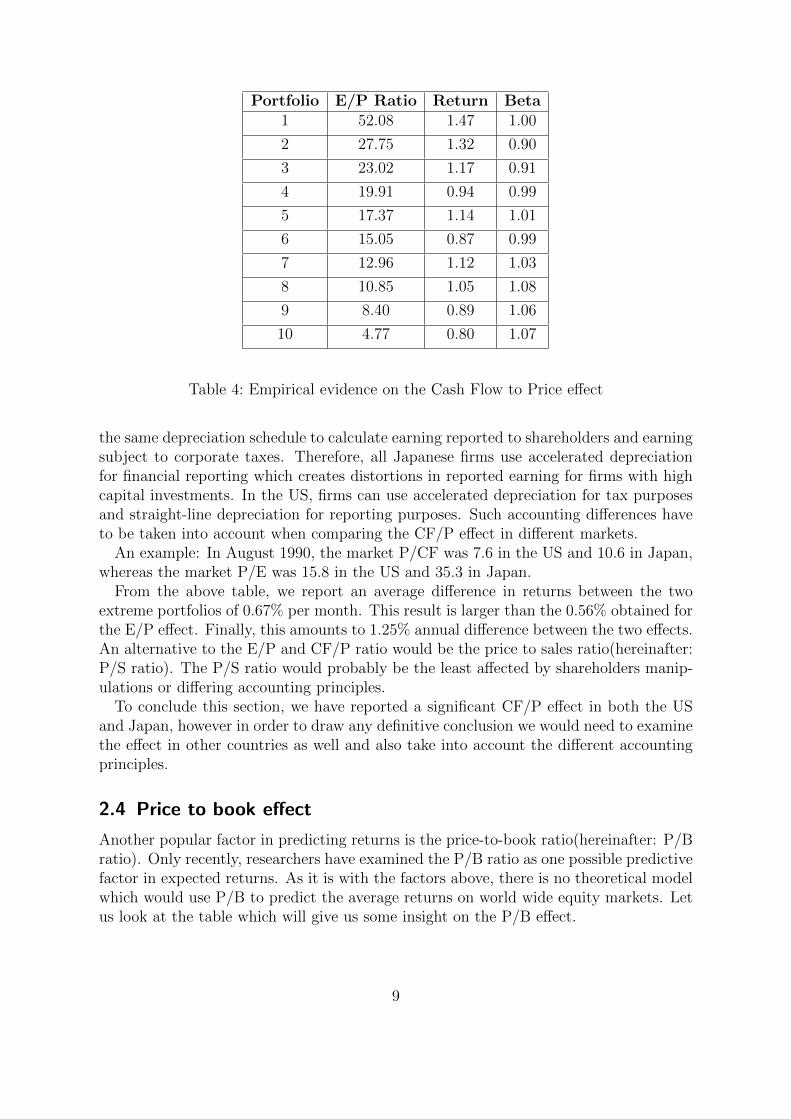
Table 4: Empirical evidence on the Cash Flow to Price effect
the same depreciation schedule to calculate earning reported to shareholders and earningsubject to corporate taxes. Therefore, all Japanese firms use accelerated depreciationfor financial reporting which creates distortions in reported earning for firms with highcapital investments. In the US, firms can use accelerated depreciation for tax purposesand straight-line depreciation for reporting purposes. Such accounting differences haveto be taken into account when comparing the CF/P effect in different markets.
An example: In August 1990, the market P/CF was 7.6 in the US and 10.6 in Japan,whereas the market P/E was 15.8 in the US and 35.3 in Japan.
From the above table, we report an average difference in returns between the twoextreme portfolios of 0.67% per month. This result is larger than the 0.56% obtained forthe E/P effect. Finally, this amounts to 1.25% annual difference between the two effects.An alternative to the E/P and CF/P ratio would be the price to sales ratio(hereinafter:P/S ratio). The P/S ratio would probably be the least affected by shareholders manip-ulations or differing accounting principles.
To conclude this section, we have reported a significant CF/P effect in both the USand Japan, however in order to draw any definitive conclusion we would need to examinethe effect in other countries as well and also take into account the different accountingprinciples.
2.4 Price to book effect
Another popular factor in predicting returns is the price-to-book ratio(hereinafter: P/Bratio). Only recently, researchers have examined the P/B ratio as one possible predictivefactor in expected returns. As it is with the factors above, there is no theoretical modelwhich would use P/B to predict the average returns on world wide equity markets. Letus look at the table which will give us some insight on the P/B effect.
9
Portfolio E/P Ratio Return Beta1 0.57 1.43 1.04
2 0.84 1.42 0.97
3 1.02 1.06 0.92
4 1.18 1.05 0.84
5 1.35 1.00 0.90
6 1.56 0.79 0.91
7 1.86 0.84 0.98
8 2.30 0.91 1.03
9 3.10 0.82 1.11
10 10.00 0.90 1.07
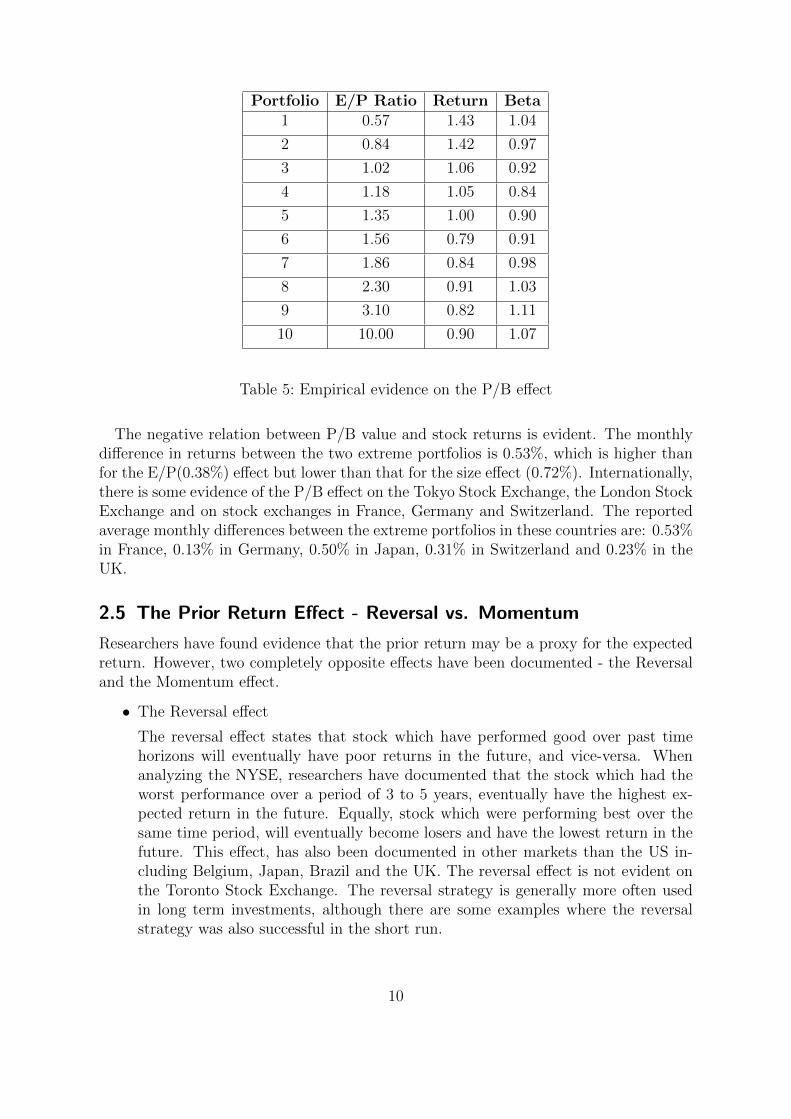
Table 5: Empirical evidence on the P/B effect
The negative relation between P/B value and stock returns is evident. The monthlydifference in returns between the two extreme portfolios is 0.53%, which is higher thanfor the E/P(0.38%) effect but lower than that for the size effect (0.72%). Internationally,there is some evidence of the P/B effect on the Tokyo Stock Exchange, the London StockExchange and on stock exchanges in France, Germany and Switzerland. The reportedaverage monthly differences between the extreme portfolios in these countries are: 0.53%in France, 0.13% in Germany, 0.50% in Japan, 0.31% in Switzerland and 0.23% in theUK.
2.5 The Prior Return Effect - Reversal vs. Momentum
Researchers have found evidence that the prior return may be a proxy for the expectedreturn. However, two completely opposite effects have been documented - the Reversaland the Momentum effect.
• The Reversal effect
The reversal effect states that stock which have performed good over past timehorizons will eventually have poor returns in the future, and vice-versa. Whenanalyzing the NYSE, researchers have documented that the stock which had theworst performance over a period of 3 to 5 years, eventually have the highest ex-pected return in the future. Equally, stock which were performing best over thesame time period, will eventually become losers and have the lowest return in thefuture. This effect, has also been documented in other markets than the US in-cluding Belgium, Japan, Brazil and the UK. The reversal effect is not evident onthe Toronto Stock Exchange. The reversal strategy is generally more often usedin long term investments, although there are some examples where the reversalstrategy was also successful in the short run.
10
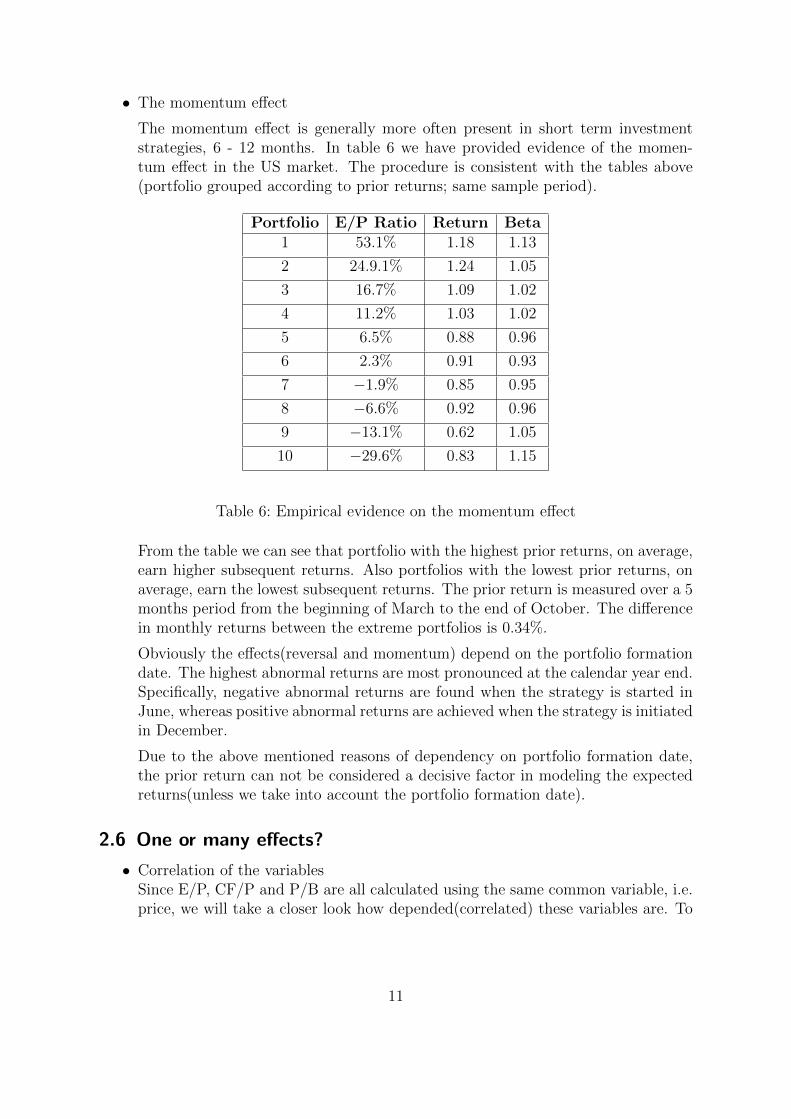
• The momentum effect
The momentum effect is generally more often present in short term investmentstrategies, 6 - 12 months. In table 6 we have provided evidence of the momen-tum effect in the US market. The procedure is consistent with the tables above(portfolio grouped according to prior returns; same sample period).
Portfolio E/P Ratio Return Beta1 53.1% 1.18 1.13
2 24.9.1% 1.24 1.05
3 16.7% 1.09 1.02
4 11.2% 1.03 1.02
5 6.5% 0.88 0.96
6 2.3% 0.91 0.93
7 −1.9% 0.85 0.95
8 −6.6% 0.92 0.96
9 −13.1% 0.62 1.05
10 −29.6% 0.83 1.15
Table 6: Empirical evidence on the momentum effect
From the table we can see that portfolio with the highest prior returns, on average,earn higher subsequent returns. Also portfolios with the lowest prior returns, onaverage, earn the lowest subsequent returns. The prior return is measured over a 5months period from the beginning of March to the end of October. The differencein monthly returns between the extreme portfolios is 0.34%.
Obviously the effects(reversal and momentum) depend on the portfolio formationdate. The highest abnormal returns are most pronounced at the calendar year end.Specifically, negative abnormal returns are found when the strategy is started inJune, whereas positive abnormal returns are achieved when the strategy is initiatedin December.
Due to the above mentioned reasons of dependency on portfolio formation date,the prior return can not be considered a decisive factor in modeling the expectedreturns(unless we take into account the portfolio formation date).
2.6 One or many effects?
• Correlation of the variablesSince E/P, CF/P and P/B are all calculated using the same common variable, i.e.price, we will take a closer look how depended(correlated) these variables are. To
11

check the correlation of the mentioned variables, we will use the pairwise Spearmanrank correlations. The procedure will be the following:
1. Each year at the end of March, the NYSE and AMEX stocks are rankedindependently on Size, P/B, E/P, CF/P, Prior Return and Price.
2. Pairwise Spearman Rank correlation are then computed
3. This is repeated for each year in the sample period 1962 - 1994. Mean rankcorrelations and standard errors are computed for the entire time series ofvalues.
4. We report the average rank correlations and associated T-values(in brackets).
Variable Market Cap. E/Price CF/Price Price/Book Prior Ret.E/Price −0.1(−4.14)
CF/Price −0.11(−4.72) 0.68(45.00)
Price/Book 0.32(17.31) −0.43(−25.23) −0.48(−24.32)
Prior Return 0.06(1.72) −0.13(−6.42) −0.14(−7.27) 0.16(7.54)
Price/Share 0.78(104.21) −0.07(−3.80) −0.15(−6.44) 0.34(19.49) 0.16(5.01)
Table 7: Correlation of the variables
The estimated rank correlations are generally large and significant. Since thepairwise correlations among the Size, E/P, CF/P, P/B, prior return and price aresignificantly different from zero, we can conclude that there are some commonalitiesamong the effects. As expected, the rank correlation between market capitalizationand price was by far the strongest.
• Correlation of the risk premiaIn the previous sections we have noticed that there are significant differences inreturns between the two extreme portfolios(portfolios grouped by size, E/P, CF/P...). These differences in returns can be interpreted as risk premia, if these variablesare sorting out securities based on risks that are not covered by beta. Under theassumption that these five variables are proxies for five different risks, the premiashould be uncorrelated across variables.
From the table 8 it is obvious that the premia associated with the five variables arecorrelated(coefficient significantly different from zero). Interestingly, the premiafor prior return is negatively correlated to the other four variables, suggestingthat the prior return is capturing a stock characteristics different from the othervariables.
To sum up, we can conclude that there is a high degree of commonality among thereported effects.
12

Variable E/P CF/P P/B Prior returnSize 0.265 0.444 0.472 −0.017
E/P 0.727 0.590 −0.230
CF/P 0.760 −0.212
P/B −0.172
Table 8: Correlation of the risk premia
2.7 Possible explanations
Researchers have been publishing many different papers trying to explain the relationbetween the variables such as Size, Prior Return, Price to Earnings Ratio, Price toBook Ratio and Cash Flow to Price ratio. Many argue that these variables are actuallyproxies for risks which are not covered by the existing asset pricing models (i.e. coveredby beta). The papers arguing that theory fall into 4 different categories:
1. Market inefficiencySeveral studies suggest that the excess returns are evidence of market inefficiency.For example, it is argued that investors are irrational because they avoid buyingvalue stocks that are mistakenly considered too risky. Institutional investors avoidbuying value stocks because the investors’ performance is measured against indexesof large, glamour stocks. Again, investors who buy these neglected value stockoutperform the indexes of large, glamour stocks.
2. Statistical biasesMany argue that the reported results may be affected by biases in samples. Usualstatistics which are used include stocks in their files only after the stock has provena successful track record. Therefore, small firms with low P/B ratios that performpoorly will not be included in the sample.
3. Additional risk factorsSome papers have emphasized the need to include other variables into the modelas well, such as human capital and the systematic variability of beta-risk over thebusiness cycle.
4. January effectMuch of the effects described above disappear if the month of January is excludedfrom the sample period.
13

3 The Three Factor Model
The CAPM is an ex-ante, static (one-period) model which assumes a linear relationshipbetween the expected return in a risky asset and its beta. So far we have discussedhow other factors than beta can predict future return and the results were significant.Therefore, in this section we will take a closer look at the Fama-Franch Three FactorModel which also incorporates variables such as size, book to market and beta. It hasthe following form:
Ri = Rf + βi(Rm −Ri) + bs(SMB) + bv(HML) + α
Where:
Ri is the expected return of the stock iRf is the risk free return rateRm is the return rate of the marketSMB stands for the historic excess returns of small capitalization minus big capitaliza-tion stocksHML stands for the historic excess returns of high book to market value stocks minuslow book to market value stocksα represents the error term
Once the variables HML and SMB are defined, we can determine the factors bs andbv by linear regression. We also have to keep in mind that the value of β in the threefactor model does not identically correspond to the β from the CAPM, since now we havealso other factors (SMB and HML) to cover for risk. The Fama-French three factormodel explains over 90% of the diversified portfolio returns, compared to the average70% given by the CAPM.
3.1 CAPM vs. The three factor model
A model for expected returns basically, as any other model, needs two features: it has tobe simple enough to be understood and applied and complex enough to be as accurateas possible. The CAPM is a very simple(linear) model and therefor definitely fulfillsthe first requirement but as we have seen, the model has flaws. The good aspects ofthe model are that it collapses everything(all risk factors) into one factor and that it issimple. On the other hand, the negative aspect is that it does not allow for any otherfactors and it requires accurate measurement of the market risk premium (Rm − Rf ).Another issue of the CAPM which we did not discuss so far, is the fact that low betafirms tend to perform better than the CAPM would predict and vice versa, high betafirms tend to perform worse than predicted.
Disproving the CAPM is difficult to do conclusively, can you disprove if you haven’tmade the right assumptions? So far, no conclusive evidence was found against the CAPMor in favor of another model but there have been some alternative models developed.
14
3.2 Alternative Models
As the topic of this paper is market inefficiencies, we will only mention the alternativemodels but not discuss them in depth.
• Merton’s intertemporal CAPMThe Intertemporal CAPM is a linear factor model with wealth and state variablethat forecast changes in the distribution of future returns or income. The maindifference between the ICAPM and the CAPM is that investors hedge againstshortfalls in consumption or against changes in the future investment opportunityset.
• Breeden’s consumption CAPMThe CCAPM implies that the expected risk premium on a risky asset, is pro-portional to the covariance of its returns and consumption in the period of thereturn. Basically the only difference is that the beta from the CCAPM does notcorrespond to the beta of the CAPM, since it is calculated differently.
• Ross’s Arbitrage Pricing TheoryThe arbitrage pricing theory states that the expected return of a financial asset canbe modeled as a linear function of various macro economic factors or theoreticalmarket indices. In this theory, sensitivity to changes in each factor in representedby a different specific beta coefficient.
4 Market Imperfections caused by Investor’s Behavior
4.1 Introduction
The stock movement is naturally affected by fundamentals of the stock/company, butanother aspect which must not be ignored is the investors sentiment which can influencethe direction of the stock movement. Wherever you go these days, people discuss thelatest news and twists in world wide equity markets. Whether it’s the disappointingIPO of Facebook, the housing bubble or the recent insider trading accusations on theWall street, investors regularly discuss their views and opinions with others hoping tostumble across some new information. Who is to blame for the housing bubble? Thepeople who tried to buy their own homes although they could not afford them or thebanks who made it possible and ignored the risk of such businesses. Many people agreethat the biggest twists and changes in stock prices, elude easy interpretation. However,economists often approach the problems differently than other people do. Economistsstress the rationality of markets, whereas many others, like journalists, money managersor politicians stress the foolishness of traders.
A centerpiece of modern finance, which we have already mentioned before, is theefficient market hypothesis in which prices do not deviate from intrinsic values. Financetheory almost completely ignores the complex behavioral and cognitive factors that
15

guide investors decisions. Therefore, we will discuss why psychology matters and whythe behavior approach should not be ignored when thinking of asset pricing.
Three main responses have arrived on the question ’What are the links between stockprices and new information?’.
1. The price is right.Meaning that stock prices correctly represent the current value of a stock and allinformation of the company. The theory would suggest that an indexing strategyis the best because no matter how you invest, you can not beat the market.
2. The prices of stocks are driven by animal spirits.These are the words of John Maynard Keynes which figuratively say that the stockprices do not mean very much in terms of real value of a stock company. Thisperspective is very much in contract to the first one. The ’animal spirits’ theorystates that investors should rely on technical analysis rather than on fundamentalanalysis when investing in stocks.
3. What goes up, must come down.The recently most popular theory which basically states that stock markets whichgrow over time, eventually have to fall. This theory can be related to the reversalinvestment strategy.
4.2 Reference class forecasting
Reference forecasting predicts the outcome of a planned action based on actual out-comes in a reference class of similar actions. Human judgement is optimistic due tooverconfidence and insufficient consideration of distributional information about out-comes. Therefore, people tend to underestimate the costs and risks of action, whereasthey tend to overestimate the benefits.
• Example:The American Association of Individual Investors has asked a random sample ofinvestors for a stock forecast every week.
• Result:The data showed that, most individuals are upbeat in bull markets and loomy inbear markets. However, the forecasts had little predictive power.
4.3 Reaction to news on stock markets
How stock prices react to news depends (partly) on how investor’s perceptions of com-pany values and future earnings are influenced by the new information. We differentiatebetween two effects. The first has to do with short-term impact of new in light of theinformation already priced into the stock prices. The second effect has a more cognitiveaspect, i.e. how the news changes the investors’ perception of the company.
16
Lets take an example: Take the Nasdaq Composite Index in 2009. Just as the economybegan to recover, after the crisis peak, the Comp rose 43.9% that year. Amounting to0.14% for each of the 252 trading days in 2009. So, this was the average daily gain. Onecould think that the Index made about 0.14% a day for at least half of the 252 tradingdays. Or maybe just at 25 out of the 252 trading days the index rose for roughly 0.14%.The answer is ’No’, the Index rose for about 0.14% only on 13 days out of the 252 daysin the year. Even if you include the days where the Index fell by less than -0.14%, itsonly 28 days out of the 252. The natural question arising would be: ’How did the Indexperform on other days during the year?’. The remaining 224 days were a rough and wildride. Let us look at the biggest jumps(up and down) during the year:
1. January 20: -5.8% - The Inauguration Day
2. March 10: +7.0% - Big public announcement
And during the rest of the year it was not far from that. Either the stock goes up alot or it looses a lot, but at the end of the year the daily return does not fit the averagedaily return calculated on a yearly basis (on most of the days of the year).
The exaggerated optimism in the stock market for firms with high P/E Ratios andexaggerated pessimism for firms with low P/E Ratios is especially significant. This is whywe are going to take a closer look at the market reactions to earnings announcements.
4.4 Overreaction to news - The Reversal Strategy
The Contrarian/Reversal Strategy or Overreaction Hypothesis implies simultaneouslybuying previous losers and selling previous winners. The theory behind the strategyis that extreme previous losers are undervalued due to investors overreaction whichare possibly instigated by some adverse news (among other earnings announcements).Given enough time, previous losers will outperform the market and generate substantialreturns.
We will examine all companies listed on the NYSE since December 1925 and usereturns over a two to five year period. Lets us look at the figures:
The above table shows that for the NYSE stocks(50 stocks were picked) which did theworst over an initial period of 5 years, eventually performed the best in the coming yearswith an annualized return rate of 8.0%. Generally, an arbitrage portfolio that financesits purchases of past losers by selling past winners earns positive returns in almost everycase.
Let us make another experiment. Take the NYSE stock market, the period 1976−1984and about 100000 stock analyst forecasts. An arbitrage strategy that buys 20% of thecompanies for which the analysts were most pessimistic and finances the purchases byselling the 20% of companies for which analysts are most optimistic, earns substantialprofits.
The market overreaction effect can be compared to the effect of voters approving ordisapproving politicians depending on the current state of the economy.
17

Country Period Lenght of Rank &Test Period
Arbitrage PortfolioLosers Minus Win-ners
Australia 1958 − 1987 3 Years 3.6%
Belgium 1970 − 1988 2 Years 18.9%
Canada 1950 − 1988 5 Years 6.4%
Germany 1961 − 1990 5 Years 6.0%
Malaysia 1986 − 1996 3 Years 13.2%
The Netherlands 1985 − 1990 2 Years 4.4%
Spain 1967 − 1984 3 Years 12.3%
Sweden 1983 − 1996 3 Years −1.8%(1983 − 1990)3.2%(1990 − 1996)
Switzerland 1973 − 1996 5 Years 3.4%
The United Kingdom 1975 − 1993 5 Years 7.6%
The United States 1926 − 1982 5 Years 8.0%
Table 9: Evidence of the reversal effect
4.5 Underreaction to news - The Momentum Strategy
Companies which have good earnings news are much better in subsequent returns thanare companies that report bad news. This effect lasts for several months which is atypical underreaction to the news. This investment strategy has proven to paid offconsistently for over 25 years. The market behaves as the earnings news were discounted- especially at turning points. Around the announcements in the next quarters of theyear, the market believes that earnings should be mirrored by what they were for thecorresponding quarter from the previous announcement. This slow reaction to earningsannouncements is very much related to the stock price momentum strategy.
The effect on the NYSE:
• For the period 1926−1982 one-year past winners outperformed one-year past losersby 7.6% per year.
• From 1965 − 1989, a strategy which buys stocks based on their past six-monthsreturns and holds them for six months, earns an average annualized return of12.0%.
18

Country Period Lenght of Rank &Test Period
Arbitrage PortfolioLosers Minus Win-ners
Austria 1980 − 1995 6 Months 11.2%
Belgium 1980 − 1995 6 Months 13.2%
Canada 1950 − 1988 1 Year 17.5%
Denmark 1980 − 1995 6 Months 13.1%
France 1980 − 1995 6 Months 11.6%
Germany 1961 − 1991 1 Year 7.9%
Italy 1980 − 1995 6 Months 11.2%
The Netherlands 1980 − 1995 6 Months 15.1%
Spain 1980 − 1995 6 Months 15.8%
Sweden 1980 − 1995 6 Months 1.9%
Switzerland 1973 − 1997 6 Months 7.7%
The United Kingdom 1980 − 1995 6 Months 10.7%
Table 10: Evidence of the momentum effect
4.6 Are these effect contradictory?
When looking at the tables which provide evidence on the Overreaction and Underre-action effect, one obvious question arises: ’Can both effects be logically true?’. Onepossible explanation would be the investors mental frames. Investors usually talk about’growth firms’ and ’declining industries’ although there is little evidence in terms of an-nual earnings which would form a basis for such assertions. Eventually, when an earningssurprise hits, many investors refuse to believe it. The momentum effect is usually con-centrated around earning announcements, therefore mental frames take time to adjustto the new information available.
Another possible reasons is that investors usually react stronger to private informationand weaker to publicly available information. Lastly, the substantial differences betweenthe two investment strategies, is that the momentum strategy is applicable for invest-ments up to 1 year whereas the reversal strategy is applicable for long-term investmentsup to 5 years.
To sum up, people are human and the psychology will for sure play a major role inthe behavior of international financial markets. The stock markets are rather a votingmachine than a weighing machine, meaning that individuals will make their choicespartly of reason and partly of emotion. Future research will have to throw more lighton the voting machine aspect and on the links between market and decision-makinganomalies. The behavioral approach once more proves that good judgement is critical,in money management as well as in every other aspect of life. Luckily, in the financial
19
arena it is impossible to get rich quick and there is no perfect receipt where and howto invest but one could improve his chances by following one of the strategies we havejust discussed. The theory which will probably for sure be always true is the one thatstates that any stock which is growing and has been growing in the past will eventuallyhave to fall. Therefore, buying glamour stock with high P/E ratios and substantial priorreturns may not be the best investment strategy, neither on the long nor the short run.
5 The future of predicting returns
Predicting the return of investments will never be an easy task and naturally we willnever be able to make perfect predictions no matter how sophisticated the model is. 100%accurate predictions wouldn’t make sense since they would allow arbitrage opportunity inthe equity markets. However, in this seminar we have provided some empirical evidencethat the current CAPM model (i.e. beta) has less predictive power than some otherpredictive variables. The results were somewhat significant and I do not want to repeatthe things already stated before, but also give a different view on the problem. If we recallhow the CAPM looks like we notice that the returns are determined by beta, the riskpremium Rm −Rf and the risk free rate Rf . Beta determines how volatile the stock weare examining is, but the stocks movement is only compared to the markets movement.In the past this was probably the best measure of the risk the stock is exposed, howevertimes have changed and stocks are not only affected by the market they operate inbut also by other markets across the world. This was especially evident in the lastfinancial crisis where the crisis which started in the US immediately affected stocks inother markets across the world. For example, money managers across europe are alsoconcerned with the happenings in the US; who will be the next president, what are hispolitical plans or even the earnings announcements of big stock companies which operatewith their subsidiaries in Europe are factors which also affect others than the ’home’markets. So how much sense does it make to take into account only the risk premiumof the market Rm − Rf (Rm is the return of the market index) for predicting returns.These and other questions have not been answered in this seminar, but represent aninteresting topic for future research. All in all, developing models for predicting returnsof stocks will be a continuous task for researchers across the world. It does not makesense to stick by an old model such as the CAPM which was developed under completelydifferent economic circumstances (more than 30 years ago), but we should at least adjustthe models to the time we live in.
20

References
[1] Donald B. Keim and William T. Ziemba: Securtiy Market Imperfec-tions in World Wide Equity Markets.
[2] Jonathan C. Mun, Geraldo M. Vasconcellos and Richard Kish:The Contrarian/Overreaction Hypothesis.
[3] Richard Thaler and Nicholas Barberis : A survey of BehavioralFinance.
[4] Werner De Bondt and Richard Thaler : Does the Stock MarketOverreact.
[5] Kengo Okada: Size effect and firm size -new relationship within the valueeffect.
21
Related Documents