Chapter 1: Review of Literature

Security Analysis and Portfolio Management
Oct 28, 2014
Welcome message from author
This document is posted to help you gain knowledge. Please leave a comment to let me know what you think about it! Share it to your friends and learn new things together.
Transcript

Chapter 1: Review of Literature
INVESTMENT DECISION PROCESS
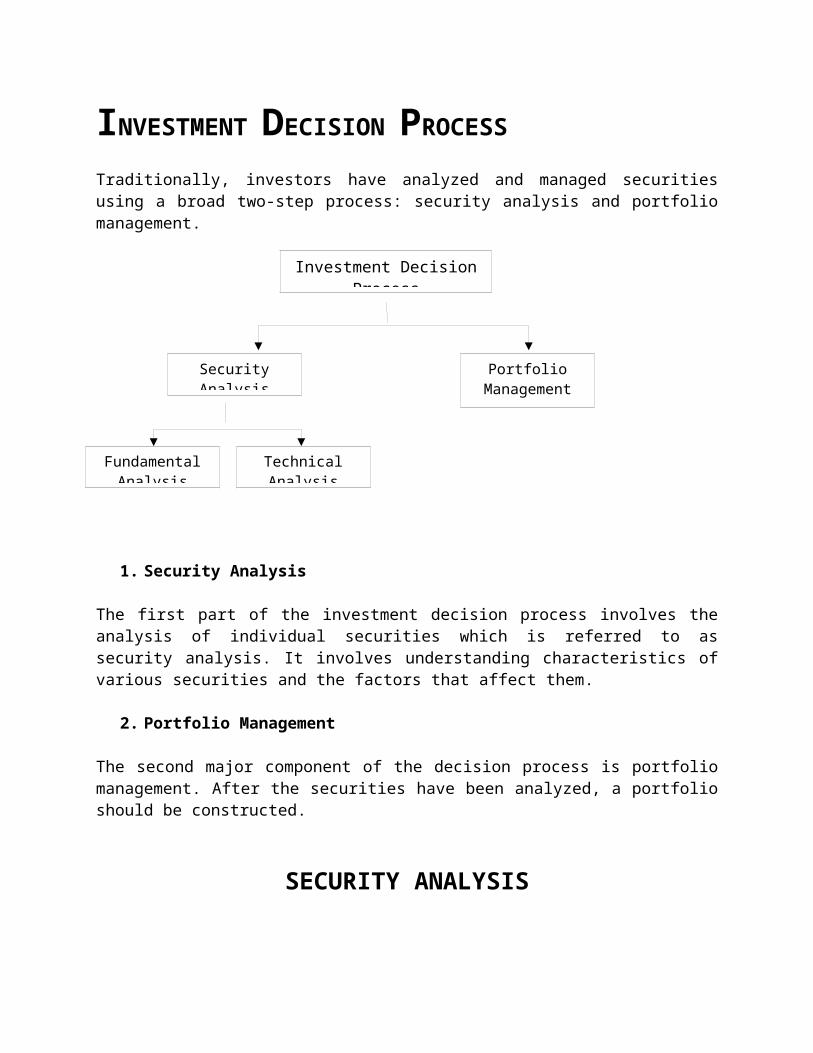
Traditionally, investors have analyzed and managed securities using a broad two-step process: security analysis and portfolio management.
1. Security Analysis
The first part of the investment decision process involves the analysis of individual securities which is referred to as security analysis. It involves understanding characteristics of various securities and the factors that affect them.
2. Portfolio Management
The second major component of the decision process is portfolio management. After the securities have been analyzed, a portfolio should be constructed.
SECURITY ANALYSIS
Security analysis is the first step which involves analyzing individual securities from various perspectives using all available information. It is useful in understanding fluctuation of prices of securities and behavior pattern of the market. Security analysis consists of fundamental analysis and technical analysis
A. Fundamental Analysis
Fundamental analysis is a method of forecasting the future price movements of a financial instrument based on economic, political, environmental and other relevant factors and statistics that will affect the basic supply and demand of whatever underlies the financial instrument. It is the study of economic, industry and company conditions in an effort to determine the value of a
Investment Decision Process
Security Analysis Portfolio Management
Fundamental Analysis
Technical Analysis

company’s stock. Fundamental analysis typically focuses on key statistics in company’s financial statements to determine if the stock price is correctly valued. The term simply refers to the analysis of the economic well-being of a financial entity as opposed to only its price movements.
Fundamental analysis is the cornerstone of investing. The basic philosophy underlying the fundamental analysis is that if an investor invests Rs.1 in buying a share of a company, how much expected returns from this investment he has.
The fundamental analysis is to appraise the intrinsic value of a security. It insists that no one should purchase or sell a share on the basis of tips and rumors. The fundamental approach calls upon the investors to make his buy or sell decision on the basis of a detailed analysis of the information about the company, about the industry, and the economy. It is also known as “top-down approach”. This approach attempts to study the economic scenario, industry position and the company expectations and is also known as “economic-industry-company approach (EIC approach)”
Thus the EIC approach involves three steps:1. Economic analysis2. Industry analysis3. Company analysis
1. Economic Analysis
The level of economic activity has an impact on investment in many ways. If the economy grows rapidly, the industry can also be expected to show rapid growth and vice versa. When the level of economic activity is low, stock prices are low, and when the level of economic activity is high, stock prices are high reflecting the prosperous outlook for sales and profits of the firms. The analysis of macro economic environment is essential to understand the behavior of the stock prices. Some commonly analyzed macro economic factors are:
COMPANY ANALYSISINDUSTRY ANALYSISECONOMIC ANALYSIS

Gross Domestic Product (GDP): GDP indicates the rate of growth of the economy. It represents the aggregate value of the goods and services produced in the economy. It consists of personal consumption expenditure, gross private domestic investment and government expenditure on goods and services and net exports of goods and services. The growth rate of economy points out the prospects for the industrial sector and the return investors can expect from investment in shares. The higher growth rate is more favorable to the stock market.
Savings and investment: It is obvious that growth requires investment which in turn requires substantial amount of domestic savings. Stock market is a channel through which the savings are made available to the corporate bodies. Savings are distributed over various assets like equity shares, deposits, mutual funds, real estate and bullion. The savings and investment patterns of the public affect the stock to a great extent.
Inflation: Along with the growth of GDP, if the inflation rate also increases, then the real growth would be very little. The effects of inflation on capital markets are numerous. An increase in the expected rate of inflation is expected to cause a nominal rise in interest rates. Also, it increases uncertainty of future business and investment decisions. As inflation increases, it results in extra costs to businesses, thereby squeezing their profit margins and leading to real declines in profitability.
Interest rates: The interest rate affects the cost of financing to the firms. A decrease in interest rate implies lower cost of finance for firms and more profitability. More money is available at a lower interest rate for the brokers who are doing business with borrowed money. Availability of cheap funds encourages speculation and rise in the price of shares.
2. Industry Analysis
An industry is a group of firms that have similar technological structure of production and produce similar products and Industry analysis is a type of business research that focuses on the status of an industry or an industrial sector (a broad industry classification, like "manufacturing"). Irrespective of specific economic situations, some industries might be expected to perform better, and share prices in these industries may not decline as much as in other industries. This identification of economic and industry specific factors influencing share prices will help investors to identify the shares that fit individual expectations
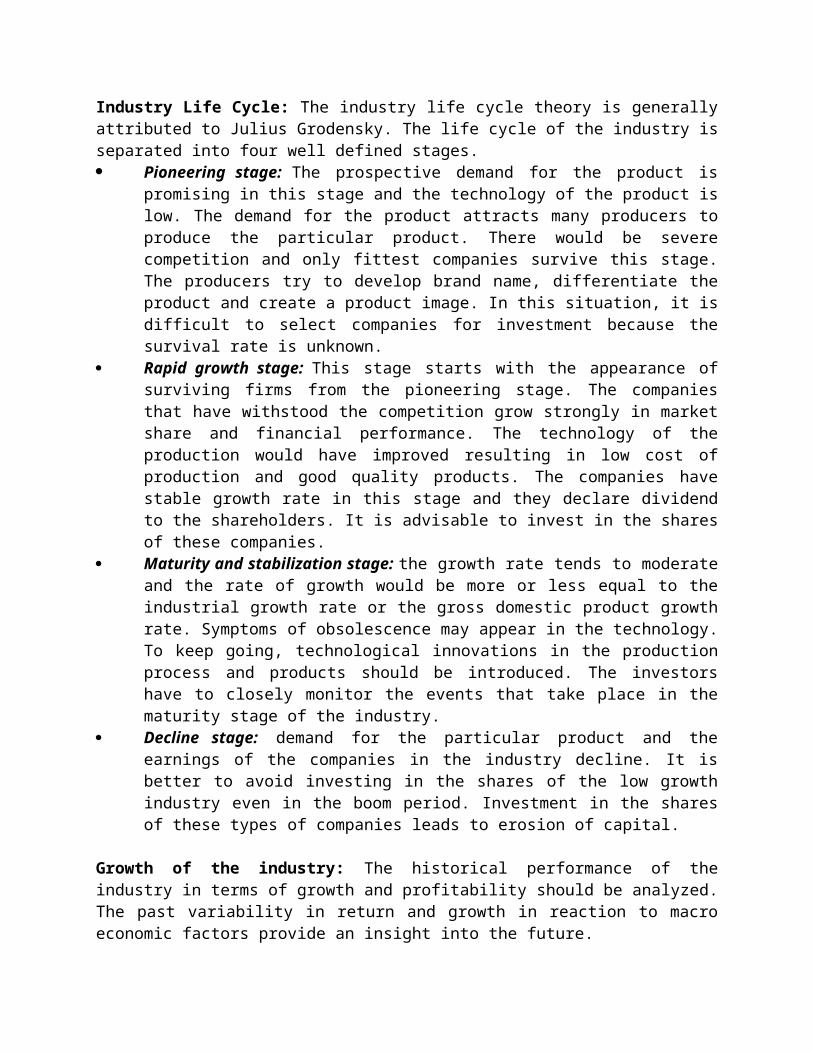
Industry Life Cycle: The industry life cycle theory is generally attributed to Julius Grodensky. The life cycle of the industry is separated into four well defined stages. Pioneering stage: The prospective demand for the product is promising in this stage and
the technology of the product is low. The demand for the product attracts many producers to produce the particular product. There would be severe competition and only fittest companies survive this stage. The producers try to develop brand name, differentiate the product and create a product image. In this situation, it is difficult to select companies for investment because the survival rate is unknown.
Rapid growth stage: This stage starts with the appearance of surviving firms from the pioneering stage. The companies that have withstood the competition grow strongly in

market share and financial performance. The technology of the production would have improved resulting in low cost of production and good quality products. The companies have stable growth rate in this stage and they declare dividend to the shareholders. It is advisable to invest in the shares of these companies.
Maturity and stabilization stage: the growth rate tends to moderate and the rate of growth would be more or less equal to the industrial growth rate or the gross domestic product growth rate. Symptoms of obsolescence may appear in the technology. To keep going, technological innovations in the production process and products should be introduced. The investors have to closely monitor the events that take place in the maturity stage of the industry.
Decline stage: demand for the particular product and the earnings of the companies in the industry decline. It is better to avoid investing in the shares of the low growth industry even in the boom period. Investment in the shares of these types of companies leads to erosion of capital.
Growth of the industry: The historical performance of the industry in terms of growth and profitability should be analyzed. The past variability in return and growth in reaction to macro economic factors provide an insight into the future.
Nature of competition: Nature of competition is an essential factor that determines the demand for the particular product, its profitability and the price of the concerned company scrips. The companies' ability to withstand the local as well as the multinational competition counts much. If too many firms are present in the organized sector, the competition would be severe. The competition would lead to a decline in the price of the product. The investor before investing in the scrip of a company should analyze the market share of the particular company's product and should compare it with the top five companies.
3. Company Analysis
In the company analysis the investor assimilates the several bits of information related to the company and evaluates the present and future values of the stock. The risk and return associated with the purchase of the stock is analyzed to take better investment decisions. The present and future values are affected by a number of factors.
Earnings of the company: Sales alone do not increase the earnings but the costs and expenses of the company also influence the earnings. Further, earnings do not always increase with increase in sales. The company’s sales might have increased but its earnings per share may decline due to rise in costs. Hence, the investor should not only depend on the sales, but should analyze the earnings of the company.
Financial analysis: The best source of financial information about a company is its own financial statements. This is a primary source of information for evaluating the investment prospects in the particular company’s stock. Financial statement analysis is the study of a company’s financial statement from various viewpoints. The statement gives the historical and current information about the company’s operations. Historical financial statement helps to predict the future and the current information aids to analyze the present status of the company. The two main statements used in the analysis are Balance sheet and Profit and Loss Account.
The balance sheet is one of the financial statements that companies prepare every year for their shareholders. It is like a financial snapshot, the company's financial situation at a moment in time. It is prepared at the year end, listing the company's current assets and liabilities. It helps to study the capital structure of the company. It is better for the investor to avoid a company with excessive debt component in its capital structure. From the balance sheet, liquidity position of the company can also be assessed with the information on current assets and current liabilities.
Ratio analysis: Ratio is a relationship between two figures expressed mathematically. Financial ratios provide numerical relationship between two relevant financial data. Financial ratios are calculated from the balance sheet and profit and loss account. The relationship can be either expressed as a percent or as a quotient. Ratios summarize the data for easy understanding, comparison and interpretations.
Ratios for investment purposes can be classified into profitability ratios, turnover ratios, and leverage ratios. Profitability ratios are the most popular ratios since investors prefer to measure the present profit performance and use this information to forecast the future strength of the company. The most often used profitability ratios are return on assets, price earnings multiplier, price to book value, price to cash flow, and price to sales, dividend yield, return on equity, present value of cash flows, and profit margins.
a) Return on Assets (ROA)
ROA is computed as the product of the net profit margin and the total asset turnover ratios.
ROA = (Net Profit/Total income) x (Total income/Total Assets)
This ratio indicates the firm's strategic success. Companies can have one of two strategies: cost leadership, or product differentiation. ROA should be rising or keeping pace with the company's competitors if the company is successfully pursuing either of these strategies, but how ROA rises will depend on the company's strategy. ROA should rise with a successful cost leadership strategy because the company’s increasing operating efficiency. An example is an increasing, total asset, turnover ratio as the company expands into new markets, increasing its market share. The company may achieve leadership by using its assets more efficiently. With a successful product differentiation strategy, ROA will rise because of a rising profit margin.
b) Return on Investment (ROI)
ROI is the return on capital invested in business, i.e., if an investment Rs 1 crore in men, machines, land and material is made to generate Rs. 25 lakhs of net profit, then the ROI is 25%. The computation of return on investment is as follows:
Return on Investment (ROI) = (Net profit/Equity investments) x 100
As this ratio reveals how well the resources of a firm are being used, higher the ratio, better are the results. The return on shareholder’s investment should be compared with the return of other similar firms in the same industry. The inert-firm comparison of this ratio determines whether

the investments in the firm are attractive or not as the investors would like to invest only where the return is higher.
c) Return on Equity
Return on equity measures how much an equity shareholder's investment is actually earning. The return on equity tells the investor how much the invested rupee is earning from the company. The higher the number, the better is the performance of the company and suggests the usefulness of the projects the company has invested in. The computation of return on equity is as follows:
Return on equity = (Net profit to owners/value of the specific owner's Contribution to the business) x 100
The ratio is more meaningful to the equity shareholders who are invested to know profits earned by the company and those profits which can be made available to pay dividend to them.
d) Earnings per Share (EPS)
This ratio determines what the company is earning for every share. For many investors, earnings are the most important tool. EPS is calculated by dividing the earnings (net profit) by the total number of equity shares.The computation of EPS is as follows:
Earnings per share = Net profit/Number of shares outstanding
The EPS is a good measure of profitability and when compared with EPS of similar other companies, it gives a view of the comparative earnings or earnings power of a firm. EPS calculated for a number of years indicates whether or not earning power of the company has increased.
e) Dividend per Share (DPS)
The extent of payment of dividend to the shareholders is measured in the form of dividend per share. The dividend per share gives the amount of cash flow from the company to the owners and is calculated as follows:
Dividend per share = Total dividend payment / Number of shares outstanding
The payment of dividend can have several interpretations to the shareholder. The distribution of dividend could be thought of as the distribution of excess profits/abnormal profits by the company. On the other hand, it could also be negatively interpreted as lack of investment opportunities. In all, dividend payout gives the extent of inflows to the shareholders from the company.
f) Dividend Yield
Dividend yield is computed by relating the dividend per share to the market price of the share. The market place provides opportunities for the investor to buy the company's share at any point of time. The price at which the share has been bought from the market is the actual cost of the

investment to the shareholder. The market price is to be taken as the cum-dividend price. Dividend yield relates the actual cost to the cash flows received from the company. The computation of dividend yield is as follows
Dividend yield = (Dividend per share / Market price per share) * 100
High dividend yield ratios are usually interpreted as undervalued companies in the market. The market price is a measure of future discounted values, while the dividend per share is the present return from the investment. Hence, a high dividend yield implies that the share has been under priced in the market. On the other hand a low dividend yield need not be interpreted as overvaluation of shares. A company that does not pay out dividends will not have a dividend yield and the real measure of the market price will be in terms of earnings per share and not through the dividend payments.
g) Price/Earnings Ratio (P/E)
The P/E multiplier or the price earnings ratio relates the current market price of the share to the earnings per share. This is computed as follows:
Price/earnings ratio = Current market price / Earnings per share
This ratio is calculated to make an estimate of appreciation in the value of a share of a company and is widely used by investors to decide whether or not to buy shares in a particular company. Many investors prefer to buy the company's shares at a low P/E ratio since the general interpretation is that the market is undervaluing the share and there will be a correction in the market price sooner or later. A very high P/E ratio on the other hand implies that the company's shares are overvalued and the investor can benefit by selling the shares at this high market price.
h) Debt-to-Equity Ratio
Debt-Equity ratio is used to measure the claims of outsiders and the owners against the firm’s assets.
Debt-to-equity ratio = Outsiders Funds / Shareholders Funds
The debt-equity ratio is calculated to measure the extent to which debt financing has been used in a business. It indicates the proportionate claims of owners and the outsiders against the firm’s assets. The purpose is to get an idea of the cushion available to outsiders on the liquidation of the firm.
B. Technical Analysis
Technical Analysis is the forecasting of future financial price movements based on an examination of past price movements. Like weather forecasting, technical analysis does not result in absolute predictions about the future. Instead, technical analysis can help investors anticipate what is "likely" to happen to prices over time. Technical analysis uses a wide variety of charts that show price over time.

Characteristics of a technical analysis
The key characteristics of technical analysis include:
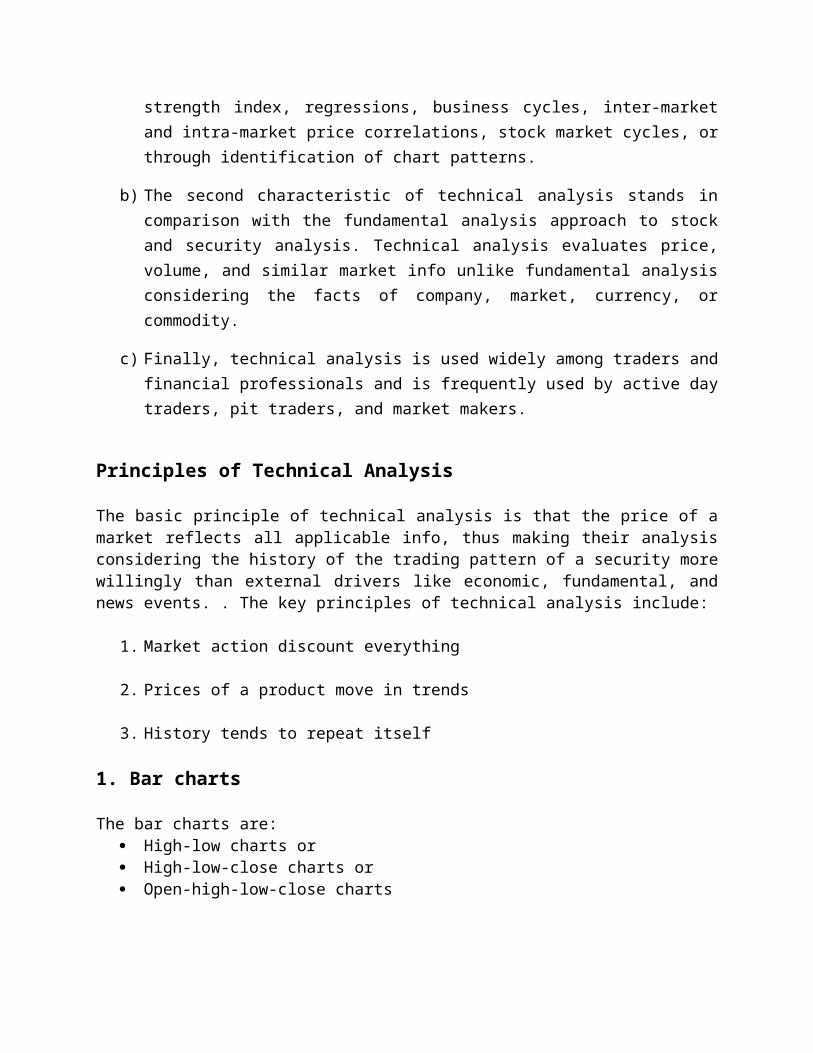
a) The primary characteristic of a technical analysis involves employing models and trading rules depending on price and volume transformations, like moving averages, relative strength index, regressions, business cycles, inter-market and intra-market price correlations, stock market cycles, or through identification of chart patterns.
b) The second characteristic of technical analysis stands in comparison with the fundamental analysis approach to stock and security analysis. Technical analysis evaluates price, volume, and similar market info unlike fundamental analysis considering the facts of company, market, currency, or commodity.
c) Finally, technical analysis is used widely among traders and financial professionals and is frequently used by active day traders, pit traders, and market makers.
Principles of Technical Analysis
The basic principle of technical analysis is that the price of a market reflects all applicable info, thus making their analysis considering the history of the trading pattern of a security more willingly than external drivers like economic, fundamental, and news events. . The key principles of technical analysis include:
1. Market action discount everything
2. Prices of a product move in trends
3. History tends to repeat itself
1. Bar charts
The bar charts are: High-low charts or High-low-close charts or Open-high-low-close charts
One single bar shows the high and the low of the respective trading period. A vertical bar is used to connect the high and the low. Horizontal lines are used to show the opening price (left) of that specific trading period and the closing price (right) at the end of the period.
2. Line charts

A line chart is the simplest of all methods. It is constructed by joining together the closing price of each period, for example daily closings for the daily line chart, weekly closings for the weekly chart or monthly closings for the monthy line chart.
3. Support and resistance
Resistance lines are horizontal lines that start at a recent extreme price peak with the line pointing horizontally into the future. Support lines are horizontal lines that start at a recent extreme of a correction low and also point toward the future on the time axis. An uptrend continues as long as the most recent peak is surpassed and new peak levels are reached. A downtrend continues as long as past lows are broken, sustaining a series of lower lows and lower highs. Notice that the previous support often becomes resistance and resistance becomes support. A resistance or a support line becomes more important and breaks above or below these lines gain more credibility as the number of price extremes (peaks for resistance; or lows for support) that can be connected by a single line increases.
4. Trendlines
Resistance levels can either be drawn by horizontal lines or can be uptrending or downtrending lines. The trendline is nothing more than a straight line drawn between at least three points. In an upmove the low points are connected to form an uptrend line. For a downtrend the peaks are connected. The important point is that it should not be drawn over the price action. Trendlines must encorporate all of the price data, i.e. connect the highs in a downtrend and the lows in an uptrend.
5. Moving averages
Moving averages are popular and versatile for identifing price trends. They smooth out fluctuations in market prices, thereby making it easier to determine underlying trends. Their other function is to signal significant changes in direction as early as possible.
PORTFOLIO MANAGEMENT
After analyzing securities, an investor has to manage a portfolio for maximizing the return at a given risk. Portfolio management is dealing with the construction and maintenance of a collection of investments. For this purpose, an investor has to specify his or her investment objectives accordingly his or her tolerance for risk. It is the process of making selection between Debt Vs Equity, Growth Vs Safety, and various other tradeoffs.
Making Investor’s Profile

An investor profile is a reflection of investors’ goals and objectives. It defines how much risk someone is willing to accept and also the kinds of rewards or returns that he is expecting. Based on the profile, an investor can determine where to allocate funds, because each asset class carries a different level of risk. An investor profile dictates how much capital goes to stocks, bonds, and other asset classes, and how much should remain in cash.
The way an investor handles loss also plays into his investor profile. If a portfolio declines 20% in one year's time and the investor uses this as an opportunity to purchase additional securities, his tolerance for risk is high. If, however, he liquidates the portfolio and sells everything, there is a low risk tolerance.
i) Conservative Investor:
Conservative investor seeks some growth but wishes to remain cautious and seeks stable or consistent returns. He/she is willing to accept comparatively low or lower returns to achieve this objective. He/she accepts that over time his/her investment may not grow as fast as inflation.
Risk profile: Lowest risk/return.
Time frame: Short to medium-term.
ii) Moderate Investor:
Someone with a moderate investor profile has a reasonable understanding of the stock market and is willing to take on some risk. He or she seeks medium to high returns from his or her investment and is prepared to accept volatility in the value of that investment to achieve this.
Risk profile: Medium to high risk/return.
Time frame: Medium to long-term.
iii) Aggressive Investor:
An aggressive investor seeks high returns from his or her investments over the long term and is prepared to accept significant fluctuations in the value of that investment to achieve this. He or she has advanced knowledge of the financial markets and is not afraid to make risky investments. He or she should expect the highest rates of return.
Risk profile: High risk/return.
Time frame: Long-term.
Implementing Diversification and Asset Allocation

After making investment strategy based upon risk profile, an investor should formulate a portfolio based on the principle of diversification. Diversification is the best risk management plan and the single most important element of portfolio management. Diversification is a portfolio strategy that reduces risk by combining different investments that are not correlated. The volatility (risk) of the portfolio is reduced because not all asset groups, industries, or stocks move together.
One of the goals of proper diversification is to reduce unsystematic risk. Unsystematic risk is risk that is specific to an individual investment and can be nearly eliminated by diversification; this includes company specific risk, poor fund management risk, industry risk, and market risk.
Chapter 2: Practical Study

SECURITY ANALYSISA. Fundamental Analysis
1. Economic Analysis
Pakistan GDP
Pakistan Gross Domestic Product is worth 175 billion dollars or 0.28% of the world economy, according to the World Bank. Historically, from 1960 until 2010, Pakistan's average Gross Domestic Product was 45.64 billion dollars reaching an historical high of 174.80 billion dollars in December of 2010 and a record low of 3.71 billion dollars in December of 1960. Pakistan's economy has suffered in the past from decades of internal political disputes, a fast growing population, mixed levels of foreign investment, and a costly, ongoing confrontation with neighboring India. However, IMF-approved government policies, bolstered by foreign investment and renewed access to global markets, have generated solid macroeconomic recovery during the last decade.
Pakistan Stock Market
The KSE100, a major stock market index which tracks the performance of large companies based in Pakistan, rallied 746 points or 13.21 percent during the last month. During the last 12 months, the KSE100 rallied 1483 points or 13.21 percent, reaching an high of 12706.52 points in February of 2012 and a low of 10879.82 points in August of 2011. Historically, from 1990 until 2012 the KSE100 market value averaged 4540.79 points reaching an historical high of 15676.34 points in April of 2008 and a record low of 538.89 points in June of 1990.

Pakistan Inflation Rate
The inflation rate in Pakistan was last reported at 10.1 percent in January of 2012. From 2003 until 2010, the average inflation rate in Pakistan was 10.15 percent reaching an historical high of 25.33 percent in August of 2008 and a record low of 1.41 percent in July of 2003. Inflation rate refers to a general rise in prices measured against a standard level of purchasing power. The most well known measures of Inflation are the CPI which measures consumer prices, and the GDP deflator, which measures inflation in the whole of the domestic economy.
Pakistan Interest Rate
The benchmark interest rate in Pakistan was last reported at 12 percent. In Pakistan, interest rates decisions are taken by the State Bank of Pakistan. The official interest rate is the discount rate.

From 1992 until 2010, Pakistan's average interest rate was 12.78 percent reaching an historical high of 20.00 percent in October of 1996 and a record low of 7.50 percent in November of 2002.
Interpretation:Almost all the indicators are showing that the country is still in an economic recession now days, and there are not many chances that the investor can have good returns out of securities. Keeping in view all of the above stated factors, we have decided 5 sectors in which we think that we can have some good returns. We assume that our perceived sectors will at least be affected by current economic conditions which are discussed in the succeeding pages.
2. Industry Analysis (sample of 5 sectors)
1. Banking Sector:Particulars Description
Sector Life Cycle
Stabilizing stage, for some companies there has been the declining stage, going for mergers and acquisitions with some foreign as well as some domestic banks to ensure their existence in the market.
Historical performanceIn the past few years, banking sector had a boom with an annual growth rate of 20% showing robust performance. But from the declaration of insolvency position of Pakistan in May 2008 and grading it to CCC-, a huge amount of F.D.I. has out flowed which led to decrease in growth of banks but banks are recovering at a good pace.
Type of industry Interest Sensitive industryMarket players HBL, NIB, MCB, NBP, ABL, UBL, Bank Al-Habib, Meezan Bank, Bank Islami
Competitors of MCB HBL, ABL, UBL, NBP

Competition Nature Indirect Competition against Each other.
Threats Bargaining power, SupplierIndustry Life Cycle Stabilizing Stage
Risk & mitigation Inflation rate, Interest Rate, Rise in Economic Capital Limit. Financial Indicators Large private banks’ profits grow by 27pc in 2011
Interpretation:Banking industry is most affected by interest hike, foreign direct investment outflow, inflation rate rise and risk of default. Therefore, a significant decrease in growth rate and profitability has been addressed and the industry is getting back on its pace to progress.
2. Fertilizer IndustryParticulars Description
Sector Life CycleExpansion Stage, rising farming is resulting to rising needs of fertilizers. Therefore, there have been a rising sales growth trend in the sector.
Historical performanceFertilizer industry is fastly growing industry, being aided by government of Pakistan, as it is Associated with agriculture. Pakistan, being an agriculture country will have to support all industries which are directly related to Agriculture to ensure maximum benefits as well as maximum production. Current the sector is growing with almost 35% rate.
Type of industry Growth industry.Market players Dawood Hercules, Fauji Fertilizers, Engro Chemicals, Fatima FertilizersCompetitors of Fauji Fertilizers
Dawood Hercules, Engro Chemicals, Fatima Fertilizers
Competition Nature Direct competitionThreats Supplier (Raw materials), Consumer.(Less purchasing power). Industry Life Cycle Expansion stage. Industry is having maximum profits.Risk & mitigation Inflation rate, Interest Rate, Environmental problems, political instability.Financial Indicators overall profitability of the fertiliser sector increased 45%
Increase in fertilizers demand by 18%.
Interpretation:Although the industry has shown a positive trend in growth, sales and profits. But due to the economic downfall, there may be a set back for the company and company’s growth rate.
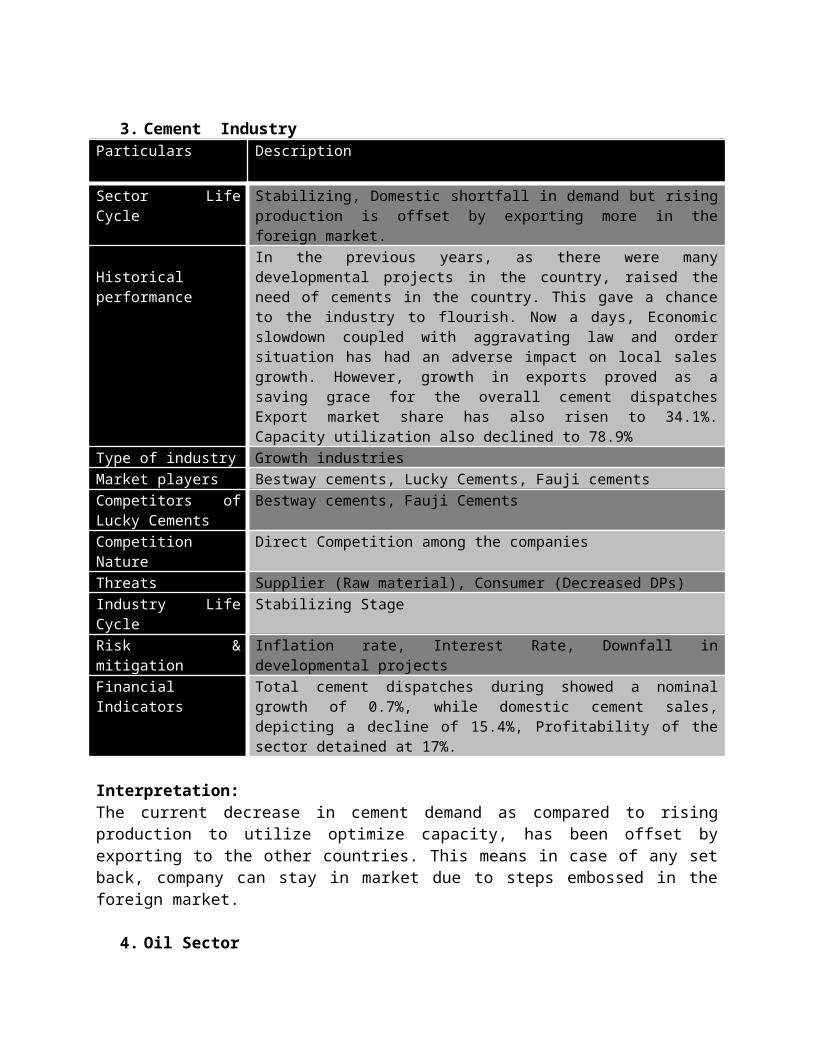
3. Cement IndustryParticulars Description

Sector Life Cycle Stabilizing, Domestic shortfall in demand but rising production is offset by exporting more in the foreign market.
Historical performanceIn the previous years, as there were many developmental projects in the country, raised the need of cements in the country. This gave a chance to the industry to flourish. Now a days, Economic slowdown coupled with aggravating law and order situation has had an adverse impact on local sales growth. However, growth in exports proved as a saving grace for the overall cement dispatches Export market share has also risen to 34.1%. Capacity utilization also declined to 78.9%
Type of industry Growth industriesMarket players Bestway cements, Lucky Cements, Fauji cementsCompetitors of Lucky Cements
Bestway cements, Fauji Cements
Competition Nature Direct Competition among the companiesThreats Supplier (Raw material), Consumer (Decreased DPs)Industry Life Cycle Stabilizing StageRisk & mitigation Inflation rate, Interest Rate, Downfall in developmental projectsFinancial Indicators Total cement dispatches during showed a nominal growth of 0.7%, while
domestic cement sales, depicting a decline of 15.4%, Profitability of the sector detained at 17%.
Interpretation:The current decrease in cement demand as compared to rising production to utilize optimize capacity, has been offset by exporting to the other countries. This means in case of any set back, company can stay in market due to steps embossed in the foreign market.
4. Oil SectorParticulars Description
Sector Life Cycle Stabilizing to expansion stage. As there has been more exploration of oil fields in Pakistan by Exploration and production companies, there will be more chances for the oil marketing companies to expand by rising sales through availability of reduced price oil, offsetting importing prices by the domestic production.
Historical performanceIn the previous years, oil companies have performed very well, having huge profits, and high growth rate. But the rise in oil prices from 2007 has made their profits to decrease significantly, after the releasing of government subsidy over the petroleum, the profits shrinked to an alarming level. But oil companies have been making a good recovery as compared to other sectors.
Type of industry Cyclical industryMarket players PSO, Shell, Attock Petroleum, Caltex, Askari, OGDCCompetitors of OGDC Shell, Attock Petroleum, PSOCompetition Nature Indirect Competition.

Threats New entrants, Suppliers (Changing petroleum prices)Industry Life Cycle ExpansionRisk & mitigation Inflation rate, Interest Rate, Rise in oil prices, oil shortages.Financial Indicators The oil consumption in the country posted a slight decline of 2.9 percent. 52
percent of the total consumption was met through local refineries and the remaining 48 percent met through imports. Among the companies, PSO occupied the largest slice of 68.2 percent
Interpretation:The rising demand of oil in the market has given the OMCs a chance to again establish themselves on the floor of market. The oil prices crunch had made many companies to abolish their existence. In future it is expected that there will be growth in the sector.
5. Commodities SectorParticulars Description
Sector Life Cycle Expansion stage. There is a rising demand for the commodities, as these are the basic necessities for the people. The rising population at a rate of 1.8 contributes towards more sales of the commodities. And giving a backhand to flourish the industry. The industry has although growth at lesser rate as compared to previous year.
Historical performanceIn the past years the industry has performed well, with ever increasing sales growth. Even now in such an economic set back, the industry is performing well as the commodities are the need of every person.
Type of industry Growth industry, having high profits. Market players Haleeb, Nurpur, Continental foods, Dawn, Bake ParlourCompetitors of Nestle Haleeb, Nurpur. Competition Nature Indirect Competition, healthy competitionThreats New entrants, Suppliers (Changing petroleum prices), consumer based.Industry Life Cycle ExpansionRisk & mitigation Inflation rate, Interest Rate, Rise in oil prices, decreasing purchasing power of
consumersFinancial Indicators Sales growth by 25%, Gross profit margin of the industry is 24% while the net
profit margin is 5%. Reduced Net profit margin is due to increased debt cost and rising tax rate.
Interpretation:The Commodities sector has although flourished but at a lesser pace as compared to previous year. The rising demand for the commodities might be handy in the development of the sector.
3. Company Analysis (sample of 5 companies)Particulars Description
Profit after Tax 16,873 million Ratios:
Dividend per share 12

Earnings per share 20.18
Price/Earnings ratio 8.85Return on Equity 21.30%Return on Assets 2.87%Dividend Yield 6.72%
1. MCB Bank
Interpretation:
The company’s overall profitability is showing that it is going with a good growth rate. It future it is expected that the company will give better profits.
2. Fauji Fertilizer Company Limited
Particulars Description
Profit after Tax 11,028 millionRatios:
Dividend per share 20Earnings per share 8.67
Price/Earnings ratio 13.94Return on Equity 97.49%Return on Assets 40.50%Dividend Yield 16.55%
Interpretation:
Fauji Fertilizer has given good returns in the current year. It is expected that it will give better profits in future irrespective of current economic spoil.
3. OGDC
Particulars Description
Profit after Tax 63,527 millionRatios:
Dividend per share 5.50Earnings per share 14.77
Price/Earnings ratio 11.37Return on Equity 31.52%Return on Assets 24.85%Dividend Yield 3.28%
Interpretation:
OGDC has made a good recovery after economic recession and is expected to make further growth.

4. Lucky Cement
Particulars Description
Profit after Tax 3,970 millionRatios:
Dividend per share 5.50Earnings per share 12.28
Price/Earnings ratio 5.77Return on Equity 14.30%Return on Assets 10.38%Dividend Yield 5.65%
Interpretation:
Lucky Cement seems to be going stable and investing in it may earn some good returns.
Particulars Description
Profit after Tax 4,112 millionRatios:
Dividend per share 5.50Earnings per share 90.69
Price/Earnings ratio 26.2Return on Equity 73.68%Return on Assets 17.91%Dividend Yield 5.65%
5. Nestle Pakistan
Interpretation:
Nestle Pakistan has a fast growth rate. It is expected that it will remain giving good returns in future.
B. Technical Analysis (sample of shares of 3 companies)
Technical Analysis for MCB Bank
MACD Daily SellCurrent Signal Buy MACD Weekly BuyCurrent Signal Date Friday, March 02, 2012 MACD Monthly N/ACurrent Signal Price 178.63 RSI Daily 54.99Sell When Price Closes Below 175.25 Indicator N/A

One Month Price Performance 2.34 % 10 Day Simple Moving Avg 178.53Three Month Price Performance 21.29 % 30 Day Simple Moving Avg 178.11Six Month Price Performance 6.47 % 60 Day Simple Moving Avg 160.87Twelve Month Price Performance -16.26 % 200 Day Simple Moving Avg 174.73Support 1 176.09 Support 2 173.54Resistance 1 180.34 Resistance 2 182.04
Technical Analysis for Fauji Fetilizer Company Limited
MACD Daily SellCurrent Signal Sell MACD Weekly SellCurrent Signal Date Tuesday, February 28, 2012MACD Monthly N/ACurrent Signal Price 186.96 RSI Daily 15.70Buy When Price Closes Above 123.81 Indicator N/AOne Month Price Performance -35.77 % 10 Day Simple Moving Avg 167.21Three Month Price Performance -23.87 % 30 Day Simple Moving Avg 177.77Six Month Price Performance -22.12 % 60 Day Simple Moving Avg 167.38Twelve Month Price Performance 0.85 % 200 Day Simple Moving Avg 162.59

Support 1 119.46 Support 2 118.07Resistance 1 123.02 Resistance 2 125.19
Technical Analysis for OGDC
MACD Daily BuyCurrent Signal Buy MACD Weekly BuyCurrent Signal Date Wednesday, February 29, 2012MACD Monthly N/ACurrent Signal Price 169.02 RSI Daily 68.38Sell When Price Closes Below 167.25 Indicator N/AOne Month Price Performance 9.79 % 10 Day Simple Moving Avg 165.88Three Month Price Performance 10.19 % 30 Day Simple Moving Avg 158.57Six Month Price Performance 33.81 % 60 Day Simple Moving Avg 153.39Twelve Month Price Performance 10.77 % 200 Day Simple Moving Avg 146.94Support 1 166.92 Support 2 165.93Resistance 1 169.29 Resistance 2 170.67

PORTFOLIO MANAGEMENT
Based on Investor Risk Profile (Conservative, Moderate or Aggressive), we can formulate the following composition of portfolio:
i. Equities
Risk: HighReturn: HighInvestment Horizon: 2Y – 5Y
ii. Fixed Income (Term Deposits, Income Funds, Government of Pakistan Schemes)
Risk: LowReturn: ModerateInvestment Horizon: 6M – 1Y
iii. Real Estate:
Risk: ModerateReturn: HighInvestment Horizon: 10Y
iv. Commodities (Gold)
Risk: ModerateReturn: HighInvestment Horizon: 1Y
v. Cash (Money Market Funds)
Risk: LowReturn: LowInvestment Horizon: 3M-6M
Related Documents