SECTION THREE—SCHOOL DISTRICT, CHARTER SCHOOL, AND TRIBAL SCHOOL FINANCIAL REPORTS Introduction Section Three of this publication contains reports that have financial information for each public school district, charter school, and tribal school in the state of Washington. These reports are from the school district financial report F-196 for FY 2019–20. The reports are arranged so comparisons can be made among school districts, charter schools, and tribal schools with a similar number of students or by county. Please refer to the Accounting Manual for Public School Districts in the state of Washington for detailed definitions of expenditure and revenue categories. The student enrollments used to calculate total expenditures per pupil include FTE for regular K–12, skill centers, summer schools, detention centers and other state institutions, and special education headcount for birth-to-two and three-to-five programs, as reported to OSPI. General Fund Expenditures, Revenues, and Ending Total Fund Balance Per Pupil by Enrollment Groups and by County This report shows expenditures, revenues, and ending total fund balance per pupil calculations from information reported by school districts, charter schools, and tribal schools. Percent and Per Pupil of General Fund Revenues and Other Financing Sources by Enrollment Groups and by County This report shows the percentage and per pupil breakdown of total revenues and other financing sources of school districts, charter schools, and tribal schools. General Fund Total Expenditures by Program Groups by Enrollment Groups and by County This report is from the school district financial report F-196 for FY 2019–20. The report shows total expenditures by program groups. The following report shows the percentage and per pupil breakdown by the same program groups. Percent and Per Pupil of General Fund Expenditures by Program Groups by Enrollment Groups and by County This report shows a percentage and per pupil breakdown of expenditures by program groups. Per Pupil General Fund Expenditure Activity Reports by Enrollment Groups and by County These reports analyze school district, charter schools, and tribal schools General Fund expenditures by activity. An activity is defined as a specific line of work in a school district. Expenditures per student for certain groups of activities and some individual activities are shown. Percentages of total General Fund expenditures by activity are also displayed. The total expenditures for all activity groups equal total direct expenditures. 1

Welcome message from author
This document is posted to help you gain knowledge. Please leave a comment to let me know what you think about it! Share it to your friends and learn new things together.
Transcript
SECTION THREE—SCHOOL DISTRICT, CHARTER SCHOOL, AND TRIBAL SCHOOL FINANCIAL REPORTS
Introduction Section Three of this publication contains reports that have financial information for each public school district, charter school, and tribal school in the state of Washington. These reports are from the school district financial report F-196 for FY 2019–20. The reports are arranged so comparisons can be made among school districts, charter schools, and tribal schools with a similar number of students or by county. Please refer to the Accounting Manual for Public School Districts in the state of Washington for detailed definitions of expenditure and revenue categories. The student enrollments used to calculate total expenditures per pupil include FTE for regular K–12, skill centers, summer schools, detention centers and other state institutions, and special education headcount for birth-to-two and three-to-five programs, as reported to OSPI.
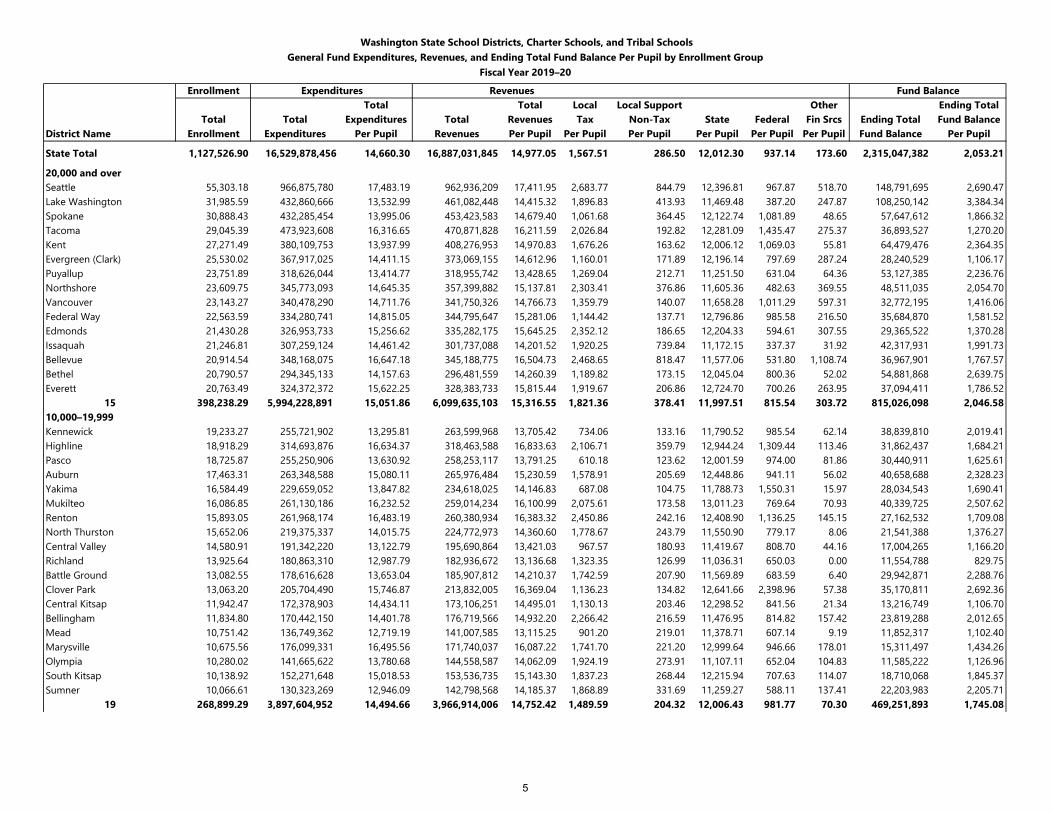
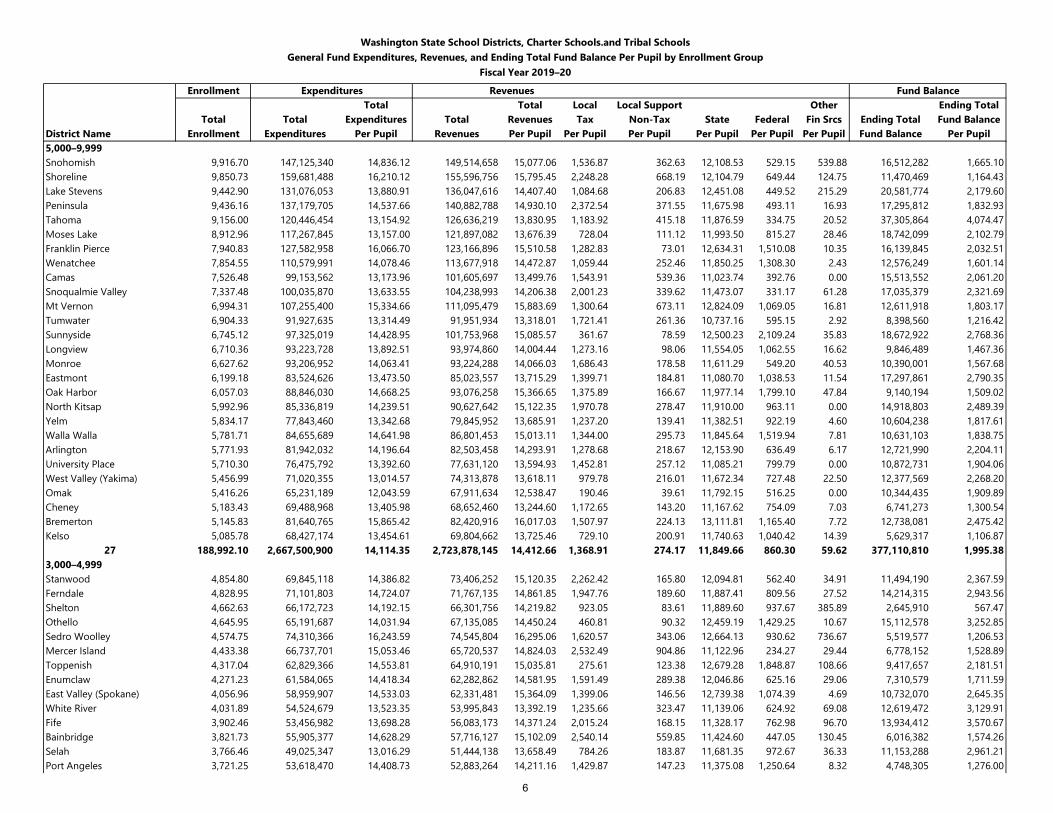
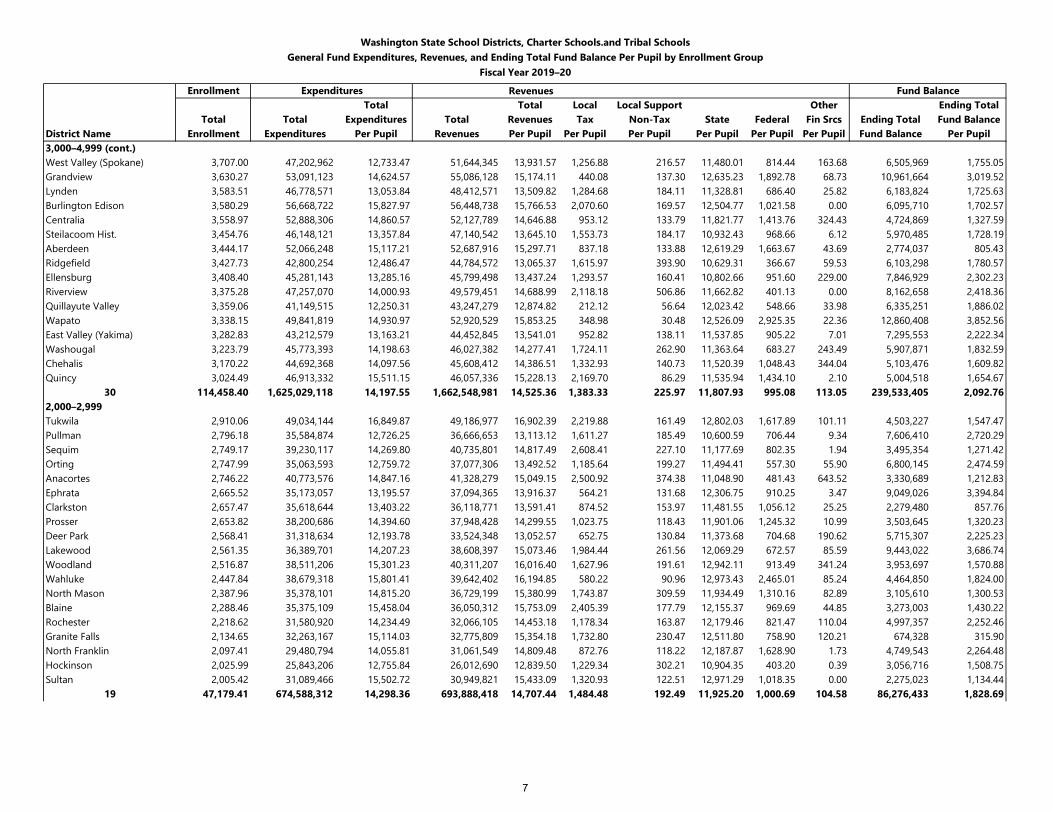
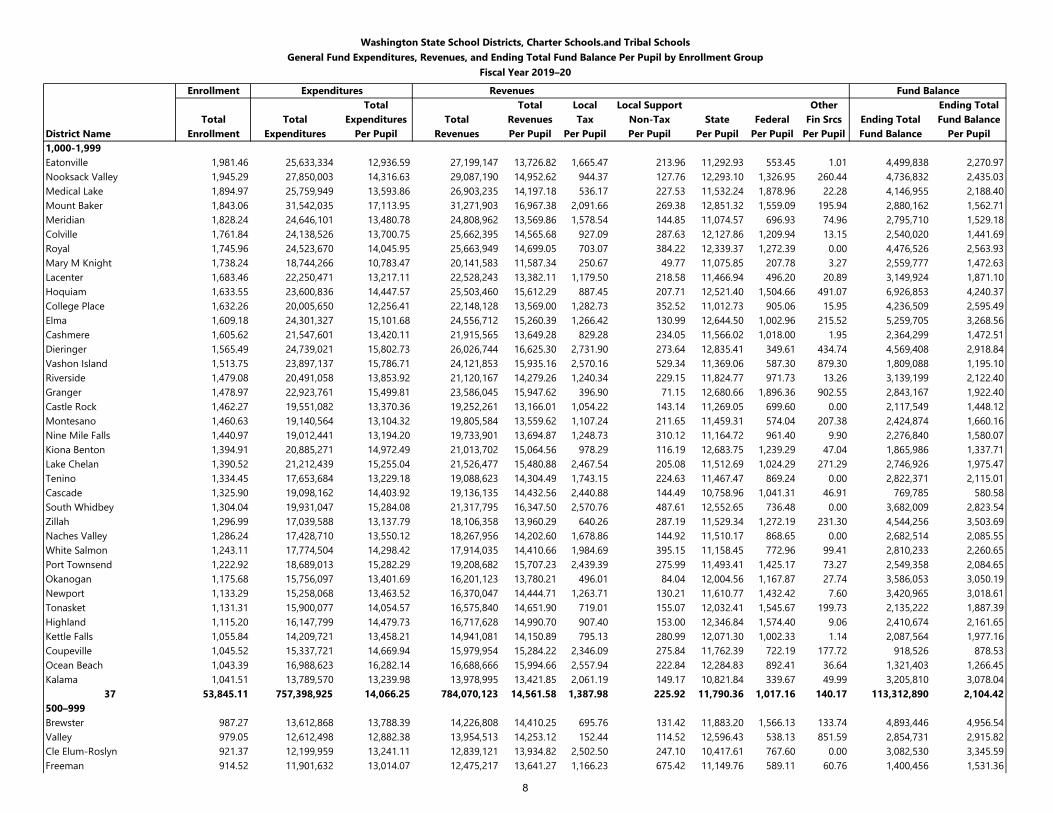
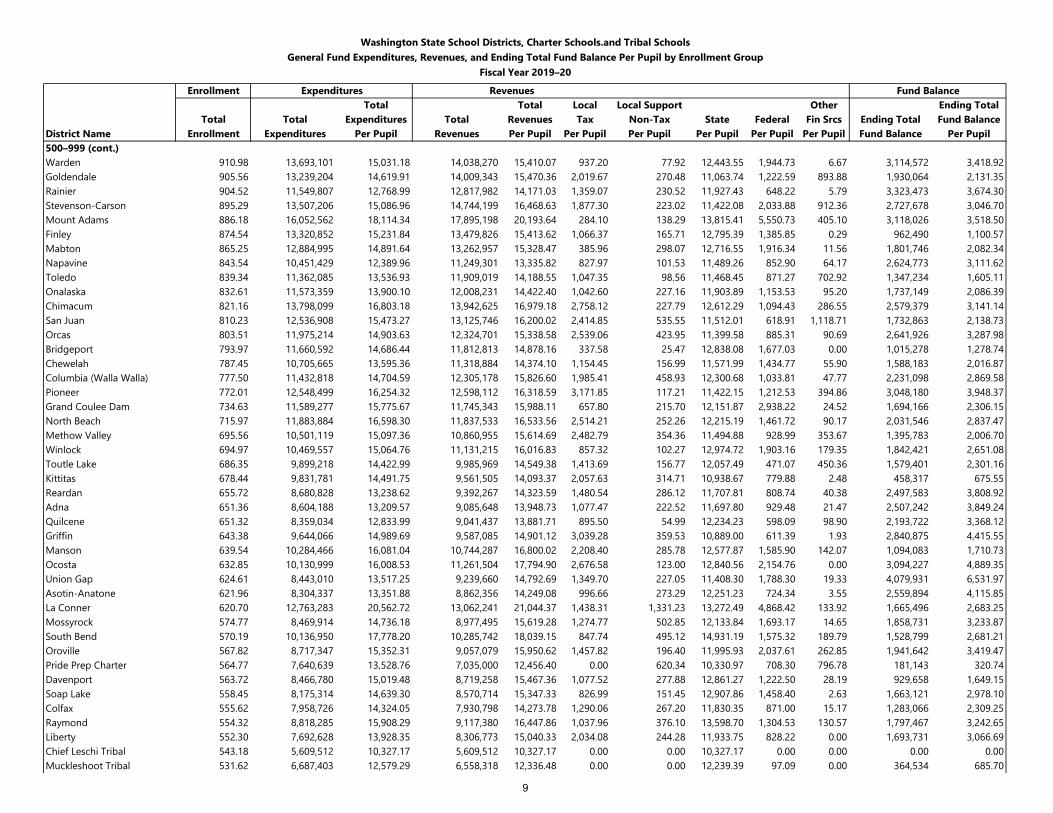
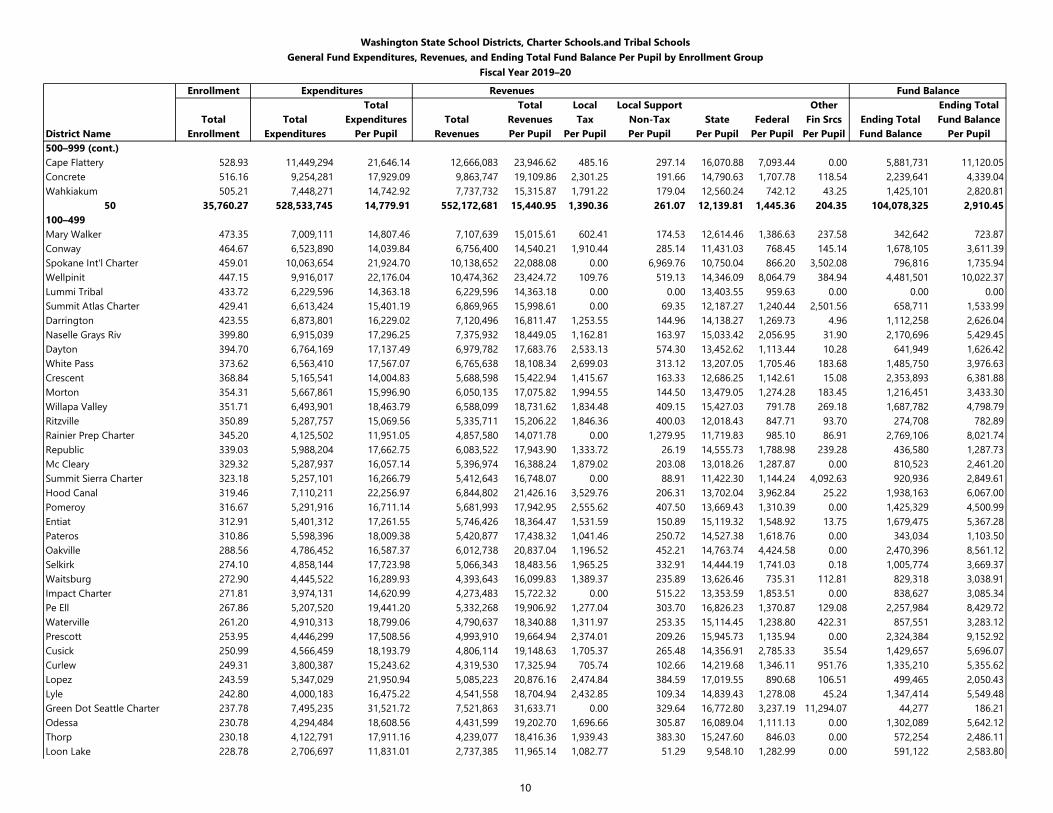
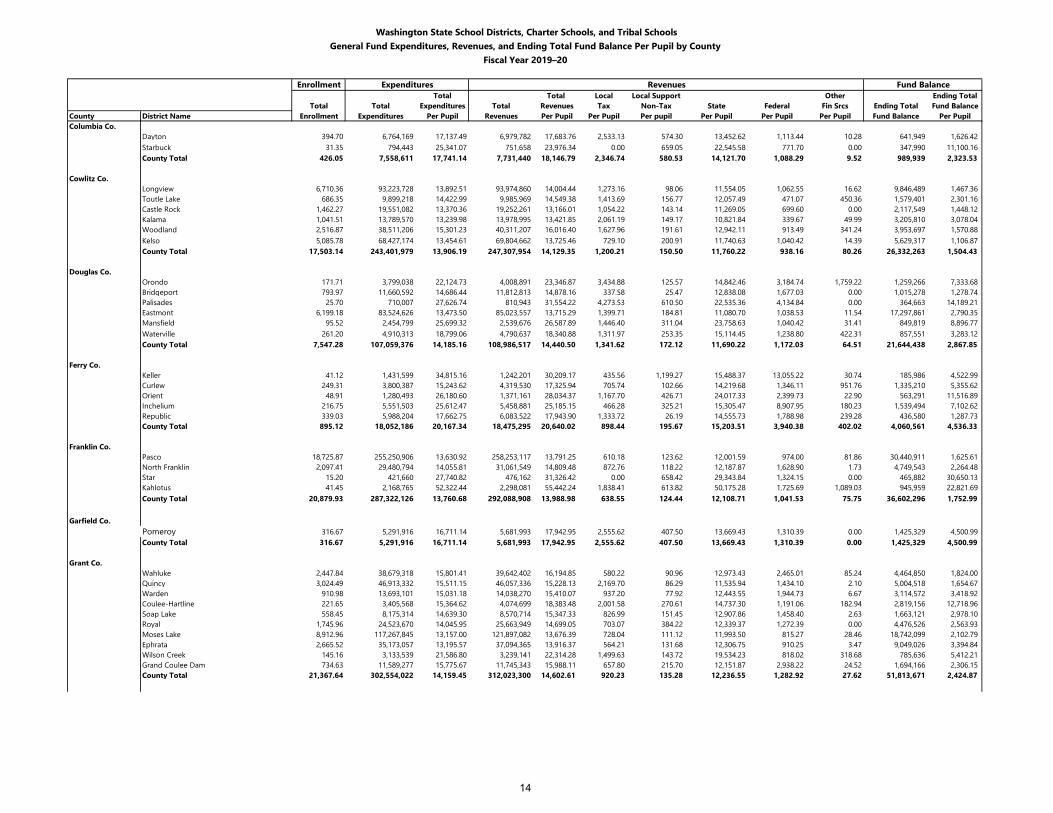
General Fund Expenditures, Revenues, and Ending Total Fund Balance Per Pupil by Enrollment Groups and by County This report shows expenditures, revenues, and ending total fund balance per pupil calculations from information reported by school districts, charter schools, and tribal schools.
Percent and Per Pupil of General Fund Revenues and Other Financing Sources by Enrollment Groups and by County This report shows the percentage and per pupil breakdown of total revenues and other financing sources of school districts, charter schools, and tribal schools.
General Fund Total Expenditures by Program Groups by Enrollment Groups and by County This report is from the school district financial report F-196 for FY 2019–20. The report shows total expenditures by program groups. The following report shows the percentage and per pupil breakdown by the same program groups.
Percent and Per Pupil of General Fund Expenditures by Program Groups by Enrollment Groups and by County This report shows a percentage and per pupil breakdown of expenditures by program groups.
Per Pupil General Fund Expenditure Activity Reports by Enrollment Groups and by County These reports analyze school district, charter schools, and tribal schools General Fund expenditures by activity. An activity is defined as a specific line of work in a school district. Expenditures per student for certain groups of activities and some individual activities are shown. Percentages of total General Fund expenditures by activity are also displayed. The total expenditures for all activity groups equal total direct expenditures.
1
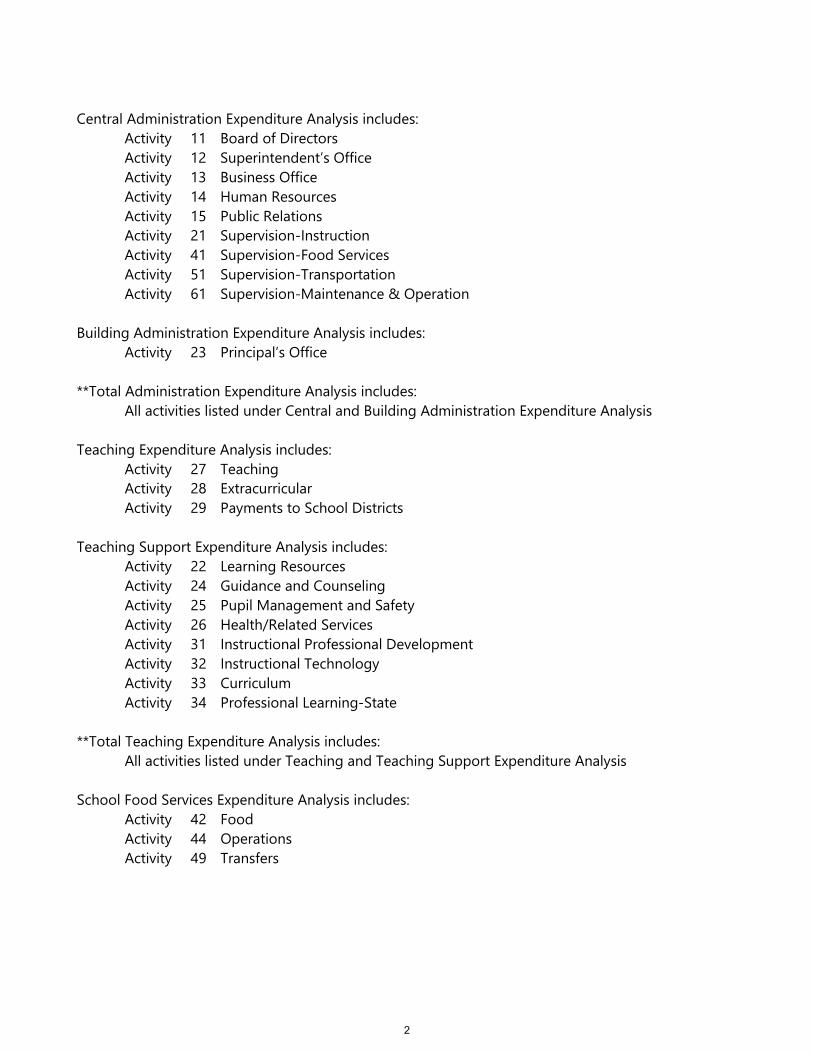
Central Administration Expenditure Analysis includes: Activity 11 Board of Directors Activity 12 Superintendent’s Office Activity 13 Business Office Activity 14 Human Resources Activity 15 Public Relations Activity 21 Supervision-Instruction Activity 41 Supervision-Food Services Activity 51 Supervision-Transportation Activity 61 Supervision-Maintenance & Operation
Building Administration Expenditure Analysis includes: Activity 23 Principal’s Office
**Total Administration Expenditure Analysis includes: All activities listed under Central and Building Administration Expenditure Analysis
Teaching Expenditure Analysis includes: Activity 27 Teaching Activity 28 Extracurricular Activity 29 Payments to School Districts
Teaching Support Expenditure Analysis includes: Activity 22 Learning Resources Activity 24 Guidance and Counseling Activity 25 Pupil Management and Safety Activity 26 Health/Related Services Activity 31 Instructional Professional Development Activity 32 Instructional Technology Activity 33 Curriculum Activity 34 Professional Learning-State
**Total Teaching Expenditure Analysis includes: All activities listed under Teaching and Teaching Support Expenditure Analysis
School Food Services Expenditure Analysis includes: Activity 42 Food Activity 44 Operations Activity 49 Transfers
2
Maintenance and Operation Expenditure Analysis includes: Activity 62 Grounds Maintenance Activity 63 Operation of Building Activity 64 Maintenance Activity 65 Utilities Activity 67 Building and Property Security
Transportation Activities Expenditure Analysis includes: Activity 52 Operations Activity 53 Maintenance Activity 56 Insurance Activity 59 Transfers
Other Support Service Activities Expenditure Analysis includes: Activity 68 Insurance (except Transportation) Activity 72 Information Systems Activity 73 Printing Activity 74 Warehousing & Distribution Activity 75 Motor Pool Activity 83 Interest Activity 84 Principal Activity 85 Debt-Related Expenditures Activity 91 Public Activities
Percent and Per Pupil of General Fund Expenditures by Object, by Enrollment Groups, and by County This report shows a percentage and per pupil breakdown of expenditures by object of expenditure.
Per Pupil All Expenditures—Four-Year Average FY 2016–17 through FY 2019–20 by Enrollment Groups and by County The four funds included in the expenditure total for this report are General, Capital Projects, Debt Service, and Transportation Vehicle Funds.
Student Enrollment Trends FY 2016–17 through FY 2019–20 by Enrollment Groups and by County This report shows the number and percentage change in student enrollments for each school district, charter school, and tribal school between fiscal years.
General Fund Total Fund Balance Per Pupil and Percent of Change by Enrollment Groups and by County This report shows the General Fund total fund balance per pupil for three years and an analysis of the percent of change during those years.
3
Percent and Per Pupil of General Fund Restricted and Unrestricted to Total Fund Balance by Enrollment Groups and by County This report shows the restricted and unrestricted fund balance accounts.
General Fund 2019 Tax Collection Survey and Three-Year Average by County The General Fund Tax Collection Survey is provided to assist school districts in budgeting property tax revenue. This report should help school districts develop realistic budget estimates.
The tax collection data consists of: Net General Fund excess Maintenance and Operation (M&O) levy collections Spring tax collections Fall tax collections
The rest of the report compares spring, fall, and total General Fund tax collection percentages for levies collectible for the recent three-year period for each school district, county, and the state. Also shown is a three-year average of spring, fall, and total tax collection percentages. The three-year average was determined by dividing the tax collected in the last three years by the total levy as certified and adjusted for timber roll. Slight variations in county and state totals between reports are due to rounding.
Notes:
• The net excess M&O levy amount is the levy certified for collection adjusted to exclude theportion attributable to timber roll. While timber roll assessed valuation is a portion of totaldistrict assessed valuations, the levy against it is treated differently than property taxes. Timbertaxes are calculated and distributed by the Department of Revenue as state funds and reportedin the General Fund as Revenue Account 1500.
• Spring and fall property tax collections were calculated using local property taxes reported onCounty Treasurer’s Monthly Reports to School Districts in Revenue Account 1100. Springincludes January 1 through August 31 collections. Fall includes September 1 through December31 collections.
• Districts should also take into consideration the influence prior year and delinquent taxcollections have on collection percentages shown on these reports. Collection percentages arebased on the current year levy. When levy amounts increase, prior year, and delinquent taxesmake up a smaller portion of taxes collected and thereby decrease tax collection percentages.The opposite is true when levy amounts decrease. If levy amounts change substantially,collection percentages may become distorted and not useful for forecasting revenue. In theseinstances, consider using the county or state collection percentages.
All Funds Long-Term Liabilities Per Pupil by Enrollment Groups and by County Long-term liabilities includes the unmatured principal of bonds, warrants, notes, and other forms of noncurrent or long-term indebtedness that have a maturity of at least one-year from the date of issuance.
4
Washington State School Districts, Charter Schools, and Tribal SchoolsGeneral Fund Expenditures, Revenues, and Ending Total Fund Balance Per Pupil by Enrollment Group
Fiscal Year 2019–20
Enrollment Expenditures Revenues Fund BalanceTotal Total Local Local Support Other Ending Total
Total Total Expenditures Total Revenues Tax Non-Tax State Federal Fin Srcs Ending Total Fund BalanceDistrict Name Enrollment Expenditures Per Pupil Revenues Per Pupil Per Pupil Per Pupil Per Pupil Per Pupil Per Pupil Fund Balance Per Pupil
State Total 1,127,526.90 16,529,878,456 14,660.30 16,887,031,845 14,977.05 1,567.51 286.50 12,012.30 937.14 173.60 2,315,047,382 2,053.21
20,000 and overSeattle 55,303.18 966,875,780 17,483.19 962,936,209 17,411.95 2,683.77 844.79 12,396.81 967.87 518.70 148,791,695 2,690.47Lake Washington 31,985.59 432,860,666 13,532.99 461,082,448 14,415.32 1,896.83 413.93 11,469.48 387.20 247.87 108,250,142 3,384.34Spokane 30,888.43 432,285,454 13,995.06 453,423,583 14,679.40 1,061.68 364.45 12,122.74 1,081.89 48.65 57,647,612 1,866.32Tacoma 29,045.39 473,923,608 16,316.65 470,871,828 16,211.59 2,026.84 192.82 12,281.09 1,435.47 275.37 36,893,527 1,270.20Kent 27,271.49 380,109,753 13,937.99 408,276,953 14,970.83 1,676.26 163.62 12,006.12 1,069.03 55.81 64,479,476 2,364.35Evergreen (Clark) 25,530.02 367,917,025 14,411.15 373,069,155 14,612.96 1,160.01 171.89 12,196.14 797.69 287.24 28,240,529 1,106.17Puyallup 23,751.89 318,626,044 13,414.77 318,955,742 13,428.65 1,269.04 212.71 11,251.50 631.04 64.36 53,127,385 2,236.76Northshore 23,609.75 345,773,093 14,645.35 357,399,882 15,137.81 2,303.41 376.86 11,605.36 482.63 369.55 48,511,035 2,054.70Vancouver 23,143.27 340,478,290 14,711.76 341,750,326 14,766.73 1,359.79 140.07 11,658.28 1,011.29 597.31 32,772,195 1,416.06Federal Way 22,563.59 334,280,741 14,815.05 344,795,647 15,281.06 1,144.42 137.71 12,796.86 985.58 216.50 35,684,870 1,581.52Edmonds 21,430.28 326,953,733 15,256.62 335,282,175 15,645.25 2,352.12 186.65 12,204.33 594.61 307.55 29,365,522 1,370.28Issaquah 21,246.81 307,259,124 14,461.42 301,737,088 14,201.52 1,920.25 739.84 11,172.15 337.37 31.92 42,317,931 1,991.73Bellevue 20,914.54 348,168,075 16,647.18 345,188,775 16,504.73 2,468.65 818.47 11,577.06 531.80 1,108.74 36,967,901 1,767.57Bethel 20,790.57 294,345,133 14,157.63 296,481,559 14,260.39 1,189.82 173.15 12,045.04 800.36 52.02 54,881,868 2,639.75Everett 20,763.49 324,372,372 15,622.25 328,383,733 15,815.44 1,919.67 206.86 12,724.70 700.26 263.95 37,094,411 1,786.52
15 398,238.29 5,994,228,891 15,051.86 6,099,635,103 15,316.55 1,821.36 378.41 11,997.51 815.54 303.72 815,026,098 2,046.5810,000–19,999Kennewick 19,233.27 255,721,902 13,295.81 263,599,968 13,705.42 734.06 133.16 11,790.52 985.54 62.14 38,839,810 2,019.41Highline 18,918.29 314,693,876 16,634.37 318,463,588 16,833.63 2,106.71 359.79 12,944.24 1,309.44 113.46 31,862,437 1,684.21Pasco 18,725.87 255,250,906 13,630.92 258,253,117 13,791.25 610.18 123.62 12,001.59 974.00 81.86 30,440,911 1,625.61Auburn 17,463.31 263,348,588 15,080.11 265,976,484 15,230.59 1,578.91 205.69 12,448.86 941.11 56.02 40,658,688 2,328.23Yakima 16,584.49 229,659,052 13,847.82 234,618,025 14,146.83 687.08 104.75 11,788.73 1,550.31 15.97 28,034,543 1,690.41Mukilteo 16,086.85 261,130,186 16,232.52 259,014,234 16,100.99 2,075.61 173.58 13,011.23 769.64 70.93 40,339,725 2,507.62Renton 15,893.05 261,968,174 16,483.19 260,380,934 16,383.32 2,450.86 242.16 12,408.90 1,136.25 145.15 27,162,532 1,709.08North Thurston 15,652.06 219,375,337 14,015.75 224,772,973 14,360.60 1,778.67 243.79 11,550.90 779.17 8.06 21,541,388 1,376.27Central Valley 14,580.91 191,342,220 13,122.79 195,690,864 13,421.03 967.57 180.93 11,419.67 808.70 44.16 17,004,265 1,166.20Richland 13,925.64 180,863,310 12,987.79 182,936,672 13,136.68 1,323.35 126.99 11,036.31 650.03 0.00 11,554,788 829.75Battle Ground 13,082.55 178,616,628 13,653.04 185,907,812 14,210.37 1,742.59 207.90 11,569.89 683.59 6.40 29,942,871 2,288.76Clover Park 13,063.20 205,704,490 15,746.87 213,832,005 16,369.04 1,136.23 134.82 12,641.66 2,398.96 57.38 35,170,811 2,692.36Central Kitsap 11,942.47 172,378,903 14,434.11 173,106,251 14,495.01 1,130.13 203.46 12,298.52 841.56 21.34 13,216,749 1,106.70Bellingham 11,834.80 170,442,150 14,401.78 176,719,566 14,932.20 2,266.42 216.59 11,476.95 814.82 157.42 23,819,288 2,012.65Mead 10,751.42 136,749,362 12,719.19 141,007,585 13,115.25 901.20 219.01 11,378.71 607.14 9.19 11,852,317 1,102.40Marysville 10,675.56 176,099,331 16,495.56 171,740,037 16,087.22 1,741.70 221.20 12,999.64 946.66 178.01 15,311,497 1,434.26Olympia 10,280.02 141,665,622 13,780.68 144,558,587 14,062.09 1,924.19 273.91 11,107.11 652.04 104.83 11,585,222 1,126.96South Kitsap 10,138.92 152,271,648 15,018.53 153,536,735 15,143.30 1,837.23 268.44 12,215.94 707.63 114.07 18,710,068 1,845.37Sumner 10,066.61 130,323,269 12,946.09 142,798,568 14,185.37 1,868.89 331.69 11,259.27 588.11 137.41 22,203,983 2,205.71
19 268,899.29 3,897,604,952 14,494.66 3,966,914,006 14,752.42 1,489.59 204.32 12,006.43 981.77 70.30 469,251,893 1,745.08
5
Washington State School Districts, Charter Schools.and Tribal SchoolsGeneral Fund Expenditures, Revenues, and Ending Total Fund Balance Per Pupil by Enrollment Group
Fiscal Year 2019–20
Enrollment Expenditures Revenues Fund BalanceTotal Total Local Local Support Other Ending Total
Total Total Expenditures Total Revenues Tax Non-Tax State Federal Fin Srcs Ending Total Fund BalanceDistrict Name Enrollment Expenditures Per Pupil Revenues Per Pupil Per Pupil Per Pupil Per Pupil Per Pupil Per Pupil Fund Balance Per Pupil5,000–9,999Snohomish 9,916.70 147,125,340 14,836.12 149,514,658 15,077.06 1,536.87 362.63 12,108.53 529.15 539.88 16,512,282 1,665.10Shoreline 9,850.73 159,681,488 16,210.12 155,596,756 15,795.45 2,248.28 668.19 12,104.79 649.44 124.75 11,470,469 1,164.43Lake Stevens 9,442.90 131,076,053 13,880.91 136,047,616 14,407.40 1,084.68 206.83 12,451.08 449.52 215.29 20,581,774 2,179.60Peninsula 9,436.16 137,179,705 14,537.66 140,882,788 14,930.10 2,372.54 371.55 11,675.98 493.11 16.93 17,295,812 1,832.93Tahoma 9,156.00 120,446,454 13,154.92 126,636,219 13,830.95 1,183.92 415.18 11,876.59 334.75 20.52 37,305,864 4,074.47Moses Lake 8,912.96 117,267,845 13,157.00 121,897,082 13,676.39 728.04 111.12 11,993.50 815.27 28.46 18,742,099 2,102.79Franklin Pierce 7,940.83 127,582,958 16,066.70 123,166,896 15,510.58 1,282.83 73.01 12,634.31 1,510.08 10.35 16,139,845 2,032.51Wenatchee 7,854.55 110,579,991 14,078.46 113,677,918 14,472.87 1,059.44 252.46 11,850.25 1,308.30 2.43 12,576,249 1,601.14Camas 7,526.48 99,153,562 13,173.96 101,605,697 13,499.76 1,543.91 539.36 11,023.74 392.76 0.00 15,513,552 2,061.20Snoqualmie Valley 7,337.48 100,035,870 13,633.55 104,238,993 14,206.38 2,001.23 339.62 11,473.07 331.17 61.28 17,035,379 2,321.69Mt Vernon 6,994.31 107,255,400 15,334.66 111,095,479 15,883.69 1,300.64 673.11 12,824.09 1,069.05 16.81 12,611,918 1,803.17Tumwater 6,904.33 91,927,635 13,314.49 91,951,934 13,318.01 1,721.41 261.36 10,737.16 595.15 2.92 8,398,560 1,216.42Sunnyside 6,745.12 97,325,019 14,428.95 101,753,968 15,085.57 361.67 78.59 12,500.23 2,109.24 35.83 18,672,922 2,768.36Longview 6,710.36 93,223,728 13,892.51 93,974,860 14,004.44 1,273.16 98.06 11,554.05 1,062.55 16.62 9,846,489 1,467.36Monroe 6,627.62 93,206,952 14,063.41 93,224,288 14,066.03 1,686.43 178.58 11,611.29 549.20 40.53 10,390,001 1,567.68Eastmont 6,199.18 83,524,626 13,473.50 85,023,557 13,715.29 1,399.71 184.81 11,080.70 1,038.53 11.54 17,297,861 2,790.35Oak Harbor 6,057.03 88,846,030 14,668.25 93,076,258 15,366.65 1,375.89 166.67 11,977.14 1,799.10 47.84 9,140,194 1,509.02North Kitsap 5,992.96 85,336,819 14,239.51 90,627,642 15,122.35 1,970.78 278.47 11,910.00 963.11 0.00 14,918,803 2,489.39Yelm 5,834.17 77,843,460 13,342.68 79,845,952 13,685.91 1,237.20 139.41 11,382.51 922.19 4.60 10,604,238 1,817.61Walla Walla 5,781.71 84,655,689 14,641.98 86,801,453 15,013.11 1,344.00 295.73 11,845.64 1,519.94 7.81 10,631,103 1,838.75Arlington 5,771.93 81,942,032 14,196.64 82,503,458 14,293.91 1,278.68 218.67 12,153.90 636.49 6.17 12,721,990 2,204.11University Place 5,710.30 76,475,792 13,392.60 77,631,120 13,594.93 1,452.81 257.12 11,085.21 799.79 0.00 10,872,731 1,904.06West Valley (Yakima) 5,456.99 71,020,355 13,014.57 74,313,878 13,618.11 979.78 216.01 11,672.34 727.48 22.50 12,377,569 2,268.20Omak 5,416.26 65,231,189 12,043.59 67,911,634 12,538.47 190.46 39.61 11,792.15 516.25 0.00 10,344,435 1,909.89Cheney 5,183.43 69,488,968 13,405.98 68,652,460 13,244.60 1,172.65 143.20 11,167.62 754.09 7.03 6,741,273 1,300.54Bremerton 5,145.83 81,640,765 15,865.42 82,420,916 16,017.03 1,507.97 224.13 13,111.81 1,165.40 7.72 12,738,081 2,475.42Kelso 5,085.78 68,427,174 13,454.61 69,804,662 13,725.46 729.10 200.91 11,740.63 1,040.42 14.39 5,629,317 1,106.87
27 188,992.10 2,667,500,900 14,114.35 2,723,878,145 14,412.66 1,368.91 274.17 11,849.66 860.30 59.62 377,110,810 1,995.383,000–4,999Stanwood 4,854.80 69,845,118 14,386.82 73,406,252 15,120.35 2,262.42 165.80 12,094.81 562.40 34.91 11,494,190 2,367.59Ferndale 4,828.95 71,101,803 14,724.07 71,767,135 14,861.85 1,947.76 189.60 11,887.41 809.56 27.52 14,214,315 2,943.56Shelton 4,662.63 66,172,723 14,192.15 66,301,756 14,219.82 923.05 83.61 11,889.60 937.67 385.89 2,645,910 567.47Othello 4,645.95 65,191,687 14,031.94 67,135,085 14,450.24 460.81 90.32 12,459.19 1,429.25 10.67 15,112,578 3,252.85Sedro Woolley 4,574.75 74,310,366 16,243.59 74,545,804 16,295.06 1,620.57 343.06 12,664.13 930.62 736.67 5,519,577 1,206.53Mercer Island 4,433.38 66,737,701 15,053.46 65,720,537 14,824.03 2,532.49 904.86 11,122.96 234.27 29.44 6,778,152 1,528.89Toppenish 4,317.04 62,829,366 14,553.81 64,910,191 15,035.81 275.61 123.38 12,679.28 1,848.87 108.66 9,417,657 2,181.51Enumclaw 4,271.23 61,584,065 14,418.34 62,282,862 14,581.95 1,591.49 289.38 12,046.86 625.16 29.06 7,310,579 1,711.59East Valley (Spokane) 4,056.96 58,959,907 14,533.03 62,331,481 15,364.09 1,399.06 146.56 12,739.38 1,074.39 4.69 10,732,070 2,645.35White River 4,031.89 54,524,679 13,523.35 53,995,843 13,392.19 1,235.66 323.47 11,139.06 624.92 69.08 12,619,472 3,129.91Fife 3,902.46 53,456,982 13,698.28 56,083,173 14,371.24 2,015.24 168.15 11,328.17 762.98 96.70 13,934,412 3,570.67Bainbridge 3,821.73 55,905,377 14,628.29 57,716,127 15,102.09 2,540.14 559.85 11,424.60 447.05 130.45 6,016,382 1,574.26Selah 3,766.46 49,025,347 13,016.29 51,444,138 13,658.49 784.26 183.87 11,681.35 972.67 36.33 11,153,288 2,961.21Port Angeles 3,721.25 53,618,470 14,408.73 52,883,264 14,211.16 1,429.87 147.23 11,375.08 1,250.64 8.32 4,748,305 1,276.00
6
Washington State School Districts, Charter Schools.and Tribal SchoolsGeneral Fund Expenditures, Revenues, and Ending Total Fund Balance Per Pupil by Enrollment Group
Fiscal Year 2019–20
Enrollment Expenditures Revenues Fund BalanceTotal Total Local Local Support Other Ending Total
Total Total Expenditures Total Revenues Tax Non-Tax State Federal Fin Srcs Ending Total Fund BalanceDistrict Name Enrollment Expenditures Per Pupil Revenues Per Pupil Per Pupil Per Pupil Per Pupil Per Pupil Per Pupil Fund Balance Per Pupil3,000–4,999 (cont.)West Valley (Spokane) 3,707.00 47,202,962 12,733.47 51,644,345 13,931.57 1,256.88 216.57 11,480.01 814.44 163.68 6,505,969 1,755.05Grandview 3,630.27 53,091,123 14,624.57 55,086,128 15,174.11 440.08 137.30 12,635.23 1,892.78 68.73 10,961,664 3,019.52Lynden 3,583.51 46,778,571 13,053.84 48,412,571 13,509.82 1,284.68 184.11 11,328.81 686.40 25.82 6,183,824 1,725.63Burlington Edison 3,580.29 56,668,722 15,827.97 56,448,738 15,766.53 2,070.60 169.57 12,504.77 1,021.58 0.00 6,095,710 1,702.57Centralia 3,558.97 52,888,306 14,860.57 52,127,789 14,646.88 953.12 133.79 11,821.77 1,413.76 324.43 4,724,869 1,327.59Steilacoom Hist. 3,454.76 46,148,121 13,357.84 47,140,542 13,645.10 1,553.73 184.17 10,932.43 968.66 6.12 5,970,485 1,728.19Aberdeen 3,444.17 52,066,248 15,117.21 52,687,916 15,297.71 837.18 133.88 12,619.29 1,663.67 43.69 2,774,037 805.43Ridgefield 3,427.73 42,800,254 12,486.47 44,784,572 13,065.37 1,615.97 393.90 10,629.31 366.67 59.53 6,103,298 1,780.57Ellensburg 3,408.40 45,281,143 13,285.16 45,799,498 13,437.24 1,293.57 160.41 10,802.66 951.60 229.00 7,846,929 2,302.23Riverview 3,375.28 47,257,070 14,000.93 49,579,451 14,688.99 2,118.18 506.86 11,662.82 401.13 0.00 8,162,658 2,418.36Quillayute Valley 3,359.06 41,149,515 12,250.31 43,247,279 12,874.82 212.12 56.64 12,023.42 548.66 33.98 6,335,251 1,886.02Wapato 3,338.15 49,841,819 14,930.97 52,920,529 15,853.25 348.98 30.48 12,526.09 2,925.35 22.36 12,860,408 3,852.56East Valley (Yakima) 3,282.83 43,212,579 13,163.21 44,452,845 13,541.01 952.82 138.11 11,537.85 905.22 7.01 7,295,553 2,222.34Washougal 3,223.79 45,773,393 14,198.63 46,027,382 14,277.41 1,724.11 262.90 11,363.64 683.27 243.49 5,907,871 1,832.59Chehalis 3,170.22 44,692,368 14,097.56 45,608,412 14,386.51 1,332.93 140.73 11,520.39 1,048.43 344.04 5,103,476 1,609.82Quincy 3,024.49 46,913,332 15,511.15 46,057,336 15,228.13 2,169.70 86.29 11,535.94 1,434.10 2.10 5,004,518 1,654.67
30 114,458.40 1,625,029,118 14,197.55 1,662,548,981 14,525.36 1,383.33 225.97 11,807.93 995.08 113.05 239,533,405 2,092.762,000–2,999Tukwila 2,910.06 49,034,144 16,849.87 49,186,977 16,902.39 2,219.88 161.49 12,802.03 1,617.89 101.11 4,503,227 1,547.47Pullman 2,796.18 35,584,874 12,726.25 36,666,653 13,113.12 1,611.27 185.49 10,600.59 706.44 9.34 7,606,410 2,720.29Sequim 2,749.17 39,230,117 14,269.80 40,735,801 14,817.49 2,608.41 227.10 11,177.69 802.35 1.94 3,495,354 1,271.42Orting 2,747.99 35,063,593 12,759.72 37,077,306 13,492.52 1,185.64 199.27 11,494.41 557.30 55.90 6,800,145 2,474.59Anacortes 2,746.22 40,773,576 14,847.16 41,328,279 15,049.15 2,500.92 374.38 11,048.90 481.43 643.52 3,330,689 1,212.83Ephrata 2,665.52 35,173,057 13,195.57 37,094,365 13,916.37 564.21 131.68 12,306.75 910.25 3.47 9,049,026 3,394.84Clarkston 2,657.47 35,618,644 13,403.22 36,118,771 13,591.41 874.52 153.97 11,481.55 1,056.12 25.25 2,279,480 857.76Prosser 2,653.82 38,200,686 14,394.60 37,948,428 14,299.55 1,023.75 118.43 11,901.06 1,245.32 10.99 3,503,645 1,320.23Deer Park 2,568.41 31,318,634 12,193.78 33,524,348 13,052.57 652.75 130.84 11,373.68 704.68 190.62 5,715,307 2,225.23Lakewood 2,561.35 36,389,701 14,207.23 38,608,397 15,073.46 1,984.44 261.56 12,069.29 672.57 85.59 9,443,022 3,686.74Woodland 2,516.87 38,511,206 15,301.23 40,311,207 16,016.40 1,627.96 191.61 12,942.11 913.49 341.24 3,953,697 1,570.88Wahluke 2,447.84 38,679,318 15,801.41 39,642,402 16,194.85 580.22 90.96 12,973.43 2,465.01 85.24 4,464,850 1,824.00North Mason 2,387.96 35,378,101 14,815.20 36,729,199 15,380.99 1,743.87 309.59 11,934.49 1,310.16 82.89 3,105,610 1,300.53Blaine 2,288.46 35,375,109 15,458.04 36,050,312 15,753.09 2,405.39 177.79 12,155.37 969.69 44.85 3,273,003 1,430.22Rochester 2,218.62 31,580,920 14,234.49 32,066,105 14,453.18 1,178.34 163.87 12,179.46 821.47 110.04 4,997,357 2,252.46Granite Falls 2,134.65 32,263,167 15,114.03 32,775,809 15,354.18 1,732.80 230.47 12,511.80 758.90 120.21 674,328 315.90North Franklin 2,097.41 29,480,794 14,055.81 31,061,549 14,809.48 872.76 118.22 12,187.87 1,628.90 1.73 4,749,543 2,264.48Hockinson 2,025.99 25,843,206 12,755.84 26,012,690 12,839.50 1,229.34 302.21 10,904.35 403.20 0.39 3,056,716 1,508.75Sultan 2,005.42 31,089,466 15,502.72 30,949,821 15,433.09 1,320.93 122.51 12,971.29 1,018.35 0.00 2,275,023 1,134.44
19 47,179.41 674,588,312 14,298.36 693,888,418 14,707.44 1,484.48 192.49 11,925.20 1,000.69 104.58 86,276,433 1,828.69
7
Washington State School Districts, Charter Schools.and Tribal SchoolsGeneral Fund Expenditures, Revenues, and Ending Total Fund Balance Per Pupil by Enrollment Group
Fiscal Year 2019–20
Enrollment Expenditures Revenues Fund BalanceTotal Total Local Local Support Other Ending Total
Total Total Expenditures Total Revenues Tax Non-Tax State Federal Fin Srcs Ending Total Fund BalanceDistrict Name Enrollment Expenditures Per Pupil Revenues Per Pupil Per Pupil Per Pupil Per Pupil Per Pupil Per Pupil Fund Balance Per Pupil1,000-1,999Eatonville 1,981.46 25,633,334 12,936.59 27,199,147 13,726.82 1,665.47 213.96 11,292.93 553.45 1.01 4,499,838 2,270.97Nooksack Valley 1,945.29 27,850,003 14,316.63 29,087,190 14,952.62 944.37 127.76 12,293.10 1,326.95 260.44 4,736,832 2,435.03Medical Lake 1,894.97 25,759,949 13,593.86 26,903,235 14,197.18 536.17 227.53 11,532.24 1,878.96 22.28 4,146,955 2,188.40Mount Baker 1,843.06 31,542,035 17,113.95 31,271,903 16,967.38 2,091.66 269.38 12,851.32 1,559.09 195.94 2,880,162 1,562.71Meridian 1,828.24 24,646,101 13,480.78 24,808,962 13,569.86 1,578.54 144.85 11,074.57 696.93 74.96 2,795,710 1,529.18Colville 1,761.84 24,138,526 13,700.75 25,662,395 14,565.68 927.09 287.63 12,127.86 1,209.94 13.15 2,540,020 1,441.69Royal 1,745.96 24,523,670 14,045.95 25,663,949 14,699.05 703.07 384.22 12,339.37 1,272.39 0.00 4,476,526 2,563.93Mary M Knight 1,738.24 18,744,266 10,783.47 20,141,583 11,587.34 250.67 49.77 11,075.85 207.78 3.27 2,559,777 1,472.63Lacenter 1,683.46 22,250,471 13,217.11 22,528,243 13,382.11 1,179.50 218.58 11,466.94 496.20 20.89 3,149,924 1,871.10Hoquiam 1,633.55 23,600,836 14,447.57 25,503,460 15,612.29 887.45 207.71 12,521.40 1,504.66 491.07 6,926,853 4,240.37College Place 1,632.26 20,005,650 12,256.41 22,148,128 13,569.00 1,282.73 352.52 11,012.73 905.06 15.95 4,236,509 2,595.49Elma 1,609.18 24,301,327 15,101.68 24,556,712 15,260.39 1,266.42 130.99 12,644.50 1,002.96 215.52 5,259,705 3,268.56Cashmere 1,605.62 21,547,601 13,420.11 21,915,565 13,649.28 829.28 234.05 11,566.02 1,018.00 1.95 2,364,299 1,472.51Dieringer 1,565.49 24,739,021 15,802.73 26,026,744 16,625.30 2,731.90 273.64 12,835.41 349.61 434.74 4,569,408 2,918.84Vashon Island 1,513.75 23,897,137 15,786.71 24,121,853 15,935.16 2,570.16 529.34 11,369.06 587.30 879.30 1,809,088 1,195.10Riverside 1,479.08 20,491,058 13,853.92 21,120,167 14,279.26 1,240.34 229.15 11,824.77 971.73 13.26 3,139,199 2,122.40Granger 1,478.97 22,923,761 15,499.81 23,586,045 15,947.62 396.90 71.15 12,680.66 1,896.36 902.55 2,843,167 1,922.40Castle Rock 1,462.27 19,551,082 13,370.36 19,252,261 13,166.01 1,054.22 143.14 11,269.05 699.60 0.00 2,117,549 1,448.12Montesano 1,460.63 19,140,564 13,104.32 19,805,584 13,559.62 1,107.24 211.65 11,459.31 574.04 207.38 2,424,874 1,660.16Nine Mile Falls 1,440.97 19,012,441 13,194.20 19,733,901 13,694.87 1,248.73 310.12 11,164.72 961.40 9.90 2,276,840 1,580.07Kiona Benton 1,394.91 20,885,271 14,972.49 21,013,702 15,064.56 978.29 116.19 12,683.75 1,239.29 47.04 1,865,986 1,337.71Lake Chelan 1,390.52 21,212,439 15,255.04 21,526,477 15,480.88 2,467.54 205.08 11,512.69 1,024.29 271.29 2,746,926 1,975.47Tenino 1,334.45 17,653,684 13,229.18 19,088,623 14,304.49 1,743.15 224.63 11,467.47 869.24 0.00 2,822,371 2,115.01Cascade 1,325.90 19,098,162 14,403.92 19,136,135 14,432.56 2,440.88 144.49 10,758.96 1,041.31 46.91 769,785 580.58South Whidbey 1,304.04 19,931,047 15,284.08 21,317,795 16,347.50 2,570.76 487.61 12,552.65 736.48 0.00 3,682,009 2,823.54Zillah 1,296.99 17,039,588 13,137.79 18,106,358 13,960.29 640.26 287.19 11,529.34 1,272.19 231.30 4,544,256 3,503.69Naches Valley 1,286.24 17,428,710 13,550.12 18,267,956 14,202.60 1,678.86 144.92 11,510.17 868.65 0.00 2,682,514 2,085.55White Salmon 1,243.11 17,774,504 14,298.42 17,914,035 14,410.66 1,984.69 395.15 11,158.45 772.96 99.41 2,810,233 2,260.65Port Townsend 1,222.92 18,689,013 15,282.29 19,208,682 15,707.23 2,439.39 275.99 11,493.41 1,425.17 73.27 2,549,358 2,084.65Okanogan 1,175.68 15,756,097 13,401.69 16,201,123 13,780.21 496.01 84.04 12,004.56 1,167.87 27.74 3,586,053 3,050.19Newport 1,133.29 15,258,068 13,463.52 16,370,047 14,444.71 1,263.71 130.21 11,610.77 1,432.42 7.60 3,420,965 3,018.61Tonasket 1,131.31 15,900,077 14,054.57 16,575,840 14,651.90 719.01 155.07 12,032.41 1,545.67 199.73 2,135,222 1,887.39Highland 1,115.20 16,147,799 14,479.73 16,717,628 14,990.70 907.40 153.00 12,346.84 1,574.40 9.06 2,410,674 2,161.65Kettle Falls 1,055.84 14,209,721 13,458.21 14,941,081 14,150.89 795.13 280.99 12,071.30 1,002.33 1.14 2,087,564 1,977.16Coupeville 1,045.52 15,337,721 14,669.94 15,979,954 15,284.22 2,346.09 275.84 11,762.39 722.19 177.72 918,526 878.53Ocean Beach 1,043.39 16,988,623 16,282.14 16,688,666 15,994.66 2,557.94 222.84 12,284.83 892.41 36.64 1,321,403 1,266.45Kalama 1,041.51 13,789,570 13,239.98 13,978,995 13,421.85 2,061.19 149.17 10,821.84 339.67 49.99 3,205,810 3,078.04
37 53,845.11 757,398,925 14,066.25 784,070,123 14,561.58 1,387.98 225.92 11,790.36 1,017.16 140.17 113,312,890 2,104.42500–999Brewster 987.27 13,612,868 13,788.39 14,226,808 14,410.25 695.76 131.42 11,883.20 1,566.13 133.74 4,893,446 4,956.54Valley 979.05 12,612,498 12,882.38 13,954,513 14,253.12 152.44 114.52 12,596.43 538.13 851.59 2,854,731 2,915.82Cle Elum-Roslyn 921.37 12,199,959 13,241.11 12,839,121 13,934.82 2,502.50 247.10 10,417.61 767.60 0.00 3,082,530 3,345.59Freeman 914.52 11,901,632 13,014.07 12,475,217 13,641.27 1,166.23 675.42 11,149.76 589.11 60.76 1,400,456 1,531.36
8
Washington State School Districts, Charter Schools.and Tribal SchoolsGeneral Fund Expenditures, Revenues, and Ending Total Fund Balance Per Pupil by Enrollment Group
Fiscal Year 2019–20
Enrollment Expenditures Revenues Fund BalanceTotal Total Local Local Support Other Ending Total
Total Total Expenditures Total Revenues Tax Non-Tax State Federal Fin Srcs Ending Total Fund BalanceDistrict Name Enrollment Expenditures Per Pupil Revenues Per Pupil Per Pupil Per Pupil Per Pupil Per Pupil Per Pupil Fund Balance Per Pupil500–999 (cont.)Warden 910.98 13,693,101 15,031.18 14,038,270 15,410.07 937.20 77.92 12,443.55 1,944.73 6.67 3,114,572 3,418.92Goldendale 905.56 13,239,204 14,619.91 14,009,343 15,470.36 2,019.67 270.48 11,063.74 1,222.59 893.88 1,930,064 2,131.35Rainier 904.52 11,549,807 12,768.99 12,817,982 14,171.03 1,359.07 230.52 11,927.43 648.22 5.79 3,323,473 3,674.30Stevenson-Carson 895.29 13,507,206 15,086.96 14,744,199 16,468.63 1,877.30 223.02 11,422.08 2,033.88 912.36 2,727,678 3,046.70Mount Adams 886.18 16,052,562 18,114.34 17,895,198 20,193.64 284.10 138.29 13,815.41 5,550.73 405.10 3,118,026 3,518.50Finley 874.54 13,320,852 15,231.84 13,479,826 15,413.62 1,066.37 165.71 12,795.39 1,385.85 0.29 962,490 1,100.57Mabton 865.25 12,884,995 14,891.64 13,262,957 15,328.47 385.96 298.07 12,716.55 1,916.34 11.56 1,801,746 2,082.34Napavine 843.54 10,451,429 12,389.96 11,249,301 13,335.82 827.97 101.53 11,489.26 852.90 64.17 2,624,773 3,111.62Toledo 839.34 11,362,085 13,536.93 11,909,019 14,188.55 1,047.35 98.56 11,468.45 871.27 702.92 1,347,234 1,605.11Onalaska 832.61 11,573,359 13,900.10 12,008,231 14,422.40 1,042.60 227.16 11,903.89 1,153.53 95.20 1,737,149 2,086.39Chimacum 821.16 13,798,099 16,803.18 13,942,625 16,979.18 2,758.12 227.79 12,612.29 1,094.43 286.55 2,579,379 3,141.14San Juan 810.23 12,536,908 15,473.27 13,125,746 16,200.02 2,414.85 535.55 11,512.01 618.91 1,118.71 1,732,863 2,138.73Orcas 803.51 11,975,214 14,903.63 12,324,701 15,338.58 2,539.06 423.95 11,399.58 885.31 90.69 2,641,926 3,287.98Bridgeport 793.97 11,660,592 14,686.44 11,812,813 14,878.16 337.58 25.47 12,838.08 1,677.03 0.00 1,015,278 1,278.74Chewelah 787.45 10,705,665 13,595.36 11,318,884 14,374.10 1,154.45 156.99 11,571.99 1,434.77 55.90 1,588,183 2,016.87Columbia (Walla Walla) 777.50 11,432,818 14,704.59 12,305,178 15,826.60 1,985.41 458.93 12,300.68 1,033.81 47.77 2,231,098 2,869.58Pioneer 772.01 12,548,499 16,254.32 12,598,112 16,318.59 3,171.85 117.21 11,422.15 1,212.53 394.86 3,048,180 3,948.37Grand Coulee Dam 734.63 11,589,277 15,775.67 11,745,343 15,988.11 657.80 215.70 12,151.87 2,938.22 24.52 1,694,166 2,306.15North Beach 715.97 11,883,884 16,598.30 11,837,533 16,533.56 2,514.21 252.26 12,215.19 1,461.72 90.17 2,031,546 2,837.47Methow Valley 695.56 10,501,119 15,097.36 10,860,955 15,614.69 2,482.79 354.36 11,494.88 928.99 353.67 1,395,783 2,006.70Winlock 694.97 10,469,557 15,064.76 11,131,215 16,016.83 857.32 102.27 12,974.72 1,903.16 179.35 1,842,421 2,651.08Toutle Lake 686.35 9,899,218 14,422.99 9,985,969 14,549.38 1,413.69 156.77 12,057.49 471.07 450.36 1,579,401 2,301.16Kittitas 678.44 9,831,781 14,491.75 9,561,505 14,093.37 2,057.63 314.71 10,938.67 779.88 2.48 458,317 675.55Reardan 655.72 8,680,828 13,238.62 9,392,267 14,323.59 1,480.54 286.12 11,707.81 808.74 40.38 2,497,583 3,808.92Adna 651.36 8,604,188 13,209.57 9,085,648 13,948.73 1,077.47 222.52 11,697.80 929.48 21.47 2,507,242 3,849.24Quilcene 651.32 8,359,034 12,833.99 9,041,437 13,881.71 895.50 54.99 12,234.23 598.09 98.90 2,193,722 3,368.12Griffin 643.38 9,644,066 14,989.69 9,587,085 14,901.12 3,039.28 359.53 10,889.00 611.39 1.93 2,840,875 4,415.55Manson 639.54 10,284,466 16,081.04 10,744,287 16,800.02 2,208.40 285.78 12,577.87 1,585.90 142.07 1,094,083 1,710.73Ocosta 632.85 10,130,999 16,008.53 11,261,504 17,794.90 2,676.58 123.00 12,840.56 2,154.76 0.00 3,094,227 4,889.35Union Gap 624.61 8,443,010 13,517.25 9,239,660 14,792.69 1,349.70 227.05 11,408.30 1,788.30 19.33 4,079,931 6,531.97Asotin-Anatone 621.96 8,304,337 13,351.88 8,862,356 14,249.08 996.66 273.29 12,251.23 724.34 3.55 2,559,894 4,115.85La Conner 620.70 12,763,283 20,562.72 13,062,241 21,044.37 1,438.31 1,331.23 13,272.49 4,868.42 133.92 1,665,496 2,683.25Mossyrock 574.77 8,469,914 14,736.18 8,977,495 15,619.28 1,274.77 502.85 12,133.84 1,693.17 14.65 1,858,731 3,233.87South Bend 570.19 10,136,950 17,778.20 10,285,742 18,039.15 847.74 495.12 14,931.19 1,575.32 189.79 1,528,799 2,681.21Oroville 567.82 8,717,347 15,352.31 9,057,079 15,950.62 1,457.82 196.40 11,995.93 2,037.61 262.85 1,941,642 3,419.47Pride Prep Charter 564.77 7,640,639 13,528.76 7,035,000 12,456.40 0.00 620.34 10,330.97 708.30 796.78 181,143 320.74Davenport 563.72 8,466,780 15,019.48 8,719,258 15,467.36 1,077.52 277.88 12,861.27 1,222.50 28.19 929,658 1,649.15Soap Lake 558.45 8,175,314 14,639.30 8,570,714 15,347.33 826.99 151.45 12,907.86 1,458.40 2.63 1,663,121 2,978.10Colfax 555.62 7,958,726 14,324.05 7,930,798 14,273.78 1,290.06 267.20 11,830.35 871.00 15.17 1,283,066 2,309.25Raymond 554.32 8,818,285 15,908.29 9,117,380 16,447.86 1,037.96 376.10 13,598.70 1,304.53 130.57 1,797,467 3,242.65Liberty 552.30 7,692,628 13,928.35 8,306,773 15,040.33 2,034.08 244.28 11,933.75 828.22 0.00 1,693,731 3,066.69Chief Leschi Tribal 543.18 5,609,512 10,327.17 5,609,512 10,327.17 0.00 0.00 10,327.17 0.00 0.00 0.00 0.00Muckleshoot Tribal 531.62 6,687,403 12,579.29 6,558,318 12,336.48 0.00 0.00 12,239.39 97.09 0.00 364,534 685.70
9
Washington State School Districts, Charter Schools.and Tribal SchoolsGeneral Fund Expenditures, Revenues, and Ending Total Fund Balance Per Pupil by Enrollment Group
Fiscal Year 2019–20
Enrollment Expenditures Revenues Fund BalanceTotal Total Local Local Support Other Ending Total
Total Total Expenditures Total Revenues Tax Non-Tax State Federal Fin Srcs Ending Total Fund BalanceDistrict Name Enrollment Expenditures Per Pupil Revenues Per Pupil Per Pupil Per Pupil Per Pupil Per Pupil Per Pupil Fund Balance Per Pupil500–999 (cont.)Cape Flattery 528.93 11,449,294 21,646.14 12,666,083 23,946.62 485.16 297.14 16,070.88 7,093.44 0.00 5,881,731 11,120.05Concrete 516.16 9,254,281 17,929.09 9,863,747 19,109.86 2,301.25 191.66 14,790.63 1,707.78 118.54 2,239,641 4,339.04Wahkiakum 505.21 7,448,271 14,742.92 7,737,732 15,315.87 1,791.22 179.04 12,560.24 742.12 43.25 1,425,101 2,820.81
50 35,760.27 528,533,745 14,779.91 552,172,681 15,440.95 1,390.36 261.07 12,139.81 1,445.36 204.35 104,078,325 2,910.45100–499Mary Walker 473.35 7,009,111 14,807.46 7,107,639 15,015.61 602.41 174.53 12,614.46 1,386.63 237.58 342,642 723.87Conway 464.67 6,523,890 14,039.84 6,756,400 14,540.21 1,910.44 285.14 11,431.03 768.45 145.14 1,678,105 3,611.39Spokane Int'l Charter 459.01 10,063,654 21,924.70 10,138,652 22,088.08 0.00 6,969.76 10,750.04 866.20 3,502.08 796,816 1,735.94Wellpinit 447.15 9,916,017 22,176.04 10,474,362 23,424.72 109.76 519.13 14,346.09 8,064.79 384.94 4,481,501 10,022.37Lummi Tribal 433.72 6,229,596 14,363.18 6,229,596 14,363.18 0.00 0.00 13,403.55 959.63 0.00 0.00 0.00Summit Atlas Charter 429.41 6,613,424 15,401.19 6,869,965 15,998.61 0.00 69.35 12,187.27 1,240.44 2,501.56 658,711 1,533.99Darrington 423.55 6,873,801 16,229.02 7,120,496 16,811.47 1,253.55 144.96 14,138.27 1,269.73 4.96 1,112,258 2,626.04Naselle Grays Riv 399.80 6,915,039 17,296.25 7,375,932 18,449.05 1,162.81 163.97 15,033.42 2,056.95 31.90 2,170,696 5,429.45Dayton 394.70 6,764,169 17,137.49 6,979,782 17,683.76 2,533.13 574.30 13,452.62 1,113.44 10.28 641,949 1,626.42White Pass 373.62 6,563,410 17,567.07 6,765,638 18,108.34 2,699.03 313.12 13,207.05 1,705.46 183.68 1,485,750 3,976.63Crescent 368.84 5,165,541 14,004.83 5,688,598 15,422.94 1,415.67 163.33 12,686.25 1,142.61 15.08 2,353,893 6,381.88Morton 354.31 5,667,861 15,996.90 6,050,135 17,075.82 1,994.55 144.50 13,479.05 1,274.28 183.45 1,216,451 3,433.30Willapa Valley 351.71 6,493,901 18,463.79 6,588,099 18,731.62 1,834.48 409.15 15,427.03 791.78 269.18 1,687,782 4,798.79Ritzville 350.89 5,287,757 15,069.56 5,335,711 15,206.22 1,846.36 400.03 12,018.43 847.71 93.70 274,708 782.89Rainier Prep Charter 345.20 4,125,502 11,951.05 4,857,580 14,071.78 0.00 1,279.95 11,719.83 985.10 86.91 2,769,106 8,021.74Republic 339.03 5,988,204 17,662.75 6,083,522 17,943.90 1,333.72 26.19 14,555.73 1,788.98 239.28 436,580 1,287.73Mc Cleary 329.32 5,287,937 16,057.14 5,396,974 16,388.24 1,879.02 203.08 13,018.26 1,287.87 0.00 810,523 2,461.20Summit Sierra Charter 323.18 5,257,101 16,266.79 5,412,643 16,748.07 0.00 88.91 11,422.30 1,144.24 4,092.63 920,936 2,849.61Hood Canal 319.46 7,110,211 22,256.97 6,844,802 21,426.16 3,529.76 206.31 13,702.04 3,962.84 25.22 1,938,163 6,067.00Pomeroy 316.67 5,291,916 16,711.14 5,681,993 17,942.95 2,555.62 407.50 13,669.43 1,310.39 0.00 1,425,329 4,500.99Entiat 312.91 5,401,312 17,261.55 5,746,426 18,364.47 1,531.59 150.89 15,119.32 1,548.92 13.75 1,679,475 5,367.28Pateros 310.86 5,598,396 18,009.38 5,420,877 17,438.32 1,041.46 250.72 14,527.38 1,618.76 0.00 343,034 1,103.50Oakville 288.56 4,786,452 16,587.37 6,012,738 20,837.04 1,196.52 452.21 14,763.74 4,424.58 0.00 2,470,396 8,561.12Selkirk 274.10 4,858,144 17,723.98 5,066,343 18,483.56 1,965.25 332.91 14,444.19 1,741.03 0.18 1,005,774 3,669.37Waitsburg 272.90 4,445,522 16,289.93 4,393,643 16,099.83 1,389.37 235.89 13,626.46 735.31 112.81 829,318 3,038.91Impact Charter 271.81 3,974,131 14,620.99 4,273,483 15,722.32 0.00 515.22 13,353.59 1,853.51 0.00 838,627 3,085.34Pe Ell 267.86 5,207,520 19,441.20 5,332,268 19,906.92 1,277.04 303.70 16,826.23 1,370.87 129.08 2,257,984 8,429.72Waterville 261.20 4,910,313 18,799.06 4,790,637 18,340.88 1,311.97 253.35 15,114.45 1,238.80 422.31 857,551 3,283.12Prescott 253.95 4,446,299 17,508.56 4,993,910 19,664.94 2,374.01 209.26 15,945.73 1,135.94 0.00 2,324,384 9,152.92Cusick 250.99 4,566,459 18,193.79 4,806,114 19,148.63 1,705.37 265.48 14,356.91 2,785.33 35.54 1,429,657 5,696.07Curlew 249.31 3,800,387 15,243.62 4,319,530 17,325.94 705.74 102.66 14,219.68 1,346.11 951.76 1,335,210 5,355.62Lopez 243.59 5,347,029 21,950.94 5,085,223 20,876.16 2,474.84 384.59 17,019.55 890.68 106.51 499,465 2,050.43Lyle 242.80 4,000,183 16,475.22 4,541,558 18,704.94 2,432.85 109.34 14,839.43 1,278.08 45.24 1,347,414 5,549.48Green Dot Seattle Charter 237.78 7,495,235 31,521.72 7,521,863 31,633.71 0.00 329.64 16,772.80 3,237.19 11,294.07 44,277 186.21Odessa 230.78 4,294,484 18,608.56 4,431,599 19,202.70 1,696.66 305.87 16,089.04 1,111.13 0.00 1,302,089 5,642.12Thorp 230.18 4,122,791 17,911.16 4,239,077 18,416.36 1,939.43 383.30 15,247.60 846.03 0.00 572,254 2,486.11Loon Lake 228.78 2,706,697 11,831.01 2,737,385 11,965.14 1,082.77 51.29 9,548.10 1,282.99 0.00 591,122 2,583.80
10
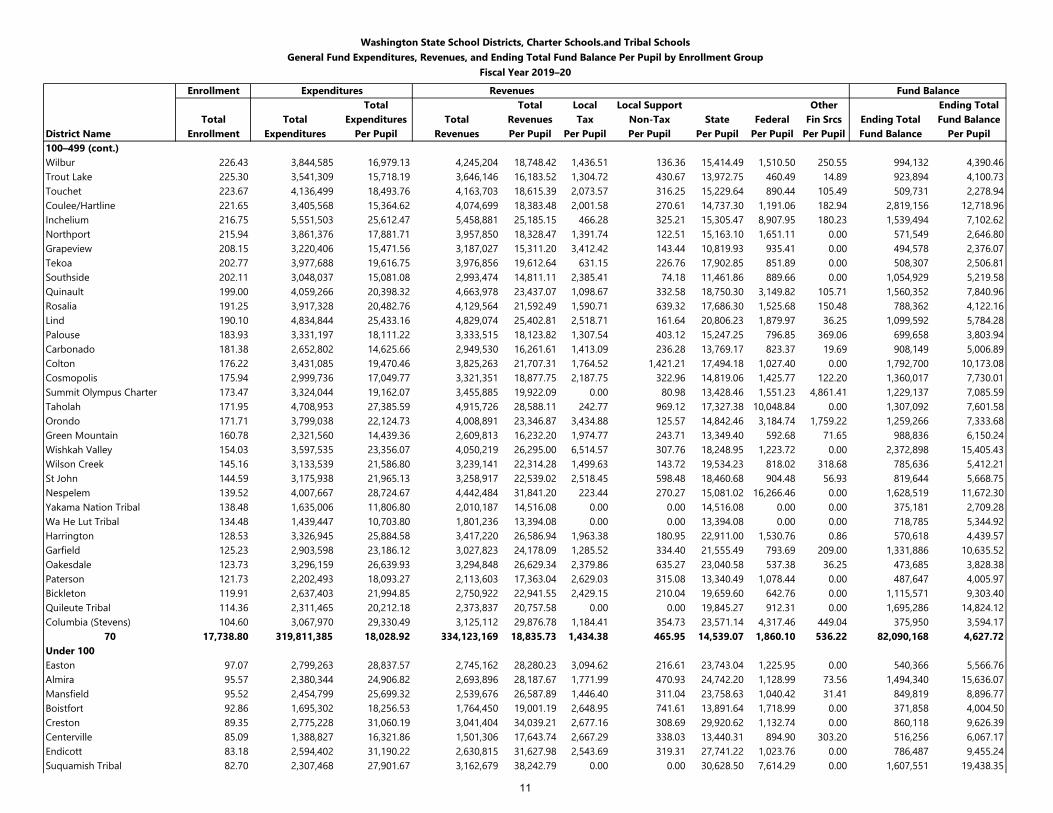
Washington State School Districts, Charter Schools.and Tribal SchoolsGeneral Fund Expenditures, Revenues, and Ending Total Fund Balance Per Pupil by Enrollment Group
Fiscal Year 2019–20
Enrollment Expenditures Revenues Fund BalanceTotal Total Local Local Support Other Ending Total
Total Total Expenditures Total Revenues Tax Non-Tax State Federal Fin Srcs Ending Total Fund BalanceDistrict Name Enrollment Expenditures Per Pupil Revenues Per Pupil Per Pupil Per Pupil Per Pupil Per Pupil Per Pupil Fund Balance Per Pupil100–499 (cont.)Wilbur 226.43 3,844,585 16,979.13 4,245,204 18,748.42 1,436.51 136.36 15,414.49 1,510.50 250.55 994,132 4,390.46Trout Lake 225.30 3,541,309 15,718.19 3,646,146 16,183.52 1,304.72 430.67 13,972.75 460.49 14.89 923,894 4,100.73Touchet 223.67 4,136,499 18,493.76 4,163,703 18,615.39 2,073.57 316.25 15,229.64 890.44 105.49 509,731 2,278.94Coulee/Hartline 221.65 3,405,568 15,364.62 4,074,699 18,383.48 2,001.58 270.61 14,737.30 1,191.06 182.94 2,819,156 12,718.96Inchelium 216.75 5,551,503 25,612.47 5,458,881 25,185.15 466.28 325.21 15,305.47 8,907.95 180.23 1,539,494 7,102.62Northport 215.94 3,861,376 17,881.71 3,957,850 18,328.47 1,391.74 122.51 15,163.10 1,651.11 0.00 571,549 2,646.80Grapeview 208.15 3,220,406 15,471.56 3,187,027 15,311.20 3,412.42 143.44 10,819.93 935.41 0.00 494,578 2,376.07Tekoa 202.77 3,977,688 19,616.75 3,976,856 19,612.64 631.15 226.76 17,902.85 851.89 0.00 508,307 2,506.81Southside 202.11 3,048,037 15,081.08 2,993,474 14,811.11 2,385.41 74.18 11,461.86 889.66 0.00 1,054,929 5,219.58Quinault 199.00 4,059,266 20,398.32 4,663,978 23,437.07 1,098.67 332.58 18,750.30 3,149.82 105.71 1,560,352 7,840.96Rosalia 191.25 3,917,328 20,482.76 4,129,564 21,592.49 1,590.71 639.32 17,686.30 1,525.68 150.48 788,362 4,122.16Lind 190.10 4,834,844 25,433.16 4,829,074 25,402.81 2,518.71 161.64 20,806.23 1,879.97 36.25 1,099,592 5,784.28Palouse 183.93 3,331,197 18,111.22 3,333,515 18,123.82 1,307.54 403.12 15,247.25 796.85 369.06 699,658 3,803.94Carbonado 181.38 2,652,802 14,625.66 2,949,530 16,261.61 1,413.09 236.28 13,769.17 823.37 19.69 908,149 5,006.89Colton 176.22 3,431,085 19,470.46 3,825,263 21,707.31 1,764.52 1,421.21 17,494.18 1,027.40 0.00 1,792,700 10,173.08Cosmopolis 175.94 2,999,736 17,049.77 3,321,351 18,877.75 2,187.75 322.96 14,819.06 1,425.77 122.20 1,360,017 7,730.01Summit Olympus Charter 173.47 3,324,044 19,162.07 3,455,885 19,922.09 0.00 80.98 13,428.46 1,551.23 4,861.41 1,229,137 7,085.59Taholah 171.95 4,708,953 27,385.59 4,915,726 28,588.11 242.77 969.12 17,327.38 10,048.84 0.00 1,307,092 7,601.58Orondo 171.71 3,799,038 22,124.73 4,008,891 23,346.87 3,434.88 125.57 14,842.46 3,184.74 1,759.22 1,259,266 7,333.68Green Mountain 160.78 2,321,560 14,439.36 2,609,813 16,232.20 1,974.77 243.71 13,349.40 592.68 71.65 988,836 6,150.24Wishkah Valley 154.03 3,597,535 23,356.07 4,050,219 26,295.00 6,514.57 307.76 18,248.95 1,223.72 0.00 2,372,898 15,405.43Wilson Creek 145.16 3,133,539 21,586.80 3,239,141 22,314.28 1,499.63 143.72 19,534.23 818.02 318.68 785,636 5,412.21St John 144.59 3,175,938 21,965.13 3,258,917 22,539.02 2,518.45 598.48 18,460.68 904.48 56.93 819,644 5,668.75Nespelem 139.52 4,007,667 28,724.67 4,442,484 31,841.20 223.44 270.27 15,081.02 16,266.46 0.00 1,628,519 11,672.30Yakama Nation Tribal 138.48 1,635,006 11,806.80 2,010,187 14,516.08 0.00 0.00 14,516.08 0.00 0.00 375,181 2,709.28Wa He Lut Tribal 134.48 1,439,447 10,703.80 1,801,236 13,394.08 0.00 0.00 13,394.08 0.00 0.00 718,785 5,344.92Harrington 128.53 3,326,945 25,884.58 3,417,220 26,586.94 1,963.38 180.95 22,911.00 1,530.76 0.86 570,618 4,439.57Garfield 125.23 2,903,598 23,186.12 3,027,823 24,178.09 1,285.52 334.40 21,555.49 793.69 209.00 1,331,886 10,635.52Oakesdale 123.73 3,296,159 26,639.93 3,294,848 26,629.34 2,379.86 635.27 23,040.58 537.38 36.25 473,685 3,828.38Paterson 121.73 2,202,493 18,093.27 2,113,603 17,363.04 2,629.03 315.08 13,340.49 1,078.44 0.00 487,647 4,005.97Bickleton 119.91 2,637,403 21,994.85 2,750,922 22,941.55 2,429.15 210.04 19,659.60 642.76 0.00 1,115,571 9,303.40Quileute Tribal 114.36 2,311,465 20,212.18 2,373,837 20,757.58 0.00 0.00 19,845.27 912.31 0.00 1,695,286 14,824.12Columbia (Stevens) 104.60 3,067,970 29,330.49 3,125,112 29,876.78 1,184.41 354.73 23,571.14 4,317.46 449.04 375,950 3,594.17
70 17,738.80 319,811,385 18,028.92 334,123,169 18,835.73 1,434.38 465.95 14,539.07 1,860.10 536.22 82,090,168 4,627.72Under 100Easton 97.07 2,799,263 28,837.57 2,745,162 28,280.23 3,094.62 216.61 23,743.04 1,225.95 0.00 540,366 5,566.76Almira 95.57 2,380,344 24,906.82 2,693,896 28,187.67 1,771.99 470.93 24,742.20 1,128.99 73.56 1,494,340 15,636.07Mansfield 95.52 2,454,799 25,699.32 2,539,676 26,587.89 1,446.40 311.04 23,758.63 1,040.42 31.41 849,819 8,896.77Boistfort 92.86 1,695,302 18,256.53 1,764,450 19,001.19 2,648.95 741.61 13,891.64 1,718.99 0.00 371,858 4,004.50Creston 89.35 2,775,228 31,060.19 3,041,404 34,039.21 2,677.16 308.69 29,920.62 1,132.74 0.00 860,118 9,626.39Centerville 85.09 1,388,827 16,321.86 1,501,306 17,643.74 2,667.29 338.03 13,440.31 894.90 303.20 516,256 6,067.17Endicott 83.18 2,594,402 31,190.22 2,630,815 31,627.98 2,543.69 319.31 27,741.22 1,023.76 0.00 786,487 9,455.24Suquamish Tribal 82.70 2,307,468 27,901.67 3,162,679 38,242.79 0.00 0.00 30,628.50 7,614.29 0.00 1,607,551 19,438.35
11
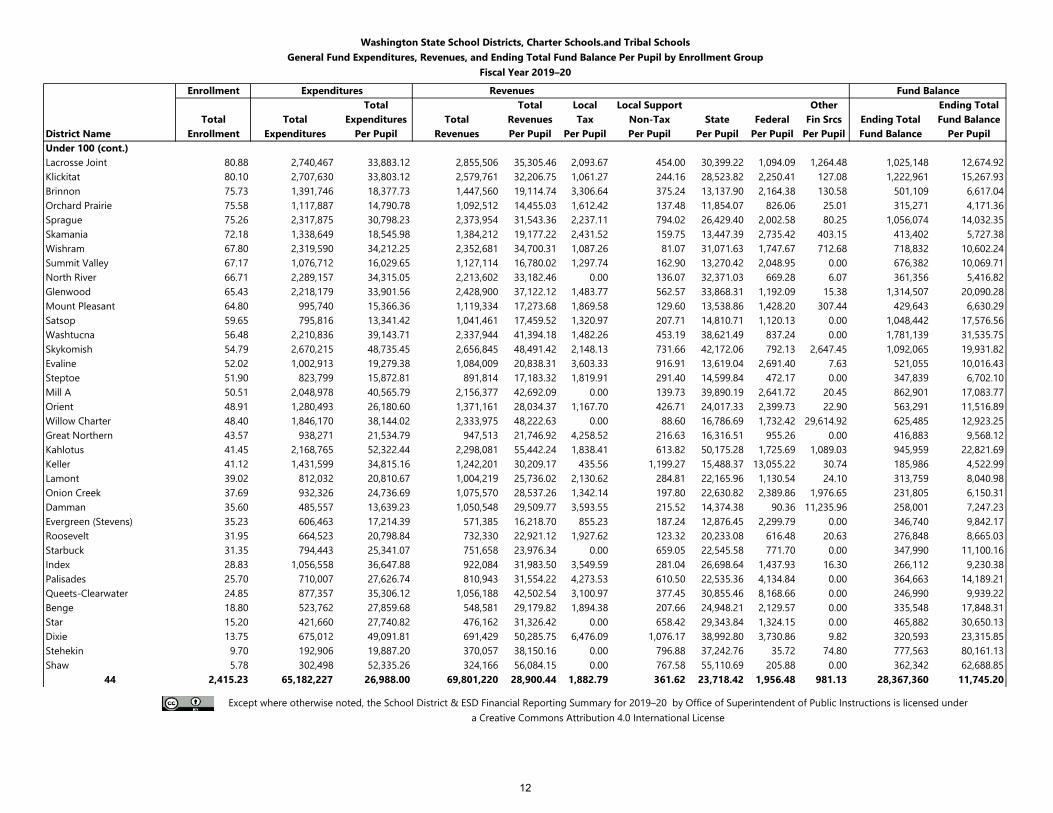
Washington State School Districts, Charter Schools.and Tribal SchoolsGeneral Fund Expenditures, Revenues, and Ending Total Fund Balance Per Pupil by Enrollment Group
Fiscal Year 2019–20
Enrollment Expenditures Revenues Fund BalanceTotal Total Local Local Support Other Ending Total
Total Total Expenditures Total Revenues Tax Non-Tax State Federal Fin Srcs Ending Total Fund BalanceDistrict Name Enrollment Expenditures Per Pupil Revenues Per Pupil Per Pupil Per Pupil Per Pupil Per Pupil Per Pupil Fund Balance Per PupilUnder 100 (cont.)Lacrosse Joint 80.88 2,740,467 33,883.12 2,855,506 35,305.46 2,093.67 454.00 30,399.22 1,094.09 1,264.48 1,025,148 12,674.92Klickitat 80.10 2,707,630 33,803.12 2,579,761 32,206.75 1,061.27 244.16 28,523.82 2,250.41 127.08 1,222,961 15,267.93Brinnon 75.73 1,391,746 18,377.73 1,447,560 19,114.74 3,306.64 375.24 13,137.90 2,164.38 130.58 501,109 6,617.04Orchard Prairie 75.58 1,117,887 14,790.78 1,092,512 14,455.03 1,612.42 137.48 11,854.07 826.06 25.01 315,271 4,171.36Sprague 75.26 2,317,875 30,798.23 2,373,954 31,543.36 2,237.11 794.02 26,429.40 2,002.58 80.25 1,056,074 14,032.35Skamania 72.18 1,338,649 18,545.98 1,384,212 19,177.22 2,431.52 159.75 13,447.39 2,735.42 403.15 413,402 5,727.38Wishram 67.80 2,319,590 34,212.25 2,352,681 34,700.31 1,087.26 81.07 31,071.63 1,747.67 712.68 718,832 10,602.24Summit Valley 67.17 1,076,712 16,029.65 1,127,114 16,780.02 1,297.74 162.90 13,270.42 2,048.95 0.00 676,382 10,069.71North River 66.71 2,289,157 34,315.05 2,213,602 33,182.46 0.00 136.07 32,371.03 669.28 6.07 361,356 5,416.82Glenwood 65.43 2,218,179 33,901.56 2,428,900 37,122.12 1,483.77 562.57 33,868.31 1,192.09 15.38 1,314,507 20,090.28Mount Pleasant 64.80 995,740 15,366.36 1,119,334 17,273.68 1,869.58 129.60 13,538.86 1,428.20 307.44 429,643 6,630.29Satsop 59.65 795,816 13,341.42 1,041,461 17,459.52 1,320.97 207.71 14,810.71 1,120.13 0.00 1,048,442 17,576.56Washtucna 56.48 2,210,836 39,143.71 2,337,944 41,394.18 1,482.26 453.19 38,621.49 837.24 0.00 1,781,139 31,535.75Skykomish 54.79 2,670,215 48,735.45 2,656,845 48,491.42 2,148.13 731.66 42,172.06 792.13 2,647.45 1,092,065 19,931.82Evaline 52.02 1,002,913 19,279.38 1,084,009 20,838.31 3,603.33 916.91 13,619.04 2,691.40 7.63 521,055 10,016.43Steptoe 51.90 823,799 15,872.81 891,814 17,183.32 1,819.91 291.40 14,599.84 472.17 0.00 347,839 6,702.10Mill A 50.51 2,048,978 40,565.79 2,156,377 42,692.09 0.00 139.73 39,890.19 2,641.72 20.45 862,901 17,083.77Orient 48.91 1,280,493 26,180.60 1,371,161 28,034.37 1,167.70 426.71 24,017.33 2,399.73 22.90 563,291 11,516.89Willow Charter 48.40 1,846,170 38,144.02 2,333,975 48,222.63 0.00 88.60 16,786.69 1,732.42 29,614.92 625,485 12,923.25Great Northern 43.57 938,271 21,534.79 947,513 21,746.92 4,258.52 216.63 16,316.51 955.26 0.00 416,883 9,568.12Kahlotus 41.45 2,168,765 52,322.44 2,298,081 55,442.24 1,838.41 613.82 50,175.28 1,725.69 1,089.03 945,959 22,821.69Keller 41.12 1,431,599 34,815.16 1,242,201 30,209.17 435.56 1,199.27 15,488.37 13,055.22 30.74 185,986 4,522.99Lamont 39.02 812,032 20,810.67 1,004,219 25,736.02 2,130.62 284.81 22,165.96 1,130.54 24.10 313,759 8,040.98Onion Creek 37.69 932,326 24,736.69 1,075,570 28,537.26 1,342.14 197.80 22,630.82 2,389.86 1,976.65 231,805 6,150.31Damman 35.60 485,557 13,639.23 1,050,548 29,509.77 3,593.55 215.52 14,374.38 90.36 11,235.96 258,001 7,247.23Evergreen (Stevens) 35.23 606,463 17,214.39 571,385 16,218.70 855.23 187.24 12,876.45 2,299.79 0.00 346,740 9,842.17Roosevelt 31.95 664,523 20,798.84 732,330 22,921.12 1,927.62 123.32 20,233.08 616.48 20.63 276,848 8,665.03Starbuck 31.35 794,443 25,341.07 751,658 23,976.34 0.00 659.05 22,545.58 771.70 0.00 347,990 11,100.16Index 28.83 1,056,558 36,647.88 922,084 31,983.50 3,549.59 281.04 26,698.64 1,437.93 16.30 266,112 9,230.38Palisades 25.70 710,007 27,626.74 810,943 31,554.22 4,273.53 610.50 22,535.36 4,134.84 0.00 364,663 14,189.21Queets-Clearwater 24.85 877,357 35,306.12 1,056,188 42,502.54 3,100.97 377.45 30,855.46 8,168.66 0.00 246,990 9,939.22Benge 18.80 523,762 27,859.68 548,581 29,179.82 1,894.38 207.66 24,948.21 2,129.57 0.00 335,548 17,848.31Star 15.20 421,660 27,740.82 476,162 31,326.42 0.00 658.42 29,343.84 1,324.15 0.00 465,882 30,650.13Dixie 13.75 675,012 49,091.81 691,429 50,285.75 6,476.09 1,076.17 38,992.80 3,730.86 9.82 320,593 23,315.85Stehekin 9.70 192,906 19,887.20 370,057 38,150.16 0.00 796.88 37,242.76 35.72 74.80 777,563 80,161.13Shaw 5.78 302,498 52,335.26 324,166 56,084.15 0.00 767.58 55,110.69 205.88 0.00 362,342 62,688.85
44 2,415.23 65,182,227 26,988.00 69,801,220 28,900.44 1,882.79 361.62 23,718.42 1,956.48 981.13 28,367,360 11,745.20
Except where otherwise noted, the School District & ESD Financial Reporting Summary for 2019–20 by Office of Superintendent of Public Instructions is licensed under a Creative Commons Attribution 4.0 International License
12
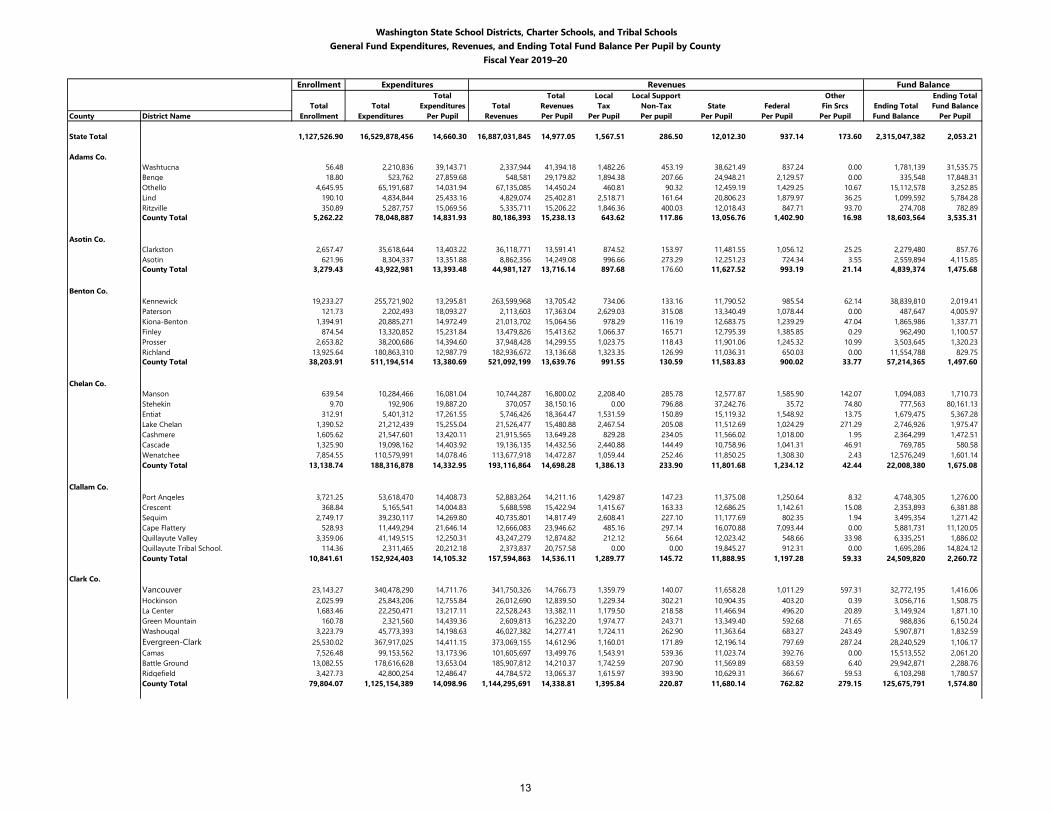
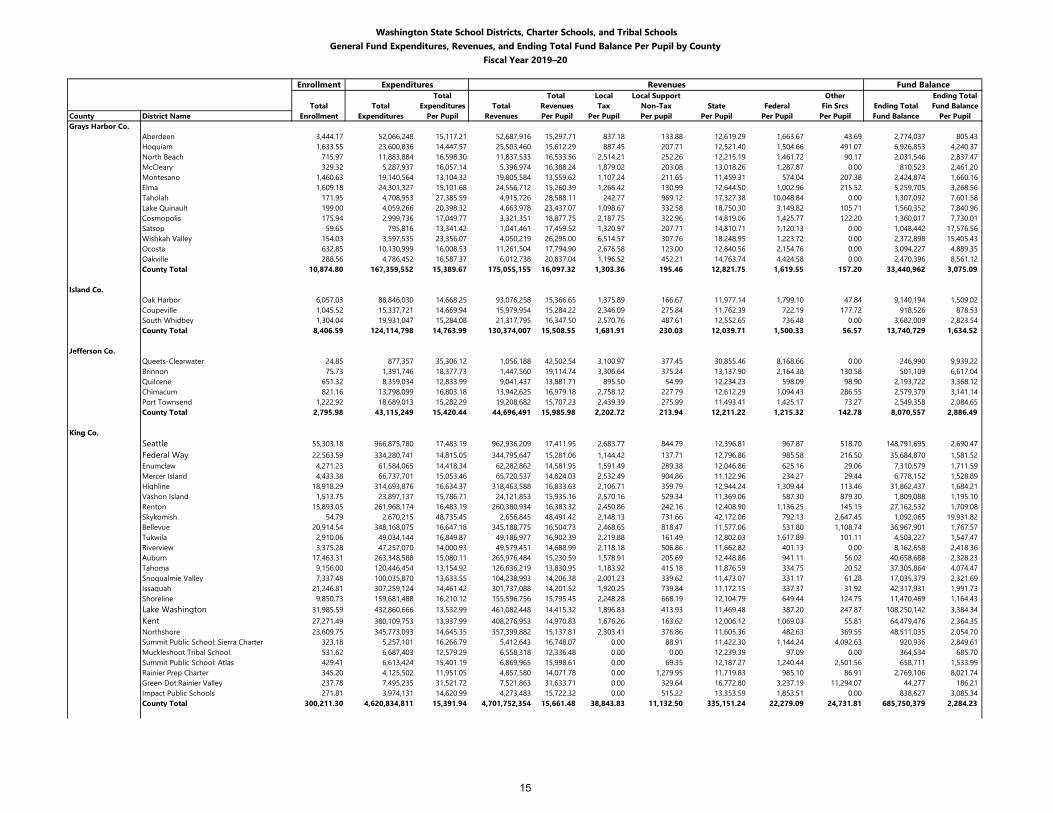
Washington State School Districts, Charter Schools, and Tribal SchoolsGeneral Fund Expenditures, Revenues, and Ending Total Fund Balance Per Pupil by County
Fiscal Year 2019–20
Enrollment Expenditures Revenues Fund BalanceTotal Total Local Local Support Other Ending Total
Total Total Expenditures Total Revenues Tax Non-Tax State Federal Fin Srcs Ending Total Fund BalanceCounty District Name Enrollment Expenditures Per Pupil Revenues Per Pupil Per Pupil Per pupil Per Pupil Per Pupil Per Pupil Fund Balance Per Pupil
State Total 1,127,526.90 16,529,878,456 14,660.30 16,887,031,845 14,977.05 1,567.51 286.50 12,012.30 937.14 173.60 2,315,047,382 2,053.21
Adams Co.Washtucna 56.48 2,210,836 39,143.71 2,337,944 41,394.18 1,482.26 453.19 38,621.49 837.24 0.00 1,781,139 31,535.75Benge 18.80 523,762 27,859.68 548,581 29,179.82 1,894.38 207.66 24,948.21 2,129.57 0.00 335,548 17,848.31Othello 4,645.95 65,191,687 14,031.94 67,135,085 14,450.24 460.81 90.32 12,459.19 1,429.25 10.67 15,112,578 3,252.85Lind 190.10 4,834,844 25,433.16 4,829,074 25,402.81 2,518.71 161.64 20,806.23 1,879.97 36.25 1,099,592 5,784.28Ritzville 350.89 5,287,757 15,069.56 5,335,711 15,206.22 1,846.36 400.03 12,018.43 847.71 93.70 274,708 782.89County Total 5,262.22 78,048,887 14,831.93 80,186,393 15,238.13 643.62 117.86 13,056.76 1,402.90 16.98 18,603,564 3,535.31
Asotin Co.Clarkston 2,657.47 35,618,644 13,403.22 36,118,771 13,591.41 874.52 153.97 11,481.55 1,056.12 25.25 2,279,480 857.76Asotin 621.96 8,304,337 13,351.88 8,862,356 14,249.08 996.66 273.29 12,251.23 724.34 3.55 2,559,894 4,115.85County Total 3,279.43 43,922,981 13,393.48 44,981,127 13,716.14 897.68 176.60 11,627.52 993.19 21.14 4,839,374 1,475.68
Benton Co.Kennewick 19,233.27 255,721,902 13,295.81 263,599,968 13,705.42 734.06 133.16 11,790.52 985.54 62.14 38,839,810 2,019.41Paterson 121.73 2,202,493 18,093.27 2,113,603 17,363.04 2,629.03 315.08 13,340.49 1,078.44 0.00 487,647 4,005.97Kiona-Benton 1,394.91 20,885,271 14,972.49 21,013,702 15,064.56 978.29 116.19 12,683.75 1,239.29 47.04 1,865,986 1,337.71Finley 874.54 13,320,852 15,231.84 13,479,826 15,413.62 1,066.37 165.71 12,795.39 1,385.85 0.29 962,490 1,100.57Prosser 2,653.82 38,200,686 14,394.60 37,948,428 14,299.55 1,023.75 118.43 11,901.06 1,245.32 10.99 3,503,645 1,320.23Richland 13,925.64 180,863,310 12,987.79 182,936,672 13,136.68 1,323.35 126.99 11,036.31 650.03 0.00 11,554,788 829.75County Total 38,203.91 511,194,514 13,380.69 521,092,199 13,639.76 991.55 130.59 11,583.83 900.02 33.77 57,214,365 1,497.60
Chelan Co.Manson 639.54 10,284,466 16,081.04 10,744,287 16,800.02 2,208.40 285.78 12,577.87 1,585.90 142.07 1,094,083 1,710.73Stehekin 9.70 192,906 19,887.20 370,057 38,150.16 0.00 796.88 37,242.76 35.72 74.80 777,563 80,161.13Entiat 312.91 5,401,312 17,261.55 5,746,426 18,364.47 1,531.59 150.89 15,119.32 1,548.92 13.75 1,679,475 5,367.28Lake Chelan 1,390.52 21,212,439 15,255.04 21,526,477 15,480.88 2,467.54 205.08 11,512.69 1,024.29 271.29 2,746,926 1,975.47Cashmere 1,605.62 21,547,601 13,420.11 21,915,565 13,649.28 829.28 234.05 11,566.02 1,018.00 1.95 2,364,299 1,472.51Cascade 1,325.90 19,098,162 14,403.92 19,136,135 14,432.56 2,440.88 144.49 10,758.96 1,041.31 46.91 769,785 580.58Wenatchee 7,854.55 110,579,991 14,078.46 113,677,918 14,472.87 1,059.44 252.46 11,850.25 1,308.30 2.43 12,576,249 1,601.14County Total 13,138.74 188,316,878 14,332.95 193,116,864 14,698.28 1,386.13 233.90 11,801.68 1,234.12 42.44 22,008,380 1,675.08
Clallam Co.Port Angeles 3,721.25 53,618,470 14,408.73 52,883,264 14,211.16 1,429.87 147.23 11,375.08 1,250.64 8.32 4,748,305 1,276.00Crescent 368.84 5,165,541 14,004.83 5,688,598 15,422.94 1,415.67 163.33 12,686.25 1,142.61 15.08 2,353,893 6,381.88Sequim 2,749.17 39,230,117 14,269.80 40,735,801 14,817.49 2,608.41 227.10 11,177.69 802.35 1.94 3,495,354 1,271.42Cape Flattery 528.93 11,449,294 21,646.14 12,666,083 23,946.62 485.16 297.14 16,070.88 7,093.44 0.00 5,881,731 11,120.05Quillayute Valley 3,359.06 41,149,515 12,250.31 43,247,279 12,874.82 212.12 56.64 12,023.42 548.66 33.98 6,335,251 1,886.02Quillayute Tribal School. 114.36 2,311,465 20,212.18 2,373,837 20,757.58 0.00 0.00 19,845.27 912.31 0.00 1,695,286 14,824.12County Total 10,841.61 152,924,403 14,105.32 157,594,863 14,536.11 1,289.77 145.72 11,888.95 1,197.28 59.33 24,509,820 2,260.72
Clark Co.Vancouver 23,143.27 340,478,290 14,711.76 341,750,326 14,766.73 1,359.79 140.07 11,658.28 1,011.29 597.31 32,772,195 1,416.06Hockinson 2,025.99 25,843,206 12,755.84 26,012,690 12,839.50 1,229.34 302.21 10,904.35 403.20 0.39 3,056,716 1,508.75La Center 1,683.46 22,250,471 13,217.11 22,528,243 13,382.11 1,179.50 218.58 11,466.94 496.20 20.89 3,149,924 1,871.10Green Mountain 160.78 2,321,560 14,439.36 2,609,813 16,232.20 1,974.77 243.71 13,349.40 592.68 71.65 988,836 6,150.24Washougal 3,223.79 45,773,393 14,198.63 46,027,382 14,277.41 1,724.11 262.90 11,363.64 683.27 243.49 5,907,871 1,832.59Evergreen-Clark 25,530.02 367,917,025 14,411.15 373,069,155 14,612.96 1,160.01 171.89 12,196.14 797.69 287.24 28,240,529 1,106.17Camas 7,526.48 99,153,562 13,173.96 101,605,697 13,499.76 1,543.91 539.36 11,023.74 392.76 0.00 15,513,552 2,061.20Battle Ground 13,082.55 178,616,628 13,653.04 185,907,812 14,210.37 1,742.59 207.90 11,569.89 683.59 6.40 29,942,871 2,288.76Ridgefield 3,427.73 42,800,254 12,486.47 44,784,572 13,065.37 1,615.97 393.90 10,629.31 366.67 59.53 6,103,298 1,780.57County Total 79,804.07 1,125,154,389 14,098.96 1,144,295,691 14,338.81 1,395.84 220.87 11,680.14 762.82 279.15 125,675,791 1,574.80
13
Washington State School Districts, Charter Schools, and Tribal SchoolsGeneral Fund Expenditures, Revenues, and Ending Total Fund Balance Per Pupil by County
Fiscal Year 2019–20
Enrollment Expenditures Revenues Fund BalanceTotal Total Local Local Support Other Ending Total
Total Total Expenditures Total Revenues Tax Non-Tax State Federal Fin Srcs Ending Total Fund BalanceCounty District Name Enrollment Expenditures Per Pupil Revenues Per Pupil Per Pupil Per pupil Per Pupil Per Pupil Per Pupil Fund Balance Per PupilColumbia Co.
Dayton 394.70 6,764,169 17,137.49 6,979,782 17,683.76 2,533.13 574.30 13,452.62 1,113.44 10.28 641,949 1,626.42Starbuck 31.35 794,443 25,341.07 751,658 23,976.34 0.00 659.05 22,545.58 771.70 0.00 347,990 11,100.16County Total 426.05 7,558,611 17,741.14 7,731,440 18,146.79 2,346.74 580.53 14,121.70 1,088.29 9.52 989,939 2,323.53
Cowlitz Co.Longview 6,710.36 93,223,728 13,892.51 93,974,860 14,004.44 1,273.16 98.06 11,554.05 1,062.55 16.62 9,846,489 1,467.36Toutle Lake 686.35 9,899,218 14,422.99 9,985,969 14,549.38 1,413.69 156.77 12,057.49 471.07 450.36 1,579,401 2,301.16Castle Rock 1,462.27 19,551,082 13,370.36 19,252,261 13,166.01 1,054.22 143.14 11,269.05 699.60 0.00 2,117,549 1,448.12Kalama 1,041.51 13,789,570 13,239.98 13,978,995 13,421.85 2,061.19 149.17 10,821.84 339.67 49.99 3,205,810 3,078.04Woodland 2,516.87 38,511,206 15,301.23 40,311,207 16,016.40 1,627.96 191.61 12,942.11 913.49 341.24 3,953,697 1,570.88Kelso 5,085.78 68,427,174 13,454.61 69,804,662 13,725.46 729.10 200.91 11,740.63 1,040.42 14.39 5,629,317 1,106.87County Total 17,503.14 243,401,979 13,906.19 247,307,954 14,129.35 1,200.21 150.50 11,760.22 938.16 80.26 26,332,263 1,504.43
Douglas Co.Orondo 171.71 3,799,038 22,124.73 4,008,891 23,346.87 3,434.88 125.57 14,842.46 3,184.74 1,759.22 1,259,266 7,333.68Bridgeport 793.97 11,660,592 14,686.44 11,812,813 14,878.16 337.58 25.47 12,838.08 1,677.03 0.00 1,015,278 1,278.74Palisades 25.70 710,007 27,626.74 810,943 31,554.22 4,273.53 610.50 22,535.36 4,134.84 0.00 364,663 14,189.21Eastmont 6,199.18 83,524,626 13,473.50 85,023,557 13,715.29 1,399.71 184.81 11,080.70 1,038.53 11.54 17,297,861 2,790.35Mansfield 95.52 2,454,799 25,699.32 2,539,676 26,587.89 1,446.40 311.04 23,758.63 1,040.42 31.41 849,819 8,896.77Waterville 261.20 4,910,313 18,799.06 4,790,637 18,340.88 1,311.97 253.35 15,114.45 1,238.80 422.31 857,551 3,283.12County Total 7,547.28 107,059,376 14,185.16 108,986,517 14,440.50 1,341.62 172.12 11,690.22 1,172.03 64.51 21,644,438 2,867.85
Ferry Co.Keller 41.12 1,431,599 34,815.16 1,242,201 30,209.17 435.56 1,199.27 15,488.37 13,055.22 30.74 185,986 4,522.99Curlew 249.31 3,800,387 15,243.62 4,319,530 17,325.94 705.74 102.66 14,219.68 1,346.11 951.76 1,335,210 5,355.62Orient 48.91 1,280,493 26,180.60 1,371,161 28,034.37 1,167.70 426.71 24,017.33 2,399.73 22.90 563,291 11,516.89Inchelium 216.75 5,551,503 25,612.47 5,458,881 25,185.15 466.28 325.21 15,305.47 8,907.95 180.23 1,539,494 7,102.62Republic 339.03 5,988,204 17,662.75 6,083,522 17,943.90 1,333.72 26.19 14,555.73 1,788.98 239.28 436,580 1,287.73County Total 895.12 18,052,186 20,167.34 18,475,295 20,640.02 898.44 195.67 15,203.51 3,940.38 402.02 4,060,561 4,536.33
Franklin Co.Pasco 18,725.87 255,250,906 13,630.92 258,253,117 13,791.25 610.18 123.62 12,001.59 974.00 81.86 30,440,911 1,625.61North Franklin 2,097.41 29,480,794 14,055.81 31,061,549 14,809.48 872.76 118.22 12,187.87 1,628.90 1.73 4,749,543 2,264.48Star 15.20 421,660 27,740.82 476,162 31,326.42 0.00 658.42 29,343.84 1,324.15 0.00 465,882 30,650.13Kahlotus 41.45 2,168,765 52,322.44 2,298,081 55,442.24 1,838.41 613.82 50,175.28 1,725.69 1,089.03 945,959 22,821.69County Total 20,879.93 287,322,126 13,760.68 292,088,908 13,988.98 638.55 124.44 12,108.71 1,041.53 75.75 36,602,296 1,752.99
Garfield Co.Pomeroy 316.67 5,291,916 16,711.14 5,681,993 17,942.95 2,555.62 407.50 13,669.43 1,310.39 0.00 1,425,329 4,500.99County Total 316.67 5,291,916 16,711.14 5,681,993 17,942.95 2,555.62 407.50 13,669.43 1,310.39 0.00 1,425,329 4,500.99
Grant Co.Wahluke 2,447.84 38,679,318 15,801.41 39,642,402 16,194.85 580.22 90.96 12,973.43 2,465.01 85.24 4,464,850 1,824.00Quincy 3,024.49 46,913,332 15,511.15 46,057,336 15,228.13 2,169.70 86.29 11,535.94 1,434.10 2.10 5,004,518 1,654.67Warden 910.98 13,693,101 15,031.18 14,038,270 15,410.07 937.20 77.92 12,443.55 1,944.73 6.67 3,114,572 3,418.92Coulee-Hartline 221.65 3,405,568 15,364.62 4,074,699 18,383.48 2,001.58 270.61 14,737.30 1,191.06 182.94 2,819,156 12,718.96Soap Lake 558.45 8,175,314 14,639.30 8,570,714 15,347.33 826.99 151.45 12,907.86 1,458.40 2.63 1,663,121 2,978.10Royal 1,745.96 24,523,670 14,045.95 25,663,949 14,699.05 703.07 384.22 12,339.37 1,272.39 0.00 4,476,526 2,563.93Moses Lake 8,912.96 117,267,845 13,157.00 121,897,082 13,676.39 728.04 111.12 11,993.50 815.27 28.46 18,742,099 2,102.79Ephrata 2,665.52 35,173,057 13,195.57 37,094,365 13,916.37 564.21 131.68 12,306.75 910.25 3.47 9,049,026 3,394.84Wilson Creek 145.16 3,133,539 21,586.80 3,239,141 22,314.28 1,499.63 143.72 19,534.23 818.02 318.68 785,636 5,412.21Grand Coulee Dam 734.63 11,589,277 15,775.67 11,745,343 15,988.11 657.80 215.70 12,151.87 2,938.22 24.52 1,694,166 2,306.15County Total 21,367.64 302,554,022 14,159.45 312,023,300 14,602.61 920.23 135.28 12,236.55 1,282.92 27.62 51,813,671 2,424.87
14
Washington State School Districts, Charter Schools, and Tribal SchoolsGeneral Fund Expenditures, Revenues, and Ending Total Fund Balance Per Pupil by County
Fiscal Year 2019–20
Enrollment Expenditures Revenues Fund BalanceTotal Total Local Local Support Other Ending Total
Total Total Expenditures Total Revenues Tax Non-Tax State Federal Fin Srcs Ending Total Fund BalanceCounty District Name Enrollment Expenditures Per Pupil Revenues Per Pupil Per Pupil Per pupil Per Pupil Per Pupil Per Pupil Fund Balance Per PupilGrays Harbor Co.
Aberdeen 3,444.17 52,066,248 15,117.21 52,687,916 15,297.71 837.18 133.88 12,619.29 1,663.67 43.69 2,774,037 805.43Hoquiam 1,633.55 23,600,836 14,447.57 25,503,460 15,612.29 887.45 207.71 12,521.40 1,504.66 491.07 6,926,853 4,240.37North Beach 715.97 11,883,884 16,598.30 11,837,533 16,533.56 2,514.21 252.26 12,215.19 1,461.72 90.17 2,031,546 2,837.47McCleary 329.32 5,287,937 16,057.14 5,396,974 16,388.24 1,879.02 203.08 13,018.26 1,287.87 0.00 810,523 2,461.20Montesano 1,460.63 19,140,564 13,104.32 19,805,584 13,559.62 1,107.24 211.65 11,459.31 574.04 207.38 2,424,874 1,660.16Elma 1,609.18 24,301,327 15,101.68 24,556,712 15,260.39 1,266.42 130.99 12,644.50 1,002.96 215.52 5,259,705 3,268.56Taholah 171.95 4,708,953 27,385.59 4,915,726 28,588.11 242.77 969.12 17,327.38 10,048.84 0.00 1,307,092 7,601.58Lake Quinault 199.00 4,059,266 20,398.32 4,663,978 23,437.07 1,098.67 332.58 18,750.30 3,149.82 105.71 1,560,352 7,840.96Cosmopolis 175.94 2,999,736 17,049.77 3,321,351 18,877.75 2,187.75 322.96 14,819.06 1,425.77 122.20 1,360,017 7,730.01Satsop 59.65 795,816 13,341.42 1,041,461 17,459.52 1,320.97 207.71 14,810.71 1,120.13 0.00 1,048,442 17,576.56Wishkah Valley 154.03 3,597,535 23,356.07 4,050,219 26,295.00 6,514.57 307.76 18,248.95 1,223.72 0.00 2,372,898 15,405.43Ocosta 632.85 10,130,999 16,008.53 11,261,504 17,794.90 2,676.58 123.00 12,840.56 2,154.76 0.00 3,094,227 4,889.35Oakville 288.56 4,786,452 16,587.37 6,012,738 20,837.04 1,196.52 452.21 14,763.74 4,424.58 0.00 2,470,396 8,561.12County Total 10,874.80 167,359,552 15,389.67 175,055,155 16,097.32 1,303.36 195.46 12,821.75 1,619.55 157.20 33,440,962 3,075.09
Island Co.Oak Harbor 6,057.03 88,846,030 14,668.25 93,076,258 15,366.65 1,375.89 166.67 11,977.14 1,799.10 47.84 9,140,194 1,509.02Coupeville 1,045.52 15,337,721 14,669.94 15,979,954 15,284.22 2,346.09 275.84 11,762.39 722.19 177.72 918,526 878.53South Whidbey 1,304.04 19,931,047 15,284.08 21,317,795 16,347.50 2,570.76 487.61 12,552.65 736.48 0.00 3,682,009 2,823.54County Total 8,406.59 124,114,798 14,763.99 130,374,007 15,508.55 1,681.91 230.03 12,039.71 1,500.33 56.57 13,740,729 1,634.52
Jefferson Co.Queets-Clearwater 24.85 877,357 35,306.12 1,056,188 42,502.54 3,100.97 377.45 30,855.46 8,168.66 0.00 246,990 9,939.22Brinnon 75.73 1,391,746 18,377.73 1,447,560 19,114.74 3,306.64 375.24 13,137.90 2,164.38 130.58 501,109 6,617.04Quilcene 651.32 8,359,034 12,833.99 9,041,437 13,881.71 895.50 54.99 12,234.23 598.09 98.90 2,193,722 3,368.12Chimacum 821.16 13,798,099 16,803.18 13,942,625 16,979.18 2,758.12 227.79 12,612.29 1,094.43 286.55 2,579,379 3,141.14Port Townsend 1,222.92 18,689,013 15,282.29 19,208,682 15,707.23 2,439.39 275.99 11,493.41 1,425.17 73.27 2,549,358 2,084.65County Total 2,795.98 43,115,249 15,420.44 44,696,491 15,985.98 2,202.72 213.94 12,211.22 1,215.32 142.78 8,070,557 2,886.49
King Co.Seattle 55,303.18 966,875,780 17,483.19 962,936,209 17,411.95 2,683.77 844.79 12,396.81 967.87 518.70 148,791,695 2,690.47Federal Way 22,563.59 334,280,741 14,815.05 344,795,647 15,281.06 1,144.42 137.71 12,796.86 985.58 216.50 35,684,870 1,581.52Enumclaw 4,271.23 61,584,065 14,418.34 62,282,862 14,581.95 1,591.49 289.38 12,046.86 625.16 29.06 7,310,579 1,711.59Mercer Island 4,433.38 66,737,701 15,053.46 65,720,537 14,824.03 2,532.49 904.86 11,122.96 234.27 29.44 6,778,152 1,528.89Highline 18,918.29 314,693,876 16,634.37 318,463,588 16,833.63 2,106.71 359.79 12,944.24 1,309.44 113.46 31,862,437 1,684.21Vashon Island 1,513.75 23,897,137 15,786.71 24,121,853 15,935.16 2,570.16 529.34 11,369.06 587.30 879.30 1,809,088 1,195.10Renton 15,893.05 261,968,174 16,483.19 260,380,934 16,383.32 2,450.86 242.16 12,408.90 1,136.25 145.15 27,162,532 1,709.08Skykomish 54.79 2,670,215 48,735.45 2,656,845 48,491.42 2,148.13 731.66 42,172.06 792.13 2,647.45 1,092,065 19,931.82Bellevue 20,914.54 348,168,075 16,647.18 345,188,775 16,504.73 2,468.65 818.47 11,577.06 531.80 1,108.74 36,967,901 1,767.57Tukwila 2,910.06 49,034,144 16,849.87 49,186,977 16,902.39 2,219.88 161.49 12,802.03 1,617.89 101.11 4,503,227 1,547.47Riverview 3,375.28 47,257,070 14,000.93 49,579,451 14,688.99 2,118.18 506.86 11,662.82 401.13 0.00 8,162,658 2,418.36Auburn 17,463.31 263,348,588 15,080.11 265,976,484 15,230.59 1,578.91 205.69 12,448.86 941.11 56.02 40,658,688 2,328.23Tahoma 9,156.00 120,446,454 13,154.92 126,636,219 13,830.95 1,183.92 415.18 11,876.59 334.75 20.52 37,305,864 4,074.47Snoqualmie Valley 7,337.48 100,035,870 13,633.55 104,238,993 14,206.38 2,001.23 339.62 11,473.07 331.17 61.28 17,035,379 2,321.69Issaquah 21,246.81 307,259,124 14,461.42 301,737,088 14,201.52 1,920.25 739.84 11,172.15 337.37 31.92 42,317,931 1,991.73Shoreline 9,850.73 159,681,488 16,210.12 155,596,756 15,795.45 2,248.28 668.19 12,104.79 649.44 124.75 11,470,469 1,164.43Lake Washington 31,985.59 432,860,666 13,532.99 461,082,448 14,415.32 1,896.83 413.93 11,469.48 387.20 247.87 108,250,142 3,384.34Kent 27,271.49 380,109,753 13,937.99 408,276,953 14,970.83 1,676.26 163.62 12,006.12 1,069.03 55.81 64,479,476 2,364.35Northshore 23,609.75 345,773,093 14,645.35 357,399,882 15,137.81 2,303.41 376.86 11,605.36 482.63 369.55 48,511,035 2,054.70Summit Public School: Sierra Charter 323.18 5,257,101 16,266.79 5,412,643 16,748.07 0.00 88.91 11,422.30 1,144.24 4,092.63 920,936 2,849.61Muckleshoot Tribal School. 531.62 6,687,403 12,579.29 6,558,318 12,336.48 0.00 0.00 12,239.39 97.09 0.00 364,534 685.70Summit Public School: Atlas 429.41 6,613,424 15,401.19 6,869,965 15,998.61 0.00 69.35 12,187.27 1,240.44 2,501.56 658,711 1,533.99Rainier Prep Charter 345.20 4,125,502 11,951.05 4,857,580 14,071.78 0.00 1,279.95 11,719.83 985.10 86.91 2,769,106 8,021.74Green Dot:Rainier Valley 237.78 7,495,235 31,521.72 7,521,863 31,633.71 0.00 329.64 16,772.80 3,237.19 11,294.07 44,277 186.21Impact Public Schools 271.81 3,974,131 14,620.99 4,273,483 15,722.32 0.00 515.22 13,353.59 1,853.51 0.00 838,627 3,085.34County Total 300,211.30 4,620,834,811 15,391.94 4,701,752,354 15,661.48 38,843.83 11,132.50 335,151.24 22,279.09 24,731.81 685,750,379 2,284.23
15
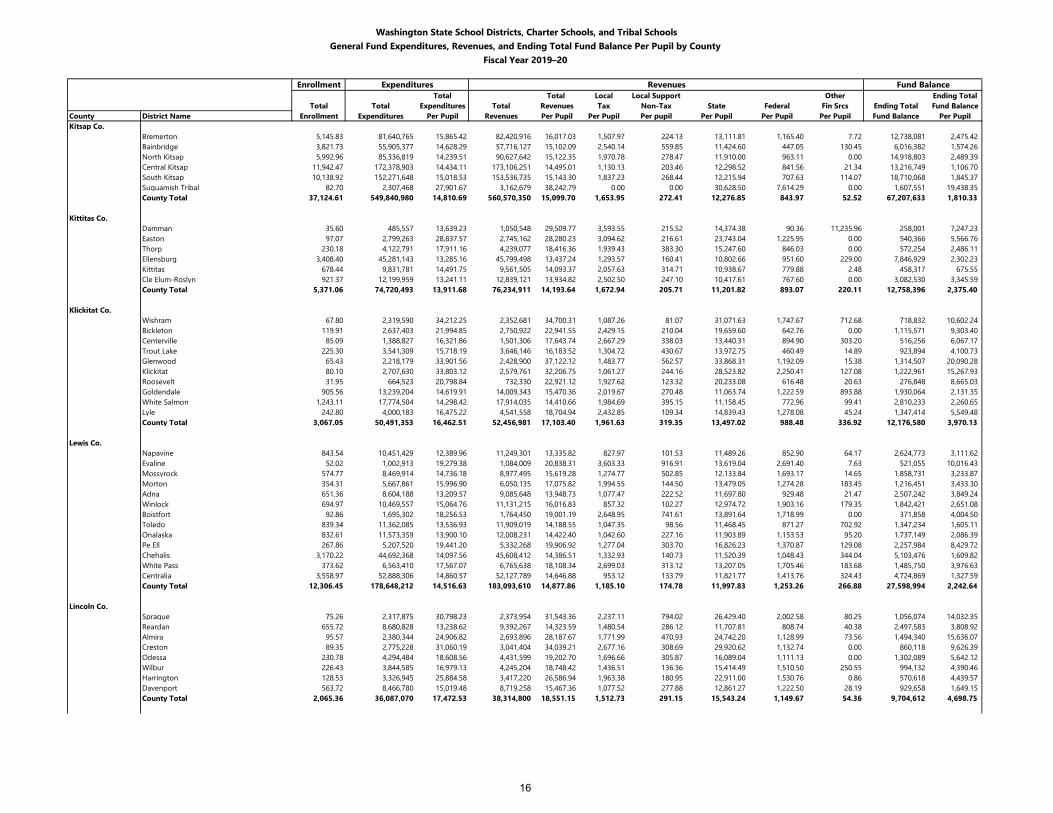
Washington State School Districts, Charter Schools, and Tribal SchoolsGeneral Fund Expenditures, Revenues, and Ending Total Fund Balance Per Pupil by County
Fiscal Year 2019–20
Enrollment Expenditures Revenues Fund BalanceTotal Total Local Local Support Other Ending Total
Total Total Expenditures Total Revenues Tax Non-Tax State Federal Fin Srcs Ending Total Fund BalanceCounty District Name Enrollment Expenditures Per Pupil Revenues Per Pupil Per Pupil Per pupil Per Pupil Per Pupil Per Pupil Fund Balance Per PupilKitsap Co.
Bremerton 5,145.83 81,640,765 15,865.42 82,420,916 16,017.03 1,507.97 224.13 13,111.81 1,165.40 7.72 12,738,081 2,475.42Bainbridge 3,821.73 55,905,377 14,628.29 57,716,127 15,102.09 2,540.14 559.85 11,424.60 447.05 130.45 6,016,382 1,574.26North Kitsap 5,992.96 85,336,819 14,239.51 90,627,642 15,122.35 1,970.78 278.47 11,910.00 963.11 0.00 14,918,803 2,489.39Central Kitsap 11,942.47 172,378,903 14,434.11 173,106,251 14,495.01 1,130.13 203.46 12,298.52 841.56 21.34 13,216,749 1,106.70South Kitsap 10,138.92 152,271,648 15,018.53 153,536,735 15,143.30 1,837.23 268.44 12,215.94 707.63 114.07 18,710,068 1,845.37Suquamish Tribal 82.70 2,307,468 27,901.67 3,162,679 38,242.79 0.00 0.00 30,628.50 7,614.29 0.00 1,607,551 19,438.35County Total 37,124.61 549,840,980 14,810.69 560,570,350 15,099.70 1,653.95 272.41 12,276.85 843.97 52.52 67,207,633 1,810.33
Kittitas Co.Damman 35.60 485,557 13,639.23 1,050,548 29,509.77 3,593.55 215.52 14,374.38 90.36 11,235.96 258,001 7,247.23Easton 97.07 2,799,263 28,837.57 2,745,162 28,280.23 3,094.62 216.61 23,743.04 1,225.95 0.00 540,366 5,566.76Thorp 230.18 4,122,791 17,911.16 4,239,077 18,416.36 1,939.43 383.30 15,247.60 846.03 0.00 572,254 2,486.11Ellensburg 3,408.40 45,281,143 13,285.16 45,799,498 13,437.24 1,293.57 160.41 10,802.66 951.60 229.00 7,846,929 2,302.23Kittitas 678.44 9,831,781 14,491.75 9,561,505 14,093.37 2,057.63 314.71 10,938.67 779.88 2.48 458,317 675.55Cle Elum-Roslyn 921.37 12,199,959 13,241.11 12,839,121 13,934.82 2,502.50 247.10 10,417.61 767.60 0.00 3,082,530 3,345.59County Total 5,371.06 74,720,493 13,911.68 76,234,911 14,193.64 1,672.94 205.71 11,201.82 893.07 220.11 12,758,396 2,375.40
Klickitat Co.Wishram 67.80 2,319,590 34,212.25 2,352,681 34,700.31 1,087.26 81.07 31,071.63 1,747.67 712.68 718,832 10,602.24Bickleton 119.91 2,637,403 21,994.85 2,750,922 22,941.55 2,429.15 210.04 19,659.60 642.76 0.00 1,115,571 9,303.40Centerville 85.09 1,388,827 16,321.86 1,501,306 17,643.74 2,667.29 338.03 13,440.31 894.90 303.20 516,256 6,067.17Trout Lake 225.30 3,541,309 15,718.19 3,646,146 16,183.52 1,304.72 430.67 13,972.75 460.49 14.89 923,894 4,100.73Glenwood 65.43 2,218,179 33,901.56 2,428,900 37,122.12 1,483.77 562.57 33,868.31 1,192.09 15.38 1,314,507 20,090.28Klickitat 80.10 2,707,630 33,803.12 2,579,761 32,206.75 1,061.27 244.16 28,523.82 2,250.41 127.08 1,222,961 15,267.93Roosevelt 31.95 664,523 20,798.84 732,330 22,921.12 1,927.62 123.32 20,233.08 616.48 20.63 276,848 8,665.03Goldendale 905.56 13,239,204 14,619.91 14,009,343 15,470.36 2,019.67 270.48 11,063.74 1,222.59 893.88 1,930,064 2,131.35White Salmon 1,243.11 17,774,504 14,298.42 17,914,035 14,410.66 1,984.69 395.15 11,158.45 772.96 99.41 2,810,233 2,260.65Lyle 242.80 4,000,183 16,475.22 4,541,558 18,704.94 2,432.85 109.34 14,839.43 1,278.08 45.24 1,347,414 5,549.48County Total 3,067.05 50,491,353 16,462.51 52,456,981 17,103.40 1,961.63 319.35 13,497.02 988.48 336.92 12,176,580 3,970.13
Lewis Co.Napavine 843.54 10,451,429 12,389.96 11,249,301 13,335.82 827.97 101.53 11,489.26 852.90 64.17 2,624,773 3,111.62Evaline 52.02 1,002,913 19,279.38 1,084,009 20,838.31 3,603.33 916.91 13,619.04 2,691.40 7.63 521,055 10,016.43Mossyrock 574.77 8,469,914 14,736.18 8,977,495 15,619.28 1,274.77 502.85 12,133.84 1,693.17 14.65 1,858,731 3,233.87Morton 354.31 5,667,861 15,996.90 6,050,135 17,075.82 1,994.55 144.50 13,479.05 1,274.28 183.45 1,216,451 3,433.30Adna 651.36 8,604,188 13,209.57 9,085,648 13,948.73 1,077.47 222.52 11,697.80 929.48 21.47 2,507,242 3,849.24Winlock 694.97 10,469,557 15,064.76 11,131,215 16,016.83 857.32 102.27 12,974.72 1,903.16 179.35 1,842,421 2,651.08Boistfort 92.86 1,695,302 18,256.53 1,764,450 19,001.19 2,648.95 741.61 13,891.64 1,718.99 0.00 371,858 4,004.50Toledo 839.34 11,362,085 13,536.93 11,909,019 14,188.55 1,047.35 98.56 11,468.45 871.27 702.92 1,347,234 1,605.11Onalaska 832.61 11,573,359 13,900.10 12,008,231 14,422.40 1,042.60 227.16 11,903.89 1,153.53 95.20 1,737,149 2,086.39Pe Ell 267.86 5,207,520 19,441.20 5,332,268 19,906.92 1,277.04 303.70 16,826.23 1,370.87 129.08 2,257,984 8,429.72Chehalis 3,170.22 44,692,368 14,097.56 45,608,412 14,386.51 1,332.93 140.73 11,520.39 1,048.43 344.04 5,103,476 1,609.82White Pass 373.62 6,563,410 17,567.07 6,765,638 18,108.34 2,699.03 313.12 13,207.05 1,705.46 183.68 1,485,750 3,976.63Centralia 3,558.97 52,888,306 14,860.57 52,127,789 14,646.88 953.12 133.79 11,821.77 1,413.76 324.43 4,724,869 1,327.59County Total 12,306.45 178,648,212 14,516.63 183,093,610 14,877.86 1,185.10 174.78 11,997.83 1,253.26 266.88 27,598,994 2,242.64
Lincoln Co.Sprague 75.26 2,317,875 30,798.23 2,373,954 31,543.36 2,237.11 794.02 26,429.40 2,002.58 80.25 1,056,074 14,032.35Reardan 655.72 8,680,828 13,238.62 9,392,267 14,323.59 1,480.54 286.12 11,707.81 808.74 40.38 2,497,583 3,808.92Almira 95.57 2,380,344 24,906.82 2,693,896 28,187.67 1,771.99 470.93 24,742.20 1,128.99 73.56 1,494,340 15,636.07Creston 89.35 2,775,228 31,060.19 3,041,404 34,039.21 2,677.16 308.69 29,920.62 1,132.74 0.00 860,118 9,626.39Odessa 230.78 4,294,484 18,608.56 4,431,599 19,202.70 1,696.66 305.87 16,089.04 1,111.13 0.00 1,302,089 5,642.12Wilbur 226.43 3,844,585 16,979.13 4,245,204 18,748.42 1,436.51 136.36 15,414.49 1,510.50 250.55 994,132 4,390.46Harrington 128.53 3,326,945 25,884.58 3,417,220 26,586.94 1,963.38 180.95 22,911.00 1,530.76 0.86 570,618 4,439.57Davenport 563.72 8,466,780 15,019.48 8,719,258 15,467.36 1,077.52 277.88 12,861.27 1,222.50 28.19 929,658 1,649.15County Total 2,065.36 36,087,070 17,472.53 38,314,800 18,551.15 1,512.73 291.15 15,543.24 1,149.67 54.36 9,704,612 4,698.75
16
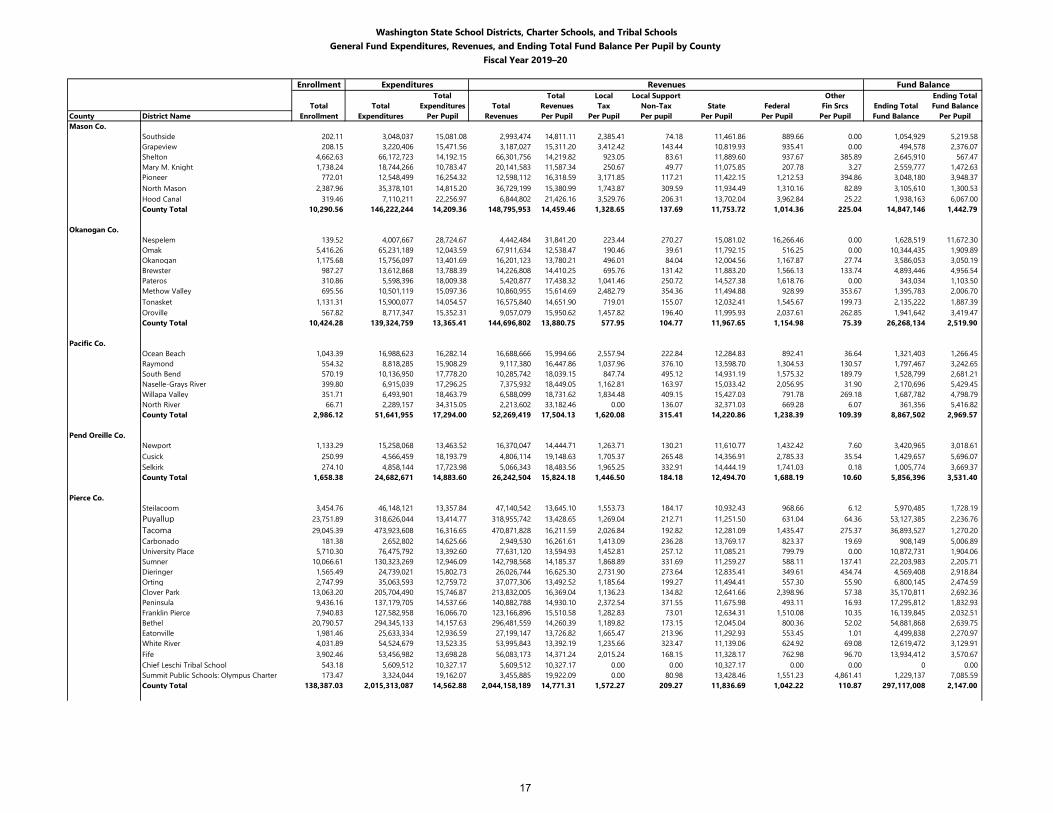
Washington State School Districts, Charter Schools, and Tribal SchoolsGeneral Fund Expenditures, Revenues, and Ending Total Fund Balance Per Pupil by County
Fiscal Year 2019–20
Enrollment Expenditures Revenues Fund BalanceTotal Total Local Local Support Other Ending Total
Total Total Expenditures Total Revenues Tax Non-Tax State Federal Fin Srcs Ending Total Fund BalanceCounty District Name Enrollment Expenditures Per Pupil Revenues Per Pupil Per Pupil Per pupil Per Pupil Per Pupil Per Pupil Fund Balance Per PupilMason Co.
Southside 202.11 3,048,037 15,081.08 2,993,474 14,811.11 2,385.41 74.18 11,461.86 889.66 0.00 1,054,929 5,219.58Grapeview 208.15 3,220,406 15,471.56 3,187,027 15,311.20 3,412.42 143.44 10,819.93 935.41 0.00 494,578 2,376.07Shelton 4,662.63 66,172,723 14,192.15 66,301,756 14,219.82 923.05 83.61 11,889.60 937.67 385.89 2,645,910 567.47Mary M. Knight 1,738.24 18,744,266 10,783.47 20,141,583 11,587.34 250.67 49.77 11,075.85 207.78 3.27 2,559,777 1,472.63Pioneer 772.01 12,548,499 16,254.32 12,598,112 16,318.59 3,171.85 117.21 11,422.15 1,212.53 394.86 3,048,180 3,948.37North Mason 2,387.96 35,378,101 14,815.20 36,729,199 15,380.99 1,743.87 309.59 11,934.49 1,310.16 82.89 3,105,610 1,300.53Hood Canal 319.46 7,110,211 22,256.97 6,844,802 21,426.16 3,529.76 206.31 13,702.04 3,962.84 25.22 1,938,163 6,067.00County Total 10,290.56 146,222,244 14,209.36 148,795,953 14,459.46 1,328.65 137.69 11,753.72 1,014.36 225.04 14,847,146 1,442.79
Okanogan Co.Nespelem 139.52 4,007,667 28,724.67 4,442,484 31,841.20 223.44 270.27 15,081.02 16,266.46 0.00 1,628,519 11,672.30Omak 5,416.26 65,231,189 12,043.59 67,911,634 12,538.47 190.46 39.61 11,792.15 516.25 0.00 10,344,435 1,909.89Okanogan 1,175.68 15,756,097 13,401.69 16,201,123 13,780.21 496.01 84.04 12,004.56 1,167.87 27.74 3,586,053 3,050.19Brewster 987.27 13,612,868 13,788.39 14,226,808 14,410.25 695.76 131.42 11,883.20 1,566.13 133.74 4,893,446 4,956.54Pateros 310.86 5,598,396 18,009.38 5,420,877 17,438.32 1,041.46 250.72 14,527.38 1,618.76 0.00 343,034 1,103.50Methow Valley 695.56 10,501,119 15,097.36 10,860,955 15,614.69 2,482.79 354.36 11,494.88 928.99 353.67 1,395,783 2,006.70Tonasket 1,131.31 15,900,077 14,054.57 16,575,840 14,651.90 719.01 155.07 12,032.41 1,545.67 199.73 2,135,222 1,887.39Oroville 567.82 8,717,347 15,352.31 9,057,079 15,950.62 1,457.82 196.40 11,995.93 2,037.61 262.85 1,941,642 3,419.47County Total 10,424.28 139,324,759 13,365.41 144,696,802 13,880.75 577.95 104.77 11,967.65 1,154.98 75.39 26,268,134 2,519.90
Pacific Co.Ocean Beach 1,043.39 16,988,623 16,282.14 16,688,666 15,994.66 2,557.94 222.84 12,284.83 892.41 36.64 1,321,403 1,266.45Raymond 554.32 8,818,285 15,908.29 9,117,380 16,447.86 1,037.96 376.10 13,598.70 1,304.53 130.57 1,797,467 3,242.65South Bend 570.19 10,136,950 17,778.20 10,285,742 18,039.15 847.74 495.12 14,931.19 1,575.32 189.79 1,528,799 2,681.21Naselle-Grays River 399.80 6,915,039 17,296.25 7,375,932 18,449.05 1,162.81 163.97 15,033.42 2,056.95 31.90 2,170,696 5,429.45Willapa Valley 351.71 6,493,901 18,463.79 6,588,099 18,731.62 1,834.48 409.15 15,427.03 791.78 269.18 1,687,782 4,798.79North River 66.71 2,289,157 34,315.05 2,213,602 33,182.46 0.00 136.07 32,371.03 669.28 6.07 361,356 5,416.82County Total 2,986.12 51,641,955 17,294.00 52,269,419 17,504.13 1,620.08 315.41 14,220.86 1,238.39 109.39 8,867,502 2,969.57
Pend Oreille Co.Newport 1,133.29 15,258,068 13,463.52 16,370,047 14,444.71 1,263.71 130.21 11,610.77 1,432.42 7.60 3,420,965 3,018.61Cusick 250.99 4,566,459 18,193.79 4,806,114 19,148.63 1,705.37 265.48 14,356.91 2,785.33 35.54 1,429,657 5,696.07Selkirk 274.10 4,858,144 17,723.98 5,066,343 18,483.56 1,965.25 332.91 14,444.19 1,741.03 0.18 1,005,774 3,669.37County Total 1,658.38 24,682,671 14,883.60 26,242,504 15,824.18 1,446.50 184.18 12,494.70 1,688.19 10.60 5,856,396 3,531.40
Pierce Co.Steilacoom 3,454.76 46,148,121 13,357.84 47,140,542 13,645.10 1,553.73 184.17 10,932.43 968.66 6.12 5,970,485 1,728.19Puyallup 23,751.89 318,626,044 13,414.77 318,955,742 13,428.65 1,269.04 212.71 11,251.50 631.04 64.36 53,127,385 2,236.76Tacoma 29,045.39 473,923,608 16,316.65 470,871,828 16,211.59 2,026.84 192.82 12,281.09 1,435.47 275.37 36,893,527 1,270.20Carbonado 181.38 2,652,802 14,625.66 2,949,530 16,261.61 1,413.09 236.28 13,769.17 823.37 19.69 908,149 5,006.89University Place 5,710.30 76,475,792 13,392.60 77,631,120 13,594.93 1,452.81 257.12 11,085.21 799.79 0.00 10,872,731 1,904.06Sumner 10,066.61 130,323,269 12,946.09 142,798,568 14,185.37 1,868.89 331.69 11,259.27 588.11 137.41 22,203,983 2,205.71Dieringer 1,565.49 24,739,021 15,802.73 26,026,744 16,625.30 2,731.90 273.64 12,835.41 349.61 434.74 4,569,408 2,918.84Orting 2,747.99 35,063,593 12,759.72 37,077,306 13,492.52 1,185.64 199.27 11,494.41 557.30 55.90 6,800,145 2,474.59Clover Park 13,063.20 205,704,490 15,746.87 213,832,005 16,369.04 1,136.23 134.82 12,641.66 2,398.96 57.38 35,170,811 2,692.36Peninsula 9,436.16 137,179,705 14,537.66 140,882,788 14,930.10 2,372.54 371.55 11,675.98 493.11 16.93 17,295,812 1,832.93Franklin Pierce 7,940.83 127,582,958 16,066.70 123,166,896 15,510.58 1,282.83 73.01 12,634.31 1,510.08 10.35 16,139,845 2,032.51Bethel 20,790.57 294,345,133 14,157.63 296,481,559 14,260.39 1,189.82 173.15 12,045.04 800.36 52.02 54,881,868 2,639.75Eatonville 1,981.46 25,633,334 12,936.59 27,199,147 13,726.82 1,665.47 213.96 11,292.93 553.45 1.01 4,499,838 2,270.97White River 4,031.89 54,524,679 13,523.35 53,995,843 13,392.19 1,235.66 323.47 11,139.06 624.92 69.08 12,619,472 3,129.91Fife 3,902.46 53,456,982 13,698.28 56,083,173 14,371.24 2,015.24 168.15 11,328.17 762.98 96.70 13,934,412 3,570.67Chief Leschi Tribal School 543.18 5,609,512 10,327.17 5,609,512 10,327.17 0.00 0.00 10,327.17 0.00 0.00 0 0.00Summit Public Schools: Olympus Charter 173.47 3,324,044 19,162.07 3,455,885 19,922.09 0.00 80.98 13,428.46 1,551.23 4,861.41 1,229,137 7,085.59County Total 138,387.03 2,015,313,087 14,562.88 2,044,158,189 14,771.31 1,572.27 209.27 11,836.69 1,042.22 110.87 297,117,008 2,147.00
17
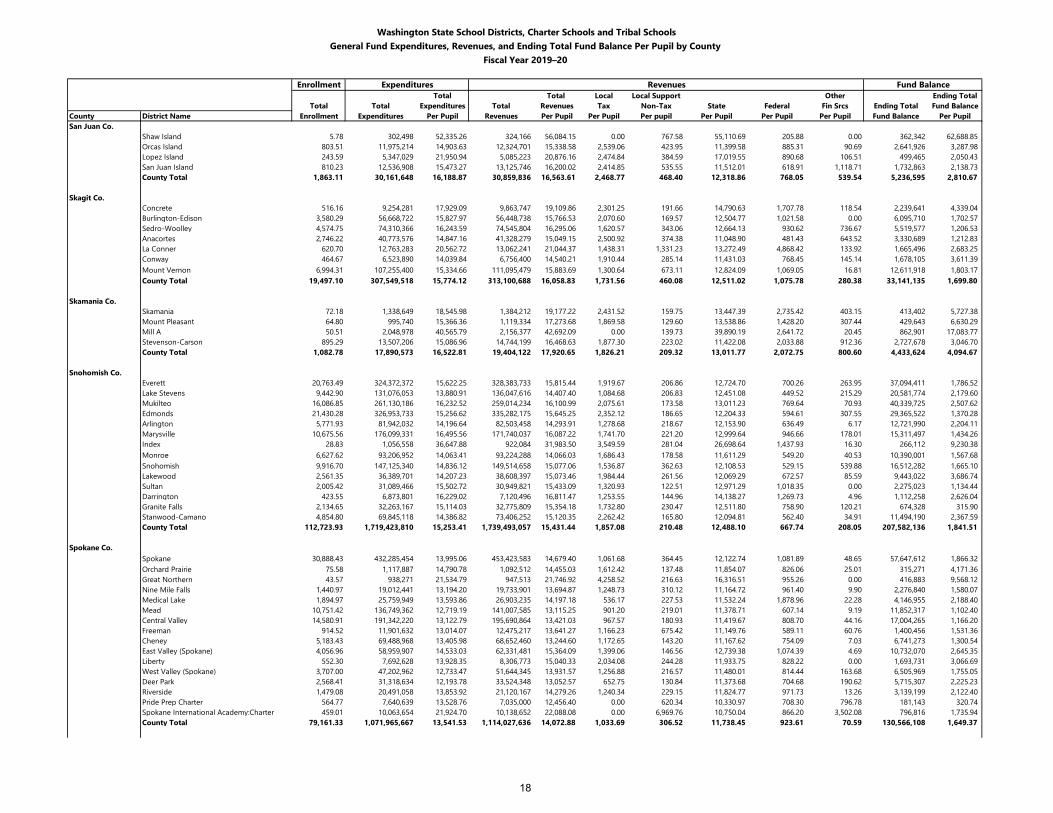
Washington State School Districts, Charter Schools and Tribal SchoolsGeneral Fund Expenditures, Revenues, and Ending Total Fund Balance Per Pupil by County
Fiscal Year 2019–20
Enrollment Expenditures Revenues Fund BalanceTotal Total Local Local Support Other Ending Total
Total Total Expenditures Total Revenues Tax Non-Tax State Federal Fin Srcs Ending Total Fund BalanceCounty District Name Enrollment Expenditures Per Pupil Revenues Per Pupil Per Pupil Per pupil Per Pupil Per Pupil Per Pupil Fund Balance Per PupilSan Juan Co.
Shaw Island 5.78 302,498 52,335.26 324,166 56,084.15 0.00 767.58 55,110.69 205.88 0.00 362,342 62,688.85Orcas Island 803.51 11,975,214 14,903.63 12,324,701 15,338.58 2,539.06 423.95 11,399.58 885.31 90.69 2,641,926 3,287.98Lopez Island 243.59 5,347,029 21,950.94 5,085,223 20,876.16 2,474.84 384.59 17,019.55 890.68 106.51 499,465 2,050.43San Juan Island 810.23 12,536,908 15,473.27 13,125,746 16,200.02 2,414.85 535.55 11,512.01 618.91 1,118.71 1,732,863 2,138.73County Total 1,863.11 30,161,648 16,188.87 30,859,836 16,563.61 2,468.77 468.40 12,318.86 768.05 539.54 5,236,595 2,810.67
Skagit Co.Concrete 516.16 9,254,281 17,929.09 9,863,747 19,109.86 2,301.25 191.66 14,790.63 1,707.78 118.54 2,239,641 4,339.04Burlington-Edison 3,580.29 56,668,722 15,827.97 56,448,738 15,766.53 2,070.60 169.57 12,504.77 1,021.58 0.00 6,095,710 1,702.57Sedro-Woolley 4,574.75 74,310,366 16,243.59 74,545,804 16,295.06 1,620.57 343.06 12,664.13 930.62 736.67 5,519,577 1,206.53Anacortes 2,746.22 40,773,576 14,847.16 41,328,279 15,049.15 2,500.92 374.38 11,048.90 481.43 643.52 3,330,689 1,212.83La Conner 620.70 12,763,283 20,562.72 13,062,241 21,044.37 1,438.31 1,331.23 13,272.49 4,868.42 133.92 1,665,496 2,683.25Conway 464.67 6,523,890 14,039.84 6,756,400 14,540.21 1,910.44 285.14 11,431.03 768.45 145.14 1,678,105 3,611.39Mount Vernon 6,994.31 107,255,400 15,334.66 111,095,479 15,883.69 1,300.64 673.11 12,824.09 1,069.05 16.81 12,611,918 1,803.17County Total 19,497.10 307,549,518 15,774.12 313,100,688 16,058.83 1,731.56 460.08 12,511.02 1,075.78 280.38 33,141,135 1,699.80
Skamania Co.Skamania 72.18 1,338,649 18,545.98 1,384,212 19,177.22 2,431.52 159.75 13,447.39 2,735.42 403.15 413,402 5,727.38Mount Pleasant 64.80 995,740 15,366.36 1,119,334 17,273.68 1,869.58 129.60 13,538.86 1,428.20 307.44 429,643 6,630.29Mill A 50.51 2,048,978 40,565.79 2,156,377 42,692.09 0.00 139.73 39,890.19 2,641.72 20.45 862,901 17,083.77Stevenson-Carson 895.29 13,507,206 15,086.96 14,744,199 16,468.63 1,877.30 223.02 11,422.08 2,033.88 912.36 2,727,678 3,046.70County Total 1,082.78 17,890,573 16,522.81 19,404,122 17,920.65 1,826.21 209.32 13,011.77 2,072.75 800.60 4,433,624 4,094.67
Snohomish Co.Everett 20,763.49 324,372,372 15,622.25 328,383,733 15,815.44 1,919.67 206.86 12,724.70 700.26 263.95 37,094,411 1,786.52Lake Stevens 9,442.90 131,076,053 13,880.91 136,047,616 14,407.40 1,084.68 206.83 12,451.08 449.52 215.29 20,581,774 2,179.60Mukilteo 16,086.85 261,130,186 16,232.52 259,014,234 16,100.99 2,075.61 173.58 13,011.23 769.64 70.93 40,339,725 2,507.62Edmonds 21,430.28 326,953,733 15,256.62 335,282,175 15,645.25 2,352.12 186.65 12,204.33 594.61 307.55 29,365,522 1,370.28Arlington 5,771.93 81,942,032 14,196.64 82,503,458 14,293.91 1,278.68 218.67 12,153.90 636.49 6.17 12,721,990 2,204.11Marysville 10,675.56 176,099,331 16,495.56 171,740,037 16,087.22 1,741.70 221.20 12,999.64 946.66 178.01 15,311,497 1,434.26Index 28.83 1,056,558 36,647.88 922,084 31,983.50 3,549.59 281.04 26,698.64 1,437.93 16.30 266,112 9,230.38Monroe 6,627.62 93,206,952 14,063.41 93,224,288 14,066.03 1,686.43 178.58 11,611.29 549.20 40.53 10,390,001 1,567.68Snohomish 9,916.70 147,125,340 14,836.12 149,514,658 15,077.06 1,536.87 362.63 12,108.53 529.15 539.88 16,512,282 1,665.10Lakewood 2,561.35 36,389,701 14,207.23 38,608,397 15,073.46 1,984.44 261.56 12,069.29 672.57 85.59 9,443,022 3,686.74Sultan 2,005.42 31,089,466 15,502.72 30,949,821 15,433.09 1,320.93 122.51 12,971.29 1,018.35 0.00 2,275,023 1,134.44Darrington 423.55 6,873,801 16,229.02 7,120,496 16,811.47 1,253.55 144.96 14,138.27 1,269.73 4.96 1,112,258 2,626.04Granite Falls 2,134.65 32,263,167 15,114.03 32,775,809 15,354.18 1,732.80 230.47 12,511.80 758.90 120.21 674,328 315.90Stanwood-Camano 4,854.80 69,845,118 14,386.82 73,406,252 15,120.35 2,262.42 165.80 12,094.81 562.40 34.91 11,494,190 2,367.59County Total 112,723.93 1,719,423,810 15,253.41 1,739,493,057 15,431.44 1,857.08 210.48 12,488.10 667.74 208.05 207,582,136 1,841.51
Spokane Co.Spokane 30,888.43 432,285,454 13,995.06 453,423,583 14,679.40 1,061.68 364.45 12,122.74 1,081.89 48.65 57,647,612 1,866.32Orchard Prairie 75.58 1,117,887 14,790.78 1,092,512 14,455.03 1,612.42 137.48 11,854.07 826.06 25.01 315,271 4,171.36Great Northern 43.57 938,271 21,534.79 947,513 21,746.92 4,258.52 216.63 16,316.51 955.26 0.00 416,883 9,568.12Nine Mile Falls 1,440.97 19,012,441 13,194.20 19,733,901 13,694.87 1,248.73 310.12 11,164.72 961.40 9.90 2,276,840 1,580.07Medical Lake 1,894.97 25,759,949 13,593.86 26,903,235 14,197.18 536.17 227.53 11,532.24 1,878.96 22.28 4,146,955 2,188.40Mead 10,751.42 136,749,362 12,719.19 141,007,585 13,115.25 901.20 219.01 11,378.71 607.14 9.19 11,852,317 1,102.40Central Valley 14,580.91 191,342,220 13,122.79 195,690,864 13,421.03 967.57 180.93 11,419.67 808.70 44.16 17,004,265 1,166.20Freeman 914.52 11,901,632 13,014.07 12,475,217 13,641.27 1,166.23 675.42 11,149.76 589.11 60.76 1,400,456 1,531.36Cheney 5,183.43 69,488,968 13,405.98 68,652,460 13,244.60 1,172.65 143.20 11,167.62 754.09 7.03 6,741,273 1,300.54East Valley (Spokane) 4,056.96 58,959,907 14,533.03 62,331,481 15,364.09 1,399.06 146.56 12,739.38 1,074.39 4.69 10,732,070 2,645.35Liberty 552.30 7,692,628 13,928.35 8,306,773 15,040.33 2,034.08 244.28 11,933.75 828.22 0.00 1,693,731 3,066.69West Valley (Spokane) 3,707.00 47,202,962 12,733.47 51,644,345 13,931.57 1,256.88 216.57 11,480.01 814.44 163.68 6,505,969 1,755.05Deer Park 2,568.41 31,318,634 12,193.78 33,524,348 13,052.57 652.75 130.84 11,373.68 704.68 190.62 5,715,307 2,225.23Riverside 1,479.08 20,491,058 13,853.92 21,120,167 14,279.26 1,240.34 229.15 11,824.77 971.73 13.26 3,139,199 2,122.40Pride Prep Charter 564.77 7,640,639 13,528.76 7,035,000 12,456.40 0.00 620.34 10,330.97 708.30 796.78 181,143 320.74Spokane International Academy:Charter 459.01 10,063,654 21,924.70 10,138,652 22,088.08 0.00 6,969.76 10,750.04 866.20 3,502.08 796,816 1,735.94County Total 79,161.33 1,071,965,667 13,541.53 1,114,027,636 14,072.88 1,033.69 306.52 11,738.45 923.61 70.59 130,566,108 1,649.37
18
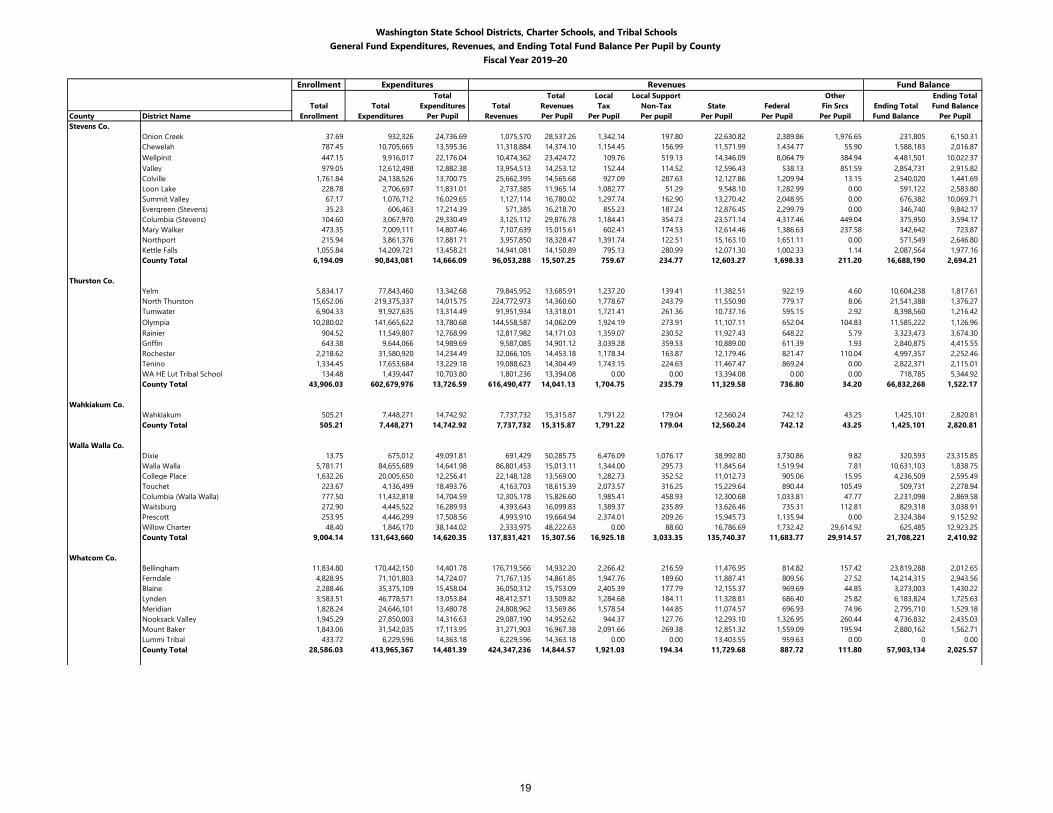
Washington State School Districts, Charter Schools, and Tribal SchoolsGeneral Fund Expenditures, Revenues, and Ending Total Fund Balance Per Pupil by County
Fiscal Year 2019–20
Enrollment Expenditures Revenues Fund BalanceTotal Total Local Local Support Other Ending Total
Total Total Expenditures Total Revenues Tax Non-Tax State Federal Fin Srcs Ending Total Fund BalanceCounty District Name Enrollment Expenditures Per Pupil Revenues Per Pupil Per Pupil Per pupil Per Pupil Per Pupil Per Pupil Fund Balance Per PupilStevens Co.
Onion Creek 37.69 932,326 24,736.69 1,075,570 28,537.26 1,342.14 197.80 22,630.82 2,389.86 1,976.65 231,805 6,150.31Chewelah 787.45 10,705,665 13,595.36 11,318,884 14,374.10 1,154.45 156.99 11,571.99 1,434.77 55.90 1,588,183 2,016.87Wellpinit 447.15 9,916,017 22,176.04 10,474,362 23,424.72 109.76 519.13 14,346.09 8,064.79 384.94 4,481,501 10,022.37Valley 979.05 12,612,498 12,882.38 13,954,513 14,253.12 152.44 114.52 12,596.43 538.13 851.59 2,854,731 2,915.82Colville 1,761.84 24,138,526 13,700.75 25,662,395 14,565.68 927.09 287.63 12,127.86 1,209.94 13.15 2,540,020 1,441.69Loon Lake 228.78 2,706,697 11,831.01 2,737,385 11,965.14 1,082.77 51.29 9,548.10 1,282.99 0.00 591,122 2,583.80Summit Valley 67.17 1,076,712 16,029.65 1,127,114 16,780.02 1,297.74 162.90 13,270.42 2,048.95 0.00 676,382 10,069.71Evergreen (Stevens) 35.23 606,463 17,214.39 571,385 16,218.70 855.23 187.24 12,876.45 2,299.79 0.00 346,740 9,842.17Columbia (Stevens) 104.60 3,067,970 29,330.49 3,125,112 29,876.78 1,184.41 354.73 23,571.14 4,317.46 449.04 375,950 3,594.17Mary Walker 473.35 7,009,111 14,807.46 7,107,639 15,015.61 602.41 174.53 12,614.46 1,386.63 237.58 342,642 723.87Northport 215.94 3,861,376 17,881.71 3,957,850 18,328.47 1,391.74 122.51 15,163.10 1,651.11 0.00 571,549 2,646.80Kettle Falls 1,055.84 14,209,721 13,458.21 14,941,081 14,150.89 795.13 280.99 12,071.30 1,002.33 1.14 2,087,564 1,977.16County Total 6,194.09 90,843,081 14,666.09 96,053,288 15,507.25 759.67 234.77 12,603.27 1,698.33 211.20 16,688,190 2,694.21
Thurston Co.Yelm 5,834.17 77,843,460 13,342.68 79,845,952 13,685.91 1,237.20 139.41 11,382.51 922.19 4.60 10,604,238 1,817.61North Thurston 15,652.06 219,375,337 14,015.75 224,772,973 14,360.60 1,778.67 243.79 11,550.90 779.17 8.06 21,541,388 1,376.27Tumwater 6,904.33 91,927,635 13,314.49 91,951,934 13,318.01 1,721.41 261.36 10,737.16 595.15 2.92 8,398,560 1,216.42Olympia 10,280.02 141,665,622 13,780.68 144,558,587 14,062.09 1,924.19 273.91 11,107.11 652.04 104.83 11,585,222 1,126.96Rainier 904.52 11,549,807 12,768.99 12,817,982 14,171.03 1,359.07 230.52 11,927.43 648.22 5.79 3,323,473 3,674.30Griffin 643.38 9,644,066 14,989.69 9,587,085 14,901.12 3,039.28 359.53 10,889.00 611.39 1.93 2,840,875 4,415.55Rochester 2,218.62 31,580,920 14,234.49 32,066,105 14,453.18 1,178.34 163.87 12,179.46 821.47 110.04 4,997,357 2,252.46Tenino 1,334.45 17,653,684 13,229.18 19,088,623 14,304.49 1,743.15 224.63 11,467.47 869.24 0.00 2,822,371 2,115.01WA HE Lut Tribal School 134.48 1,439,447 10,703.80 1,801,236 13,394.08 0.00 0.00 13,394.08 0.00 0.00 718,785 5,344.92County Total 43,906.03 602,679,976 13,726.59 616,490,477 14,041.13 1,704.75 235.79 11,329.58 736.80 34.20 66,832,268 1,522.17
Wahkiakum Co.Wahkiakum 505.21 7,448,271 14,742.92 7,737,732 15,315.87 1,791.22 179.04 12,560.24 742.12 43.25 1,425,101 2,820.81County Total 505.21 7,448,271 14,742.92 7,737,732 15,315.87 1,791.22 179.04 12,560.24 742.12 43.25 1,425,101 2,820.81
Walla Walla Co.Dixie 13.75 675,012 49,091.81 691,429 50,285.75 6,476.09 1,076.17 38,992.80 3,730.86 9.82 320,593 23,315.85Walla Walla 5,781.71 84,655,689 14,641.98 86,801,453 15,013.11 1,344.00 295.73 11,845.64 1,519.94 7.81 10,631,103 1,838.75College Place 1,632.26 20,005,650 12,256.41 22,148,128 13,569.00 1,282.73 352.52 11,012.73 905.06 15.95 4,236,509 2,595.49Touchet 223.67 4,136,499 18,493.76 4,163,703 18,615.39 2,073.57 316.25 15,229.64 890.44 105.49 509,731 2,278.94Columbia (Walla Walla) 777.50 11,432,818 14,704.59 12,305,178 15,826.60 1,985.41 458.93 12,300.68 1,033.81 47.77 2,231,098 2,869.58Waitsburg 272.90 4,445,522 16,289.93 4,393,643 16,099.83 1,389.37 235.89 13,626.46 735.31 112.81 829,318 3,038.91Prescott 253.95 4,446,299 17,508.56 4,993,910 19,664.94 2,374.01 209.26 15,945.73 1,135.94 0.00 2,324,384 9,152.92Willow Charter 48.40 1,846,170 38,144.02 2,333,975 48,222.63 0.00 88.60 16,786.69 1,732.42 29,614.92 625,485 12,923.25County Total 9,004.14 131,643,660 14,620.35 137,831,421 15,307.56 16,925.18 3,033.35 135,740.37 11,683.77 29,914.57 21,708,221 2,410.92
Whatcom Co.Bellingham 11,834.80 170,442,150 14,401.78 176,719,566 14,932.20 2,266.42 216.59 11,476.95 814.82 157.42 23,819,288 2,012.65Ferndale 4,828.95 71,101,803 14,724.07 71,767,135 14,861.85 1,947.76 189.60 11,887.41 809.56 27.52 14,214,315 2,943.56Blaine 2,288.46 35,375,109 15,458.04 36,050,312 15,753.09 2,405.39 177.79 12,155.37 969.69 44.85 3,273,003 1,430.22Lynden 3,583.51 46,778,571 13,053.84 48,412,571 13,509.82 1,284.68 184.11 11,328.81 686.40 25.82 6,183,824 1,725.63Meridian 1,828.24 24,646,101 13,480.78 24,808,962 13,569.86 1,578.54 144.85 11,074.57 696.93 74.96 2,795,710 1,529.18Nooksack Valley 1,945.29 27,850,003 14,316.63 29,087,190 14,952.62 944.37 127.76 12,293.10 1,326.95 260.44 4,736,832 2,435.03Mount Baker 1,843.06 31,542,035 17,113.95 31,271,903 16,967.38 2,091.66 269.38 12,851.32 1,559.09 195.94 2,880,162 1,562.71Lummi Tribal 433.72 6,229,596 14,363.18 6,229,596 14,363.18 0.00 0.00 13,403.55 959.63 0.00 0 0.00County Total 28,586.03 413,965,367 14,481.39 424,347,236 14,844.57 1,921.03 194.34 11,729.68 887.72 111.80 57,903,134 2,025.57
19
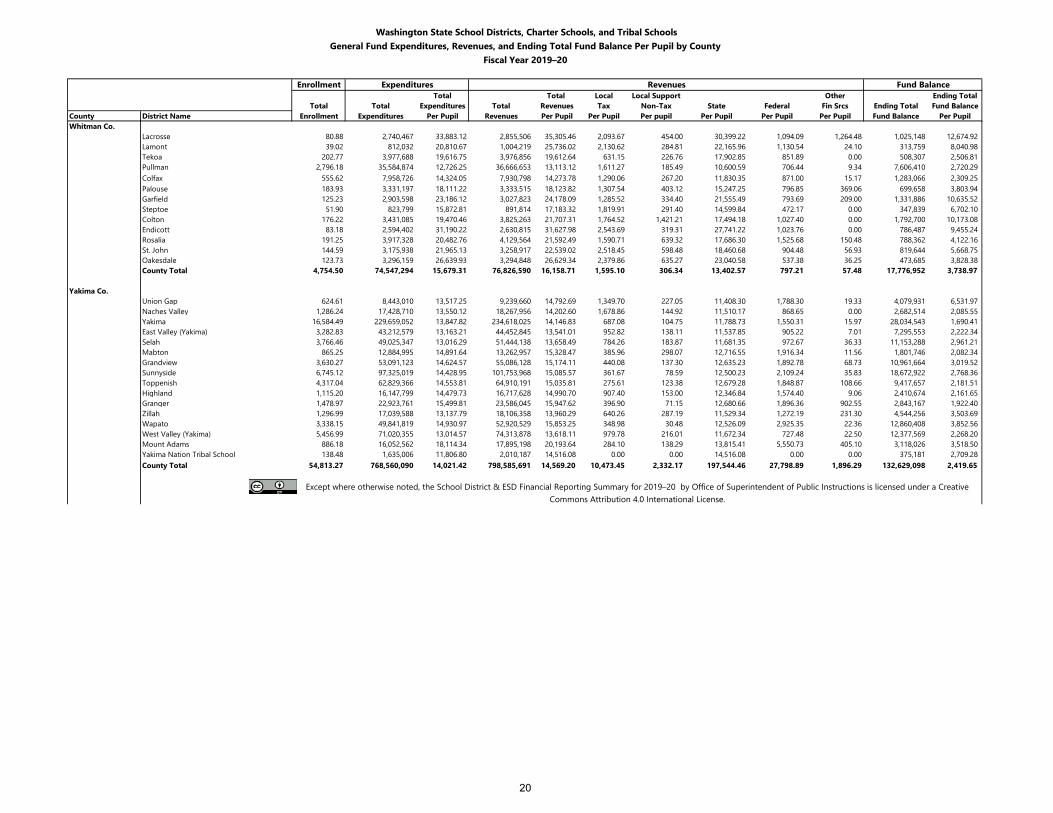
Washington State School Districts, Charter Schools, and Tribal SchoolsGeneral Fund Expenditures, Revenues, and Ending Total Fund Balance Per Pupil by County
Fiscal Year 2019–20
Enrollment Expenditures Revenues Fund BalanceTotal Total Local Local Support Other Ending Total
Total Total Expenditures Total Revenues Tax Non-Tax State Federal Fin Srcs Ending Total Fund BalanceCounty District Name Enrollment Expenditures Per Pupil Revenues Per Pupil Per Pupil Per pupil Per Pupil Per Pupil Per Pupil Fund Balance Per PupilWhitman Co.
Lacrosse 80.88 2,740,467 33,883.12 2,855,506 35,305.46 2,093.67 454.00 30,399.22 1,094.09 1,264.48 1,025,148 12,674.92Lamont 39.02 812,032 20,810.67 1,004,219 25,736.02 2,130.62 284.81 22,165.96 1,130.54 24.10 313,759 8,040.98Tekoa 202.77 3,977,688 19,616.75 3,976,856 19,612.64 631.15 226.76 17,902.85 851.89 0.00 508,307 2,506.81Pullman 2,796.18 35,584,874 12,726.25 36,666,653 13,113.12 1,611.27 185.49 10,600.59 706.44 9.34 7,606,410 2,720.29Colfax 555.62 7,958,726 14,324.05 7,930,798 14,273.78 1,290.06 267.20 11,830.35 871.00 15.17 1,283,066 2,309.25Palouse 183.93 3,331,197 18,111.22 3,333,515 18,123.82 1,307.54 403.12 15,247.25 796.85 369.06 699,658 3,803.94Garfield 125.23 2,903,598 23,186.12 3,027,823 24,178.09 1,285.52 334.40 21,555.49 793.69 209.00 1,331,886 10,635.52Steptoe 51.90 823,799 15,872.81 891,814 17,183.32 1,819.91 291.40 14,599.84 472.17 0.00 347,839 6,702.10Colton 176.22 3,431,085 19,470.46 3,825,263 21,707.31 1,764.52 1,421.21 17,494.18 1,027.40 0.00 1,792,700 10,173.08Endicott 83.18 2,594,402 31,190.22 2,630,815 31,627.98 2,543.69 319.31 27,741.22 1,023.76 0.00 786,487 9,455.24Rosalia 191.25 3,917,328 20,482.76 4,129,564 21,592.49 1,590.71 639.32 17,686.30 1,525.68 150.48 788,362 4,122.16St. John 144.59 3,175,938 21,965.13 3,258,917 22,539.02 2,518.45 598.48 18,460.68 904.48 56.93 819,644 5,668.75Oakesdale 123.73 3,296,159 26,639.93 3,294,848 26,629.34 2,379.86 635.27 23,040.58 537.38 36.25 473,685 3,828.38County Total 4,754.50 74,547,294 15,679.31 76,826,590 16,158.71 1,595.10 306.34 13,402.57 797.21 57.48 17,776,952 3,738.97
Yakima Co.Union Gap 624.61 8,443,010 13,517.25 9,239,660 14,792.69 1,349.70 227.05 11,408.30 1,788.30 19.33 4,079,931 6,531.97Naches Valley 1,286.24 17,428,710 13,550.12 18,267,956 14,202.60 1,678.86 144.92 11,510.17 868.65 0.00 2,682,514 2,085.55Yakima 16,584.49 229,659,052 13,847.82 234,618,025 14,146.83 687.08 104.75 11,788.73 1,550.31 15.97 28,034,543 1,690.41East Valley (Yakima) 3,282.83 43,212,579 13,163.21 44,452,845 13,541.01 952.82 138.11 11,537.85 905.22 7.01 7,295,553 2,222.34Selah 3,766.46 49,025,347 13,016.29 51,444,138 13,658.49 784.26 183.87 11,681.35 972.67 36.33 11,153,288 2,961.21Mabton 865.25 12,884,995 14,891.64 13,262,957 15,328.47 385.96 298.07 12,716.55 1,916.34 11.56 1,801,746 2,082.34Grandview 3,630.27 53,091,123 14,624.57 55,086,128 15,174.11 440.08 137.30 12,635.23 1,892.78 68.73 10,961,664 3,019.52Sunnyside 6,745.12 97,325,019 14,428.95 101,753,968 15,085.57 361.67 78.59 12,500.23 2,109.24 35.83 18,672,922 2,768.36Toppenish 4,317.04 62,829,366 14,553.81 64,910,191 15,035.81 275.61 123.38 12,679.28 1,848.87 108.66 9,417,657 2,181.51Highland 1,115.20 16,147,799 14,479.73 16,717,628 14,990.70 907.40 153.00 12,346.84 1,574.40 9.06 2,410,674 2,161.65Granger 1,478.97 22,923,761 15,499.81 23,586,045 15,947.62 396.90 71.15 12,680.66 1,896.36 902.55 2,843,167 1,922.40Zillah 1,296.99 17,039,588 13,137.79 18,106,358 13,960.29 640.26 287.19 11,529.34 1,272.19 231.30 4,544,256 3,503.69Wapato 3,338.15 49,841,819 14,930.97 52,920,529 15,853.25 348.98 30.48 12,526.09 2,925.35 22.36 12,860,408 3,852.56West Valley (Yakima) 5,456.99 71,020,355 13,014.57 74,313,878 13,618.11 979.78 216.01 11,672.34 727.48 22.50 12,377,569 2,268.20Mount Adams 886.18 16,052,562 18,114.34 17,895,198 20,193.64 284.10 138.29 13,815.41 5,550.73 405.10 3,118,026 3,518.50Yakima Nation Tribal School 138.48 1,635,006 11,806.80 2,010,187 14,516.08 0.00 0.00 14,516.08 0.00 0.00 375,181 2,709.28County Total 54,813.27 768,560,090 14,021.42 798,585,691 14,569.20 10,473.45 2,332.17 197,544.46 27,798.89 1,896.29 132,629,098 2,419.65
Except where otherwise noted, the School District & ESD Financial Reporting Summary for 2019–20 by Office of Superintendent of Public Instructions is licensed under a Creative Commons Attribution 4.0 International License.
20
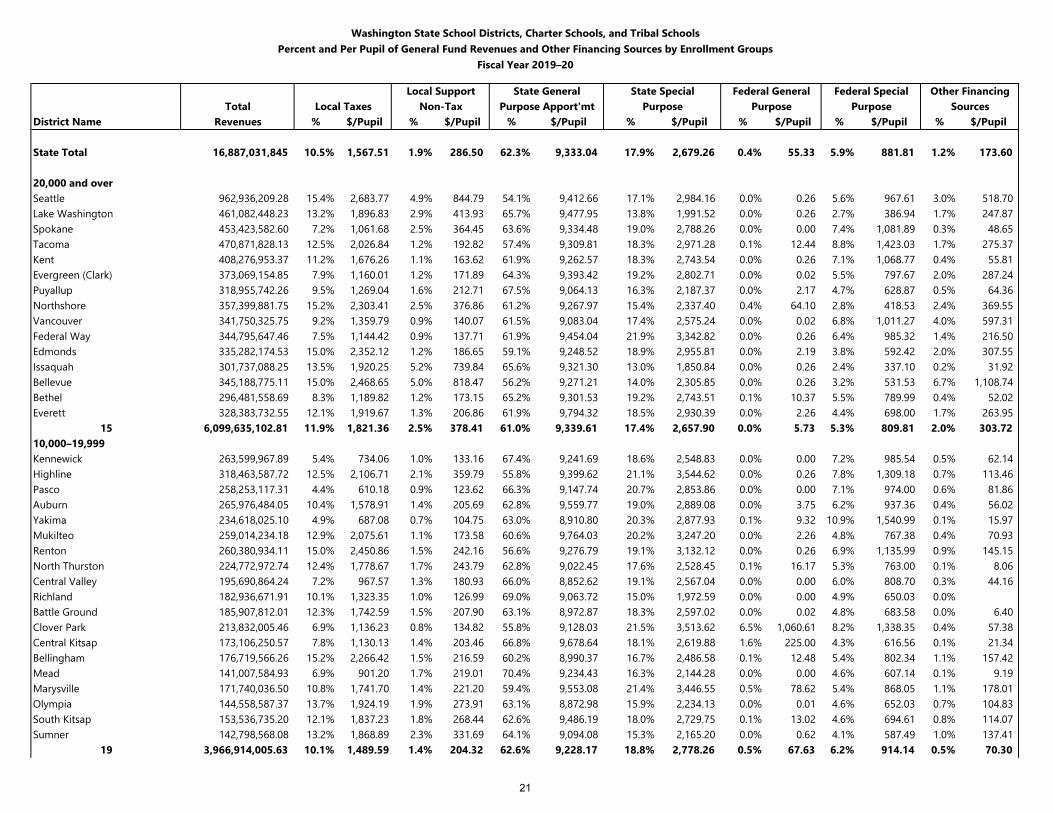
Washington State School Districts, Charter Schools, and Tribal SchoolsPercent and Per Pupil of General Fund Revenues and Other Financing Sources by Enrollment Groups
Fiscal Year 2019–20
Local Support State General State Special Federal General Federal Special Other FinancingTotal Local Taxes Non-Tax Purpose Apport'mt Purpose Purpose Purpose Sources
District Name Revenues % $/Pupil % $/Pupil % $/Pupil % $/Pupil % $/Pupil % $/Pupil % $/Pupil
State Total 16,887,031,845 10.5% 1,567.51 1.9% 286.50 62.3% 9,333.04 17.9% 2,679.26 0.4% 55.33 5.9% 881.81 1.2% 173.60
20,000 and overSeattle 962,936,209.28 15.4% 2,683.77 4.9% 844.79 54.1% 9,412.66 17.1% 2,984.16 0.0% 0.26 5.6% 967.61 3.0% 518.70 Lake Washington 461,082,448.23 13.2% 1,896.83 2.9% 413.93 65.7% 9,477.95 13.8% 1,991.52 0.0% 0.26 2.7% 386.94 1.7% 247.87 Spokane 453,423,582.60 7.2% 1,061.68 2.5% 364.45 63.6% 9,334.48 19.0% 2,788.26 0.0% 0.00 7.4% 1,081.89 0.3% 48.65 Tacoma 470,871,828.13 12.5% 2,026.84 1.2% 192.82 57.4% 9,309.81 18.3% 2,971.28 0.1% 12.44 8.8% 1,423.03 1.7% 275.37 Kent 408,276,953.37 11.2% 1,676.26 1.1% 163.62 61.9% 9,262.57 18.3% 2,743.54 0.0% 0.26 7.1% 1,068.77 0.4% 55.81 Evergreen (Clark) 373,069,154.85 7.9% 1,160.01 1.2% 171.89 64.3% 9,393.42 19.2% 2,802.71 0.0% 0.02 5.5% 797.67 2.0% 287.24 Puyallup 318,955,742.26 9.5% 1,269.04 1.6% 212.71 67.5% 9,064.13 16.3% 2,187.37 0.0% 2.17 4.7% 628.87 0.5% 64.36 Northshore 357,399,881.75 15.2% 2,303.41 2.5% 376.86 61.2% 9,267.97 15.4% 2,337.40 0.4% 64.10 2.8% 418.53 2.4% 369.55 Vancouver 341,750,325.75 9.2% 1,359.79 0.9% 140.07 61.5% 9,083.04 17.4% 2,575.24 0.0% 0.02 6.8% 1,011.27 4.0% 597.31 Federal Way 344,795,647.46 7.5% 1,144.42 0.9% 137.71 61.9% 9,454.04 21.9% 3,342.82 0.0% 0.26 6.4% 985.32 1.4% 216.50 Edmonds 335,282,174.53 15.0% 2,352.12 1.2% 186.65 59.1% 9,248.52 18.9% 2,955.81 0.0% 2.19 3.8% 592.42 2.0% 307.55 Issaquah 301,737,088.25 13.5% 1,920.25 5.2% 739.84 65.6% 9,321.30 13.0% 1,850.84 0.0% 0.26 2.4% 337.10 0.2% 31.92 Bellevue 345,188,775.11 15.0% 2,468.65 5.0% 818.47 56.2% 9,271.21 14.0% 2,305.85 0.0% 0.26 3.2% 531.53 6.7% 1,108.74 Bethel 296,481,558.69 8.3% 1,189.82 1.2% 173.15 65.2% 9,301.53 19.2% 2,743.51 0.1% 10.37 5.5% 789.99 0.4% 52.02 Everett 328,383,732.55 12.1% 1,919.67 1.3% 206.86 61.9% 9,794.32 18.5% 2,930.39 0.0% 2.26 4.4% 698.00 1.7% 263.95
15 6,099,635,102.81 11.9% 1,821.36 2.5% 378.41 61.0% 9,339.61 17.4% 2,657.90 0.0% 5.73 5.3% 809.81 2.0% 303.72 10,000–19,999Kennewick 263,599,967.89 5.4% 734.06 1.0% 133.16 67.4% 9,241.69 18.6% 2,548.83 0.0% 0.00 7.2% 985.54 0.5% 62.14 Highline 318,463,587.72 12.5% 2,106.71 2.1% 359.79 55.8% 9,399.62 21.1% 3,544.62 0.0% 0.26 7.8% 1,309.18 0.7% 113.46 Pasco 258,253,117.31 4.4% 610.18 0.9% 123.62 66.3% 9,147.74 20.7% 2,853.86 0.0% 0.00 7.1% 974.00 0.6% 81.86 Auburn 265,976,484.05 10.4% 1,578.91 1.4% 205.69 62.8% 9,559.77 19.0% 2,889.08 0.0% 3.75 6.2% 937.36 0.4% 56.02 Yakima 234,618,025.10 4.9% 687.08 0.7% 104.75 63.0% 8,910.80 20.3% 2,877.93 0.1% 9.32 10.9% 1,540.99 0.1% 15.97 Mukilteo 259,014,234.18 12.9% 2,075.61 1.1% 173.58 60.6% 9,764.03 20.2% 3,247.20 0.0% 2.26 4.8% 767.38 0.4% 70.93 Renton 260,380,934.11 15.0% 2,450.86 1.5% 242.16 56.6% 9,276.79 19.1% 3,132.12 0.0% 0.26 6.9% 1,135.99 0.9% 145.15 North Thurston 224,772,972.74 12.4% 1,778.67 1.7% 243.79 62.8% 9,022.45 17.6% 2,528.45 0.1% 16.17 5.3% 763.00 0.1% 8.06 Central Valley 195,690,864.24 7.2% 967.57 1.3% 180.93 66.0% 8,852.62 19.1% 2,567.04 0.0% 0.00 6.0% 808.70 0.3% 44.16 Richland 182,936,671.91 10.1% 1,323.35 1.0% 126.99 69.0% 9,063.72 15.0% 1,972.59 0.0% 0.00 4.9% 650.03 0.0% Battle Ground 185,907,812.01 12.3% 1,742.59 1.5% 207.90 63.1% 8,972.87 18.3% 2,597.02 0.0% 0.02 4.8% 683.58 0.0% 6.40 Clover Park 213,832,005.46 6.9% 1,136.23 0.8% 134.82 55.8% 9,128.03 21.5% 3,513.62 6.5% 1,060.61 8.2% 1,338.35 0.4% 57.38 Central Kitsap 173,106,250.57 7.8% 1,130.13 1.4% 203.46 66.8% 9,678.64 18.1% 2,619.88 1.6% 225.00 4.3% 616.56 0.1% 21.34 Bellingham 176,719,566.26 15.2% 2,266.42 1.5% 216.59 60.2% 8,990.37 16.7% 2,486.58 0.1% 12.48 5.4% 802.34 1.1% 157.42 Mead 141,007,584.93 6.9% 901.20 1.7% 219.01 70.4% 9,234.43 16.3% 2,144.28 0.0% 0.00 4.6% 607.14 0.1% 9.19 Marysville 171,740,036.50 10.8% 1,741.70 1.4% 221.20 59.4% 9,553.08 21.4% 3,446.55 0.5% 78.62 5.4% 868.05 1.1% 178.01 Olympia 144,558,587.37 13.7% 1,924.19 1.9% 273.91 63.1% 8,872.98 15.9% 2,234.13 0.0% 0.01 4.6% 652.03 0.7% 104.83 South Kitsap 153,536,735.20 12.1% 1,837.23 1.8% 268.44 62.6% 9,486.19 18.0% 2,729.75 0.1% 13.02 4.6% 694.61 0.8% 114.07 Sumner 142,798,568.08 13.2% 1,868.89 2.3% 331.69 64.1% 9,094.08 15.3% 2,165.20 0.0% 0.62 4.1% 587.49 1.0% 137.41
19 3,966,914,005.63 10.1% 1,489.59 1.4% 204.32 62.6% 9,228.17 18.8% 2,778.26 0.5% 67.63 6.2% 914.14 0.5% 70.30
21
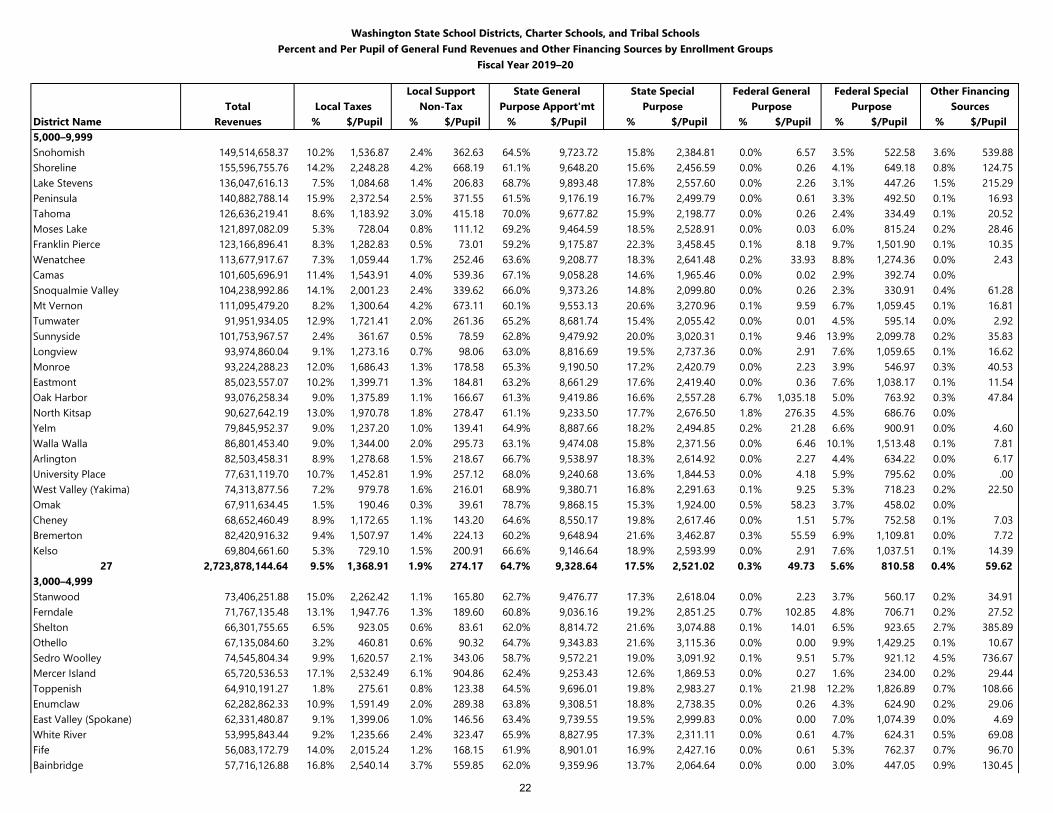
Washington State School Districts, Charter Schools, and Tribal SchoolsPercent and Per Pupil of General Fund Revenues and Other Financing Sources by Enrollment Groups
Fiscal Year 2019–20
Local Support State General State Special Federal General Federal Special Other FinancingTotal Local Taxes Non-Tax Purpose Apport'mt Purpose Purpose Purpose Sources
District Name Revenues % $/Pupil % $/Pupil % $/Pupil % $/Pupil % $/Pupil % $/Pupil % $/Pupil5,000–9,999Snohomish 149,514,658.37 10.2% 1,536.87 2.4% 362.63 64.5% 9,723.72 15.8% 2,384.81 0.0% 6.57 3.5% 522.58 3.6% 539.88 Shoreline 155,596,755.76 14.2% 2,248.28 4.2% 668.19 61.1% 9,648.20 15.6% 2,456.59 0.0% 0.26 4.1% 649.18 0.8% 124.75 Lake Stevens 136,047,616.13 7.5% 1,084.68 1.4% 206.83 68.7% 9,893.48 17.8% 2,557.60 0.0% 2.26 3.1% 447.26 1.5% 215.29 Peninsula 140,882,788.14 15.9% 2,372.54 2.5% 371.55 61.5% 9,176.19 16.7% 2,499.79 0.0% 0.61 3.3% 492.50 0.1% 16.93 Tahoma 126,636,219.41 8.6% 1,183.92 3.0% 415.18 70.0% 9,677.82 15.9% 2,198.77 0.0% 0.26 2.4% 334.49 0.1% 20.52 Moses Lake 121,897,082.09 5.3% 728.04 0.8% 111.12 69.2% 9,464.59 18.5% 2,528.91 0.0% 0.03 6.0% 815.24 0.2% 28.46 Franklin Pierce 123,166,896.41 8.3% 1,282.83 0.5% 73.01 59.2% 9,175.87 22.3% 3,458.45 0.1% 8.18 9.7% 1,501.90 0.1% 10.35 Wenatchee 113,677,917.67 7.3% 1,059.44 1.7% 252.46 63.6% 9,208.77 18.3% 2,641.48 0.2% 33.93 8.8% 1,274.36 0.0% 2.43 Camas 101,605,696.91 11.4% 1,543.91 4.0% 539.36 67.1% 9,058.28 14.6% 1,965.46 0.0% 0.02 2.9% 392.74 0.0% Snoqualmie Valley 104,238,992.86 14.1% 2,001.23 2.4% 339.62 66.0% 9,373.26 14.8% 2,099.80 0.0% 0.26 2.3% 330.91 0.4% 61.28 Mt Vernon 111,095,479.20 8.2% 1,300.64 4.2% 673.11 60.1% 9,553.13 20.6% 3,270.96 0.1% 9.59 6.7% 1,059.45 0.1% 16.81 Tumwater 91,951,934.05 12.9% 1,721.41 2.0% 261.36 65.2% 8,681.74 15.4% 2,055.42 0.0% 0.01 4.5% 595.14 0.0% 2.92 Sunnyside 101,753,967.57 2.4% 361.67 0.5% 78.59 62.8% 9,479.92 20.0% 3,020.31 0.1% 9.46 13.9% 2,099.78 0.2% 35.83 Longview 93,974,860.04 9.1% 1,273.16 0.7% 98.06 63.0% 8,816.69 19.5% 2,737.36 0.0% 2.91 7.6% 1,059.65 0.1% 16.62 Monroe 93,224,288.23 12.0% 1,686.43 1.3% 178.58 65.3% 9,190.50 17.2% 2,420.79 0.0% 2.23 3.9% 546.97 0.3% 40.53 Eastmont 85,023,557.07 10.2% 1,399.71 1.3% 184.81 63.2% 8,661.29 17.6% 2,419.40 0.0% 0.36 7.6% 1,038.17 0.1% 11.54 Oak Harbor 93,076,258.34 9.0% 1,375.89 1.1% 166.67 61.3% 9,419.86 16.6% 2,557.28 6.7% 1,035.18 5.0% 763.92 0.3% 47.84 North Kitsap 90,627,642.19 13.0% 1,970.78 1.8% 278.47 61.1% 9,233.50 17.7% 2,676.50 1.8% 276.35 4.5% 686.76 0.0% Yelm 79,845,952.37 9.0% 1,237.20 1.0% 139.41 64.9% 8,887.66 18.2% 2,494.85 0.2% 21.28 6.6% 900.91 0.0% 4.60 Walla Walla 86,801,453.40 9.0% 1,344.00 2.0% 295.73 63.1% 9,474.08 15.8% 2,371.56 0.0% 6.46 10.1% 1,513.48 0.1% 7.81 Arlington 82,503,458.31 8.9% 1,278.68 1.5% 218.67 66.7% 9,538.97 18.3% 2,614.92 0.0% 2.27 4.4% 634.22 0.0% 6.17 University Place 77,631,119.70 10.7% 1,452.81 1.9% 257.12 68.0% 9,240.68 13.6% 1,844.53 0.0% 4.18 5.9% 795.62 0.0% .00 West Valley (Yakima) 74,313,877.56 7.2% 979.78 1.6% 216.01 68.9% 9,380.71 16.8% 2,291.63 0.1% 9.25 5.3% 718.23 0.2% 22.50 Omak 67,911,634.45 1.5% 190.46 0.3% 39.61 78.7% 9,868.15 15.3% 1,924.00 0.5% 58.23 3.7% 458.02 0.0% Cheney 68,652,460.49 8.9% 1,172.65 1.1% 143.20 64.6% 8,550.17 19.8% 2,617.46 0.0% 1.51 5.7% 752.58 0.1% 7.03 Bremerton 82,420,916.32 9.4% 1,507.97 1.4% 224.13 60.2% 9,648.94 21.6% 3,462.87 0.3% 55.59 6.9% 1,109.81 0.0% 7.72 Kelso 69,804,661.60 5.3% 729.10 1.5% 200.91 66.6% 9,146.64 18.9% 2,593.99 0.0% 2.91 7.6% 1,037.51 0.1% 14.39
27 2,723,878,144.64 9.5% 1,368.91 1.9% 274.17 64.7% 9,328.64 17.5% 2,521.02 0.3% 49.73 5.6% 810.58 0.4% 59.62 3,000–4,999Stanwood 73,406,251.88 15.0% 2,262.42 1.1% 165.80 62.7% 9,476.77 17.3% 2,618.04 0.0% 2.23 3.7% 560.17 0.2% 34.91 Ferndale 71,767,135.48 13.1% 1,947.76 1.3% 189.60 60.8% 9,036.16 19.2% 2,851.25 0.7% 102.85 4.8% 706.71 0.2% 27.52 Shelton 66,301,755.65 6.5% 923.05 0.6% 83.61 62.0% 8,814.72 21.6% 3,074.88 0.1% 14.01 6.5% 923.65 2.7% 385.89 Othello 67,135,084.60 3.2% 460.81 0.6% 90.32 64.7% 9,343.83 21.6% 3,115.36 0.0% 0.00 9.9% 1,429.25 0.1% 10.67 Sedro Woolley 74,545,804.34 9.9% 1,620.57 2.1% 343.06 58.7% 9,572.21 19.0% 3,091.92 0.1% 9.51 5.7% 921.12 4.5% 736.67 Mercer Island 65,720,536.53 17.1% 2,532.49 6.1% 904.86 62.4% 9,253.43 12.6% 1,869.53 0.0% 0.27 1.6% 234.00 0.2% 29.44 Toppenish 64,910,191.27 1.8% 275.61 0.8% 123.38 64.5% 9,696.01 19.8% 2,983.27 0.1% 21.98 12.2% 1,826.89 0.7% 108.66 Enumclaw 62,282,862.33 10.9% 1,591.49 2.0% 289.38 63.8% 9,308.51 18.8% 2,738.35 0.0% 0.26 4.3% 624.90 0.2% 29.06 East Valley (Spokane) 62,331,480.87 9.1% 1,399.06 1.0% 146.56 63.4% 9,739.55 19.5% 2,999.83 0.0% 0.00 7.0% 1,074.39 0.0% 4.69 White River 53,995,843.44 9.2% 1,235.66 2.4% 323.47 65.9% 8,827.95 17.3% 2,311.11 0.0% 0.61 4.7% 624.31 0.5% 69.08 Fife 56,083,172.79 14.0% 2,015.24 1.2% 168.15 61.9% 8,901.01 16.9% 2,427.16 0.0% 0.61 5.3% 762.37 0.7% 96.70 Bainbridge 57,716,126.88 16.8% 2,540.14 3.7% 559.85 62.0% 9,359.96 13.7% 2,064.64 0.0% 0.00 3.0% 447.05 0.9% 130.45
22
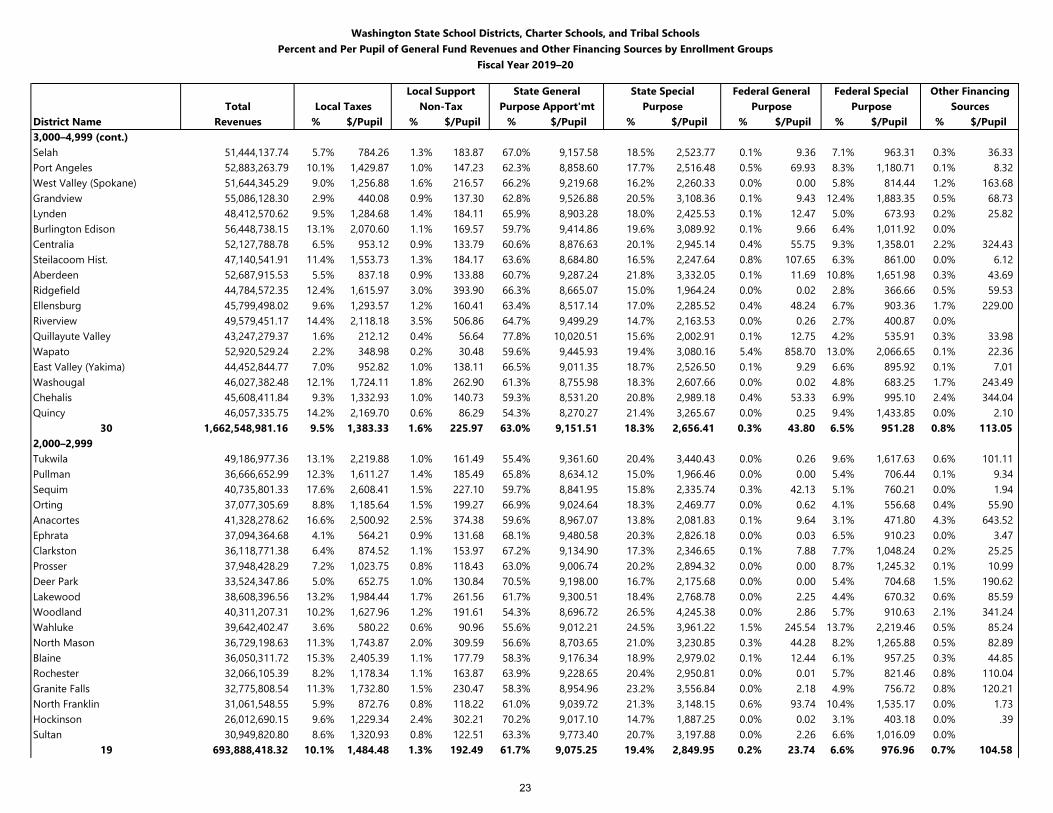
Washington State School Districts, Charter Schools, and Tribal SchoolsPercent and Per Pupil of General Fund Revenues and Other Financing Sources by Enrollment Groups
Fiscal Year 2019–20
Local Support State General State Special Federal General Federal Special Other FinancingTotal Local Taxes Non-Tax Purpose Apport'mt Purpose Purpose Purpose Sources
District Name Revenues % $/Pupil % $/Pupil % $/Pupil % $/Pupil % $/Pupil % $/Pupil % $/Pupil3,000–4,999 (cont.)Selah 51,444,137.74 5.7% 784.26 1.3% 183.87 67.0% 9,157.58 18.5% 2,523.77 0.1% 9.36 7.1% 963.31 0.3% 36.33 Port Angeles 52,883,263.79 10.1% 1,429.87 1.0% 147.23 62.3% 8,858.60 17.7% 2,516.48 0.5% 69.93 8.3% 1,180.71 0.1% 8.32 West Valley (Spokane) 51,644,345.29 9.0% 1,256.88 1.6% 216.57 66.2% 9,219.68 16.2% 2,260.33 0.0% 0.00 5.8% 814.44 1.2% 163.68 Grandview 55,086,128.30 2.9% 440.08 0.9% 137.30 62.8% 9,526.88 20.5% 3,108.36 0.1% 9.43 12.4% 1,883.35 0.5% 68.73 Lynden 48,412,570.62 9.5% 1,284.68 1.4% 184.11 65.9% 8,903.28 18.0% 2,425.53 0.1% 12.47 5.0% 673.93 0.2% 25.82 Burlington Edison 56,448,738.15 13.1% 2,070.60 1.1% 169.57 59.7% 9,414.86 19.6% 3,089.92 0.1% 9.66 6.4% 1,011.92 0.0% Centralia 52,127,788.78 6.5% 953.12 0.9% 133.79 60.6% 8,876.63 20.1% 2,945.14 0.4% 55.75 9.3% 1,358.01 2.2% 324.43 Steilacoom Hist. 47,140,541.91 11.4% 1,553.73 1.3% 184.17 63.6% 8,684.80 16.5% 2,247.64 0.8% 107.65 6.3% 861.00 0.0% 6.12 Aberdeen 52,687,915.53 5.5% 837.18 0.9% 133.88 60.7% 9,287.24 21.8% 3,332.05 0.1% 11.69 10.8% 1,651.98 0.3% 43.69 Ridgefield 44,784,572.35 12.4% 1,615.97 3.0% 393.90 66.3% 8,665.07 15.0% 1,964.24 0.0% 0.02 2.8% 366.66 0.5% 59.53 Ellensburg 45,799,498.02 9.6% 1,293.57 1.2% 160.41 63.4% 8,517.14 17.0% 2,285.52 0.4% 48.24 6.7% 903.36 1.7% 229.00 Riverview 49,579,451.17 14.4% 2,118.18 3.5% 506.86 64.7% 9,499.29 14.7% 2,163.53 0.0% 0.26 2.7% 400.87 0.0% Quillayute Valley 43,247,279.37 1.6% 212.12 0.4% 56.64 77.8% 10,020.51 15.6% 2,002.91 0.1% 12.75 4.2% 535.91 0.3% 33.98 Wapato 52,920,529.24 2.2% 348.98 0.2% 30.48 59.6% 9,445.93 19.4% 3,080.16 5.4% 858.70 13.0% 2,066.65 0.1% 22.36 East Valley (Yakima) 44,452,844.77 7.0% 952.82 1.0% 138.11 66.5% 9,011.35 18.7% 2,526.50 0.1% 9.29 6.6% 895.92 0.1% 7.01 Washougal 46,027,382.48 12.1% 1,724.11 1.8% 262.90 61.3% 8,755.98 18.3% 2,607.66 0.0% 0.02 4.8% 683.25 1.7% 243.49 Chehalis 45,608,411.84 9.3% 1,332.93 1.0% 140.73 59.3% 8,531.20 20.8% 2,989.18 0.4% 53.33 6.9% 995.10 2.4% 344.04 Quincy 46,057,335.75 14.2% 2,169.70 0.6% 86.29 54.3% 8,270.27 21.4% 3,265.67 0.0% 0.25 9.4% 1,433.85 0.0% 2.10
30 1,662,548,981.16 9.5% 1,383.33 1.6% 225.97 63.0% 9,151.51 18.3% 2,656.41 0.3% 43.80 6.5% 951.28 0.8% 113.05 2,000–2,999Tukwila 49,186,977.36 13.1% 2,219.88 1.0% 161.49 55.4% 9,361.60 20.4% 3,440.43 0.0% 0.26 9.6% 1,617.63 0.6% 101.11 Pullman 36,666,652.99 12.3% 1,611.27 1.4% 185.49 65.8% 8,634.12 15.0% 1,966.46 0.0% 0.00 5.4% 706.44 0.1% 9.34 Sequim 40,735,801.33 17.6% 2,608.41 1.5% 227.10 59.7% 8,841.95 15.8% 2,335.74 0.3% 42.13 5.1% 760.21 0.0% 1.94 Orting 37,077,305.69 8.8% 1,185.64 1.5% 199.27 66.9% 9,024.64 18.3% 2,469.77 0.0% 0.62 4.1% 556.68 0.4% 55.90 Anacortes 41,328,278.62 16.6% 2,500.92 2.5% 374.38 59.6% 8,967.07 13.8% 2,081.83 0.1% 9.64 3.1% 471.80 4.3% 643.52 Ephrata 37,094,364.68 4.1% 564.21 0.9% 131.68 68.1% 9,480.58 20.3% 2,826.18 0.0% 0.03 6.5% 910.23 0.0% 3.47 Clarkston 36,118,771.38 6.4% 874.52 1.1% 153.97 67.2% 9,134.90 17.3% 2,346.65 0.1% 7.88 7.7% 1,048.24 0.2% 25.25 Prosser 37,948,428.29 7.2% 1,023.75 0.8% 118.43 63.0% 9,006.74 20.2% 2,894.32 0.0% 0.00 8.7% 1,245.32 0.1% 10.99 Deer Park 33,524,347.86 5.0% 652.75 1.0% 130.84 70.5% 9,198.00 16.7% 2,175.68 0.0% 0.00 5.4% 704.68 1.5% 190.62 Lakewood 38,608,396.56 13.2% 1,984.44 1.7% 261.56 61.7% 9,300.51 18.4% 2,768.78 0.0% 2.25 4.4% 670.32 0.6% 85.59 Woodland 40,311,207.31 10.2% 1,627.96 1.2% 191.61 54.3% 8,696.72 26.5% 4,245.38 0.0% 2.86 5.7% 910.63 2.1% 341.24 Wahluke 39,642,402.47 3.6% 580.22 0.6% 90.96 55.6% 9,012.21 24.5% 3,961.22 1.5% 245.54 13.7% 2,219.46 0.5% 85.24 North Mason 36,729,198.63 11.3% 1,743.87 2.0% 309.59 56.6% 8,703.65 21.0% 3,230.85 0.3% 44.28 8.2% 1,265.88 0.5% 82.89 Blaine 36,050,311.72 15.3% 2,405.39 1.1% 177.79 58.3% 9,176.34 18.9% 2,979.02 0.1% 12.44 6.1% 957.25 0.3% 44.85 Rochester 32,066,105.39 8.2% 1,178.34 1.1% 163.87 63.9% 9,228.65 20.4% 2,950.81 0.0% 0.01 5.7% 821.46 0.8% 110.04 Granite Falls 32,775,808.54 11.3% 1,732.80 1.5% 230.47 58.3% 8,954.96 23.2% 3,556.84 0.0% 2.18 4.9% 756.72 0.8% 120.21 North Franklin 31,061,548.55 5.9% 872.76 0.8% 118.22 61.0% 9,039.72 21.3% 3,148.15 0.6% 93.74 10.4% 1,535.17 0.0% 1.73 Hockinson 26,012,690.15 9.6% 1,229.34 2.4% 302.21 70.2% 9,017.10 14.7% 1,887.25 0.0% 0.02 3.1% 403.18 0.0% .39 Sultan 30,949,820.80 8.6% 1,320.93 0.8% 122.51 63.3% 9,773.40 20.7% 3,197.88 0.0% 2.26 6.6% 1,016.09 0.0%
19 693,888,418.32 10.1% 1,484.48 1.3% 192.49 61.7% 9,075.25 19.4% 2,849.95 0.2% 23.74 6.6% 976.96 0.7% 104.58
23
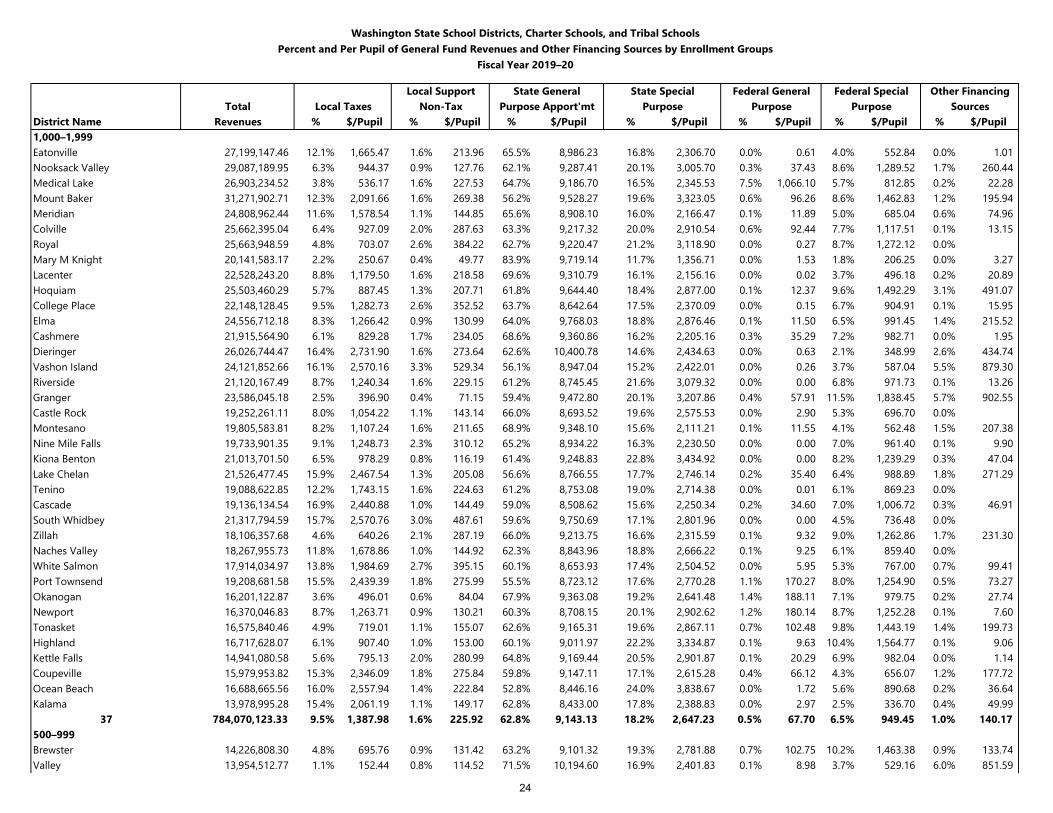
Washington State School Districts, Charter Schools, and Tribal SchoolsPercent and Per Pupil of General Fund Revenues and Other Financing Sources by Enrollment Groups
Fiscal Year 2019–20
Local Support State General State Special Federal General Federal Special Other FinancingTotal Local Taxes Non-Tax Purpose Apport'mt Purpose Purpose Purpose Sources
District Name Revenues % $/Pupil % $/Pupil % $/Pupil % $/Pupil % $/Pupil % $/Pupil % $/Pupil1,000–1,999Eatonville 27,199,147.46 12.1% 1,665.47 1.6% 213.96 65.5% 8,986.23 16.8% 2,306.70 0.0% 0.61 4.0% 552.84 0.0% 1.01 Nooksack Valley 29,087,189.95 6.3% 944.37 0.9% 127.76 62.1% 9,287.41 20.1% 3,005.70 0.3% 37.43 8.6% 1,289.52 1.7% 260.44 Medical Lake 26,903,234.52 3.8% 536.17 1.6% 227.53 64.7% 9,186.70 16.5% 2,345.53 7.5% 1,066.10 5.7% 812.85 0.2% 22.28 Mount Baker 31,271,902.71 12.3% 2,091.66 1.6% 269.38 56.2% 9,528.27 19.6% 3,323.05 0.6% 96.26 8.6% 1,462.83 1.2% 195.94 Meridian 24,808,962.44 11.6% 1,578.54 1.1% 144.85 65.6% 8,908.10 16.0% 2,166.47 0.1% 11.89 5.0% 685.04 0.6% 74.96 Colville 25,662,395.04 6.4% 927.09 2.0% 287.63 63.3% 9,217.32 20.0% 2,910.54 0.6% 92.44 7.7% 1,117.51 0.1% 13.15 Royal 25,663,948.59 4.8% 703.07 2.6% 384.22 62.7% 9,220.47 21.2% 3,118.90 0.0% 0.27 8.7% 1,272.12 0.0% Mary M Knight 20,141,583.17 2.2% 250.67 0.4% 49.77 83.9% 9,719.14 11.7% 1,356.71 0.0% 1.53 1.8% 206.25 0.0% 3.27 Lacenter 22,528,243.20 8.8% 1,179.50 1.6% 218.58 69.6% 9,310.79 16.1% 2,156.16 0.0% 0.02 3.7% 496.18 0.2% 20.89 Hoquiam 25,503,460.29 5.7% 887.45 1.3% 207.71 61.8% 9,644.40 18.4% 2,877.00 0.1% 12.37 9.6% 1,492.29 3.1% 491.07 College Place 22,148,128.45 9.5% 1,282.73 2.6% 352.52 63.7% 8,642.64 17.5% 2,370.09 0.0% 0.15 6.7% 904.91 0.1% 15.95 Elma 24,556,712.18 8.3% 1,266.42 0.9% 130.99 64.0% 9,768.03 18.8% 2,876.46 0.1% 11.50 6.5% 991.45 1.4% 215.52 Cashmere 21,915,564.90 6.1% 829.28 1.7% 234.05 68.6% 9,360.86 16.2% 2,205.16 0.3% 35.29 7.2% 982.71 0.0% 1.95 Dieringer 26,026,744.47 16.4% 2,731.90 1.6% 273.64 62.6% 10,400.78 14.6% 2,434.63 0.0% 0.63 2.1% 348.99 2.6% 434.74 Vashon Island 24,121,852.66 16.1% 2,570.16 3.3% 529.34 56.1% 8,947.04 15.2% 2,422.01 0.0% 0.26 3.7% 587.04 5.5% 879.30 Riverside 21,120,167.49 8.7% 1,240.34 1.6% 229.15 61.2% 8,745.45 21.6% 3,079.32 0.0% 0.00 6.8% 971.73 0.1% 13.26 Granger 23,586,045.18 2.5% 396.90 0.4% 71.15 59.4% 9,472.80 20.1% 3,207.86 0.4% 57.91 11.5% 1,838.45 5.7% 902.55 Castle Rock 19,252,261.11 8.0% 1,054.22 1.1% 143.14 66.0% 8,693.52 19.6% 2,575.53 0.0% 2.90 5.3% 696.70 0.0% Montesano 19,805,583.81 8.2% 1,107.24 1.6% 211.65 68.9% 9,348.10 15.6% 2,111.21 0.1% 11.55 4.1% 562.48 1.5% 207.38 Nine Mile Falls 19,733,901.35 9.1% 1,248.73 2.3% 310.12 65.2% 8,934.22 16.3% 2,230.50 0.0% 0.00 7.0% 961.40 0.1% 9.90 Kiona Benton 21,013,701.50 6.5% 978.29 0.8% 116.19 61.4% 9,248.83 22.8% 3,434.92 0.0% 0.00 8.2% 1,239.29 0.3% 47.04 Lake Chelan 21,526,477.45 15.9% 2,467.54 1.3% 205.08 56.6% 8,766.55 17.7% 2,746.14 0.2% 35.40 6.4% 988.89 1.8% 271.29 Tenino 19,088,622.85 12.2% 1,743.15 1.6% 224.63 61.2% 8,753.08 19.0% 2,714.38 0.0% 0.01 6.1% 869.23 0.0% Cascade 19,136,134.54 16.9% 2,440.88 1.0% 144.49 59.0% 8,508.62 15.6% 2,250.34 0.2% 34.60 7.0% 1,006.72 0.3% 46.91 South Whidbey 21,317,794.59 15.7% 2,570.76 3.0% 487.61 59.6% 9,750.69 17.1% 2,801.96 0.0% 0.00 4.5% 736.48 0.0% Zillah 18,106,357.68 4.6% 640.26 2.1% 287.19 66.0% 9,213.75 16.6% 2,315.59 0.1% 9.32 9.0% 1,262.86 1.7% 231.30 Naches Valley 18,267,955.73 11.8% 1,678.86 1.0% 144.92 62.3% 8,843.96 18.8% 2,666.22 0.1% 9.25 6.1% 859.40 0.0% White Salmon 17,914,034.97 13.8% 1,984.69 2.7% 395.15 60.1% 8,653.93 17.4% 2,504.52 0.0% 5.95 5.3% 767.00 0.7% 99.41 Port Townsend 19,208,681.58 15.5% 2,439.39 1.8% 275.99 55.5% 8,723.12 17.6% 2,770.28 1.1% 170.27 8.0% 1,254.90 0.5% 73.27 Okanogan 16,201,122.87 3.6% 496.01 0.6% 84.04 67.9% 9,363.08 19.2% 2,641.48 1.4% 188.11 7.1% 979.75 0.2% 27.74 Newport 16,370,046.83 8.7% 1,263.71 0.9% 130.21 60.3% 8,708.15 20.1% 2,902.62 1.2% 180.14 8.7% 1,252.28 0.1% 7.60 Tonasket 16,575,840.46 4.9% 719.01 1.1% 155.07 62.6% 9,165.31 19.6% 2,867.11 0.7% 102.48 9.8% 1,443.19 1.4% 199.73 Highland 16,717,628.07 6.1% 907.40 1.0% 153.00 60.1% 9,011.97 22.2% 3,334.87 0.1% 9.63 10.4% 1,564.77 0.1% 9.06 Kettle Falls 14,941,080.58 5.6% 795.13 2.0% 280.99 64.8% 9,169.44 20.5% 2,901.87 0.1% 20.29 6.9% 982.04 0.0% 1.14 Coupeville 15,979,953.82 15.3% 2,346.09 1.8% 275.84 59.8% 9,147.11 17.1% 2,615.28 0.4% 66.12 4.3% 656.07 1.2% 177.72 Ocean Beach 16,688,665.56 16.0% 2,557.94 1.4% 222.84 52.8% 8,446.16 24.0% 3,838.67 0.0% 1.72 5.6% 890.68 0.2% 36.64 Kalama 13,978,995.28 15.4% 2,061.19 1.1% 149.17 62.8% 8,433.00 17.8% 2,388.83 0.0% 2.97 2.5% 336.70 0.4% 49.99
37 784,070,123.33 9.5% 1,387.98 1.6% 225.92 62.8% 9,143.13 18.2% 2,647.23 0.5% 67.70 6.5% 949.45 1.0% 140.17 500–999Brewster 14,226,808.30 4.8% 695.76 0.9% 131.42 63.2% 9,101.32 19.3% 2,781.88 0.7% 102.75 10.2% 1,463.38 0.9% 133.74 Valley 13,954,512.77 1.1% 152.44 0.8% 114.52 71.5% 10,194.60 16.9% 2,401.83 0.1% 8.98 3.7% 529.16 6.0% 851.59
24
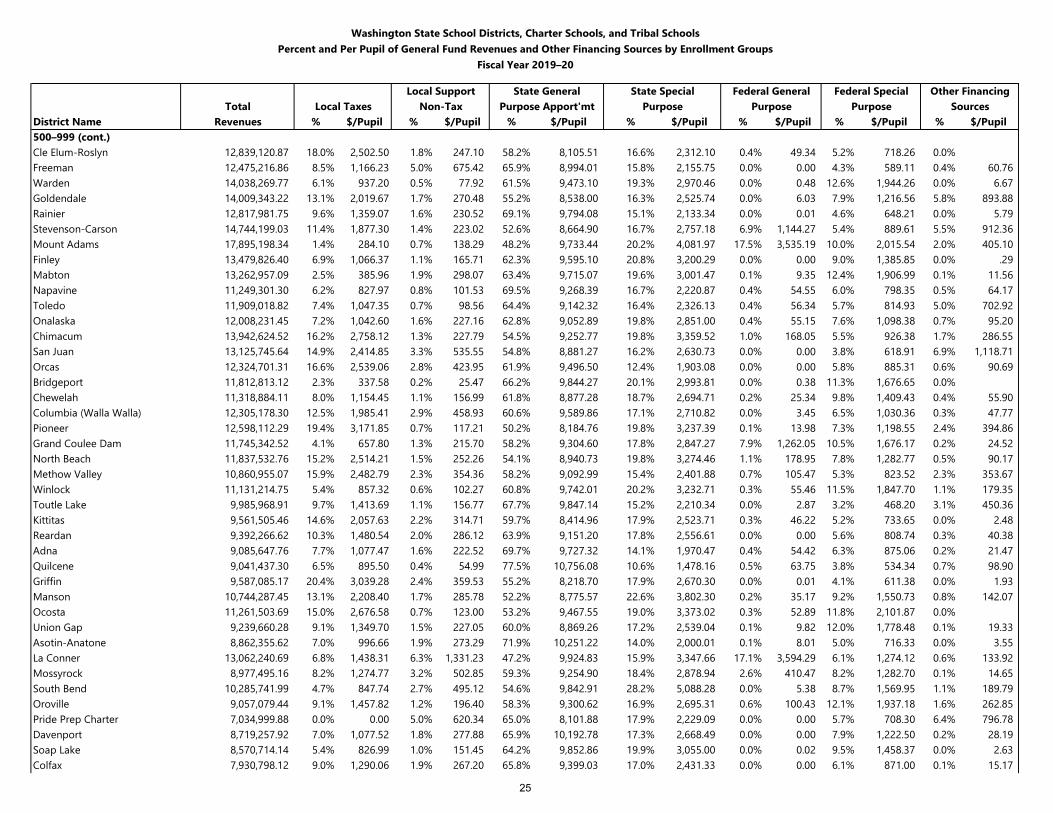
Washington State School Districts, Charter Schools, and Tribal SchoolsPercent and Per Pupil of General Fund Revenues and Other Financing Sources by Enrollment Groups
Fiscal Year 2019–20
Local Support State General State Special Federal General Federal Special Other FinancingTotal Local Taxes Non-Tax Purpose Apport'mt Purpose Purpose Purpose Sources
District Name Revenues % $/Pupil % $/Pupil % $/Pupil % $/Pupil % $/Pupil % $/Pupil % $/Pupil500–999 (cont.)Cle Elum-Roslyn 12,839,120.87 18.0% 2,502.50 1.8% 247.10 58.2% 8,105.51 16.6% 2,312.10 0.4% 49.34 5.2% 718.26 0.0% Freeman 12,475,216.86 8.5% 1,166.23 5.0% 675.42 65.9% 8,994.01 15.8% 2,155.75 0.0% 0.00 4.3% 589.11 0.4% 60.76 Warden 14,038,269.77 6.1% 937.20 0.5% 77.92 61.5% 9,473.10 19.3% 2,970.46 0.0% 0.48 12.6% 1,944.26 0.0% 6.67 Goldendale 14,009,343.22 13.1% 2,019.67 1.7% 270.48 55.2% 8,538.00 16.3% 2,525.74 0.0% 6.03 7.9% 1,216.56 5.8% 893.88 Rainier 12,817,981.75 9.6% 1,359.07 1.6% 230.52 69.1% 9,794.08 15.1% 2,133.34 0.0% 0.01 4.6% 648.21 0.0% 5.79 Stevenson-Carson 14,744,199.03 11.4% 1,877.30 1.4% 223.02 52.6% 8,664.90 16.7% 2,757.18 6.9% 1,144.27 5.4% 889.61 5.5% 912.36 Mount Adams 17,895,198.34 1.4% 284.10 0.7% 138.29 48.2% 9,733.44 20.2% 4,081.97 17.5% 3,535.19 10.0% 2,015.54 2.0% 405.10 Finley 13,479,826.40 6.9% 1,066.37 1.1% 165.71 62.3% 9,595.10 20.8% 3,200.29 0.0% 0.00 9.0% 1,385.85 0.0% .29 Mabton 13,262,957.09 2.5% 385.96 1.9% 298.07 63.4% 9,715.07 19.6% 3,001.47 0.1% 9.35 12.4% 1,906.99 0.1% 11.56 Napavine 11,249,301.30 6.2% 827.97 0.8% 101.53 69.5% 9,268.39 16.7% 2,220.87 0.4% 54.55 6.0% 798.35 0.5% 64.17 Toledo 11,909,018.82 7.4% 1,047.35 0.7% 98.56 64.4% 9,142.32 16.4% 2,326.13 0.4% 56.34 5.7% 814.93 5.0% 702.92 Onalaska 12,008,231.45 7.2% 1,042.60 1.6% 227.16 62.8% 9,052.89 19.8% 2,851.00 0.4% 55.15 7.6% 1,098.38 0.7% 95.20 Chimacum 13,942,624.52 16.2% 2,758.12 1.3% 227.79 54.5% 9,252.77 19.8% 3,359.52 1.0% 168.05 5.5% 926.38 1.7% 286.55 San Juan 13,125,745.64 14.9% 2,414.85 3.3% 535.55 54.8% 8,881.27 16.2% 2,630.73 0.0% 0.00 3.8% 618.91 6.9% 1,118.71 Orcas 12,324,701.31 16.6% 2,539.06 2.8% 423.95 61.9% 9,496.50 12.4% 1,903.08 0.0% 0.00 5.8% 885.31 0.6% 90.69 Bridgeport 11,812,813.12 2.3% 337.58 0.2% 25.47 66.2% 9,844.27 20.1% 2,993.81 0.0% 0.38 11.3% 1,676.65 0.0% Chewelah 11,318,884.11 8.0% 1,154.45 1.1% 156.99 61.8% 8,877.28 18.7% 2,694.71 0.2% 25.34 9.8% 1,409.43 0.4% 55.90 Columbia (Walla Walla) 12,305,178.30 12.5% 1,985.41 2.9% 458.93 60.6% 9,589.86 17.1% 2,710.82 0.0% 3.45 6.5% 1,030.36 0.3% 47.77 Pioneer 12,598,112.29 19.4% 3,171.85 0.7% 117.21 50.2% 8,184.76 19.8% 3,237.39 0.1% 13.98 7.3% 1,198.55 2.4% 394.86 Grand Coulee Dam 11,745,342.52 4.1% 657.80 1.3% 215.70 58.2% 9,304.60 17.8% 2,847.27 7.9% 1,262.05 10.5% 1,676.17 0.2% 24.52 North Beach 11,837,532.76 15.2% 2,514.21 1.5% 252.26 54.1% 8,940.73 19.8% 3,274.46 1.1% 178.95 7.8% 1,282.77 0.5% 90.17 Methow Valley 10,860,955.07 15.9% 2,482.79 2.3% 354.36 58.2% 9,092.99 15.4% 2,401.88 0.7% 105.47 5.3% 823.52 2.3% 353.67 Winlock 11,131,214.75 5.4% 857.32 0.6% 102.27 60.8% 9,742.01 20.2% 3,232.71 0.3% 55.46 11.5% 1,847.70 1.1% 179.35 Toutle Lake 9,985,968.91 9.7% 1,413.69 1.1% 156.77 67.7% 9,847.14 15.2% 2,210.34 0.0% 2.87 3.2% 468.20 3.1% 450.36 Kittitas 9,561,505.46 14.6% 2,057.63 2.2% 314.71 59.7% 8,414.96 17.9% 2,523.71 0.3% 46.22 5.2% 733.65 0.0% 2.48 Reardan 9,392,266.62 10.3% 1,480.54 2.0% 286.12 63.9% 9,151.20 17.8% 2,556.61 0.0% 0.00 5.6% 808.74 0.3% 40.38 Adna 9,085,647.76 7.7% 1,077.47 1.6% 222.52 69.7% 9,727.32 14.1% 1,970.47 0.4% 54.42 6.3% 875.06 0.2% 21.47 Quilcene 9,041,437.30 6.5% 895.50 0.4% 54.99 77.5% 10,756.08 10.6% 1,478.16 0.5% 63.75 3.8% 534.34 0.7% 98.90 Griffin 9,587,085.17 20.4% 3,039.28 2.4% 359.53 55.2% 8,218.70 17.9% 2,670.30 0.0% 0.01 4.1% 611.38 0.0% 1.93 Manson 10,744,287.45 13.1% 2,208.40 1.7% 285.78 52.2% 8,775.57 22.6% 3,802.30 0.2% 35.17 9.2% 1,550.73 0.8% 142.07 Ocosta 11,261,503.69 15.0% 2,676.58 0.7% 123.00 53.2% 9,467.55 19.0% 3,373.02 0.3% 52.89 11.8% 2,101.87 0.0% Union Gap 9,239,660.28 9.1% 1,349.70 1.5% 227.05 60.0% 8,869.26 17.2% 2,539.04 0.1% 9.82 12.0% 1,778.48 0.1% 19.33 Asotin-Anatone 8,862,355.62 7.0% 996.66 1.9% 273.29 71.9% 10,251.22 14.0% 2,000.01 0.1% 8.01 5.0% 716.33 0.0% 3.55 La Conner 13,062,240.69 6.8% 1,438.31 6.3% 1,331.23 47.2% 9,924.83 15.9% 3,347.66 17.1% 3,594.29 6.1% 1,274.12 0.6% 133.92 Mossyrock 8,977,495.16 8.2% 1,274.77 3.2% 502.85 59.3% 9,254.90 18.4% 2,878.94 2.6% 410.47 8.2% 1,282.70 0.1% 14.65 South Bend 10,285,741.99 4.7% 847.74 2.7% 495.12 54.6% 9,842.91 28.2% 5,088.28 0.0% 5.38 8.7% 1,569.95 1.1% 189.79 Oroville 9,057,079.44 9.1% 1,457.82 1.2% 196.40 58.3% 9,300.62 16.9% 2,695.31 0.6% 100.43 12.1% 1,937.18 1.6% 262.85 Pride Prep Charter 7,034,999.88 0.0% 0.00 5.0% 620.34 65.0% 8,101.88 17.9% 2,229.09 0.0% 0.00 5.7% 708.30 6.4% 796.78 Davenport 8,719,257.92 7.0% 1,077.52 1.8% 277.88 65.9% 10,192.78 17.3% 2,668.49 0.0% 0.00 7.9% 1,222.50 0.2% 28.19 Soap Lake 8,570,714.14 5.4% 826.99 1.0% 151.45 64.2% 9,852.86 19.9% 3,055.00 0.0% 0.02 9.5% 1,458.37 0.0% 2.63 Colfax 7,930,798.12 9.0% 1,290.06 1.9% 267.20 65.8% 9,399.03 17.0% 2,431.33 0.0% 0.00 6.1% 871.00 0.1% 15.17
25
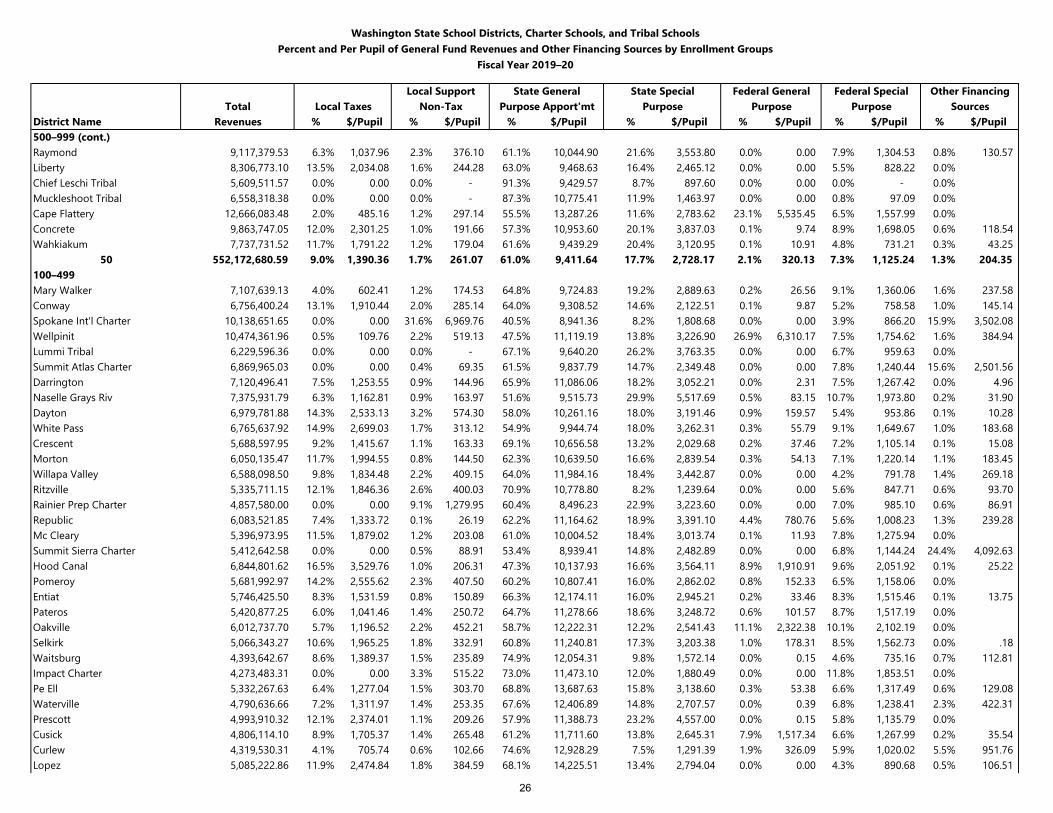
Washington State School Districts, Charter Schools, and Tribal SchoolsPercent and Per Pupil of General Fund Revenues and Other Financing Sources by Enrollment Groups
Fiscal Year 2019–20
Local Support State General State Special Federal General Federal Special Other FinancingTotal Local Taxes Non-Tax Purpose Apport'mt Purpose Purpose Purpose Sources
District Name Revenues % $/Pupil % $/Pupil % $/Pupil % $/Pupil % $/Pupil % $/Pupil % $/Pupil500–999 (cont.)Raymond 9,117,379.53 6.3% 1,037.96 2.3% 376.10 61.1% 10,044.90 21.6% 3,553.80 0.0% 0.00 7.9% 1,304.53 0.8% 130.57 Liberty 8,306,773.10 13.5% 2,034.08 1.6% 244.28 63.0% 9,468.63 16.4% 2,465.12 0.0% 0.00 5.5% 828.22 0.0% Chief Leschi Tribal 5,609,511.57 0.0% 0.00 0.0% - 91.3% 9,429.57 8.7% 897.60 0.0% 0.00 0.0% - 0.0% Muckleshoot Tribal 6,558,318.38 0.0% 0.00 0.0% - 87.3% 10,775.41 11.9% 1,463.97 0.0% 0.00 0.8% 97.09 0.0% Cape Flattery 12,666,083.48 2.0% 485.16 1.2% 297.14 55.5% 13,287.26 11.6% 2,783.62 23.1% 5,535.45 6.5% 1,557.99 0.0% Concrete 9,863,747.05 12.0% 2,301.25 1.0% 191.66 57.3% 10,953.60 20.1% 3,837.03 0.1% 9.74 8.9% 1,698.05 0.6% 118.54 Wahkiakum 7,737,731.52 11.7% 1,791.22 1.2% 179.04 61.6% 9,439.29 20.4% 3,120.95 0.1% 10.91 4.8% 731.21 0.3% 43.25
50 552,172,680.59 9.0% 1,390.36 1.7% 261.07 61.0% 9,411.64 17.7% 2,728.17 2.1% 320.13 7.3% 1,125.24 1.3% 204.35 100–499Mary Walker 7,107,639.13 4.0% 602.41 1.2% 174.53 64.8% 9,724.83 19.2% 2,889.63 0.2% 26.56 9.1% 1,360.06 1.6% 237.58 Conway 6,756,400.24 13.1% 1,910.44 2.0% 285.14 64.0% 9,308.52 14.6% 2,122.51 0.1% 9.87 5.2% 758.58 1.0% 145.14 Spokane Int'l Charter 10,138,651.65 0.0% 0.00 31.6% 6,969.76 40.5% 8,941.36 8.2% 1,808.68 0.0% 0.00 3.9% 866.20 15.9% 3,502.08 Wellpinit 10,474,361.96 0.5% 109.76 2.2% 519.13 47.5% 11,119.19 13.8% 3,226.90 26.9% 6,310.17 7.5% 1,754.62 1.6% 384.94 Lummi Tribal 6,229,596.36 0.0% 0.00 0.0% - 67.1% 9,640.20 26.2% 3,763.35 0.0% 0.00 6.7% 959.63 0.0% Summit Atlas Charter 6,869,965.03 0.0% 0.00 0.4% 69.35 61.5% 9,837.79 14.7% 2,349.48 0.0% 0.00 7.8% 1,240.44 15.6% 2,501.56 Darrington 7,120,496.41 7.5% 1,253.55 0.9% 144.96 65.9% 11,086.06 18.2% 3,052.21 0.0% 2.31 7.5% 1,267.42 0.0% 4.96 Naselle Grays Riv 7,375,931.79 6.3% 1,162.81 0.9% 163.97 51.6% 9,515.73 29.9% 5,517.69 0.5% 83.15 10.7% 1,973.80 0.2% 31.90 Dayton 6,979,781.88 14.3% 2,533.13 3.2% 574.30 58.0% 10,261.16 18.0% 3,191.46 0.9% 159.57 5.4% 953.86 0.1% 10.28 White Pass 6,765,637.92 14.9% 2,699.03 1.7% 313.12 54.9% 9,944.74 18.0% 3,262.31 0.3% 55.79 9.1% 1,649.67 1.0% 183.68 Crescent 5,688,597.95 9.2% 1,415.67 1.1% 163.33 69.1% 10,656.58 13.2% 2,029.68 0.2% 37.46 7.2% 1,105.14 0.1% 15.08 Morton 6,050,135.47 11.7% 1,994.55 0.8% 144.50 62.3% 10,639.50 16.6% 2,839.54 0.3% 54.13 7.1% 1,220.14 1.1% 183.45 Willapa Valley 6,588,098.50 9.8% 1,834.48 2.2% 409.15 64.0% 11,984.16 18.4% 3,442.87 0.0% 0.00 4.2% 791.78 1.4% 269.18 Ritzville 5,335,711.15 12.1% 1,846.36 2.6% 400.03 70.9% 10,778.80 8.2% 1,239.64 0.0% 0.00 5.6% 847.71 0.6% 93.70 Rainier Prep Charter 4,857,580.00 0.0% 0.00 9.1% 1,279.95 60.4% 8,496.23 22.9% 3,223.60 0.0% 0.00 7.0% 985.10 0.6% 86.91 Republic 6,083,521.85 7.4% 1,333.72 0.1% 26.19 62.2% 11,164.62 18.9% 3,391.10 4.4% 780.76 5.6% 1,008.23 1.3% 239.28 Mc Cleary 5,396,973.95 11.5% 1,879.02 1.2% 203.08 61.0% 10,004.52 18.4% 3,013.74 0.1% 11.93 7.8% 1,275.94 0.0% Summit Sierra Charter 5,412,642.58 0.0% 0.00 0.5% 88.91 53.4% 8,939.41 14.8% 2,482.89 0.0% 0.00 6.8% 1,144.24 24.4% 4,092.63 Hood Canal 6,844,801.62 16.5% 3,529.76 1.0% 206.31 47.3% 10,137.93 16.6% 3,564.11 8.9% 1,910.91 9.6% 2,051.92 0.1% 25.22 Pomeroy 5,681,992.97 14.2% 2,555.62 2.3% 407.50 60.2% 10,807.41 16.0% 2,862.02 0.8% 152.33 6.5% 1,158.06 0.0% Entiat 5,746,425.50 8.3% 1,531.59 0.8% 150.89 66.3% 12,174.11 16.0% 2,945.21 0.2% 33.46 8.3% 1,515.46 0.1% 13.75 Pateros 5,420,877.25 6.0% 1,041.46 1.4% 250.72 64.7% 11,278.66 18.6% 3,248.72 0.6% 101.57 8.7% 1,517.19 0.0% Oakville 6,012,737.70 5.7% 1,196.52 2.2% 452.21 58.7% 12,222.31 12.2% 2,541.43 11.1% 2,322.38 10.1% 2,102.19 0.0% Selkirk 5,066,343.27 10.6% 1,965.25 1.8% 332.91 60.8% 11,240.81 17.3% 3,203.38 1.0% 178.31 8.5% 1,562.73 0.0% .18 Waitsburg 4,393,642.67 8.6% 1,389.37 1.5% 235.89 74.9% 12,054.31 9.8% 1,572.14 0.0% 0.15 4.6% 735.16 0.7% 112.81 Impact Charter 4,273,483.31 0.0% 0.00 3.3% 515.22 73.0% 11,473.10 12.0% 1,880.49 0.0% 0.00 11.8% 1,853.51 0.0% Pe Ell 5,332,267.63 6.4% 1,277.04 1.5% 303.70 68.8% 13,687.63 15.8% 3,138.60 0.3% 53.38 6.6% 1,317.49 0.6% 129.08 Waterville 4,790,636.66 7.2% 1,311.97 1.4% 253.35 67.6% 12,406.89 14.8% 2,707.57 0.0% 0.39 6.8% 1,238.41 2.3% 422.31 Prescott 4,993,910.32 12.1% 2,374.01 1.1% 209.26 57.9% 11,388.73 23.2% 4,557.00 0.0% 0.15 5.8% 1,135.79 0.0% Cusick 4,806,114.10 8.9% 1,705.37 1.4% 265.48 61.2% 11,711.60 13.8% 2,645.31 7.9% 1,517.34 6.6% 1,267.99 0.2% 35.54 Curlew 4,319,530.31 4.1% 705.74 0.6% 102.66 74.6% 12,928.29 7.5% 1,291.39 1.9% 326.09 5.9% 1,020.02 5.5% 951.76 Lopez 5,085,222.86 11.9% 2,474.84 1.8% 384.59 68.1% 14,225.51 13.4% 2,794.04 0.0% 0.00 4.3% 890.68 0.5% 106.51
26
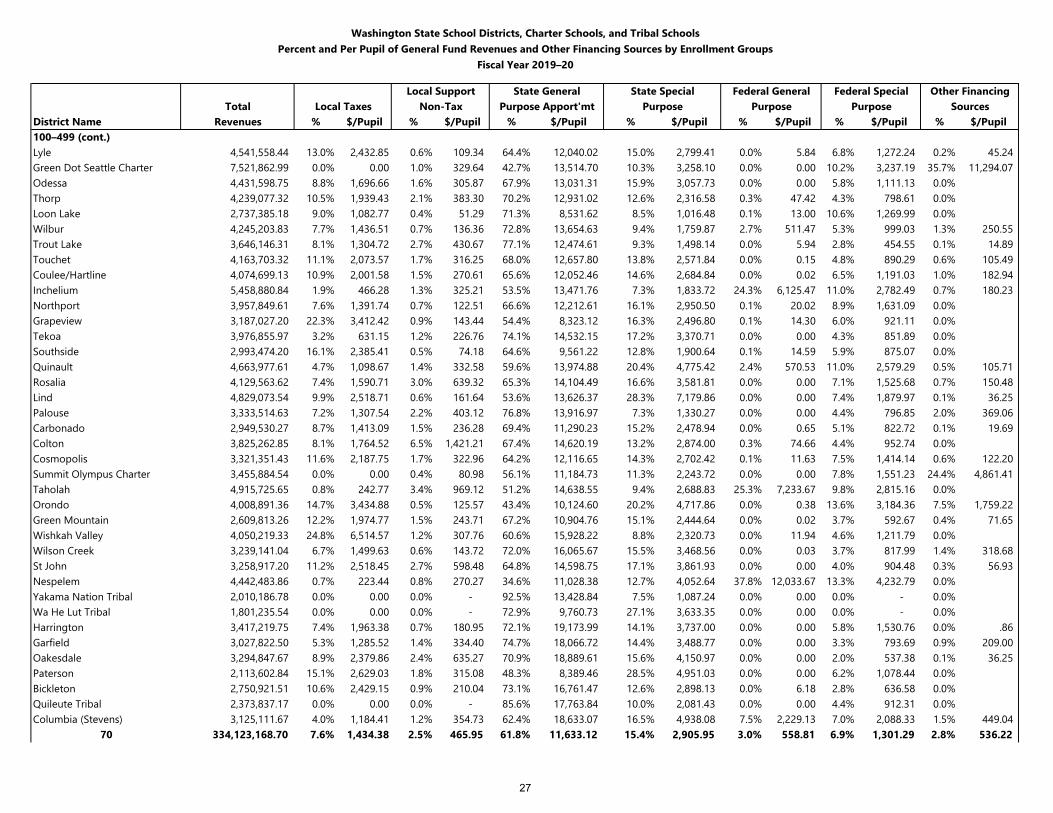
Washington State School Districts, Charter Schools, and Tribal SchoolsPercent and Per Pupil of General Fund Revenues and Other Financing Sources by Enrollment Groups
Fiscal Year 2019–20
Local Support State General State Special Federal General Federal Special Other FinancingTotal Local Taxes Non-Tax Purpose Apport'mt Purpose Purpose Purpose Sources
District Name Revenues % $/Pupil % $/Pupil % $/Pupil % $/Pupil % $/Pupil % $/Pupil % $/Pupil100–499 (cont.)Lyle 4,541,558.44 13.0% 2,432.85 0.6% 109.34 64.4% 12,040.02 15.0% 2,799.41 0.0% 5.84 6.8% 1,272.24 0.2% 45.24 Green Dot Seattle Charter 7,521,862.99 0.0% 0.00 1.0% 329.64 42.7% 13,514.70 10.3% 3,258.10 0.0% 0.00 10.2% 3,237.19 35.7% 11,294.07 Odessa 4,431,598.75 8.8% 1,696.66 1.6% 305.87 67.9% 13,031.31 15.9% 3,057.73 0.0% 0.00 5.8% 1,111.13 0.0% Thorp 4,239,077.32 10.5% 1,939.43 2.1% 383.30 70.2% 12,931.02 12.6% 2,316.58 0.3% 47.42 4.3% 798.61 0.0% Loon Lake 2,737,385.18 9.0% 1,082.77 0.4% 51.29 71.3% 8,531.62 8.5% 1,016.48 0.1% 13.00 10.6% 1,269.99 0.0% Wilbur 4,245,203.83 7.7% 1,436.51 0.7% 136.36 72.8% 13,654.63 9.4% 1,759.87 2.7% 511.47 5.3% 999.03 1.3% 250.55 Trout Lake 3,646,146.31 8.1% 1,304.72 2.7% 430.67 77.1% 12,474.61 9.3% 1,498.14 0.0% 5.94 2.8% 454.55 0.1% 14.89 Touchet 4,163,703.32 11.1% 2,073.57 1.7% 316.25 68.0% 12,657.80 13.8% 2,571.84 0.0% 0.15 4.8% 890.29 0.6% 105.49 Coulee/Hartline 4,074,699.13 10.9% 2,001.58 1.5% 270.61 65.6% 12,052.46 14.6% 2,684.84 0.0% 0.02 6.5% 1,191.03 1.0% 182.94 Inchelium 5,458,880.84 1.9% 466.28 1.3% 325.21 53.5% 13,471.76 7.3% 1,833.72 24.3% 6,125.47 11.0% 2,782.49 0.7% 180.23 Northport 3,957,849.61 7.6% 1,391.74 0.7% 122.51 66.6% 12,212.61 16.1% 2,950.50 0.1% 20.02 8.9% 1,631.09 0.0% Grapeview 3,187,027.20 22.3% 3,412.42 0.9% 143.44 54.4% 8,323.12 16.3% 2,496.80 0.1% 14.30 6.0% 921.11 0.0% Tekoa 3,976,855.97 3.2% 631.15 1.2% 226.76 74.1% 14,532.15 17.2% 3,370.71 0.0% 0.00 4.3% 851.89 0.0% Southside 2,993,474.20 16.1% 2,385.41 0.5% 74.18 64.6% 9,561.22 12.8% 1,900.64 0.1% 14.59 5.9% 875.07 0.0% Quinault 4,663,977.61 4.7% 1,098.67 1.4% 332.58 59.6% 13,974.88 20.4% 4,775.42 2.4% 570.53 11.0% 2,579.29 0.5% 105.71 Rosalia 4,129,563.62 7.4% 1,590.71 3.0% 639.32 65.3% 14,104.49 16.6% 3,581.81 0.0% 0.00 7.1% 1,525.68 0.7% 150.48 Lind 4,829,073.54 9.9% 2,518.71 0.6% 161.64 53.6% 13,626.37 28.3% 7,179.86 0.0% 0.00 7.4% 1,879.97 0.1% 36.25 Palouse 3,333,514.63 7.2% 1,307.54 2.2% 403.12 76.8% 13,916.97 7.3% 1,330.27 0.0% 0.00 4.4% 796.85 2.0% 369.06 Carbonado 2,949,530.27 8.7% 1,413.09 1.5% 236.28 69.4% 11,290.23 15.2% 2,478.94 0.0% 0.65 5.1% 822.72 0.1% 19.69 Colton 3,825,262.85 8.1% 1,764.52 6.5% 1,421.21 67.4% 14,620.19 13.2% 2,874.00 0.3% 74.66 4.4% 952.74 0.0% Cosmopolis 3,321,351.43 11.6% 2,187.75 1.7% 322.96 64.2% 12,116.65 14.3% 2,702.42 0.1% 11.63 7.5% 1,414.14 0.6% 122.20 Summit Olympus Charter 3,455,884.54 0.0% 0.00 0.4% 80.98 56.1% 11,184.73 11.3% 2,243.72 0.0% 0.00 7.8% 1,551.23 24.4% 4,861.41 Taholah 4,915,725.65 0.8% 242.77 3.4% 969.12 51.2% 14,638.55 9.4% 2,688.83 25.3% 7,233.67 9.8% 2,815.16 0.0% Orondo 4,008,891.36 14.7% 3,434.88 0.5% 125.57 43.4% 10,124.60 20.2% 4,717.86 0.0% 0.38 13.6% 3,184.36 7.5% 1,759.22 Green Mountain 2,609,813.26 12.2% 1,974.77 1.5% 243.71 67.2% 10,904.76 15.1% 2,444.64 0.0% 0.02 3.7% 592.67 0.4% 71.65 Wishkah Valley 4,050,219.33 24.8% 6,514.57 1.2% 307.76 60.6% 15,928.22 8.8% 2,320.73 0.0% 11.94 4.6% 1,211.79 0.0% Wilson Creek 3,239,141.04 6.7% 1,499.63 0.6% 143.72 72.0% 16,065.67 15.5% 3,468.56 0.0% 0.03 3.7% 817.99 1.4% 318.68 St John 3,258,917.20 11.2% 2,518.45 2.7% 598.48 64.8% 14,598.75 17.1% 3,861.93 0.0% 0.00 4.0% 904.48 0.3% 56.93 Nespelem 4,442,483.86 0.7% 223.44 0.8% 270.27 34.6% 11,028.38 12.7% 4,052.64 37.8% 12,033.67 13.3% 4,232.79 0.0% Yakama Nation Tribal 2,010,186.78 0.0% 0.00 0.0% - 92.5% 13,428.84 7.5% 1,087.24 0.0% 0.00 0.0% - 0.0% Wa He Lut Tribal 1,801,235.54 0.0% 0.00 0.0% - 72.9% 9,760.73 27.1% 3,633.35 0.0% 0.00 0.0% - 0.0% Harrington 3,417,219.75 7.4% 1,963.38 0.7% 180.95 72.1% 19,173.99 14.1% 3,737.00 0.0% 0.00 5.8% 1,530.76 0.0% .86 Garfield 3,027,822.50 5.3% 1,285.52 1.4% 334.40 74.7% 18,066.72 14.4% 3,488.77 0.0% 0.00 3.3% 793.69 0.9% 209.00 Oakesdale 3,294,847.67 8.9% 2,379.86 2.4% 635.27 70.9% 18,889.61 15.6% 4,150.97 0.0% 0.00 2.0% 537.38 0.1% 36.25 Paterson 2,113,602.84 15.1% 2,629.03 1.8% 315.08 48.3% 8,389.46 28.5% 4,951.03 0.0% 0.00 6.2% 1,078.44 0.0% Bickleton 2,750,921.51 10.6% 2,429.15 0.9% 210.04 73.1% 16,761.47 12.6% 2,898.13 0.0% 6.18 2.8% 636.58 0.0% Quileute Tribal 2,373,837.17 0.0% 0.00 0.0% - 85.6% 17,763.84 10.0% 2,081.43 0.0% 0.00 4.4% 912.31 0.0% Columbia (Stevens) 3,125,111.67 4.0% 1,184.41 1.2% 354.73 62.4% 18,633.07 16.5% 4,938.08 7.5% 2,229.13 7.0% 2,088.33 1.5% 449.04
70 334,123,168.70 7.6% 1,434.38 2.5% 465.95 61.8% 11,633.12 15.4% 2,905.95 3.0% 558.81 6.9% 1,301.29 2.8% 536.22
27
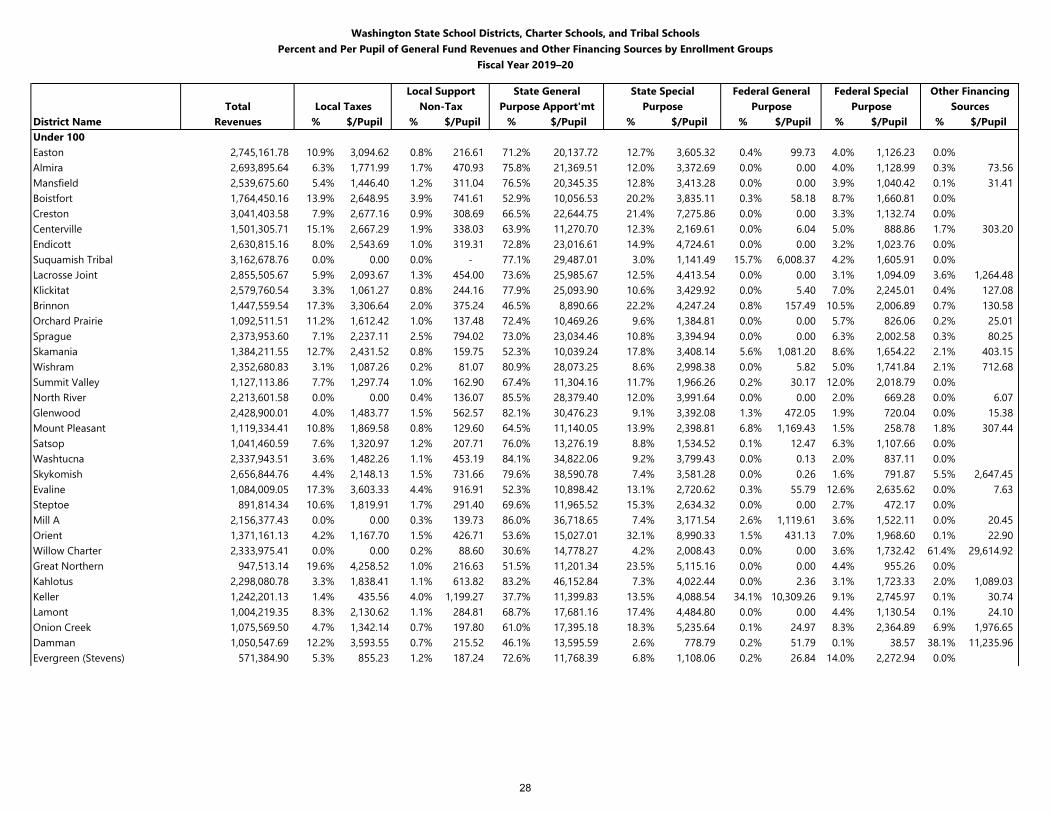
Washington State School Districts, Charter Schools, and Tribal SchoolsPercent and Per Pupil of General Fund Revenues and Other Financing Sources by Enrollment Groups
Fiscal Year 2019–20
Local Support State General State Special Federal General Federal Special Other FinancingTotal Local Taxes Non-Tax Purpose Apport'mt Purpose Purpose Purpose Sources
District Name Revenues % $/Pupil % $/Pupil % $/Pupil % $/Pupil % $/Pupil % $/Pupil % $/PupilUnder 100Easton 2,745,161.78 10.9% 3,094.62 0.8% 216.61 71.2% 20,137.72 12.7% 3,605.32 0.4% 99.73 4.0% 1,126.23 0.0% Almira 2,693,895.64 6.3% 1,771.99 1.7% 470.93 75.8% 21,369.51 12.0% 3,372.69 0.0% 0.00 4.0% 1,128.99 0.3% 73.56 Mansfield 2,539,675.60 5.4% 1,446.40 1.2% 311.04 76.5% 20,345.35 12.8% 3,413.28 0.0% 0.00 3.9% 1,040.42 0.1% 31.41 Boistfort 1,764,450.16 13.9% 2,648.95 3.9% 741.61 52.9% 10,056.53 20.2% 3,835.11 0.3% 58.18 8.7% 1,660.81 0.0% Creston 3,041,403.58 7.9% 2,677.16 0.9% 308.69 66.5% 22,644.75 21.4% 7,275.86 0.0% 0.00 3.3% 1,132.74 0.0% Centerville 1,501,305.71 15.1% 2,667.29 1.9% 338.03 63.9% 11,270.70 12.3% 2,169.61 0.0% 6.04 5.0% 888.86 1.7% 303.20 Endicott 2,630,815.16 8.0% 2,543.69 1.0% 319.31 72.8% 23,016.61 14.9% 4,724.61 0.0% 0.00 3.2% 1,023.76 0.0% Suquamish Tribal 3,162,678.76 0.0% 0.00 0.0% - 77.1% 29,487.01 3.0% 1,141.49 15.7% 6,008.37 4.2% 1,605.91 0.0% Lacrosse Joint 2,855,505.67 5.9% 2,093.67 1.3% 454.00 73.6% 25,985.67 12.5% 4,413.54 0.0% 0.00 3.1% 1,094.09 3.6% 1,264.48 Klickitat 2,579,760.54 3.3% 1,061.27 0.8% 244.16 77.9% 25,093.90 10.6% 3,429.92 0.0% 5.40 7.0% 2,245.01 0.4% 127.08 Brinnon 1,447,559.54 17.3% 3,306.64 2.0% 375.24 46.5% 8,890.66 22.2% 4,247.24 0.8% 157.49 10.5% 2,006.89 0.7% 130.58 Orchard Prairie 1,092,511.51 11.2% 1,612.42 1.0% 137.48 72.4% 10,469.26 9.6% 1,384.81 0.0% 0.00 5.7% 826.06 0.2% 25.01 Sprague 2,373,953.60 7.1% 2,237.11 2.5% 794.02 73.0% 23,034.46 10.8% 3,394.94 0.0% 0.00 6.3% 2,002.58 0.3% 80.25 Skamania 1,384,211.55 12.7% 2,431.52 0.8% 159.75 52.3% 10,039.24 17.8% 3,408.14 5.6% 1,081.20 8.6% 1,654.22 2.1% 403.15 Wishram 2,352,680.83 3.1% 1,087.26 0.2% 81.07 80.9% 28,073.25 8.6% 2,998.38 0.0% 5.82 5.0% 1,741.84 2.1% 712.68 Summit Valley 1,127,113.86 7.7% 1,297.74 1.0% 162.90 67.4% 11,304.16 11.7% 1,966.26 0.2% 30.17 12.0% 2,018.79 0.0% North River 2,213,601.58 0.0% 0.00 0.4% 136.07 85.5% 28,379.40 12.0% 3,991.64 0.0% 0.00 2.0% 669.28 0.0% 6.07 Glenwood 2,428,900.01 4.0% 1,483.77 1.5% 562.57 82.1% 30,476.23 9.1% 3,392.08 1.3% 472.05 1.9% 720.04 0.0% 15.38 Mount Pleasant 1,119,334.41 10.8% 1,869.58 0.8% 129.60 64.5% 11,140.05 13.9% 2,398.81 6.8% 1,169.43 1.5% 258.78 1.8% 307.44 Satsop 1,041,460.59 7.6% 1,320.97 1.2% 207.71 76.0% 13,276.19 8.8% 1,534.52 0.1% 12.47 6.3% 1,107.66 0.0% Washtucna 2,337,943.51 3.6% 1,482.26 1.1% 453.19 84.1% 34,822.06 9.2% 3,799.43 0.0% 0.13 2.0% 837.11 0.0% Skykomish 2,656,844.76 4.4% 2,148.13 1.5% 731.66 79.6% 38,590.78 7.4% 3,581.28 0.0% 0.26 1.6% 791.87 5.5% 2,647.45 Evaline 1,084,009.05 17.3% 3,603.33 4.4% 916.91 52.3% 10,898.42 13.1% 2,720.62 0.3% 55.79 12.6% 2,635.62 0.0% 7.63 Steptoe 891,814.34 10.6% 1,819.91 1.7% 291.40 69.6% 11,965.52 15.3% 2,634.32 0.0% 0.00 2.7% 472.17 0.0% Mill A 2,156,377.43 0.0% 0.00 0.3% 139.73 86.0% 36,718.65 7.4% 3,171.54 2.6% 1,119.61 3.6% 1,522.11 0.0% 20.45 Orient 1,371,161.13 4.2% 1,167.70 1.5% 426.71 53.6% 15,027.01 32.1% 8,990.33 1.5% 431.13 7.0% 1,968.60 0.1% 22.90 Willow Charter 2,333,975.41 0.0% 0.00 0.2% 88.60 30.6% 14,778.27 4.2% 2,008.43 0.0% 0.00 3.6% 1,732.42 61.4% 29,614.92 Great Northern 947,513.14 19.6% 4,258.52 1.0% 216.63 51.5% 11,201.34 23.5% 5,115.16 0.0% 0.00 4.4% 955.26 0.0% Kahlotus 2,298,080.78 3.3% 1,838.41 1.1% 613.82 83.2% 46,152.84 7.3% 4,022.44 0.0% 2.36 3.1% 1,723.33 2.0% 1,089.03 Keller 1,242,201.13 1.4% 435.56 4.0% 1,199.27 37.7% 11,399.83 13.5% 4,088.54 34.1% 10,309.26 9.1% 2,745.97 0.1% 30.74 Lamont 1,004,219.35 8.3% 2,130.62 1.1% 284.81 68.7% 17,681.16 17.4% 4,484.80 0.0% 0.00 4.4% 1,130.54 0.1% 24.10 Onion Creek 1,075,569.50 4.7% 1,342.14 0.7% 197.80 61.0% 17,395.18 18.3% 5,235.64 0.1% 24.97 8.3% 2,364.89 6.9% 1,976.65 Damman 1,050,547.69 12.2% 3,593.55 0.7% 215.52 46.1% 13,595.59 2.6% 778.79 0.2% 51.79 0.1% 38.57 38.1% 11,235.96 Evergreen (Stevens) 571,384.90 5.3% 855.23 1.2% 187.24 72.6% 11,768.39 6.8% 1,108.06 0.2% 26.84 14.0% 2,272.94 0.0%
28
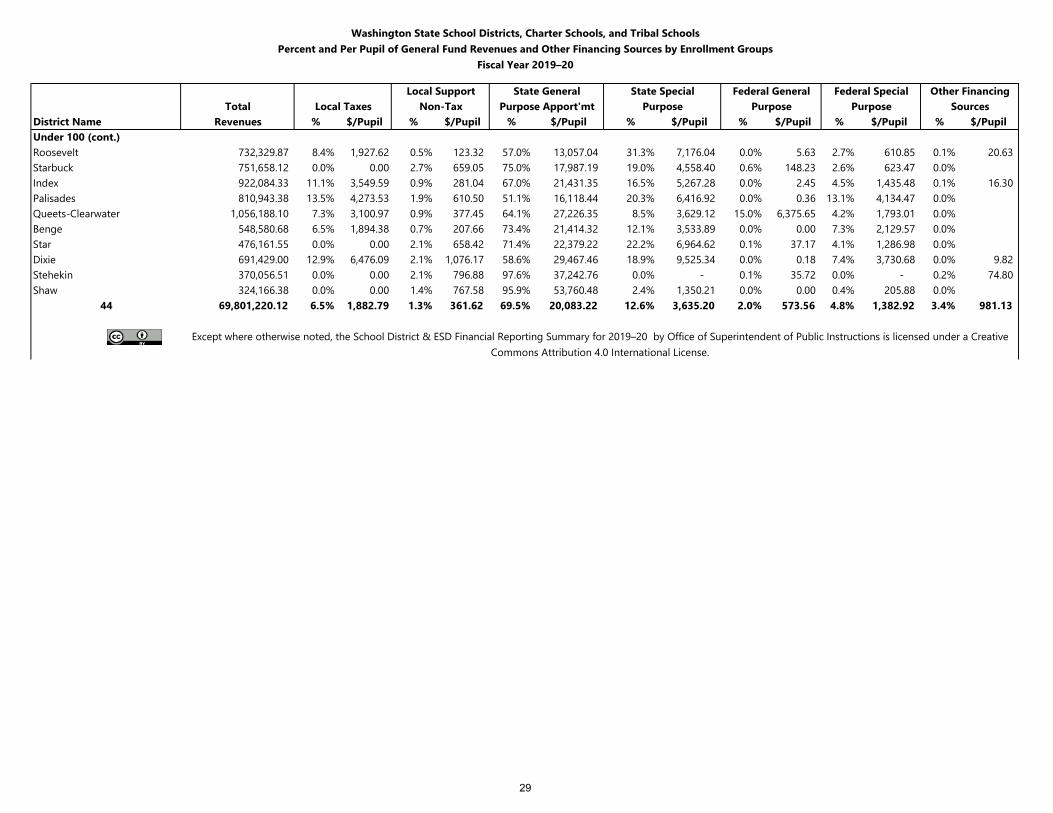
Washington State School Districts, Charter Schools, and Tribal SchoolsPercent and Per Pupil of General Fund Revenues and Other Financing Sources by Enrollment Groups
Fiscal Year 2019–20
Local Support State General State Special Federal General Federal Special Other FinancingTotal Local Taxes Non-Tax Purpose Apport'mt Purpose Purpose Purpose Sources
District Name Revenues % $/Pupil % $/Pupil % $/Pupil % $/Pupil % $/Pupil % $/Pupil % $/PupilUnder 100 (cont.)Roosevelt 732,329.87 8.4% 1,927.62 0.5% 123.32 57.0% 13,057.04 31.3% 7,176.04 0.0% 5.63 2.7% 610.85 0.1% 20.63 Starbuck 751,658.12 0.0% 0.00 2.7% 659.05 75.0% 17,987.19 19.0% 4,558.40 0.6% 148.23 2.6% 623.47 0.0%Index 922,084.33 11.1% 3,549.59 0.9% 281.04 67.0% 21,431.35 16.5% 5,267.28 0.0% 2.45 4.5% 1,435.48 0.1% 16.30 Palisades 810,943.38 13.5% 4,273.53 1.9% 610.50 51.1% 16,118.44 20.3% 6,416.92 0.0% 0.36 13.1% 4,134.47 0.0%Queets-Clearwater 1,056,188.10 7.3% 3,100.97 0.9% 377.45 64.1% 27,226.35 8.5% 3,629.12 15.0% 6,375.65 4.2% 1,793.01 0.0%Benge 548,580.68 6.5% 1,894.38 0.7% 207.66 73.4% 21,414.32 12.1% 3,533.89 0.0% 0.00 7.3% 2,129.57 0.0%Star 476,161.55 0.0% 0.00 2.1% 658.42 71.4% 22,379.22 22.2% 6,964.62 0.1% 37.17 4.1% 1,286.98 0.0%Dixie 691,429.00 12.9% 6,476.09 2.1% 1,076.17 58.6% 29,467.46 18.9% 9,525.34 0.0% 0.18 7.4% 3,730.68 0.0% 9.82 Stehekin 370,056.51 0.0% 0.00 2.1% 796.88 97.6% 37,242.76 0.0% - 0.1% 35.72 0.0% - 0.2% 74.80 Shaw 324,166.38 0.0% 0.00 1.4% 767.58 95.9% 53,760.48 2.4% 1,350.21 0.0% 0.00 0.4% 205.88 0.0%
44 69,801,220.12 6.5% 1,882.79 1.3% 361.62 69.5% 20,083.22 12.6% 3,635.20 2.0% 573.56 4.8% 1,382.92 3.4% 981.13
Except where otherwise noted, the School District & ESD Financial Reporting Summary for 2019–20 by Office of Superintendent of Public Instructions is licensed under a Creative Commons Attribution 4.0 International License.
29
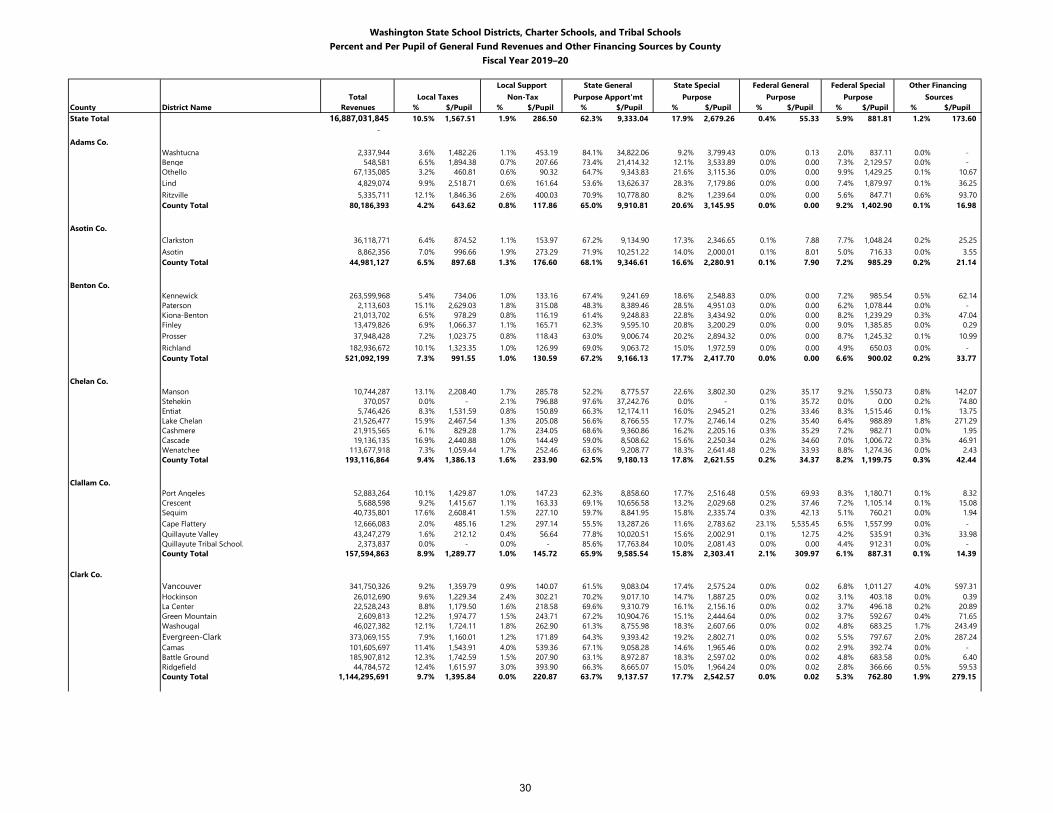
Washington State School Districts, Charter Schools, and Tribal SchoolsPercent and Per Pupil of General Fund Revenues and Other Financing Sources by County
Fiscal Year 2019–20
Local Support State General State Special Federal General Federal Special Other FinancingTotal Local Taxes Non-Tax Purpose Apport'mt Purpose Purpose Purpose Sources
County District Name Revenues % $/Pupil % $/Pupil % $/Pupil % $/Pupil % $/Pupil % $/Pupil % $/PupilState Total 16,887,031,845 10.5% 1,567.51 1.9% 286.50 62.3% 9,333.04 17.9% 2,679.26 0.4% 55.33 5.9% 881.81 1.2% 173.60
- Adams Co.
Washtucna 2,337,944 3.6% 1,482.26 1.1% 453.19 84.1% 34,822.06 9.2% 3,799.43 0.0% 0.13 2.0% 837.11 0.0% - Benge 548,581 6.5% 1,894.38 0.7% 207.66 73.4% 21,414.32 12.1% 3,533.89 0.0% 0.00 7.3% 2,129.57 0.0% - Othello 67,135,085 3.2% 460.81 0.6% 90.32 64.7% 9,343.83 21.6% 3,115.36 0.0% 0.00 9.9% 1,429.25 0.1% 10.67 Lind 4,829,074 9.9% 2,518.71 0.6% 161.64 53.6% 13,626.37 28.3% 7,179.86 0.0% 0.00 7.4% 1,879.97 0.1% 36.25 Ritzville 5,335,711 12.1% 1,846.36 2.6% 400.03 70.9% 10,778.80 8.2% 1,239.64 0.0% 0.00 5.6% 847.71 0.6% 93.70 County Total 80,186,393 4.2% 643.62 0.8% 117.86 65.0% 9,910.81 20.6% 3,145.95 0.0% 0.00 9.2% 1,402.90 0.1% 16.98
Asotin Co.Clarkston 36,118,771 6.4% 874.52 1.1% 153.97 67.2% 9,134.90 17.3% 2,346.65 0.1% 7.88 7.7% 1,048.24 0.2% 25.25 Asotin 8,862,356 7.0% 996.66 1.9% 273.29 71.9% 10,251.22 14.0% 2,000.01 0.1% 8.01 5.0% 716.33 0.0% 3.55 County Total 44,981,127 6.5% 897.68 1.3% 176.60 68.1% 9,346.61 16.6% 2,280.91 0.1% 7.90 7.2% 985.29 0.2% 21.14
Benton Co.Kennewick 263,599,968 5.4% 734.06 1.0% 133.16 67.4% 9,241.69 18.6% 2,548.83 0.0% 0.00 7.2% 985.54 0.5% 62.14 Paterson 2,113,603 15.1% 2,629.03 1.8% 315.08 48.3% 8,389.46 28.5% 4,951.03 0.0% 0.00 6.2% 1,078.44 0.0% - Kiona-Benton 21,013,702 6.5% 978.29 0.8% 116.19 61.4% 9,248.83 22.8% 3,434.92 0.0% 0.00 8.2% 1,239.29 0.3% 47.04 Finley 13,479,826 6.9% 1,066.37 1.1% 165.71 62.3% 9,595.10 20.8% 3,200.29 0.0% 0.00 9.0% 1,385.85 0.0% 0.29 Prosser 37,948,428 7.2% 1,023.75 0.8% 118.43 63.0% 9,006.74 20.2% 2,894.32 0.0% 0.00 8.7% 1,245.32 0.1% 10.99 Richland 182,936,672 10.1% 1,323.35 1.0% 126.99 69.0% 9,063.72 15.0% 1,972.59 0.0% 0.00 4.9% 650.03 0.0% - County Total 521,092,199 7.3% 991.55 1.0% 130.59 67.2% 9,166.13 17.7% 2,417.70 0.0% 0.00 6.6% 900.02 0.2% 33.77
Chelan Co.Manson 10,744,287 13.1% 2,208.40 1.7% 285.78 52.2% 8,775.57 22.6% 3,802.30 0.2% 35.17 9.2% 1,550.73 0.8% 142.07 Stehekin 370,057 0.0% - 2.1% 796.88 97.6% 37,242.76 0.0% - 0.1% 35.72 0.0% 0.00 0.2% 74.80 Entiat 5,746,426 8.3% 1,531.59 0.8% 150.89 66.3% 12,174.11 16.0% 2,945.21 0.2% 33.46 8.3% 1,515.46 0.1% 13.75 Lake Chelan 21,526,477 15.9% 2,467.54 1.3% 205.08 56.6% 8,766.55 17.7% 2,746.14 0.2% 35.40 6.4% 988.89 1.8% 271.29 Cashmere 21,915,565 6.1% 829.28 1.7% 234.05 68.6% 9,360.86 16.2% 2,205.16 0.3% 35.29 7.2% 982.71 0.0% 1.95 Cascade 19,136,135 16.9% 2,440.88 1.0% 144.49 59.0% 8,508.62 15.6% 2,250.34 0.2% 34.60 7.0% 1,006.72 0.3% 46.91 Wenatchee 113,677,918 7.3% 1,059.44 1.7% 252.46 63.6% 9,208.77 18.3% 2,641.48 0.2% 33.93 8.8% 1,274.36 0.0% 2.43 County Total 193,116,864 9.4% 1,386.13 1.6% 233.90 62.5% 9,180.13 17.8% 2,621.55 0.2% 34.37 8.2% 1,199.75 0.3% 42.44
Clallam Co.Port Angeles 52,883,264 10.1% 1,429.87 1.0% 147.23 62.3% 8,858.60 17.7% 2,516.48 0.5% 69.93 8.3% 1,180.71 0.1% 8.32 Crescent 5,688,598 9.2% 1,415.67 1.1% 163.33 69.1% 10,656.58 13.2% 2,029.68 0.2% 37.46 7.2% 1,105.14 0.1% 15.08 Sequim 40,735,801 17.6% 2,608.41 1.5% 227.10 59.7% 8,841.95 15.8% 2,335.74 0.3% 42.13 5.1% 760.21 0.0% 1.94 Cape Flattery 12,666,083 2.0% 485.16 1.2% 297.14 55.5% 13,287.26 11.6% 2,783.62 23.1% 5,535.45 6.5% 1,557.99 0.0% - Quillayute Valley 43,247,279 1.6% 212.12 0.4% 56.64 77.8% 10,020.51 15.6% 2,002.91 0.1% 12.75 4.2% 535.91 0.3% 33.98 Quillayute Tribal School. 2,373,837 0.0% - 0.0% - 85.6% 17,763.84 10.0% 2,081.43 0.0% 0.00 4.4% 912.31 0.0% - County Total 157,594,863 8.9% 1,289.77 1.0% 145.72 65.9% 9,585.54 15.8% 2,303.41 2.1% 309.97 6.1% 887.31 0.1% 14.39
Clark Co.Vancouver 341,750,326 9.2% 1,359.79 0.9% 140.07 61.5% 9,083.04 17.4% 2,575.24 0.0% 0.02 6.8% 1,011.27 4.0% 597.31 Hockinson 26,012,690 9.6% 1,229.34 2.4% 302.21 70.2% 9,017.10 14.7% 1,887.25 0.0% 0.02 3.1% 403.18 0.0% 0.39 La Center 22,528,243 8.8% 1,179.50 1.6% 218.58 69.6% 9,310.79 16.1% 2,156.16 0.0% 0.02 3.7% 496.18 0.2% 20.89 Green Mountain 2,609,813 12.2% 1,974.77 1.5% 243.71 67.2% 10,904.76 15.1% 2,444.64 0.0% 0.02 3.7% 592.67 0.4% 71.65 Washougal 46,027,382 12.1% 1,724.11 1.8% 262.90 61.3% 8,755.98 18.3% 2,607.66 0.0% 0.02 4.8% 683.25 1.7% 243.49 Evergreen-Clark 373,069,155 7.9% 1,160.01 1.2% 171.89 64.3% 9,393.42 19.2% 2,802.71 0.0% 0.02 5.5% 797.67 2.0% 287.24 Camas 101,605,697 11.4% 1,543.91 4.0% 539.36 67.1% 9,058.28 14.6% 1,965.46 0.0% 0.02 2.9% 392.74 0.0% - Battle Ground 185,907,812 12.3% 1,742.59 1.5% 207.90 63.1% 8,972.87 18.3% 2,597.02 0.0% 0.02 4.8% 683.58 0.0% 6.40 Ridgefield 44,784,572 12.4% 1,615.97 3.0% 393.90 66.3% 8,665.07 15.0% 1,964.24 0.0% 0.02 2.8% 366.66 0.5% 59.53 County Total 1,144,295,691 9.7% 1,395.84 0.0% 220.87 63.7% 9,137.57 17.7% 2,542.57 0.0% 0.02 5.3% 762.80 1.9% 279.15
30
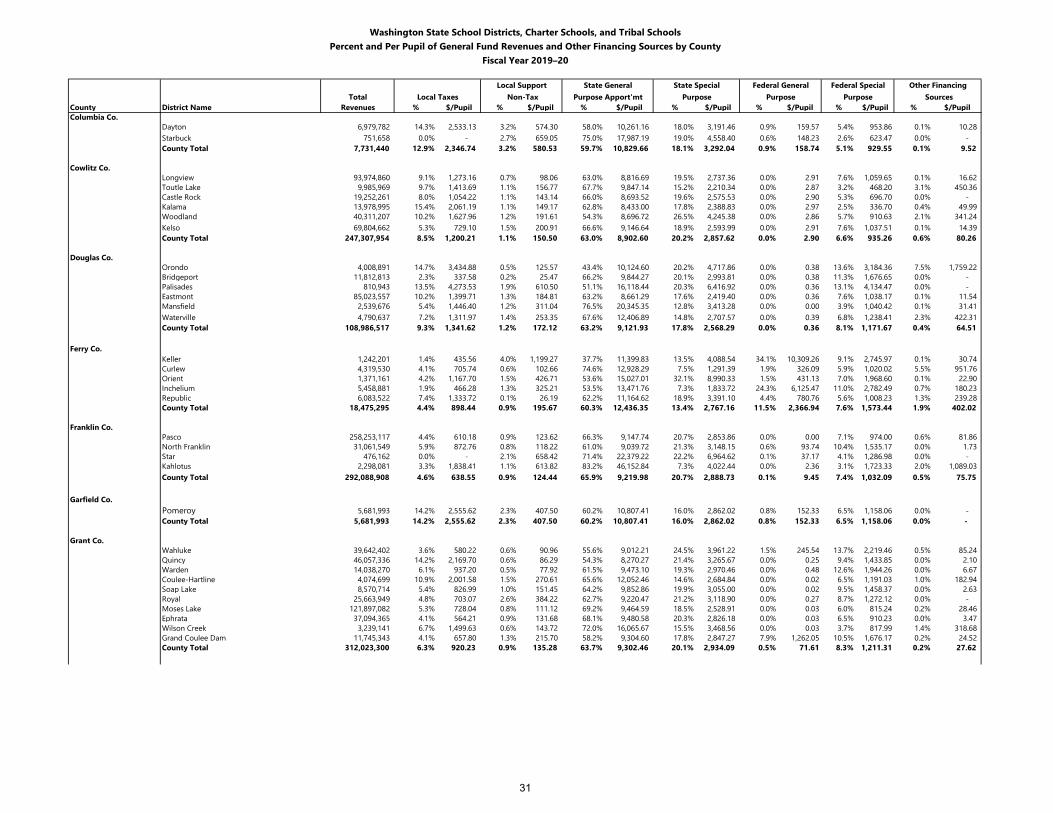
Washington State School Districts, Charter Schools, and Tribal SchoolsPercent and Per Pupil of General Fund Revenues and Other Financing Sources by County
Fiscal Year 2019–20
Local Support State General State Special Federal General Federal Special Other FinancingTotal Local Taxes Non-Tax Purpose Apport'mt Purpose Purpose Purpose Sources
County District Name Revenues % $/Pupil % $/Pupil % $/Pupil % $/Pupil % $/Pupil % $/Pupil % $/PupilColumbia Co.
Dayton 6,979,782 14.3% 2,533.13 3.2% 574.30 58.0% 10,261.16 18.0% 3,191.46 0.9% 159.57 5.4% 953.86 0.1% 10.28 Starbuck 751,658 0.0% - 2.7% 659.05 75.0% 17,987.19 19.0% 4,558.40 0.6% 148.23 2.6% 623.47 0.0% - County Total 7,731,440 12.9% 2,346.74 3.2% 580.53 59.7% 10,829.66 18.1% 3,292.04 0.9% 158.74 5.1% 929.55 0.1% 9.52
Cowlitz Co.Longview 93,974,860 9.1% 1,273.16 0.7% 98.06 63.0% 8,816.69 19.5% 2,737.36 0.0% 2.91 7.6% 1,059.65 0.1% 16.62 Toutle Lake 9,985,969 9.7% 1,413.69 1.1% 156.77 67.7% 9,847.14 15.2% 2,210.34 0.0% 2.87 3.2% 468.20 3.1% 450.36 Castle Rock 19,252,261 8.0% 1,054.22 1.1% 143.14 66.0% 8,693.52 19.6% 2,575.53 0.0% 2.90 5.3% 696.70 0.0% - Kalama 13,978,995 15.4% 2,061.19 1.1% 149.17 62.8% 8,433.00 17.8% 2,388.83 0.0% 2.97 2.5% 336.70 0.4% 49.99 Woodland 40,311,207 10.2% 1,627.96 1.2% 191.61 54.3% 8,696.72 26.5% 4,245.38 0.0% 2.86 5.7% 910.63 2.1% 341.24 Kelso 69,804,662 5.3% 729.10 1.5% 200.91 66.6% 9,146.64 18.9% 2,593.99 0.0% 2.91 7.6% 1,037.51 0.1% 14.39 County Total 247,307,954 8.5% 1,200.21 1.1% 150.50 63.0% 8,902.60 20.2% 2,857.62 0.0% 2.90 6.6% 935.26 0.6% 80.26
Douglas Co.Orondo 4,008,891 14.7% 3,434.88 0.5% 125.57 43.4% 10,124.60 20.2% 4,717.86 0.0% 0.38 13.6% 3,184.36 7.5% 1,759.22 Bridgeport 11,812,813 2.3% 337.58 0.2% 25.47 66.2% 9,844.27 20.1% 2,993.81 0.0% 0.38 11.3% 1,676.65 0.0% - Palisades 810,943 13.5% 4,273.53 1.9% 610.50 51.1% 16,118.44 20.3% 6,416.92 0.0% 0.36 13.1% 4,134.47 0.0% - Eastmont 85,023,557 10.2% 1,399.71 1.3% 184.81 63.2% 8,661.29 17.6% 2,419.40 0.0% 0.36 7.6% 1,038.17 0.1% 11.54 Mansfield 2,539,676 5.4% 1,446.40 1.2% 311.04 76.5% 20,345.35 12.8% 3,413.28 0.0% 0.00 3.9% 1,040.42 0.1% 31.41 Waterville 4,790,637 7.2% 1,311.97 1.4% 253.35 67.6% 12,406.89 14.8% 2,707.57 0.0% 0.39 6.8% 1,238.41 2.3% 422.31 County Total 108,986,517 9.3% 1,341.62 1.2% 172.12 63.2% 9,121.93 17.8% 2,568.29 0.0% 0.36 8.1% 1,171.67 0.4% 64.51
Ferry Co.Keller 1,242,201 1.4% 435.56 4.0% 1,199.27 37.7% 11,399.83 13.5% 4,088.54 34.1% 10,309.26 9.1% 2,745.97 0.1% 30.74 Curlew 4,319,530 4.1% 705.74 0.6% 102.66 74.6% 12,928.29 7.5% 1,291.39 1.9% 326.09 5.9% 1,020.02 5.5% 951.76 Orient 1,371,161 4.2% 1,167.70 1.5% 426.71 53.6% 15,027.01 32.1% 8,990.33 1.5% 431.13 7.0% 1,968.60 0.1% 22.90 Inchelium 5,458,881 1.9% 466.28 1.3% 325.21 53.5% 13,471.76 7.3% 1,833.72 24.3% 6,125.47 11.0% 2,782.49 0.7% 180.23 Republic 6,083,522 7.4% 1,333.72 0.1% 26.19 62.2% 11,164.62 18.9% 3,391.10 4.4% 780.76 5.6% 1,008.23 1.3% 239.28 County Total 18,475,295 4.4% 898.44 0.9% 195.67 60.3% 12,436.35 13.4% 2,767.16 11.5% 2,366.94 7.6% 1,573.44 1.9% 402.02
Franklin Co.Pasco 258,253,117 4.4% 610.18 0.9% 123.62 66.3% 9,147.74 20.7% 2,853.86 0.0% 0.00 7.1% 974.00 0.6% 81.86 North Franklin 31,061,549 5.9% 872.76 0.8% 118.22 61.0% 9,039.72 21.3% 3,148.15 0.6% 93.74 10.4% 1,535.17 0.0% 1.73 Star 476,162 0.0% - 2.1% 658.42 71.4% 22,379.22 22.2% 6,964.62 0.1% 37.17 4.1% 1,286.98 0.0% - Kahlotus 2,298,081 3.3% 1,838.41 1.1% 613.82 83.2% 46,152.84 7.3% 4,022.44 0.0% 2.36 3.1% 1,723.33 2.0% 1,089.03 County Total 292,088,908 4.6% 638.55 0.9% 124.44 65.9% 9,219.98 20.7% 2,888.73 0.1% 9.45 7.4% 1,032.09 0.5% 75.75
Garfield Co.Pomeroy 5,681,993 14.2% 2,555.62 2.3% 407.50 60.2% 10,807.41 16.0% 2,862.02 0.8% 152.33 6.5% 1,158.06 0.0% - County Total 5,681,993 14.2% 2,555.62 2.3% 407.50 60.2% 10,807.41 16.0% 2,862.02 0.8% 152.33 6.5% 1,158.06 0.0% -
Grant Co.Wahluke 39,642,402 3.6% 580.22 0.6% 90.96 55.6% 9,012.21 24.5% 3,961.22 1.5% 245.54 13.7% 2,219.46 0.5% 85.24 Quincy 46,057,336 14.2% 2,169.70 0.6% 86.29 54.3% 8,270.27 21.4% 3,265.67 0.0% 0.25 9.4% 1,433.85 0.0% 2.10 Warden 14,038,270 6.1% 937.20 0.5% 77.92 61.5% 9,473.10 19.3% 2,970.46 0.0% 0.48 12.6% 1,944.26 0.0% 6.67 Coulee-Hartline 4,074,699 10.9% 2,001.58 1.5% 270.61 65.6% 12,052.46 14.6% 2,684.84 0.0% 0.02 6.5% 1,191.03 1.0% 182.94 Soap Lake 8,570,714 5.4% 826.99 1.0% 151.45 64.2% 9,852.86 19.9% 3,055.00 0.0% 0.02 9.5% 1,458.37 0.0% 2.63 Royal 25,663,949 4.8% 703.07 2.6% 384.22 62.7% 9,220.47 21.2% 3,118.90 0.0% 0.27 8.7% 1,272.12 0.0% - Moses Lake 121,897,082 5.3% 728.04 0.8% 111.12 69.2% 9,464.59 18.5% 2,528.91 0.0% 0.03 6.0% 815.24 0.2% 28.46 Ephrata 37,094,365 4.1% 564.21 0.9% 131.68 68.1% 9,480.58 20.3% 2,826.18 0.0% 0.03 6.5% 910.23 0.0% 3.47 Wilson Creek 3,239,141 6.7% 1,499.63 0.6% 143.72 72.0% 16,065.67 15.5% 3,468.56 0.0% 0.03 3.7% 817.99 1.4% 318.68 Grand Coulee Dam 11,745,343 4.1% 657.80 1.3% 215.70 58.2% 9,304.60 17.8% 2,847.27 7.9% 1,262.05 10.5% 1,676.17 0.2% 24.52 County Total 312,023,300 6.3% 920.23 0.9% 135.28 63.7% 9,302.46 20.1% 2,934.09 0.5% 71.61 8.3% 1,211.31 0.2% 27.62
31
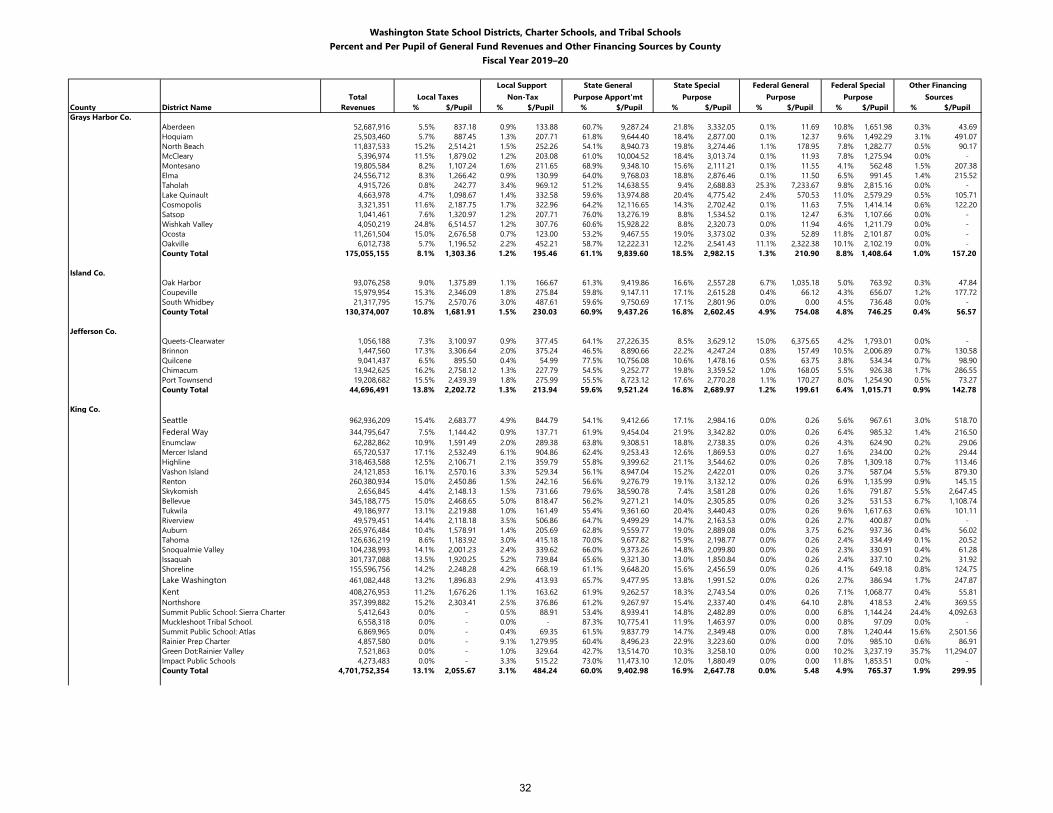
Washington State School Districts, Charter Schools, and Tribal SchoolsPercent and Per Pupil of General Fund Revenues and Other Financing Sources by County
Fiscal Year 2019–20
Local Support State General State Special Federal General Federal Special Other FinancingTotal Local Taxes Non-Tax Purpose Apport'mt Purpose Purpose Purpose Sources
County District Name Revenues % $/Pupil % $/Pupil % $/Pupil % $/Pupil % $/Pupil % $/Pupil % $/PupilGrays Harbor Co.
Aberdeen 52,687,916 5.5% 837.18 0.9% 133.88 60.7% 9,287.24 21.8% 3,332.05 0.1% 11.69 10.8% 1,651.98 0.3% 43.69 Hoquiam 25,503,460 5.7% 887.45 1.3% 207.71 61.8% 9,644.40 18.4% 2,877.00 0.1% 12.37 9.6% 1,492.29 3.1% 491.07 North Beach 11,837,533 15.2% 2,514.21 1.5% 252.26 54.1% 8,940.73 19.8% 3,274.46 1.1% 178.95 7.8% 1,282.77 0.5% 90.17 McCleary 5,396,974 11.5% 1,879.02 1.2% 203.08 61.0% 10,004.52 18.4% 3,013.74 0.1% 11.93 7.8% 1,275.94 0.0% - Montesano 19,805,584 8.2% 1,107.24 1.6% 211.65 68.9% 9,348.10 15.6% 2,111.21 0.1% 11.55 4.1% 562.48 1.5% 207.38 Elma 24,556,712 8.3% 1,266.42 0.9% 130.99 64.0% 9,768.03 18.8% 2,876.46 0.1% 11.50 6.5% 991.45 1.4% 215.52 Taholah 4,915,726 0.8% 242.77 3.4% 969.12 51.2% 14,638.55 9.4% 2,688.83 25.3% 7,233.67 9.8% 2,815.16 0.0% - Lake Quinault 4,663,978 4.7% 1,098.67 1.4% 332.58 59.6% 13,974.88 20.4% 4,775.42 2.4% 570.53 11.0% 2,579.29 0.5% 105.71 Cosmopolis 3,321,351 11.6% 2,187.75 1.7% 322.96 64.2% 12,116.65 14.3% 2,702.42 0.1% 11.63 7.5% 1,414.14 0.6% 122.20 Satsop 1,041,461 7.6% 1,320.97 1.2% 207.71 76.0% 13,276.19 8.8% 1,534.52 0.1% 12.47 6.3% 1,107.66 0.0% - Wishkah Valley 4,050,219 24.8% 6,514.57 1.2% 307.76 60.6% 15,928.22 8.8% 2,320.73 0.0% 11.94 4.6% 1,211.79 0.0% - Ocosta 11,261,504 15.0% 2,676.58 0.7% 123.00 53.2% 9,467.55 19.0% 3,373.02 0.3% 52.89 11.8% 2,101.87 0.0% - Oakville 6,012,738 5.7% 1,196.52 2.2% 452.21 58.7% 12,222.31 12.2% 2,541.43 11.1% 2,322.38 10.1% 2,102.19 0.0% - County Total 175,055,155 8.1% 1,303.36 1.2% 195.46 61.1% 9,839.60 18.5% 2,982.15 1.3% 210.90 8.8% 1,408.64 1.0% 157.20
Island Co.Oak Harbor 93,076,258 9.0% 1,375.89 1.1% 166.67 61.3% 9,419.86 16.6% 2,557.28 6.7% 1,035.18 5.0% 763.92 0.3% 47.84 Coupeville 15,979,954 15.3% 2,346.09 1.8% 275.84 59.8% 9,147.11 17.1% 2,615.28 0.4% 66.12 4.3% 656.07 1.2% 177.72 South Whidbey 21,317,795 15.7% 2,570.76 3.0% 487.61 59.6% 9,750.69 17.1% 2,801.96 0.0% 0.00 4.5% 736.48 0.0% - County Total 130,374,007 10.8% 1,681.91 1.5% 230.03 60.9% 9,437.26 16.8% 2,602.45 4.9% 754.08 4.8% 746.25 0.4% 56.57
Jefferson Co.Queets-Clearwater 1,056,188 7.3% 3,100.97 0.9% 377.45 64.1% 27,226.35 8.5% 3,629.12 15.0% 6,375.65 4.2% 1,793.01 0.0% - Brinnon 1,447,560 17.3% 3,306.64 2.0% 375.24 46.5% 8,890.66 22.2% 4,247.24 0.8% 157.49 10.5% 2,006.89 0.7% 130.58 Quilcene 9,041,437 6.5% 895.50 0.4% 54.99 77.5% 10,756.08 10.6% 1,478.16 0.5% 63.75 3.8% 534.34 0.7% 98.90 Chimacum 13,942,625 16.2% 2,758.12 1.3% 227.79 54.5% 9,252.77 19.8% 3,359.52 1.0% 168.05 5.5% 926.38 1.7% 286.55 Port Townsend 19,208,682 15.5% 2,439.39 1.8% 275.99 55.5% 8,723.12 17.6% 2,770.28 1.1% 170.27 8.0% 1,254.90 0.5% 73.27 County Total 44,696,491 13.8% 2,202.72 1.3% 213.94 59.6% 9,521.24 16.8% 2,689.97 1.2% 199.61 6.4% 1,015.71 0.9% 142.78
King Co.Seattle 962,936,209 15.4% 2,683.77 4.9% 844.79 54.1% 9,412.66 17.1% 2,984.16 0.0% 0.26 5.6% 967.61 3.0% 518.70 Federal Way 344,795,647 7.5% 1,144.42 0.9% 137.71 61.9% 9,454.04 21.9% 3,342.82 0.0% 0.26 6.4% 985.32 1.4% 216.50 Enumclaw 62,282,862 10.9% 1,591.49 2.0% 289.38 63.8% 9,308.51 18.8% 2,738.35 0.0% 0.26 4.3% 624.90 0.2% 29.06 Mercer Island 65,720,537 17.1% 2,532.49 6.1% 904.86 62.4% 9,253.43 12.6% 1,869.53 0.0% 0.27 1.6% 234.00 0.2% 29.44 Highline 318,463,588 12.5% 2,106.71 2.1% 359.79 55.8% 9,399.62 21.1% 3,544.62 0.0% 0.26 7.8% 1,309.18 0.7% 113.46 Vashon Island 24,121,853 16.1% 2,570.16 3.3% 529.34 56.1% 8,947.04 15.2% 2,422.01 0.0% 0.26 3.7% 587.04 5.5% 879.30 Renton 260,380,934 15.0% 2,450.86 1.5% 242.16 56.6% 9,276.79 19.1% 3,132.12 0.0% 0.26 6.9% 1,135.99 0.9% 145.15 Skykomish 2,656,845 4.4% 2,148.13 1.5% 731.66 79.6% 38,590.78 7.4% 3,581.28 0.0% 0.26 1.6% 791.87 5.5% 2,647.45 Bellevue 345,188,775 15.0% 2,468.65 5.0% 818.47 56.2% 9,271.21 14.0% 2,305.85 0.0% 0.26 3.2% 531.53 6.7% 1,108.74 Tukwila 49,186,977 13.1% 2,219.88 1.0% 161.49 55.4% 9,361.60 20.4% 3,440.43 0.0% 0.26 9.6% 1,617.63 0.6% 101.11 Riverview 49,579,451 14.4% 2,118.18 3.5% 506.86 64.7% 9,499.29 14.7% 2,163.53 0.0% 0.26 2.7% 400.87 0.0% - Auburn 265,976,484 10.4% 1,578.91 1.4% 205.69 62.8% 9,559.77 19.0% 2,889.08 0.0% 3.75 6.2% 937.36 0.4% 56.02 Tahoma 126,636,219 8.6% 1,183.92 3.0% 415.18 70.0% 9,677.82 15.9% 2,198.77 0.0% 0.26 2.4% 334.49 0.1% 20.52 Snoqualmie Valley 104,238,993 14.1% 2,001.23 2.4% 339.62 66.0% 9,373.26 14.8% 2,099.80 0.0% 0.26 2.3% 330.91 0.4% 61.28 Issaquah 301,737,088 13.5% 1,920.25 5.2% 739.84 65.6% 9,321.30 13.0% 1,850.84 0.0% 0.26 2.4% 337.10 0.2% 31.92 Shoreline 155,596,756 14.2% 2,248.28 4.2% 668.19 61.1% 9,648.20 15.6% 2,456.59 0.0% 0.26 4.1% 649.18 0.8% 124.75 Lake Washington 461,082,448 13.2% 1,896.83 2.9% 413.93 65.7% 9,477.95 13.8% 1,991.52 0.0% 0.26 2.7% 386.94 1.7% 247.87 Kent 408,276,953 11.2% 1,676.26 1.1% 163.62 61.9% 9,262.57 18.3% 2,743.54 0.0% 0.26 7.1% 1,068.77 0.4% 55.81 Northshore 357,399,882 15.2% 2,303.41 2.5% 376.86 61.2% 9,267.97 15.4% 2,337.40 0.4% 64.10 2.8% 418.53 2.4% 369.55 Summit Public School: Sierra Charter 5,412,643 0.0% - 0.5% 88.91 53.4% 8,939.41 14.8% 2,482.89 0.0% 0.00 6.8% 1,144.24 24.4% 4,092.63 Muckleshoot Tribal School. 6,558,318 0.0% - 0.0% - 87.3% 10,775.41 11.9% 1,463.97 0.0% 0.00 0.8% 97.09 0.0% - Summit Public School: Atlas 6,869,965 0.0% - 0.4% 69.35 61.5% 9,837.79 14.7% 2,349.48 0.0% 0.00 7.8% 1,240.44 15.6% 2,501.56 Rainier Prep Charter 4,857,580 0.0% - 9.1% 1,279.95 60.4% 8,496.23 22.9% 3,223.60 0.0% 0.00 7.0% 985.10 0.6% 86.91 Green Dot:Rainier Valley 7,521,863 0.0% - 1.0% 329.64 42.7% 13,514.70 10.3% 3,258.10 0.0% 0.00 10.2% 3,237.19 35.7% 11,294.07 Impact Public Schools 4,273,483 0.0% - 3.3% 515.22 73.0% 11,473.10 12.0% 1,880.49 0.0% 0.00 11.8% 1,853.51 0.0% - County Total 4,701,752,354 13.1% 2,055.67 3.1% 484.24 60.0% 9,402.98 16.9% 2,647.78 0.0% 5.48 4.9% 765.37 1.9% 299.95
32
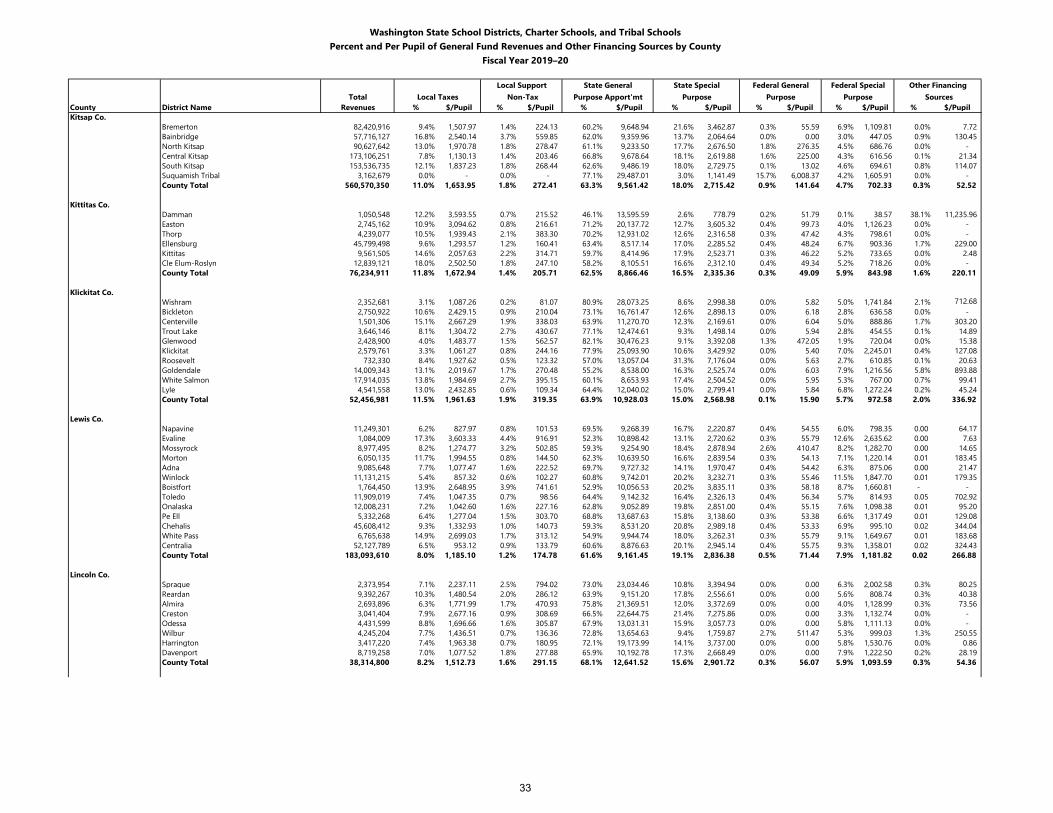
Washington State School Districts, Charter Schools, and Tribal SchoolsPercent and Per Pupil of General Fund Revenues and Other Financing Sources by County
Fiscal Year 2019–20
Local Support State General State Special Federal General Federal Special Other FinancingTotal Local Taxes Non-Tax Purpose Apport'mt Purpose Purpose Purpose Sources
County District Name Revenues % $/Pupil % $/Pupil % $/Pupil % $/Pupil % $/Pupil % $/Pupil % $/PupilKitsap Co.
Bremerton 82,420,916 9.4% 1,507.97 1.4% 224.13 60.2% 9,648.94 21.6% 3,462.87 0.3% 55.59 6.9% 1,109.81 0.0% 7.72 Bainbridge 57,716,127 16.8% 2,540.14 3.7% 559.85 62.0% 9,359.96 13.7% 2,064.64 0.0% 0.00 3.0% 447.05 0.9% 130.45 North Kitsap 90,627,642 13.0% 1,970.78 1.8% 278.47 61.1% 9,233.50 17.7% 2,676.50 1.8% 276.35 4.5% 686.76 0.0% - Central Kitsap 173,106,251 7.8% 1,130.13 1.4% 203.46 66.8% 9,678.64 18.1% 2,619.88 1.6% 225.00 4.3% 616.56 0.1% 21.34 South Kitsap 153,536,735 12.1% 1,837.23 1.8% 268.44 62.6% 9,486.19 18.0% 2,729.75 0.1% 13.02 4.6% 694.61 0.8% 114.07 Suquamish Tribal 3,162,679 0.0% - 0.0% - 77.1% 29,487.01 3.0% 1,141.49 15.7% 6,008.37 4.2% 1,605.91 0.0% - County Total 560,570,350 11.0% 1,653.95 1.8% 272.41 63.3% 9,561.42 18.0% 2,715.42 0.9% 141.64 4.7% 702.33 0.3% 52.52
Kittitas Co.Damman 1,050,548 12.2% 3,593.55 0.7% 215.52 46.1% 13,595.59 2.6% 778.79 0.2% 51.79 0.1% 38.57 38.1% 11,235.96 Easton 2,745,162 10.9% 3,094.62 0.8% 216.61 71.2% 20,137.72 12.7% 3,605.32 0.4% 99.73 4.0% 1,126.23 0.0% - Thorp 4,239,077 10.5% 1,939.43 2.1% 383.30 70.2% 12,931.02 12.6% 2,316.58 0.3% 47.42 4.3% 798.61 0.0% - Ellensburg 45,799,498 9.6% 1,293.57 1.2% 160.41 63.4% 8,517.14 17.0% 2,285.52 0.4% 48.24 6.7% 903.36 1.7% 229.00 Kittitas 9,561,505 14.6% 2,057.63 2.2% 314.71 59.7% 8,414.96 17.9% 2,523.71 0.3% 46.22 5.2% 733.65 0.0% 2.48 Cle Elum-Roslyn 12,839,121 18.0% 2,502.50 1.8% 247.10 58.2% 8,105.51 16.6% 2,312.10 0.4% 49.34 5.2% 718.26 0.0% - County Total 76,234,911 11.8% 1,672.94 1.4% 205.71 62.5% 8,866.46 16.5% 2,335.36 0.3% 49.09 5.9% 843.98 1.6% 220.11
Klickitat Co.Wishram 2,352,681 3.1% 1,087.26 0.2% 81.07 80.9% 28,073.25 8.6% 2,998.38 0.0% 5.82 5.0% 1,741.84 2.1% 712.68Bickleton 2,750,922 10.6% 2,429.15 0.9% 210.04 73.1% 16,761.47 12.6% 2,898.13 0.0% 6.18 2.8% 636.58 0.0% - Centerville 1,501,306 15.1% 2,667.29 1.9% 338.03 63.9% 11,270.70 12.3% 2,169.61 0.0% 6.04 5.0% 888.86 1.7% 303.20 Trout Lake 3,646,146 8.1% 1,304.72 2.7% 430.67 77.1% 12,474.61 9.3% 1,498.14 0.0% 5.94 2.8% 454.55 0.1% 14.89 Glenwood 2,428,900 4.0% 1,483.77 1.5% 562.57 82.1% 30,476.23 9.1% 3,392.08 1.3% 472.05 1.9% 720.04 0.0% 15.38 Klickitat 2,579,761 3.3% 1,061.27 0.8% 244.16 77.9% 25,093.90 10.6% 3,429.92 0.0% 5.40 7.0% 2,245.01 0.4% 127.08 Roosevelt 732,330 8.4% 1,927.62 0.5% 123.32 57.0% 13,057.04 31.3% 7,176.04 0.0% 5.63 2.7% 610.85 0.1% 20.63 Goldendale 14,009,343 13.1% 2,019.67 1.7% 270.48 55.2% 8,538.00 16.3% 2,525.74 0.0% 6.03 7.9% 1,216.56 5.8% 893.88 White Salmon 17,914,035 13.8% 1,984.69 2.7% 395.15 60.1% 8,653.93 17.4% 2,504.52 0.0% 5.95 5.3% 767.00 0.7% 99.41 Lyle 4,541,558 13.0% 2,432.85 0.6% 109.34 64.4% 12,040.02 15.0% 2,799.41 0.0% 5.84 6.8% 1,272.24 0.2% 45.24 County Total 52,456,981 11.5% 1,961.63 1.9% 319.35 63.9% 10,928.03 15.0% 2,568.98 0.1% 15.90 5.7% 972.58 2.0% 336.92
Lewis Co.Napavine 11,249,301 6.2% 827.97 0.8% 101.53 69.5% 9,268.39 16.7% 2,220.87 0.4% 54.55 6.0% 798.35 0.00 64.17 Evaline 1,084,009 17.3% 3,603.33 4.4% 916.91 52.3% 10,898.42 13.1% 2,720.62 0.3% 55.79 12.6% 2,635.62 0.00 7.63 Mossyrock 8,977,495 8.2% 1,274.77 3.2% 502.85 59.3% 9,254.90 18.4% 2,878.94 2.6% 410.47 8.2% 1,282.70 0.00 14.65 Morton 6,050,135 11.7% 1,994.55 0.8% 144.50 62.3% 10,639.50 16.6% 2,839.54 0.3% 54.13 7.1% 1,220.14 0.01 183.45 Adna 9,085,648 7.7% 1,077.47 1.6% 222.52 69.7% 9,727.32 14.1% 1,970.47 0.4% 54.42 6.3% 875.06 0.00 21.47 Winlock 11,131,215 5.4% 857.32 0.6% 102.27 60.8% 9,742.01 20.2% 3,232.71 0.3% 55.46 11.5% 1,847.70 0.01 179.35 Boistfort 1,764,450 13.9% 2,648.95 3.9% 741.61 52.9% 10,056.53 20.2% 3,835.11 0.3% 58.18 8.7% 1,660.81 - - Toledo 11,909,019 7.4% 1,047.35 0.7% 98.56 64.4% 9,142.32 16.4% 2,326.13 0.4% 56.34 5.7% 814.93 0.05 702.92 Onalaska 12,008,231 7.2% 1,042.60 1.6% 227.16 62.8% 9,052.89 19.8% 2,851.00 0.4% 55.15 7.6% 1,098.38 0.01 95.20 Pe Ell 5,332,268 6.4% 1,277.04 1.5% 303.70 68.8% 13,687.63 15.8% 3,138.60 0.3% 53.38 6.6% 1,317.49 0.01 129.08 Chehalis 45,608,412 9.3% 1,332.93 1.0% 140.73 59.3% 8,531.20 20.8% 2,989.18 0.4% 53.33 6.9% 995.10 0.02 344.04 White Pass 6,765,638 14.9% 2,699.03 1.7% 313.12 54.9% 9,944.74 18.0% 3,262.31 0.3% 55.79 9.1% 1,649.67 0.01 183.68 Centralia 52,127,789 6.5% 953.12 0.9% 133.79 60.6% 8,876.63 20.1% 2,945.14 0.4% 55.75 9.3% 1,358.01 0.02 324.43 County Total 183,093,610 8.0% 1,185.10 1.2% 174.78 61.6% 9,161.45 19.1% 2,836.38 0.5% 71.44 7.9% 1,181.82 0.02 266.88
Lincoln Co.Sprague 2,373,954 7.1% 2,237.11 2.5% 794.02 73.0% 23,034.46 10.8% 3,394.94 0.0% 0.00 6.3% 2,002.58 0.3% 80.25 Reardan 9,392,267 10.3% 1,480.54 2.0% 286.12 63.9% 9,151.20 17.8% 2,556.61 0.0% 0.00 5.6% 808.74 0.3% 40.38 Almira 2,693,896 6.3% 1,771.99 1.7% 470.93 75.8% 21,369.51 12.0% 3,372.69 0.0% 0.00 4.0% 1,128.99 0.3% 73.56 Creston 3,041,404 7.9% 2,677.16 0.9% 308.69 66.5% 22,644.75 21.4% 7,275.86 0.0% 0.00 3.3% 1,132.74 0.0% - Odessa 4,431,599 8.8% 1,696.66 1.6% 305.87 67.9% 13,031.31 15.9% 3,057.73 0.0% 0.00 5.8% 1,111.13 0.0% - Wilbur 4,245,204 7.7% 1,436.51 0.7% 136.36 72.8% 13,654.63 9.4% 1,759.87 2.7% 511.47 5.3% 999.03 1.3% 250.55 Harrington 3,417,220 7.4% 1,963.38 0.7% 180.95 72.1% 19,173.99 14.1% 3,737.00 0.0% 0.00 5.8% 1,530.76 0.0% 0.86 Davenport 8,719,258 7.0% 1,077.52 1.8% 277.88 65.9% 10,192.78 17.3% 2,668.49 0.0% 0.00 7.9% 1,222.50 0.2% 28.19 County Total 38,314,800 8.2% 1,512.73 1.6% 291.15 68.1% 12,641.52 15.6% 2,901.72 0.3% 56.07 5.9% 1,093.59 0.3% 54.36
33
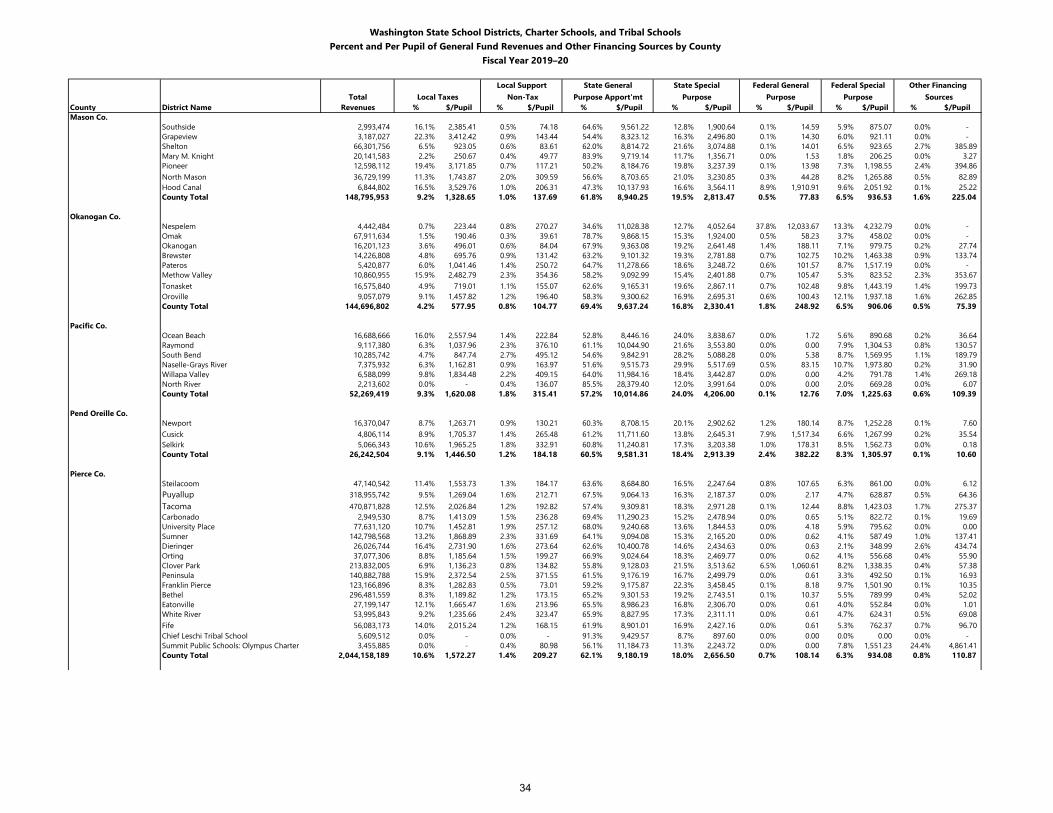
Washington State School Districts, Charter Schools, and Tribal SchoolsPercent and Per Pupil of General Fund Revenues and Other Financing Sources by County
Fiscal Year 2019–20
Local Support State General State Special Federal General Federal Special Other FinancingTotal Local Taxes Non-Tax Purpose Apport'mt Purpose Purpose Purpose Sources
County District Name Revenues % $/Pupil % $/Pupil % $/Pupil % $/Pupil % $/Pupil % $/Pupil % $/PupilMason Co.
Southside 2,993,474 16.1% 2,385.41 0.5% 74.18 64.6% 9,561.22 12.8% 1,900.64 0.1% 14.59 5.9% 875.07 0.0% - Grapeview 3,187,027 22.3% 3,412.42 0.9% 143.44 54.4% 8,323.12 16.3% 2,496.80 0.1% 14.30 6.0% 921.11 0.0% - Shelton 66,301,756 6.5% 923.05 0.6% 83.61 62.0% 8,814.72 21.6% 3,074.88 0.1% 14.01 6.5% 923.65 2.7% 385.89 Mary M. Knight 20,141,583 2.2% 250.67 0.4% 49.77 83.9% 9,719.14 11.7% 1,356.71 0.0% 1.53 1.8% 206.25 0.0% 3.27 Pioneer 12,598,112 19.4% 3,171.85 0.7% 117.21 50.2% 8,184.76 19.8% 3,237.39 0.1% 13.98 7.3% 1,198.55 2.4% 394.86 North Mason 36,729,199 11.3% 1,743.87 2.0% 309.59 56.6% 8,703.65 21.0% 3,230.85 0.3% 44.28 8.2% 1,265.88 0.5% 82.89 Hood Canal 6,844,802 16.5% 3,529.76 1.0% 206.31 47.3% 10,137.93 16.6% 3,564.11 8.9% 1,910.91 9.6% 2,051.92 0.1% 25.22 County Total 148,795,953 9.2% 1,328.65 1.0% 137.69 61.8% 8,940.25 19.5% 2,813.47 0.5% 77.83 6.5% 936.53 1.6% 225.04
Okanogan Co.Nespelem 4,442,484 0.7% 223.44 0.8% 270.27 34.6% 11,028.38 12.7% 4,052.64 37.8% 12,033.67 13.3% 4,232.79 0.0% - Omak 67,911,634 1.5% 190.46 0.3% 39.61 78.7% 9,868.15 15.3% 1,924.00 0.5% 58.23 3.7% 458.02 0.0% - Okanogan 16,201,123 3.6% 496.01 0.6% 84.04 67.9% 9,363.08 19.2% 2,641.48 1.4% 188.11 7.1% 979.75 0.2% 27.74 Brewster 14,226,808 4.8% 695.76 0.9% 131.42 63.2% 9,101.32 19.3% 2,781.88 0.7% 102.75 10.2% 1,463.38 0.9% 133.74 Pateros 5,420,877 6.0% 1,041.46 1.4% 250.72 64.7% 11,278.66 18.6% 3,248.72 0.6% 101.57 8.7% 1,517.19 0.0% - Methow Valley 10,860,955 15.9% 2,482.79 2.3% 354.36 58.2% 9,092.99 15.4% 2,401.88 0.7% 105.47 5.3% 823.52 2.3% 353.67 Tonasket 16,575,840 4.9% 719.01 1.1% 155.07 62.6% 9,165.31 19.6% 2,867.11 0.7% 102.48 9.8% 1,443.19 1.4% 199.73 Oroville 9,057,079 9.1% 1,457.82 1.2% 196.40 58.3% 9,300.62 16.9% 2,695.31 0.6% 100.43 12.1% 1,937.18 1.6% 262.85 County Total 144,696,802 4.2% 577.95 0.8% 104.77 69.4% 9,637.24 16.8% 2,330.41 1.8% 248.92 6.5% 906.06 0.5% 75.39
Pacific Co.Ocean Beach 16,688,666 16.0% 2,557.94 1.4% 222.84 52.8% 8,446.16 24.0% 3,838.67 0.0% 1.72 5.6% 890.68 0.2% 36.64 Raymond 9,117,380 6.3% 1,037.96 2.3% 376.10 61.1% 10,044.90 21.6% 3,553.80 0.0% 0.00 7.9% 1,304.53 0.8% 130.57 South Bend 10,285,742 4.7% 847.74 2.7% 495.12 54.6% 9,842.91 28.2% 5,088.28 0.0% 5.38 8.7% 1,569.95 1.1% 189.79 Naselle-Grays River 7,375,932 6.3% 1,162.81 0.9% 163.97 51.6% 9,515.73 29.9% 5,517.69 0.5% 83.15 10.7% 1,973.80 0.2% 31.90 Willapa Valley 6,588,099 9.8% 1,834.48 2.2% 409.15 64.0% 11,984.16 18.4% 3,442.87 0.0% 0.00 4.2% 791.78 1.4% 269.18 North River 2,213,602 0.0% - 0.4% 136.07 85.5% 28,379.40 12.0% 3,991.64 0.0% 0.00 2.0% 669.28 0.0% 6.07 County Total 52,269,419 9.3% 1,620.08 1.8% 315.41 57.2% 10,014.86 24.0% 4,206.00 0.1% 12.76 7.0% 1,225.63 0.6% 109.39
Pend Oreille Co.Newport 16,370,047 8.7% 1,263.71 0.9% 130.21 60.3% 8,708.15 20.1% 2,902.62 1.2% 180.14 8.7% 1,252.28 0.1% 7.60 Cusick 4,806,114 8.9% 1,705.37 1.4% 265.48 61.2% 11,711.60 13.8% 2,645.31 7.9% 1,517.34 6.6% 1,267.99 0.2% 35.54 Selkirk 5,066,343 10.6% 1,965.25 1.8% 332.91 60.8% 11,240.81 17.3% 3,203.38 1.0% 178.31 8.5% 1,562.73 0.0% 0.18 County Total 26,242,504 9.1% 1,446.50 1.2% 184.18 60.5% 9,581.31 18.4% 2,913.39 2.4% 382.22 8.3% 1,305.97 0.1% 10.60
Pierce Co.Steilacoom 47,140,542 11.4% 1,553.73 1.3% 184.17 63.6% 8,684.80 16.5% 2,247.64 0.8% 107.65 6.3% 861.00 0.0% 6.12 Puyallup 318,955,742 9.5% 1,269.04 1.6% 212.71 67.5% 9,064.13 16.3% 2,187.37 0.0% 2.17 4.7% 628.87 0.5% 64.36 Tacoma 470,871,828 12.5% 2,026.84 1.2% 192.82 57.4% 9,309.81 18.3% 2,971.28 0.1% 12.44 8.8% 1,423.03 1.7% 275.37 Carbonado 2,949,530 8.7% 1,413.09 1.5% 236.28 69.4% 11,290.23 15.2% 2,478.94 0.0% 0.65 5.1% 822.72 0.1% 19.69 University Place 77,631,120 10.7% 1,452.81 1.9% 257.12 68.0% 9,240.68 13.6% 1,844.53 0.0% 4.18 5.9% 795.62 0.0% 0.00 Sumner 142,798,568 13.2% 1,868.89 2.3% 331.69 64.1% 9,094.08 15.3% 2,165.20 0.0% 0.62 4.1% 587.49 1.0% 137.41 Dieringer 26,026,744 16.4% 2,731.90 1.6% 273.64 62.6% 10,400.78 14.6% 2,434.63 0.0% 0.63 2.1% 348.99 2.6% 434.74 Orting 37,077,306 8.8% 1,185.64 1.5% 199.27 66.9% 9,024.64 18.3% 2,469.77 0.0% 0.62 4.1% 556.68 0.4% 55.90 Clover Park 213,832,005 6.9% 1,136.23 0.8% 134.82 55.8% 9,128.03 21.5% 3,513.62 6.5% 1,060.61 8.2% 1,338.35 0.4% 57.38 Peninsula 140,882,788 15.9% 2,372.54 2.5% 371.55 61.5% 9,176.19 16.7% 2,499.79 0.0% 0.61 3.3% 492.50 0.1% 16.93 Franklin Pierce 123,166,896 8.3% 1,282.83 0.5% 73.01 59.2% 9,175.87 22.3% 3,458.45 0.1% 8.18 9.7% 1,501.90 0.1% 10.35 Bethel 296,481,559 8.3% 1,189.82 1.2% 173.15 65.2% 9,301.53 19.2% 2,743.51 0.1% 10.37 5.5% 789.99 0.4% 52.02 Eatonville 27,199,147 12.1% 1,665.47 1.6% 213.96 65.5% 8,986.23 16.8% 2,306.70 0.0% 0.61 4.0% 552.84 0.0% 1.01 White River 53,995,843 9.2% 1,235.66 2.4% 323.47 65.9% 8,827.95 17.3% 2,311.11 0.0% 0.61 4.7% 624.31 0.5% 69.08 Fife 56,083,173 14.0% 2,015.24 1.2% 168.15 61.9% 8,901.01 16.9% 2,427.16 0.0% 0.61 5.3% 762.37 0.7% 96.70 Chief Leschi Tribal School 5,609,512 0.0% - 0.0% - 91.3% 9,429.57 8.7% 897.60 0.0% 0.00 0.0% 0.00 0.0% - Summit Public Schools: Olympus Charter 3,455,885 0.0% - 0.4% 80.98 56.1% 11,184.73 11.3% 2,243.72 0.0% 0.00 7.8% 1,551.23 24.4% 4,861.41 County Total 2,044,158,189 10.6% 1,572.27 1.4% 209.27 62.1% 9,180.19 18.0% 2,656.50 0.7% 108.14 6.3% 934.08 0.8% 110.87
34
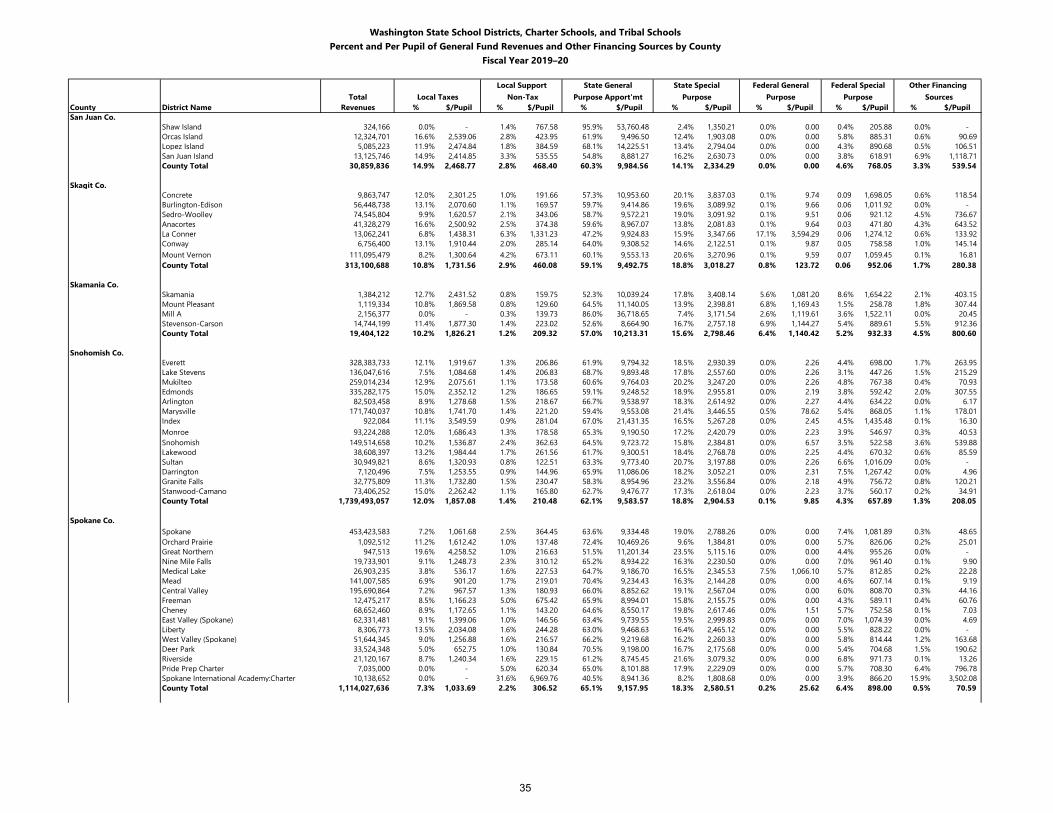
Washington State School Districts, Charter Schools, and Tribal SchoolsPercent and Per Pupil of General Fund Revenues and Other Financing Sources by County
Fiscal Year 2019–20
Local Support State General State Special Federal General Federal Special Other FinancingTotal Local Taxes Non-Tax Purpose Apport'mt Purpose Purpose Purpose Sources
County District Name Revenues % $/Pupil % $/Pupil % $/Pupil % $/Pupil % $/Pupil % $/Pupil % $/PupilSan Juan Co.
Shaw Island 324,166 0.0% - 1.4% 767.58 95.9% 53,760.48 2.4% 1,350.21 0.0% 0.00 0.4% 205.88 0.0% - Orcas Island 12,324,701 16.6% 2,539.06 2.8% 423.95 61.9% 9,496.50 12.4% 1,903.08 0.0% 0.00 5.8% 885.31 0.6% 90.69 Lopez Island 5,085,223 11.9% 2,474.84 1.8% 384.59 68.1% 14,225.51 13.4% 2,794.04 0.0% 0.00 4.3% 890.68 0.5% 106.51 San Juan Island 13,125,746 14.9% 2,414.85 3.3% 535.55 54.8% 8,881.27 16.2% 2,630.73 0.0% 0.00 3.8% 618.91 6.9% 1,118.71 County Total 30,859,836 14.9% 2,468.77 2.8% 468.40 60.3% 9,984.56 14.1% 2,334.29 0.0% 0.00 4.6% 768.05 3.3% 539.54
Skagit Co.Concrete 9,863,747 12.0% 2,301.25 1.0% 191.66 57.3% 10,953.60 20.1% 3,837.03 0.1% 9.74 0.09 1,698.05 0.6% 118.54 Burlington-Edison 56,448,738 13.1% 2,070.60 1.1% 169.57 59.7% 9,414.86 19.6% 3,089.92 0.1% 9.66 0.06 1,011.92 0.0% - Sedro-Woolley 74,545,804 9.9% 1,620.57 2.1% 343.06 58.7% 9,572.21 19.0% 3,091.92 0.1% 9.51 0.06 921.12 4.5% 736.67 Anacortes 41,328,279 16.6% 2,500.92 2.5% 374.38 59.6% 8,967.07 13.8% 2,081.83 0.1% 9.64 0.03 471.80 4.3% 643.52 La Conner 13,062,241 6.8% 1,438.31 6.3% 1,331.23 47.2% 9,924.83 15.9% 3,347.66 17.1% 3,594.29 0.06 1,274.12 0.6% 133.92 Conway 6,756,400 13.1% 1,910.44 2.0% 285.14 64.0% 9,308.52 14.6% 2,122.51 0.1% 9.87 0.05 758.58 1.0% 145.14 Mount Vernon 111,095,479 8.2% 1,300.64 4.2% 673.11 60.1% 9,553.13 20.6% 3,270.96 0.1% 9.59 0.07 1,059.45 0.1% 16.81 County Total 313,100,688 10.8% 1,731.56 2.9% 460.08 59.1% 9,492.75 18.8% 3,018.27 0.8% 123.72 0.06 952.06 1.7% 280.38
Skamania Co.Skamania 1,384,212 12.7% 2,431.52 0.8% 159.75 52.3% 10,039.24 17.8% 3,408.14 5.6% 1,081.20 8.6% 1,654.22 2.1% 403.15 Mount Pleasant 1,119,334 10.8% 1,869.58 0.8% 129.60 64.5% 11,140.05 13.9% 2,398.81 6.8% 1,169.43 1.5% 258.78 1.8% 307.44 Mill A 2,156,377 0.0% - 0.3% 139.73 86.0% 36,718.65 7.4% 3,171.54 2.6% 1,119.61 3.6% 1,522.11 0.0% 20.45 Stevenson-Carson 14,744,199 11.4% 1,877.30 1.4% 223.02 52.6% 8,664.90 16.7% 2,757.18 6.9% 1,144.27 5.4% 889.61 5.5% 912.36 County Total 19,404,122 10.2% 1,826.21 1.2% 209.32 57.0% 10,213.31 15.6% 2,798.46 6.4% 1,140.42 5.2% 932.33 4.5% 800.60
Snohomish Co.Everett 328,383,733 12.1% 1,919.67 1.3% 206.86 61.9% 9,794.32 18.5% 2,930.39 0.0% 2.26 4.4% 698.00 1.7% 263.95 Lake Stevens 136,047,616 7.5% 1,084.68 1.4% 206.83 68.7% 9,893.48 17.8% 2,557.60 0.0% 2.26 3.1% 447.26 1.5% 215.29 Mukilteo 259,014,234 12.9% 2,075.61 1.1% 173.58 60.6% 9,764.03 20.2% 3,247.20 0.0% 2.26 4.8% 767.38 0.4% 70.93 Edmonds 335,282,175 15.0% 2,352.12 1.2% 186.65 59.1% 9,248.52 18.9% 2,955.81 0.0% 2.19 3.8% 592.42 2.0% 307.55 Arlington 82,503,458 8.9% 1,278.68 1.5% 218.67 66.7% 9,538.97 18.3% 2,614.92 0.0% 2.27 4.4% 634.22 0.0% 6.17 Marysville 171,740,037 10.8% 1,741.70 1.4% 221.20 59.4% 9,553.08 21.4% 3,446.55 0.5% 78.62 5.4% 868.05 1.1% 178.01 Index 922,084 11.1% 3,549.59 0.9% 281.04 67.0% 21,431.35 16.5% 5,267.28 0.0% 2.45 4.5% 1,435.48 0.1% 16.30 Monroe 93,224,288 12.0% 1,686.43 1.3% 178.58 65.3% 9,190.50 17.2% 2,420.79 0.0% 2.23 3.9% 546.97 0.3% 40.53 Snohomish 149,514,658 10.2% 1,536.87 2.4% 362.63 64.5% 9,723.72 15.8% 2,384.81 0.0% 6.57 3.5% 522.58 3.6% 539.88 Lakewood 38,608,397 13.2% 1,984.44 1.7% 261.56 61.7% 9,300.51 18.4% 2,768.78 0.0% 2.25 4.4% 670.32 0.6% 85.59 Sultan 30,949,821 8.6% 1,320.93 0.8% 122.51 63.3% 9,773.40 20.7% 3,197.88 0.0% 2.26 6.6% 1,016.09 0.0% - Darrington 7,120,496 7.5% 1,253.55 0.9% 144.96 65.9% 11,086.06 18.2% 3,052.21 0.0% 2.31 7.5% 1,267.42 0.0% 4.96 Granite Falls 32,775,809 11.3% 1,732.80 1.5% 230.47 58.3% 8,954.96 23.2% 3,556.84 0.0% 2.18 4.9% 756.72 0.8% 120.21 Stanwood-Camano 73,406,252 15.0% 2,262.42 1.1% 165.80 62.7% 9,476.77 17.3% 2,618.04 0.0% 2.23 3.7% 560.17 0.2% 34.91 County Total 1,739,493,057 12.0% 1,857.08 1.4% 210.48 62.1% 9,583.57 18.8% 2,904.53 0.1% 9.85 4.3% 657.89 1.3% 208.05
Spokane Co.Spokane 453,423,583 7.2% 1,061.68 2.5% 364.45 63.6% 9,334.48 19.0% 2,788.26 0.0% 0.00 7.4% 1,081.89 0.3% 48.65 Orchard Prairie 1,092,512 11.2% 1,612.42 1.0% 137.48 72.4% 10,469.26 9.6% 1,384.81 0.0% 0.00 5.7% 826.06 0.2% 25.01 Great Northern 947,513 19.6% 4,258.52 1.0% 216.63 51.5% 11,201.34 23.5% 5,115.16 0.0% 0.00 4.4% 955.26 0.0% - Nine Mile Falls 19,733,901 9.1% 1,248.73 2.3% 310.12 65.2% 8,934.22 16.3% 2,230.50 0.0% 0.00 7.0% 961.40 0.1% 9.90 Medical Lake 26,903,235 3.8% 536.17 1.6% 227.53 64.7% 9,186.70 16.5% 2,345.53 7.5% 1,066.10 5.7% 812.85 0.2% 22.28 Mead 141,007,585 6.9% 901.20 1.7% 219.01 70.4% 9,234.43 16.3% 2,144.28 0.0% 0.00 4.6% 607.14 0.1% 9.19 Central Valley 195,690,864 7.2% 967.57 1.3% 180.93 66.0% 8,852.62 19.1% 2,567.04 0.0% 0.00 6.0% 808.70 0.3% 44.16 Freeman 12,475,217 8.5% 1,166.23 5.0% 675.42 65.9% 8,994.01 15.8% 2,155.75 0.0% 0.00 4.3% 589.11 0.4% 60.76 Cheney 68,652,460 8.9% 1,172.65 1.1% 143.20 64.6% 8,550.17 19.8% 2,617.46 0.0% 1.51 5.7% 752.58 0.1% 7.03 East Valley (Spokane) 62,331,481 9.1% 1,399.06 1.0% 146.56 63.4% 9,739.55 19.5% 2,999.83 0.0% 0.00 7.0% 1,074.39 0.0% 4.69 Liberty 8,306,773 13.5% 2,034.08 1.6% 244.28 63.0% 9,468.63 16.4% 2,465.12 0.0% 0.00 5.5% 828.22 0.0% - West Valley (Spokane) 51,644,345 9.0% 1,256.88 1.6% 216.57 66.2% 9,219.68 16.2% 2,260.33 0.0% 0.00 5.8% 814.44 1.2% 163.68 Deer Park 33,524,348 5.0% 652.75 1.0% 130.84 70.5% 9,198.00 16.7% 2,175.68 0.0% 0.00 5.4% 704.68 1.5% 190.62 Riverside 21,120,167 8.7% 1,240.34 1.6% 229.15 61.2% 8,745.45 21.6% 3,079.32 0.0% 0.00 6.8% 971.73 0.1% 13.26 Pride Prep Charter 7,035,000 0.0% - 5.0% 620.34 65.0% 8,101.88 17.9% 2,229.09 0.0% 0.00 5.7% 708.30 6.4% 796.78 Spokane International Academy:Charter 10,138,652 0.0% - 31.6% 6,969.76 40.5% 8,941.36 8.2% 1,808.68 0.0% 0.00 3.9% 866.20 15.9% 3,502.08 County Total 1,114,027,636 7.3% 1,033.69 2.2% 306.52 65.1% 9,157.95 18.3% 2,580.51 0.2% 25.62 6.4% 898.00 0.5% 70.59
35
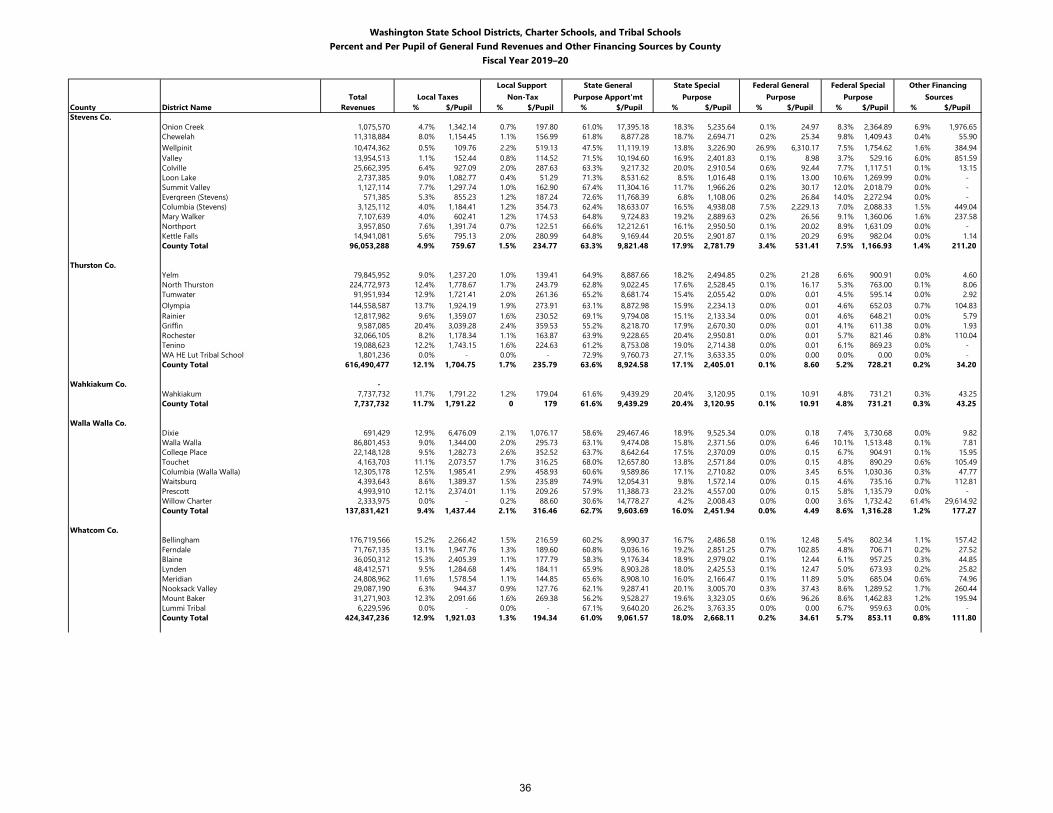
Washington State School Districts, Charter Schools, and Tribal SchoolsPercent and Per Pupil of General Fund Revenues and Other Financing Sources by County
Fiscal Year 2019–20
Local Support State General State Special Federal General Federal Special Other FinancingTotal Local Taxes Non-Tax Purpose Apport'mt Purpose Purpose Purpose Sources
County District Name Revenues % $/Pupil % $/Pupil % $/Pupil % $/Pupil % $/Pupil % $/Pupil % $/PupilStevens Co.
Onion Creek 1,075,570 4.7% 1,342.14 0.7% 197.80 61.0% 17,395.18 18.3% 5,235.64 0.1% 24.97 8.3% 2,364.89 6.9% 1,976.65 Chewelah 11,318,884 8.0% 1,154.45 1.1% 156.99 61.8% 8,877.28 18.7% 2,694.71 0.2% 25.34 9.8% 1,409.43 0.4% 55.90 Wellpinit 10,474,362 0.5% 109.76 2.2% 519.13 47.5% 11,119.19 13.8% 3,226.90 26.9% 6,310.17 7.5% 1,754.62 1.6% 384.94 Valley 13,954,513 1.1% 152.44 0.8% 114.52 71.5% 10,194.60 16.9% 2,401.83 0.1% 8.98 3.7% 529.16 6.0% 851.59 Colville 25,662,395 6.4% 927.09 2.0% 287.63 63.3% 9,217.32 20.0% 2,910.54 0.6% 92.44 7.7% 1,117.51 0.1% 13.15 Loon Lake 2,737,385 9.0% 1,082.77 0.4% 51.29 71.3% 8,531.62 8.5% 1,016.48 0.1% 13.00 10.6% 1,269.99 0.0% - Summit Valley 1,127,114 7.7% 1,297.74 1.0% 162.90 67.4% 11,304.16 11.7% 1,966.26 0.2% 30.17 12.0% 2,018.79 0.0% - Evergreen (Stevens) 571,385 5.3% 855.23 1.2% 187.24 72.6% 11,768.39 6.8% 1,108.06 0.2% 26.84 14.0% 2,272.94 0.0% - Columbia (Stevens) 3,125,112 4.0% 1,184.41 1.2% 354.73 62.4% 18,633.07 16.5% 4,938.08 7.5% 2,229.13 7.0% 2,088.33 1.5% 449.04 Mary Walker 7,107,639 4.0% 602.41 1.2% 174.53 64.8% 9,724.83 19.2% 2,889.63 0.2% 26.56 9.1% 1,360.06 1.6% 237.58 Northport 3,957,850 7.6% 1,391.74 0.7% 122.51 66.6% 12,212.61 16.1% 2,950.50 0.1% 20.02 8.9% 1,631.09 0.0% - Kettle Falls 14,941,081 5.6% 795.13 2.0% 280.99 64.8% 9,169.44 20.5% 2,901.87 0.1% 20.29 6.9% 982.04 0.0% 1.14 County Total 96,053,288 4.9% 759.67 1.5% 234.77 63.3% 9,821.48 17.9% 2,781.79 3.4% 531.41 7.5% 1,166.93 1.4% 211.20
Thurston Co.Yelm 79,845,952 9.0% 1,237.20 1.0% 139.41 64.9% 8,887.66 18.2% 2,494.85 0.2% 21.28 6.6% 900.91 0.0% 4.60 North Thurston 224,772,973 12.4% 1,778.67 1.7% 243.79 62.8% 9,022.45 17.6% 2,528.45 0.1% 16.17 5.3% 763.00 0.1% 8.06 Tumwater 91,951,934 12.9% 1,721.41 2.0% 261.36 65.2% 8,681.74 15.4% 2,055.42 0.0% 0.01 4.5% 595.14 0.0% 2.92 Olympia 144,558,587 13.7% 1,924.19 1.9% 273.91 63.1% 8,872.98 15.9% 2,234.13 0.0% 0.01 4.6% 652.03 0.7% 104.83 Rainier 12,817,982 9.6% 1,359.07 1.6% 230.52 69.1% 9,794.08 15.1% 2,133.34 0.0% 0.01 4.6% 648.21 0.0% 5.79 Griffin 9,587,085 20.4% 3,039.28 2.4% 359.53 55.2% 8,218.70 17.9% 2,670.30 0.0% 0.01 4.1% 611.38 0.0% 1.93 Rochester 32,066,105 8.2% 1,178.34 1.1% 163.87 63.9% 9,228.65 20.4% 2,950.81 0.0% 0.01 5.7% 821.46 0.8% 110.04 Tenino 19,088,623 12.2% 1,743.15 1.6% 224.63 61.2% 8,753.08 19.0% 2,714.38 0.0% 0.01 6.1% 869.23 0.0% - WA HE Lut Tribal School 1,801,236 0.0% - 0.0% - 72.9% 9,760.73 27.1% 3,633.35 0.0% 0.00 0.0% 0.00 0.0% - County Total 616,490,477 12.1% 1,704.75 1.7% 235.79 63.6% 8,924.58 17.1% 2,405.01 0.1% 8.60 5.2% 728.21 0.2% 34.20
Wahkiakum Co. - Wahkiakum 7,737,732 11.7% 1,791.22 1.2% 179.04 61.6% 9,439.29 20.4% 3,120.95 0.1% 10.91 4.8% 731.21 0.3% 43.25 County Total 7,737,732 11.7% 1,791.22 0 179 61.6% 9,439.29 20.4% 3,120.95 0.1% 10.91 4.8% 731.21 0.3% 43.25
Walla Walla Co.Dixie 691,429 12.9% 6,476.09 2.1% 1,076.17 58.6% 29,467.46 18.9% 9,525.34 0.0% 0.18 7.4% 3,730.68 0.0% 9.82 Walla Walla 86,801,453 9.0% 1,344.00 2.0% 295.73 63.1% 9,474.08 15.8% 2,371.56 0.0% 6.46 10.1% 1,513.48 0.1% 7.81 College Place 22,148,128 9.5% 1,282.73 2.6% 352.52 63.7% 8,642.64 17.5% 2,370.09 0.0% 0.15 6.7% 904.91 0.1% 15.95 Touchet 4,163,703 11.1% 2,073.57 1.7% 316.25 68.0% 12,657.80 13.8% 2,571.84 0.0% 0.15 4.8% 890.29 0.6% 105.49 Columbia (Walla Walla) 12,305,178 12.5% 1,985.41 2.9% 458.93 60.6% 9,589.86 17.1% 2,710.82 0.0% 3.45 6.5% 1,030.36 0.3% 47.77 Waitsburg 4,393,643 8.6% 1,389.37 1.5% 235.89 74.9% 12,054.31 9.8% 1,572.14 0.0% 0.15 4.6% 735.16 0.7% 112.81 Prescott 4,993,910 12.1% 2,374.01 1.1% 209.26 57.9% 11,388.73 23.2% 4,557.00 0.0% 0.15 5.8% 1,135.79 0.0% - Willow Charter 2,333,975 0.0% - 0.2% 88.60 30.6% 14,778.27 4.2% 2,008.43 0.0% 0.00 3.6% 1,732.42 61.4% 29,614.92 County Total 137,831,421 9.4% 1,437.44 2.1% 316.46 62.7% 9,603.69 16.0% 2,451.94 0.0% 4.49 8.6% 1,316.28 1.2% 177.27
Whatcom Co.Bellingham 176,719,566 15.2% 2,266.42 1.5% 216.59 60.2% 8,990.37 16.7% 2,486.58 0.1% 12.48 5.4% 802.34 1.1% 157.42 Ferndale 71,767,135 13.1% 1,947.76 1.3% 189.60 60.8% 9,036.16 19.2% 2,851.25 0.7% 102.85 4.8% 706.71 0.2% 27.52 Blaine 36,050,312 15.3% 2,405.39 1.1% 177.79 58.3% 9,176.34 18.9% 2,979.02 0.1% 12.44 6.1% 957.25 0.3% 44.85 Lynden 48,412,571 9.5% 1,284.68 1.4% 184.11 65.9% 8,903.28 18.0% 2,425.53 0.1% 12.47 5.0% 673.93 0.2% 25.82 Meridian 24,808,962 11.6% 1,578.54 1.1% 144.85 65.6% 8,908.10 16.0% 2,166.47 0.1% 11.89 5.0% 685.04 0.6% 74.96 Nooksack Valley 29,087,190 6.3% 944.37 0.9% 127.76 62.1% 9,287.41 20.1% 3,005.70 0.3% 37.43 8.6% 1,289.52 1.7% 260.44 Mount Baker 31,271,903 12.3% 2,091.66 1.6% 269.38 56.2% 9,528.27 19.6% 3,323.05 0.6% 96.26 8.6% 1,462.83 1.2% 195.94 Lummi Tribal 6,229,596 0.0% - 0.0% - 67.1% 9,640.20 26.2% 3,763.35 0.0% 0.00 6.7% 959.63 0.0% - County Total 424,347,236 12.9% 1,921.03 1.3% 194.34 61.0% 9,061.57 18.0% 2,668.11 0.2% 34.61 5.7% 853.11 0.8% 111.80
36
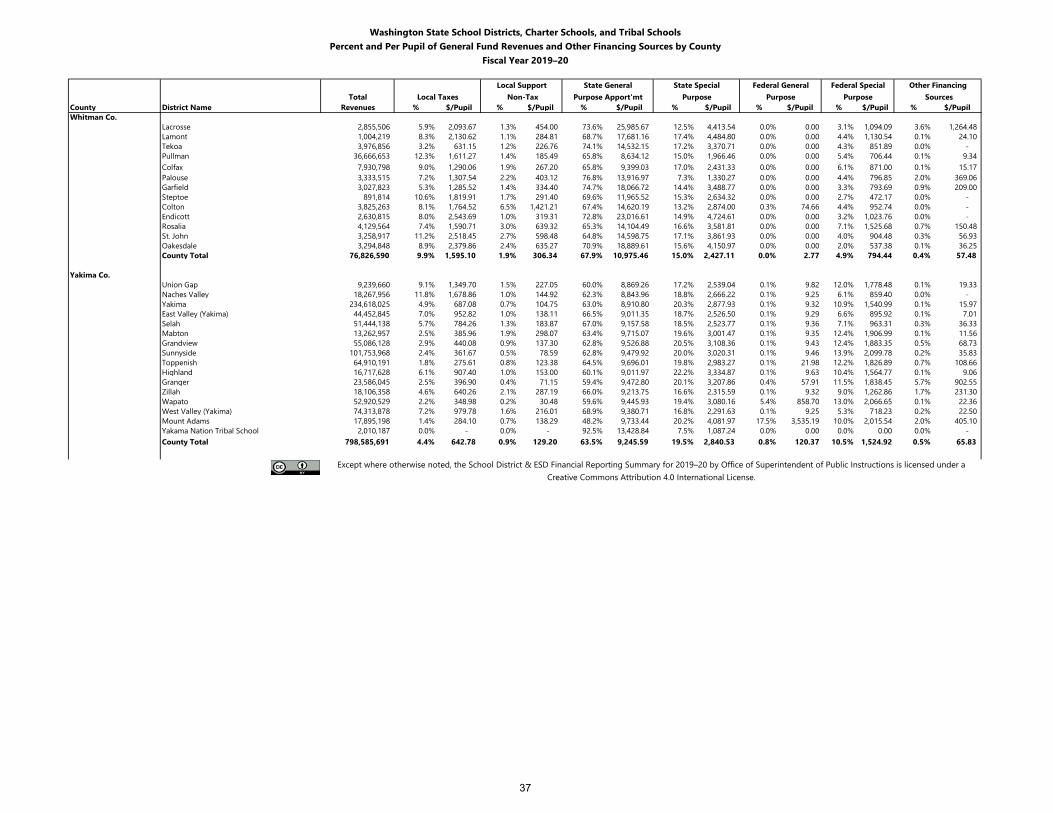
Washington State School Districts, Charter Schools, and Tribal SchoolsPercent and Per Pupil of General Fund Revenues and Other Financing Sources by County
Fiscal Year 2019–20
Local Support State General State Special Federal General Federal Special Other FinancingTotal Local Taxes Non-Tax Purpose Apport'mt Purpose Purpose Purpose Sources
County District Name Revenues % $/Pupil % $/Pupil % $/Pupil % $/Pupil % $/Pupil % $/Pupil % $/PupilWhitman Co.
Lacrosse 2,855,506 5.9% 2,093.67 1.3% 454.00 73.6% 25,985.67 12.5% 4,413.54 0.0% 0.00 3.1% 1,094.09 3.6% 1,264.48 Lamont 1,004,219 8.3% 2,130.62 1.1% 284.81 68.7% 17,681.16 17.4% 4,484.80 0.0% 0.00 4.4% 1,130.54 0.1% 24.10 Tekoa 3,976,856 3.2% 631.15 1.2% 226.76 74.1% 14,532.15 17.2% 3,370.71 0.0% 0.00 4.3% 851.89 0.0% - Pullman 36,666,653 12.3% 1,611.27 1.4% 185.49 65.8% 8,634.12 15.0% 1,966.46 0.0% 0.00 5.4% 706.44 0.1% 9.34 Colfax 7,930,798 9.0% 1,290.06 1.9% 267.20 65.8% 9,399.03 17.0% 2,431.33 0.0% 0.00 6.1% 871.00 0.1% 15.17 Palouse 3,333,515 7.2% 1,307.54 2.2% 403.12 76.8% 13,916.97 7.3% 1,330.27 0.0% 0.00 4.4% 796.85 2.0% 369.06 Garfield 3,027,823 5.3% 1,285.52 1.4% 334.40 74.7% 18,066.72 14.4% 3,488.77 0.0% 0.00 3.3% 793.69 0.9% 209.00 Steptoe 891,814 10.6% 1,819.91 1.7% 291.40 69.6% 11,965.52 15.3% 2,634.32 0.0% 0.00 2.7% 472.17 0.0% - Colton 3,825,263 8.1% 1,764.52 6.5% 1,421.21 67.4% 14,620.19 13.2% 2,874.00 0.3% 74.66 4.4% 952.74 0.0% - Endicott 2,630,815 8.0% 2,543.69 1.0% 319.31 72.8% 23,016.61 14.9% 4,724.61 0.0% 0.00 3.2% 1,023.76 0.0% - Rosalia 4,129,564 7.4% 1,590.71 3.0% 639.32 65.3% 14,104.49 16.6% 3,581.81 0.0% 0.00 7.1% 1,525.68 0.7% 150.48 St. John 3,258,917 11.2% 2,518.45 2.7% 598.48 64.8% 14,598.75 17.1% 3,861.93 0.0% 0.00 4.0% 904.48 0.3% 56.93 Oakesdale 3,294,848 8.9% 2,379.86 2.4% 635.27 70.9% 18,889.61 15.6% 4,150.97 0.0% 0.00 2.0% 537.38 0.1% 36.25 County Total 76,826,590 9.9% 1,595.10 1.9% 306.34 67.9% 10,975.46 15.0% 2,427.11 0.0% 2.77 4.9% 794.44 0.4% 57.48
Yakima Co.Union Gap 9,239,660 9.1% 1,349.70 1.5% 227.05 60.0% 8,869.26 17.2% 2,539.04 0.1% 9.82 12.0% 1,778.48 0.1% 19.33 Naches Valley 18,267,956 11.8% 1,678.86 1.0% 144.92 62.3% 8,843.96 18.8% 2,666.22 0.1% 9.25 6.1% 859.40 0.0% - Yakima 234,618,025 4.9% 687.08 0.7% 104.75 63.0% 8,910.80 20.3% 2,877.93 0.1% 9.32 10.9% 1,540.99 0.1% 15.97 East Valley (Yakima) 44,452,845 7.0% 952.82 1.0% 138.11 66.5% 9,011.35 18.7% 2,526.50 0.1% 9.29 6.6% 895.92 0.1% 7.01 Selah 51,444,138 5.7% 784.26 1.3% 183.87 67.0% 9,157.58 18.5% 2,523.77 0.1% 9.36 7.1% 963.31 0.3% 36.33 Mabton 13,262,957 2.5% 385.96 1.9% 298.07 63.4% 9,715.07 19.6% 3,001.47 0.1% 9.35 12.4% 1,906.99 0.1% 11.56 Grandview 55,086,128 2.9% 440.08 0.9% 137.30 62.8% 9,526.88 20.5% 3,108.36 0.1% 9.43 12.4% 1,883.35 0.5% 68.73 Sunnyside 101,753,968 2.4% 361.67 0.5% 78.59 62.8% 9,479.92 20.0% 3,020.31 0.1% 9.46 13.9% 2,099.78 0.2% 35.83 Toppenish 64,910,191 1.8% 275.61 0.8% 123.38 64.5% 9,696.01 19.8% 2,983.27 0.1% 21.98 12.2% 1,826.89 0.7% 108.66 Highland 16,717,628 6.1% 907.40 1.0% 153.00 60.1% 9,011.97 22.2% 3,334.87 0.1% 9.63 10.4% 1,564.77 0.1% 9.06 Granger 23,586,045 2.5% 396.90 0.4% 71.15 59.4% 9,472.80 20.1% 3,207.86 0.4% 57.91 11.5% 1,838.45 5.7% 902.55 Zillah 18,106,358 4.6% 640.26 2.1% 287.19 66.0% 9,213.75 16.6% 2,315.59 0.1% 9.32 9.0% 1,262.86 1.7% 231.30 Wapato 52,920,529 2.2% 348.98 0.2% 30.48 59.6% 9,445.93 19.4% 3,080.16 5.4% 858.70 13.0% 2,066.65 0.1% 22.36 West Valley (Yakima) 74,313,878 7.2% 979.78 1.6% 216.01 68.9% 9,380.71 16.8% 2,291.63 0.1% 9.25 5.3% 718.23 0.2% 22.50 Mount Adams 17,895,198 1.4% 284.10 0.7% 138.29 48.2% 9,733.44 20.2% 4,081.97 17.5% 3,535.19 10.0% 2,015.54 2.0% 405.10 Yakama Nation Tribal School 2,010,187 0.0% - 0.0% - 92.5% 13,428.84 7.5% 1,087.24 0.0% 0.00 0.0% 0.00 0.0% - County Total 798,585,691 4.4% 642.78 0.9% 129.20 63.5% 9,245.59 19.5% 2,840.53 0.8% 120.37 10.5% 1,524.92 0.5% 65.83
Except where otherwise noted, the School District & ESD Financial Reporting Summary for 2019–20 by Office of Superintendent of Public Instructions is licensed under a Creative Commons Attribution 4.0 International License.
37
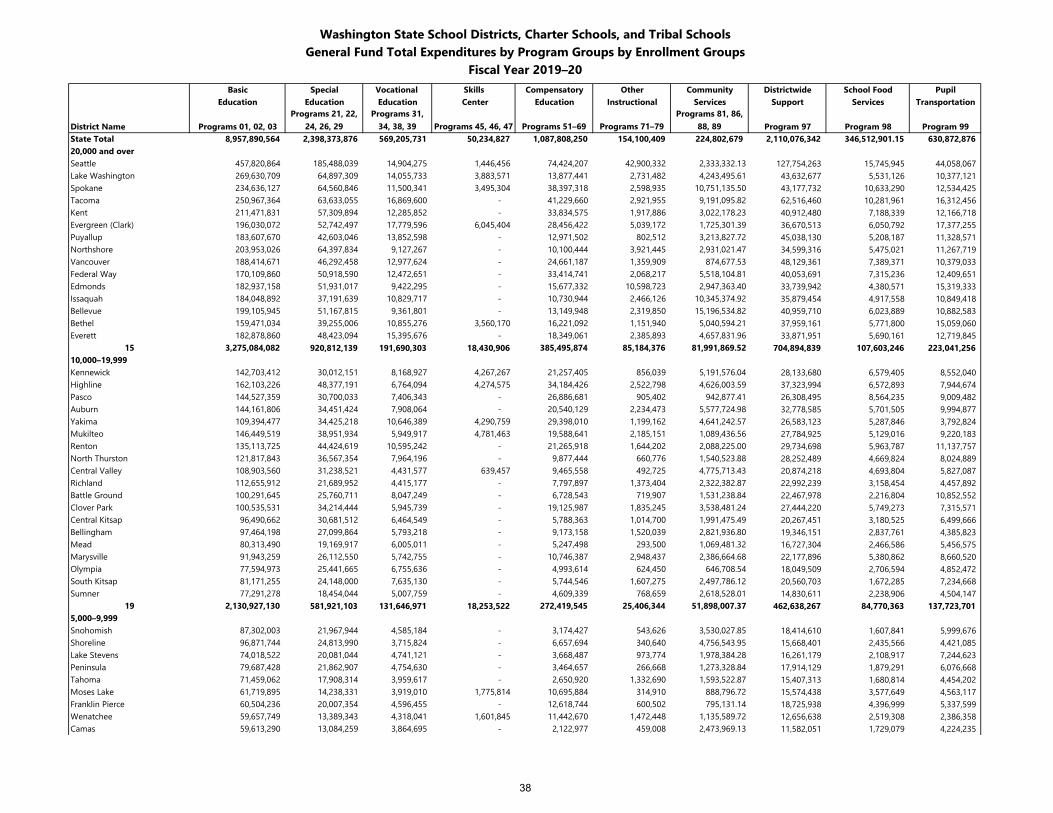
Washington State School Districts, Charter Schools, and Tribal SchoolsGeneral Fund Total Expenditures by Program Groups by Enrollment Groups
Fiscal Year 2019–20Basic Special Vocational Skills Compensatory Other Community Districtwide School Food Pupil
Education Education Education Center Education Instructional Services Support Services Transportation
District Name Programs 01, 02, 03Programs 21, 22,
24, 26, 29Programs 31,
34, 38, 39 Programs 45, 46, 47 Programs 51–69 Programs 71–79Programs 81, 86,
88, 89 Program 97 Program 98 Program 99State Total 8,957,890,564 2,398,373,876 569,205,731 50,234,827 1,087,808,250 154,100,409 224,802,679 2,110,076,342 346,512,901.15 630,872,876 20,000 and overSeattle 457,820,864 185,488,039 14,904,275 1,446,456 74,424,207 42,900,332 2,333,332.13 127,754,263 15,745,945 44,058,067 Lake Washington 269,630,709 64,897,309 14,055,733 3,883,571 13,877,441 2,731,482 4,243,495.61 43,632,677 5,531,126 10,377,121 Spokane 234,636,127 64,560,846 11,500,341 3,495,304 38,397,318 2,598,935 10,751,135.50 43,177,732 10,633,290 12,534,425 Tacoma 250,967,364 63,633,055 16,869,600 - 41,229,660 2,921,955 9,191,095.82 62,516,460 10,281,961 16,312,456 Kent 211,471,831 57,309,894 12,285,852 - 33,834,575 1,917,886 3,022,178.23 40,912,480 7,188,339 12,166,718 Evergreen (Clark) 196,030,072 52,742,497 17,779,596 6,045,404 28,456,422 5,039,172 1,725,301.39 36,670,513 6,050,792 17,377,255 Puyallup 183,607,670 42,603,046 13,852,598 - 12,971,502 802,512 3,213,827.72 45,038,130 5,208,187 11,328,571 Northshore 203,953,026 64,397,834 9,127,267 - 10,100,444 3,921,445 2,931,021.47 34,599,316 5,475,021 11,267,719 Vancouver 188,414,671 46,292,458 12,977,624 - 24,661,187 1,359,909 874,677.53 48,129,361 7,389,371 10,379,033 Federal Way 170,109,860 50,918,590 12,472,651 - 33,414,741 2,068,217 5,518,104.81 40,053,691 7,315,236 12,409,651 Edmonds 182,937,158 51,931,017 9,422,295 - 15,677,332 10,598,723 2,947,363.40 33,739,942 4,380,571 15,319,333 Issaquah 184,048,892 37,191,639 10,829,717 - 10,730,944 2,466,126 10,345,374.92 35,879,454 4,917,558 10,849,418 Bellevue 199,105,945 51,167,815 9,361,801 - 13,149,948 2,319,850 15,196,534.82 40,959,710 6,023,889 10,882,583 Bethel 159,471,034 39,255,006 10,855,276 3,560,170 16,221,092 1,151,940 5,040,594.21 37,959,161 5,771,800 15,059,060 Everett 182,878,860 48,423,094 15,395,676 - 18,349,061 2,385,893 4,657,831.96 33,871,951 5,690,161 12,719,845
15 3,275,084,082 920,812,139 191,690,303 18,430,906 385,495,874 85,184,376 81,991,869.52 704,894,839 107,603,246 223,041,256 10,000–19,999Kennewick 142,703,412 30,012,151 8,168,927 4,267,267 21,257,405 856,039 5,191,576.04 28,133,680 6,579,405 8,552,040 Highline 162,103,226 48,377,191 6,764,094 4,274,575 34,184,426 2,522,798 4,626,003.59 37,323,994 6,572,893 7,944,674 Pasco 144,527,359 30,700,033 7,406,343 - 26,886,681 905,402 942,877.41 26,308,495 8,564,235 9,009,482 Auburn 144,161,806 34,451,424 7,908,064 - 20,540,129 2,234,473 5,577,724.98 32,778,585 5,701,505 9,994,877 Yakima 109,394,477 34,425,218 10,646,389 4,290,759 29,398,010 1,199,162 4,641,242.57 26,583,123 5,287,846 3,792,824 Mukilteo 146,449,519 38,951,934 5,949,917 4,781,463 19,588,641 2,185,151 1,089,436.56 27,784,925 5,129,016 9,220,183 Renton 135,113,725 44,424,619 10,595,242 - 21,265,918 1,644,202 2,088,225.00 29,734,698 5,963,787 11,137,757 North Thurston 121,817,843 36,567,354 7,964,196 - 9,877,444 660,776 1,540,523.88 28,252,489 4,669,824 8,024,889 Central Valley 108,903,560 31,238,521 4,431,577 639,457 9,465,558 492,725 4,775,713.43 20,874,218 4,693,804 5,827,087 Richland 112,655,912 21,689,952 4,415,177 - 7,797,897 1,373,404 2,322,382.87 22,992,239 3,158,454 4,457,892 Battle Ground 100,291,645 25,760,711 8,047,249 - 6,728,543 719,907 1,531,238.84 22,467,978 2,216,804 10,852,552 Clover Park 100,535,531 34,214,444 5,945,739 - 19,125,987 1,835,245 3,538,481.24 27,444,220 5,749,273 7,315,571 Central Kitsap 96,490,662 30,681,512 6,464,549 - 5,788,363 1,014,700 1,991,475.49 20,267,451 3,180,525 6,499,666 Bellingham 97,464,198 27,099,864 5,793,218 - 9,173,158 1,520,039 2,821,936.80 19,346,151 2,837,761 4,385,823 Mead 80,313,490 19,169,917 6,005,011 - 5,247,498 293,500 1,069,481.32 16,727,304 2,466,586 5,456,575 Marysville 91,943,259 26,112,550 5,742,755 - 10,746,387 2,948,437 2,386,664.68 22,177,896 5,380,862 8,660,520 Olympia 77,594,973 25,441,665 6,755,636 - 4,993,614 624,450 646,708.54 18,049,509 2,706,594 4,852,472 South Kitsap 81,171,255 24,148,000 7,635,130 - 5,744,546 1,607,275 2,497,786.12 20,560,703 1,672,285 7,234,668 Sumner 77,291,278 18,454,044 5,007,759 - 4,609,339 768,659 2,618,528.01 14,830,611 2,238,906 4,504,147
19 2,130,927,130 581,921,103 131,646,971 18,253,522 272,419,545 25,406,344 51,898,007.37 462,638,267 84,770,363 137,723,701 5,000–9,999Snohomish 87,302,003 21,967,944 4,585,184 - 3,174,427 543,626 3,530,027.85 18,414,610 1,607,841 5,999,676 Shoreline 96,871,744 24,813,990 3,715,824 - 6,657,694 340,640 4,756,543.95 15,668,401 2,435,566 4,421,085 Lake Stevens 74,018,522 20,081,044 4,741,121 - 3,668,487 973,774 1,978,384.28 16,261,179 2,108,917 7,244,623 Peninsula 79,687,428 21,862,907 4,754,630 - 3,464,657 266,668 1,273,328.84 17,914,129 1,879,291 6,076,668 Tahoma 71,459,062 17,908,314 3,959,617 - 2,650,920 1,332,690 1,593,522.87 15,407,313 1,680,814 4,454,202 Moses Lake 61,719,895 14,238,331 3,919,010 1,775,814 10,695,884 314,910 888,796.72 15,574,438 3,577,649 4,563,117 Franklin Pierce 60,504,236 20,007,354 4,596,455 - 12,618,744 600,502 795,131.14 18,725,938 4,396,999 5,337,599 Wenatchee 59,657,749 13,389,343 4,318,041 1,601,845 11,442,670 1,472,448 1,135,589.72 12,656,638 2,519,308 2,386,358 Camas 59,613,290 13,084,259 3,864,695 - 2,122,977 459,008 2,473,969.13 11,582,051 1,729,079 4,224,235
38
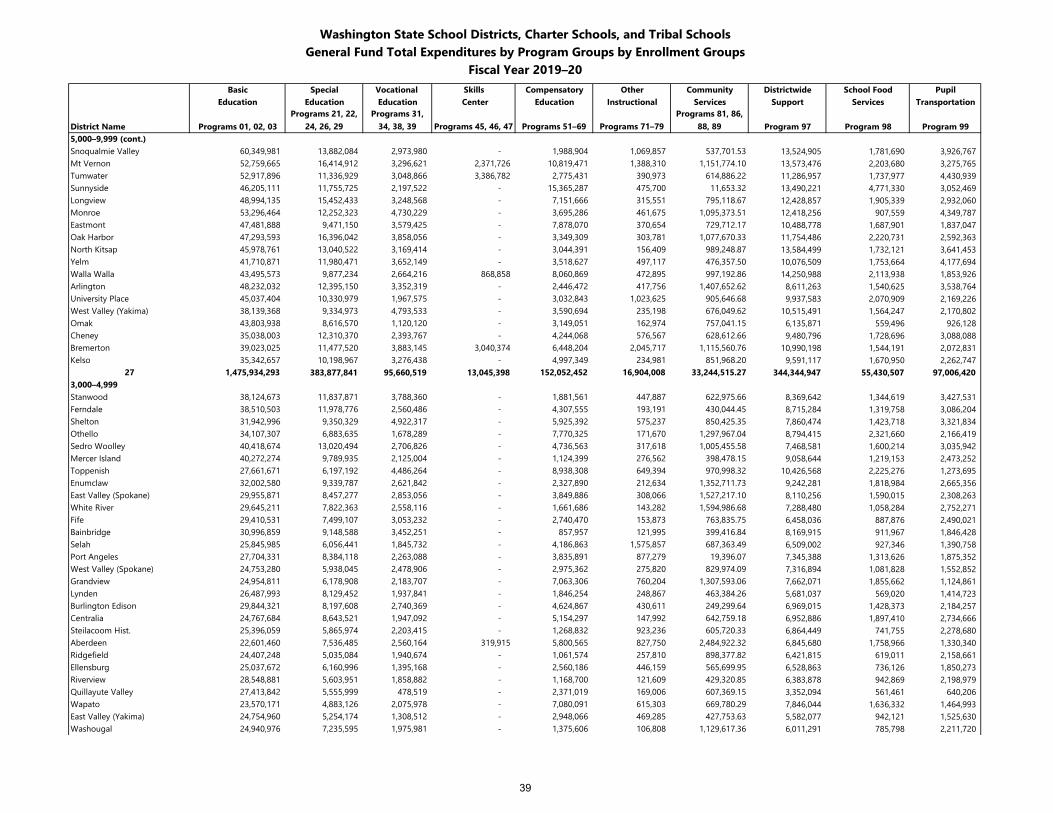
Washington State School Districts, Charter Schools, and Tribal SchoolsGeneral Fund Total Expenditures by Program Groups by Enrollment Groups
Fiscal Year 2019–20Basic Special Vocational Skills Compensatory Other Community Districtwide School Food Pupil
Education Education Education Center Education Instructional Services Support Services Transportation
District Name Programs 01, 02, 03Programs 21, 22,
24, 26, 29Programs 31,
34, 38, 39 Programs 45, 46, 47 Programs 51–69 Programs 71–79Programs 81, 86,
88, 89 Program 97 Program 98 Program 995,000–9,999 (cont.)Snoqualmie Valley 60,349,981 13,882,084 2,973,980 - 1,988,904 1,069,857 537,701.53 13,524,905 1,781,690 3,926,767 Mt Vernon 52,759,665 16,414,912 3,296,621 2,371,726 10,819,471 1,388,310 1,151,774.10 13,573,476 2,203,680 3,275,765 Tumwater 52,917,896 11,336,929 3,048,866 3,386,782 2,775,431 390,973 614,886.22 11,286,957 1,737,977 4,430,939 Sunnyside 46,205,111 11,755,725 2,197,522 - 15,365,287 475,700 11,653.32 13,490,221 4,771,330 3,052,469 Longview 48,994,135 15,452,433 3,248,568 - 7,151,666 315,551 795,118.67 12,428,857 1,905,339 2,932,060 Monroe 53,296,464 12,252,323 4,730,229 - 3,695,286 461,675 1,095,373.51 12,418,256 907,559 4,349,787 Eastmont 47,481,888 9,471,150 3,579,425 - 7,878,070 370,654 729,712.17 10,488,778 1,687,901 1,837,047 Oak Harbor 47,293,593 16,396,042 3,858,056 - 3,349,309 303,781 1,077,670.33 11,754,486 2,220,731 2,592,363 North Kitsap 45,978,761 13,040,522 3,169,414 - 3,044,391 156,409 989,248.87 13,584,499 1,732,121 3,641,453 Yelm 41,710,871 11,980,471 3,652,149 - 3,518,627 497,117 476,357.50 10,076,509 1,753,664 4,177,694 Walla Walla 43,495,573 9,877,234 2,664,216 868,858 8,060,869 472,895 997,192.86 14,250,988 2,113,938 1,853,926 Arlington 48,232,032 12,395,150 3,352,319 - 2,446,472 417,756 1,407,652.62 8,611,263 1,540,625 3,538,764 University Place 45,037,404 10,330,979 1,967,575 - 3,032,843 1,023,625 905,646.68 9,937,583 2,070,909 2,169,226 West Valley (Yakima) 38,139,368 9,334,973 4,793,533 - 3,590,694 235,198 676,049.62 10,515,491 1,564,247 2,170,802 Omak 43,803,938 8,616,570 1,120,120 - 3,149,051 162,974 757,041.15 6,135,871 559,496 926,128 Cheney 35,038,003 12,310,370 2,393,767 - 4,244,068 576,567 628,612.66 9,480,796 1,728,696 3,088,088 Bremerton 39,023,025 11,477,520 3,883,145 3,040,374 6,448,204 2,045,717 1,115,560.76 10,990,198 1,544,191 2,072,831 Kelso 35,342,657 10,198,967 3,276,438 - 4,997,349 234,981 851,968.20 9,591,117 1,670,950 2,262,747
27 1,475,934,293 383,877,841 95,660,519 13,045,398 152,052,452 16,904,008 33,244,515.27 344,344,947 55,430,507 97,006,420 3,000–4,999Stanwood 38,124,673 11,837,871 3,788,360 - 1,881,561 447,887 622,975.66 8,369,642 1,344,619 3,427,531 Ferndale 38,510,503 11,978,776 2,560,486 - 4,307,555 193,191 430,044.45 8,715,284 1,319,758 3,086,204 Shelton 31,942,996 9,350,329 4,922,317 - 5,925,392 575,237 850,425.35 7,860,474 1,423,718 3,321,834 Othello 34,107,307 6,883,635 1,678,289 - 7,770,325 171,670 1,297,967.04 8,794,415 2,321,660 2,166,419 Sedro Woolley 40,418,674 13,020,494 2,706,826 - 4,736,563 317,618 1,005,455.58 7,468,581 1,600,214 3,035,942 Mercer Island 40,272,274 9,789,935 2,125,004 - 1,124,399 276,562 398,478.15 9,058,644 1,219,153 2,473,252 Toppenish 27,661,671 6,197,192 4,486,264 - 8,938,308 649,394 970,998.32 10,426,568 2,225,276 1,273,695 Enumclaw 32,002,580 9,339,787 2,621,842 - 2,327,890 212,634 1,352,711.73 9,242,281 1,818,984 2,665,356 East Valley (Spokane) 29,955,871 8,457,277 2,853,056 - 3,849,886 308,066 1,527,217.10 8,110,256 1,590,015 2,308,263 White River 29,645,211 7,822,363 2,558,116 - 1,661,686 143,282 1,594,986.68 7,288,480 1,058,284 2,752,271 Fife 29,410,531 7,499,107 3,053,232 - 2,740,470 153,873 763,835.75 6,458,036 887,876 2,490,021 Bainbridge 30,996,859 9,148,588 3,452,251 - 857,957 121,995 399,416.84 8,169,915 911,967 1,846,428 Selah 25,845,985 6,056,441 1,845,732 - 4,186,863 1,575,857 687,363.49 6,509,002 927,346 1,390,758 Port Angeles 27,704,331 8,384,118 2,263,088 - 3,835,891 877,279 19,396.07 7,345,388 1,313,626 1,875,352 West Valley (Spokane) 24,753,280 5,938,045 2,478,906 - 2,975,362 275,820 829,974.09 7,316,894 1,081,828 1,552,852 Grandview 24,954,811 6,178,908 2,183,707 - 7,063,306 760,204 1,307,593.06 7,662,071 1,855,662 1,124,861 Lynden 26,487,993 8,129,452 1,937,841 - 1,846,254 248,867 463,384.26 5,681,037 569,020 1,414,723 Burlington Edison 29,844,321 8,197,608 2,740,369 - 4,624,867 430,611 249,299.64 6,969,015 1,428,373 2,184,257 Centralia 24,767,684 8,643,521 1,947,092 - 5,154,297 147,992 642,759.18 6,952,886 1,897,410 2,734,666 Steilacoom Hist. 25,396,059 5,865,974 2,203,415 - 1,268,832 923,236 605,720.33 6,864,449 741,755 2,278,680 Aberdeen 22,601,460 7,536,485 2,560,164 319,915 5,800,565 827,750 2,484,922.32 6,845,680 1,758,966 1,330,340 Ridgefield 24,407,248 5,035,084 1,940,674 - 1,061,574 257,810 898,377.82 6,421,815 619,011 2,158,661 Ellensburg 25,037,672 6,160,996 1,395,168 - 2,560,186 446,159 565,699.95 6,528,863 736,126 1,850,273 Riverview 28,548,881 5,603,951 1,858,882 - 1,168,700 121,609 429,320.85 6,383,878 942,869 2,198,979 Quillayute Valley 27,413,842 5,555,999 478,519 - 2,371,019 169,006 607,369.15 3,352,094 561,461 640,206 Wapato 23,570,171 4,883,126 2,075,978 - 7,080,091 615,303 669,780.29 7,846,044 1,636,332 1,464,993 East Valley (Yakima) 24,754,960 5,254,174 1,308,512 - 2,948,066 469,285 427,753.63 5,582,077 942,121 1,525,630 Washougal 24,940,976 7,235,595 1,975,981 - 1,375,606 106,808 1,129,617.36 6,011,291 785,798 2,211,720
39
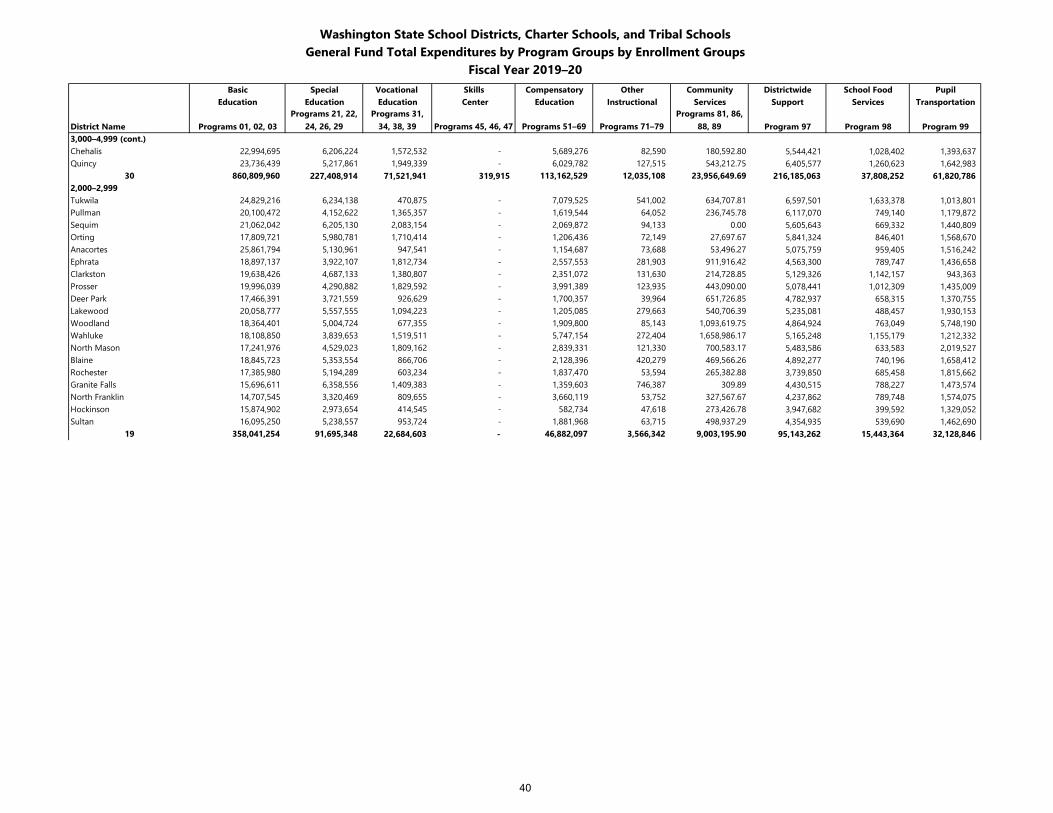
Washington State School Districts, Charter Schools, and Tribal SchoolsGeneral Fund Total Expenditures by Program Groups by Enrollment Groups
Fiscal Year 2019–20Basic Special Vocational Skills Compensatory Other Community Districtwide School Food Pupil
Education Education Education Center Education Instructional Services Support Services Transportation
District Name Programs 01, 02, 03Programs 21, 22,
24, 26, 29Programs 31,
34, 38, 39 Programs 45, 46, 47 Programs 51–69 Programs 71–79Programs 81, 86,
88, 89 Program 97 Program 98 Program 993,000–4,999 (cont.)Chehalis 22,994,695 6,206,224 1,572,532 - 5,689,276 82,590 180,592.80 5,544,421 1,028,402 1,393,637 Quincy 23,736,439 5,217,861 1,949,339 - 6,029,782 127,515 543,212.75 6,405,577 1,260,623 1,642,983
30 860,809,960 227,408,914 71,521,941 319,915 113,162,529 12,035,108 23,956,649.69 216,185,063 37,808,252 61,820,786 2,000–2,999Tukwila 24,829,216 6,234,138 470,875 - 7,079,525 541,002 634,707.81 6,597,501 1,633,378 1,013,801 Pullman 20,100,472 4,152,622 1,365,357 - 1,619,544 64,052 236,745.78 6,117,070 749,140 1,179,872 Sequim 21,062,042 6,205,130 2,083,154 - 2,069,872 94,133 0.00 5,605,643 669,332 1,440,809 Orting 17,809,721 5,980,781 1,710,414 - 1,206,436 72,149 27,697.67 5,841,324 846,401 1,568,670 Anacortes 25,861,794 5,130,961 947,541 - 1,154,687 73,688 53,496.27 5,075,759 959,405 1,516,242 Ephrata 18,897,137 3,922,107 1,812,734 - 2,557,553 281,903 911,916.42 4,563,300 789,747 1,436,658 Clarkston 19,638,426 4,687,133 1,380,807 - 2,351,072 131,630 214,728.85 5,129,326 1,142,157 943,363 Prosser 19,996,039 4,290,882 1,829,592 - 3,991,389 123,935 443,090.00 5,078,441 1,012,309 1,435,009 Deer Park 17,466,391 3,721,559 926,629 - 1,700,357 39,964 651,726.85 4,782,937 658,315 1,370,755 Lakewood 20,058,777 5,557,555 1,094,223 - 1,205,085 279,663 540,706.39 5,235,081 488,457 1,930,153 Woodland 18,364,401 5,004,724 677,355 - 1,909,800 85,143 1,093,619.75 4,864,924 763,049 5,748,190 Wahluke 18,108,850 3,839,653 1,519,511 - 5,747,154 272,404 1,658,986.17 5,165,248 1,155,179 1,212,332 North Mason 17,241,976 4,529,023 1,809,162 - 2,839,331 121,330 700,583.17 5,483,586 633,583 2,019,527 Blaine 18,845,723 5,353,554 866,706 - 2,128,396 420,279 469,566.26 4,892,277 740,196 1,658,412 Rochester 17,385,980 5,194,289 603,234 - 1,837,470 53,594 265,382.88 3,739,850 685,458 1,815,662 Granite Falls 15,696,611 6,358,556 1,409,383 - 1,359,603 746,387 309.89 4,430,515 788,227 1,473,574 North Franklin 14,707,545 3,320,469 809,655 - 3,660,119 53,752 327,567.67 4,237,862 789,748 1,574,075 Hockinson 15,874,902 2,973,654 414,545 - 582,734 47,618 273,426.78 3,947,682 399,592 1,329,052 Sultan 16,095,250 5,238,557 953,724 - 1,881,968 63,715 498,937.29 4,354,935 539,690 1,462,690
19 358,041,254 91,695,348 22,684,603 - 46,882,097 3,566,342 9,003,195.90 95,143,262 15,443,364 32,128,846
40
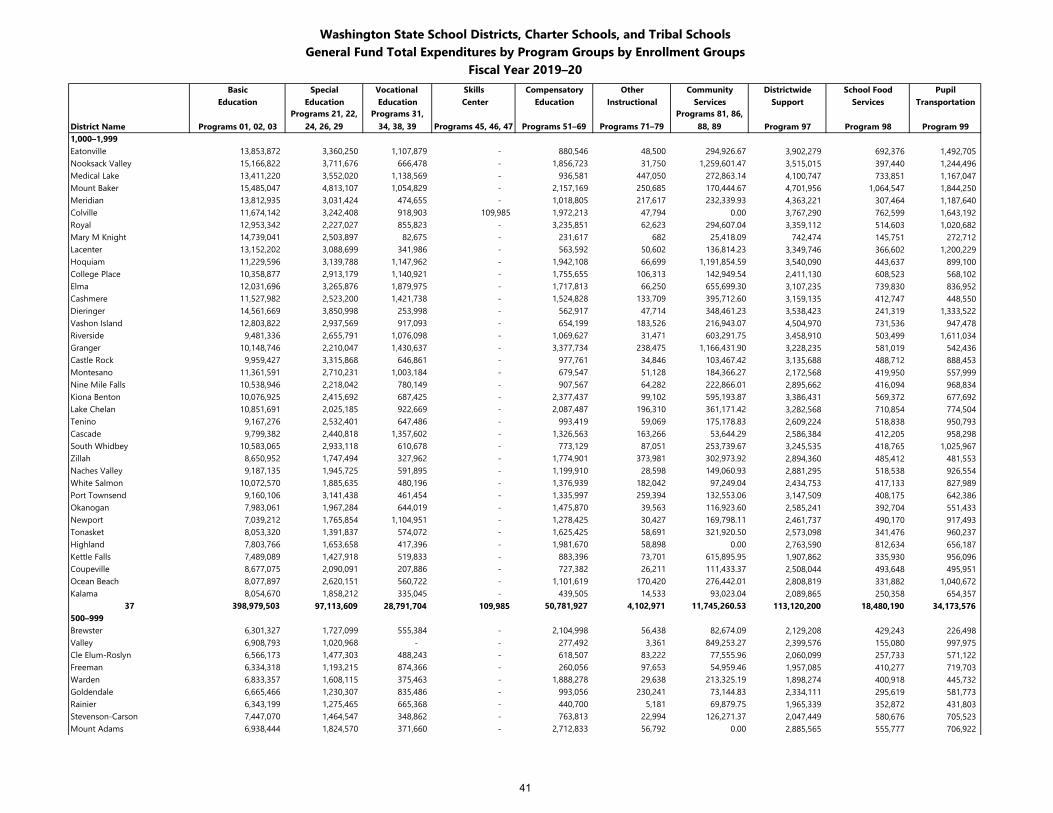
Washington State School Districts, Charter Schools, and Tribal SchoolsGeneral Fund Total Expenditures by Program Groups by Enrollment Groups
Fiscal Year 2019–20Basic Special Vocational Skills Compensatory Other Community Districtwide School Food Pupil
Education Education Education Center Education Instructional Services Support Services Transportation
District Name Programs 01, 02, 03Programs 21, 22,
24, 26, 29Programs 31,
34, 38, 39 Programs 45, 46, 47 Programs 51–69 Programs 71–79Programs 81, 86,
88, 89 Program 97 Program 98 Program 991,000–1,999Eatonville 13,853,872 3,360,250 1,107,879 - 880,546 48,500 294,926.67 3,902,279 692,376 1,492,705 Nooksack Valley 15,166,822 3,711,676 666,478 - 1,856,723 31,750 1,259,601.47 3,515,015 397,440 1,244,496 Medical Lake 13,411,220 3,552,020 1,138,569 - 936,581 447,050 272,863.14 4,100,747 733,851 1,167,047 Mount Baker 15,485,047 4,813,107 1,054,829 - 2,157,169 250,685 170,444.67 4,701,956 1,064,547 1,844,250 Meridian 13,812,935 3,031,424 474,655 - 1,018,805 217,617 232,339.93 4,363,221 307,464 1,187,640 Colville 11,674,142 3,242,408 918,903 109,985 1,972,213 47,794 0.00 3,767,290 762,599 1,643,192 Royal 12,953,342 2,227,027 855,823 - 3,235,851 62,623 294,607.04 3,359,112 514,603 1,020,682 Mary M Knight 14,739,041 2,503,897 82,675 - 231,617 682 25,418.09 742,474 145,751 272,712 Lacenter 13,152,202 3,088,699 341,986 - 563,592 50,602 136,814.23 3,349,746 366,602 1,200,229 Hoquiam 11,229,596 3,139,788 1,147,962 - 1,942,108 66,699 1,191,854.59 3,540,090 443,637 899,100 College Place 10,358,877 2,913,179 1,140,921 - 1,755,655 106,313 142,949.54 2,411,130 608,523 568,102 Elma 12,031,696 3,265,876 1,879,975 - 1,717,813 66,250 655,699.30 3,107,235 739,830 836,952 Cashmere 11,527,982 2,523,200 1,421,738 - 1,524,828 133,709 395,712.60 3,159,135 412,747 448,550 Dieringer 14,561,669 3,850,998 253,998 - 562,917 47,714 348,461.23 3,538,423 241,319 1,333,522 Vashon Island 12,803,822 2,937,569 917,093 - 654,199 183,526 216,943.07 4,504,970 731,536 947,478 Riverside 9,481,336 2,655,791 1,076,098 - 1,069,627 31,471 603,291.75 3,458,910 503,499 1,611,034 Granger 10,148,746 2,210,047 1,430,637 - 3,377,734 238,475 1,166,431.90 3,228,235 581,019 542,436 Castle Rock 9,959,427 3,315,868 646,861 - 977,761 34,846 103,467.42 3,135,688 488,712 888,453 Montesano 11,361,591 2,710,231 1,003,184 - 679,547 51,128 184,366.27 2,172,568 419,950 557,999 Nine Mile Falls 10,538,946 2,218,042 780,149 - 907,567 64,282 222,866.01 2,895,662 416,094 968,834 Kiona Benton 10,076,925 2,415,692 687,425 - 2,377,437 99,102 595,193.87 3,386,431 569,372 677,692 Lake Chelan 10,851,691 2,025,185 922,669 - 2,087,487 196,310 361,171.42 3,282,568 710,854 774,504 Tenino 9,167,276 2,532,401 647,486 - 993,419 59,069 175,178.83 2,609,224 518,838 950,793 Cascade 9,799,382 2,440,818 1,357,602 - 1,326,563 163,266 53,644.29 2,586,384 412,205 958,298 South Whidbey 10,583,065 2,933,118 610,678 - 773,129 87,051 253,739.67 3,245,535 418,765 1,025,967 Zillah 8,650,952 1,747,494 327,962 - 1,774,901 373,981 302,973.92 2,894,360 485,412 481,553 Naches Valley 9,187,135 1,945,725 591,895 - 1,199,910 28,598 149,060.93 2,881,295 518,538 926,554 White Salmon 10,072,570 1,885,635 480,196 - 1,376,939 182,042 97,249.04 2,434,753 417,133 827,989 Port Townsend 9,160,106 3,141,438 461,454 - 1,335,997 259,394 132,553.06 3,147,509 408,175 642,386 Okanogan 7,983,061 1,967,284 644,019 - 1,475,870 39,563 116,923.60 2,585,241 392,704 551,433 Newport 7,039,212 1,765,854 1,104,951 - 1,278,425 30,427 169,798.11 2,461,737 490,170 917,493 Tonasket 8,053,320 1,391,837 574,072 - 1,625,425 58,691 321,920.50 2,573,098 341,476 960,237 Highland 7,803,766 1,653,658 417,396 - 1,981,670 58,898 0.00 2,763,590 812,634 656,187 Kettle Falls 7,489,089 1,427,918 519,833 - 883,396 73,701 615,895.95 1,907,862 335,930 956,096 Coupeville 8,677,075 2,090,091 207,886 - 727,382 26,211 111,433.37 2,508,044 493,648 495,951 Ocean Beach 8,077,897 2,620,151 560,722 - 1,101,619 170,420 276,442.01 2,808,819 331,882 1,040,672 Kalama 8,054,670 1,858,212 335,045 - 439,505 14,533 93,023.04 2,089,865 250,358 654,357
37 398,979,503 97,113,609 28,791,704 109,985 50,781,927 4,102,971 11,745,260.53 113,120,200 18,480,190 34,173,576 500–999Brewster 6,301,327 1,727,099 555,384 - 2,104,998 56,438 82,674.09 2,129,208 429,243 226,498 Valley 6,908,793 1,020,968 - - 277,492 3,361 849,253.27 2,399,576 155,080 997,975 Cle Elum-Roslyn 6,566,173 1,477,303 488,243 - 618,507 83,222 77,555.96 2,060,099 257,733 571,122 Freeman 6,334,318 1,193,215 874,366 - 260,056 97,653 54,959.46 1,957,085 410,277 719,703 Warden 6,833,357 1,608,115 375,463 - 1,888,278 29,638 213,325.19 1,898,274 400,918 445,732 Goldendale 6,665,466 1,230,307 835,486 - 993,056 230,241 73,144.83 2,334,111 295,619 581,773 Rainier 6,343,199 1,275,465 665,368 - 440,700 5,181 69,879.75 1,965,339 352,872 431,803 Stevenson-Carson 7,447,070 1,464,547 348,862 - 763,813 22,994 126,271.37 2,047,449 580,676 705,523 Mount Adams 6,938,444 1,824,570 371,660 - 2,712,833 56,792 0.00 2,885,565 555,777 706,922
41
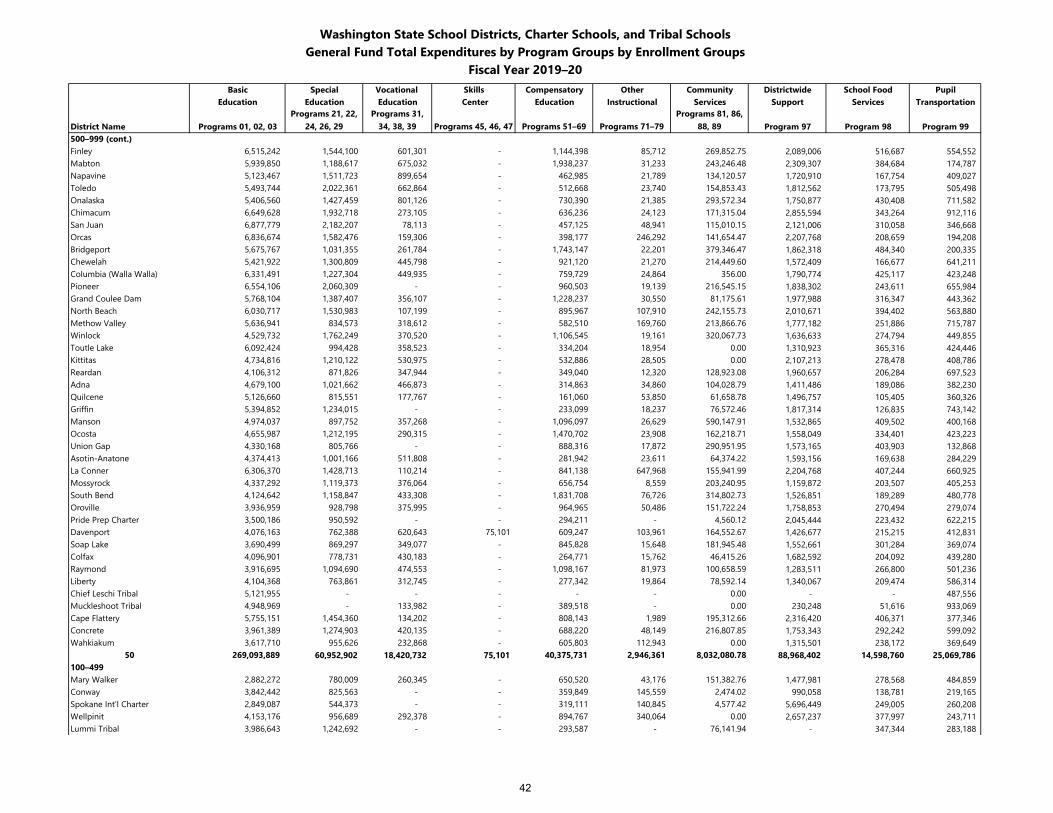
Washington State School Districts, Charter Schools, and Tribal SchoolsGeneral Fund Total Expenditures by Program Groups by Enrollment Groups
Fiscal Year 2019–20Basic Special Vocational Skills Compensatory Other Community Districtwide School Food Pupil
Education Education Education Center Education Instructional Services Support Services Transportation
District Name Programs 01, 02, 03Programs 21, 22,
24, 26, 29Programs 31,
34, 38, 39 Programs 45, 46, 47 Programs 51–69 Programs 71–79Programs 81, 86,
88, 89 Program 97 Program 98 Program 99500–999 (cont.)Finley 6,515,242 1,544,100 601,301 - 1,144,398 85,712 269,852.75 2,089,006 516,687 554,552 Mabton 5,939,850 1,188,617 675,032 - 1,938,237 31,233 243,246.48 2,309,307 384,684 174,787 Napavine 5,123,467 1,511,723 899,654 - 462,985 21,789 134,120.57 1,720,910 167,754 409,027 Toledo 5,493,744 2,022,361 662,864 - 512,668 23,740 154,853.43 1,812,562 173,795 505,498 Onalaska 5,406,560 1,427,459 801,126 - 730,390 21,385 293,572.34 1,750,877 430,408 711,582 Chimacum 6,649,628 1,932,718 273,105 - 636,236 24,123 171,315.04 2,855,594 343,264 912,116 San Juan 6,877,779 2,182,207 78,113 - 457,125 48,941 115,010.15 2,121,006 310,058 346,668 Orcas 6,836,674 1,582,476 159,306 - 398,177 246,292 141,654.47 2,207,768 208,659 194,208 Bridgeport 5,675,767 1,031,355 261,784 - 1,743,147 22,201 379,346.47 1,862,318 484,340 200,335 Chewelah 5,421,922 1,300,809 445,798 - 921,120 21,270 214,449.60 1,572,409 166,677 641,211 Columbia (Walla Walla) 6,331,491 1,227,304 449,935 - 759,729 24,864 356.00 1,790,774 425,117 423,248 Pioneer 6,554,106 2,060,309 - - 960,503 19,139 216,545.15 1,838,302 243,611 655,984 Grand Coulee Dam 5,768,104 1,387,407 356,107 - 1,228,237 30,550 81,175.61 1,977,988 316,347 443,362 North Beach 6,030,717 1,530,983 107,199 - 895,967 107,910 242,155.73 2,010,671 394,402 563,880 Methow Valley 5,636,941 834,573 318,612 - 582,510 169,760 213,866.76 1,777,182 251,886 715,787 Winlock 4,529,732 1,762,249 370,520 - 1,106,545 19,161 320,067.73 1,636,633 274,794 449,855 Toutle Lake 6,092,424 994,428 358,523 - 334,204 18,954 0.00 1,310,923 365,316 424,446 Kittitas 4,734,816 1,210,122 530,975 - 532,886 28,505 0.00 2,107,213 278,478 408,786 Reardan 4,106,312 871,826 347,944 - 349,040 12,320 128,923.08 1,960,657 206,284 697,523 Adna 4,679,100 1,021,662 466,873 - 314,863 34,860 104,028.79 1,411,486 189,086 382,230 Quilcene 5,126,660 815,551 177,767 - 161,060 53,850 61,658.78 1,496,757 105,405 360,326 Griffin 5,394,852 1,234,015 - - 233,099 18,237 76,572.46 1,817,314 126,835 743,142 Manson 4,974,037 897,752 357,268 - 1,096,097 26,629 590,147.91 1,532,865 409,502 400,168 Ocosta 4,655,987 1,212,195 290,315 - 1,470,702 23,908 162,218.71 1,558,049 334,401 423,223 Union Gap 4,330,168 805,766 - - 888,316 17,872 290,951.95 1,573,165 403,903 132,868 Asotin-Anatone 4,374,413 1,001,166 511,808 - 281,942 23,611 64,374.22 1,593,156 169,638 284,229 La Conner 6,306,370 1,428,713 110,214 - 841,138 647,968 155,941.99 2,204,768 407,244 660,925 Mossyrock 4,337,292 1,119,373 376,064 - 656,754 8,559 203,240.95 1,159,872 203,507 405,253 South Bend 4,124,642 1,158,847 433,308 - 1,831,708 76,726 314,802.73 1,526,851 189,289 480,778 Oroville 3,936,959 928,798 375,995 - 964,965 50,486 151,722.24 1,758,853 270,494 279,074 Pride Prep Charter 3,500,186 950,592 - - 294,211 - 4,560.12 2,045,444 223,432 622,215 Davenport 4,076,163 762,388 620,643 75,101 609,247 103,961 164,552.67 1,426,677 215,215 412,831 Soap Lake 3,690,499 869,297 349,077 - 845,828 15,648 181,945.48 1,552,661 301,284 369,074 Colfax 4,096,901 778,731 430,183 - 264,771 15,762 46,415.26 1,682,592 204,092 439,280 Raymond 3,916,695 1,094,690 474,553 - 1,098,167 81,973 100,658.59 1,283,511 266,800 501,236 Liberty 4,104,368 763,861 312,745 - 277,342 19,864 78,592.14 1,340,067 209,474 586,314 Chief Leschi Tribal 5,121,955 - - - - - 0.00 - - 487,556 Muckleshoot Tribal 4,948,969 - 133,982 - 389,518 - 0.00 230,248 51,616 933,069 Cape Flattery 5,755,151 1,454,360 134,202 - 808,143 1,989 195,312.66 2,316,420 406,371 377,346 Concrete 3,961,389 1,274,903 420,135 - 688,220 48,149 216,807.85 1,753,343 292,242 599,092 Wahkiakum 3,617,710 955,626 232,868 - 605,803 112,943 0.00 1,315,501 238,172 369,649
50 269,093,889 60,952,902 18,420,732 75,101 40,375,731 2,946,361 8,032,080.78 88,968,402 14,598,760 25,069,786 100–499Mary Walker 2,882,272 780,009 260,345 - 650,520 43,176 151,382.76 1,477,981 278,568 484,859 Conway 3,842,442 825,563 - - 359,849 145,559 2,474.02 990,058 138,781 219,165 Spokane Int'l Charter 2,849,087 544,373 - - 319,111 140,845 4,577.42 5,696,449 249,005 260,208 Wellpinit 4,153,176 956,689 292,378 - 894,767 340,064 0.00 2,657,237 377,997 243,711 Lummi Tribal 3,986,643 1,242,692 - - 293,587 - 76,141.94 - 347,344 283,188
42
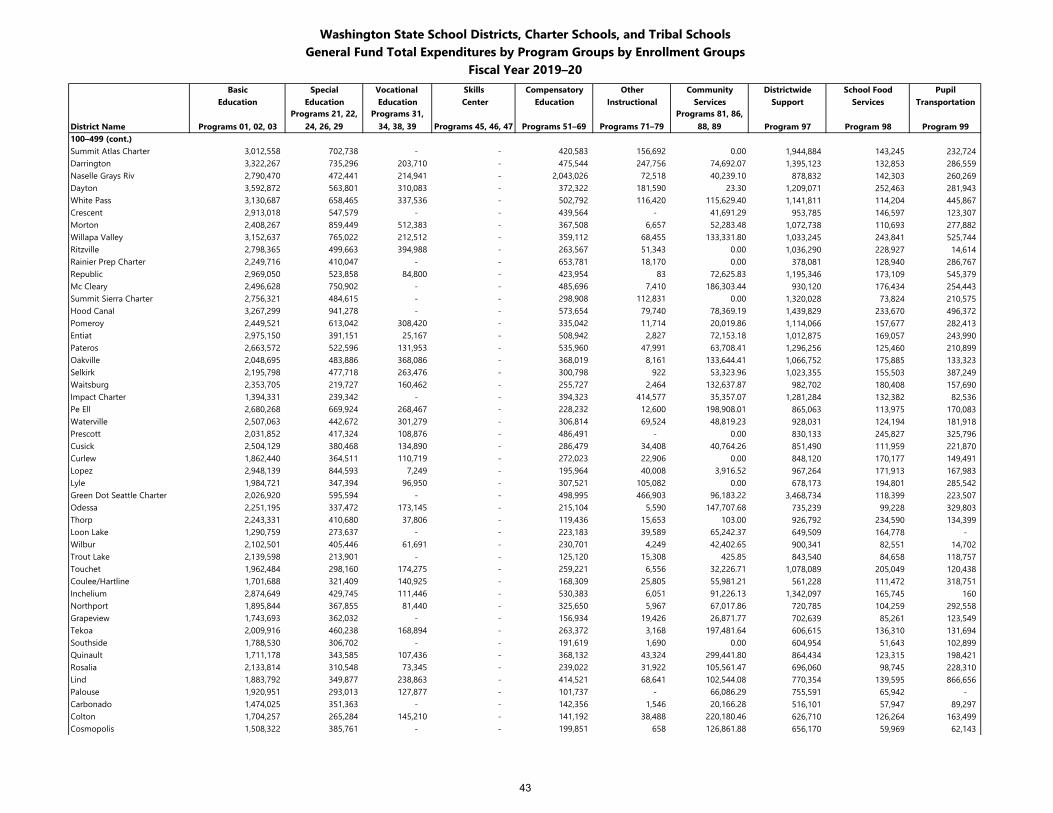
Washington State School Districts, Charter Schools, and Tribal SchoolsGeneral Fund Total Expenditures by Program Groups by Enrollment Groups
Fiscal Year 2019–20Basic Special Vocational Skills Compensatory Other Community Districtwide School Food Pupil
Education Education Education Center Education Instructional Services Support Services Transportation
District Name Programs 01, 02, 03Programs 21, 22,
24, 26, 29Programs 31,
34, 38, 39 Programs 45, 46, 47 Programs 51–69 Programs 71–79Programs 81, 86,
88, 89 Program 97 Program 98 Program 99100–499 (cont.)Summit Atlas Charter 3,012,558 702,738 - - 420,583 156,692 0.00 1,944,884 143,245 232,724 Darrington 3,322,267 735,296 203,710 - 475,544 247,756 74,692.07 1,395,123 132,853 286,559 Naselle Grays Riv 2,790,470 472,441 214,941 - 2,043,026 72,518 40,239.10 878,832 142,303 260,269 Dayton 3,592,872 563,801 310,083 - 372,322 181,590 23.30 1,209,071 252,463 281,943 White Pass 3,130,687 658,465 337,536 - 502,792 116,420 115,629.40 1,141,811 114,204 445,867 Crescent 2,913,018 547,579 - - 439,564 - 41,691.29 953,785 146,597 123,307 Morton 2,408,267 859,449 512,383 - 367,508 6,657 52,283.48 1,072,738 110,693 277,882 Willapa Valley 3,152,637 765,022 212,512 - 359,112 68,455 133,331.80 1,033,245 243,841 525,744 Ritzville 2,798,365 499,663 394,988 - 263,567 51,343 0.00 1,036,290 228,927 14,614 Rainier Prep Charter 2,249,716 410,047 - - 653,781 18,170 0.00 378,081 128,940 286,767 Republic 2,969,050 523,858 84,800 - 423,954 83 72,625.83 1,195,346 173,109 545,379 Mc Cleary 2,496,628 750,902 - - 485,696 7,410 186,303.44 930,120 176,434 254,443 Summit Sierra Charter 2,756,321 484,615 - - 298,908 112,831 0.00 1,320,028 73,824 210,575 Hood Canal 3,267,299 941,278 - - 573,654 79,740 78,369.19 1,439,829 233,670 496,372 Pomeroy 2,449,521 613,042 308,420 - 335,042 11,714 20,019.86 1,114,066 157,677 282,413 Entiat 2,975,150 391,151 25,167 - 508,942 2,827 72,153.18 1,012,875 169,057 243,990 Pateros 2,663,572 522,596 131,953 - 535,960 47,991 63,708.41 1,296,256 125,460 210,899 Oakville 2,048,695 483,886 368,086 - 368,019 8,161 133,644.41 1,066,752 175,885 133,323 Selkirk 2,195,798 477,718 263,476 - 300,798 922 53,323.96 1,023,355 155,503 387,249 Waitsburg 2,353,705 219,727 160,462 - 255,727 2,464 132,637.87 982,702 180,408 157,690 Impact Charter 1,394,331 239,342 - - 394,323 414,577 35,357.07 1,281,284 132,382 82,536 Pe Ell 2,680,268 669,924 268,467 - 228,232 12,600 198,908.01 865,063 113,975 170,083 Waterville 2,507,063 442,672 301,279 - 306,814 69,524 48,819.23 928,031 124,194 181,918 Prescott 2,031,852 417,324 108,876 - 486,491 - 0.00 830,133 245,827 325,796 Cusick 2,504,129 380,468 134,890 - 286,479 34,408 40,764.26 851,490 111,959 221,870 Curlew 1,862,440 364,511 110,719 - 272,023 22,906 0.00 848,120 170,177 149,491 Lopez 2,948,139 844,593 7,249 - 195,964 40,008 3,916.52 967,264 171,913 167,983 Lyle 1,984,721 347,394 96,950 - 307,521 105,082 0.00 678,173 194,801 285,542 Green Dot Seattle Charter 2,026,920 595,594 - - 498,995 466,903 96,183.22 3,468,734 118,399 223,507 Odessa 2,251,195 337,472 173,145 - 215,104 5,590 147,707.68 735,239 99,228 329,803 Thorp 2,243,331 410,680 37,806 - 119,436 15,653 103.00 926,792 234,590 134,399 Loon Lake 1,290,759 273,637 - - 223,183 39,589 65,242.37 649,509 164,778 - Wilbur 2,102,501 405,446 61,691 - 230,701 4,249 42,402.65 900,341 82,551 14,702 Trout Lake 2,139,598 213,901 - - 125,120 15,308 425.85 843,540 84,658 118,757 Touchet 1,962,484 298,160 174,275 - 259,221 6,556 32,226.71 1,078,089 205,049 120,438 Coulee/Hartline 1,701,688 321,409 140,925 - 168,309 25,805 55,981.21 561,228 111,472 318,751 Inchelium 2,874,649 429,745 111,446 - 530,383 6,051 91,226.13 1,342,097 165,745 160 Northport 1,895,844 367,855 81,440 - 325,650 5,967 67,017.86 720,785 104,259 292,558 Grapeview 1,743,693 362,032 - - 156,934 19,426 26,871.77 702,639 85,261 123,549 Tekoa 2,009,916 460,238 168,894 - 263,372 3,168 197,481.64 606,615 136,310 131,694 Southside 1,788,530 306,702 - - 191,619 1,690 0.00 604,954 51,643 102,899 Quinault 1,711,178 343,585 107,436 - 368,132 43,324 299,441.80 864,434 123,315 198,421 Rosalia 2,133,814 310,548 73,345 - 239,022 31,922 105,561.47 696,060 98,745 228,310 Lind 1,883,792 349,877 238,863 - 414,521 68,641 102,544.08 770,354 139,595 866,656 Palouse 1,920,951 293,013 127,877 - 101,737 - 66,086.29 755,591 65,942 - Carbonado 1,474,025 351,363 - - 142,356 1,546 20,166.28 516,101 57,947 89,297 Colton 1,704,257 265,284 145,210 - 141,192 38,488 220,180.46 626,710 126,264 163,499 Cosmopolis 1,508,322 385,761 - - 199,851 658 126,861.88 656,170 59,969 62,143
43
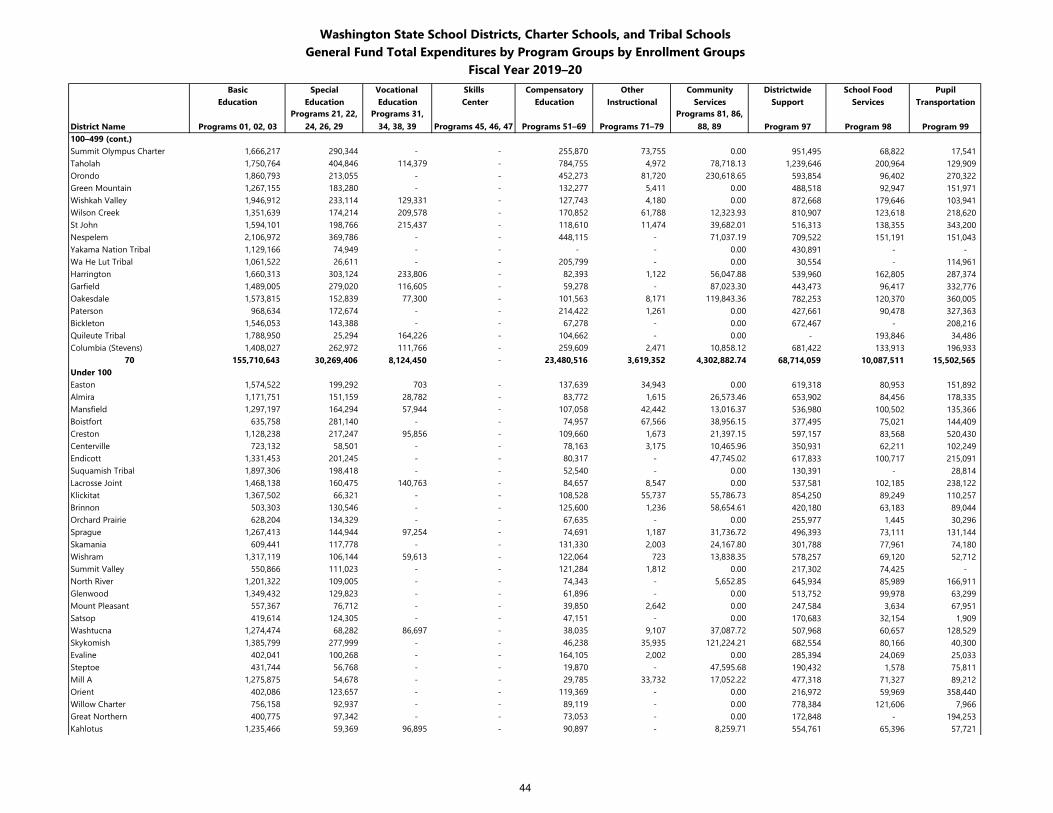
Washington State School Districts, Charter Schools, and Tribal SchoolsGeneral Fund Total Expenditures by Program Groups by Enrollment Groups
Fiscal Year 2019–20Basic Special Vocational Skills Compensatory Other Community Districtwide School Food Pupil
Education Education Education Center Education Instructional Services Support Services Transportation
District Name Programs 01, 02, 03Programs 21, 22,
24, 26, 29Programs 31,
34, 38, 39 Programs 45, 46, 47 Programs 51–69 Programs 71–79Programs 81, 86,
88, 89 Program 97 Program 98 Program 99100–499 (cont.)Summit Olympus Charter 1,666,217 290,344 - - 255,870 73,755 0.00 951,495 68,822 17,541 Taholah 1,750,764 404,846 114,379 - 784,755 4,972 78,718.13 1,239,646 200,964 129,909 Orondo 1,860,793 213,055 - - 452,273 81,720 230,618.65 593,854 96,402 270,322 Green Mountain 1,267,155 183,280 - - 132,277 5,411 0.00 488,518 92,947 151,971 Wishkah Valley 1,946,912 233,114 129,331 - 127,743 4,180 0.00 872,668 179,646 103,941 Wilson Creek 1,351,639 174,214 209,578 - 170,852 61,788 12,323.93 810,907 123,618 218,620 St John 1,594,101 198,766 215,437 - 118,610 11,474 39,682.01 516,313 138,355 343,200 Nespelem 2,106,972 369,786 - - 448,115 - 71,037.19 709,522 151,191 151,043 Yakama Nation Tribal 1,129,166 74,949 - - - - 0.00 430,891 - - Wa He Lut Tribal 1,061,522 26,611 - - 205,799 - 0.00 30,554 - 114,961 Harrington 1,660,313 303,124 233,806 - 82,393 1,122 56,047.88 539,960 162,805 287,374 Garfield 1,489,005 279,020 116,605 - 59,278 - 87,023.30 443,473 96,417 332,776 Oakesdale 1,573,815 152,839 77,300 - 101,563 8,171 119,843.36 782,253 120,370 360,005 Paterson 968,634 172,674 - - 214,422 1,261 0.00 427,661 90,478 327,363 Bickleton 1,546,053 143,388 - - 67,278 - 0.00 672,467 - 208,216 Quileute Tribal 1,788,950 25,294 164,226 - 104,662 - 0.00 - 193,846 34,486 Columbia (Stevens) 1,408,027 262,972 111,766 - 259,609 2,471 10,858.12 681,422 133,913 196,933
70 155,710,643 30,269,406 8,124,450 - 23,480,516 3,619,352 4,302,882.74 68,714,059 10,087,511 15,502,565 Under 100Easton 1,574,522 199,292 703 - 137,639 34,943 0.00 619,318 80,953 151,892 Almira 1,171,751 151,159 28,782 - 83,772 1,615 26,573.46 653,902 84,456 178,335 Mansfield 1,297,197 164,294 57,944 - 107,058 42,442 13,016.37 536,980 100,502 135,366 Boistfort 635,758 281,140 - - 74,957 67,566 38,956.15 377,495 75,021 144,409 Creston 1,128,238 217,247 95,856 - 109,660 1,673 21,397.15 597,157 83,568 520,430 Centerville 723,132 58,501 - - 78,163 3,175 10,465.96 350,931 62,211 102,249 Endicott 1,331,453 201,245 - - 80,317 - 47,745.02 617,833 100,717 215,091 Suquamish Tribal 1,897,306 198,418 - - 52,540 - 0.00 130,391 - 28,814 Lacrosse Joint 1,468,138 160,475 140,763 - 84,657 8,547 0.00 537,581 102,185 238,122 Klickitat 1,367,502 66,321 - - 108,528 55,737 55,786.73 854,250 89,249 110,257 Brinnon 503,303 130,546 - - 125,600 1,236 58,654.61 420,180 63,183 89,044 Orchard Prairie 628,204 134,329 - - 67,635 - 0.00 255,977 1,445 30,296 Sprague 1,267,413 144,944 97,254 - 74,691 1,187 31,736.72 496,393 73,111 131,144 Skamania 609,441 117,778 - - 131,330 2,003 24,167.80 301,788 77,961 74,180 Wishram 1,317,119 106,144 59,613 - 122,064 723 13,838.35 578,257 69,120 52,712 Summit Valley 550,866 111,023 - - 121,284 1,812 0.00 217,302 74,425 - North River 1,201,322 109,005 - - 74,343 - 5,652.85 645,934 85,989 166,911 Glenwood 1,349,432 129,823 - - 61,896 - 0.00 513,752 99,978 63,299 Mount Pleasant 557,367 76,712 - - 39,850 2,642 0.00 247,584 3,634 67,951 Satsop 419,614 124,305 - - 47,151 - 0.00 170,683 32,154 1,909 Washtucna 1,274,474 68,282 86,697 - 38,035 9,107 37,087.72 507,968 60,657 128,529 Skykomish 1,385,799 277,999 - - 46,238 35,935 121,224.21 682,554 80,166 40,300 Evaline 402,041 100,268 - - 164,105 2,002 0.00 285,394 24,069 25,033 Steptoe 431,744 56,768 - - 19,870 - 47,595.68 190,432 1,578 75,811 Mill A 1,275,875 54,678 - - 29,785 33,732 17,052.22 477,318 71,327 89,212 Orient 402,086 123,657 - - 119,369 - 0.00 216,972 59,969 358,440 Willow Charter 756,158 92,937 - - 89,119 - 0.00 778,384 121,606 7,966 Great Northern 400,775 97,342 - - 73,053 - 0.00 172,848 - 194,253 Kahlotus 1,235,466 59,369 96,895 - 90,897 - 8,259.71 554,761 65,396 57,721
44
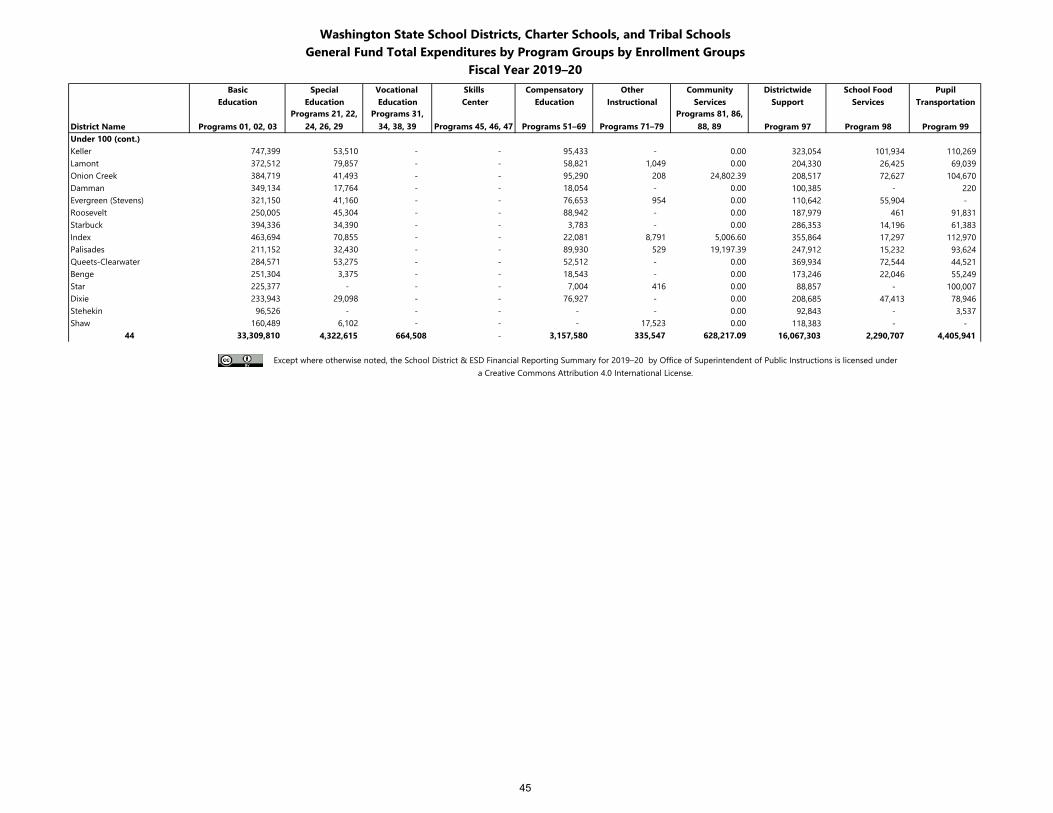
Washington State School Districts, Charter Schools, and Tribal SchoolsGeneral Fund Total Expenditures by Program Groups by Enrollment Groups
Fiscal Year 2019–20Basic Special Vocational Skills Compensatory Other Community Districtwide School Food Pupil
Education Education Education Center Education Instructional Services Support Services Transportation
District Name Programs 01, 02, 03Programs 21, 22,
24, 26, 29Programs 31,
34, 38, 39 Programs 45, 46, 47 Programs 51–69 Programs 71–79Programs 81, 86,
88, 89 Program 97 Program 98 Program 99Under 100 (cont.)Keller 747,399 53,510 - - 95,433 - 0.00 323,054 101,934 110,269 Lamont 372,512 79,857 - - 58,821 1,049 0.00 204,330 26,425 69,039 Onion Creek 384,719 41,493 - - 95,290 208 24,802.39 208,517 72,627 104,670 Damman 349,134 17,764 - - 18,054 - 0.00 100,385 - 220 Evergreen (Stevens) 321,150 41,160 - - 76,653 954 0.00 110,642 55,904 - Roosevelt 250,005 45,304 - - 88,942 - 0.00 187,979 461 91,831 Starbuck 394,336 34,390 - - 3,783 - 0.00 286,353 14,196 61,383 Index 463,694 70,855 - - 22,081 8,791 5,006.60 355,864 17,297 112,970 Palisades 211,152 32,430 - - 89,930 529 19,197.39 247,912 15,232 93,624 Queets-Clearwater 284,571 53,275 - - 52,512 - 0.00 369,934 72,544 44,521 Benge 251,304 3,375 - - 18,543 - 0.00 173,246 22,046 55,249 Star 225,377 - - - 7,004 416 0.00 88,857 - 100,007 Dixie 233,943 29,098 - - 76,927 - 0.00 208,685 47,413 78,946 Stehekin 96,526 - - - - - 0.00 92,843 - 3,537 Shaw 160,489 6,102 - - - 17,523 0.00 118,383 - -
44 33,309,810 4,322,615 664,508 - 3,157,580 335,547 628,217.09 16,067,303 2,290,707 4,405,941
Except where otherwise noted, the School District & ESD Financial Reporting Summary for 2019–20 by Office of Superintendent of Public Instructions is licensed undera Creative Commons Attribution 4.0 International License.
45
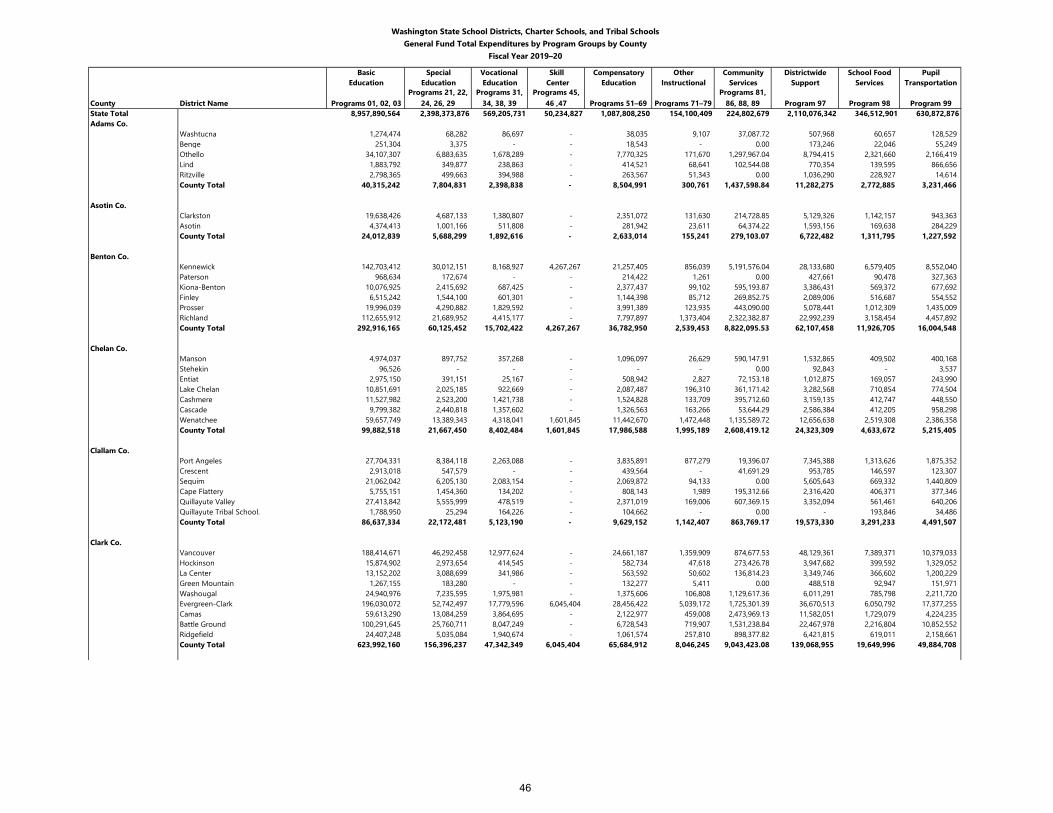
Washington State School Districts, Charter Schools, and Tribal SchoolsGeneral Fund Total Expenditures by Program Groups by County
Fiscal Year 2019–20
Basic Special Vocational Skill Compensatory Other Community Districtwide School Food PupilEducation Education Education Center Education Instructional Services Support Services Transportation
County District Name Programs 01, 02, 03Programs 21, 22,
24, 26, 29Programs 31,
34, 38, 39Programs 45,
46 ,47 Programs 51–69 Programs 71–79Programs 81,
86, 88, 89 Program 97 Program 98 Program 99State Total 8,957,890,564 2,398,373,876 569,205,731 50,234,827 1,087,808,250 154,100,409 224,802,679 2,110,076,342 346,512,901 630,872,876Adams Co.
Washtucna 1,274,474 68,282 86,697 - 38,035 9,107 37,087.72 507,968 60,657 128,529 Benge 251,304 3,375 - - 18,543 - 0.00 173,246 22,046 55,249 Othello 34,107,307 6,883,635 1,678,289 - 7,770,325 171,670 1,297,967.04 8,794,415 2,321,660 2,166,419 Lind 1,883,792 349,877 238,863 - 414,521 68,641 102,544.08 770,354 139,595 866,656 Ritzville 2,798,365 499,663 394,988 - 263,567 51,343 0.00 1,036,290 228,927 14,614 County Total 40,315,242 7,804,831 2,398,838 - 8,504,991 300,761 1,437,598.84 11,282,275 2,772,885 3,231,466
Asotin Co.Clarkston 19,638,426 4,687,133 1,380,807 - 2,351,072 131,630 214,728.85 5,129,326 1,142,157 943,363 Asotin 4,374,413 1,001,166 511,808 - 281,942 23,611 64,374.22 1,593,156 169,638 284,229 County Total 24,012,839 5,688,299 1,892,616 - 2,633,014 155,241 279,103.07 6,722,482 1,311,795 1,227,592
Benton Co.Kennewick 142,703,412 30,012,151 8,168,927 4,267,267 21,257,405 856,039 5,191,576.04 28,133,680 6,579,405 8,552,040 Paterson 968,634 172,674 - - 214,422 1,261 0.00 427,661 90,478 327,363 Kiona-Benton 10,076,925 2,415,692 687,425 - 2,377,437 99,102 595,193.87 3,386,431 569,372 677,692 Finley 6,515,242 1,544,100 601,301 - 1,144,398 85,712 269,852.75 2,089,006 516,687 554,552 Prosser 19,996,039 4,290,882 1,829,592 - 3,991,389 123,935 443,090.00 5,078,441 1,012,309 1,435,009 Richland 112,655,912 21,689,952 4,415,177 - 7,797,897 1,373,404 2,322,382.87 22,992,239 3,158,454 4,457,892 County Total 292,916,165 60,125,452 15,702,422 4,267,267 36,782,950 2,539,453 8,822,095.53 62,107,458 11,926,705 16,004,548
Chelan Co.Manson 4,974,037 897,752 357,268 - 1,096,097 26,629 590,147.91 1,532,865 409,502 400,168 Stehekin 96,526 - - - - - 0.00 92,843 - 3,537 Entiat 2,975,150 391,151 25,167 - 508,942 2,827 72,153.18 1,012,875 169,057 243,990 Lake Chelan 10,851,691 2,025,185 922,669 - 2,087,487 196,310 361,171.42 3,282,568 710,854 774,504 Cashmere 11,527,982 2,523,200 1,421,738 - 1,524,828 133,709 395,712.60 3,159,135 412,747 448,550 Cascade 9,799,382 2,440,818 1,357,602 - 1,326,563 163,266 53,644.29 2,586,384 412,205 958,298 Wenatchee 59,657,749 13,389,343 4,318,041 1,601,845 11,442,670 1,472,448 1,135,589.72 12,656,638 2,519,308 2,386,358 County Total 99,882,518 21,667,450 8,402,484 1,601,845 17,986,588 1,995,189 2,608,419.12 24,323,309 4,633,672 5,215,405
Clallam Co.Port Angeles 27,704,331 8,384,118 2,263,088 - 3,835,891 877,279 19,396.07 7,345,388 1,313,626 1,875,352 Crescent 2,913,018 547,579 - - 439,564 - 41,691.29 953,785 146,597 123,307 Sequim 21,062,042 6,205,130 2,083,154 - 2,069,872 94,133 0.00 5,605,643 669,332 1,440,809 Cape Flattery 5,755,151 1,454,360 134,202 - 808,143 1,989 195,312.66 2,316,420 406,371 377,346 Quillayute Valley 27,413,842 5,555,999 478,519 - 2,371,019 169,006 607,369.15 3,352,094 561,461 640,206 Quillayute Tribal School. 1,788,950 25,294 164,226 - 104,662 - 0.00 - 193,846 34,486 County Total 86,637,334 22,172,481 5,123,190 - 9,629,152 1,142,407 863,769.17 19,573,330 3,291,233 4,491,507
Clark Co.Vancouver 188,414,671 46,292,458 12,977,624 - 24,661,187 1,359,909 874,677.53 48,129,361 7,389,371 10,379,033 Hockinson 15,874,902 2,973,654 414,545 - 582,734 47,618 273,426.78 3,947,682 399,592 1,329,052 La Center 13,152,202 3,088,699 341,986 - 563,592 50,602 136,814.23 3,349,746 366,602 1,200,229 Green Mountain 1,267,155 183,280 - - 132,277 5,411 0.00 488,518 92,947 151,971 Washougal 24,940,976 7,235,595 1,975,981 - 1,375,606 106,808 1,129,617.36 6,011,291 785,798 2,211,720 Evergreen-Clark 196,030,072 52,742,497 17,779,596 6,045,404 28,456,422 5,039,172 1,725,301.39 36,670,513 6,050,792 17,377,255 Camas 59,613,290 13,084,259 3,864,695 - 2,122,977 459,008 2,473,969.13 11,582,051 1,729,079 4,224,235 Battle Ground 100,291,645 25,760,711 8,047,249 - 6,728,543 719,907 1,531,238.84 22,467,978 2,216,804 10,852,552 Ridgefield 24,407,248 5,035,084 1,940,674 - 1,061,574 257,810 898,377.82 6,421,815 619,011 2,158,661 County Total 623,992,160 156,396,237 47,342,349 6,045,404 65,684,912 8,046,245 9,043,423.08 139,068,955 19,649,996 49,884,708
46
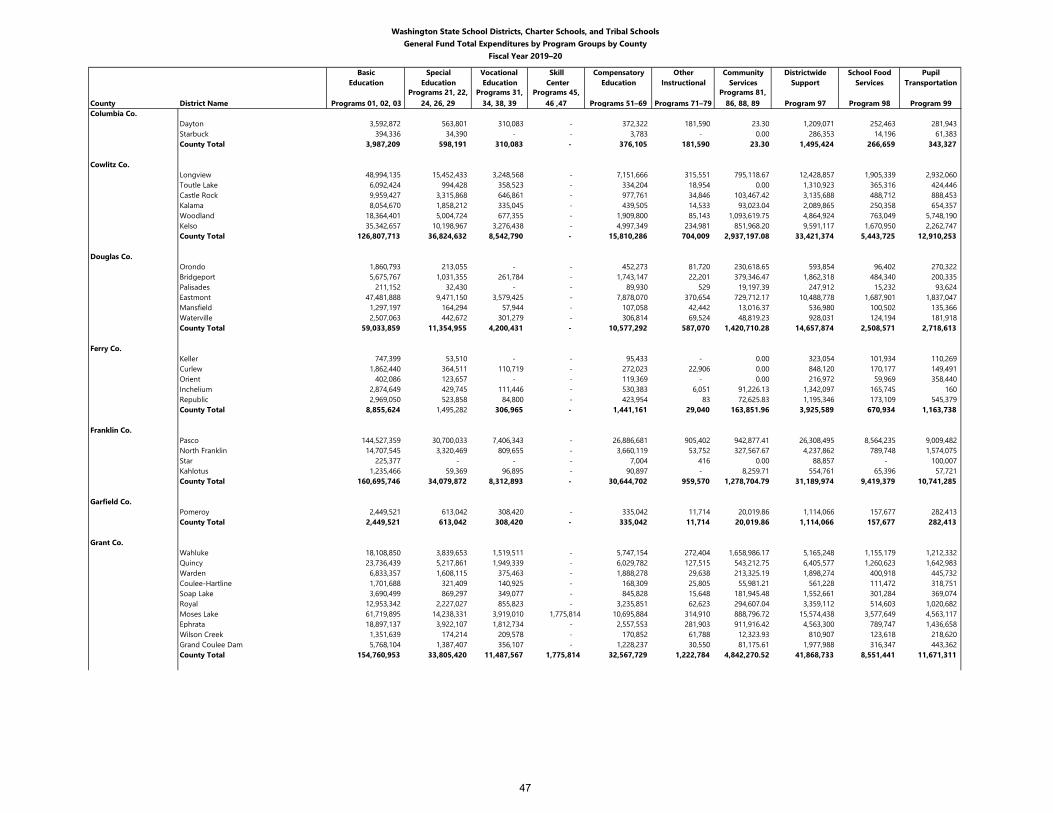
Washington State School Districts, Charter Schools, and Tribal SchoolsGeneral Fund Total Expenditures by Program Groups by County
Fiscal Year 2019–20
Basic Special Vocational Skill Compensatory Other Community Districtwide School Food PupilEducation Education Education Center Education Instructional Services Support Services Transportation
County District Name Programs 01, 02, 03Programs 21, 22,
24, 26, 29Programs 31,
34, 38, 39Programs 45,
46 ,47 Programs 51–69 Programs 71–79Programs 81,
86, 88, 89 Program 97 Program 98 Program 99Columbia Co.
Dayton 3,592,872 563,801 310,083 - 372,322 181,590 23.30 1,209,071 252,463 281,943 Starbuck 394,336 34,390 - - 3,783 - 0.00 286,353 14,196 61,383 County Total 3,987,209 598,191 310,083 - 376,105 181,590 23.30 1,495,424 266,659 343,327
Cowlitz Co.Longview 48,994,135 15,452,433 3,248,568 - 7,151,666 315,551 795,118.67 12,428,857 1,905,339 2,932,060 Toutle Lake 6,092,424 994,428 358,523 - 334,204 18,954 0.00 1,310,923 365,316 424,446 Castle Rock 9,959,427 3,315,868 646,861 - 977,761 34,846 103,467.42 3,135,688 488,712 888,453 Kalama 8,054,670 1,858,212 335,045 - 439,505 14,533 93,023.04 2,089,865 250,358 654,357 Woodland 18,364,401 5,004,724 677,355 - 1,909,800 85,143 1,093,619.75 4,864,924 763,049 5,748,190 Kelso 35,342,657 10,198,967 3,276,438 - 4,997,349 234,981 851,968.20 9,591,117 1,670,950 2,262,747 County Total 126,807,713 36,824,632 8,542,790 - 15,810,286 704,009 2,937,197.08 33,421,374 5,443,725 12,910,253
Douglas Co.Orondo 1,860,793 213,055 - - 452,273 81,720 230,618.65 593,854 96,402 270,322 Bridgeport 5,675,767 1,031,355 261,784 - 1,743,147 22,201 379,346.47 1,862,318 484,340 200,335 Palisades 211,152 32,430 - - 89,930 529 19,197.39 247,912 15,232 93,624 Eastmont 47,481,888 9,471,150 3,579,425 - 7,878,070 370,654 729,712.17 10,488,778 1,687,901 1,837,047 Mansfield 1,297,197 164,294 57,944 - 107,058 42,442 13,016.37 536,980 100,502 135,366 Waterville 2,507,063 442,672 301,279 - 306,814 69,524 48,819.23 928,031 124,194 181,918 County Total 59,033,859 11,354,955 4,200,431 - 10,577,292 587,070 1,420,710.28 14,657,874 2,508,571 2,718,613
Ferry Co.Keller 747,399 53,510 - - 95,433 - 0.00 323,054 101,934 110,269 Curlew 1,862,440 364,511 110,719 - 272,023 22,906 0.00 848,120 170,177 149,491 Orient 402,086 123,657 - - 119,369 - 0.00 216,972 59,969 358,440 Inchelium 2,874,649 429,745 111,446 - 530,383 6,051 91,226.13 1,342,097 165,745 160 Republic 2,969,050 523,858 84,800 - 423,954 83 72,625.83 1,195,346 173,109 545,379 County Total 8,855,624 1,495,282 306,965 - 1,441,161 29,040 163,851.96 3,925,589 670,934 1,163,738
Franklin Co.Pasco 144,527,359 30,700,033 7,406,343 - 26,886,681 905,402 942,877.41 26,308,495 8,564,235 9,009,482 North Franklin 14,707,545 3,320,469 809,655 - 3,660,119 53,752 327,567.67 4,237,862 789,748 1,574,075 Star 225,377 - - - 7,004 416 0.00 88,857 - 100,007 Kahlotus 1,235,466 59,369 96,895 - 90,897 - 8,259.71 554,761 65,396 57,721 County Total 160,695,746 34,079,872 8,312,893 - 30,644,702 959,570 1,278,704.79 31,189,974 9,419,379 10,741,285
Garfield Co.Pomeroy 2,449,521 613,042 308,420 - 335,042 11,714 20,019.86 1,114,066 157,677 282,413 County Total 2,449,521 613,042 308,420 - 335,042 11,714 20,019.86 1,114,066 157,677 282,413
Grant Co.Wahluke 18,108,850 3,839,653 1,519,511 - 5,747,154 272,404 1,658,986.17 5,165,248 1,155,179 1,212,332 Quincy 23,736,439 5,217,861 1,949,339 - 6,029,782 127,515 543,212.75 6,405,577 1,260,623 1,642,983 Warden 6,833,357 1,608,115 375,463 - 1,888,278 29,638 213,325.19 1,898,274 400,918 445,732 Coulee-Hartline 1,701,688 321,409 140,925 - 168,309 25,805 55,981.21 561,228 111,472 318,751 Soap Lake 3,690,499 869,297 349,077 - 845,828 15,648 181,945.48 1,552,661 301,284 369,074 Royal 12,953,342 2,227,027 855,823 - 3,235,851 62,623 294,607.04 3,359,112 514,603 1,020,682 Moses Lake 61,719,895 14,238,331 3,919,010 1,775,814 10,695,884 314,910 888,796.72 15,574,438 3,577,649 4,563,117 Ephrata 18,897,137 3,922,107 1,812,734 - 2,557,553 281,903 911,916.42 4,563,300 789,747 1,436,658 Wilson Creek 1,351,639 174,214 209,578 - 170,852 61,788 12,323.93 810,907 123,618 218,620 Grand Coulee Dam 5,768,104 1,387,407 356,107 - 1,228,237 30,550 81,175.61 1,977,988 316,347 443,362 County Total 154,760,953 33,805,420 11,487,567 1,775,814 32,567,729 1,222,784 4,842,270.52 41,868,733 8,551,441 11,671,311
47
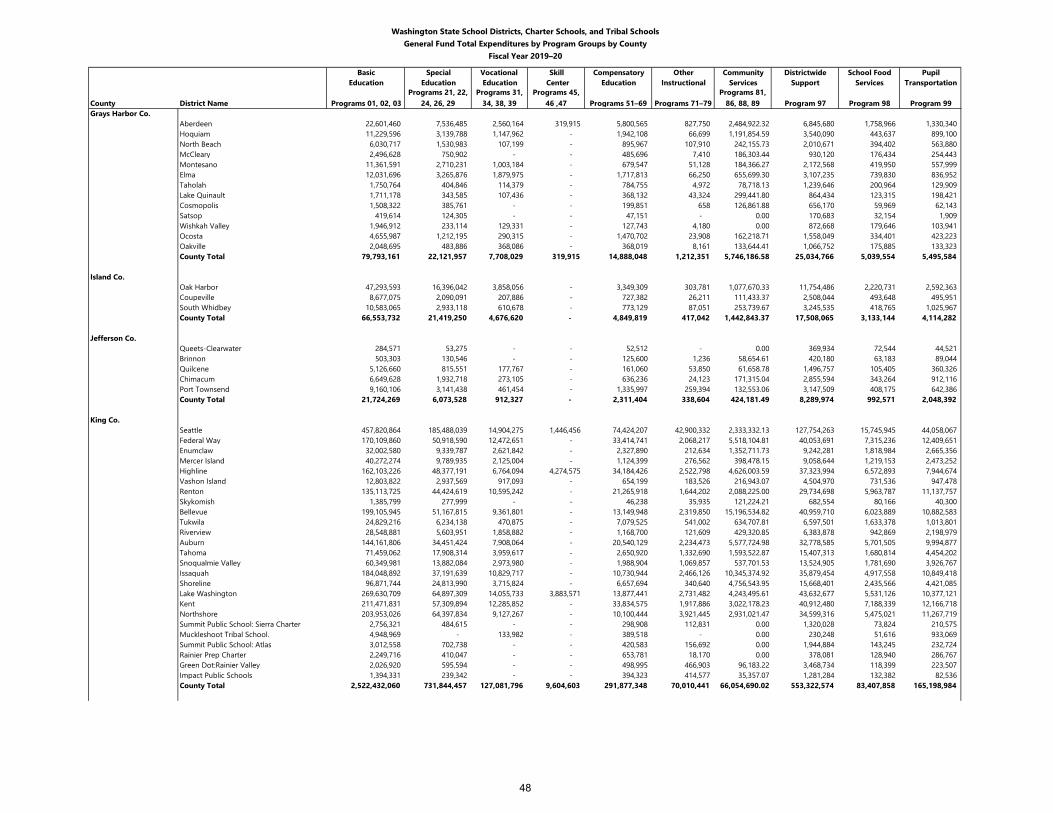
Washington State School Districts, Charter Schools, and Tribal SchoolsGeneral Fund Total Expenditures by Program Groups by County
Fiscal Year 2019–20
Basic Special Vocational Skill Compensatory Other Community Districtwide School Food PupilEducation Education Education Center Education Instructional Services Support Services Transportation
County District Name Programs 01, 02, 03Programs 21, 22,
24, 26, 29Programs 31,
34, 38, 39Programs 45,
46 ,47 Programs 51–69 Programs 71–79Programs 81,
86, 88, 89 Program 97 Program 98 Program 99Grays Harbor Co.
Aberdeen 22,601,460 7,536,485 2,560,164 319,915 5,800,565 827,750 2,484,922.32 6,845,680 1,758,966 1,330,340 Hoquiam 11,229,596 3,139,788 1,147,962 - 1,942,108 66,699 1,191,854.59 3,540,090 443,637 899,100 North Beach 6,030,717 1,530,983 107,199 - 895,967 107,910 242,155.73 2,010,671 394,402 563,880 McCleary 2,496,628 750,902 - - 485,696 7,410 186,303.44 930,120 176,434 254,443 Montesano 11,361,591 2,710,231 1,003,184 - 679,547 51,128 184,366.27 2,172,568 419,950 557,999 Elma 12,031,696 3,265,876 1,879,975 - 1,717,813 66,250 655,699.30 3,107,235 739,830 836,952 Taholah 1,750,764 404,846 114,379 - 784,755 4,972 78,718.13 1,239,646 200,964 129,909 Lake Quinault 1,711,178 343,585 107,436 - 368,132 43,324 299,441.80 864,434 123,315 198,421 Cosmopolis 1,508,322 385,761 - - 199,851 658 126,861.88 656,170 59,969 62,143 Satsop 419,614 124,305 - - 47,151 - 0.00 170,683 32,154 1,909 Wishkah Valley 1,946,912 233,114 129,331 - 127,743 4,180 0.00 872,668 179,646 103,941 Ocosta 4,655,987 1,212,195 290,315 - 1,470,702 23,908 162,218.71 1,558,049 334,401 423,223 Oakville 2,048,695 483,886 368,086 - 368,019 8,161 133,644.41 1,066,752 175,885 133,323 County Total 79,793,161 22,121,957 7,708,029 319,915 14,888,048 1,212,351 5,746,186.58 25,034,766 5,039,554 5,495,584
Island Co.Oak Harbor 47,293,593 16,396,042 3,858,056 - 3,349,309 303,781 1,077,670.33 11,754,486 2,220,731 2,592,363 Coupeville 8,677,075 2,090,091 207,886 - 727,382 26,211 111,433.37 2,508,044 493,648 495,951 South Whidbey 10,583,065 2,933,118 610,678 - 773,129 87,051 253,739.67 3,245,535 418,765 1,025,967 County Total 66,553,732 21,419,250 4,676,620 - 4,849,819 417,042 1,442,843.37 17,508,065 3,133,144 4,114,282
Jefferson Co.Queets-Clearwater 284,571 53,275 - - 52,512 - 0.00 369,934 72,544 44,521 Brinnon 503,303 130,546 - - 125,600 1,236 58,654.61 420,180 63,183 89,044 Quilcene 5,126,660 815,551 177,767 - 161,060 53,850 61,658.78 1,496,757 105,405 360,326 Chimacum 6,649,628 1,932,718 273,105 - 636,236 24,123 171,315.04 2,855,594 343,264 912,116 Port Townsend 9,160,106 3,141,438 461,454 - 1,335,997 259,394 132,553.06 3,147,509 408,175 642,386 County Total 21,724,269 6,073,528 912,327 - 2,311,404 338,604 424,181.49 8,289,974 992,571 2,048,392
King Co.Seattle 457,820,864 185,488,039 14,904,275 1,446,456 74,424,207 42,900,332 2,333,332.13 127,754,263 15,745,945 44,058,067 Federal Way 170,109,860 50,918,590 12,472,651 - 33,414,741 2,068,217 5,518,104.81 40,053,691 7,315,236 12,409,651 Enumclaw 32,002,580 9,339,787 2,621,842 - 2,327,890 212,634 1,352,711.73 9,242,281 1,818,984 2,665,356 Mercer Island 40,272,274 9,789,935 2,125,004 - 1,124,399 276,562 398,478.15 9,058,644 1,219,153 2,473,252 Highline 162,103,226 48,377,191 6,764,094 4,274,575 34,184,426 2,522,798 4,626,003.59 37,323,994 6,572,893 7,944,674 Vashon Island 12,803,822 2,937,569 917,093 - 654,199 183,526 216,943.07 4,504,970 731,536 947,478 Renton 135,113,725 44,424,619 10,595,242 - 21,265,918 1,644,202 2,088,225.00 29,734,698 5,963,787 11,137,757 Skykomish 1,385,799 277,999 - - 46,238 35,935 121,224.21 682,554 80,166 40,300 Bellevue 199,105,945 51,167,815 9,361,801 - 13,149,948 2,319,850 15,196,534.82 40,959,710 6,023,889 10,882,583 Tukwila 24,829,216 6,234,138 470,875 - 7,079,525 541,002 634,707.81 6,597,501 1,633,378 1,013,801 Riverview 28,548,881 5,603,951 1,858,882 - 1,168,700 121,609 429,320.85 6,383,878 942,869 2,198,979 Auburn 144,161,806 34,451,424 7,908,064 - 20,540,129 2,234,473 5,577,724.98 32,778,585 5,701,505 9,994,877 Tahoma 71,459,062 17,908,314 3,959,617 - 2,650,920 1,332,690 1,593,522.87 15,407,313 1,680,814 4,454,202 Snoqualmie Valley 60,349,981 13,882,084 2,973,980 - 1,988,904 1,069,857 537,701.53 13,524,905 1,781,690 3,926,767 Issaquah 184,048,892 37,191,639 10,829,717 - 10,730,944 2,466,126 10,345,374.92 35,879,454 4,917,558 10,849,418 Shoreline 96,871,744 24,813,990 3,715,824 - 6,657,694 340,640 4,756,543.95 15,668,401 2,435,566 4,421,085 Lake Washington 269,630,709 64,897,309 14,055,733 3,883,571 13,877,441 2,731,482 4,243,495.61 43,632,677 5,531,126 10,377,121 Kent 211,471,831 57,309,894 12,285,852 - 33,834,575 1,917,886 3,022,178.23 40,912,480 7,188,339 12,166,718 Northshore 203,953,026 64,397,834 9,127,267 - 10,100,444 3,921,445 2,931,021.47 34,599,316 5,475,021 11,267,719 Summit Public School: Sierra Charter 2,756,321 484,615 - - 298,908 112,831 0.00 1,320,028 73,824 210,575 Muckleshoot Tribal School. 4,948,969 - 133,982 - 389,518 - 0.00 230,248 51,616 933,069 Summit Public School: Atlas 3,012,558 702,738 - - 420,583 156,692 0.00 1,944,884 143,245 232,724 Rainier Prep Charter 2,249,716 410,047 - - 653,781 18,170 0.00 378,081 128,940 286,767 Green Dot:Rainier Valley 2,026,920 595,594 - - 498,995 466,903 96,183.22 3,468,734 118,399 223,507 Impact Public Schools 1,394,331 239,342 - - 394,323 414,577 35,357.07 1,281,284 132,382 82,536 County Total 2,522,432,060 731,844,457 127,081,796 9,604,603 291,877,348 70,010,441 66,054,690.02 553,322,574 83,407,858 165,198,984
48
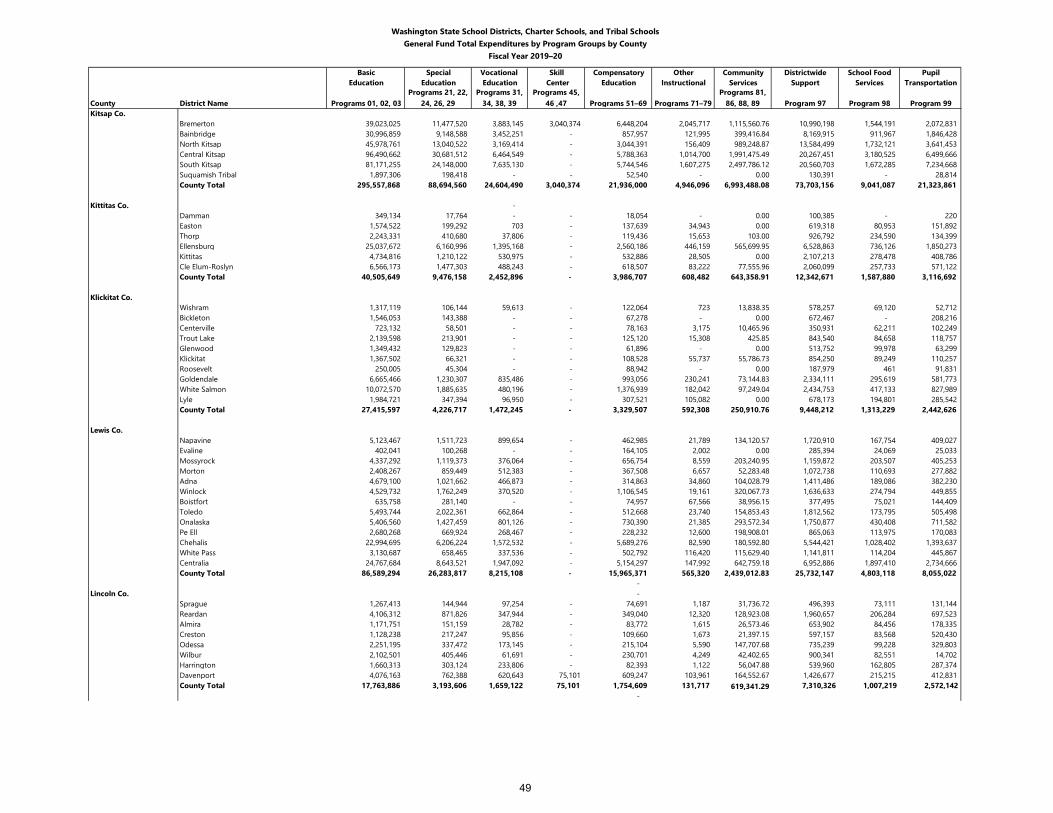
Washington State School Districts, Charter Schools, and Tribal SchoolsGeneral Fund Total Expenditures by Program Groups by County
Fiscal Year 2019–20
Basic Special Vocational Skill Compensatory Other Community Districtwide School Food PupilEducation Education Education Center Education Instructional Services Support Services Transportation
County District Name Programs 01, 02, 03Programs 21, 22,
24, 26, 29Programs 31,
34, 38, 39Programs 45,
46 ,47 Programs 51–69 Programs 71–79Programs 81,
86, 88, 89 Program 97 Program 98 Program 99Kitsap Co.
Bremerton 39,023,025 11,477,520 3,883,145 3,040,374 6,448,204 2,045,717 1,115,560.76 10,990,198 1,544,191 2,072,831 Bainbridge 30,996,859 9,148,588 3,452,251 - 857,957 121,995 399,416.84 8,169,915 911,967 1,846,428 North Kitsap 45,978,761 13,040,522 3,169,414 - 3,044,391 156,409 989,248.87 13,584,499 1,732,121 3,641,453 Central Kitsap 96,490,662 30,681,512 6,464,549 - 5,788,363 1,014,700 1,991,475.49 20,267,451 3,180,525 6,499,666 South Kitsap 81,171,255 24,148,000 7,635,130 - 5,744,546 1,607,275 2,497,786.12 20,560,703 1,672,285 7,234,668 Suquamish Tribal 1,897,306 198,418 - - 52,540 - 0.00 130,391 - 28,814 County Total 295,557,868 88,694,560 24,604,490 3,040,374 21,936,000 4,946,096 6,993,488.08 73,703,156 9,041,087 21,323,861
Kittitas Co. - Damman 349,134 17,764 - - 18,054 - 0.00 100,385 - 220 Easton 1,574,522 199,292 703 - 137,639 34,943 0.00 619,318 80,953 151,892 Thorp 2,243,331 410,680 37,806 - 119,436 15,653 103.00 926,792 234,590 134,399 Ellensburg 25,037,672 6,160,996 1,395,168 - 2,560,186 446,159 565,699.95 6,528,863 736,126 1,850,273 Kittitas 4,734,816 1,210,122 530,975 - 532,886 28,505 0.00 2,107,213 278,478 408,786 Cle Elum-Roslyn 6,566,173 1,477,303 488,243 - 618,507 83,222 77,555.96 2,060,099 257,733 571,122 County Total 40,505,649 9,476,158 2,452,896 - 3,986,707 608,482 643,358.91 12,342,671 1,587,880 3,116,692
Klickitat Co.Wishram 1,317,119 106,144 59,613 - 122,064 723 13,838.35 578,257 69,120 52,712 Bickleton 1,546,053 143,388 - - 67,278 - 0.00 672,467 - 208,216 Centerville 723,132 58,501 - - 78,163 3,175 10,465.96 350,931 62,211 102,249 Trout Lake 2,139,598 213,901 - - 125,120 15,308 425.85 843,540 84,658 118,757 Glenwood 1,349,432 129,823 - - 61,896 - 0.00 513,752 99,978 63,299 Klickitat 1,367,502 66,321 - - 108,528 55,737 55,786.73 854,250 89,249 110,257 Roosevelt 250,005 45,304 - - 88,942 - 0.00 187,979 461 91,831 Goldendale 6,665,466 1,230,307 835,486 - 993,056 230,241 73,144.83 2,334,111 295,619 581,773 White Salmon 10,072,570 1,885,635 480,196 - 1,376,939 182,042 97,249.04 2,434,753 417,133 827,989 Lyle 1,984,721 347,394 96,950 - 307,521 105,082 0.00 678,173 194,801 285,542 County Total 27,415,597 4,226,717 1,472,245 - 3,329,507 592,308 250,910.76 9,448,212 1,313,229 2,442,626
Lewis Co.Napavine 5,123,467 1,511,723 899,654 - 462,985 21,789 134,120.57 1,720,910 167,754 409,027 Evaline 402,041 100,268 - - 164,105 2,002 0.00 285,394 24,069 25,033 Mossyrock 4,337,292 1,119,373 376,064 - 656,754 8,559 203,240.95 1,159,872 203,507 405,253 Morton 2,408,267 859,449 512,383 - 367,508 6,657 52,283.48 1,072,738 110,693 277,882 Adna 4,679,100 1,021,662 466,873 - 314,863 34,860 104,028.79 1,411,486 189,086 382,230 Winlock 4,529,732 1,762,249 370,520 - 1,106,545 19,161 320,067.73 1,636,633 274,794 449,855 Boistfort 635,758 281,140 - - 74,957 67,566 38,956.15 377,495 75,021 144,409 Toledo 5,493,744 2,022,361 662,864 - 512,668 23,740 154,853.43 1,812,562 173,795 505,498 Onalaska 5,406,560 1,427,459 801,126 - 730,390 21,385 293,572.34 1,750,877 430,408 711,582 Pe Ell 2,680,268 669,924 268,467 - 228,232 12,600 198,908.01 865,063 113,975 170,083 Chehalis 22,994,695 6,206,224 1,572,532 - 5,689,276 82,590 180,592.80 5,544,421 1,028,402 1,393,637 White Pass 3,130,687 658,465 337,536 - 502,792 116,420 115,629.40 1,141,811 114,204 445,867 Centralia 24,767,684 8,643,521 1,947,092 - 5,154,297 147,992 642,759.18 6,952,886 1,897,410 2,734,666 County Total 86,589,294 26,283,817 8,215,108 - 15,965,371 565,320 2,439,012.83 25,732,147 4,803,118 8,055,022
- Lincoln Co. -
Sprague 1,267,413 144,944 97,254 - 74,691 1,187 31,736.72 496,393 73,111 131,144 Reardan 4,106,312 871,826 347,944 - 349,040 12,320 128,923.08 1,960,657 206,284 697,523 Almira 1,171,751 151,159 28,782 - 83,772 1,615 26,573.46 653,902 84,456 178,335 Creston 1,128,238 217,247 95,856 - 109,660 1,673 21,397.15 597,157 83,568 520,430 Odessa 2,251,195 337,472 173,145 - 215,104 5,590 147,707.68 735,239 99,228 329,803 Wilbur 2,102,501 405,446 61,691 - 230,701 4,249 42,402.65 900,341 82,551 14,702 Harrington 1,660,313 303,124 233,806 - 82,393 1,122 56,047.88 539,960 162,805 287,374 Davenport 4,076,163 762,388 620,643 75,101 609,247 103,961 164,552.67 1,426,677 215,215 412,831 County Total 17,763,886 3,193,606 1,659,122 75,101 1,754,609 131,717 619,341.29 7,310,326 1,007,219 2,572,142
-
49
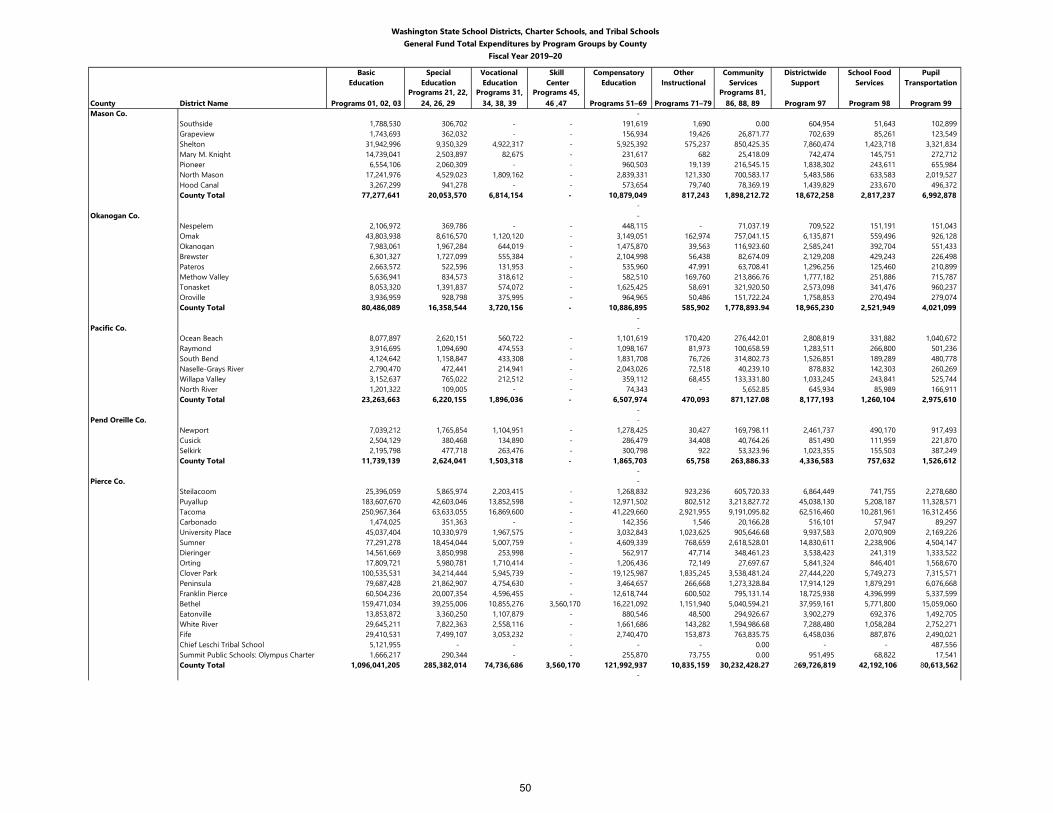
Washington State School Districts, Charter Schools, and Tribal SchoolsGeneral Fund Total Expenditures by Program Groups by County
Fiscal Year 2019–20
Basic Special Vocational Skill Compensatory Other Community Districtwide School Food PupilEducation Education Education Center Education Instructional Services Support Services Transportation
County District Name Programs 01, 02, 03Programs 21, 22,
24, 26, 29Programs 31,
34, 38, 39Programs 45,
46 ,47 Programs 51–69 Programs 71–79Programs 81,
86, 88, 89 Program 97 Program 98 Program 99Mason Co. -
Southside 1,788,530 306,702 - - 191,619 1,690 0.00 604,954 51,643 102,899 Grapeview 1,743,693 362,032 - - 156,934 19,426 26,871.77 702,639 85,261 123,549 Shelton 31,942,996 9,350,329 4,922,317 - 5,925,392 575,237 850,425.35 7,860,474 1,423,718 3,321,834 Mary M. Knight 14,739,041 2,503,897 82,675 - 231,617 682 25,418.09 742,474 145,751 272,712 Pioneer 6,554,106 2,060,309 - - 960,503 19,139 216,545.15 1,838,302 243,611 655,984 North Mason 17,241,976 4,529,023 1,809,162 - 2,839,331 121,330 700,583.17 5,483,586 633,583 2,019,527 Hood Canal 3,267,299 941,278 - - 573,654 79,740 78,369.19 1,439,829 233,670 496,372 County Total 77,277,641 20,053,570 6,814,154 - 10,879,049 817,243 1,898,212.72 18,672,258 2,817,237 6,992,878
- Okanogan Co. -
Nespelem 2,106,972 369,786 - - 448,115 - 71,037.19 709,522 151,191 151,043 Omak 43,803,938 8,616,570 1,120,120 - 3,149,051 162,974 757,041.15 6,135,871 559,496 926,128 Okanogan 7,983,061 1,967,284 644,019 - 1,475,870 39,563 116,923.60 2,585,241 392,704 551,433 Brewster 6,301,327 1,727,099 555,384 - 2,104,998 56,438 82,674.09 2,129,208 429,243 226,498 Pateros 2,663,572 522,596 131,953 - 535,960 47,991 63,708.41 1,296,256 125,460 210,899 Methow Valley 5,636,941 834,573 318,612 - 582,510 169,760 213,866.76 1,777,182 251,886 715,787 Tonasket 8,053,320 1,391,837 574,072 - 1,625,425 58,691 321,920.50 2,573,098 341,476 960,237 Oroville 3,936,959 928,798 375,995 - 964,965 50,486 151,722.24 1,758,853 270,494 279,074 County Total 80,486,089 16,358,544 3,720,156 - 10,886,895 585,902 1,778,893.94 18,965,230 2,521,949 4,021,099
- Pacific Co. -
Ocean Beach 8,077,897 2,620,151 560,722 - 1,101,619 170,420 276,442.01 2,808,819 331,882 1,040,672 Raymond 3,916,695 1,094,690 474,553 - 1,098,167 81,973 100,658.59 1,283,511 266,800 501,236 South Bend 4,124,642 1,158,847 433,308 - 1,831,708 76,726 314,802.73 1,526,851 189,289 480,778 Naselle-Grays River 2,790,470 472,441 214,941 - 2,043,026 72,518 40,239.10 878,832 142,303 260,269 Willapa Valley 3,152,637 765,022 212,512 - 359,112 68,455 133,331.80 1,033,245 243,841 525,744 North River 1,201,322 109,005 - - 74,343 - 5,652.85 645,934 85,989 166,911 County Total 23,263,663 6,220,155 1,896,036 - 6,507,974 470,093 871,127.08 8,177,193 1,260,104 2,975,610
- Pend Oreille Co. -
Newport 7,039,212 1,765,854 1,104,951 - 1,278,425 30,427 169,798.11 2,461,737 490,170 917,493 Cusick 2,504,129 380,468 134,890 - 286,479 34,408 40,764.26 851,490 111,959 221,870 Selkirk 2,195,798 477,718 263,476 - 300,798 922 53,323.96 1,023,355 155,503 387,249 County Total 11,739,139 2,624,041 1,503,318 - 1,865,703 65,758 263,886.33 4,336,583 757,632 1,526,612
- Pierce Co. -
Steilacoom 25,396,059 5,865,974 2,203,415 - 1,268,832 923,236 605,720.33 6,864,449 741,755 2,278,680 Puyallup 183,607,670 42,603,046 13,852,598 - 12,971,502 802,512 3,213,827.72 45,038,130 5,208,187 11,328,571 Tacoma 250,967,364 63,633,055 16,869,600 - 41,229,660 2,921,955 9,191,095.82 62,516,460 10,281,961 16,312,456 Carbonado 1,474,025 351,363 - - 142,356 1,546 20,166.28 516,101 57,947 89,297 University Place 45,037,404 10,330,979 1,967,575 - 3,032,843 1,023,625 905,646.68 9,937,583 2,070,909 2,169,226 Sumner 77,291,278 18,454,044 5,007,759 - 4,609,339 768,659 2,618,528.01 14,830,611 2,238,906 4,504,147 Dieringer 14,561,669 3,850,998 253,998 - 562,917 47,714 348,461.23 3,538,423 241,319 1,333,522 Orting 17,809,721 5,980,781 1,710,414 - 1,206,436 72,149 27,697.67 5,841,324 846,401 1,568,670 Clover Park 100,535,531 34,214,444 5,945,739 - 19,125,987 1,835,245 3,538,481.24 27,444,220 5,749,273 7,315,571 Peninsula 79,687,428 21,862,907 4,754,630 - 3,464,657 266,668 1,273,328.84 17,914,129 1,879,291 6,076,668 Franklin Pierce 60,504,236 20,007,354 4,596,455 - 12,618,744 600,502 795,131.14 18,725,938 4,396,999 5,337,599 Bethel 159,471,034 39,255,006 10,855,276 3,560,170 16,221,092 1,151,940 5,040,594.21 37,959,161 5,771,800 15,059,060 Eatonville 13,853,872 3,360,250 1,107,879 - 880,546 48,500 294,926.67 3,902,279 692,376 1,492,705 White River 29,645,211 7,822,363 2,558,116 - 1,661,686 143,282 1,594,986.68 7,288,480 1,058,284 2,752,271 Fife 29,410,531 7,499,107 3,053,232 - 2,740,470 153,873 763,835.75 6,458,036 887,876 2,490,021 Chief Leschi Tribal School 5,121,955 - - - - - 0.00 - - 487,556 Summit Public Schools: Olympus Charter 1,666,217 290,344 - - 255,870 73,755 0.00 951,495 68,822 17,541 County Total 1,096,041,205 285,382,014 74,736,686 3,560,170 121,992,937 10,835,159 30,232,428.27 269,726,819 42,192,106 80,613,562
-
50
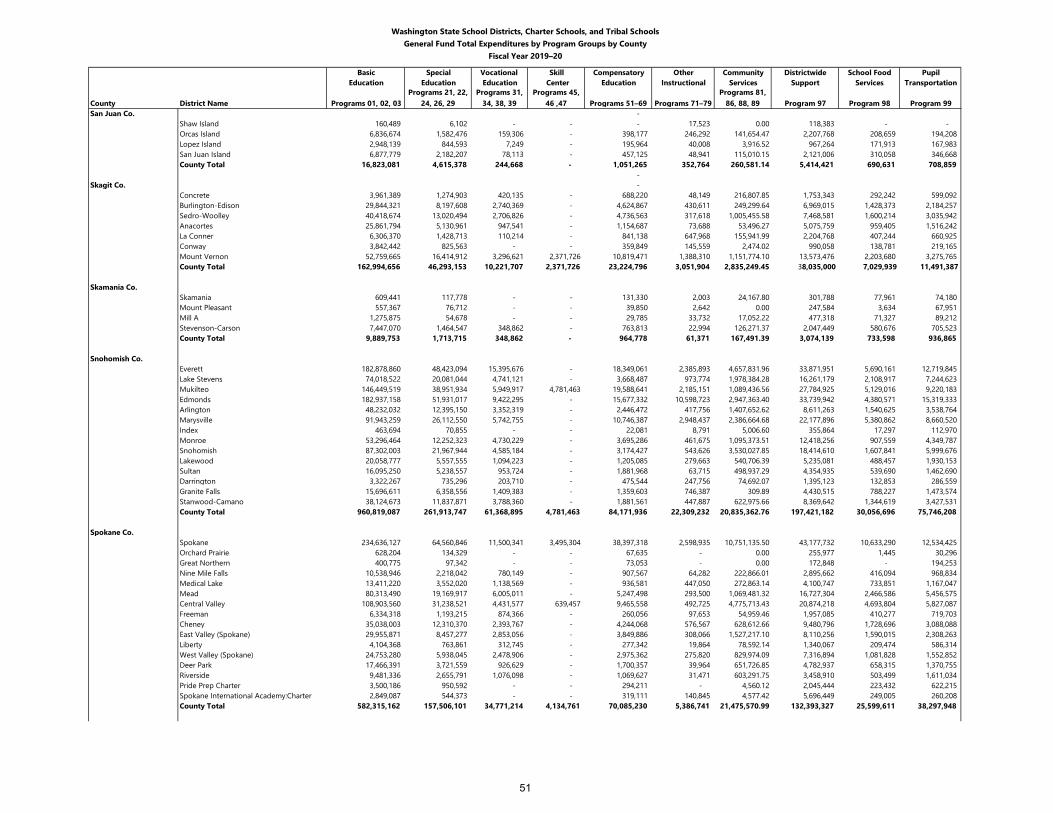
Washington State School Districts, Charter Schools, and Tribal SchoolsGeneral Fund Total Expenditures by Program Groups by County
Fiscal Year 2019–20
Basic Special Vocational Skill Compensatory Other Community Districtwide School Food PupilEducation Education Education Center Education Instructional Services Support Services Transportation
County District Name Programs 01, 02, 03Programs 21, 22,
24, 26, 29Programs 31,
34, 38, 39Programs 45,
46 ,47 Programs 51–69 Programs 71–79Programs 81,
86, 88, 89 Program 97 Program 98 Program 99San Juan Co. -
Shaw Island 160,489 6,102 - - - 17,523 0.00 118,383 - - Orcas Island 6,836,674 1,582,476 159,306 - 398,177 246,292 141,654.47 2,207,768 208,659 194,208 Lopez Island 2,948,139 844,593 7,249 - 195,964 40,008 3,916.52 967,264 171,913 167,983 San Juan Island 6,877,779 2,182,207 78,113 - 457,125 48,941 115,010.15 2,121,006 310,058 346,668 County Total 16,823,081 4,615,378 244,668 - 1,051,265 352,764 260,581.14 5,414,421 690,631 708,859
- Skagit Co. -
Concrete 3,961,389 1,274,903 420,135 - 688,220 48,149 216,807.85 1,753,343 292,242 599,092 Burlington-Edison 29,844,321 8,197,608 2,740,369 - 4,624,867 430,611 249,299.64 6,969,015 1,428,373 2,184,257 Sedro-Woolley 40,418,674 13,020,494 2,706,826 - 4,736,563 317,618 1,005,455.58 7,468,581 1,600,214 3,035,942 Anacortes 25,861,794 5,130,961 947,541 - 1,154,687 73,688 53,496.27 5,075,759 959,405 1,516,242 La Conner 6,306,370 1,428,713 110,214 - 841,138 647,968 155,941.99 2,204,768 407,244 660,925 Conway 3,842,442 825,563 - - 359,849 145,559 2,474.02 990,058 138,781 219,165 Mount Vernon 52,759,665 16,414,912 3,296,621 2,371,726 10,819,471 1,388,310 1,151,774.10 13,573,476 2,203,680 3,275,765 County Total 162,994,656 46,293,153 10,221,707 2,371,726 23,224,796 3,051,904 2,835,249.45 38,035,000 7,029,939 11,491,387
Skamania Co.Skamania 609,441 117,778 - - 131,330 2,003 24,167.80 301,788 77,961 74,180 Mount Pleasant 557,367 76,712 - - 39,850 2,642 0.00 247,584 3,634 67,951 Mill A 1,275,875 54,678 - - 29,785 33,732 17,052.22 477,318 71,327 89,212 Stevenson-Carson 7,447,070 1,464,547 348,862 - 763,813 22,994 126,271.37 2,047,449 580,676 705,523 County Total 9,889,753 1,713,715 348,862 - 964,778 61,371 167,491.39 3,074,139 733,598 936,865
Snohomish Co.Everett 182,878,860 48,423,094 15,395,676 - 18,349,061 2,385,893 4,657,831.96 33,871,951 5,690,161 12,719,845 Lake Stevens 74,018,522 20,081,044 4,741,121 - 3,668,487 973,774 1,978,384.28 16,261,179 2,108,917 7,244,623 Mukilteo 146,449,519 38,951,934 5,949,917 4,781,463 19,588,641 2,185,151 1,089,436.56 27,784,925 5,129,016 9,220,183 Edmonds 182,937,158 51,931,017 9,422,295 - 15,677,332 10,598,723 2,947,363.40 33,739,942 4,380,571 15,319,333 Arlington 48,232,032 12,395,150 3,352,319 - 2,446,472 417,756 1,407,652.62 8,611,263 1,540,625 3,538,764 Marysville 91,943,259 26,112,550 5,742,755 - 10,746,387 2,948,437 2,386,664.68 22,177,896 5,380,862 8,660,520 Index 463,694 70,855 - - 22,081 8,791 5,006.60 355,864 17,297 112,970 Monroe 53,296,464 12,252,323 4,730,229 - 3,695,286 461,675 1,095,373.51 12,418,256 907,559 4,349,787 Snohomish 87,302,003 21,967,944 4,585,184 - 3,174,427 543,626 3,530,027.85 18,414,610 1,607,841 5,999,676 Lakewood 20,058,777 5,557,555 1,094,223 - 1,205,085 279,663 540,706.39 5,235,081 488,457 1,930,153 Sultan 16,095,250 5,238,557 953,724 - 1,881,968 63,715 498,937.29 4,354,935 539,690 1,462,690 Darrington 3,322,267 735,296 203,710 - 475,544 247,756 74,692.07 1,395,123 132,853 286,559 Granite Falls 15,696,611 6,358,556 1,409,383 - 1,359,603 746,387 309.89 4,430,515 788,227 1,473,574 Stanwood-Camano 38,124,673 11,837,871 3,788,360 - 1,881,561 447,887 622,975.66 8,369,642 1,344,619 3,427,531 County Total 960,819,087 261,913,747 61,368,895 4,781,463 84,171,936 22,309,232 20,835,362.76 197,421,182 30,056,696 75,746,208
Spokane Co.Spokane 234,636,127 64,560,846 11,500,341 3,495,304 38,397,318 2,598,935 10,751,135.50 43,177,732 10,633,290 12,534,425 Orchard Prairie 628,204 134,329 - - 67,635 - 0.00 255,977 1,445 30,296 Great Northern 400,775 97,342 - - 73,053 - 0.00 172,848 - 194,253 Nine Mile Falls 10,538,946 2,218,042 780,149 - 907,567 64,282 222,866.01 2,895,662 416,094 968,834 Medical Lake 13,411,220 3,552,020 1,138,569 - 936,581 447,050 272,863.14 4,100,747 733,851 1,167,047 Mead 80,313,490 19,169,917 6,005,011 - 5,247,498 293,500 1,069,481.32 16,727,304 2,466,586 5,456,575 Central Valley 108,903,560 31,238,521 4,431,577 639,457 9,465,558 492,725 4,775,713.43 20,874,218 4,693,804 5,827,087 Freeman 6,334,318 1,193,215 874,366 - 260,056 97,653 54,959.46 1,957,085 410,277 719,703 Cheney 35,038,003 12,310,370 2,393,767 - 4,244,068 576,567 628,612.66 9,480,796 1,728,696 3,088,088 East Valley (Spokane) 29,955,871 8,457,277 2,853,056 - 3,849,886 308,066 1,527,217.10 8,110,256 1,590,015 2,308,263 Liberty 4,104,368 763,861 312,745 - 277,342 19,864 78,592.14 1,340,067 209,474 586,314 West Valley (Spokane) 24,753,280 5,938,045 2,478,906 - 2,975,362 275,820 829,974.09 7,316,894 1,081,828 1,552,852 Deer Park 17,466,391 3,721,559 926,629 - 1,700,357 39,964 651,726.85 4,782,937 658,315 1,370,755 Riverside 9,481,336 2,655,791 1,076,098 - 1,069,627 31,471 603,291.75 3,458,910 503,499 1,611,034 Pride Prep Charter 3,500,186 950,592 - - 294,211 - 4,560.12 2,045,444 223,432 622,215 Spokane International Academy:Charter 2,849,087 544,373 - - 319,111 140,845 4,577.42 5,696,449 249,005 260,208 County Total 582,315,162 157,506,101 34,771,214 4,134,761 70,085,230 5,386,741 21,475,570.99 132,393,327 25,599,611 38,297,948
51
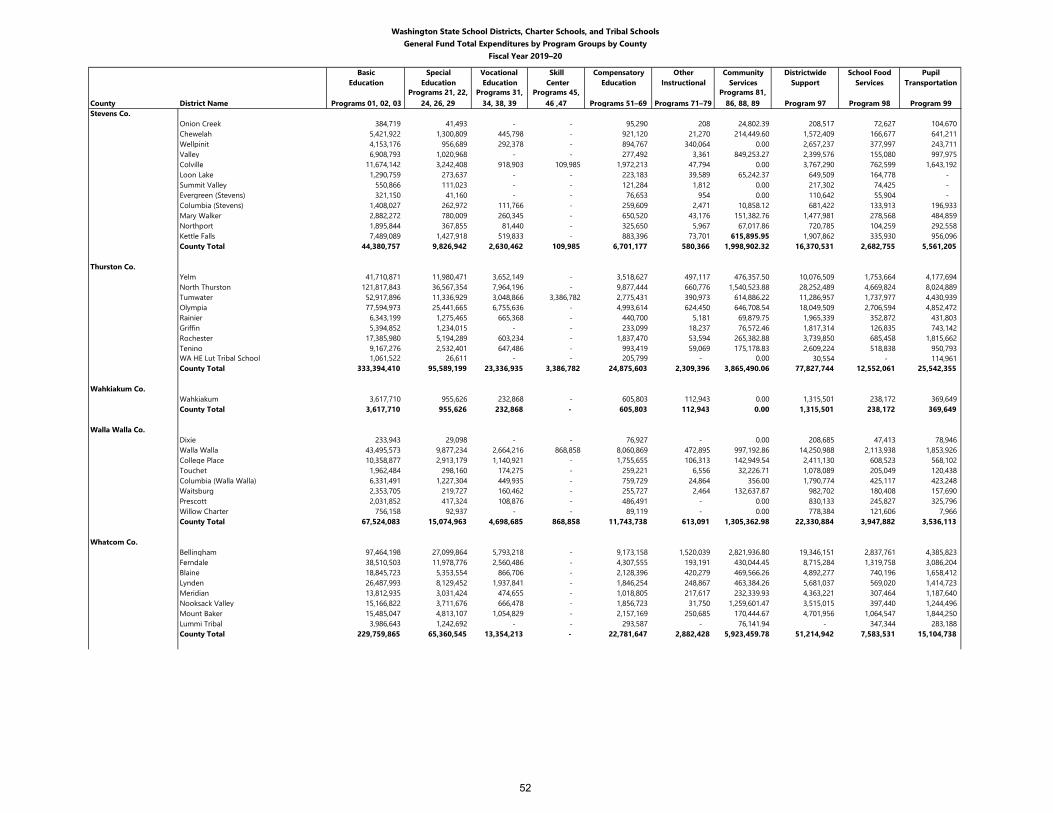
Washington State School Districts, Charter Schools, and Tribal SchoolsGeneral Fund Total Expenditures by Program Groups by County
Fiscal Year 2019–20
Basic Special Vocational Skill Compensatory Other Community Districtwide School Food PupilEducation Education Education Center Education Instructional Services Support Services Transportation
County District Name Programs 01, 02, 03Programs 21, 22,
24, 26, 29Programs 31,
34, 38, 39Programs 45,
46 ,47 Programs 51–69 Programs 71–79Programs 81,
86, 88, 89 Program 97 Program 98 Program 99Stevens Co.
Onion Creek 384,719 41,493 - - 95,290 208 24,802.39 208,517 72,627 104,670 Chewelah 5,421,922 1,300,809 445,798 - 921,120 21,270 214,449.60 1,572,409 166,677 641,211 Wellpinit 4,153,176 956,689 292,378 - 894,767 340,064 0.00 2,657,237 377,997 243,711 Valley 6,908,793 1,020,968 - - 277,492 3,361 849,253.27 2,399,576 155,080 997,975 Colville 11,674,142 3,242,408 918,903 109,985 1,972,213 47,794 0.00 3,767,290 762,599 1,643,192 Loon Lake 1,290,759 273,637 - - 223,183 39,589 65,242.37 649,509 164,778 - Summit Valley 550,866 111,023 - - 121,284 1,812 0.00 217,302 74,425 - Evergreen (Stevens) 321,150 41,160 - - 76,653 954 0.00 110,642 55,904 - Columbia (Stevens) 1,408,027 262,972 111,766 - 259,609 2,471 10,858.12 681,422 133,913 196,933 Mary Walker 2,882,272 780,009 260,345 - 650,520 43,176 151,382.76 1,477,981 278,568 484,859 Northport 1,895,844 367,855 81,440 - 325,650 5,967 67,017.86 720,785 104,259 292,558 Kettle Falls 7,489,089 1,427,918 519,833 - 883,396 73,701 615,895.95 1,907,862 335,930 956,096 County Total 44,380,757 9,826,942 2,630,462 109,985 6,701,177 580,366 1,998,902.32 16,370,531 2,682,755 5,561,205
Thurston Co.Yelm 41,710,871 11,980,471 3,652,149 - 3,518,627 497,117 476,357.50 10,076,509 1,753,664 4,177,694 North Thurston 121,817,843 36,567,354 7,964,196 - 9,877,444 660,776 1,540,523.88 28,252,489 4,669,824 8,024,889 Tumwater 52,917,896 11,336,929 3,048,866 3,386,782 2,775,431 390,973 614,886.22 11,286,957 1,737,977 4,430,939 Olympia 77,594,973 25,441,665 6,755,636 - 4,993,614 624,450 646,708.54 18,049,509 2,706,594 4,852,472 Rainier 6,343,199 1,275,465 665,368 - 440,700 5,181 69,879.75 1,965,339 352,872 431,803 Griffin 5,394,852 1,234,015 - - 233,099 18,237 76,572.46 1,817,314 126,835 743,142 Rochester 17,385,980 5,194,289 603,234 - 1,837,470 53,594 265,382.88 3,739,850 685,458 1,815,662 Tenino 9,167,276 2,532,401 647,486 - 993,419 59,069 175,178.83 2,609,224 518,838 950,793 WA HE Lut Tribal School 1,061,522 26,611 - - 205,799 - 0.00 30,554 - 114,961 County Total 333,394,410 95,589,199 23,336,935 3,386,782 24,875,603 2,309,396 3,865,490.06 77,827,744 12,552,061 25,542,355
Wahkiakum Co.Wahkiakum 3,617,710 955,626 232,868 - 605,803 112,943 0.00 1,315,501 238,172 369,649 County Total 3,617,710 955,626 232,868 - 605,803 112,943 0.00 1,315,501 238,172 369,649
Walla Walla Co.Dixie 233,943 29,098 - - 76,927 - 0.00 208,685 47,413 78,946 Walla Walla 43,495,573 9,877,234 2,664,216 868,858 8,060,869 472,895 997,192.86 14,250,988 2,113,938 1,853,926 College Place 10,358,877 2,913,179 1,140,921 - 1,755,655 106,313 142,949.54 2,411,130 608,523 568,102 Touchet 1,962,484 298,160 174,275 - 259,221 6,556 32,226.71 1,078,089 205,049 120,438 Columbia (Walla Walla) 6,331,491 1,227,304 449,935 - 759,729 24,864 356.00 1,790,774 425,117 423,248 Waitsburg 2,353,705 219,727 160,462 - 255,727 2,464 132,637.87 982,702 180,408 157,690 Prescott 2,031,852 417,324 108,876 - 486,491 - 0.00 830,133 245,827 325,796 Willow Charter 756,158 92,937 - - 89,119 - 0.00 778,384 121,606 7,966 County Total 67,524,083 15,074,963 4,698,685 868,858 11,743,738 613,091 1,305,362.98 22,330,884 3,947,882 3,536,113
Whatcom Co.Bellingham 97,464,198 27,099,864 5,793,218 - 9,173,158 1,520,039 2,821,936.80 19,346,151 2,837,761 4,385,823 Ferndale 38,510,503 11,978,776 2,560,486 - 4,307,555 193,191 430,044.45 8,715,284 1,319,758 3,086,204 Blaine 18,845,723 5,353,554 866,706 - 2,128,396 420,279 469,566.26 4,892,277 740,196 1,658,412 Lynden 26,487,993 8,129,452 1,937,841 - 1,846,254 248,867 463,384.26 5,681,037 569,020 1,414,723 Meridian 13,812,935 3,031,424 474,655 - 1,018,805 217,617 232,339.93 4,363,221 307,464 1,187,640 Nooksack Valley 15,166,822 3,711,676 666,478 - 1,856,723 31,750 1,259,601.47 3,515,015 397,440 1,244,496 Mount Baker 15,485,047 4,813,107 1,054,829 - 2,157,169 250,685 170,444.67 4,701,956 1,064,547 1,844,250 Lummi Tribal 3,986,643 1,242,692 - - 293,587 - 76,141.94 - 347,344 283,188 County Total 229,759,865 65,360,545 13,354,213 - 22,781,647 2,882,428 5,923,459.78 51,214,942 7,583,531 15,104,738
52
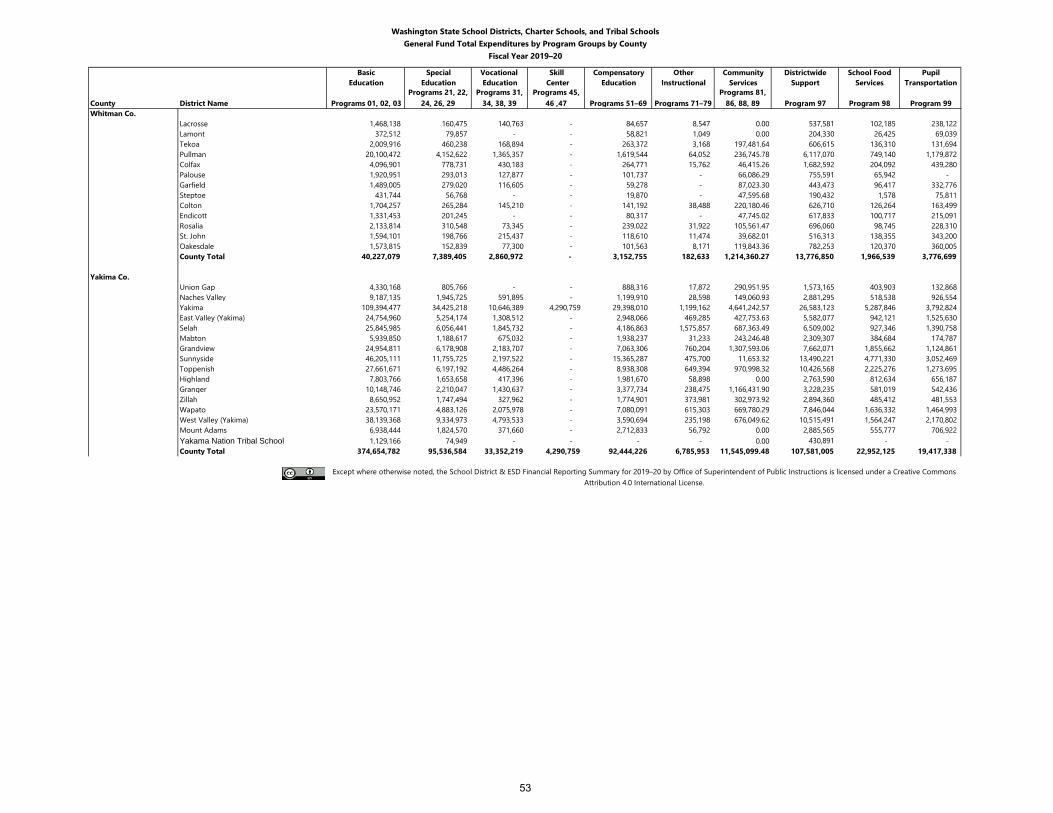
Washington State School Districts, Charter Schools, and Tribal SchoolsGeneral Fund Total Expenditures by Program Groups by County
Fiscal Year 2019–20
Basic Special Vocational Skill Compensatory Other Community Districtwide School Food PupilEducation Education Education Center Education Instructional Services Support Services Transportation
County District Name Programs 01, 02, 03Programs 21, 22,
24, 26, 29Programs 31,
34, 38, 39Programs 45,
46 ,47 Programs 51–69 Programs 71–79Programs 81,
86, 88, 89 Program 97 Program 98 Program 99Whitman Co.
Lacrosse 1,468,138 160,475 140,763 - 84,657 8,547 0.00 537,581 102,185 238,122 Lamont 372,512 79,857 - - 58,821 1,049 0.00 204,330 26,425 69,039 Tekoa 2,009,916 460,238 168,894 - 263,372 3,168 197,481.64 606,615 136,310 131,694 Pullman 20,100,472 4,152,622 1,365,357 - 1,619,544 64,052 236,745.78 6,117,070 749,140 1,179,872 Colfax 4,096,901 778,731 430,183 - 264,771 15,762 46,415.26 1,682,592 204,092 439,280 Palouse 1,920,951 293,013 127,877 - 101,737 - 66,086.29 755,591 65,942 - Garfield 1,489,005 279,020 116,605 - 59,278 - 87,023.30 443,473 96,417 332,776 Steptoe 431,744 56,768 - - 19,870 - 47,595.68 190,432 1,578 75,811 Colton 1,704,257 265,284 145,210 - 141,192 38,488 220,180.46 626,710 126,264 163,499 Endicott 1,331,453 201,245 - - 80,317 - 47,745.02 617,833 100,717 215,091 Rosalia 2,133,814 310,548 73,345 - 239,022 31,922 105,561.47 696,060 98,745 228,310 St. John 1,594,101 198,766 215,437 - 118,610 11,474 39,682.01 516,313 138,355 343,200 Oakesdale 1,573,815 152,839 77,300 - 101,563 8,171 119,843.36 782,253 120,370 360,005 County Total 40,227,079 7,389,405 2,860,972 - 3,152,755 182,633 1,214,360.27 13,776,850 1,966,539 3,776,699
Yakima Co.Union Gap 4,330,168 805,766 - - 888,316 17,872 290,951.95 1,573,165 403,903 132,868 Naches Valley 9,187,135 1,945,725 591,895 - 1,199,910 28,598 149,060.93 2,881,295 518,538 926,554 Yakima 109,394,477 34,425,218 10,646,389 4,290,759 29,398,010 1,199,162 4,641,242.57 26,583,123 5,287,846 3,792,824 East Valley (Yakima) 24,754,960 5,254,174 1,308,512 - 2,948,066 469,285 427,753.63 5,582,077 942,121 1,525,630 Selah 25,845,985 6,056,441 1,845,732 - 4,186,863 1,575,857 687,363.49 6,509,002 927,346 1,390,758 Mabton 5,939,850 1,188,617 675,032 - 1,938,237 31,233 243,246.48 2,309,307 384,684 174,787 Grandview 24,954,811 6,178,908 2,183,707 - 7,063,306 760,204 1,307,593.06 7,662,071 1,855,662 1,124,861 Sunnyside 46,205,111 11,755,725 2,197,522 - 15,365,287 475,700 11,653.32 13,490,221 4,771,330 3,052,469 Toppenish 27,661,671 6,197,192 4,486,264 - 8,938,308 649,394 970,998.32 10,426,568 2,225,276 1,273,695 Highland 7,803,766 1,653,658 417,396 - 1,981,670 58,898 0.00 2,763,590 812,634 656,187 Granger 10,148,746 2,210,047 1,430,637 - 3,377,734 238,475 1,166,431.90 3,228,235 581,019 542,436 Zillah 8,650,952 1,747,494 327,962 - 1,774,901 373,981 302,973.92 2,894,360 485,412 481,553 Wapato 23,570,171 4,883,126 2,075,978 - 7,080,091 615,303 669,780.29 7,846,044 1,636,332 1,464,993 West Valley (Yakima) 38,139,368 9,334,973 4,793,533 - 3,590,694 235,198 676,049.62 10,515,491 1,564,247 2,170,802 Mount Adams 6,938,444 1,824,570 371,660 - 2,712,833 56,792 0.00 2,885,565 555,777 706,922 Yakama Nation Tribal School 1,129,166 74,949 - - - - 0.00 430,891 - - County Total 374,654,782 95,536,584 33,352,219 4,290,759 92,444,226 6,785,953 11,545,099.48 107,581,005 22,952,125 19,417,338
Except where otherwise noted, the School District & ESD Financial Reporting Summary for 2019–20 by Office of Superintendent of Public Instructions is licensed under a Creative Commons Attribution 4.0 International License.
53
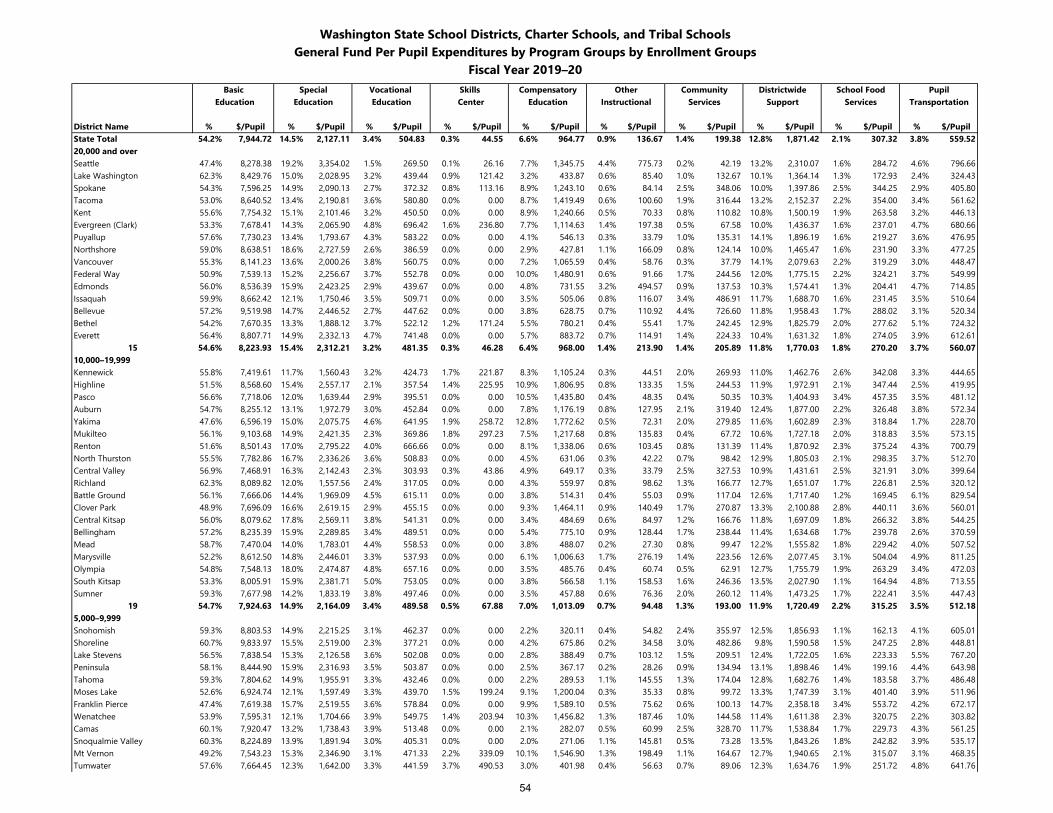
Washington State School Districts, Charter Schools, and Tribal SchoolsGeneral Fund Per Pupil Expenditures by Program Groups by Enrollment Groups
Fiscal Year 2019–20Basic Special Vocational Skills Compensatory Other Community Districtwide School Food Pupil
Education Education Education Center Education Instructional Services Support Services Transportation
District Name % $/Pupil % $/Pupil % $/Pupil % $/Pupil % $/Pupil % $/Pupil % $/Pupil % $/Pupil % $/Pupil % $/PupilState Total 54.2% 7,944.72 14.5% 2,127.11 3.4% 504.83 0.3% 44.55 6.6% 964.77 0.9% 136.67 1.4% 199.38 12.8% 1,871.42 2.1% 307.32 3.8% 559.5220,000 and overSeattle 47.4% 8,278.38 19.2% 3,354.02 1.5% 269.50 0.1% 26.16 7.7% 1,345.75 4.4% 775.73 0.2% 42.19 13.2% 2,310.07 1.6% 284.72 4.6% 796.66Lake Washington 62.3% 8,429.76 15.0% 2,028.95 3.2% 439.44 0.9% 121.42 3.2% 433.87 0.6% 85.40 1.0% 132.67 10.1% 1,364.14 1.3% 172.93 2.4% 324.43Spokane 54.3% 7,596.25 14.9% 2,090.13 2.7% 372.32 0.8% 113.16 8.9% 1,243.10 0.6% 84.14 2.5% 348.06 10.0% 1,397.86 2.5% 344.25 2.9% 405.80Tacoma 53.0% 8,640.52 13.4% 2,190.81 3.6% 580.80 0.0% 0.00 8.7% 1,419.49 0.6% 100.60 1.9% 316.44 13.2% 2,152.37 2.2% 354.00 3.4% 561.62Kent 55.6% 7,754.32 15.1% 2,101.46 3.2% 450.50 0.0% 0.00 8.9% 1,240.66 0.5% 70.33 0.8% 110.82 10.8% 1,500.19 1.9% 263.58 3.2% 446.13Evergreen (Clark) 53.3% 7,678.41 14.3% 2,065.90 4.8% 696.42 1.6% 236.80 7.7% 1,114.63 1.4% 197.38 0.5% 67.58 10.0% 1,436.37 1.6% 237.01 4.7% 680.66Puyallup 57.6% 7,730.23 13.4% 1,793.67 4.3% 583.22 0.0% 0.00 4.1% 546.13 0.3% 33.79 1.0% 135.31 14.1% 1,896.19 1.6% 219.27 3.6% 476.95Northshore 59.0% 8,638.51 18.6% 2,727.59 2.6% 386.59 0.0% 0.00 2.9% 427.81 1.1% 166.09 0.8% 124.14 10.0% 1,465.47 1.6% 231.90 3.3% 477.25Vancouver 55.3% 8,141.23 13.6% 2,000.26 3.8% 560.75 0.0% 0.00 7.2% 1,065.59 0.4% 58.76 0.3% 37.79 14.1% 2,079.63 2.2% 319.29 3.0% 448.47Federal Way 50.9% 7,539.13 15.2% 2,256.67 3.7% 552.78 0.0% 0.00 10.0% 1,480.91 0.6% 91.66 1.7% 244.56 12.0% 1,775.15 2.2% 324.21 3.7% 549.99Edmonds 56.0% 8,536.39 15.9% 2,423.25 2.9% 439.67 0.0% 0.00 4.8% 731.55 3.2% 494.57 0.9% 137.53 10.3% 1,574.41 1.3% 204.41 4.7% 714.85Issaquah 59.9% 8,662.42 12.1% 1,750.46 3.5% 509.71 0.0% 0.00 3.5% 505.06 0.8% 116.07 3.4% 486.91 11.7% 1,688.70 1.6% 231.45 3.5% 510.64Bellevue 57.2% 9,519.98 14.7% 2,446.52 2.7% 447.62 0.0% 0.00 3.8% 628.75 0.7% 110.92 4.4% 726.60 11.8% 1,958.43 1.7% 288.02 3.1% 520.34Bethel 54.2% 7,670.35 13.3% 1,888.12 3.7% 522.12 1.2% 171.24 5.5% 780.21 0.4% 55.41 1.7% 242.45 12.9% 1,825.79 2.0% 277.62 5.1% 724.32Everett 56.4% 8,807.71 14.9% 2,332.13 4.7% 741.48 0.0% 0.00 5.7% 883.72 0.7% 114.91 1.4% 224.33 10.4% 1,631.32 1.8% 274.05 3.9% 612.61
15 54.6% 8,223.93 15.4% 2,312.21 3.2% 481.35 0.3% 46.28 6.4% 968.00 1.4% 213.90 1.4% 205.89 11.8% 1,770.03 1.8% 270.20 3.7% 560.0710,000–19,999Kennewick 55.8% 7,419.61 11.7% 1,560.43 3.2% 424.73 1.7% 221.87 8.3% 1,105.24 0.3% 44.51 2.0% 269.93 11.0% 1,462.76 2.6% 342.08 3.3% 444.65Highline 51.5% 8,568.60 15.4% 2,557.17 2.1% 357.54 1.4% 225.95 10.9% 1,806.95 0.8% 133.35 1.5% 244.53 11.9% 1,972.91 2.1% 347.44 2.5% 419.95Pasco 56.6% 7,718.06 12.0% 1,639.44 2.9% 395.51 0.0% 0.00 10.5% 1,435.80 0.4% 48.35 0.4% 50.35 10.3% 1,404.93 3.4% 457.35 3.5% 481.12Auburn 54.7% 8,255.12 13.1% 1,972.79 3.0% 452.84 0.0% 0.00 7.8% 1,176.19 0.8% 127.95 2.1% 319.40 12.4% 1,877.00 2.2% 326.48 3.8% 572.34Yakima 47.6% 6,596.19 15.0% 2,075.75 4.6% 641.95 1.9% 258.72 12.8% 1,772.62 0.5% 72.31 2.0% 279.85 11.6% 1,602.89 2.3% 318.84 1.7% 228.70Mukilteo 56.1% 9,103.68 14.9% 2,421.35 2.3% 369.86 1.8% 297.23 7.5% 1,217.68 0.8% 135.83 0.4% 67.72 10.6% 1,727.18 2.0% 318.83 3.5% 573.15Renton 51.6% 8,501.43 17.0% 2,795.22 4.0% 666.66 0.0% 0.00 8.1% 1,338.06 0.6% 103.45 0.8% 131.39 11.4% 1,870.92 2.3% 375.24 4.3% 700.79North Thurston 55.5% 7,782.86 16.7% 2,336.26 3.6% 508.83 0.0% 0.00 4.5% 631.06 0.3% 42.22 0.7% 98.42 12.9% 1,805.03 2.1% 298.35 3.7% 512.70Central Valley 56.9% 7,468.91 16.3% 2,142.43 2.3% 303.93 0.3% 43.86 4.9% 649.17 0.3% 33.79 2.5% 327.53 10.9% 1,431.61 2.5% 321.91 3.0% 399.64Richland 62.3% 8,089.82 12.0% 1,557.56 2.4% 317.05 0.0% 0.00 4.3% 559.97 0.8% 98.62 1.3% 166.77 12.7% 1,651.07 1.7% 226.81 2.5% 320.12Battle Ground 56.1% 7,666.06 14.4% 1,969.09 4.5% 615.11 0.0% 0.00 3.8% 514.31 0.4% 55.03 0.9% 117.04 12.6% 1,717.40 1.2% 169.45 6.1% 829.54Clover Park 48.9% 7,696.09 16.6% 2,619.15 2.9% 455.15 0.0% 0.00 9.3% 1,464.11 0.9% 140.49 1.7% 270.87 13.3% 2,100.88 2.8% 440.11 3.6% 560.01Central Kitsap 56.0% 8,079.62 17.8% 2,569.11 3.8% 541.31 0.0% 0.00 3.4% 484.69 0.6% 84.97 1.2% 166.76 11.8% 1,697.09 1.8% 266.32 3.8% 544.25Bellingham 57.2% 8,235.39 15.9% 2,289.85 3.4% 489.51 0.0% 0.00 5.4% 775.10 0.9% 128.44 1.7% 238.44 11.4% 1,634.68 1.7% 239.78 2.6% 370.59Mead 58.7% 7,470.04 14.0% 1,783.01 4.4% 558.53 0.0% 0.00 3.8% 488.07 0.2% 27.30 0.8% 99.47 12.2% 1,555.82 1.8% 229.42 4.0% 507.52Marysville 52.2% 8,612.50 14.8% 2,446.01 3.3% 537.93 0.0% 0.00 6.1% 1,006.63 1.7% 276.19 1.4% 223.56 12.6% 2,077.45 3.1% 504.04 4.9% 811.25Olympia 54.8% 7,548.13 18.0% 2,474.87 4.8% 657.16 0.0% 0.00 3.5% 485.76 0.4% 60.74 0.5% 62.91 12.7% 1,755.79 1.9% 263.29 3.4% 472.03South Kitsap 53.3% 8,005.91 15.9% 2,381.71 5.0% 753.05 0.0% 0.00 3.8% 566.58 1.1% 158.53 1.6% 246.36 13.5% 2,027.90 1.1% 164.94 4.8% 713.55Sumner 59.3% 7,677.98 14.2% 1,833.19 3.8% 497.46 0.0% 0.00 3.5% 457.88 0.6% 76.36 2.0% 260.12 11.4% 1,473.25 1.7% 222.41 3.5% 447.43
19 54.7% 7,924.63 14.9% 2,164.09 3.4% 489.58 0.5% 67.88 7.0% 1,013.09 0.7% 94.48 1.3% 193.00 11.9% 1,720.49 2.2% 315.25 3.5% 512.185,000–9,999Snohomish 59.3% 8,803.53 14.9% 2,215.25 3.1% 462.37 0.0% 0.00 2.2% 320.11 0.4% 54.82 2.4% 355.97 12.5% 1,856.93 1.1% 162.13 4.1% 605.01Shoreline 60.7% 9,833.97 15.5% 2,519.00 2.3% 377.21 0.0% 0.00 4.2% 675.86 0.2% 34.58 3.0% 482.86 9.8% 1,590.58 1.5% 247.25 2.8% 448.81Lake Stevens 56.5% 7,838.54 15.3% 2,126.58 3.6% 502.08 0.0% 0.00 2.8% 388.49 0.7% 103.12 1.5% 209.51 12.4% 1,722.05 1.6% 223.33 5.5% 767.20Peninsula 58.1% 8,444.90 15.9% 2,316.93 3.5% 503.87 0.0% 0.00 2.5% 367.17 0.2% 28.26 0.9% 134.94 13.1% 1,898.46 1.4% 199.16 4.4% 643.98Tahoma 59.3% 7,804.62 14.9% 1,955.91 3.3% 432.46 0.0% 0.00 2.2% 289.53 1.1% 145.55 1.3% 174.04 12.8% 1,682.76 1.4% 183.58 3.7% 486.48Moses Lake 52.6% 6,924.74 12.1% 1,597.49 3.3% 439.70 1.5% 199.24 9.1% 1,200.04 0.3% 35.33 0.8% 99.72 13.3% 1,747.39 3.1% 401.40 3.9% 511.96Franklin Pierce 47.4% 7,619.38 15.7% 2,519.55 3.6% 578.84 0.0% 0.00 9.9% 1,589.10 0.5% 75.62 0.6% 100.13 14.7% 2,358.18 3.4% 553.72 4.2% 672.17Wenatchee 53.9% 7,595.31 12.1% 1,704.66 3.9% 549.75 1.4% 203.94 10.3% 1,456.82 1.3% 187.46 1.0% 144.58 11.4% 1,611.38 2.3% 320.75 2.2% 303.82Camas 60.1% 7,920.47 13.2% 1,738.43 3.9% 513.48 0.0% 0.00 2.1% 282.07 0.5% 60.99 2.5% 328.70 11.7% 1,538.84 1.7% 229.73 4.3% 561.25Snoqualmie Valley 60.3% 8,224.89 13.9% 1,891.94 3.0% 405.31 0.0% 0.00 2.0% 271.06 1.1% 145.81 0.5% 73.28 13.5% 1,843.26 1.8% 242.82 3.9% 535.17Mt Vernon 49.2% 7,543.23 15.3% 2,346.90 3.1% 471.33 2.2% 339.09 10.1% 1,546.90 1.3% 198.49 1.1% 164.67 12.7% 1,940.65 2.1% 315.07 3.1% 468.35Tumwater 57.6% 7,664.45 12.3% 1,642.00 3.3% 441.59 3.7% 490.53 3.0% 401.98 0.4% 56.63 0.7% 89.06 12.3% 1,634.76 1.9% 251.72 4.8% 641.76
54
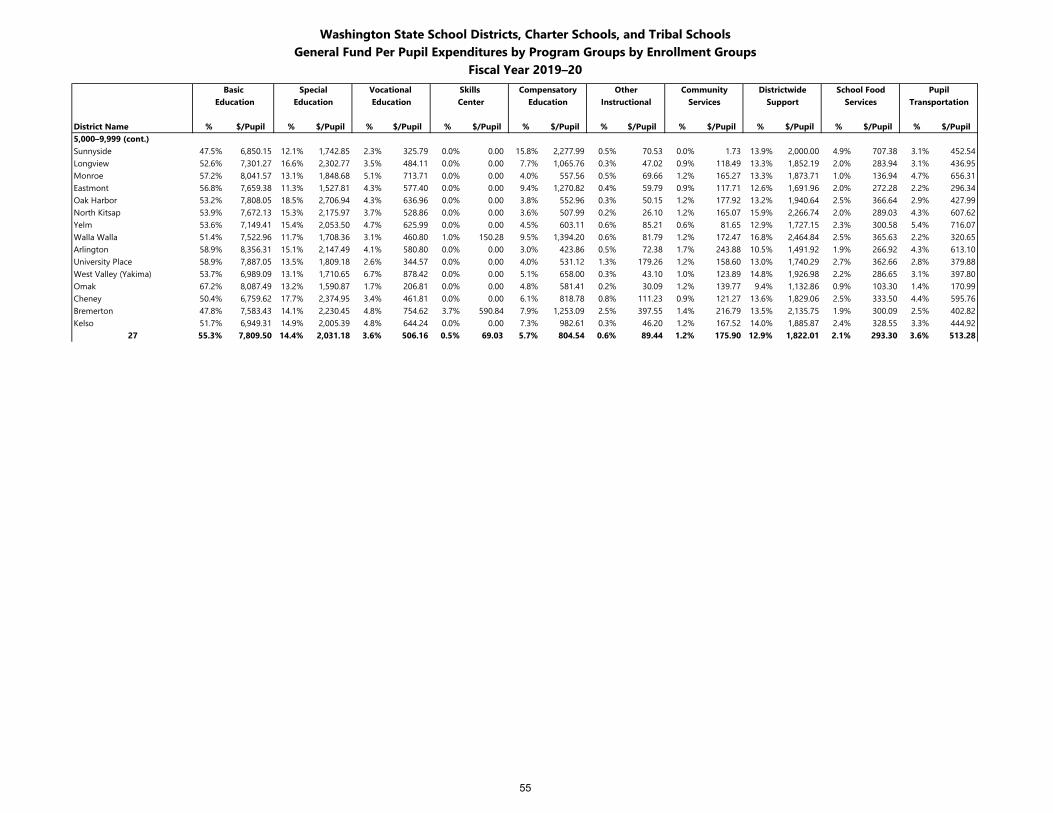
Washington State School Districts, Charter Schools, and Tribal SchoolsGeneral Fund Per Pupil Expenditures by Program Groups by Enrollment Groups
Fiscal Year 2019–20Basic Special Vocational Skills Compensatory Other Community Districtwide School Food Pupil
Education Education Education Center Education Instructional Services Support Services Transportation
District Name % $/Pupil % $/Pupil % $/Pupil % $/Pupil % $/Pupil % $/Pupil % $/Pupil % $/Pupil % $/Pupil % $/Pupil5,000–9,999 (cont.)Sunnyside 47.5% 6,850.15 12.1% 1,742.85 2.3% 325.79 0.0% 0.00 15.8% 2,277.99 0.5% 70.53 0.0% 1.73 13.9% 2,000.00 4.9% 707.38 3.1% 452.54Longview 52.6% 7,301.27 16.6% 2,302.77 3.5% 484.11 0.0% 0.00 7.7% 1,065.76 0.3% 47.02 0.9% 118.49 13.3% 1,852.19 2.0% 283.94 3.1% 436.95Monroe 57.2% 8,041.57 13.1% 1,848.68 5.1% 713.71 0.0% 0.00 4.0% 557.56 0.5% 69.66 1.2% 165.27 13.3% 1,873.71 1.0% 136.94 4.7% 656.31Eastmont 56.8% 7,659.38 11.3% 1,527.81 4.3% 577.40 0.0% 0.00 9.4% 1,270.82 0.4% 59.79 0.9% 117.71 12.6% 1,691.96 2.0% 272.28 2.2% 296.34Oak Harbor 53.2% 7,808.05 18.5% 2,706.94 4.3% 636.96 0.0% 0.00 3.8% 552.96 0.3% 50.15 1.2% 177.92 13.2% 1,940.64 2.5% 366.64 2.9% 427.99North Kitsap 53.9% 7,672.13 15.3% 2,175.97 3.7% 528.86 0.0% 0.00 3.6% 507.99 0.2% 26.10 1.2% 165.07 15.9% 2,266.74 2.0% 289.03 4.3% 607.62Yelm 53.6% 7,149.41 15.4% 2,053.50 4.7% 625.99 0.0% 0.00 4.5% 603.11 0.6% 85.21 0.6% 81.65 12.9% 1,727.15 2.3% 300.58 5.4% 716.07Walla Walla 51.4% 7,522.96 11.7% 1,708.36 3.1% 460.80 1.0% 150.28 9.5% 1,394.20 0.6% 81.79 1.2% 172.47 16.8% 2,464.84 2.5% 365.63 2.2% 320.65Arlington 58.9% 8,356.31 15.1% 2,147.49 4.1% 580.80 0.0% 0.00 3.0% 423.86 0.5% 72.38 1.7% 243.88 10.5% 1,491.92 1.9% 266.92 4.3% 613.10University Place 58.9% 7,887.05 13.5% 1,809.18 2.6% 344.57 0.0% 0.00 4.0% 531.12 1.3% 179.26 1.2% 158.60 13.0% 1,740.29 2.7% 362.66 2.8% 379.88West Valley (Yakima) 53.7% 6,989.09 13.1% 1,710.65 6.7% 878.42 0.0% 0.00 5.1% 658.00 0.3% 43.10 1.0% 123.89 14.8% 1,926.98 2.2% 286.65 3.1% 397.80Omak 67.2% 8,087.49 13.2% 1,590.87 1.7% 206.81 0.0% 0.00 4.8% 581.41 0.2% 30.09 1.2% 139.77 9.4% 1,132.86 0.9% 103.30 1.4% 170.99Cheney 50.4% 6,759.62 17.7% 2,374.95 3.4% 461.81 0.0% 0.00 6.1% 818.78 0.8% 111.23 0.9% 121.27 13.6% 1,829.06 2.5% 333.50 4.4% 595.76Bremerton 47.8% 7,583.43 14.1% 2,230.45 4.8% 754.62 3.7% 590.84 7.9% 1,253.09 2.5% 397.55 1.4% 216.79 13.5% 2,135.75 1.9% 300.09 2.5% 402.82Kelso 51.7% 6,949.31 14.9% 2,005.39 4.8% 644.24 0.0% 0.00 7.3% 982.61 0.3% 46.20 1.2% 167.52 14.0% 1,885.87 2.4% 328.55 3.3% 444.92
27 55.3% 7,809.50 14.4% 2,031.18 3.6% 506.16 0.5% 69.03 5.7% 804.54 0.6% 89.44 1.2% 175.90 12.9% 1,822.01 2.1% 293.30 3.6% 513.28
55
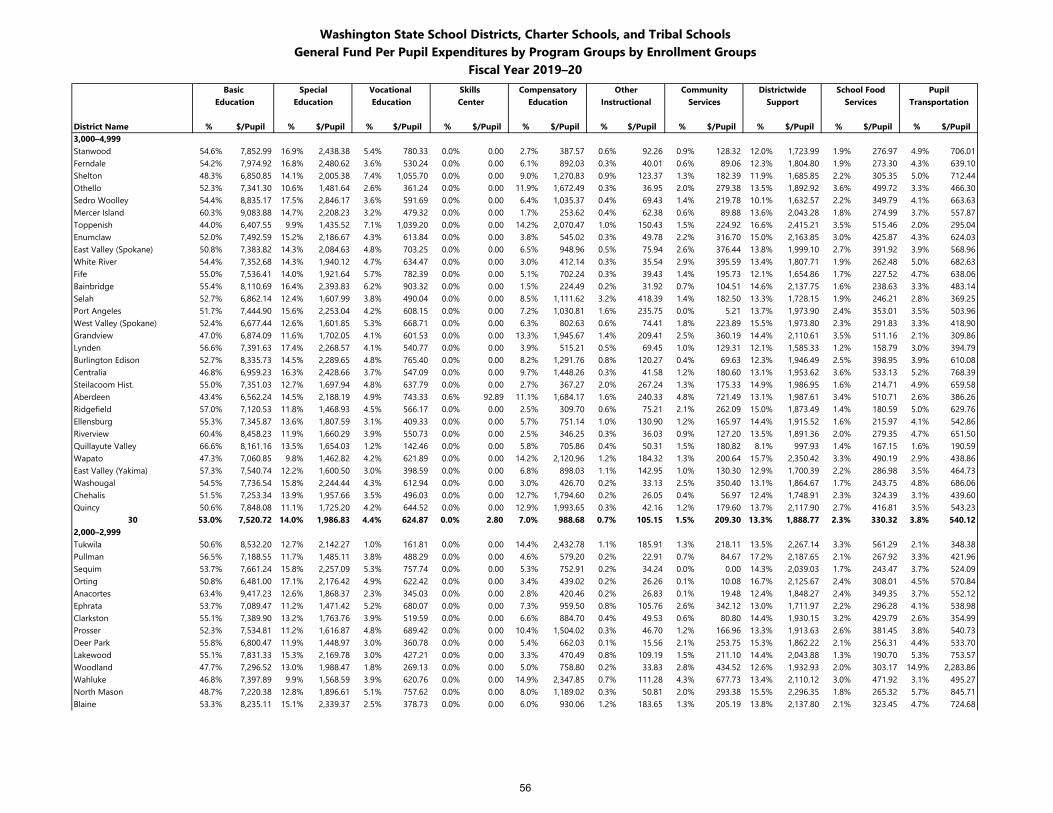
Washington State School Districts, Charter Schools, and Tribal SchoolsGeneral Fund Per Pupil Expenditures by Program Groups by Enrollment Groups
Fiscal Year 2019–20Basic Special Vocational Skills Compensatory Other Community Districtwide School Food Pupil
Education Education Education Center Education Instructional Services Support Services Transportation
District Name % $/Pupil % $/Pupil % $/Pupil % $/Pupil % $/Pupil % $/Pupil % $/Pupil % $/Pupil % $/Pupil % $/Pupil3,000–4,999Stanwood 54.6% 7,852.99 16.9% 2,438.38 5.4% 780.33 0.0% 0.00 2.7% 387.57 0.6% 92.26 0.9% 128.32 12.0% 1,723.99 1.9% 276.97 4.9% 706.01Ferndale 54.2% 7,974.92 16.8% 2,480.62 3.6% 530.24 0.0% 0.00 6.1% 892.03 0.3% 40.01 0.6% 89.06 12.3% 1,804.80 1.9% 273.30 4.3% 639.10Shelton 48.3% 6,850.85 14.1% 2,005.38 7.4% 1,055.70 0.0% 0.00 9.0% 1,270.83 0.9% 123.37 1.3% 182.39 11.9% 1,685.85 2.2% 305.35 5.0% 712.44Othello 52.3% 7,341.30 10.6% 1,481.64 2.6% 361.24 0.0% 0.00 11.9% 1,672.49 0.3% 36.95 2.0% 279.38 13.5% 1,892.92 3.6% 499.72 3.3% 466.30Sedro Woolley 54.4% 8,835.17 17.5% 2,846.17 3.6% 591.69 0.0% 0.00 6.4% 1,035.37 0.4% 69.43 1.4% 219.78 10.1% 1,632.57 2.2% 349.79 4.1% 663.63Mercer Island 60.3% 9,083.88 14.7% 2,208.23 3.2% 479.32 0.0% 0.00 1.7% 253.62 0.4% 62.38 0.6% 89.88 13.6% 2,043.28 1.8% 274.99 3.7% 557.87Toppenish 44.0% 6,407.55 9.9% 1,435.52 7.1% 1,039.20 0.0% 0.00 14.2% 2,070.47 1.0% 150.43 1.5% 224.92 16.6% 2,415.21 3.5% 515.46 2.0% 295.04Enumclaw 52.0% 7,492.59 15.2% 2,186.67 4.3% 613.84 0.0% 0.00 3.8% 545.02 0.3% 49.78 2.2% 316.70 15.0% 2,163.85 3.0% 425.87 4.3% 624.03East Valley (Spokane) 50.8% 7,383.82 14.3% 2,084.63 4.8% 703.25 0.0% 0.00 6.5% 948.96 0.5% 75.94 2.6% 376.44 13.8% 1,999.10 2.7% 391.92 3.9% 568.96White River 54.4% 7,352.68 14.3% 1,940.12 4.7% 634.47 0.0% 0.00 3.0% 412.14 0.3% 35.54 2.9% 395.59 13.4% 1,807.71 1.9% 262.48 5.0% 682.63Fife 55.0% 7,536.41 14.0% 1,921.64 5.7% 782.39 0.0% 0.00 5.1% 702.24 0.3% 39.43 1.4% 195.73 12.1% 1,654.86 1.7% 227.52 4.7% 638.06Bainbridge 55.4% 8,110.69 16.4% 2,393.83 6.2% 903.32 0.0% 0.00 1.5% 224.49 0.2% 31.92 0.7% 104.51 14.6% 2,137.75 1.6% 238.63 3.3% 483.14Selah 52.7% 6,862.14 12.4% 1,607.99 3.8% 490.04 0.0% 0.00 8.5% 1,111.62 3.2% 418.39 1.4% 182.50 13.3% 1,728.15 1.9% 246.21 2.8% 369.25Port Angeles 51.7% 7,444.90 15.6% 2,253.04 4.2% 608.15 0.0% 0.00 7.2% 1,030.81 1.6% 235.75 0.0% 5.21 13.7% 1,973.90 2.4% 353.01 3.5% 503.96West Valley (Spokane) 52.4% 6,677.44 12.6% 1,601.85 5.3% 668.71 0.0% 0.00 6.3% 802.63 0.6% 74.41 1.8% 223.89 15.5% 1,973.80 2.3% 291.83 3.3% 418.90Grandview 47.0% 6,874.09 11.6% 1,702.05 4.1% 601.53 0.0% 0.00 13.3% 1,945.67 1.4% 209.41 2.5% 360.19 14.4% 2,110.61 3.5% 511.16 2.1% 309.86Lynden 56.6% 7,391.63 17.4% 2,268.57 4.1% 540.77 0.0% 0.00 3.9% 515.21 0.5% 69.45 1.0% 129.31 12.1% 1,585.33 1.2% 158.79 3.0% 394.79Burlington Edison 52.7% 8,335.73 14.5% 2,289.65 4.8% 765.40 0.0% 0.00 8.2% 1,291.76 0.8% 120.27 0.4% 69.63 12.3% 1,946.49 2.5% 398.95 3.9% 610.08Centralia 46.8% 6,959.23 16.3% 2,428.66 3.7% 547.09 0.0% 0.00 9.7% 1,448.26 0.3% 41.58 1.2% 180.60 13.1% 1,953.62 3.6% 533.13 5.2% 768.39Steilacoom Hist. 55.0% 7,351.03 12.7% 1,697.94 4.8% 637.79 0.0% 0.00 2.7% 367.27 2.0% 267.24 1.3% 175.33 14.9% 1,986.95 1.6% 214.71 4.9% 659.58Aberdeen 43.4% 6,562.24 14.5% 2,188.19 4.9% 743.33 0.6% 92.89 11.1% 1,684.17 1.6% 240.33 4.8% 721.49 13.1% 1,987.61 3.4% 510.71 2.6% 386.26Ridgefield 57.0% 7,120.53 11.8% 1,468.93 4.5% 566.17 0.0% 0.00 2.5% 309.70 0.6% 75.21 2.1% 262.09 15.0% 1,873.49 1.4% 180.59 5.0% 629.76Ellensburg 55.3% 7,345.87 13.6% 1,807.59 3.1% 409.33 0.0% 0.00 5.7% 751.14 1.0% 130.90 1.2% 165.97 14.4% 1,915.52 1.6% 215.97 4.1% 542.86Riverview 60.4% 8,458.23 11.9% 1,660.29 3.9% 550.73 0.0% 0.00 2.5% 346.25 0.3% 36.03 0.9% 127.20 13.5% 1,891.36 2.0% 279.35 4.7% 651.50Quillayute Valley 66.6% 8,161.16 13.5% 1,654.03 1.2% 142.46 0.0% 0.00 5.8% 705.86 0.4% 50.31 1.5% 180.82 8.1% 997.93 1.4% 167.15 1.6% 190.59Wapato 47.3% 7,060.85 9.8% 1,462.82 4.2% 621.89 0.0% 0.00 14.2% 2,120.96 1.2% 184.32 1.3% 200.64 15.7% 2,350.42 3.3% 490.19 2.9% 438.86East Valley (Yakima) 57.3% 7,540.74 12.2% 1,600.50 3.0% 398.59 0.0% 0.00 6.8% 898.03 1.1% 142.95 1.0% 130.30 12.9% 1,700.39 2.2% 286.98 3.5% 464.73Washougal 54.5% 7,736.54 15.8% 2,244.44 4.3% 612.94 0.0% 0.00 3.0% 426.70 0.2% 33.13 2.5% 350.40 13.1% 1,864.67 1.7% 243.75 4.8% 686.06Chehalis 51.5% 7,253.34 13.9% 1,957.66 3.5% 496.03 0.0% 0.00 12.7% 1,794.60 0.2% 26.05 0.4% 56.97 12.4% 1,748.91 2.3% 324.39 3.1% 439.60Quincy 50.6% 7,848.08 11.1% 1,725.20 4.2% 644.52 0.0% 0.00 12.9% 1,993.65 0.3% 42.16 1.2% 179.60 13.7% 2,117.90 2.7% 416.81 3.5% 543.23
30 53.0% 7,520.72 14.0% 1,986.83 4.4% 624.87 0.0% 2.80 7.0% 988.68 0.7% 105.15 1.5% 209.30 13.3% 1,888.77 2.3% 330.32 3.8% 540.122,000–2,999Tukwila 50.6% 8,532.20 12.7% 2,142.27 1.0% 161.81 0.0% 0.00 14.4% 2,432.78 1.1% 185.91 1.3% 218.11 13.5% 2,267.14 3.3% 561.29 2.1% 348.38Pullman 56.5% 7,188.55 11.7% 1,485.11 3.8% 488.29 0.0% 0.00 4.6% 579.20 0.2% 22.91 0.7% 84.67 17.2% 2,187.65 2.1% 267.92 3.3% 421.96Sequim 53.7% 7,661.24 15.8% 2,257.09 5.3% 757.74 0.0% 0.00 5.3% 752.91 0.2% 34.24 0.0% 0.00 14.3% 2,039.03 1.7% 243.47 3.7% 524.09Orting 50.8% 6,481.00 17.1% 2,176.42 4.9% 622.42 0.0% 0.00 3.4% 439.02 0.2% 26.26 0.1% 10.08 16.7% 2,125.67 2.4% 308.01 4.5% 570.84Anacortes 63.4% 9,417.23 12.6% 1,868.37 2.3% 345.03 0.0% 0.00 2.8% 420.46 0.2% 26.83 0.1% 19.48 12.4% 1,848.27 2.4% 349.35 3.7% 552.12Ephrata 53.7% 7,089.47 11.2% 1,471.42 5.2% 680.07 0.0% 0.00 7.3% 959.50 0.8% 105.76 2.6% 342.12 13.0% 1,711.97 2.2% 296.28 4.1% 538.98Clarkston 55.1% 7,389.90 13.2% 1,763.76 3.9% 519.59 0.0% 0.00 6.6% 884.70 0.4% 49.53 0.6% 80.80 14.4% 1,930.15 3.2% 429.79 2.6% 354.99Prosser 52.3% 7,534.81 11.2% 1,616.87 4.8% 689.42 0.0% 0.00 10.4% 1,504.02 0.3% 46.70 1.2% 166.96 13.3% 1,913.63 2.6% 381.45 3.8% 540.73Deer Park 55.8% 6,800.47 11.9% 1,448.97 3.0% 360.78 0.0% 0.00 5.4% 662.03 0.1% 15.56 2.1% 253.75 15.3% 1,862.22 2.1% 256.31 4.4% 533.70Lakewood 55.1% 7,831.33 15.3% 2,169.78 3.0% 427.21 0.0% 0.00 3.3% 470.49 0.8% 109.19 1.5% 211.10 14.4% 2,043.88 1.3% 190.70 5.3% 753.57Woodland 47.7% 7,296.52 13.0% 1,988.47 1.8% 269.13 0.0% 0.00 5.0% 758.80 0.2% 33.83 2.8% 434.52 12.6% 1,932.93 2.0% 303.17 14.9% 2,283.86Wahluke 46.8% 7,397.89 9.9% 1,568.59 3.9% 620.76 0.0% 0.00 14.9% 2,347.85 0.7% 111.28 4.3% 677.73 13.4% 2,110.12 3.0% 471.92 3.1% 495.27North Mason 48.7% 7,220.38 12.8% 1,896.61 5.1% 757.62 0.0% 0.00 8.0% 1,189.02 0.3% 50.81 2.0% 293.38 15.5% 2,296.35 1.8% 265.32 5.7% 845.71Blaine 53.3% 8,235.11 15.1% 2,339.37 2.5% 378.73 0.0% 0.00 6.0% 930.06 1.2% 183.65 1.3% 205.19 13.8% 2,137.80 2.1% 323.45 4.7% 724.68
56
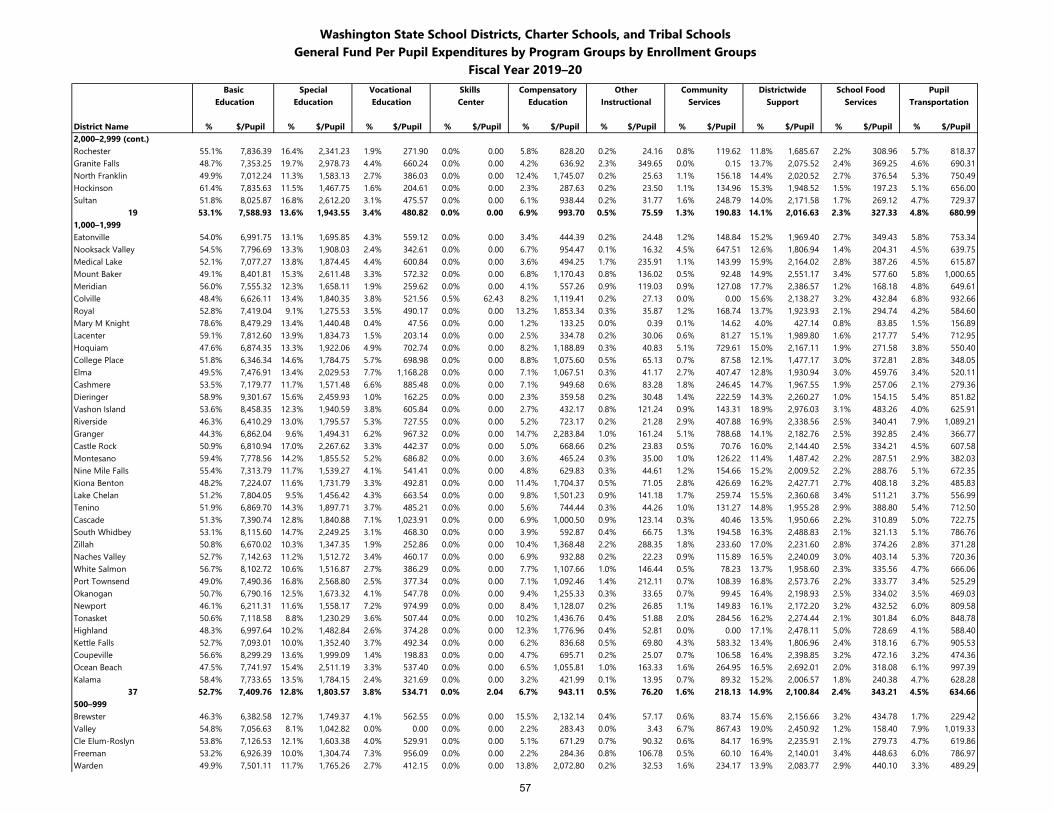
Washington State School Districts, Charter Schools, and Tribal SchoolsGeneral Fund Per Pupil Expenditures by Program Groups by Enrollment Groups
Fiscal Year 2019–20Basic Special Vocational Skills Compensatory Other Community Districtwide School Food Pupil
Education Education Education Center Education Instructional Services Support Services Transportation
District Name % $/Pupil % $/Pupil % $/Pupil % $/Pupil % $/Pupil % $/Pupil % $/Pupil % $/Pupil % $/Pupil % $/Pupil2,000–2,999 (cont.)Rochester 55.1% 7,836.39 16.4% 2,341.23 1.9% 271.90 0.0% 0.00 5.8% 828.20 0.2% 24.16 0.8% 119.62 11.8% 1,685.67 2.2% 308.96 5.7% 818.37Granite Falls 48.7% 7,353.25 19.7% 2,978.73 4.4% 660.24 0.0% 0.00 4.2% 636.92 2.3% 349.65 0.0% 0.15 13.7% 2,075.52 2.4% 369.25 4.6% 690.31North Franklin 49.9% 7,012.24 11.3% 1,583.13 2.7% 386.03 0.0% 0.00 12.4% 1,745.07 0.2% 25.63 1.1% 156.18 14.4% 2,020.52 2.7% 376.54 5.3% 750.49Hockinson 61.4% 7,835.63 11.5% 1,467.75 1.6% 204.61 0.0% 0.00 2.3% 287.63 0.2% 23.50 1.1% 134.96 15.3% 1,948.52 1.5% 197.23 5.1% 656.00Sultan 51.8% 8,025.87 16.8% 2,612.20 3.1% 475.57 0.0% 0.00 6.1% 938.44 0.2% 31.77 1.6% 248.79 14.0% 2,171.58 1.7% 269.12 4.7% 729.37
19 53.1% 7,588.93 13.6% 1,943.55 3.4% 480.82 0.0% 0.00 6.9% 993.70 0.5% 75.59 1.3% 190.83 14.1% 2,016.63 2.3% 327.33 4.8% 680.991,000–1,999Eatonville 54.0% 6,991.75 13.1% 1,695.85 4.3% 559.12 0.0% 0.00 3.4% 444.39 0.2% 24.48 1.2% 148.84 15.2% 1,969.40 2.7% 349.43 5.8% 753.34Nooksack Valley 54.5% 7,796.69 13.3% 1,908.03 2.4% 342.61 0.0% 0.00 6.7% 954.47 0.1% 16.32 4.5% 647.51 12.6% 1,806.94 1.4% 204.31 4.5% 639.75Medical Lake 52.1% 7,077.27 13.8% 1,874.45 4.4% 600.84 0.0% 0.00 3.6% 494.25 1.7% 235.91 1.1% 143.99 15.9% 2,164.02 2.8% 387.26 4.5% 615.87Mount Baker 49.1% 8,401.81 15.3% 2,611.48 3.3% 572.32 0.0% 0.00 6.8% 1,170.43 0.8% 136.02 0.5% 92.48 14.9% 2,551.17 3.4% 577.60 5.8% 1,000.65Meridian 56.0% 7,555.32 12.3% 1,658.11 1.9% 259.62 0.0% 0.00 4.1% 557.26 0.9% 119.03 0.9% 127.08 17.7% 2,386.57 1.2% 168.18 4.8% 649.61Colville 48.4% 6,626.11 13.4% 1,840.35 3.8% 521.56 0.5% 62.43 8.2% 1,119.41 0.2% 27.13 0.0% 0.00 15.6% 2,138.27 3.2% 432.84 6.8% 932.66Royal 52.8% 7,419.04 9.1% 1,275.53 3.5% 490.17 0.0% 0.00 13.2% 1,853.34 0.3% 35.87 1.2% 168.74 13.7% 1,923.93 2.1% 294.74 4.2% 584.60Mary M Knight 78.6% 8,479.29 13.4% 1,440.48 0.4% 47.56 0.0% 0.00 1.2% 133.25 0.0% 0.39 0.1% 14.62 4.0% 427.14 0.8% 83.85 1.5% 156.89Lacenter 59.1% 7,812.60 13.9% 1,834.73 1.5% 203.14 0.0% 0.00 2.5% 334.78 0.2% 30.06 0.6% 81.27 15.1% 1,989.80 1.6% 217.77 5.4% 712.95Hoquiam 47.6% 6,874.35 13.3% 1,922.06 4.9% 702.74 0.0% 0.00 8.2% 1,188.89 0.3% 40.83 5.1% 729.61 15.0% 2,167.11 1.9% 271.58 3.8% 550.40College Place 51.8% 6,346.34 14.6% 1,784.75 5.7% 698.98 0.0% 0.00 8.8% 1,075.60 0.5% 65.13 0.7% 87.58 12.1% 1,477.17 3.0% 372.81 2.8% 348.05Elma 49.5% 7,476.91 13.4% 2,029.53 7.7% 1,168.28 0.0% 0.00 7.1% 1,067.51 0.3% 41.17 2.7% 407.47 12.8% 1,930.94 3.0% 459.76 3.4% 520.11Cashmere 53.5% 7,179.77 11.7% 1,571.48 6.6% 885.48 0.0% 0.00 7.1% 949.68 0.6% 83.28 1.8% 246.45 14.7% 1,967.55 1.9% 257.06 2.1% 279.36Dieringer 58.9% 9,301.67 15.6% 2,459.93 1.0% 162.25 0.0% 0.00 2.3% 359.58 0.2% 30.48 1.4% 222.59 14.3% 2,260.27 1.0% 154.15 5.4% 851.82Vashon Island 53.6% 8,458.35 12.3% 1,940.59 3.8% 605.84 0.0% 0.00 2.7% 432.17 0.8% 121.24 0.9% 143.31 18.9% 2,976.03 3.1% 483.26 4.0% 625.91Riverside 46.3% 6,410.29 13.0% 1,795.57 5.3% 727.55 0.0% 0.00 5.2% 723.17 0.2% 21.28 2.9% 407.88 16.9% 2,338.56 2.5% 340.41 7.9% 1,089.21Granger 44.3% 6,862.04 9.6% 1,494.31 6.2% 967.32 0.0% 0.00 14.7% 2,283.84 1.0% 161.24 5.1% 788.68 14.1% 2,182.76 2.5% 392.85 2.4% 366.77Castle Rock 50.9% 6,810.94 17.0% 2,267.62 3.3% 442.37 0.0% 0.00 5.0% 668.66 0.2% 23.83 0.5% 70.76 16.0% 2,144.40 2.5% 334.21 4.5% 607.58Montesano 59.4% 7,778.56 14.2% 1,855.52 5.2% 686.82 0.0% 0.00 3.6% 465.24 0.3% 35.00 1.0% 126.22 11.4% 1,487.42 2.2% 287.51 2.9% 382.03Nine Mile Falls 55.4% 7,313.79 11.7% 1,539.27 4.1% 541.41 0.0% 0.00 4.8% 629.83 0.3% 44.61 1.2% 154.66 15.2% 2,009.52 2.2% 288.76 5.1% 672.35Kiona Benton 48.2% 7,224.07 11.6% 1,731.79 3.3% 492.81 0.0% 0.00 11.4% 1,704.37 0.5% 71.05 2.8% 426.69 16.2% 2,427.71 2.7% 408.18 3.2% 485.83Lake Chelan 51.2% 7,804.05 9.5% 1,456.42 4.3% 663.54 0.0% 0.00 9.8% 1,501.23 0.9% 141.18 1.7% 259.74 15.5% 2,360.68 3.4% 511.21 3.7% 556.99Tenino 51.9% 6,869.70 14.3% 1,897.71 3.7% 485.21 0.0% 0.00 5.6% 744.44 0.3% 44.26 1.0% 131.27 14.8% 1,955.28 2.9% 388.80 5.4% 712.50Cascade 51.3% 7,390.74 12.8% 1,840.88 7.1% 1,023.91 0.0% 0.00 6.9% 1,000.50 0.9% 123.14 0.3% 40.46 13.5% 1,950.66 2.2% 310.89 5.0% 722.75South Whidbey 53.1% 8,115.60 14.7% 2,249.25 3.1% 468.30 0.0% 0.00 3.9% 592.87 0.4% 66.75 1.3% 194.58 16.3% 2,488.83 2.1% 321.13 5.1% 786.76Zillah 50.8% 6,670.02 10.3% 1,347.35 1.9% 252.86 0.0% 0.00 10.4% 1,368.48 2.2% 288.35 1.8% 233.60 17.0% 2,231.60 2.8% 374.26 2.8% 371.28Naches Valley 52.7% 7,142.63 11.2% 1,512.72 3.4% 460.17 0.0% 0.00 6.9% 932.88 0.2% 22.23 0.9% 115.89 16.5% 2,240.09 3.0% 403.14 5.3% 720.36White Salmon 56.7% 8,102.72 10.6% 1,516.87 2.7% 386.29 0.0% 0.00 7.7% 1,107.66 1.0% 146.44 0.5% 78.23 13.7% 1,958.60 2.3% 335.56 4.7% 666.06Port Townsend 49.0% 7,490.36 16.8% 2,568.80 2.5% 377.34 0.0% 0.00 7.1% 1,092.46 1.4% 212.11 0.7% 108.39 16.8% 2,573.76 2.2% 333.77 3.4% 525.29Okanogan 50.7% 6,790.16 12.5% 1,673.32 4.1% 547.78 0.0% 0.00 9.4% 1,255.33 0.3% 33.65 0.7% 99.45 16.4% 2,198.93 2.5% 334.02 3.5% 469.03Newport 46.1% 6,211.31 11.6% 1,558.17 7.2% 974.99 0.0% 0.00 8.4% 1,128.07 0.2% 26.85 1.1% 149.83 16.1% 2,172.20 3.2% 432.52 6.0% 809.58Tonasket 50.6% 7,118.58 8.8% 1,230.29 3.6% 507.44 0.0% 0.00 10.2% 1,436.76 0.4% 51.88 2.0% 284.56 16.2% 2,274.44 2.1% 301.84 6.0% 848.78Highland 48.3% 6,997.64 10.2% 1,482.84 2.6% 374.28 0.0% 0.00 12.3% 1,776.96 0.4% 52.81 0.0% 0.00 17.1% 2,478.11 5.0% 728.69 4.1% 588.40Kettle Falls 52.7% 7,093.01 10.0% 1,352.40 3.7% 492.34 0.0% 0.00 6.2% 836.68 0.5% 69.80 4.3% 583.32 13.4% 1,806.96 2.4% 318.16 6.7% 905.53Coupeville 56.6% 8,299.29 13.6% 1,999.09 1.4% 198.83 0.0% 0.00 4.7% 695.71 0.2% 25.07 0.7% 106.58 16.4% 2,398.85 3.2% 472.16 3.2% 474.36Ocean Beach 47.5% 7,741.97 15.4% 2,511.19 3.3% 537.40 0.0% 0.00 6.5% 1,055.81 1.0% 163.33 1.6% 264.95 16.5% 2,692.01 2.0% 318.08 6.1% 997.39Kalama 58.4% 7,733.65 13.5% 1,784.15 2.4% 321.69 0.0% 0.00 3.2% 421.99 0.1% 13.95 0.7% 89.32 15.2% 2,006.57 1.8% 240.38 4.7% 628.28
37 52.7% 7,409.76 12.8% 1,803.57 3.8% 534.71 0.0% 2.04 6.7% 943.11 0.5% 76.20 1.6% 218.13 14.9% 2,100.84 2.4% 343.21 4.5% 634.66500–999Brewster 46.3% 6,382.58 12.7% 1,749.37 4.1% 562.55 0.0% 0.00 15.5% 2,132.14 0.4% 57.17 0.6% 83.74 15.6% 2,156.66 3.2% 434.78 1.7% 229.42Valley 54.8% 7,056.63 8.1% 1,042.82 0.0% 0.00 0.0% 0.00 2.2% 283.43 0.0% 3.43 6.7% 867.43 19.0% 2,450.92 1.2% 158.40 7.9% 1,019.33Cle Elum-Roslyn 53.8% 7,126.53 12.1% 1,603.38 4.0% 529.91 0.0% 0.00 5.1% 671.29 0.7% 90.32 0.6% 84.17 16.9% 2,235.91 2.1% 279.73 4.7% 619.86Freeman 53.2% 6,926.39 10.0% 1,304.74 7.3% 956.09 0.0% 0.00 2.2% 284.36 0.8% 106.78 0.5% 60.10 16.4% 2,140.01 3.4% 448.63 6.0% 786.97Warden 49.9% 7,501.11 11.7% 1,765.26 2.7% 412.15 0.0% 0.00 13.8% 2,072.80 0.2% 32.53 1.6% 234.17 13.9% 2,083.77 2.9% 440.10 3.3% 489.29
57
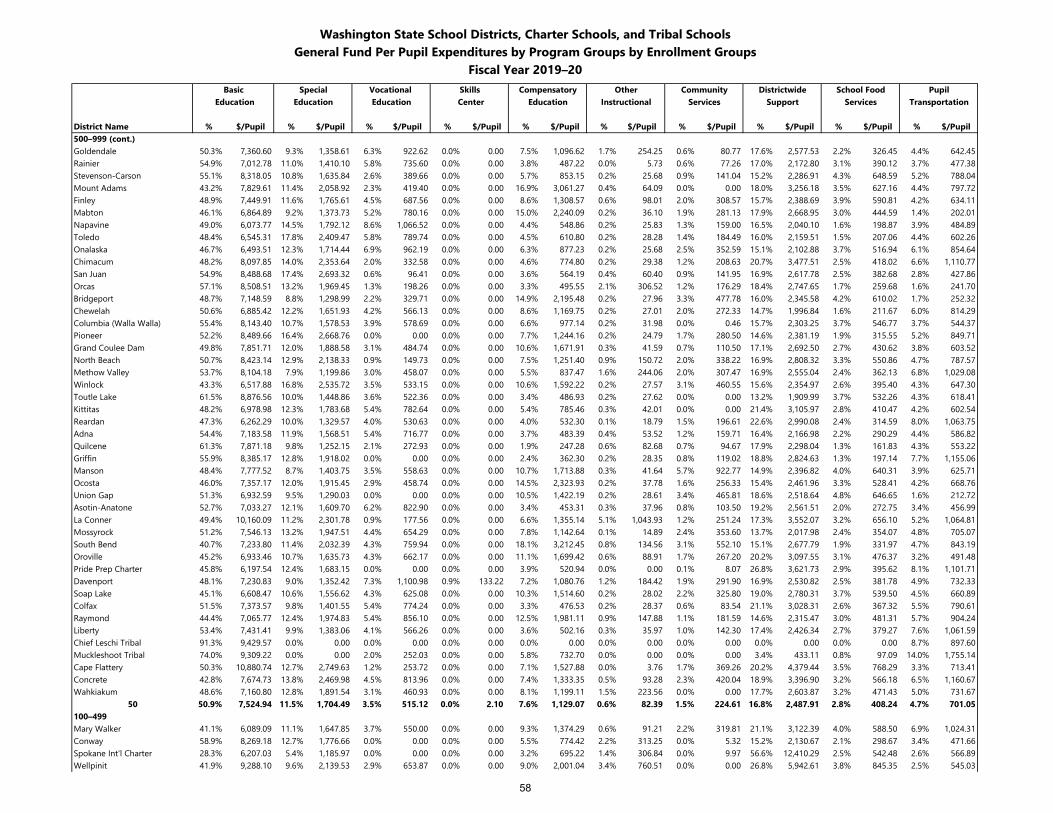
Washington State School Districts, Charter Schools, and Tribal SchoolsGeneral Fund Per Pupil Expenditures by Program Groups by Enrollment Groups
Fiscal Year 2019–20Basic Special Vocational Skills Compensatory Other Community Districtwide School Food Pupil
Education Education Education Center Education Instructional Services Support Services Transportation
District Name % $/Pupil % $/Pupil % $/Pupil % $/Pupil % $/Pupil % $/Pupil % $/Pupil % $/Pupil % $/Pupil % $/Pupil500–999 (cont.)Goldendale 50.3% 7,360.60 9.3% 1,358.61 6.3% 922.62 0.0% 0.00 7.5% 1,096.62 1.7% 254.25 0.6% 80.77 17.6% 2,577.53 2.2% 326.45 4.4% 642.45Rainier 54.9% 7,012.78 11.0% 1,410.10 5.8% 735.60 0.0% 0.00 3.8% 487.22 0.0% 5.73 0.6% 77.26 17.0% 2,172.80 3.1% 390.12 3.7% 477.38Stevenson-Carson 55.1% 8,318.05 10.8% 1,635.84 2.6% 389.66 0.0% 0.00 5.7% 853.15 0.2% 25.68 0.9% 141.04 15.2% 2,286.91 4.3% 648.59 5.2% 788.04Mount Adams 43.2% 7,829.61 11.4% 2,058.92 2.3% 419.40 0.0% 0.00 16.9% 3,061.27 0.4% 64.09 0.0% 0.00 18.0% 3,256.18 3.5% 627.16 4.4% 797.72Finley 48.9% 7,449.91 11.6% 1,765.61 4.5% 687.56 0.0% 0.00 8.6% 1,308.57 0.6% 98.01 2.0% 308.57 15.7% 2,388.69 3.9% 590.81 4.2% 634.11Mabton 46.1% 6,864.89 9.2% 1,373.73 5.2% 780.16 0.0% 0.00 15.0% 2,240.09 0.2% 36.10 1.9% 281.13 17.9% 2,668.95 3.0% 444.59 1.4% 202.01Napavine 49.0% 6,073.77 14.5% 1,792.12 8.6% 1,066.52 0.0% 0.00 4.4% 548.86 0.2% 25.83 1.3% 159.00 16.5% 2,040.10 1.6% 198.87 3.9% 484.89Toledo 48.4% 6,545.31 17.8% 2,409.47 5.8% 789.74 0.0% 0.00 4.5% 610.80 0.2% 28.28 1.4% 184.49 16.0% 2,159.51 1.5% 207.06 4.4% 602.26Onalaska 46.7% 6,493.51 12.3% 1,714.44 6.9% 962.19 0.0% 0.00 6.3% 877.23 0.2% 25.68 2.5% 352.59 15.1% 2,102.88 3.7% 516.94 6.1% 854.64Chimacum 48.2% 8,097.85 14.0% 2,353.64 2.0% 332.58 0.0% 0.00 4.6% 774.80 0.2% 29.38 1.2% 208.63 20.7% 3,477.51 2.5% 418.02 6.6% 1,110.77San Juan 54.9% 8,488.68 17.4% 2,693.32 0.6% 96.41 0.0% 0.00 3.6% 564.19 0.4% 60.40 0.9% 141.95 16.9% 2,617.78 2.5% 382.68 2.8% 427.86Orcas 57.1% 8,508.51 13.2% 1,969.45 1.3% 198.26 0.0% 0.00 3.3% 495.55 2.1% 306.52 1.2% 176.29 18.4% 2,747.65 1.7% 259.68 1.6% 241.70Bridgeport 48.7% 7,148.59 8.8% 1,298.99 2.2% 329.71 0.0% 0.00 14.9% 2,195.48 0.2% 27.96 3.3% 477.78 16.0% 2,345.58 4.2% 610.02 1.7% 252.32Chewelah 50.6% 6,885.42 12.2% 1,651.93 4.2% 566.13 0.0% 0.00 8.6% 1,169.75 0.2% 27.01 2.0% 272.33 14.7% 1,996.84 1.6% 211.67 6.0% 814.29Columbia (Walla Walla) 55.4% 8,143.40 10.7% 1,578.53 3.9% 578.69 0.0% 0.00 6.6% 977.14 0.2% 31.98 0.0% 0.46 15.7% 2,303.25 3.7% 546.77 3.7% 544.37Pioneer 52.2% 8,489.66 16.4% 2,668.76 0.0% 0.00 0.0% 0.00 7.7% 1,244.16 0.2% 24.79 1.7% 280.50 14.6% 2,381.19 1.9% 315.55 5.2% 849.71Grand Coulee Dam 49.8% 7,851.71 12.0% 1,888.58 3.1% 484.74 0.0% 0.00 10.6% 1,671.91 0.3% 41.59 0.7% 110.50 17.1% 2,692.50 2.7% 430.62 3.8% 603.52North Beach 50.7% 8,423.14 12.9% 2,138.33 0.9% 149.73 0.0% 0.00 7.5% 1,251.40 0.9% 150.72 2.0% 338.22 16.9% 2,808.32 3.3% 550.86 4.7% 787.57Methow Valley 53.7% 8,104.18 7.9% 1,199.86 3.0% 458.07 0.0% 0.00 5.5% 837.47 1.6% 244.06 2.0% 307.47 16.9% 2,555.04 2.4% 362.13 6.8% 1,029.08Winlock 43.3% 6,517.88 16.8% 2,535.72 3.5% 533.15 0.0% 0.00 10.6% 1,592.22 0.2% 27.57 3.1% 460.55 15.6% 2,354.97 2.6% 395.40 4.3% 647.30Toutle Lake 61.5% 8,876.56 10.0% 1,448.86 3.6% 522.36 0.0% 0.00 3.4% 486.93 0.2% 27.62 0.0% 0.00 13.2% 1,909.99 3.7% 532.26 4.3% 618.41Kittitas 48.2% 6,978.98 12.3% 1,783.68 5.4% 782.64 0.0% 0.00 5.4% 785.46 0.3% 42.01 0.0% 0.00 21.4% 3,105.97 2.8% 410.47 4.2% 602.54Reardan 47.3% 6,262.29 10.0% 1,329.57 4.0% 530.63 0.0% 0.00 4.0% 532.30 0.1% 18.79 1.5% 196.61 22.6% 2,990.08 2.4% 314.59 8.0% 1,063.75Adna 54.4% 7,183.58 11.9% 1,568.51 5.4% 716.77 0.0% 0.00 3.7% 483.39 0.4% 53.52 1.2% 159.71 16.4% 2,166.98 2.2% 290.29 4.4% 586.82Quilcene 61.3% 7,871.18 9.8% 1,252.15 2.1% 272.93 0.0% 0.00 1.9% 247.28 0.6% 82.68 0.7% 94.67 17.9% 2,298.04 1.3% 161.83 4.3% 553.22Griffin 55.9% 8,385.17 12.8% 1,918.02 0.0% 0.00 0.0% 0.00 2.4% 362.30 0.2% 28.35 0.8% 119.02 18.8% 2,824.63 1.3% 197.14 7.7% 1,155.06Manson 48.4% 7,777.52 8.7% 1,403.75 3.5% 558.63 0.0% 0.00 10.7% 1,713.88 0.3% 41.64 5.7% 922.77 14.9% 2,396.82 4.0% 640.31 3.9% 625.71Ocosta 46.0% 7,357.17 12.0% 1,915.45 2.9% 458.74 0.0% 0.00 14.5% 2,323.93 0.2% 37.78 1.6% 256.33 15.4% 2,461.96 3.3% 528.41 4.2% 668.76Union Gap 51.3% 6,932.59 9.5% 1,290.03 0.0% 0.00 0.0% 0.00 10.5% 1,422.19 0.2% 28.61 3.4% 465.81 18.6% 2,518.64 4.8% 646.65 1.6% 212.72Asotin-Anatone 52.7% 7,033.27 12.1% 1,609.70 6.2% 822.90 0.0% 0.00 3.4% 453.31 0.3% 37.96 0.8% 103.50 19.2% 2,561.51 2.0% 272.75 3.4% 456.99La Conner 49.4% 10,160.09 11.2% 2,301.78 0.9% 177.56 0.0% 0.00 6.6% 1,355.14 5.1% 1,043.93 1.2% 251.24 17.3% 3,552.07 3.2% 656.10 5.2% 1,064.81Mossyrock 51.2% 7,546.13 13.2% 1,947.51 4.4% 654.29 0.0% 0.00 7.8% 1,142.64 0.1% 14.89 2.4% 353.60 13.7% 2,017.98 2.4% 354.07 4.8% 705.07South Bend 40.7% 7,233.80 11.4% 2,032.39 4.3% 759.94 0.0% 0.00 18.1% 3,212.45 0.8% 134.56 3.1% 552.10 15.1% 2,677.79 1.9% 331.97 4.7% 843.19Oroville 45.2% 6,933.46 10.7% 1,635.73 4.3% 662.17 0.0% 0.00 11.1% 1,699.42 0.6% 88.91 1.7% 267.20 20.2% 3,097.55 3.1% 476.37 3.2% 491.48Pride Prep Charter 45.8% 6,197.54 12.4% 1,683.15 0.0% 0.00 0.0% 0.00 3.9% 520.94 0.0% 0.00 0.1% 8.07 26.8% 3,621.73 2.9% 395.62 8.1% 1,101.71Davenport 48.1% 7,230.83 9.0% 1,352.42 7.3% 1,100.98 0.9% 133.22 7.2% 1,080.76 1.2% 184.42 1.9% 291.90 16.9% 2,530.82 2.5% 381.78 4.9% 732.33Soap Lake 45.1% 6,608.47 10.6% 1,556.62 4.3% 625.08 0.0% 0.00 10.3% 1,514.60 0.2% 28.02 2.2% 325.80 19.0% 2,780.31 3.7% 539.50 4.5% 660.89Colfax 51.5% 7,373.57 9.8% 1,401.55 5.4% 774.24 0.0% 0.00 3.3% 476.53 0.2% 28.37 0.6% 83.54 21.1% 3,028.31 2.6% 367.32 5.5% 790.61Raymond 44.4% 7,065.77 12.4% 1,974.83 5.4% 856.10 0.0% 0.00 12.5% 1,981.11 0.9% 147.88 1.1% 181.59 14.6% 2,315.47 3.0% 481.31 5.7% 904.24Liberty 53.4% 7,431.41 9.9% 1,383.06 4.1% 566.26 0.0% 0.00 3.6% 502.16 0.3% 35.97 1.0% 142.30 17.4% 2,426.34 2.7% 379.27 7.6% 1,061.59Chief Leschi Tribal 91.3% 9,429.57 0.0% 0.00 0.0% 0.00 0.0% 0.00 0.0% 0.00 0.0% 0.00 0.0% 0.00 0.0% 0.00 0.0% 0.00 8.7% 897.60Muckleshoot Tribal 74.0% 9,309.22 0.0% 0.00 2.0% 252.03 0.0% 0.00 5.8% 732.70 0.0% 0.00 0.0% 0.00 3.4% 433.11 0.8% 97.09 14.0% 1,755.14Cape Flattery 50.3% 10,880.74 12.7% 2,749.63 1.2% 253.72 0.0% 0.00 7.1% 1,527.88 0.0% 3.76 1.7% 369.26 20.2% 4,379.44 3.5% 768.29 3.3% 713.41Concrete 42.8% 7,674.73 13.8% 2,469.98 4.5% 813.96 0.0% 0.00 7.4% 1,333.35 0.5% 93.28 2.3% 420.04 18.9% 3,396.90 3.2% 566.18 6.5% 1,160.67Wahkiakum 48.6% 7,160.80 12.8% 1,891.54 3.1% 460.93 0.0% 0.00 8.1% 1,199.11 1.5% 223.56 0.0% 0.00 17.7% 2,603.87 3.2% 471.43 5.0% 731.67
50 50.9% 7,524.94 11.5% 1,704.49 3.5% 515.12 0.0% 2.10 7.6% 1,129.07 0.6% 82.39 1.5% 224.61 16.8% 2,487.91 2.8% 408.24 4.7% 701.05100–499Mary Walker 41.1% 6,089.09 11.1% 1,647.85 3.7% 550.00 0.0% 0.00 9.3% 1,374.29 0.6% 91.21 2.2% 319.81 21.1% 3,122.39 4.0% 588.50 6.9% 1,024.31Conway 58.9% 8,269.18 12.7% 1,776.66 0.0% 0.00 0.0% 0.00 5.5% 774.42 2.2% 313.25 0.0% 5.32 15.2% 2,130.67 2.1% 298.67 3.4% 471.66Spokane Int'l Charter 28.3% 6,207.03 5.4% 1,185.97 0.0% 0.00 0.0% 0.00 3.2% 695.22 1.4% 306.84 0.0% 9.97 56.6% 12,410.29 2.5% 542.48 2.6% 566.89Wellpinit 41.9% 9,288.10 9.6% 2,139.53 2.9% 653.87 0.0% 0.00 9.0% 2,001.04 3.4% 760.51 0.0% 0.00 26.8% 5,942.61 3.8% 845.35 2.5% 545.03
58
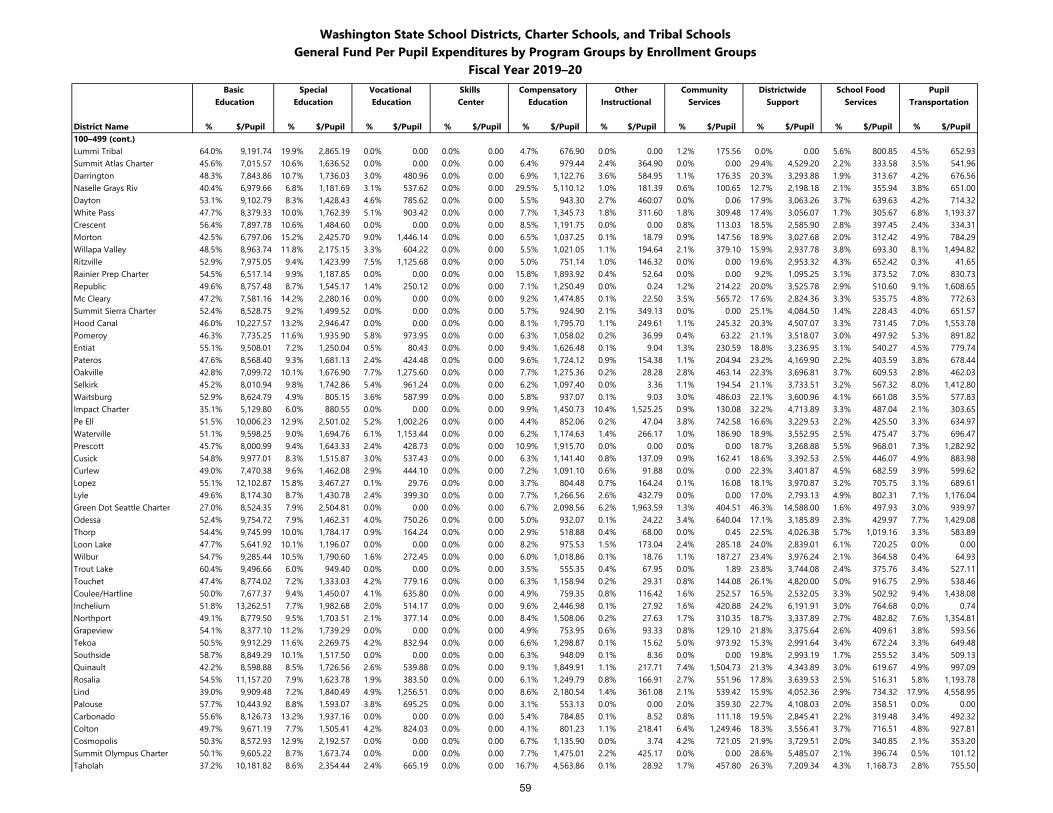
Washington State School Districts, Charter Schools, and Tribal SchoolsGeneral Fund Per Pupil Expenditures by Program Groups by Enrollment Groups
Fiscal Year 2019–20Basic Special Vocational Skills Compensatory Other Community Districtwide School Food Pupil
Education Education Education Center Education Instructional Services Support Services Transportation
District Name % $/Pupil % $/Pupil % $/Pupil % $/Pupil % $/Pupil % $/Pupil % $/Pupil % $/Pupil % $/Pupil % $/Pupil100–499 (cont.)Lummi Tribal 64.0% 9,191.74 19.9% 2,865.19 0.0% 0.00 0.0% 0.00 4.7% 676.90 0.0% 0.00 1.2% 175.56 0.0% 0.00 5.6% 800.85 4.5% 652.93Summit Atlas Charter 45.6% 7,015.57 10.6% 1,636.52 0.0% 0.00 0.0% 0.00 6.4% 979.44 2.4% 364.90 0.0% 0.00 29.4% 4,529.20 2.2% 333.58 3.5% 541.96Darrington 48.3% 7,843.86 10.7% 1,736.03 3.0% 480.96 0.0% 0.00 6.9% 1,122.76 3.6% 584.95 1.1% 176.35 20.3% 3,293.88 1.9% 313.67 4.2% 676.56Naselle Grays Riv 40.4% 6,979.66 6.8% 1,181.69 3.1% 537.62 0.0% 0.00 29.5% 5,110.12 1.0% 181.39 0.6% 100.65 12.7% 2,198.18 2.1% 355.94 3.8% 651.00Dayton 53.1% 9,102.79 8.3% 1,428.43 4.6% 785.62 0.0% 0.00 5.5% 943.30 2.7% 460.07 0.0% 0.06 17.9% 3,063.26 3.7% 639.63 4.2% 714.32White Pass 47.7% 8,379.33 10.0% 1,762.39 5.1% 903.42 0.0% 0.00 7.7% 1,345.73 1.8% 311.60 1.8% 309.48 17.4% 3,056.07 1.7% 305.67 6.8% 1,193.37Crescent 56.4% 7,897.78 10.6% 1,484.60 0.0% 0.00 0.0% 0.00 8.5% 1,191.75 0.0% 0.00 0.8% 113.03 18.5% 2,585.90 2.8% 397.45 2.4% 334.31Morton 42.5% 6,797.06 15.2% 2,425.70 9.0% 1,446.14 0.0% 0.00 6.5% 1,037.25 0.1% 18.79 0.9% 147.56 18.9% 3,027.68 2.0% 312.42 4.9% 784.29Willapa Valley 48.5% 8,963.74 11.8% 2,175.15 3.3% 604.22 0.0% 0.00 5.5% 1,021.05 1.1% 194.64 2.1% 379.10 15.9% 2,937.78 3.8% 693.30 8.1% 1,494.82Ritzville 52.9% 7,975.05 9.4% 1,423.99 7.5% 1,125.68 0.0% 0.00 5.0% 751.14 1.0% 146.32 0.0% 0.00 19.6% 2,953.32 4.3% 652.42 0.3% 41.65Rainier Prep Charter 54.5% 6,517.14 9.9% 1,187.85 0.0% 0.00 0.0% 0.00 15.8% 1,893.92 0.4% 52.64 0.0% 0.00 9.2% 1,095.25 3.1% 373.52 7.0% 830.73Republic 49.6% 8,757.48 8.7% 1,545.17 1.4% 250.12 0.0% 0.00 7.1% 1,250.49 0.0% 0.24 1.2% 214.22 20.0% 3,525.78 2.9% 510.60 9.1% 1,608.65Mc Cleary 47.2% 7,581.16 14.2% 2,280.16 0.0% 0.00 0.0% 0.00 9.2% 1,474.85 0.1% 22.50 3.5% 565.72 17.6% 2,824.36 3.3% 535.75 4.8% 772.63Summit Sierra Charter 52.4% 8,528.75 9.2% 1,499.52 0.0% 0.00 0.0% 0.00 5.7% 924.90 2.1% 349.13 0.0% 0.00 25.1% 4,084.50 1.4% 228.43 4.0% 651.57Hood Canal 46.0% 10,227.57 13.2% 2,946.47 0.0% 0.00 0.0% 0.00 8.1% 1,795.70 1.1% 249.61 1.1% 245.32 20.3% 4,507.07 3.3% 731.45 7.0% 1,553.78Pomeroy 46.3% 7,735.25 11.6% 1,935.90 5.8% 973.95 0.0% 0.00 6.3% 1,058.02 0.2% 36.99 0.4% 63.22 21.1% 3,518.07 3.0% 497.92 5.3% 891.82Entiat 55.1% 9,508.01 7.2% 1,250.04 0.5% 80.43 0.0% 0.00 9.4% 1,626.48 0.1% 9.04 1.3% 230.59 18.8% 3,236.95 3.1% 540.27 4.5% 779.74Pateros 47.6% 8,568.40 9.3% 1,681.13 2.4% 424.48 0.0% 0.00 9.6% 1,724.12 0.9% 154.38 1.1% 204.94 23.2% 4,169.90 2.2% 403.59 3.8% 678.44Oakville 42.8% 7,099.72 10.1% 1,676.90 7.7% 1,275.60 0.0% 0.00 7.7% 1,275.36 0.2% 28.28 2.8% 463.14 22.3% 3,696.81 3.7% 609.53 2.8% 462.03Selkirk 45.2% 8,010.94 9.8% 1,742.86 5.4% 961.24 0.0% 0.00 6.2% 1,097.40 0.0% 3.36 1.1% 194.54 21.1% 3,733.51 3.2% 567.32 8.0% 1,412.80Waitsburg 52.9% 8,624.79 4.9% 805.15 3.6% 587.99 0.0% 0.00 5.8% 937.07 0.1% 9.03 3.0% 486.03 22.1% 3,600.96 4.1% 661.08 3.5% 577.83Impact Charter 35.1% 5,129.80 6.0% 880.55 0.0% 0.00 0.0% 0.00 9.9% 1,450.73 10.4% 1,525.25 0.9% 130.08 32.2% 4,713.89 3.3% 487.04 2.1% 303.65Pe Ell 51.5% 10,006.23 12.9% 2,501.02 5.2% 1,002.26 0.0% 0.00 4.4% 852.06 0.2% 47.04 3.8% 742.58 16.6% 3,229.53 2.2% 425.50 3.3% 634.97Waterville 51.1% 9,598.25 9.0% 1,694.76 6.1% 1,153.44 0.0% 0.00 6.2% 1,174.63 1.4% 266.17 1.0% 186.90 18.9% 3,552.95 2.5% 475.47 3.7% 696.47Prescott 45.7% 8,000.99 9.4% 1,643.33 2.4% 428.73 0.0% 0.00 10.9% 1,915.70 0.0% 0.00 0.0% 0.00 18.7% 3,268.88 5.5% 968.01 7.3% 1,282.92Cusick 54.8% 9,977.01 8.3% 1,515.87 3.0% 537.43 0.0% 0.00 6.3% 1,141.40 0.8% 137.09 0.9% 162.41 18.6% 3,392.53 2.5% 446.07 4.9% 883.98Curlew 49.0% 7,470.38 9.6% 1,462.08 2.9% 444.10 0.0% 0.00 7.2% 1,091.10 0.6% 91.88 0.0% 0.00 22.3% 3,401.87 4.5% 682.59 3.9% 599.62Lopez 55.1% 12,102.87 15.8% 3,467.27 0.1% 29.76 0.0% 0.00 3.7% 804.48 0.7% 164.24 0.1% 16.08 18.1% 3,970.87 3.2% 705.75 3.1% 689.61Lyle 49.6% 8,174.30 8.7% 1,430.78 2.4% 399.30 0.0% 0.00 7.7% 1,266.56 2.6% 432.79 0.0% 0.00 17.0% 2,793.13 4.9% 802.31 7.1% 1,176.04Green Dot Seattle Charter 27.0% 8,524.35 7.9% 2,504.81 0.0% 0.00 0.0% 0.00 6.7% 2,098.56 6.2% 1,963.59 1.3% 404.51 46.3% 14,588.00 1.6% 497.93 3.0% 939.97Odessa 52.4% 9,754.72 7.9% 1,462.31 4.0% 750.26 0.0% 0.00 5.0% 932.07 0.1% 24.22 3.4% 640.04 17.1% 3,185.89 2.3% 429.97 7.7% 1,429.08Thorp 54.4% 9,745.99 10.0% 1,784.17 0.9% 164.24 0.0% 0.00 2.9% 518.88 0.4% 68.00 0.0% 0.45 22.5% 4,026.38 5.7% 1,019.16 3.3% 583.89Loon Lake 47.7% 5,641.92 10.1% 1,196.07 0.0% 0.00 0.0% 0.00 8.2% 975.53 1.5% 173.04 2.4% 285.18 24.0% 2,839.01 6.1% 720.25 0.0% 0.00Wilbur 54.7% 9,285.44 10.5% 1,790.60 1.6% 272.45 0.0% 0.00 6.0% 1,018.86 0.1% 18.76 1.1% 187.27 23.4% 3,976.24 2.1% 364.58 0.4% 64.93Trout Lake 60.4% 9,496.66 6.0% 949.40 0.0% 0.00 0.0% 0.00 3.5% 555.35 0.4% 67.95 0.0% 1.89 23.8% 3,744.08 2.4% 375.76 3.4% 527.11Touchet 47.4% 8,774.02 7.2% 1,333.03 4.2% 779.16 0.0% 0.00 6.3% 1,158.94 0.2% 29.31 0.8% 144.08 26.1% 4,820.00 5.0% 916.75 2.9% 538.46Coulee/Hartline 50.0% 7,677.37 9.4% 1,450.07 4.1% 635.80 0.0% 0.00 4.9% 759.35 0.8% 116.42 1.6% 252.57 16.5% 2,532.05 3.3% 502.92 9.4% 1,438.08Inchelium 51.8% 13,262.51 7.7% 1,982.68 2.0% 514.17 0.0% 0.00 9.6% 2,446.98 0.1% 27.92 1.6% 420.88 24.2% 6,191.91 3.0% 764.68 0.0% 0.74Northport 49.1% 8,779.50 9.5% 1,703.51 2.1% 377.14 0.0% 0.00 8.4% 1,508.06 0.2% 27.63 1.7% 310.35 18.7% 3,337.89 2.7% 482.82 7.6% 1,354.81Grapeview 54.1% 8,377.10 11.2% 1,739.29 0.0% 0.00 0.0% 0.00 4.9% 753.95 0.6% 93.33 0.8% 129.10 21.8% 3,375.64 2.6% 409.61 3.8% 593.56Tekoa 50.5% 9,912.29 11.6% 2,269.75 4.2% 832.94 0.0% 0.00 6.6% 1,298.87 0.1% 15.62 5.0% 973.92 15.3% 2,991.64 3.4% 672.24 3.3% 649.48Southside 58.7% 8,849.29 10.1% 1,517.50 0.0% 0.00 0.0% 0.00 6.3% 948.09 0.1% 8.36 0.0% 0.00 19.8% 2,993.19 1.7% 255.52 3.4% 509.13Quinault 42.2% 8,598.88 8.5% 1,726.56 2.6% 539.88 0.0% 0.00 9.1% 1,849.91 1.1% 217.71 7.4% 1,504.73 21.3% 4,343.89 3.0% 619.67 4.9% 997.09Rosalia 54.5% 11,157.20 7.9% 1,623.78 1.9% 383.50 0.0% 0.00 6.1% 1,249.79 0.8% 166.91 2.7% 551.96 17.8% 3,639.53 2.5% 516.31 5.8% 1,193.78Lind 39.0% 9,909.48 7.2% 1,840.49 4.9% 1,256.51 0.0% 0.00 8.6% 2,180.54 1.4% 361.08 2.1% 539.42 15.9% 4,052.36 2.9% 734.32 17.9% 4,558.95Palouse 57.7% 10,443.92 8.8% 1,593.07 3.8% 695.25 0.0% 0.00 3.1% 553.13 0.0% 0.00 2.0% 359.30 22.7% 4,108.03 2.0% 358.51 0.0% 0.00Carbonado 55.6% 8,126.73 13.2% 1,937.16 0.0% 0.00 0.0% 0.00 5.4% 784.85 0.1% 8.52 0.8% 111.18 19.5% 2,845.41 2.2% 319.48 3.4% 492.32Colton 49.7% 9,671.19 7.7% 1,505.41 4.2% 824.03 0.0% 0.00 4.1% 801.23 1.1% 218.41 6.4% 1,249.46 18.3% 3,556.41 3.7% 716.51 4.8% 927.81Cosmopolis 50.3% 8,572.93 12.9% 2,192.57 0.0% 0.00 0.0% 0.00 6.7% 1,135.90 0.0% 3.74 4.2% 721.05 21.9% 3,729.51 2.0% 340.85 2.1% 353.20Summit Olympus Charter 50.1% 9,605.22 8.7% 1,673.74 0.0% 0.00 0.0% 0.00 7.7% 1,475.01 2.2% 425.17 0.0% 0.00 28.6% 5,485.07 2.1% 396.74 0.5% 101.12Taholah 37.2% 10,181.82 8.6% 2,354.44 2.4% 665.19 0.0% 0.00 16.7% 4,563.86 0.1% 28.92 1.7% 457.80 26.3% 7,209.34 4.3% 1,168.73 2.8% 755.50
59
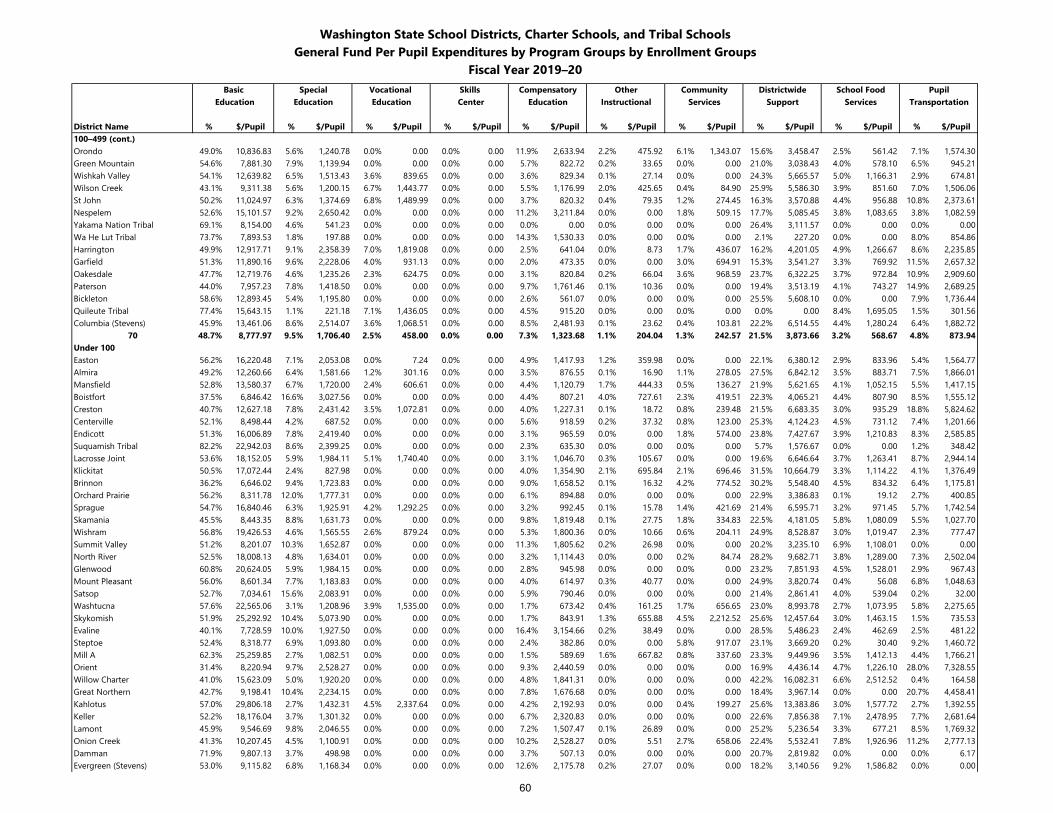
Washington State School Districts, Charter Schools, and Tribal SchoolsGeneral Fund Per Pupil Expenditures by Program Groups by Enrollment Groups
Fiscal Year 2019–20Basic Special Vocational Skills Compensatory Other Community Districtwide School Food Pupil
Education Education Education Center Education Instructional Services Support Services Transportation
District Name % $/Pupil % $/Pupil % $/Pupil % $/Pupil % $/Pupil % $/Pupil % $/Pupil % $/Pupil % $/Pupil % $/Pupil100–499 (cont.)Orondo 49.0% 10,836.83 5.6% 1,240.78 0.0% 0.00 0.0% 0.00 11.9% 2,633.94 2.2% 475.92 6.1% 1,343.07 15.6% 3,458.47 2.5% 561.42 7.1% 1,574.30Green Mountain 54.6% 7,881.30 7.9% 1,139.94 0.0% 0.00 0.0% 0.00 5.7% 822.72 0.2% 33.65 0.0% 0.00 21.0% 3,038.43 4.0% 578.10 6.5% 945.21Wishkah Valley 54.1% 12,639.82 6.5% 1,513.43 3.6% 839.65 0.0% 0.00 3.6% 829.34 0.1% 27.14 0.0% 0.00 24.3% 5,665.57 5.0% 1,166.31 2.9% 674.81Wilson Creek 43.1% 9,311.38 5.6% 1,200.15 6.7% 1,443.77 0.0% 0.00 5.5% 1,176.99 2.0% 425.65 0.4% 84.90 25.9% 5,586.30 3.9% 851.60 7.0% 1,506.06St John 50.2% 11,024.97 6.3% 1,374.69 6.8% 1,489.99 0.0% 0.00 3.7% 820.32 0.4% 79.35 1.2% 274.45 16.3% 3,570.88 4.4% 956.88 10.8% 2,373.61Nespelem 52.6% 15,101.57 9.2% 2,650.42 0.0% 0.00 0.0% 0.00 11.2% 3,211.84 0.0% 0.00 1.8% 509.15 17.7% 5,085.45 3.8% 1,083.65 3.8% 1,082.59Yakama Nation Tribal 69.1% 8,154.00 4.6% 541.23 0.0% 0.00 0.0% 0.00 0.0% 0.00 0.0% 0.00 0.0% 0.00 26.4% 3,111.57 0.0% 0.00 0.0% 0.00Wa He Lut Tribal 73.7% 7,893.53 1.8% 197.88 0.0% 0.00 0.0% 0.00 14.3% 1,530.33 0.0% 0.00 0.0% 0.00 2.1% 227.20 0.0% 0.00 8.0% 854.86Harrington 49.9% 12,917.71 9.1% 2,358.39 7.0% 1,819.08 0.0% 0.00 2.5% 641.04 0.0% 8.73 1.7% 436.07 16.2% 4,201.05 4.9% 1,266.67 8.6% 2,235.85Garfield 51.3% 11,890.16 9.6% 2,228.06 4.0% 931.13 0.0% 0.00 2.0% 473.35 0.0% 0.00 3.0% 694.91 15.3% 3,541.27 3.3% 769.92 11.5% 2,657.32Oakesdale 47.7% 12,719.76 4.6% 1,235.26 2.3% 624.75 0.0% 0.00 3.1% 820.84 0.2% 66.04 3.6% 968.59 23.7% 6,322.25 3.7% 972.84 10.9% 2,909.60Paterson 44.0% 7,957.23 7.8% 1,418.50 0.0% 0.00 0.0% 0.00 9.7% 1,761.46 0.1% 10.36 0.0% 0.00 19.4% 3,513.19 4.1% 743.27 14.9% 2,689.25Bickleton 58.6% 12,893.45 5.4% 1,195.80 0.0% 0.00 0.0% 0.00 2.6% 561.07 0.0% 0.00 0.0% 0.00 25.5% 5,608.10 0.0% 0.00 7.9% 1,736.44Quileute Tribal 77.4% 15,643.15 1.1% 221.18 7.1% 1,436.05 0.0% 0.00 4.5% 915.20 0.0% 0.00 0.0% 0.00 0.0% 0.00 8.4% 1,695.05 1.5% 301.56Columbia (Stevens) 45.9% 13,461.06 8.6% 2,514.07 3.6% 1,068.51 0.0% 0.00 8.5% 2,481.93 0.1% 23.62 0.4% 103.81 22.2% 6,514.55 4.4% 1,280.24 6.4% 1,882.72
70 48.7% 8,777.97 9.5% 1,706.40 2.5% 458.00 0.0% 0.00 7.3% 1,323.68 1.1% 204.04 1.3% 242.57 21.5% 3,873.66 3.2% 568.67 4.8% 873.94Under 100Easton 56.2% 16,220.48 7.1% 2,053.08 0.0% 7.24 0.0% 0.00 4.9% 1,417.93 1.2% 359.98 0.0% 0.00 22.1% 6,380.12 2.9% 833.96 5.4% 1,564.77Almira 49.2% 12,260.66 6.4% 1,581.66 1.2% 301.16 0.0% 0.00 3.5% 876.55 0.1% 16.90 1.1% 278.05 27.5% 6,842.12 3.5% 883.71 7.5% 1,866.01Mansfield 52.8% 13,580.37 6.7% 1,720.00 2.4% 606.61 0.0% 0.00 4.4% 1,120.79 1.7% 444.33 0.5% 136.27 21.9% 5,621.65 4.1% 1,052.15 5.5% 1,417.15Boistfort 37.5% 6,846.42 16.6% 3,027.56 0.0% 0.00 0.0% 0.00 4.4% 807.21 4.0% 727.61 2.3% 419.51 22.3% 4,065.21 4.4% 807.90 8.5% 1,555.12Creston 40.7% 12,627.18 7.8% 2,431.42 3.5% 1,072.81 0.0% 0.00 4.0% 1,227.31 0.1% 18.72 0.8% 239.48 21.5% 6,683.35 3.0% 935.29 18.8% 5,824.62Centerville 52.1% 8,498.44 4.2% 687.52 0.0% 0.00 0.0% 0.00 5.6% 918.59 0.2% 37.32 0.8% 123.00 25.3% 4,124.23 4.5% 731.12 7.4% 1,201.66Endicott 51.3% 16,006.89 7.8% 2,419.40 0.0% 0.00 0.0% 0.00 3.1% 965.59 0.0% 0.00 1.8% 574.00 23.8% 7,427.67 3.9% 1,210.83 8.3% 2,585.85Suquamish Tribal 82.2% 22,942.03 8.6% 2,399.25 0.0% 0.00 0.0% 0.00 2.3% 635.30 0.0% 0.00 0.0% 0.00 5.7% 1,576.67 0.0% 0.00 1.2% 348.42Lacrosse Joint 53.6% 18,152.05 5.9% 1,984.11 5.1% 1,740.40 0.0% 0.00 3.1% 1,046.70 0.3% 105.67 0.0% 0.00 19.6% 6,646.64 3.7% 1,263.41 8.7% 2,944.14Klickitat 50.5% 17,072.44 2.4% 827.98 0.0% 0.00 0.0% 0.00 4.0% 1,354.90 2.1% 695.84 2.1% 696.46 31.5% 10,664.79 3.3% 1,114.22 4.1% 1,376.49Brinnon 36.2% 6,646.02 9.4% 1,723.83 0.0% 0.00 0.0% 0.00 9.0% 1,658.52 0.1% 16.32 4.2% 774.52 30.2% 5,548.40 4.5% 834.32 6.4% 1,175.81Orchard Prairie 56.2% 8,311.78 12.0% 1,777.31 0.0% 0.00 0.0% 0.00 6.1% 894.88 0.0% 0.00 0.0% 0.00 22.9% 3,386.83 0.1% 19.12 2.7% 400.85Sprague 54.7% 16,840.46 6.3% 1,925.91 4.2% 1,292.25 0.0% 0.00 3.2% 992.45 0.1% 15.78 1.4% 421.69 21.4% 6,595.71 3.2% 971.45 5.7% 1,742.54Skamania 45.5% 8,443.35 8.8% 1,631.73 0.0% 0.00 0.0% 0.00 9.8% 1,819.48 0.1% 27.75 1.8% 334.83 22.5% 4,181.05 5.8% 1,080.09 5.5% 1,027.70Wishram 56.8% 19,426.53 4.6% 1,565.55 2.6% 879.24 0.0% 0.00 5.3% 1,800.36 0.0% 10.66 0.6% 204.11 24.9% 8,528.87 3.0% 1,019.47 2.3% 777.47Summit Valley 51.2% 8,201.07 10.3% 1,652.87 0.0% 0.00 0.0% 0.00 11.3% 1,805.62 0.2% 26.98 0.0% 0.00 20.2% 3,235.10 6.9% 1,108.01 0.0% 0.00North River 52.5% 18,008.13 4.8% 1,634.01 0.0% 0.00 0.0% 0.00 3.2% 1,114.43 0.0% 0.00 0.2% 84.74 28.2% 9,682.71 3.8% 1,289.00 7.3% 2,502.04Glenwood 60.8% 20,624.05 5.9% 1,984.15 0.0% 0.00 0.0% 0.00 2.8% 945.98 0.0% 0.00 0.0% 0.00 23.2% 7,851.93 4.5% 1,528.01 2.9% 967.43Mount Pleasant 56.0% 8,601.34 7.7% 1,183.83 0.0% 0.00 0.0% 0.00 4.0% 614.97 0.3% 40.77 0.0% 0.00 24.9% 3,820.74 0.4% 56.08 6.8% 1,048.63Satsop 52.7% 7,034.61 15.6% 2,083.91 0.0% 0.00 0.0% 0.00 5.9% 790.46 0.0% 0.00 0.0% 0.00 21.4% 2,861.41 4.0% 539.04 0.2% 32.00Washtucna 57.6% 22,565.06 3.1% 1,208.96 3.9% 1,535.00 0.0% 0.00 1.7% 673.42 0.4% 161.25 1.7% 656.65 23.0% 8,993.78 2.7% 1,073.95 5.8% 2,275.65Skykomish 51.9% 25,292.92 10.4% 5,073.90 0.0% 0.00 0.0% 0.00 1.7% 843.91 1.3% 655.88 4.5% 2,212.52 25.6% 12,457.64 3.0% 1,463.15 1.5% 735.53Evaline 40.1% 7,728.59 10.0% 1,927.50 0.0% 0.00 0.0% 0.00 16.4% 3,154.66 0.2% 38.49 0.0% 0.00 28.5% 5,486.23 2.4% 462.69 2.5% 481.22Steptoe 52.4% 8,318.77 6.9% 1,093.80 0.0% 0.00 0.0% 0.00 2.4% 382.86 0.0% 0.00 5.8% 917.07 23.1% 3,669.20 0.2% 30.40 9.2% 1,460.72Mill A 62.3% 25,259.85 2.7% 1,082.51 0.0% 0.00 0.0% 0.00 1.5% 589.69 1.6% 667.82 0.8% 337.60 23.3% 9,449.96 3.5% 1,412.13 4.4% 1,766.21Orient 31.4% 8,220.94 9.7% 2,528.27 0.0% 0.00 0.0% 0.00 9.3% 2,440.59 0.0% 0.00 0.0% 0.00 16.9% 4,436.14 4.7% 1,226.10 28.0% 7,328.55Willow Charter 41.0% 15,623.09 5.0% 1,920.20 0.0% 0.00 0.0% 0.00 4.8% 1,841.31 0.0% 0.00 0.0% 0.00 42.2% 16,082.31 6.6% 2,512.52 0.4% 164.58Great Northern 42.7% 9,198.41 10.4% 2,234.15 0.0% 0.00 0.0% 0.00 7.8% 1,676.68 0.0% 0.00 0.0% 0.00 18.4% 3,967.14 0.0% 0.00 20.7% 4,458.41Kahlotus 57.0% 29,806.18 2.7% 1,432.31 4.5% 2,337.64 0.0% 0.00 4.2% 2,192.93 0.0% 0.00 0.4% 199.27 25.6% 13,383.86 3.0% 1,577.72 2.7% 1,392.55Keller 52.2% 18,176.04 3.7% 1,301.32 0.0% 0.00 0.0% 0.00 6.7% 2,320.83 0.0% 0.00 0.0% 0.00 22.6% 7,856.38 7.1% 2,478.95 7.7% 2,681.64Lamont 45.9% 9,546.69 9.8% 2,046.55 0.0% 0.00 0.0% 0.00 7.2% 1,507.47 0.1% 26.89 0.0% 0.00 25.2% 5,236.54 3.3% 677.21 8.5% 1,769.32Onion Creek 41.3% 10,207.45 4.5% 1,100.91 0.0% 0.00 0.0% 0.00 10.2% 2,528.27 0.0% 5.51 2.7% 658.06 22.4% 5,532.41 7.8% 1,926.96 11.2% 2,777.13Damman 71.9% 9,807.13 3.7% 498.98 0.0% 0.00 0.0% 0.00 3.7% 507.13 0.0% 0.00 0.0% 0.00 20.7% 2,819.82 0.0% 0.00 0.0% 6.17Evergreen (Stevens) 53.0% 9,115.82 6.8% 1,168.34 0.0% 0.00 0.0% 0.00 12.6% 2,175.78 0.2% 27.07 0.0% 0.00 18.2% 3,140.56 9.2% 1,586.82 0.0% 0.00
60
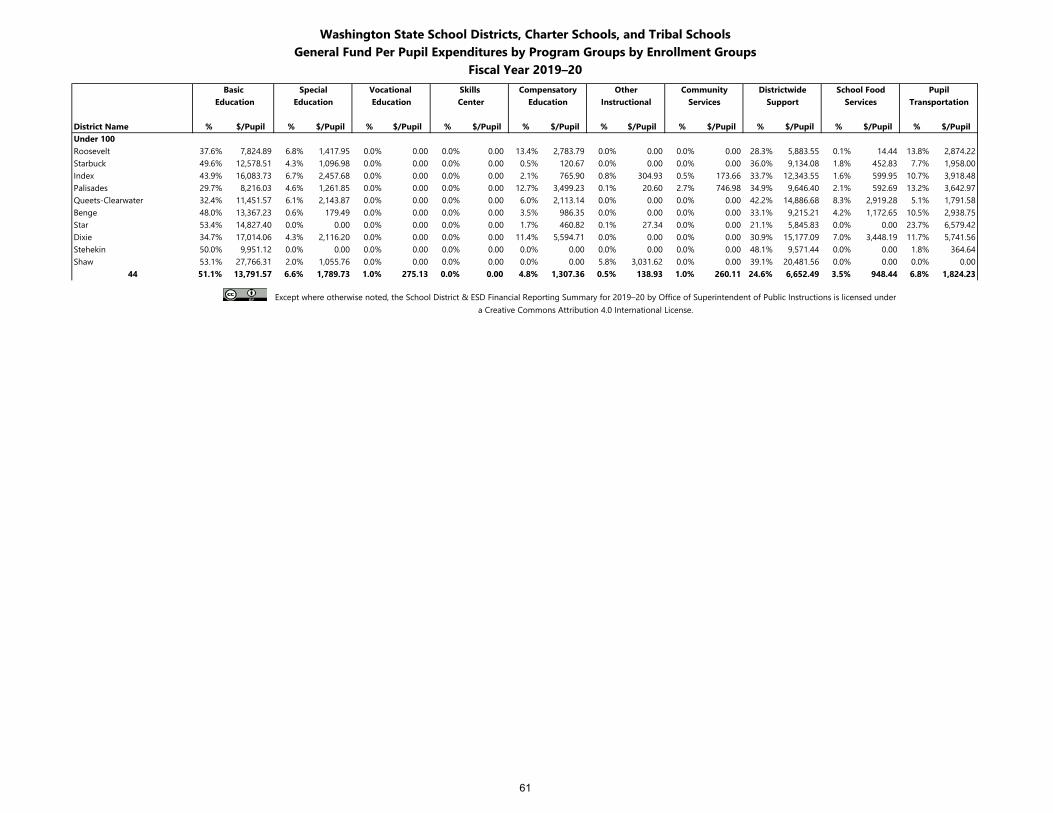
Washington State School Districts, Charter Schools, and Tribal SchoolsGeneral Fund Per Pupil Expenditures by Program Groups by Enrollment Groups
Fiscal Year 2019–20Basic Special Vocational Skills Compensatory Other Community Districtwide School Food Pupil
Education Education Education Center Education Instructional Services Support Services Transportation
District Name % $/Pupil % $/Pupil % $/Pupil % $/Pupil % $/Pupil % $/Pupil % $/Pupil % $/Pupil % $/Pupil % $/PupilUnder 100Roosevelt 37.6% 7,824.89 6.8% 1,417.95 0.0% 0.00 0.0% 0.00 13.4% 2,783.79 0.0% 0.00 0.0% 0.00 28.3% 5,883.55 0.1% 14.44 13.8% 2,874.22Starbuck 49.6% 12,578.51 4.3% 1,096.98 0.0% 0.00 0.0% 0.00 0.5% 120.67 0.0% 0.00 0.0% 0.00 36.0% 9,134.08 1.8% 452.83 7.7% 1,958.00Index 43.9% 16,083.73 6.7% 2,457.68 0.0% 0.00 0.0% 0.00 2.1% 765.90 0.8% 304.93 0.5% 173.66 33.7% 12,343.55 1.6% 599.95 10.7% 3,918.48Palisades 29.7% 8,216.03 4.6% 1,261.85 0.0% 0.00 0.0% 0.00 12.7% 3,499.23 0.1% 20.60 2.7% 746.98 34.9% 9,646.40 2.1% 592.69 13.2% 3,642.97Queets-Clearwater 32.4% 11,451.57 6.1% 2,143.87 0.0% 0.00 0.0% 0.00 6.0% 2,113.14 0.0% 0.00 0.0% 0.00 42.2% 14,886.68 8.3% 2,919.28 5.1% 1,791.58Benge 48.0% 13,367.23 0.6% 179.49 0.0% 0.00 0.0% 0.00 3.5% 986.35 0.0% 0.00 0.0% 0.00 33.1% 9,215.21 4.2% 1,172.65 10.5% 2,938.75Star 53.4% 14,827.40 0.0% 0.00 0.0% 0.00 0.0% 0.00 1.7% 460.82 0.1% 27.34 0.0% 0.00 21.1% 5,845.83 0.0% 0.00 23.7% 6,579.42Dixie 34.7% 17,014.06 4.3% 2,116.20 0.0% 0.00 0.0% 0.00 11.4% 5,594.71 0.0% 0.00 0.0% 0.00 30.9% 15,177.09 7.0% 3,448.19 11.7% 5,741.56Stehekin 50.0% 9,951.12 0.0% 0.00 0.0% 0.00 0.0% 0.00 0.0% 0.00 0.0% 0.00 0.0% 0.00 48.1% 9,571.44 0.0% 0.00 1.8% 364.64Shaw 53.1% 27,766.31 2.0% 1,055.76 0.0% 0.00 0.0% 0.00 0.0% 0.00 5.8% 3,031.62 0.0% 0.00 39.1% 20,481.56 0.0% 0.00 0.0% 0.00
44 51.1% 13,791.57 6.6% 1,789.73 1.0% 275.13 0.0% 0.00 4.8% 1,307.36 0.5% 138.93 1.0% 260.11 24.6% 6,652.49 3.5% 948.44 6.8% 1,824.23
Except where otherwise noted, the School District & ESD Financial Reporting Summary for 2019–20 by Office of Superintendent of Public Instructions is licensed undera Creative Commons Attribution 4.0 International License.
61
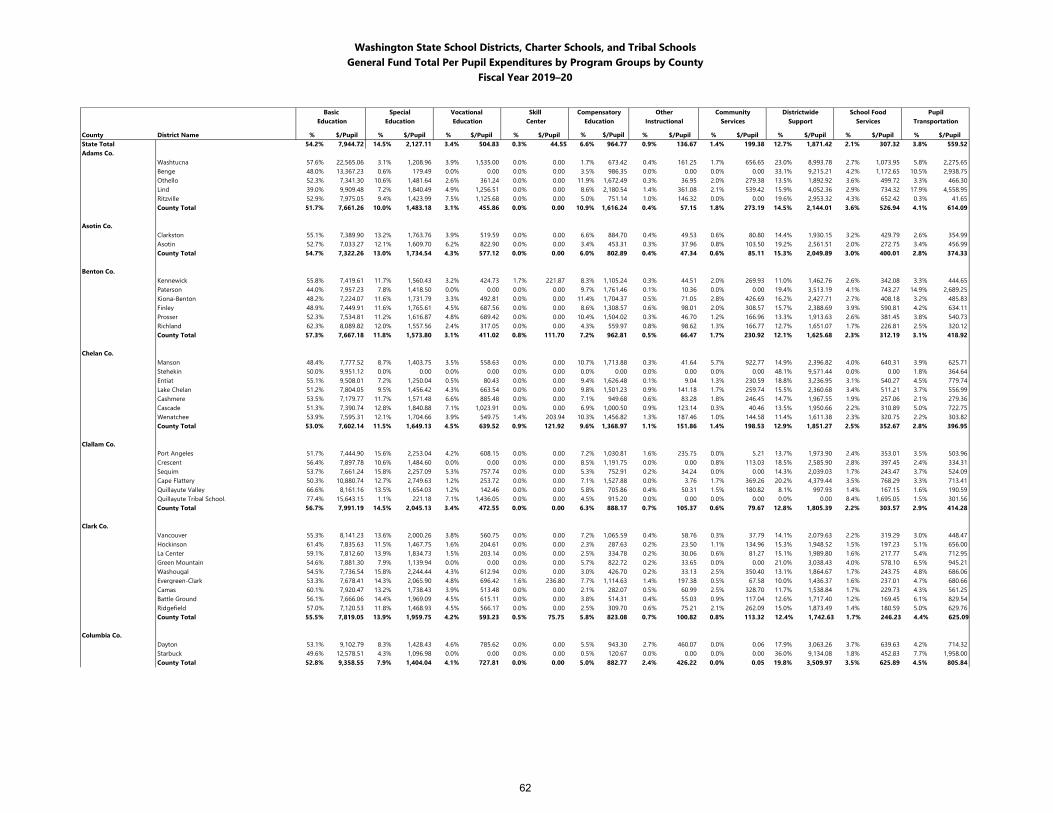
Washington State School Districts, Charter Schools, and Tribal SchoolsGeneral Fund Total Per Pupil Expenditures by Program Groups by County
Fiscal Year 2019–20
Basic Special Vocational Skill Compensatory Other Community Districtwide School Food Pupil Education Education Education Center Education Instructional Services Support Services Transportation
County District Name % $/Pupil % $/Pupil % $/Pupil % $/Pupil % $/Pupil % $/Pupil % $/Pupil % $/Pupil % $/Pupil % $/PupilState Total 54.2% 7,944.72 14.5% 2,127.11 3.4% 504.83 0.3% 44.55 6.6% 964.77 0.9% 136.67 1.4% 199.38 12.7% 1,871.42 2.1% 307.32 3.8% 559.52Adams Co.
Washtucna 57.6% 22,565.06 3.1% 1,208.96 3.9% 1,535.00 0.0% 0.00 1.7% 673.42 0.4% 161.25 1.7% 656.65 23.0% 8,993.78 2.7% 1,073.95 5.8% 2,275.65Benge 48.0% 13,367.23 0.6% 179.49 0.0% 0.00 0.0% 0.00 3.5% 986.35 0.0% 0.00 0.0% 0.00 33.1% 9,215.21 4.2% 1,172.65 10.5% 2,938.75Othello 52.3% 7,341.30 10.6% 1,481.64 2.6% 361.24 0.0% 0.00 11.9% 1,672.49 0.3% 36.95 2.0% 279.38 13.5% 1,892.92 3.6% 499.72 3.3% 466.30Lind 39.0% 9,909.48 7.2% 1,840.49 4.9% 1,256.51 0.0% 0.00 8.6% 2,180.54 1.4% 361.08 2.1% 539.42 15.9% 4,052.36 2.9% 734.32 17.9% 4,558.95Ritzville 52.9% 7,975.05 9.4% 1,423.99 7.5% 1,125.68 0.0% 0.00 5.0% 751.14 1.0% 146.32 0.0% 0.00 19.6% 2,953.32 4.3% 652.42 0.3% 41.65County Total 51.7% 7,661.26 10.0% 1,483.18 3.1% 455.86 0.0% 0.00 10.9% 1,616.24 0.4% 57.15 1.8% 273.19 14.5% 2,144.01 3.6% 526.94 4.1% 614.09
Asotin Co.Clarkston 55.1% 7,389.90 13.2% 1,763.76 3.9% 519.59 0.0% 0.00 6.6% 884.70 0.4% 49.53 0.6% 80.80 14.4% 1,930.15 3.2% 429.79 2.6% 354.99Asotin 52.7% 7,033.27 12.1% 1,609.70 6.2% 822.90 0.0% 0.00 3.4% 453.31 0.3% 37.96 0.8% 103.50 19.2% 2,561.51 2.0% 272.75 3.4% 456.99County Total 54.7% 7,322.26 13.0% 1,734.54 4.3% 577.12 0.0% 0.00 6.0% 802.89 0.4% 47.34 0.6% 85.11 15.3% 2,049.89 3.0% 400.01 2.8% 374.33
Benton Co.Kennewick 55.8% 7,419.61 11.7% 1,560.43 3.2% 424.73 1.7% 221.87 8.3% 1,105.24 0.3% 44.51 2.0% 269.93 11.0% 1,462.76 2.6% 342.08 3.3% 444.65Paterson 44.0% 7,957.23 7.8% 1,418.50 0.0% 0.00 0.0% 0.00 9.7% 1,761.46 0.1% 10.36 0.0% 0.00 19.4% 3,513.19 4.1% 743.27 14.9% 2,689.25Kiona-Benton 48.2% 7,224.07 11.6% 1,731.79 3.3% 492.81 0.0% 0.00 11.4% 1,704.37 0.5% 71.05 2.8% 426.69 16.2% 2,427.71 2.7% 408.18 3.2% 485.83Finley 48.9% 7,449.91 11.6% 1,765.61 4.5% 687.56 0.0% 0.00 8.6% 1,308.57 0.6% 98.01 2.0% 308.57 15.7% 2,388.69 3.9% 590.81 4.2% 634.11Prosser 52.3% 7,534.81 11.2% 1,616.87 4.8% 689.42 0.0% 0.00 10.4% 1,504.02 0.3% 46.70 1.2% 166.96 13.3% 1,913.63 2.6% 381.45 3.8% 540.73Richland 62.3% 8,089.82 12.0% 1,557.56 2.4% 317.05 0.0% 0.00 4.3% 559.97 0.8% 98.62 1.3% 166.77 12.7% 1,651.07 1.7% 226.81 2.5% 320.12County Total 57.3% 7,667.18 11.8% 1,573.80 3.1% 411.02 0.8% 111.70 7.2% 962.81 0.5% 66.47 1.7% 230.92 12.1% 1,625.68 2.3% 312.19 3.1% 418.92
Chelan Co.Manson 48.4% 7,777.52 8.7% 1,403.75 3.5% 558.63 0.0% 0.00 10.7% 1,713.88 0.3% 41.64 5.7% 922.77 14.9% 2,396.82 4.0% 640.31 3.9% 625.71Stehekin 50.0% 9,951.12 0.0% 0.00 0.0% 0.00 0.0% 0.00 0.0% 0.00 0.0% 0.00 0.0% 0.00 48.1% 9,571.44 0.0% 0.00 1.8% 364.64Entiat 55.1% 9,508.01 7.2% 1,250.04 0.5% 80.43 0.0% 0.00 9.4% 1,626.48 0.1% 9.04 1.3% 230.59 18.8% 3,236.95 3.1% 540.27 4.5% 779.74Lake Chelan 51.2% 7,804.05 9.5% 1,456.42 4.3% 663.54 0.0% 0.00 9.8% 1,501.23 0.9% 141.18 1.7% 259.74 15.5% 2,360.68 3.4% 511.21 3.7% 556.99Cashmere 53.5% 7,179.77 11.7% 1,571.48 6.6% 885.48 0.0% 0.00 7.1% 949.68 0.6% 83.28 1.8% 246.45 14.7% 1,967.55 1.9% 257.06 2.1% 279.36Cascade 51.3% 7,390.74 12.8% 1,840.88 7.1% 1,023.91 0.0% 0.00 6.9% 1,000.50 0.9% 123.14 0.3% 40.46 13.5% 1,950.66 2.2% 310.89 5.0% 722.75Wenatchee 53.9% 7,595.31 12.1% 1,704.66 3.9% 549.75 1.4% 203.94 10.3% 1,456.82 1.3% 187.46 1.0% 144.58 11.4% 1,611.38 2.3% 320.75 2.2% 303.82County Total 53.0% 7,602.14 11.5% 1,649.13 4.5% 639.52 0.9% 121.92 9.6% 1,368.97 1.1% 151.86 1.4% 198.53 12.9% 1,851.27 2.5% 352.67 2.8% 396.95
Clallam Co.Port Angeles 51.7% 7,444.90 15.6% 2,253.04 4.2% 608.15 0.0% 0.00 7.2% 1,030.81 1.6% 235.75 0.0% 5.21 13.7% 1,973.90 2.4% 353.01 3.5% 503.96Crescent 56.4% 7,897.78 10.6% 1,484.60 0.0% 0.00 0.0% 0.00 8.5% 1,191.75 0.0% 0.00 0.8% 113.03 18.5% 2,585.90 2.8% 397.45 2.4% 334.31Sequim 53.7% 7,661.24 15.8% 2,257.09 5.3% 757.74 0.0% 0.00 5.3% 752.91 0.2% 34.24 0.0% 0.00 14.3% 2,039.03 1.7% 243.47 3.7% 524.09Cape Flattery 50.3% 10,880.74 12.7% 2,749.63 1.2% 253.72 0.0% 0.00 7.1% 1,527.88 0.0% 3.76 1.7% 369.26 20.2% 4,379.44 3.5% 768.29 3.3% 713.41Quillayute Valley 66.6% 8,161.16 13.5% 1,654.03 1.2% 142.46 0.0% 0.00 5.8% 705.86 0.4% 50.31 1.5% 180.82 8.1% 997.93 1.4% 167.15 1.6% 190.59Quillayute Tribal School. 77.4% 15,643.15 1.1% 221.18 7.1% 1,436.05 0.0% 0.00 4.5% 915.20 0.0% 0.00 0.0% 0.00 0.0% 0.00 8.4% 1,695.05 1.5% 301.56County Total 56.7% 7,991.19 14.5% 2,045.13 3.4% 472.55 0.0% 0.00 6.3% 888.17 0.7% 105.37 0.6% 79.67 12.8% 1,805.39 2.2% 303.57 2.9% 414.28
Clark Co.Vancouver 55.3% 8,141.23 13.6% 2,000.26 3.8% 560.75 0.0% 0.00 7.2% 1,065.59 0.4% 58.76 0.3% 37.79 14.1% 2,079.63 2.2% 319.29 3.0% 448.47Hockinson 61.4% 7,835.63 11.5% 1,467.75 1.6% 204.61 0.0% 0.00 2.3% 287.63 0.2% 23.50 1.1% 134.96 15.3% 1,948.52 1.5% 197.23 5.1% 656.00La Center 59.1% 7,812.60 13.9% 1,834.73 1.5% 203.14 0.0% 0.00 2.5% 334.78 0.2% 30.06 0.6% 81.27 15.1% 1,989.80 1.6% 217.77 5.4% 712.95Green Mountain 54.6% 7,881.30 7.9% 1,139.94 0.0% 0.00 0.0% 0.00 5.7% 822.72 0.2% 33.65 0.0% 0.00 21.0% 3,038.43 4.0% 578.10 6.5% 945.21Washougal 54.5% 7,736.54 15.8% 2,244.44 4.3% 612.94 0.0% 0.00 3.0% 426.70 0.2% 33.13 2.5% 350.40 13.1% 1,864.67 1.7% 243.75 4.8% 686.06Evergreen-Clark 53.3% 7,678.41 14.3% 2,065.90 4.8% 696.42 1.6% 236.80 7.7% 1,114.63 1.4% 197.38 0.5% 67.58 10.0% 1,436.37 1.6% 237.01 4.7% 680.66Camas 60.1% 7,920.47 13.2% 1,738.43 3.9% 513.48 0.0% 0.00 2.1% 282.07 0.5% 60.99 2.5% 328.70 11.7% 1,538.84 1.7% 229.73 4.3% 561.25Battle Ground 56.1% 7,666.06 14.4% 1,969.09 4.5% 615.11 0.0% 0.00 3.8% 514.31 0.4% 55.03 0.9% 117.04 12.6% 1,717.40 1.2% 169.45 6.1% 829.54Ridgefield 57.0% 7,120.53 11.8% 1,468.93 4.5% 566.17 0.0% 0.00 2.5% 309.70 0.6% 75.21 2.1% 262.09 15.0% 1,873.49 1.4% 180.59 5.0% 629.76County Total 55.5% 7,819.05 13.9% 1,959.75 4.2% 593.23 0.5% 75.75 5.8% 823.08 0.7% 100.82 0.8% 113.32 12.4% 1,742.63 1.7% 246.23 4.4% 625.09
Columbia Co.Dayton 53.1% 9,102.79 8.3% 1,428.43 4.6% 785.62 0.0% 0.00 5.5% 943.30 2.7% 460.07 0.0% 0.06 17.9% 3,063.26 3.7% 639.63 4.2% 714.32Starbuck 49.6% 12,578.51 4.3% 1,096.98 0.0% 0.00 0.0% 0.00 0.5% 120.67 0.0% 0.00 0.0% 0.00 36.0% 9,134.08 1.8% 452.83 7.7% 1,958.00County Total 52.8% 9,358.55 7.9% 1,404.04 4.1% 727.81 0.0% 0.00 5.0% 882.77 2.4% 426.22 0.0% 0.05 19.8% 3,509.97 3.5% 625.89 4.5% 805.84
62
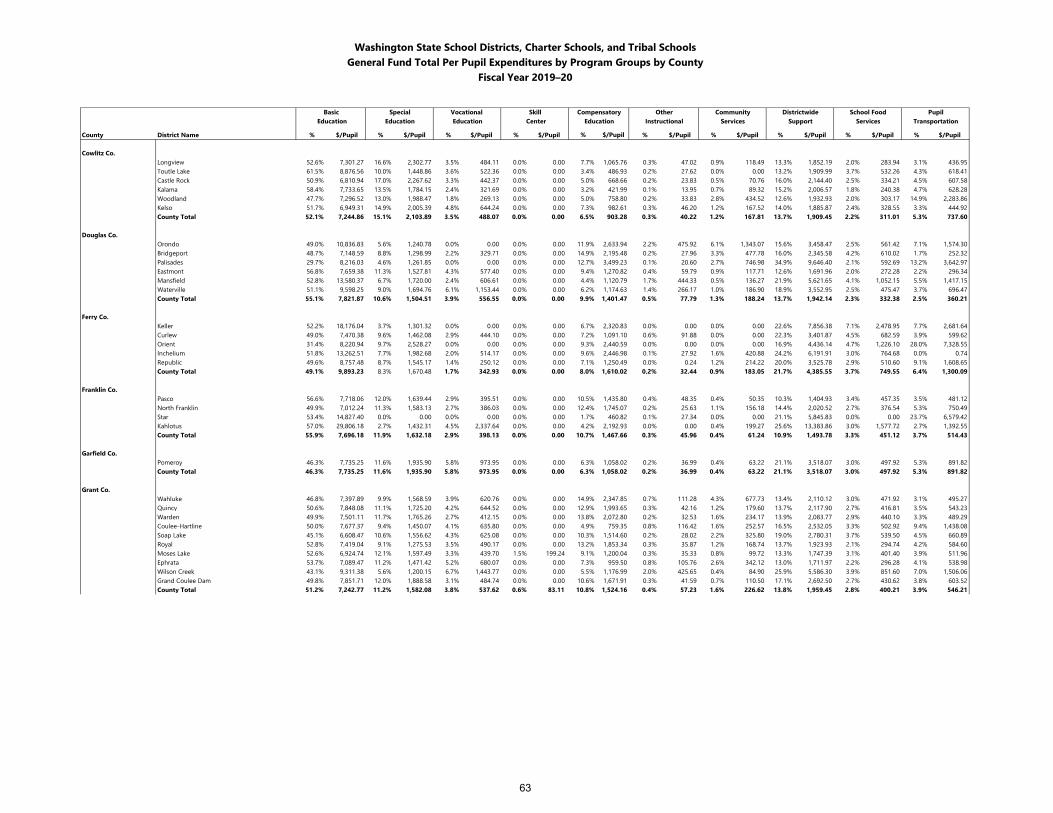
Washington State School Districts, Charter Schools, and Tribal SchoolsGeneral Fund Total Per Pupil Expenditures by Program Groups by County
Fiscal Year 2019–20
Basic Special Vocational Skill Compensatory Other Community Districtwide School Food Pupil Education Education Education Center Education Instructional Services Support Services Transportation
County District Name % $/Pupil % $/Pupil % $/Pupil % $/Pupil % $/Pupil % $/Pupil % $/Pupil % $/Pupil % $/Pupil % $/Pupil
Cowlitz Co.Longview 52.6% 7,301.27 16.6% 2,302.77 3.5% 484.11 0.0% 0.00 7.7% 1,065.76 0.3% 47.02 0.9% 118.49 13.3% 1,852.19 2.0% 283.94 3.1% 436.95Toutle Lake 61.5% 8,876.56 10.0% 1,448.86 3.6% 522.36 0.0% 0.00 3.4% 486.93 0.2% 27.62 0.0% 0.00 13.2% 1,909.99 3.7% 532.26 4.3% 618.41Castle Rock 50.9% 6,810.94 17.0% 2,267.62 3.3% 442.37 0.0% 0.00 5.0% 668.66 0.2% 23.83 0.5% 70.76 16.0% 2,144.40 2.5% 334.21 4.5% 607.58Kalama 58.4% 7,733.65 13.5% 1,784.15 2.4% 321.69 0.0% 0.00 3.2% 421.99 0.1% 13.95 0.7% 89.32 15.2% 2,006.57 1.8% 240.38 4.7% 628.28Woodland 47.7% 7,296.52 13.0% 1,988.47 1.8% 269.13 0.0% 0.00 5.0% 758.80 0.2% 33.83 2.8% 434.52 12.6% 1,932.93 2.0% 303.17 14.9% 2,283.86Kelso 51.7% 6,949.31 14.9% 2,005.39 4.8% 644.24 0.0% 0.00 7.3% 982.61 0.3% 46.20 1.2% 167.52 14.0% 1,885.87 2.4% 328.55 3.3% 444.92County Total 52.1% 7,244.86 15.1% 2,103.89 3.5% 488.07 0.0% 0.00 6.5% 903.28 0.3% 40.22 1.2% 167.81 13.7% 1,909.45 2.2% 311.01 5.3% 737.60
Douglas Co.Orondo 49.0% 10,836.83 5.6% 1,240.78 0.0% 0.00 0.0% 0.00 11.9% 2,633.94 2.2% 475.92 6.1% 1,343.07 15.6% 3,458.47 2.5% 561.42 7.1% 1,574.30Bridgeport 48.7% 7,148.59 8.8% 1,298.99 2.2% 329.71 0.0% 0.00 14.9% 2,195.48 0.2% 27.96 3.3% 477.78 16.0% 2,345.58 4.2% 610.02 1.7% 252.32Palisades 29.7% 8,216.03 4.6% 1,261.85 0.0% 0.00 0.0% 0.00 12.7% 3,499.23 0.1% 20.60 2.7% 746.98 34.9% 9,646.40 2.1% 592.69 13.2% 3,642.97Eastmont 56.8% 7,659.38 11.3% 1,527.81 4.3% 577.40 0.0% 0.00 9.4% 1,270.82 0.4% 59.79 0.9% 117.71 12.6% 1,691.96 2.0% 272.28 2.2% 296.34Mansfield 52.8% 13,580.37 6.7% 1,720.00 2.4% 606.61 0.0% 0.00 4.4% 1,120.79 1.7% 444.33 0.5% 136.27 21.9% 5,621.65 4.1% 1,052.15 5.5% 1,417.15Waterville 51.1% 9,598.25 9.0% 1,694.76 6.1% 1,153.44 0.0% 0.00 6.2% 1,174.63 1.4% 266.17 1.0% 186.90 18.9% 3,552.95 2.5% 475.47 3.7% 696.47County Total 55.1% 7,821.87 10.6% 1,504.51 3.9% 556.55 0.0% 0.00 9.9% 1,401.47 0.5% 77.79 1.3% 188.24 13.7% 1,942.14 2.3% 332.38 2.5% 360.21
Ferry Co.Keller 52.2% 18,176.04 3.7% 1,301.32 0.0% 0.00 0.0% 0.00 6.7% 2,320.83 0.0% 0.00 0.0% 0.00 22.6% 7,856.38 7.1% 2,478.95 7.7% 2,681.64Curlew 49.0% 7,470.38 9.6% 1,462.08 2.9% 444.10 0.0% 0.00 7.2% 1,091.10 0.6% 91.88 0.0% 0.00 22.3% 3,401.87 4.5% 682.59 3.9% 599.62Orient 31.4% 8,220.94 9.7% 2,528.27 0.0% 0.00 0.0% 0.00 9.3% 2,440.59 0.0% 0.00 0.0% 0.00 16.9% 4,436.14 4.7% 1,226.10 28.0% 7,328.55Inchelium 51.8% 13,262.51 7.7% 1,982.68 2.0% 514.17 0.0% 0.00 9.6% 2,446.98 0.1% 27.92 1.6% 420.88 24.2% 6,191.91 3.0% 764.68 0.0% 0.74Republic 49.6% 8,757.48 8.7% 1,545.17 1.4% 250.12 0.0% 0.00 7.1% 1,250.49 0.0% 0.24 1.2% 214.22 20.0% 3,525.78 2.9% 510.60 9.1% 1,608.65County Total 49.1% 9,893.23 8.3% 1,670.48 1.7% 342.93 0.0% 0.00 8.0% 1,610.02 0.2% 32.44 0.9% 183.05 21.7% 4,385.55 3.7% 749.55 6.4% 1,300.09
Franklin Co.Pasco 56.6% 7,718.06 12.0% 1,639.44 2.9% 395.51 0.0% 0.00 10.5% 1,435.80 0.4% 48.35 0.4% 50.35 10.3% 1,404.93 3.4% 457.35 3.5% 481.12North Franklin 49.9% 7,012.24 11.3% 1,583.13 2.7% 386.03 0.0% 0.00 12.4% 1,745.07 0.2% 25.63 1.1% 156.18 14.4% 2,020.52 2.7% 376.54 5.3% 750.49Star 53.4% 14,827.40 0.0% 0.00 0.0% 0.00 0.0% 0.00 1.7% 460.82 0.1% 27.34 0.0% 0.00 21.1% 5,845.83 0.0% 0.00 23.7% 6,579.42Kahlotus 57.0% 29,806.18 2.7% 1,432.31 4.5% 2,337.64 0.0% 0.00 4.2% 2,192.93 0.0% 0.00 0.4% 199.27 25.6% 13,383.86 3.0% 1,577.72 2.7% 1,392.55County Total 55.9% 7,696.18 11.9% 1,632.18 2.9% 398.13 0.0% 0.00 10.7% 1,467.66 0.3% 45.96 0.4% 61.24 10.9% 1,493.78 3.3% 451.12 3.7% 514.43
Garfield Co.Pomeroy 46.3% 7,735.25 11.6% 1,935.90 5.8% 973.95 0.0% 0.00 6.3% 1,058.02 0.2% 36.99 0.4% 63.22 21.1% 3,518.07 3.0% 497.92 5.3% 891.82County Total 46.3% 7,735.25 11.6% 1,935.90 5.8% 973.95 0.0% 0.00 6.3% 1,058.02 0.2% 36.99 0.4% 63.22 21.1% 3,518.07 3.0% 497.92 5.3% 891.82
Grant Co.Wahluke 46.8% 7,397.89 9.9% 1,568.59 3.9% 620.76 0.0% 0.00 14.9% 2,347.85 0.7% 111.28 4.3% 677.73 13.4% 2,110.12 3.0% 471.92 3.1% 495.27Quincy 50.6% 7,848.08 11.1% 1,725.20 4.2% 644.52 0.0% 0.00 12.9% 1,993.65 0.3% 42.16 1.2% 179.60 13.7% 2,117.90 2.7% 416.81 3.5% 543.23Warden 49.9% 7,501.11 11.7% 1,765.26 2.7% 412.15 0.0% 0.00 13.8% 2,072.80 0.2% 32.53 1.6% 234.17 13.9% 2,083.77 2.9% 440.10 3.3% 489.29Coulee-Hartline 50.0% 7,677.37 9.4% 1,450.07 4.1% 635.80 0.0% 0.00 4.9% 759.35 0.8% 116.42 1.6% 252.57 16.5% 2,532.05 3.3% 502.92 9.4% 1,438.08Soap Lake 45.1% 6,608.47 10.6% 1,556.62 4.3% 625.08 0.0% 0.00 10.3% 1,514.60 0.2% 28.02 2.2% 325.80 19.0% 2,780.31 3.7% 539.50 4.5% 660.89Royal 52.8% 7,419.04 9.1% 1,275.53 3.5% 490.17 0.0% 0.00 13.2% 1,853.34 0.3% 35.87 1.2% 168.74 13.7% 1,923.93 2.1% 294.74 4.2% 584.60Moses Lake 52.6% 6,924.74 12.1% 1,597.49 3.3% 439.70 1.5% 199.24 9.1% 1,200.04 0.3% 35.33 0.8% 99.72 13.3% 1,747.39 3.1% 401.40 3.9% 511.96Ephrata 53.7% 7,089.47 11.2% 1,471.42 5.2% 680.07 0.0% 0.00 7.3% 959.50 0.8% 105.76 2.6% 342.12 13.0% 1,711.97 2.2% 296.28 4.1% 538.98Wilson Creek 43.1% 9,311.38 5.6% 1,200.15 6.7% 1,443.77 0.0% 0.00 5.5% 1,176.99 2.0% 425.65 0.4% 84.90 25.9% 5,586.30 3.9% 851.60 7.0% 1,506.06Grand Coulee Dam 49.8% 7,851.71 12.0% 1,888.58 3.1% 484.74 0.0% 0.00 10.6% 1,671.91 0.3% 41.59 0.7% 110.50 17.1% 2,692.50 2.7% 430.62 3.8% 603.52County Total 51.2% 7,242.77 11.2% 1,582.08 3.8% 537.62 0.6% 83.11 10.8% 1,524.16 0.4% 57.23 1.6% 226.62 13.8% 1,959.45 2.8% 400.21 3.9% 546.21
63
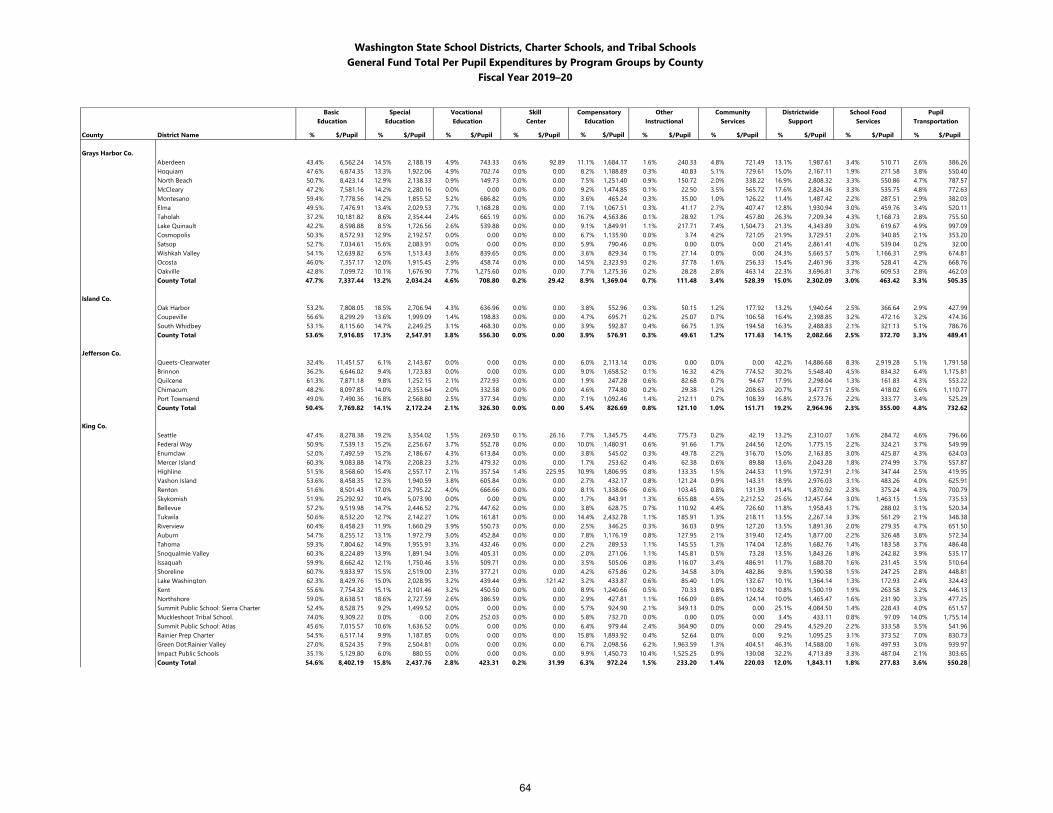
Washington State School Districts, Charter Schools, and Tribal SchoolsGeneral Fund Total Per Pupil Expenditures by Program Groups by County
Fiscal Year 2019–20
Basic Special Vocational Skill Compensatory Other Community Districtwide School Food Pupil Education Education Education Center Education Instructional Services Support Services Transportation
County District Name % $/Pupil % $/Pupil % $/Pupil % $/Pupil % $/Pupil % $/Pupil % $/Pupil % $/Pupil % $/Pupil % $/Pupil
Grays Harbor Co.Aberdeen 43.4% 6,562.24 14.5% 2,188.19 4.9% 743.33 0.6% 92.89 11.1% 1,684.17 1.6% 240.33 4.8% 721.49 13.1% 1,987.61 3.4% 510.71 2.6% 386.26Hoquiam 47.6% 6,874.35 13.3% 1,922.06 4.9% 702.74 0.0% 0.00 8.2% 1,188.89 0.3% 40.83 5.1% 729.61 15.0% 2,167.11 1.9% 271.58 3.8% 550.40North Beach 50.7% 8,423.14 12.9% 2,138.33 0.9% 149.73 0.0% 0.00 7.5% 1,251.40 0.9% 150.72 2.0% 338.22 16.9% 2,808.32 3.3% 550.86 4.7% 787.57McCleary 47.2% 7,581.16 14.2% 2,280.16 0.0% 0.00 0.0% 0.00 9.2% 1,474.85 0.1% 22.50 3.5% 565.72 17.6% 2,824.36 3.3% 535.75 4.8% 772.63Montesano 59.4% 7,778.56 14.2% 1,855.52 5.2% 686.82 0.0% 0.00 3.6% 465.24 0.3% 35.00 1.0% 126.22 11.4% 1,487.42 2.2% 287.51 2.9% 382.03Elma 49.5% 7,476.91 13.4% 2,029.53 7.7% 1,168.28 0.0% 0.00 7.1% 1,067.51 0.3% 41.17 2.7% 407.47 12.8% 1,930.94 3.0% 459.76 3.4% 520.11Taholah 37.2% 10,181.82 8.6% 2,354.44 2.4% 665.19 0.0% 0.00 16.7% 4,563.86 0.1% 28.92 1.7% 457.80 26.3% 7,209.34 4.3% 1,168.73 2.8% 755.50Lake Quinault 42.2% 8,598.88 8.5% 1,726.56 2.6% 539.88 0.0% 0.00 9.1% 1,849.91 1.1% 217.71 7.4% 1,504.73 21.3% 4,343.89 3.0% 619.67 4.9% 997.09Cosmopolis 50.3% 8,572.93 12.9% 2,192.57 0.0% 0.00 0.0% 0.00 6.7% 1,135.90 0.0% 3.74 4.2% 721.05 21.9% 3,729.51 2.0% 340.85 2.1% 353.20Satsop 52.7% 7,034.61 15.6% 2,083.91 0.0% 0.00 0.0% 0.00 5.9% 790.46 0.0% 0.00 0.0% 0.00 21.4% 2,861.41 4.0% 539.04 0.2% 32.00Wishkah Valley 54.1% 12,639.82 6.5% 1,513.43 3.6% 839.65 0.0% 0.00 3.6% 829.34 0.1% 27.14 0.0% 0.00 24.3% 5,665.57 5.0% 1,166.31 2.9% 674.81Ocosta 46.0% 7,357.17 12.0% 1,915.45 2.9% 458.74 0.0% 0.00 14.5% 2,323.93 0.2% 37.78 1.6% 256.33 15.4% 2,461.96 3.3% 528.41 4.2% 668.76Oakville 42.8% 7,099.72 10.1% 1,676.90 7.7% 1,275.60 0.0% 0.00 7.7% 1,275.36 0.2% 28.28 2.8% 463.14 22.3% 3,696.81 3.7% 609.53 2.8% 462.03County Total 47.7% 7,337.44 13.2% 2,034.24 4.6% 708.80 0.2% 29.42 8.9% 1,369.04 0.7% 111.48 3.4% 528.39 15.0% 2,302.09 3.0% 463.42 3.3% 505.35
Island Co.Oak Harbor 53.2% 7,808.05 18.5% 2,706.94 4.3% 636.96 0.0% 0.00 3.8% 552.96 0.3% 50.15 1.2% 177.92 13.2% 1,940.64 2.5% 366.64 2.9% 427.99Coupeville 56.6% 8,299.29 13.6% 1,999.09 1.4% 198.83 0.0% 0.00 4.7% 695.71 0.2% 25.07 0.7% 106.58 16.4% 2,398.85 3.2% 472.16 3.2% 474.36South Whidbey 53.1% 8,115.60 14.7% 2,249.25 3.1% 468.30 0.0% 0.00 3.9% 592.87 0.4% 66.75 1.3% 194.58 16.3% 2,488.83 2.1% 321.13 5.1% 786.76County Total 53.6% 7,916.85 17.3% 2,547.91 3.8% 556.30 0.0% 0.00 3.9% 576.91 0.3% 49.61 1.2% 171.63 14.1% 2,082.66 2.5% 372.70 3.3% 489.41
Jefferson Co.Queets-Clearwater 32.4% 11,451.57 6.1% 2,143.87 0.0% 0.00 0.0% 0.00 6.0% 2,113.14 0.0% 0.00 0.0% 0.00 42.2% 14,886.68 8.3% 2,919.28 5.1% 1,791.58Brinnon 36.2% 6,646.02 9.4% 1,723.83 0.0% 0.00 0.0% 0.00 9.0% 1,658.52 0.1% 16.32 4.2% 774.52 30.2% 5,548.40 4.5% 834.32 6.4% 1,175.81Quilcene 61.3% 7,871.18 9.8% 1,252.15 2.1% 272.93 0.0% 0.00 1.9% 247.28 0.6% 82.68 0.7% 94.67 17.9% 2,298.04 1.3% 161.83 4.3% 553.22Chimacum 48.2% 8,097.85 14.0% 2,353.64 2.0% 332.58 0.0% 0.00 4.6% 774.80 0.2% 29.38 1.2% 208.63 20.7% 3,477.51 2.5% 418.02 6.6% 1,110.77Port Townsend 49.0% 7,490.36 16.8% 2,568.80 2.5% 377.34 0.0% 0.00 7.1% 1,092.46 1.4% 212.11 0.7% 108.39 16.8% 2,573.76 2.2% 333.77 3.4% 525.29County Total 50.4% 7,769.82 14.1% 2,172.24 2.1% 326.30 0.0% 0.00 5.4% 826.69 0.8% 121.10 1.0% 151.71 19.2% 2,964.96 2.3% 355.00 4.8% 732.62
King Co.Seattle 47.4% 8,278.38 19.2% 3,354.02 1.5% 269.50 0.1% 26.16 7.7% 1,345.75 4.4% 775.73 0.2% 42.19 13.2% 2,310.07 1.6% 284.72 4.6% 796.66Federal Way 50.9% 7,539.13 15.2% 2,256.67 3.7% 552.78 0.0% 0.00 10.0% 1,480.91 0.6% 91.66 1.7% 244.56 12.0% 1,775.15 2.2% 324.21 3.7% 549.99Enumclaw 52.0% 7,492.59 15.2% 2,186.67 4.3% 613.84 0.0% 0.00 3.8% 545.02 0.3% 49.78 2.2% 316.70 15.0% 2,163.85 3.0% 425.87 4.3% 624.03Mercer Island 60.3% 9,083.88 14.7% 2,208.23 3.2% 479.32 0.0% 0.00 1.7% 253.62 0.4% 62.38 0.6% 89.88 13.6% 2,043.28 1.8% 274.99 3.7% 557.87Highline 51.5% 8,568.60 15.4% 2,557.17 2.1% 357.54 1.4% 225.95 10.9% 1,806.95 0.8% 133.35 1.5% 244.53 11.9% 1,972.91 2.1% 347.44 2.5% 419.95Vashon Island 53.6% 8,458.35 12.3% 1,940.59 3.8% 605.84 0.0% 0.00 2.7% 432.17 0.8% 121.24 0.9% 143.31 18.9% 2,976.03 3.1% 483.26 4.0% 625.91Renton 51.6% 8,501.43 17.0% 2,795.22 4.0% 666.66 0.0% 0.00 8.1% 1,338.06 0.6% 103.45 0.8% 131.39 11.4% 1,870.92 2.3% 375.24 4.3% 700.79Skykomish 51.9% 25,292.92 10.4% 5,073.90 0.0% 0.00 0.0% 0.00 1.7% 843.91 1.3% 655.88 4.5% 2,212.52 25.6% 12,457.64 3.0% 1,463.15 1.5% 735.53Bellevue 57.2% 9,519.98 14.7% 2,446.52 2.7% 447.62 0.0% 0.00 3.8% 628.75 0.7% 110.92 4.4% 726.60 11.8% 1,958.43 1.7% 288.02 3.1% 520.34Tukwila 50.6% 8,532.20 12.7% 2,142.27 1.0% 161.81 0.0% 0.00 14.4% 2,432.78 1.1% 185.91 1.3% 218.11 13.5% 2,267.14 3.3% 561.29 2.1% 348.38Riverview 60.4% 8,458.23 11.9% 1,660.29 3.9% 550.73 0.0% 0.00 2.5% 346.25 0.3% 36.03 0.9% 127.20 13.5% 1,891.36 2.0% 279.35 4.7% 651.50Auburn 54.7% 8,255.12 13.1% 1,972.79 3.0% 452.84 0.0% 0.00 7.8% 1,176.19 0.8% 127.95 2.1% 319.40 12.4% 1,877.00 2.2% 326.48 3.8% 572.34Tahoma 59.3% 7,804.62 14.9% 1,955.91 3.3% 432.46 0.0% 0.00 2.2% 289.53 1.1% 145.55 1.3% 174.04 12.8% 1,682.76 1.4% 183.58 3.7% 486.48Snoqualmie Valley 60.3% 8,224.89 13.9% 1,891.94 3.0% 405.31 0.0% 0.00 2.0% 271.06 1.1% 145.81 0.5% 73.28 13.5% 1,843.26 1.8% 242.82 3.9% 535.17Issaquah 59.9% 8,662.42 12.1% 1,750.46 3.5% 509.71 0.0% 0.00 3.5% 505.06 0.8% 116.07 3.4% 486.91 11.7% 1,688.70 1.6% 231.45 3.5% 510.64Shoreline 60.7% 9,833.97 15.5% 2,519.00 2.3% 377.21 0.0% 0.00 4.2% 675.86 0.2% 34.58 3.0% 482.86 9.8% 1,590.58 1.5% 247.25 2.8% 448.81Lake Washington 62.3% 8,429.76 15.0% 2,028.95 3.2% 439.44 0.9% 121.42 3.2% 433.87 0.6% 85.40 1.0% 132.67 10.1% 1,364.14 1.3% 172.93 2.4% 324.43Kent 55.6% 7,754.32 15.1% 2,101.46 3.2% 450.50 0.0% 0.00 8.9% 1,240.66 0.5% 70.33 0.8% 110.82 10.8% 1,500.19 1.9% 263.58 3.2% 446.13Northshore 59.0% 8,638.51 18.6% 2,727.59 2.6% 386.59 0.0% 0.00 2.9% 427.81 1.1% 166.09 0.8% 124.14 10.0% 1,465.47 1.6% 231.90 3.3% 477.25Summit Public School: Sierra Charter 52.4% 8,528.75 9.2% 1,499.52 0.0% 0.00 0.0% 0.00 5.7% 924.90 2.1% 349.13 0.0% 0.00 25.1% 4,084.50 1.4% 228.43 4.0% 651.57Muckleshoot Tribal School. 74.0% 9,309.22 0.0% 0.00 2.0% 252.03 0.0% 0.00 5.8% 732.70 0.0% 0.00 0.0% 0.00 3.4% 433.11 0.8% 97.09 14.0% 1,755.14Summit Public School: Atlas 45.6% 7,015.57 10.6% 1,636.52 0.0% 0.00 0.0% 0.00 6.4% 979.44 2.4% 364.90 0.0% 0.00 29.4% 4,529.20 2.2% 333.58 3.5% 541.96Rainier Prep Charter 54.5% 6,517.14 9.9% 1,187.85 0.0% 0.00 0.0% 0.00 15.8% 1,893.92 0.4% 52.64 0.0% 0.00 9.2% 1,095.25 3.1% 373.52 7.0% 830.73Green Dot:Rainier Valley 27.0% 8,524.35 7.9% 2,504.81 0.0% 0.00 0.0% 0.00 6.7% 2,098.56 6.2% 1,963.59 1.3% 404.51 46.3% 14,588.00 1.6% 497.93 3.0% 939.97Impact Public Schools 35.1% 5,129.80 6.0% 880.55 0.0% 0.00 0.0% 0.00 9.9% 1,450.73 10.4% 1,525.25 0.9% 130.08 32.2% 4,713.89 3.3% 487.04 2.1% 303.65County Total 54.6% 8,402.19 15.8% 2,437.76 2.8% 423.31 0.2% 31.99 6.3% 972.24 1.5% 233.20 1.4% 220.03 12.0% 1,843.11 1.8% 277.83 3.6% 550.28
64
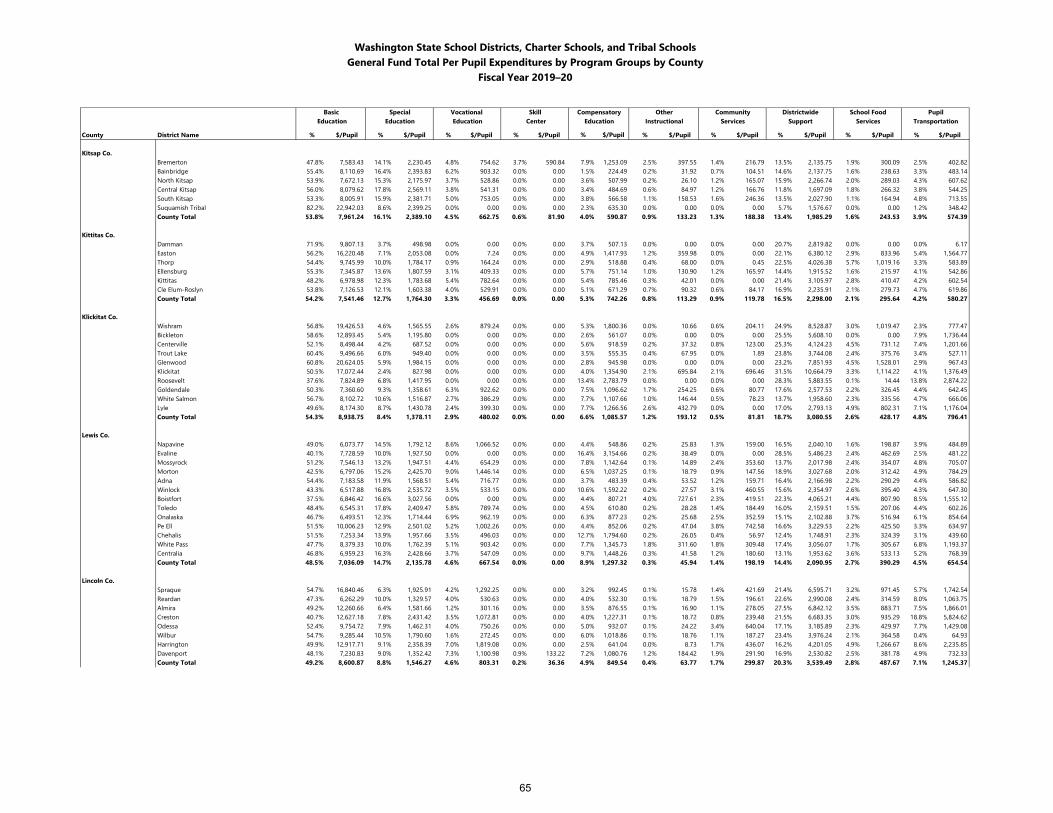
Washington State School Districts, Charter Schools, and Tribal SchoolsGeneral Fund Total Per Pupil Expenditures by Program Groups by County
Fiscal Year 2019–20
Basic Special Vocational Skill Compensatory Other Community Districtwide School Food Pupil Education Education Education Center Education Instructional Services Support Services Transportation
County District Name % $/Pupil % $/Pupil % $/Pupil % $/Pupil % $/Pupil % $/Pupil % $/Pupil % $/Pupil % $/Pupil % $/Pupil
Kitsap Co.Bremerton 47.8% 7,583.43 14.1% 2,230.45 4.8% 754.62 3.7% 590.84 7.9% 1,253.09 2.5% 397.55 1.4% 216.79 13.5% 2,135.75 1.9% 300.09 2.5% 402.82Bainbridge 55.4% 8,110.69 16.4% 2,393.83 6.2% 903.32 0.0% 0.00 1.5% 224.49 0.2% 31.92 0.7% 104.51 14.6% 2,137.75 1.6% 238.63 3.3% 483.14North Kitsap 53.9% 7,672.13 15.3% 2,175.97 3.7% 528.86 0.0% 0.00 3.6% 507.99 0.2% 26.10 1.2% 165.07 15.9% 2,266.74 2.0% 289.03 4.3% 607.62Central Kitsap 56.0% 8,079.62 17.8% 2,569.11 3.8% 541.31 0.0% 0.00 3.4% 484.69 0.6% 84.97 1.2% 166.76 11.8% 1,697.09 1.8% 266.32 3.8% 544.25South Kitsap 53.3% 8,005.91 15.9% 2,381.71 5.0% 753.05 0.0% 0.00 3.8% 566.58 1.1% 158.53 1.6% 246.36 13.5% 2,027.90 1.1% 164.94 4.8% 713.55Suquamish Tribal 82.2% 22,942.03 8.6% 2,399.25 0.0% 0.00 0.0% 0.00 2.3% 635.30 0.0% 0.00 0.0% 0.00 5.7% 1,576.67 0.0% 0.00 1.2% 348.42County Total 53.8% 7,961.24 16.1% 2,389.10 4.5% 662.75 0.6% 81.90 4.0% 590.87 0.9% 133.23 1.3% 188.38 13.4% 1,985.29 1.6% 243.53 3.9% 574.39
Kittitas Co.Damman 71.9% 9,807.13 3.7% 498.98 0.0% 0.00 0.0% 0.00 3.7% 507.13 0.0% 0.00 0.0% 0.00 20.7% 2,819.82 0.0% 0.00 0.0% 6.17Easton 56.2% 16,220.48 7.1% 2,053.08 0.0% 7.24 0.0% 0.00 4.9% 1,417.93 1.2% 359.98 0.0% 0.00 22.1% 6,380.12 2.9% 833.96 5.4% 1,564.77Thorp 54.4% 9,745.99 10.0% 1,784.17 0.9% 164.24 0.0% 0.00 2.9% 518.88 0.4% 68.00 0.0% 0.45 22.5% 4,026.38 5.7% 1,019.16 3.3% 583.89Ellensburg 55.3% 7,345.87 13.6% 1,807.59 3.1% 409.33 0.0% 0.00 5.7% 751.14 1.0% 130.90 1.2% 165.97 14.4% 1,915.52 1.6% 215.97 4.1% 542.86Kittitas 48.2% 6,978.98 12.3% 1,783.68 5.4% 782.64 0.0% 0.00 5.4% 785.46 0.3% 42.01 0.0% 0.00 21.4% 3,105.97 2.8% 410.47 4.2% 602.54Cle Elum-Roslyn 53.8% 7,126.53 12.1% 1,603.38 4.0% 529.91 0.0% 0.00 5.1% 671.29 0.7% 90.32 0.6% 84.17 16.9% 2,235.91 2.1% 279.73 4.7% 619.86County Total 54.2% 7,541.46 12.7% 1,764.30 3.3% 456.69 0.0% 0.00 5.3% 742.26 0.8% 113.29 0.9% 119.78 16.5% 2,298.00 2.1% 295.64 4.2% 580.27
Klickitat Co.Wishram 56.8% 19,426.53 4.6% 1,565.55 2.6% 879.24 0.0% 0.00 5.3% 1,800.36 0.0% 10.66 0.6% 204.11 24.9% 8,528.87 3.0% 1,019.47 2.3% 777.47Bickleton 58.6% 12,893.45 5.4% 1,195.80 0.0% 0.00 0.0% 0.00 2.6% 561.07 0.0% 0.00 0.0% 0.00 25.5% 5,608.10 0.0% 0.00 7.9% 1,736.44Centerville 52.1% 8,498.44 4.2% 687.52 0.0% 0.00 0.0% 0.00 5.6% 918.59 0.2% 37.32 0.8% 123.00 25.3% 4,124.23 4.5% 731.12 7.4% 1,201.66Trout Lake 60.4% 9,496.66 6.0% 949.40 0.0% 0.00 0.0% 0.00 3.5% 555.35 0.4% 67.95 0.0% 1.89 23.8% 3,744.08 2.4% 375.76 3.4% 527.11Glenwood 60.8% 20,624.05 5.9% 1,984.15 0.0% 0.00 0.0% 0.00 2.8% 945.98 0.0% 0.00 0.0% 0.00 23.2% 7,851.93 4.5% 1,528.01 2.9% 967.43Klickitat 50.5% 17,072.44 2.4% 827.98 0.0% 0.00 0.0% 0.00 4.0% 1,354.90 2.1% 695.84 2.1% 696.46 31.5% 10,664.79 3.3% 1,114.22 4.1% 1,376.49Roosevelt 37.6% 7,824.89 6.8% 1,417.95 0.0% 0.00 0.0% 0.00 13.4% 2,783.79 0.0% 0.00 0.0% 0.00 28.3% 5,883.55 0.1% 14.44 13.8% 2,874.22Goldendale 50.3% 7,360.60 9.3% 1,358.61 6.3% 922.62 0.0% 0.00 7.5% 1,096.62 1.7% 254.25 0.6% 80.77 17.6% 2,577.53 2.2% 326.45 4.4% 642.45White Salmon 56.7% 8,102.72 10.6% 1,516.87 2.7% 386.29 0.0% 0.00 7.7% 1,107.66 1.0% 146.44 0.5% 78.23 13.7% 1,958.60 2.3% 335.56 4.7% 666.06Lyle 49.6% 8,174.30 8.7% 1,430.78 2.4% 399.30 0.0% 0.00 7.7% 1,266.56 2.6% 432.79 0.0% 0.00 17.0% 2,793.13 4.9% 802.31 7.1% 1,176.04County Total 54.3% 8,938.75 8.4% 1,378.11 2.9% 480.02 0.0% 0.00 6.6% 1,085.57 1.2% 193.12 0.5% 81.81 18.7% 3,080.55 2.6% 428.17 4.8% 796.41
Lewis Co.Napavine 49.0% 6,073.77 14.5% 1,792.12 8.6% 1,066.52 0.0% 0.00 4.4% 548.86 0.2% 25.83 1.3% 159.00 16.5% 2,040.10 1.6% 198.87 3.9% 484.89Evaline 40.1% 7,728.59 10.0% 1,927.50 0.0% 0.00 0.0% 0.00 16.4% 3,154.66 0.2% 38.49 0.0% 0.00 28.5% 5,486.23 2.4% 462.69 2.5% 481.22Mossyrock 51.2% 7,546.13 13.2% 1,947.51 4.4% 654.29 0.0% 0.00 7.8% 1,142.64 0.1% 14.89 2.4% 353.60 13.7% 2,017.98 2.4% 354.07 4.8% 705.07Morton 42.5% 6,797.06 15.2% 2,425.70 9.0% 1,446.14 0.0% 0.00 6.5% 1,037.25 0.1% 18.79 0.9% 147.56 18.9% 3,027.68 2.0% 312.42 4.9% 784.29Adna 54.4% 7,183.58 11.9% 1,568.51 5.4% 716.77 0.0% 0.00 3.7% 483.39 0.4% 53.52 1.2% 159.71 16.4% 2,166.98 2.2% 290.29 4.4% 586.82Winlock 43.3% 6,517.88 16.8% 2,535.72 3.5% 533.15 0.0% 0.00 10.6% 1,592.22 0.2% 27.57 3.1% 460.55 15.6% 2,354.97 2.6% 395.40 4.3% 647.30Boistfort 37.5% 6,846.42 16.6% 3,027.56 0.0% 0.00 0.0% 0.00 4.4% 807.21 4.0% 727.61 2.3% 419.51 22.3% 4,065.21 4.4% 807.90 8.5% 1,555.12Toledo 48.4% 6,545.31 17.8% 2,409.47 5.8% 789.74 0.0% 0.00 4.5% 610.80 0.2% 28.28 1.4% 184.49 16.0% 2,159.51 1.5% 207.06 4.4% 602.26Onalaska 46.7% 6,493.51 12.3% 1,714.44 6.9% 962.19 0.0% 0.00 6.3% 877.23 0.2% 25.68 2.5% 352.59 15.1% 2,102.88 3.7% 516.94 6.1% 854.64Pe Ell 51.5% 10,006.23 12.9% 2,501.02 5.2% 1,002.26 0.0% 0.00 4.4% 852.06 0.2% 47.04 3.8% 742.58 16.6% 3,229.53 2.2% 425.50 3.3% 634.97Chehalis 51.5% 7,253.34 13.9% 1,957.66 3.5% 496.03 0.0% 0.00 12.7% 1,794.60 0.2% 26.05 0.4% 56.97 12.4% 1,748.91 2.3% 324.39 3.1% 439.60White Pass 47.7% 8,379.33 10.0% 1,762.39 5.1% 903.42 0.0% 0.00 7.7% 1,345.73 1.8% 311.60 1.8% 309.48 17.4% 3,056.07 1.7% 305.67 6.8% 1,193.37Centralia 46.8% 6,959.23 16.3% 2,428.66 3.7% 547.09 0.0% 0.00 9.7% 1,448.26 0.3% 41.58 1.2% 180.60 13.1% 1,953.62 3.6% 533.13 5.2% 768.39County Total 48.5% 7,036.09 14.7% 2,135.78 4.6% 667.54 0.0% 0.00 8.9% 1,297.32 0.3% 45.94 1.4% 198.19 14.4% 2,090.95 2.7% 390.29 4.5% 654.54
Lincoln Co.Sprague 54.7% 16,840.46 6.3% 1,925.91 4.2% 1,292.25 0.0% 0.00 3.2% 992.45 0.1% 15.78 1.4% 421.69 21.4% 6,595.71 3.2% 971.45 5.7% 1,742.54Reardan 47.3% 6,262.29 10.0% 1,329.57 4.0% 530.63 0.0% 0.00 4.0% 532.30 0.1% 18.79 1.5% 196.61 22.6% 2,990.08 2.4% 314.59 8.0% 1,063.75Almira 49.2% 12,260.66 6.4% 1,581.66 1.2% 301.16 0.0% 0.00 3.5% 876.55 0.1% 16.90 1.1% 278.05 27.5% 6,842.12 3.5% 883.71 7.5% 1,866.01Creston 40.7% 12,627.18 7.8% 2,431.42 3.5% 1,072.81 0.0% 0.00 4.0% 1,227.31 0.1% 18.72 0.8% 239.48 21.5% 6,683.35 3.0% 935.29 18.8% 5,824.62Odessa 52.4% 9,754.72 7.9% 1,462.31 4.0% 750.26 0.0% 0.00 5.0% 932.07 0.1% 24.22 3.4% 640.04 17.1% 3,185.89 2.3% 429.97 7.7% 1,429.08Wilbur 54.7% 9,285.44 10.5% 1,790.60 1.6% 272.45 0.0% 0.00 6.0% 1,018.86 0.1% 18.76 1.1% 187.27 23.4% 3,976.24 2.1% 364.58 0.4% 64.93Harrington 49.9% 12,917.71 9.1% 2,358.39 7.0% 1,819.08 0.0% 0.00 2.5% 641.04 0.0% 8.73 1.7% 436.07 16.2% 4,201.05 4.9% 1,266.67 8.6% 2,235.85Davenport 48.1% 7,230.83 9.0% 1,352.42 7.3% 1,100.98 0.9% 133.22 7.2% 1,080.76 1.2% 184.42 1.9% 291.90 16.9% 2,530.82 2.5% 381.78 4.9% 732.33County Total 49.2% 8,600.87 8.8% 1,546.27 4.6% 803.31 0.2% 36.36 4.9% 849.54 0.4% 63.77 1.7% 299.87 20.3% 3,539.49 2.8% 487.67 7.1% 1,245.37
65
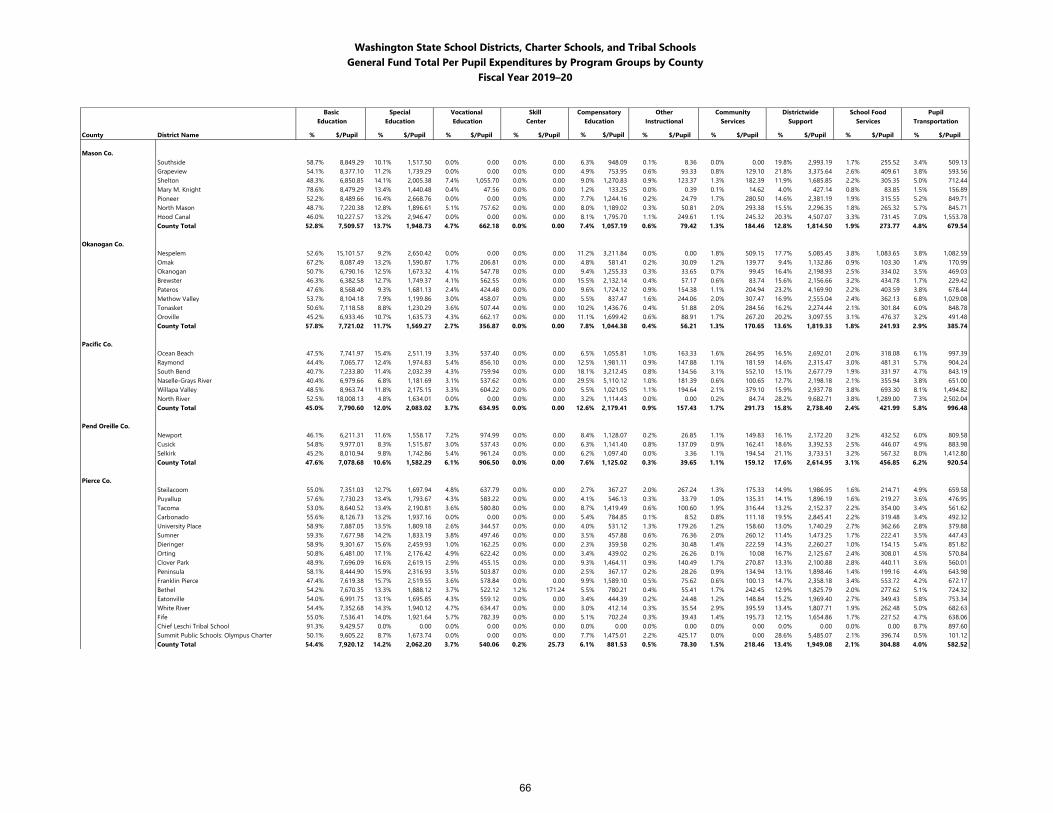
Washington State School Districts, Charter Schools, and Tribal SchoolsGeneral Fund Total Per Pupil Expenditures by Program Groups by County
Fiscal Year 2019–20
Basic Special Vocational Skill Compensatory Other Community Districtwide School Food Pupil Education Education Education Center Education Instructional Services Support Services Transportation
County District Name % $/Pupil % $/Pupil % $/Pupil % $/Pupil % $/Pupil % $/Pupil % $/Pupil % $/Pupil % $/Pupil % $/Pupil
Mason Co.Southside 58.7% 8,849.29 10.1% 1,517.50 0.0% 0.00 0.0% 0.00 6.3% 948.09 0.1% 8.36 0.0% 0.00 19.8% 2,993.19 1.7% 255.52 3.4% 509.13Grapeview 54.1% 8,377.10 11.2% 1,739.29 0.0% 0.00 0.0% 0.00 4.9% 753.95 0.6% 93.33 0.8% 129.10 21.8% 3,375.64 2.6% 409.61 3.8% 593.56Shelton 48.3% 6,850.85 14.1% 2,005.38 7.4% 1,055.70 0.0% 0.00 9.0% 1,270.83 0.9% 123.37 1.3% 182.39 11.9% 1,685.85 2.2% 305.35 5.0% 712.44Mary M. Knight 78.6% 8,479.29 13.4% 1,440.48 0.4% 47.56 0.0% 0.00 1.2% 133.25 0.0% 0.39 0.1% 14.62 4.0% 427.14 0.8% 83.85 1.5% 156.89Pioneer 52.2% 8,489.66 16.4% 2,668.76 0.0% 0.00 0.0% 0.00 7.7% 1,244.16 0.2% 24.79 1.7% 280.50 14.6% 2,381.19 1.9% 315.55 5.2% 849.71North Mason 48.7% 7,220.38 12.8% 1,896.61 5.1% 757.62 0.0% 0.00 8.0% 1,189.02 0.3% 50.81 2.0% 293.38 15.5% 2,296.35 1.8% 265.32 5.7% 845.71Hood Canal 46.0% 10,227.57 13.2% 2,946.47 0.0% 0.00 0.0% 0.00 8.1% 1,795.70 1.1% 249.61 1.1% 245.32 20.3% 4,507.07 3.3% 731.45 7.0% 1,553.78County Total 52.8% 7,509.57 13.7% 1,948.73 4.7% 662.18 0.0% 0.00 7.4% 1,057.19 0.6% 79.42 1.3% 184.46 12.8% 1,814.50 1.9% 273.77 4.8% 679.54
Okanogan Co.Nespelem 52.6% 15,101.57 9.2% 2,650.42 0.0% 0.00 0.0% 0.00 11.2% 3,211.84 0.0% 0.00 1.8% 509.15 17.7% 5,085.45 3.8% 1,083.65 3.8% 1,082.59Omak 67.2% 8,087.49 13.2% 1,590.87 1.7% 206.81 0.0% 0.00 4.8% 581.41 0.2% 30.09 1.2% 139.77 9.4% 1,132.86 0.9% 103.30 1.4% 170.99Okanogan 50.7% 6,790.16 12.5% 1,673.32 4.1% 547.78 0.0% 0.00 9.4% 1,255.33 0.3% 33.65 0.7% 99.45 16.4% 2,198.93 2.5% 334.02 3.5% 469.03Brewster 46.3% 6,382.58 12.7% 1,749.37 4.1% 562.55 0.0% 0.00 15.5% 2,132.14 0.4% 57.17 0.6% 83.74 15.6% 2,156.66 3.2% 434.78 1.7% 229.42Pateros 47.6% 8,568.40 9.3% 1,681.13 2.4% 424.48 0.0% 0.00 9.6% 1,724.12 0.9% 154.38 1.1% 204.94 23.2% 4,169.90 2.2% 403.59 3.8% 678.44Methow Valley 53.7% 8,104.18 7.9% 1,199.86 3.0% 458.07 0.0% 0.00 5.5% 837.47 1.6% 244.06 2.0% 307.47 16.9% 2,555.04 2.4% 362.13 6.8% 1,029.08Tonasket 50.6% 7,118.58 8.8% 1,230.29 3.6% 507.44 0.0% 0.00 10.2% 1,436.76 0.4% 51.88 2.0% 284.56 16.2% 2,274.44 2.1% 301.84 6.0% 848.78Oroville 45.2% 6,933.46 10.7% 1,635.73 4.3% 662.17 0.0% 0.00 11.1% 1,699.42 0.6% 88.91 1.7% 267.20 20.2% 3,097.55 3.1% 476.37 3.2% 491.48County Total 57.8% 7,721.02 11.7% 1,569.27 2.7% 356.87 0.0% 0.00 7.8% 1,044.38 0.4% 56.21 1.3% 170.65 13.6% 1,819.33 1.8% 241.93 2.9% 385.74
Pacific Co.Ocean Beach 47.5% 7,741.97 15.4% 2,511.19 3.3% 537.40 0.0% 0.00 6.5% 1,055.81 1.0% 163.33 1.6% 264.95 16.5% 2,692.01 2.0% 318.08 6.1% 997.39Raymond 44.4% 7,065.77 12.4% 1,974.83 5.4% 856.10 0.0% 0.00 12.5% 1,981.11 0.9% 147.88 1.1% 181.59 14.6% 2,315.47 3.0% 481.31 5.7% 904.24South Bend 40.7% 7,233.80 11.4% 2,032.39 4.3% 759.94 0.0% 0.00 18.1% 3,212.45 0.8% 134.56 3.1% 552.10 15.1% 2,677.79 1.9% 331.97 4.7% 843.19Naselle-Grays River 40.4% 6,979.66 6.8% 1,181.69 3.1% 537.62 0.0% 0.00 29.5% 5,110.12 1.0% 181.39 0.6% 100.65 12.7% 2,198.18 2.1% 355.94 3.8% 651.00Willapa Valley 48.5% 8,963.74 11.8% 2,175.15 3.3% 604.22 0.0% 0.00 5.5% 1,021.05 1.1% 194.64 2.1% 379.10 15.9% 2,937.78 3.8% 693.30 8.1% 1,494.82North River 52.5% 18,008.13 4.8% 1,634.01 0.0% 0.00 0.0% 0.00 3.2% 1,114.43 0.0% 0.00 0.2% 84.74 28.2% 9,682.71 3.8% 1,289.00 7.3% 2,502.04County Total 45.0% 7,790.60 12.0% 2,083.02 3.7% 634.95 0.0% 0.00 12.6% 2,179.41 0.9% 157.43 1.7% 291.73 15.8% 2,738.40 2.4% 421.99 5.8% 996.48
Pend Oreille Co.Newport 46.1% 6,211.31 11.6% 1,558.17 7.2% 974.99 0.0% 0.00 8.4% 1,128.07 0.2% 26.85 1.1% 149.83 16.1% 2,172.20 3.2% 432.52 6.0% 809.58Cusick 54.8% 9,977.01 8.3% 1,515.87 3.0% 537.43 0.0% 0.00 6.3% 1,141.40 0.8% 137.09 0.9% 162.41 18.6% 3,392.53 2.5% 446.07 4.9% 883.98Selkirk 45.2% 8,010.94 9.8% 1,742.86 5.4% 961.24 0.0% 0.00 6.2% 1,097.40 0.0% 3.36 1.1% 194.54 21.1% 3,733.51 3.2% 567.32 8.0% 1,412.80County Total 47.6% 7,078.68 10.6% 1,582.29 6.1% 906.50 0.0% 0.00 7.6% 1,125.02 0.3% 39.65 1.1% 159.12 17.6% 2,614.95 3.1% 456.85 6.2% 920.54
Pierce Co.Steilacoom 55.0% 7,351.03 12.7% 1,697.94 4.8% 637.79 0.0% 0.00 2.7% 367.27 2.0% 267.24 1.3% 175.33 14.9% 1,986.95 1.6% 214.71 4.9% 659.58Puyallup 57.6% 7,730.23 13.4% 1,793.67 4.3% 583.22 0.0% 0.00 4.1% 546.13 0.3% 33.79 1.0% 135.31 14.1% 1,896.19 1.6% 219.27 3.6% 476.95Tacoma 53.0% 8,640.52 13.4% 2,190.81 3.6% 580.80 0.0% 0.00 8.7% 1,419.49 0.6% 100.60 1.9% 316.44 13.2% 2,152.37 2.2% 354.00 3.4% 561.62Carbonado 55.6% 8,126.73 13.2% 1,937.16 0.0% 0.00 0.0% 0.00 5.4% 784.85 0.1% 8.52 0.8% 111.18 19.5% 2,845.41 2.2% 319.48 3.4% 492.32University Place 58.9% 7,887.05 13.5% 1,809.18 2.6% 344.57 0.0% 0.00 4.0% 531.12 1.3% 179.26 1.2% 158.60 13.0% 1,740.29 2.7% 362.66 2.8% 379.88Sumner 59.3% 7,677.98 14.2% 1,833.19 3.8% 497.46 0.0% 0.00 3.5% 457.88 0.6% 76.36 2.0% 260.12 11.4% 1,473.25 1.7% 222.41 3.5% 447.43Dieringer 58.9% 9,301.67 15.6% 2,459.93 1.0% 162.25 0.0% 0.00 2.3% 359.58 0.2% 30.48 1.4% 222.59 14.3% 2,260.27 1.0% 154.15 5.4% 851.82Orting 50.8% 6,481.00 17.1% 2,176.42 4.9% 622.42 0.0% 0.00 3.4% 439.02 0.2% 26.26 0.1% 10.08 16.7% 2,125.67 2.4% 308.01 4.5% 570.84Clover Park 48.9% 7,696.09 16.6% 2,619.15 2.9% 455.15 0.0% 0.00 9.3% 1,464.11 0.9% 140.49 1.7% 270.87 13.3% 2,100.88 2.8% 440.11 3.6% 560.01Peninsula 58.1% 8,444.90 15.9% 2,316.93 3.5% 503.87 0.0% 0.00 2.5% 367.17 0.2% 28.26 0.9% 134.94 13.1% 1,898.46 1.4% 199.16 4.4% 643.98Franklin Pierce 47.4% 7,619.38 15.7% 2,519.55 3.6% 578.84 0.0% 0.00 9.9% 1,589.10 0.5% 75.62 0.6% 100.13 14.7% 2,358.18 3.4% 553.72 4.2% 672.17Bethel 54.2% 7,670.35 13.3% 1,888.12 3.7% 522.12 1.2% 171.24 5.5% 780.21 0.4% 55.41 1.7% 242.45 12.9% 1,825.79 2.0% 277.62 5.1% 724.32Eatonville 54.0% 6,991.75 13.1% 1,695.85 4.3% 559.12 0.0% 0.00 3.4% 444.39 0.2% 24.48 1.2% 148.84 15.2% 1,969.40 2.7% 349.43 5.8% 753.34White River 54.4% 7,352.68 14.3% 1,940.12 4.7% 634.47 0.0% 0.00 3.0% 412.14 0.3% 35.54 2.9% 395.59 13.4% 1,807.71 1.9% 262.48 5.0% 682.63Fife 55.0% 7,536.41 14.0% 1,921.64 5.7% 782.39 0.0% 0.00 5.1% 702.24 0.3% 39.43 1.4% 195.73 12.1% 1,654.86 1.7% 227.52 4.7% 638.06Chief Leschi Tribal School 91.3% 9,429.57 0.0% 0.00 0.0% 0.00 0.0% 0.00 0.0% 0.00 0.0% 0.00 0.0% 0.00 0.0% 0.00 0.0% 0.00 8.7% 897.60Summit Public Schools: Olympus Charter 50.1% 9,605.22 8.7% 1,673.74 0.0% 0.00 0.0% 0.00 7.7% 1,475.01 2.2% 425.17 0.0% 0.00 28.6% 5,485.07 2.1% 396.74 0.5% 101.12County Total 54.4% 7,920.12 14.2% 2,062.20 3.7% 540.06 0.2% 25.73 6.1% 881.53 0.5% 78.30 1.5% 218.46 13.4% 1,949.08 2.1% 304.88 4.0% 582.52
66
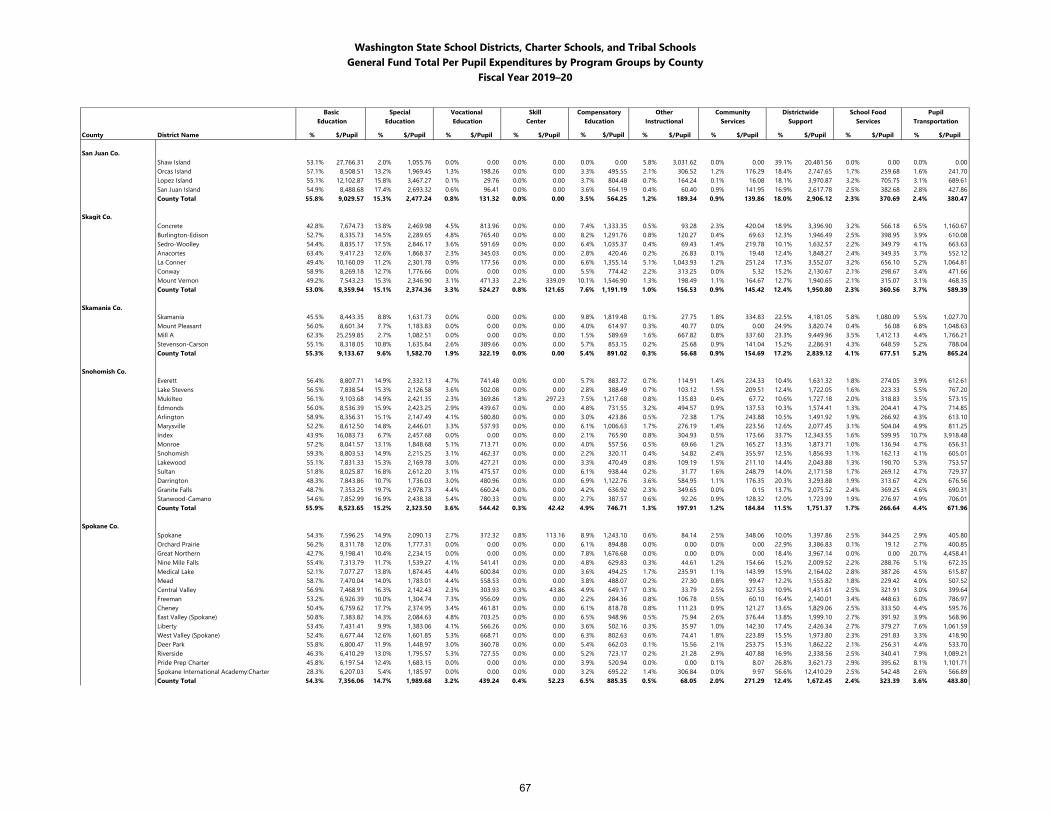
Washington State School Districts, Charter Schools, and Tribal SchoolsGeneral Fund Total Per Pupil Expenditures by Program Groups by County
Fiscal Year 2019–20
Basic Special Vocational Skill Compensatory Other Community Districtwide School Food Pupil Education Education Education Center Education Instructional Services Support Services Transportation
County District Name % $/Pupil % $/Pupil % $/Pupil % $/Pupil % $/Pupil % $/Pupil % $/Pupil % $/Pupil % $/Pupil % $/Pupil
San Juan Co.Shaw Island 53.1% 27,766.31 2.0% 1,055.76 0.0% 0.00 0.0% 0.00 0.0% 0.00 5.8% 3,031.62 0.0% 0.00 39.1% 20,481.56 0.0% 0.00 0.0% 0.00Orcas Island 57.1% 8,508.51 13.2% 1,969.45 1.3% 198.26 0.0% 0.00 3.3% 495.55 2.1% 306.52 1.2% 176.29 18.4% 2,747.65 1.7% 259.68 1.6% 241.70Lopez Island 55.1% 12,102.87 15.8% 3,467.27 0.1% 29.76 0.0% 0.00 3.7% 804.48 0.7% 164.24 0.1% 16.08 18.1% 3,970.87 3.2% 705.75 3.1% 689.61San Juan Island 54.9% 8,488.68 17.4% 2,693.32 0.6% 96.41 0.0% 0.00 3.6% 564.19 0.4% 60.40 0.9% 141.95 16.9% 2,617.78 2.5% 382.68 2.8% 427.86County Total 55.8% 9,029.57 15.3% 2,477.24 0.8% 131.32 0.0% 0.00 3.5% 564.25 1.2% 189.34 0.9% 139.86 18.0% 2,906.12 2.3% 370.69 2.4% 380.47
Skagit Co.Concrete 42.8% 7,674.73 13.8% 2,469.98 4.5% 813.96 0.0% 0.00 7.4% 1,333.35 0.5% 93.28 2.3% 420.04 18.9% 3,396.90 3.2% 566.18 6.5% 1,160.67Burlington-Edison 52.7% 8,335.73 14.5% 2,289.65 4.8% 765.40 0.0% 0.00 8.2% 1,291.76 0.8% 120.27 0.4% 69.63 12.3% 1,946.49 2.5% 398.95 3.9% 610.08Sedro-Woolley 54.4% 8,835.17 17.5% 2,846.17 3.6% 591.69 0.0% 0.00 6.4% 1,035.37 0.4% 69.43 1.4% 219.78 10.1% 1,632.57 2.2% 349.79 4.1% 663.63Anacortes 63.4% 9,417.23 12.6% 1,868.37 2.3% 345.03 0.0% 0.00 2.8% 420.46 0.2% 26.83 0.1% 19.48 12.4% 1,848.27 2.4% 349.35 3.7% 552.12La Conner 49.4% 10,160.09 11.2% 2,301.78 0.9% 177.56 0.0% 0.00 6.6% 1,355.14 5.1% 1,043.93 1.2% 251.24 17.3% 3,552.07 3.2% 656.10 5.2% 1,064.81Conway 58.9% 8,269.18 12.7% 1,776.66 0.0% 0.00 0.0% 0.00 5.5% 774.42 2.2% 313.25 0.0% 5.32 15.2% 2,130.67 2.1% 298.67 3.4% 471.66Mount Vernon 49.2% 7,543.23 15.3% 2,346.90 3.1% 471.33 2.2% 339.09 10.1% 1,546.90 1.3% 198.49 1.1% 164.67 12.7% 1,940.65 2.1% 315.07 3.1% 468.35County Total 53.0% 8,359.94 15.1% 2,374.36 3.3% 524.27 0.8% 121.65 7.6% 1,191.19 1.0% 156.53 0.9% 145.42 12.4% 1,950.80 2.3% 360.56 3.7% 589.39
Skamania Co.Skamania 45.5% 8,443.35 8.8% 1,631.73 0.0% 0.00 0.0% 0.00 9.8% 1,819.48 0.1% 27.75 1.8% 334.83 22.5% 4,181.05 5.8% 1,080.09 5.5% 1,027.70Mount Pleasant 56.0% 8,601.34 7.7% 1,183.83 0.0% 0.00 0.0% 0.00 4.0% 614.97 0.3% 40.77 0.0% 0.00 24.9% 3,820.74 0.4% 56.08 6.8% 1,048.63Mill A 62.3% 25,259.85 2.7% 1,082.51 0.0% 0.00 0.0% 0.00 1.5% 589.69 1.6% 667.82 0.8% 337.60 23.3% 9,449.96 3.5% 1,412.13 4.4% 1,766.21Stevenson-Carson 55.1% 8,318.05 10.8% 1,635.84 2.6% 389.66 0.0% 0.00 5.7% 853.15 0.2% 25.68 0.9% 141.04 15.2% 2,286.91 4.3% 648.59 5.2% 788.04County Total 55.3% 9,133.67 9.6% 1,582.70 1.9% 322.19 0.0% 0.00 5.4% 891.02 0.3% 56.68 0.9% 154.69 17.2% 2,839.12 4.1% 677.51 5.2% 865.24
Snohomish Co.Everett 56.4% 8,807.71 14.9% 2,332.13 4.7% 741.48 0.0% 0.00 5.7% 883.72 0.7% 114.91 1.4% 224.33 10.4% 1,631.32 1.8% 274.05 3.9% 612.61Lake Stevens 56.5% 7,838.54 15.3% 2,126.58 3.6% 502.08 0.0% 0.00 2.8% 388.49 0.7% 103.12 1.5% 209.51 12.4% 1,722.05 1.6% 223.33 5.5% 767.20Mukilteo 56.1% 9,103.68 14.9% 2,421.35 2.3% 369.86 1.8% 297.23 7.5% 1,217.68 0.8% 135.83 0.4% 67.72 10.6% 1,727.18 2.0% 318.83 3.5% 573.15Edmonds 56.0% 8,536.39 15.9% 2,423.25 2.9% 439.67 0.0% 0.00 4.8% 731.55 3.2% 494.57 0.9% 137.53 10.3% 1,574.41 1.3% 204.41 4.7% 714.85Arlington 58.9% 8,356.31 15.1% 2,147.49 4.1% 580.80 0.0% 0.00 3.0% 423.86 0.5% 72.38 1.7% 243.88 10.5% 1,491.92 1.9% 266.92 4.3% 613.10Marysville 52.2% 8,612.50 14.8% 2,446.01 3.3% 537.93 0.0% 0.00 6.1% 1,006.63 1.7% 276.19 1.4% 223.56 12.6% 2,077.45 3.1% 504.04 4.9% 811.25Index 43.9% 16,083.73 6.7% 2,457.68 0.0% 0.00 0.0% 0.00 2.1% 765.90 0.8% 304.93 0.5% 173.66 33.7% 12,343.55 1.6% 599.95 10.7% 3,918.48Monroe 57.2% 8,041.57 13.1% 1,848.68 5.1% 713.71 0.0% 0.00 4.0% 557.56 0.5% 69.66 1.2% 165.27 13.3% 1,873.71 1.0% 136.94 4.7% 656.31Snohomish 59.3% 8,803.53 14.9% 2,215.25 3.1% 462.37 0.0% 0.00 2.2% 320.11 0.4% 54.82 2.4% 355.97 12.5% 1,856.93 1.1% 162.13 4.1% 605.01Lakewood 55.1% 7,831.33 15.3% 2,169.78 3.0% 427.21 0.0% 0.00 3.3% 470.49 0.8% 109.19 1.5% 211.10 14.4% 2,043.88 1.3% 190.70 5.3% 753.57Sultan 51.8% 8,025.87 16.8% 2,612.20 3.1% 475.57 0.0% 0.00 6.1% 938.44 0.2% 31.77 1.6% 248.79 14.0% 2,171.58 1.7% 269.12 4.7% 729.37Darrington 48.3% 7,843.86 10.7% 1,736.03 3.0% 480.96 0.0% 0.00 6.9% 1,122.76 3.6% 584.95 1.1% 176.35 20.3% 3,293.88 1.9% 313.67 4.2% 676.56Granite Falls 48.7% 7,353.25 19.7% 2,978.73 4.4% 660.24 0.0% 0.00 4.2% 636.92 2.3% 349.65 0.0% 0.15 13.7% 2,075.52 2.4% 369.25 4.6% 690.31Stanwood-Camano 54.6% 7,852.99 16.9% 2,438.38 5.4% 780.33 0.0% 0.00 2.7% 387.57 0.6% 92.26 0.9% 128.32 12.0% 1,723.99 1.9% 276.97 4.9% 706.01County Total 55.9% 8,523.65 15.2% 2,323.50 3.6% 544.42 0.3% 42.42 4.9% 746.71 1.3% 197.91 1.2% 184.84 11.5% 1,751.37 1.7% 266.64 4.4% 671.96
Spokane Co.Spokane 54.3% 7,596.25 14.9% 2,090.13 2.7% 372.32 0.8% 113.16 8.9% 1,243.10 0.6% 84.14 2.5% 348.06 10.0% 1,397.86 2.5% 344.25 2.9% 405.80Orchard Prairie 56.2% 8,311.78 12.0% 1,777.31 0.0% 0.00 0.0% 0.00 6.1% 894.88 0.0% 0.00 0.0% 0.00 22.9% 3,386.83 0.1% 19.12 2.7% 400.85Great Northern 42.7% 9,198.41 10.4% 2,234.15 0.0% 0.00 0.0% 0.00 7.8% 1,676.68 0.0% 0.00 0.0% 0.00 18.4% 3,967.14 0.0% 0.00 20.7% 4,458.41Nine Mile Falls 55.4% 7,313.79 11.7% 1,539.27 4.1% 541.41 0.0% 0.00 4.8% 629.83 0.3% 44.61 1.2% 154.66 15.2% 2,009.52 2.2% 288.76 5.1% 672.35Medical Lake 52.1% 7,077.27 13.8% 1,874.45 4.4% 600.84 0.0% 0.00 3.6% 494.25 1.7% 235.91 1.1% 143.99 15.9% 2,164.02 2.8% 387.26 4.5% 615.87Mead 58.7% 7,470.04 14.0% 1,783.01 4.4% 558.53 0.0% 0.00 3.8% 488.07 0.2% 27.30 0.8% 99.47 12.2% 1,555.82 1.8% 229.42 4.0% 507.52Central Valley 56.9% 7,468.91 16.3% 2,142.43 2.3% 303.93 0.3% 43.86 4.9% 649.17 0.3% 33.79 2.5% 327.53 10.9% 1,431.61 2.5% 321.91 3.0% 399.64Freeman 53.2% 6,926.39 10.0% 1,304.74 7.3% 956.09 0.0% 0.00 2.2% 284.36 0.8% 106.78 0.5% 60.10 16.4% 2,140.01 3.4% 448.63 6.0% 786.97Cheney 50.4% 6,759.62 17.7% 2,374.95 3.4% 461.81 0.0% 0.00 6.1% 818.78 0.8% 111.23 0.9% 121.27 13.6% 1,829.06 2.5% 333.50 4.4% 595.76East Valley (Spokane) 50.8% 7,383.82 14.3% 2,084.63 4.8% 703.25 0.0% 0.00 6.5% 948.96 0.5% 75.94 2.6% 376.44 13.8% 1,999.10 2.7% 391.92 3.9% 568.96Liberty 53.4% 7,431.41 9.9% 1,383.06 4.1% 566.26 0.0% 0.00 3.6% 502.16 0.3% 35.97 1.0% 142.30 17.4% 2,426.34 2.7% 379.27 7.6% 1,061.59West Valley (Spokane) 52.4% 6,677.44 12.6% 1,601.85 5.3% 668.71 0.0% 0.00 6.3% 802.63 0.6% 74.41 1.8% 223.89 15.5% 1,973.80 2.3% 291.83 3.3% 418.90Deer Park 55.8% 6,800.47 11.9% 1,448.97 3.0% 360.78 0.0% 0.00 5.4% 662.03 0.1% 15.56 2.1% 253.75 15.3% 1,862.22 2.1% 256.31 4.4% 533.70Riverside 46.3% 6,410.29 13.0% 1,795.57 5.3% 727.55 0.0% 0.00 5.2% 723.17 0.2% 21.28 2.9% 407.88 16.9% 2,338.56 2.5% 340.41 7.9% 1,089.21Pride Prep Charter 45.8% 6,197.54 12.4% 1,683.15 0.0% 0.00 0.0% 0.00 3.9% 520.94 0.0% 0.00 0.1% 8.07 26.8% 3,621.73 2.9% 395.62 8.1% 1,101.71Spokane International Academy:Charter 28.3% 6,207.03 5.4% 1,185.97 0.0% 0.00 0.0% 0.00 3.2% 695.22 1.4% 306.84 0.0% 9.97 56.6% 12,410.29 2.5% 542.48 2.6% 566.89County Total 54.3% 7,356.06 14.7% 1,989.68 3.2% 439.24 0.4% 52.23 6.5% 885.35 0.5% 68.05 2.0% 271.29 12.4% 1,672.45 2.4% 323.39 3.6% 483.80
67
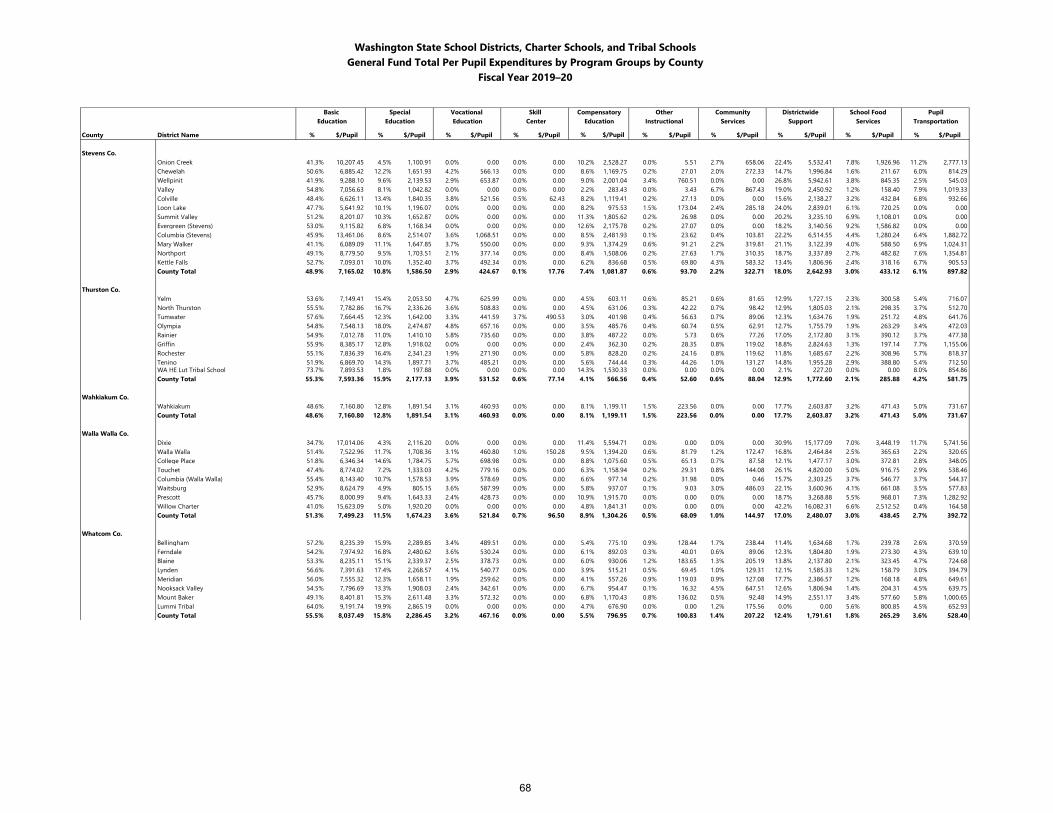
Washington State School Districts, Charter Schools, and Tribal SchoolsGeneral Fund Total Per Pupil Expenditures by Program Groups by County
Fiscal Year 2019–20
Basic Special Vocational Skill Compensatory Other Community Districtwide School Food Pupil Education Education Education Center Education Instructional Services Support Services Transportation
County District Name % $/Pupil % $/Pupil % $/Pupil % $/Pupil % $/Pupil % $/Pupil % $/Pupil % $/Pupil % $/Pupil % $/Pupil
Stevens Co.Onion Creek 41.3% 10,207.45 4.5% 1,100.91 0.0% 0.00 0.0% 0.00 10.2% 2,528.27 0.0% 5.51 2.7% 658.06 22.4% 5,532.41 7.8% 1,926.96 11.2% 2,777.13Chewelah 50.6% 6,885.42 12.2% 1,651.93 4.2% 566.13 0.0% 0.00 8.6% 1,169.75 0.2% 27.01 2.0% 272.33 14.7% 1,996.84 1.6% 211.67 6.0% 814.29Wellpinit 41.9% 9,288.10 9.6% 2,139.53 2.9% 653.87 0.0% 0.00 9.0% 2,001.04 3.4% 760.51 0.0% 0.00 26.8% 5,942.61 3.8% 845.35 2.5% 545.03Valley 54.8% 7,056.63 8.1% 1,042.82 0.0% 0.00 0.0% 0.00 2.2% 283.43 0.0% 3.43 6.7% 867.43 19.0% 2,450.92 1.2% 158.40 7.9% 1,019.33Colville 48.4% 6,626.11 13.4% 1,840.35 3.8% 521.56 0.5% 62.43 8.2% 1,119.41 0.2% 27.13 0.0% 0.00 15.6% 2,138.27 3.2% 432.84 6.8% 932.66Loon Lake 47.7% 5,641.92 10.1% 1,196.07 0.0% 0.00 0.0% 0.00 8.2% 975.53 1.5% 173.04 2.4% 285.18 24.0% 2,839.01 6.1% 720.25 0.0% 0.00Summit Valley 51.2% 8,201.07 10.3% 1,652.87 0.0% 0.00 0.0% 0.00 11.3% 1,805.62 0.2% 26.98 0.0% 0.00 20.2% 3,235.10 6.9% 1,108.01 0.0% 0.00Evergreen (Stevens) 53.0% 9,115.82 6.8% 1,168.34 0.0% 0.00 0.0% 0.00 12.6% 2,175.78 0.2% 27.07 0.0% 0.00 18.2% 3,140.56 9.2% 1,586.82 0.0% 0.00Columbia (Stevens) 45.9% 13,461.06 8.6% 2,514.07 3.6% 1,068.51 0.0% 0.00 8.5% 2,481.93 0.1% 23.62 0.4% 103.81 22.2% 6,514.55 4.4% 1,280.24 6.4% 1,882.72Mary Walker 41.1% 6,089.09 11.1% 1,647.85 3.7% 550.00 0.0% 0.00 9.3% 1,374.29 0.6% 91.21 2.2% 319.81 21.1% 3,122.39 4.0% 588.50 6.9% 1,024.31Northport 49.1% 8,779.50 9.5% 1,703.51 2.1% 377.14 0.0% 0.00 8.4% 1,508.06 0.2% 27.63 1.7% 310.35 18.7% 3,337.89 2.7% 482.82 7.6% 1,354.81Kettle Falls 52.7% 7,093.01 10.0% 1,352.40 3.7% 492.34 0.0% 0.00 6.2% 836.68 0.5% 69.80 4.3% 583.32 13.4% 1,806.96 2.4% 318.16 6.7% 905.53County Total 48.9% 7,165.02 10.8% 1,586.50 2.9% 424.67 0.1% 17.76 7.4% 1,081.87 0.6% 93.70 2.2% 322.71 18.0% 2,642.93 3.0% 433.12 6.1% 897.82
Thurston Co.Yelm 53.6% 7,149.41 15.4% 2,053.50 4.7% 625.99 0.0% 0.00 4.5% 603.11 0.6% 85.21 0.6% 81.65 12.9% 1,727.15 2.3% 300.58 5.4% 716.07North Thurston 55.5% 7,782.86 16.7% 2,336.26 3.6% 508.83 0.0% 0.00 4.5% 631.06 0.3% 42.22 0.7% 98.42 12.9% 1,805.03 2.1% 298.35 3.7% 512.70Tumwater 57.6% 7,664.45 12.3% 1,642.00 3.3% 441.59 3.7% 490.53 3.0% 401.98 0.4% 56.63 0.7% 89.06 12.3% 1,634.76 1.9% 251.72 4.8% 641.76Olympia 54.8% 7,548.13 18.0% 2,474.87 4.8% 657.16 0.0% 0.00 3.5% 485.76 0.4% 60.74 0.5% 62.91 12.7% 1,755.79 1.9% 263.29 3.4% 472.03Rainier 54.9% 7,012.78 11.0% 1,410.10 5.8% 735.60 0.0% 0.00 3.8% 487.22 0.0% 5.73 0.6% 77.26 17.0% 2,172.80 3.1% 390.12 3.7% 477.38Griffin 55.9% 8,385.17 12.8% 1,918.02 0.0% 0.00 0.0% 0.00 2.4% 362.30 0.2% 28.35 0.8% 119.02 18.8% 2,824.63 1.3% 197.14 7.7% 1,155.06Rochester 55.1% 7,836.39 16.4% 2,341.23 1.9% 271.90 0.0% 0.00 5.8% 828.20 0.2% 24.16 0.8% 119.62 11.8% 1,685.67 2.2% 308.96 5.7% 818.37Tenino 51.9% 6,869.70 14.3% 1,897.71 3.7% 485.21 0.0% 0.00 5.6% 744.44 0.3% 44.26 1.0% 131.27 14.8% 1,955.28 2.9% 388.80 5.4% 712.50WA HE Lut Tribal School 73.7% 7,893.53 1.8% 197.88 0.0% 0.00 0.0% 0.00 14.3% 1,530.33 0.0% 0.00 0.0% 0.00 2.1% 227.20 0.0% 0.00 8.0% 854.86County Total 55.3% 7,593.36 15.9% 2,177.13 3.9% 531.52 0.6% 77.14 4.1% 566.56 0.4% 52.60 0.6% 88.04 12.9% 1,772.60 2.1% 285.88 4.2% 581.75
Wahkiakum Co.Wahkiakum 48.6% 7,160.80 12.8% 1,891.54 3.1% 460.93 0.0% 0.00 8.1% 1,199.11 1.5% 223.56 0.0% 0.00 17.7% 2,603.87 3.2% 471.43 5.0% 731.67County Total 48.6% 7,160.80 12.8% 1,891.54 3.1% 460.93 0.0% 0.00 8.1% 1,199.11 1.5% 223.56 0.0% 0.00 17.7% 2,603.87 3.2% 471.43 5.0% 731.67
Walla Walla Co.Dixie 34.7% 17,014.06 4.3% 2,116.20 0.0% 0.00 0.0% 0.00 11.4% 5,594.71 0.0% 0.00 0.0% 0.00 30.9% 15,177.09 7.0% 3,448.19 11.7% 5,741.56Walla Walla 51.4% 7,522.96 11.7% 1,708.36 3.1% 460.80 1.0% 150.28 9.5% 1,394.20 0.6% 81.79 1.2% 172.47 16.8% 2,464.84 2.5% 365.63 2.2% 320.65College Place 51.8% 6,346.34 14.6% 1,784.75 5.7% 698.98 0.0% 0.00 8.8% 1,075.60 0.5% 65.13 0.7% 87.58 12.1% 1,477.17 3.0% 372.81 2.8% 348.05Touchet 47.4% 8,774.02 7.2% 1,333.03 4.2% 779.16 0.0% 0.00 6.3% 1,158.94 0.2% 29.31 0.8% 144.08 26.1% 4,820.00 5.0% 916.75 2.9% 538.46Columbia (Walla Walla) 55.4% 8,143.40 10.7% 1,578.53 3.9% 578.69 0.0% 0.00 6.6% 977.14 0.2% 31.98 0.0% 0.46 15.7% 2,303.25 3.7% 546.77 3.7% 544.37Waitsburg 52.9% 8,624.79 4.9% 805.15 3.6% 587.99 0.0% 0.00 5.8% 937.07 0.1% 9.03 3.0% 486.03 22.1% 3,600.96 4.1% 661.08 3.5% 577.83Prescott 45.7% 8,000.99 9.4% 1,643.33 2.4% 428.73 0.0% 0.00 10.9% 1,915.70 0.0% 0.00 0.0% 0.00 18.7% 3,268.88 5.5% 968.01 7.3% 1,282.92Willow Charter 41.0% 15,623.09 5.0% 1,920.20 0.0% 0.00 0.0% 0.00 4.8% 1,841.31 0.0% 0.00 0.0% 0.00 42.2% 16,082.31 6.6% 2,512.52 0.4% 164.58County Total 51.3% 7,499.23 11.5% 1,674.23 3.6% 521.84 0.7% 96.50 8.9% 1,304.26 0.5% 68.09 1.0% 144.97 17.0% 2,480.07 3.0% 438.45 2.7% 392.72
Whatcom Co.Bellingham 57.2% 8,235.39 15.9% 2,289.85 3.4% 489.51 0.0% 0.00 5.4% 775.10 0.9% 128.44 1.7% 238.44 11.4% 1,634.68 1.7% 239.78 2.6% 370.59Ferndale 54.2% 7,974.92 16.8% 2,480.62 3.6% 530.24 0.0% 0.00 6.1% 892.03 0.3% 40.01 0.6% 89.06 12.3% 1,804.80 1.9% 273.30 4.3% 639.10Blaine 53.3% 8,235.11 15.1% 2,339.37 2.5% 378.73 0.0% 0.00 6.0% 930.06 1.2% 183.65 1.3% 205.19 13.8% 2,137.80 2.1% 323.45 4.7% 724.68Lynden 56.6% 7,391.63 17.4% 2,268.57 4.1% 540.77 0.0% 0.00 3.9% 515.21 0.5% 69.45 1.0% 129.31 12.1% 1,585.33 1.2% 158.79 3.0% 394.79Meridian 56.0% 7,555.32 12.3% 1,658.11 1.9% 259.62 0.0% 0.00 4.1% 557.26 0.9% 119.03 0.9% 127.08 17.7% 2,386.57 1.2% 168.18 4.8% 649.61Nooksack Valley 54.5% 7,796.69 13.3% 1,908.03 2.4% 342.61 0.0% 0.00 6.7% 954.47 0.1% 16.32 4.5% 647.51 12.6% 1,806.94 1.4% 204.31 4.5% 639.75Mount Baker 49.1% 8,401.81 15.3% 2,611.48 3.3% 572.32 0.0% 0.00 6.8% 1,170.43 0.8% 136.02 0.5% 92.48 14.9% 2,551.17 3.4% 577.60 5.8% 1,000.65Lummi Tribal 64.0% 9,191.74 19.9% 2,865.19 0.0% 0.00 0.0% 0.00 4.7% 676.90 0.0% 0.00 1.2% 175.56 0.0% 0.00 5.6% 800.85 4.5% 652.93County Total 55.5% 8,037.49 15.8% 2,286.45 3.2% 467.16 0.0% 0.00 5.5% 796.95 0.7% 100.83 1.4% 207.22 12.4% 1,791.61 1.8% 265.29 3.6% 528.40
68
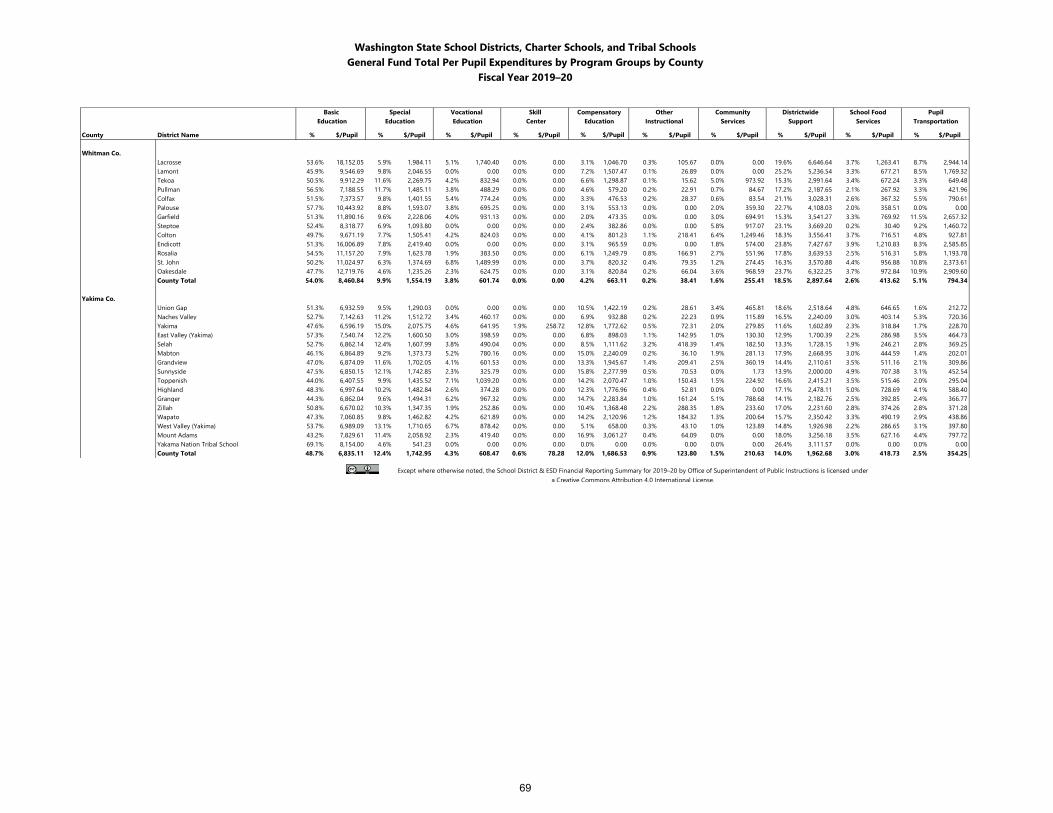
Washington State School Districts, Charter Schools, and Tribal SchoolsGeneral Fund Total Per Pupil Expenditures by Program Groups by County
Fiscal Year 2019–20
Basic Special Vocational Skill Compensatory Other Community Districtwide School Food Pupil Education Education Education Center Education Instructional Services Support Services Transportation
County District Name % $/Pupil % $/Pupil % $/Pupil % $/Pupil % $/Pupil % $/Pupil % $/Pupil % $/Pupil % $/Pupil % $/Pupil
Whitman Co.Lacrosse 53.6% 18,152.05 5.9% 1,984.11 5.1% 1,740.40 0.0% 0.00 3.1% 1,046.70 0.3% 105.67 0.0% 0.00 19.6% 6,646.64 3.7% 1,263.41 8.7% 2,944.14Lamont 45.9% 9,546.69 9.8% 2,046.55 0.0% 0.00 0.0% 0.00 7.2% 1,507.47 0.1% 26.89 0.0% 0.00 25.2% 5,236.54 3.3% 677.21 8.5% 1,769.32Tekoa 50.5% 9,912.29 11.6% 2,269.75 4.2% 832.94 0.0% 0.00 6.6% 1,298.87 0.1% 15.62 5.0% 973.92 15.3% 2,991.64 3.4% 672.24 3.3% 649.48Pullman 56.5% 7,188.55 11.7% 1,485.11 3.8% 488.29 0.0% 0.00 4.6% 579.20 0.2% 22.91 0.7% 84.67 17.2% 2,187.65 2.1% 267.92 3.3% 421.96Colfax 51.5% 7,373.57 9.8% 1,401.55 5.4% 774.24 0.0% 0.00 3.3% 476.53 0.2% 28.37 0.6% 83.54 21.1% 3,028.31 2.6% 367.32 5.5% 790.61Palouse 57.7% 10,443.92 8.8% 1,593.07 3.8% 695.25 0.0% 0.00 3.1% 553.13 0.0% 0.00 2.0% 359.30 22.7% 4,108.03 2.0% 358.51 0.0% 0.00Garfield 51.3% 11,890.16 9.6% 2,228.06 4.0% 931.13 0.0% 0.00 2.0% 473.35 0.0% 0.00 3.0% 694.91 15.3% 3,541.27 3.3% 769.92 11.5% 2,657.32Steptoe 52.4% 8,318.77 6.9% 1,093.80 0.0% 0.00 0.0% 0.00 2.4% 382.86 0.0% 0.00 5.8% 917.07 23.1% 3,669.20 0.2% 30.40 9.2% 1,460.72Colton 49.7% 9,671.19 7.7% 1,505.41 4.2% 824.03 0.0% 0.00 4.1% 801.23 1.1% 218.41 6.4% 1,249.46 18.3% 3,556.41 3.7% 716.51 4.8% 927.81Endicott 51.3% 16,006.89 7.8% 2,419.40 0.0% 0.00 0.0% 0.00 3.1% 965.59 0.0% 0.00 1.8% 574.00 23.8% 7,427.67 3.9% 1,210.83 8.3% 2,585.85Rosalia 54.5% 11,157.20 7.9% 1,623.78 1.9% 383.50 0.0% 0.00 6.1% 1,249.79 0.8% 166.91 2.7% 551.96 17.8% 3,639.53 2.5% 516.31 5.8% 1,193.78St. John 50.2% 11,024.97 6.3% 1,374.69 6.8% 1,489.99 0.0% 0.00 3.7% 820.32 0.4% 79.35 1.2% 274.45 16.3% 3,570.88 4.4% 956.88 10.8% 2,373.61Oakesdale 47.7% 12,719.76 4.6% 1,235.26 2.3% 624.75 0.0% 0.00 3.1% 820.84 0.2% 66.04 3.6% 968.59 23.7% 6,322.25 3.7% 972.84 10.9% 2,909.60County Total 54.0% 8,460.84 9.9% 1,554.19 3.8% 601.74 0.0% 0.00 4.2% 663.11 0.2% 38.41 1.6% 255.41 18.5% 2,897.64 2.6% 413.62 5.1% 794.34
Yakima Co.Union Gap 51.3% 6,932.59 9.5% 1,290.03 0.0% 0.00 0.0% 0.00 10.5% 1,422.19 0.2% 28.61 3.4% 465.81 18.6% 2,518.64 4.8% 646.65 1.6% 212.72Naches Valley 52.7% 7,142.63 11.2% 1,512.72 3.4% 460.17 0.0% 0.00 6.9% 932.88 0.2% 22.23 0.9% 115.89 16.5% 2,240.09 3.0% 403.14 5.3% 720.36Yakima 47.6% 6,596.19 15.0% 2,075.75 4.6% 641.95 1.9% 258.72 12.8% 1,772.62 0.5% 72.31 2.0% 279.85 11.6% 1,602.89 2.3% 318.84 1.7% 228.70East Valley (Yakima) 57.3% 7,540.74 12.2% 1,600.50 3.0% 398.59 0.0% 0.00 6.8% 898.03 1.1% 142.95 1.0% 130.30 12.9% 1,700.39 2.2% 286.98 3.5% 464.73Selah 52.7% 6,862.14 12.4% 1,607.99 3.8% 490.04 0.0% 0.00 8.5% 1,111.62 3.2% 418.39 1.4% 182.50 13.3% 1,728.15 1.9% 246.21 2.8% 369.25Mabton 46.1% 6,864.89 9.2% 1,373.73 5.2% 780.16 0.0% 0.00 15.0% 2,240.09 0.2% 36.10 1.9% 281.13 17.9% 2,668.95 3.0% 444.59 1.4% 202.01Grandview 47.0% 6,874.09 11.6% 1,702.05 4.1% 601.53 0.0% 0.00 13.3% 1,945.67 1.4% 209.41 2.5% 360.19 14.4% 2,110.61 3.5% 511.16 2.1% 309.86Sunnyside 47.5% 6,850.15 12.1% 1,742.85 2.3% 325.79 0.0% 0.00 15.8% 2,277.99 0.5% 70.53 0.0% 1.73 13.9% 2,000.00 4.9% 707.38 3.1% 452.54Toppenish 44.0% 6,407.55 9.9% 1,435.52 7.1% 1,039.20 0.0% 0.00 14.2% 2,070.47 1.0% 150.43 1.5% 224.92 16.6% 2,415.21 3.5% 515.46 2.0% 295.04Highland 48.3% 6,997.64 10.2% 1,482.84 2.6% 374.28 0.0% 0.00 12.3% 1,776.96 0.4% 52.81 0.0% 0.00 17.1% 2,478.11 5.0% 728.69 4.1% 588.40Granger 44.3% 6,862.04 9.6% 1,494.31 6.2% 967.32 0.0% 0.00 14.7% 2,283.84 1.0% 161.24 5.1% 788.68 14.1% 2,182.76 2.5% 392.85 2.4% 366.77Zillah 50.8% 6,670.02 10.3% 1,347.35 1.9% 252.86 0.0% 0.00 10.4% 1,368.48 2.2% 288.35 1.8% 233.60 17.0% 2,231.60 2.8% 374.26 2.8% 371.28Wapato 47.3% 7,060.85 9.8% 1,462.82 4.2% 621.89 0.0% 0.00 14.2% 2,120.96 1.2% 184.32 1.3% 200.64 15.7% 2,350.42 3.3% 490.19 2.9% 438.86West Valley (Yakima) 53.7% 6,989.09 13.1% 1,710.65 6.7% 878.42 0.0% 0.00 5.1% 658.00 0.3% 43.10 1.0% 123.89 14.8% 1,926.98 2.2% 286.65 3.1% 397.80Mount Adams 43.2% 7,829.61 11.4% 2,058.92 2.3% 419.40 0.0% 0.00 16.9% 3,061.27 0.4% 64.09 0.0% 0.00 18.0% 3,256.18 3.5% 627.16 4.4% 797.72Yakama Nation Tribal School 69.1% 8,154.00 4.6% 541.23 0.0% 0.00 0.0% 0.00 0.0% 0.00 0.0% 0.00 0.0% 0.00 26.4% 3,111.57 0.0% 0.00 0.0% 0.00County Total 48.7% 6,835.11 12.4% 1,742.95 4.3% 608.47 0.6% 78.28 12.0% 1,686.53 0.9% 123.80 1.5% 210.63 14.0% 1,962.68 3.0% 418.73 2.5% 354.25
Except where otherwise noted, the School District & ESD Financial Reporting Summary for 2019–20 by Office of Superintendent of Public Instructions is licensed undera Creative Commons Attribution 4.0 International License.
69
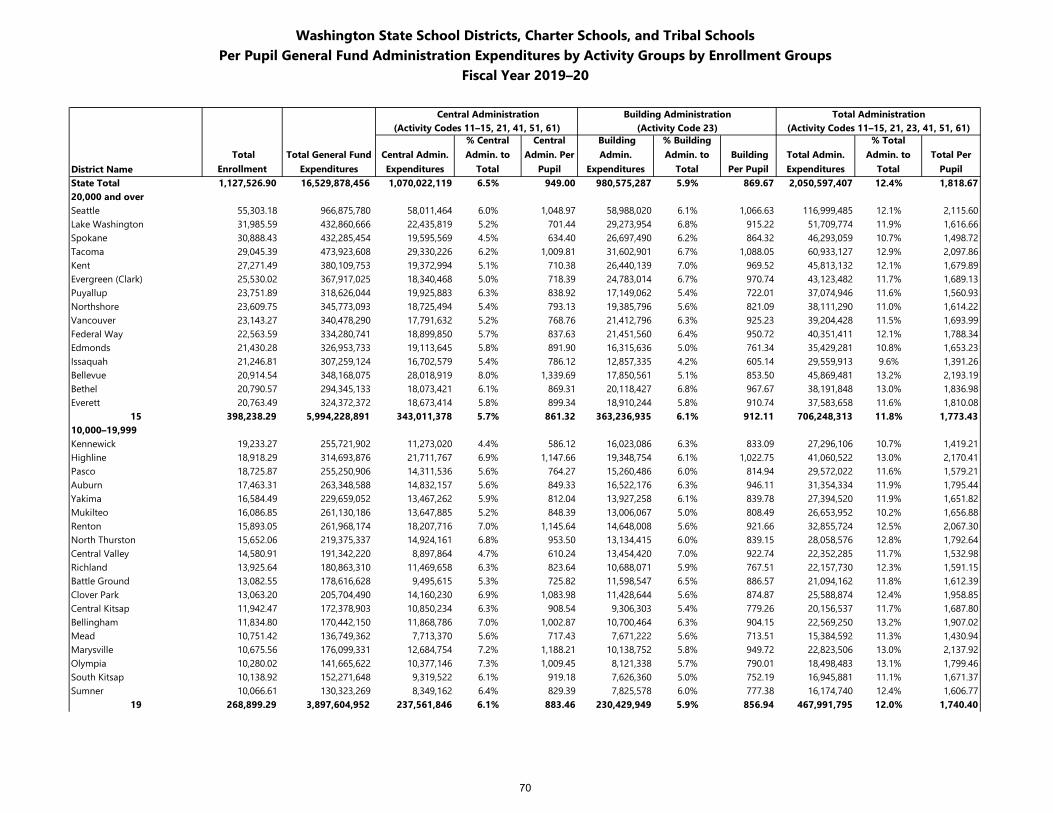
Washington State School Districts, Charter Schools, and Tribal SchoolsPer Pupil General Fund Administration Expenditures by Activity Groups by Enrollment Groups
Fiscal Year 2019–20
Central Administration Building Administration Total Administration(Activity Codes 11–15, 21, 41, 51, 61) (Activity Code 23) (Activity Codes 11–15, 21, 23, 41, 51, 61)
District Name Total
Enrollment Total General Fund
ExpendituresCentral Admin. Expenditures
% Central Admin. to
Total
Central Admin. Per
Pupil
Building Admin.
Expenditures
% Building Admin. to
Total Building Per Pupil
Total Admin. Expenditures
% Total Admin. to
TotalTotal Per
PupilState Total 1,127,526.90 16,529,878,456 1,070,022,119 6.5% 949.00 980,575,287 5.9% 869.67 2,050,597,407 12.4% 1,818.6720,000 and overSeattle 55,303.18 966,875,780 58,011,464 6.0% 1,048.97 58,988,020 6.1% 1,066.63 116,999,485 12.1% 2,115.60Lake Washington 31,985.59 432,860,666 22,435,819 5.2% 701.44 29,273,954 6.8% 915.22 51,709,774 11.9% 1,616.66Spokane 30,888.43 432,285,454 19,595,569 4.5% 634.40 26,697,490 6.2% 864.32 46,293,059 10.7% 1,498.72Tacoma 29,045.39 473,923,608 29,330,226 6.2% 1,009.81 31,602,901 6.7% 1,088.05 60,933,127 12.9% 2,097.86Kent 27,271.49 380,109,753 19,372,994 5.1% 710.38 26,440,139 7.0% 969.52 45,813,132 12.1% 1,679.89Evergreen (Clark) 25,530.02 367,917,025 18,340,468 5.0% 718.39 24,783,014 6.7% 970.74 43,123,482 11.7% 1,689.13Puyallup 23,751.89 318,626,044 19,925,883 6.3% 838.92 17,149,062 5.4% 722.01 37,074,946 11.6% 1,560.93Northshore 23,609.75 345,773,093 18,725,494 5.4% 793.13 19,385,796 5.6% 821.09 38,111,290 11.0% 1,614.22Vancouver 23,143.27 340,478,290 17,791,632 5.2% 768.76 21,412,796 6.3% 925.23 39,204,428 11.5% 1,693.99Federal Way 22,563.59 334,280,741 18,899,850 5.7% 837.63 21,451,560 6.4% 950.72 40,351,411 12.1% 1,788.34Edmonds 21,430.28 326,953,733 19,113,645 5.8% 891.90 16,315,636 5.0% 761.34 35,429,281 10.8% 1,653.23Issaquah 21,246.81 307,259,124 16,702,579 5.4% 786.12 12,857,335 4.2% 605.14 29,559,913 9.6% 1,391.26Bellevue 20,914.54 348,168,075 28,018,919 8.0% 1,339.69 17,850,561 5.1% 853.50 45,869,481 13.2% 2,193.19Bethel 20,790.57 294,345,133 18,073,421 6.1% 869.31 20,118,427 6.8% 967.67 38,191,848 13.0% 1,836.98Everett 20,763.49 324,372,372 18,673,414 5.8% 899.34 18,910,244 5.8% 910.74 37,583,658 11.6% 1,810.08
15 398,238.29 5,994,228,891 343,011,378 5.7% 861.32 363,236,935 6.1% 912.11 706,248,313 11.8% 1,773.4310,000–19,999Kennewick 19,233.27 255,721,902 11,273,020 4.4% 586.12 16,023,086 6.3% 833.09 27,296,106 10.7% 1,419.21Highline 18,918.29 314,693,876 21,711,767 6.9% 1,147.66 19,348,754 6.1% 1,022.75 41,060,522 13.0% 2,170.41Pasco 18,725.87 255,250,906 14,311,536 5.6% 764.27 15,260,486 6.0% 814.94 29,572,022 11.6% 1,579.21Auburn 17,463.31 263,348,588 14,832,157 5.6% 849.33 16,522,176 6.3% 946.11 31,354,334 11.9% 1,795.44Yakima 16,584.49 229,659,052 13,467,262 5.9% 812.04 13,927,258 6.1% 839.78 27,394,520 11.9% 1,651.82Mukilteo 16,086.85 261,130,186 13,647,885 5.2% 848.39 13,006,067 5.0% 808.49 26,653,952 10.2% 1,656.88Renton 15,893.05 261,968,174 18,207,716 7.0% 1,145.64 14,648,008 5.6% 921.66 32,855,724 12.5% 2,067.30North Thurston 15,652.06 219,375,337 14,924,161 6.8% 953.50 13,134,415 6.0% 839.15 28,058,576 12.8% 1,792.64Central Valley 14,580.91 191,342,220 8,897,864 4.7% 610.24 13,454,420 7.0% 922.74 22,352,285 11.7% 1,532.98Richland 13,925.64 180,863,310 11,469,658 6.3% 823.64 10,688,071 5.9% 767.51 22,157,730 12.3% 1,591.15Battle Ground 13,082.55 178,616,628 9,495,615 5.3% 725.82 11,598,547 6.5% 886.57 21,094,162 11.8% 1,612.39Clover Park 13,063.20 205,704,490 14,160,230 6.9% 1,083.98 11,428,644 5.6% 874.87 25,588,874 12.4% 1,958.85Central Kitsap 11,942.47 172,378,903 10,850,234 6.3% 908.54 9,306,303 5.4% 779.26 20,156,537 11.7% 1,687.80Bellingham 11,834.80 170,442,150 11,868,786 7.0% 1,002.87 10,700,464 6.3% 904.15 22,569,250 13.2% 1,907.02Mead 10,751.42 136,749,362 7,713,370 5.6% 717.43 7,671,222 5.6% 713.51 15,384,592 11.3% 1,430.94Marysville 10,675.56 176,099,331 12,684,754 7.2% 1,188.21 10,138,752 5.8% 949.72 22,823,506 13.0% 2,137.92Olympia 10,280.02 141,665,622 10,377,146 7.3% 1,009.45 8,121,338 5.7% 790.01 18,498,483 13.1% 1,799.46South Kitsap 10,138.92 152,271,648 9,319,522 6.1% 919.18 7,626,360 5.0% 752.19 16,945,881 11.1% 1,671.37Sumner 10,066.61 130,323,269 8,349,162 6.4% 829.39 7,825,578 6.0% 777.38 16,174,740 12.4% 1,606.77
19 268,899.29 3,897,604,952 237,561,846 6.1% 883.46 230,429,949 5.9% 856.94 467,991,795 12.0% 1,740.40
70
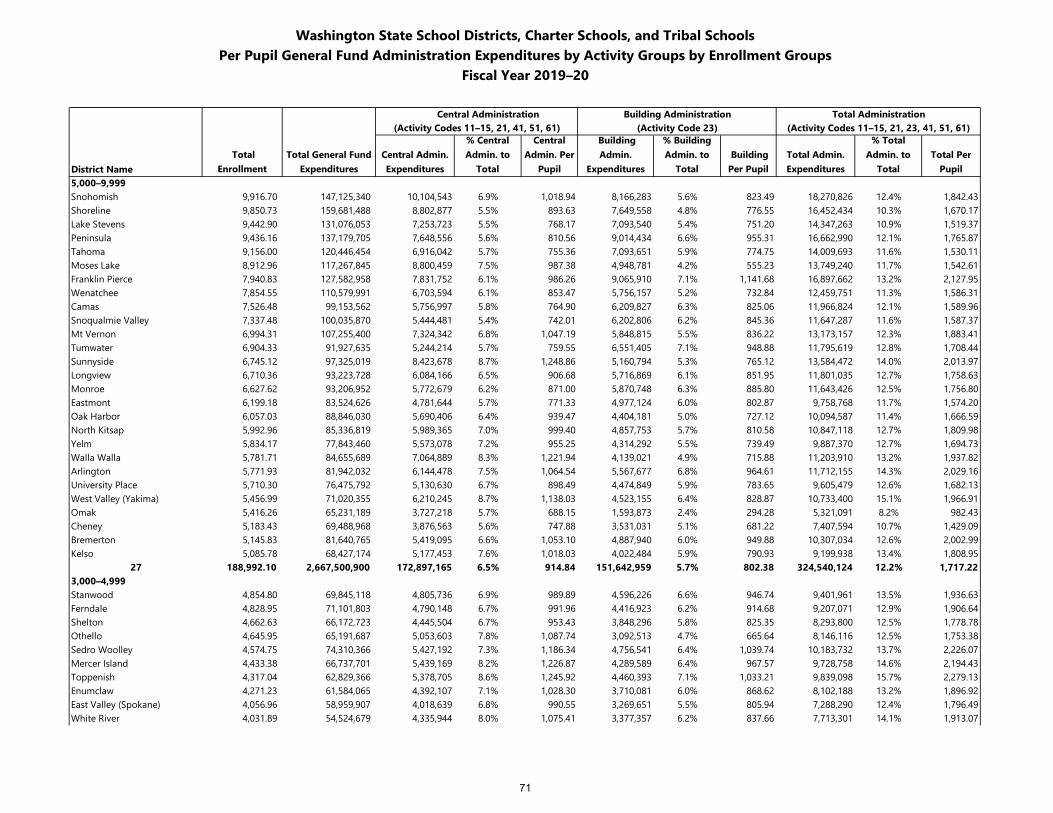
Washington State School Districts, Charter Schools, and Tribal SchoolsPer Pupil General Fund Administration Expenditures by Activity Groups by Enrollment Groups
Fiscal Year 2019–20
Central Administration Building Administration Total Administration(Activity Codes 11–15, 21, 41, 51, 61) (Activity Code 23) (Activity Codes 11–15, 21, 23, 41, 51, 61)
District Name Total
Enrollment Total General Fund
ExpendituresCentral Admin. Expenditures
% Central Admin. to
Total
Central Admin. Per
Pupil
Building Admin.
Expenditures
% Building Admin. to
Total Building Per Pupil
Total Admin. Expenditures
% Total Admin. to
TotalTotal Per
Pupil5,000–9,999Snohomish 9,916.70 147,125,340 10,104,543 6.9% 1,018.94 8,166,283 5.6% 823.49 18,270,826 12.4% 1,842.43Shoreline 9,850.73 159,681,488 8,802,877 5.5% 893.63 7,649,558 4.8% 776.55 16,452,434 10.3% 1,670.17Lake Stevens 9,442.90 131,076,053 7,253,723 5.5% 768.17 7,093,540 5.4% 751.20 14,347,263 10.9% 1,519.37Peninsula 9,436.16 137,179,705 7,648,556 5.6% 810.56 9,014,434 6.6% 955.31 16,662,990 12.1% 1,765.87Tahoma 9,156.00 120,446,454 6,916,042 5.7% 755.36 7,093,651 5.9% 774.75 14,009,693 11.6% 1,530.11Moses Lake 8,912.96 117,267,845 8,800,459 7.5% 987.38 4,948,781 4.2% 555.23 13,749,240 11.7% 1,542.61Franklin Pierce 7,940.83 127,582,958 7,831,752 6.1% 986.26 9,065,910 7.1% 1,141.68 16,897,662 13.2% 2,127.95Wenatchee 7,854.55 110,579,991 6,703,594 6.1% 853.47 5,756,157 5.2% 732.84 12,459,751 11.3% 1,586.31Camas 7,526.48 99,153,562 5,756,997 5.8% 764.90 6,209,827 6.3% 825.06 11,966,824 12.1% 1,589.96Snoqualmie Valley 7,337.48 100,035,870 5,444,481 5.4% 742.01 6,202,806 6.2% 845.36 11,647,287 11.6% 1,587.37Mt Vernon 6,994.31 107,255,400 7,324,342 6.8% 1,047.19 5,848,815 5.5% 836.22 13,173,157 12.3% 1,883.41Tumwater 6,904.33 91,927,635 5,244,214 5.7% 759.55 6,551,405 7.1% 948.88 11,795,619 12.8% 1,708.44Sunnyside 6,745.12 97,325,019 8,423,678 8.7% 1,248.86 5,160,794 5.3% 765.12 13,584,472 14.0% 2,013.97Longview 6,710.36 93,223,728 6,084,166 6.5% 906.68 5,716,869 6.1% 851.95 11,801,035 12.7% 1,758.63Monroe 6,627.62 93,206,952 5,772,679 6.2% 871.00 5,870,748 6.3% 885.80 11,643,426 12.5% 1,756.80Eastmont 6,199.18 83,524,626 4,781,644 5.7% 771.33 4,977,124 6.0% 802.87 9,758,768 11.7% 1,574.20Oak Harbor 6,057.03 88,846,030 5,690,406 6.4% 939.47 4,404,181 5.0% 727.12 10,094,587 11.4% 1,666.59North Kitsap 5,992.96 85,336,819 5,989,365 7.0% 999.40 4,857,753 5.7% 810.58 10,847,118 12.7% 1,809.98Yelm 5,834.17 77,843,460 5,573,078 7.2% 955.25 4,314,292 5.5% 739.49 9,887,370 12.7% 1,694.73Walla Walla 5,781.71 84,655,689 7,064,889 8.3% 1,221.94 4,139,021 4.9% 715.88 11,203,910 13.2% 1,937.82Arlington 5,771.93 81,942,032 6,144,478 7.5% 1,064.54 5,567,677 6.8% 964.61 11,712,155 14.3% 2,029.16University Place 5,710.30 76,475,792 5,130,630 6.7% 898.49 4,474,849 5.9% 783.65 9,605,479 12.6% 1,682.13West Valley (Yakima) 5,456.99 71,020,355 6,210,245 8.7% 1,138.03 4,523,155 6.4% 828.87 10,733,400 15.1% 1,966.91Omak 5,416.26 65,231,189 3,727,218 5.7% 688.15 1,593,873 2.4% 294.28 5,321,091 8.2% 982.43Cheney 5,183.43 69,488,968 3,876,563 5.6% 747.88 3,531,031 5.1% 681.22 7,407,594 10.7% 1,429.09Bremerton 5,145.83 81,640,765 5,419,095 6.6% 1,053.10 4,887,940 6.0% 949.88 10,307,034 12.6% 2,002.99Kelso 5,085.78 68,427,174 5,177,453 7.6% 1,018.03 4,022,484 5.9% 790.93 9,199,938 13.4% 1,808.95
27 188,992.10 2,667,500,900 172,897,165 6.5% 914.84 151,642,959 5.7% 802.38 324,540,124 12.2% 1,717.223,000–4,999Stanwood 4,854.80 69,845,118 4,805,736 6.9% 989.89 4,596,226 6.6% 946.74 9,401,961 13.5% 1,936.63Ferndale 4,828.95 71,101,803 4,790,148 6.7% 991.96 4,416,923 6.2% 914.68 9,207,071 12.9% 1,906.64Shelton 4,662.63 66,172,723 4,445,504 6.7% 953.43 3,848,296 5.8% 825.35 8,293,800 12.5% 1,778.78Othello 4,645.95 65,191,687 5,053,603 7.8% 1,087.74 3,092,513 4.7% 665.64 8,146,116 12.5% 1,753.38Sedro Woolley 4,574.75 74,310,366 5,427,192 7.3% 1,186.34 4,756,541 6.4% 1,039.74 10,183,732 13.7% 2,226.07Mercer Island 4,433.38 66,737,701 5,439,169 8.2% 1,226.87 4,289,589 6.4% 967.57 9,728,758 14.6% 2,194.43Toppenish 4,317.04 62,829,366 5,378,705 8.6% 1,245.92 4,460,393 7.1% 1,033.21 9,839,098 15.7% 2,279.13Enumclaw 4,271.23 61,584,065 4,392,107 7.1% 1,028.30 3,710,081 6.0% 868.62 8,102,188 13.2% 1,896.92East Valley (Spokane) 4,056.96 58,959,907 4,018,639 6.8% 990.55 3,269,651 5.5% 805.94 7,288,290 12.4% 1,796.49White River 4,031.89 54,524,679 4,335,944 8.0% 1,075.41 3,377,357 6.2% 837.66 7,713,301 14.1% 1,913.07
71
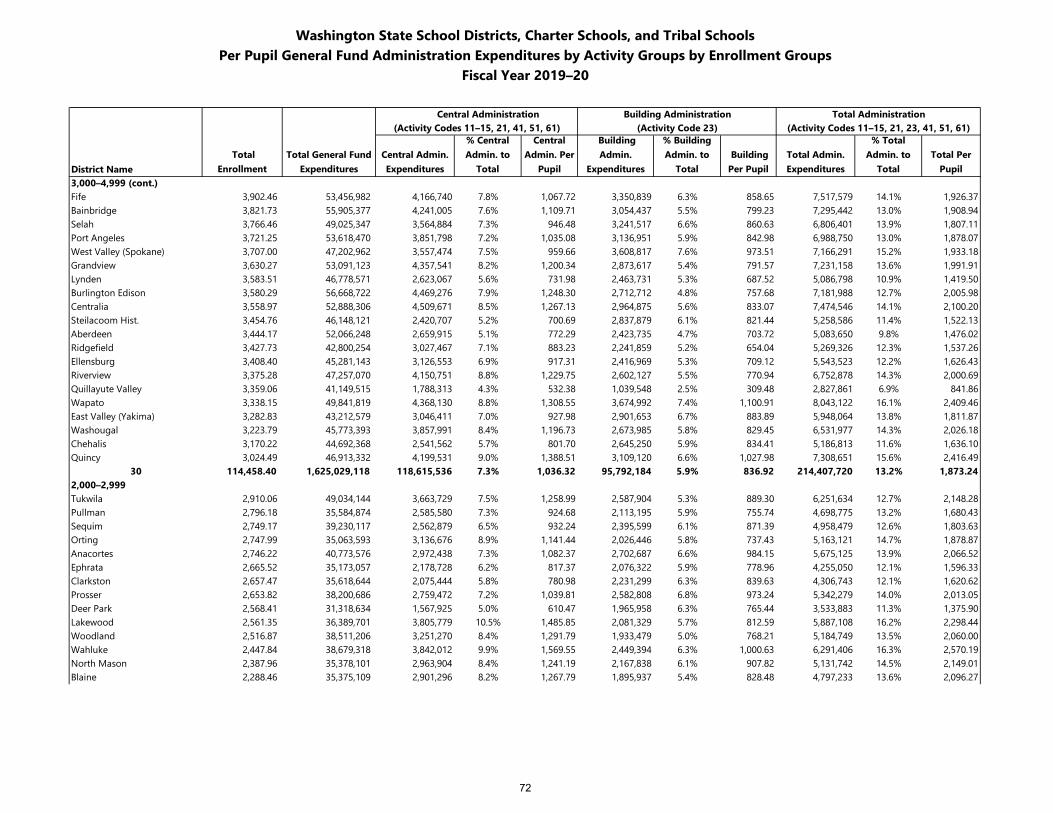
Washington State School Districts, Charter Schools, and Tribal SchoolsPer Pupil General Fund Administration Expenditures by Activity Groups by Enrollment Groups
Fiscal Year 2019–20
Central Administration Building Administration Total Administration(Activity Codes 11–15, 21, 41, 51, 61) (Activity Code 23) (Activity Codes 11–15, 21, 23, 41, 51, 61)
District Name Total
Enrollment Total General Fund
ExpendituresCentral Admin. Expenditures
% Central Admin. to
Total
Central Admin. Per
Pupil
Building Admin.
Expenditures
% Building Admin. to
Total Building Per Pupil
Total Admin. Expenditures
% Total Admin. to
TotalTotal Per
Pupil3,000–4,999 (cont.)Fife 3,902.46 53,456,982 4,166,740 7.8% 1,067.72 3,350,839 6.3% 858.65 7,517,579 14.1% 1,926.37Bainbridge 3,821.73 55,905,377 4,241,005 7.6% 1,109.71 3,054,437 5.5% 799.23 7,295,442 13.0% 1,908.94Selah 3,766.46 49,025,347 3,564,884 7.3% 946.48 3,241,517 6.6% 860.63 6,806,401 13.9% 1,807.11Port Angeles 3,721.25 53,618,470 3,851,798 7.2% 1,035.08 3,136,951 5.9% 842.98 6,988,750 13.0% 1,878.07West Valley (Spokane) 3,707.00 47,202,962 3,557,474 7.5% 959.66 3,608,817 7.6% 973.51 7,166,291 15.2% 1,933.18Grandview 3,630.27 53,091,123 4,357,541 8.2% 1,200.34 2,873,617 5.4% 791.57 7,231,158 13.6% 1,991.91Lynden 3,583.51 46,778,571 2,623,067 5.6% 731.98 2,463,731 5.3% 687.52 5,086,798 10.9% 1,419.50Burlington Edison 3,580.29 56,668,722 4,469,276 7.9% 1,248.30 2,712,712 4.8% 757.68 7,181,988 12.7% 2,005.98Centralia 3,558.97 52,888,306 4,509,671 8.5% 1,267.13 2,964,875 5.6% 833.07 7,474,546 14.1% 2,100.20Steilacoom Hist. 3,454.76 46,148,121 2,420,707 5.2% 700.69 2,837,879 6.1% 821.44 5,258,586 11.4% 1,522.13Aberdeen 3,444.17 52,066,248 2,659,915 5.1% 772.29 2,423,735 4.7% 703.72 5,083,650 9.8% 1,476.02Ridgefield 3,427.73 42,800,254 3,027,467 7.1% 883.23 2,241,859 5.2% 654.04 5,269,326 12.3% 1,537.26Ellensburg 3,408.40 45,281,143 3,126,553 6.9% 917.31 2,416,969 5.3% 709.12 5,543,523 12.2% 1,626.43Riverview 3,375.28 47,257,070 4,150,751 8.8% 1,229.75 2,602,127 5.5% 770.94 6,752,878 14.3% 2,000.69Quillayute Valley 3,359.06 41,149,515 1,788,313 4.3% 532.38 1,039,548 2.5% 309.48 2,827,861 6.9% 841.86Wapato 3,338.15 49,841,819 4,368,130 8.8% 1,308.55 3,674,992 7.4% 1,100.91 8,043,122 16.1% 2,409.46East Valley (Yakima) 3,282.83 43,212,579 3,046,411 7.0% 927.98 2,901,653 6.7% 883.89 5,948,064 13.8% 1,811.87Washougal 3,223.79 45,773,393 3,857,991 8.4% 1,196.73 2,673,985 5.8% 829.45 6,531,977 14.3% 2,026.18Chehalis 3,170.22 44,692,368 2,541,562 5.7% 801.70 2,645,250 5.9% 834.41 5,186,813 11.6% 1,636.10Quincy 3,024.49 46,913,332 4,199,531 9.0% 1,388.51 3,109,120 6.6% 1,027.98 7,308,651 15.6% 2,416.49
30 114,458.40 1,625,029,118 118,615,536 7.3% 1,036.32 95,792,184 5.9% 836.92 214,407,720 13.2% 1,873.242,000–2,999Tukwila 2,910.06 49,034,144 3,663,729 7.5% 1,258.99 2,587,904 5.3% 889.30 6,251,634 12.7% 2,148.28Pullman 2,796.18 35,584,874 2,585,580 7.3% 924.68 2,113,195 5.9% 755.74 4,698,775 13.2% 1,680.43Sequim 2,749.17 39,230,117 2,562,879 6.5% 932.24 2,395,599 6.1% 871.39 4,958,479 12.6% 1,803.63Orting 2,747.99 35,063,593 3,136,676 8.9% 1,141.44 2,026,446 5.8% 737.43 5,163,121 14.7% 1,878.87Anacortes 2,746.22 40,773,576 2,972,438 7.3% 1,082.37 2,702,687 6.6% 984.15 5,675,125 13.9% 2,066.52Ephrata 2,665.52 35,173,057 2,178,728 6.2% 817.37 2,076,322 5.9% 778.96 4,255,050 12.1% 1,596.33Clarkston 2,657.47 35,618,644 2,075,444 5.8% 780.98 2,231,299 6.3% 839.63 4,306,743 12.1% 1,620.62Prosser 2,653.82 38,200,686 2,759,472 7.2% 1,039.81 2,582,808 6.8% 973.24 5,342,279 14.0% 2,013.05Deer Park 2,568.41 31,318,634 1,567,925 5.0% 610.47 1,965,958 6.3% 765.44 3,533,883 11.3% 1,375.90Lakewood 2,561.35 36,389,701 3,805,779 10.5% 1,485.85 2,081,329 5.7% 812.59 5,887,108 16.2% 2,298.44Woodland 2,516.87 38,511,206 3,251,270 8.4% 1,291.79 1,933,479 5.0% 768.21 5,184,749 13.5% 2,060.00Wahluke 2,447.84 38,679,318 3,842,012 9.9% 1,569.55 2,449,394 6.3% 1,000.63 6,291,406 16.3% 2,570.19North Mason 2,387.96 35,378,101 2,963,904 8.4% 1,241.19 2,167,838 6.1% 907.82 5,131,742 14.5% 2,149.01Blaine 2,288.46 35,375,109 2,901,296 8.2% 1,267.79 1,895,937 5.4% 828.48 4,797,233 13.6% 2,096.27
72

Washington State School Districts, Charter Schools, and Tribal SchoolsPer Pupil General Fund Administration Expenditures by Activity Groups by Enrollment Groups
Fiscal Year 2019–20
Central Administration Building Administration Total Administration(Activity Codes 11–15, 21, 41, 51, 61) (Activity Code 23) (Activity Codes 11–15, 21, 23, 41, 51, 61)
District Name Total
Enrollment Total General Fund
ExpendituresCentral Admin. Expenditures
% Central Admin. to
Total
Central Admin. Per
Pupil
Building Admin.
Expenditures
% Building Admin. to
Total Building Per Pupil
Total Admin. Expenditures
% Total Admin. to
TotalTotal Per
Pupil2,000–2,999 (cont.)Rochester 2,218.62 31,580,920 1,695,009 5.4% 763.99 1,756,443 5.6% 791.68 3,451,452 10.9% 1,555.67Granite Falls 2,134.65 32,263,167 2,765,339 8.6% 1,295.45 1,560,696 4.8% 731.12 4,326,035 13.4% 2,026.58North Franklin 2,097.41 29,480,794 2,309,551 7.8% 1,101.14 1,436,007 4.9% 684.66 3,745,557 12.7% 1,785.80Hockinson 2,025.99 25,843,206 2,144,924 8.3% 1,058.70 1,684,554 6.5% 831.47 3,829,477 14.8% 1,890.18Sultan 2,005.42 31,089,466 2,314,462 7.4% 1,154.10 1,833,894 5.9% 914.47 4,148,356 13.3% 2,068.57
19 47,179.41 674,588,312 51,496,418 7.6% 1,091.50 39,481,787 5.9% 836.84 90,978,205 13.5% 1,928.351,000–1,999Eatonville 1,981.46 25,633,334 2,085,833 8.1% 1,052.67 1,599,041 6.2% 807.00 3,684,874 14.4% 1,859.68Nooksack Valley 1,945.29 27,850,003 1,865,941 6.7% 959.21 1,835,006 6.6% 943.31 3,700,947 13.3% 1,902.52Medical Lake 1,894.97 25,759,949 2,193,786 8.5% 1,157.69 1,573,840 6.1% 830.54 3,767,626 14.6% 1,988.22Mount Baker 1,843.06 31,542,035 2,510,310 8.0% 1,362.03 1,795,049 5.7% 973.95 4,305,360 13.6% 2,335.98Meridian 1,828.24 24,646,101 1,835,134 7.4% 1,003.77 1,644,186 6.7% 899.33 3,479,319 14.1% 1,903.10Colville 1,761.84 24,138,526 1,724,396 7.1% 978.75 1,304,258 5.4% 740.28 3,028,654 12.5% 1,719.03Royal 1,745.96 24,523,670 1,455,762 5.9% 833.79 1,501,203 6.1% 859.82 2,956,964 12.1% 1,693.60Mary M Knight 1,738.24 18,744,266 351,620 1.9% 202.28 279,619 1.5% 160.86 631,239 3.4% 363.15Lacenter 1,683.46 22,250,471 1,629,087 7.3% 967.70 1,414,343 6.4% 840.14 3,043,430 13.7% 1,807.84Hoquiam 1,633.55 23,600,836 1,948,896 8.3% 1,193.04 1,445,684 6.1% 885.00 3,394,581 14.4% 2,078.04College Place 1,632.26 20,005,650 1,584,551 7.9% 970.77 1,032,293 5.2% 632.43 2,616,844 13.1% 1,603.20Elma 1,609.18 24,301,327 1,768,929 7.3% 1,099.27 1,709,971 7.0% 1,062.63 3,478,899 14.3% 2,161.91Cashmere 1,605.62 21,547,601 1,211,371 5.6% 754.46 1,494,997 6.9% 931.10 2,706,369 12.6% 1,685.56Dieringer 1,565.49 24,739,021 1,681,814 6.8% 1,074.31 1,168,997 4.7% 746.73 2,850,812 11.5% 1,821.03Vashon Island 1,513.75 23,897,137 2,309,559 9.7% 1,525.72 1,401,628 5.9% 925.93 3,711,187 15.5% 2,451.65Riverside 1,479.08 20,491,058 1,277,148 6.2% 863.47 1,209,208 5.9% 817.54 2,486,356 12.1% 1,681.02Granger 1,478.97 22,923,761 1,936,702 8.4% 1,309.49 1,394,228 6.1% 942.70 3,330,930 14.5% 2,252.20Castle Rock 1,462.27 19,551,082 1,558,571 8.0% 1,065.86 1,214,192 6.2% 830.35 2,772,764 14.2% 1,896.20Montesano 1,460.63 19,140,564 1,325,748 6.9% 907.66 1,023,172 5.3% 700.50 2,348,920 12.3% 1,608.16Nine Mile Falls 1,440.97 19,012,441 1,312,466 6.9% 910.82 1,278,626 6.7% 887.34 2,591,092 13.6% 1,798.16Kiona Benton 1,394.91 20,885,271 2,005,560 9.6% 1,437.77 1,486,607 7.1% 1,065.74 3,492,167 16.7% 2,503.51Lake Chelan 1,390.52 21,212,439 1,748,495 8.2% 1,257.44 1,008,013 4.8% 724.92 2,756,507 13.0% 1,982.36Tenino 1,334.45 17,653,684 1,181,276 6.7% 885.22 1,451,427 8.2% 1,087.66 2,632,703 14.9% 1,972.88Cascade 1,325.90 19,098,162 1,446,448 7.6% 1,090.92 1,136,005 5.9% 856.78 2,582,452 13.5% 1,947.70South Whidbey 1,304.04 19,931,047 1,947,438 9.8% 1,493.39 1,251,734 6.3% 959.89 3,199,171 16.1% 2,453.28Zillah 1,296.99 17,039,588 1,377,616 8.1% 1,062.16 1,171,055 6.9% 902.90 2,548,671 15.0% 1,965.07Naches Valley 1,286.24 17,428,710 1,401,368 8.0% 1,089.51 1,109,425 6.4% 862.53 2,510,793 14.4% 1,952.04White Salmon 1,243.11 17,774,504 1,270,877 7.1% 1,022.34 1,299,457 7.3% 1,045.33 2,570,333 14.5% 2,067.66Port Townsend 1,222.92 18,689,013 1,562,288 8.4% 1,277.51 816,382 4.4% 667.57 2,378,670 12.7% 1,945.07Okanogan 1,175.68 15,756,097 1,264,994 8.0% 1,075.97 826,129 5.2% 702.68 2,091,123 13.3% 1,778.65Newport 1,133.29 15,258,068 889,319 5.8% 784.72 866,579 5.7% 764.66 1,755,898 11.5% 1,549.38Tonasket 1,131.31 15,900,077 1,399,320 8.8% 1,236.90 982,263 6.2% 868.25 2,381,583 15.0% 2,105.16
73
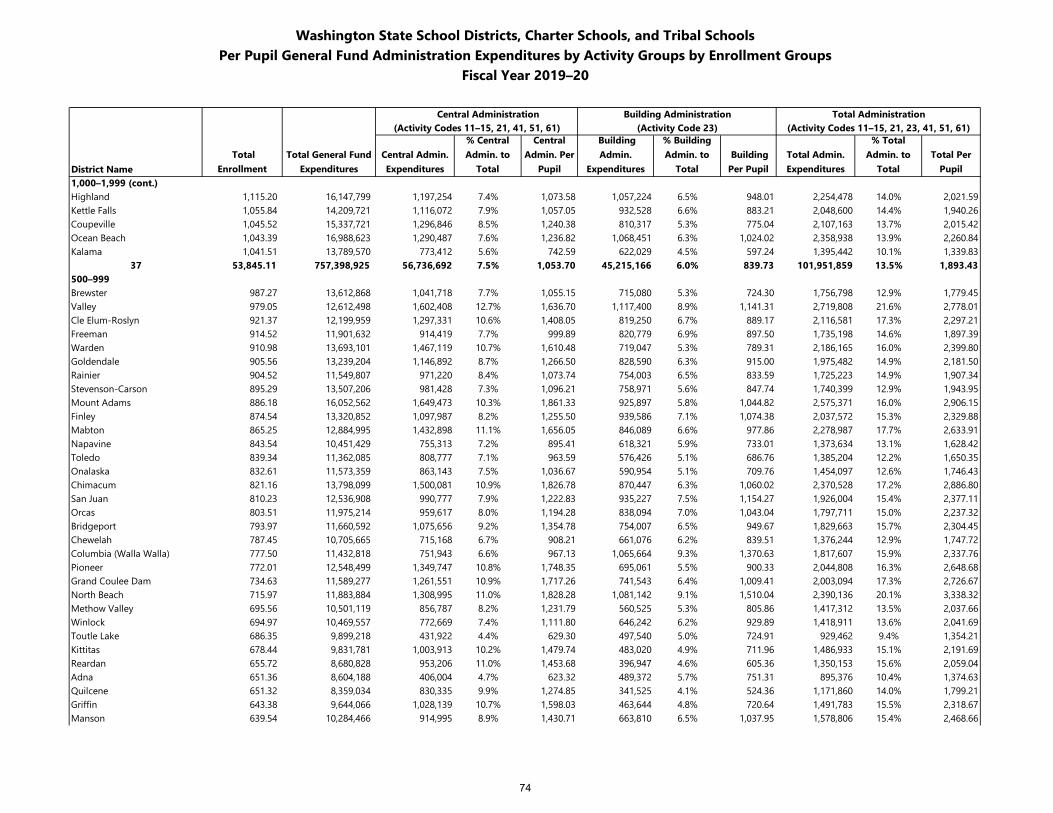
Washington State School Districts, Charter Schools, and Tribal SchoolsPer Pupil General Fund Administration Expenditures by Activity Groups by Enrollment Groups
Fiscal Year 2019–20
Central Administration Building Administration Total Administration(Activity Codes 11–15, 21, 41, 51, 61) (Activity Code 23) (Activity Codes 11–15, 21, 23, 41, 51, 61)
District Name Total
Enrollment Total General Fund
ExpendituresCentral Admin. Expenditures
% Central Admin. to
Total
Central Admin. Per
Pupil
Building Admin.
Expenditures
% Building Admin. to
Total Building Per Pupil
Total Admin. Expenditures
% Total Admin. to
TotalTotal Per
Pupil1,000–1,999 (cont.)Highland 1,115.20 16,147,799 1,197,254 7.4% 1,073.58 1,057,224 6.5% 948.01 2,254,478 14.0% 2,021.59Kettle Falls 1,055.84 14,209,721 1,116,072 7.9% 1,057.05 932,528 6.6% 883.21 2,048,600 14.4% 1,940.26Coupeville 1,045.52 15,337,721 1,296,846 8.5% 1,240.38 810,317 5.3% 775.04 2,107,163 13.7% 2,015.42Ocean Beach 1,043.39 16,988,623 1,290,487 7.6% 1,236.82 1,068,451 6.3% 1,024.02 2,358,938 13.9% 2,260.84Kalama 1,041.51 13,789,570 773,412 5.6% 742.59 622,029 4.5% 597.24 1,395,442 10.1% 1,339.83
37 53,845.11 757,398,925 56,736,692 7.5% 1,053.70 45,215,166 6.0% 839.73 101,951,859 13.5% 1,893.43500–999Brewster 987.27 13,612,868 1,041,718 7.7% 1,055.15 715,080 5.3% 724.30 1,756,798 12.9% 1,779.45Valley 979.05 12,612,498 1,602,408 12.7% 1,636.70 1,117,400 8.9% 1,141.31 2,719,808 21.6% 2,778.01Cle Elum-Roslyn 921.37 12,199,959 1,297,331 10.6% 1,408.05 819,250 6.7% 889.17 2,116,581 17.3% 2,297.21Freeman 914.52 11,901,632 914,419 7.7% 999.89 820,779 6.9% 897.50 1,735,198 14.6% 1,897.39Warden 910.98 13,693,101 1,467,119 10.7% 1,610.48 719,047 5.3% 789.31 2,186,165 16.0% 2,399.80Goldendale 905.56 13,239,204 1,146,892 8.7% 1,266.50 828,590 6.3% 915.00 1,975,482 14.9% 2,181.50Rainier 904.52 11,549,807 971,220 8.4% 1,073.74 754,003 6.5% 833.59 1,725,223 14.9% 1,907.34Stevenson-Carson 895.29 13,507,206 981,428 7.3% 1,096.21 758,971 5.6% 847.74 1,740,399 12.9% 1,943.95Mount Adams 886.18 16,052,562 1,649,473 10.3% 1,861.33 925,897 5.8% 1,044.82 2,575,371 16.0% 2,906.15Finley 874.54 13,320,852 1,097,987 8.2% 1,255.50 939,586 7.1% 1,074.38 2,037,572 15.3% 2,329.88Mabton 865.25 12,884,995 1,432,898 11.1% 1,656.05 846,089 6.6% 977.86 2,278,987 17.7% 2,633.91Napavine 843.54 10,451,429 755,313 7.2% 895.41 618,321 5.9% 733.01 1,373,634 13.1% 1,628.42Toledo 839.34 11,362,085 808,777 7.1% 963.59 576,426 5.1% 686.76 1,385,204 12.2% 1,650.35Onalaska 832.61 11,573,359 863,143 7.5% 1,036.67 590,954 5.1% 709.76 1,454,097 12.6% 1,746.43Chimacum 821.16 13,798,099 1,500,081 10.9% 1,826.78 870,447 6.3% 1,060.02 2,370,528 17.2% 2,886.80San Juan 810.23 12,536,908 990,777 7.9% 1,222.83 935,227 7.5% 1,154.27 1,926,004 15.4% 2,377.11Orcas 803.51 11,975,214 959,617 8.0% 1,194.28 838,094 7.0% 1,043.04 1,797,711 15.0% 2,237.32Bridgeport 793.97 11,660,592 1,075,656 9.2% 1,354.78 754,007 6.5% 949.67 1,829,663 15.7% 2,304.45Chewelah 787.45 10,705,665 715,168 6.7% 908.21 661,076 6.2% 839.51 1,376,244 12.9% 1,747.72Columbia (Walla Walla) 777.50 11,432,818 751,943 6.6% 967.13 1,065,664 9.3% 1,370.63 1,817,607 15.9% 2,337.76Pioneer 772.01 12,548,499 1,349,747 10.8% 1,748.35 695,061 5.5% 900.33 2,044,808 16.3% 2,648.68Grand Coulee Dam 734.63 11,589,277 1,261,551 10.9% 1,717.26 741,543 6.4% 1,009.41 2,003,094 17.3% 2,726.67North Beach 715.97 11,883,884 1,308,995 11.0% 1,828.28 1,081,142 9.1% 1,510.04 2,390,136 20.1% 3,338.32Methow Valley 695.56 10,501,119 856,787 8.2% 1,231.79 560,525 5.3% 805.86 1,417,312 13.5% 2,037.66Winlock 694.97 10,469,557 772,669 7.4% 1,111.80 646,242 6.2% 929.89 1,418,911 13.6% 2,041.69Toutle Lake 686.35 9,899,218 431,922 4.4% 629.30 497,540 5.0% 724.91 929,462 9.4% 1,354.21Kittitas 678.44 9,831,781 1,003,913 10.2% 1,479.74 483,020 4.9% 711.96 1,486,933 15.1% 2,191.69Reardan 655.72 8,680,828 953,206 11.0% 1,453.68 396,947 4.6% 605.36 1,350,153 15.6% 2,059.04Adna 651.36 8,604,188 406,004 4.7% 623.32 489,372 5.7% 751.31 895,376 10.4% 1,374.63Quilcene 651.32 8,359,034 830,335 9.9% 1,274.85 341,525 4.1% 524.36 1,171,860 14.0% 1,799.21Griffin 643.38 9,644,066 1,028,139 10.7% 1,598.03 463,644 4.8% 720.64 1,491,783 15.5% 2,318.67Manson 639.54 10,284,466 914,995 8.9% 1,430.71 663,810 6.5% 1,037.95 1,578,806 15.4% 2,468.66
74
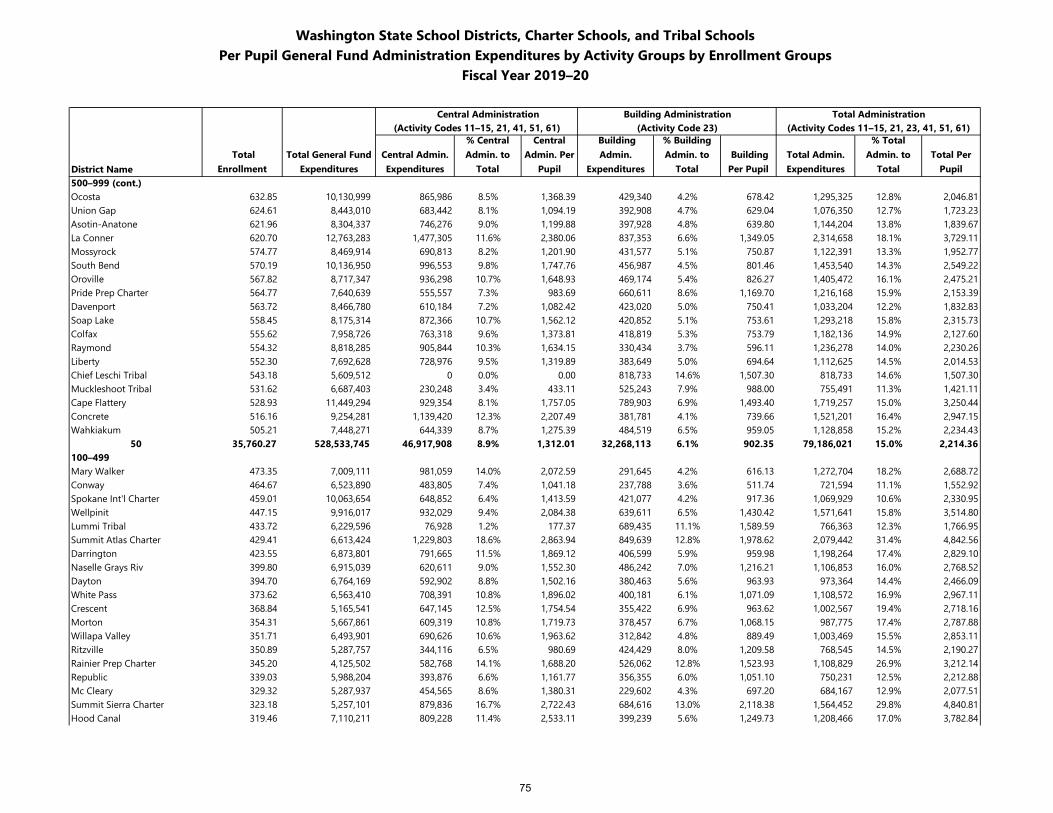
Washington State School Districts, Charter Schools, and Tribal SchoolsPer Pupil General Fund Administration Expenditures by Activity Groups by Enrollment Groups
Fiscal Year 2019–20
Central Administration Building Administration Total Administration(Activity Codes 11–15, 21, 41, 51, 61) (Activity Code 23) (Activity Codes 11–15, 21, 23, 41, 51, 61)
District Name Total
Enrollment Total General Fund
ExpendituresCentral Admin. Expenditures
% Central Admin. to
Total
Central Admin. Per
Pupil
Building Admin.
Expenditures
% Building Admin. to
Total Building Per Pupil
Total Admin. Expenditures
% Total Admin. to
TotalTotal Per
Pupil500–999 (cont.)Ocosta 632.85 10,130,999 865,986 8.5% 1,368.39 429,340 4.2% 678.42 1,295,325 12.8% 2,046.81Union Gap 624.61 8,443,010 683,442 8.1% 1,094.19 392,908 4.7% 629.04 1,076,350 12.7% 1,723.23Asotin-Anatone 621.96 8,304,337 746,276 9.0% 1,199.88 397,928 4.8% 639.80 1,144,204 13.8% 1,839.67La Conner 620.70 12,763,283 1,477,305 11.6% 2,380.06 837,353 6.6% 1,349.05 2,314,658 18.1% 3,729.11Mossyrock 574.77 8,469,914 690,813 8.2% 1,201.90 431,577 5.1% 750.87 1,122,391 13.3% 1,952.77South Bend 570.19 10,136,950 996,553 9.8% 1,747.76 456,987 4.5% 801.46 1,453,540 14.3% 2,549.22Oroville 567.82 8,717,347 936,298 10.7% 1,648.93 469,174 5.4% 826.27 1,405,472 16.1% 2,475.21Pride Prep Charter 564.77 7,640,639 555,557 7.3% 983.69 660,611 8.6% 1,169.70 1,216,168 15.9% 2,153.39Davenport 563.72 8,466,780 610,184 7.2% 1,082.42 423,020 5.0% 750.41 1,033,204 12.2% 1,832.83Soap Lake 558.45 8,175,314 872,366 10.7% 1,562.12 420,852 5.1% 753.61 1,293,218 15.8% 2,315.73Colfax 555.62 7,958,726 763,318 9.6% 1,373.81 418,819 5.3% 753.79 1,182,136 14.9% 2,127.60Raymond 554.32 8,818,285 905,844 10.3% 1,634.15 330,434 3.7% 596.11 1,236,278 14.0% 2,230.26Liberty 552.30 7,692,628 728,976 9.5% 1,319.89 383,649 5.0% 694.64 1,112,625 14.5% 2,014.53Chief Leschi Tribal 543.18 5,609,512 0 0.0% 0.00 818,733 14.6% 1,507.30 818,733 14.6% 1,507.30Muckleshoot Tribal 531.62 6,687,403 230,248 3.4% 433.11 525,243 7.9% 988.00 755,491 11.3% 1,421.11Cape Flattery 528.93 11,449,294 929,354 8.1% 1,757.05 789,903 6.9% 1,493.40 1,719,257 15.0% 3,250.44Concrete 516.16 9,254,281 1,139,420 12.3% 2,207.49 381,781 4.1% 739.66 1,521,201 16.4% 2,947.15Wahkiakum 505.21 7,448,271 644,339 8.7% 1,275.39 484,519 6.5% 959.05 1,128,858 15.2% 2,234.43
50 35,760.27 528,533,745 46,917,908 8.9% 1,312.01 32,268,113 6.1% 902.35 79,186,021 15.0% 2,214.36100–499Mary Walker 473.35 7,009,111 981,059 14.0% 2,072.59 291,645 4.2% 616.13 1,272,704 18.2% 2,688.72Conway 464.67 6,523,890 483,805 7.4% 1,041.18 237,788 3.6% 511.74 721,594 11.1% 1,552.92Spokane Int'l Charter 459.01 10,063,654 648,852 6.4% 1,413.59 421,077 4.2% 917.36 1,069,929 10.6% 2,330.95Wellpinit 447.15 9,916,017 932,029 9.4% 2,084.38 639,611 6.5% 1,430.42 1,571,641 15.8% 3,514.80Lummi Tribal 433.72 6,229,596 76,928 1.2% 177.37 689,435 11.1% 1,589.59 766,363 12.3% 1,766.95Summit Atlas Charter 429.41 6,613,424 1,229,803 18.6% 2,863.94 849,639 12.8% 1,978.62 2,079,442 31.4% 4,842.56Darrington 423.55 6,873,801 791,665 11.5% 1,869.12 406,599 5.9% 959.98 1,198,264 17.4% 2,829.10Naselle Grays Riv 399.80 6,915,039 620,611 9.0% 1,552.30 486,242 7.0% 1,216.21 1,106,853 16.0% 2,768.52Dayton 394.70 6,764,169 592,902 8.8% 1,502.16 380,463 5.6% 963.93 973,364 14.4% 2,466.09White Pass 373.62 6,563,410 708,391 10.8% 1,896.02 400,181 6.1% 1,071.09 1,108,572 16.9% 2,967.11Crescent 368.84 5,165,541 647,145 12.5% 1,754.54 355,422 6.9% 963.62 1,002,567 19.4% 2,718.16Morton 354.31 5,667,861 609,319 10.8% 1,719.73 378,457 6.7% 1,068.15 987,775 17.4% 2,787.88Willapa Valley 351.71 6,493,901 690,626 10.6% 1,963.62 312,842 4.8% 889.49 1,003,469 15.5% 2,853.11Ritzville 350.89 5,287,757 344,116 6.5% 980.69 424,429 8.0% 1,209.58 768,545 14.5% 2,190.27Rainier Prep Charter 345.20 4,125,502 582,768 14.1% 1,688.20 526,062 12.8% 1,523.93 1,108,829 26.9% 3,212.14Republic 339.03 5,988,204 393,876 6.6% 1,161.77 356,355 6.0% 1,051.10 750,231 12.5% 2,212.88Mc Cleary 329.32 5,287,937 454,565 8.6% 1,380.31 229,602 4.3% 697.20 684,167 12.9% 2,077.51Summit Sierra Charter 323.18 5,257,101 879,836 16.7% 2,722.43 684,616 13.0% 2,118.38 1,564,452 29.8% 4,840.81Hood Canal 319.46 7,110,211 809,228 11.4% 2,533.11 399,239 5.6% 1,249.73 1,208,466 17.0% 3,782.84
75
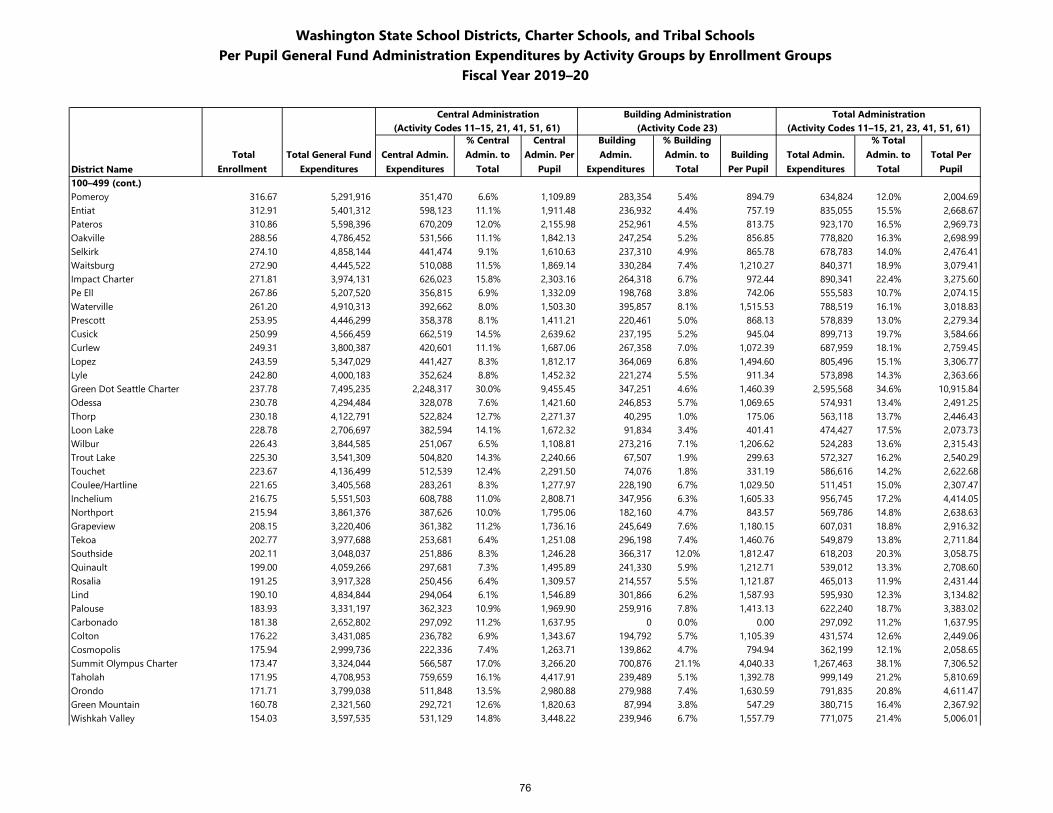
Washington State School Districts, Charter Schools, and Tribal SchoolsPer Pupil General Fund Administration Expenditures by Activity Groups by Enrollment Groups
Fiscal Year 2019–20
Central Administration Building Administration Total Administration(Activity Codes 11–15, 21, 41, 51, 61) (Activity Code 23) (Activity Codes 11–15, 21, 23, 41, 51, 61)
District Name Total
Enrollment Total General Fund
ExpendituresCentral Admin. Expenditures
% Central Admin. to
Total
Central Admin. Per
Pupil
Building Admin.
Expenditures
% Building Admin. to
Total Building Per Pupil
Total Admin. Expenditures
% Total Admin. to
TotalTotal Per
Pupil100–499 (cont.)Pomeroy 316.67 5,291,916 351,470 6.6% 1,109.89 283,354 5.4% 894.79 634,824 12.0% 2,004.69Entiat 312.91 5,401,312 598,123 11.1% 1,911.48 236,932 4.4% 757.19 835,055 15.5% 2,668.67Pateros 310.86 5,598,396 670,209 12.0% 2,155.98 252,961 4.5% 813.75 923,170 16.5% 2,969.73Oakville 288.56 4,786,452 531,566 11.1% 1,842.13 247,254 5.2% 856.85 778,820 16.3% 2,698.99Selkirk 274.10 4,858,144 441,474 9.1% 1,610.63 237,310 4.9% 865.78 678,783 14.0% 2,476.41Waitsburg 272.90 4,445,522 510,088 11.5% 1,869.14 330,284 7.4% 1,210.27 840,371 18.9% 3,079.41Impact Charter 271.81 3,974,131 626,023 15.8% 2,303.16 264,318 6.7% 972.44 890,341 22.4% 3,275.60Pe Ell 267.86 5,207,520 356,815 6.9% 1,332.09 198,768 3.8% 742.06 555,583 10.7% 2,074.15Waterville 261.20 4,910,313 392,662 8.0% 1,503.30 395,857 8.1% 1,515.53 788,519 16.1% 3,018.83Prescott 253.95 4,446,299 358,378 8.1% 1,411.21 220,461 5.0% 868.13 578,839 13.0% 2,279.34Cusick 250.99 4,566,459 662,519 14.5% 2,639.62 237,195 5.2% 945.04 899,713 19.7% 3,584.66Curlew 249.31 3,800,387 420,601 11.1% 1,687.06 267,358 7.0% 1,072.39 687,959 18.1% 2,759.45Lopez 243.59 5,347,029 441,427 8.3% 1,812.17 364,069 6.8% 1,494.60 805,496 15.1% 3,306.77Lyle 242.80 4,000,183 352,624 8.8% 1,452.32 221,274 5.5% 911.34 573,898 14.3% 2,363.66Green Dot Seattle Charter 237.78 7,495,235 2,248,317 30.0% 9,455.45 347,251 4.6% 1,460.39 2,595,568 34.6% 10,915.84Odessa 230.78 4,294,484 328,078 7.6% 1,421.60 246,853 5.7% 1,069.65 574,931 13.4% 2,491.25Thorp 230.18 4,122,791 522,824 12.7% 2,271.37 40,295 1.0% 175.06 563,118 13.7% 2,446.43Loon Lake 228.78 2,706,697 382,594 14.1% 1,672.32 91,834 3.4% 401.41 474,427 17.5% 2,073.73Wilbur 226.43 3,844,585 251,067 6.5% 1,108.81 273,216 7.1% 1,206.62 524,283 13.6% 2,315.43Trout Lake 225.30 3,541,309 504,820 14.3% 2,240.66 67,507 1.9% 299.63 572,327 16.2% 2,540.29Touchet 223.67 4,136,499 512,539 12.4% 2,291.50 74,076 1.8% 331.19 586,616 14.2% 2,622.68Coulee/Hartline 221.65 3,405,568 283,261 8.3% 1,277.97 228,190 6.7% 1,029.50 511,451 15.0% 2,307.47Inchelium 216.75 5,551,503 608,788 11.0% 2,808.71 347,956 6.3% 1,605.33 956,745 17.2% 4,414.05Northport 215.94 3,861,376 387,626 10.0% 1,795.06 182,160 4.7% 843.57 569,786 14.8% 2,638.63Grapeview 208.15 3,220,406 361,382 11.2% 1,736.16 245,649 7.6% 1,180.15 607,031 18.8% 2,916.32Tekoa 202.77 3,977,688 253,681 6.4% 1,251.08 296,198 7.4% 1,460.76 549,879 13.8% 2,711.84Southside 202.11 3,048,037 251,886 8.3% 1,246.28 366,317 12.0% 1,812.47 618,203 20.3% 3,058.75Quinault 199.00 4,059,266 297,681 7.3% 1,495.89 241,330 5.9% 1,212.71 539,012 13.3% 2,708.60Rosalia 191.25 3,917,328 250,456 6.4% 1,309.57 214,557 5.5% 1,121.87 465,013 11.9% 2,431.44Lind 190.10 4,834,844 294,064 6.1% 1,546.89 301,866 6.2% 1,587.93 595,930 12.3% 3,134.82Palouse 183.93 3,331,197 362,323 10.9% 1,969.90 259,916 7.8% 1,413.13 622,240 18.7% 3,383.02Carbonado 181.38 2,652,802 297,092 11.2% 1,637.95 0 0.0% 0.00 297,092 11.2% 1,637.95Colton 176.22 3,431,085 236,782 6.9% 1,343.67 194,792 5.7% 1,105.39 431,574 12.6% 2,449.06Cosmopolis 175.94 2,999,736 222,336 7.4% 1,263.71 139,862 4.7% 794.94 362,199 12.1% 2,058.65Summit Olympus Charter 173.47 3,324,044 566,587 17.0% 3,266.20 700,876 21.1% 4,040.33 1,267,463 38.1% 7,306.52Taholah 171.95 4,708,953 759,659 16.1% 4,417.91 239,489 5.1% 1,392.78 999,149 21.2% 5,810.69Orondo 171.71 3,799,038 511,848 13.5% 2,980.88 279,988 7.4% 1,630.59 791,835 20.8% 4,611.47Green Mountain 160.78 2,321,560 292,721 12.6% 1,820.63 87,994 3.8% 547.29 380,715 16.4% 2,367.92Wishkah Valley 154.03 3,597,535 531,129 14.8% 3,448.22 239,946 6.7% 1,557.79 771,075 21.4% 5,006.01
76
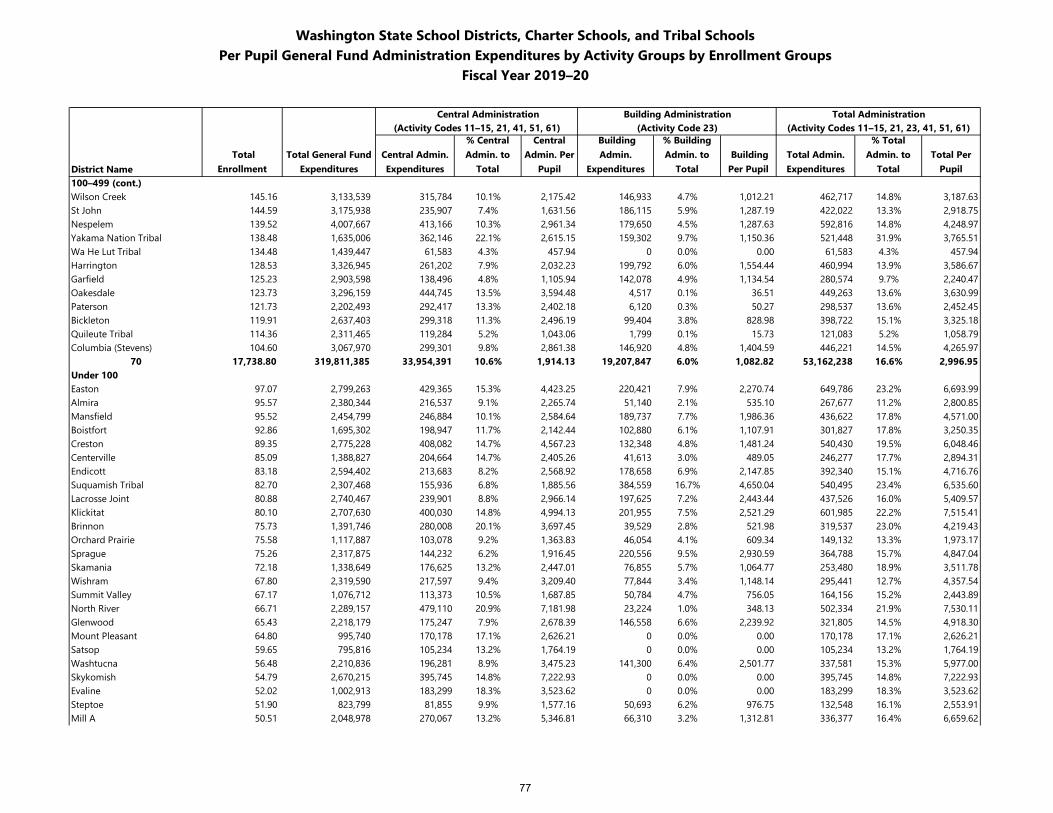
Washington State School Districts, Charter Schools, and Tribal SchoolsPer Pupil General Fund Administration Expenditures by Activity Groups by Enrollment Groups
Fiscal Year 2019–20
Central Administration Building Administration Total Administration(Activity Codes 11–15, 21, 41, 51, 61) (Activity Code 23) (Activity Codes 11–15, 21, 23, 41, 51, 61)
District Name Total
Enrollment Total General Fund
ExpendituresCentral Admin. Expenditures
% Central Admin. to
Total
Central Admin. Per
Pupil
Building Admin.
Expenditures
% Building Admin. to
Total Building Per Pupil
Total Admin. Expenditures
% Total Admin. to
TotalTotal Per
Pupil100–499 (cont.)Wilson Creek 145.16 3,133,539 315,784 10.1% 2,175.42 146,933 4.7% 1,012.21 462,717 14.8% 3,187.63St John 144.59 3,175,938 235,907 7.4% 1,631.56 186,115 5.9% 1,287.19 422,022 13.3% 2,918.75Nespelem 139.52 4,007,667 413,166 10.3% 2,961.34 179,650 4.5% 1,287.63 592,816 14.8% 4,248.97Yakama Nation Tribal 138.48 1,635,006 362,146 22.1% 2,615.15 159,302 9.7% 1,150.36 521,448 31.9% 3,765.51Wa He Lut Tribal 134.48 1,439,447 61,583 4.3% 457.94 0 0.0% 0.00 61,583 4.3% 457.94Harrington 128.53 3,326,945 261,202 7.9% 2,032.23 199,792 6.0% 1,554.44 460,994 13.9% 3,586.67Garfield 125.23 2,903,598 138,496 4.8% 1,105.94 142,078 4.9% 1,134.54 280,574 9.7% 2,240.47Oakesdale 123.73 3,296,159 444,745 13.5% 3,594.48 4,517 0.1% 36.51 449,263 13.6% 3,630.99Paterson 121.73 2,202,493 292,417 13.3% 2,402.18 6,120 0.3% 50.27 298,537 13.6% 2,452.45Bickleton 119.91 2,637,403 299,318 11.3% 2,496.19 99,404 3.8% 828.98 398,722 15.1% 3,325.18Quileute Tribal 114.36 2,311,465 119,284 5.2% 1,043.06 1,799 0.1% 15.73 121,083 5.2% 1,058.79Columbia (Stevens) 104.60 3,067,970 299,301 9.8% 2,861.38 146,920 4.8% 1,404.59 446,221 14.5% 4,265.97
70 17,738.80 319,811,385 33,954,391 10.6% 1,914.13 19,207,847 6.0% 1,082.82 53,162,238 16.6% 2,996.95Under 100Easton 97.07 2,799,263 429,365 15.3% 4,423.25 220,421 7.9% 2,270.74 649,786 23.2% 6,693.99Almira 95.57 2,380,344 216,537 9.1% 2,265.74 51,140 2.1% 535.10 267,677 11.2% 2,800.85Mansfield 95.52 2,454,799 246,884 10.1% 2,584.64 189,737 7.7% 1,986.36 436,622 17.8% 4,571.00Boistfort 92.86 1,695,302 198,947 11.7% 2,142.44 102,880 6.1% 1,107.91 301,827 17.8% 3,250.35Creston 89.35 2,775,228 408,082 14.7% 4,567.23 132,348 4.8% 1,481.24 540,430 19.5% 6,048.46Centerville 85.09 1,388,827 204,664 14.7% 2,405.26 41,613 3.0% 489.05 246,277 17.7% 2,894.31Endicott 83.18 2,594,402 213,683 8.2% 2,568.92 178,658 6.9% 2,147.85 392,340 15.1% 4,716.76Suquamish Tribal 82.70 2,307,468 155,936 6.8% 1,885.56 384,559 16.7% 4,650.04 540,495 23.4% 6,535.60Lacrosse Joint 80.88 2,740,467 239,901 8.8% 2,966.14 197,625 7.2% 2,443.44 437,526 16.0% 5,409.57Klickitat 80.10 2,707,630 400,030 14.8% 4,994.13 201,955 7.5% 2,521.29 601,985 22.2% 7,515.41Brinnon 75.73 1,391,746 280,008 20.1% 3,697.45 39,529 2.8% 521.98 319,537 23.0% 4,219.43Orchard Prairie 75.58 1,117,887 103,078 9.2% 1,363.83 46,054 4.1% 609.34 149,132 13.3% 1,973.17Sprague 75.26 2,317,875 144,232 6.2% 1,916.45 220,556 9.5% 2,930.59 364,788 15.7% 4,847.04Skamania 72.18 1,338,649 176,625 13.2% 2,447.01 76,855 5.7% 1,064.77 253,480 18.9% 3,511.78Wishram 67.80 2,319,590 217,597 9.4% 3,209.40 77,844 3.4% 1,148.14 295,441 12.7% 4,357.54Summit Valley 67.17 1,076,712 113,373 10.5% 1,687.85 50,784 4.7% 756.05 164,156 15.2% 2,443.89North River 66.71 2,289,157 479,110 20.9% 7,181.98 23,224 1.0% 348.13 502,334 21.9% 7,530.11Glenwood 65.43 2,218,179 175,247 7.9% 2,678.39 146,558 6.6% 2,239.92 321,805 14.5% 4,918.30Mount Pleasant 64.80 995,740 170,178 17.1% 2,626.21 0 0.0% 0.00 170,178 17.1% 2,626.21Satsop 59.65 795,816 105,234 13.2% 1,764.19 0 0.0% 0.00 105,234 13.2% 1,764.19Washtucna 56.48 2,210,836 196,281 8.9% 3,475.23 141,300 6.4% 2,501.77 337,581 15.3% 5,977.00Skykomish 54.79 2,670,215 395,745 14.8% 7,222.93 0 0.0% 0.00 395,745 14.8% 7,222.93Evaline 52.02 1,002,913 183,299 18.3% 3,523.62 0 0.0% 0.00 183,299 18.3% 3,523.62Steptoe 51.90 823,799 81,855 9.9% 1,577.16 50,693 6.2% 976.75 132,548 16.1% 2,553.91Mill A 50.51 2,048,978 270,067 13.2% 5,346.81 66,310 3.2% 1,312.81 336,377 16.4% 6,659.62
77
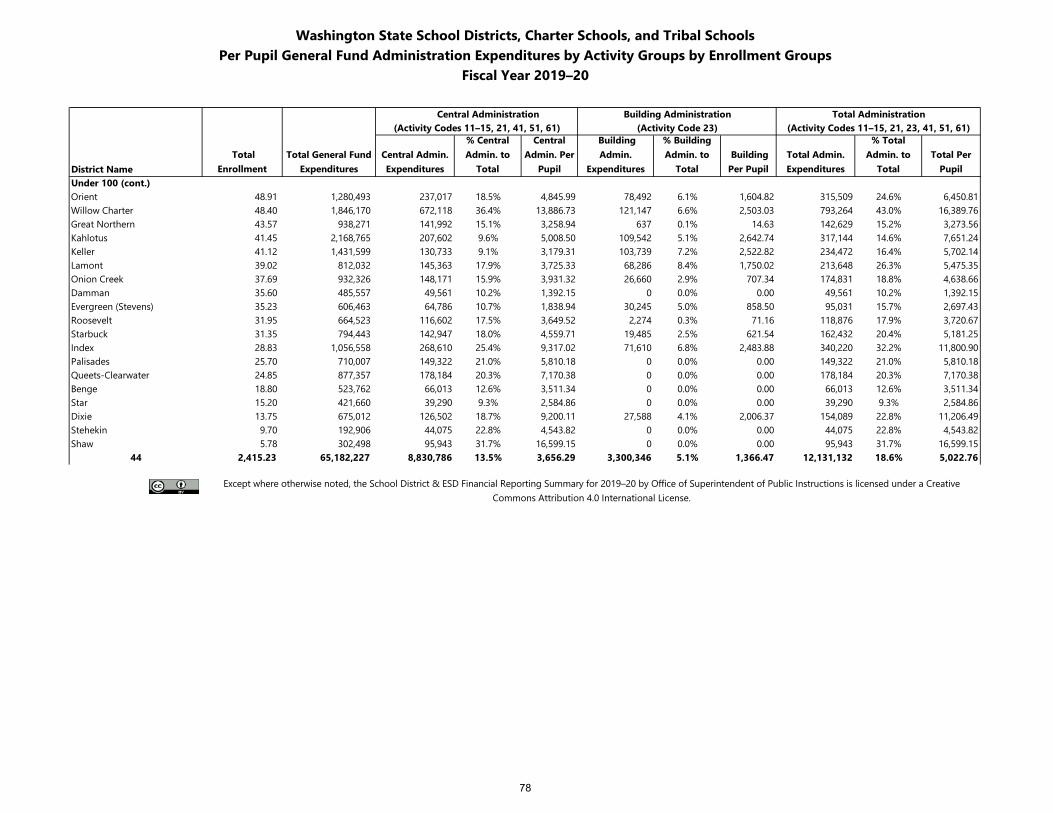
Washington State School Districts, Charter Schools, and Tribal SchoolsPer Pupil General Fund Administration Expenditures by Activity Groups by Enrollment Groups
Fiscal Year 2019–20
Central Administration Building Administration Total Administration(Activity Codes 11–15, 21, 41, 51, 61) (Activity Code 23) (Activity Codes 11–15, 21, 23, 41, 51, 61)
District Name Total
Enrollment Total General Fund
ExpendituresCentral Admin. Expenditures
% CentralAdmin. to
Total
Central Admin. Per
Pupil
BuildingAdmin.
Expenditures
% BuildingAdmin. to
Total Building Per Pupil
Total Admin. Expenditures
% TotalAdmin. to
TotalTotal Per
PupilUnder 100 (cont.)Orient 48.91 1,280,493 237,017 18.5% 4,845.99 78,492 6.1% 1,604.82 315,509 24.6% 6,450.81Willow Charter 48.40 1,846,170 672,118 36.4% 13,886.73 121,147 6.6% 2,503.03 793,264 43.0% 16,389.76Great Northern 43.57 938,271 141,992 15.1% 3,258.94 637 0.1% 14.63 142,629 15.2% 3,273.56Kahlotus 41.45 2,168,765 207,602 9.6% 5,008.50 109,542 5.1% 2,642.74 317,144 14.6% 7,651.24Keller 41.12 1,431,599 130,733 9.1% 3,179.31 103,739 7.2% 2,522.82 234,472 16.4% 5,702.14Lamont 39.02 812,032 145,363 17.9% 3,725.33 68,286 8.4% 1,750.02 213,648 26.3% 5,475.35Onion Creek 37.69 932,326 148,171 15.9% 3,931.32 26,660 2.9% 707.34 174,831 18.8% 4,638.66Damman 35.60 485,557 49,561 10.2% 1,392.15 0 0.0% 0.00 49,561 10.2% 1,392.15Evergreen (Stevens) 35.23 606,463 64,786 10.7% 1,838.94 30,245 5.0% 858.50 95,031 15.7% 2,697.43Roosevelt 31.95 664,523 116,602 17.5% 3,649.52 2,274 0.3% 71.16 118,876 17.9% 3,720.67Starbuck 31.35 794,443 142,947 18.0% 4,559.71 19,485 2.5% 621.54 162,432 20.4% 5,181.25Index 28.83 1,056,558 268,610 25.4% 9,317.02 71,610 6.8% 2,483.88 340,220 32.2% 11,800.90Palisades 25.70 710,007 149,322 21.0% 5,810.18 0 0.0% 0.00 149,322 21.0% 5,810.18Queets-Clearwater 24.85 877,357 178,184 20.3% 7,170.38 0 0.0% 0.00 178,184 20.3% 7,170.38Benge 18.80 523,762 66,013 12.6% 3,511.34 0 0.0% 0.00 66,013 12.6% 3,511.34Star 15.20 421,660 39,290 9.3% 2,584.86 0 0.0% 0.00 39,290 9.3% 2,584.86Dixie 13.75 675,012 126,502 18.7% 9,200.11 27,588 4.1% 2,006.37 154,089 22.8% 11,206.49Stehekin 9.70 192,906 44,075 22.8% 4,543.82 0 0.0% 0.00 44,075 22.8% 4,543.82Shaw 5.78 302,498 95,943 31.7% 16,599.15 0 0.0% 0.00 95,943 31.7% 16,599.15
44 2,415.23 65,182,227 8,830,786 13.5% 3,656.29 3,300,346 5.1% 1,366.47 12,131,132 18.6% 5,022.76
Except where otherwise noted, the School District & ESD Financial Reporting Summary for 2019–20 by Office of Superintendent of Public Instructions is licensed under a Creative Commons Attribution 4.0 International License.
78
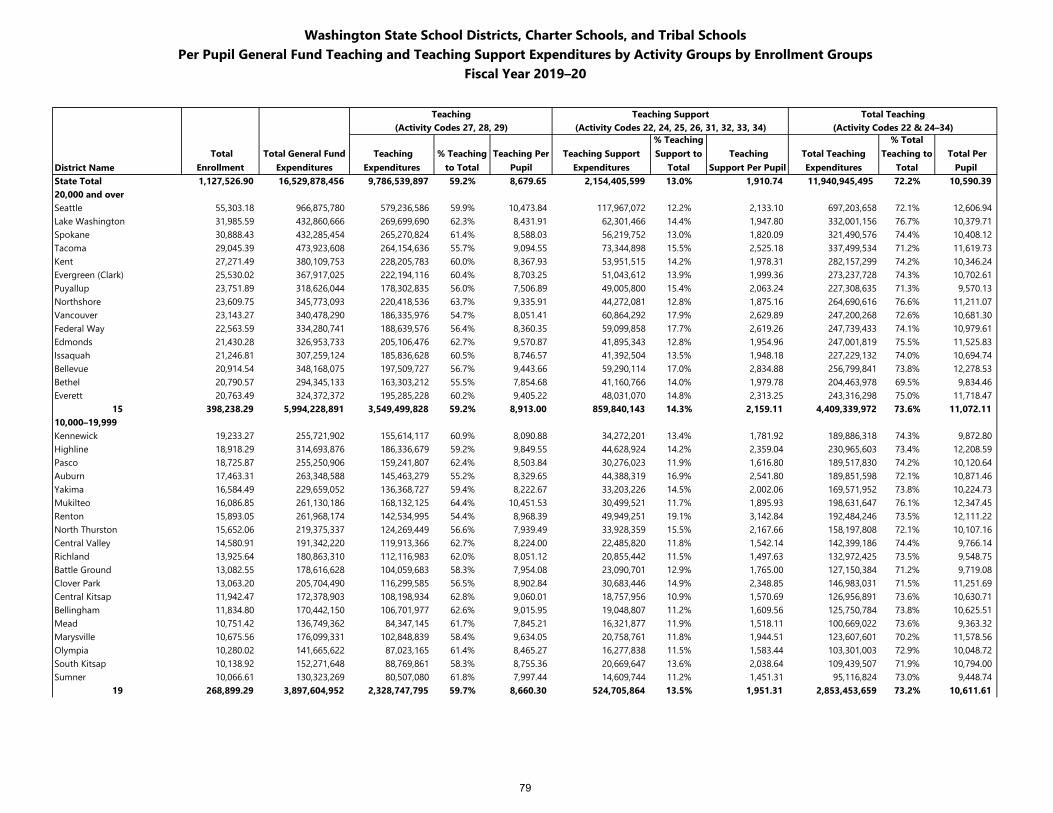
Washington State School Districts, Charter Schools, and Tribal SchoolsPer Pupil General Fund Teaching and Teaching Support Expenditures by Activity Groups by Enrollment Groups
Fiscal Year 2019–20
Teaching Teaching Support Total Teaching(Activity Codes 27, 28, 29) (Activity Codes 22, 24, 25, 26, 31, 32, 33, 34) (Activity Codes 22 & 24–34)
District Name Total
Enrollment Total General Fund
Expenditures Teaching
Expenditures % Teaching
to TotalTeaching Per
PupilTeaching Support
Expenditures
% Teaching Support to
Total Teaching
Support Per Pupil Total Teaching Expenditures
% Total Teaching to
Total Total Per
Pupil State Total 1,127,526.90 16,529,878,456 9,786,539,897 59.2% 8,679.65 2,154,405,599 13.0% 1,910.74 11,940,945,495 72.2% 10,590.39 20,000 and overSeattle 55,303.18 966,875,780 579,236,586 59.9% 10,473.84 117,967,072 12.2% 2,133.10 697,203,658 72.1% 12,606.94 Lake Washington 31,985.59 432,860,666 269,699,690 62.3% 8,431.91 62,301,466 14.4% 1,947.80 332,001,156 76.7% 10,379.71 Spokane 30,888.43 432,285,454 265,270,824 61.4% 8,588.03 56,219,752 13.0% 1,820.09 321,490,576 74.4% 10,408.12 Tacoma 29,045.39 473,923,608 264,154,636 55.7% 9,094.55 73,344,898 15.5% 2,525.18 337,499,534 71.2% 11,619.73 Kent 27,271.49 380,109,753 228,205,783 60.0% 8,367.93 53,951,515 14.2% 1,978.31 282,157,299 74.2% 10,346.24 Evergreen (Clark) 25,530.02 367,917,025 222,194,116 60.4% 8,703.25 51,043,612 13.9% 1,999.36 273,237,728 74.3% 10,702.61 Puyallup 23,751.89 318,626,044 178,302,835 56.0% 7,506.89 49,005,800 15.4% 2,063.24 227,308,635 71.3% 9,570.13 Northshore 23,609.75 345,773,093 220,418,536 63.7% 9,335.91 44,272,081 12.8% 1,875.16 264,690,616 76.6% 11,211.07 Vancouver 23,143.27 340,478,290 186,335,976 54.7% 8,051.41 60,864,292 17.9% 2,629.89 247,200,268 72.6% 10,681.30 Federal Way 22,563.59 334,280,741 188,639,576 56.4% 8,360.35 59,099,858 17.7% 2,619.26 247,739,433 74.1% 10,979.61 Edmonds 21,430.28 326,953,733 205,106,476 62.7% 9,570.87 41,895,343 12.8% 1,954.96 247,001,819 75.5% 11,525.83 Issaquah 21,246.81 307,259,124 185,836,628 60.5% 8,746.57 41,392,504 13.5% 1,948.18 227,229,132 74.0% 10,694.74 Bellevue 20,914.54 348,168,075 197,509,727 56.7% 9,443.66 59,290,114 17.0% 2,834.88 256,799,841 73.8% 12,278.53 Bethel 20,790.57 294,345,133 163,303,212 55.5% 7,854.68 41,160,766 14.0% 1,979.78 204,463,978 69.5% 9,834.46 Everett 20,763.49 324,372,372 195,285,228 60.2% 9,405.22 48,031,070 14.8% 2,313.25 243,316,298 75.0% 11,718.47
15 398,238.29 5,994,228,891 3,549,499,828 59.2% 8,913.00 859,840,143 14.3% 2,159.11 4,409,339,972 73.6% 11,072.11 10,000–19,999Kennewick 19,233.27 255,721,902 155,614,117 60.9% 8,090.88 34,272,201 13.4% 1,781.92 189,886,318 74.3% 9,872.80 Highline 18,918.29 314,693,876 186,336,679 59.2% 9,849.55 44,628,924 14.2% 2,359.04 230,965,603 73.4% 12,208.59 Pasco 18,725.87 255,250,906 159,241,807 62.4% 8,503.84 30,276,023 11.9% 1,616.80 189,517,830 74.2% 10,120.64 Auburn 17,463.31 263,348,588 145,463,279 55.2% 8,329.65 44,388,319 16.9% 2,541.80 189,851,598 72.1% 10,871.46 Yakima 16,584.49 229,659,052 136,368,727 59.4% 8,222.67 33,203,226 14.5% 2,002.06 169,571,952 73.8% 10,224.73 Mukilteo 16,086.85 261,130,186 168,132,125 64.4% 10,451.53 30,499,521 11.7% 1,895.93 198,631,647 76.1% 12,347.45 Renton 15,893.05 261,968,174 142,534,995 54.4% 8,968.39 49,949,251 19.1% 3,142.84 192,484,246 73.5% 12,111.22 North Thurston 15,652.06 219,375,337 124,269,449 56.6% 7,939.49 33,928,359 15.5% 2,167.66 158,197,808 72.1% 10,107.16 Central Valley 14,580.91 191,342,220 119,913,366 62.7% 8,224.00 22,485,820 11.8% 1,542.14 142,399,186 74.4% 9,766.14 Richland 13,925.64 180,863,310 112,116,983 62.0% 8,051.12 20,855,442 11.5% 1,497.63 132,972,425 73.5% 9,548.75 Battle Ground 13,082.55 178,616,628 104,059,683 58.3% 7,954.08 23,090,701 12.9% 1,765.00 127,150,384 71.2% 9,719.08 Clover Park 13,063.20 205,704,490 116,299,585 56.5% 8,902.84 30,683,446 14.9% 2,348.85 146,983,031 71.5% 11,251.69 Central Kitsap 11,942.47 172,378,903 108,198,934 62.8% 9,060.01 18,757,956 10.9% 1,570.69 126,956,891 73.6% 10,630.71 Bellingham 11,834.80 170,442,150 106,701,977 62.6% 9,015.95 19,048,807 11.2% 1,609.56 125,750,784 73.8% 10,625.51 Mead 10,751.42 136,749,362 84,347,145 61.7% 7,845.21 16,321,877 11.9% 1,518.11 100,669,022 73.6% 9,363.32 Marysville 10,675.56 176,099,331 102,848,839 58.4% 9,634.05 20,758,761 11.8% 1,944.51 123,607,601 70.2% 11,578.56 Olympia 10,280.02 141,665,622 87,023,165 61.4% 8,465.27 16,277,838 11.5% 1,583.44 103,301,003 72.9% 10,048.72 South Kitsap 10,138.92 152,271,648 88,769,861 58.3% 8,755.36 20,669,647 13.6% 2,038.64 109,439,507 71.9% 10,794.00 Sumner 10,066.61 130,323,269 80,507,080 61.8% 7,997.44 14,609,744 11.2% 1,451.31 95,116,824 73.0% 9,448.74
19 268,899.29 3,897,604,952 2,328,747,795 59.7% 8,660.30 524,705,864 13.5% 1,951.31 2,853,453,659 73.2% 10,611.61
79
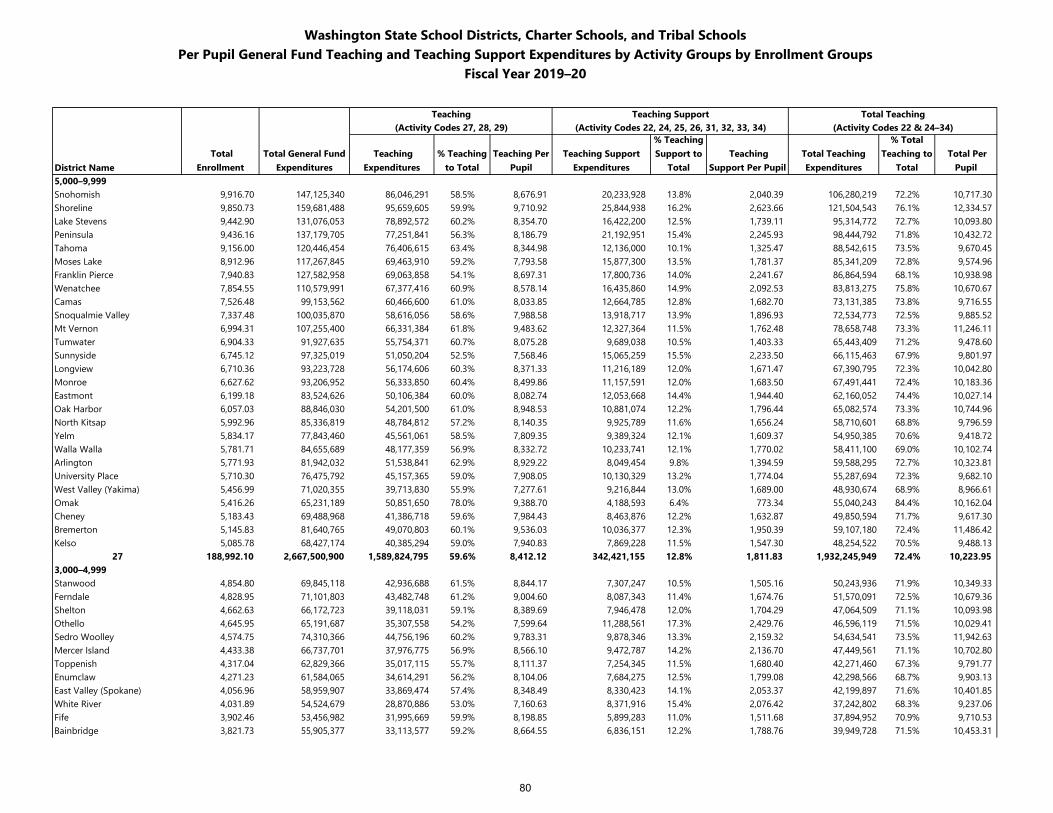
Washington State School Districts, Charter Schools, and Tribal SchoolsPer Pupil General Fund Teaching and Teaching Support Expenditures by Activity Groups by Enrollment Groups
Fiscal Year 2019–20
Teaching Teaching Support Total Teaching(Activity Codes 27, 28, 29) (Activity Codes 22, 24, 25, 26, 31, 32, 33, 34) (Activity Codes 22 & 24–34)
District Name Total
Enrollment Total General Fund
Expenditures Teaching
Expenditures % Teaching
to TotalTeaching Per
PupilTeaching Support
Expenditures
% Teaching Support to
Total Teaching
Support Per Pupil Total Teaching Expenditures
% Total Teaching to
Total Total Per
Pupil 5,000–9,999Snohomish 9,916.70 147,125,340 86,046,291 58.5% 8,676.91 20,233,928 13.8% 2,040.39 106,280,219 72.2% 10,717.30 Shoreline 9,850.73 159,681,488 95,659,605 59.9% 9,710.92 25,844,938 16.2% 2,623.66 121,504,543 76.1% 12,334.57 Lake Stevens 9,442.90 131,076,053 78,892,572 60.2% 8,354.70 16,422,200 12.5% 1,739.11 95,314,772 72.7% 10,093.80 Peninsula 9,436.16 137,179,705 77,251,841 56.3% 8,186.79 21,192,951 15.4% 2,245.93 98,444,792 71.8% 10,432.72 Tahoma 9,156.00 120,446,454 76,406,615 63.4% 8,344.98 12,136,000 10.1% 1,325.47 88,542,615 73.5% 9,670.45 Moses Lake 8,912.96 117,267,845 69,463,910 59.2% 7,793.58 15,877,300 13.5% 1,781.37 85,341,209 72.8% 9,574.96 Franklin Pierce 7,940.83 127,582,958 69,063,858 54.1% 8,697.31 17,800,736 14.0% 2,241.67 86,864,594 68.1% 10,938.98 Wenatchee 7,854.55 110,579,991 67,377,416 60.9% 8,578.14 16,435,860 14.9% 2,092.53 83,813,275 75.8% 10,670.67 Camas 7,526.48 99,153,562 60,466,600 61.0% 8,033.85 12,664,785 12.8% 1,682.70 73,131,385 73.8% 9,716.55 Snoqualmie Valley 7,337.48 100,035,870 58,616,056 58.6% 7,988.58 13,918,717 13.9% 1,896.93 72,534,773 72.5% 9,885.52 Mt Vernon 6,994.31 107,255,400 66,331,384 61.8% 9,483.62 12,327,364 11.5% 1,762.48 78,658,748 73.3% 11,246.11 Tumwater 6,904.33 91,927,635 55,754,371 60.7% 8,075.28 9,689,038 10.5% 1,403.33 65,443,409 71.2% 9,478.60 Sunnyside 6,745.12 97,325,019 51,050,204 52.5% 7,568.46 15,065,259 15.5% 2,233.50 66,115,463 67.9% 9,801.97 Longview 6,710.36 93,223,728 56,174,606 60.3% 8,371.33 11,216,189 12.0% 1,671.47 67,390,795 72.3% 10,042.80 Monroe 6,627.62 93,206,952 56,333,850 60.4% 8,499.86 11,157,591 12.0% 1,683.50 67,491,441 72.4% 10,183.36 Eastmont 6,199.18 83,524,626 50,106,384 60.0% 8,082.74 12,053,668 14.4% 1,944.40 62,160,052 74.4% 10,027.14 Oak Harbor 6,057.03 88,846,030 54,201,500 61.0% 8,948.53 10,881,074 12.2% 1,796.44 65,082,574 73.3% 10,744.96 North Kitsap 5,992.96 85,336,819 48,784,812 57.2% 8,140.35 9,925,789 11.6% 1,656.24 58,710,601 68.8% 9,796.59 Yelm 5,834.17 77,843,460 45,561,061 58.5% 7,809.35 9,389,324 12.1% 1,609.37 54,950,385 70.6% 9,418.72 Walla Walla 5,781.71 84,655,689 48,177,359 56.9% 8,332.72 10,233,741 12.1% 1,770.02 58,411,100 69.0% 10,102.74 Arlington 5,771.93 81,942,032 51,538,841 62.9% 8,929.22 8,049,454 9.8% 1,394.59 59,588,295 72.7% 10,323.81 University Place 5,710.30 76,475,792 45,157,365 59.0% 7,908.05 10,130,329 13.2% 1,774.04 55,287,694 72.3% 9,682.10 West Valley (Yakima) 5,456.99 71,020,355 39,713,830 55.9% 7,277.61 9,216,844 13.0% 1,689.00 48,930,674 68.9% 8,966.61 Omak 5,416.26 65,231,189 50,851,650 78.0% 9,388.70 4,188,593 6.4% 773.34 55,040,243 84.4% 10,162.04 Cheney 5,183.43 69,488,968 41,386,718 59.6% 7,984.43 8,463,876 12.2% 1,632.87 49,850,594 71.7% 9,617.30 Bremerton 5,145.83 81,640,765 49,070,803 60.1% 9,536.03 10,036,377 12.3% 1,950.39 59,107,180 72.4% 11,486.42 Kelso 5,085.78 68,427,174 40,385,294 59.0% 7,940.83 7,869,228 11.5% 1,547.30 48,254,522 70.5% 9,488.13
27 188,992.10 2,667,500,900 1,589,824,795 59.6% 8,412.12 342,421,155 12.8% 1,811.83 1,932,245,949 72.4% 10,223.95 3,000–4,999Stanwood 4,854.80 69,845,118 42,936,688 61.5% 8,844.17 7,307,247 10.5% 1,505.16 50,243,936 71.9% 10,349.33 Ferndale 4,828.95 71,101,803 43,482,748 61.2% 9,004.60 8,087,343 11.4% 1,674.76 51,570,091 72.5% 10,679.36 Shelton 4,662.63 66,172,723 39,118,031 59.1% 8,389.69 7,946,478 12.0% 1,704.29 47,064,509 71.1% 10,093.98 Othello 4,645.95 65,191,687 35,307,558 54.2% 7,599.64 11,288,561 17.3% 2,429.76 46,596,119 71.5% 10,029.41 Sedro Woolley 4,574.75 74,310,366 44,756,196 60.2% 9,783.31 9,878,346 13.3% 2,159.32 54,634,541 73.5% 11,942.63 Mercer Island 4,433.38 66,737,701 37,976,775 56.9% 8,566.10 9,472,787 14.2% 2,136.70 47,449,561 71.1% 10,702.80 Toppenish 4,317.04 62,829,366 35,017,115 55.7% 8,111.37 7,254,345 11.5% 1,680.40 42,271,460 67.3% 9,791.77 Enumclaw 4,271.23 61,584,065 34,614,291 56.2% 8,104.06 7,684,275 12.5% 1,799.08 42,298,566 68.7% 9,903.13 East Valley (Spokane) 4,056.96 58,959,907 33,869,474 57.4% 8,348.49 8,330,423 14.1% 2,053.37 42,199,897 71.6% 10,401.85 White River 4,031.89 54,524,679 28,870,886 53.0% 7,160.63 8,371,916 15.4% 2,076.42 37,242,802 68.3% 9,237.06 Fife 3,902.46 53,456,982 31,995,669 59.9% 8,198.85 5,899,283 11.0% 1,511.68 37,894,952 70.9% 9,710.53 Bainbridge 3,821.73 55,905,377 33,113,577 59.2% 8,664.55 6,836,151 12.2% 1,788.76 39,949,728 71.5% 10,453.31
80
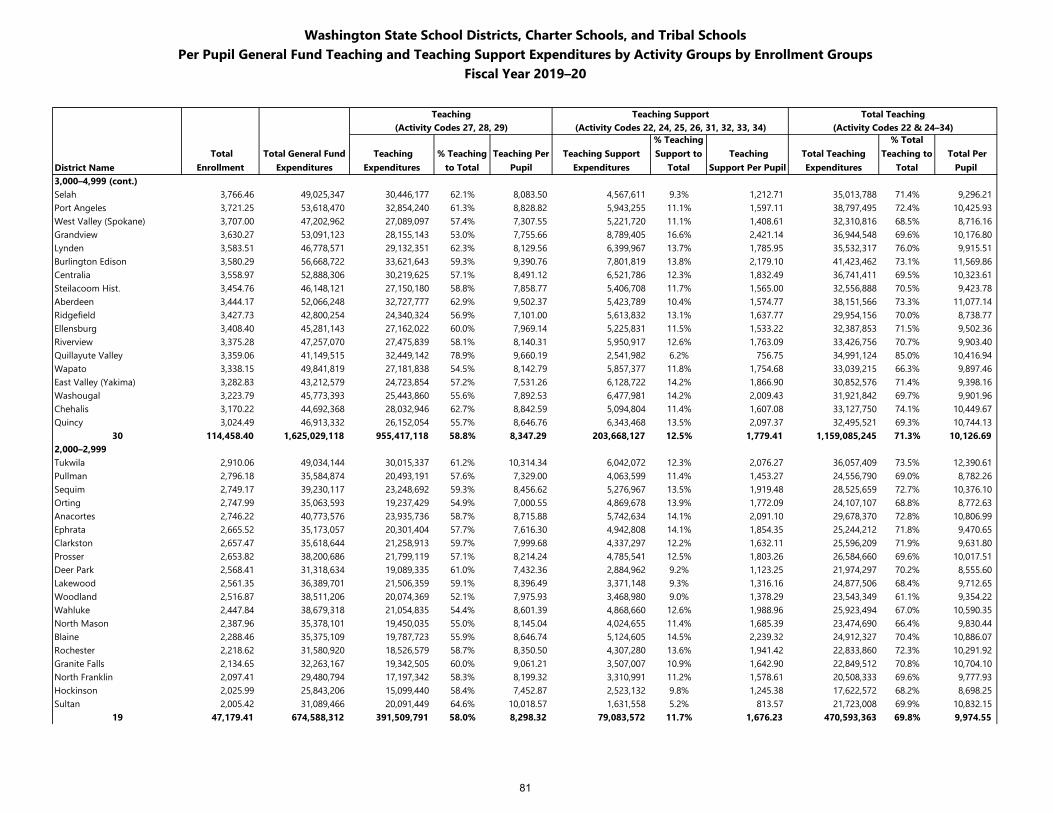
Washington State School Districts, Charter Schools, and Tribal SchoolsPer Pupil General Fund Teaching and Teaching Support Expenditures by Activity Groups by Enrollment Groups
Fiscal Year 2019–20
Teaching Teaching Support Total Teaching(Activity Codes 27, 28, 29) (Activity Codes 22, 24, 25, 26, 31, 32, 33, 34) (Activity Codes 22 & 24–34)
District Name Total
Enrollment Total General Fund
Expenditures Teaching
Expenditures % Teaching
to TotalTeaching Per
PupilTeaching Support
Expenditures
% Teaching Support to
Total Teaching
Support Per Pupil Total Teaching Expenditures
% Total Teaching to
Total Total Per
Pupil 3,000–4,999 (cont.)Selah 3,766.46 49,025,347 30,446,177 62.1% 8,083.50 4,567,611 9.3% 1,212.71 35,013,788 71.4% 9,296.21 Port Angeles 3,721.25 53,618,470 32,854,240 61.3% 8,828.82 5,943,255 11.1% 1,597.11 38,797,495 72.4% 10,425.93 West Valley (Spokane) 3,707.00 47,202,962 27,089,097 57.4% 7,307.55 5,221,720 11.1% 1,408.61 32,310,816 68.5% 8,716.16 Grandview 3,630.27 53,091,123 28,155,143 53.0% 7,755.66 8,789,405 16.6% 2,421.14 36,944,548 69.6% 10,176.80 Lynden 3,583.51 46,778,571 29,132,351 62.3% 8,129.56 6,399,967 13.7% 1,785.95 35,532,317 76.0% 9,915.51 Burlington Edison 3,580.29 56,668,722 33,621,643 59.3% 9,390.76 7,801,819 13.8% 2,179.10 41,423,462 73.1% 11,569.86 Centralia 3,558.97 52,888,306 30,219,625 57.1% 8,491.12 6,521,786 12.3% 1,832.49 36,741,411 69.5% 10,323.61 Steilacoom Hist. 3,454.76 46,148,121 27,150,180 58.8% 7,858.77 5,406,708 11.7% 1,565.00 32,556,888 70.5% 9,423.78 Aberdeen 3,444.17 52,066,248 32,727,777 62.9% 9,502.37 5,423,789 10.4% 1,574.77 38,151,566 73.3% 11,077.14 Ridgefield 3,427.73 42,800,254 24,340,324 56.9% 7,101.00 5,613,832 13.1% 1,637.77 29,954,156 70.0% 8,738.77 Ellensburg 3,408.40 45,281,143 27,162,022 60.0% 7,969.14 5,225,831 11.5% 1,533.22 32,387,853 71.5% 9,502.36 Riverview 3,375.28 47,257,070 27,475,839 58.1% 8,140.31 5,950,917 12.6% 1,763.09 33,426,756 70.7% 9,903.40 Quillayute Valley 3,359.06 41,149,515 32,449,142 78.9% 9,660.19 2,541,982 6.2% 756.75 34,991,124 85.0% 10,416.94 Wapato 3,338.15 49,841,819 27,181,838 54.5% 8,142.79 5,857,377 11.8% 1,754.68 33,039,215 66.3% 9,897.46 East Valley (Yakima) 3,282.83 43,212,579 24,723,854 57.2% 7,531.26 6,128,722 14.2% 1,866.90 30,852,576 71.4% 9,398.16 Washougal 3,223.79 45,773,393 25,443,860 55.6% 7,892.53 6,477,981 14.2% 2,009.43 31,921,842 69.7% 9,901.96 Chehalis 3,170.22 44,692,368 28,032,946 62.7% 8,842.59 5,094,804 11.4% 1,607.08 33,127,750 74.1% 10,449.67 Quincy 3,024.49 46,913,332 26,152,054 55.7% 8,646.76 6,343,468 13.5% 2,097.37 32,495,521 69.3% 10,744.13
30 114,458.40 1,625,029,118 955,417,118 58.8% 8,347.29 203,668,127 12.5% 1,779.41 1,159,085,245 71.3% 10,126.69 2,000–2,999Tukwila 2,910.06 49,034,144 30,015,337 61.2% 10,314.34 6,042,072 12.3% 2,076.27 36,057,409 73.5% 12,390.61 Pullman 2,796.18 35,584,874 20,493,191 57.6% 7,329.00 4,063,599 11.4% 1,453.27 24,556,790 69.0% 8,782.26 Sequim 2,749.17 39,230,117 23,248,692 59.3% 8,456.62 5,276,967 13.5% 1,919.48 28,525,659 72.7% 10,376.10 Orting 2,747.99 35,063,593 19,237,429 54.9% 7,000.55 4,869,678 13.9% 1,772.09 24,107,107 68.8% 8,772.63 Anacortes 2,746.22 40,773,576 23,935,736 58.7% 8,715.88 5,742,634 14.1% 2,091.10 29,678,370 72.8% 10,806.99 Ephrata 2,665.52 35,173,057 20,301,404 57.7% 7,616.30 4,942,808 14.1% 1,854.35 25,244,212 71.8% 9,470.65 Clarkston 2,657.47 35,618,644 21,258,913 59.7% 7,999.68 4,337,297 12.2% 1,632.11 25,596,209 71.9% 9,631.80 Prosser 2,653.82 38,200,686 21,799,119 57.1% 8,214.24 4,785,541 12.5% 1,803.26 26,584,660 69.6% 10,017.51 Deer Park 2,568.41 31,318,634 19,089,335 61.0% 7,432.36 2,884,962 9.2% 1,123.25 21,974,297 70.2% 8,555.60 Lakewood 2,561.35 36,389,701 21,506,359 59.1% 8,396.49 3,371,148 9.3% 1,316.16 24,877,506 68.4% 9,712.65 Woodland 2,516.87 38,511,206 20,074,369 52.1% 7,975.93 3,468,980 9.0% 1,378.29 23,543,349 61.1% 9,354.22 Wahluke 2,447.84 38,679,318 21,054,835 54.4% 8,601.39 4,868,660 12.6% 1,988.96 25,923,494 67.0% 10,590.35 North Mason 2,387.96 35,378,101 19,450,035 55.0% 8,145.04 4,024,655 11.4% 1,685.39 23,474,690 66.4% 9,830.44 Blaine 2,288.46 35,375,109 19,787,723 55.9% 8,646.74 5,124,605 14.5% 2,239.32 24,912,327 70.4% 10,886.07 Rochester 2,218.62 31,580,920 18,526,579 58.7% 8,350.50 4,307,280 13.6% 1,941.42 22,833,860 72.3% 10,291.92 Granite Falls 2,134.65 32,263,167 19,342,505 60.0% 9,061.21 3,507,007 10.9% 1,642.90 22,849,512 70.8% 10,704.10 North Franklin 2,097.41 29,480,794 17,197,342 58.3% 8,199.32 3,310,991 11.2% 1,578.61 20,508,333 69.6% 9,777.93 Hockinson 2,025.99 25,843,206 15,099,440 58.4% 7,452.87 2,523,132 9.8% 1,245.38 17,622,572 68.2% 8,698.25 Sultan 2,005.42 31,089,466 20,091,449 64.6% 10,018.57 1,631,558 5.2% 813.57 21,723,008 69.9% 10,832.15
19 47,179.41 674,588,312 391,509,791 58.0% 8,298.32 79,083,572 11.7% 1,676.23 470,593,363 69.8% 9,974.55
81
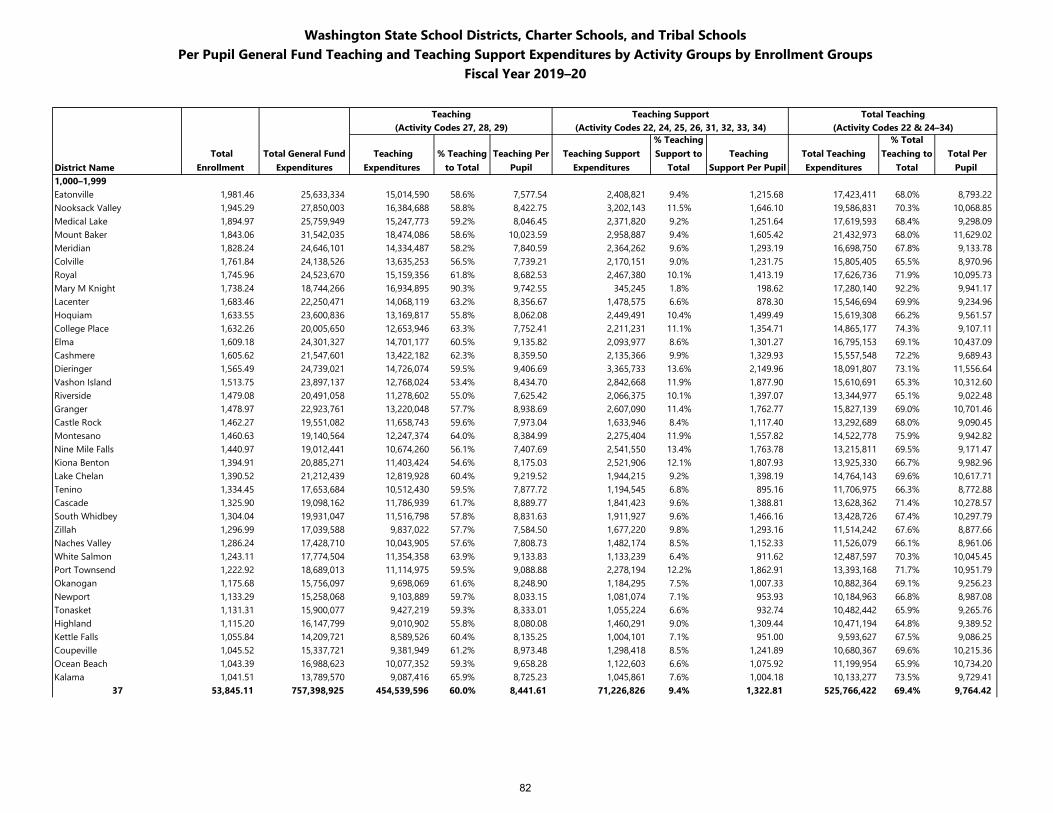
Washington State School Districts, Charter Schools, and Tribal SchoolsPer Pupil General Fund Teaching and Teaching Support Expenditures by Activity Groups by Enrollment Groups
Fiscal Year 2019–20
Teaching Teaching Support Total Teaching(Activity Codes 27, 28, 29) (Activity Codes 22, 24, 25, 26, 31, 32, 33, 34) (Activity Codes 22 & 24–34)
District Name Total
Enrollment Total General Fund
Expenditures Teaching
Expenditures % Teaching
to TotalTeaching Per
PupilTeaching Support
Expenditures
% Teaching Support to
Total Teaching
Support Per Pupil Total Teaching Expenditures
% Total Teaching to
Total Total Per
Pupil 1,000–1,999Eatonville 1,981.46 25,633,334 15,014,590 58.6% 7,577.54 2,408,821 9.4% 1,215.68 17,423,411 68.0% 8,793.22 Nooksack Valley 1,945.29 27,850,003 16,384,688 58.8% 8,422.75 3,202,143 11.5% 1,646.10 19,586,831 70.3% 10,068.85 Medical Lake 1,894.97 25,759,949 15,247,773 59.2% 8,046.45 2,371,820 9.2% 1,251.64 17,619,593 68.4% 9,298.09 Mount Baker 1,843.06 31,542,035 18,474,086 58.6% 10,023.59 2,958,887 9.4% 1,605.42 21,432,973 68.0% 11,629.02 Meridian 1,828.24 24,646,101 14,334,487 58.2% 7,840.59 2,364,262 9.6% 1,293.19 16,698,750 67.8% 9,133.78 Colville 1,761.84 24,138,526 13,635,253 56.5% 7,739.21 2,170,151 9.0% 1,231.75 15,805,405 65.5% 8,970.96 Royal 1,745.96 24,523,670 15,159,356 61.8% 8,682.53 2,467,380 10.1% 1,413.19 17,626,736 71.9% 10,095.73 Mary M Knight 1,738.24 18,744,266 16,934,895 90.3% 9,742.55 345,245 1.8% 198.62 17,280,140 92.2% 9,941.17 Lacenter 1,683.46 22,250,471 14,068,119 63.2% 8,356.67 1,478,575 6.6% 878.30 15,546,694 69.9% 9,234.96 Hoquiam 1,633.55 23,600,836 13,169,817 55.8% 8,062.08 2,449,491 10.4% 1,499.49 15,619,308 66.2% 9,561.57 College Place 1,632.26 20,005,650 12,653,946 63.3% 7,752.41 2,211,231 11.1% 1,354.71 14,865,177 74.3% 9,107.11 Elma 1,609.18 24,301,327 14,701,177 60.5% 9,135.82 2,093,977 8.6% 1,301.27 16,795,153 69.1% 10,437.09 Cashmere 1,605.62 21,547,601 13,422,182 62.3% 8,359.50 2,135,366 9.9% 1,329.93 15,557,548 72.2% 9,689.43 Dieringer 1,565.49 24,739,021 14,726,074 59.5% 9,406.69 3,365,733 13.6% 2,149.96 18,091,807 73.1% 11,556.64 Vashon Island 1,513.75 23,897,137 12,768,024 53.4% 8,434.70 2,842,668 11.9% 1,877.90 15,610,691 65.3% 10,312.60 Riverside 1,479.08 20,491,058 11,278,602 55.0% 7,625.42 2,066,375 10.1% 1,397.07 13,344,977 65.1% 9,022.48 Granger 1,478.97 22,923,761 13,220,048 57.7% 8,938.69 2,607,090 11.4% 1,762.77 15,827,139 69.0% 10,701.46 Castle Rock 1,462.27 19,551,082 11,658,743 59.6% 7,973.04 1,633,946 8.4% 1,117.40 13,292,689 68.0% 9,090.45 Montesano 1,460.63 19,140,564 12,247,374 64.0% 8,384.99 2,275,404 11.9% 1,557.82 14,522,778 75.9% 9,942.82 Nine Mile Falls 1,440.97 19,012,441 10,674,260 56.1% 7,407.69 2,541,550 13.4% 1,763.78 13,215,811 69.5% 9,171.47 Kiona Benton 1,394.91 20,885,271 11,403,424 54.6% 8,175.03 2,521,906 12.1% 1,807.93 13,925,330 66.7% 9,982.96 Lake Chelan 1,390.52 21,212,439 12,819,928 60.4% 9,219.52 1,944,215 9.2% 1,398.19 14,764,143 69.6% 10,617.71 Tenino 1,334.45 17,653,684 10,512,430 59.5% 7,877.72 1,194,545 6.8% 895.16 11,706,975 66.3% 8,772.88 Cascade 1,325.90 19,098,162 11,786,939 61.7% 8,889.77 1,841,423 9.6% 1,388.81 13,628,362 71.4% 10,278.57 South Whidbey 1,304.04 19,931,047 11,516,798 57.8% 8,831.63 1,911,927 9.6% 1,466.16 13,428,726 67.4% 10,297.79 Zillah 1,296.99 17,039,588 9,837,022 57.7% 7,584.50 1,677,220 9.8% 1,293.16 11,514,242 67.6% 8,877.66 Naches Valley 1,286.24 17,428,710 10,043,905 57.6% 7,808.73 1,482,174 8.5% 1,152.33 11,526,079 66.1% 8,961.06 White Salmon 1,243.11 17,774,504 11,354,358 63.9% 9,133.83 1,133,239 6.4% 911.62 12,487,597 70.3% 10,045.45 Port Townsend 1,222.92 18,689,013 11,114,975 59.5% 9,088.88 2,278,194 12.2% 1,862.91 13,393,168 71.7% 10,951.79 Okanogan 1,175.68 15,756,097 9,698,069 61.6% 8,248.90 1,184,295 7.5% 1,007.33 10,882,364 69.1% 9,256.23 Newport 1,133.29 15,258,068 9,103,889 59.7% 8,033.15 1,081,074 7.1% 953.93 10,184,963 66.8% 8,987.08 Tonasket 1,131.31 15,900,077 9,427,219 59.3% 8,333.01 1,055,224 6.6% 932.74 10,482,442 65.9% 9,265.76 Highland 1,115.20 16,147,799 9,010,902 55.8% 8,080.08 1,460,291 9.0% 1,309.44 10,471,194 64.8% 9,389.52 Kettle Falls 1,055.84 14,209,721 8,589,526 60.4% 8,135.25 1,004,101 7.1% 951.00 9,593,627 67.5% 9,086.25 Coupeville 1,045.52 15,337,721 9,381,949 61.2% 8,973.48 1,298,418 8.5% 1,241.89 10,680,367 69.6% 10,215.36 Ocean Beach 1,043.39 16,988,623 10,077,352 59.3% 9,658.28 1,122,603 6.6% 1,075.92 11,199,954 65.9% 10,734.20 Kalama 1,041.51 13,789,570 9,087,416 65.9% 8,725.23 1,045,861 7.6% 1,004.18 10,133,277 73.5% 9,729.41
37 53,845.11 757,398,925 454,539,596 60.0% 8,441.61 71,226,826 9.4% 1,322.81 525,766,422 69.4% 9,764.42
82
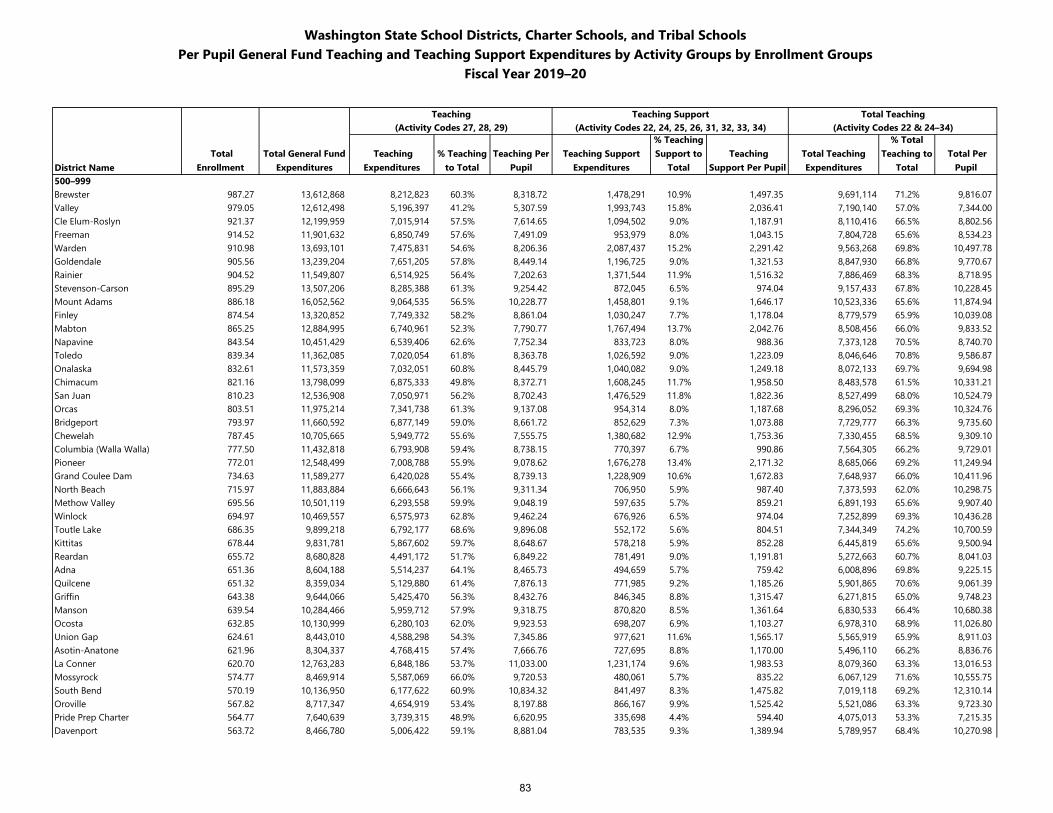
Washington State School Districts, Charter Schools, and Tribal SchoolsPer Pupil General Fund Teaching and Teaching Support Expenditures by Activity Groups by Enrollment Groups
Fiscal Year 2019–20
Teaching Teaching Support Total Teaching(Activity Codes 27, 28, 29) (Activity Codes 22, 24, 25, 26, 31, 32, 33, 34) (Activity Codes 22 & 24–34)
District Name Total
Enrollment Total General Fund
Expenditures Teaching
Expenditures % Teaching
to TotalTeaching Per
PupilTeaching Support
Expenditures
% Teaching Support to
Total Teaching
Support Per Pupil Total Teaching Expenditures
% Total Teaching to
Total Total Per
Pupil 500–999Brewster 987.27 13,612,868 8,212,823 60.3% 8,318.72 1,478,291 10.9% 1,497.35 9,691,114 71.2% 9,816.07 Valley 979.05 12,612,498 5,196,397 41.2% 5,307.59 1,993,743 15.8% 2,036.41 7,190,140 57.0% 7,344.00 Cle Elum-Roslyn 921.37 12,199,959 7,015,914 57.5% 7,614.65 1,094,502 9.0% 1,187.91 8,110,416 66.5% 8,802.56 Freeman 914.52 11,901,632 6,850,749 57.6% 7,491.09 953,979 8.0% 1,043.15 7,804,728 65.6% 8,534.23 Warden 910.98 13,693,101 7,475,831 54.6% 8,206.36 2,087,437 15.2% 2,291.42 9,563,268 69.8% 10,497.78 Goldendale 905.56 13,239,204 7,651,205 57.8% 8,449.14 1,196,725 9.0% 1,321.53 8,847,930 66.8% 9,770.67 Rainier 904.52 11,549,807 6,514,925 56.4% 7,202.63 1,371,544 11.9% 1,516.32 7,886,469 68.3% 8,718.95 Stevenson-Carson 895.29 13,507,206 8,285,388 61.3% 9,254.42 872,045 6.5% 974.04 9,157,433 67.8% 10,228.45 Mount Adams 886.18 16,052,562 9,064,535 56.5% 10,228.77 1,458,801 9.1% 1,646.17 10,523,336 65.6% 11,874.94 Finley 874.54 13,320,852 7,749,332 58.2% 8,861.04 1,030,247 7.7% 1,178.04 8,779,579 65.9% 10,039.08 Mabton 865.25 12,884,995 6,740,961 52.3% 7,790.77 1,767,494 13.7% 2,042.76 8,508,456 66.0% 9,833.52 Napavine 843.54 10,451,429 6,539,406 62.6% 7,752.34 833,723 8.0% 988.36 7,373,128 70.5% 8,740.70 Toledo 839.34 11,362,085 7,020,054 61.8% 8,363.78 1,026,592 9.0% 1,223.09 8,046,646 70.8% 9,586.87 Onalaska 832.61 11,573,359 7,032,051 60.8% 8,445.79 1,040,082 9.0% 1,249.18 8,072,133 69.7% 9,694.98 Chimacum 821.16 13,798,099 6,875,333 49.8% 8,372.71 1,608,245 11.7% 1,958.50 8,483,578 61.5% 10,331.21 San Juan 810.23 12,536,908 7,050,971 56.2% 8,702.43 1,476,529 11.8% 1,822.36 8,527,499 68.0% 10,524.79 Orcas 803.51 11,975,214 7,341,738 61.3% 9,137.08 954,314 8.0% 1,187.68 8,296,052 69.3% 10,324.76 Bridgeport 793.97 11,660,592 6,877,149 59.0% 8,661.72 852,629 7.3% 1,073.88 7,729,777 66.3% 9,735.60 Chewelah 787.45 10,705,665 5,949,772 55.6% 7,555.75 1,380,682 12.9% 1,753.36 7,330,455 68.5% 9,309.10 Columbia (Walla Walla) 777.50 11,432,818 6,793,908 59.4% 8,738.15 770,397 6.7% 990.86 7,564,305 66.2% 9,729.01 Pioneer 772.01 12,548,499 7,008,788 55.9% 9,078.62 1,676,278 13.4% 2,171.32 8,685,066 69.2% 11,249.94 Grand Coulee Dam 734.63 11,589,277 6,420,028 55.4% 8,739.13 1,228,909 10.6% 1,672.83 7,648,937 66.0% 10,411.96 North Beach 715.97 11,883,884 6,666,643 56.1% 9,311.34 706,950 5.9% 987.40 7,373,593 62.0% 10,298.75 Methow Valley 695.56 10,501,119 6,293,558 59.9% 9,048.19 597,635 5.7% 859.21 6,891,193 65.6% 9,907.40 Winlock 694.97 10,469,557 6,575,973 62.8% 9,462.24 676,926 6.5% 974.04 7,252,899 69.3% 10,436.28 Toutle Lake 686.35 9,899,218 6,792,177 68.6% 9,896.08 552,172 5.6% 804.51 7,344,349 74.2% 10,700.59 Kittitas 678.44 9,831,781 5,867,602 59.7% 8,648.67 578,218 5.9% 852.28 6,445,819 65.6% 9,500.94 Reardan 655.72 8,680,828 4,491,172 51.7% 6,849.22 781,491 9.0% 1,191.81 5,272,663 60.7% 8,041.03 Adna 651.36 8,604,188 5,514,237 64.1% 8,465.73 494,659 5.7% 759.42 6,008,896 69.8% 9,225.15 Quilcene 651.32 8,359,034 5,129,880 61.4% 7,876.13 771,985 9.2% 1,185.26 5,901,865 70.6% 9,061.39 Griffin 643.38 9,644,066 5,425,470 56.3% 8,432.76 846,345 8.8% 1,315.47 6,271,815 65.0% 9,748.23 Manson 639.54 10,284,466 5,959,712 57.9% 9,318.75 870,820 8.5% 1,361.64 6,830,533 66.4% 10,680.38 Ocosta 632.85 10,130,999 6,280,103 62.0% 9,923.53 698,207 6.9% 1,103.27 6,978,310 68.9% 11,026.80 Union Gap 624.61 8,443,010 4,588,298 54.3% 7,345.86 977,621 11.6% 1,565.17 5,565,919 65.9% 8,911.03 Asotin-Anatone 621.96 8,304,337 4,768,415 57.4% 7,666.76 727,695 8.8% 1,170.00 5,496,110 66.2% 8,836.76 La Conner 620.70 12,763,283 6,848,186 53.7% 11,033.00 1,231,174 9.6% 1,983.53 8,079,360 63.3% 13,016.53 Mossyrock 574.77 8,469,914 5,587,069 66.0% 9,720.53 480,061 5.7% 835.22 6,067,129 71.6% 10,555.75 South Bend 570.19 10,136,950 6,177,622 60.9% 10,834.32 841,497 8.3% 1,475.82 7,019,118 69.2% 12,310.14 Oroville 567.82 8,717,347 4,654,919 53.4% 8,197.88 866,167 9.9% 1,525.42 5,521,086 63.3% 9,723.30 Pride Prep Charter 564.77 7,640,639 3,739,315 48.9% 6,620.95 335,698 4.4% 594.40 4,075,013 53.3% 7,215.35 Davenport 563.72 8,466,780 5,006,422 59.1% 8,881.04 783,535 9.3% 1,389.94 5,789,957 68.4% 10,270.98
83
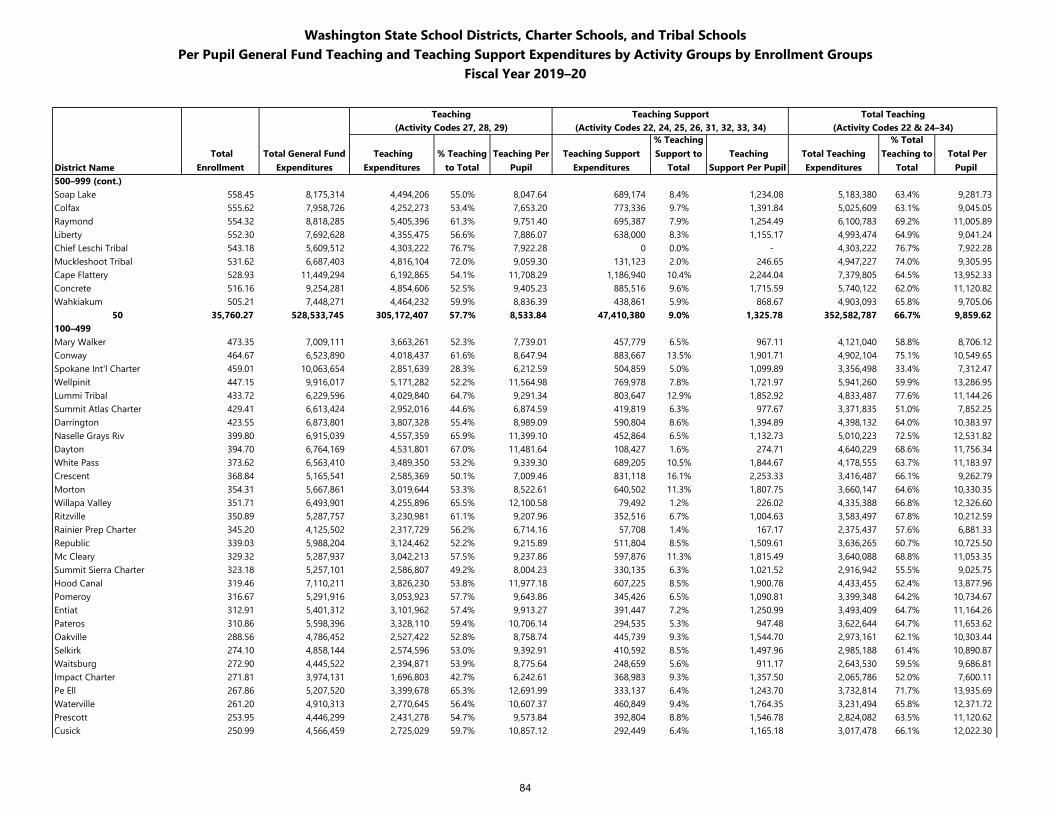
Washington State School Districts, Charter Schools, and Tribal SchoolsPer Pupil General Fund Teaching and Teaching Support Expenditures by Activity Groups by Enrollment Groups
Fiscal Year 2019–20
Teaching Teaching Support Total Teaching(Activity Codes 27, 28, 29) (Activity Codes 22, 24, 25, 26, 31, 32, 33, 34) (Activity Codes 22 & 24–34)
District Name Total
Enrollment Total General Fund
Expenditures Teaching
Expenditures % Teaching
to TotalTeaching Per
PupilTeaching Support
Expenditures
% Teaching Support to
Total Teaching
Support Per Pupil Total Teaching Expenditures
% Total Teaching to
Total Total Per
Pupil 500–999 (cont.)Soap Lake 558.45 8,175,314 4,494,206 55.0% 8,047.64 689,174 8.4% 1,234.08 5,183,380 63.4% 9,281.73 Colfax 555.62 7,958,726 4,252,273 53.4% 7,653.20 773,336 9.7% 1,391.84 5,025,609 63.1% 9,045.05 Raymond 554.32 8,818,285 5,405,396 61.3% 9,751.40 695,387 7.9% 1,254.49 6,100,783 69.2% 11,005.89 Liberty 552.30 7,692,628 4,355,475 56.6% 7,886.07 638,000 8.3% 1,155.17 4,993,474 64.9% 9,041.24 Chief Leschi Tribal 543.18 5,609,512 4,303,222 76.7% 7,922.28 0 0.0% - 4,303,222 76.7% 7,922.28 Muckleshoot Tribal 531.62 6,687,403 4,816,104 72.0% 9,059.30 131,123 2.0% 246.65 4,947,227 74.0% 9,305.95 Cape Flattery 528.93 11,449,294 6,192,865 54.1% 11,708.29 1,186,940 10.4% 2,244.04 7,379,805 64.5% 13,952.33 Concrete 516.16 9,254,281 4,854,606 52.5% 9,405.23 885,516 9.6% 1,715.59 5,740,122 62.0% 11,120.82 Wahkiakum 505.21 7,448,271 4,464,232 59.9% 8,836.39 438,861 5.9% 868.67 4,903,093 65.8% 9,705.06
50 35,760.27 528,533,745 305,172,407 57.7% 8,533.84 47,410,380 9.0% 1,325.78 352,582,787 66.7% 9,859.62 100–499Mary Walker 473.35 7,009,111 3,663,261 52.3% 7,739.01 457,779 6.5% 967.11 4,121,040 58.8% 8,706.12 Conway 464.67 6,523,890 4,018,437 61.6% 8,647.94 883,667 13.5% 1,901.71 4,902,104 75.1% 10,549.65 Spokane Int'l Charter 459.01 10,063,654 2,851,639 28.3% 6,212.59 504,859 5.0% 1,099.89 3,356,498 33.4% 7,312.47 Wellpinit 447.15 9,916,017 5,171,282 52.2% 11,564.98 769,978 7.8% 1,721.97 5,941,260 59.9% 13,286.95 Lummi Tribal 433.72 6,229,596 4,029,840 64.7% 9,291.34 803,647 12.9% 1,852.92 4,833,487 77.6% 11,144.26 Summit Atlas Charter 429.41 6,613,424 2,952,016 44.6% 6,874.59 419,819 6.3% 977.67 3,371,835 51.0% 7,852.25 Darrington 423.55 6,873,801 3,807,328 55.4% 8,989.09 590,804 8.6% 1,394.89 4,398,132 64.0% 10,383.97 Naselle Grays Riv 399.80 6,915,039 4,557,359 65.9% 11,399.10 452,864 6.5% 1,132.73 5,010,223 72.5% 12,531.82 Dayton 394.70 6,764,169 4,531,801 67.0% 11,481.64 108,427 1.6% 274.71 4,640,229 68.6% 11,756.34 White Pass 373.62 6,563,410 3,489,350 53.2% 9,339.30 689,205 10.5% 1,844.67 4,178,555 63.7% 11,183.97 Crescent 368.84 5,165,541 2,585,369 50.1% 7,009.46 831,118 16.1% 2,253.33 3,416,487 66.1% 9,262.79 Morton 354.31 5,667,861 3,019,644 53.3% 8,522.61 640,502 11.3% 1,807.75 3,660,147 64.6% 10,330.35 Willapa Valley 351.71 6,493,901 4,255,896 65.5% 12,100.58 79,492 1.2% 226.02 4,335,388 66.8% 12,326.60 Ritzville 350.89 5,287,757 3,230,981 61.1% 9,207.96 352,516 6.7% 1,004.63 3,583,497 67.8% 10,212.59 Rainier Prep Charter 345.20 4,125,502 2,317,729 56.2% 6,714.16 57,708 1.4% 167.17 2,375,437 57.6% 6,881.33 Republic 339.03 5,988,204 3,124,462 52.2% 9,215.89 511,804 8.5% 1,509.61 3,636,265 60.7% 10,725.50 Mc Cleary 329.32 5,287,937 3,042,213 57.5% 9,237.86 597,876 11.3% 1,815.49 3,640,088 68.8% 11,053.35 Summit Sierra Charter 323.18 5,257,101 2,586,807 49.2% 8,004.23 330,135 6.3% 1,021.52 2,916,942 55.5% 9,025.75 Hood Canal 319.46 7,110,211 3,826,230 53.8% 11,977.18 607,225 8.5% 1,900.78 4,433,455 62.4% 13,877.96 Pomeroy 316.67 5,291,916 3,053,923 57.7% 9,643.86 345,426 6.5% 1,090.81 3,399,348 64.2% 10,734.67 Entiat 312.91 5,401,312 3,101,962 57.4% 9,913.27 391,447 7.2% 1,250.99 3,493,409 64.7% 11,164.26 Pateros 310.86 5,598,396 3,328,110 59.4% 10,706.14 294,535 5.3% 947.48 3,622,644 64.7% 11,653.62 Oakville 288.56 4,786,452 2,527,422 52.8% 8,758.74 445,739 9.3% 1,544.70 2,973,161 62.1% 10,303.44 Selkirk 274.10 4,858,144 2,574,596 53.0% 9,392.91 410,592 8.5% 1,497.96 2,985,188 61.4% 10,890.87 Waitsburg 272.90 4,445,522 2,394,871 53.9% 8,775.64 248,659 5.6% 911.17 2,643,530 59.5% 9,686.81 Impact Charter 271.81 3,974,131 1,696,803 42.7% 6,242.61 368,983 9.3% 1,357.50 2,065,786 52.0% 7,600.11 Pe Ell 267.86 5,207,520 3,399,678 65.3% 12,691.99 333,137 6.4% 1,243.70 3,732,814 71.7% 13,935.69 Waterville 261.20 4,910,313 2,770,645 56.4% 10,607.37 460,849 9.4% 1,764.35 3,231,494 65.8% 12,371.72 Prescott 253.95 4,446,299 2,431,278 54.7% 9,573.84 392,804 8.8% 1,546.78 2,824,082 63.5% 11,120.62 Cusick 250.99 4,566,459 2,725,029 59.7% 10,857.12 292,449 6.4% 1,165.18 3,017,478 66.1% 12,022.30
84
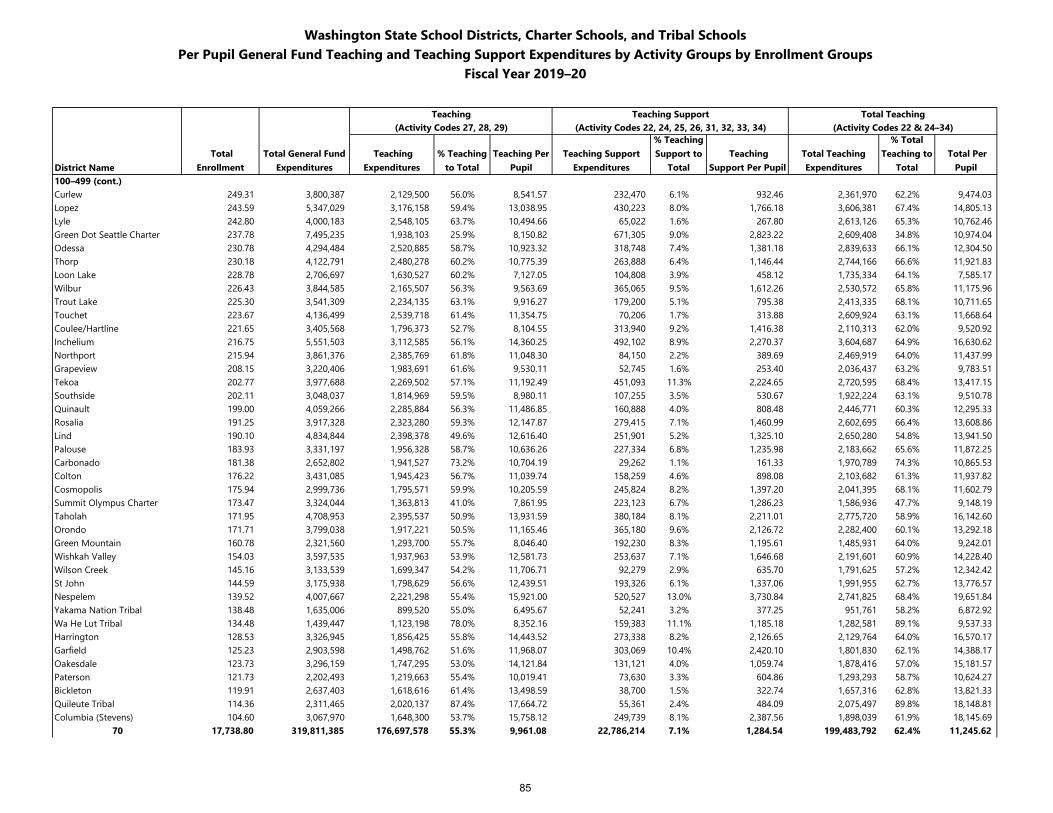
Washington State School Districts, Charter Schools, and Tribal SchoolsPer Pupil General Fund Teaching and Teaching Support Expenditures by Activity Groups by Enrollment Groups
Fiscal Year 2019–20
Teaching Teaching Support Total Teaching(Activity Codes 27, 28, 29) (Activity Codes 22, 24, 25, 26, 31, 32, 33, 34) (Activity Codes 22 & 24–34)
District Name Total
Enrollment Total General Fund
Expenditures Teaching
Expenditures % Teaching
to TotalTeaching Per
PupilTeaching Support
Expenditures
% Teaching Support to
Total Teaching
Support Per Pupil Total Teaching Expenditures
% Total Teaching to
Total Total Per
Pupil 100–499 (cont.)Curlew 249.31 3,800,387 2,129,500 56.0% 8,541.57 232,470 6.1% 932.46 2,361,970 62.2% 9,474.03 Lopez 243.59 5,347,029 3,176,158 59.4% 13,038.95 430,223 8.0% 1,766.18 3,606,381 67.4% 14,805.13 Lyle 242.80 4,000,183 2,548,105 63.7% 10,494.66 65,022 1.6% 267.80 2,613,126 65.3% 10,762.46 Green Dot Seattle Charter 237.78 7,495,235 1,938,103 25.9% 8,150.82 671,305 9.0% 2,823.22 2,609,408 34.8% 10,974.04 Odessa 230.78 4,294,484 2,520,885 58.7% 10,923.32 318,748 7.4% 1,381.18 2,839,633 66.1% 12,304.50 Thorp 230.18 4,122,791 2,480,278 60.2% 10,775.39 263,888 6.4% 1,146.44 2,744,166 66.6% 11,921.83 Loon Lake 228.78 2,706,697 1,630,527 60.2% 7,127.05 104,808 3.9% 458.12 1,735,334 64.1% 7,585.17 Wilbur 226.43 3,844,585 2,165,507 56.3% 9,563.69 365,065 9.5% 1,612.26 2,530,572 65.8% 11,175.96 Trout Lake 225.30 3,541,309 2,234,135 63.1% 9,916.27 179,200 5.1% 795.38 2,413,335 68.1% 10,711.65 Touchet 223.67 4,136,499 2,539,718 61.4% 11,354.75 70,206 1.7% 313.88 2,609,924 63.1% 11,668.64 Coulee/Hartline 221.65 3,405,568 1,796,373 52.7% 8,104.55 313,940 9.2% 1,416.38 2,110,313 62.0% 9,520.92 Inchelium 216.75 5,551,503 3,112,585 56.1% 14,360.25 492,102 8.9% 2,270.37 3,604,687 64.9% 16,630.62 Northport 215.94 3,861,376 2,385,769 61.8% 11,048.30 84,150 2.2% 389.69 2,469,919 64.0% 11,437.99 Grapeview 208.15 3,220,406 1,983,691 61.6% 9,530.11 52,745 1.6% 253.40 2,036,437 63.2% 9,783.51 Tekoa 202.77 3,977,688 2,269,502 57.1% 11,192.49 451,093 11.3% 2,224.65 2,720,595 68.4% 13,417.15 Southside 202.11 3,048,037 1,814,969 59.5% 8,980.11 107,255 3.5% 530.67 1,922,224 63.1% 9,510.78 Quinault 199.00 4,059,266 2,285,884 56.3% 11,486.85 160,888 4.0% 808.48 2,446,771 60.3% 12,295.33 Rosalia 191.25 3,917,328 2,323,280 59.3% 12,147.87 279,415 7.1% 1,460.99 2,602,695 66.4% 13,608.86 Lind 190.10 4,834,844 2,398,378 49.6% 12,616.40 251,901 5.2% 1,325.10 2,650,280 54.8% 13,941.50 Palouse 183.93 3,331,197 1,956,328 58.7% 10,636.26 227,334 6.8% 1,235.98 2,183,662 65.6% 11,872.25 Carbonado 181.38 2,652,802 1,941,527 73.2% 10,704.19 29,262 1.1% 161.33 1,970,789 74.3% 10,865.53 Colton 176.22 3,431,085 1,945,423 56.7% 11,039.74 158,259 4.6% 898.08 2,103,682 61.3% 11,937.82 Cosmopolis 175.94 2,999,736 1,795,571 59.9% 10,205.59 245,824 8.2% 1,397.20 2,041,395 68.1% 11,602.79 Summit Olympus Charter 173.47 3,324,044 1,363,813 41.0% 7,861.95 223,123 6.7% 1,286.23 1,586,936 47.7% 9,148.19 Taholah 171.95 4,708,953 2,395,537 50.9% 13,931.59 380,184 8.1% 2,211.01 2,775,720 58.9% 16,142.60 Orondo 171.71 3,799,038 1,917,221 50.5% 11,165.46 365,180 9.6% 2,126.72 2,282,400 60.1% 13,292.18 Green Mountain 160.78 2,321,560 1,293,700 55.7% 8,046.40 192,230 8.3% 1,195.61 1,485,931 64.0% 9,242.01 Wishkah Valley 154.03 3,597,535 1,937,963 53.9% 12,581.73 253,637 7.1% 1,646.68 2,191,601 60.9% 14,228.40 Wilson Creek 145.16 3,133,539 1,699,347 54.2% 11,706.71 92,279 2.9% 635.70 1,791,625 57.2% 12,342.42 St John 144.59 3,175,938 1,798,629 56.6% 12,439.51 193,326 6.1% 1,337.06 1,991,955 62.7% 13,776.57 Nespelem 139.52 4,007,667 2,221,298 55.4% 15,921.00 520,527 13.0% 3,730.84 2,741,825 68.4% 19,651.84 Yakama Nation Tribal 138.48 1,635,006 899,520 55.0% 6,495.67 52,241 3.2% 377.25 951,761 58.2% 6,872.92 Wa He Lut Tribal 134.48 1,439,447 1,123,198 78.0% 8,352.16 159,383 11.1% 1,185.18 1,282,581 89.1% 9,537.33 Harrington 128.53 3,326,945 1,856,425 55.8% 14,443.52 273,338 8.2% 2,126.65 2,129,764 64.0% 16,570.17 Garfield 125.23 2,903,598 1,498,762 51.6% 11,968.07 303,069 10.4% 2,420.10 1,801,830 62.1% 14,388.17 Oakesdale 123.73 3,296,159 1,747,295 53.0% 14,121.84 131,121 4.0% 1,059.74 1,878,416 57.0% 15,181.57 Paterson 121.73 2,202,493 1,219,663 55.4% 10,019.41 73,630 3.3% 604.86 1,293,293 58.7% 10,624.27 Bickleton 119.91 2,637,403 1,618,616 61.4% 13,498.59 38,700 1.5% 322.74 1,657,316 62.8% 13,821.33 Quileute Tribal 114.36 2,311,465 2,020,137 87.4% 17,664.72 55,361 2.4% 484.09 2,075,497 89.8% 18,148.81 Columbia (Stevens) 104.60 3,067,970 1,648,300 53.7% 15,758.12 249,739 8.1% 2,387.56 1,898,039 61.9% 18,145.69
70 17,738.80 319,811,385 176,697,578 55.3% 9,961.08 22,786,214 7.1% 1,284.54 199,483,792 62.4% 11,245.62
85
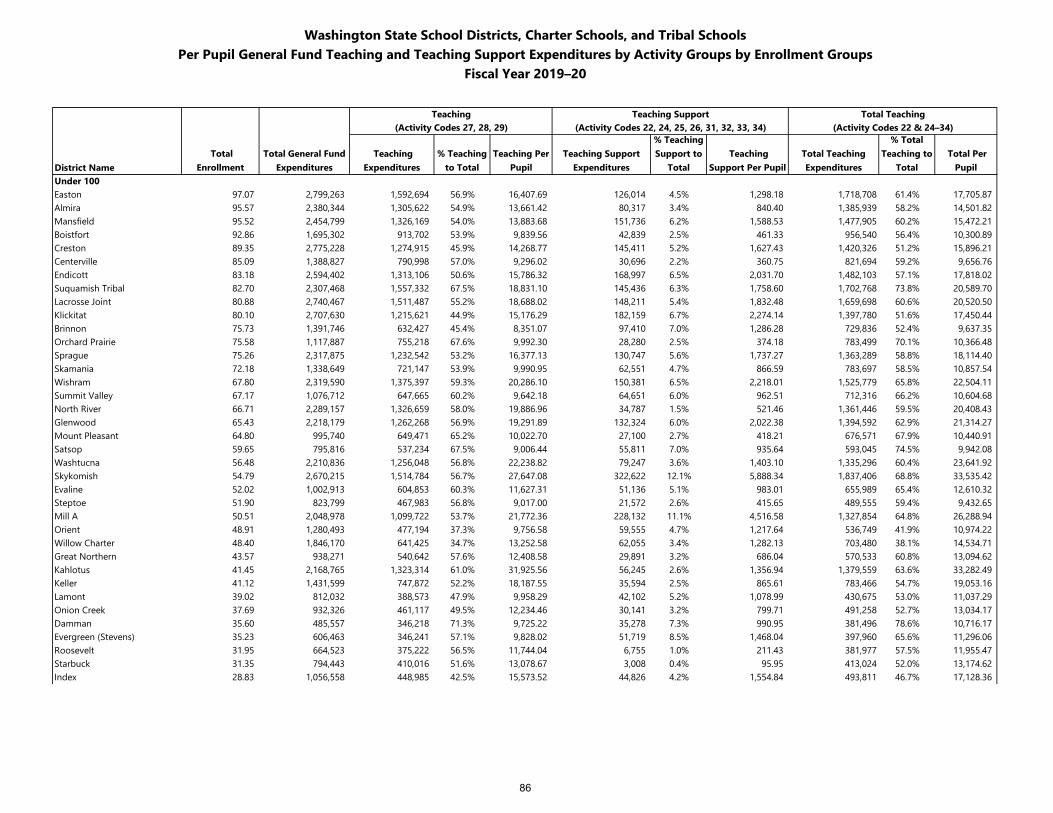
Washington State School Districts, Charter Schools, and Tribal SchoolsPer Pupil General Fund Teaching and Teaching Support Expenditures by Activity Groups by Enrollment Groups
Fiscal Year 2019–20
Teaching Teaching Support Total Teaching(Activity Codes 27, 28, 29) (Activity Codes 22, 24, 25, 26, 31, 32, 33, 34) (Activity Codes 22 & 24–34)
District Name Total
Enrollment Total General Fund
Expenditures Teaching
Expenditures % Teaching
to TotalTeaching Per
PupilTeaching Support
Expenditures
% Teaching Support to
Total Teaching
Support Per Pupil Total Teaching Expenditures
% Total Teaching to
Total Total Per
Pupil Under 100Easton 97.07 2,799,263 1,592,694 56.9% 16,407.69 126,014 4.5% 1,298.18 1,718,708 61.4% 17,705.87 Almira 95.57 2,380,344 1,305,622 54.9% 13,661.42 80,317 3.4% 840.40 1,385,939 58.2% 14,501.82 Mansfield 95.52 2,454,799 1,326,169 54.0% 13,883.68 151,736 6.2% 1,588.53 1,477,905 60.2% 15,472.21 Boistfort 92.86 1,695,302 913,702 53.9% 9,839.56 42,839 2.5% 461.33 956,540 56.4% 10,300.89 Creston 89.35 2,775,228 1,274,915 45.9% 14,268.77 145,411 5.2% 1,627.43 1,420,326 51.2% 15,896.21 Centerville 85.09 1,388,827 790,998 57.0% 9,296.02 30,696 2.2% 360.75 821,694 59.2% 9,656.76 Endicott 83.18 2,594,402 1,313,106 50.6% 15,786.32 168,997 6.5% 2,031.70 1,482,103 57.1% 17,818.02 Suquamish Tribal 82.70 2,307,468 1,557,332 67.5% 18,831.10 145,436 6.3% 1,758.60 1,702,768 73.8% 20,589.70 Lacrosse Joint 80.88 2,740,467 1,511,487 55.2% 18,688.02 148,211 5.4% 1,832.48 1,659,698 60.6% 20,520.50 Klickitat 80.10 2,707,630 1,215,621 44.9% 15,176.29 182,159 6.7% 2,274.14 1,397,780 51.6% 17,450.44 Brinnon 75.73 1,391,746 632,427 45.4% 8,351.07 97,410 7.0% 1,286.28 729,836 52.4% 9,637.35 Orchard Prairie 75.58 1,117,887 755,218 67.6% 9,992.30 28,280 2.5% 374.18 783,499 70.1% 10,366.48 Sprague 75.26 2,317,875 1,232,542 53.2% 16,377.13 130,747 5.6% 1,737.27 1,363,289 58.8% 18,114.40 Skamania 72.18 1,338,649 721,147 53.9% 9,990.95 62,551 4.7% 866.59 783,697 58.5% 10,857.54 Wishram 67.80 2,319,590 1,375,397 59.3% 20,286.10 150,381 6.5% 2,218.01 1,525,779 65.8% 22,504.11 Summit Valley 67.17 1,076,712 647,665 60.2% 9,642.18 64,651 6.0% 962.51 712,316 66.2% 10,604.68 North River 66.71 2,289,157 1,326,659 58.0% 19,886.96 34,787 1.5% 521.46 1,361,446 59.5% 20,408.43 Glenwood 65.43 2,218,179 1,262,268 56.9% 19,291.89 132,324 6.0% 2,022.38 1,394,592 62.9% 21,314.27 Mount Pleasant 64.80 995,740 649,471 65.2% 10,022.70 27,100 2.7% 418.21 676,571 67.9% 10,440.91 Satsop 59.65 795,816 537,234 67.5% 9,006.44 55,811 7.0% 935.64 593,045 74.5% 9,942.08 Washtucna 56.48 2,210,836 1,256,048 56.8% 22,238.82 79,247 3.6% 1,403.10 1,335,296 60.4% 23,641.92 Skykomish 54.79 2,670,215 1,514,784 56.7% 27,647.08 322,622 12.1% 5,888.34 1,837,406 68.8% 33,535.42 Evaline 52.02 1,002,913 604,853 60.3% 11,627.31 51,136 5.1% 983.01 655,989 65.4% 12,610.32 Steptoe 51.90 823,799 467,983 56.8% 9,017.00 21,572 2.6% 415.65 489,555 59.4% 9,432.65 Mill A 50.51 2,048,978 1,099,722 53.7% 21,772.36 228,132 11.1% 4,516.58 1,327,854 64.8% 26,288.94 Orient 48.91 1,280,493 477,194 37.3% 9,756.58 59,555 4.7% 1,217.64 536,749 41.9% 10,974.22 Willow Charter 48.40 1,846,170 641,425 34.7% 13,252.58 62,055 3.4% 1,282.13 703,480 38.1% 14,534.71 Great Northern 43.57 938,271 540,642 57.6% 12,408.58 29,891 3.2% 686.04 570,533 60.8% 13,094.62 Kahlotus 41.45 2,168,765 1,323,314 61.0% 31,925.56 56,245 2.6% 1,356.94 1,379,559 63.6% 33,282.49 Keller 41.12 1,431,599 747,872 52.2% 18,187.55 35,594 2.5% 865.61 783,466 54.7% 19,053.16 Lamont 39.02 812,032 388,573 47.9% 9,958.29 42,102 5.2% 1,078.99 430,675 53.0% 11,037.29 Onion Creek 37.69 932,326 461,117 49.5% 12,234.46 30,141 3.2% 799.71 491,258 52.7% 13,034.17 Damman 35.60 485,557 346,218 71.3% 9,725.22 35,278 7.3% 990.95 381,496 78.6% 10,716.17 Evergreen (Stevens) 35.23 606,463 346,241 57.1% 9,828.02 51,719 8.5% 1,468.04 397,960 65.6% 11,296.06 Roosevelt 31.95 664,523 375,222 56.5% 11,744.04 6,755 1.0% 211.43 381,977 57.5% 11,955.47 Starbuck 31.35 794,443 410,016 51.6% 13,078.67 3,008 0.4% 95.95 413,024 52.0% 13,174.62 Index 28.83 1,056,558 448,985 42.5% 15,573.52 44,826 4.2% 1,554.84 493,811 46.7% 17,128.36
86
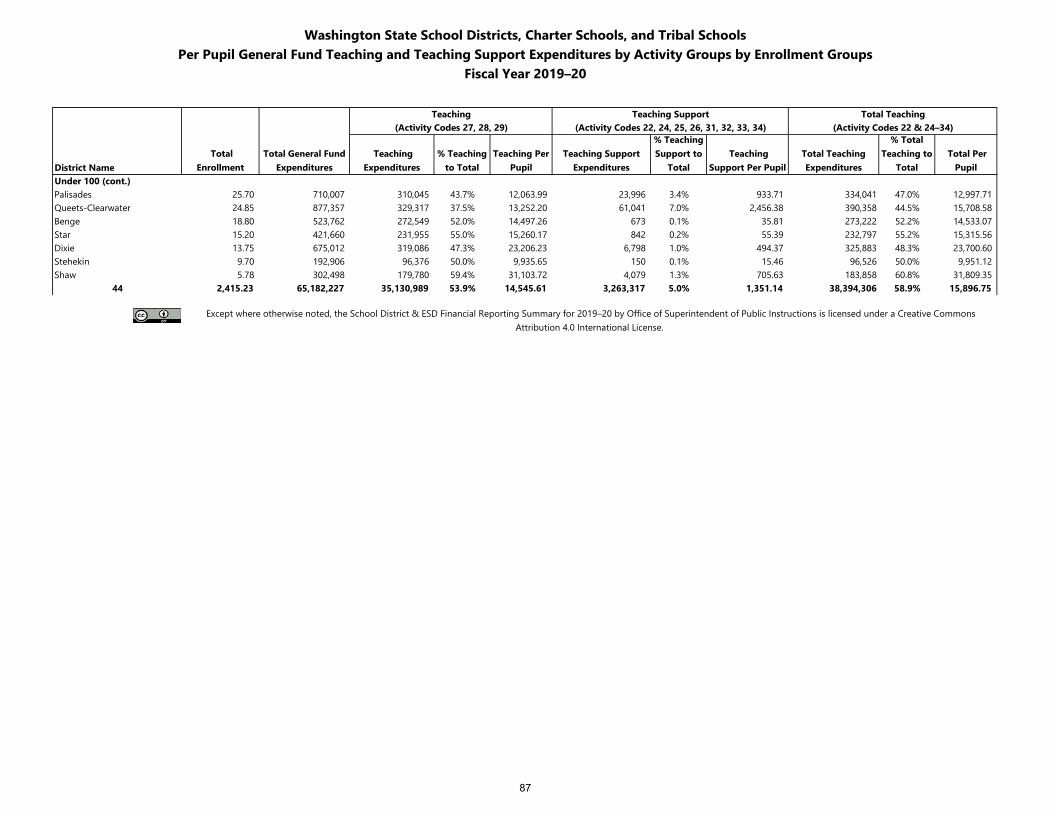
Washington State School Districts, Charter Schools, and Tribal SchoolsPer Pupil General Fund Teaching and Teaching Support Expenditures by Activity Groups by Enrollment Groups
Fiscal Year 2019–20
Teaching Teaching Support Total Teaching(Activity Codes 27, 28, 29) (Activity Codes 22, 24, 25, 26, 31, 32, 33, 34) (Activity Codes 22 & 24–34)
District Name Total
Enrollment Total General Fund
Expenditures Teaching
Expenditures % Teaching
to TotalTeaching Per
PupilTeaching Support
Expenditures
% TeachingSupport to
Total Teaching
Support Per Pupil Total Teaching Expenditures
% Total Teaching to
Total Total Per
Pupil Under 100 (cont.)Palisades 25.70 710,007 310,045 43.7% 12,063.99 23,996 3.4% 933.71 334,041 47.0% 12,997.71 Queets-Clearwater 24.85 877,357 329,317 37.5% 13,252.20 61,041 7.0% 2,456.38 390,358 44.5% 15,708.58 Benge 18.80 523,762 272,549 52.0% 14,497.26 673 0.1% 35.81 273,222 52.2% 14,533.07 Star 15.20 421,660 231,955 55.0% 15,260.17 842 0.2% 55.39 232,797 55.2% 15,315.56 Dixie 13.75 675,012 319,086 47.3% 23,206.23 6,798 1.0% 494.37 325,883 48.3% 23,700.60 Stehekin 9.70 192,906 96,376 50.0% 9,935.65 150 0.1% 15.46 96,526 50.0% 9,951.12 Shaw 5.78 302,498 179,780 59.4% 31,103.72 4,079 1.3% 705.63 183,858 60.8% 31,809.35
44 2,415.23 65,182,227 35,130,989 53.9% 14,545.61 3,263,317 5.0% 1,351.14 38,394,306 58.9% 15,896.75
Except where otherwise noted, the School District & ESD Financial Reporting Summary for 2019–20 by Office of Superintendent of Public Instructions is licensed under a Creative Commons Attribution 4.0 International License.
87
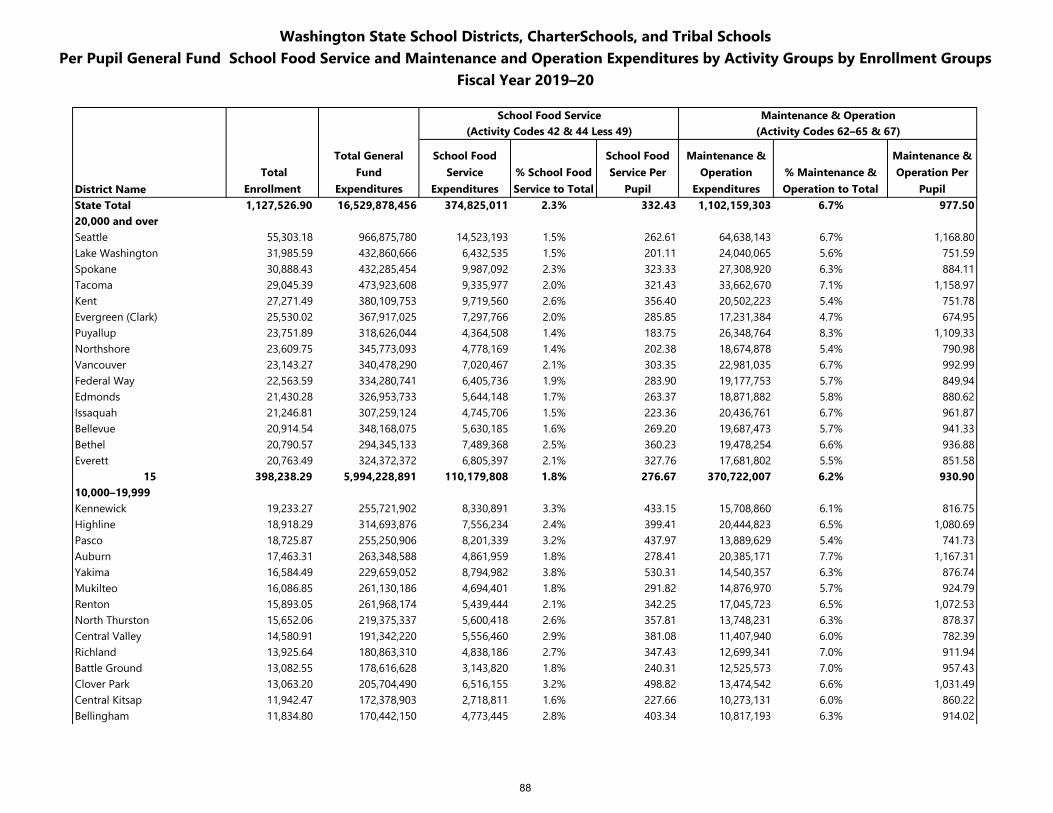
Washington State School Districts, CharterSchools, and Tribal SchoolsPer Pupil General Fund School Food Service and Maintenance and Operation Expenditures by Activity Groups by Enrollment Groups
Fiscal Year 2019–20
School Food Service Maintenance & Operation(Activity Codes 42 & 44 Less 49) (Activity Codes 62–65 & 67)
District Name Total
Enrollment
Total General Fund
Expenditures
School Food Service
Expenditures% School Food Service to Total
School Food Service Per
Pupil
Maintenance & Operation
Expenditures% Maintenance & Operation to Total
Maintenance & Operation Per
PupilState Total 1,127,526.90 16,529,878,456 374,825,011 2.3% 332.43 1,102,159,303 6.7% 977.5020,000 and overSeattle 55,303.18 966,875,780 14,523,193 1.5% 262.61 64,638,143 6.7% 1,168.80Lake Washington 31,985.59 432,860,666 6,432,535 1.5% 201.11 24,040,065 5.6% 751.59Spokane 30,888.43 432,285,454 9,987,092 2.3% 323.33 27,308,920 6.3% 884.11Tacoma 29,045.39 473,923,608 9,335,977 2.0% 321.43 33,662,670 7.1% 1,158.97Kent 27,271.49 380,109,753 9,719,560 2.6% 356.40 20,502,223 5.4% 751.78Evergreen (Clark) 25,530.02 367,917,025 7,297,766 2.0% 285.85 17,231,384 4.7% 674.95Puyallup 23,751.89 318,626,044 4,364,508 1.4% 183.75 26,348,764 8.3% 1,109.33Northshore 23,609.75 345,773,093 4,778,169 1.4% 202.38 18,674,878 5.4% 790.98Vancouver 23,143.27 340,478,290 7,020,467 2.1% 303.35 22,981,035 6.7% 992.99Federal Way 22,563.59 334,280,741 6,405,736 1.9% 283.90 19,177,753 5.7% 849.94Edmonds 21,430.28 326,953,733 5,644,148 1.7% 263.37 18,871,882 5.8% 880.62Issaquah 21,246.81 307,259,124 4,745,706 1.5% 223.36 20,436,761 6.7% 961.87Bellevue 20,914.54 348,168,075 5,630,185 1.6% 269.20 19,687,473 5.7% 941.33Bethel 20,790.57 294,345,133 7,489,368 2.5% 360.23 19,478,254 6.6% 936.88Everett 20,763.49 324,372,372 6,805,397 2.1% 327.76 17,681,802 5.5% 851.58
15 398,238.29 5,994,228,891 110,179,808 1.8% 276.67 370,722,007 6.2% 930.9010,000–19,999Kennewick 19,233.27 255,721,902 8,330,891 3.3% 433.15 15,708,860 6.1% 816.75Highline 18,918.29 314,693,876 7,556,234 2.4% 399.41 20,444,823 6.5% 1,080.69Pasco 18,725.87 255,250,906 8,201,339 3.2% 437.97 13,889,629 5.4% 741.73Auburn 17,463.31 263,348,588 4,861,959 1.8% 278.41 20,385,171 7.7% 1,167.31Yakima 16,584.49 229,659,052 8,794,982 3.8% 530.31 14,540,357 6.3% 876.74Mukilteo 16,086.85 261,130,186 4,694,401 1.8% 291.82 14,876,970 5.7% 924.79Renton 15,893.05 261,968,174 5,439,444 2.1% 342.25 17,045,723 6.5% 1,072.53North Thurston 15,652.06 219,375,337 5,600,418 2.6% 357.81 13,748,231 6.3% 878.37Central Valley 14,580.91 191,342,220 5,556,460 2.9% 381.08 11,407,940 6.0% 782.39Richland 13,925.64 180,863,310 4,838,186 2.7% 347.43 12,699,341 7.0% 911.94Battle Ground 13,082.55 178,616,628 3,143,820 1.8% 240.31 12,525,573 7.0% 957.43Clover Park 13,063.20 205,704,490 6,516,155 3.2% 498.82 13,474,542 6.6% 1,031.49Central Kitsap 11,942.47 172,378,903 2,718,811 1.6% 227.66 10,273,131 6.0% 860.22Bellingham 11,834.80 170,442,150 4,773,445 2.8% 403.34 10,817,193 6.3% 914.02
88
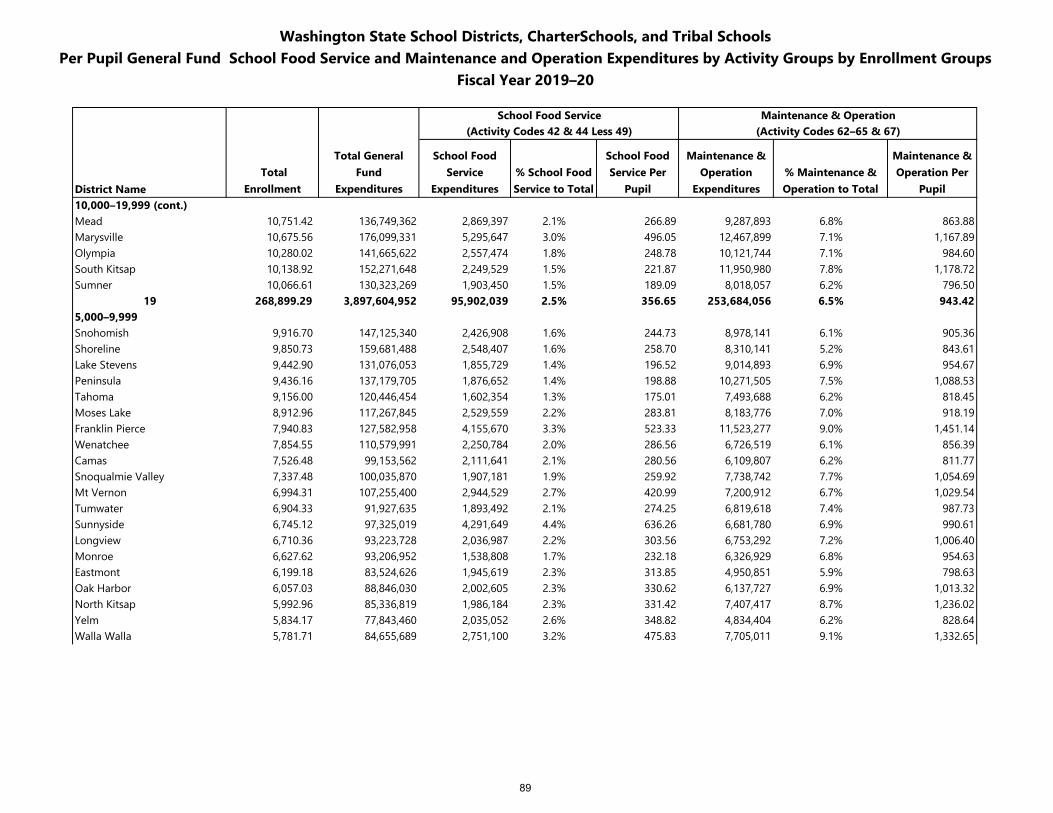
Washington State School Districts, CharterSchools, and Tribal SchoolsPer Pupil General Fund School Food Service and Maintenance and Operation Expenditures by Activity Groups by Enrollment Groups
Fiscal Year 2019–20
School Food Service Maintenance & Operation(Activity Codes 42 & 44 Less 49) (Activity Codes 62–65 & 67)
District Name Total
Enrollment
Total General Fund
Expenditures
School Food Service
Expenditures% School Food Service to Total
School Food Service Per
Pupil
Maintenance & Operation
Expenditures% Maintenance & Operation to Total
Maintenance & Operation Per
Pupil10,000–19,999 (cont.)Mead 10,751.42 136,749,362 2,869,397 2.1% 266.89 9,287,893 6.8% 863.88Marysville 10,675.56 176,099,331 5,295,647 3.0% 496.05 12,467,899 7.1% 1,167.89Olympia 10,280.02 141,665,622 2,557,474 1.8% 248.78 10,121,744 7.1% 984.60South Kitsap 10,138.92 152,271,648 2,249,529 1.5% 221.87 11,950,980 7.8% 1,178.72Sumner 10,066.61 130,323,269 1,903,450 1.5% 189.09 8,018,057 6.2% 796.50
19 268,899.29 3,897,604,952 95,902,039 2.5% 356.65 253,684,056 6.5% 943.425,000–9,999Snohomish 9,916.70 147,125,340 2,426,908 1.6% 244.73 8,978,141 6.1% 905.36Shoreline 9,850.73 159,681,488 2,548,407 1.6% 258.70 8,310,141 5.2% 843.61Lake Stevens 9,442.90 131,076,053 1,855,729 1.4% 196.52 9,014,893 6.9% 954.67Peninsula 9,436.16 137,179,705 1,876,652 1.4% 198.88 10,271,505 7.5% 1,088.53Tahoma 9,156.00 120,446,454 1,602,354 1.3% 175.01 7,493,688 6.2% 818.45Moses Lake 8,912.96 117,267,845 2,529,559 2.2% 283.81 8,183,776 7.0% 918.19Franklin Pierce 7,940.83 127,582,958 4,155,670 3.3% 523.33 11,523,277 9.0% 1,451.14Wenatchee 7,854.55 110,579,991 2,250,784 2.0% 286.56 6,726,519 6.1% 856.39Camas 7,526.48 99,153,562 2,111,641 2.1% 280.56 6,109,807 6.2% 811.77Snoqualmie Valley 7,337.48 100,035,870 1,907,181 1.9% 259.92 7,738,742 7.7% 1,054.69Mt Vernon 6,994.31 107,255,400 2,944,529 2.7% 420.99 7,200,912 6.7% 1,029.54Tumwater 6,904.33 91,927,635 1,893,492 2.1% 274.25 6,819,618 7.4% 987.73Sunnyside 6,745.12 97,325,019 4,291,649 4.4% 636.26 6,681,780 6.9% 990.61Longview 6,710.36 93,223,728 2,036,987 2.2% 303.56 6,753,292 7.2% 1,006.40Monroe 6,627.62 93,206,952 1,538,808 1.7% 232.18 6,326,929 6.8% 954.63Eastmont 6,199.18 83,524,626 1,945,619 2.3% 313.85 4,950,851 5.9% 798.63Oak Harbor 6,057.03 88,846,030 2,002,605 2.3% 330.62 6,137,727 6.9% 1,013.32North Kitsap 5,992.96 85,336,819 1,986,184 2.3% 331.42 7,407,417 8.7% 1,236.02Yelm 5,834.17 77,843,460 2,035,052 2.6% 348.82 4,834,404 6.2% 828.64Walla Walla 5,781.71 84,655,689 2,751,100 3.2% 475.83 7,705,011 9.1% 1,332.65
89
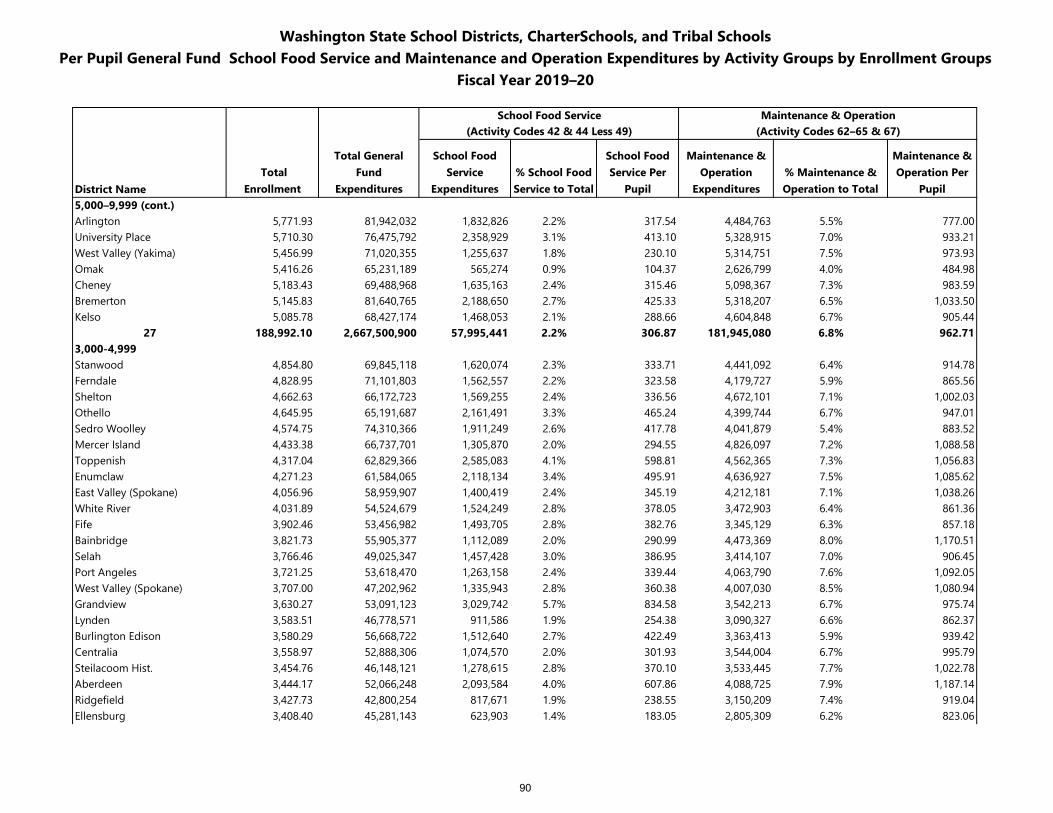
Washington State School Districts, CharterSchools, and Tribal SchoolsPer Pupil General Fund School Food Service and Maintenance and Operation Expenditures by Activity Groups by Enrollment Groups
Fiscal Year 2019–20
School Food Service Maintenance & Operation(Activity Codes 42 & 44 Less 49) (Activity Codes 62–65 & 67)
District Name Total
Enrollment
Total General Fund
Expenditures
School Food Service
Expenditures% School Food Service to Total
School Food Service Per
Pupil
Maintenance & Operation
Expenditures% Maintenance & Operation to Total
Maintenance & Operation Per
Pupil5,000–9,999 (cont.)Arlington 5,771.93 81,942,032 1,832,826 2.2% 317.54 4,484,763 5.5% 777.00University Place 5,710.30 76,475,792 2,358,929 3.1% 413.10 5,328,915 7.0% 933.21West Valley (Yakima) 5,456.99 71,020,355 1,255,637 1.8% 230.10 5,314,751 7.5% 973.93Omak 5,416.26 65,231,189 565,274 0.9% 104.37 2,626,799 4.0% 484.98Cheney 5,183.43 69,488,968 1,635,163 2.4% 315.46 5,098,367 7.3% 983.59Bremerton 5,145.83 81,640,765 2,188,650 2.7% 425.33 5,318,207 6.5% 1,033.50Kelso 5,085.78 68,427,174 1,468,053 2.1% 288.66 4,604,848 6.7% 905.44
27 188,992.10 2,667,500,900 57,995,441 2.2% 306.87 181,945,080 6.8% 962.713,000-4,999Stanwood 4,854.80 69,845,118 1,620,074 2.3% 333.71 4,441,092 6.4% 914.78Ferndale 4,828.95 71,101,803 1,562,557 2.2% 323.58 4,179,727 5.9% 865.56Shelton 4,662.63 66,172,723 1,569,255 2.4% 336.56 4,672,101 7.1% 1,002.03Othello 4,645.95 65,191,687 2,161,491 3.3% 465.24 4,399,744 6.7% 947.01Sedro Woolley 4,574.75 74,310,366 1,911,249 2.6% 417.78 4,041,879 5.4% 883.52Mercer Island 4,433.38 66,737,701 1,305,870 2.0% 294.55 4,826,097 7.2% 1,088.58Toppenish 4,317.04 62,829,366 2,585,083 4.1% 598.81 4,562,365 7.3% 1,056.83Enumclaw 4,271.23 61,584,065 2,118,134 3.4% 495.91 4,636,927 7.5% 1,085.62East Valley (Spokane) 4,056.96 58,959,907 1,400,419 2.4% 345.19 4,212,181 7.1% 1,038.26White River 4,031.89 54,524,679 1,524,249 2.8% 378.05 3,472,903 6.4% 861.36Fife 3,902.46 53,456,982 1,493,705 2.8% 382.76 3,345,129 6.3% 857.18Bainbridge 3,821.73 55,905,377 1,112,089 2.0% 290.99 4,473,369 8.0% 1,170.51Selah 3,766.46 49,025,347 1,457,428 3.0% 386.95 3,414,107 7.0% 906.45Port Angeles 3,721.25 53,618,470 1,263,158 2.4% 339.44 4,063,790 7.6% 1,092.05West Valley (Spokane) 3,707.00 47,202,962 1,335,943 2.8% 360.38 4,007,030 8.5% 1,080.94Grandview 3,630.27 53,091,123 3,029,742 5.7% 834.58 3,542,213 6.7% 975.74Lynden 3,583.51 46,778,571 911,586 1.9% 254.38 3,090,327 6.6% 862.37Burlington Edison 3,580.29 56,668,722 1,512,640 2.7% 422.49 3,363,413 5.9% 939.42Centralia 3,558.97 52,888,306 1,074,570 2.0% 301.93 3,544,004 6.7% 995.79Steilacoom Hist. 3,454.76 46,148,121 1,278,615 2.8% 370.10 3,533,445 7.7% 1,022.78Aberdeen 3,444.17 52,066,248 2,093,584 4.0% 607.86 4,088,725 7.9% 1,187.14Ridgefield 3,427.73 42,800,254 817,671 1.9% 238.55 3,150,209 7.4% 919.04Ellensburg 3,408.40 45,281,143 623,903 1.4% 183.05 2,805,309 6.2% 823.06
90
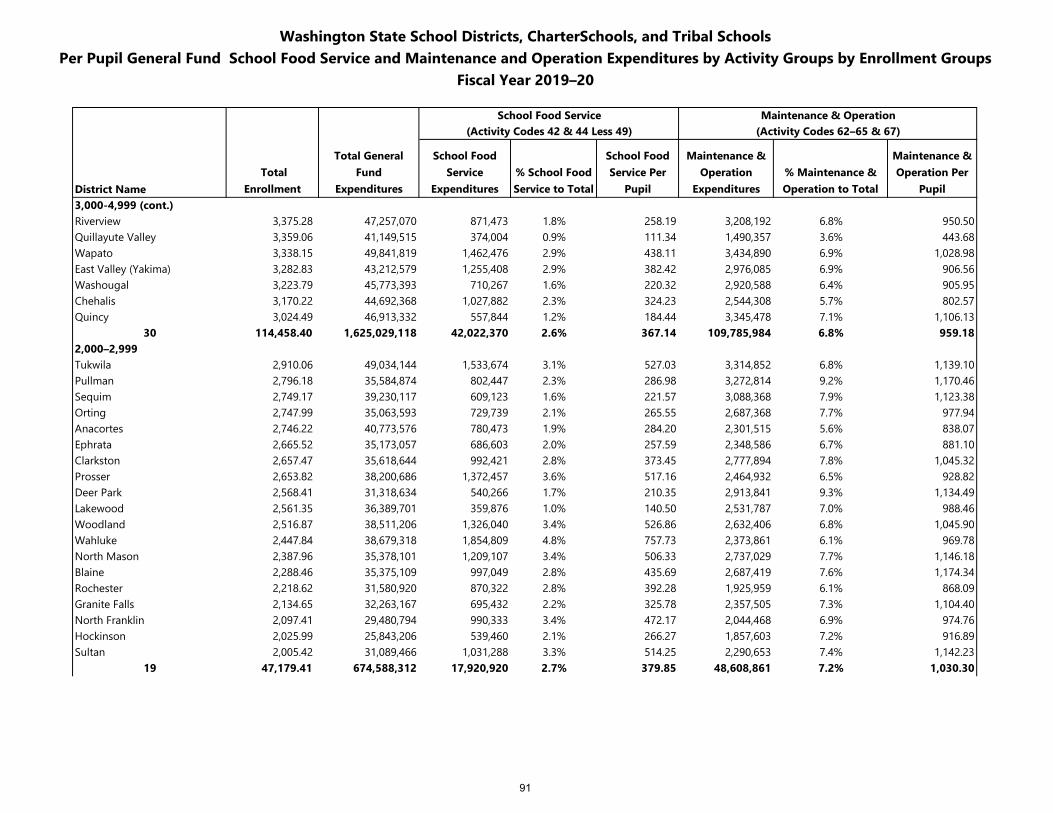
Washington State School Districts, CharterSchools, and Tribal SchoolsPer Pupil General Fund School Food Service and Maintenance and Operation Expenditures by Activity Groups by Enrollment Groups
Fiscal Year 2019–20
School Food Service Maintenance & Operation(Activity Codes 42 & 44 Less 49) (Activity Codes 62–65 & 67)
District Name Total
Enrollment
Total General Fund
Expenditures
School Food Service
Expenditures% School Food Service to Total
School Food Service Per
Pupil
Maintenance & Operation
Expenditures% Maintenance & Operation to Total
Maintenance & Operation Per
Pupil3,000-4,999 (cont.)Riverview 3,375.28 47,257,070 871,473 1.8% 258.19 3,208,192 6.8% 950.50Quillayute Valley 3,359.06 41,149,515 374,004 0.9% 111.34 1,490,357 3.6% 443.68Wapato 3,338.15 49,841,819 1,462,476 2.9% 438.11 3,434,890 6.9% 1,028.98East Valley (Yakima) 3,282.83 43,212,579 1,255,408 2.9% 382.42 2,976,085 6.9% 906.56Washougal 3,223.79 45,773,393 710,267 1.6% 220.32 2,920,588 6.4% 905.95Chehalis 3,170.22 44,692,368 1,027,882 2.3% 324.23 2,544,308 5.7% 802.57Quincy 3,024.49 46,913,332 557,844 1.2% 184.44 3,345,478 7.1% 1,106.13
30 114,458.40 1,625,029,118 42,022,370 2.6% 367.14 109,785,984 6.8% 959.182,000–2,999Tukwila 2,910.06 49,034,144 1,533,674 3.1% 527.03 3,314,852 6.8% 1,139.10Pullman 2,796.18 35,584,874 802,447 2.3% 286.98 3,272,814 9.2% 1,170.46Sequim 2,749.17 39,230,117 609,123 1.6% 221.57 3,088,368 7.9% 1,123.38Orting 2,747.99 35,063,593 729,739 2.1% 265.55 2,687,368 7.7% 977.94Anacortes 2,746.22 40,773,576 780,473 1.9% 284.20 2,301,515 5.6% 838.07Ephrata 2,665.52 35,173,057 686,603 2.0% 257.59 2,348,586 6.7% 881.10Clarkston 2,657.47 35,618,644 992,421 2.8% 373.45 2,777,894 7.8% 1,045.32Prosser 2,653.82 38,200,686 1,372,457 3.6% 517.16 2,464,932 6.5% 928.82Deer Park 2,568.41 31,318,634 540,266 1.7% 210.35 2,913,841 9.3% 1,134.49Lakewood 2,561.35 36,389,701 359,876 1.0% 140.50 2,531,787 7.0% 988.46Woodland 2,516.87 38,511,206 1,326,040 3.4% 526.86 2,632,406 6.8% 1,045.90Wahluke 2,447.84 38,679,318 1,854,809 4.8% 757.73 2,373,861 6.1% 969.78North Mason 2,387.96 35,378,101 1,209,107 3.4% 506.33 2,737,029 7.7% 1,146.18Blaine 2,288.46 35,375,109 997,049 2.8% 435.69 2,687,419 7.6% 1,174.34Rochester 2,218.62 31,580,920 870,322 2.8% 392.28 1,925,959 6.1% 868.09Granite Falls 2,134.65 32,263,167 695,432 2.2% 325.78 2,357,505 7.3% 1,104.40North Franklin 2,097.41 29,480,794 990,333 3.4% 472.17 2,044,468 6.9% 974.76Hockinson 2,025.99 25,843,206 539,460 2.1% 266.27 1,857,603 7.2% 916.89Sultan 2,005.42 31,089,466 1,031,288 3.3% 514.25 2,290,653 7.4% 1,142.23
19 47,179.41 674,588,312 17,920,920 2.7% 379.85 48,608,861 7.2% 1,030.30
91
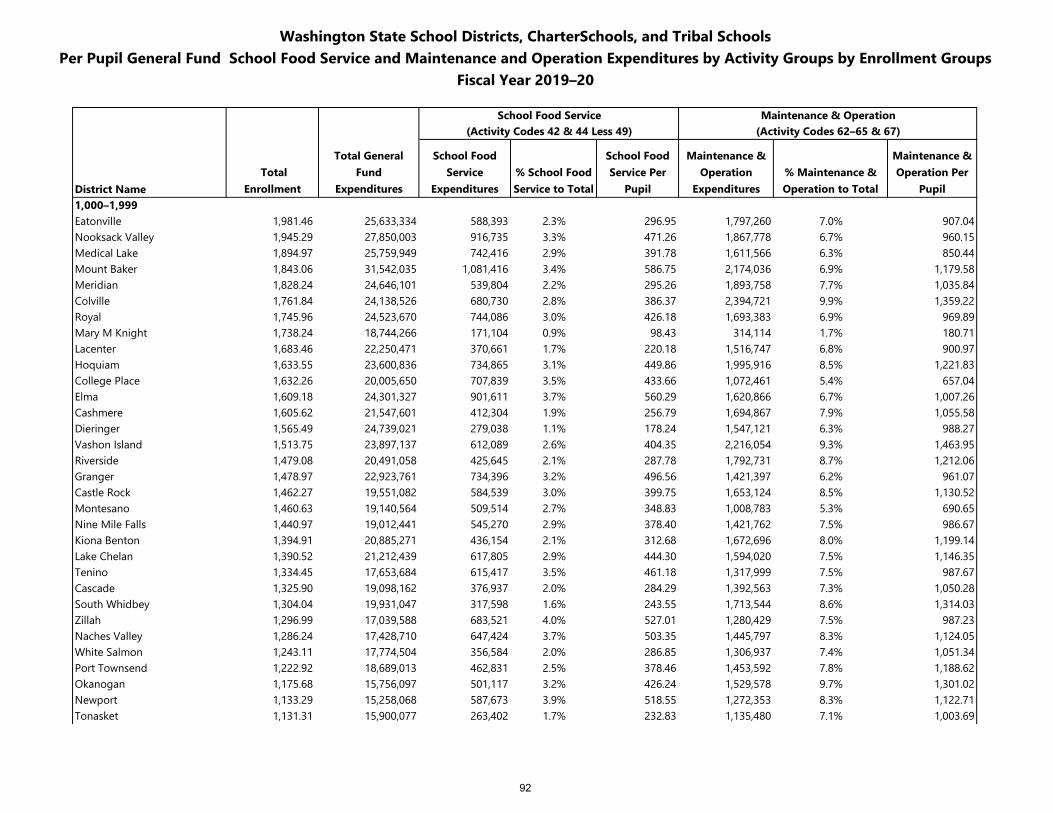
Washington State School Districts, CharterSchools, and Tribal SchoolsPer Pupil General Fund School Food Service and Maintenance and Operation Expenditures by Activity Groups by Enrollment Groups
Fiscal Year 2019–20
School Food Service Maintenance & Operation(Activity Codes 42 & 44 Less 49) (Activity Codes 62–65 & 67)
District Name Total
Enrollment
Total General Fund
Expenditures
School Food Service
Expenditures% School Food Service to Total
School Food Service Per
Pupil
Maintenance & Operation
Expenditures% Maintenance & Operation to Total
Maintenance & Operation Per
Pupil1,000–1,999Eatonville 1,981.46 25,633,334 588,393 2.3% 296.95 1,797,260 7.0% 907.04Nooksack Valley 1,945.29 27,850,003 916,735 3.3% 471.26 1,867,778 6.7% 960.15Medical Lake 1,894.97 25,759,949 742,416 2.9% 391.78 1,611,566 6.3% 850.44Mount Baker 1,843.06 31,542,035 1,081,416 3.4% 586.75 2,174,036 6.9% 1,179.58Meridian 1,828.24 24,646,101 539,804 2.2% 295.26 1,893,758 7.7% 1,035.84Colville 1,761.84 24,138,526 680,730 2.8% 386.37 2,394,721 9.9% 1,359.22Royal 1,745.96 24,523,670 744,086 3.0% 426.18 1,693,383 6.9% 969.89Mary M Knight 1,738.24 18,744,266 171,104 0.9% 98.43 314,114 1.7% 180.71Lacenter 1,683.46 22,250,471 370,661 1.7% 220.18 1,516,747 6.8% 900.97Hoquiam 1,633.55 23,600,836 734,865 3.1% 449.86 1,995,916 8.5% 1,221.83College Place 1,632.26 20,005,650 707,839 3.5% 433.66 1,072,461 5.4% 657.04Elma 1,609.18 24,301,327 901,611 3.7% 560.29 1,620,866 6.7% 1,007.26Cashmere 1,605.62 21,547,601 412,304 1.9% 256.79 1,694,867 7.9% 1,055.58Dieringer 1,565.49 24,739,021 279,038 1.1% 178.24 1,547,121 6.3% 988.27Vashon Island 1,513.75 23,897,137 612,089 2.6% 404.35 2,216,054 9.3% 1,463.95Riverside 1,479.08 20,491,058 425,645 2.1% 287.78 1,792,731 8.7% 1,212.06Granger 1,478.97 22,923,761 734,396 3.2% 496.56 1,421,397 6.2% 961.07Castle Rock 1,462.27 19,551,082 584,539 3.0% 399.75 1,653,124 8.5% 1,130.52Montesano 1,460.63 19,140,564 509,514 2.7% 348.83 1,008,783 5.3% 690.65Nine Mile Falls 1,440.97 19,012,441 545,270 2.9% 378.40 1,421,762 7.5% 986.67Kiona Benton 1,394.91 20,885,271 436,154 2.1% 312.68 1,672,696 8.0% 1,199.14Lake Chelan 1,390.52 21,212,439 617,805 2.9% 444.30 1,594,020 7.5% 1,146.35Tenino 1,334.45 17,653,684 615,417 3.5% 461.18 1,317,999 7.5% 987.67Cascade 1,325.90 19,098,162 376,937 2.0% 284.29 1,392,563 7.3% 1,050.28South Whidbey 1,304.04 19,931,047 317,598 1.6% 243.55 1,713,544 8.6% 1,314.03Zillah 1,296.99 17,039,588 683,521 4.0% 527.01 1,280,429 7.5% 987.23Naches Valley 1,286.24 17,428,710 647,424 3.7% 503.35 1,445,797 8.3% 1,124.05White Salmon 1,243.11 17,774,504 356,584 2.0% 286.85 1,306,937 7.4% 1,051.34Port Townsend 1,222.92 18,689,013 462,831 2.5% 378.46 1,453,592 7.8% 1,188.62Okanogan 1,175.68 15,756,097 501,117 3.2% 426.24 1,529,578 9.7% 1,301.02Newport 1,133.29 15,258,068 587,673 3.9% 518.55 1,272,353 8.3% 1,122.71Tonasket 1,131.31 15,900,077 263,402 1.7% 232.83 1,135,480 7.1% 1,003.69
92
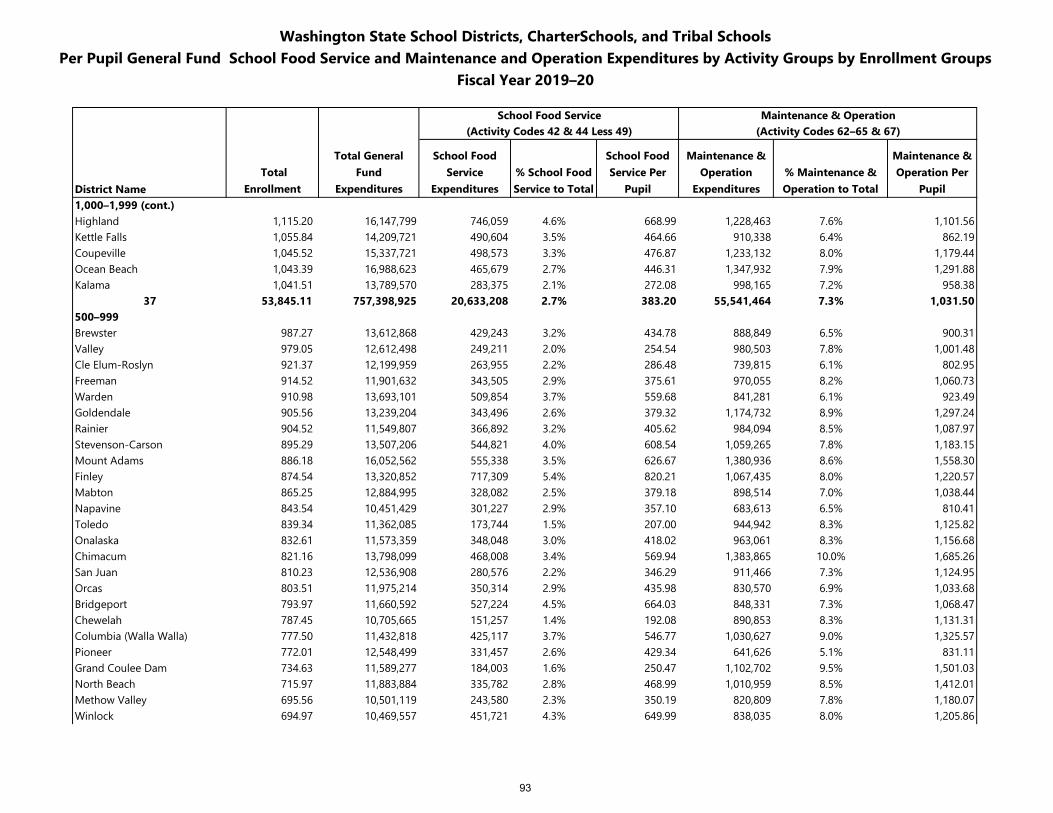
Washington State School Districts, CharterSchools, and Tribal SchoolsPer Pupil General Fund School Food Service and Maintenance and Operation Expenditures by Activity Groups by Enrollment Groups
Fiscal Year 2019–20
School Food Service Maintenance & Operation(Activity Codes 42 & 44 Less 49) (Activity Codes 62–65 & 67)
District Name Total
Enrollment
Total General Fund
Expenditures
School Food Service
Expenditures% School Food Service to Total
School Food Service Per
Pupil
Maintenance & Operation
Expenditures% Maintenance & Operation to Total
Maintenance & Operation Per
Pupil1,000–1,999 (cont.)Highland 1,115.20 16,147,799 746,059 4.6% 668.99 1,228,463 7.6% 1,101.56Kettle Falls 1,055.84 14,209,721 490,604 3.5% 464.66 910,338 6.4% 862.19Coupeville 1,045.52 15,337,721 498,573 3.3% 476.87 1,233,132 8.0% 1,179.44Ocean Beach 1,043.39 16,988,623 465,679 2.7% 446.31 1,347,932 7.9% 1,291.88Kalama 1,041.51 13,789,570 283,375 2.1% 272.08 998,165 7.2% 958.38
37 53,845.11 757,398,925 20,633,208 2.7% 383.20 55,541,464 7.3% 1,031.50500–999Brewster 987.27 13,612,868 429,243 3.2% 434.78 888,849 6.5% 900.31Valley 979.05 12,612,498 249,211 2.0% 254.54 980,503 7.8% 1,001.48Cle Elum-Roslyn 921.37 12,199,959 263,955 2.2% 286.48 739,815 6.1% 802.95Freeman 914.52 11,901,632 343,505 2.9% 375.61 970,055 8.2% 1,060.73Warden 910.98 13,693,101 509,854 3.7% 559.68 841,281 6.1% 923.49Goldendale 905.56 13,239,204 343,496 2.6% 379.32 1,174,732 8.9% 1,297.24Rainier 904.52 11,549,807 366,892 3.2% 405.62 984,094 8.5% 1,087.97Stevenson-Carson 895.29 13,507,206 544,821 4.0% 608.54 1,059,265 7.8% 1,183.15Mount Adams 886.18 16,052,562 555,338 3.5% 626.67 1,380,936 8.6% 1,558.30Finley 874.54 13,320,852 717,309 5.4% 820.21 1,067,435 8.0% 1,220.57Mabton 865.25 12,884,995 328,082 2.5% 379.18 898,514 7.0% 1,038.44Napavine 843.54 10,451,429 301,227 2.9% 357.10 683,613 6.5% 810.41Toledo 839.34 11,362,085 173,744 1.5% 207.00 944,942 8.3% 1,125.82Onalaska 832.61 11,573,359 348,048 3.0% 418.02 963,061 8.3% 1,156.68Chimacum 821.16 13,798,099 468,008 3.4% 569.94 1,383,865 10.0% 1,685.26San Juan 810.23 12,536,908 280,576 2.2% 346.29 911,466 7.3% 1,124.95Orcas 803.51 11,975,214 350,314 2.9% 435.98 830,570 6.9% 1,033.68Bridgeport 793.97 11,660,592 527,224 4.5% 664.03 848,331 7.3% 1,068.47Chewelah 787.45 10,705,665 151,257 1.4% 192.08 890,853 8.3% 1,131.31Columbia (Walla Walla) 777.50 11,432,818 425,117 3.7% 546.77 1,030,627 9.0% 1,325.57Pioneer 772.01 12,548,499 331,457 2.6% 429.34 641,626 5.1% 831.11Grand Coulee Dam 734.63 11,589,277 184,003 1.6% 250.47 1,102,702 9.5% 1,501.03North Beach 715.97 11,883,884 335,782 2.8% 468.99 1,010,959 8.5% 1,412.01Methow Valley 695.56 10,501,119 243,580 2.3% 350.19 820,809 7.8% 1,180.07Winlock 694.97 10,469,557 451,721 4.3% 649.99 838,035 8.0% 1,205.86
93
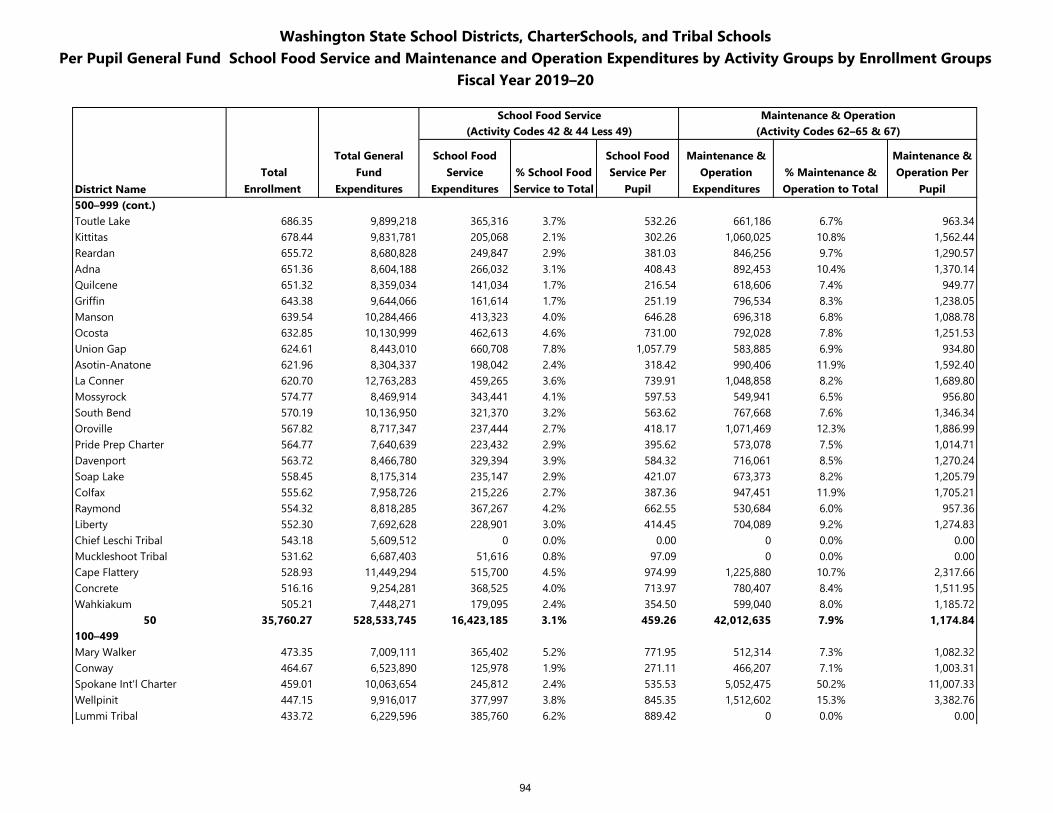
Washington State School Districts, CharterSchools, and Tribal SchoolsPer Pupil General Fund School Food Service and Maintenance and Operation Expenditures by Activity Groups by Enrollment Groups
Fiscal Year 2019–20
School Food Service Maintenance & Operation(Activity Codes 42 & 44 Less 49) (Activity Codes 62–65 & 67)
District Name Total
Enrollment
Total General Fund
Expenditures
School Food Service
Expenditures% School Food Service to Total
School Food Service Per
Pupil
Maintenance & Operation
Expenditures% Maintenance & Operation to Total
Maintenance & Operation Per
Pupil500–999 (cont.)Toutle Lake 686.35 9,899,218 365,316 3.7% 532.26 661,186 6.7% 963.34Kittitas 678.44 9,831,781 205,068 2.1% 302.26 1,060,025 10.8% 1,562.44Reardan 655.72 8,680,828 249,847 2.9% 381.03 846,256 9.7% 1,290.57Adna 651.36 8,604,188 266,032 3.1% 408.43 892,453 10.4% 1,370.14Quilcene 651.32 8,359,034 141,034 1.7% 216.54 618,606 7.4% 949.77Griffin 643.38 9,644,066 161,614 1.7% 251.19 796,534 8.3% 1,238.05Manson 639.54 10,284,466 413,323 4.0% 646.28 696,318 6.8% 1,088.78Ocosta 632.85 10,130,999 462,613 4.6% 731.00 792,028 7.8% 1,251.53Union Gap 624.61 8,443,010 660,708 7.8% 1,057.79 583,885 6.9% 934.80Asotin-Anatone 621.96 8,304,337 198,042 2.4% 318.42 990,406 11.9% 1,592.40La Conner 620.70 12,763,283 459,265 3.6% 739.91 1,048,858 8.2% 1,689.80Mossyrock 574.77 8,469,914 343,441 4.1% 597.53 549,941 6.5% 956.80South Bend 570.19 10,136,950 321,370 3.2% 563.62 767,668 7.6% 1,346.34Oroville 567.82 8,717,347 237,444 2.7% 418.17 1,071,469 12.3% 1,886.99Pride Prep Charter 564.77 7,640,639 223,432 2.9% 395.62 573,078 7.5% 1,014.71Davenport 563.72 8,466,780 329,394 3.9% 584.32 716,061 8.5% 1,270.24Soap Lake 558.45 8,175,314 235,147 2.9% 421.07 673,373 8.2% 1,205.79Colfax 555.62 7,958,726 215,226 2.7% 387.36 947,451 11.9% 1,705.21Raymond 554.32 8,818,285 367,267 4.2% 662.55 530,684 6.0% 957.36Liberty 552.30 7,692,628 228,901 3.0% 414.45 704,089 9.2% 1,274.83Chief Leschi Tribal 543.18 5,609,512 0 0.0% 0.00 0 0.0% 0.00Muckleshoot Tribal 531.62 6,687,403 51,616 0.8% 97.09 0 0.0% 0.00Cape Flattery 528.93 11,449,294 515,700 4.5% 974.99 1,225,880 10.7% 2,317.66Concrete 516.16 9,254,281 368,525 4.0% 713.97 780,407 8.4% 1,511.95Wahkiakum 505.21 7,448,271 179,095 2.4% 354.50 599,040 8.0% 1,185.72
50 35,760.27 528,533,745 16,423,185 3.1% 459.26 42,012,635 7.9% 1,174.84100–499Mary Walker 473.35 7,009,111 365,402 5.2% 771.95 512,314 7.3% 1,082.32Conway 464.67 6,523,890 125,978 1.9% 271.11 466,207 7.1% 1,003.31Spokane Int'l Charter 459.01 10,063,654 245,812 2.4% 535.53 5,052,475 50.2% 11,007.33Wellpinit 447.15 9,916,017 377,997 3.8% 845.35 1,512,602 15.3% 3,382.76Lummi Tribal 433.72 6,229,596 385,760 6.2% 889.42 0 0.0% 0.00
94
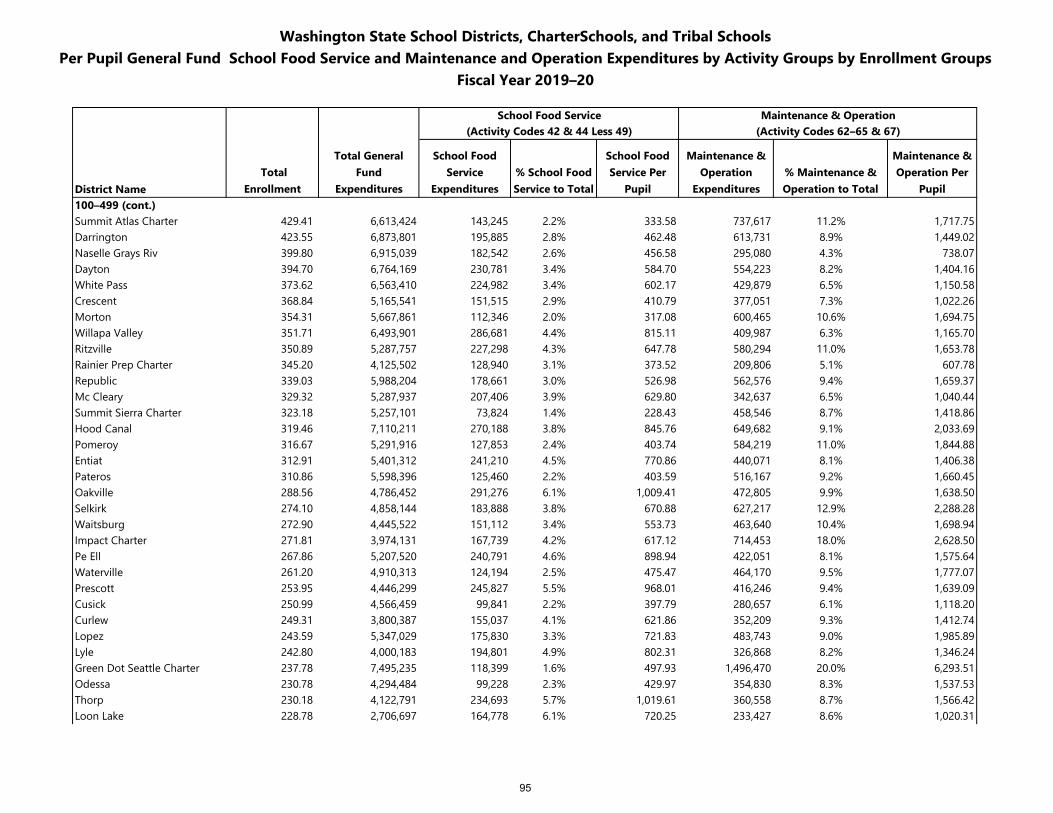
Washington State School Districts, CharterSchools, and Tribal SchoolsPer Pupil General Fund School Food Service and Maintenance and Operation Expenditures by Activity Groups by Enrollment Groups
Fiscal Year 2019–20
School Food Service Maintenance & Operation(Activity Codes 42 & 44 Less 49) (Activity Codes 62–65 & 67)
District Name Total
Enrollment
Total General Fund
Expenditures
School Food Service
Expenditures% School Food Service to Total
School Food Service Per
Pupil
Maintenance & Operation
Expenditures% Maintenance & Operation to Total
Maintenance & Operation Per
Pupil100–499 (cont.)Summit Atlas Charter 429.41 6,613,424 143,245 2.2% 333.58 737,617 11.2% 1,717.75Darrington 423.55 6,873,801 195,885 2.8% 462.48 613,731 8.9% 1,449.02Naselle Grays Riv 399.80 6,915,039 182,542 2.6% 456.58 295,080 4.3% 738.07Dayton 394.70 6,764,169 230,781 3.4% 584.70 554,223 8.2% 1,404.16White Pass 373.62 6,563,410 224,982 3.4% 602.17 429,879 6.5% 1,150.58Crescent 368.84 5,165,541 151,515 2.9% 410.79 377,051 7.3% 1,022.26Morton 354.31 5,667,861 112,346 2.0% 317.08 600,465 10.6% 1,694.75Willapa Valley 351.71 6,493,901 286,681 4.4% 815.11 409,987 6.3% 1,165.70Ritzville 350.89 5,287,757 227,298 4.3% 647.78 580,294 11.0% 1,653.78Rainier Prep Charter 345.20 4,125,502 128,940 3.1% 373.52 209,806 5.1% 607.78Republic 339.03 5,988,204 178,661 3.0% 526.98 562,576 9.4% 1,659.37Mc Cleary 329.32 5,287,937 207,406 3.9% 629.80 342,637 6.5% 1,040.44Summit Sierra Charter 323.18 5,257,101 73,824 1.4% 228.43 458,546 8.7% 1,418.86Hood Canal 319.46 7,110,211 270,188 3.8% 845.76 649,682 9.1% 2,033.69Pomeroy 316.67 5,291,916 127,853 2.4% 403.74 584,219 11.0% 1,844.88Entiat 312.91 5,401,312 241,210 4.5% 770.86 440,071 8.1% 1,406.38Pateros 310.86 5,598,396 125,460 2.2% 403.59 516,167 9.2% 1,660.45Oakville 288.56 4,786,452 291,276 6.1% 1,009.41 472,805 9.9% 1,638.50Selkirk 274.10 4,858,144 183,888 3.8% 670.88 627,217 12.9% 2,288.28Waitsburg 272.90 4,445,522 151,112 3.4% 553.73 463,640 10.4% 1,698.94Impact Charter 271.81 3,974,131 167,739 4.2% 617.12 714,453 18.0% 2,628.50Pe Ell 267.86 5,207,520 240,791 4.6% 898.94 422,051 8.1% 1,575.64Waterville 261.20 4,910,313 124,194 2.5% 475.47 464,170 9.5% 1,777.07Prescott 253.95 4,446,299 245,827 5.5% 968.01 416,246 9.4% 1,639.09Cusick 250.99 4,566,459 99,841 2.2% 397.79 280,657 6.1% 1,118.20Curlew 249.31 3,800,387 155,037 4.1% 621.86 352,209 9.3% 1,412.74Lopez 243.59 5,347,029 175,830 3.3% 721.83 483,743 9.0% 1,985.89Lyle 242.80 4,000,183 194,801 4.9% 802.31 326,868 8.2% 1,346.24Green Dot Seattle Charter 237.78 7,495,235 118,399 1.6% 497.93 1,496,470 20.0% 6,293.51Odessa 230.78 4,294,484 99,228 2.3% 429.97 354,830 8.3% 1,537.53Thorp 230.18 4,122,791 234,693 5.7% 1,019.61 360,558 8.7% 1,566.42Loon Lake 228.78 2,706,697 164,778 6.1% 720.25 233,427 8.6% 1,020.31
95
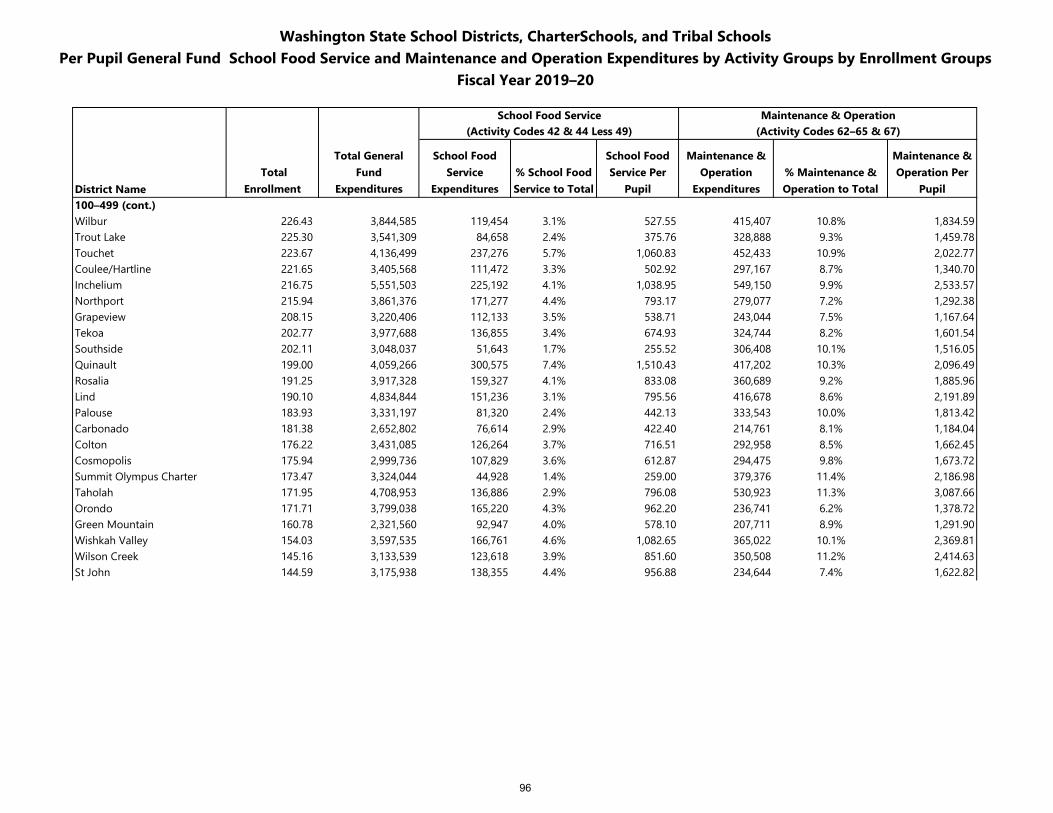
Washington State School Districts, CharterSchools, and Tribal SchoolsPer Pupil General Fund School Food Service and Maintenance and Operation Expenditures by Activity Groups by Enrollment Groups
Fiscal Year 2019–20
School Food Service Maintenance & Operation(Activity Codes 42 & 44 Less 49) (Activity Codes 62–65 & 67)
District Name Total
Enrollment
Total General Fund
Expenditures
School Food Service
Expenditures% School Food Service to Total
School Food Service Per
Pupil
Maintenance & Operation
Expenditures% Maintenance & Operation to Total
Maintenance & Operation Per
Pupil100–499 (cont.)Wilbur 226.43 3,844,585 119,454 3.1% 527.55 415,407 10.8% 1,834.59Trout Lake 225.30 3,541,309 84,658 2.4% 375.76 328,888 9.3% 1,459.78Touchet 223.67 4,136,499 237,276 5.7% 1,060.83 452,433 10.9% 2,022.77Coulee/Hartline 221.65 3,405,568 111,472 3.3% 502.92 297,167 8.7% 1,340.70Inchelium 216.75 5,551,503 225,192 4.1% 1,038.95 549,150 9.9% 2,533.57Northport 215.94 3,861,376 171,277 4.4% 793.17 279,077 7.2% 1,292.38Grapeview 208.15 3,220,406 112,133 3.5% 538.71 243,044 7.5% 1,167.64Tekoa 202.77 3,977,688 136,855 3.4% 674.93 324,744 8.2% 1,601.54Southside 202.11 3,048,037 51,643 1.7% 255.52 306,408 10.1% 1,516.05Quinault 199.00 4,059,266 300,575 7.4% 1,510.43 417,202 10.3% 2,096.49Rosalia 191.25 3,917,328 159,327 4.1% 833.08 360,689 9.2% 1,885.96Lind 190.10 4,834,844 151,236 3.1% 795.56 416,678 8.6% 2,191.89Palouse 183.93 3,331,197 81,320 2.4% 442.13 333,543 10.0% 1,813.42Carbonado 181.38 2,652,802 76,614 2.9% 422.40 214,761 8.1% 1,184.04Colton 176.22 3,431,085 126,264 3.7% 716.51 292,958 8.5% 1,662.45Cosmopolis 175.94 2,999,736 107,829 3.6% 612.87 294,475 9.8% 1,673.72Summit Olympus Charter 173.47 3,324,044 44,928 1.4% 259.00 379,376 11.4% 2,186.98Taholah 171.95 4,708,953 136,886 2.9% 796.08 530,923 11.3% 3,087.66Orondo 171.71 3,799,038 165,220 4.3% 962.20 236,741 6.2% 1,378.72Green Mountain 160.78 2,321,560 92,947 4.0% 578.10 207,711 8.9% 1,291.90Wishkah Valley 154.03 3,597,535 166,761 4.6% 1,082.65 365,022 10.1% 2,369.81Wilson Creek 145.16 3,133,539 123,618 3.9% 851.60 350,508 11.2% 2,414.63St John 144.59 3,175,938 138,355 4.4% 956.88 234,644 7.4% 1,622.82
96
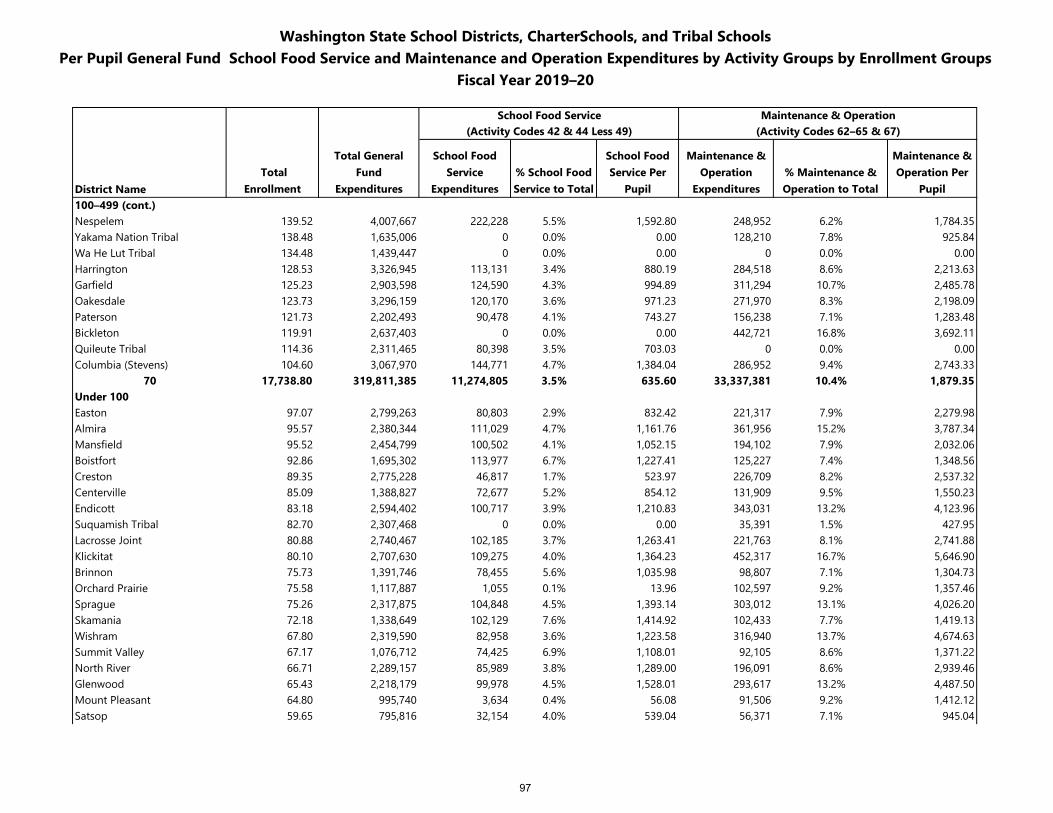
Washington State School Districts, CharterSchools, and Tribal SchoolsPer Pupil General Fund School Food Service and Maintenance and Operation Expenditures by Activity Groups by Enrollment Groups
Fiscal Year 2019–20
School Food Service Maintenance & Operation(Activity Codes 42 & 44 Less 49) (Activity Codes 62–65 & 67)
District Name Total
Enrollment
Total General Fund
Expenditures
School Food Service
Expenditures% School Food Service to Total
School Food Service Per
Pupil
Maintenance & Operation
Expenditures% Maintenance & Operation to Total
Maintenance & Operation Per
Pupil100–499 (cont.)Nespelem 139.52 4,007,667 222,228 5.5% 1,592.80 248,952 6.2% 1,784.35Yakama Nation Tribal 138.48 1,635,006 0 0.0% 0.00 128,210 7.8% 925.84Wa He Lut Tribal 134.48 1,439,447 0 0.0% 0.00 0 0.0% 0.00Harrington 128.53 3,326,945 113,131 3.4% 880.19 284,518 8.6% 2,213.63Garfield 125.23 2,903,598 124,590 4.3% 994.89 311,294 10.7% 2,485.78Oakesdale 123.73 3,296,159 120,170 3.6% 971.23 271,970 8.3% 2,198.09Paterson 121.73 2,202,493 90,478 4.1% 743.27 156,238 7.1% 1,283.48Bickleton 119.91 2,637,403 0 0.0% 0.00 442,721 16.8% 3,692.11Quileute Tribal 114.36 2,311,465 80,398 3.5% 703.03 0 0.0% 0.00Columbia (Stevens) 104.60 3,067,970 144,771 4.7% 1,384.04 286,952 9.4% 2,743.33
70 17,738.80 319,811,385 11,274,805 3.5% 635.60 33,337,381 10.4% 1,879.35Under 100Easton 97.07 2,799,263 80,803 2.9% 832.42 221,317 7.9% 2,279.98Almira 95.57 2,380,344 111,029 4.7% 1,161.76 361,956 15.2% 3,787.34Mansfield 95.52 2,454,799 100,502 4.1% 1,052.15 194,102 7.9% 2,032.06Boistfort 92.86 1,695,302 113,977 6.7% 1,227.41 125,227 7.4% 1,348.56Creston 89.35 2,775,228 46,817 1.7% 523.97 226,709 8.2% 2,537.32Centerville 85.09 1,388,827 72,677 5.2% 854.12 131,909 9.5% 1,550.23Endicott 83.18 2,594,402 100,717 3.9% 1,210.83 343,031 13.2% 4,123.96Suquamish Tribal 82.70 2,307,468 0 0.0% 0.00 35,391 1.5% 427.95Lacrosse Joint 80.88 2,740,467 102,185 3.7% 1,263.41 221,763 8.1% 2,741.88Klickitat 80.10 2,707,630 109,275 4.0% 1,364.23 452,317 16.7% 5,646.90Brinnon 75.73 1,391,746 78,455 5.6% 1,035.98 98,807 7.1% 1,304.73Orchard Prairie 75.58 1,117,887 1,055 0.1% 13.96 102,597 9.2% 1,357.46Sprague 75.26 2,317,875 104,848 4.5% 1,393.14 303,012 13.1% 4,026.20Skamania 72.18 1,338,649 102,129 7.6% 1,414.92 102,433 7.7% 1,419.13Wishram 67.80 2,319,590 82,958 3.6% 1,223.58 316,940 13.7% 4,674.63Summit Valley 67.17 1,076,712 74,425 6.9% 1,108.01 92,105 8.6% 1,371.22North River 66.71 2,289,157 85,989 3.8% 1,289.00 196,091 8.6% 2,939.46Glenwood 65.43 2,218,179 99,978 4.5% 1,528.01 293,617 13.2% 4,487.50Mount Pleasant 64.80 995,740 3,634 0.4% 56.08 91,506 9.2% 1,412.12Satsop 59.65 795,816 32,154 4.0% 539.04 56,371 7.1% 945.04
97
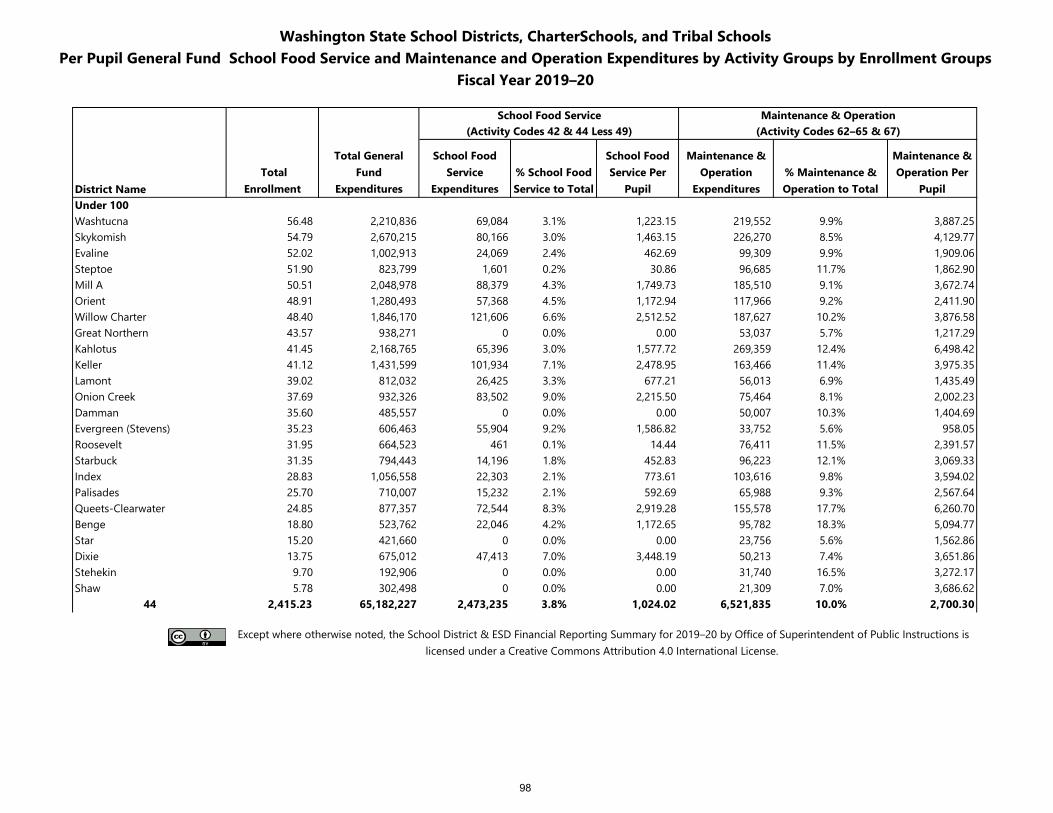
Washington State School Districts, CharterSchools, and Tribal SchoolsPer Pupil General Fund School Food Service and Maintenance and Operation Expenditures by Activity Groups by Enrollment Groups
Fiscal Year 2019–20
School Food Service Maintenance & Operation(Activity Codes 42 & 44 Less 49) (Activity Codes 62–65 & 67)
District Name Total
Enrollment
Total General Fund
Expenditures
School Food Service
Expenditures% School Food Service to Total
School Food Service Per
Pupil
Maintenance & Operation
Expenditures% Maintenance & Operation to Total
Maintenance & Operation Per
PupilUnder 100Washtucna 56.48 2,210,836 69,084 3.1% 1,223.15 219,552 9.9% 3,887.25Skykomish 54.79 2,670,215 80,166 3.0% 1,463.15 226,270 8.5% 4,129.77Evaline 52.02 1,002,913 24,069 2.4% 462.69 99,309 9.9% 1,909.06Steptoe 51.90 823,799 1,601 0.2% 30.86 96,685 11.7% 1,862.90Mill A 50.51 2,048,978 88,379 4.3% 1,749.73 185,510 9.1% 3,672.74Orient 48.91 1,280,493 57,368 4.5% 1,172.94 117,966 9.2% 2,411.90Willow Charter 48.40 1,846,170 121,606 6.6% 2,512.52 187,627 10.2% 3,876.58Great Northern 43.57 938,271 0 0.0% 0.00 53,037 5.7% 1,217.29Kahlotus 41.45 2,168,765 65,396 3.0% 1,577.72 269,359 12.4% 6,498.42Keller 41.12 1,431,599 101,934 7.1% 2,478.95 163,466 11.4% 3,975.35Lamont 39.02 812,032 26,425 3.3% 677.21 56,013 6.9% 1,435.49Onion Creek 37.69 932,326 83,502 9.0% 2,215.50 75,464 8.1% 2,002.23Damman 35.60 485,557 0 0.0% 0.00 50,007 10.3% 1,404.69Evergreen (Stevens) 35.23 606,463 55,904 9.2% 1,586.82 33,752 5.6% 958.05Roosevelt 31.95 664,523 461 0.1% 14.44 76,411 11.5% 2,391.57Starbuck 31.35 794,443 14,196 1.8% 452.83 96,223 12.1% 3,069.33Index 28.83 1,056,558 22,303 2.1% 773.61 103,616 9.8% 3,594.02Palisades 25.70 710,007 15,232 2.1% 592.69 65,988 9.3% 2,567.64Queets-Clearwater 24.85 877,357 72,544 8.3% 2,919.28 155,578 17.7% 6,260.70Benge 18.80 523,762 22,046 4.2% 1,172.65 95,782 18.3% 5,094.77Star 15.20 421,660 0 0.0% 0.00 23,756 5.6% 1,562.86Dixie 13.75 675,012 47,413 7.0% 3,448.19 50,213 7.4% 3,651.86Stehekin 9.70 192,906 0 0.0% 0.00 31,740 16.5% 3,272.17Shaw 5.78 302,498 0 0.0% 0.00 21,309 7.0% 3,686.62
44 2,415.23 65,182,227 2,473,235 3.8% 1,024.02 6,521,835 10.0% 2,700.30
Except where otherwise noted, the School District & ESD Financial Reporting Summary for 2019–20 by Office of Superintendent of Public Instructions is licensed under a Creative Commons Attribution 4.0 International License.
98
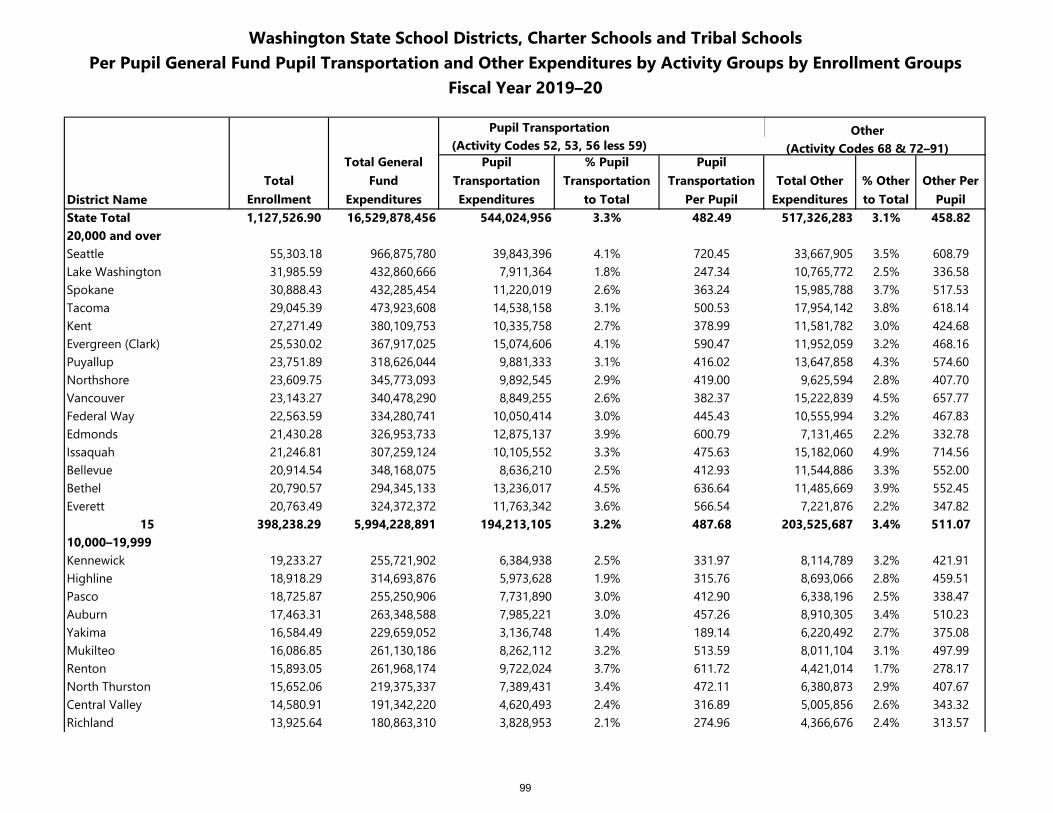
Washington State School Districts, Charter Schools and Tribal SchoolsPer Pupil General Fund Pupil Transportation and Other Expenditures by Activity Groups by Enrollment Groups
Fiscal Year 2019–20
Pupil Transportation Other(Activity Codes 52, 53, 56 less 59) (Activity Codes 68 & 72–91)
District NameTotal
Enrollment
Total General Fund
Expenditures
Pupil Transportation Expenditures
% Pupil Transportation
to Total
Pupil Transportation
Per PupilTotal Other
Expenditures% Other to Total
Other Per Pupil
State Total 1,127,526.90 16,529,878,456 544,024,956 3.3% 482.49 517,326,283 3.1% 458.8220,000 and overSeattle 55,303.18 966,875,780 39,843,396 4.1% 720.45 33,667,905 3.5% 608.79Lake Washington 31,985.59 432,860,666 7,911,364 1.8% 247.34 10,765,772 2.5% 336.58Spokane 30,888.43 432,285,454 11,220,019 2.6% 363.24 15,985,788 3.7% 517.53Tacoma 29,045.39 473,923,608 14,538,158 3.1% 500.53 17,954,142 3.8% 618.14Kent 27,271.49 380,109,753 10,335,758 2.7% 378.99 11,581,782 3.0% 424.68Evergreen (Clark) 25,530.02 367,917,025 15,074,606 4.1% 590.47 11,952,059 3.2% 468.16Puyallup 23,751.89 318,626,044 9,881,333 3.1% 416.02 13,647,858 4.3% 574.60Northshore 23,609.75 345,773,093 9,892,545 2.9% 419.00 9,625,594 2.8% 407.70Vancouver 23,143.27 340,478,290 8,849,255 2.6% 382.37 15,222,839 4.5% 657.77Federal Way 22,563.59 334,280,741 10,050,414 3.0% 445.43 10,555,994 3.2% 467.83Edmonds 21,430.28 326,953,733 12,875,137 3.9% 600.79 7,131,465 2.2% 332.78Issaquah 21,246.81 307,259,124 10,105,552 3.3% 475.63 15,182,060 4.9% 714.56Bellevue 20,914.54 348,168,075 8,636,210 2.5% 412.93 11,544,886 3.3% 552.00Bethel 20,790.57 294,345,133 13,236,017 4.5% 636.64 11,485,669 3.9% 552.45Everett 20,763.49 324,372,372 11,763,342 3.6% 566.54 7,221,876 2.2% 347.82
15 398,238.29 5,994,228,891 194,213,105 3.2% 487.68 203,525,687 3.4% 511.0710,000–19,999Kennewick 19,233.27 255,721,902 6,384,938 2.5% 331.97 8,114,789 3.2% 421.91Highline 18,918.29 314,693,876 5,973,628 1.9% 315.76 8,693,066 2.8% 459.51Pasco 18,725.87 255,250,906 7,731,890 3.0% 412.90 6,338,196 2.5% 338.47Auburn 17,463.31 263,348,588 7,985,221 3.0% 457.26 8,910,305 3.4% 510.23Yakima 16,584.49 229,659,052 3,136,748 1.4% 189.14 6,220,492 2.7% 375.08Mukilteo 16,086.85 261,130,186 8,262,112 3.2% 513.59 8,011,104 3.1% 497.99Renton 15,893.05 261,968,174 9,722,024 3.7% 611.72 4,421,014 1.7% 278.17North Thurston 15,652.06 219,375,337 7,389,431 3.4% 472.11 6,380,873 2.9% 407.67Central Valley 14,580.91 191,342,220 4,620,493 2.4% 316.89 5,005,856 2.6% 343.32Richland 13,925.64 180,863,310 3,828,953 2.1% 274.96 4,366,676 2.4% 313.57
99
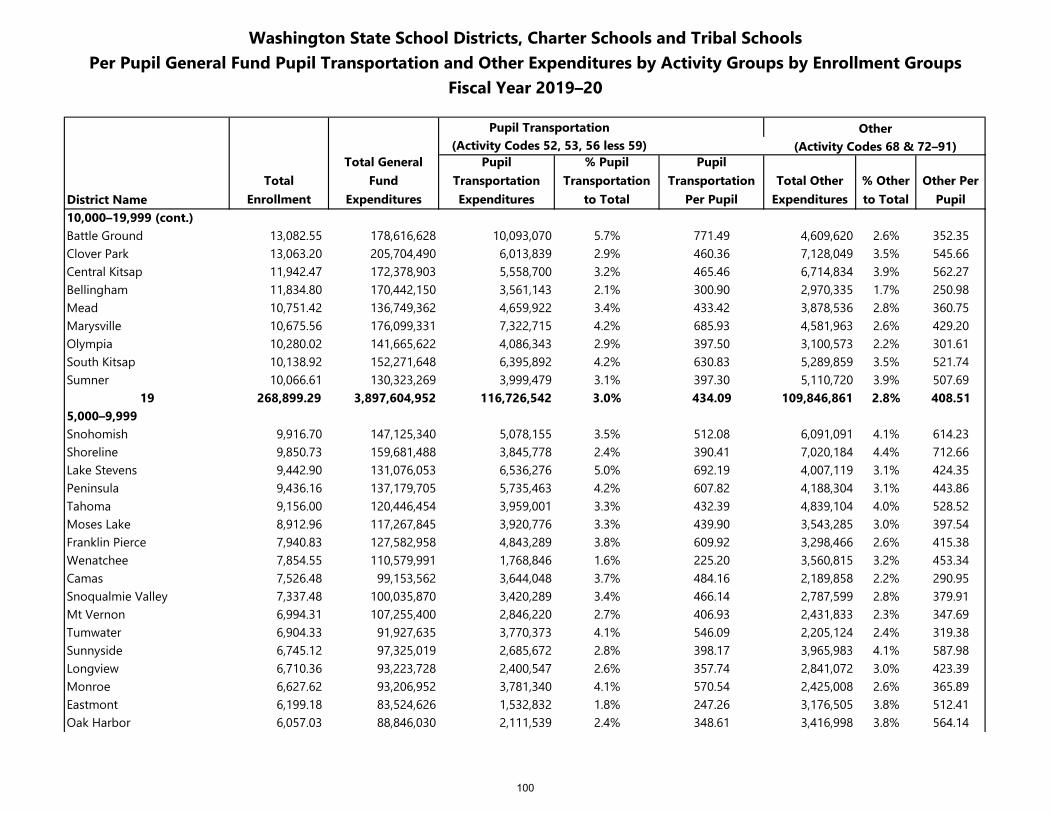
Washington State School Districts, Charter Schools and Tribal SchoolsPer Pupil General Fund Pupil Transportation and Other Expenditures by Activity Groups by Enrollment Groups
Fiscal Year 2019–20
Pupil Transportation Other(Activity Codes 52, 53, 56 less 59) (Activity Codes 68 & 72–91)
District NameTotal
Enrollment
Total General Fund
Expenditures
Pupil Transportation Expenditures
% Pupil Transportation
to Total
Pupil Transportation
Per PupilTotal Other
Expenditures% Other to Total
Other Per Pupil
10,000–19,999 (cont.)Battle Ground 13,082.55 178,616,628 10,093,070 5.7% 771.49 4,609,620 2.6% 352.35Clover Park 13,063.20 205,704,490 6,013,839 2.9% 460.36 7,128,049 3.5% 545.66Central Kitsap 11,942.47 172,378,903 5,558,700 3.2% 465.46 6,714,834 3.9% 562.27Bellingham 11,834.80 170,442,150 3,561,143 2.1% 300.90 2,970,335 1.7% 250.98Mead 10,751.42 136,749,362 4,659,922 3.4% 433.42 3,878,536 2.8% 360.75Marysville 10,675.56 176,099,331 7,322,715 4.2% 685.93 4,581,963 2.6% 429.20Olympia 10,280.02 141,665,622 4,086,343 2.9% 397.50 3,100,573 2.2% 301.61South Kitsap 10,138.92 152,271,648 6,395,892 4.2% 630.83 5,289,859 3.5% 521.74Sumner 10,066.61 130,323,269 3,999,479 3.1% 397.30 5,110,720 3.9% 507.69
19 268,899.29 3,897,604,952 116,726,542 3.0% 434.09 109,846,861 2.8% 408.515,000–9,999Snohomish 9,916.70 147,125,340 5,078,155 3.5% 512.08 6,091,091 4.1% 614.23Shoreline 9,850.73 159,681,488 3,845,778 2.4% 390.41 7,020,184 4.4% 712.66Lake Stevens 9,442.90 131,076,053 6,536,276 5.0% 692.19 4,007,119 3.1% 424.35Peninsula 9,436.16 137,179,705 5,735,463 4.2% 607.82 4,188,304 3.1% 443.86Tahoma 9,156.00 120,446,454 3,959,001 3.3% 432.39 4,839,104 4.0% 528.52Moses Lake 8,912.96 117,267,845 3,920,776 3.3% 439.90 3,543,285 3.0% 397.54Franklin Pierce 7,940.83 127,582,958 4,843,289 3.8% 609.92 3,298,466 2.6% 415.38Wenatchee 7,854.55 110,579,991 1,768,846 1.6% 225.20 3,560,815 3.2% 453.34Camas 7,526.48 99,153,562 3,644,048 3.7% 484.16 2,189,858 2.2% 290.95Snoqualmie Valley 7,337.48 100,035,870 3,420,289 3.4% 466.14 2,787,599 2.8% 379.91Mt Vernon 6,994.31 107,255,400 2,846,220 2.7% 406.93 2,431,833 2.3% 347.69Tumwater 6,904.33 91,927,635 3,770,373 4.1% 546.09 2,205,124 2.4% 319.38Sunnyside 6,745.12 97,325,019 2,685,672 2.8% 398.17 3,965,983 4.1% 587.98Longview 6,710.36 93,223,728 2,400,547 2.6% 357.74 2,841,072 3.0% 423.39Monroe 6,627.62 93,206,952 3,781,340 4.1% 570.54 2,425,008 2.6% 365.89Eastmont 6,199.18 83,524,626 1,532,832 1.8% 247.26 3,176,505 3.8% 512.41Oak Harbor 6,057.03 88,846,030 2,111,539 2.4% 348.61 3,416,998 3.8% 564.14
100
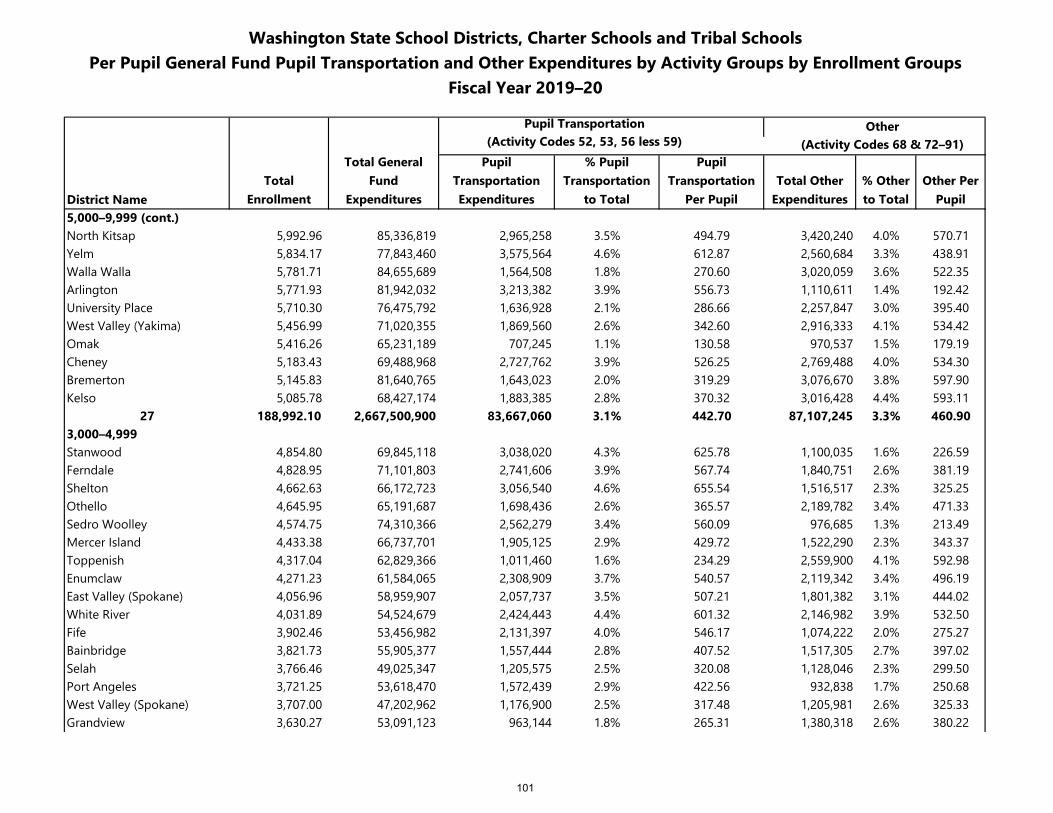
Washington State School Districts, Charter Schools and Tribal SchoolsPer Pupil General Fund Pupil Transportation and Other Expenditures by Activity Groups by Enrollment Groups
Fiscal Year 2019–20
Pupil Transportation Other(Activity Codes 52, 53, 56 less 59) (Activity Codes 68 & 72–91)
District NameTotal
Enrollment
Total General Fund
Expenditures
Pupil Transportation Expenditures
% Pupil Transportation
to Total
Pupil Transportation
Per PupilTotal Other
Expenditures% Other to Total
Other Per Pupil
5,000–9,999 (cont.)North Kitsap 5,992.96 85,336,819 2,965,258 3.5% 494.79 3,420,240 4.0% 570.71Yelm 5,834.17 77,843,460 3,575,564 4.6% 612.87 2,560,684 3.3% 438.91Walla Walla 5,781.71 84,655,689 1,564,508 1.8% 270.60 3,020,059 3.6% 522.35Arlington 5,771.93 81,942,032 3,213,382 3.9% 556.73 1,110,611 1.4% 192.42University Place 5,710.30 76,475,792 1,636,928 2.1% 286.66 2,257,847 3.0% 395.40West Valley (Yakima) 5,456.99 71,020,355 1,869,560 2.6% 342.60 2,916,333 4.1% 534.42Omak 5,416.26 65,231,189 707,245 1.1% 130.58 970,537 1.5% 179.19Cheney 5,183.43 69,488,968 2,727,762 3.9% 526.25 2,769,488 4.0% 534.30Bremerton 5,145.83 81,640,765 1,643,023 2.0% 319.29 3,076,670 3.8% 597.90Kelso 5,085.78 68,427,174 1,883,385 2.8% 370.32 3,016,428 4.4% 593.11
27 188,992.10 2,667,500,900 83,667,060 3.1% 442.70 87,107,245 3.3% 460.903,000–4,999Stanwood 4,854.80 69,845,118 3,038,020 4.3% 625.78 1,100,035 1.6% 226.59Ferndale 4,828.95 71,101,803 2,741,606 3.9% 567.74 1,840,751 2.6% 381.19Shelton 4,662.63 66,172,723 3,056,540 4.6% 655.54 1,516,517 2.3% 325.25Othello 4,645.95 65,191,687 1,698,436 2.6% 365.57 2,189,782 3.4% 471.33Sedro Woolley 4,574.75 74,310,366 2,562,279 3.4% 560.09 976,685 1.3% 213.49Mercer Island 4,433.38 66,737,701 1,905,125 2.9% 429.72 1,522,290 2.3% 343.37Toppenish 4,317.04 62,829,366 1,011,460 1.6% 234.29 2,559,900 4.1% 592.98Enumclaw 4,271.23 61,584,065 2,308,909 3.7% 540.57 2,119,342 3.4% 496.19East Valley (Spokane) 4,056.96 58,959,907 2,057,737 3.5% 507.21 1,801,382 3.1% 444.02White River 4,031.89 54,524,679 2,424,443 4.4% 601.32 2,146,982 3.9% 532.50Fife 3,902.46 53,456,982 2,131,397 4.0% 546.17 1,074,222 2.0% 275.27Bainbridge 3,821.73 55,905,377 1,557,444 2.8% 407.52 1,517,305 2.7% 397.02Selah 3,766.46 49,025,347 1,205,575 2.5% 320.08 1,128,046 2.3% 299.50Port Angeles 3,721.25 53,618,470 1,572,439 2.9% 422.56 932,838 1.7% 250.68West Valley (Spokane) 3,707.00 47,202,962 1,176,900 2.5% 317.48 1,205,981 2.6% 325.33Grandview 3,630.27 53,091,123 963,144 1.8% 265.31 1,380,318 2.6% 380.22
101
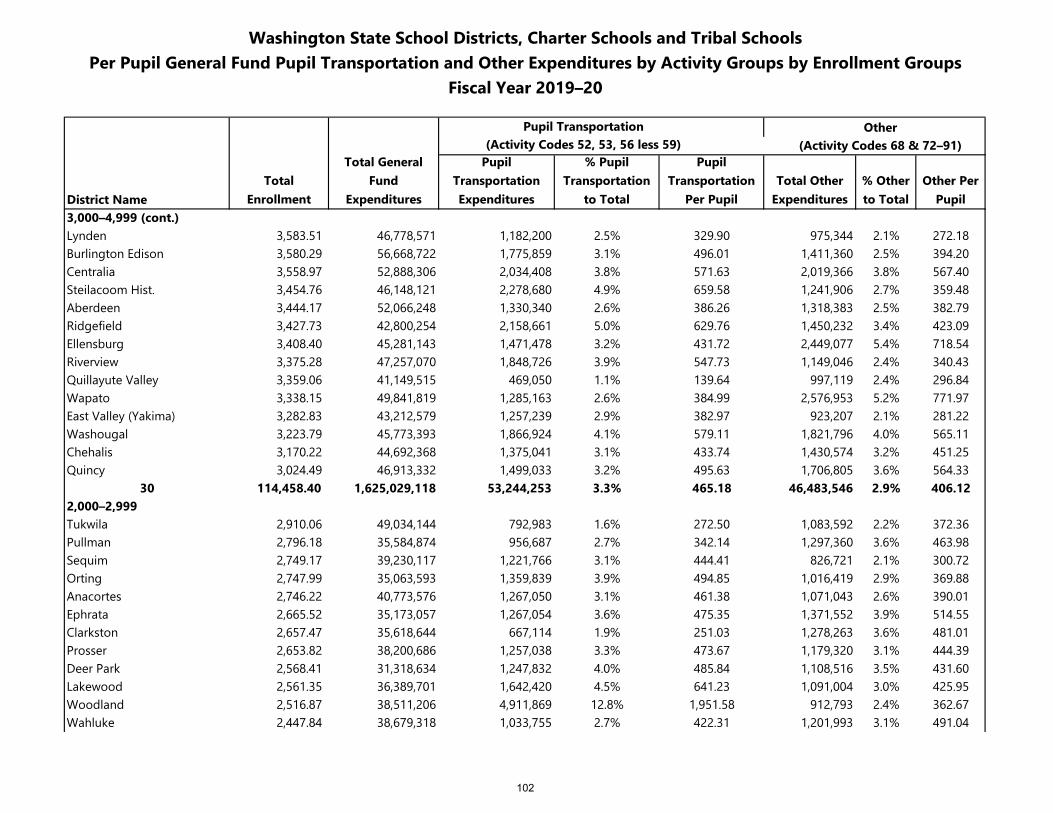
Washington State School Districts, Charter Schools and Tribal SchoolsPer Pupil General Fund Pupil Transportation and Other Expenditures by Activity Groups by Enrollment Groups
Fiscal Year 2019–20
Pupil Transportation Other(Activity Codes 52, 53, 56 less 59) (Activity Codes 68 & 72–91)
District NameTotal
Enrollment
Total General Fund
Expenditures
Pupil Transportation Expenditures
% Pupil Transportation
to Total
Pupil Transportation
Per PupilTotal Other
Expenditures% Other to Total
Other Per Pupil
3,000–4,999 (cont.)Lynden 3,583.51 46,778,571 1,182,200 2.5% 329.90 975,344 2.1% 272.18Burlington Edison 3,580.29 56,668,722 1,775,859 3.1% 496.01 1,411,360 2.5% 394.20Centralia 3,558.97 52,888,306 2,034,408 3.8% 571.63 2,019,366 3.8% 567.40Steilacoom Hist. 3,454.76 46,148,121 2,278,680 4.9% 659.58 1,241,906 2.7% 359.48Aberdeen 3,444.17 52,066,248 1,330,340 2.6% 386.26 1,318,383 2.5% 382.79Ridgefield 3,427.73 42,800,254 2,158,661 5.0% 629.76 1,450,232 3.4% 423.09Ellensburg 3,408.40 45,281,143 1,471,478 3.2% 431.72 2,449,077 5.4% 718.54Riverview 3,375.28 47,257,070 1,848,726 3.9% 547.73 1,149,046 2.4% 340.43Quillayute Valley 3,359.06 41,149,515 469,050 1.1% 139.64 997,119 2.4% 296.84Wapato 3,338.15 49,841,819 1,285,163 2.6% 384.99 2,576,953 5.2% 771.97East Valley (Yakima) 3,282.83 43,212,579 1,257,239 2.9% 382.97 923,207 2.1% 281.22Washougal 3,223.79 45,773,393 1,866,924 4.1% 579.11 1,821,796 4.0% 565.11Chehalis 3,170.22 44,692,368 1,375,041 3.1% 433.74 1,430,574 3.2% 451.25Quincy 3,024.49 46,913,332 1,499,033 3.2% 495.63 1,706,805 3.6% 564.33
30 114,458.40 1,625,029,118 53,244,253 3.3% 465.18 46,483,546 2.9% 406.122,000–2,999Tukwila 2,910.06 49,034,144 792,983 1.6% 272.50 1,083,592 2.2% 372.36Pullman 2,796.18 35,584,874 956,687 2.7% 342.14 1,297,360 3.6% 463.98Sequim 2,749.17 39,230,117 1,221,766 3.1% 444.41 826,721 2.1% 300.72Orting 2,747.99 35,063,593 1,359,839 3.9% 494.85 1,016,419 2.9% 369.88Anacortes 2,746.22 40,773,576 1,267,050 3.1% 461.38 1,071,043 2.6% 390.01Ephrata 2,665.52 35,173,057 1,267,054 3.6% 475.35 1,371,552 3.9% 514.55Clarkston 2,657.47 35,618,644 667,114 1.9% 251.03 1,278,263 3.6% 481.01Prosser 2,653.82 38,200,686 1,257,038 3.3% 473.67 1,179,320 3.1% 444.39Deer Park 2,568.41 31,318,634 1,247,832 4.0% 485.84 1,108,516 3.5% 431.60Lakewood 2,561.35 36,389,701 1,642,420 4.5% 641.23 1,091,004 3.0% 425.95Woodland 2,516.87 38,511,206 4,911,869 12.8% 1,951.58 912,793 2.4% 362.67Wahluke 2,447.84 38,679,318 1,033,755 2.7% 422.31 1,201,993 3.1% 491.04
102
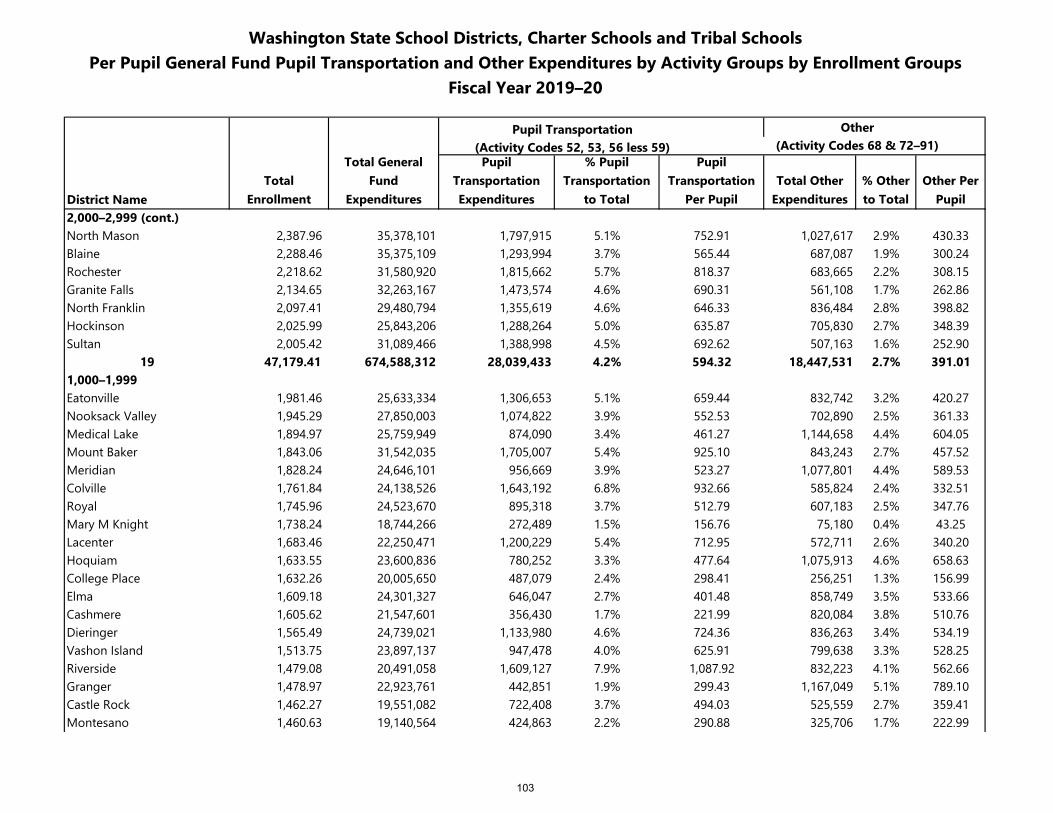
Washington State School Districts, Charter Schools and Tribal SchoolsPer Pupil General Fund Pupil Transportation and Other Expenditures by Activity Groups by Enrollment Groups
Fiscal Year 2019–20
Pupil Transportation Other(Activity Codes 52, 53, 56 less 59) (Activity Codes 68 & 72–91)
District NameTotal
Enrollment
Total General Fund
Expenditures
Pupil Transportation Expenditures
% Pupil Transportation
to Total
Pupil Transportation
Per PupilTotal Other
Expenditures% Other to Total
Other Per Pupil
2,000–2,999 (cont.)North Mason 2,387.96 35,378,101 1,797,915 5.1% 752.91 1,027,617 2.9% 430.33Blaine 2,288.46 35,375,109 1,293,994 3.7% 565.44 687,087 1.9% 300.24Rochester 2,218.62 31,580,920 1,815,662 5.7% 818.37 683,665 2.2% 308.15Granite Falls 2,134.65 32,263,167 1,473,574 4.6% 690.31 561,108 1.7% 262.86North Franklin 2,097.41 29,480,794 1,355,619 4.6% 646.33 836,484 2.8% 398.82Hockinson 2,025.99 25,843,206 1,288,264 5.0% 635.87 705,830 2.7% 348.39Sultan 2,005.42 31,089,466 1,388,998 4.5% 692.62 507,163 1.6% 252.90
19 47,179.41 674,588,312 28,039,433 4.2% 594.32 18,447,531 2.7% 391.011,000–1,999Eatonville 1,981.46 25,633,334 1,306,653 5.1% 659.44 832,742 3.2% 420.27Nooksack Valley 1,945.29 27,850,003 1,074,822 3.9% 552.53 702,890 2.5% 361.33Medical Lake 1,894.97 25,759,949 874,090 3.4% 461.27 1,144,658 4.4% 604.05Mount Baker 1,843.06 31,542,035 1,705,007 5.4% 925.10 843,243 2.7% 457.52Meridian 1,828.24 24,646,101 956,669 3.9% 523.27 1,077,801 4.4% 589.53Colville 1,761.84 24,138,526 1,643,192 6.8% 932.66 585,824 2.4% 332.51Royal 1,745.96 24,523,670 895,318 3.7% 512.79 607,183 2.5% 347.76Mary M Knight 1,738.24 18,744,266 272,489 1.5% 156.76 75,180 0.4% 43.25Lacenter 1,683.46 22,250,471 1,200,229 5.4% 712.95 572,711 2.6% 340.20Hoquiam 1,633.55 23,600,836 780,252 3.3% 477.64 1,075,913 4.6% 658.63College Place 1,632.26 20,005,650 487,079 2.4% 298.41 256,251 1.3% 156.99Elma 1,609.18 24,301,327 646,047 2.7% 401.48 858,749 3.5% 533.66Cashmere 1,605.62 21,547,601 356,430 1.7% 221.99 820,084 3.8% 510.76Dieringer 1,565.49 24,739,021 1,133,980 4.6% 724.36 836,263 3.4% 534.19Vashon Island 1,513.75 23,897,137 947,478 4.0% 625.91 799,638 3.3% 528.25Riverside 1,479.08 20,491,058 1,609,127 7.9% 1,087.92 832,223 4.1% 562.66Granger 1,478.97 22,923,761 442,851 1.9% 299.43 1,167,049 5.1% 789.10Castle Rock 1,462.27 19,551,082 722,408 3.7% 494.03 525,559 2.7% 359.41Montesano 1,460.63 19,140,564 424,863 2.2% 290.88 325,706 1.7% 222.99
103
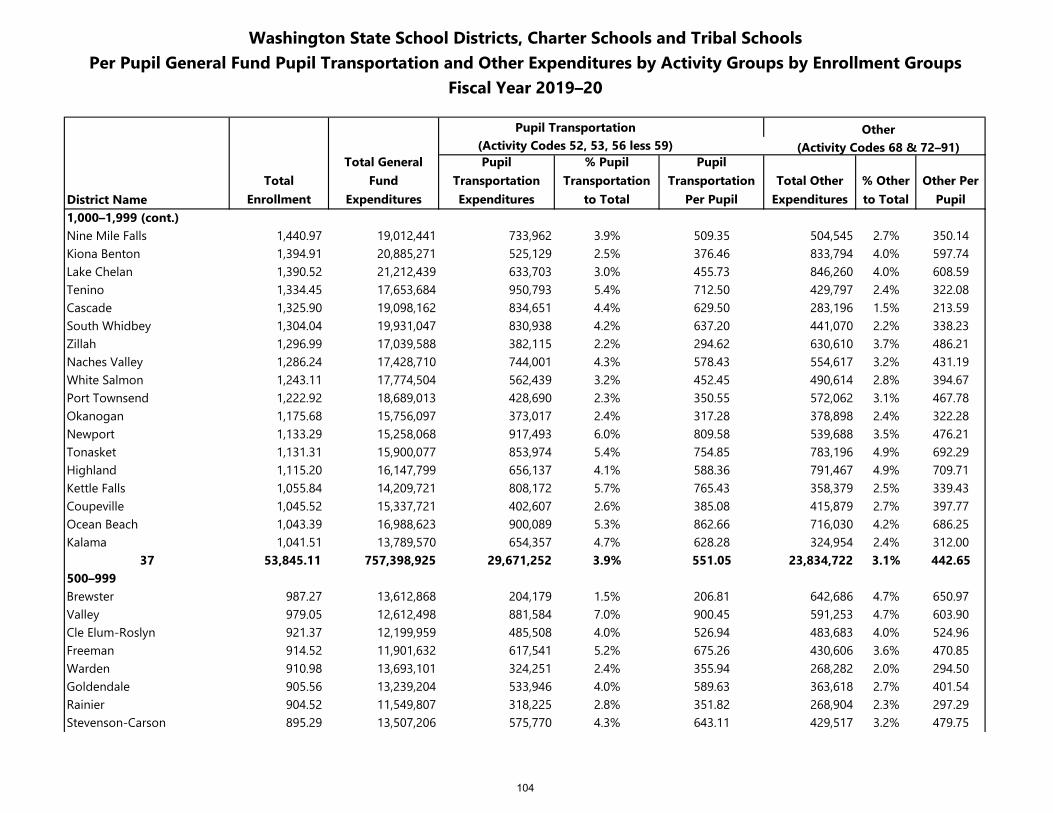
Washington State School Districts, Charter Schools and Tribal SchoolsPer Pupil General Fund Pupil Transportation and Other Expenditures by Activity Groups by Enrollment Groups
Fiscal Year 2019–20
Pupil Transportation Other(Activity Codes 52, 53, 56 less 59) (Activity Codes 68 & 72–91)
District NameTotal
Enrollment
Total General Fund
Expenditures
Pupil Transportation Expenditures
% Pupil Transportation
to Total
Pupil Transportation
Per PupilTotal Other
Expenditures% Other to Total
Other Per Pupil
1,000–1,999 (cont.)Nine Mile Falls 1,440.97 19,012,441 733,962 3.9% 509.35 504,545 2.7% 350.14Kiona Benton 1,394.91 20,885,271 525,129 2.5% 376.46 833,794 4.0% 597.74Lake Chelan 1,390.52 21,212,439 633,703 3.0% 455.73 846,260 4.0% 608.59Tenino 1,334.45 17,653,684 950,793 5.4% 712.50 429,797 2.4% 322.08Cascade 1,325.90 19,098,162 834,651 4.4% 629.50 283,196 1.5% 213.59South Whidbey 1,304.04 19,931,047 830,938 4.2% 637.20 441,070 2.2% 338.23Zillah 1,296.99 17,039,588 382,115 2.2% 294.62 630,610 3.7% 486.21Naches Valley 1,286.24 17,428,710 744,001 4.3% 578.43 554,617 3.2% 431.19White Salmon 1,243.11 17,774,504 562,439 3.2% 452.45 490,614 2.8% 394.67Port Townsend 1,222.92 18,689,013 428,690 2.3% 350.55 572,062 3.1% 467.78Okanogan 1,175.68 15,756,097 373,017 2.4% 317.28 378,898 2.4% 322.28Newport 1,133.29 15,258,068 917,493 6.0% 809.58 539,688 3.5% 476.21Tonasket 1,131.31 15,900,077 853,974 5.4% 754.85 783,196 4.9% 692.29Highland 1,115.20 16,147,799 656,137 4.1% 588.36 791,467 4.9% 709.71Kettle Falls 1,055.84 14,209,721 808,172 5.7% 765.43 358,379 2.5% 339.43Coupeville 1,045.52 15,337,721 402,607 2.6% 385.08 415,879 2.7% 397.77Ocean Beach 1,043.39 16,988,623 900,089 5.3% 862.66 716,030 4.2% 686.25Kalama 1,041.51 13,789,570 654,357 4.7% 628.28 324,954 2.4% 312.00
37 53,845.11 757,398,925 29,671,252 3.9% 551.05 23,834,722 3.1% 442.65500–999Brewster 987.27 13,612,868 204,179 1.5% 206.81 642,686 4.7% 650.97Valley 979.05 12,612,498 881,584 7.0% 900.45 591,253 4.7% 603.90Cle Elum-Roslyn 921.37 12,199,959 485,508 4.0% 526.94 483,683 4.0% 524.96Freeman 914.52 11,901,632 617,541 5.2% 675.26 430,606 3.6% 470.85Warden 910.98 13,693,101 324,251 2.4% 355.94 268,282 2.0% 294.50Goldendale 905.56 13,239,204 533,946 4.0% 589.63 363,618 2.7% 401.54Rainier 904.52 11,549,807 318,225 2.8% 351.82 268,904 2.3% 297.29Stevenson-Carson 895.29 13,507,206 575,770 4.3% 643.11 429,517 3.2% 479.75
104
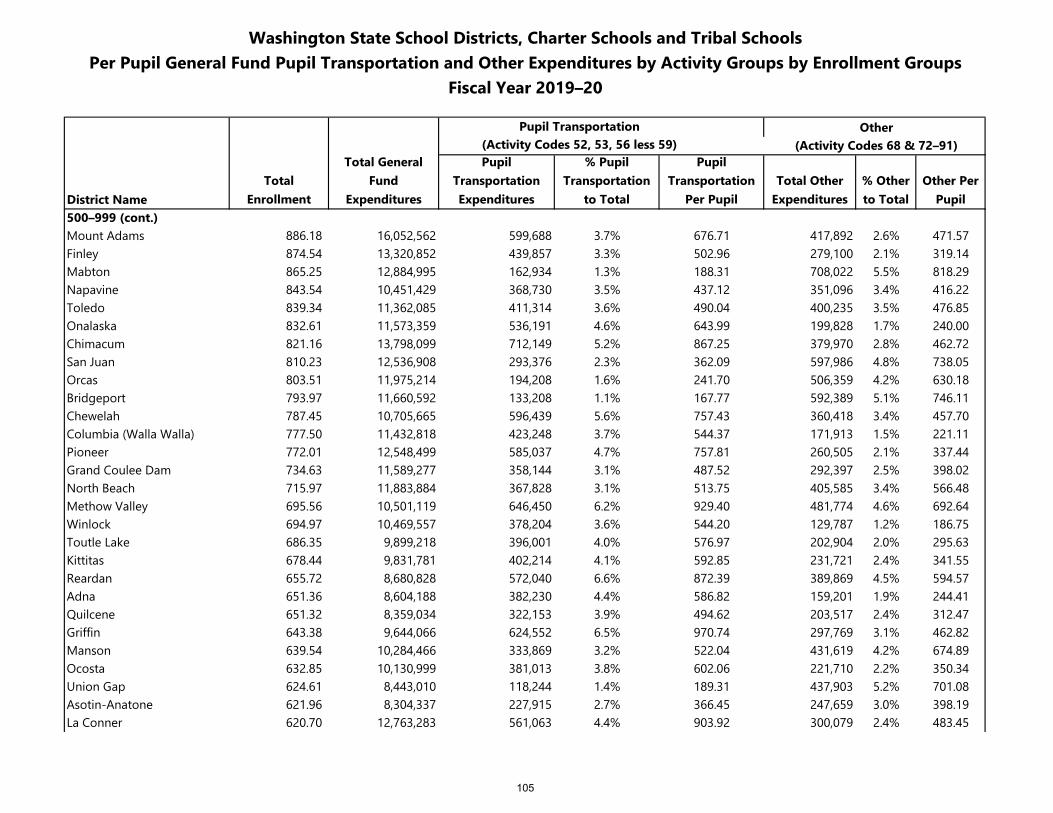
Washington State School Districts, Charter Schools and Tribal SchoolsPer Pupil General Fund Pupil Transportation and Other Expenditures by Activity Groups by Enrollment Groups
Fiscal Year 2019–20
Pupil Transportation Other(Activity Codes 52, 53, 56 less 59) (Activity Codes 68 & 72–91)
District NameTotal
Enrollment
Total General Fund
Expenditures
Pupil Transportation Expenditures
% Pupil Transportation
to Total
Pupil Transportation
Per PupilTotal Other
Expenditures% Other to Total
Other Per Pupil
500–999 (cont.)Mount Adams 886.18 16,052,562 599,688 3.7% 676.71 417,892 2.6% 471.57Finley 874.54 13,320,852 439,857 3.3% 502.96 279,100 2.1% 319.14Mabton 865.25 12,884,995 162,934 1.3% 188.31 708,022 5.5% 818.29Napavine 843.54 10,451,429 368,730 3.5% 437.12 351,096 3.4% 416.22Toledo 839.34 11,362,085 411,314 3.6% 490.04 400,235 3.5% 476.85Onalaska 832.61 11,573,359 536,191 4.6% 643.99 199,828 1.7% 240.00Chimacum 821.16 13,798,099 712,149 5.2% 867.25 379,970 2.8% 462.72San Juan 810.23 12,536,908 293,376 2.3% 362.09 597,986 4.8% 738.05Orcas 803.51 11,975,214 194,208 1.6% 241.70 506,359 4.2% 630.18Bridgeport 793.97 11,660,592 133,208 1.1% 167.77 592,389 5.1% 746.11Chewelah 787.45 10,705,665 596,439 5.6% 757.43 360,418 3.4% 457.70Columbia (Walla Walla) 777.50 11,432,818 423,248 3.7% 544.37 171,913 1.5% 221.11Pioneer 772.01 12,548,499 585,037 4.7% 757.81 260,505 2.1% 337.44Grand Coulee Dam 734.63 11,589,277 358,144 3.1% 487.52 292,397 2.5% 398.02North Beach 715.97 11,883,884 367,828 3.1% 513.75 405,585 3.4% 566.48Methow Valley 695.56 10,501,119 646,450 6.2% 929.40 481,774 4.6% 692.64Winlock 694.97 10,469,557 378,204 3.6% 544.20 129,787 1.2% 186.75Toutle Lake 686.35 9,899,218 396,001 4.0% 576.97 202,904 2.0% 295.63Kittitas 678.44 9,831,781 402,214 4.1% 592.85 231,721 2.4% 341.55Reardan 655.72 8,680,828 572,040 6.6% 872.39 389,869 4.5% 594.57Adna 651.36 8,604,188 382,230 4.4% 586.82 159,201 1.9% 244.41Quilcene 651.32 8,359,034 322,153 3.9% 494.62 203,517 2.4% 312.47Griffin 643.38 9,644,066 624,552 6.5% 970.74 297,769 3.1% 462.82Manson 639.54 10,284,466 333,869 3.2% 522.04 431,619 4.2% 674.89Ocosta 632.85 10,130,999 381,013 3.8% 602.06 221,710 2.2% 350.34Union Gap 624.61 8,443,010 118,244 1.4% 189.31 437,903 5.2% 701.08Asotin-Anatone 621.96 8,304,337 227,915 2.7% 366.45 247,659 3.0% 398.19La Conner 620.70 12,763,283 561,063 4.4% 903.92 300,079 2.4% 483.45
105
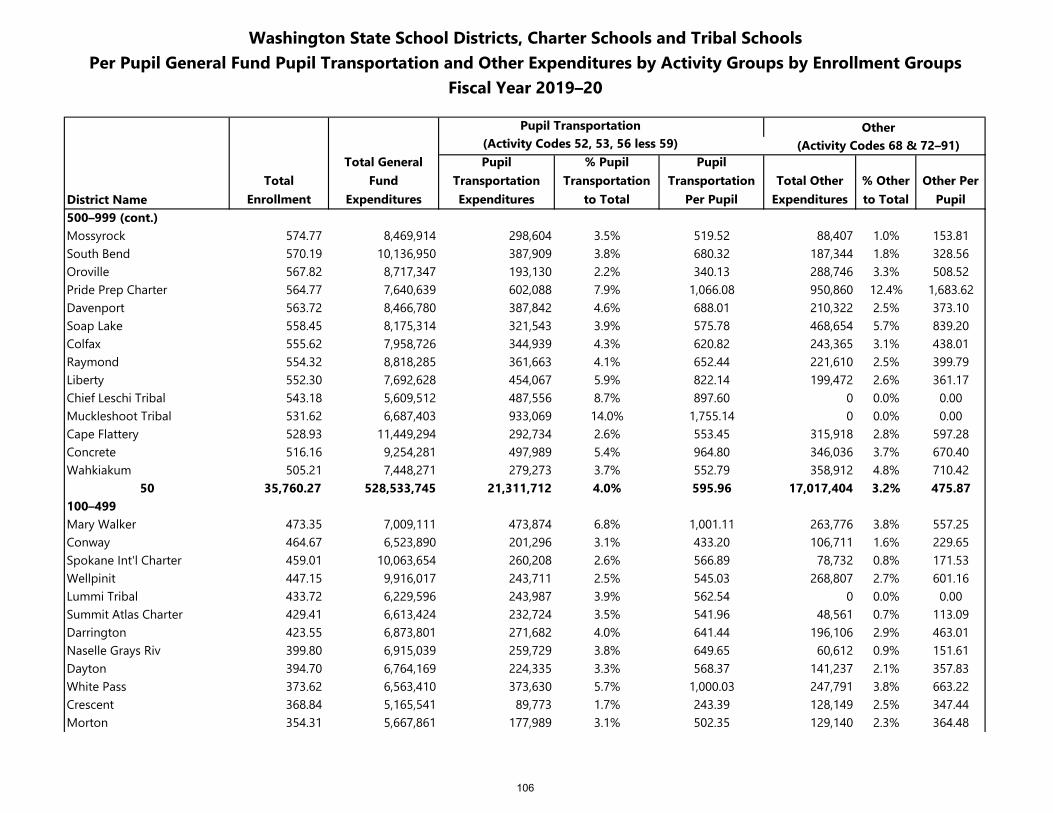
Washington State School Districts, Charter Schools and Tribal SchoolsPer Pupil General Fund Pupil Transportation and Other Expenditures by Activity Groups by Enrollment Groups
Fiscal Year 2019–20
Pupil Transportation Other(Activity Codes 52, 53, 56 less 59) (Activity Codes 68 & 72–91)
District NameTotal
Enrollment
Total General Fund
Expenditures
Pupil Transportation Expenditures
% Pupil Transportation
to Total
Pupil Transportation
Per PupilTotal Other
Expenditures% Other to Total
Other Per Pupil
500–999 (cont.)Mossyrock 574.77 8,469,914 298,604 3.5% 519.52 88,407 1.0% 153.81South Bend 570.19 10,136,950 387,909 3.8% 680.32 187,344 1.8% 328.56Oroville 567.82 8,717,347 193,130 2.2% 340.13 288,746 3.3% 508.52Pride Prep Charter 564.77 7,640,639 602,088 7.9% 1,066.08 950,860 12.4% 1,683.62Davenport 563.72 8,466,780 387,842 4.6% 688.01 210,322 2.5% 373.10Soap Lake 558.45 8,175,314 321,543 3.9% 575.78 468,654 5.7% 839.20Colfax 555.62 7,958,726 344,939 4.3% 620.82 243,365 3.1% 438.01Raymond 554.32 8,818,285 361,663 4.1% 652.44 221,610 2.5% 399.79Liberty 552.30 7,692,628 454,067 5.9% 822.14 199,472 2.6% 361.17Chief Leschi Tribal 543.18 5,609,512 487,556 8.7% 897.60 0 0.0% 0.00Muckleshoot Tribal 531.62 6,687,403 933,069 14.0% 1,755.14 0 0.0% 0.00Cape Flattery 528.93 11,449,294 292,734 2.6% 553.45 315,918 2.8% 597.28Concrete 516.16 9,254,281 497,989 5.4% 964.80 346,036 3.7% 670.40Wahkiakum 505.21 7,448,271 279,273 3.7% 552.79 358,912 4.8% 710.42
50 35,760.27 528,533,745 21,311,712 4.0% 595.96 17,017,404 3.2% 475.87100–499Mary Walker 473.35 7,009,111 473,874 6.8% 1,001.11 263,776 3.8% 557.25Conway 464.67 6,523,890 201,296 3.1% 433.20 106,711 1.6% 229.65Spokane Int'l Charter 459.01 10,063,654 260,208 2.6% 566.89 78,732 0.8% 171.53Wellpinit 447.15 9,916,017 243,711 2.5% 545.03 268,807 2.7% 601.16Lummi Tribal 433.72 6,229,596 243,987 3.9% 562.54 0 0.0% 0.00Summit Atlas Charter 429.41 6,613,424 232,724 3.5% 541.96 48,561 0.7% 113.09Darrington 423.55 6,873,801 271,682 4.0% 641.44 196,106 2.9% 463.01Naselle Grays Riv 399.80 6,915,039 259,729 3.8% 649.65 60,612 0.9% 151.61Dayton 394.70 6,764,169 224,335 3.3% 568.37 141,237 2.1% 357.83White Pass 373.62 6,563,410 373,630 5.7% 1,000.03 247,791 3.8% 663.22Crescent 368.84 5,165,541 89,773 1.7% 243.39 128,149 2.5% 347.44Morton 354.31 5,667,861 177,989 3.1% 502.35 129,140 2.3% 364.48
106
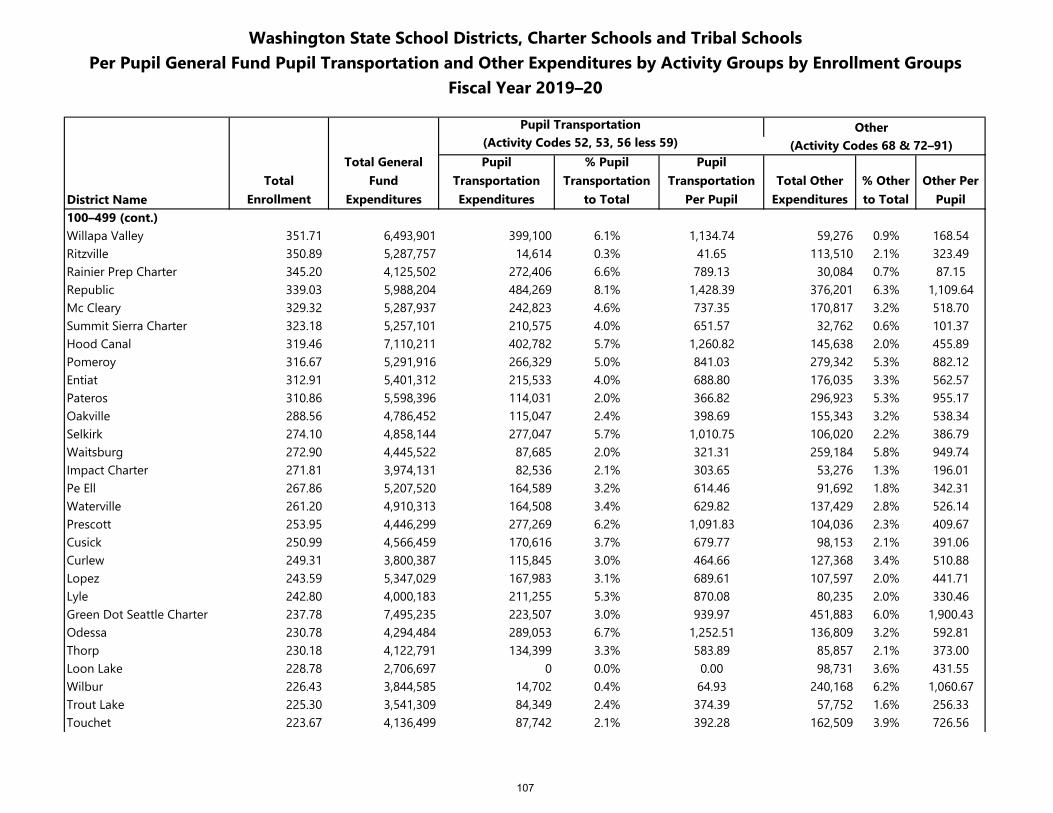
Washington State School Districts, Charter Schools and Tribal SchoolsPer Pupil General Fund Pupil Transportation and Other Expenditures by Activity Groups by Enrollment Groups
Fiscal Year 2019–20
Pupil Transportation Other(Activity Codes 52, 53, 56 less 59) (Activity Codes 68 & 72–91)
District NameTotal
Enrollment
Total General Fund
Expenditures
Pupil Transportation Expenditures
% Pupil Transportation
to Total
Pupil Transportation
Per PupilTotal Other
Expenditures% Other to Total
Other Per Pupil
100–499 (cont.)Willapa Valley 351.71 6,493,901 399,100 6.1% 1,134.74 59,276 0.9% 168.54Ritzville 350.89 5,287,757 14,614 0.3% 41.65 113,510 2.1% 323.49Rainier Prep Charter 345.20 4,125,502 272,406 6.6% 789.13 30,084 0.7% 87.15Republic 339.03 5,988,204 484,269 8.1% 1,428.39 376,201 6.3% 1,109.64Mc Cleary 329.32 5,287,937 242,823 4.6% 737.35 170,817 3.2% 518.70Summit Sierra Charter 323.18 5,257,101 210,575 4.0% 651.57 32,762 0.6% 101.37Hood Canal 319.46 7,110,211 402,782 5.7% 1,260.82 145,638 2.0% 455.89Pomeroy 316.67 5,291,916 266,329 5.0% 841.03 279,342 5.3% 882.12Entiat 312.91 5,401,312 215,533 4.0% 688.80 176,035 3.3% 562.57Pateros 310.86 5,598,396 114,031 2.0% 366.82 296,923 5.3% 955.17Oakville 288.56 4,786,452 115,047 2.4% 398.69 155,343 3.2% 538.34Selkirk 274.10 4,858,144 277,047 5.7% 1,010.75 106,020 2.2% 386.79Waitsburg 272.90 4,445,522 87,685 2.0% 321.31 259,184 5.8% 949.74Impact Charter 271.81 3,974,131 82,536 2.1% 303.65 53,276 1.3% 196.01Pe Ell 267.86 5,207,520 164,589 3.2% 614.46 91,692 1.8% 342.31Waterville 261.20 4,910,313 164,508 3.4% 629.82 137,429 2.8% 526.14Prescott 253.95 4,446,299 277,269 6.2% 1,091.83 104,036 2.3% 409.67Cusick 250.99 4,566,459 170,616 3.7% 679.77 98,153 2.1% 391.06Curlew 249.31 3,800,387 115,845 3.0% 464.66 127,368 3.4% 510.88Lopez 243.59 5,347,029 167,983 3.1% 689.61 107,597 2.0% 441.71Lyle 242.80 4,000,183 211,255 5.3% 870.08 80,235 2.0% 330.46Green Dot Seattle Charter 237.78 7,495,235 223,507 3.0% 939.97 451,883 6.0% 1,900.43Odessa 230.78 4,294,484 289,053 6.7% 1,252.51 136,809 3.2% 592.81Thorp 230.18 4,122,791 134,399 3.3% 583.89 85,857 2.1% 373.00Loon Lake 228.78 2,706,697 0 0.0% 0.00 98,731 3.6% 431.55Wilbur 226.43 3,844,585 14,702 0.4% 64.93 240,168 6.2% 1,060.67Trout Lake 225.30 3,541,309 84,349 2.4% 374.39 57,752 1.6% 256.33Touchet 223.67 4,136,499 87,742 2.1% 392.28 162,509 3.9% 726.56
107
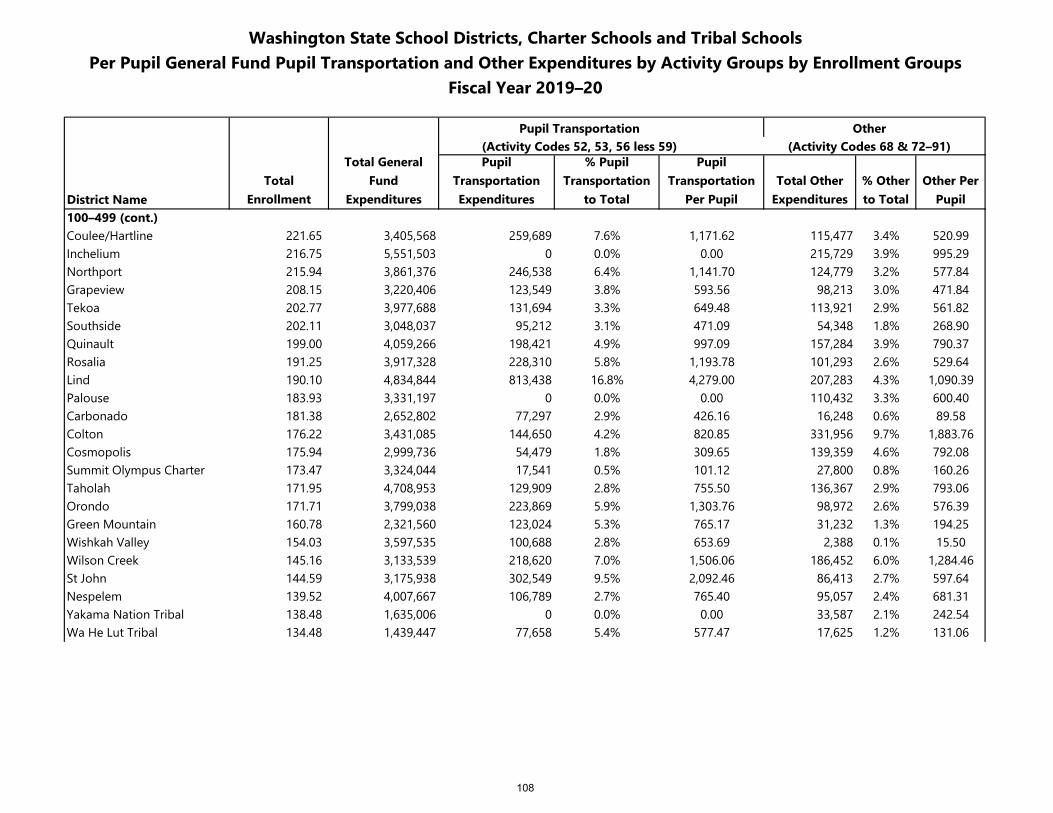
Washington State School Districts, Charter Schools and Tribal SchoolsPer Pupil General Fund Pupil Transportation and Other Expenditures by Activity Groups by Enrollment Groups
Fiscal Year 2019–20
Pupil Transportation Other(Activity Codes 52, 53, 56 less 59) (Activity Codes 68 & 72–91)
District NameTotal
Enrollment
Total General Fund
Expenditures
Pupil Transportation Expenditures
% Pupil Transportation
to Total
Pupil Transportation
Per PupilTotal Other
Expenditures% Other to Total
Other Per Pupil
100–499 (cont.)Coulee/Hartline 221.65 3,405,568 259,689 7.6% 1,171.62 115,477 3.4% 520.99Inchelium 216.75 5,551,503 0 0.0% 0.00 215,729 3.9% 995.29Northport 215.94 3,861,376 246,538 6.4% 1,141.70 124,779 3.2% 577.84Grapeview 208.15 3,220,406 123,549 3.8% 593.56 98,213 3.0% 471.84Tekoa 202.77 3,977,688 131,694 3.3% 649.48 113,921 2.9% 561.82Southside 202.11 3,048,037 95,212 3.1% 471.09 54,348 1.8% 268.90Quinault 199.00 4,059,266 198,421 4.9% 997.09 157,284 3.9% 790.37Rosalia 191.25 3,917,328 228,310 5.8% 1,193.78 101,293 2.6% 529.64Lind 190.10 4,834,844 813,438 16.8% 4,279.00 207,283 4.3% 1,090.39Palouse 183.93 3,331,197 0 0.0% 0.00 110,432 3.3% 600.40Carbonado 181.38 2,652,802 77,297 2.9% 426.16 16,248 0.6% 89.58Colton 176.22 3,431,085 144,650 4.2% 820.85 331,956 9.7% 1,883.76Cosmopolis 175.94 2,999,736 54,479 1.8% 309.65 139,359 4.6% 792.08Summit Olympus Charter 173.47 3,324,044 17,541 0.5% 101.12 27,800 0.8% 160.26Taholah 171.95 4,708,953 129,909 2.8% 755.50 136,367 2.9% 793.06Orondo 171.71 3,799,038 223,869 5.9% 1,303.76 98,972 2.6% 576.39Green Mountain 160.78 2,321,560 123,024 5.3% 765.17 31,232 1.3% 194.25Wishkah Valley 154.03 3,597,535 100,688 2.8% 653.69 2,388 0.1% 15.50Wilson Creek 145.16 3,133,539 218,620 7.0% 1,506.06 186,452 6.0% 1,284.46St John 144.59 3,175,938 302,549 9.5% 2,092.46 86,413 2.7% 597.64Nespelem 139.52 4,007,667 106,789 2.7% 765.40 95,057 2.4% 681.31Yakama Nation Tribal 138.48 1,635,006 0 0.0% 0.00 33,587 2.1% 242.54Wa He Lut Tribal 134.48 1,439,447 77,658 5.4% 577.47 17,625 1.2% 131.06
108
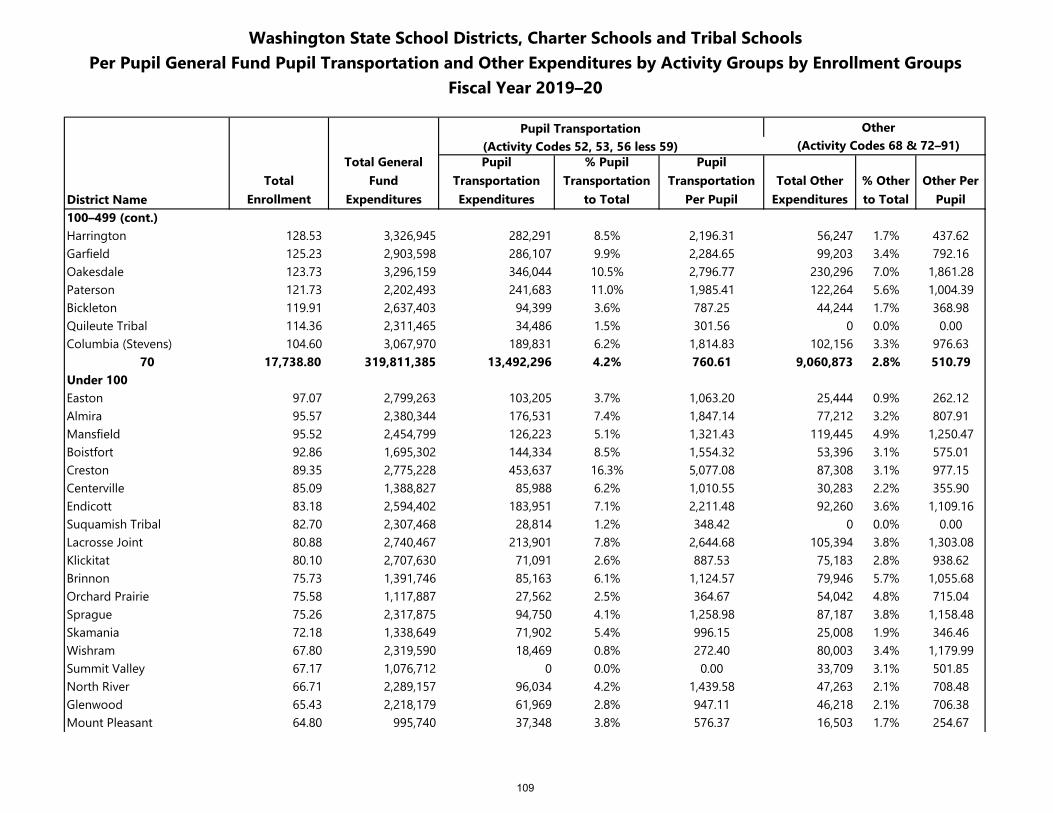
Washington State School Districts, Charter Schools and Tribal SchoolsPer Pupil General Fund Pupil Transportation and Other Expenditures by Activity Groups by Enrollment Groups
Fiscal Year 2019–20
Pupil Transportation Other(Activity Codes 52, 53, 56 less 59) (Activity Codes 68 & 72–91)
District NameTotal
Enrollment
Total General Fund
Expenditures
Pupil Transportation Expenditures
% Pupil Transportation
to Total
Pupil Transportation
Per PupilTotal Other
Expenditures% Other to Total
Other Per Pupil
100–499 (cont.)Harrington 128.53 3,326,945 282,291 8.5% 2,196.31 56,247 1.7% 437.62Garfield 125.23 2,903,598 286,107 9.9% 2,284.65 99,203 3.4% 792.16Oakesdale 123.73 3,296,159 346,044 10.5% 2,796.77 230,296 7.0% 1,861.28Paterson 121.73 2,202,493 241,683 11.0% 1,985.41 122,264 5.6% 1,004.39Bickleton 119.91 2,637,403 94,399 3.6% 787.25 44,244 1.7% 368.98Quileute Tribal 114.36 2,311,465 34,486 1.5% 301.56 0 0.0% 0.00Columbia (Stevens) 104.60 3,067,970 189,831 6.2% 1,814.83 102,156 3.3% 976.63
70 17,738.80 319,811,385 13,492,296 4.2% 760.61 9,060,873 2.8% 510.79Under 100Easton 97.07 2,799,263 103,205 3.7% 1,063.20 25,444 0.9% 262.12Almira 95.57 2,380,344 176,531 7.4% 1,847.14 77,212 3.2% 807.91Mansfield 95.52 2,454,799 126,223 5.1% 1,321.43 119,445 4.9% 1,250.47Boistfort 92.86 1,695,302 144,334 8.5% 1,554.32 53,396 3.1% 575.01Creston 89.35 2,775,228 453,637 16.3% 5,077.08 87,308 3.1% 977.15Centerville 85.09 1,388,827 85,988 6.2% 1,010.55 30,283 2.2% 355.90Endicott 83.18 2,594,402 183,951 7.1% 2,211.48 92,260 3.6% 1,109.16Suquamish Tribal 82.70 2,307,468 28,814 1.2% 348.42 0 0.0% 0.00Lacrosse Joint 80.88 2,740,467 213,901 7.8% 2,644.68 105,394 3.8% 1,303.08Klickitat 80.10 2,707,630 71,091 2.6% 887.53 75,183 2.8% 938.62Brinnon 75.73 1,391,746 85,163 6.1% 1,124.57 79,946 5.7% 1,055.68Orchard Prairie 75.58 1,117,887 27,562 2.5% 364.67 54,042 4.8% 715.04Sprague 75.26 2,317,875 94,750 4.1% 1,258.98 87,187 3.8% 1,158.48Skamania 72.18 1,338,649 71,902 5.4% 996.15 25,008 1.9% 346.46Wishram 67.80 2,319,590 18,469 0.8% 272.40 80,003 3.4% 1,179.99Summit Valley 67.17 1,076,712 0 0.0% 0.00 33,709 3.1% 501.85North River 66.71 2,289,157 96,034 4.2% 1,439.58 47,263 2.1% 708.48Glenwood 65.43 2,218,179 61,969 2.8% 947.11 46,218 2.1% 706.38Mount Pleasant 64.80 995,740 37,348 3.8% 576.37 16,503 1.7% 254.67
109
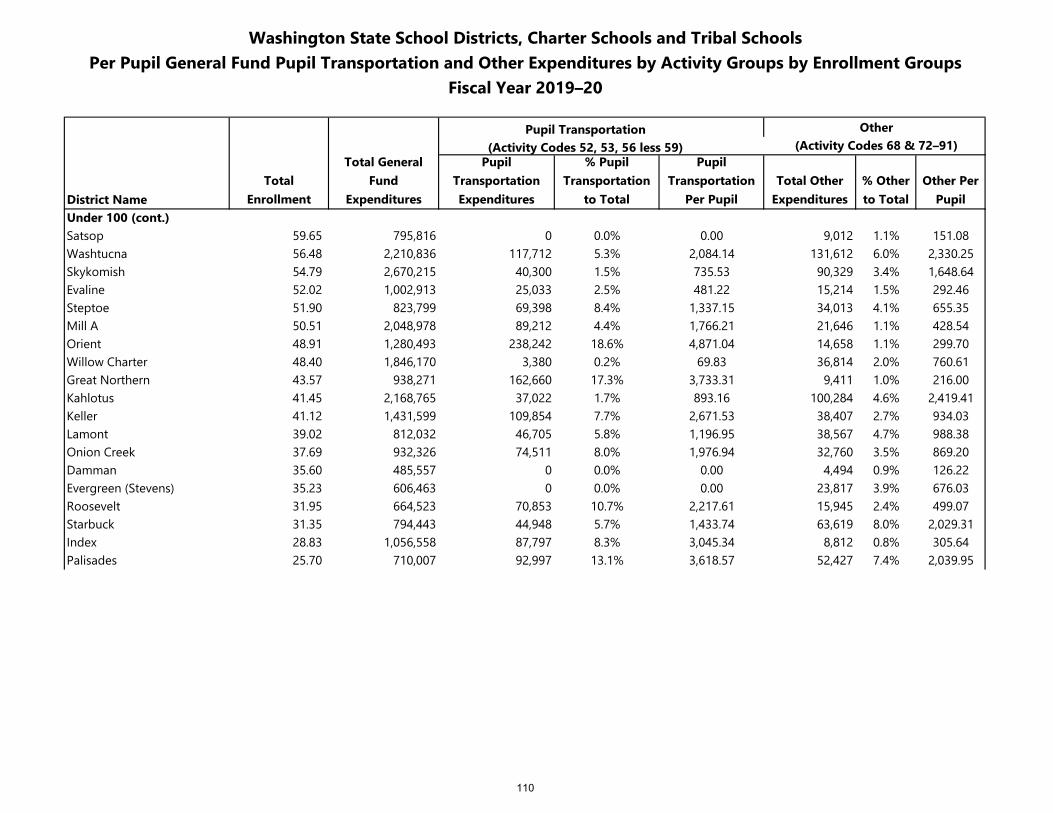
Washington State School Districts, Charter Schools and Tribal SchoolsPer Pupil General Fund Pupil Transportation and Other Expenditures by Activity Groups by Enrollment Groups
Fiscal Year 2019–20
Pupil Transportation Other(Activity Codes 52, 53, 56 less 59) (Activity Codes 68 & 72–91)
District NameTotal
Enrollment
Total General Fund
Expenditures
Pupil Transportation Expenditures
% Pupil Transportation
to Total
Pupil Transportation
Per PupilTotal Other
Expenditures% Other to Total
Other Per Pupil
Under 100 (cont.)Satsop 59.65 795,816 0 0.0% 0.00 9,012 1.1% 151.08Washtucna 56.48 2,210,836 117,712 5.3% 2,084.14 131,612 6.0% 2,330.25Skykomish 54.79 2,670,215 40,300 1.5% 735.53 90,329 3.4% 1,648.64Evaline 52.02 1,002,913 25,033 2.5% 481.22 15,214 1.5% 292.46Steptoe 51.90 823,799 69,398 8.4% 1,337.15 34,013 4.1% 655.35Mill A 50.51 2,048,978 89,212 4.4% 1,766.21 21,646 1.1% 428.54Orient 48.91 1,280,493 238,242 18.6% 4,871.04 14,658 1.1% 299.70Willow Charter 48.40 1,846,170 3,380 0.2% 69.83 36,814 2.0% 760.61Great Northern 43.57 938,271 162,660 17.3% 3,733.31 9,411 1.0% 216.00Kahlotus 41.45 2,168,765 37,022 1.7% 893.16 100,284 4.6% 2,419.41Keller 41.12 1,431,599 109,854 7.7% 2,671.53 38,407 2.7% 934.03Lamont 39.02 812,032 46,705 5.8% 1,196.95 38,567 4.7% 988.38Onion Creek 37.69 932,326 74,511 8.0% 1,976.94 32,760 3.5% 869.20Damman 35.60 485,557 0 0.0% 0.00 4,494 0.9% 126.22Evergreen (Stevens) 35.23 606,463 0 0.0% 0.00 23,817 3.9% 676.03Roosevelt 31.95 664,523 70,853 10.7% 2,217.61 15,945 2.4% 499.07Starbuck 31.35 794,443 44,948 5.7% 1,433.74 63,619 8.0% 2,029.31Index 28.83 1,056,558 87,797 8.3% 3,045.34 8,812 0.8% 305.64Palisades 25.70 710,007 92,997 13.1% 3,618.57 52,427 7.4% 2,039.95
110
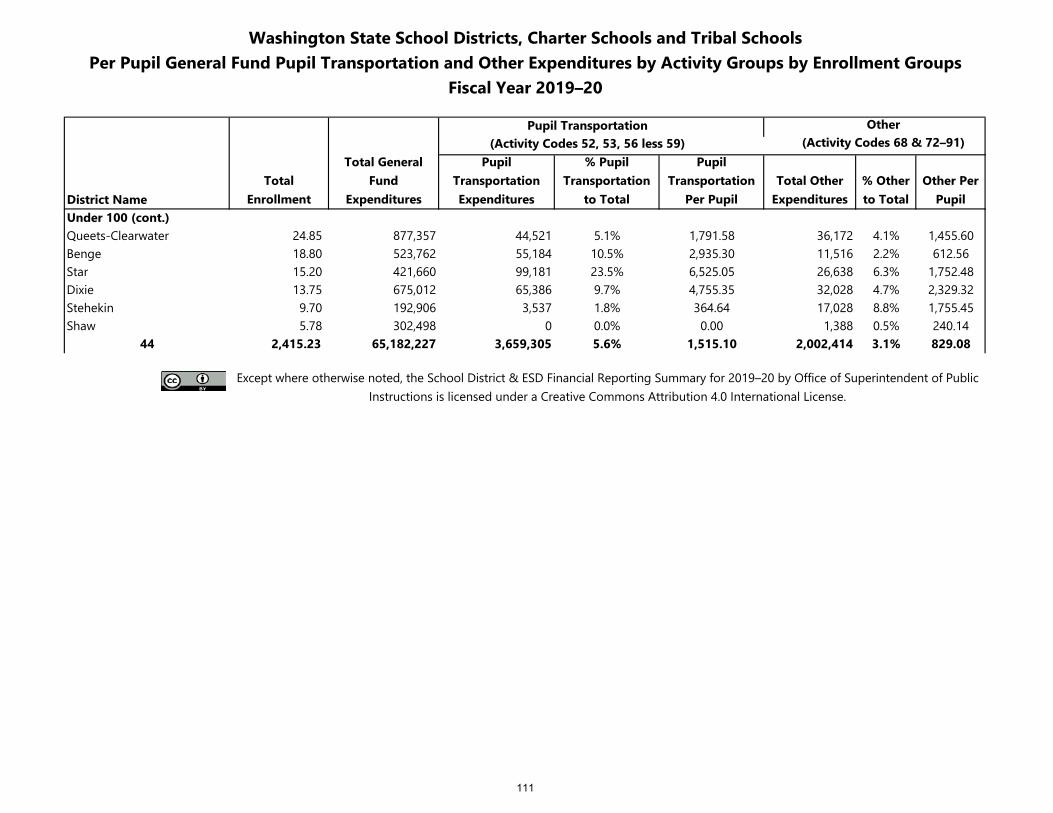
Washington State School Districts, Charter Schools and Tribal SchoolsPer Pupil General Fund Pupil Transportation and Other Expenditures by Activity Groups by Enrollment Groups
Fiscal Year 2019–20
Pupil Transportation Other(Activity Codes 52, 53, 56 less 59) (Activity Codes 68 & 72–91)
District NameTotal
Enrollment
Total General Fund
Expenditures
Pupil Transportation Expenditures
% Pupil Transportation
to Total
Pupil Transportation
Per PupilTotal Other
Expenditures% Other to Total
Other Per Pupil
Under 100 (cont.)Queets-Clearwater 24.85 877,357 44,521 5.1% 1,791.58 36,172 4.1% 1,455.60Benge 18.80 523,762 55,184 10.5% 2,935.30 11,516 2.2% 612.56Star 15.20 421,660 99,181 23.5% 6,525.05 26,638 6.3% 1,752.48Dixie 13.75 675,012 65,386 9.7% 4,755.35 32,028 4.7% 2,329.32Stehekin 9.70 192,906 3,537 1.8% 364.64 17,028 8.8% 1,755.45Shaw 5.78 302,498 0 0.0% 0.00 1,388 0.5% 240.14
44 2,415.23 65,182,227 3,659,305 5.6% 1,515.10 2,002,414 3.1% 829.08
Except where otherwise noted, the School District & ESD Financial Reporting Summary for 2019–20 by Office of Superintendent of Public Instructions is licensed under a Creative Commons Attribution 4.0 International License.
111
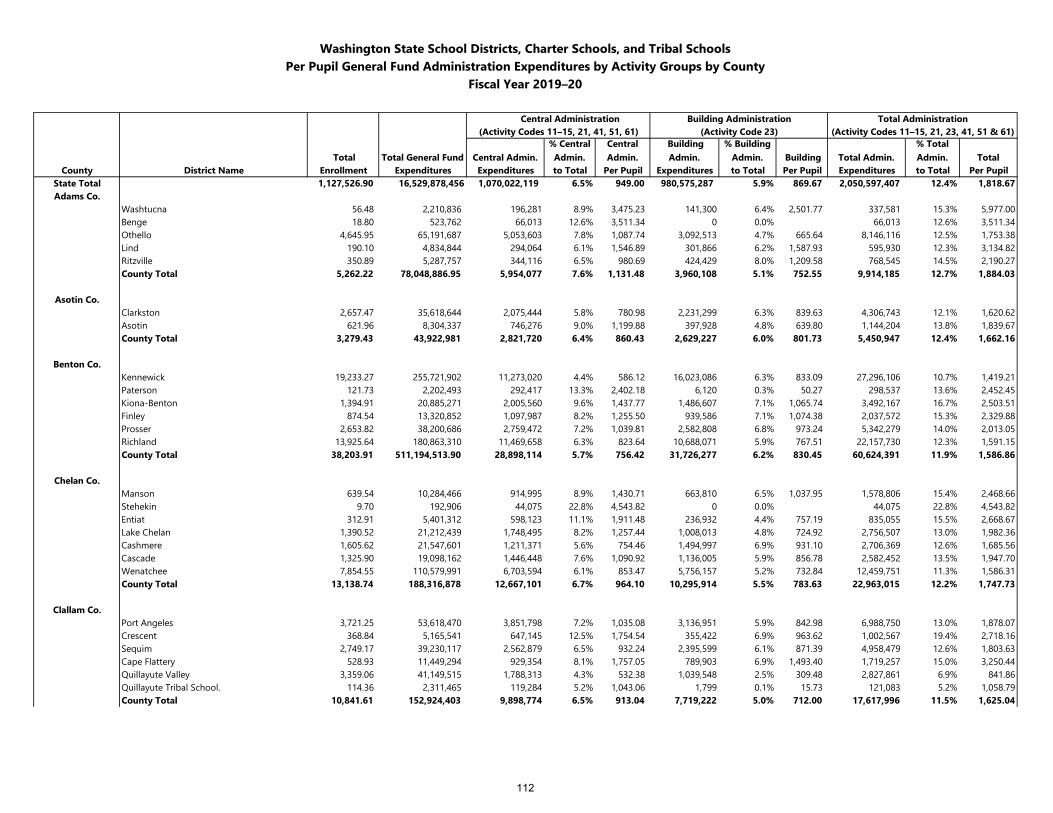
Washington State School Districts, Charter Schools, and Tribal SchoolsPer Pupil General Fund Administration Expenditures by Activity Groups by County
Fiscal Year 2019–20
Central Administration Building Administration Total Administration(Activity Codes 11–15, 21, 41, 51, 61) (Activity Code 23) (Activity Codes 11–15, 21, 23, 41, 51 & 61)
Total Total General Fund Central Admin. % Central Admin.
Central Admin.
Building Admin.
% Building Admin. Building Total Admin.
% Total Admin. Total
County District Name Enrollment Expenditures Expenditures to Total Per Pupil Expenditures to Total Per Pupil Expenditures to Total Per PupilState Total 1,127,526.90 16,529,878,456 1,070,022,119 6.5% 949.00 980,575,287 5.9% 869.67 2,050,597,407 12.4% 1,818.67Adams Co.
Washtucna 56.48 2,210,836 196,281 8.9% 3,475.23 141,300 6.4% 2,501.77 337,581 15.3% 5,977.00Benge 18.80 523,762 66,013 12.6% 3,511.34 0 0.0% 66,013 12.6% 3,511.34Othello 4,645.95 65,191,687 5,053,603 7.8% 1,087.74 3,092,513 4.7% 665.64 8,146,116 12.5% 1,753.38Lind 190.10 4,834,844 294,064 6.1% 1,546.89 301,866 6.2% 1,587.93 595,930 12.3% 3,134.82Ritzville 350.89 5,287,757 344,116 6.5% 980.69 424,429 8.0% 1,209.58 768,545 14.5% 2,190.27County Total 5,262.22 78,048,886.95 5,954,077 7.6% 1,131.48 3,960,108 5.1% 752.55 9,914,185 12.7% 1,884.03
Asotin Co.Clarkston 2,657.47 35,618,644 2,075,444 5.8% 780.98 2,231,299 6.3% 839.63 4,306,743 12.1% 1,620.62Asotin 621.96 8,304,337 746,276 9.0% 1,199.88 397,928 4.8% 639.80 1,144,204 13.8% 1,839.67County Total 3,279.43 43,922,981 2,821,720 6.4% 860.43 2,629,227 6.0% 801.73 5,450,947 12.4% 1,662.16
Benton Co.Kennewick 19,233.27 255,721,902 11,273,020 4.4% 586.12 16,023,086 6.3% 833.09 27,296,106 10.7% 1,419.21Paterson 121.73 2,202,493 292,417 13.3% 2,402.18 6,120 0.3% 50.27 298,537 13.6% 2,452.45Kiona-Benton 1,394.91 20,885,271 2,005,560 9.6% 1,437.77 1,486,607 7.1% 1,065.74 3,492,167 16.7% 2,503.51Finley 874.54 13,320,852 1,097,987 8.2% 1,255.50 939,586 7.1% 1,074.38 2,037,572 15.3% 2,329.88Prosser 2,653.82 38,200,686 2,759,472 7.2% 1,039.81 2,582,808 6.8% 973.24 5,342,279 14.0% 2,013.05Richland 13,925.64 180,863,310 11,469,658 6.3% 823.64 10,688,071 5.9% 767.51 22,157,730 12.3% 1,591.15County Total 38,203.91 511,194,513.90 28,898,114 5.7% 756.42 31,726,277 6.2% 830.45 60,624,391 11.9% 1,586.86
Chelan Co.Manson 639.54 10,284,466 914,995 8.9% 1,430.71 663,810 6.5% 1,037.95 1,578,806 15.4% 2,468.66Stehekin 9.70 192,906 44,075 22.8% 4,543.82 0 0.0% 44,075 22.8% 4,543.82Entiat 312.91 5,401,312 598,123 11.1% 1,911.48 236,932 4.4% 757.19 835,055 15.5% 2,668.67Lake Chelan 1,390.52 21,212,439 1,748,495 8.2% 1,257.44 1,008,013 4.8% 724.92 2,756,507 13.0% 1,982.36Cashmere 1,605.62 21,547,601 1,211,371 5.6% 754.46 1,494,997 6.9% 931.10 2,706,369 12.6% 1,685.56Cascade 1,325.90 19,098,162 1,446,448 7.6% 1,090.92 1,136,005 5.9% 856.78 2,582,452 13.5% 1,947.70Wenatchee 7,854.55 110,579,991 6,703,594 6.1% 853.47 5,756,157 5.2% 732.84 12,459,751 11.3% 1,586.31County Total 13,138.74 188,316,878 12,667,101 6.7% 964.10 10,295,914 5.5% 783.63 22,963,015 12.2% 1,747.73
Clallam Co.Port Angeles 3,721.25 53,618,470 3,851,798 7.2% 1,035.08 3,136,951 5.9% 842.98 6,988,750 13.0% 1,878.07Crescent 368.84 5,165,541 647,145 12.5% 1,754.54 355,422 6.9% 963.62 1,002,567 19.4% 2,718.16Sequim 2,749.17 39,230,117 2,562,879 6.5% 932.24 2,395,599 6.1% 871.39 4,958,479 12.6% 1,803.63Cape Flattery 528.93 11,449,294 929,354 8.1% 1,757.05 789,903 6.9% 1,493.40 1,719,257 15.0% 3,250.44Quillayute Valley 3,359.06 41,149,515 1,788,313 4.3% 532.38 1,039,548 2.5% 309.48 2,827,861 6.9% 841.86Quillayute Tribal School. 114.36 2,311,465 119,284 5.2% 1,043.06 1,799 0.1% 15.73 121,083 5.2% 1,058.79County Total 10,841.61 152,924,403 9,898,774 6.5% 913.04 7,719,222 5.0% 712.00 17,617,996 11.5% 1,625.04
112
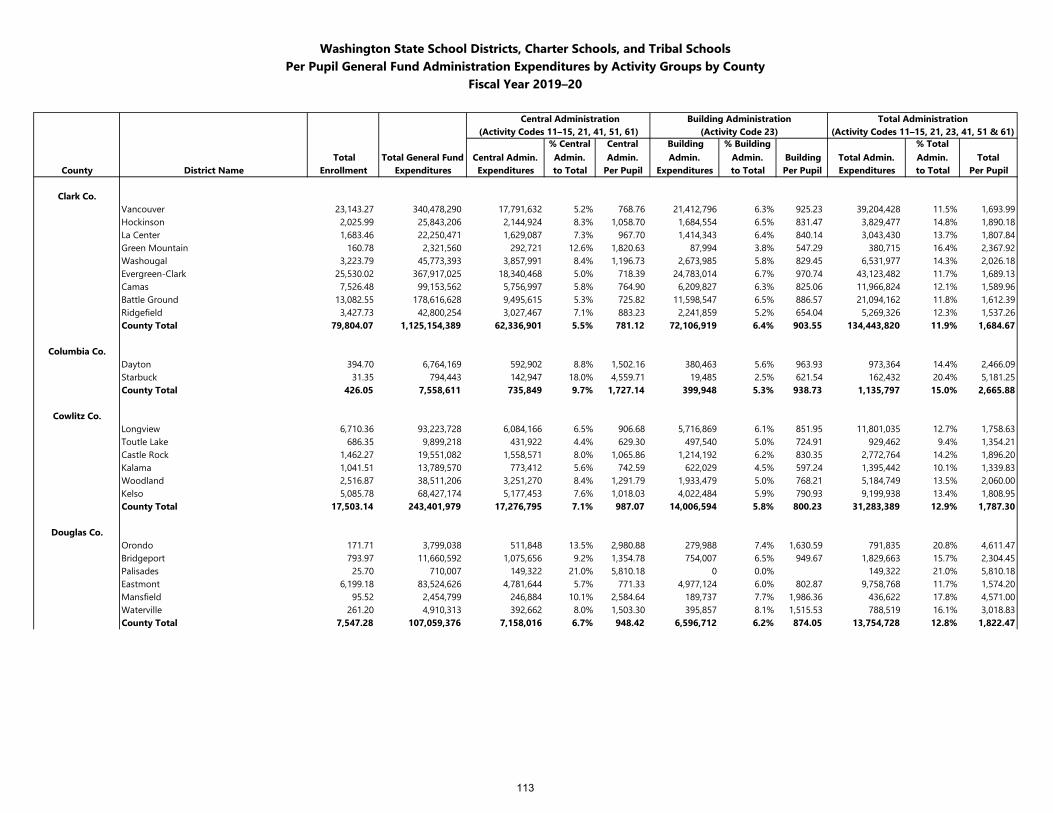
Washington State School Districts, Charter Schools, and Tribal SchoolsPer Pupil General Fund Administration Expenditures by Activity Groups by County
Fiscal Year 2019–20
Central Administration Building Administration Total Administration(Activity Codes 11–15, 21, 41, 51, 61) (Activity Code 23) (Activity Codes 11–15, 21, 23, 41, 51 & 61)
Total Total General Fund Central Admin. % Central Admin.
Central Admin.
Building Admin.
% Building Admin. Building Total Admin.
% Total Admin. Total
County District Name Enrollment Expenditures Expenditures to Total Per Pupil Expenditures to Total Per Pupil Expenditures to Total Per Pupil
Clark Co.Vancouver 23,143.27 340,478,290 17,791,632 5.2% 768.76 21,412,796 6.3% 925.23 39,204,428 11.5% 1,693.99Hockinson 2,025.99 25,843,206 2,144,924 8.3% 1,058.70 1,684,554 6.5% 831.47 3,829,477 14.8% 1,890.18La Center 1,683.46 22,250,471 1,629,087 7.3% 967.70 1,414,343 6.4% 840.14 3,043,430 13.7% 1,807.84Green Mountain 160.78 2,321,560 292,721 12.6% 1,820.63 87,994 3.8% 547.29 380,715 16.4% 2,367.92Washougal 3,223.79 45,773,393 3,857,991 8.4% 1,196.73 2,673,985 5.8% 829.45 6,531,977 14.3% 2,026.18Evergreen-Clark 25,530.02 367,917,025 18,340,468 5.0% 718.39 24,783,014 6.7% 970.74 43,123,482 11.7% 1,689.13Camas 7,526.48 99,153,562 5,756,997 5.8% 764.90 6,209,827 6.3% 825.06 11,966,824 12.1% 1,589.96Battle Ground 13,082.55 178,616,628 9,495,615 5.3% 725.82 11,598,547 6.5% 886.57 21,094,162 11.8% 1,612.39Ridgefield 3,427.73 42,800,254 3,027,467 7.1% 883.23 2,241,859 5.2% 654.04 5,269,326 12.3% 1,537.26County Total 79,804.07 1,125,154,389 62,336,901 5.5% 781.12 72,106,919 6.4% 903.55 134,443,820 11.9% 1,684.67
Columbia Co.Dayton 394.70 6,764,169 592,902 8.8% 1,502.16 380,463 5.6% 963.93 973,364 14.4% 2,466.09Starbuck 31.35 794,443 142,947 18.0% 4,559.71 19,485 2.5% 621.54 162,432 20.4% 5,181.25County Total 426.05 7,558,611 735,849 9.7% 1,727.14 399,948 5.3% 938.73 1,135,797 15.0% 2,665.88
Cowlitz Co.Longview 6,710.36 93,223,728 6,084,166 6.5% 906.68 5,716,869 6.1% 851.95 11,801,035 12.7% 1,758.63Toutle Lake 686.35 9,899,218 431,922 4.4% 629.30 497,540 5.0% 724.91 929,462 9.4% 1,354.21Castle Rock 1,462.27 19,551,082 1,558,571 8.0% 1,065.86 1,214,192 6.2% 830.35 2,772,764 14.2% 1,896.20Kalama 1,041.51 13,789,570 773,412 5.6% 742.59 622,029 4.5% 597.24 1,395,442 10.1% 1,339.83Woodland 2,516.87 38,511,206 3,251,270 8.4% 1,291.79 1,933,479 5.0% 768.21 5,184,749 13.5% 2,060.00Kelso 5,085.78 68,427,174 5,177,453 7.6% 1,018.03 4,022,484 5.9% 790.93 9,199,938 13.4% 1,808.95County Total 17,503.14 243,401,979 17,276,795 7.1% 987.07 14,006,594 5.8% 800.23 31,283,389 12.9% 1,787.30
Douglas Co.Orondo 171.71 3,799,038 511,848 13.5% 2,980.88 279,988 7.4% 1,630.59 791,835 20.8% 4,611.47Bridgeport 793.97 11,660,592 1,075,656 9.2% 1,354.78 754,007 6.5% 949.67 1,829,663 15.7% 2,304.45Palisades 25.70 710,007 149,322 21.0% 5,810.18 0 0.0% 149,322 21.0% 5,810.18Eastmont 6,199.18 83,524,626 4,781,644 5.7% 771.33 4,977,124 6.0% 802.87 9,758,768 11.7% 1,574.20Mansfield 95.52 2,454,799 246,884 10.1% 2,584.64 189,737 7.7% 1,986.36 436,622 17.8% 4,571.00Waterville 261.20 4,910,313 392,662 8.0% 1,503.30 395,857 8.1% 1,515.53 788,519 16.1% 3,018.83County Total 7,547.28 107,059,376 7,158,016 6.7% 948.42 6,596,712 6.2% 874.05 13,754,728 12.8% 1,822.47
113
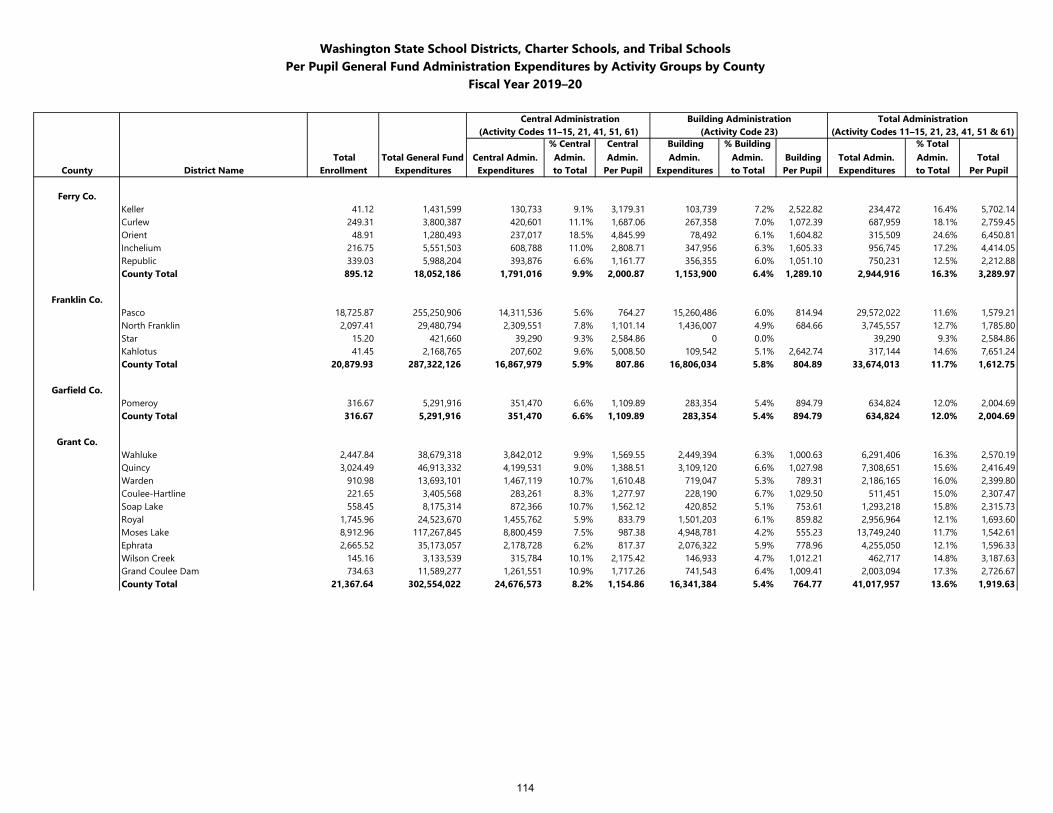
Washington State School Districts, Charter Schools, and Tribal SchoolsPer Pupil General Fund Administration Expenditures by Activity Groups by County
Fiscal Year 2019–20
Central Administration Building Administration Total Administration(Activity Codes 11–15, 21, 41, 51, 61) (Activity Code 23) (Activity Codes 11–15, 21, 23, 41, 51 & 61)
Total Total General Fund Central Admin. % Central Admin.
Central Admin.
Building Admin.
% Building Admin. Building Total Admin.
% Total Admin. Total
County District Name Enrollment Expenditures Expenditures to Total Per Pupil Expenditures to Total Per Pupil Expenditures to Total Per Pupil
Ferry Co.Keller 41.12 1,431,599 130,733 9.1% 3,179.31 103,739 7.2% 2,522.82 234,472 16.4% 5,702.14Curlew 249.31 3,800,387 420,601 11.1% 1,687.06 267,358 7.0% 1,072.39 687,959 18.1% 2,759.45Orient 48.91 1,280,493 237,017 18.5% 4,845.99 78,492 6.1% 1,604.82 315,509 24.6% 6,450.81Inchelium 216.75 5,551,503 608,788 11.0% 2,808.71 347,956 6.3% 1,605.33 956,745 17.2% 4,414.05Republic 339.03 5,988,204 393,876 6.6% 1,161.77 356,355 6.0% 1,051.10 750,231 12.5% 2,212.88County Total 895.12 18,052,186 1,791,016 9.9% 2,000.87 1,153,900 6.4% 1,289.10 2,944,916 16.3% 3,289.97
Franklin Co.Pasco 18,725.87 255,250,906 14,311,536 5.6% 764.27 15,260,486 6.0% 814.94 29,572,022 11.6% 1,579.21North Franklin 2,097.41 29,480,794 2,309,551 7.8% 1,101.14 1,436,007 4.9% 684.66 3,745,557 12.7% 1,785.80Star 15.20 421,660 39,290 9.3% 2,584.86 0 0.0% 39,290 9.3% 2,584.86Kahlotus 41.45 2,168,765 207,602 9.6% 5,008.50 109,542 5.1% 2,642.74 317,144 14.6% 7,651.24County Total 20,879.93 287,322,126 16,867,979 5.9% 807.86 16,806,034 5.8% 804.89 33,674,013 11.7% 1,612.75
Garfield Co.Pomeroy 316.67 5,291,916 351,470 6.6% 1,109.89 283,354 5.4% 894.79 634,824 12.0% 2,004.69County Total 316.67 5,291,916 351,470 6.6% 1,109.89 283,354 5.4% 894.79 634,824 12.0% 2,004.69
Grant Co.Wahluke 2,447.84 38,679,318 3,842,012 9.9% 1,569.55 2,449,394 6.3% 1,000.63 6,291,406 16.3% 2,570.19Quincy 3,024.49 46,913,332 4,199,531 9.0% 1,388.51 3,109,120 6.6% 1,027.98 7,308,651 15.6% 2,416.49Warden 910.98 13,693,101 1,467,119 10.7% 1,610.48 719,047 5.3% 789.31 2,186,165 16.0% 2,399.80Coulee-Hartline 221.65 3,405,568 283,261 8.3% 1,277.97 228,190 6.7% 1,029.50 511,451 15.0% 2,307.47Soap Lake 558.45 8,175,314 872,366 10.7% 1,562.12 420,852 5.1% 753.61 1,293,218 15.8% 2,315.73Royal 1,745.96 24,523,670 1,455,762 5.9% 833.79 1,501,203 6.1% 859.82 2,956,964 12.1% 1,693.60Moses Lake 8,912.96 117,267,845 8,800,459 7.5% 987.38 4,948,781 4.2% 555.23 13,749,240 11.7% 1,542.61Ephrata 2,665.52 35,173,057 2,178,728 6.2% 817.37 2,076,322 5.9% 778.96 4,255,050 12.1% 1,596.33Wilson Creek 145.16 3,133,539 315,784 10.1% 2,175.42 146,933 4.7% 1,012.21 462,717 14.8% 3,187.63Grand Coulee Dam 734.63 11,589,277 1,261,551 10.9% 1,717.26 741,543 6.4% 1,009.41 2,003,094 17.3% 2,726.67County Total 21,367.64 302,554,022 24,676,573 8.2% 1,154.86 16,341,384 5.4% 764.77 41,017,957 13.6% 1,919.63
114
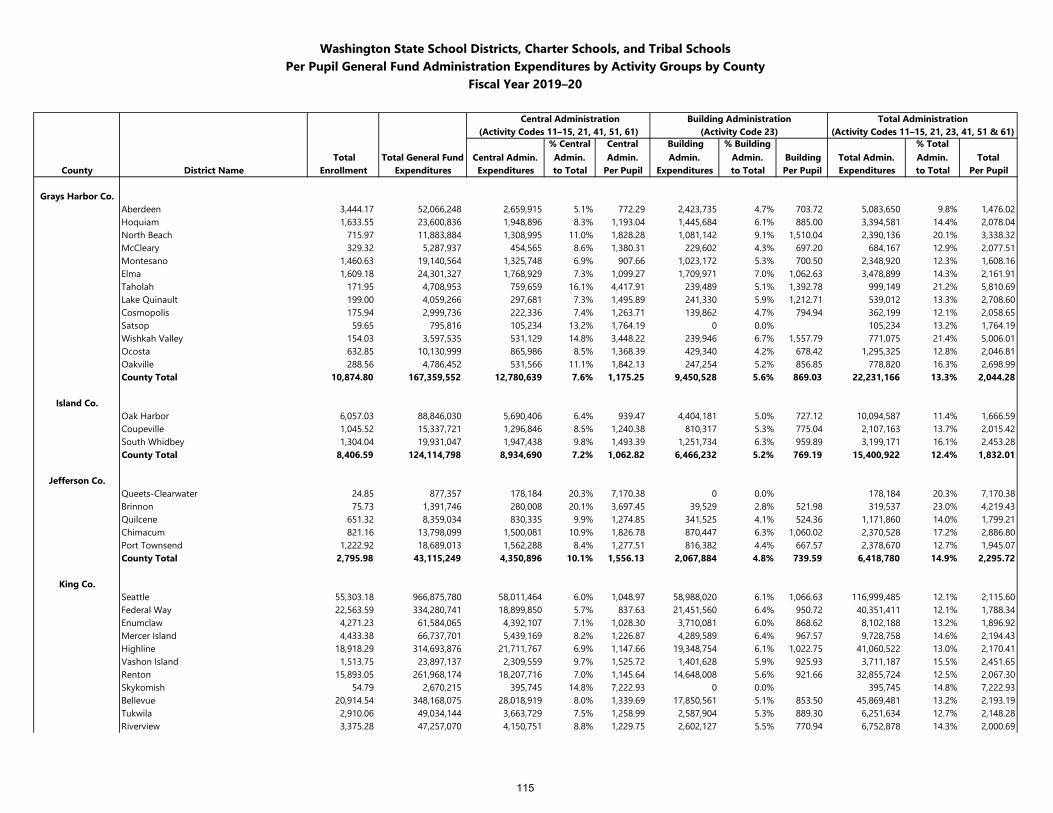
Washington State School Districts, Charter Schools, and Tribal SchoolsPer Pupil General Fund Administration Expenditures by Activity Groups by County
Fiscal Year 2019–20
Central Administration Building Administration Total Administration(Activity Codes 11–15, 21, 41, 51, 61) (Activity Code 23) (Activity Codes 11–15, 21, 23, 41, 51 & 61)
Total Total General Fund Central Admin. % Central Admin.
Central Admin.
Building Admin.
% Building Admin. Building Total Admin.
% Total Admin. Total
County District Name Enrollment Expenditures Expenditures to Total Per Pupil Expenditures to Total Per Pupil Expenditures to Total Per Pupil
Grays Harbor Co.Aberdeen 3,444.17 52,066,248 2,659,915 5.1% 772.29 2,423,735 4.7% 703.72 5,083,650 9.8% 1,476.02Hoquiam 1,633.55 23,600,836 1,948,896 8.3% 1,193.04 1,445,684 6.1% 885.00 3,394,581 14.4% 2,078.04North Beach 715.97 11,883,884 1,308,995 11.0% 1,828.28 1,081,142 9.1% 1,510.04 2,390,136 20.1% 3,338.32McCleary 329.32 5,287,937 454,565 8.6% 1,380.31 229,602 4.3% 697.20 684,167 12.9% 2,077.51Montesano 1,460.63 19,140,564 1,325,748 6.9% 907.66 1,023,172 5.3% 700.50 2,348,920 12.3% 1,608.16Elma 1,609.18 24,301,327 1,768,929 7.3% 1,099.27 1,709,971 7.0% 1,062.63 3,478,899 14.3% 2,161.91Taholah 171.95 4,708,953 759,659 16.1% 4,417.91 239,489 5.1% 1,392.78 999,149 21.2% 5,810.69Lake Quinault 199.00 4,059,266 297,681 7.3% 1,495.89 241,330 5.9% 1,212.71 539,012 13.3% 2,708.60Cosmopolis 175.94 2,999,736 222,336 7.4% 1,263.71 139,862 4.7% 794.94 362,199 12.1% 2,058.65Satsop 59.65 795,816 105,234 13.2% 1,764.19 0 0.0% 105,234 13.2% 1,764.19Wishkah Valley 154.03 3,597,535 531,129 14.8% 3,448.22 239,946 6.7% 1,557.79 771,075 21.4% 5,006.01Ocosta 632.85 10,130,999 865,986 8.5% 1,368.39 429,340 4.2% 678.42 1,295,325 12.8% 2,046.81Oakville 288.56 4,786,452 531,566 11.1% 1,842.13 247,254 5.2% 856.85 778,820 16.3% 2,698.99County Total 10,874.80 167,359,552 12,780,639 7.6% 1,175.25 9,450,528 5.6% 869.03 22,231,166 13.3% 2,044.28
Island Co.Oak Harbor 6,057.03 88,846,030 5,690,406 6.4% 939.47 4,404,181 5.0% 727.12 10,094,587 11.4% 1,666.59Coupeville 1,045.52 15,337,721 1,296,846 8.5% 1,240.38 810,317 5.3% 775.04 2,107,163 13.7% 2,015.42South Whidbey 1,304.04 19,931,047 1,947,438 9.8% 1,493.39 1,251,734 6.3% 959.89 3,199,171 16.1% 2,453.28County Total 8,406.59 124,114,798 8,934,690 7.2% 1,062.82 6,466,232 5.2% 769.19 15,400,922 12.4% 1,832.01
Jefferson Co.Queets-Clearwater 24.85 877,357 178,184 20.3% 7,170.38 0 0.0% 178,184 20.3% 7,170.38Brinnon 75.73 1,391,746 280,008 20.1% 3,697.45 39,529 2.8% 521.98 319,537 23.0% 4,219.43Quilcene 651.32 8,359,034 830,335 9.9% 1,274.85 341,525 4.1% 524.36 1,171,860 14.0% 1,799.21Chimacum 821.16 13,798,099 1,500,081 10.9% 1,826.78 870,447 6.3% 1,060.02 2,370,528 17.2% 2,886.80Port Townsend 1,222.92 18,689,013 1,562,288 8.4% 1,277.51 816,382 4.4% 667.57 2,378,670 12.7% 1,945.07County Total 2,795.98 43,115,249 4,350,896 10.1% 1,556.13 2,067,884 4.8% 739.59 6,418,780 14.9% 2,295.72
King Co.Seattle 55,303.18 966,875,780 58,011,464 6.0% 1,048.97 58,988,020 6.1% 1,066.63 116,999,485 12.1% 2,115.60Federal Way 22,563.59 334,280,741 18,899,850 5.7% 837.63 21,451,560 6.4% 950.72 40,351,411 12.1% 1,788.34Enumclaw 4,271.23 61,584,065 4,392,107 7.1% 1,028.30 3,710,081 6.0% 868.62 8,102,188 13.2% 1,896.92Mercer Island 4,433.38 66,737,701 5,439,169 8.2% 1,226.87 4,289,589 6.4% 967.57 9,728,758 14.6% 2,194.43Highline 18,918.29 314,693,876 21,711,767 6.9% 1,147.66 19,348,754 6.1% 1,022.75 41,060,522 13.0% 2,170.41Vashon Island 1,513.75 23,897,137 2,309,559 9.7% 1,525.72 1,401,628 5.9% 925.93 3,711,187 15.5% 2,451.65Renton 15,893.05 261,968,174 18,207,716 7.0% 1,145.64 14,648,008 5.6% 921.66 32,855,724 12.5% 2,067.30Skykomish 54.79 2,670,215 395,745 14.8% 7,222.93 0 0.0% 395,745 14.8% 7,222.93Bellevue 20,914.54 348,168,075 28,018,919 8.0% 1,339.69 17,850,561 5.1% 853.50 45,869,481 13.2% 2,193.19Tukwila 2,910.06 49,034,144 3,663,729 7.5% 1,258.99 2,587,904 5.3% 889.30 6,251,634 12.7% 2,148.28Riverview 3,375.28 47,257,070 4,150,751 8.8% 1,229.75 2,602,127 5.5% 770.94 6,752,878 14.3% 2,000.69
115
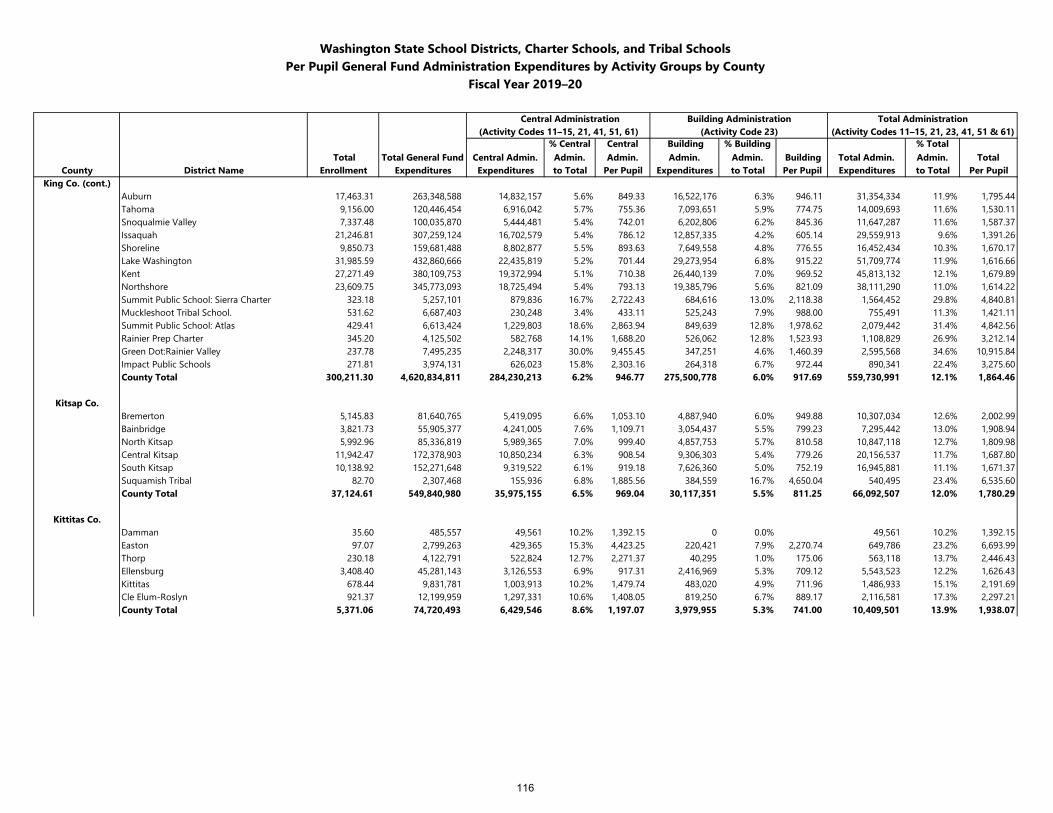
Washington State School Districts, Charter Schools, and Tribal SchoolsPer Pupil General Fund Administration Expenditures by Activity Groups by County
Fiscal Year 2019–20
Central Administration Building Administration Total Administration(Activity Codes 11–15, 21, 41, 51, 61) (Activity Code 23) (Activity Codes 11–15, 21, 23, 41, 51 & 61)
Total Total General Fund Central Admin. % Central Admin.
Central Admin.
Building Admin.
% Building Admin. Building Total Admin.
% Total Admin. Total
County District Name Enrollment Expenditures Expenditures to Total Per Pupil Expenditures to Total Per Pupil Expenditures to Total Per PupilKing Co. (cont.)
Auburn 17,463.31 263,348,588 14,832,157 5.6% 849.33 16,522,176 6.3% 946.11 31,354,334 11.9% 1,795.44Tahoma 9,156.00 120,446,454 6,916,042 5.7% 755.36 7,093,651 5.9% 774.75 14,009,693 11.6% 1,530.11Snoqualmie Valley 7,337.48 100,035,870 5,444,481 5.4% 742.01 6,202,806 6.2% 845.36 11,647,287 11.6% 1,587.37Issaquah 21,246.81 307,259,124 16,702,579 5.4% 786.12 12,857,335 4.2% 605.14 29,559,913 9.6% 1,391.26Shoreline 9,850.73 159,681,488 8,802,877 5.5% 893.63 7,649,558 4.8% 776.55 16,452,434 10.3% 1,670.17Lake Washington 31,985.59 432,860,666 22,435,819 5.2% 701.44 29,273,954 6.8% 915.22 51,709,774 11.9% 1,616.66Kent 27,271.49 380,109,753 19,372,994 5.1% 710.38 26,440,139 7.0% 969.52 45,813,132 12.1% 1,679.89Northshore 23,609.75 345,773,093 18,725,494 5.4% 793.13 19,385,796 5.6% 821.09 38,111,290 11.0% 1,614.22Summit Public School: Sierra Charter 323.18 5,257,101 879,836 16.7% 2,722.43 684,616 13.0% 2,118.38 1,564,452 29.8% 4,840.81Muckleshoot Tribal School. 531.62 6,687,403 230,248 3.4% 433.11 525,243 7.9% 988.00 755,491 11.3% 1,421.11Summit Public School: Atlas 429.41 6,613,424 1,229,803 18.6% 2,863.94 849,639 12.8% 1,978.62 2,079,442 31.4% 4,842.56Rainier Prep Charter 345.20 4,125,502 582,768 14.1% 1,688.20 526,062 12.8% 1,523.93 1,108,829 26.9% 3,212.14Green Dot:Rainier Valley 237.78 7,495,235 2,248,317 30.0% 9,455.45 347,251 4.6% 1,460.39 2,595,568 34.6% 10,915.84Impact Public Schools 271.81 3,974,131 626,023 15.8% 2,303.16 264,318 6.7% 972.44 890,341 22.4% 3,275.60County Total 300,211.30 4,620,834,811 284,230,213 6.2% 946.77 275,500,778 6.0% 917.69 559,730,991 12.1% 1,864.46
Kitsap Co.Bremerton 5,145.83 81,640,765 5,419,095 6.6% 1,053.10 4,887,940 6.0% 949.88 10,307,034 12.6% 2,002.99Bainbridge 3,821.73 55,905,377 4,241,005 7.6% 1,109.71 3,054,437 5.5% 799.23 7,295,442 13.0% 1,908.94North Kitsap 5,992.96 85,336,819 5,989,365 7.0% 999.40 4,857,753 5.7% 810.58 10,847,118 12.7% 1,809.98Central Kitsap 11,942.47 172,378,903 10,850,234 6.3% 908.54 9,306,303 5.4% 779.26 20,156,537 11.7% 1,687.80South Kitsap 10,138.92 152,271,648 9,319,522 6.1% 919.18 7,626,360 5.0% 752.19 16,945,881 11.1% 1,671.37Suquamish Tribal 82.70 2,307,468 155,936 6.8% 1,885.56 384,559 16.7% 4,650.04 540,495 23.4% 6,535.60County Total 37,124.61 549,840,980 35,975,155 6.5% 969.04 30,117,351 5.5% 811.25 66,092,507 12.0% 1,780.29
Kittitas Co.Damman 35.60 485,557 49,561 10.2% 1,392.15 0 0.0% 49,561 10.2% 1,392.15Easton 97.07 2,799,263 429,365 15.3% 4,423.25 220,421 7.9% 2,270.74 649,786 23.2% 6,693.99Thorp 230.18 4,122,791 522,824 12.7% 2,271.37 40,295 1.0% 175.06 563,118 13.7% 2,446.43Ellensburg 3,408.40 45,281,143 3,126,553 6.9% 917.31 2,416,969 5.3% 709.12 5,543,523 12.2% 1,626.43Kittitas 678.44 9,831,781 1,003,913 10.2% 1,479.74 483,020 4.9% 711.96 1,486,933 15.1% 2,191.69Cle Elum-Roslyn 921.37 12,199,959 1,297,331 10.6% 1,408.05 819,250 6.7% 889.17 2,116,581 17.3% 2,297.21County Total 5,371.06 74,720,493 6,429,546 8.6% 1,197.07 3,979,955 5.3% 741.00 10,409,501 13.9% 1,938.07
116
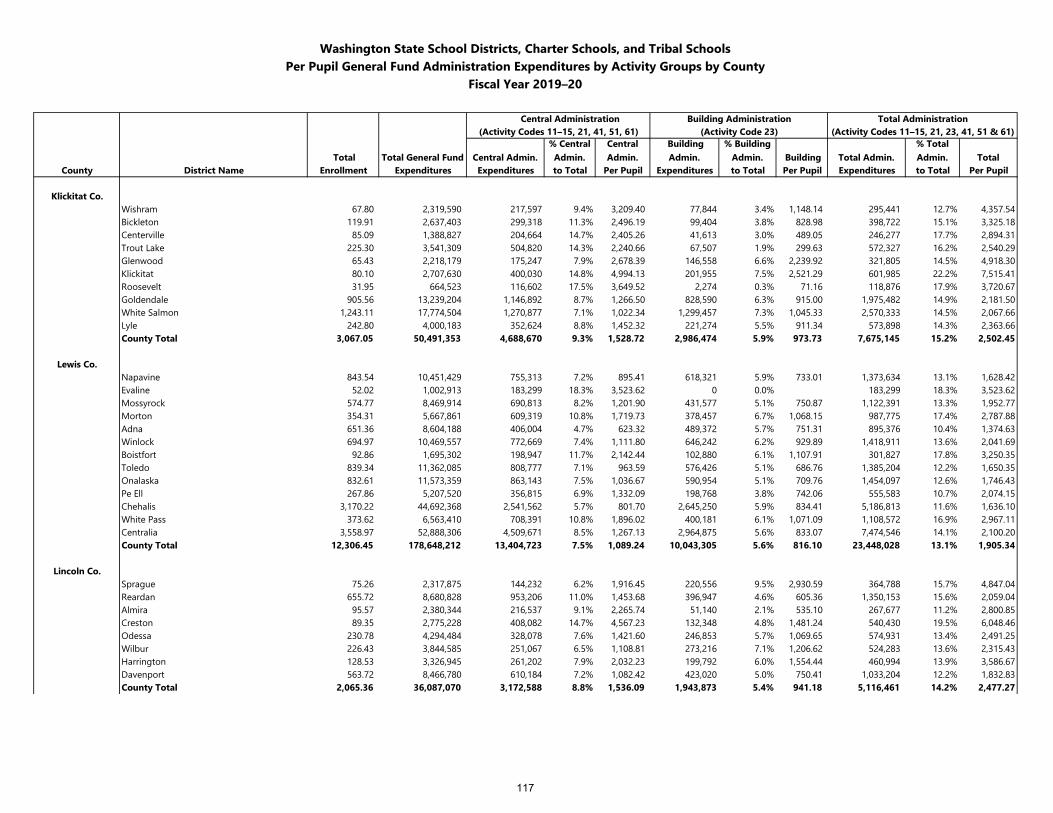
Washington State School Districts, Charter Schools, and Tribal SchoolsPer Pupil General Fund Administration Expenditures by Activity Groups by County
Fiscal Year 2019–20
Central Administration Building Administration Total Administration(Activity Codes 11–15, 21, 41, 51, 61) (Activity Code 23) (Activity Codes 11–15, 21, 23, 41, 51 & 61)
Total Total General Fund Central Admin. % Central Admin.
Central Admin.
Building Admin.
% Building Admin. Building Total Admin.
% Total Admin. Total
County District Name Enrollment Expenditures Expenditures to Total Per Pupil Expenditures to Total Per Pupil Expenditures to Total Per Pupil
Klickitat Co.Wishram 67.80 2,319,590 217,597 9.4% 3,209.40 77,844 3.4% 1,148.14 295,441 12.7% 4,357.54Bickleton 119.91 2,637,403 299,318 11.3% 2,496.19 99,404 3.8% 828.98 398,722 15.1% 3,325.18Centerville 85.09 1,388,827 204,664 14.7% 2,405.26 41,613 3.0% 489.05 246,277 17.7% 2,894.31Trout Lake 225.30 3,541,309 504,820 14.3% 2,240.66 67,507 1.9% 299.63 572,327 16.2% 2,540.29Glenwood 65.43 2,218,179 175,247 7.9% 2,678.39 146,558 6.6% 2,239.92 321,805 14.5% 4,918.30Klickitat 80.10 2,707,630 400,030 14.8% 4,994.13 201,955 7.5% 2,521.29 601,985 22.2% 7,515.41Roosevelt 31.95 664,523 116,602 17.5% 3,649.52 2,274 0.3% 71.16 118,876 17.9% 3,720.67Goldendale 905.56 13,239,204 1,146,892 8.7% 1,266.50 828,590 6.3% 915.00 1,975,482 14.9% 2,181.50White Salmon 1,243.11 17,774,504 1,270,877 7.1% 1,022.34 1,299,457 7.3% 1,045.33 2,570,333 14.5% 2,067.66Lyle 242.80 4,000,183 352,624 8.8% 1,452.32 221,274 5.5% 911.34 573,898 14.3% 2,363.66County Total 3,067.05 50,491,353 4,688,670 9.3% 1,528.72 2,986,474 5.9% 973.73 7,675,145 15.2% 2,502.45
Lewis Co.Napavine 843.54 10,451,429 755,313 7.2% 895.41 618,321 5.9% 733.01 1,373,634 13.1% 1,628.42Evaline 52.02 1,002,913 183,299 18.3% 3,523.62 0 0.0% 183,299 18.3% 3,523.62Mossyrock 574.77 8,469,914 690,813 8.2% 1,201.90 431,577 5.1% 750.87 1,122,391 13.3% 1,952.77Morton 354.31 5,667,861 609,319 10.8% 1,719.73 378,457 6.7% 1,068.15 987,775 17.4% 2,787.88Adna 651.36 8,604,188 406,004 4.7% 623.32 489,372 5.7% 751.31 895,376 10.4% 1,374.63Winlock 694.97 10,469,557 772,669 7.4% 1,111.80 646,242 6.2% 929.89 1,418,911 13.6% 2,041.69Boistfort 92.86 1,695,302 198,947 11.7% 2,142.44 102,880 6.1% 1,107.91 301,827 17.8% 3,250.35Toledo 839.34 11,362,085 808,777 7.1% 963.59 576,426 5.1% 686.76 1,385,204 12.2% 1,650.35Onalaska 832.61 11,573,359 863,143 7.5% 1,036.67 590,954 5.1% 709.76 1,454,097 12.6% 1,746.43Pe Ell 267.86 5,207,520 356,815 6.9% 1,332.09 198,768 3.8% 742.06 555,583 10.7% 2,074.15Chehalis 3,170.22 44,692,368 2,541,562 5.7% 801.70 2,645,250 5.9% 834.41 5,186,813 11.6% 1,636.10White Pass 373.62 6,563,410 708,391 10.8% 1,896.02 400,181 6.1% 1,071.09 1,108,572 16.9% 2,967.11Centralia 3,558.97 52,888,306 4,509,671 8.5% 1,267.13 2,964,875 5.6% 833.07 7,474,546 14.1% 2,100.20County Total 12,306.45 178,648,212 13,404,723 7.5% 1,089.24 10,043,305 5.6% 816.10 23,448,028 13.1% 1,905.34
Lincoln Co.Sprague 75.26 2,317,875 144,232 6.2% 1,916.45 220,556 9.5% 2,930.59 364,788 15.7% 4,847.04Reardan 655.72 8,680,828 953,206 11.0% 1,453.68 396,947 4.6% 605.36 1,350,153 15.6% 2,059.04Almira 95.57 2,380,344 216,537 9.1% 2,265.74 51,140 2.1% 535.10 267,677 11.2% 2,800.85Creston 89.35 2,775,228 408,082 14.7% 4,567.23 132,348 4.8% 1,481.24 540,430 19.5% 6,048.46Odessa 230.78 4,294,484 328,078 7.6% 1,421.60 246,853 5.7% 1,069.65 574,931 13.4% 2,491.25Wilbur 226.43 3,844,585 251,067 6.5% 1,108.81 273,216 7.1% 1,206.62 524,283 13.6% 2,315.43Harrington 128.53 3,326,945 261,202 7.9% 2,032.23 199,792 6.0% 1,554.44 460,994 13.9% 3,586.67Davenport 563.72 8,466,780 610,184 7.2% 1,082.42 423,020 5.0% 750.41 1,033,204 12.2% 1,832.83County Total 2,065.36 36,087,070 3,172,588 8.8% 1,536.09 1,943,873 5.4% 941.18 5,116,461 14.2% 2,477.27
117
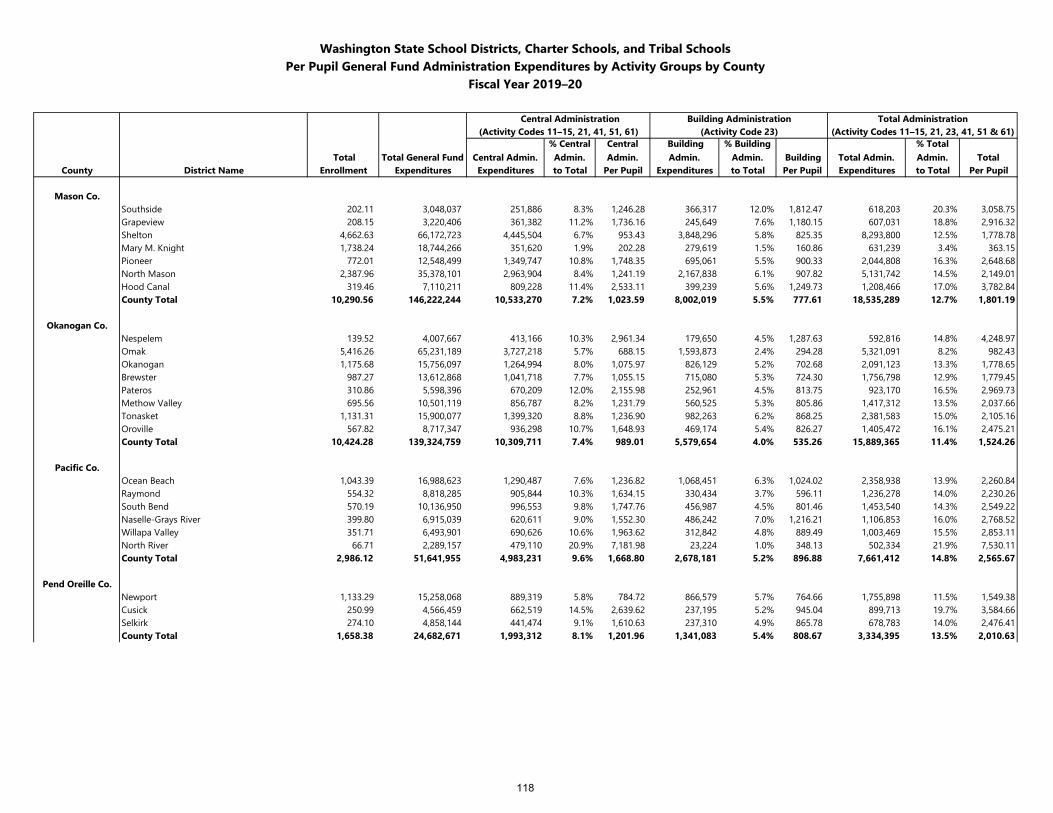
Washington State School Districts, Charter Schools, and Tribal SchoolsPer Pupil General Fund Administration Expenditures by Activity Groups by County
Fiscal Year 2019–20
Central Administration Building Administration Total Administration(Activity Codes 11–15, 21, 41, 51, 61) (Activity Code 23) (Activity Codes 11–15, 21, 23, 41, 51 & 61)
Total Total General Fund Central Admin. % Central Admin.
Central Admin.
Building Admin.
% Building Admin. Building Total Admin.
% Total Admin. Total
County District Name Enrollment Expenditures Expenditures to Total Per Pupil Expenditures to Total Per Pupil Expenditures to Total Per Pupil
Mason Co.Southside 202.11 3,048,037 251,886 8.3% 1,246.28 366,317 12.0% 1,812.47 618,203 20.3% 3,058.75Grapeview 208.15 3,220,406 361,382 11.2% 1,736.16 245,649 7.6% 1,180.15 607,031 18.8% 2,916.32Shelton 4,662.63 66,172,723 4,445,504 6.7% 953.43 3,848,296 5.8% 825.35 8,293,800 12.5% 1,778.78Mary M. Knight 1,738.24 18,744,266 351,620 1.9% 202.28 279,619 1.5% 160.86 631,239 3.4% 363.15Pioneer 772.01 12,548,499 1,349,747 10.8% 1,748.35 695,061 5.5% 900.33 2,044,808 16.3% 2,648.68North Mason 2,387.96 35,378,101 2,963,904 8.4% 1,241.19 2,167,838 6.1% 907.82 5,131,742 14.5% 2,149.01Hood Canal 319.46 7,110,211 809,228 11.4% 2,533.11 399,239 5.6% 1,249.73 1,208,466 17.0% 3,782.84County Total 10,290.56 146,222,244 10,533,270 7.2% 1,023.59 8,002,019 5.5% 777.61 18,535,289 12.7% 1,801.19
Okanogan Co.Nespelem 139.52 4,007,667 413,166 10.3% 2,961.34 179,650 4.5% 1,287.63 592,816 14.8% 4,248.97Omak 5,416.26 65,231,189 3,727,218 5.7% 688.15 1,593,873 2.4% 294.28 5,321,091 8.2% 982.43Okanogan 1,175.68 15,756,097 1,264,994 8.0% 1,075.97 826,129 5.2% 702.68 2,091,123 13.3% 1,778.65Brewster 987.27 13,612,868 1,041,718 7.7% 1,055.15 715,080 5.3% 724.30 1,756,798 12.9% 1,779.45Pateros 310.86 5,598,396 670,209 12.0% 2,155.98 252,961 4.5% 813.75 923,170 16.5% 2,969.73Methow Valley 695.56 10,501,119 856,787 8.2% 1,231.79 560,525 5.3% 805.86 1,417,312 13.5% 2,037.66Tonasket 1,131.31 15,900,077 1,399,320 8.8% 1,236.90 982,263 6.2% 868.25 2,381,583 15.0% 2,105.16Oroville 567.82 8,717,347 936,298 10.7% 1,648.93 469,174 5.4% 826.27 1,405,472 16.1% 2,475.21County Total 10,424.28 139,324,759 10,309,711 7.4% 989.01 5,579,654 4.0% 535.26 15,889,365 11.4% 1,524.26
Pacific Co.Ocean Beach 1,043.39 16,988,623 1,290,487 7.6% 1,236.82 1,068,451 6.3% 1,024.02 2,358,938 13.9% 2,260.84Raymond 554.32 8,818,285 905,844 10.3% 1,634.15 330,434 3.7% 596.11 1,236,278 14.0% 2,230.26South Bend 570.19 10,136,950 996,553 9.8% 1,747.76 456,987 4.5% 801.46 1,453,540 14.3% 2,549.22Naselle-Grays River 399.80 6,915,039 620,611 9.0% 1,552.30 486,242 7.0% 1,216.21 1,106,853 16.0% 2,768.52Willapa Valley 351.71 6,493,901 690,626 10.6% 1,963.62 312,842 4.8% 889.49 1,003,469 15.5% 2,853.11North River 66.71 2,289,157 479,110 20.9% 7,181.98 23,224 1.0% 348.13 502,334 21.9% 7,530.11County Total 2,986.12 51,641,955 4,983,231 9.6% 1,668.80 2,678,181 5.2% 896.88 7,661,412 14.8% 2,565.67
Pend Oreille Co.Newport 1,133.29 15,258,068 889,319 5.8% 784.72 866,579 5.7% 764.66 1,755,898 11.5% 1,549.38Cusick 250.99 4,566,459 662,519 14.5% 2,639.62 237,195 5.2% 945.04 899,713 19.7% 3,584.66Selkirk 274.10 4,858,144 441,474 9.1% 1,610.63 237,310 4.9% 865.78 678,783 14.0% 2,476.41County Total 1,658.38 24,682,671 1,993,312 8.1% 1,201.96 1,341,083 5.4% 808.67 3,334,395 13.5% 2,010.63
118
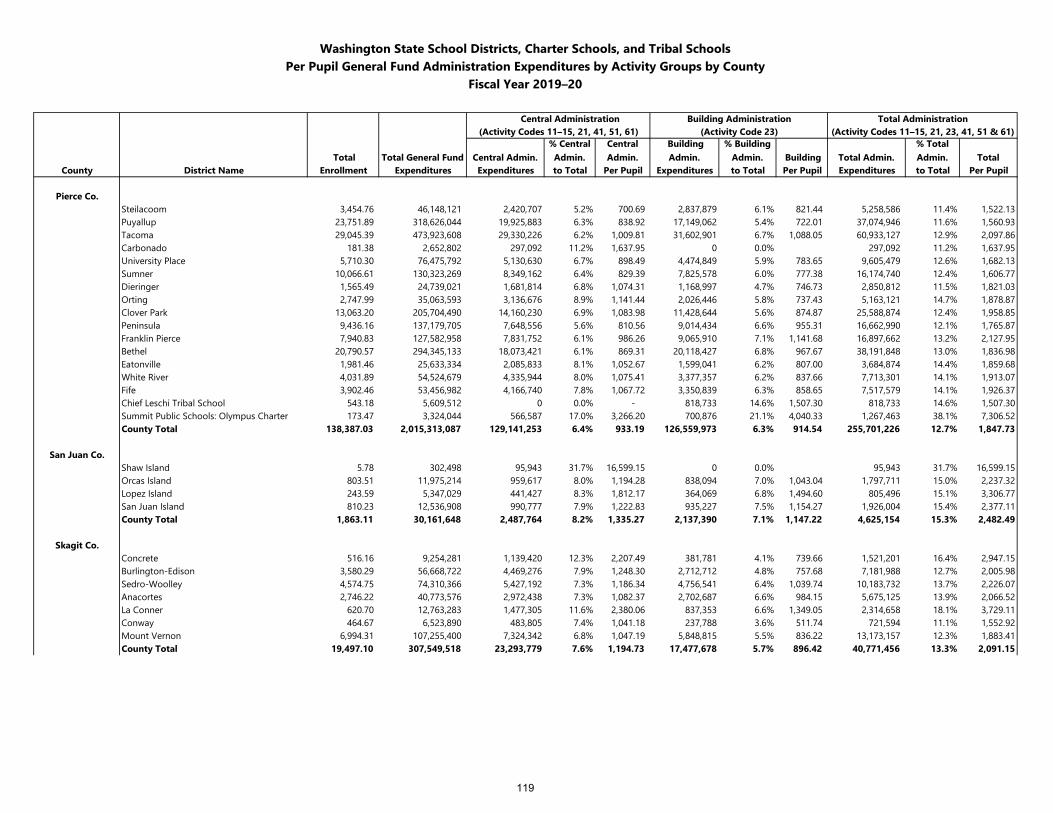
Washington State School Districts, Charter Schools, and Tribal SchoolsPer Pupil General Fund Administration Expenditures by Activity Groups by County
Fiscal Year 2019–20
Central Administration Building Administration Total Administration(Activity Codes 11–15, 21, 41, 51, 61) (Activity Code 23) (Activity Codes 11–15, 21, 23, 41, 51 & 61)
Total Total General Fund Central Admin. % Central Admin.
Central Admin.
Building Admin.
% Building Admin. Building Total Admin.
% Total Admin. Total
County District Name Enrollment Expenditures Expenditures to Total Per Pupil Expenditures to Total Per Pupil Expenditures to Total Per Pupil
Pierce Co.Steilacoom 3,454.76 46,148,121 2,420,707 5.2% 700.69 2,837,879 6.1% 821.44 5,258,586 11.4% 1,522.13Puyallup 23,751.89 318,626,044 19,925,883 6.3% 838.92 17,149,062 5.4% 722.01 37,074,946 11.6% 1,560.93Tacoma 29,045.39 473,923,608 29,330,226 6.2% 1,009.81 31,602,901 6.7% 1,088.05 60,933,127 12.9% 2,097.86Carbonado 181.38 2,652,802 297,092 11.2% 1,637.95 0 0.0% 297,092 11.2% 1,637.95University Place 5,710.30 76,475,792 5,130,630 6.7% 898.49 4,474,849 5.9% 783.65 9,605,479 12.6% 1,682.13Sumner 10,066.61 130,323,269 8,349,162 6.4% 829.39 7,825,578 6.0% 777.38 16,174,740 12.4% 1,606.77Dieringer 1,565.49 24,739,021 1,681,814 6.8% 1,074.31 1,168,997 4.7% 746.73 2,850,812 11.5% 1,821.03Orting 2,747.99 35,063,593 3,136,676 8.9% 1,141.44 2,026,446 5.8% 737.43 5,163,121 14.7% 1,878.87Clover Park 13,063.20 205,704,490 14,160,230 6.9% 1,083.98 11,428,644 5.6% 874.87 25,588,874 12.4% 1,958.85Peninsula 9,436.16 137,179,705 7,648,556 5.6% 810.56 9,014,434 6.6% 955.31 16,662,990 12.1% 1,765.87Franklin Pierce 7,940.83 127,582,958 7,831,752 6.1% 986.26 9,065,910 7.1% 1,141.68 16,897,662 13.2% 2,127.95Bethel 20,790.57 294,345,133 18,073,421 6.1% 869.31 20,118,427 6.8% 967.67 38,191,848 13.0% 1,836.98Eatonville 1,981.46 25,633,334 2,085,833 8.1% 1,052.67 1,599,041 6.2% 807.00 3,684,874 14.4% 1,859.68White River 4,031.89 54,524,679 4,335,944 8.0% 1,075.41 3,377,357 6.2% 837.66 7,713,301 14.1% 1,913.07Fife 3,902.46 53,456,982 4,166,740 7.8% 1,067.72 3,350,839 6.3% 858.65 7,517,579 14.1% 1,926.37Chief Leschi Tribal School 543.18 5,609,512 0 0.0% - 818,733 14.6% 1,507.30 818,733 14.6% 1,507.30Summit Public Schools: Olympus Charter 173.47 3,324,044 566,587 17.0% 3,266.20 700,876 21.1% 4,040.33 1,267,463 38.1% 7,306.52County Total 138,387.03 2,015,313,087 129,141,253 6.4% 933.19 126,559,973 6.3% 914.54 255,701,226 12.7% 1,847.73
San Juan Co.Shaw Island 5.78 302,498 95,943 31.7% 16,599.15 0 0.0% 95,943 31.7% 16,599.15Orcas Island 803.51 11,975,214 959,617 8.0% 1,194.28 838,094 7.0% 1,043.04 1,797,711 15.0% 2,237.32Lopez Island 243.59 5,347,029 441,427 8.3% 1,812.17 364,069 6.8% 1,494.60 805,496 15.1% 3,306.77San Juan Island 810.23 12,536,908 990,777 7.9% 1,222.83 935,227 7.5% 1,154.27 1,926,004 15.4% 2,377.11County Total 1,863.11 30,161,648 2,487,764 8.2% 1,335.27 2,137,390 7.1% 1,147.22 4,625,154 15.3% 2,482.49
Skagit Co.Concrete 516.16 9,254,281 1,139,420 12.3% 2,207.49 381,781 4.1% 739.66 1,521,201 16.4% 2,947.15Burlington-Edison 3,580.29 56,668,722 4,469,276 7.9% 1,248.30 2,712,712 4.8% 757.68 7,181,988 12.7% 2,005.98Sedro-Woolley 4,574.75 74,310,366 5,427,192 7.3% 1,186.34 4,756,541 6.4% 1,039.74 10,183,732 13.7% 2,226.07Anacortes 2,746.22 40,773,576 2,972,438 7.3% 1,082.37 2,702,687 6.6% 984.15 5,675,125 13.9% 2,066.52La Conner 620.70 12,763,283 1,477,305 11.6% 2,380.06 837,353 6.6% 1,349.05 2,314,658 18.1% 3,729.11Conway 464.67 6,523,890 483,805 7.4% 1,041.18 237,788 3.6% 511.74 721,594 11.1% 1,552.92Mount Vernon 6,994.31 107,255,400 7,324,342 6.8% 1,047.19 5,848,815 5.5% 836.22 13,173,157 12.3% 1,883.41County Total 19,497.10 307,549,518 23,293,779 7.6% 1,194.73 17,477,678 5.7% 896.42 40,771,456 13.3% 2,091.15
119
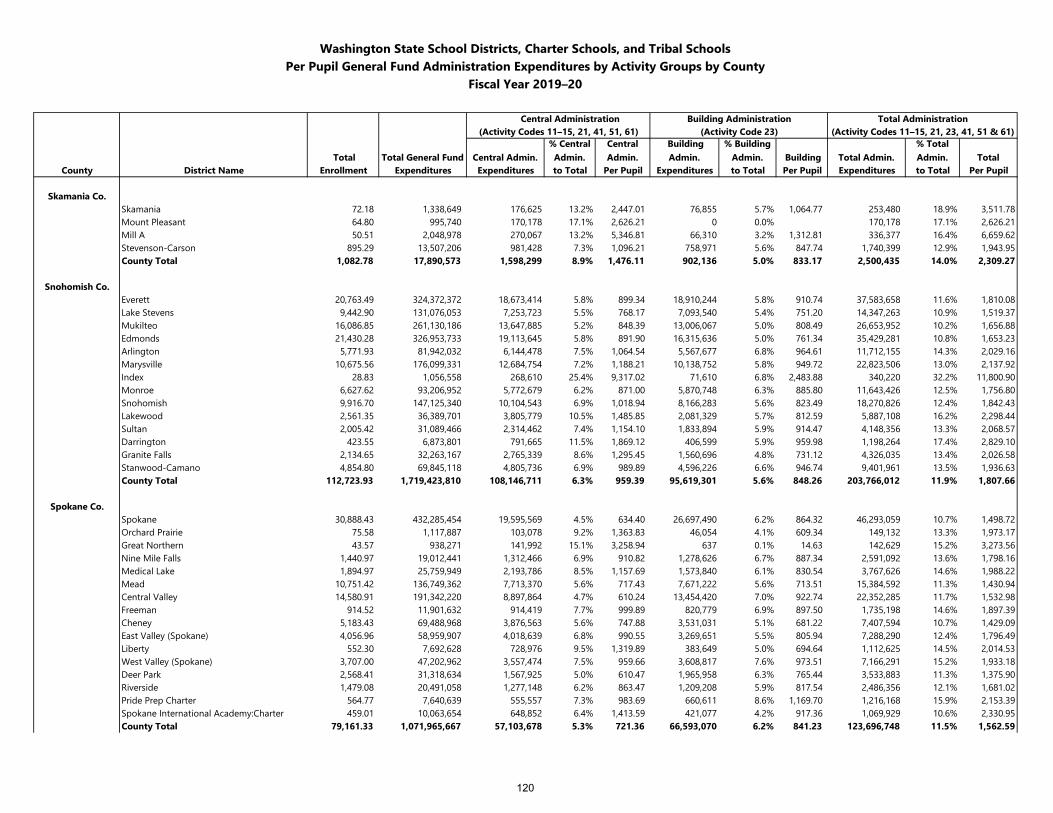
Washington State School Districts, Charter Schools, and Tribal SchoolsPer Pupil General Fund Administration Expenditures by Activity Groups by County
Fiscal Year 2019–20
Central Administration Building Administration Total Administration(Activity Codes 11–15, 21, 41, 51, 61) (Activity Code 23) (Activity Codes 11–15, 21, 23, 41, 51 & 61)
Total Total General Fund Central Admin. % Central Admin.
Central Admin.
Building Admin.
% Building Admin. Building Total Admin.
% Total Admin. Total
County District Name Enrollment Expenditures Expenditures to Total Per Pupil Expenditures to Total Per Pupil Expenditures to Total Per Pupil
Skamania Co.Skamania 72.18 1,338,649 176,625 13.2% 2,447.01 76,855 5.7% 1,064.77 253,480 18.9% 3,511.78Mount Pleasant 64.80 995,740 170,178 17.1% 2,626.21 0 0.0% 170,178 17.1% 2,626.21Mill A 50.51 2,048,978 270,067 13.2% 5,346.81 66,310 3.2% 1,312.81 336,377 16.4% 6,659.62Stevenson-Carson 895.29 13,507,206 981,428 7.3% 1,096.21 758,971 5.6% 847.74 1,740,399 12.9% 1,943.95County Total 1,082.78 17,890,573 1,598,299 8.9% 1,476.11 902,136 5.0% 833.17 2,500,435 14.0% 2,309.27
Snohomish Co.Everett 20,763.49 324,372,372 18,673,414 5.8% 899.34 18,910,244 5.8% 910.74 37,583,658 11.6% 1,810.08Lake Stevens 9,442.90 131,076,053 7,253,723 5.5% 768.17 7,093,540 5.4% 751.20 14,347,263 10.9% 1,519.37Mukilteo 16,086.85 261,130,186 13,647,885 5.2% 848.39 13,006,067 5.0% 808.49 26,653,952 10.2% 1,656.88Edmonds 21,430.28 326,953,733 19,113,645 5.8% 891.90 16,315,636 5.0% 761.34 35,429,281 10.8% 1,653.23Arlington 5,771.93 81,942,032 6,144,478 7.5% 1,064.54 5,567,677 6.8% 964.61 11,712,155 14.3% 2,029.16Marysville 10,675.56 176,099,331 12,684,754 7.2% 1,188.21 10,138,752 5.8% 949.72 22,823,506 13.0% 2,137.92Index 28.83 1,056,558 268,610 25.4% 9,317.02 71,610 6.8% 2,483.88 340,220 32.2% 11,800.90Monroe 6,627.62 93,206,952 5,772,679 6.2% 871.00 5,870,748 6.3% 885.80 11,643,426 12.5% 1,756.80Snohomish 9,916.70 147,125,340 10,104,543 6.9% 1,018.94 8,166,283 5.6% 823.49 18,270,826 12.4% 1,842.43Lakewood 2,561.35 36,389,701 3,805,779 10.5% 1,485.85 2,081,329 5.7% 812.59 5,887,108 16.2% 2,298.44Sultan 2,005.42 31,089,466 2,314,462 7.4% 1,154.10 1,833,894 5.9% 914.47 4,148,356 13.3% 2,068.57Darrington 423.55 6,873,801 791,665 11.5% 1,869.12 406,599 5.9% 959.98 1,198,264 17.4% 2,829.10Granite Falls 2,134.65 32,263,167 2,765,339 8.6% 1,295.45 1,560,696 4.8% 731.12 4,326,035 13.4% 2,026.58Stanwood-Camano 4,854.80 69,845,118 4,805,736 6.9% 989.89 4,596,226 6.6% 946.74 9,401,961 13.5% 1,936.63County Total 112,723.93 1,719,423,810 108,146,711 6.3% 959.39 95,619,301 5.6% 848.26 203,766,012 11.9% 1,807.66
Spokane Co.Spokane 30,888.43 432,285,454 19,595,569 4.5% 634.40 26,697,490 6.2% 864.32 46,293,059 10.7% 1,498.72Orchard Prairie 75.58 1,117,887 103,078 9.2% 1,363.83 46,054 4.1% 609.34 149,132 13.3% 1,973.17Great Northern 43.57 938,271 141,992 15.1% 3,258.94 637 0.1% 14.63 142,629 15.2% 3,273.56Nine Mile Falls 1,440.97 19,012,441 1,312,466 6.9% 910.82 1,278,626 6.7% 887.34 2,591,092 13.6% 1,798.16Medical Lake 1,894.97 25,759,949 2,193,786 8.5% 1,157.69 1,573,840 6.1% 830.54 3,767,626 14.6% 1,988.22Mead 10,751.42 136,749,362 7,713,370 5.6% 717.43 7,671,222 5.6% 713.51 15,384,592 11.3% 1,430.94Central Valley 14,580.91 191,342,220 8,897,864 4.7% 610.24 13,454,420 7.0% 922.74 22,352,285 11.7% 1,532.98Freeman 914.52 11,901,632 914,419 7.7% 999.89 820,779 6.9% 897.50 1,735,198 14.6% 1,897.39Cheney 5,183.43 69,488,968 3,876,563 5.6% 747.88 3,531,031 5.1% 681.22 7,407,594 10.7% 1,429.09East Valley (Spokane) 4,056.96 58,959,907 4,018,639 6.8% 990.55 3,269,651 5.5% 805.94 7,288,290 12.4% 1,796.49Liberty 552.30 7,692,628 728,976 9.5% 1,319.89 383,649 5.0% 694.64 1,112,625 14.5% 2,014.53West Valley (Spokane) 3,707.00 47,202,962 3,557,474 7.5% 959.66 3,608,817 7.6% 973.51 7,166,291 15.2% 1,933.18Deer Park 2,568.41 31,318,634 1,567,925 5.0% 610.47 1,965,958 6.3% 765.44 3,533,883 11.3% 1,375.90Riverside 1,479.08 20,491,058 1,277,148 6.2% 863.47 1,209,208 5.9% 817.54 2,486,356 12.1% 1,681.02Pride Prep Charter 564.77 7,640,639 555,557 7.3% 983.69 660,611 8.6% 1,169.70 1,216,168 15.9% 2,153.39Spokane International Academy:Charter 459.01 10,063,654 648,852 6.4% 1,413.59 421,077 4.2% 917.36 1,069,929 10.6% 2,330.95County Total 79,161.33 1,071,965,667 57,103,678 5.3% 721.36 66,593,070 6.2% 841.23 123,696,748 11.5% 1,562.59
120
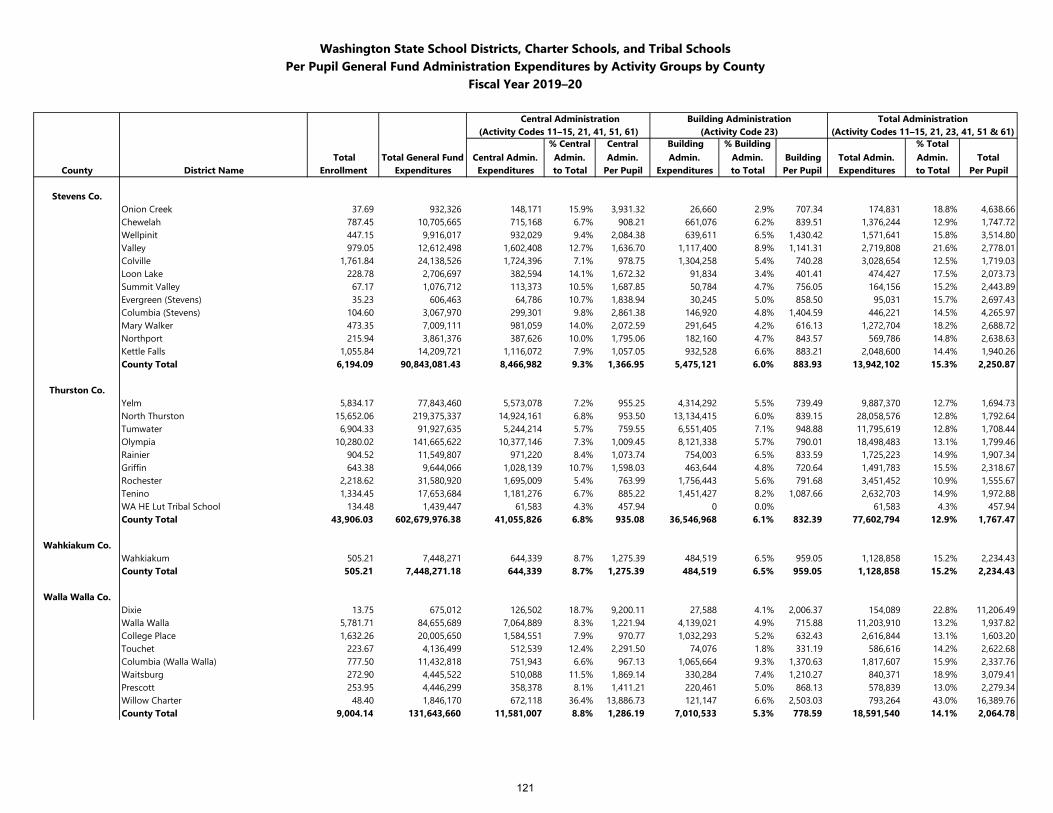
Washington State School Districts, Charter Schools, and Tribal SchoolsPer Pupil General Fund Administration Expenditures by Activity Groups by County
Fiscal Year 2019–20
Central Administration Building Administration Total Administration(Activity Codes 11–15, 21, 41, 51, 61) (Activity Code 23) (Activity Codes 11–15, 21, 23, 41, 51 & 61)
Total Total General Fund Central Admin. % Central Admin.
Central Admin.
Building Admin.
% Building Admin. Building Total Admin.
% Total Admin. Total
County District Name Enrollment Expenditures Expenditures to Total Per Pupil Expenditures to Total Per Pupil Expenditures to Total Per Pupil
Stevens Co.Onion Creek 37.69 932,326 148,171 15.9% 3,931.32 26,660 2.9% 707.34 174,831 18.8% 4,638.66Chewelah 787.45 10,705,665 715,168 6.7% 908.21 661,076 6.2% 839.51 1,376,244 12.9% 1,747.72Wellpinit 447.15 9,916,017 932,029 9.4% 2,084.38 639,611 6.5% 1,430.42 1,571,641 15.8% 3,514.80Valley 979.05 12,612,498 1,602,408 12.7% 1,636.70 1,117,400 8.9% 1,141.31 2,719,808 21.6% 2,778.01Colville 1,761.84 24,138,526 1,724,396 7.1% 978.75 1,304,258 5.4% 740.28 3,028,654 12.5% 1,719.03Loon Lake 228.78 2,706,697 382,594 14.1% 1,672.32 91,834 3.4% 401.41 474,427 17.5% 2,073.73Summit Valley 67.17 1,076,712 113,373 10.5% 1,687.85 50,784 4.7% 756.05 164,156 15.2% 2,443.89Evergreen (Stevens) 35.23 606,463 64,786 10.7% 1,838.94 30,245 5.0% 858.50 95,031 15.7% 2,697.43Columbia (Stevens) 104.60 3,067,970 299,301 9.8% 2,861.38 146,920 4.8% 1,404.59 446,221 14.5% 4,265.97Mary Walker 473.35 7,009,111 981,059 14.0% 2,072.59 291,645 4.2% 616.13 1,272,704 18.2% 2,688.72Northport 215.94 3,861,376 387,626 10.0% 1,795.06 182,160 4.7% 843.57 569,786 14.8% 2,638.63Kettle Falls 1,055.84 14,209,721 1,116,072 7.9% 1,057.05 932,528 6.6% 883.21 2,048,600 14.4% 1,940.26County Total 6,194.09 90,843,081.43 8,466,982 9.3% 1,366.95 5,475,121 6.0% 883.93 13,942,102 15.3% 2,250.87
Thurston Co.Yelm 5,834.17 77,843,460 5,573,078 7.2% 955.25 4,314,292 5.5% 739.49 9,887,370 12.7% 1,694.73North Thurston 15,652.06 219,375,337 14,924,161 6.8% 953.50 13,134,415 6.0% 839.15 28,058,576 12.8% 1,792.64Tumwater 6,904.33 91,927,635 5,244,214 5.7% 759.55 6,551,405 7.1% 948.88 11,795,619 12.8% 1,708.44Olympia 10,280.02 141,665,622 10,377,146 7.3% 1,009.45 8,121,338 5.7% 790.01 18,498,483 13.1% 1,799.46Rainier 904.52 11,549,807 971,220 8.4% 1,073.74 754,003 6.5% 833.59 1,725,223 14.9% 1,907.34Griffin 643.38 9,644,066 1,028,139 10.7% 1,598.03 463,644 4.8% 720.64 1,491,783 15.5% 2,318.67Rochester 2,218.62 31,580,920 1,695,009 5.4% 763.99 1,756,443 5.6% 791.68 3,451,452 10.9% 1,555.67Tenino 1,334.45 17,653,684 1,181,276 6.7% 885.22 1,451,427 8.2% 1,087.66 2,632,703 14.9% 1,972.88WA HE Lut Tribal School 134.48 1,439,447 61,583 4.3% 457.94 0 0.0% 61,583 4.3% 457.94County Total 43,906.03 602,679,976.38 41,055,826 6.8% 935.08 36,546,968 6.1% 832.39 77,602,794 12.9% 1,767.47
Wahkiakum Co.Wahkiakum 505.21 7,448,271 644,339 8.7% 1,275.39 484,519 6.5% 959.05 1,128,858 15.2% 2,234.43County Total 505.21 7,448,271.18 644,339 8.7% 1,275.39 484,519 6.5% 959.05 1,128,858 15.2% 2,234.43
Walla Walla Co.Dixie 13.75 675,012 126,502 18.7% 9,200.11 27,588 4.1% 2,006.37 154,089 22.8% 11,206.49Walla Walla 5,781.71 84,655,689 7,064,889 8.3% 1,221.94 4,139,021 4.9% 715.88 11,203,910 13.2% 1,937.82College Place 1,632.26 20,005,650 1,584,551 7.9% 970.77 1,032,293 5.2% 632.43 2,616,844 13.1% 1,603.20Touchet 223.67 4,136,499 512,539 12.4% 2,291.50 74,076 1.8% 331.19 586,616 14.2% 2,622.68Columbia (Walla Walla) 777.50 11,432,818 751,943 6.6% 967.13 1,065,664 9.3% 1,370.63 1,817,607 15.9% 2,337.76Waitsburg 272.90 4,445,522 510,088 11.5% 1,869.14 330,284 7.4% 1,210.27 840,371 18.9% 3,079.41Prescott 253.95 4,446,299 358,378 8.1% 1,411.21 220,461 5.0% 868.13 578,839 13.0% 2,279.34Willow Charter 48.40 1,846,170 672,118 36.4% 13,886.73 121,147 6.6% 2,503.03 793,264 43.0% 16,389.76County Total 9,004.14 131,643,660 11,581,007 8.8% 1,286.19 7,010,533 5.3% 778.59 18,591,540 14.1% 2,064.78
121
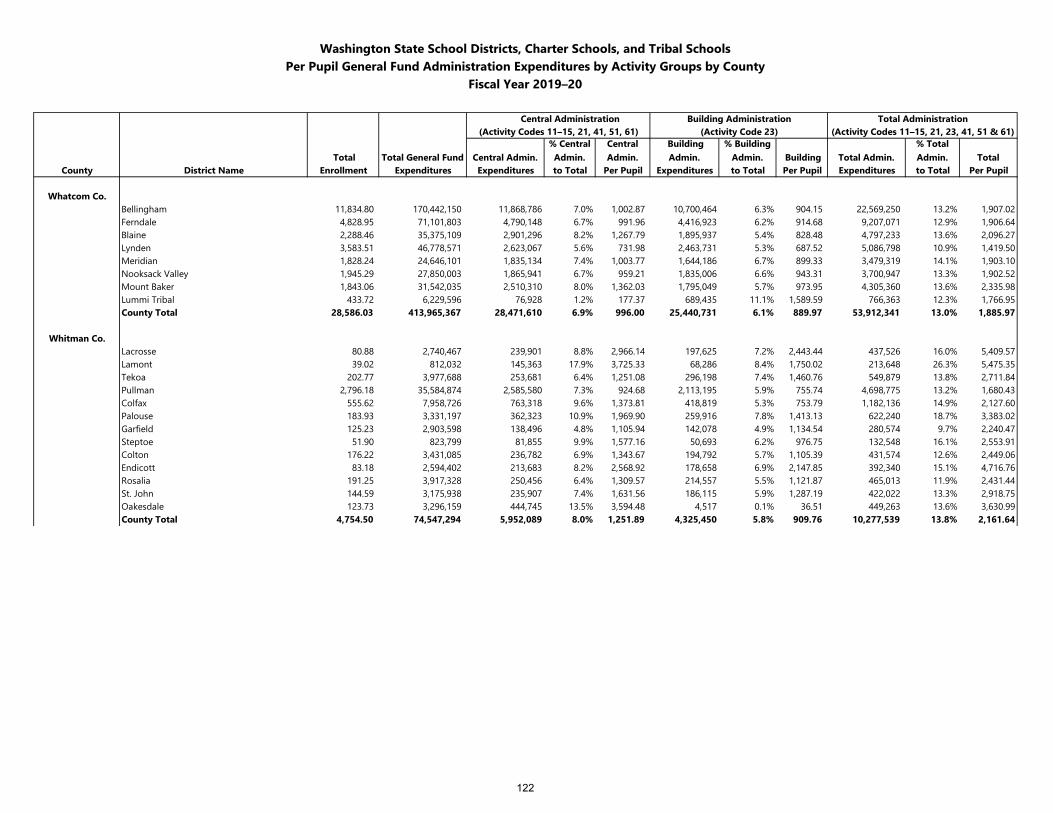
Washington State School Districts, Charter Schools, and Tribal SchoolsPer Pupil General Fund Administration Expenditures by Activity Groups by County
Fiscal Year 2019–20
Central Administration Building Administration Total Administration(Activity Codes 11–15, 21, 41, 51, 61) (Activity Code 23) (Activity Codes 11–15, 21, 23, 41, 51 & 61)
Total Total General Fund Central Admin. % Central Admin.
Central Admin.
Building Admin.
% Building Admin. Building Total Admin.
% Total Admin. Total
County District Name Enrollment Expenditures Expenditures to Total Per Pupil Expenditures to Total Per Pupil Expenditures to Total Per Pupil
Whatcom Co.Bellingham 11,834.80 170,442,150 11,868,786 7.0% 1,002.87 10,700,464 6.3% 904.15 22,569,250 13.2% 1,907.02Ferndale 4,828.95 71,101,803 4,790,148 6.7% 991.96 4,416,923 6.2% 914.68 9,207,071 12.9% 1,906.64Blaine 2,288.46 35,375,109 2,901,296 8.2% 1,267.79 1,895,937 5.4% 828.48 4,797,233 13.6% 2,096.27Lynden 3,583.51 46,778,571 2,623,067 5.6% 731.98 2,463,731 5.3% 687.52 5,086,798 10.9% 1,419.50Meridian 1,828.24 24,646,101 1,835,134 7.4% 1,003.77 1,644,186 6.7% 899.33 3,479,319 14.1% 1,903.10Nooksack Valley 1,945.29 27,850,003 1,865,941 6.7% 959.21 1,835,006 6.6% 943.31 3,700,947 13.3% 1,902.52Mount Baker 1,843.06 31,542,035 2,510,310 8.0% 1,362.03 1,795,049 5.7% 973.95 4,305,360 13.6% 2,335.98Lummi Tribal 433.72 6,229,596 76,928 1.2% 177.37 689,435 11.1% 1,589.59 766,363 12.3% 1,766.95County Total 28,586.03 413,965,367 28,471,610 6.9% 996.00 25,440,731 6.1% 889.97 53,912,341 13.0% 1,885.97
Whitman Co.Lacrosse 80.88 2,740,467 239,901 8.8% 2,966.14 197,625 7.2% 2,443.44 437,526 16.0% 5,409.57Lamont 39.02 812,032 145,363 17.9% 3,725.33 68,286 8.4% 1,750.02 213,648 26.3% 5,475.35Tekoa 202.77 3,977,688 253,681 6.4% 1,251.08 296,198 7.4% 1,460.76 549,879 13.8% 2,711.84Pullman 2,796.18 35,584,874 2,585,580 7.3% 924.68 2,113,195 5.9% 755.74 4,698,775 13.2% 1,680.43Colfax 555.62 7,958,726 763,318 9.6% 1,373.81 418,819 5.3% 753.79 1,182,136 14.9% 2,127.60Palouse 183.93 3,331,197 362,323 10.9% 1,969.90 259,916 7.8% 1,413.13 622,240 18.7% 3,383.02Garfield 125.23 2,903,598 138,496 4.8% 1,105.94 142,078 4.9% 1,134.54 280,574 9.7% 2,240.47Steptoe 51.90 823,799 81,855 9.9% 1,577.16 50,693 6.2% 976.75 132,548 16.1% 2,553.91Colton 176.22 3,431,085 236,782 6.9% 1,343.67 194,792 5.7% 1,105.39 431,574 12.6% 2,449.06Endicott 83.18 2,594,402 213,683 8.2% 2,568.92 178,658 6.9% 2,147.85 392,340 15.1% 4,716.76Rosalia 191.25 3,917,328 250,456 6.4% 1,309.57 214,557 5.5% 1,121.87 465,013 11.9% 2,431.44St. John 144.59 3,175,938 235,907 7.4% 1,631.56 186,115 5.9% 1,287.19 422,022 13.3% 2,918.75Oakesdale 123.73 3,296,159 444,745 13.5% 3,594.48 4,517 0.1% 36.51 449,263 13.6% 3,630.99County Total 4,754.50 74,547,294 5,952,089 8.0% 1,251.89 4,325,450 5.8% 909.76 10,277,539 13.8% 2,161.64
122
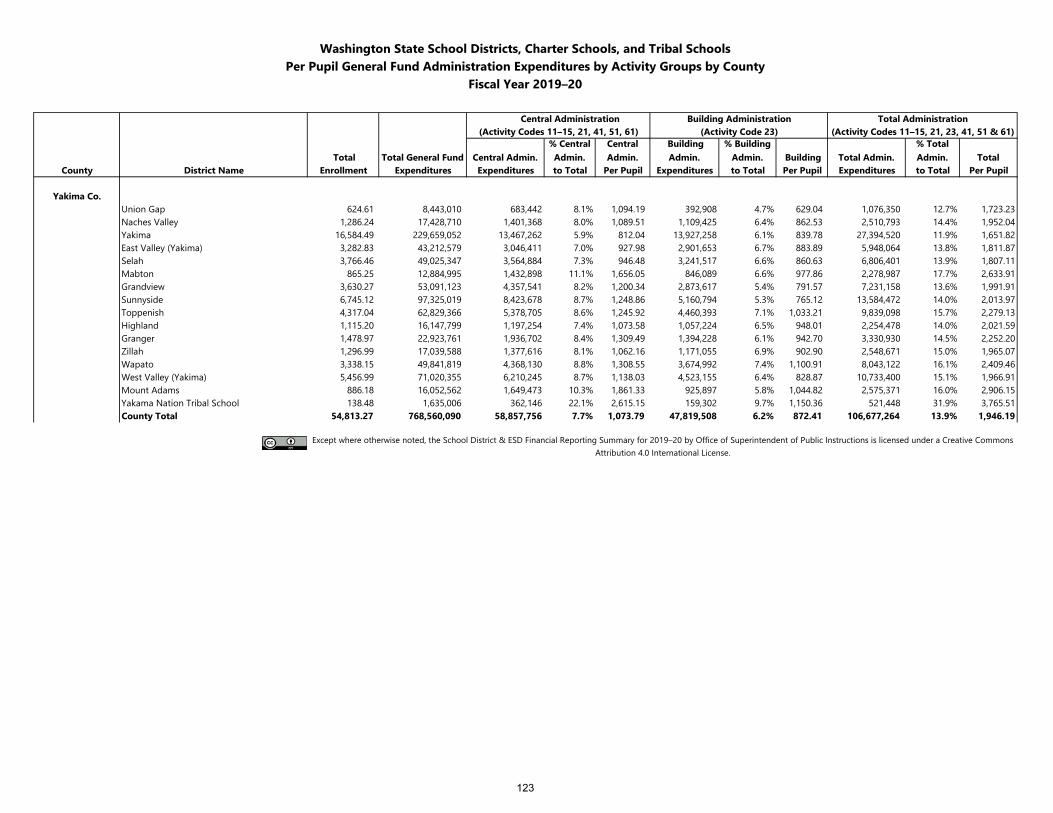
Washington State School Districts, Charter Schools, and Tribal SchoolsPer Pupil General Fund Administration Expenditures by Activity Groups by County
Fiscal Year 2019–20
Central Administration Building Administration Total Administration(Activity Codes 11–15, 21, 41, 51, 61) (Activity Code 23) (Activity Codes 11–15, 21, 23, 41, 51 & 61)
Total Total General Fund Central Admin. % Central Admin.
Central Admin.
Building Admin.
% Building Admin. Building Total Admin.
% Total Admin. Total
County District Name Enrollment Expenditures Expenditures to Total Per Pupil Expenditures to Total Per Pupil Expenditures to Total Per Pupil
Yakima Co.Union Gap 624.61 8,443,010 683,442 8.1% 1,094.19 392,908 4.7% 629.04 1,076,350 12.7% 1,723.23Naches Valley 1,286.24 17,428,710 1,401,368 8.0% 1,089.51 1,109,425 6.4% 862.53 2,510,793 14.4% 1,952.04Yakima 16,584.49 229,659,052 13,467,262 5.9% 812.04 13,927,258 6.1% 839.78 27,394,520 11.9% 1,651.82East Valley (Yakima) 3,282.83 43,212,579 3,046,411 7.0% 927.98 2,901,653 6.7% 883.89 5,948,064 13.8% 1,811.87Selah 3,766.46 49,025,347 3,564,884 7.3% 946.48 3,241,517 6.6% 860.63 6,806,401 13.9% 1,807.11Mabton 865.25 12,884,995 1,432,898 11.1% 1,656.05 846,089 6.6% 977.86 2,278,987 17.7% 2,633.91Grandview 3,630.27 53,091,123 4,357,541 8.2% 1,200.34 2,873,617 5.4% 791.57 7,231,158 13.6% 1,991.91Sunnyside 6,745.12 97,325,019 8,423,678 8.7% 1,248.86 5,160,794 5.3% 765.12 13,584,472 14.0% 2,013.97Toppenish 4,317.04 62,829,366 5,378,705 8.6% 1,245.92 4,460,393 7.1% 1,033.21 9,839,098 15.7% 2,279.13Highland 1,115.20 16,147,799 1,197,254 7.4% 1,073.58 1,057,224 6.5% 948.01 2,254,478 14.0% 2,021.59Granger 1,478.97 22,923,761 1,936,702 8.4% 1,309.49 1,394,228 6.1% 942.70 3,330,930 14.5% 2,252.20Zillah 1,296.99 17,039,588 1,377,616 8.1% 1,062.16 1,171,055 6.9% 902.90 2,548,671 15.0% 1,965.07Wapato 3,338.15 49,841,819 4,368,130 8.8% 1,308.55 3,674,992 7.4% 1,100.91 8,043,122 16.1% 2,409.46West Valley (Yakima) 5,456.99 71,020,355 6,210,245 8.7% 1,138.03 4,523,155 6.4% 828.87 10,733,400 15.1% 1,966.91Mount Adams 886.18 16,052,562 1,649,473 10.3% 1,861.33 925,897 5.8% 1,044.82 2,575,371 16.0% 2,906.15Yakama Nation Tribal School 138.48 1,635,006 362,146 22.1% 2,615.15 159,302 9.7% 1,150.36 521,448 31.9% 3,765.51County Total 54,813.27 768,560,090 58,857,756 7.7% 1,073.79 47,819,508 6.2% 872.41 106,677,264 13.9% 1,946.19
Except where otherwise noted, the School District & ESD Financial Reporting Summary for 2019–20 by Office of Superintendent of Public Instructions is licensed under a Creative Commons Attribution 4.0 International License.
123
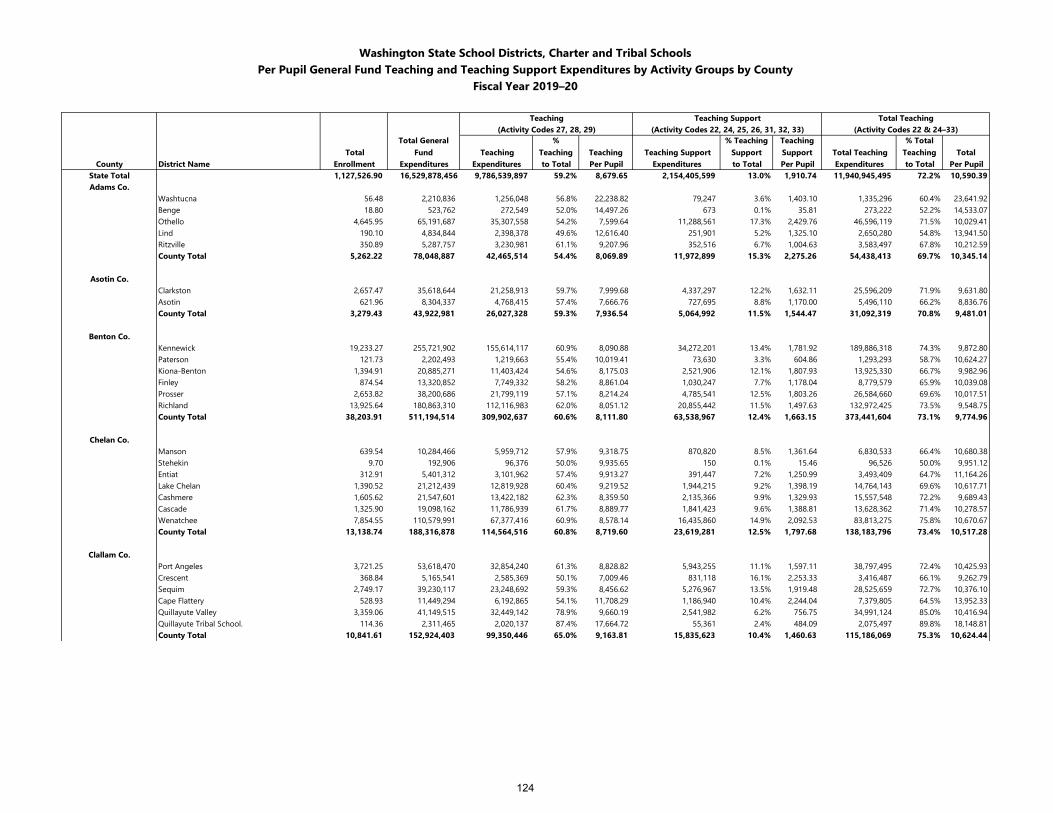
Washington State School Districts, Charter and Tribal SchoolsPer Pupil General Fund Teaching and Teaching Support Expenditures by Activity Groups by County
Fiscal Year 2019–20
Teaching Teaching Support Total Teaching(Activity Codes 27, 28, 29) (Activity Codes 22, 24, 25, 26, 31, 32, 33) (Activity Codes 22 & 24–33)
Total Total General
Fund Teaching %
Teaching Teaching Teaching Support % Teaching
SupportTeaching Support Total Teaching
% Total Teaching Total
County District Name Enrollment Expenditures Expenditures to Total Per Pupil Expenditures to Total Per Pupil Expenditures to Total Per PupilState Total 1,127,526.90 16,529,878,456 9,786,539,897 59.2% 8,679.65 2,154,405,599 13.0% 1,910.74 11,940,945,495 72.2% 10,590.39Adams Co.
Washtucna 56.48 2,210,836 1,256,048 56.8% 22,238.82 79,247 3.6% 1,403.10 1,335,296 60.4% 23,641.92Benge 18.80 523,762 272,549 52.0% 14,497.26 673 0.1% 35.81 273,222 52.2% 14,533.07Othello 4,645.95 65,191,687 35,307,558 54.2% 7,599.64 11,288,561 17.3% 2,429.76 46,596,119 71.5% 10,029.41Lind 190.10 4,834,844 2,398,378 49.6% 12,616.40 251,901 5.2% 1,325.10 2,650,280 54.8% 13,941.50Ritzville 350.89 5,287,757 3,230,981 61.1% 9,207.96 352,516 6.7% 1,004.63 3,583,497 67.8% 10,212.59County Total 5,262.22 78,048,887 42,465,514 54.4% 8,069.89 11,972,899 15.3% 2,275.26 54,438,413 69.7% 10,345.14
Asotin Co.Clarkston 2,657.47 35,618,644 21,258,913 59.7% 7,999.68 4,337,297 12.2% 1,632.11 25,596,209 71.9% 9,631.80Asotin 621.96 8,304,337 4,768,415 57.4% 7,666.76 727,695 8.8% 1,170.00 5,496,110 66.2% 8,836.76County Total 3,279.43 43,922,981 26,027,328 59.3% 7,936.54 5,064,992 11.5% 1,544.47 31,092,319 70.8% 9,481.01
Benton Co.Kennewick 19,233.27 255,721,902 155,614,117 60.9% 8,090.88 34,272,201 13.4% 1,781.92 189,886,318 74.3% 9,872.80Paterson 121.73 2,202,493 1,219,663 55.4% 10,019.41 73,630 3.3% 604.86 1,293,293 58.7% 10,624.27Kiona-Benton 1,394.91 20,885,271 11,403,424 54.6% 8,175.03 2,521,906 12.1% 1,807.93 13,925,330 66.7% 9,982.96Finley 874.54 13,320,852 7,749,332 58.2% 8,861.04 1,030,247 7.7% 1,178.04 8,779,579 65.9% 10,039.08Prosser 2,653.82 38,200,686 21,799,119 57.1% 8,214.24 4,785,541 12.5% 1,803.26 26,584,660 69.6% 10,017.51Richland 13,925.64 180,863,310 112,116,983 62.0% 8,051.12 20,855,442 11.5% 1,497.63 132,972,425 73.5% 9,548.75County Total 38,203.91 511,194,514 309,902,637 60.6% 8,111.80 63,538,967 12.4% 1,663.15 373,441,604 73.1% 9,774.96
Chelan Co.Manson 639.54 10,284,466 5,959,712 57.9% 9,318.75 870,820 8.5% 1,361.64 6,830,533 66.4% 10,680.38Stehekin 9.70 192,906 96,376 50.0% 9,935.65 150 0.1% 15.46 96,526 50.0% 9,951.12Entiat 312.91 5,401,312 3,101,962 57.4% 9,913.27 391,447 7.2% 1,250.99 3,493,409 64.7% 11,164.26Lake Chelan 1,390.52 21,212,439 12,819,928 60.4% 9,219.52 1,944,215 9.2% 1,398.19 14,764,143 69.6% 10,617.71Cashmere 1,605.62 21,547,601 13,422,182 62.3% 8,359.50 2,135,366 9.9% 1,329.93 15,557,548 72.2% 9,689.43Cascade 1,325.90 19,098,162 11,786,939 61.7% 8,889.77 1,841,423 9.6% 1,388.81 13,628,362 71.4% 10,278.57Wenatchee 7,854.55 110,579,991 67,377,416 60.9% 8,578.14 16,435,860 14.9% 2,092.53 83,813,275 75.8% 10,670.67County Total 13,138.74 188,316,878 114,564,516 60.8% 8,719.60 23,619,281 12.5% 1,797.68 138,183,796 73.4% 10,517.28
Clallam Co.Port Angeles 3,721.25 53,618,470 32,854,240 61.3% 8,828.82 5,943,255 11.1% 1,597.11 38,797,495 72.4% 10,425.93Crescent 368.84 5,165,541 2,585,369 50.1% 7,009.46 831,118 16.1% 2,253.33 3,416,487 66.1% 9,262.79Sequim 2,749.17 39,230,117 23,248,692 59.3% 8,456.62 5,276,967 13.5% 1,919.48 28,525,659 72.7% 10,376.10Cape Flattery 528.93 11,449,294 6,192,865 54.1% 11,708.29 1,186,940 10.4% 2,244.04 7,379,805 64.5% 13,952.33Quillayute Valley 3,359.06 41,149,515 32,449,142 78.9% 9,660.19 2,541,982 6.2% 756.75 34,991,124 85.0% 10,416.94Quillayute Tribal School. 114.36 2,311,465 2,020,137 87.4% 17,664.72 55,361 2.4% 484.09 2,075,497 89.8% 18,148.81County Total 10,841.61 152,924,403 99,350,446 65.0% 9,163.81 15,835,623 10.4% 1,460.63 115,186,069 75.3% 10,624.44
124
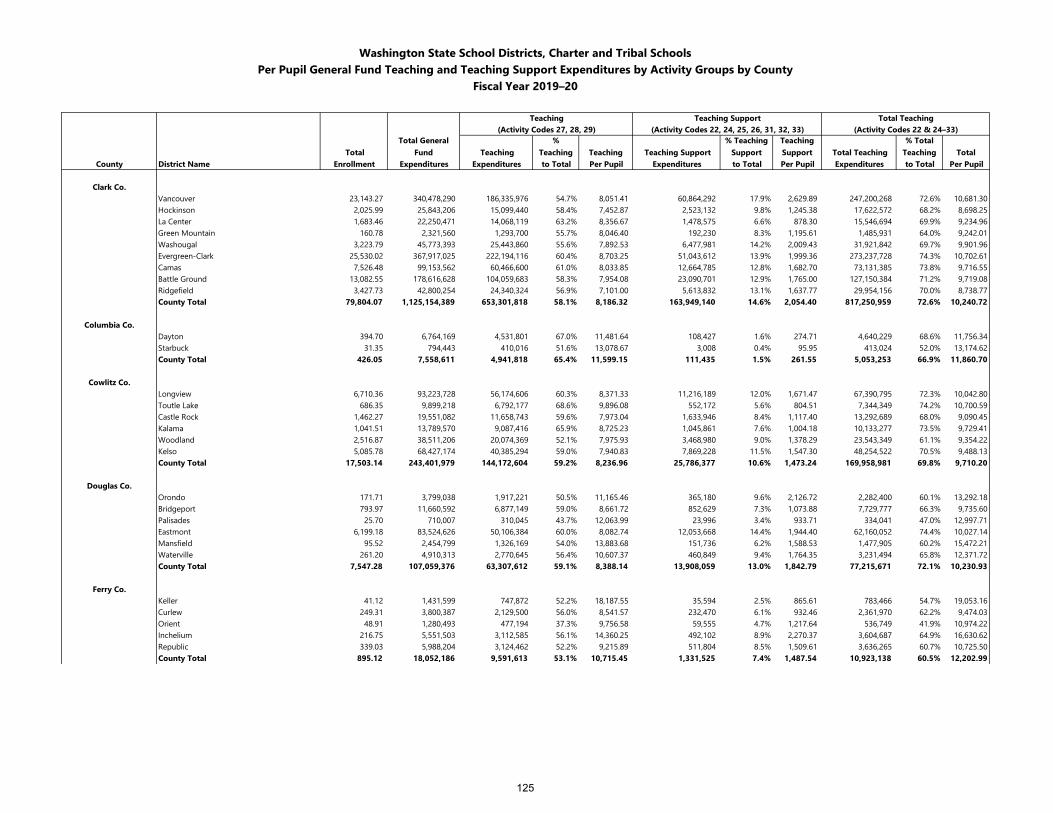
Washington State School Districts, Charter and Tribal SchoolsPer Pupil General Fund Teaching and Teaching Support Expenditures by Activity Groups by County
Fiscal Year 2019–20
Teaching Teaching Support Total Teaching(Activity Codes 27, 28, 29) (Activity Codes 22, 24, 25, 26, 31, 32, 33) (Activity Codes 22 & 24–33)
Total Total General
Fund Teaching %
Teaching Teaching Teaching Support % Teaching
SupportTeaching Support Total Teaching
% Total Teaching Total
County District Name Enrollment Expenditures Expenditures to Total Per Pupil Expenditures to Total Per Pupil Expenditures to Total Per Pupil
Clark Co.Vancouver 23,143.27 340,478,290 186,335,976 54.7% 8,051.41 60,864,292 17.9% 2,629.89 247,200,268 72.6% 10,681.30Hockinson 2,025.99 25,843,206 15,099,440 58.4% 7,452.87 2,523,132 9.8% 1,245.38 17,622,572 68.2% 8,698.25La Center 1,683.46 22,250,471 14,068,119 63.2% 8,356.67 1,478,575 6.6% 878.30 15,546,694 69.9% 9,234.96Green Mountain 160.78 2,321,560 1,293,700 55.7% 8,046.40 192,230 8.3% 1,195.61 1,485,931 64.0% 9,242.01Washougal 3,223.79 45,773,393 25,443,860 55.6% 7,892.53 6,477,981 14.2% 2,009.43 31,921,842 69.7% 9,901.96Evergreen-Clark 25,530.02 367,917,025 222,194,116 60.4% 8,703.25 51,043,612 13.9% 1,999.36 273,237,728 74.3% 10,702.61Camas 7,526.48 99,153,562 60,466,600 61.0% 8,033.85 12,664,785 12.8% 1,682.70 73,131,385 73.8% 9,716.55Battle Ground 13,082.55 178,616,628 104,059,683 58.3% 7,954.08 23,090,701 12.9% 1,765.00 127,150,384 71.2% 9,719.08Ridgefield 3,427.73 42,800,254 24,340,324 56.9% 7,101.00 5,613,832 13.1% 1,637.77 29,954,156 70.0% 8,738.77County Total 79,804.07 1,125,154,389 653,301,818 58.1% 8,186.32 163,949,140 14.6% 2,054.40 817,250,959 72.6% 10,240.72
Columbia Co.Dayton 394.70 6,764,169 4,531,801 67.0% 11,481.64 108,427 1.6% 274.71 4,640,229 68.6% 11,756.34Starbuck 31.35 794,443 410,016 51.6% 13,078.67 3,008 0.4% 95.95 413,024 52.0% 13,174.62County Total 426.05 7,558,611 4,941,818 65.4% 11,599.15 111,435 1.5% 261.55 5,053,253 66.9% 11,860.70
Cowlitz Co.Longview 6,710.36 93,223,728 56,174,606 60.3% 8,371.33 11,216,189 12.0% 1,671.47 67,390,795 72.3% 10,042.80Toutle Lake 686.35 9,899,218 6,792,177 68.6% 9,896.08 552,172 5.6% 804.51 7,344,349 74.2% 10,700.59Castle Rock 1,462.27 19,551,082 11,658,743 59.6% 7,973.04 1,633,946 8.4% 1,117.40 13,292,689 68.0% 9,090.45Kalama 1,041.51 13,789,570 9,087,416 65.9% 8,725.23 1,045,861 7.6% 1,004.18 10,133,277 73.5% 9,729.41Woodland 2,516.87 38,511,206 20,074,369 52.1% 7,975.93 3,468,980 9.0% 1,378.29 23,543,349 61.1% 9,354.22Kelso 5,085.78 68,427,174 40,385,294 59.0% 7,940.83 7,869,228 11.5% 1,547.30 48,254,522 70.5% 9,488.13County Total 17,503.14 243,401,979 144,172,604 59.2% 8,236.96 25,786,377 10.6% 1,473.24 169,958,981 69.8% 9,710.20
Douglas Co.Orondo 171.71 3,799,038 1,917,221 50.5% 11,165.46 365,180 9.6% 2,126.72 2,282,400 60.1% 13,292.18Bridgeport 793.97 11,660,592 6,877,149 59.0% 8,661.72 852,629 7.3% 1,073.88 7,729,777 66.3% 9,735.60Palisades 25.70 710,007 310,045 43.7% 12,063.99 23,996 3.4% 933.71 334,041 47.0% 12,997.71Eastmont 6,199.18 83,524,626 50,106,384 60.0% 8,082.74 12,053,668 14.4% 1,944.40 62,160,052 74.4% 10,027.14Mansfield 95.52 2,454,799 1,326,169 54.0% 13,883.68 151,736 6.2% 1,588.53 1,477,905 60.2% 15,472.21Waterville 261.20 4,910,313 2,770,645 56.4% 10,607.37 460,849 9.4% 1,764.35 3,231,494 65.8% 12,371.72County Total 7,547.28 107,059,376 63,307,612 59.1% 8,388.14 13,908,059 13.0% 1,842.79 77,215,671 72.1% 10,230.93
Ferry Co.Keller 41.12 1,431,599 747,872 52.2% 18,187.55 35,594 2.5% 865.61 783,466 54.7% 19,053.16Curlew 249.31 3,800,387 2,129,500 56.0% 8,541.57 232,470 6.1% 932.46 2,361,970 62.2% 9,474.03Orient 48.91 1,280,493 477,194 37.3% 9,756.58 59,555 4.7% 1,217.64 536,749 41.9% 10,974.22Inchelium 216.75 5,551,503 3,112,585 56.1% 14,360.25 492,102 8.9% 2,270.37 3,604,687 64.9% 16,630.62Republic 339.03 5,988,204 3,124,462 52.2% 9,215.89 511,804 8.5% 1,509.61 3,636,265 60.7% 10,725.50County Total 895.12 18,052,186 9,591,613 53.1% 10,715.45 1,331,525 7.4% 1,487.54 10,923,138 60.5% 12,202.99
125
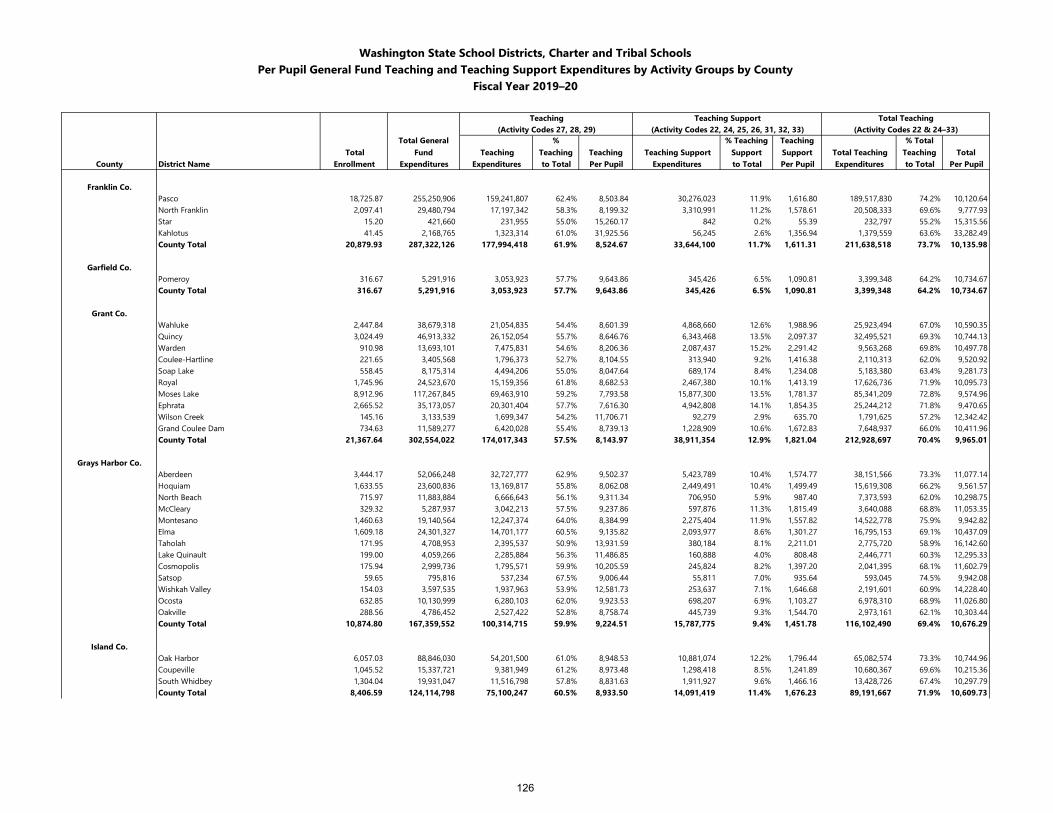
Washington State School Districts, Charter and Tribal SchoolsPer Pupil General Fund Teaching and Teaching Support Expenditures by Activity Groups by County
Fiscal Year 2019–20
Teaching Teaching Support Total Teaching(Activity Codes 27, 28, 29) (Activity Codes 22, 24, 25, 26, 31, 32, 33) (Activity Codes 22 & 24–33)
Total Total General
Fund Teaching %
Teaching Teaching Teaching Support % Teaching
SupportTeaching Support Total Teaching
% Total Teaching Total
County District Name Enrollment Expenditures Expenditures to Total Per Pupil Expenditures to Total Per Pupil Expenditures to Total Per Pupil
Franklin Co.Pasco 18,725.87 255,250,906 159,241,807 62.4% 8,503.84 30,276,023 11.9% 1,616.80 189,517,830 74.2% 10,120.64North Franklin 2,097.41 29,480,794 17,197,342 58.3% 8,199.32 3,310,991 11.2% 1,578.61 20,508,333 69.6% 9,777.93Star 15.20 421,660 231,955 55.0% 15,260.17 842 0.2% 55.39 232,797 55.2% 15,315.56Kahlotus 41.45 2,168,765 1,323,314 61.0% 31,925.56 56,245 2.6% 1,356.94 1,379,559 63.6% 33,282.49County Total 20,879.93 287,322,126 177,994,418 61.9% 8,524.67 33,644,100 11.7% 1,611.31 211,638,518 73.7% 10,135.98
Garfield Co.Pomeroy 316.67 5,291,916 3,053,923 57.7% 9,643.86 345,426 6.5% 1,090.81 3,399,348 64.2% 10,734.67County Total 316.67 5,291,916 3,053,923 57.7% 9,643.86 345,426 6.5% 1,090.81 3,399,348 64.2% 10,734.67
Grant Co.Wahluke 2,447.84 38,679,318 21,054,835 54.4% 8,601.39 4,868,660 12.6% 1,988.96 25,923,494 67.0% 10,590.35Quincy 3,024.49 46,913,332 26,152,054 55.7% 8,646.76 6,343,468 13.5% 2,097.37 32,495,521 69.3% 10,744.13Warden 910.98 13,693,101 7,475,831 54.6% 8,206.36 2,087,437 15.2% 2,291.42 9,563,268 69.8% 10,497.78Coulee-Hartline 221.65 3,405,568 1,796,373 52.7% 8,104.55 313,940 9.2% 1,416.38 2,110,313 62.0% 9,520.92Soap Lake 558.45 8,175,314 4,494,206 55.0% 8,047.64 689,174 8.4% 1,234.08 5,183,380 63.4% 9,281.73Royal 1,745.96 24,523,670 15,159,356 61.8% 8,682.53 2,467,380 10.1% 1,413.19 17,626,736 71.9% 10,095.73Moses Lake 8,912.96 117,267,845 69,463,910 59.2% 7,793.58 15,877,300 13.5% 1,781.37 85,341,209 72.8% 9,574.96Ephrata 2,665.52 35,173,057 20,301,404 57.7% 7,616.30 4,942,808 14.1% 1,854.35 25,244,212 71.8% 9,470.65Wilson Creek 145.16 3,133,539 1,699,347 54.2% 11,706.71 92,279 2.9% 635.70 1,791,625 57.2% 12,342.42Grand Coulee Dam 734.63 11,589,277 6,420,028 55.4% 8,739.13 1,228,909 10.6% 1,672.83 7,648,937 66.0% 10,411.96County Total 21,367.64 302,554,022 174,017,343 57.5% 8,143.97 38,911,354 12.9% 1,821.04 212,928,697 70.4% 9,965.01
Grays Harbor Co.Aberdeen 3,444.17 52,066,248 32,727,777 62.9% 9,502.37 5,423,789 10.4% 1,574.77 38,151,566 73.3% 11,077.14Hoquiam 1,633.55 23,600,836 13,169,817 55.8% 8,062.08 2,449,491 10.4% 1,499.49 15,619,308 66.2% 9,561.57North Beach 715.97 11,883,884 6,666,643 56.1% 9,311.34 706,950 5.9% 987.40 7,373,593 62.0% 10,298.75McCleary 329.32 5,287,937 3,042,213 57.5% 9,237.86 597,876 11.3% 1,815.49 3,640,088 68.8% 11,053.35Montesano 1,460.63 19,140,564 12,247,374 64.0% 8,384.99 2,275,404 11.9% 1,557.82 14,522,778 75.9% 9,942.82Elma 1,609.18 24,301,327 14,701,177 60.5% 9,135.82 2,093,977 8.6% 1,301.27 16,795,153 69.1% 10,437.09Taholah 171.95 4,708,953 2,395,537 50.9% 13,931.59 380,184 8.1% 2,211.01 2,775,720 58.9% 16,142.60Lake Quinault 199.00 4,059,266 2,285,884 56.3% 11,486.85 160,888 4.0% 808.48 2,446,771 60.3% 12,295.33Cosmopolis 175.94 2,999,736 1,795,571 59.9% 10,205.59 245,824 8.2% 1,397.20 2,041,395 68.1% 11,602.79Satsop 59.65 795,816 537,234 67.5% 9,006.44 55,811 7.0% 935.64 593,045 74.5% 9,942.08Wishkah Valley 154.03 3,597,535 1,937,963 53.9% 12,581.73 253,637 7.1% 1,646.68 2,191,601 60.9% 14,228.40Ocosta 632.85 10,130,999 6,280,103 62.0% 9,923.53 698,207 6.9% 1,103.27 6,978,310 68.9% 11,026.80Oakville 288.56 4,786,452 2,527,422 52.8% 8,758.74 445,739 9.3% 1,544.70 2,973,161 62.1% 10,303.44County Total 10,874.80 167,359,552 100,314,715 59.9% 9,224.51 15,787,775 9.4% 1,451.78 116,102,490 69.4% 10,676.29
Island Co.Oak Harbor 6,057.03 88,846,030 54,201,500 61.0% 8,948.53 10,881,074 12.2% 1,796.44 65,082,574 73.3% 10,744.96Coupeville 1,045.52 15,337,721 9,381,949 61.2% 8,973.48 1,298,418 8.5% 1,241.89 10,680,367 69.6% 10,215.36South Whidbey 1,304.04 19,931,047 11,516,798 57.8% 8,831.63 1,911,927 9.6% 1,466.16 13,428,726 67.4% 10,297.79County Total 8,406.59 124,114,798 75,100,247 60.5% 8,933.50 14,091,419 11.4% 1,676.23 89,191,667 71.9% 10,609.73
126
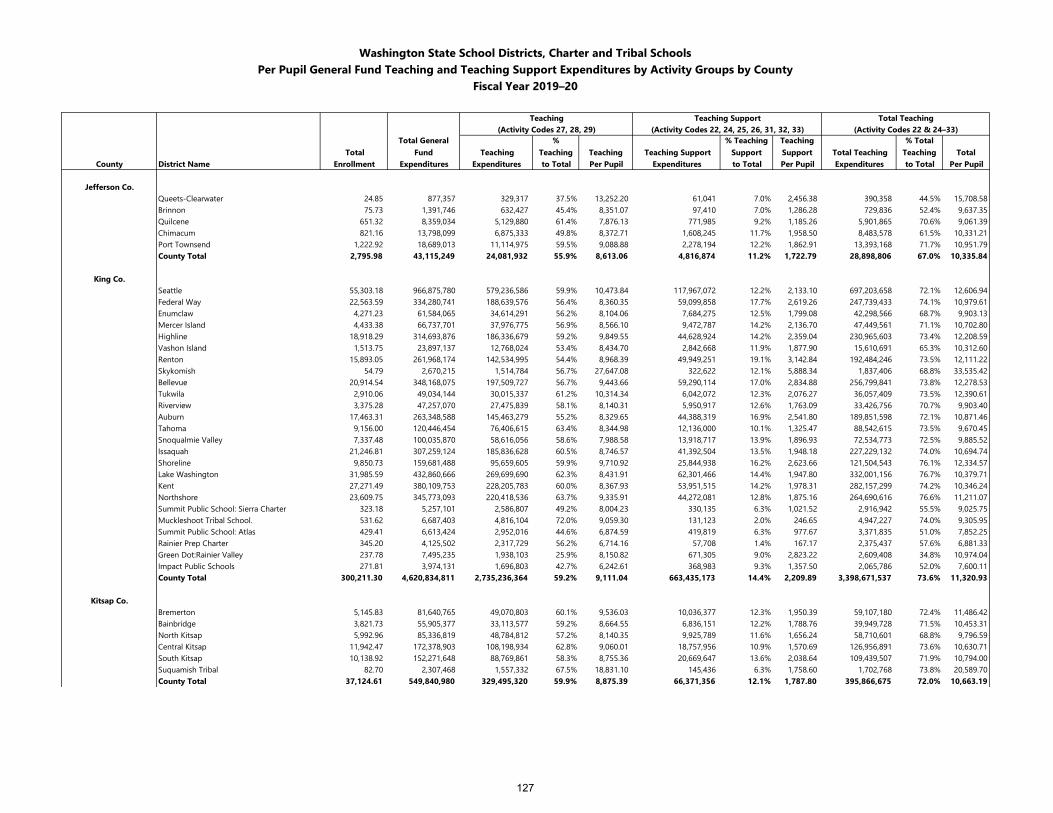
Washington State School Districts, Charter and Tribal SchoolsPer Pupil General Fund Teaching and Teaching Support Expenditures by Activity Groups by County
Fiscal Year 2019–20
Teaching Teaching Support Total Teaching(Activity Codes 27, 28, 29) (Activity Codes 22, 24, 25, 26, 31, 32, 33) (Activity Codes 22 & 24–33)
Total Total General
Fund Teaching %
Teaching Teaching Teaching Support % Teaching
SupportTeaching Support Total Teaching
% Total Teaching Total
County District Name Enrollment Expenditures Expenditures to Total Per Pupil Expenditures to Total Per Pupil Expenditures to Total Per Pupil
Jefferson Co.Queets-Clearwater 24.85 877,357 329,317 37.5% 13,252.20 61,041 7.0% 2,456.38 390,358 44.5% 15,708.58Brinnon 75.73 1,391,746 632,427 45.4% 8,351.07 97,410 7.0% 1,286.28 729,836 52.4% 9,637.35Quilcene 651.32 8,359,034 5,129,880 61.4% 7,876.13 771,985 9.2% 1,185.26 5,901,865 70.6% 9,061.39Chimacum 821.16 13,798,099 6,875,333 49.8% 8,372.71 1,608,245 11.7% 1,958.50 8,483,578 61.5% 10,331.21Port Townsend 1,222.92 18,689,013 11,114,975 59.5% 9,088.88 2,278,194 12.2% 1,862.91 13,393,168 71.7% 10,951.79County Total 2,795.98 43,115,249 24,081,932 55.9% 8,613.06 4,816,874 11.2% 1,722.79 28,898,806 67.0% 10,335.84
King Co.Seattle 55,303.18 966,875,780 579,236,586 59.9% 10,473.84 117,967,072 12.2% 2,133.10 697,203,658 72.1% 12,606.94Federal Way 22,563.59 334,280,741 188,639,576 56.4% 8,360.35 59,099,858 17.7% 2,619.26 247,739,433 74.1% 10,979.61Enumclaw 4,271.23 61,584,065 34,614,291 56.2% 8,104.06 7,684,275 12.5% 1,799.08 42,298,566 68.7% 9,903.13Mercer Island 4,433.38 66,737,701 37,976,775 56.9% 8,566.10 9,472,787 14.2% 2,136.70 47,449,561 71.1% 10,702.80Highline 18,918.29 314,693,876 186,336,679 59.2% 9,849.55 44,628,924 14.2% 2,359.04 230,965,603 73.4% 12,208.59Vashon Island 1,513.75 23,897,137 12,768,024 53.4% 8,434.70 2,842,668 11.9% 1,877.90 15,610,691 65.3% 10,312.60Renton 15,893.05 261,968,174 142,534,995 54.4% 8,968.39 49,949,251 19.1% 3,142.84 192,484,246 73.5% 12,111.22Skykomish 54.79 2,670,215 1,514,784 56.7% 27,647.08 322,622 12.1% 5,888.34 1,837,406 68.8% 33,535.42Bellevue 20,914.54 348,168,075 197,509,727 56.7% 9,443.66 59,290,114 17.0% 2,834.88 256,799,841 73.8% 12,278.53Tukwila 2,910.06 49,034,144 30,015,337 61.2% 10,314.34 6,042,072 12.3% 2,076.27 36,057,409 73.5% 12,390.61Riverview 3,375.28 47,257,070 27,475,839 58.1% 8,140.31 5,950,917 12.6% 1,763.09 33,426,756 70.7% 9,903.40Auburn 17,463.31 263,348,588 145,463,279 55.2% 8,329.65 44,388,319 16.9% 2,541.80 189,851,598 72.1% 10,871.46Tahoma 9,156.00 120,446,454 76,406,615 63.4% 8,344.98 12,136,000 10.1% 1,325.47 88,542,615 73.5% 9,670.45Snoqualmie Valley 7,337.48 100,035,870 58,616,056 58.6% 7,988.58 13,918,717 13.9% 1,896.93 72,534,773 72.5% 9,885.52Issaquah 21,246.81 307,259,124 185,836,628 60.5% 8,746.57 41,392,504 13.5% 1,948.18 227,229,132 74.0% 10,694.74Shoreline 9,850.73 159,681,488 95,659,605 59.9% 9,710.92 25,844,938 16.2% 2,623.66 121,504,543 76.1% 12,334.57Lake Washington 31,985.59 432,860,666 269,699,690 62.3% 8,431.91 62,301,466 14.4% 1,947.80 332,001,156 76.7% 10,379.71Kent 27,271.49 380,109,753 228,205,783 60.0% 8,367.93 53,951,515 14.2% 1,978.31 282,157,299 74.2% 10,346.24Northshore 23,609.75 345,773,093 220,418,536 63.7% 9,335.91 44,272,081 12.8% 1,875.16 264,690,616 76.6% 11,211.07Summit Public School: Sierra Charter 323.18 5,257,101 2,586,807 49.2% 8,004.23 330,135 6.3% 1,021.52 2,916,942 55.5% 9,025.75Muckleshoot Tribal School. 531.62 6,687,403 4,816,104 72.0% 9,059.30 131,123 2.0% 246.65 4,947,227 74.0% 9,305.95Summit Public School: Atlas 429.41 6,613,424 2,952,016 44.6% 6,874.59 419,819 6.3% 977.67 3,371,835 51.0% 7,852.25Rainier Prep Charter 345.20 4,125,502 2,317,729 56.2% 6,714.16 57,708 1.4% 167.17 2,375,437 57.6% 6,881.33Green Dot:Rainier Valley 237.78 7,495,235 1,938,103 25.9% 8,150.82 671,305 9.0% 2,823.22 2,609,408 34.8% 10,974.04Impact Public Schools 271.81 3,974,131 1,696,803 42.7% 6,242.61 368,983 9.3% 1,357.50 2,065,786 52.0% 7,600.11County Total 300,211.30 4,620,834,811 2,735,236,364 59.2% 9,111.04 663,435,173 14.4% 2,209.89 3,398,671,537 73.6% 11,320.93
Kitsap Co.Bremerton 5,145.83 81,640,765 49,070,803 60.1% 9,536.03 10,036,377 12.3% 1,950.39 59,107,180 72.4% 11,486.42Bainbridge 3,821.73 55,905,377 33,113,577 59.2% 8,664.55 6,836,151 12.2% 1,788.76 39,949,728 71.5% 10,453.31North Kitsap 5,992.96 85,336,819 48,784,812 57.2% 8,140.35 9,925,789 11.6% 1,656.24 58,710,601 68.8% 9,796.59Central Kitsap 11,942.47 172,378,903 108,198,934 62.8% 9,060.01 18,757,956 10.9% 1,570.69 126,956,891 73.6% 10,630.71South Kitsap 10,138.92 152,271,648 88,769,861 58.3% 8,755.36 20,669,647 13.6% 2,038.64 109,439,507 71.9% 10,794.00Suquamish Tribal 82.70 2,307,468 1,557,332 67.5% 18,831.10 145,436 6.3% 1,758.60 1,702,768 73.8% 20,589.70County Total 37,124.61 549,840,980 329,495,320 59.9% 8,875.39 66,371,356 12.1% 1,787.80 395,866,675 72.0% 10,663.19
127
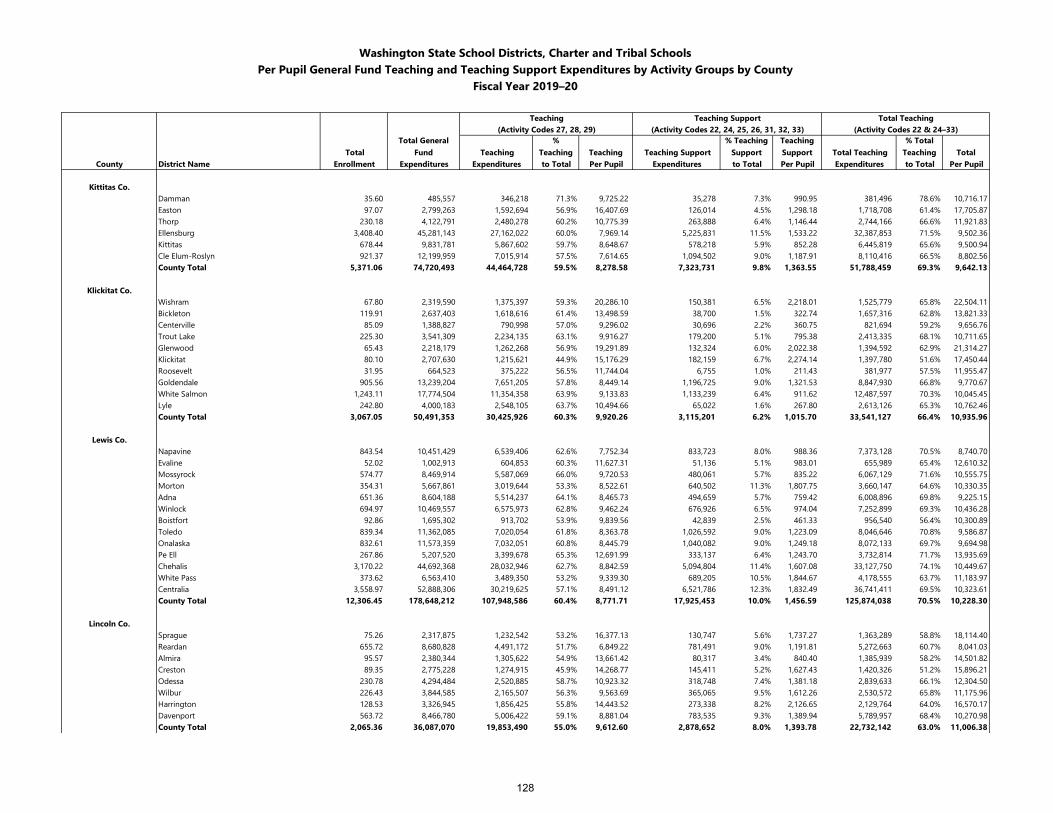
Washington State School Districts, Charter and Tribal SchoolsPer Pupil General Fund Teaching and Teaching Support Expenditures by Activity Groups by County
Fiscal Year 2019–20
Teaching Teaching Support Total Teaching(Activity Codes 27, 28, 29) (Activity Codes 22, 24, 25, 26, 31, 32, 33) (Activity Codes 22 & 24–33)
Total Total General
Fund Teaching %
Teaching Teaching Teaching Support % Teaching
SupportTeaching Support Total Teaching
% Total Teaching Total
County District Name Enrollment Expenditures Expenditures to Total Per Pupil Expenditures to Total Per Pupil Expenditures to Total Per Pupil
Kittitas Co.Damman 35.60 485,557 346,218 71.3% 9,725.22 35,278 7.3% 990.95 381,496 78.6% 10,716.17Easton 97.07 2,799,263 1,592,694 56.9% 16,407.69 126,014 4.5% 1,298.18 1,718,708 61.4% 17,705.87Thorp 230.18 4,122,791 2,480,278 60.2% 10,775.39 263,888 6.4% 1,146.44 2,744,166 66.6% 11,921.83Ellensburg 3,408.40 45,281,143 27,162,022 60.0% 7,969.14 5,225,831 11.5% 1,533.22 32,387,853 71.5% 9,502.36Kittitas 678.44 9,831,781 5,867,602 59.7% 8,648.67 578,218 5.9% 852.28 6,445,819 65.6% 9,500.94Cle Elum-Roslyn 921.37 12,199,959 7,015,914 57.5% 7,614.65 1,094,502 9.0% 1,187.91 8,110,416 66.5% 8,802.56County Total 5,371.06 74,720,493 44,464,728 59.5% 8,278.58 7,323,731 9.8% 1,363.55 51,788,459 69.3% 9,642.13
Klickitat Co.Wishram 67.80 2,319,590 1,375,397 59.3% 20,286.10 150,381 6.5% 2,218.01 1,525,779 65.8% 22,504.11Bickleton 119.91 2,637,403 1,618,616 61.4% 13,498.59 38,700 1.5% 322.74 1,657,316 62.8% 13,821.33Centerville 85.09 1,388,827 790,998 57.0% 9,296.02 30,696 2.2% 360.75 821,694 59.2% 9,656.76Trout Lake 225.30 3,541,309 2,234,135 63.1% 9,916.27 179,200 5.1% 795.38 2,413,335 68.1% 10,711.65Glenwood 65.43 2,218,179 1,262,268 56.9% 19,291.89 132,324 6.0% 2,022.38 1,394,592 62.9% 21,314.27Klickitat 80.10 2,707,630 1,215,621 44.9% 15,176.29 182,159 6.7% 2,274.14 1,397,780 51.6% 17,450.44Roosevelt 31.95 664,523 375,222 56.5% 11,744.04 6,755 1.0% 211.43 381,977 57.5% 11,955.47Goldendale 905.56 13,239,204 7,651,205 57.8% 8,449.14 1,196,725 9.0% 1,321.53 8,847,930 66.8% 9,770.67White Salmon 1,243.11 17,774,504 11,354,358 63.9% 9,133.83 1,133,239 6.4% 911.62 12,487,597 70.3% 10,045.45Lyle 242.80 4,000,183 2,548,105 63.7% 10,494.66 65,022 1.6% 267.80 2,613,126 65.3% 10,762.46County Total 3,067.05 50,491,353 30,425,926 60.3% 9,920.26 3,115,201 6.2% 1,015.70 33,541,127 66.4% 10,935.96
Lewis Co.Napavine 843.54 10,451,429 6,539,406 62.6% 7,752.34 833,723 8.0% 988.36 7,373,128 70.5% 8,740.70Evaline 52.02 1,002,913 604,853 60.3% 11,627.31 51,136 5.1% 983.01 655,989 65.4% 12,610.32Mossyrock 574.77 8,469,914 5,587,069 66.0% 9,720.53 480,061 5.7% 835.22 6,067,129 71.6% 10,555.75Morton 354.31 5,667,861 3,019,644 53.3% 8,522.61 640,502 11.3% 1,807.75 3,660,147 64.6% 10,330.35Adna 651.36 8,604,188 5,514,237 64.1% 8,465.73 494,659 5.7% 759.42 6,008,896 69.8% 9,225.15Winlock 694.97 10,469,557 6,575,973 62.8% 9,462.24 676,926 6.5% 974.04 7,252,899 69.3% 10,436.28Boistfort 92.86 1,695,302 913,702 53.9% 9,839.56 42,839 2.5% 461.33 956,540 56.4% 10,300.89Toledo 839.34 11,362,085 7,020,054 61.8% 8,363.78 1,026,592 9.0% 1,223.09 8,046,646 70.8% 9,586.87Onalaska 832.61 11,573,359 7,032,051 60.8% 8,445.79 1,040,082 9.0% 1,249.18 8,072,133 69.7% 9,694.98Pe Ell 267.86 5,207,520 3,399,678 65.3% 12,691.99 333,137 6.4% 1,243.70 3,732,814 71.7% 13,935.69Chehalis 3,170.22 44,692,368 28,032,946 62.7% 8,842.59 5,094,804 11.4% 1,607.08 33,127,750 74.1% 10,449.67White Pass 373.62 6,563,410 3,489,350 53.2% 9,339.30 689,205 10.5% 1,844.67 4,178,555 63.7% 11,183.97Centralia 3,558.97 52,888,306 30,219,625 57.1% 8,491.12 6,521,786 12.3% 1,832.49 36,741,411 69.5% 10,323.61County Total 12,306.45 178,648,212 107,948,586 60.4% 8,771.71 17,925,453 10.0% 1,456.59 125,874,038 70.5% 10,228.30
Lincoln Co.Sprague 75.26 2,317,875 1,232,542 53.2% 16,377.13 130,747 5.6% 1,737.27 1,363,289 58.8% 18,114.40Reardan 655.72 8,680,828 4,491,172 51.7% 6,849.22 781,491 9.0% 1,191.81 5,272,663 60.7% 8,041.03Almira 95.57 2,380,344 1,305,622 54.9% 13,661.42 80,317 3.4% 840.40 1,385,939 58.2% 14,501.82Creston 89.35 2,775,228 1,274,915 45.9% 14,268.77 145,411 5.2% 1,627.43 1,420,326 51.2% 15,896.21Odessa 230.78 4,294,484 2,520,885 58.7% 10,923.32 318,748 7.4% 1,381.18 2,839,633 66.1% 12,304.50Wilbur 226.43 3,844,585 2,165,507 56.3% 9,563.69 365,065 9.5% 1,612.26 2,530,572 65.8% 11,175.96Harrington 128.53 3,326,945 1,856,425 55.8% 14,443.52 273,338 8.2% 2,126.65 2,129,764 64.0% 16,570.17Davenport 563.72 8,466,780 5,006,422 59.1% 8,881.04 783,535 9.3% 1,389.94 5,789,957 68.4% 10,270.98County Total 2,065.36 36,087,070 19,853,490 55.0% 9,612.60 2,878,652 8.0% 1,393.78 22,732,142 63.0% 11,006.38
128
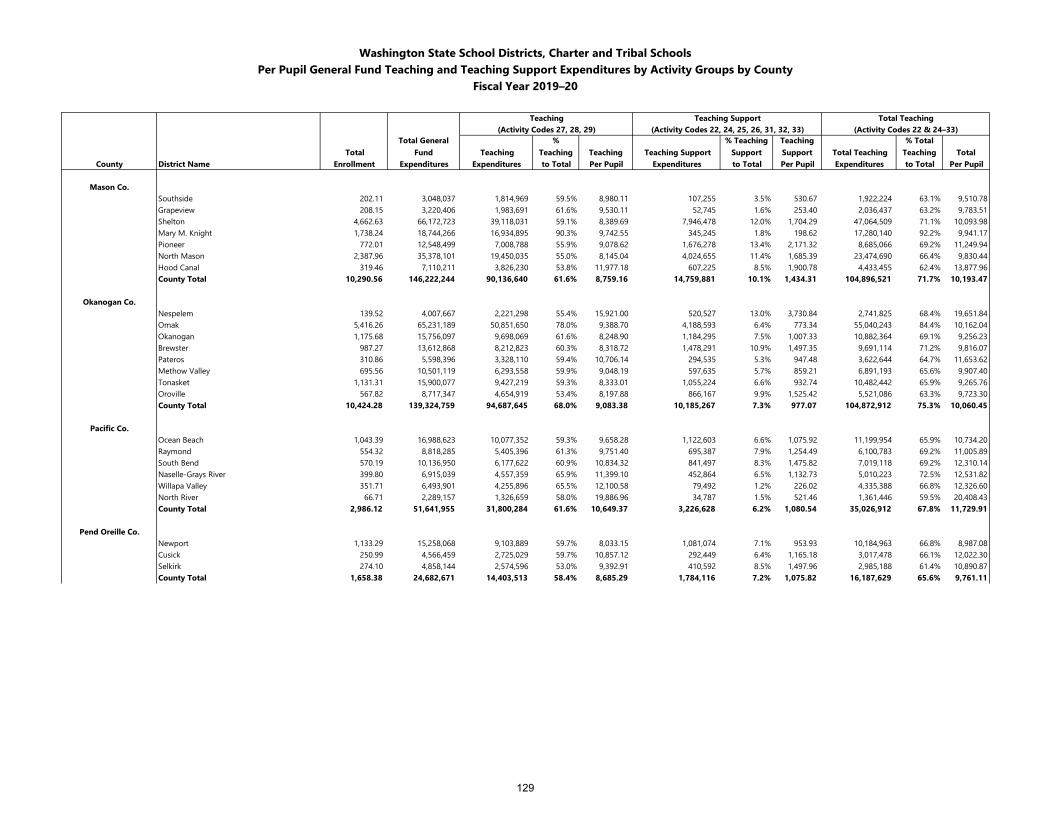
Washington State School Districts, Charter and Tribal SchoolsPer Pupil General Fund Teaching and Teaching Support Expenditures by Activity Groups by County
Fiscal Year 2019–20
Teaching Teaching Support Total Teaching(Activity Codes 27, 28, 29) (Activity Codes 22, 24, 25, 26, 31, 32, 33) (Activity Codes 22 & 24–33)
Total Total General
Fund Teaching %
Teaching Teaching Teaching Support % Teaching
SupportTeaching Support Total Teaching
% Total Teaching Total
County District Name Enrollment Expenditures Expenditures to Total Per Pupil Expenditures to Total Per Pupil Expenditures to Total Per Pupil
Mason Co.Southside 202.11 3,048,037 1,814,969 59.5% 8,980.11 107,255 3.5% 530.67 1,922,224 63.1% 9,510.78Grapeview 208.15 3,220,406 1,983,691 61.6% 9,530.11 52,745 1.6% 253.40 2,036,437 63.2% 9,783.51Shelton 4,662.63 66,172,723 39,118,031 59.1% 8,389.69 7,946,478 12.0% 1,704.29 47,064,509 71.1% 10,093.98Mary M. Knight 1,738.24 18,744,266 16,934,895 90.3% 9,742.55 345,245 1.8% 198.62 17,280,140 92.2% 9,941.17Pioneer 772.01 12,548,499 7,008,788 55.9% 9,078.62 1,676,278 13.4% 2,171.32 8,685,066 69.2% 11,249.94North Mason 2,387.96 35,378,101 19,450,035 55.0% 8,145.04 4,024,655 11.4% 1,685.39 23,474,690 66.4% 9,830.44Hood Canal 319.46 7,110,211 3,826,230 53.8% 11,977.18 607,225 8.5% 1,900.78 4,433,455 62.4% 13,877.96County Total 10,290.56 146,222,244 90,136,640 61.6% 8,759.16 14,759,881 10.1% 1,434.31 104,896,521 71.7% 10,193.47
Okanogan Co.Nespelem 139.52 4,007,667 2,221,298 55.4% 15,921.00 520,527 13.0% 3,730.84 2,741,825 68.4% 19,651.84Omak 5,416.26 65,231,189 50,851,650 78.0% 9,388.70 4,188,593 6.4% 773.34 55,040,243 84.4% 10,162.04Okanogan 1,175.68 15,756,097 9,698,069 61.6% 8,248.90 1,184,295 7.5% 1,007.33 10,882,364 69.1% 9,256.23Brewster 987.27 13,612,868 8,212,823 60.3% 8,318.72 1,478,291 10.9% 1,497.35 9,691,114 71.2% 9,816.07Pateros 310.86 5,598,396 3,328,110 59.4% 10,706.14 294,535 5.3% 947.48 3,622,644 64.7% 11,653.62Methow Valley 695.56 10,501,119 6,293,558 59.9% 9,048.19 597,635 5.7% 859.21 6,891,193 65.6% 9,907.40Tonasket 1,131.31 15,900,077 9,427,219 59.3% 8,333.01 1,055,224 6.6% 932.74 10,482,442 65.9% 9,265.76Oroville 567.82 8,717,347 4,654,919 53.4% 8,197.88 866,167 9.9% 1,525.42 5,521,086 63.3% 9,723.30County Total 10,424.28 139,324,759 94,687,645 68.0% 9,083.38 10,185,267 7.3% 977.07 104,872,912 75.3% 10,060.45
Pacific Co.Ocean Beach 1,043.39 16,988,623 10,077,352 59.3% 9,658.28 1,122,603 6.6% 1,075.92 11,199,954 65.9% 10,734.20Raymond 554.32 8,818,285 5,405,396 61.3% 9,751.40 695,387 7.9% 1,254.49 6,100,783 69.2% 11,005.89South Bend 570.19 10,136,950 6,177,622 60.9% 10,834.32 841,497 8.3% 1,475.82 7,019,118 69.2% 12,310.14Naselle-Grays River 399.80 6,915,039 4,557,359 65.9% 11,399.10 452,864 6.5% 1,132.73 5,010,223 72.5% 12,531.82Willapa Valley 351.71 6,493,901 4,255,896 65.5% 12,100.58 79,492 1.2% 226.02 4,335,388 66.8% 12,326.60North River 66.71 2,289,157 1,326,659 58.0% 19,886.96 34,787 1.5% 521.46 1,361,446 59.5% 20,408.43County Total 2,986.12 51,641,955 31,800,284 61.6% 10,649.37 3,226,628 6.2% 1,080.54 35,026,912 67.8% 11,729.91
Pend Oreille Co.Newport 1,133.29 15,258,068 9,103,889 59.7% 8,033.15 1,081,074 7.1% 953.93 10,184,963 66.8% 8,987.08Cusick 250.99 4,566,459 2,725,029 59.7% 10,857.12 292,449 6.4% 1,165.18 3,017,478 66.1% 12,022.30Selkirk 274.10 4,858,144 2,574,596 53.0% 9,392.91 410,592 8.5% 1,497.96 2,985,188 61.4% 10,890.87County Total 1,658.38 24,682,671 14,403,513 58.4% 8,685.29 1,784,116 7.2% 1,075.82 16,187,629 65.6% 9,761.11
129
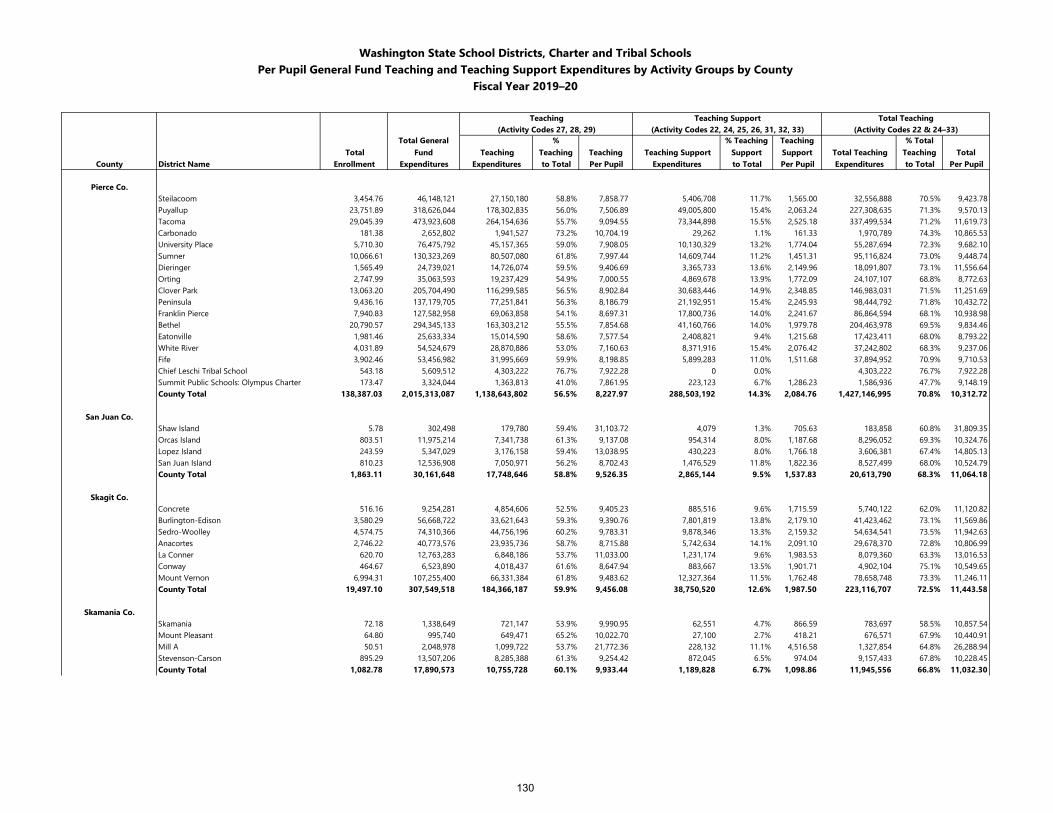
Washington State School Districts, Charter and Tribal SchoolsPer Pupil General Fund Teaching and Teaching Support Expenditures by Activity Groups by County
Fiscal Year 2019–20
Teaching Teaching Support Total Teaching(Activity Codes 27, 28, 29) (Activity Codes 22, 24, 25, 26, 31, 32, 33) (Activity Codes 22 & 24–33)
Total Total General
Fund Teaching %
Teaching Teaching Teaching Support % Teaching
SupportTeaching Support Total Teaching
% Total Teaching Total
County District Name Enrollment Expenditures Expenditures to Total Per Pupil Expenditures to Total Per Pupil Expenditures to Total Per Pupil
Pierce Co.Steilacoom 3,454.76 46,148,121 27,150,180 58.8% 7,858.77 5,406,708 11.7% 1,565.00 32,556,888 70.5% 9,423.78Puyallup 23,751.89 318,626,044 178,302,835 56.0% 7,506.89 49,005,800 15.4% 2,063.24 227,308,635 71.3% 9,570.13Tacoma 29,045.39 473,923,608 264,154,636 55.7% 9,094.55 73,344,898 15.5% 2,525.18 337,499,534 71.2% 11,619.73Carbonado 181.38 2,652,802 1,941,527 73.2% 10,704.19 29,262 1.1% 161.33 1,970,789 74.3% 10,865.53University Place 5,710.30 76,475,792 45,157,365 59.0% 7,908.05 10,130,329 13.2% 1,774.04 55,287,694 72.3% 9,682.10Sumner 10,066.61 130,323,269 80,507,080 61.8% 7,997.44 14,609,744 11.2% 1,451.31 95,116,824 73.0% 9,448.74Dieringer 1,565.49 24,739,021 14,726,074 59.5% 9,406.69 3,365,733 13.6% 2,149.96 18,091,807 73.1% 11,556.64Orting 2,747.99 35,063,593 19,237,429 54.9% 7,000.55 4,869,678 13.9% 1,772.09 24,107,107 68.8% 8,772.63Clover Park 13,063.20 205,704,490 116,299,585 56.5% 8,902.84 30,683,446 14.9% 2,348.85 146,983,031 71.5% 11,251.69Peninsula 9,436.16 137,179,705 77,251,841 56.3% 8,186.79 21,192,951 15.4% 2,245.93 98,444,792 71.8% 10,432.72Franklin Pierce 7,940.83 127,582,958 69,063,858 54.1% 8,697.31 17,800,736 14.0% 2,241.67 86,864,594 68.1% 10,938.98Bethel 20,790.57 294,345,133 163,303,212 55.5% 7,854.68 41,160,766 14.0% 1,979.78 204,463,978 69.5% 9,834.46Eatonville 1,981.46 25,633,334 15,014,590 58.6% 7,577.54 2,408,821 9.4% 1,215.68 17,423,411 68.0% 8,793.22White River 4,031.89 54,524,679 28,870,886 53.0% 7,160.63 8,371,916 15.4% 2,076.42 37,242,802 68.3% 9,237.06Fife 3,902.46 53,456,982 31,995,669 59.9% 8,198.85 5,899,283 11.0% 1,511.68 37,894,952 70.9% 9,710.53Chief Leschi Tribal School 543.18 5,609,512 4,303,222 76.7% 7,922.28 0 0.0% 4,303,222 76.7% 7,922.28Summit Public Schools: Olympus Charter 173.47 3,324,044 1,363,813 41.0% 7,861.95 223,123 6.7% 1,286.23 1,586,936 47.7% 9,148.19County Total 138,387.03 2,015,313,087 1,138,643,802 56.5% 8,227.97 288,503,192 14.3% 2,084.76 1,427,146,995 70.8% 10,312.72
San Juan Co.Shaw Island 5.78 302,498 179,780 59.4% 31,103.72 4,079 1.3% 705.63 183,858 60.8% 31,809.35Orcas Island 803.51 11,975,214 7,341,738 61.3% 9,137.08 954,314 8.0% 1,187.68 8,296,052 69.3% 10,324.76Lopez Island 243.59 5,347,029 3,176,158 59.4% 13,038.95 430,223 8.0% 1,766.18 3,606,381 67.4% 14,805.13San Juan Island 810.23 12,536,908 7,050,971 56.2% 8,702.43 1,476,529 11.8% 1,822.36 8,527,499 68.0% 10,524.79County Total 1,863.11 30,161,648 17,748,646 58.8% 9,526.35 2,865,144 9.5% 1,537.83 20,613,790 68.3% 11,064.18
Skagit Co.Concrete 516.16 9,254,281 4,854,606 52.5% 9,405.23 885,516 9.6% 1,715.59 5,740,122 62.0% 11,120.82Burlington-Edison 3,580.29 56,668,722 33,621,643 59.3% 9,390.76 7,801,819 13.8% 2,179.10 41,423,462 73.1% 11,569.86Sedro-Woolley 4,574.75 74,310,366 44,756,196 60.2% 9,783.31 9,878,346 13.3% 2,159.32 54,634,541 73.5% 11,942.63Anacortes 2,746.22 40,773,576 23,935,736 58.7% 8,715.88 5,742,634 14.1% 2,091.10 29,678,370 72.8% 10,806.99La Conner 620.70 12,763,283 6,848,186 53.7% 11,033.00 1,231,174 9.6% 1,983.53 8,079,360 63.3% 13,016.53Conway 464.67 6,523,890 4,018,437 61.6% 8,647.94 883,667 13.5% 1,901.71 4,902,104 75.1% 10,549.65Mount Vernon 6,994.31 107,255,400 66,331,384 61.8% 9,483.62 12,327,364 11.5% 1,762.48 78,658,748 73.3% 11,246.11County Total 19,497.10 307,549,518 184,366,187 59.9% 9,456.08 38,750,520 12.6% 1,987.50 223,116,707 72.5% 11,443.58
Skamania Co.Skamania 72.18 1,338,649 721,147 53.9% 9,990.95 62,551 4.7% 866.59 783,697 58.5% 10,857.54Mount Pleasant 64.80 995,740 649,471 65.2% 10,022.70 27,100 2.7% 418.21 676,571 67.9% 10,440.91Mill A 50.51 2,048,978 1,099,722 53.7% 21,772.36 228,132 11.1% 4,516.58 1,327,854 64.8% 26,288.94Stevenson-Carson 895.29 13,507,206 8,285,388 61.3% 9,254.42 872,045 6.5% 974.04 9,157,433 67.8% 10,228.45County Total 1,082.78 17,890,573 10,755,728 60.1% 9,933.44 1,189,828 6.7% 1,098.86 11,945,556 66.8% 11,032.30
130
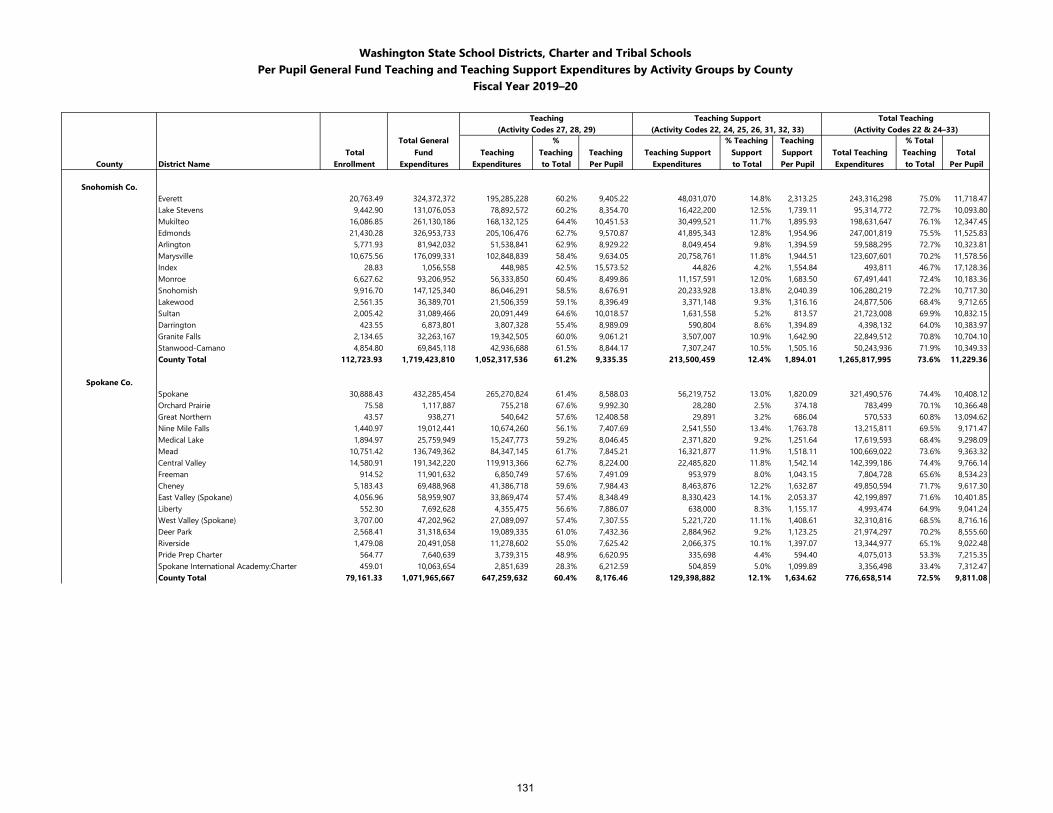
Washington State School Districts, Charter and Tribal SchoolsPer Pupil General Fund Teaching and Teaching Support Expenditures by Activity Groups by County
Fiscal Year 2019–20
Teaching Teaching Support Total Teaching(Activity Codes 27, 28, 29) (Activity Codes 22, 24, 25, 26, 31, 32, 33) (Activity Codes 22 & 24–33)
Total Total General
Fund Teaching %
Teaching Teaching Teaching Support % Teaching
SupportTeaching Support Total Teaching
% Total Teaching Total
County District Name Enrollment Expenditures Expenditures to Total Per Pupil Expenditures to Total Per Pupil Expenditures to Total Per Pupil
Snohomish Co.Everett 20,763.49 324,372,372 195,285,228 60.2% 9,405.22 48,031,070 14.8% 2,313.25 243,316,298 75.0% 11,718.47Lake Stevens 9,442.90 131,076,053 78,892,572 60.2% 8,354.70 16,422,200 12.5% 1,739.11 95,314,772 72.7% 10,093.80Mukilteo 16,086.85 261,130,186 168,132,125 64.4% 10,451.53 30,499,521 11.7% 1,895.93 198,631,647 76.1% 12,347.45Edmonds 21,430.28 326,953,733 205,106,476 62.7% 9,570.87 41,895,343 12.8% 1,954.96 247,001,819 75.5% 11,525.83Arlington 5,771.93 81,942,032 51,538,841 62.9% 8,929.22 8,049,454 9.8% 1,394.59 59,588,295 72.7% 10,323.81Marysville 10,675.56 176,099,331 102,848,839 58.4% 9,634.05 20,758,761 11.8% 1,944.51 123,607,601 70.2% 11,578.56Index 28.83 1,056,558 448,985 42.5% 15,573.52 44,826 4.2% 1,554.84 493,811 46.7% 17,128.36Monroe 6,627.62 93,206,952 56,333,850 60.4% 8,499.86 11,157,591 12.0% 1,683.50 67,491,441 72.4% 10,183.36Snohomish 9,916.70 147,125,340 86,046,291 58.5% 8,676.91 20,233,928 13.8% 2,040.39 106,280,219 72.2% 10,717.30Lakewood 2,561.35 36,389,701 21,506,359 59.1% 8,396.49 3,371,148 9.3% 1,316.16 24,877,506 68.4% 9,712.65Sultan 2,005.42 31,089,466 20,091,449 64.6% 10,018.57 1,631,558 5.2% 813.57 21,723,008 69.9% 10,832.15Darrington 423.55 6,873,801 3,807,328 55.4% 8,989.09 590,804 8.6% 1,394.89 4,398,132 64.0% 10,383.97Granite Falls 2,134.65 32,263,167 19,342,505 60.0% 9,061.21 3,507,007 10.9% 1,642.90 22,849,512 70.8% 10,704.10Stanwood-Camano 4,854.80 69,845,118 42,936,688 61.5% 8,844.17 7,307,247 10.5% 1,505.16 50,243,936 71.9% 10,349.33County Total 112,723.93 1,719,423,810 1,052,317,536 61.2% 9,335.35 213,500,459 12.4% 1,894.01 1,265,817,995 73.6% 11,229.36
Spokane Co.Spokane 30,888.43 432,285,454 265,270,824 61.4% 8,588.03 56,219,752 13.0% 1,820.09 321,490,576 74.4% 10,408.12Orchard Prairie 75.58 1,117,887 755,218 67.6% 9,992.30 28,280 2.5% 374.18 783,499 70.1% 10,366.48Great Northern 43.57 938,271 540,642 57.6% 12,408.58 29,891 3.2% 686.04 570,533 60.8% 13,094.62Nine Mile Falls 1,440.97 19,012,441 10,674,260 56.1% 7,407.69 2,541,550 13.4% 1,763.78 13,215,811 69.5% 9,171.47Medical Lake 1,894.97 25,759,949 15,247,773 59.2% 8,046.45 2,371,820 9.2% 1,251.64 17,619,593 68.4% 9,298.09Mead 10,751.42 136,749,362 84,347,145 61.7% 7,845.21 16,321,877 11.9% 1,518.11 100,669,022 73.6% 9,363.32Central Valley 14,580.91 191,342,220 119,913,366 62.7% 8,224.00 22,485,820 11.8% 1,542.14 142,399,186 74.4% 9,766.14Freeman 914.52 11,901,632 6,850,749 57.6% 7,491.09 953,979 8.0% 1,043.15 7,804,728 65.6% 8,534.23Cheney 5,183.43 69,488,968 41,386,718 59.6% 7,984.43 8,463,876 12.2% 1,632.87 49,850,594 71.7% 9,617.30East Valley (Spokane) 4,056.96 58,959,907 33,869,474 57.4% 8,348.49 8,330,423 14.1% 2,053.37 42,199,897 71.6% 10,401.85Liberty 552.30 7,692,628 4,355,475 56.6% 7,886.07 638,000 8.3% 1,155.17 4,993,474 64.9% 9,041.24West Valley (Spokane) 3,707.00 47,202,962 27,089,097 57.4% 7,307.55 5,221,720 11.1% 1,408.61 32,310,816 68.5% 8,716.16Deer Park 2,568.41 31,318,634 19,089,335 61.0% 7,432.36 2,884,962 9.2% 1,123.25 21,974,297 70.2% 8,555.60Riverside 1,479.08 20,491,058 11,278,602 55.0% 7,625.42 2,066,375 10.1% 1,397.07 13,344,977 65.1% 9,022.48Pride Prep Charter 564.77 7,640,639 3,739,315 48.9% 6,620.95 335,698 4.4% 594.40 4,075,013 53.3% 7,215.35Spokane International Academy:Charter 459.01 10,063,654 2,851,639 28.3% 6,212.59 504,859 5.0% 1,099.89 3,356,498 33.4% 7,312.47County Total 79,161.33 1,071,965,667 647,259,632 60.4% 8,176.46 129,398,882 12.1% 1,634.62 776,658,514 72.5% 9,811.08
131
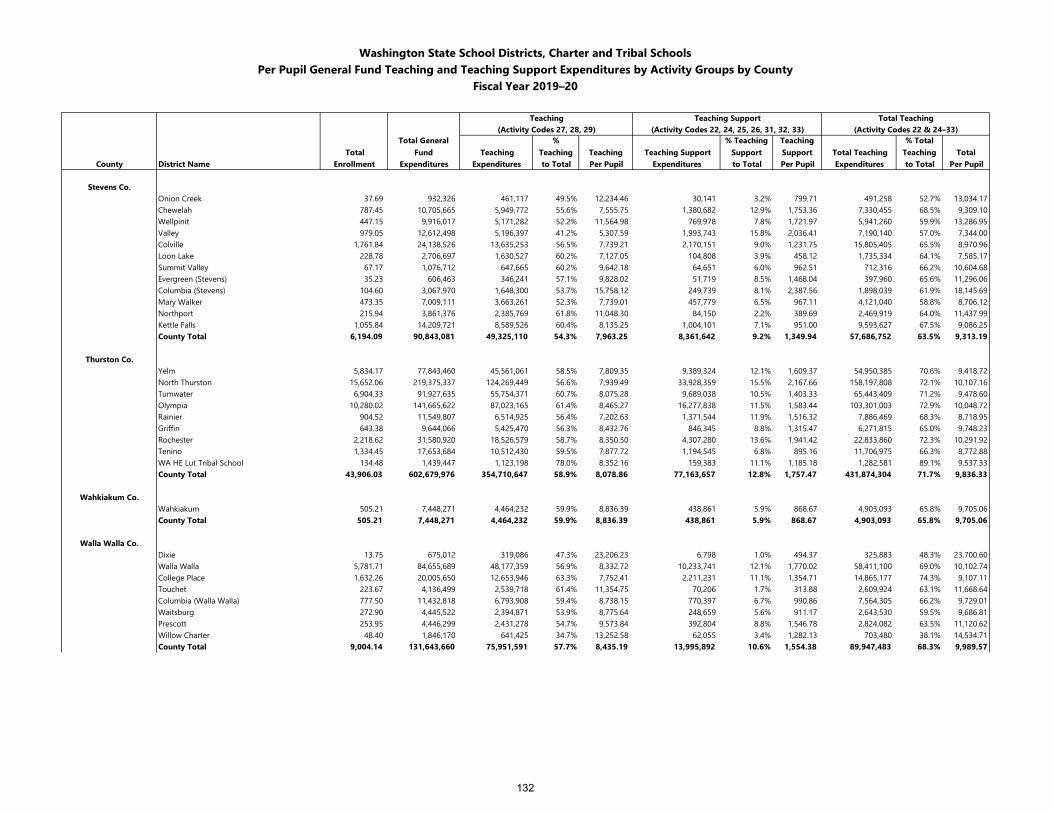
Washington State School Districts, Charter and Tribal SchoolsPer Pupil General Fund Teaching and Teaching Support Expenditures by Activity Groups by County
Fiscal Year 2019–20
Teaching Teaching Support Total Teaching(Activity Codes 27, 28, 29) (Activity Codes 22, 24, 25, 26, 31, 32, 33) (Activity Codes 22 & 24–33)
Total Total General
Fund Teaching %
Teaching Teaching Teaching Support % Teaching
SupportTeaching Support Total Teaching
% Total Teaching Total
County District Name Enrollment Expenditures Expenditures to Total Per Pupil Expenditures to Total Per Pupil Expenditures to Total Per Pupil
Stevens Co.Onion Creek 37.69 932,326 461,117 49.5% 12,234.46 30,141 3.2% 799.71 491,258 52.7% 13,034.17Chewelah 787.45 10,705,665 5,949,772 55.6% 7,555.75 1,380,682 12.9% 1,753.36 7,330,455 68.5% 9,309.10Wellpinit 447.15 9,916,017 5,171,282 52.2% 11,564.98 769,978 7.8% 1,721.97 5,941,260 59.9% 13,286.95Valley 979.05 12,612,498 5,196,397 41.2% 5,307.59 1,993,743 15.8% 2,036.41 7,190,140 57.0% 7,344.00Colville 1,761.84 24,138,526 13,635,253 56.5% 7,739.21 2,170,151 9.0% 1,231.75 15,805,405 65.5% 8,970.96Loon Lake 228.78 2,706,697 1,630,527 60.2% 7,127.05 104,808 3.9% 458.12 1,735,334 64.1% 7,585.17Summit Valley 67.17 1,076,712 647,665 60.2% 9,642.18 64,651 6.0% 962.51 712,316 66.2% 10,604.68Evergreen (Stevens) 35.23 606,463 346,241 57.1% 9,828.02 51,719 8.5% 1,468.04 397,960 65.6% 11,296.06Columbia (Stevens) 104.60 3,067,970 1,648,300 53.7% 15,758.12 249,739 8.1% 2,387.56 1,898,039 61.9% 18,145.69Mary Walker 473.35 7,009,111 3,663,261 52.3% 7,739.01 457,779 6.5% 967.11 4,121,040 58.8% 8,706.12Northport 215.94 3,861,376 2,385,769 61.8% 11,048.30 84,150 2.2% 389.69 2,469,919 64.0% 11,437.99Kettle Falls 1,055.84 14,209,721 8,589,526 60.4% 8,135.25 1,004,101 7.1% 951.00 9,593,627 67.5% 9,086.25County Total 6,194.09 90,843,081 49,325,110 54.3% 7,963.25 8,361,642 9.2% 1,349.94 57,686,752 63.5% 9,313.19
Thurston Co.Yelm 5,834.17 77,843,460 45,561,061 58.5% 7,809.35 9,389,324 12.1% 1,609.37 54,950,385 70.6% 9,418.72North Thurston 15,652.06 219,375,337 124,269,449 56.6% 7,939.49 33,928,359 15.5% 2,167.66 158,197,808 72.1% 10,107.16Tumwater 6,904.33 91,927,635 55,754,371 60.7% 8,075.28 9,689,038 10.5% 1,403.33 65,443,409 71.2% 9,478.60Olympia 10,280.02 141,665,622 87,023,165 61.4% 8,465.27 16,277,838 11.5% 1,583.44 103,301,003 72.9% 10,048.72Rainier 904.52 11,549,807 6,514,925 56.4% 7,202.63 1,371,544 11.9% 1,516.32 7,886,469 68.3% 8,718.95Griffin 643.38 9,644,066 5,425,470 56.3% 8,432.76 846,345 8.8% 1,315.47 6,271,815 65.0% 9,748.23Rochester 2,218.62 31,580,920 18,526,579 58.7% 8,350.50 4,307,280 13.6% 1,941.42 22,833,860 72.3% 10,291.92Tenino 1,334.45 17,653,684 10,512,430 59.5% 7,877.72 1,194,545 6.8% 895.16 11,706,975 66.3% 8,772.88WA HE Lut Tribal School 134.48 1,439,447 1,123,198 78.0% 8,352.16 159,383 11.1% 1,185.18 1,282,581 89.1% 9,537.33County Total 43,906.03 602,679,976 354,710,647 58.9% 8,078.86 77,163,657 12.8% 1,757.47 431,874,304 71.7% 9,836.33
Wahkiakum Co.Wahkiakum 505.21 7,448,271 4,464,232 59.9% 8,836.39 438,861 5.9% 868.67 4,903,093 65.8% 9,705.06County Total 505.21 7,448,271 4,464,232 59.9% 8,836.39 438,861 5.9% 868.67 4,903,093 65.8% 9,705.06
Walla Walla Co.Dixie 13.75 675,012 319,086 47.3% 23,206.23 6,798 1.0% 494.37 325,883 48.3% 23,700.60Walla Walla 5,781.71 84,655,689 48,177,359 56.9% 8,332.72 10,233,741 12.1% 1,770.02 58,411,100 69.0% 10,102.74College Place 1,632.26 20,005,650 12,653,946 63.3% 7,752.41 2,211,231 11.1% 1,354.71 14,865,177 74.3% 9,107.11Touchet 223.67 4,136,499 2,539,718 61.4% 11,354.75 70,206 1.7% 313.88 2,609,924 63.1% 11,668.64Columbia (Walla Walla) 777.50 11,432,818 6,793,908 59.4% 8,738.15 770,397 6.7% 990.86 7,564,305 66.2% 9,729.01Waitsburg 272.90 4,445,522 2,394,871 53.9% 8,775.64 248,659 5.6% 911.17 2,643,530 59.5% 9,686.81Prescott 253.95 4,446,299 2,431,278 54.7% 9,573.84 392,804 8.8% 1,546.78 2,824,082 63.5% 11,120.62Willow Charter 48.40 1,846,170 641,425 34.7% 13,252.58 62,055 3.4% 1,282.13 703,480 38.1% 14,534.71County Total 9,004.14 131,643,660 75,951,591 57.7% 8,435.19 13,995,892 10.6% 1,554.38 89,947,483 68.3% 9,989.57
132
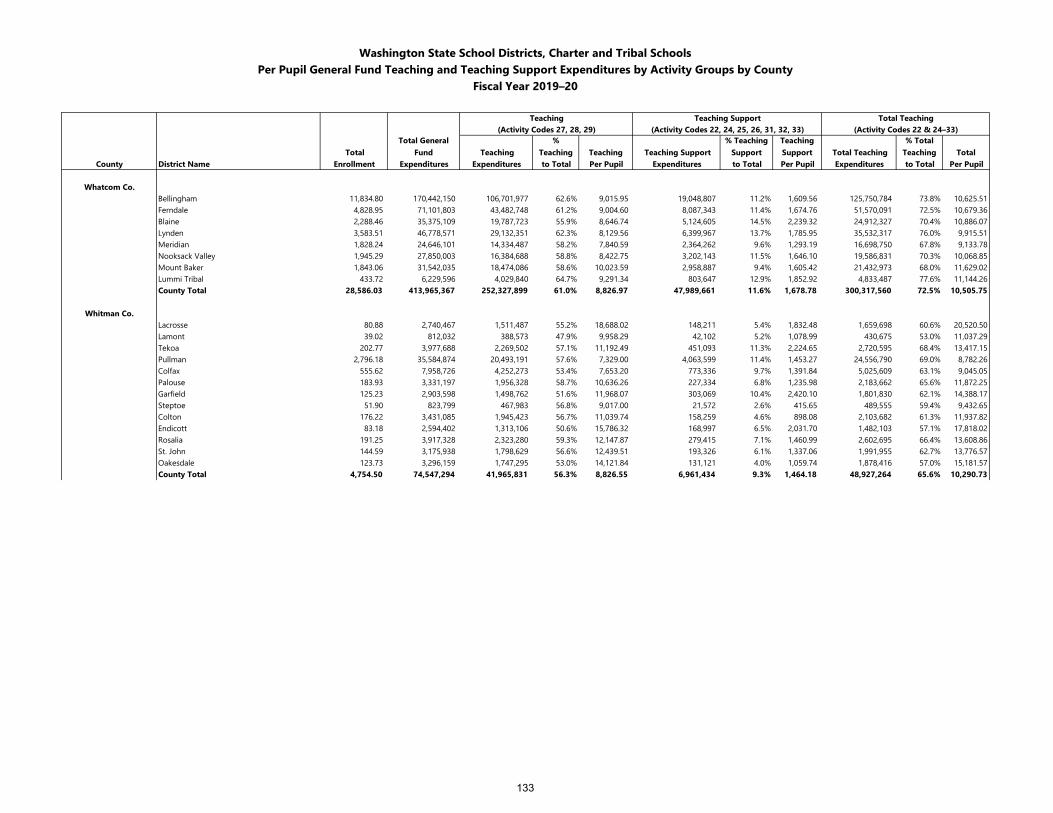
Washington State School Districts, Charter and Tribal SchoolsPer Pupil General Fund Teaching and Teaching Support Expenditures by Activity Groups by County
Fiscal Year 2019–20
Teaching Teaching Support Total Teaching(Activity Codes 27, 28, 29) (Activity Codes 22, 24, 25, 26, 31, 32, 33) (Activity Codes 22 & 24–33)
Total Total General
Fund Teaching %
Teaching Teaching Teaching Support % Teaching
SupportTeaching Support Total Teaching
% Total Teaching Total
County District Name Enrollment Expenditures Expenditures to Total Per Pupil Expenditures to Total Per Pupil Expenditures to Total Per Pupil
Whatcom Co.Bellingham 11,834.80 170,442,150 106,701,977 62.6% 9,015.95 19,048,807 11.2% 1,609.56 125,750,784 73.8% 10,625.51Ferndale 4,828.95 71,101,803 43,482,748 61.2% 9,004.60 8,087,343 11.4% 1,674.76 51,570,091 72.5% 10,679.36Blaine 2,288.46 35,375,109 19,787,723 55.9% 8,646.74 5,124,605 14.5% 2,239.32 24,912,327 70.4% 10,886.07Lynden 3,583.51 46,778,571 29,132,351 62.3% 8,129.56 6,399,967 13.7% 1,785.95 35,532,317 76.0% 9,915.51Meridian 1,828.24 24,646,101 14,334,487 58.2% 7,840.59 2,364,262 9.6% 1,293.19 16,698,750 67.8% 9,133.78Nooksack Valley 1,945.29 27,850,003 16,384,688 58.8% 8,422.75 3,202,143 11.5% 1,646.10 19,586,831 70.3% 10,068.85Mount Baker 1,843.06 31,542,035 18,474,086 58.6% 10,023.59 2,958,887 9.4% 1,605.42 21,432,973 68.0% 11,629.02Lummi Tribal 433.72 6,229,596 4,029,840 64.7% 9,291.34 803,647 12.9% 1,852.92 4,833,487 77.6% 11,144.26County Total 28,586.03 413,965,367 252,327,899 61.0% 8,826.97 47,989,661 11.6% 1,678.78 300,317,560 72.5% 10,505.75
Whitman Co.Lacrosse 80.88 2,740,467 1,511,487 55.2% 18,688.02 148,211 5.4% 1,832.48 1,659,698 60.6% 20,520.50Lamont 39.02 812,032 388,573 47.9% 9,958.29 42,102 5.2% 1,078.99 430,675 53.0% 11,037.29Tekoa 202.77 3,977,688 2,269,502 57.1% 11,192.49 451,093 11.3% 2,224.65 2,720,595 68.4% 13,417.15Pullman 2,796.18 35,584,874 20,493,191 57.6% 7,329.00 4,063,599 11.4% 1,453.27 24,556,790 69.0% 8,782.26Colfax 555.62 7,958,726 4,252,273 53.4% 7,653.20 773,336 9.7% 1,391.84 5,025,609 63.1% 9,045.05Palouse 183.93 3,331,197 1,956,328 58.7% 10,636.26 227,334 6.8% 1,235.98 2,183,662 65.6% 11,872.25Garfield 125.23 2,903,598 1,498,762 51.6% 11,968.07 303,069 10.4% 2,420.10 1,801,830 62.1% 14,388.17Steptoe 51.90 823,799 467,983 56.8% 9,017.00 21,572 2.6% 415.65 489,555 59.4% 9,432.65Colton 176.22 3,431,085 1,945,423 56.7% 11,039.74 158,259 4.6% 898.08 2,103,682 61.3% 11,937.82Endicott 83.18 2,594,402 1,313,106 50.6% 15,786.32 168,997 6.5% 2,031.70 1,482,103 57.1% 17,818.02Rosalia 191.25 3,917,328 2,323,280 59.3% 12,147.87 279,415 7.1% 1,460.99 2,602,695 66.4% 13,608.86St. John 144.59 3,175,938 1,798,629 56.6% 12,439.51 193,326 6.1% 1,337.06 1,991,955 62.7% 13,776.57Oakesdale 123.73 3,296,159 1,747,295 53.0% 14,121.84 131,121 4.0% 1,059.74 1,878,416 57.0% 15,181.57County Total 4,754.50 74,547,294 41,965,831 56.3% 8,826.55 6,961,434 9.3% 1,464.18 48,927,264 65.6% 10,290.73
133
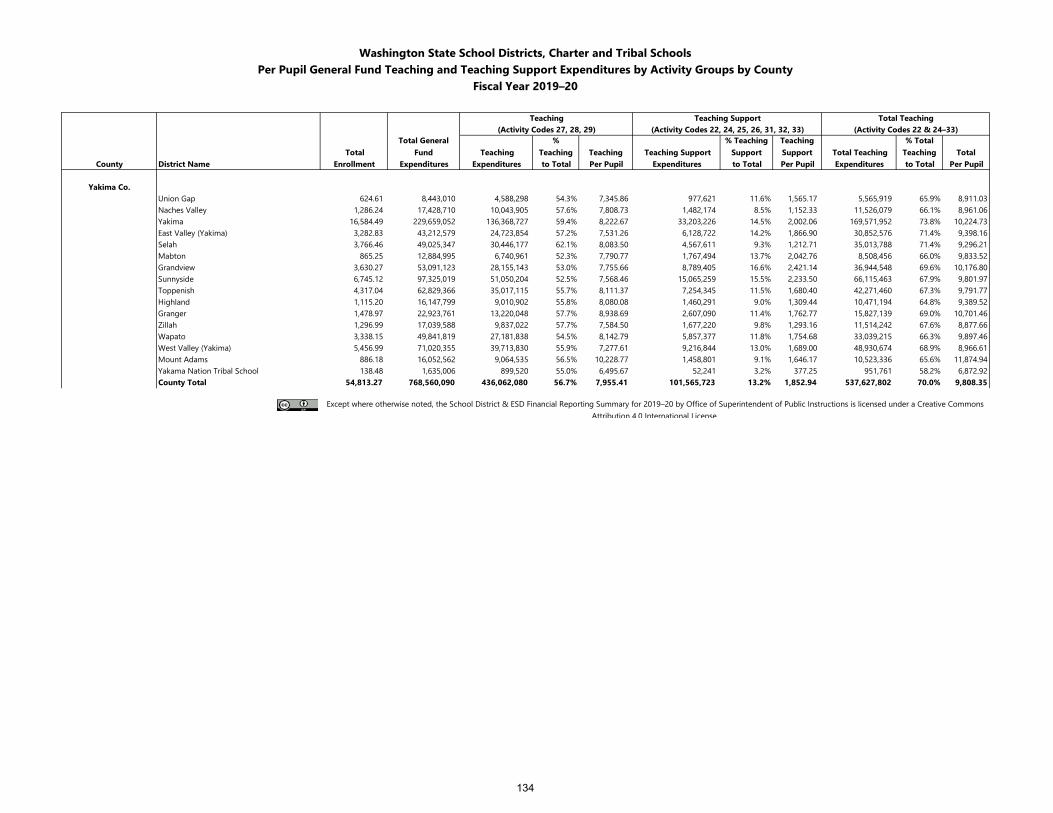
Washington State School Districts, Charter and Tribal SchoolsPer Pupil General Fund Teaching and Teaching Support Expenditures by Activity Groups by County
Fiscal Year 2019–20
Teaching Teaching Support Total Teaching(Activity Codes 27, 28, 29) (Activity Codes 22, 24, 25, 26, 31, 32, 33) (Activity Codes 22 & 24–33)
Total Total General
Fund Teaching %
Teaching Teaching Teaching Support % Teaching
SupportTeaching Support Total Teaching
% Total Teaching Total
County District Name Enrollment Expenditures Expenditures to Total Per Pupil Expenditures to Total Per Pupil Expenditures to Total Per Pupil
Yakima Co.Union Gap 624.61 8,443,010 4,588,298 54.3% 7,345.86 977,621 11.6% 1,565.17 5,565,919 65.9% 8,911.03Naches Valley 1,286.24 17,428,710 10,043,905 57.6% 7,808.73 1,482,174 8.5% 1,152.33 11,526,079 66.1% 8,961.06Yakima 16,584.49 229,659,052 136,368,727 59.4% 8,222.67 33,203,226 14.5% 2,002.06 169,571,952 73.8% 10,224.73East Valley (Yakima) 3,282.83 43,212,579 24,723,854 57.2% 7,531.26 6,128,722 14.2% 1,866.90 30,852,576 71.4% 9,398.16Selah 3,766.46 49,025,347 30,446,177 62.1% 8,083.50 4,567,611 9.3% 1,212.71 35,013,788 71.4% 9,296.21Mabton 865.25 12,884,995 6,740,961 52.3% 7,790.77 1,767,494 13.7% 2,042.76 8,508,456 66.0% 9,833.52Grandview 3,630.27 53,091,123 28,155,143 53.0% 7,755.66 8,789,405 16.6% 2,421.14 36,944,548 69.6% 10,176.80Sunnyside 6,745.12 97,325,019 51,050,204 52.5% 7,568.46 15,065,259 15.5% 2,233.50 66,115,463 67.9% 9,801.97Toppenish 4,317.04 62,829,366 35,017,115 55.7% 8,111.37 7,254,345 11.5% 1,680.40 42,271,460 67.3% 9,791.77Highland 1,115.20 16,147,799 9,010,902 55.8% 8,080.08 1,460,291 9.0% 1,309.44 10,471,194 64.8% 9,389.52Granger 1,478.97 22,923,761 13,220,048 57.7% 8,938.69 2,607,090 11.4% 1,762.77 15,827,139 69.0% 10,701.46Zillah 1,296.99 17,039,588 9,837,022 57.7% 7,584.50 1,677,220 9.8% 1,293.16 11,514,242 67.6% 8,877.66Wapato 3,338.15 49,841,819 27,181,838 54.5% 8,142.79 5,857,377 11.8% 1,754.68 33,039,215 66.3% 9,897.46West Valley (Yakima) 5,456.99 71,020,355 39,713,830 55.9% 7,277.61 9,216,844 13.0% 1,689.00 48,930,674 68.9% 8,966.61Mount Adams 886.18 16,052,562 9,064,535 56.5% 10,228.77 1,458,801 9.1% 1,646.17 10,523,336 65.6% 11,874.94Yakama Nation Tribal School 138.48 1,635,006 899,520 55.0% 6,495.67 52,241 3.2% 377.25 951,761 58.2% 6,872.92County Total 54,813.27 768,560,090 436,062,080 56.7% 7,955.41 101,565,723 13.2% 1,852.94 537,627,802 70.0% 9,808.35
Except where otherwise noted, the School District & ESD Financial Reporting Summary for 2019–20 by Office of Superintendent of Public Instructions is licensed under a Creative Commons Attribution 4.0 International License.
134
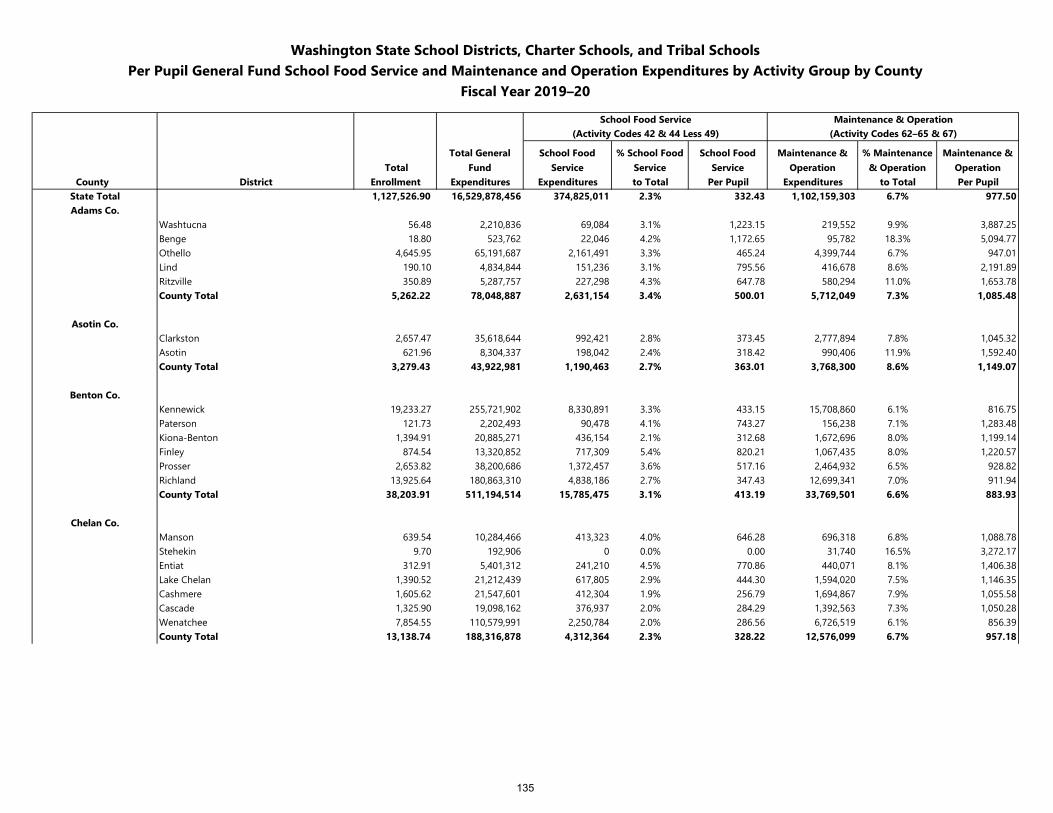
Washington State School Districts, Charter Schools, and Tribal SchoolsPer Pupil General Fund School Food Service and Maintenance and Operation Expenditures by Activity Group by County
Fiscal Year 2019–20
School Food Service Maintenance & Operation(Activity Codes 42 & 44 Less 49) (Activity Codes 62–65 & 67)
Total Total General
FundSchool Food
Service% School Food
ServiceSchool Food
ServiceMaintenance &
Operation% Maintenance
& OperationMaintenance &
OperationCounty District Enrollment Expenditures Expenditures to Total Per Pupil Expenditures to Total Per Pupil
State Total 1,127,526.90 16,529,878,456 374,825,011 2.3% 332.43 1,102,159,303 6.7% 977.50Adams Co.
Washtucna 56.48 2,210,836 69,084 3.1% 1,223.15 219,552 9.9% 3,887.25Benge 18.80 523,762 22,046 4.2% 1,172.65 95,782 18.3% 5,094.77Othello 4,645.95 65,191,687 2,161,491 3.3% 465.24 4,399,744 6.7% 947.01Lind 190.10 4,834,844 151,236 3.1% 795.56 416,678 8.6% 2,191.89Ritzville 350.89 5,287,757 227,298 4.3% 647.78 580,294 11.0% 1,653.78County Total 5,262.22 78,048,887 2,631,154 3.4% 500.01 5,712,049 7.3% 1,085.48
Asotin Co.Clarkston 2,657.47 35,618,644 992,421 2.8% 373.45 2,777,894 7.8% 1,045.32Asotin 621.96 8,304,337 198,042 2.4% 318.42 990,406 11.9% 1,592.40County Total 3,279.43 43,922,981 1,190,463 2.7% 363.01 3,768,300 8.6% 1,149.07
Benton Co.Kennewick 19,233.27 255,721,902 8,330,891 3.3% 433.15 15,708,860 6.1% 816.75Paterson 121.73 2,202,493 90,478 4.1% 743.27 156,238 7.1% 1,283.48Kiona-Benton 1,394.91 20,885,271 436,154 2.1% 312.68 1,672,696 8.0% 1,199.14Finley 874.54 13,320,852 717,309 5.4% 820.21 1,067,435 8.0% 1,220.57Prosser 2,653.82 38,200,686 1,372,457 3.6% 517.16 2,464,932 6.5% 928.82Richland 13,925.64 180,863,310 4,838,186 2.7% 347.43 12,699,341 7.0% 911.94County Total 38,203.91 511,194,514 15,785,475 3.1% 413.19 33,769,501 6.6% 883.93
Chelan Co.Manson 639.54 10,284,466 413,323 4.0% 646.28 696,318 6.8% 1,088.78Stehekin 9.70 192,906 0 0.0% 0.00 31,740 16.5% 3,272.17Entiat 312.91 5,401,312 241,210 4.5% 770.86 440,071 8.1% 1,406.38Lake Chelan 1,390.52 21,212,439 617,805 2.9% 444.30 1,594,020 7.5% 1,146.35Cashmere 1,605.62 21,547,601 412,304 1.9% 256.79 1,694,867 7.9% 1,055.58Cascade 1,325.90 19,098,162 376,937 2.0% 284.29 1,392,563 7.3% 1,050.28Wenatchee 7,854.55 110,579,991 2,250,784 2.0% 286.56 6,726,519 6.1% 856.39County Total 13,138.74 188,316,878 4,312,364 2.3% 328.22 12,576,099 6.7% 957.18
135
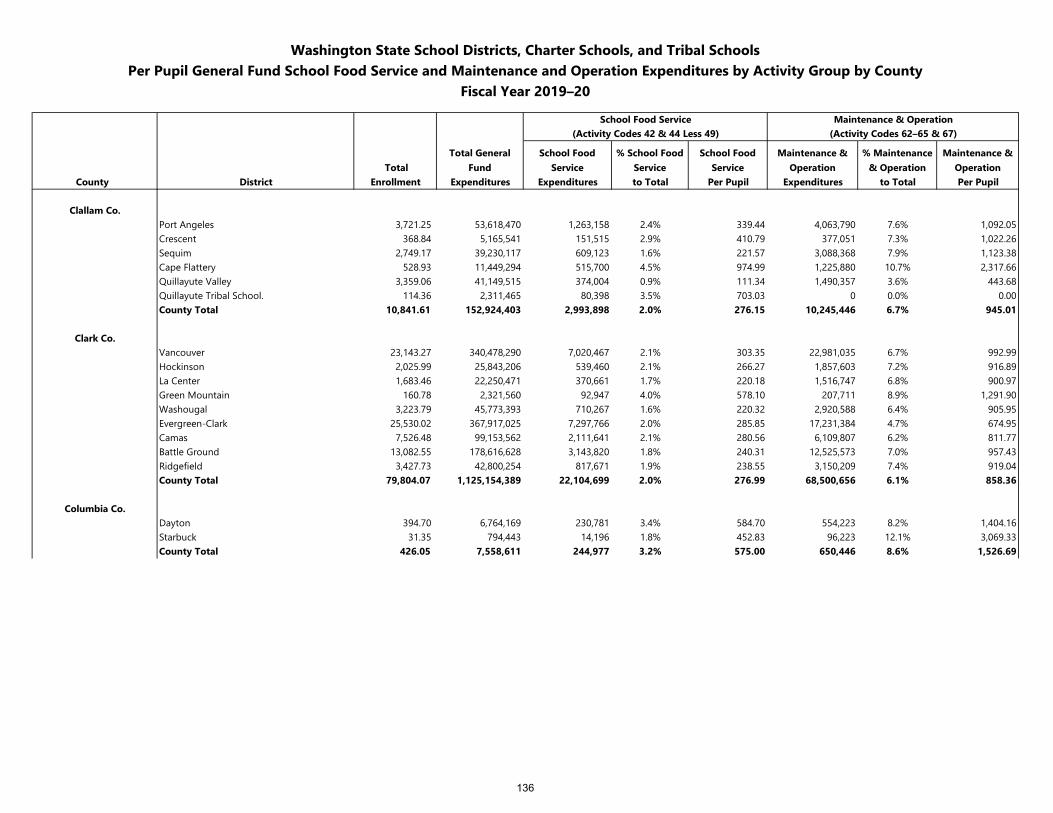
Washington State School Districts, Charter Schools, and Tribal SchoolsPer Pupil General Fund School Food Service and Maintenance and Operation Expenditures by Activity Group by County
Fiscal Year 2019–20
School Food Service Maintenance & Operation(Activity Codes 42 & 44 Less 49) (Activity Codes 62–65 & 67)
Total Total General
FundSchool Food
Service% School Food
ServiceSchool Food
ServiceMaintenance &
Operation% Maintenance
& OperationMaintenance &
OperationCounty District Enrollment Expenditures Expenditures to Total Per Pupil Expenditures to Total Per Pupil
Clallam Co.Port Angeles 3,721.25 53,618,470 1,263,158 2.4% 339.44 4,063,790 7.6% 1,092.05Crescent 368.84 5,165,541 151,515 2.9% 410.79 377,051 7.3% 1,022.26Sequim 2,749.17 39,230,117 609,123 1.6% 221.57 3,088,368 7.9% 1,123.38Cape Flattery 528.93 11,449,294 515,700 4.5% 974.99 1,225,880 10.7% 2,317.66Quillayute Valley 3,359.06 41,149,515 374,004 0.9% 111.34 1,490,357 3.6% 443.68Quillayute Tribal School. 114.36 2,311,465 80,398 3.5% 703.03 0 0.0% 0.00County Total 10,841.61 152,924,403 2,993,898 2.0% 276.15 10,245,446 6.7% 945.01
Clark Co.Vancouver 23,143.27 340,478,290 7,020,467 2.1% 303.35 22,981,035 6.7% 992.99Hockinson 2,025.99 25,843,206 539,460 2.1% 266.27 1,857,603 7.2% 916.89La Center 1,683.46 22,250,471 370,661 1.7% 220.18 1,516,747 6.8% 900.97Green Mountain 160.78 2,321,560 92,947 4.0% 578.10 207,711 8.9% 1,291.90Washougal 3,223.79 45,773,393 710,267 1.6% 220.32 2,920,588 6.4% 905.95Evergreen-Clark 25,530.02 367,917,025 7,297,766 2.0% 285.85 17,231,384 4.7% 674.95Camas 7,526.48 99,153,562 2,111,641 2.1% 280.56 6,109,807 6.2% 811.77Battle Ground 13,082.55 178,616,628 3,143,820 1.8% 240.31 12,525,573 7.0% 957.43Ridgefield 3,427.73 42,800,254 817,671 1.9% 238.55 3,150,209 7.4% 919.04County Total 79,804.07 1,125,154,389 22,104,699 2.0% 276.99 68,500,656 6.1% 858.36
Columbia Co.Dayton 394.70 6,764,169 230,781 3.4% 584.70 554,223 8.2% 1,404.16Starbuck 31.35 794,443 14,196 1.8% 452.83 96,223 12.1% 3,069.33County Total 426.05 7,558,611 244,977 3.2% 575.00 650,446 8.6% 1,526.69
136
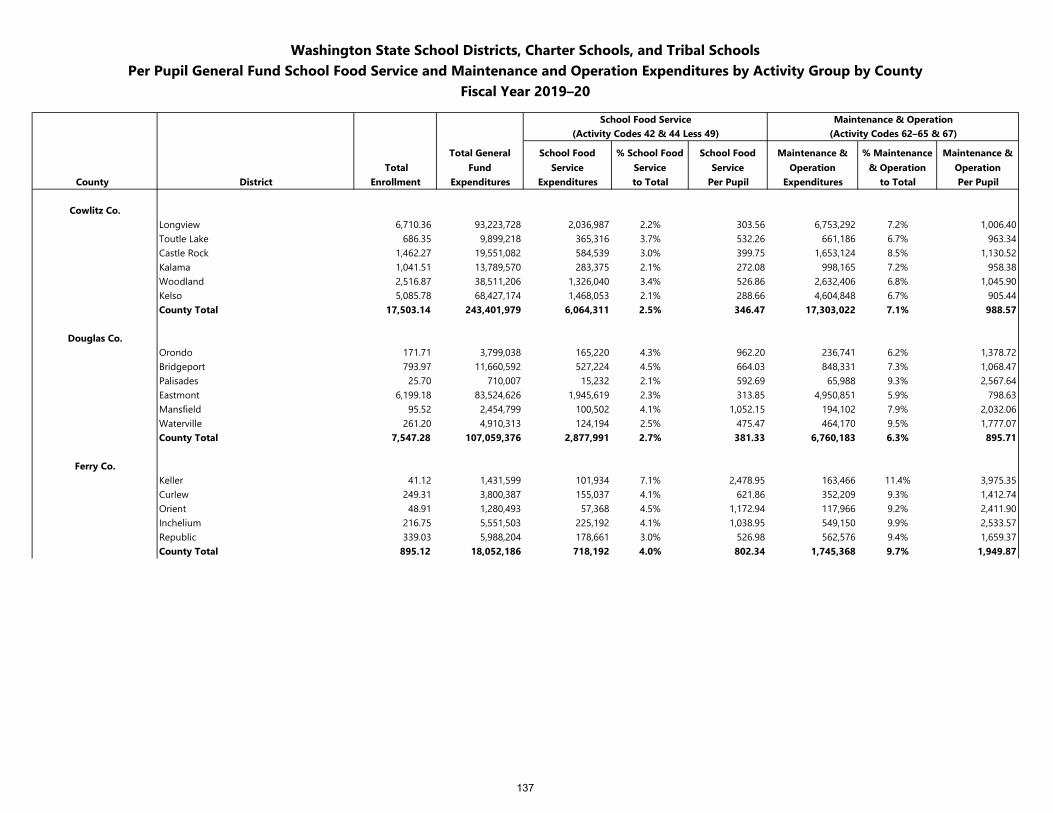
Washington State School Districts, Charter Schools, and Tribal SchoolsPer Pupil General Fund School Food Service and Maintenance and Operation Expenditures by Activity Group by County
Fiscal Year 2019–20
School Food Service Maintenance & Operation(Activity Codes 42 & 44 Less 49) (Activity Codes 62–65 & 67)
Total Total General
FundSchool Food
Service% School Food
ServiceSchool Food
ServiceMaintenance &
Operation% Maintenance
& OperationMaintenance &
OperationCounty District Enrollment Expenditures Expenditures to Total Per Pupil Expenditures to Total Per Pupil
Cowlitz Co.Longview 6,710.36 93,223,728 2,036,987 2.2% 303.56 6,753,292 7.2% 1,006.40Toutle Lake 686.35 9,899,218 365,316 3.7% 532.26 661,186 6.7% 963.34Castle Rock 1,462.27 19,551,082 584,539 3.0% 399.75 1,653,124 8.5% 1,130.52Kalama 1,041.51 13,789,570 283,375 2.1% 272.08 998,165 7.2% 958.38Woodland 2,516.87 38,511,206 1,326,040 3.4% 526.86 2,632,406 6.8% 1,045.90Kelso 5,085.78 68,427,174 1,468,053 2.1% 288.66 4,604,848 6.7% 905.44County Total 17,503.14 243,401,979 6,064,311 2.5% 346.47 17,303,022 7.1% 988.57
Douglas Co.Orondo 171.71 3,799,038 165,220 4.3% 962.20 236,741 6.2% 1,378.72Bridgeport 793.97 11,660,592 527,224 4.5% 664.03 848,331 7.3% 1,068.47Palisades 25.70 710,007 15,232 2.1% 592.69 65,988 9.3% 2,567.64Eastmont 6,199.18 83,524,626 1,945,619 2.3% 313.85 4,950,851 5.9% 798.63Mansfield 95.52 2,454,799 100,502 4.1% 1,052.15 194,102 7.9% 2,032.06Waterville 261.20 4,910,313 124,194 2.5% 475.47 464,170 9.5% 1,777.07County Total 7,547.28 107,059,376 2,877,991 2.7% 381.33 6,760,183 6.3% 895.71
Ferry Co.Keller 41.12 1,431,599 101,934 7.1% 2,478.95 163,466 11.4% 3,975.35Curlew 249.31 3,800,387 155,037 4.1% 621.86 352,209 9.3% 1,412.74Orient 48.91 1,280,493 57,368 4.5% 1,172.94 117,966 9.2% 2,411.90Inchelium 216.75 5,551,503 225,192 4.1% 1,038.95 549,150 9.9% 2,533.57Republic 339.03 5,988,204 178,661 3.0% 526.98 562,576 9.4% 1,659.37County Total 895.12 18,052,186 718,192 4.0% 802.34 1,745,368 9.7% 1,949.87
137
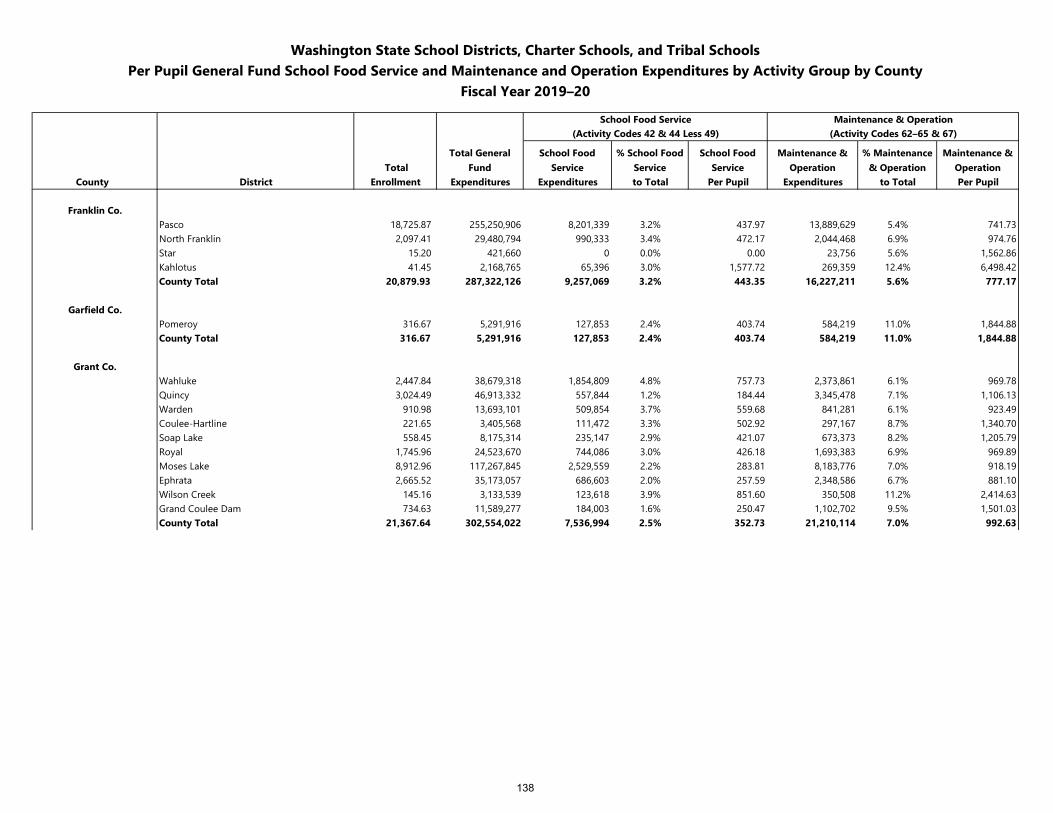
Washington State School Districts, Charter Schools, and Tribal SchoolsPer Pupil General Fund School Food Service and Maintenance and Operation Expenditures by Activity Group by County
Fiscal Year 2019–20
School Food Service Maintenance & Operation(Activity Codes 42 & 44 Less 49) (Activity Codes 62–65 & 67)
Total Total General
FundSchool Food
Service% School Food
ServiceSchool Food
ServiceMaintenance &
Operation% Maintenance
& OperationMaintenance &
OperationCounty District Enrollment Expenditures Expenditures to Total Per Pupil Expenditures to Total Per Pupil
Franklin Co.Pasco 18,725.87 255,250,906 8,201,339 3.2% 437.97 13,889,629 5.4% 741.73North Franklin 2,097.41 29,480,794 990,333 3.4% 472.17 2,044,468 6.9% 974.76Star 15.20 421,660 0 0.0% 0.00 23,756 5.6% 1,562.86Kahlotus 41.45 2,168,765 65,396 3.0% 1,577.72 269,359 12.4% 6,498.42County Total 20,879.93 287,322,126 9,257,069 3.2% 443.35 16,227,211 5.6% 777.17
Garfield Co.Pomeroy 316.67 5,291,916 127,853 2.4% 403.74 584,219 11.0% 1,844.88County Total 316.67 5,291,916 127,853 2.4% 403.74 584,219 11.0% 1,844.88
Grant Co.Wahluke 2,447.84 38,679,318 1,854,809 4.8% 757.73 2,373,861 6.1% 969.78Quincy 3,024.49 46,913,332 557,844 1.2% 184.44 3,345,478 7.1% 1,106.13Warden 910.98 13,693,101 509,854 3.7% 559.68 841,281 6.1% 923.49Coulee-Hartline 221.65 3,405,568 111,472 3.3% 502.92 297,167 8.7% 1,340.70Soap Lake 558.45 8,175,314 235,147 2.9% 421.07 673,373 8.2% 1,205.79Royal 1,745.96 24,523,670 744,086 3.0% 426.18 1,693,383 6.9% 969.89Moses Lake 8,912.96 117,267,845 2,529,559 2.2% 283.81 8,183,776 7.0% 918.19Ephrata 2,665.52 35,173,057 686,603 2.0% 257.59 2,348,586 6.7% 881.10Wilson Creek 145.16 3,133,539 123,618 3.9% 851.60 350,508 11.2% 2,414.63Grand Coulee Dam 734.63 11,589,277 184,003 1.6% 250.47 1,102,702 9.5% 1,501.03County Total 21,367.64 302,554,022 7,536,994 2.5% 352.73 21,210,114 7.0% 992.63
138
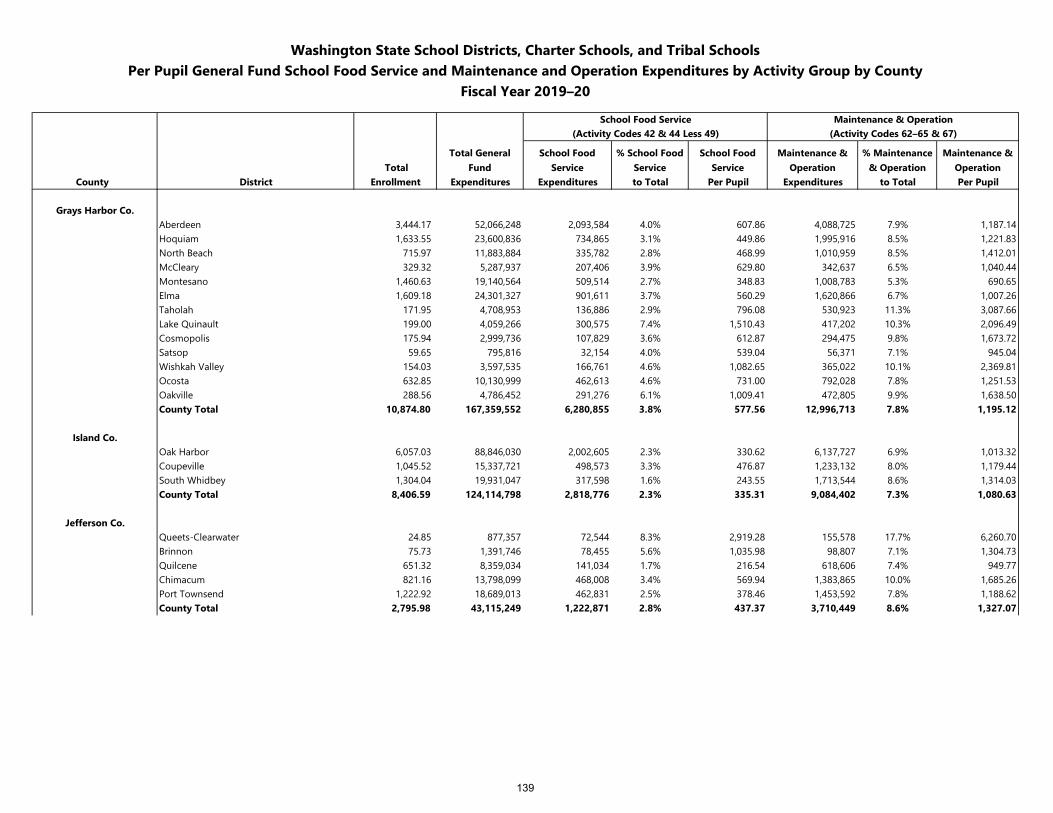
Washington State School Districts, Charter Schools, and Tribal SchoolsPer Pupil General Fund School Food Service and Maintenance and Operation Expenditures by Activity Group by County
Fiscal Year 2019–20
School Food Service Maintenance & Operation(Activity Codes 42 & 44 Less 49) (Activity Codes 62–65 & 67)
Total Total General
FundSchool Food
Service% School Food
ServiceSchool Food
ServiceMaintenance &
Operation% Maintenance
& OperationMaintenance &
OperationCounty District Enrollment Expenditures Expenditures to Total Per Pupil Expenditures to Total Per Pupil
Grays Harbor Co.Aberdeen 3,444.17 52,066,248 2,093,584 4.0% 607.86 4,088,725 7.9% 1,187.14Hoquiam 1,633.55 23,600,836 734,865 3.1% 449.86 1,995,916 8.5% 1,221.83North Beach 715.97 11,883,884 335,782 2.8% 468.99 1,010,959 8.5% 1,412.01McCleary 329.32 5,287,937 207,406 3.9% 629.80 342,637 6.5% 1,040.44Montesano 1,460.63 19,140,564 509,514 2.7% 348.83 1,008,783 5.3% 690.65Elma 1,609.18 24,301,327 901,611 3.7% 560.29 1,620,866 6.7% 1,007.26Taholah 171.95 4,708,953 136,886 2.9% 796.08 530,923 11.3% 3,087.66Lake Quinault 199.00 4,059,266 300,575 7.4% 1,510.43 417,202 10.3% 2,096.49Cosmopolis 175.94 2,999,736 107,829 3.6% 612.87 294,475 9.8% 1,673.72Satsop 59.65 795,816 32,154 4.0% 539.04 56,371 7.1% 945.04Wishkah Valley 154.03 3,597,535 166,761 4.6% 1,082.65 365,022 10.1% 2,369.81Ocosta 632.85 10,130,999 462,613 4.6% 731.00 792,028 7.8% 1,251.53Oakville 288.56 4,786,452 291,276 6.1% 1,009.41 472,805 9.9% 1,638.50County Total 10,874.80 167,359,552 6,280,855 3.8% 577.56 12,996,713 7.8% 1,195.12
Island Co.Oak Harbor 6,057.03 88,846,030 2,002,605 2.3% 330.62 6,137,727 6.9% 1,013.32Coupeville 1,045.52 15,337,721 498,573 3.3% 476.87 1,233,132 8.0% 1,179.44South Whidbey 1,304.04 19,931,047 317,598 1.6% 243.55 1,713,544 8.6% 1,314.03County Total 8,406.59 124,114,798 2,818,776 2.3% 335.31 9,084,402 7.3% 1,080.63
Jefferson Co.Queets-Clearwater 24.85 877,357 72,544 8.3% 2,919.28 155,578 17.7% 6,260.70Brinnon 75.73 1,391,746 78,455 5.6% 1,035.98 98,807 7.1% 1,304.73Quilcene 651.32 8,359,034 141,034 1.7% 216.54 618,606 7.4% 949.77Chimacum 821.16 13,798,099 468,008 3.4% 569.94 1,383,865 10.0% 1,685.26Port Townsend 1,222.92 18,689,013 462,831 2.5% 378.46 1,453,592 7.8% 1,188.62County Total 2,795.98 43,115,249 1,222,871 2.8% 437.37 3,710,449 8.6% 1,327.07
139
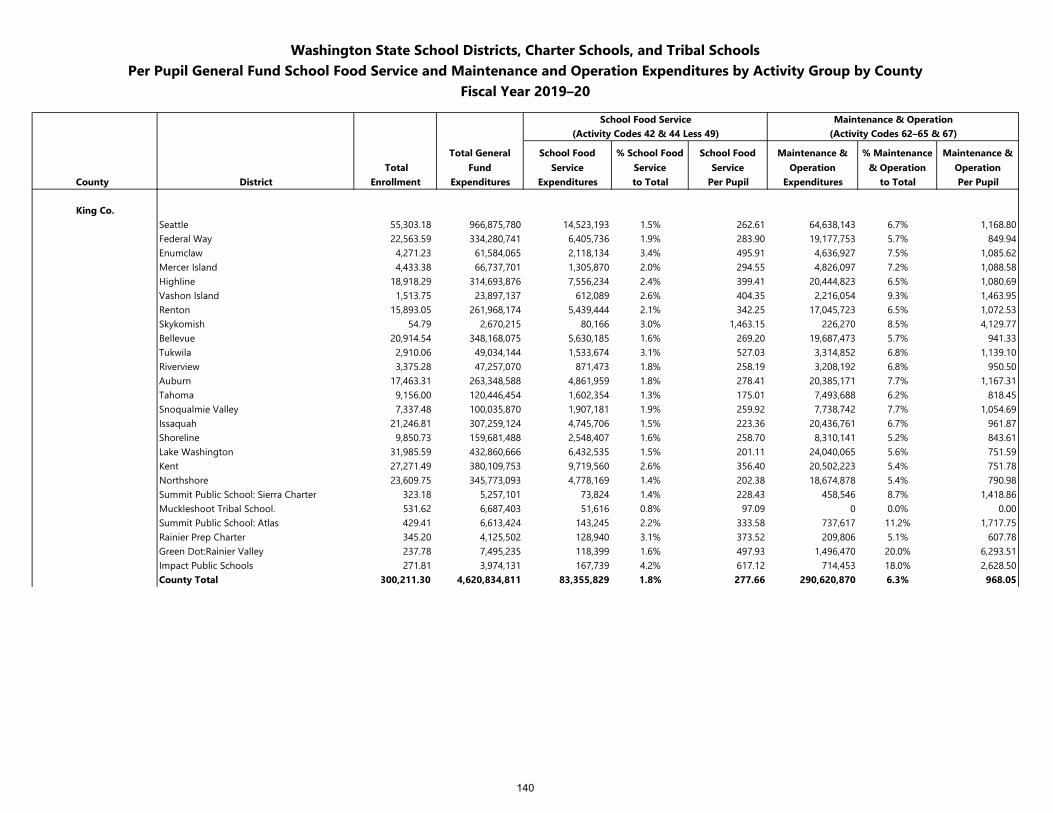
Washington State School Districts, Charter Schools, and Tribal SchoolsPer Pupil General Fund School Food Service and Maintenance and Operation Expenditures by Activity Group by County
Fiscal Year 2019–20
School Food Service Maintenance & Operation(Activity Codes 42 & 44 Less 49) (Activity Codes 62–65 & 67)
Total Total General
FundSchool Food
Service% School Food
ServiceSchool Food
ServiceMaintenance &
Operation% Maintenance
& OperationMaintenance &
OperationCounty District Enrollment Expenditures Expenditures to Total Per Pupil Expenditures to Total Per Pupil
King Co.Seattle 55,303.18 966,875,780 14,523,193 1.5% 262.61 64,638,143 6.7% 1,168.80Federal Way 22,563.59 334,280,741 6,405,736 1.9% 283.90 19,177,753 5.7% 849.94Enumclaw 4,271.23 61,584,065 2,118,134 3.4% 495.91 4,636,927 7.5% 1,085.62Mercer Island 4,433.38 66,737,701 1,305,870 2.0% 294.55 4,826,097 7.2% 1,088.58Highline 18,918.29 314,693,876 7,556,234 2.4% 399.41 20,444,823 6.5% 1,080.69Vashon Island 1,513.75 23,897,137 612,089 2.6% 404.35 2,216,054 9.3% 1,463.95Renton 15,893.05 261,968,174 5,439,444 2.1% 342.25 17,045,723 6.5% 1,072.53Skykomish 54.79 2,670,215 80,166 3.0% 1,463.15 226,270 8.5% 4,129.77Bellevue 20,914.54 348,168,075 5,630,185 1.6% 269.20 19,687,473 5.7% 941.33Tukwila 2,910.06 49,034,144 1,533,674 3.1% 527.03 3,314,852 6.8% 1,139.10Riverview 3,375.28 47,257,070 871,473 1.8% 258.19 3,208,192 6.8% 950.50Auburn 17,463.31 263,348,588 4,861,959 1.8% 278.41 20,385,171 7.7% 1,167.31Tahoma 9,156.00 120,446,454 1,602,354 1.3% 175.01 7,493,688 6.2% 818.45Snoqualmie Valley 7,337.48 100,035,870 1,907,181 1.9% 259.92 7,738,742 7.7% 1,054.69Issaquah 21,246.81 307,259,124 4,745,706 1.5% 223.36 20,436,761 6.7% 961.87Shoreline 9,850.73 159,681,488 2,548,407 1.6% 258.70 8,310,141 5.2% 843.61Lake Washington 31,985.59 432,860,666 6,432,535 1.5% 201.11 24,040,065 5.6% 751.59Kent 27,271.49 380,109,753 9,719,560 2.6% 356.40 20,502,223 5.4% 751.78Northshore 23,609.75 345,773,093 4,778,169 1.4% 202.38 18,674,878 5.4% 790.98Summit Public School: Sierra Charter 323.18 5,257,101 73,824 1.4% 228.43 458,546 8.7% 1,418.86Muckleshoot Tribal School. 531.62 6,687,403 51,616 0.8% 97.09 0 0.0% 0.00Summit Public School: Atlas 429.41 6,613,424 143,245 2.2% 333.58 737,617 11.2% 1,717.75Rainier Prep Charter 345.20 4,125,502 128,940 3.1% 373.52 209,806 5.1% 607.78Green Dot:Rainier Valley 237.78 7,495,235 118,399 1.6% 497.93 1,496,470 20.0% 6,293.51Impact Public Schools 271.81 3,974,131 167,739 4.2% 617.12 714,453 18.0% 2,628.50County Total 300,211.30 4,620,834,811 83,355,829 1.8% 277.66 290,620,870 6.3% 968.05
140
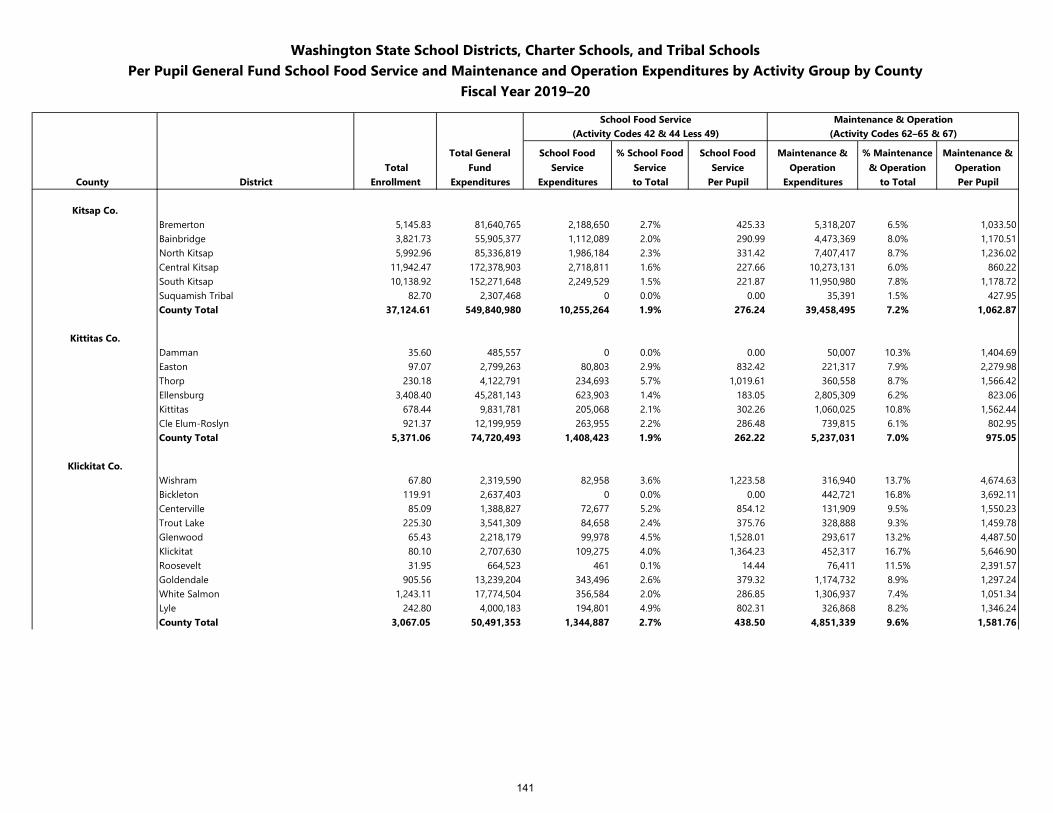
Washington State School Districts, Charter Schools, and Tribal SchoolsPer Pupil General Fund School Food Service and Maintenance and Operation Expenditures by Activity Group by County
Fiscal Year 2019–20
School Food Service Maintenance & Operation(Activity Codes 42 & 44 Less 49) (Activity Codes 62–65 & 67)
Total Total General
FundSchool Food
Service% School Food
ServiceSchool Food
ServiceMaintenance &
Operation% Maintenance
& OperationMaintenance &
OperationCounty District Enrollment Expenditures Expenditures to Total Per Pupil Expenditures to Total Per Pupil
Kitsap Co.Bremerton 5,145.83 81,640,765 2,188,650 2.7% 425.33 5,318,207 6.5% 1,033.50Bainbridge 3,821.73 55,905,377 1,112,089 2.0% 290.99 4,473,369 8.0% 1,170.51North Kitsap 5,992.96 85,336,819 1,986,184 2.3% 331.42 7,407,417 8.7% 1,236.02Central Kitsap 11,942.47 172,378,903 2,718,811 1.6% 227.66 10,273,131 6.0% 860.22South Kitsap 10,138.92 152,271,648 2,249,529 1.5% 221.87 11,950,980 7.8% 1,178.72Suquamish Tribal 82.70 2,307,468 0 0.0% 0.00 35,391 1.5% 427.95County Total 37,124.61 549,840,980 10,255,264 1.9% 276.24 39,458,495 7.2% 1,062.87
Kittitas Co.Damman 35.60 485,557 0 0.0% 0.00 50,007 10.3% 1,404.69Easton 97.07 2,799,263 80,803 2.9% 832.42 221,317 7.9% 2,279.98Thorp 230.18 4,122,791 234,693 5.7% 1,019.61 360,558 8.7% 1,566.42Ellensburg 3,408.40 45,281,143 623,903 1.4% 183.05 2,805,309 6.2% 823.06Kittitas 678.44 9,831,781 205,068 2.1% 302.26 1,060,025 10.8% 1,562.44Cle Elum-Roslyn 921.37 12,199,959 263,955 2.2% 286.48 739,815 6.1% 802.95County Total 5,371.06 74,720,493 1,408,423 1.9% 262.22 5,237,031 7.0% 975.05
Klickitat Co.Wishram 67.80 2,319,590 82,958 3.6% 1,223.58 316,940 13.7% 4,674.63Bickleton 119.91 2,637,403 0 0.0% 0.00 442,721 16.8% 3,692.11Centerville 85.09 1,388,827 72,677 5.2% 854.12 131,909 9.5% 1,550.23Trout Lake 225.30 3,541,309 84,658 2.4% 375.76 328,888 9.3% 1,459.78Glenwood 65.43 2,218,179 99,978 4.5% 1,528.01 293,617 13.2% 4,487.50Klickitat 80.10 2,707,630 109,275 4.0% 1,364.23 452,317 16.7% 5,646.90Roosevelt 31.95 664,523 461 0.1% 14.44 76,411 11.5% 2,391.57Goldendale 905.56 13,239,204 343,496 2.6% 379.32 1,174,732 8.9% 1,297.24White Salmon 1,243.11 17,774,504 356,584 2.0% 286.85 1,306,937 7.4% 1,051.34Lyle 242.80 4,000,183 194,801 4.9% 802.31 326,868 8.2% 1,346.24County Total 3,067.05 50,491,353 1,344,887 2.7% 438.50 4,851,339 9.6% 1,581.76
141
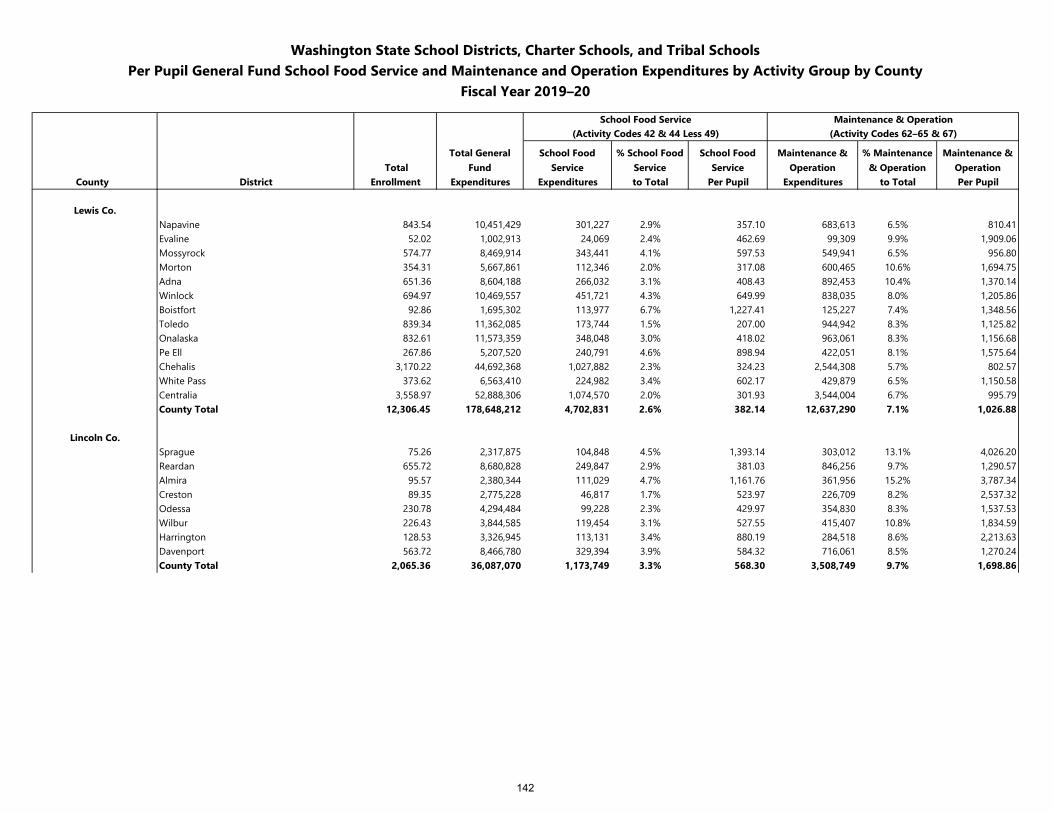
Washington State School Districts, Charter Schools, and Tribal SchoolsPer Pupil General Fund School Food Service and Maintenance and Operation Expenditures by Activity Group by County
Fiscal Year 2019–20
School Food Service Maintenance & Operation(Activity Codes 42 & 44 Less 49) (Activity Codes 62–65 & 67)
Total Total General
FundSchool Food
Service% School Food
ServiceSchool Food
ServiceMaintenance &
Operation% Maintenance
& OperationMaintenance &
OperationCounty District Enrollment Expenditures Expenditures to Total Per Pupil Expenditures to Total Per Pupil
Lewis Co.Napavine 843.54 10,451,429 301,227 2.9% 357.10 683,613 6.5% 810.41Evaline 52.02 1,002,913 24,069 2.4% 462.69 99,309 9.9% 1,909.06Mossyrock 574.77 8,469,914 343,441 4.1% 597.53 549,941 6.5% 956.80Morton 354.31 5,667,861 112,346 2.0% 317.08 600,465 10.6% 1,694.75Adna 651.36 8,604,188 266,032 3.1% 408.43 892,453 10.4% 1,370.14Winlock 694.97 10,469,557 451,721 4.3% 649.99 838,035 8.0% 1,205.86Boistfort 92.86 1,695,302 113,977 6.7% 1,227.41 125,227 7.4% 1,348.56Toledo 839.34 11,362,085 173,744 1.5% 207.00 944,942 8.3% 1,125.82Onalaska 832.61 11,573,359 348,048 3.0% 418.02 963,061 8.3% 1,156.68Pe Ell 267.86 5,207,520 240,791 4.6% 898.94 422,051 8.1% 1,575.64Chehalis 3,170.22 44,692,368 1,027,882 2.3% 324.23 2,544,308 5.7% 802.57White Pass 373.62 6,563,410 224,982 3.4% 602.17 429,879 6.5% 1,150.58Centralia 3,558.97 52,888,306 1,074,570 2.0% 301.93 3,544,004 6.7% 995.79County Total 12,306.45 178,648,212 4,702,831 2.6% 382.14 12,637,290 7.1% 1,026.88
Lincoln Co.Sprague 75.26 2,317,875 104,848 4.5% 1,393.14 303,012 13.1% 4,026.20Reardan 655.72 8,680,828 249,847 2.9% 381.03 846,256 9.7% 1,290.57Almira 95.57 2,380,344 111,029 4.7% 1,161.76 361,956 15.2% 3,787.34Creston 89.35 2,775,228 46,817 1.7% 523.97 226,709 8.2% 2,537.32Odessa 230.78 4,294,484 99,228 2.3% 429.97 354,830 8.3% 1,537.53Wilbur 226.43 3,844,585 119,454 3.1% 527.55 415,407 10.8% 1,834.59Harrington 128.53 3,326,945 113,131 3.4% 880.19 284,518 8.6% 2,213.63Davenport 563.72 8,466,780 329,394 3.9% 584.32 716,061 8.5% 1,270.24County Total 2,065.36 36,087,070 1,173,749 3.3% 568.30 3,508,749 9.7% 1,698.86
142
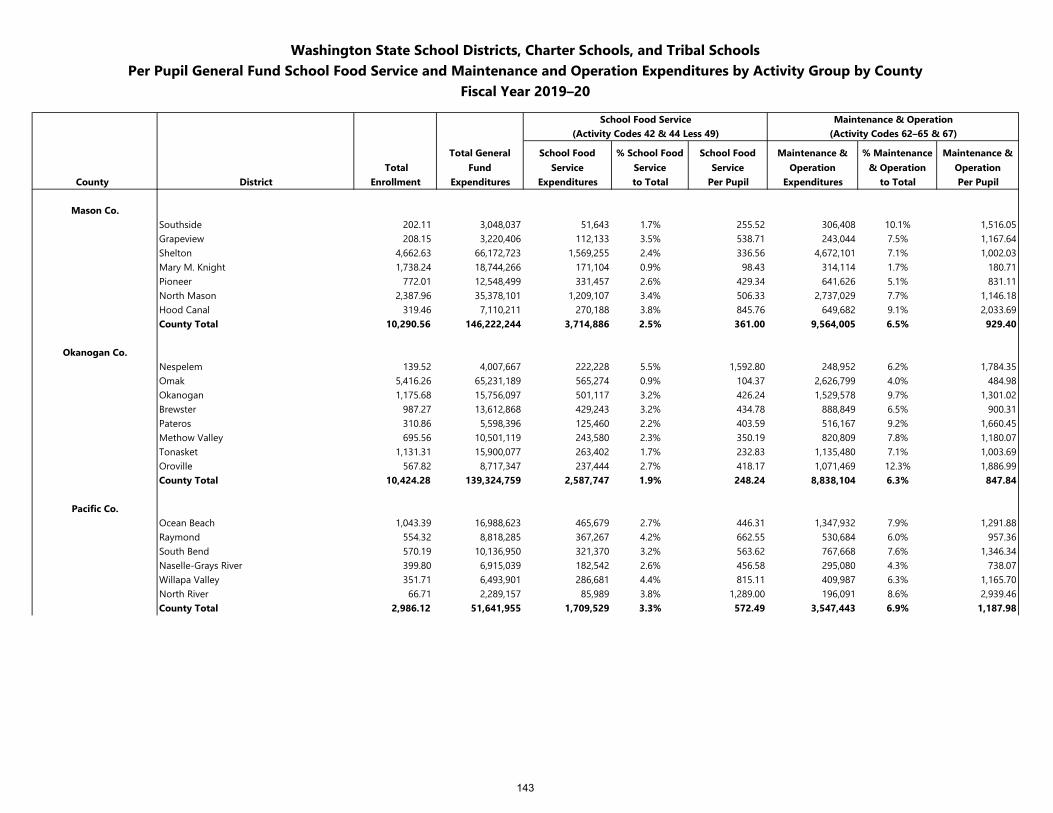
Washington State School Districts, Charter Schools, and Tribal SchoolsPer Pupil General Fund School Food Service and Maintenance and Operation Expenditures by Activity Group by County
Fiscal Year 2019–20
School Food Service Maintenance & Operation(Activity Codes 42 & 44 Less 49) (Activity Codes 62–65 & 67)
Total Total General
FundSchool Food
Service% School Food
ServiceSchool Food
ServiceMaintenance &
Operation% Maintenance
& OperationMaintenance &
OperationCounty District Enrollment Expenditures Expenditures to Total Per Pupil Expenditures to Total Per Pupil
Mason Co.Southside 202.11 3,048,037 51,643 1.7% 255.52 306,408 10.1% 1,516.05Grapeview 208.15 3,220,406 112,133 3.5% 538.71 243,044 7.5% 1,167.64Shelton 4,662.63 66,172,723 1,569,255 2.4% 336.56 4,672,101 7.1% 1,002.03Mary M. Knight 1,738.24 18,744,266 171,104 0.9% 98.43 314,114 1.7% 180.71Pioneer 772.01 12,548,499 331,457 2.6% 429.34 641,626 5.1% 831.11North Mason 2,387.96 35,378,101 1,209,107 3.4% 506.33 2,737,029 7.7% 1,146.18Hood Canal 319.46 7,110,211 270,188 3.8% 845.76 649,682 9.1% 2,033.69County Total 10,290.56 146,222,244 3,714,886 2.5% 361.00 9,564,005 6.5% 929.40
Okanogan Co.Nespelem 139.52 4,007,667 222,228 5.5% 1,592.80 248,952 6.2% 1,784.35Omak 5,416.26 65,231,189 565,274 0.9% 104.37 2,626,799 4.0% 484.98Okanogan 1,175.68 15,756,097 501,117 3.2% 426.24 1,529,578 9.7% 1,301.02Brewster 987.27 13,612,868 429,243 3.2% 434.78 888,849 6.5% 900.31Pateros 310.86 5,598,396 125,460 2.2% 403.59 516,167 9.2% 1,660.45Methow Valley 695.56 10,501,119 243,580 2.3% 350.19 820,809 7.8% 1,180.07Tonasket 1,131.31 15,900,077 263,402 1.7% 232.83 1,135,480 7.1% 1,003.69Oroville 567.82 8,717,347 237,444 2.7% 418.17 1,071,469 12.3% 1,886.99County Total 10,424.28 139,324,759 2,587,747 1.9% 248.24 8,838,104 6.3% 847.84
Pacific Co.Ocean Beach 1,043.39 16,988,623 465,679 2.7% 446.31 1,347,932 7.9% 1,291.88Raymond 554.32 8,818,285 367,267 4.2% 662.55 530,684 6.0% 957.36South Bend 570.19 10,136,950 321,370 3.2% 563.62 767,668 7.6% 1,346.34Naselle-Grays River 399.80 6,915,039 182,542 2.6% 456.58 295,080 4.3% 738.07Willapa Valley 351.71 6,493,901 286,681 4.4% 815.11 409,987 6.3% 1,165.70North River 66.71 2,289,157 85,989 3.8% 1,289.00 196,091 8.6% 2,939.46County Total 2,986.12 51,641,955 1,709,529 3.3% 572.49 3,547,443 6.9% 1,187.98
143
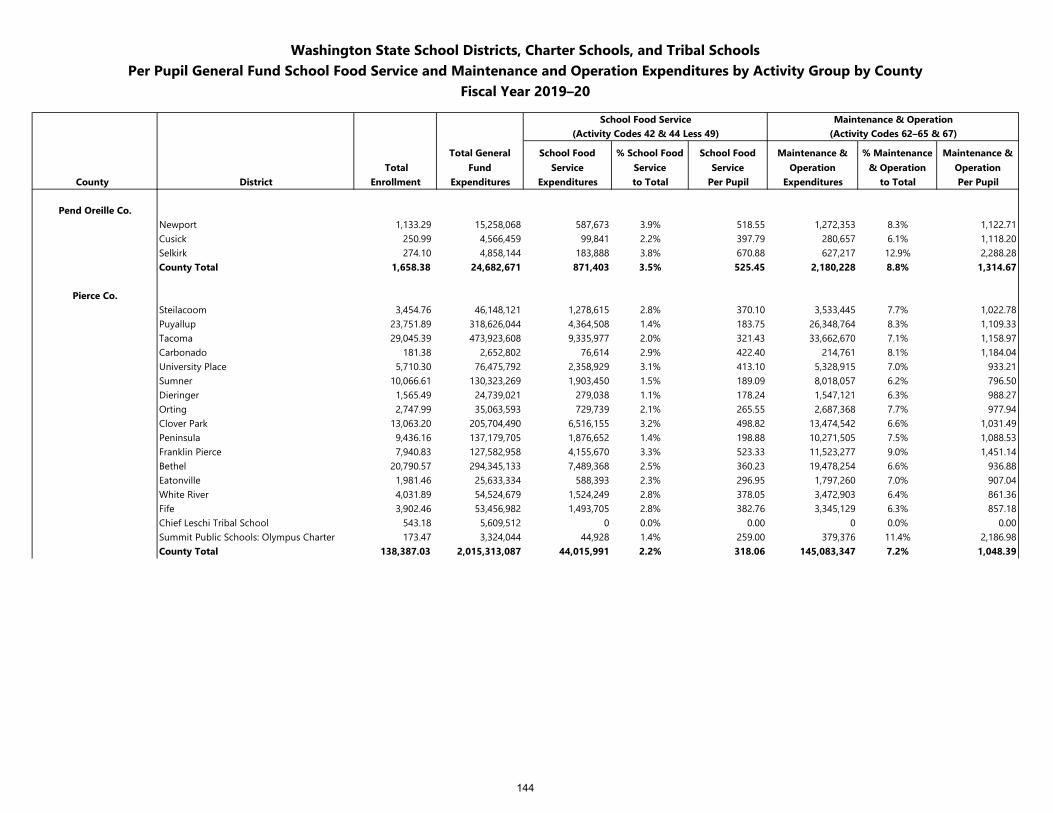
Washington State School Districts, Charter Schools, and Tribal SchoolsPer Pupil General Fund School Food Service and Maintenance and Operation Expenditures by Activity Group by County
Fiscal Year 2019–20
School Food Service Maintenance & Operation(Activity Codes 42 & 44 Less 49) (Activity Codes 62–65 & 67)
Total Total General
FundSchool Food
Service% School Food
ServiceSchool Food
ServiceMaintenance &
Operation% Maintenance
& OperationMaintenance &
OperationCounty District Enrollment Expenditures Expenditures to Total Per Pupil Expenditures to Total Per Pupil
Pend Oreille Co.Newport 1,133.29 15,258,068 587,673 3.9% 518.55 1,272,353 8.3% 1,122.71Cusick 250.99 4,566,459 99,841 2.2% 397.79 280,657 6.1% 1,118.20Selkirk 274.10 4,858,144 183,888 3.8% 670.88 627,217 12.9% 2,288.28County Total 1,658.38 24,682,671 871,403 3.5% 525.45 2,180,228 8.8% 1,314.67
Pierce Co.Steilacoom 3,454.76 46,148,121 1,278,615 2.8% 370.10 3,533,445 7.7% 1,022.78Puyallup 23,751.89 318,626,044 4,364,508 1.4% 183.75 26,348,764 8.3% 1,109.33Tacoma 29,045.39 473,923,608 9,335,977 2.0% 321.43 33,662,670 7.1% 1,158.97Carbonado 181.38 2,652,802 76,614 2.9% 422.40 214,761 8.1% 1,184.04University Place 5,710.30 76,475,792 2,358,929 3.1% 413.10 5,328,915 7.0% 933.21Sumner 10,066.61 130,323,269 1,903,450 1.5% 189.09 8,018,057 6.2% 796.50Dieringer 1,565.49 24,739,021 279,038 1.1% 178.24 1,547,121 6.3% 988.27Orting 2,747.99 35,063,593 729,739 2.1% 265.55 2,687,368 7.7% 977.94Clover Park 13,063.20 205,704,490 6,516,155 3.2% 498.82 13,474,542 6.6% 1,031.49Peninsula 9,436.16 137,179,705 1,876,652 1.4% 198.88 10,271,505 7.5% 1,088.53Franklin Pierce 7,940.83 127,582,958 4,155,670 3.3% 523.33 11,523,277 9.0% 1,451.14Bethel 20,790.57 294,345,133 7,489,368 2.5% 360.23 19,478,254 6.6% 936.88Eatonville 1,981.46 25,633,334 588,393 2.3% 296.95 1,797,260 7.0% 907.04White River 4,031.89 54,524,679 1,524,249 2.8% 378.05 3,472,903 6.4% 861.36Fife 3,902.46 53,456,982 1,493,705 2.8% 382.76 3,345,129 6.3% 857.18Chief Leschi Tribal School 543.18 5,609,512 0 0.0% 0.00 0 0.0% 0.00Summit Public Schools: Olympus Charter 173.47 3,324,044 44,928 1.4% 259.00 379,376 11.4% 2,186.98County Total 138,387.03 2,015,313,087 44,015,991 2.2% 318.06 145,083,347 7.2% 1,048.39
144
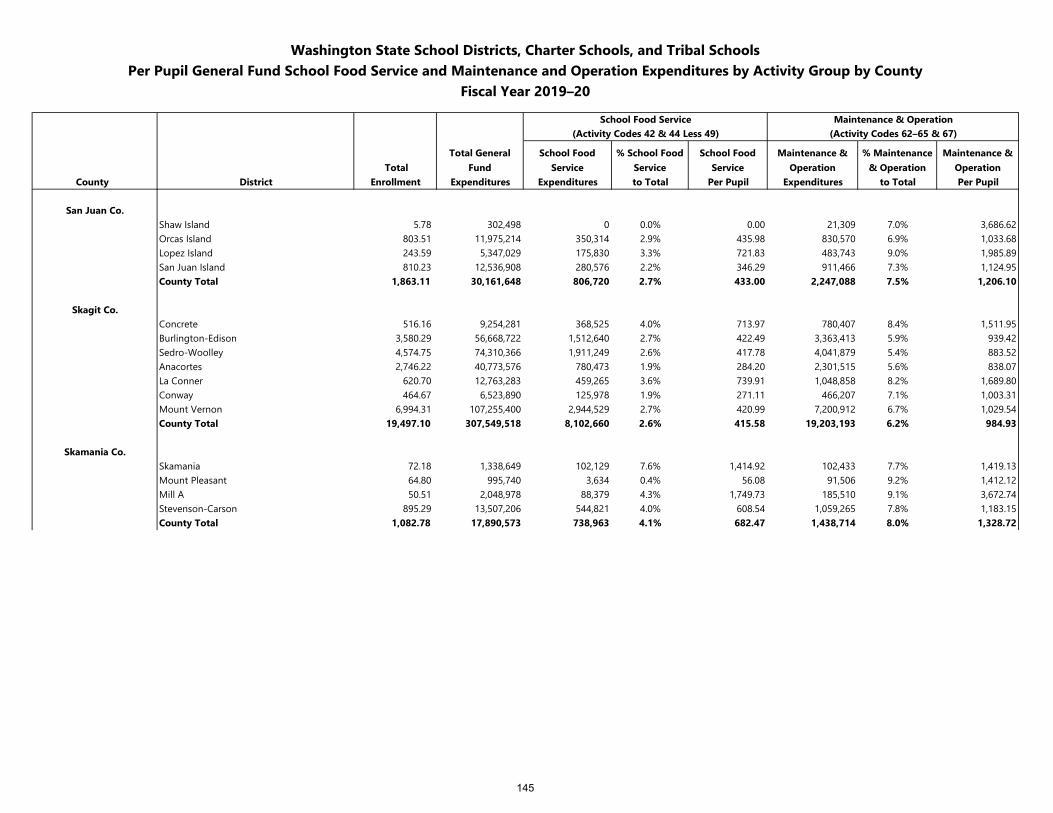
Washington State School Districts, Charter Schools, and Tribal SchoolsPer Pupil General Fund School Food Service and Maintenance and Operation Expenditures by Activity Group by County
Fiscal Year 2019–20
School Food Service Maintenance & Operation(Activity Codes 42 & 44 Less 49) (Activity Codes 62–65 & 67)
Total Total General
FundSchool Food
Service% School Food
ServiceSchool Food
ServiceMaintenance &
Operation% Maintenance
& OperationMaintenance &
OperationCounty District Enrollment Expenditures Expenditures to Total Per Pupil Expenditures to Total Per Pupil
San Juan Co.Shaw Island 5.78 302,498 0 0.0% 0.00 21,309 7.0% 3,686.62Orcas Island 803.51 11,975,214 350,314 2.9% 435.98 830,570 6.9% 1,033.68Lopez Island 243.59 5,347,029 175,830 3.3% 721.83 483,743 9.0% 1,985.89San Juan Island 810.23 12,536,908 280,576 2.2% 346.29 911,466 7.3% 1,124.95County Total 1,863.11 30,161,648 806,720 2.7% 433.00 2,247,088 7.5% 1,206.10
Skagit Co.Concrete 516.16 9,254,281 368,525 4.0% 713.97 780,407 8.4% 1,511.95Burlington-Edison 3,580.29 56,668,722 1,512,640 2.7% 422.49 3,363,413 5.9% 939.42Sedro-Woolley 4,574.75 74,310,366 1,911,249 2.6% 417.78 4,041,879 5.4% 883.52Anacortes 2,746.22 40,773,576 780,473 1.9% 284.20 2,301,515 5.6% 838.07La Conner 620.70 12,763,283 459,265 3.6% 739.91 1,048,858 8.2% 1,689.80Conway 464.67 6,523,890 125,978 1.9% 271.11 466,207 7.1% 1,003.31Mount Vernon 6,994.31 107,255,400 2,944,529 2.7% 420.99 7,200,912 6.7% 1,029.54County Total 19,497.10 307,549,518 8,102,660 2.6% 415.58 19,203,193 6.2% 984.93
Skamania Co.Skamania 72.18 1,338,649 102,129 7.6% 1,414.92 102,433 7.7% 1,419.13Mount Pleasant 64.80 995,740 3,634 0.4% 56.08 91,506 9.2% 1,412.12Mill A 50.51 2,048,978 88,379 4.3% 1,749.73 185,510 9.1% 3,672.74Stevenson-Carson 895.29 13,507,206 544,821 4.0% 608.54 1,059,265 7.8% 1,183.15County Total 1,082.78 17,890,573 738,963 4.1% 682.47 1,438,714 8.0% 1,328.72
145
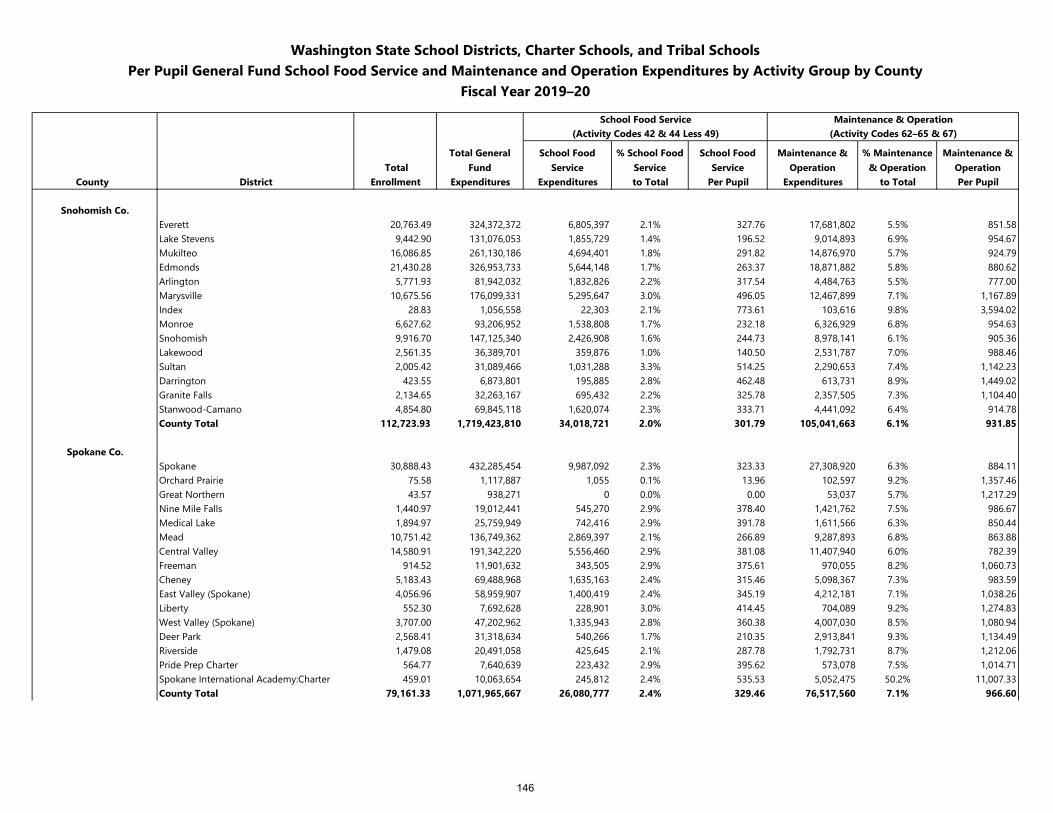
Washington State School Districts, Charter Schools, and Tribal SchoolsPer Pupil General Fund School Food Service and Maintenance and Operation Expenditures by Activity Group by County
Fiscal Year 2019–20
School Food Service Maintenance & Operation(Activity Codes 42 & 44 Less 49) (Activity Codes 62–65 & 67)
Total Total General
FundSchool Food
Service% School Food
ServiceSchool Food
ServiceMaintenance &
Operation% Maintenance
& OperationMaintenance &
OperationCounty District Enrollment Expenditures Expenditures to Total Per Pupil Expenditures to Total Per Pupil
Snohomish Co.Everett 20,763.49 324,372,372 6,805,397 2.1% 327.76 17,681,802 5.5% 851.58Lake Stevens 9,442.90 131,076,053 1,855,729 1.4% 196.52 9,014,893 6.9% 954.67Mukilteo 16,086.85 261,130,186 4,694,401 1.8% 291.82 14,876,970 5.7% 924.79Edmonds 21,430.28 326,953,733 5,644,148 1.7% 263.37 18,871,882 5.8% 880.62Arlington 5,771.93 81,942,032 1,832,826 2.2% 317.54 4,484,763 5.5% 777.00Marysville 10,675.56 176,099,331 5,295,647 3.0% 496.05 12,467,899 7.1% 1,167.89Index 28.83 1,056,558 22,303 2.1% 773.61 103,616 9.8% 3,594.02Monroe 6,627.62 93,206,952 1,538,808 1.7% 232.18 6,326,929 6.8% 954.63Snohomish 9,916.70 147,125,340 2,426,908 1.6% 244.73 8,978,141 6.1% 905.36Lakewood 2,561.35 36,389,701 359,876 1.0% 140.50 2,531,787 7.0% 988.46Sultan 2,005.42 31,089,466 1,031,288 3.3% 514.25 2,290,653 7.4% 1,142.23Darrington 423.55 6,873,801 195,885 2.8% 462.48 613,731 8.9% 1,449.02Granite Falls 2,134.65 32,263,167 695,432 2.2% 325.78 2,357,505 7.3% 1,104.40Stanwood-Camano 4,854.80 69,845,118 1,620,074 2.3% 333.71 4,441,092 6.4% 914.78County Total 112,723.93 1,719,423,810 34,018,721 2.0% 301.79 105,041,663 6.1% 931.85
Spokane Co.Spokane 30,888.43 432,285,454 9,987,092 2.3% 323.33 27,308,920 6.3% 884.11Orchard Prairie 75.58 1,117,887 1,055 0.1% 13.96 102,597 9.2% 1,357.46Great Northern 43.57 938,271 0 0.0% 0.00 53,037 5.7% 1,217.29Nine Mile Falls 1,440.97 19,012,441 545,270 2.9% 378.40 1,421,762 7.5% 986.67Medical Lake 1,894.97 25,759,949 742,416 2.9% 391.78 1,611,566 6.3% 850.44Mead 10,751.42 136,749,362 2,869,397 2.1% 266.89 9,287,893 6.8% 863.88Central Valley 14,580.91 191,342,220 5,556,460 2.9% 381.08 11,407,940 6.0% 782.39Freeman 914.52 11,901,632 343,505 2.9% 375.61 970,055 8.2% 1,060.73Cheney 5,183.43 69,488,968 1,635,163 2.4% 315.46 5,098,367 7.3% 983.59East Valley (Spokane) 4,056.96 58,959,907 1,400,419 2.4% 345.19 4,212,181 7.1% 1,038.26Liberty 552.30 7,692,628 228,901 3.0% 414.45 704,089 9.2% 1,274.83West Valley (Spokane) 3,707.00 47,202,962 1,335,943 2.8% 360.38 4,007,030 8.5% 1,080.94Deer Park 2,568.41 31,318,634 540,266 1.7% 210.35 2,913,841 9.3% 1,134.49Riverside 1,479.08 20,491,058 425,645 2.1% 287.78 1,792,731 8.7% 1,212.06Pride Prep Charter 564.77 7,640,639 223,432 2.9% 395.62 573,078 7.5% 1,014.71Spokane International Academy:Charter 459.01 10,063,654 245,812 2.4% 535.53 5,052,475 50.2% 11,007.33County Total 79,161.33 1,071,965,667 26,080,777 2.4% 329.46 76,517,560 7.1% 966.60
146
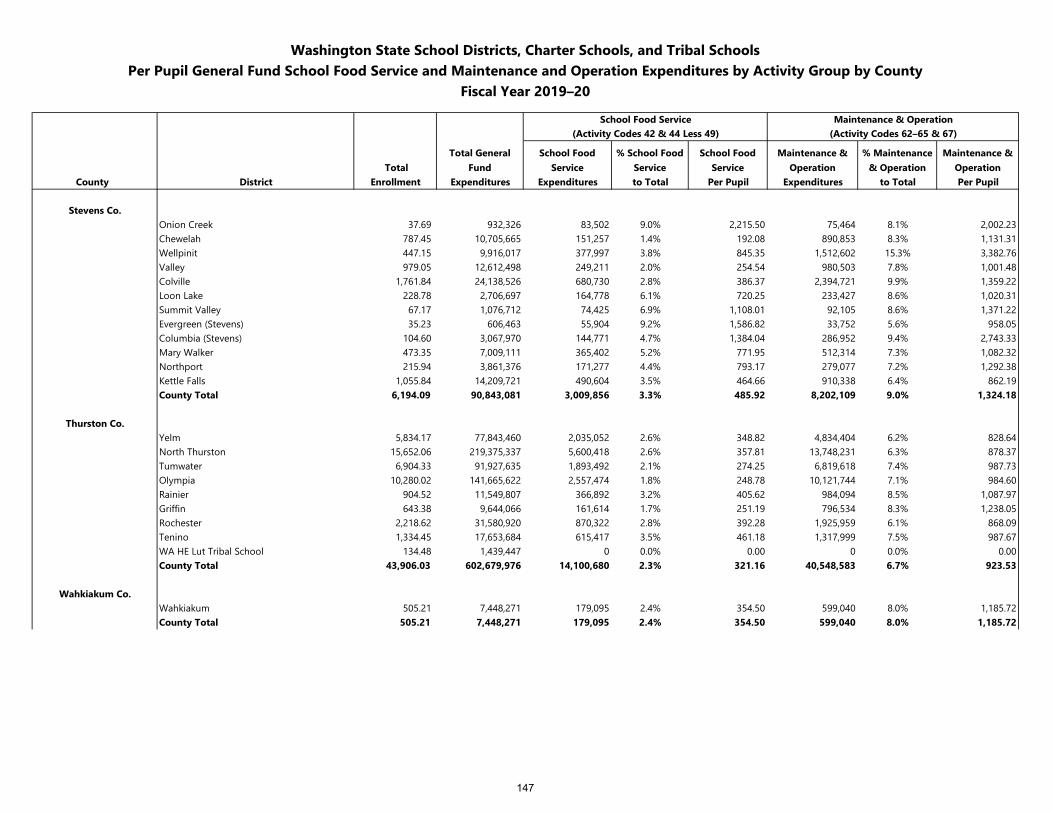
Washington State School Districts, Charter Schools, and Tribal SchoolsPer Pupil General Fund School Food Service and Maintenance and Operation Expenditures by Activity Group by County
Fiscal Year 2019–20
School Food Service Maintenance & Operation(Activity Codes 42 & 44 Less 49) (Activity Codes 62–65 & 67)
Total Total General
FundSchool Food
Service% School Food
ServiceSchool Food
ServiceMaintenance &
Operation% Maintenance
& OperationMaintenance &
OperationCounty District Enrollment Expenditures Expenditures to Total Per Pupil Expenditures to Total Per Pupil
Stevens Co.Onion Creek 37.69 932,326 83,502 9.0% 2,215.50 75,464 8.1% 2,002.23Chewelah 787.45 10,705,665 151,257 1.4% 192.08 890,853 8.3% 1,131.31Wellpinit 447.15 9,916,017 377,997 3.8% 845.35 1,512,602 15.3% 3,382.76Valley 979.05 12,612,498 249,211 2.0% 254.54 980,503 7.8% 1,001.48Colville 1,761.84 24,138,526 680,730 2.8% 386.37 2,394,721 9.9% 1,359.22Loon Lake 228.78 2,706,697 164,778 6.1% 720.25 233,427 8.6% 1,020.31Summit Valley 67.17 1,076,712 74,425 6.9% 1,108.01 92,105 8.6% 1,371.22Evergreen (Stevens) 35.23 606,463 55,904 9.2% 1,586.82 33,752 5.6% 958.05Columbia (Stevens) 104.60 3,067,970 144,771 4.7% 1,384.04 286,952 9.4% 2,743.33Mary Walker 473.35 7,009,111 365,402 5.2% 771.95 512,314 7.3% 1,082.32Northport 215.94 3,861,376 171,277 4.4% 793.17 279,077 7.2% 1,292.38Kettle Falls 1,055.84 14,209,721 490,604 3.5% 464.66 910,338 6.4% 862.19County Total 6,194.09 90,843,081 3,009,856 3.3% 485.92 8,202,109 9.0% 1,324.18
Thurston Co.Yelm 5,834.17 77,843,460 2,035,052 2.6% 348.82 4,834,404 6.2% 828.64North Thurston 15,652.06 219,375,337 5,600,418 2.6% 357.81 13,748,231 6.3% 878.37Tumwater 6,904.33 91,927,635 1,893,492 2.1% 274.25 6,819,618 7.4% 987.73Olympia 10,280.02 141,665,622 2,557,474 1.8% 248.78 10,121,744 7.1% 984.60Rainier 904.52 11,549,807 366,892 3.2% 405.62 984,094 8.5% 1,087.97Griffin 643.38 9,644,066 161,614 1.7% 251.19 796,534 8.3% 1,238.05Rochester 2,218.62 31,580,920 870,322 2.8% 392.28 1,925,959 6.1% 868.09Tenino 1,334.45 17,653,684 615,417 3.5% 461.18 1,317,999 7.5% 987.67WA HE Lut Tribal School 134.48 1,439,447 0 0.0% 0.00 0 0.0% 0.00County Total 43,906.03 602,679,976 14,100,680 2.3% 321.16 40,548,583 6.7% 923.53
Wahkiakum Co.Wahkiakum 505.21 7,448,271 179,095 2.4% 354.50 599,040 8.0% 1,185.72County Total 505.21 7,448,271 179,095 2.4% 354.50 599,040 8.0% 1,185.72
147
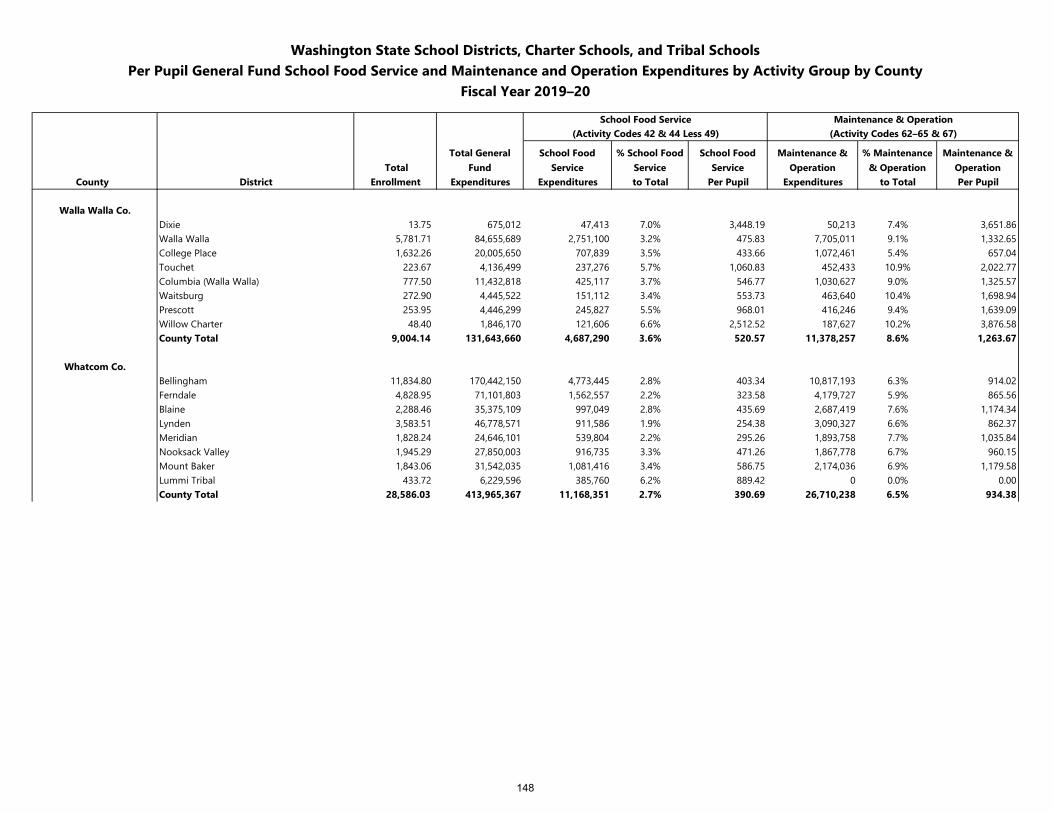
Washington State School Districts, Charter Schools, and Tribal SchoolsPer Pupil General Fund School Food Service and Maintenance and Operation Expenditures by Activity Group by County
Fiscal Year 2019–20
School Food Service Maintenance & Operation(Activity Codes 42 & 44 Less 49) (Activity Codes 62–65 & 67)
Total Total General
FundSchool Food
Service% School Food
ServiceSchool Food
ServiceMaintenance &
Operation% Maintenance
& OperationMaintenance &
OperationCounty District Enrollment Expenditures Expenditures to Total Per Pupil Expenditures to Total Per Pupil
Walla Walla Co.Dixie 13.75 675,012 47,413 7.0% 3,448.19 50,213 7.4% 3,651.86Walla Walla 5,781.71 84,655,689 2,751,100 3.2% 475.83 7,705,011 9.1% 1,332.65College Place 1,632.26 20,005,650 707,839 3.5% 433.66 1,072,461 5.4% 657.04Touchet 223.67 4,136,499 237,276 5.7% 1,060.83 452,433 10.9% 2,022.77Columbia (Walla Walla) 777.50 11,432,818 425,117 3.7% 546.77 1,030,627 9.0% 1,325.57Waitsburg 272.90 4,445,522 151,112 3.4% 553.73 463,640 10.4% 1,698.94Prescott 253.95 4,446,299 245,827 5.5% 968.01 416,246 9.4% 1,639.09Willow Charter 48.40 1,846,170 121,606 6.6% 2,512.52 187,627 10.2% 3,876.58County Total 9,004.14 131,643,660 4,687,290 3.6% 520.57 11,378,257 8.6% 1,263.67
Whatcom Co.Bellingham 11,834.80 170,442,150 4,773,445 2.8% 403.34 10,817,193 6.3% 914.02Ferndale 4,828.95 71,101,803 1,562,557 2.2% 323.58 4,179,727 5.9% 865.56Blaine 2,288.46 35,375,109 997,049 2.8% 435.69 2,687,419 7.6% 1,174.34Lynden 3,583.51 46,778,571 911,586 1.9% 254.38 3,090,327 6.6% 862.37Meridian 1,828.24 24,646,101 539,804 2.2% 295.26 1,893,758 7.7% 1,035.84Nooksack Valley 1,945.29 27,850,003 916,735 3.3% 471.26 1,867,778 6.7% 960.15Mount Baker 1,843.06 31,542,035 1,081,416 3.4% 586.75 2,174,036 6.9% 1,179.58Lummi Tribal 433.72 6,229,596 385,760 6.2% 889.42 0 0.0% 0.00County Total 28,586.03 413,965,367 11,168,351 2.7% 390.69 26,710,238 6.5% 934.38
148
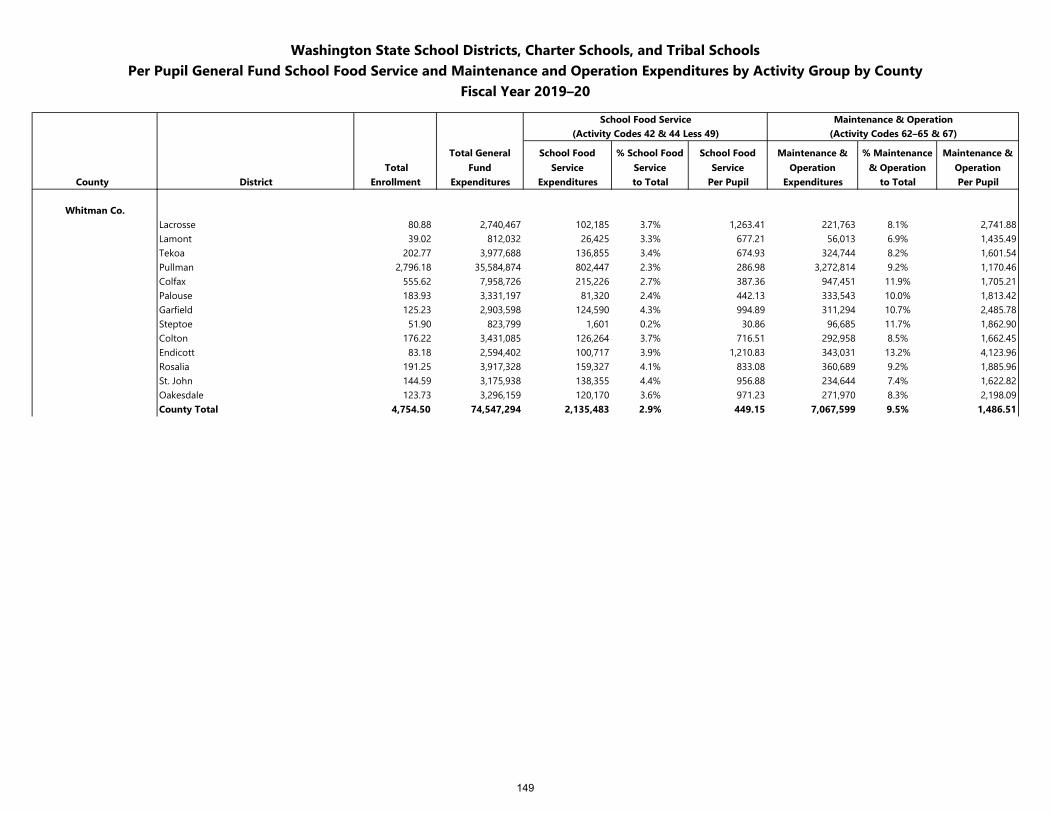
Washington State School Districts, Charter Schools, and Tribal SchoolsPer Pupil General Fund School Food Service and Maintenance and Operation Expenditures by Activity Group by County
Fiscal Year 2019–20
School Food Service Maintenance & Operation(Activity Codes 42 & 44 Less 49) (Activity Codes 62–65 & 67)
Total Total General
FundSchool Food
Service% School Food
ServiceSchool Food
ServiceMaintenance &
Operation% Maintenance
& OperationMaintenance &
OperationCounty District Enrollment Expenditures Expenditures to Total Per Pupil Expenditures to Total Per Pupil
Whitman Co.Lacrosse 80.88 2,740,467 102,185 3.7% 1,263.41 221,763 8.1% 2,741.88Lamont 39.02 812,032 26,425 3.3% 677.21 56,013 6.9% 1,435.49Tekoa 202.77 3,977,688 136,855 3.4% 674.93 324,744 8.2% 1,601.54Pullman 2,796.18 35,584,874 802,447 2.3% 286.98 3,272,814 9.2% 1,170.46Colfax 555.62 7,958,726 215,226 2.7% 387.36 947,451 11.9% 1,705.21Palouse 183.93 3,331,197 81,320 2.4% 442.13 333,543 10.0% 1,813.42Garfield 125.23 2,903,598 124,590 4.3% 994.89 311,294 10.7% 2,485.78Steptoe 51.90 823,799 1,601 0.2% 30.86 96,685 11.7% 1,862.90Colton 176.22 3,431,085 126,264 3.7% 716.51 292,958 8.5% 1,662.45Endicott 83.18 2,594,402 100,717 3.9% 1,210.83 343,031 13.2% 4,123.96Rosalia 191.25 3,917,328 159,327 4.1% 833.08 360,689 9.2% 1,885.96St. John 144.59 3,175,938 138,355 4.4% 956.88 234,644 7.4% 1,622.82Oakesdale 123.73 3,296,159 120,170 3.6% 971.23 271,970 8.3% 2,198.09County Total 4,754.50 74,547,294 2,135,483 2.9% 449.15 7,067,599 9.5% 1,486.51
149
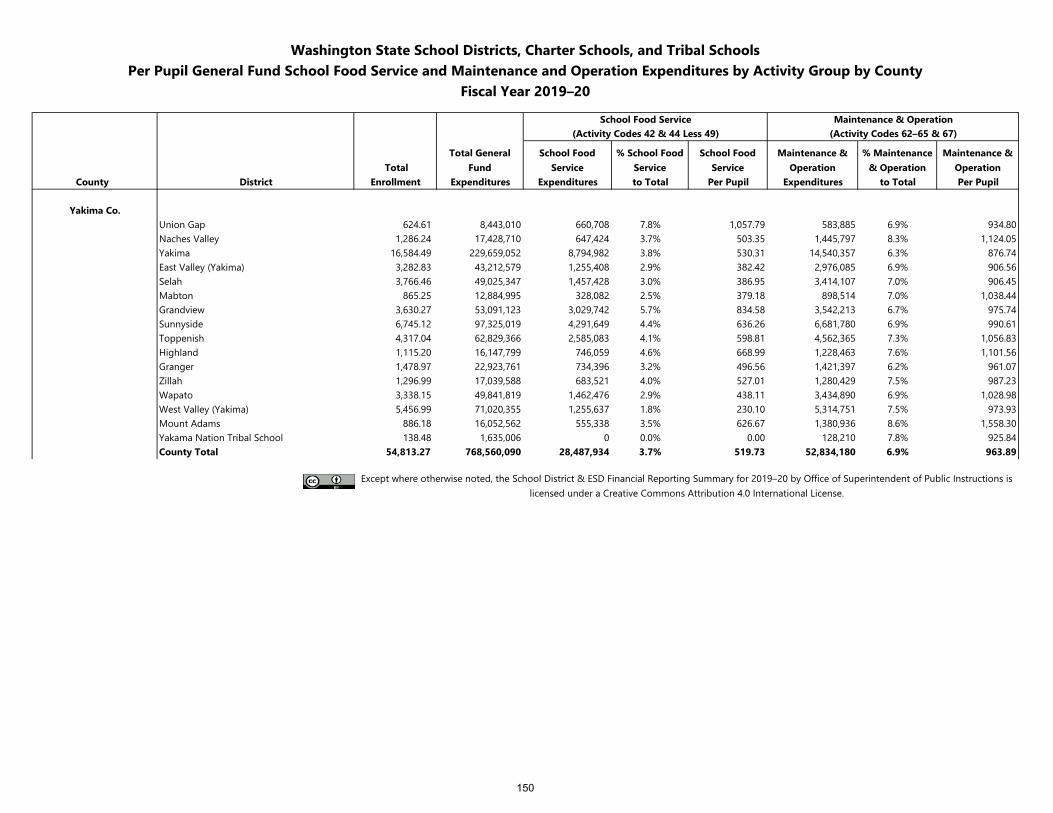
Washington State School Districts, Charter Schools, and Tribal SchoolsPer Pupil General Fund School Food Service and Maintenance and Operation Expenditures by Activity Group by County
Fiscal Year 2019–20
School Food Service Maintenance & Operation(Activity Codes 42 & 44 Less 49) (Activity Codes 62–65 & 67)
Total Total General
FundSchool Food
Service% School Food
ServiceSchool Food
ServiceMaintenance &
Operation% Maintenance
& OperationMaintenance &
OperationCounty District Enrollment Expenditures Expenditures to Total Per Pupil Expenditures to Total Per Pupil
Yakima Co.Union Gap 624.61 8,443,010 660,708 7.8% 1,057.79 583,885 6.9% 934.80Naches Valley 1,286.24 17,428,710 647,424 3.7% 503.35 1,445,797 8.3% 1,124.05Yakima 16,584.49 229,659,052 8,794,982 3.8% 530.31 14,540,357 6.3% 876.74East Valley (Yakima) 3,282.83 43,212,579 1,255,408 2.9% 382.42 2,976,085 6.9% 906.56Selah 3,766.46 49,025,347 1,457,428 3.0% 386.95 3,414,107 7.0% 906.45Mabton 865.25 12,884,995 328,082 2.5% 379.18 898,514 7.0% 1,038.44Grandview 3,630.27 53,091,123 3,029,742 5.7% 834.58 3,542,213 6.7% 975.74Sunnyside 6,745.12 97,325,019 4,291,649 4.4% 636.26 6,681,780 6.9% 990.61Toppenish 4,317.04 62,829,366 2,585,083 4.1% 598.81 4,562,365 7.3% 1,056.83Highland 1,115.20 16,147,799 746,059 4.6% 668.99 1,228,463 7.6% 1,101.56Granger 1,478.97 22,923,761 734,396 3.2% 496.56 1,421,397 6.2% 961.07Zillah 1,296.99 17,039,588 683,521 4.0% 527.01 1,280,429 7.5% 987.23Wapato 3,338.15 49,841,819 1,462,476 2.9% 438.11 3,434,890 6.9% 1,028.98West Valley (Yakima) 5,456.99 71,020,355 1,255,637 1.8% 230.10 5,314,751 7.5% 973.93Mount Adams 886.18 16,052,562 555,338 3.5% 626.67 1,380,936 8.6% 1,558.30Yakama Nation Tribal School 138.48 1,635,006 0 0.0% 0.00 128,210 7.8% 925.84County Total 54,813.27 768,560,090 28,487,934 3.7% 519.73 52,834,180 6.9% 963.89
Except where otherwise noted, the School District & ESD Financial Reporting Summary for 2019–20 by Office of Superintendent of Public Instructions is licensed under a Creative Commons Attribution 4.0 International License.
150
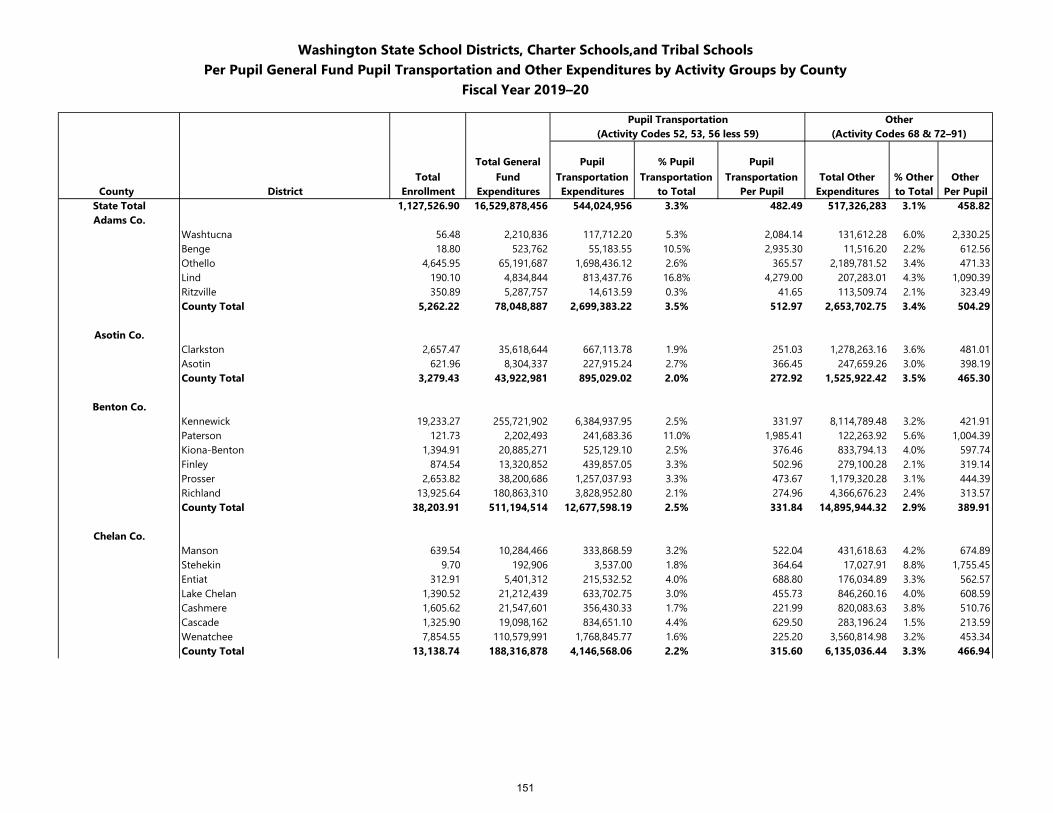
Washington State School Districts, Charter Schools,and Tribal SchoolsPer Pupil General Fund Pupil Transportation and Other Expenditures by Activity Groups by County
Fiscal Year 2019–20
Pupil Transportation Other(Activity Codes 52, 53, 56 less 59) (Activity Codes 68 & 72–91)
TotalTotal General
FundPupil
Transportation% Pupil
TransportationPupil
Transportation Total Other % Other OtherCounty District Enrollment Expenditures Expenditures to Total Per Pupil Expenditures to Total Per Pupil
State Total 1,127,526.90 16,529,878,456 544,024,956 3.3% 482.49 517,326,283 3.1% 458.82Adams Co.
Washtucna 56.48 2,210,836 117,712.20 5.3% 2,084.14 131,612.28 6.0% 2,330.25Benge 18.80 523,762 55,183.55 10.5% 2,935.30 11,516.20 2.2% 612.56Othello 4,645.95 65,191,687 1,698,436.12 2.6% 365.57 2,189,781.52 3.4% 471.33Lind 190.10 4,834,844 813,437.76 16.8% 4,279.00 207,283.01 4.3% 1,090.39Ritzville 350.89 5,287,757 14,613.59 0.3% 41.65 113,509.74 2.1% 323.49County Total 5,262.22 78,048,887 2,699,383.22 3.5% 512.97 2,653,702.75 3.4% 504.29
Asotin Co.Clarkston 2,657.47 35,618,644 667,113.78 1.9% 251.03 1,278,263.16 3.6% 481.01Asotin 621.96 8,304,337 227,915.24 2.7% 366.45 247,659.26 3.0% 398.19County Total 3,279.43 43,922,981 895,029.02 2.0% 272.92 1,525,922.42 3.5% 465.30
Benton Co.Kennewick 19,233.27 255,721,902 6,384,937.95 2.5% 331.97 8,114,789.48 3.2% 421.91Paterson 121.73 2,202,493 241,683.36 11.0% 1,985.41 122,263.92 5.6% 1,004.39Kiona-Benton 1,394.91 20,885,271 525,129.10 2.5% 376.46 833,794.13 4.0% 597.74Finley 874.54 13,320,852 439,857.05 3.3% 502.96 279,100.28 2.1% 319.14Prosser 2,653.82 38,200,686 1,257,037.93 3.3% 473.67 1,179,320.28 3.1% 444.39Richland 13,925.64 180,863,310 3,828,952.80 2.1% 274.96 4,366,676.23 2.4% 313.57County Total 38,203.91 511,194,514 12,677,598.19 2.5% 331.84 14,895,944.32 2.9% 389.91
Chelan Co.Manson 639.54 10,284,466 333,868.59 3.2% 522.04 431,618.63 4.2% 674.89Stehekin 9.70 192,906 3,537.00 1.8% 364.64 17,027.91 8.8% 1,755.45Entiat 312.91 5,401,312 215,532.52 4.0% 688.80 176,034.89 3.3% 562.57Lake Chelan 1,390.52 21,212,439 633,702.75 3.0% 455.73 846,260.16 4.0% 608.59Cashmere 1,605.62 21,547,601 356,430.33 1.7% 221.99 820,083.63 3.8% 510.76Cascade 1,325.90 19,098,162 834,651.10 4.4% 629.50 283,196.24 1.5% 213.59Wenatchee 7,854.55 110,579,991 1,768,845.77 1.6% 225.20 3,560,814.98 3.2% 453.34County Total 13,138.74 188,316,878 4,146,568.06 2.2% 315.60 6,135,036.44 3.3% 466.94
151
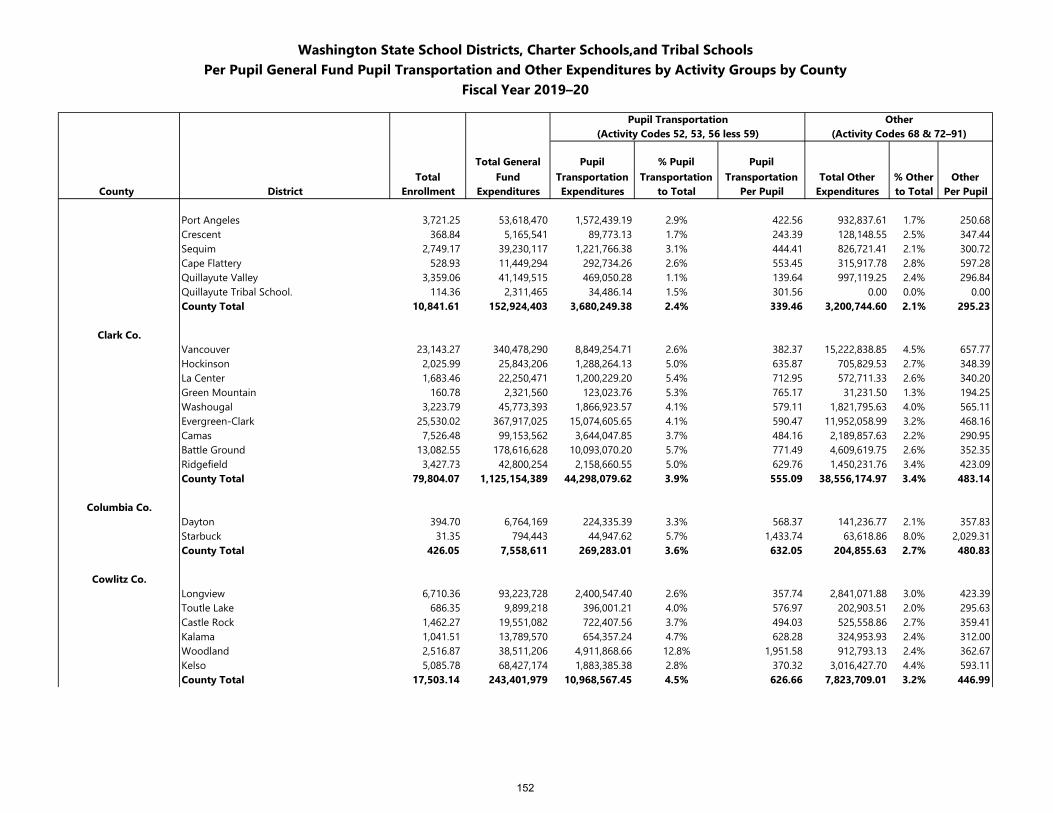
Washington State School Districts, Charter Schools,and Tribal SchoolsPer Pupil General Fund Pupil Transportation and Other Expenditures by Activity Groups by County
Fiscal Year 2019–20
Pupil Transportation Other(Activity Codes 52, 53, 56 less 59) (Activity Codes 68 & 72–91)
TotalTotal General
FundPupil
Transportation% Pupil
TransportationPupil
Transportation Total Other % Other OtherCounty District Enrollment Expenditures Expenditures to Total Per Pupil Expenditures to Total Per Pupil
Port Angeles 3,721.25 53,618,470 1,572,439.19 2.9% 422.56 932,837.61 1.7% 250.68Crescent 368.84 5,165,541 89,773.13 1.7% 243.39 128,148.55 2.5% 347.44Sequim 2,749.17 39,230,117 1,221,766.38 3.1% 444.41 826,721.41 2.1% 300.72Cape Flattery 528.93 11,449,294 292,734.26 2.6% 553.45 315,917.78 2.8% 597.28Quillayute Valley 3,359.06 41,149,515 469,050.28 1.1% 139.64 997,119.25 2.4% 296.84Quillayute Tribal School. 114.36 2,311,465 34,486.14 1.5% 301.56 0.00 0.0% 0.00County Total 10,841.61 152,924,403 3,680,249.38 2.4% 339.46 3,200,744.60 2.1% 295.23
Clark Co.Vancouver 23,143.27 340,478,290 8,849,254.71 2.6% 382.37 15,222,838.85 4.5% 657.77Hockinson 2,025.99 25,843,206 1,288,264.13 5.0% 635.87 705,829.53 2.7% 348.39La Center 1,683.46 22,250,471 1,200,229.20 5.4% 712.95 572,711.33 2.6% 340.20Green Mountain 160.78 2,321,560 123,023.76 5.3% 765.17 31,231.50 1.3% 194.25Washougal 3,223.79 45,773,393 1,866,923.57 4.1% 579.11 1,821,795.63 4.0% 565.11Evergreen-Clark 25,530.02 367,917,025 15,074,605.65 4.1% 590.47 11,952,058.99 3.2% 468.16Camas 7,526.48 99,153,562 3,644,047.85 3.7% 484.16 2,189,857.63 2.2% 290.95Battle Ground 13,082.55 178,616,628 10,093,070.20 5.7% 771.49 4,609,619.75 2.6% 352.35Ridgefield 3,427.73 42,800,254 2,158,660.55 5.0% 629.76 1,450,231.76 3.4% 423.09County Total 79,804.07 1,125,154,389 44,298,079.62 3.9% 555.09 38,556,174.97 3.4% 483.14
Columbia Co.Dayton 394.70 6,764,169 224,335.39 3.3% 568.37 141,236.77 2.1% 357.83Starbuck 31.35 794,443 44,947.62 5.7% 1,433.74 63,618.86 8.0% 2,029.31County Total 426.05 7,558,611 269,283.01 3.6% 632.05 204,855.63 2.7% 480.83
Cowlitz Co.Longview 6,710.36 93,223,728 2,400,547.40 2.6% 357.74 2,841,071.88 3.0% 423.39Toutle Lake 686.35 9,899,218 396,001.21 4.0% 576.97 202,903.51 2.0% 295.63Castle Rock 1,462.27 19,551,082 722,407.56 3.7% 494.03 525,558.86 2.7% 359.41Kalama 1,041.51 13,789,570 654,357.24 4.7% 628.28 324,953.93 2.4% 312.00Woodland 2,516.87 38,511,206 4,911,868.66 12.8% 1,951.58 912,793.13 2.4% 362.67Kelso 5,085.78 68,427,174 1,883,385.38 2.8% 370.32 3,016,427.70 4.4% 593.11County Total 17,503.14 243,401,979 10,968,567.45 4.5% 626.66 7,823,709.01 3.2% 446.99
152
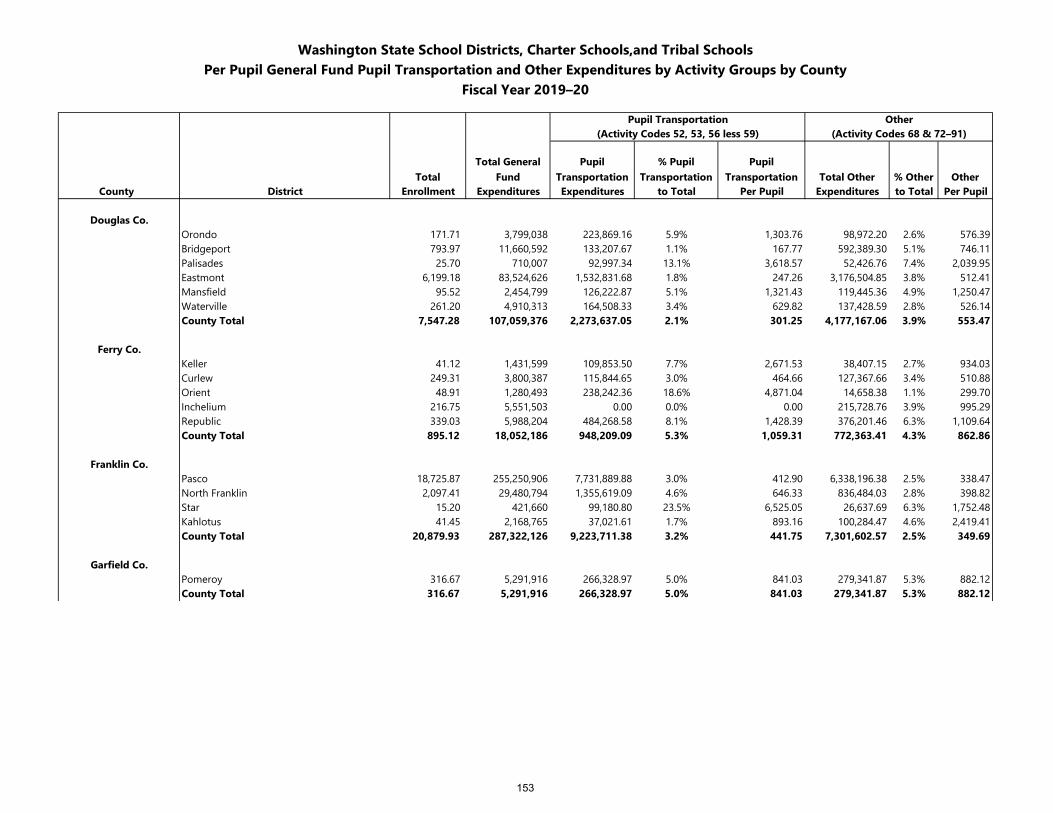
Washington State School Districts, Charter Schools,and Tribal SchoolsPer Pupil General Fund Pupil Transportation and Other Expenditures by Activity Groups by County
Fiscal Year 2019–20
Pupil Transportation Other(Activity Codes 52, 53, 56 less 59) (Activity Codes 68 & 72–91)
TotalTotal General
FundPupil
Transportation% Pupil
TransportationPupil
Transportation Total Other % Other OtherCounty District Enrollment Expenditures Expenditures to Total Per Pupil Expenditures to Total Per Pupil
Douglas Co.Orondo 171.71 3,799,038 223,869.16 5.9% 1,303.76 98,972.20 2.6% 576.39Bridgeport 793.97 11,660,592 133,207.67 1.1% 167.77 592,389.30 5.1% 746.11Palisades 25.70 710,007 92,997.34 13.1% 3,618.57 52,426.76 7.4% 2,039.95Eastmont 6,199.18 83,524,626 1,532,831.68 1.8% 247.26 3,176,504.85 3.8% 512.41Mansfield 95.52 2,454,799 126,222.87 5.1% 1,321.43 119,445.36 4.9% 1,250.47Waterville 261.20 4,910,313 164,508.33 3.4% 629.82 137,428.59 2.8% 526.14County Total 7,547.28 107,059,376 2,273,637.05 2.1% 301.25 4,177,167.06 3.9% 553.47
Ferry Co.Keller 41.12 1,431,599 109,853.50 7.7% 2,671.53 38,407.15 2.7% 934.03Curlew 249.31 3,800,387 115,844.65 3.0% 464.66 127,367.66 3.4% 510.88Orient 48.91 1,280,493 238,242.36 18.6% 4,871.04 14,658.38 1.1% 299.70Inchelium 216.75 5,551,503 0.00 0.0% 0.00 215,728.76 3.9% 995.29Republic 339.03 5,988,204 484,268.58 8.1% 1,428.39 376,201.46 6.3% 1,109.64County Total 895.12 18,052,186 948,209.09 5.3% 1,059.31 772,363.41 4.3% 862.86
Franklin Co.Pasco 18,725.87 255,250,906 7,731,889.88 3.0% 412.90 6,338,196.38 2.5% 338.47North Franklin 2,097.41 29,480,794 1,355,619.09 4.6% 646.33 836,484.03 2.8% 398.82Star 15.20 421,660 99,180.80 23.5% 6,525.05 26,637.69 6.3% 1,752.48Kahlotus 41.45 2,168,765 37,021.61 1.7% 893.16 100,284.47 4.6% 2,419.41County Total 20,879.93 287,322,126 9,223,711.38 3.2% 441.75 7,301,602.57 2.5% 349.69
Garfield Co.Pomeroy 316.67 5,291,916 266,328.97 5.0% 841.03 279,341.87 5.3% 882.12County Total 316.67 5,291,916 266,328.97 5.0% 841.03 279,341.87 5.3% 882.12
153
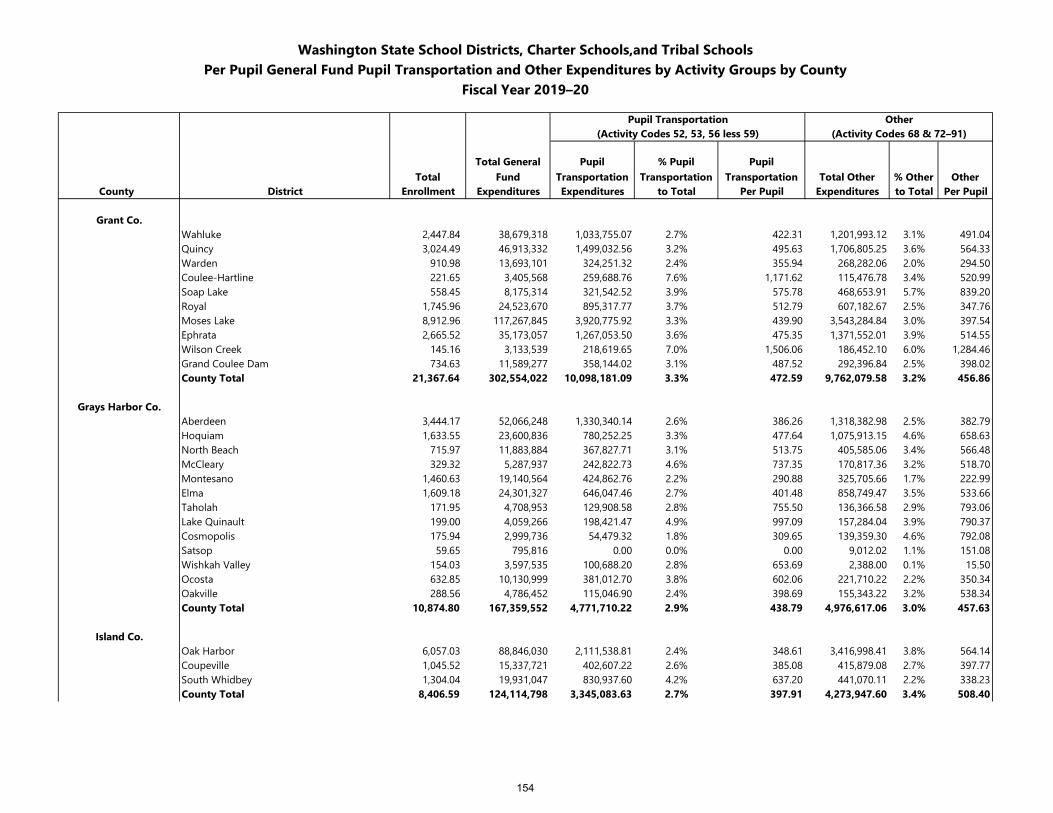
Washington State School Districts, Charter Schools,and Tribal SchoolsPer Pupil General Fund Pupil Transportation and Other Expenditures by Activity Groups by County
Fiscal Year 2019–20
Pupil Transportation Other(Activity Codes 52, 53, 56 less 59) (Activity Codes 68 & 72–91)
TotalTotal General
FundPupil
Transportation% Pupil
TransportationPupil
Transportation Total Other % Other OtherCounty District Enrollment Expenditures Expenditures to Total Per Pupil Expenditures to Total Per Pupil
Grant Co.Wahluke 2,447.84 38,679,318 1,033,755.07 2.7% 422.31 1,201,993.12 3.1% 491.04Quincy 3,024.49 46,913,332 1,499,032.56 3.2% 495.63 1,706,805.25 3.6% 564.33Warden 910.98 13,693,101 324,251.32 2.4% 355.94 268,282.06 2.0% 294.50Coulee-Hartline 221.65 3,405,568 259,688.76 7.6% 1,171.62 115,476.78 3.4% 520.99Soap Lake 558.45 8,175,314 321,542.52 3.9% 575.78 468,653.91 5.7% 839.20Royal 1,745.96 24,523,670 895,317.77 3.7% 512.79 607,182.67 2.5% 347.76Moses Lake 8,912.96 117,267,845 3,920,775.92 3.3% 439.90 3,543,284.84 3.0% 397.54Ephrata 2,665.52 35,173,057 1,267,053.50 3.6% 475.35 1,371,552.01 3.9% 514.55Wilson Creek 145.16 3,133,539 218,619.65 7.0% 1,506.06 186,452.10 6.0% 1,284.46Grand Coulee Dam 734.63 11,589,277 358,144.02 3.1% 487.52 292,396.84 2.5% 398.02County Total 21,367.64 302,554,022 10,098,181.09 3.3% 472.59 9,762,079.58 3.2% 456.86
Grays Harbor Co.Aberdeen 3,444.17 52,066,248 1,330,340.14 2.6% 386.26 1,318,382.98 2.5% 382.79Hoquiam 1,633.55 23,600,836 780,252.25 3.3% 477.64 1,075,913.15 4.6% 658.63North Beach 715.97 11,883,884 367,827.71 3.1% 513.75 405,585.06 3.4% 566.48McCleary 329.32 5,287,937 242,822.73 4.6% 737.35 170,817.36 3.2% 518.70Montesano 1,460.63 19,140,564 424,862.76 2.2% 290.88 325,705.66 1.7% 222.99Elma 1,609.18 24,301,327 646,047.46 2.7% 401.48 858,749.47 3.5% 533.66Taholah 171.95 4,708,953 129,908.58 2.8% 755.50 136,366.58 2.9% 793.06Lake Quinault 199.00 4,059,266 198,421.47 4.9% 997.09 157,284.04 3.9% 790.37Cosmopolis 175.94 2,999,736 54,479.32 1.8% 309.65 139,359.30 4.6% 792.08Satsop 59.65 795,816 0.00 0.0% 0.00 9,012.02 1.1% 151.08Wishkah Valley 154.03 3,597,535 100,688.20 2.8% 653.69 2,388.00 0.1% 15.50Ocosta 632.85 10,130,999 381,012.70 3.8% 602.06 221,710.22 2.2% 350.34Oakville 288.56 4,786,452 115,046.90 2.4% 398.69 155,343.22 3.2% 538.34County Total 10,874.80 167,359,552 4,771,710.22 2.9% 438.79 4,976,617.06 3.0% 457.63
Island Co.Oak Harbor 6,057.03 88,846,030 2,111,538.81 2.4% 348.61 3,416,998.41 3.8% 564.14Coupeville 1,045.52 15,337,721 402,607.22 2.6% 385.08 415,879.08 2.7% 397.77South Whidbey 1,304.04 19,931,047 830,937.60 4.2% 637.20 441,070.11 2.2% 338.23County Total 8,406.59 124,114,798 3,345,083.63 2.7% 397.91 4,273,947.60 3.4% 508.40
154
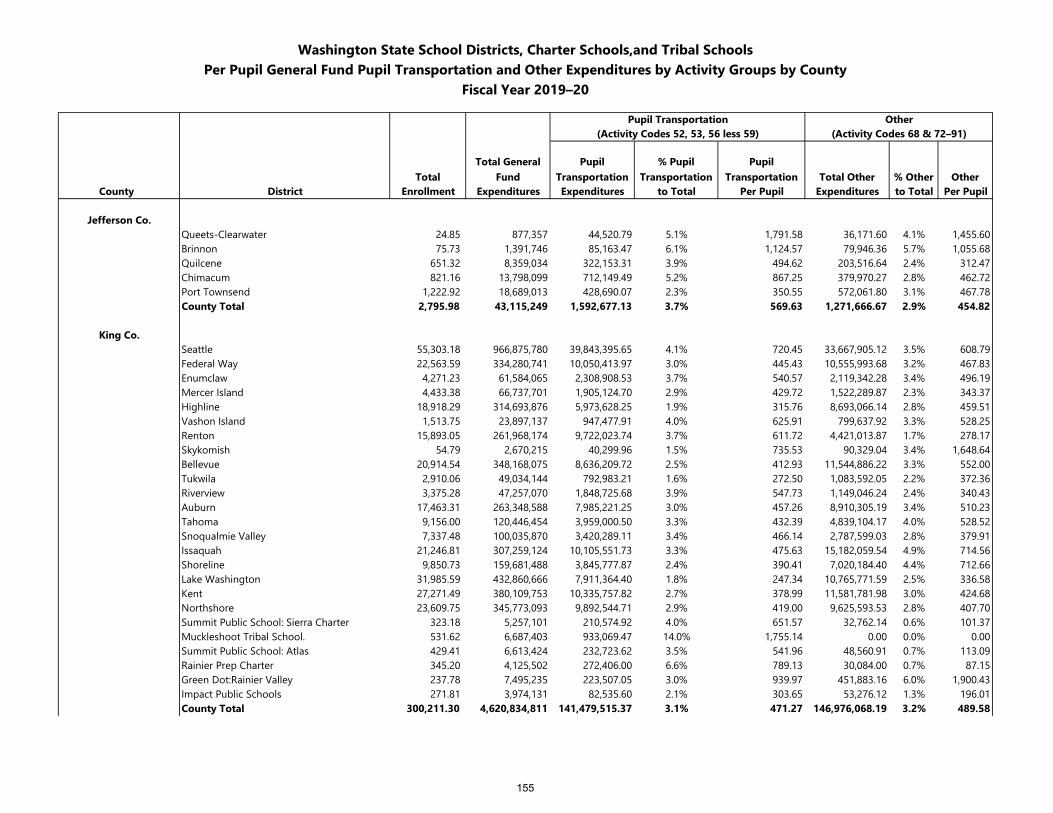
Washington State School Districts, Charter Schools,and Tribal SchoolsPer Pupil General Fund Pupil Transportation and Other Expenditures by Activity Groups by County
Fiscal Year 2019–20
Pupil Transportation Other(Activity Codes 52, 53, 56 less 59) (Activity Codes 68 & 72–91)
TotalTotal General
FundPupil
Transportation% Pupil
TransportationPupil
Transportation Total Other % Other OtherCounty District Enrollment Expenditures Expenditures to Total Per Pupil Expenditures to Total Per Pupil
Jefferson Co.Queets-Clearwater 24.85 877,357 44,520.79 5.1% 1,791.58 36,171.60 4.1% 1,455.60Brinnon 75.73 1,391,746 85,163.47 6.1% 1,124.57 79,946.36 5.7% 1,055.68Quilcene 651.32 8,359,034 322,153.31 3.9% 494.62 203,516.64 2.4% 312.47Chimacum 821.16 13,798,099 712,149.49 5.2% 867.25 379,970.27 2.8% 462.72Port Townsend 1,222.92 18,689,013 428,690.07 2.3% 350.55 572,061.80 3.1% 467.78County Total 2,795.98 43,115,249 1,592,677.13 3.7% 569.63 1,271,666.67 2.9% 454.82
King Co.Seattle 55,303.18 966,875,780 39,843,395.65 4.1% 720.45 33,667,905.12 3.5% 608.79Federal Way 22,563.59 334,280,741 10,050,413.97 3.0% 445.43 10,555,993.68 3.2% 467.83Enumclaw 4,271.23 61,584,065 2,308,908.53 3.7% 540.57 2,119,342.28 3.4% 496.19Mercer Island 4,433.38 66,737,701 1,905,124.70 2.9% 429.72 1,522,289.87 2.3% 343.37Highline 18,918.29 314,693,876 5,973,628.25 1.9% 315.76 8,693,066.14 2.8% 459.51Vashon Island 1,513.75 23,897,137 947,477.91 4.0% 625.91 799,637.92 3.3% 528.25Renton 15,893.05 261,968,174 9,722,023.74 3.7% 611.72 4,421,013.87 1.7% 278.17Skykomish 54.79 2,670,215 40,299.96 1.5% 735.53 90,329.04 3.4% 1,648.64Bellevue 20,914.54 348,168,075 8,636,209.72 2.5% 412.93 11,544,886.22 3.3% 552.00Tukwila 2,910.06 49,034,144 792,983.21 1.6% 272.50 1,083,592.05 2.2% 372.36Riverview 3,375.28 47,257,070 1,848,725.68 3.9% 547.73 1,149,046.24 2.4% 340.43Auburn 17,463.31 263,348,588 7,985,221.25 3.0% 457.26 8,910,305.19 3.4% 510.23Tahoma 9,156.00 120,446,454 3,959,000.50 3.3% 432.39 4,839,104.17 4.0% 528.52Snoqualmie Valley 7,337.48 100,035,870 3,420,289.11 3.4% 466.14 2,787,599.03 2.8% 379.91Issaquah 21,246.81 307,259,124 10,105,551.73 3.3% 475.63 15,182,059.54 4.9% 714.56Shoreline 9,850.73 159,681,488 3,845,777.87 2.4% 390.41 7,020,184.40 4.4% 712.66Lake Washington 31,985.59 432,860,666 7,911,364.40 1.8% 247.34 10,765,771.59 2.5% 336.58Kent 27,271.49 380,109,753 10,335,757.82 2.7% 378.99 11,581,781.98 3.0% 424.68Northshore 23,609.75 345,773,093 9,892,544.71 2.9% 419.00 9,625,593.53 2.8% 407.70Summit Public School: Sierra Charter 323.18 5,257,101 210,574.92 4.0% 651.57 32,762.14 0.6% 101.37Muckleshoot Tribal School. 531.62 6,687,403 933,069.47 14.0% 1,755.14 0.00 0.0% 0.00Summit Public School: Atlas 429.41 6,613,424 232,723.62 3.5% 541.96 48,560.91 0.7% 113.09Rainier Prep Charter 345.20 4,125,502 272,406.00 6.6% 789.13 30,084.00 0.7% 87.15Green Dot:Rainier Valley 237.78 7,495,235 223,507.05 3.0% 939.97 451,883.16 6.0% 1,900.43Impact Public Schools 271.81 3,974,131 82,535.60 2.1% 303.65 53,276.12 1.3% 196.01County Total 300,211.30 4,620,834,811 141,479,515.37 3.1% 471.27 146,976,068.19 3.2% 489.58
155
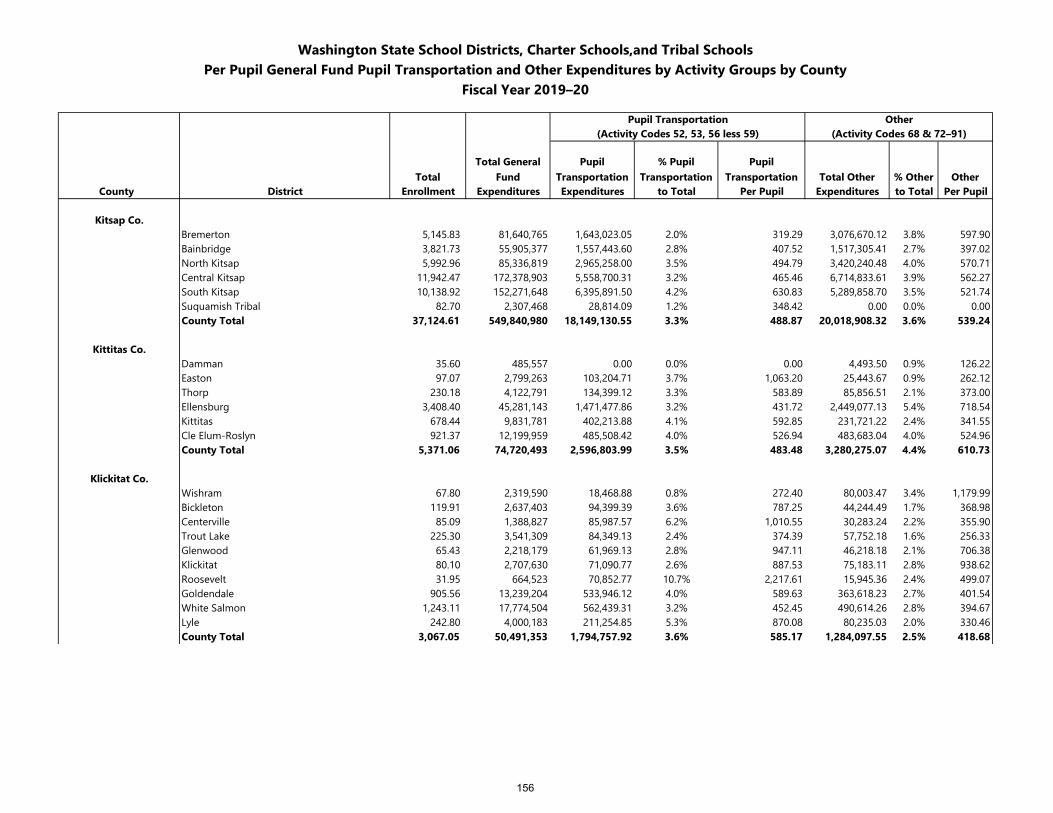
Washington State School Districts, Charter Schools,and Tribal SchoolsPer Pupil General Fund Pupil Transportation and Other Expenditures by Activity Groups by County
Fiscal Year 2019–20
Pupil Transportation Other(Activity Codes 52, 53, 56 less 59) (Activity Codes 68 & 72–91)
TotalTotal General
FundPupil
Transportation% Pupil
TransportationPupil
Transportation Total Other % Other OtherCounty District Enrollment Expenditures Expenditures to Total Per Pupil Expenditures to Total Per Pupil
Kitsap Co.Bremerton 5,145.83 81,640,765 1,643,023.05 2.0% 319.29 3,076,670.12 3.8% 597.90Bainbridge 3,821.73 55,905,377 1,557,443.60 2.8% 407.52 1,517,305.41 2.7% 397.02North Kitsap 5,992.96 85,336,819 2,965,258.00 3.5% 494.79 3,420,240.48 4.0% 570.71Central Kitsap 11,942.47 172,378,903 5,558,700.31 3.2% 465.46 6,714,833.61 3.9% 562.27South Kitsap 10,138.92 152,271,648 6,395,891.50 4.2% 630.83 5,289,858.70 3.5% 521.74Suquamish Tribal 82.70 2,307,468 28,814.09 1.2% 348.42 0.00 0.0% 0.00County Total 37,124.61 549,840,980 18,149,130.55 3.3% 488.87 20,018,908.32 3.6% 539.24
Kittitas Co.Damman 35.60 485,557 0.00 0.0% 0.00 4,493.50 0.9% 126.22Easton 97.07 2,799,263 103,204.71 3.7% 1,063.20 25,443.67 0.9% 262.12Thorp 230.18 4,122,791 134,399.12 3.3% 583.89 85,856.51 2.1% 373.00Ellensburg 3,408.40 45,281,143 1,471,477.86 3.2% 431.72 2,449,077.13 5.4% 718.54Kittitas 678.44 9,831,781 402,213.88 4.1% 592.85 231,721.22 2.4% 341.55Cle Elum-Roslyn 921.37 12,199,959 485,508.42 4.0% 526.94 483,683.04 4.0% 524.96County Total 5,371.06 74,720,493 2,596,803.99 3.5% 483.48 3,280,275.07 4.4% 610.73
Klickitat Co.Wishram 67.80 2,319,590 18,468.88 0.8% 272.40 80,003.47 3.4% 1,179.99Bickleton 119.91 2,637,403 94,399.39 3.6% 787.25 44,244.49 1.7% 368.98Centerville 85.09 1,388,827 85,987.57 6.2% 1,010.55 30,283.24 2.2% 355.90Trout Lake 225.30 3,541,309 84,349.13 2.4% 374.39 57,752.18 1.6% 256.33Glenwood 65.43 2,218,179 61,969.13 2.8% 947.11 46,218.18 2.1% 706.38Klickitat 80.10 2,707,630 71,090.77 2.6% 887.53 75,183.11 2.8% 938.62Roosevelt 31.95 664,523 70,852.77 10.7% 2,217.61 15,945.36 2.4% 499.07Goldendale 905.56 13,239,204 533,946.12 4.0% 589.63 363,618.23 2.7% 401.54White Salmon 1,243.11 17,774,504 562,439.31 3.2% 452.45 490,614.26 2.8% 394.67Lyle 242.80 4,000,183 211,254.85 5.3% 870.08 80,235.03 2.0% 330.46County Total 3,067.05 50,491,353 1,794,757.92 3.6% 585.17 1,284,097.55 2.5% 418.68
156
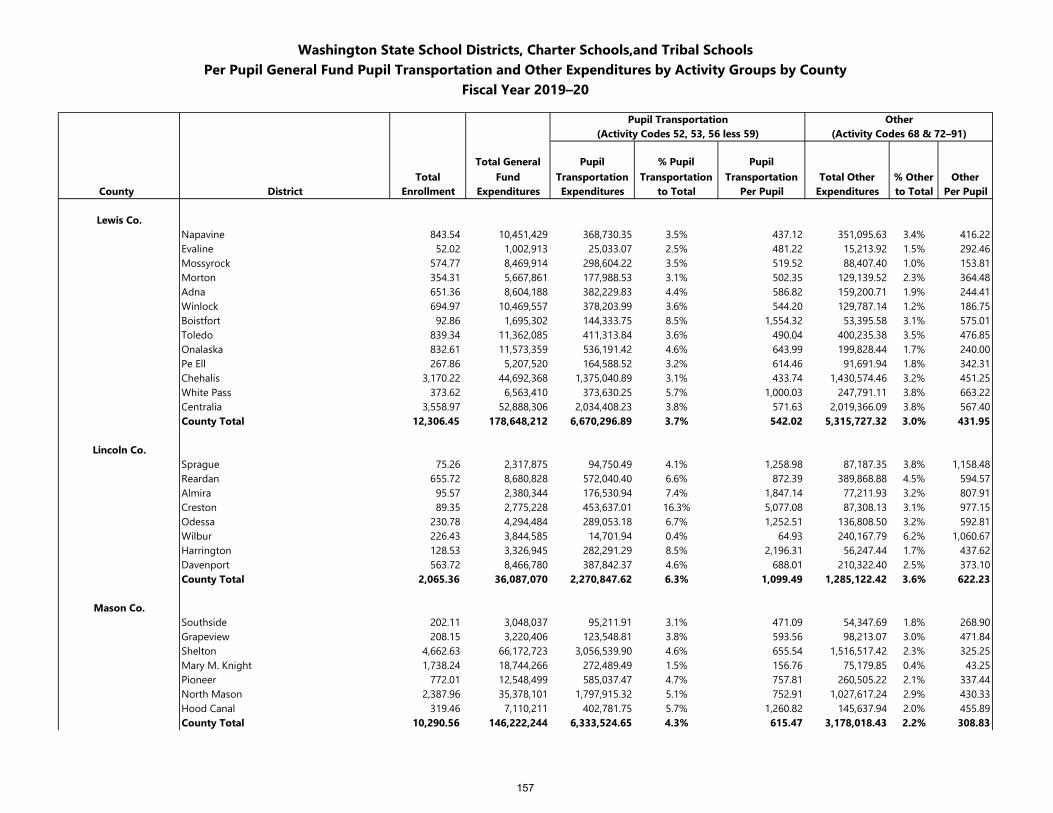
Washington State School Districts, Charter Schools,and Tribal SchoolsPer Pupil General Fund Pupil Transportation and Other Expenditures by Activity Groups by County
Fiscal Year 2019–20
Pupil Transportation Other(Activity Codes 52, 53, 56 less 59) (Activity Codes 68 & 72–91)
TotalTotal General
FundPupil
Transportation% Pupil
TransportationPupil
Transportation Total Other % Other OtherCounty District Enrollment Expenditures Expenditures to Total Per Pupil Expenditures to Total Per Pupil
Lewis Co.Napavine 843.54 10,451,429 368,730.35 3.5% 437.12 351,095.63 3.4% 416.22Evaline 52.02 1,002,913 25,033.07 2.5% 481.22 15,213.92 1.5% 292.46Mossyrock 574.77 8,469,914 298,604.22 3.5% 519.52 88,407.40 1.0% 153.81Morton 354.31 5,667,861 177,988.53 3.1% 502.35 129,139.52 2.3% 364.48Adna 651.36 8,604,188 382,229.83 4.4% 586.82 159,200.71 1.9% 244.41Winlock 694.97 10,469,557 378,203.99 3.6% 544.20 129,787.14 1.2% 186.75Boistfort 92.86 1,695,302 144,333.75 8.5% 1,554.32 53,395.58 3.1% 575.01Toledo 839.34 11,362,085 411,313.84 3.6% 490.04 400,235.38 3.5% 476.85Onalaska 832.61 11,573,359 536,191.42 4.6% 643.99 199,828.44 1.7% 240.00Pe Ell 267.86 5,207,520 164,588.52 3.2% 614.46 91,691.94 1.8% 342.31Chehalis 3,170.22 44,692,368 1,375,040.89 3.1% 433.74 1,430,574.46 3.2% 451.25White Pass 373.62 6,563,410 373,630.25 5.7% 1,000.03 247,791.11 3.8% 663.22Centralia 3,558.97 52,888,306 2,034,408.23 3.8% 571.63 2,019,366.09 3.8% 567.40County Total 12,306.45 178,648,212 6,670,296.89 3.7% 542.02 5,315,727.32 3.0% 431.95
Lincoln Co.Sprague 75.26 2,317,875 94,750.49 4.1% 1,258.98 87,187.35 3.8% 1,158.48Reardan 655.72 8,680,828 572,040.40 6.6% 872.39 389,868.88 4.5% 594.57Almira 95.57 2,380,344 176,530.94 7.4% 1,847.14 77,211.93 3.2% 807.91Creston 89.35 2,775,228 453,637.01 16.3% 5,077.08 87,308.13 3.1% 977.15Odessa 230.78 4,294,484 289,053.18 6.7% 1,252.51 136,808.50 3.2% 592.81Wilbur 226.43 3,844,585 14,701.94 0.4% 64.93 240,167.79 6.2% 1,060.67Harrington 128.53 3,326,945 282,291.29 8.5% 2,196.31 56,247.44 1.7% 437.62Davenport 563.72 8,466,780 387,842.37 4.6% 688.01 210,322.40 2.5% 373.10County Total 2,065.36 36,087,070 2,270,847.62 6.3% 1,099.49 1,285,122.42 3.6% 622.23
Mason Co.Southside 202.11 3,048,037 95,211.91 3.1% 471.09 54,347.69 1.8% 268.90Grapeview 208.15 3,220,406 123,548.81 3.8% 593.56 98,213.07 3.0% 471.84Shelton 4,662.63 66,172,723 3,056,539.90 4.6% 655.54 1,516,517.42 2.3% 325.25Mary M. Knight 1,738.24 18,744,266 272,489.49 1.5% 156.76 75,179.85 0.4% 43.25Pioneer 772.01 12,548,499 585,037.47 4.7% 757.81 260,505.22 2.1% 337.44North Mason 2,387.96 35,378,101 1,797,915.32 5.1% 752.91 1,027,617.24 2.9% 430.33Hood Canal 319.46 7,110,211 402,781.75 5.7% 1,260.82 145,637.94 2.0% 455.89County Total 10,290.56 146,222,244 6,333,524.65 4.3% 615.47 3,178,018.43 2.2% 308.83
157
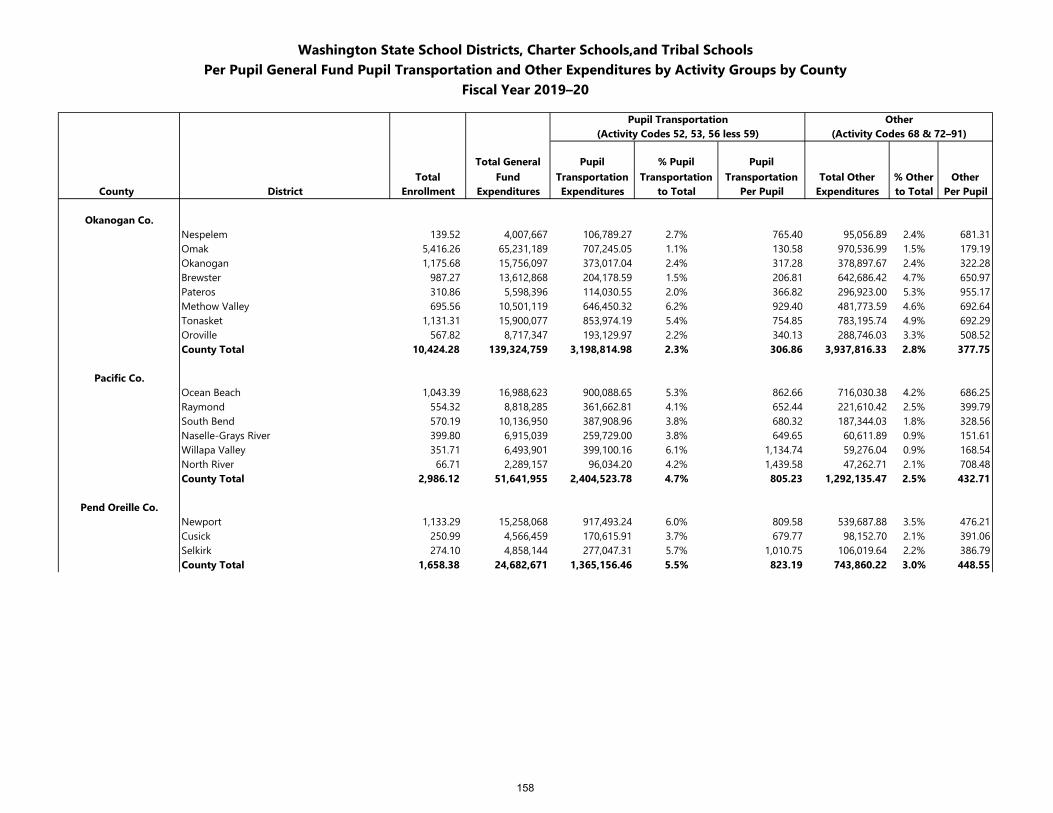
Washington State School Districts, Charter Schools,and Tribal SchoolsPer Pupil General Fund Pupil Transportation and Other Expenditures by Activity Groups by County
Fiscal Year 2019–20
Pupil Transportation Other(Activity Codes 52, 53, 56 less 59) (Activity Codes 68 & 72–91)
TotalTotal General
FundPupil
Transportation% Pupil
TransportationPupil
Transportation Total Other % Other OtherCounty District Enrollment Expenditures Expenditures to Total Per Pupil Expenditures to Total Per Pupil
Okanogan Co.Nespelem 139.52 4,007,667 106,789.27 2.7% 765.40 95,056.89 2.4% 681.31Omak 5,416.26 65,231,189 707,245.05 1.1% 130.58 970,536.99 1.5% 179.19Okanogan 1,175.68 15,756,097 373,017.04 2.4% 317.28 378,897.67 2.4% 322.28Brewster 987.27 13,612,868 204,178.59 1.5% 206.81 642,686.42 4.7% 650.97Pateros 310.86 5,598,396 114,030.55 2.0% 366.82 296,923.00 5.3% 955.17Methow Valley 695.56 10,501,119 646,450.32 6.2% 929.40 481,773.59 4.6% 692.64Tonasket 1,131.31 15,900,077 853,974.19 5.4% 754.85 783,195.74 4.9% 692.29Oroville 567.82 8,717,347 193,129.97 2.2% 340.13 288,746.03 3.3% 508.52County Total 10,424.28 139,324,759 3,198,814.98 2.3% 306.86 3,937,816.33 2.8% 377.75
Pacific Co.Ocean Beach 1,043.39 16,988,623 900,088.65 5.3% 862.66 716,030.38 4.2% 686.25Raymond 554.32 8,818,285 361,662.81 4.1% 652.44 221,610.42 2.5% 399.79South Bend 570.19 10,136,950 387,908.96 3.8% 680.32 187,344.03 1.8% 328.56Naselle-Grays River 399.80 6,915,039 259,729.00 3.8% 649.65 60,611.89 0.9% 151.61Willapa Valley 351.71 6,493,901 399,100.16 6.1% 1,134.74 59,276.04 0.9% 168.54North River 66.71 2,289,157 96,034.20 4.2% 1,439.58 47,262.71 2.1% 708.48County Total 2,986.12 51,641,955 2,404,523.78 4.7% 805.23 1,292,135.47 2.5% 432.71
Pend Oreille Co.Newport 1,133.29 15,258,068 917,493.24 6.0% 809.58 539,687.88 3.5% 476.21Cusick 250.99 4,566,459 170,615.91 3.7% 679.77 98,152.70 2.1% 391.06Selkirk 274.10 4,858,144 277,047.31 5.7% 1,010.75 106,019.64 2.2% 386.79County Total 1,658.38 24,682,671 1,365,156.46 5.5% 823.19 743,860.22 3.0% 448.55
158
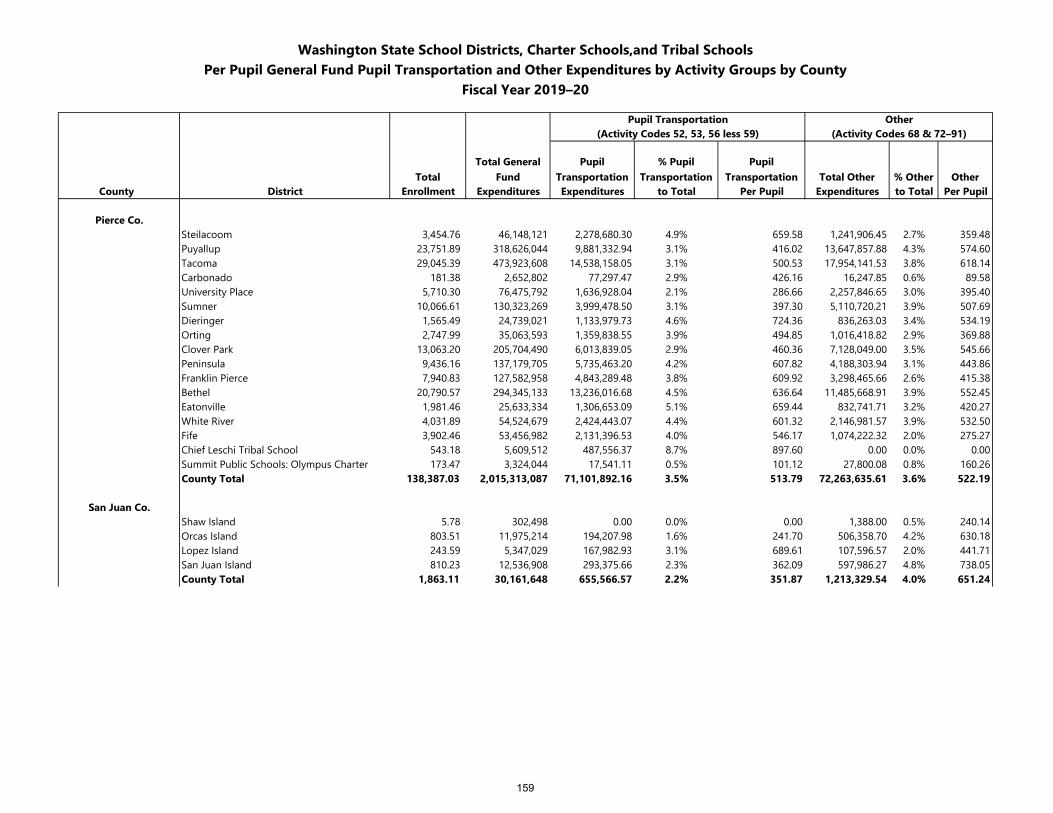
Washington State School Districts, Charter Schools,and Tribal SchoolsPer Pupil General Fund Pupil Transportation and Other Expenditures by Activity Groups by County
Fiscal Year 2019–20
Pupil Transportation Other(Activity Codes 52, 53, 56 less 59) (Activity Codes 68 & 72–91)
TotalTotal General
FundPupil
Transportation% Pupil
TransportationPupil
Transportation Total Other % Other OtherCounty District Enrollment Expenditures Expenditures to Total Per Pupil Expenditures to Total Per Pupil
Pierce Co.Steilacoom 3,454.76 46,148,121 2,278,680.30 4.9% 659.58 1,241,906.45 2.7% 359.48Puyallup 23,751.89 318,626,044 9,881,332.94 3.1% 416.02 13,647,857.88 4.3% 574.60Tacoma 29,045.39 473,923,608 14,538,158.05 3.1% 500.53 17,954,141.53 3.8% 618.14Carbonado 181.38 2,652,802 77,297.47 2.9% 426.16 16,247.85 0.6% 89.58University Place 5,710.30 76,475,792 1,636,928.04 2.1% 286.66 2,257,846.65 3.0% 395.40Sumner 10,066.61 130,323,269 3,999,478.50 3.1% 397.30 5,110,720.21 3.9% 507.69Dieringer 1,565.49 24,739,021 1,133,979.73 4.6% 724.36 836,263.03 3.4% 534.19Orting 2,747.99 35,063,593 1,359,838.55 3.9% 494.85 1,016,418.82 2.9% 369.88Clover Park 13,063.20 205,704,490 6,013,839.05 2.9% 460.36 7,128,049.00 3.5% 545.66Peninsula 9,436.16 137,179,705 5,735,463.20 4.2% 607.82 4,188,303.94 3.1% 443.86Franklin Pierce 7,940.83 127,582,958 4,843,289.48 3.8% 609.92 3,298,465.66 2.6% 415.38Bethel 20,790.57 294,345,133 13,236,016.68 4.5% 636.64 11,485,668.91 3.9% 552.45Eatonville 1,981.46 25,633,334 1,306,653.09 5.1% 659.44 832,741.71 3.2% 420.27White River 4,031.89 54,524,679 2,424,443.07 4.4% 601.32 2,146,981.57 3.9% 532.50Fife 3,902.46 53,456,982 2,131,396.53 4.0% 546.17 1,074,222.32 2.0% 275.27Chief Leschi Tribal School 543.18 5,609,512 487,556.37 8.7% 897.60 0.00 0.0% 0.00Summit Public Schools: Olympus Charter 173.47 3,324,044 17,541.11 0.5% 101.12 27,800.08 0.8% 160.26County Total 138,387.03 2,015,313,087 71,101,892.16 3.5% 513.79 72,263,635.61 3.6% 522.19
San Juan Co.Shaw Island 5.78 302,498 0.00 0.0% 0.00 1,388.00 0.5% 240.14Orcas Island 803.51 11,975,214 194,207.98 1.6% 241.70 506,358.70 4.2% 630.18Lopez Island 243.59 5,347,029 167,982.93 3.1% 689.61 107,596.57 2.0% 441.71San Juan Island 810.23 12,536,908 293,375.66 2.3% 362.09 597,986.27 4.8% 738.05County Total 1,863.11 30,161,648 655,566.57 2.2% 351.87 1,213,329.54 4.0% 651.24
159
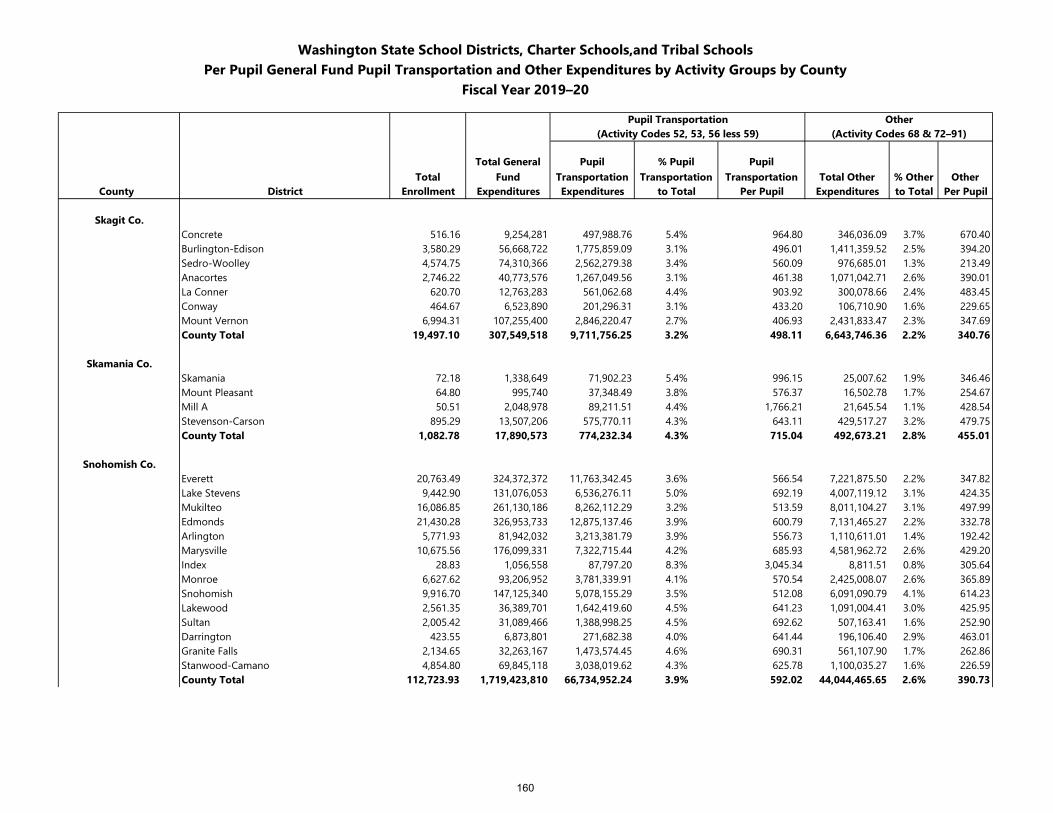
Washington State School Districts, Charter Schools,and Tribal SchoolsPer Pupil General Fund Pupil Transportation and Other Expenditures by Activity Groups by County
Fiscal Year 2019–20
Pupil Transportation Other(Activity Codes 52, 53, 56 less 59) (Activity Codes 68 & 72–91)
TotalTotal General
FundPupil
Transportation% Pupil
TransportationPupil
Transportation Total Other % Other OtherCounty District Enrollment Expenditures Expenditures to Total Per Pupil Expenditures to Total Per Pupil
Skagit Co.Concrete 516.16 9,254,281 497,988.76 5.4% 964.80 346,036.09 3.7% 670.40Burlington-Edison 3,580.29 56,668,722 1,775,859.09 3.1% 496.01 1,411,359.52 2.5% 394.20Sedro-Woolley 4,574.75 74,310,366 2,562,279.38 3.4% 560.09 976,685.01 1.3% 213.49Anacortes 2,746.22 40,773,576 1,267,049.56 3.1% 461.38 1,071,042.71 2.6% 390.01La Conner 620.70 12,763,283 561,062.68 4.4% 903.92 300,078.66 2.4% 483.45Conway 464.67 6,523,890 201,296.31 3.1% 433.20 106,710.90 1.6% 229.65Mount Vernon 6,994.31 107,255,400 2,846,220.47 2.7% 406.93 2,431,833.47 2.3% 347.69County Total 19,497.10 307,549,518 9,711,756.25 3.2% 498.11 6,643,746.36 2.2% 340.76
Skamania Co.Skamania 72.18 1,338,649 71,902.23 5.4% 996.15 25,007.62 1.9% 346.46Mount Pleasant 64.80 995,740 37,348.49 3.8% 576.37 16,502.78 1.7% 254.67Mill A 50.51 2,048,978 89,211.51 4.4% 1,766.21 21,645.54 1.1% 428.54Stevenson-Carson 895.29 13,507,206 575,770.11 4.3% 643.11 429,517.27 3.2% 479.75County Total 1,082.78 17,890,573 774,232.34 4.3% 715.04 492,673.21 2.8% 455.01
Snohomish Co.Everett 20,763.49 324,372,372 11,763,342.45 3.6% 566.54 7,221,875.50 2.2% 347.82Lake Stevens 9,442.90 131,076,053 6,536,276.11 5.0% 692.19 4,007,119.12 3.1% 424.35Mukilteo 16,086.85 261,130,186 8,262,112.29 3.2% 513.59 8,011,104.27 3.1% 497.99Edmonds 21,430.28 326,953,733 12,875,137.46 3.9% 600.79 7,131,465.27 2.2% 332.78Arlington 5,771.93 81,942,032 3,213,381.79 3.9% 556.73 1,110,611.01 1.4% 192.42Marysville 10,675.56 176,099,331 7,322,715.44 4.2% 685.93 4,581,962.72 2.6% 429.20Index 28.83 1,056,558 87,797.20 8.3% 3,045.34 8,811.51 0.8% 305.64Monroe 6,627.62 93,206,952 3,781,339.91 4.1% 570.54 2,425,008.07 2.6% 365.89Snohomish 9,916.70 147,125,340 5,078,155.29 3.5% 512.08 6,091,090.79 4.1% 614.23Lakewood 2,561.35 36,389,701 1,642,419.60 4.5% 641.23 1,091,004.41 3.0% 425.95Sultan 2,005.42 31,089,466 1,388,998.25 4.5% 692.62 507,163.41 1.6% 252.90Darrington 423.55 6,873,801 271,682.38 4.0% 641.44 196,106.40 2.9% 463.01Granite Falls 2,134.65 32,263,167 1,473,574.45 4.6% 690.31 561,107.90 1.7% 262.86Stanwood-Camano 4,854.80 69,845,118 3,038,019.62 4.3% 625.78 1,100,035.27 1.6% 226.59County Total 112,723.93 1,719,423,810 66,734,952.24 3.9% 592.02 44,044,465.65 2.6% 390.73
160
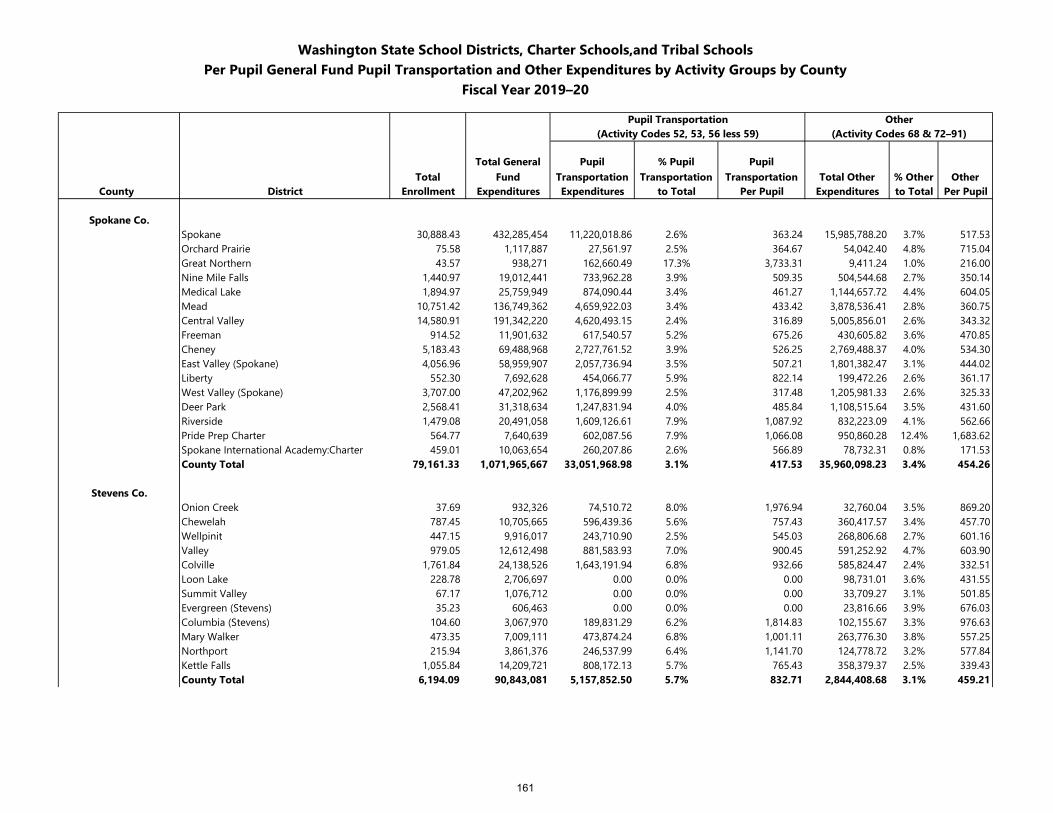
Washington State School Districts, Charter Schools,and Tribal SchoolsPer Pupil General Fund Pupil Transportation and Other Expenditures by Activity Groups by County
Fiscal Year 2019–20
Pupil Transportation Other(Activity Codes 52, 53, 56 less 59) (Activity Codes 68 & 72–91)
TotalTotal General
FundPupil
Transportation% Pupil
TransportationPupil
Transportation Total Other % Other OtherCounty District Enrollment Expenditures Expenditures to Total Per Pupil Expenditures to Total Per Pupil
Spokane Co.Spokane 30,888.43 432,285,454 11,220,018.86 2.6% 363.24 15,985,788.20 3.7% 517.53Orchard Prairie 75.58 1,117,887 27,561.97 2.5% 364.67 54,042.40 4.8% 715.04Great Northern 43.57 938,271 162,660.49 17.3% 3,733.31 9,411.24 1.0% 216.00Nine Mile Falls 1,440.97 19,012,441 733,962.28 3.9% 509.35 504,544.68 2.7% 350.14Medical Lake 1,894.97 25,759,949 874,090.44 3.4% 461.27 1,144,657.72 4.4% 604.05Mead 10,751.42 136,749,362 4,659,922.03 3.4% 433.42 3,878,536.41 2.8% 360.75Central Valley 14,580.91 191,342,220 4,620,493.15 2.4% 316.89 5,005,856.01 2.6% 343.32Freeman 914.52 11,901,632 617,540.57 5.2% 675.26 430,605.82 3.6% 470.85Cheney 5,183.43 69,488,968 2,727,761.52 3.9% 526.25 2,769,488.37 4.0% 534.30East Valley (Spokane) 4,056.96 58,959,907 2,057,736.94 3.5% 507.21 1,801,382.47 3.1% 444.02Liberty 552.30 7,692,628 454,066.77 5.9% 822.14 199,472.26 2.6% 361.17West Valley (Spokane) 3,707.00 47,202,962 1,176,899.99 2.5% 317.48 1,205,981.33 2.6% 325.33Deer Park 2,568.41 31,318,634 1,247,831.94 4.0% 485.84 1,108,515.64 3.5% 431.60Riverside 1,479.08 20,491,058 1,609,126.61 7.9% 1,087.92 832,223.09 4.1% 562.66Pride Prep Charter 564.77 7,640,639 602,087.56 7.9% 1,066.08 950,860.28 12.4% 1,683.62Spokane International Academy:Charter 459.01 10,063,654 260,207.86 2.6% 566.89 78,732.31 0.8% 171.53County Total 79,161.33 1,071,965,667 33,051,968.98 3.1% 417.53 35,960,098.23 3.4% 454.26
Stevens Co.Onion Creek 37.69 932,326 74,510.72 8.0% 1,976.94 32,760.04 3.5% 869.20Chewelah 787.45 10,705,665 596,439.36 5.6% 757.43 360,417.57 3.4% 457.70Wellpinit 447.15 9,916,017 243,710.90 2.5% 545.03 268,806.68 2.7% 601.16Valley 979.05 12,612,498 881,583.93 7.0% 900.45 591,252.92 4.7% 603.90Colville 1,761.84 24,138,526 1,643,191.94 6.8% 932.66 585,824.47 2.4% 332.51Loon Lake 228.78 2,706,697 0.00 0.0% 0.00 98,731.01 3.6% 431.55Summit Valley 67.17 1,076,712 0.00 0.0% 0.00 33,709.27 3.1% 501.85Evergreen (Stevens) 35.23 606,463 0.00 0.0% 0.00 23,816.66 3.9% 676.03Columbia (Stevens) 104.60 3,067,970 189,831.29 6.2% 1,814.83 102,155.67 3.3% 976.63Mary Walker 473.35 7,009,111 473,874.24 6.8% 1,001.11 263,776.30 3.8% 557.25Northport 215.94 3,861,376 246,537.99 6.4% 1,141.70 124,778.72 3.2% 577.84Kettle Falls 1,055.84 14,209,721 808,172.13 5.7% 765.43 358,379.37 2.5% 339.43County Total 6,194.09 90,843,081 5,157,852.50 5.7% 832.71 2,844,408.68 3.1% 459.21
161
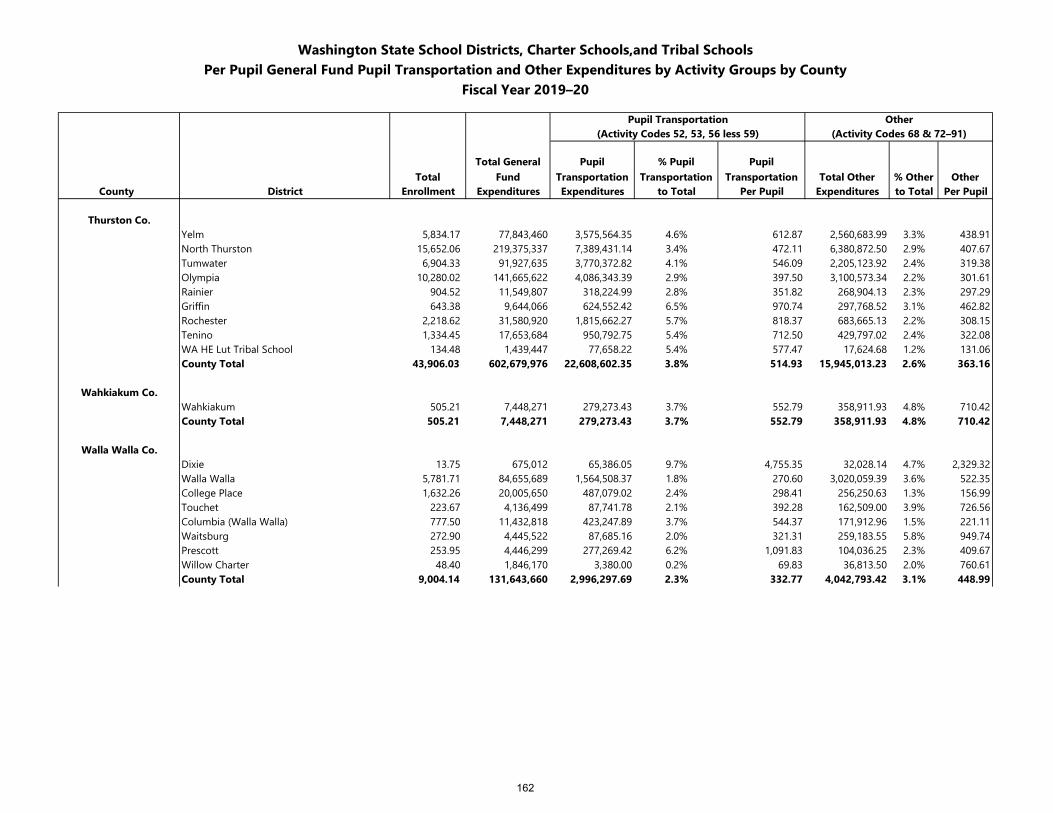
Washington State School Districts, Charter Schools,and Tribal SchoolsPer Pupil General Fund Pupil Transportation and Other Expenditures by Activity Groups by County
Fiscal Year 2019–20
Pupil Transportation Other(Activity Codes 52, 53, 56 less 59) (Activity Codes 68 & 72–91)
TotalTotal General
FundPupil
Transportation% Pupil
TransportationPupil
Transportation Total Other % Other OtherCounty District Enrollment Expenditures Expenditures to Total Per Pupil Expenditures to Total Per Pupil
Thurston Co.Yelm 5,834.17 77,843,460 3,575,564.35 4.6% 612.87 2,560,683.99 3.3% 438.91North Thurston 15,652.06 219,375,337 7,389,431.14 3.4% 472.11 6,380,872.50 2.9% 407.67Tumwater 6,904.33 91,927,635 3,770,372.82 4.1% 546.09 2,205,123.92 2.4% 319.38Olympia 10,280.02 141,665,622 4,086,343.39 2.9% 397.50 3,100,573.34 2.2% 301.61Rainier 904.52 11,549,807 318,224.99 2.8% 351.82 268,904.13 2.3% 297.29Griffin 643.38 9,644,066 624,552.42 6.5% 970.74 297,768.52 3.1% 462.82Rochester 2,218.62 31,580,920 1,815,662.27 5.7% 818.37 683,665.13 2.2% 308.15Tenino 1,334.45 17,653,684 950,792.75 5.4% 712.50 429,797.02 2.4% 322.08WA HE Lut Tribal School 134.48 1,439,447 77,658.22 5.4% 577.47 17,624.68 1.2% 131.06County Total 43,906.03 602,679,976 22,608,602.35 3.8% 514.93 15,945,013.23 2.6% 363.16
Wahkiakum Co.Wahkiakum 505.21 7,448,271 279,273.43 3.7% 552.79 358,911.93 4.8% 710.42County Total 505.21 7,448,271 279,273.43 3.7% 552.79 358,911.93 4.8% 710.42
Walla Walla Co.Dixie 13.75 675,012 65,386.05 9.7% 4,755.35 32,028.14 4.7% 2,329.32Walla Walla 5,781.71 84,655,689 1,564,508.37 1.8% 270.60 3,020,059.39 3.6% 522.35College Place 1,632.26 20,005,650 487,079.02 2.4% 298.41 256,250.63 1.3% 156.99Touchet 223.67 4,136,499 87,741.78 2.1% 392.28 162,509.00 3.9% 726.56Columbia (Walla Walla) 777.50 11,432,818 423,247.89 3.7% 544.37 171,912.96 1.5% 221.11Waitsburg 272.90 4,445,522 87,685.16 2.0% 321.31 259,183.55 5.8% 949.74Prescott 253.95 4,446,299 277,269.42 6.2% 1,091.83 104,036.25 2.3% 409.67Willow Charter 48.40 1,846,170 3,380.00 0.2% 69.83 36,813.50 2.0% 760.61County Total 9,004.14 131,643,660 2,996,297.69 2.3% 332.77 4,042,793.42 3.1% 448.99
162
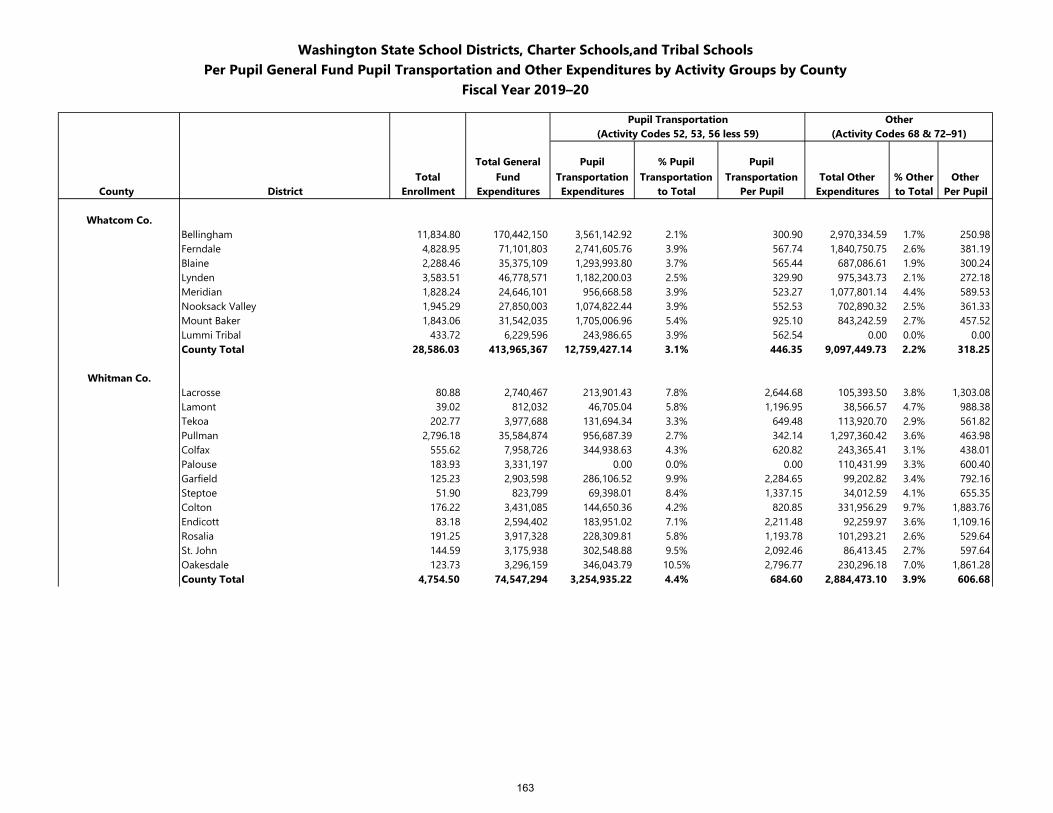
Washington State School Districts, Charter Schools,and Tribal SchoolsPer Pupil General Fund Pupil Transportation and Other Expenditures by Activity Groups by County
Fiscal Year 2019–20
Pupil Transportation Other(Activity Codes 52, 53, 56 less 59) (Activity Codes 68 & 72–91)
TotalTotal General
FundPupil
Transportation% Pupil
TransportationPupil
Transportation Total Other % Other OtherCounty District Enrollment Expenditures Expenditures to Total Per Pupil Expenditures to Total Per Pupil
Whatcom Co.Bellingham 11,834.80 170,442,150 3,561,142.92 2.1% 300.90 2,970,334.59 1.7% 250.98Ferndale 4,828.95 71,101,803 2,741,605.76 3.9% 567.74 1,840,750.75 2.6% 381.19Blaine 2,288.46 35,375,109 1,293,993.80 3.7% 565.44 687,086.61 1.9% 300.24Lynden 3,583.51 46,778,571 1,182,200.03 2.5% 329.90 975,343.73 2.1% 272.18Meridian 1,828.24 24,646,101 956,668.58 3.9% 523.27 1,077,801.14 4.4% 589.53Nooksack Valley 1,945.29 27,850,003 1,074,822.44 3.9% 552.53 702,890.32 2.5% 361.33Mount Baker 1,843.06 31,542,035 1,705,006.96 5.4% 925.10 843,242.59 2.7% 457.52Lummi Tribal 433.72 6,229,596 243,986.65 3.9% 562.54 0.00 0.0% 0.00County Total 28,586.03 413,965,367 12,759,427.14 3.1% 446.35 9,097,449.73 2.2% 318.25
Whitman Co.Lacrosse 80.88 2,740,467 213,901.43 7.8% 2,644.68 105,393.50 3.8% 1,303.08Lamont 39.02 812,032 46,705.04 5.8% 1,196.95 38,566.57 4.7% 988.38Tekoa 202.77 3,977,688 131,694.34 3.3% 649.48 113,920.70 2.9% 561.82Pullman 2,796.18 35,584,874 956,687.39 2.7% 342.14 1,297,360.42 3.6% 463.98Colfax 555.62 7,958,726 344,938.63 4.3% 620.82 243,365.41 3.1% 438.01Palouse 183.93 3,331,197 0.00 0.0% 0.00 110,431.99 3.3% 600.40Garfield 125.23 2,903,598 286,106.52 9.9% 2,284.65 99,202.82 3.4% 792.16Steptoe 51.90 823,799 69,398.01 8.4% 1,337.15 34,012.59 4.1% 655.35Colton 176.22 3,431,085 144,650.36 4.2% 820.85 331,956.29 9.7% 1,883.76Endicott 83.18 2,594,402 183,951.02 7.1% 2,211.48 92,259.97 3.6% 1,109.16Rosalia 191.25 3,917,328 228,309.81 5.8% 1,193.78 101,293.21 2.6% 529.64St. John 144.59 3,175,938 302,548.88 9.5% 2,092.46 86,413.45 2.7% 597.64Oakesdale 123.73 3,296,159 346,043.79 10.5% 2,796.77 230,296.18 7.0% 1,861.28County Total 4,754.50 74,547,294 3,254,935.22 4.4% 684.60 2,884,473.10 3.9% 606.68
163
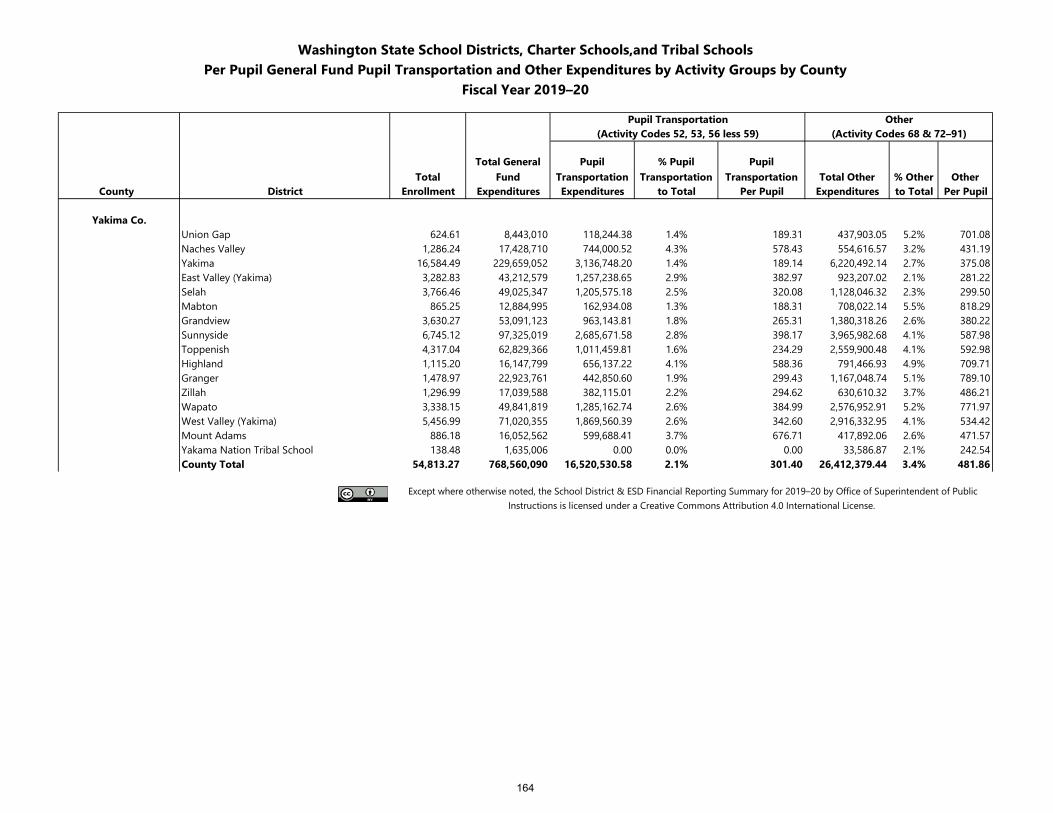
Washington State School Districts, Charter Schools,and Tribal SchoolsPer Pupil General Fund Pupil Transportation and Other Expenditures by Activity Groups by County
Fiscal Year 2019–20
Pupil Transportation Other(Activity Codes 52, 53, 56 less 59) (Activity Codes 68 & 72–91)
TotalTotal General
FundPupil
Transportation% Pupil
TransportationPupil
Transportation Total Other % Other OtherCounty District Enrollment Expenditures Expenditures to Total Per Pupil Expenditures to Total Per Pupil
Yakima Co.Union Gap 624.61 8,443,010 118,244.38 1.4% 189.31 437,903.05 5.2% 701.08Naches Valley 1,286.24 17,428,710 744,000.52 4.3% 578.43 554,616.57 3.2% 431.19Yakima 16,584.49 229,659,052 3,136,748.20 1.4% 189.14 6,220,492.14 2.7% 375.08East Valley (Yakima) 3,282.83 43,212,579 1,257,238.65 2.9% 382.97 923,207.02 2.1% 281.22Selah 3,766.46 49,025,347 1,205,575.18 2.5% 320.08 1,128,046.32 2.3% 299.50Mabton 865.25 12,884,995 162,934.08 1.3% 188.31 708,022.14 5.5% 818.29Grandview 3,630.27 53,091,123 963,143.81 1.8% 265.31 1,380,318.26 2.6% 380.22Sunnyside 6,745.12 97,325,019 2,685,671.58 2.8% 398.17 3,965,982.68 4.1% 587.98Toppenish 4,317.04 62,829,366 1,011,459.81 1.6% 234.29 2,559,900.48 4.1% 592.98Highland 1,115.20 16,147,799 656,137.22 4.1% 588.36 791,466.93 4.9% 709.71Granger 1,478.97 22,923,761 442,850.60 1.9% 299.43 1,167,048.74 5.1% 789.10Zillah 1,296.99 17,039,588 382,115.01 2.2% 294.62 630,610.32 3.7% 486.21Wapato 3,338.15 49,841,819 1,285,162.74 2.6% 384.99 2,576,952.91 5.2% 771.97West Valley (Yakima) 5,456.99 71,020,355 1,869,560.39 2.6% 342.60 2,916,332.95 4.1% 534.42Mount Adams 886.18 16,052,562 599,688.41 3.7% 676.71 417,892.06 2.6% 471.57Yakama Nation Tribal School 138.48 1,635,006 0.00 0.0% 0.00 33,586.87 2.1% 242.54County Total 54,813.27 768,560,090 16,520,530.58 2.1% 301.40 26,412,379.44 3.4% 481.86
Except where otherwise noted, the School District & ESD Financial Reporting Summary for 2019–20 by Office of Superintendent of Public Instructions is licensed under a Creative Commons Attribution 4.0 International License.
164
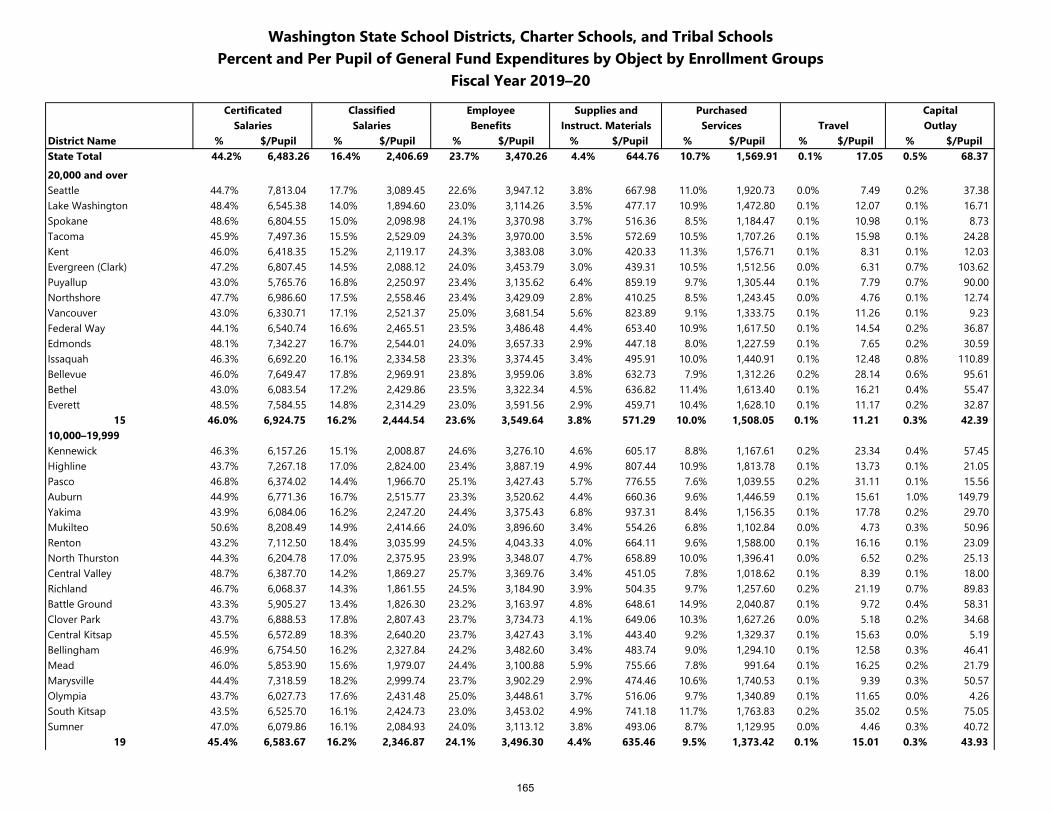
Washington State School Districts, Charter Schools, and Tribal SchoolsPercent and Per Pupil of General Fund Expenditures by Object by Enrollment Groups
Fiscal Year 2019–20
Certificated Classified Employee Supplies and Purchased CapitalSalaries Salaries Benefits Instruct. Materials Services Travel Outlay
District Name % $/Pupil % $/Pupil % $/Pupil % $/Pupil % $/Pupil % $/Pupil % $/PupilState Total 44.2% 6,483.26 16.4% 2,406.69 23.7% 3,470.26 4.4% 644.76 10.7% 1,569.91 0.1% 17.05 0.5% 68.37
20,000 and overSeattle 44.7% 7,813.04 17.7% 3,089.45 22.6% 3,947.12 3.8% 667.98 11.0% 1,920.73 0.0% 7.49 0.2% 37.38 Lake Washington 48.4% 6,545.38 14.0% 1,894.60 23.0% 3,114.26 3.5% 477.17 10.9% 1,472.80 0.1% 12.07 0.1% 16.71 Spokane 48.6% 6,804.55 15.0% 2,098.98 24.1% 3,370.98 3.7% 516.36 8.5% 1,184.47 0.1% 10.98 0.1% 8.73 Tacoma 45.9% 7,497.36 15.5% 2,529.09 24.3% 3,970.00 3.5% 572.69 10.5% 1,707.26 0.1% 15.98 0.1% 24.28 Kent 46.0% 6,418.35 15.2% 2,119.17 24.3% 3,383.08 3.0% 420.33 11.3% 1,576.71 0.1% 8.31 0.1% 12.03 Evergreen (Clark) 47.2% 6,807.45 14.5% 2,088.12 24.0% 3,453.79 3.0% 439.31 10.5% 1,512.56 0.0% 6.31 0.7% 103.62 Puyallup 43.0% 5,765.76 16.8% 2,250.97 23.4% 3,135.62 6.4% 859.19 9.7% 1,305.44 0.1% 7.79 0.7% 90.00 Northshore 47.7% 6,986.60 17.5% 2,558.46 23.4% 3,429.09 2.8% 410.25 8.5% 1,243.45 0.0% 4.76 0.1% 12.74 Vancouver 43.0% 6,330.71 17.1% 2,521.37 25.0% 3,681.54 5.6% 823.89 9.1% 1,333.75 0.1% 11.26 0.1% 9.23 Federal Way 44.1% 6,540.74 16.6% 2,465.51 23.5% 3,486.48 4.4% 653.40 10.9% 1,617.50 0.1% 14.54 0.2% 36.87 Edmonds 48.1% 7,342.27 16.7% 2,544.01 24.0% 3,657.33 2.9% 447.18 8.0% 1,227.59 0.1% 7.65 0.2% 30.59 Issaquah 46.3% 6,692.20 16.1% 2,334.58 23.3% 3,374.45 3.4% 495.91 10.0% 1,440.91 0.1% 12.48 0.8% 110.89 Bellevue 46.0% 7,649.47 17.8% 2,969.91 23.8% 3,959.06 3.8% 632.73 7.9% 1,312.26 0.2% 28.14 0.6% 95.61 Bethel 43.0% 6,083.54 17.2% 2,429.86 23.5% 3,322.34 4.5% 636.82 11.4% 1,613.40 0.1% 16.21 0.4% 55.47 Everett 48.5% 7,584.55 14.8% 2,314.29 23.0% 3,591.56 2.9% 459.71 10.4% 1,628.10 0.1% 11.17 0.2% 32.87
15 46.0% 6,924.75 16.2% 2,444.54 23.6% 3,549.64 3.8% 571.29 10.0% 1,508.05 0.1% 11.21 0.3% 42.39 10,000–19,999Kennewick 46.3% 6,157.26 15.1% 2,008.87 24.6% 3,276.10 4.6% 605.17 8.8% 1,167.61 0.2% 23.34 0.4% 57.45 Highline 43.7% 7,267.18 17.0% 2,824.00 23.4% 3,887.19 4.9% 807.44 10.9% 1,813.78 0.1% 13.73 0.1% 21.05 Pasco 46.8% 6,374.02 14.4% 1,966.70 25.1% 3,427.43 5.7% 776.55 7.6% 1,039.55 0.2% 31.11 0.1% 15.56 Auburn 44.9% 6,771.36 16.7% 2,515.77 23.3% 3,520.62 4.4% 660.36 9.6% 1,446.59 0.1% 15.61 1.0% 149.79 Yakima 43.9% 6,084.06 16.2% 2,247.20 24.4% 3,375.43 6.8% 937.31 8.4% 1,156.35 0.1% 17.78 0.2% 29.70 Mukilteo 50.6% 8,208.49 14.9% 2,414.66 24.0% 3,896.60 3.4% 554.26 6.8% 1,102.84 0.0% 4.73 0.3% 50.96 Renton 43.2% 7,112.50 18.4% 3,035.99 24.5% 4,043.33 4.0% 664.11 9.6% 1,588.00 0.1% 16.16 0.1% 23.09 North Thurston 44.3% 6,204.78 17.0% 2,375.95 23.9% 3,348.07 4.7% 658.89 10.0% 1,396.41 0.0% 6.52 0.2% 25.13 Central Valley 48.7% 6,387.70 14.2% 1,869.27 25.7% 3,369.76 3.4% 451.05 7.8% 1,018.62 0.1% 8.39 0.1% 18.00 Richland 46.7% 6,068.37 14.3% 1,861.55 24.5% 3,184.90 3.9% 504.35 9.7% 1,257.60 0.2% 21.19 0.7% 89.83 Battle Ground 43.3% 5,905.27 13.4% 1,826.30 23.2% 3,163.97 4.8% 648.61 14.9% 2,040.87 0.1% 9.72 0.4% 58.31 Clover Park 43.7% 6,888.53 17.8% 2,807.43 23.7% 3,734.73 4.1% 649.06 10.3% 1,627.26 0.0% 5.18 0.2% 34.68 Central Kitsap 45.5% 6,572.89 18.3% 2,640.20 23.7% 3,427.43 3.1% 443.40 9.2% 1,329.37 0.1% 15.63 0.0% 5.19 Bellingham 46.9% 6,754.50 16.2% 2,327.84 24.2% 3,482.60 3.4% 483.74 9.0% 1,294.10 0.1% 12.58 0.3% 46.41 Mead 46.0% 5,853.90 15.6% 1,979.07 24.4% 3,100.88 5.9% 755.66 7.8% 991.64 0.1% 16.25 0.2% 21.79 Marysville 44.4% 7,318.59 18.2% 2,999.74 23.7% 3,902.29 2.9% 474.46 10.6% 1,740.53 0.1% 9.39 0.3% 50.57 Olympia 43.7% 6,027.73 17.6% 2,431.48 25.0% 3,448.61 3.7% 516.06 9.7% 1,340.89 0.1% 11.65 0.0% 4.26 South Kitsap 43.5% 6,525.70 16.1% 2,424.73 23.0% 3,453.02 4.9% 741.18 11.7% 1,763.83 0.2% 35.02 0.5% 75.05 Sumner 47.0% 6,079.86 16.1% 2,084.93 24.0% 3,113.12 3.8% 493.06 8.7% 1,129.95 0.0% 4.46 0.3% 40.72
19 45.4% 6,583.67 16.2% 2,346.87 24.1% 3,496.30 4.4% 635.46 9.5% 1,373.42 0.1% 15.01 0.3% 43.93
165
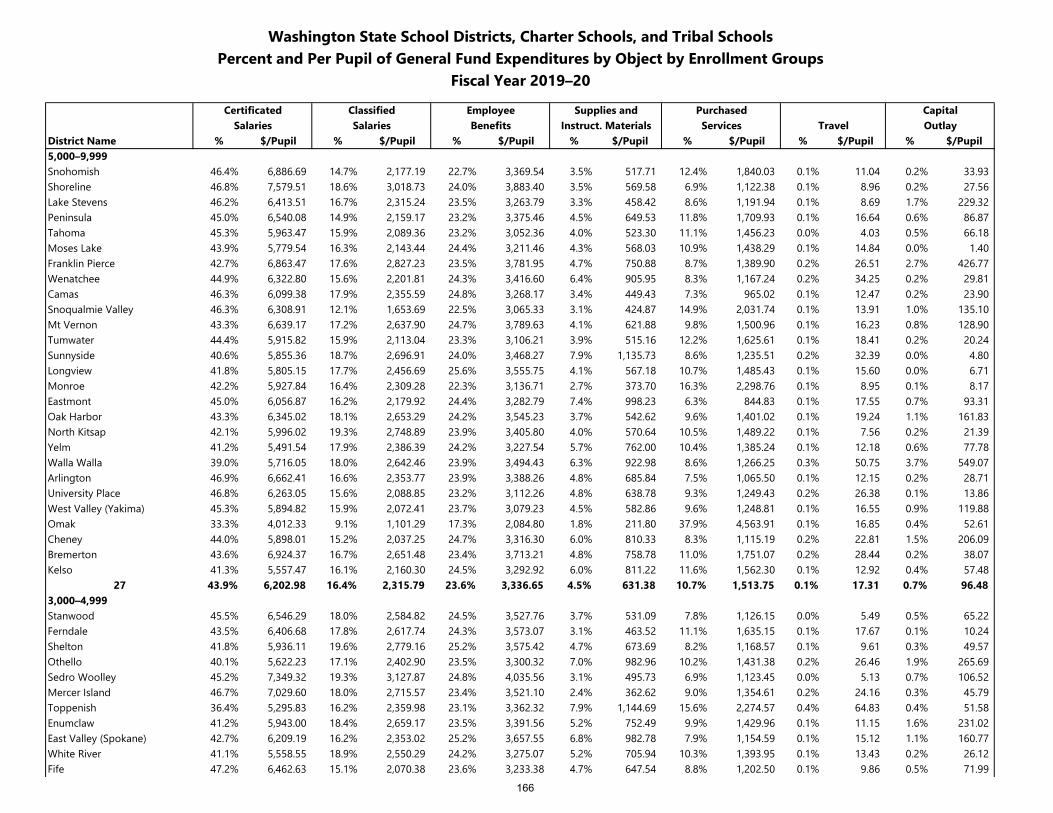
Washington State School Districts, Charter Schools, and Tribal SchoolsPercent and Per Pupil of General Fund Expenditures by Object by Enrollment Groups
Fiscal Year 2019–20
Certificated Classified Employee Supplies and Purchased CapitalSalaries Salaries Benefits Instruct. Materials Services Travel Outlay
District Name % $/Pupil % $/Pupil % $/Pupil % $/Pupil % $/Pupil % $/Pupil % $/Pupil5,000–9,999Snohomish 46.4% 6,886.69 14.7% 2,177.19 22.7% 3,369.54 3.5% 517.71 12.4% 1,840.03 0.1% 11.04 0.2% 33.93 Shoreline 46.8% 7,579.51 18.6% 3,018.73 24.0% 3,883.40 3.5% 569.58 6.9% 1,122.38 0.1% 8.96 0.2% 27.56 Lake Stevens 46.2% 6,413.51 16.7% 2,315.24 23.5% 3,263.79 3.3% 458.42 8.6% 1,191.94 0.1% 8.69 1.7% 229.32 Peninsula 45.0% 6,540.08 14.9% 2,159.17 23.2% 3,375.46 4.5% 649.53 11.8% 1,709.93 0.1% 16.64 0.6% 86.87 Tahoma 45.3% 5,963.47 15.9% 2,089.36 23.2% 3,052.36 4.0% 523.30 11.1% 1,456.23 0.0% 4.03 0.5% 66.18 Moses Lake 43.9% 5,779.54 16.3% 2,143.44 24.4% 3,211.46 4.3% 568.03 10.9% 1,438.29 0.1% 14.84 0.0% 1.40 Franklin Pierce 42.7% 6,863.47 17.6% 2,827.23 23.5% 3,781.95 4.7% 750.88 8.7% 1,389.90 0.2% 26.51 2.7% 426.77 Wenatchee 44.9% 6,322.80 15.6% 2,201.81 24.3% 3,416.60 6.4% 905.95 8.3% 1,167.24 0.2% 34.25 0.2% 29.81 Camas 46.3% 6,099.38 17.9% 2,355.59 24.8% 3,268.17 3.4% 449.43 7.3% 965.02 0.1% 12.47 0.2% 23.90 Snoqualmie Valley 46.3% 6,308.91 12.1% 1,653.69 22.5% 3,065.33 3.1% 424.87 14.9% 2,031.74 0.1% 13.91 1.0% 135.10 Mt Vernon 43.3% 6,639.17 17.2% 2,637.90 24.7% 3,789.63 4.1% 621.88 9.8% 1,500.96 0.1% 16.23 0.8% 128.90 Tumwater 44.4% 5,915.82 15.9% 2,113.04 23.3% 3,106.21 3.9% 515.16 12.2% 1,625.61 0.1% 18.41 0.2% 20.24 Sunnyside 40.6% 5,855.36 18.7% 2,696.91 24.0% 3,468.27 7.9% 1,135.73 8.6% 1,235.51 0.2% 32.39 0.0% 4.80 Longview 41.8% 5,805.15 17.7% 2,456.69 25.6% 3,555.75 4.1% 567.18 10.7% 1,485.43 0.1% 15.60 0.0% 6.71 Monroe 42.2% 5,927.84 16.4% 2,309.28 22.3% 3,136.71 2.7% 373.70 16.3% 2,298.76 0.1% 8.95 0.1% 8.17 Eastmont 45.0% 6,056.87 16.2% 2,179.92 24.4% 3,282.79 7.4% 998.23 6.3% 844.83 0.1% 17.55 0.7% 93.31 Oak Harbor 43.3% 6,345.02 18.1% 2,653.29 24.2% 3,545.23 3.7% 542.62 9.6% 1,401.02 0.1% 19.24 1.1% 161.83 North Kitsap 42.1% 5,996.02 19.3% 2,748.89 23.9% 3,405.80 4.0% 570.64 10.5% 1,489.22 0.1% 7.56 0.2% 21.39 Yelm 41.2% 5,491.54 17.9% 2,386.39 24.2% 3,227.54 5.7% 762.00 10.4% 1,385.24 0.1% 12.18 0.6% 77.78 Walla Walla 39.0% 5,716.05 18.0% 2,642.46 23.9% 3,494.43 6.3% 922.98 8.6% 1,266.25 0.3% 50.75 3.7% 549.07 Arlington 46.9% 6,662.41 16.6% 2,353.77 23.9% 3,388.26 4.8% 685.84 7.5% 1,065.50 0.1% 12.15 0.2% 28.71 University Place 46.8% 6,263.05 15.6% 2,088.85 23.2% 3,112.26 4.8% 638.78 9.3% 1,249.43 0.2% 26.38 0.1% 13.86 West Valley (Yakima) 45.3% 5,894.82 15.9% 2,072.41 23.7% 3,079.23 4.5% 582.86 9.6% 1,248.81 0.1% 16.55 0.9% 119.88 Omak 33.3% 4,012.33 9.1% 1,101.29 17.3% 2,084.80 1.8% 211.80 37.9% 4,563.91 0.1% 16.85 0.4% 52.61 Cheney 44.0% 5,898.01 15.2% 2,037.25 24.7% 3,316.30 6.0% 810.33 8.3% 1,115.19 0.2% 22.81 1.5% 206.09 Bremerton 43.6% 6,924.37 16.7% 2,651.48 23.4% 3,713.21 4.8% 758.78 11.0% 1,751.07 0.2% 28.44 0.2% 38.07 Kelso 41.3% 5,557.47 16.1% 2,160.30 24.5% 3,292.92 6.0% 811.22 11.6% 1,562.30 0.1% 12.92 0.4% 57.48
27 43.9% 6,202.98 16.4% 2,315.79 23.6% 3,336.65 4.5% 631.38 10.7% 1,513.75 0.1% 17.31 0.7% 96.48 3,000–4,999Stanwood 45.5% 6,546.29 18.0% 2,584.82 24.5% 3,527.76 3.7% 531.09 7.8% 1,126.15 0.0% 5.49 0.5% 65.22 Ferndale 43.5% 6,406.68 17.8% 2,617.74 24.3% 3,573.07 3.1% 463.52 11.1% 1,635.15 0.1% 17.67 0.1% 10.24 Shelton 41.8% 5,936.11 19.6% 2,779.16 25.2% 3,575.42 4.7% 673.69 8.2% 1,168.57 0.1% 9.61 0.3% 49.57 Othello 40.1% 5,622.23 17.1% 2,402.90 23.5% 3,300.32 7.0% 982.96 10.2% 1,431.38 0.2% 26.46 1.9% 265.69 Sedro Woolley 45.2% 7,349.32 19.3% 3,127.87 24.8% 4,035.56 3.1% 495.73 6.9% 1,123.45 0.0% 5.13 0.7% 106.52 Mercer Island 46.7% 7,029.60 18.0% 2,715.57 23.4% 3,521.10 2.4% 362.62 9.0% 1,354.61 0.2% 24.16 0.3% 45.79 Toppenish 36.4% 5,295.83 16.2% 2,359.98 23.1% 3,362.32 7.9% 1,144.69 15.6% 2,274.57 0.4% 64.83 0.4% 51.58 Enumclaw 41.2% 5,943.00 18.4% 2,659.17 23.5% 3,391.56 5.2% 752.49 9.9% 1,429.96 0.1% 11.15 1.6% 231.02 East Valley (Spokane) 42.7% 6,209.19 16.2% 2,353.02 25.2% 3,657.55 6.8% 982.78 7.9% 1,154.59 0.1% 15.12 1.1% 160.77 White River 41.1% 5,558.55 18.9% 2,550.29 24.2% 3,275.07 5.2% 705.94 10.3% 1,393.95 0.1% 13.43 0.2% 26.12 Fife 47.2% 6,462.63 15.1% 2,070.38 23.6% 3,233.38 4.7% 647.54 8.8% 1,202.50 0.1% 9.86 0.5% 71.99
166
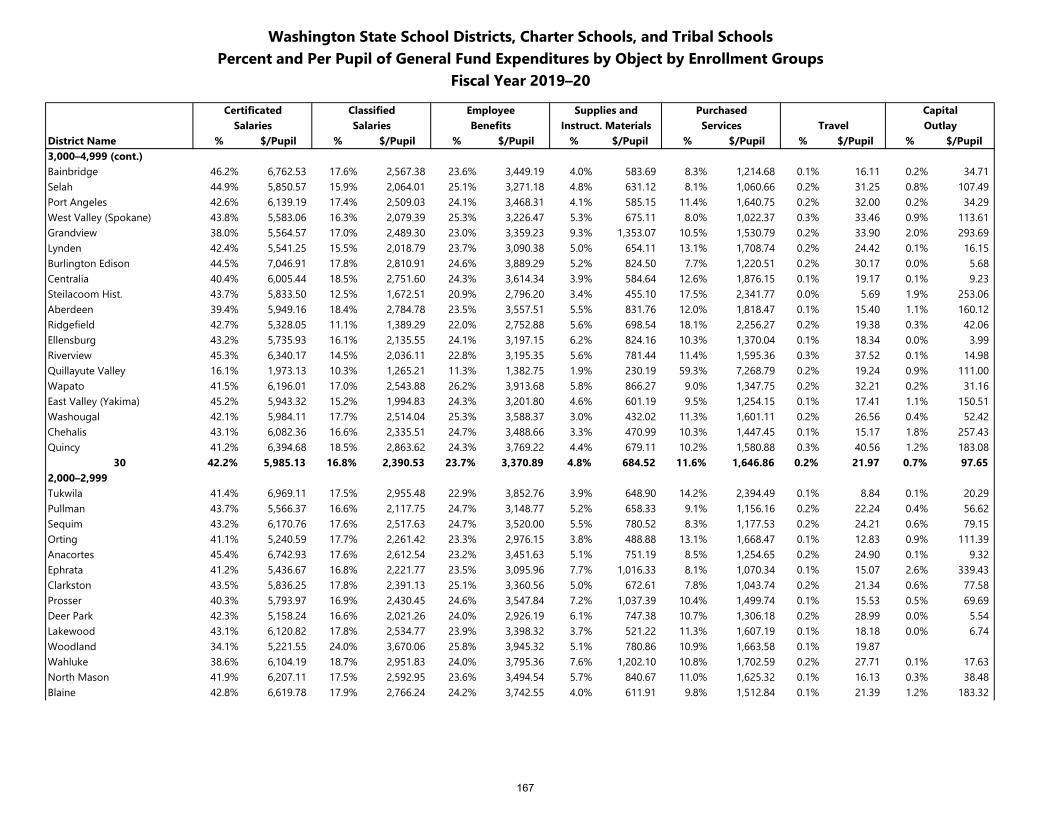
Washington State School Districts, Charter Schools, and Tribal SchoolsPercent and Per Pupil of General Fund Expenditures by Object by Enrollment Groups
Fiscal Year 2019–20
Certificated Classified Employee Supplies and Purchased CapitalSalaries Salaries Benefits Instruct. Materials Services Travel Outlay
District Name % $/Pupil % $/Pupil % $/Pupil % $/Pupil % $/Pupil % $/Pupil % $/Pupil3,000–4,999 (cont.)Bainbridge 46.2% 6,762.53 17.6% 2,567.38 23.6% 3,449.19 4.0% 583.69 8.3% 1,214.68 0.1% 16.11 0.2% 34.71 Selah 44.9% 5,850.57 15.9% 2,064.01 25.1% 3,271.18 4.8% 631.12 8.1% 1,060.66 0.2% 31.25 0.8% 107.49 Port Angeles 42.6% 6,139.19 17.4% 2,509.03 24.1% 3,468.31 4.1% 585.15 11.4% 1,640.75 0.2% 32.00 0.2% 34.29 West Valley (Spokane) 43.8% 5,583.06 16.3% 2,079.39 25.3% 3,226.47 5.3% 675.11 8.0% 1,022.37 0.3% 33.46 0.9% 113.61 Grandview 38.0% 5,564.57 17.0% 2,489.30 23.0% 3,359.23 9.3% 1,353.07 10.5% 1,530.79 0.2% 33.90 2.0% 293.69 Lynden 42.4% 5,541.25 15.5% 2,018.79 23.7% 3,090.38 5.0% 654.11 13.1% 1,708.74 0.2% 24.42 0.1% 16.15 Burlington Edison 44.5% 7,046.91 17.8% 2,810.91 24.6% 3,889.29 5.2% 824.50 7.7% 1,220.51 0.2% 30.17 0.0% 5.68 Centralia 40.4% 6,005.44 18.5% 2,751.60 24.3% 3,614.34 3.9% 584.64 12.6% 1,876.15 0.1% 19.17 0.1% 9.23 Steilacoom Hist. 43.7% 5,833.50 12.5% 1,672.51 20.9% 2,796.20 3.4% 455.10 17.5% 2,341.77 0.0% 5.69 1.9% 253.06 Aberdeen 39.4% 5,949.16 18.4% 2,784.78 23.5% 3,557.51 5.5% 831.76 12.0% 1,818.47 0.1% 15.40 1.1% 160.12 Ridgefield 42.7% 5,328.05 11.1% 1,389.29 22.0% 2,752.88 5.6% 698.54 18.1% 2,256.27 0.2% 19.38 0.3% 42.06 Ellensburg 43.2% 5,735.93 16.1% 2,135.55 24.1% 3,197.15 6.2% 824.16 10.3% 1,370.04 0.1% 18.34 0.0% 3.99 Riverview 45.3% 6,340.17 14.5% 2,036.11 22.8% 3,195.35 5.6% 781.44 11.4% 1,595.36 0.3% 37.52 0.1% 14.98 Quillayute Valley 16.1% 1,973.13 10.3% 1,265.21 11.3% 1,382.75 1.9% 230.19 59.3% 7,268.79 0.2% 19.24 0.9% 111.00 Wapato 41.5% 6,196.01 17.0% 2,543.88 26.2% 3,913.68 5.8% 866.27 9.0% 1,347.75 0.2% 32.21 0.2% 31.16 East Valley (Yakima) 45.2% 5,943.32 15.2% 1,994.83 24.3% 3,201.80 4.6% 601.19 9.5% 1,254.15 0.1% 17.41 1.1% 150.51 Washougal 42.1% 5,984.11 17.7% 2,514.04 25.3% 3,588.37 3.0% 432.02 11.3% 1,601.11 0.2% 26.56 0.4% 52.42 Chehalis 43.1% 6,082.36 16.6% 2,335.51 24.7% 3,488.66 3.3% 470.99 10.3% 1,447.45 0.1% 15.17 1.8% 257.43 Quincy 41.2% 6,394.68 18.5% 2,863.62 24.3% 3,769.22 4.4% 679.11 10.2% 1,580.88 0.3% 40.56 1.2% 183.08
30 42.2% 5,985.13 16.8% 2,390.53 23.7% 3,370.89 4.8% 684.52 11.6% 1,646.86 0.2% 21.97 0.7% 97.65 2,000–2,999Tukwila 41.4% 6,969.11 17.5% 2,955.48 22.9% 3,852.76 3.9% 648.90 14.2% 2,394.49 0.1% 8.84 0.1% 20.29 Pullman 43.7% 5,566.37 16.6% 2,117.75 24.7% 3,148.77 5.2% 658.33 9.1% 1,156.16 0.2% 22.24 0.4% 56.62 Sequim 43.2% 6,170.76 17.6% 2,517.63 24.7% 3,520.00 5.5% 780.52 8.3% 1,177.53 0.2% 24.21 0.6% 79.15 Orting 41.1% 5,240.59 17.7% 2,261.42 23.3% 2,976.15 3.8% 488.88 13.1% 1,668.47 0.1% 12.83 0.9% 111.39 Anacortes 45.4% 6,742.93 17.6% 2,612.54 23.2% 3,451.63 5.1% 751.19 8.5% 1,254.65 0.2% 24.90 0.1% 9.32 Ephrata 41.2% 5,436.67 16.8% 2,221.77 23.5% 3,095.96 7.7% 1,016.33 8.1% 1,070.34 0.1% 15.07 2.6% 339.43 Clarkston 43.5% 5,836.25 17.8% 2,391.13 25.1% 3,360.56 5.0% 672.61 7.8% 1,043.74 0.2% 21.34 0.6% 77.58 Prosser 40.3% 5,793.97 16.9% 2,430.45 24.6% 3,547.84 7.2% 1,037.39 10.4% 1,499.74 0.1% 15.53 0.5% 69.69 Deer Park 42.3% 5,158.24 16.6% 2,021.26 24.0% 2,926.19 6.1% 747.38 10.7% 1,306.18 0.2% 28.99 0.0% 5.54 Lakewood 43.1% 6,120.82 17.8% 2,534.77 23.9% 3,398.32 3.7% 521.22 11.3% 1,607.19 0.1% 18.18 0.0% 6.74 Woodland 34.1% 5,221.55 24.0% 3,670.06 25.8% 3,945.32 5.1% 780.86 10.9% 1,663.58 0.1% 19.87 Wahluke 38.6% 6,104.19 18.7% 2,951.83 24.0% 3,795.36 7.6% 1,202.10 10.8% 1,702.59 0.2% 27.71 0.1% 17.63 North Mason 41.9% 6,207.11 17.5% 2,592.95 23.6% 3,494.54 5.7% 840.67 11.0% 1,625.32 0.1% 16.13 0.3% 38.48 Blaine 42.8% 6,619.78 17.9% 2,766.24 24.2% 3,742.55 4.0% 611.91 9.8% 1,512.84 0.1% 21.39 1.2% 183.32
167
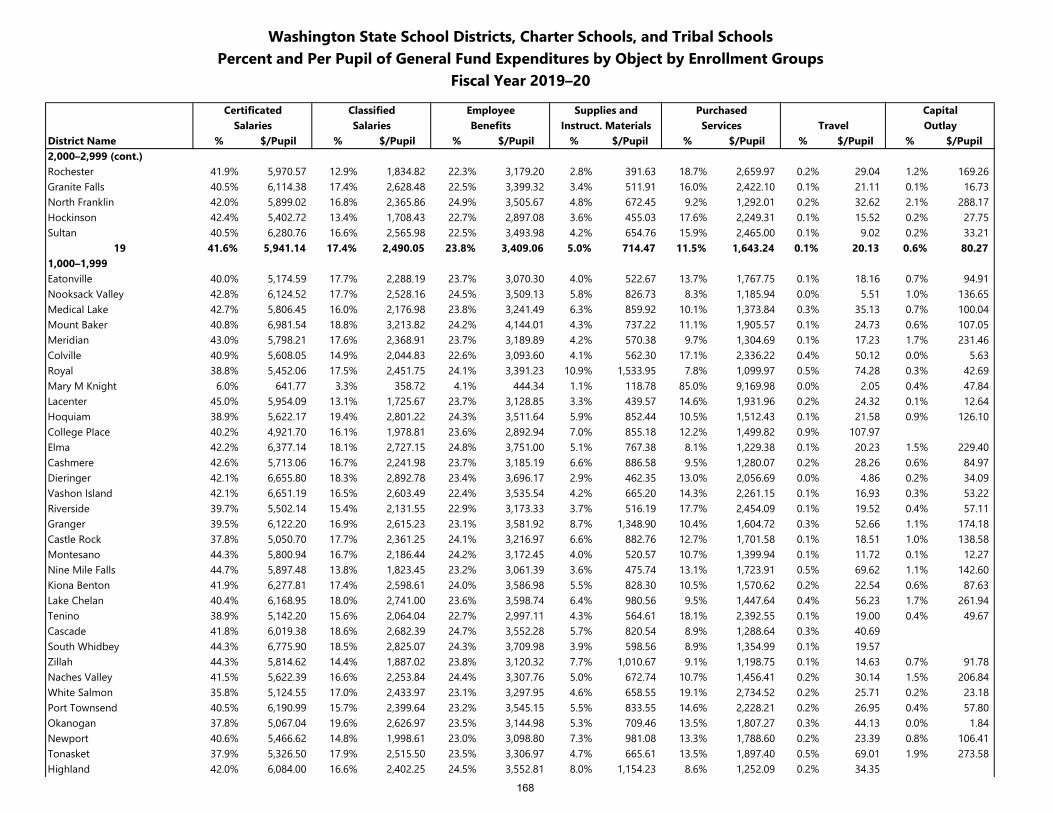
Washington State School Districts, Charter Schools, and Tribal SchoolsPercent and Per Pupil of General Fund Expenditures by Object by Enrollment Groups
Fiscal Year 2019–20
Certificated Classified Employee Supplies and Purchased CapitalSalaries Salaries Benefits Instruct. Materials Services Travel Outlay
District Name % $/Pupil % $/Pupil % $/Pupil % $/Pupil % $/Pupil % $/Pupil % $/Pupil2,000–2,999 (cont.)Rochester 41.9% 5,970.57 12.9% 1,834.82 22.3% 3,179.20 2.8% 391.63 18.7% 2,659.97 0.2% 29.04 1.2% 169.26 Granite Falls 40.5% 6,114.38 17.4% 2,628.48 22.5% 3,399.32 3.4% 511.91 16.0% 2,422.10 0.1% 21.11 0.1% 16.73 North Franklin 42.0% 5,899.02 16.8% 2,365.86 24.9% 3,505.67 4.8% 672.45 9.2% 1,292.01 0.2% 32.62 2.1% 288.17 Hockinson 42.4% 5,402.72 13.4% 1,708.43 22.7% 2,897.08 3.6% 455.03 17.6% 2,249.31 0.1% 15.52 0.2% 27.75 Sultan 40.5% 6,280.76 16.6% 2,565.98 22.5% 3,493.98 4.2% 654.76 15.9% 2,465.00 0.1% 9.02 0.2% 33.21
19 41.6% 5,941.14 17.4% 2,490.05 23.8% 3,409.06 5.0% 714.47 11.5% 1,643.24 0.1% 20.13 0.6% 80.27 1,000–1,999Eatonville 40.0% 5,174.59 17.7% 2,288.19 23.7% 3,070.30 4.0% 522.67 13.7% 1,767.75 0.1% 18.16 0.7% 94.91 Nooksack Valley 42.8% 6,124.52 17.7% 2,528.16 24.5% 3,509.13 5.8% 826.73 8.3% 1,185.94 0.0% 5.51 1.0% 136.65 Medical Lake 42.7% 5,806.45 16.0% 2,176.98 23.8% 3,241.49 6.3% 859.92 10.1% 1,373.84 0.3% 35.13 0.7% 100.04 Mount Baker 40.8% 6,981.54 18.8% 3,213.82 24.2% 4,144.01 4.3% 737.22 11.1% 1,905.57 0.1% 24.73 0.6% 107.05 Meridian 43.0% 5,798.21 17.6% 2,368.91 23.7% 3,189.89 4.2% 570.38 9.7% 1,304.69 0.1% 17.23 1.7% 231.46 Colville 40.9% 5,608.05 14.9% 2,044.83 22.6% 3,093.60 4.1% 562.30 17.1% 2,336.22 0.4% 50.12 0.0% 5.63 Royal 38.8% 5,452.06 17.5% 2,451.75 24.1% 3,391.23 10.9% 1,533.95 7.8% 1,099.97 0.5% 74.28 0.3% 42.69 Mary M Knight 6.0% 641.77 3.3% 358.72 4.1% 444.34 1.1% 118.78 85.0% 9,169.98 0.0% 2.05 0.4% 47.84 Lacenter 45.0% 5,954.09 13.1% 1,725.67 23.7% 3,128.85 3.3% 439.57 14.6% 1,931.96 0.2% 24.32 0.1% 12.64 Hoquiam 38.9% 5,622.17 19.4% 2,801.22 24.3% 3,511.64 5.9% 852.44 10.5% 1,512.43 0.1% 21.58 0.9% 126.10 College Place 40.2% 4,921.70 16.1% 1,978.81 23.6% 2,892.94 7.0% 855.18 12.2% 1,499.82 0.9% 107.97 Elma 42.2% 6,377.14 18.1% 2,727.15 24.8% 3,751.00 5.1% 767.38 8.1% 1,229.38 0.1% 20.23 1.5% 229.40 Cashmere 42.6% 5,713.06 16.7% 2,241.98 23.7% 3,185.19 6.6% 886.58 9.5% 1,280.07 0.2% 28.26 0.6% 84.97 Dieringer 42.1% 6,655.80 18.3% 2,892.78 23.4% 3,696.17 2.9% 462.35 13.0% 2,056.69 0.0% 4.86 0.2% 34.09 Vashon Island 42.1% 6,651.19 16.5% 2,603.49 22.4% 3,535.54 4.2% 665.20 14.3% 2,261.15 0.1% 16.93 0.3% 53.22 Riverside 39.7% 5,502.14 15.4% 2,131.55 22.9% 3,173.33 3.7% 516.19 17.7% 2,454.09 0.1% 19.52 0.4% 57.11 Granger 39.5% 6,122.20 16.9% 2,615.23 23.1% 3,581.92 8.7% 1,348.90 10.4% 1,604.72 0.3% 52.66 1.1% 174.18 Castle Rock 37.8% 5,050.70 17.7% 2,361.25 24.1% 3,216.97 6.6% 882.76 12.7% 1,701.58 0.1% 18.51 1.0% 138.58 Montesano 44.3% 5,800.94 16.7% 2,186.44 24.2% 3,172.45 4.0% 520.57 10.7% 1,399.94 0.1% 11.72 0.1% 12.27 Nine Mile Falls 44.7% 5,897.48 13.8% 1,823.45 23.2% 3,061.39 3.6% 475.74 13.1% 1,723.91 0.5% 69.62 1.1% 142.60 Kiona Benton 41.9% 6,277.81 17.4% 2,598.61 24.0% 3,586.98 5.5% 828.30 10.5% 1,570.62 0.2% 22.54 0.6% 87.63 Lake Chelan 40.4% 6,168.95 18.0% 2,741.00 23.6% 3,598.74 6.4% 980.56 9.5% 1,447.64 0.4% 56.23 1.7% 261.94 Tenino 38.9% 5,142.20 15.6% 2,064.04 22.7% 2,997.11 4.3% 564.61 18.1% 2,392.55 0.1% 19.00 0.4% 49.67 Cascade 41.8% 6,019.38 18.6% 2,682.39 24.7% 3,552.28 5.7% 820.54 8.9% 1,288.64 0.3% 40.69 South Whidbey 44.3% 6,775.90 18.5% 2,825.07 24.3% 3,709.98 3.9% 598.56 8.9% 1,354.99 0.1% 19.57 Zillah 44.3% 5,814.62 14.4% 1,887.02 23.8% 3,120.32 7.7% 1,010.67 9.1% 1,198.75 0.1% 14.63 0.7% 91.78 Naches Valley 41.5% 5,622.39 16.6% 2,253.84 24.4% 3,307.76 5.0% 672.74 10.7% 1,456.41 0.2% 30.14 1.5% 206.84 White Salmon 35.8% 5,124.55 17.0% 2,433.97 23.1% 3,297.95 4.6% 658.55 19.1% 2,734.52 0.2% 25.71 0.2% 23.18 Port Townsend 40.5% 6,190.99 15.7% 2,399.64 23.2% 3,545.15 5.5% 833.55 14.6% 2,228.21 0.2% 26.95 0.4% 57.80 Okanogan 37.8% 5,067.04 19.6% 2,626.97 23.5% 3,144.98 5.3% 709.46 13.5% 1,807.27 0.3% 44.13 0.0% 1.84 Newport 40.6% 5,466.62 14.8% 1,998.61 23.0% 3,098.80 7.3% 981.08 13.3% 1,788.60 0.2% 23.39 0.8% 106.41 Tonasket 37.9% 5,326.50 17.9% 2,515.50 23.5% 3,306.97 4.7% 665.61 13.5% 1,897.40 0.5% 69.01 1.9% 273.58 Highland 42.0% 6,084.00 16.6% 2,402.25 24.5% 3,552.81 8.0% 1,154.23 8.6% 1,252.09 0.2% 34.35
168
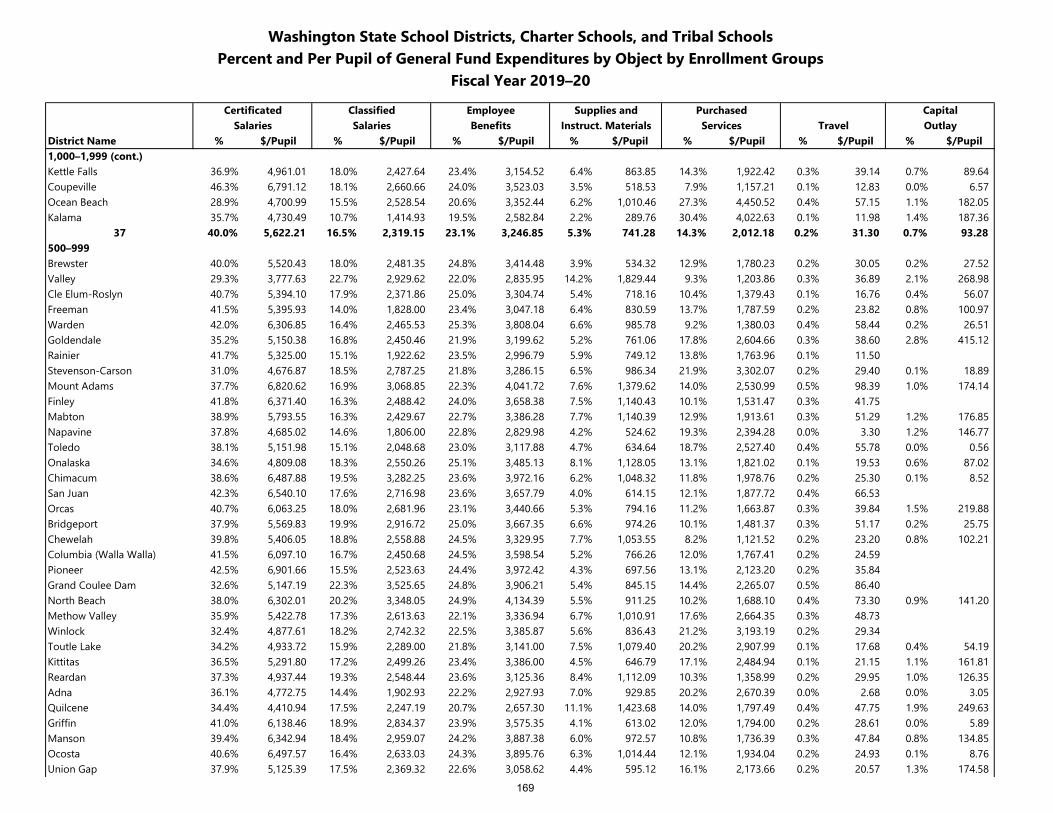
Washington State School Districts, Charter Schools, and Tribal SchoolsPercent and Per Pupil of General Fund Expenditures by Object by Enrollment Groups
Fiscal Year 2019–20
Certificated Classified Employee Supplies and Purchased CapitalSalaries Salaries Benefits Instruct. Materials Services Travel Outlay
District Name % $/Pupil % $/Pupil % $/Pupil % $/Pupil % $/Pupil % $/Pupil % $/Pupil1,000–1,999 (cont.)Kettle Falls 36.9% 4,961.01 18.0% 2,427.64 23.4% 3,154.52 6.4% 863.85 14.3% 1,922.42 0.3% 39.14 0.7% 89.64 Coupeville 46.3% 6,791.12 18.1% 2,660.66 24.0% 3,523.03 3.5% 518.53 7.9% 1,157.21 0.1% 12.83 0.0% 6.57 Ocean Beach 28.9% 4,700.99 15.5% 2,528.54 20.6% 3,352.44 6.2% 1,010.46 27.3% 4,450.52 0.4% 57.15 1.1% 182.05 Kalama 35.7% 4,730.49 10.7% 1,414.93 19.5% 2,582.84 2.2% 289.76 30.4% 4,022.63 0.1% 11.98 1.4% 187.36
37 40.0% 5,622.21 16.5% 2,319.15 23.1% 3,246.85 5.3% 741.28 14.3% 2,012.18 0.2% 31.30 0.7% 93.28 500–999Brewster 40.0% 5,520.43 18.0% 2,481.35 24.8% 3,414.48 3.9% 534.32 12.9% 1,780.23 0.2% 30.05 0.2% 27.52 Valley 29.3% 3,777.63 22.7% 2,929.62 22.0% 2,835.95 14.2% 1,829.44 9.3% 1,203.86 0.3% 36.89 2.1% 268.98 Cle Elum-Roslyn 40.7% 5,394.10 17.9% 2,371.86 25.0% 3,304.74 5.4% 718.16 10.4% 1,379.43 0.1% 16.76 0.4% 56.07 Freeman 41.5% 5,395.93 14.0% 1,828.00 23.4% 3,047.18 6.4% 830.59 13.7% 1,787.59 0.2% 23.82 0.8% 100.97 Warden 42.0% 6,306.85 16.4% 2,465.53 25.3% 3,808.04 6.6% 985.78 9.2% 1,380.03 0.4% 58.44 0.2% 26.51 Goldendale 35.2% 5,150.38 16.8% 2,450.46 21.9% 3,199.62 5.2% 761.06 17.8% 2,604.66 0.3% 38.60 2.8% 415.12 Rainier 41.7% 5,325.00 15.1% 1,922.62 23.5% 2,996.79 5.9% 749.12 13.8% 1,763.96 0.1% 11.50 Stevenson-Carson 31.0% 4,676.87 18.5% 2,787.25 21.8% 3,286.15 6.5% 986.34 21.9% 3,302.07 0.2% 29.40 0.1% 18.89 Mount Adams 37.7% 6,820.62 16.9% 3,068.85 22.3% 4,041.72 7.6% 1,379.62 14.0% 2,530.99 0.5% 98.39 1.0% 174.14 Finley 41.8% 6,371.40 16.3% 2,488.42 24.0% 3,658.38 7.5% 1,140.43 10.1% 1,531.47 0.3% 41.75 Mabton 38.9% 5,793.55 16.3% 2,429.67 22.7% 3,386.28 7.7% 1,140.39 12.9% 1,913.61 0.3% 51.29 1.2% 176.85 Napavine 37.8% 4,685.02 14.6% 1,806.00 22.8% 2,829.98 4.2% 524.62 19.3% 2,394.28 0.0% 3.30 1.2% 146.77 Toledo 38.1% 5,151.98 15.1% 2,048.68 23.0% 3,117.88 4.7% 634.64 18.7% 2,527.40 0.4% 55.78 0.0% 0.56 Onalaska 34.6% 4,809.08 18.3% 2,550.26 25.1% 3,485.13 8.1% 1,128.05 13.1% 1,821.02 0.1% 19.53 0.6% 87.02 Chimacum 38.6% 6,487.88 19.5% 3,282.25 23.6% 3,972.16 6.2% 1,048.32 11.8% 1,978.76 0.2% 25.30 0.1% 8.52 San Juan 42.3% 6,540.10 17.6% 2,716.98 23.6% 3,657.79 4.0% 614.15 12.1% 1,877.72 0.4% 66.53 Orcas 40.7% 6,063.25 18.0% 2,681.96 23.1% 3,440.66 5.3% 794.16 11.2% 1,663.87 0.3% 39.84 1.5% 219.88 Bridgeport 37.9% 5,569.83 19.9% 2,916.72 25.0% 3,667.35 6.6% 974.26 10.1% 1,481.37 0.3% 51.17 0.2% 25.75 Chewelah 39.8% 5,406.05 18.8% 2,558.88 24.5% 3,329.95 7.7% 1,053.55 8.2% 1,121.52 0.2% 23.20 0.8% 102.21 Columbia (Walla Walla) 41.5% 6,097.10 16.7% 2,450.68 24.5% 3,598.54 5.2% 766.26 12.0% 1,767.41 0.2% 24.59 Pioneer 42.5% 6,901.66 15.5% 2,523.63 24.4% 3,972.42 4.3% 697.56 13.1% 2,123.20 0.2% 35.84 Grand Coulee Dam 32.6% 5,147.19 22.3% 3,525.65 24.8% 3,906.21 5.4% 845.15 14.4% 2,265.07 0.5% 86.40 North Beach 38.0% 6,302.01 20.2% 3,348.05 24.9% 4,134.39 5.5% 911.25 10.2% 1,688.10 0.4% 73.30 0.9% 141.20 Methow Valley 35.9% 5,422.78 17.3% 2,613.63 22.1% 3,336.94 6.7% 1,010.91 17.6% 2,664.35 0.3% 48.73 Winlock 32.4% 4,877.61 18.2% 2,742.32 22.5% 3,385.87 5.6% 836.43 21.2% 3,193.19 0.2% 29.34 Toutle Lake 34.2% 4,933.72 15.9% 2,289.00 21.8% 3,141.00 7.5% 1,079.40 20.2% 2,907.99 0.1% 17.68 0.4% 54.19 Kittitas 36.5% 5,291.80 17.2% 2,499.26 23.4% 3,386.00 4.5% 646.79 17.1% 2,484.94 0.1% 21.15 1.1% 161.81 Reardan 37.3% 4,937.44 19.3% 2,548.44 23.6% 3,125.36 8.4% 1,112.09 10.3% 1,358.99 0.2% 29.95 1.0% 126.35 Adna 36.1% 4,772.75 14.4% 1,902.93 22.2% 2,927.93 7.0% 929.85 20.2% 2,670.39 0.0% 2.68 0.0% 3.05 Quilcene 34.4% 4,410.94 17.5% 2,247.19 20.7% 2,657.30 11.1% 1,423.68 14.0% 1,797.49 0.4% 47.75 1.9% 249.63 Griffin 41.0% 6,138.46 18.9% 2,834.37 23.9% 3,575.35 4.1% 613.02 12.0% 1,794.00 0.2% 28.61 0.0% 5.89 Manson 39.4% 6,342.94 18.4% 2,959.07 24.2% 3,887.38 6.0% 972.57 10.8% 1,736.39 0.3% 47.84 0.8% 134.85 Ocosta 40.6% 6,497.57 16.4% 2,633.03 24.3% 3,895.76 6.3% 1,014.44 12.1% 1,934.04 0.2% 24.93 0.1% 8.76 Union Gap 37.9% 5,125.39 17.5% 2,369.32 22.6% 3,058.62 4.4% 595.12 16.1% 2,173.66 0.2% 20.57 1.3% 174.58
169
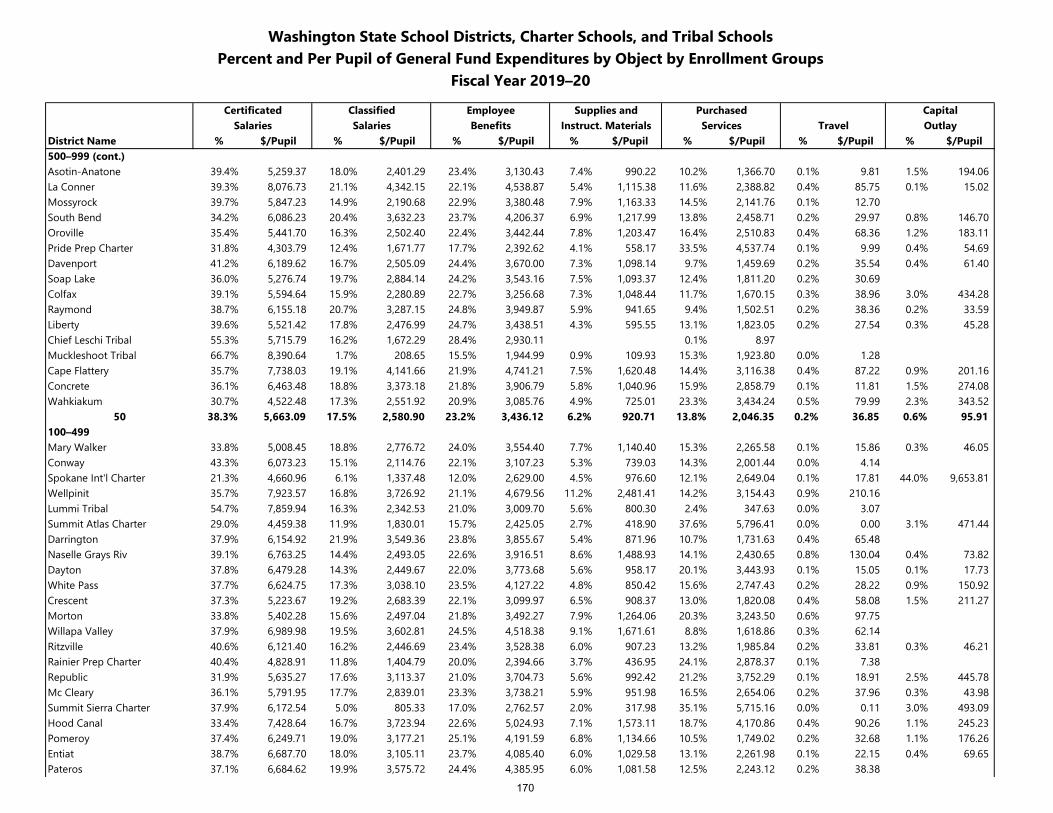
Washington State School Districts, Charter Schools, and Tribal SchoolsPercent and Per Pupil of General Fund Expenditures by Object by Enrollment Groups
Fiscal Year 2019–20
Certificated Classified Employee Supplies and Purchased CapitalSalaries Salaries Benefits Instruct. Materials Services Travel Outlay
District Name % $/Pupil % $/Pupil % $/Pupil % $/Pupil % $/Pupil % $/Pupil % $/Pupil500–999 (cont.)Asotin-Anatone 39.4% 5,259.37 18.0% 2,401.29 23.4% 3,130.43 7.4% 990.22 10.2% 1,366.70 0.1% 9.81 1.5% 194.06 La Conner 39.3% 8,076.73 21.1% 4,342.15 22.1% 4,538.87 5.4% 1,115.38 11.6% 2,388.82 0.4% 85.75 0.1% 15.02 Mossyrock 39.7% 5,847.23 14.9% 2,190.68 22.9% 3,380.48 7.9% 1,163.33 14.5% 2,141.76 0.1% 12.70 South Bend 34.2% 6,086.23 20.4% 3,632.23 23.7% 4,206.37 6.9% 1,217.99 13.8% 2,458.71 0.2% 29.97 0.8% 146.70 Oroville 35.4% 5,441.70 16.3% 2,502.40 22.4% 3,442.44 7.8% 1,203.47 16.4% 2,510.83 0.4% 68.36 1.2% 183.11 Pride Prep Charter 31.8% 4,303.79 12.4% 1,671.77 17.7% 2,392.62 4.1% 558.17 33.5% 4,537.74 0.1% 9.99 0.4% 54.69 Davenport 41.2% 6,189.62 16.7% 2,505.09 24.4% 3,670.00 7.3% 1,098.14 9.7% 1,459.69 0.2% 35.54 0.4% 61.40 Soap Lake 36.0% 5,276.74 19.7% 2,884.14 24.2% 3,543.16 7.5% 1,093.37 12.4% 1,811.20 0.2% 30.69 Colfax 39.1% 5,594.64 15.9% 2,280.89 22.7% 3,256.68 7.3% 1,048.44 11.7% 1,670.15 0.3% 38.96 3.0% 434.28 Raymond 38.7% 6,155.18 20.7% 3,287.15 24.8% 3,949.87 5.9% 941.65 9.4% 1,502.51 0.2% 38.36 0.2% 33.59 Liberty 39.6% 5,521.42 17.8% 2,476.99 24.7% 3,438.51 4.3% 595.55 13.1% 1,823.05 0.2% 27.54 0.3% 45.28 Chief Leschi Tribal 55.3% 5,715.79 16.2% 1,672.29 28.4% 2,930.11 0.1% 8.97 Muckleshoot Tribal 66.7% 8,390.64 1.7% 208.65 15.5% 1,944.99 0.9% 109.93 15.3% 1,923.80 0.0% 1.28 Cape Flattery 35.7% 7,738.03 19.1% 4,141.66 21.9% 4,741.21 7.5% 1,620.48 14.4% 3,116.38 0.4% 87.22 0.9% 201.16 Concrete 36.1% 6,463.48 18.8% 3,373.18 21.8% 3,906.79 5.8% 1,040.96 15.9% 2,858.79 0.1% 11.81 1.5% 274.08 Wahkiakum 30.7% 4,522.48 17.3% 2,551.92 20.9% 3,085.76 4.9% 725.01 23.3% 3,434.24 0.5% 79.99 2.3% 343.52
50 38.3% 5,663.09 17.5% 2,580.90 23.2% 3,436.12 6.2% 920.71 13.8% 2,046.35 0.2% 36.85 0.6% 95.91 100–499Mary Walker 33.8% 5,008.45 18.8% 2,776.72 24.0% 3,554.40 7.7% 1,140.40 15.3% 2,265.58 0.1% 15.86 0.3% 46.05 Conway 43.3% 6,073.23 15.1% 2,114.76 22.1% 3,107.23 5.3% 739.03 14.3% 2,001.44 0.0% 4.14 Spokane Int'l Charter 21.3% 4,660.96 6.1% 1,337.48 12.0% 2,629.00 4.5% 976.60 12.1% 2,649.04 0.1% 17.81 44.0% 9,653.81 Wellpinit 35.7% 7,923.57 16.8% 3,726.92 21.1% 4,679.56 11.2% 2,481.41 14.2% 3,154.43 0.9% 210.16 Lummi Tribal 54.7% 7,859.94 16.3% 2,342.53 21.0% 3,009.70 5.6% 800.30 2.4% 347.63 0.0% 3.07 Summit Atlas Charter 29.0% 4,459.38 11.9% 1,830.01 15.7% 2,425.05 2.7% 418.90 37.6% 5,796.41 0.0% 0.00 3.1% 471.44 Darrington 37.9% 6,154.92 21.9% 3,549.36 23.8% 3,855.67 5.4% 871.96 10.7% 1,731.63 0.4% 65.48 Naselle Grays Riv 39.1% 6,763.25 14.4% 2,493.05 22.6% 3,916.51 8.6% 1,488.93 14.1% 2,430.65 0.8% 130.04 0.4% 73.82 Dayton 37.8% 6,479.28 14.3% 2,449.67 22.0% 3,773.68 5.6% 958.17 20.1% 3,443.93 0.1% 15.05 0.1% 17.73 White Pass 37.7% 6,624.75 17.3% 3,038.10 23.5% 4,127.22 4.8% 850.42 15.6% 2,747.43 0.2% 28.22 0.9% 150.92 Crescent 37.3% 5,223.67 19.2% 2,683.39 22.1% 3,099.97 6.5% 908.37 13.0% 1,820.08 0.4% 58.08 1.5% 211.27 Morton 33.8% 5,402.28 15.6% 2,497.04 21.8% 3,492.27 7.9% 1,264.06 20.3% 3,243.50 0.6% 97.75 Willapa Valley 37.9% 6,989.98 19.5% 3,602.81 24.5% 4,518.38 9.1% 1,671.61 8.8% 1,618.86 0.3% 62.14 Ritzville 40.6% 6,121.40 16.2% 2,446.69 23.4% 3,528.38 6.0% 907.23 13.2% 1,985.84 0.2% 33.81 0.3% 46.21 Rainier Prep Charter 40.4% 4,828.91 11.8% 1,404.79 20.0% 2,394.66 3.7% 436.95 24.1% 2,878.37 0.1% 7.38 Republic 31.9% 5,635.27 17.6% 3,113.37 21.0% 3,704.73 5.6% 992.42 21.2% 3,752.29 0.1% 18.91 2.5% 445.78 Mc Cleary 36.1% 5,791.95 17.7% 2,839.01 23.3% 3,738.21 5.9% 951.98 16.5% 2,654.06 0.2% 37.96 0.3% 43.98 Summit Sierra Charter 37.9% 6,172.54 5.0% 805.33 17.0% 2,762.57 2.0% 317.98 35.1% 5,715.16 0.0% 0.11 3.0% 493.09 Hood Canal 33.4% 7,428.64 16.7% 3,723.94 22.6% 5,024.93 7.1% 1,573.11 18.7% 4,170.86 0.4% 90.26 1.1% 245.23 Pomeroy 37.4% 6,249.71 19.0% 3,177.21 25.1% 4,191.59 6.8% 1,134.66 10.5% 1,749.02 0.2% 32.68 1.1% 176.26 Entiat 38.7% 6,687.70 18.0% 3,105.11 23.7% 4,085.40 6.0% 1,029.58 13.1% 2,261.98 0.1% 22.15 0.4% 69.65 Pateros 37.1% 6,684.62 19.9% 3,575.72 24.4% 4,385.95 6.0% 1,081.58 12.5% 2,243.12 0.2% 38.38
170
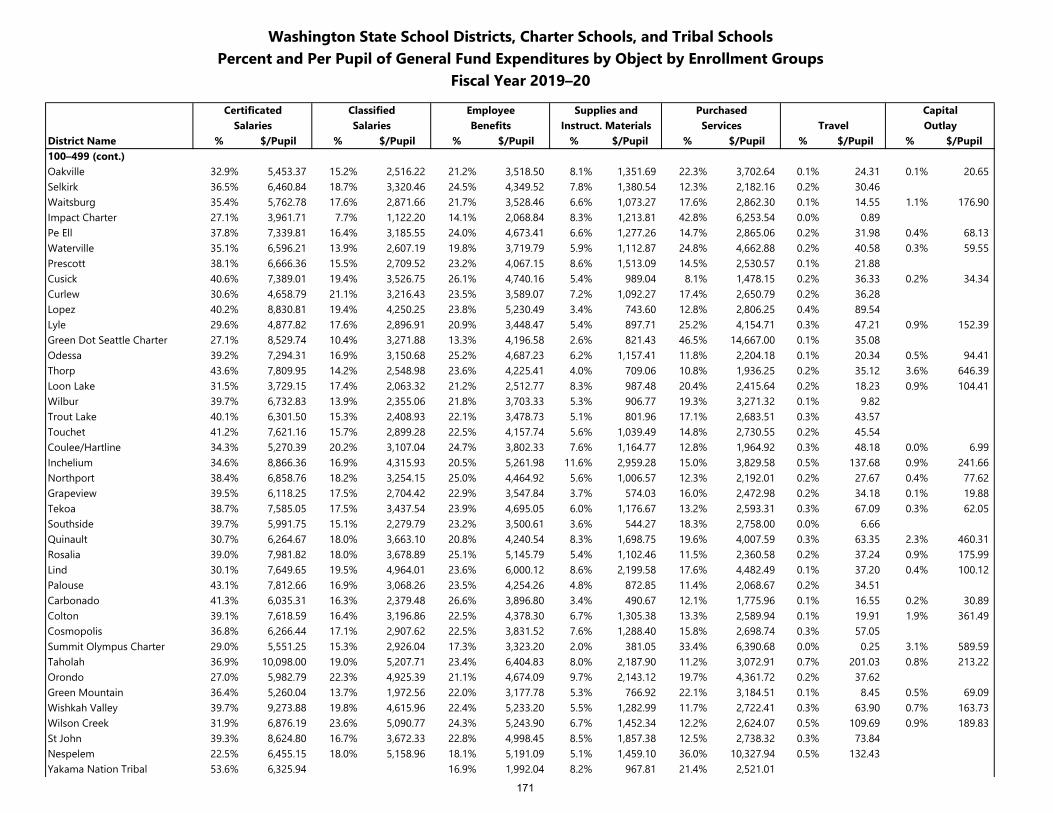
Washington State School Districts, Charter Schools, and Tribal SchoolsPercent and Per Pupil of General Fund Expenditures by Object by Enrollment Groups
Fiscal Year 2019–20
Certificated Classified Employee Supplies and Purchased CapitalSalaries Salaries Benefits Instruct. Materials Services Travel Outlay
District Name % $/Pupil % $/Pupil % $/Pupil % $/Pupil % $/Pupil % $/Pupil % $/Pupil100–499 (cont.)Oakville 32.9% 5,453.37 15.2% 2,516.22 21.2% 3,518.50 8.1% 1,351.69 22.3% 3,702.64 0.1% 24.31 0.1% 20.65 Selkirk 36.5% 6,460.84 18.7% 3,320.46 24.5% 4,349.52 7.8% 1,380.54 12.3% 2,182.16 0.2% 30.46 Waitsburg 35.4% 5,762.78 17.6% 2,871.66 21.7% 3,528.46 6.6% 1,073.27 17.6% 2,862.30 0.1% 14.55 1.1% 176.90 Impact Charter 27.1% 3,961.71 7.7% 1,122.20 14.1% 2,068.84 8.3% 1,213.81 42.8% 6,253.54 0.0% 0.89 Pe Ell 37.8% 7,339.81 16.4% 3,185.55 24.0% 4,673.41 6.6% 1,277.26 14.7% 2,865.06 0.2% 31.98 0.4% 68.13 Waterville 35.1% 6,596.21 13.9% 2,607.19 19.8% 3,719.79 5.9% 1,112.87 24.8% 4,662.88 0.2% 40.58 0.3% 59.55 Prescott 38.1% 6,666.36 15.5% 2,709.52 23.2% 4,067.15 8.6% 1,513.09 14.5% 2,530.57 0.1% 21.88 Cusick 40.6% 7,389.01 19.4% 3,526.75 26.1% 4,740.16 5.4% 989.04 8.1% 1,478.15 0.2% 36.33 0.2% 34.34 Curlew 30.6% 4,658.79 21.1% 3,216.43 23.5% 3,589.07 7.2% 1,092.27 17.4% 2,650.79 0.2% 36.28 Lopez 40.2% 8,830.81 19.4% 4,250.25 23.8% 5,230.49 3.4% 743.60 12.8% 2,806.25 0.4% 89.54 Lyle 29.6% 4,877.82 17.6% 2,896.91 20.9% 3,448.47 5.4% 897.71 25.2% 4,154.71 0.3% 47.21 0.9% 152.39 Green Dot Seattle Charter 27.1% 8,529.74 10.4% 3,271.88 13.3% 4,196.58 2.6% 821.43 46.5% 14,667.00 0.1% 35.08 Odessa 39.2% 7,294.31 16.9% 3,150.68 25.2% 4,687.23 6.2% 1,157.41 11.8% 2,204.18 0.1% 20.34 0.5% 94.41 Thorp 43.6% 7,809.95 14.2% 2,548.98 23.6% 4,225.41 4.0% 709.06 10.8% 1,936.25 0.2% 35.12 3.6% 646.39 Loon Lake 31.5% 3,729.15 17.4% 2,063.32 21.2% 2,512.77 8.3% 987.48 20.4% 2,415.64 0.2% 18.23 0.9% 104.41 Wilbur 39.7% 6,732.83 13.9% 2,355.06 21.8% 3,703.33 5.3% 906.77 19.3% 3,271.32 0.1% 9.82 Trout Lake 40.1% 6,301.50 15.3% 2,408.93 22.1% 3,478.73 5.1% 801.96 17.1% 2,683.51 0.3% 43.57 Touchet 41.2% 7,621.16 15.7% 2,899.28 22.5% 4,157.74 5.6% 1,039.49 14.8% 2,730.55 0.2% 45.54 Coulee/Hartline 34.3% 5,270.39 20.2% 3,107.04 24.7% 3,802.33 7.6% 1,164.77 12.8% 1,964.92 0.3% 48.18 0.0% 6.99 Inchelium 34.6% 8,866.36 16.9% 4,315.93 20.5% 5,261.98 11.6% 2,959.28 15.0% 3,829.58 0.5% 137.68 0.9% 241.66 Northport 38.4% 6,858.76 18.2% 3,254.15 25.0% 4,464.92 5.6% 1,006.57 12.3% 2,192.01 0.2% 27.67 0.4% 77.62 Grapeview 39.5% 6,118.25 17.5% 2,704.42 22.9% 3,547.84 3.7% 574.03 16.0% 2,472.98 0.2% 34.18 0.1% 19.88 Tekoa 38.7% 7,585.05 17.5% 3,437.54 23.9% 4,695.05 6.0% 1,176.67 13.2% 2,593.31 0.3% 67.09 0.3% 62.05 Southside 39.7% 5,991.75 15.1% 2,279.79 23.2% 3,500.61 3.6% 544.27 18.3% 2,758.00 0.0% 6.66 Quinault 30.7% 6,264.67 18.0% 3,663.10 20.8% 4,240.54 8.3% 1,698.75 19.6% 4,007.59 0.3% 63.35 2.3% 460.31 Rosalia 39.0% 7,981.82 18.0% 3,678.89 25.1% 5,145.79 5.4% 1,102.46 11.5% 2,360.58 0.2% 37.24 0.9% 175.99 Lind 30.1% 7,649.65 19.5% 4,964.01 23.6% 6,000.12 8.6% 2,199.58 17.6% 4,482.49 0.1% 37.20 0.4% 100.12 Palouse 43.1% 7,812.66 16.9% 3,068.26 23.5% 4,254.26 4.8% 872.85 11.4% 2,068.67 0.2% 34.51 Carbonado 41.3% 6,035.31 16.3% 2,379.48 26.6% 3,896.80 3.4% 490.67 12.1% 1,775.96 0.1% 16.55 0.2% 30.89 Colton 39.1% 7,618.59 16.4% 3,196.86 22.5% 4,378.30 6.7% 1,305.38 13.3% 2,589.94 0.1% 19.91 1.9% 361.49 Cosmopolis 36.8% 6,266.44 17.1% 2,907.62 22.5% 3,831.52 7.6% 1,288.40 15.8% 2,698.74 0.3% 57.05 Summit Olympus Charter 29.0% 5,551.25 15.3% 2,926.04 17.3% 3,323.20 2.0% 381.05 33.4% 6,390.68 0.0% 0.25 3.1% 589.59 Taholah 36.9% 10,098.00 19.0% 5,207.71 23.4% 6,404.83 8.0% 2,187.90 11.2% 3,072.91 0.7% 201.03 0.8% 213.22 Orondo 27.0% 5,982.79 22.3% 4,925.39 21.1% 4,674.09 9.7% 2,143.12 19.7% 4,361.72 0.2% 37.62 Green Mountain 36.4% 5,260.04 13.7% 1,972.56 22.0% 3,177.78 5.3% 766.92 22.1% 3,184.51 0.1% 8.45 0.5% 69.09 Wishkah Valley 39.7% 9,273.88 19.8% 4,615.96 22.4% 5,233.20 5.5% 1,282.99 11.7% 2,722.41 0.3% 63.90 0.7% 163.73 Wilson Creek 31.9% 6,876.19 23.6% 5,090.77 24.3% 5,243.90 6.7% 1,452.34 12.2% 2,624.07 0.5% 109.69 0.9% 189.83 St John 39.3% 8,624.80 16.7% 3,672.33 22.8% 4,998.45 8.5% 1,857.38 12.5% 2,738.32 0.3% 73.84 Nespelem 22.5% 6,455.15 18.0% 5,158.96 18.1% 5,191.09 5.1% 1,459.10 36.0% 10,327.94 0.5% 132.43 Yakama Nation Tribal 53.6% 6,325.94 16.9% 1,992.04 8.2% 967.81 21.4% 2,521.01
171
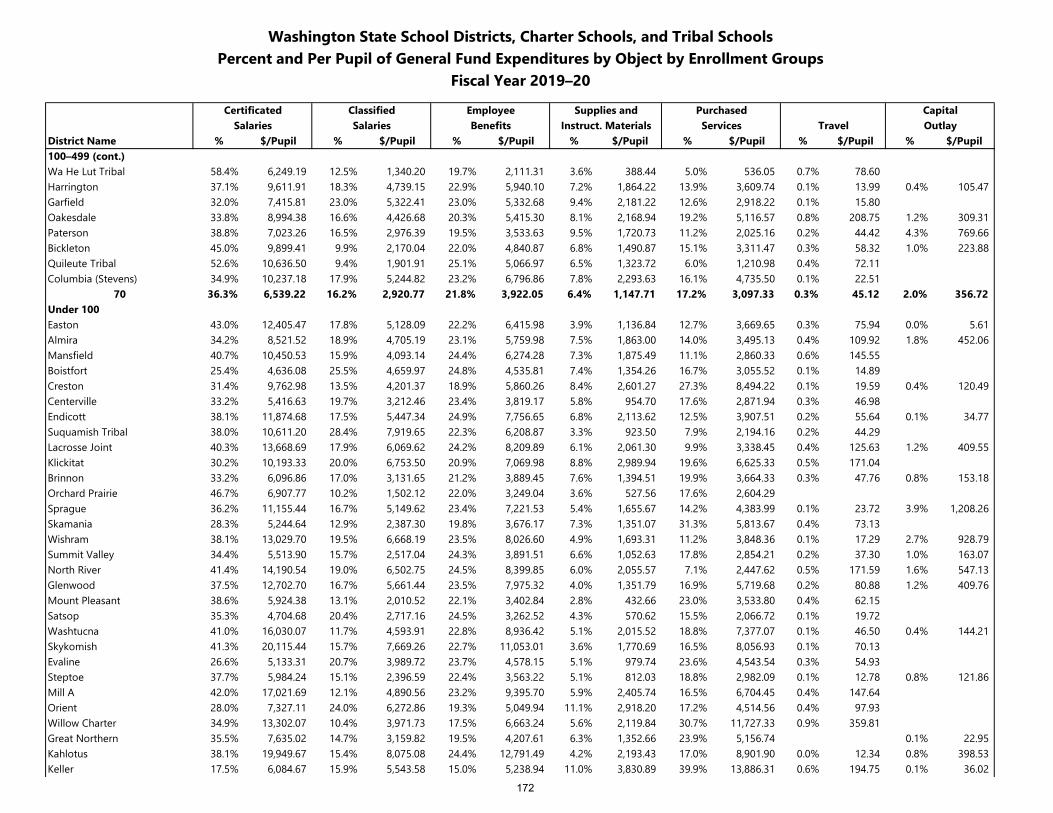
Washington State School Districts, Charter Schools, and Tribal SchoolsPercent and Per Pupil of General Fund Expenditures by Object by Enrollment Groups
Fiscal Year 2019–20
Certificated Classified Employee Supplies and Purchased CapitalSalaries Salaries Benefits Instruct. Materials Services Travel Outlay
District Name % $/Pupil % $/Pupil % $/Pupil % $/Pupil % $/Pupil % $/Pupil % $/Pupil100–499 (cont.)Wa He Lut Tribal 58.4% 6,249.19 12.5% 1,340.20 19.7% 2,111.31 3.6% 388.44 5.0% 536.05 0.7% 78.60 Harrington 37.1% 9,611.91 18.3% 4,739.15 22.9% 5,940.10 7.2% 1,864.22 13.9% 3,609.74 0.1% 13.99 0.4% 105.47 Garfield 32.0% 7,415.81 23.0% 5,322.41 23.0% 5,332.68 9.4% 2,181.22 12.6% 2,918.22 0.1% 15.80 Oakesdale 33.8% 8,994.38 16.6% 4,426.68 20.3% 5,415.30 8.1% 2,168.94 19.2% 5,116.57 0.8% 208.75 1.2% 309.31 Paterson 38.8% 7,023.26 16.5% 2,976.39 19.5% 3,533.63 9.5% 1,720.73 11.2% 2,025.16 0.2% 44.42 4.3% 769.66 Bickleton 45.0% 9,899.41 9.9% 2,170.04 22.0% 4,840.87 6.8% 1,490.87 15.1% 3,311.47 0.3% 58.32 1.0% 223.88 Quileute Tribal 52.6% 10,636.50 9.4% 1,901.91 25.1% 5,066.97 6.5% 1,323.72 6.0% 1,210.98 0.4% 72.11 Columbia (Stevens) 34.9% 10,237.18 17.9% 5,244.82 23.2% 6,796.86 7.8% 2,293.63 16.1% 4,735.50 0.1% 22.51
70 36.3% 6,539.22 16.2% 2,920.77 21.8% 3,922.05 6.4% 1,147.71 17.2% 3,097.33 0.3% 45.12 2.0% 356.72 Under 100Easton 43.0% 12,405.47 17.8% 5,128.09 22.2% 6,415.98 3.9% 1,136.84 12.7% 3,669.65 0.3% 75.94 0.0% 5.61 Almira 34.2% 8,521.52 18.9% 4,705.19 23.1% 5,759.98 7.5% 1,863.00 14.0% 3,495.13 0.4% 109.92 1.8% 452.06 Mansfield 40.7% 10,450.53 15.9% 4,093.14 24.4% 6,274.28 7.3% 1,875.49 11.1% 2,860.33 0.6% 145.55 Boistfort 25.4% 4,636.08 25.5% 4,659.97 24.8% 4,535.81 7.4% 1,354.26 16.7% 3,055.52 0.1% 14.89 Creston 31.4% 9,762.98 13.5% 4,201.37 18.9% 5,860.26 8.4% 2,601.27 27.3% 8,494.22 0.1% 19.59 0.4% 120.49 Centerville 33.2% 5,416.63 19.7% 3,212.46 23.4% 3,819.17 5.8% 954.70 17.6% 2,871.94 0.3% 46.98 Endicott 38.1% 11,874.68 17.5% 5,447.34 24.9% 7,756.65 6.8% 2,113.62 12.5% 3,907.51 0.2% 55.64 0.1% 34.77 Suquamish Tribal 38.0% 10,611.20 28.4% 7,919.65 22.3% 6,208.87 3.3% 923.50 7.9% 2,194.16 0.2% 44.29 Lacrosse Joint 40.3% 13,668.69 17.9% 6,069.62 24.2% 8,209.89 6.1% 2,061.30 9.9% 3,338.45 0.4% 125.63 1.2% 409.55 Klickitat 30.2% 10,193.33 20.0% 6,753.50 20.9% 7,069.98 8.8% 2,989.94 19.6% 6,625.33 0.5% 171.04 Brinnon 33.2% 6,096.86 17.0% 3,131.65 21.2% 3,889.45 7.6% 1,394.51 19.9% 3,664.33 0.3% 47.76 0.8% 153.18 Orchard Prairie 46.7% 6,907.77 10.2% 1,502.12 22.0% 3,249.04 3.6% 527.56 17.6% 2,604.29 Sprague 36.2% 11,155.44 16.7% 5,149.62 23.4% 7,221.53 5.4% 1,655.67 14.2% 4,383.99 0.1% 23.72 3.9% 1,208.26 Skamania 28.3% 5,244.64 12.9% 2,387.30 19.8% 3,676.17 7.3% 1,351.07 31.3% 5,813.67 0.4% 73.13 Wishram 38.1% 13,029.70 19.5% 6,668.19 23.5% 8,026.60 4.9% 1,693.31 11.2% 3,848.36 0.1% 17.29 2.7% 928.79 Summit Valley 34.4% 5,513.90 15.7% 2,517.04 24.3% 3,891.51 6.6% 1,052.63 17.8% 2,854.21 0.2% 37.30 1.0% 163.07 North River 41.4% 14,190.54 19.0% 6,502.75 24.5% 8,399.85 6.0% 2,055.57 7.1% 2,447.62 0.5% 171.59 1.6% 547.13 Glenwood 37.5% 12,702.70 16.7% 5,661.44 23.5% 7,975.32 4.0% 1,351.79 16.9% 5,719.68 0.2% 80.88 1.2% 409.76 Mount Pleasant 38.6% 5,924.38 13.1% 2,010.52 22.1% 3,402.84 2.8% 432.66 23.0% 3,533.80 0.4% 62.15 Satsop 35.3% 4,704.68 20.4% 2,717.16 24.5% 3,262.52 4.3% 570.62 15.5% 2,066.72 0.1% 19.72 Washtucna 41.0% 16,030.07 11.7% 4,593.91 22.8% 8,936.42 5.1% 2,015.52 18.8% 7,377.07 0.1% 46.50 0.4% 144.21 Skykomish 41.3% 20,115.44 15.7% 7,669.26 22.7% 11,053.01 3.6% 1,770.69 16.5% 8,056.93 0.1% 70.13 Evaline 26.6% 5,133.31 20.7% 3,989.72 23.7% 4,578.15 5.1% 979.74 23.6% 4,543.54 0.3% 54.93 Steptoe 37.7% 5,984.24 15.1% 2,396.59 22.4% 3,563.22 5.1% 812.03 18.8% 2,982.09 0.1% 12.78 0.8% 121.86 Mill A 42.0% 17,021.69 12.1% 4,890.56 23.2% 9,395.70 5.9% 2,405.74 16.5% 6,704.45 0.4% 147.64 Orient 28.0% 7,327.11 24.0% 6,272.86 19.3% 5,049.94 11.1% 2,918.20 17.2% 4,514.56 0.4% 97.93 Willow Charter 34.9% 13,302.07 10.4% 3,971.73 17.5% 6,663.24 5.6% 2,119.84 30.7% 11,727.33 0.9% 359.81 Great Northern 35.5% 7,635.02 14.7% 3,159.82 19.5% 4,207.61 6.3% 1,352.66 23.9% 5,156.74 0.1% 22.95 Kahlotus 38.1% 19,949.67 15.4% 8,075.08 24.4% 12,791.49 4.2% 2,193.43 17.0% 8,901.90 0.0% 12.34 0.8% 398.53 Keller 17.5% 6,084.67 15.9% 5,543.58 15.0% 5,238.94 11.0% 3,830.89 39.9% 13,886.31 0.6% 194.75 0.1% 36.02
172
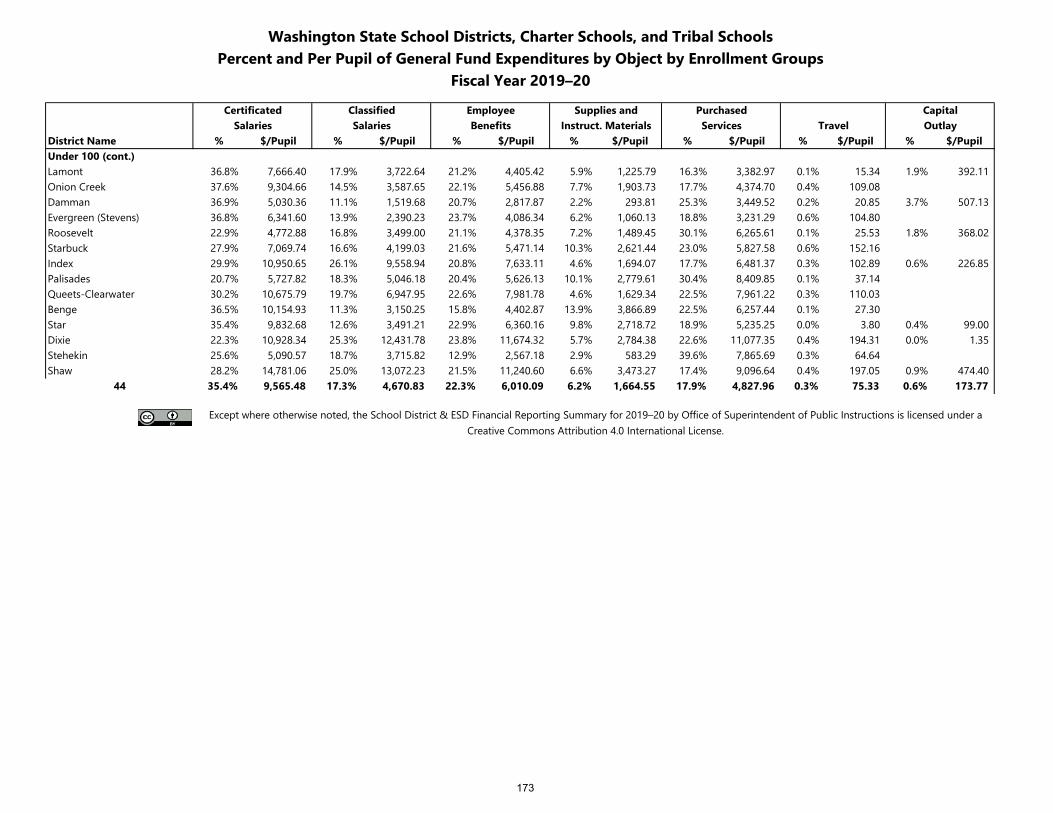
Washington State School Districts, Charter Schools, and Tribal SchoolsPercent and Per Pupil of General Fund Expenditures by Object by Enrollment Groups
Fiscal Year 2019–20
Certificated Classified Employee Supplies and Purchased CapitalSalaries Salaries Benefits Instruct. Materials Services Travel Outlay
District Name % $/Pupil % $/Pupil % $/Pupil % $/Pupil % $/Pupil % $/Pupil % $/PupilUnder 100 (cont.)Lamont 36.8% 7,666.40 17.9% 3,722.64 21.2% 4,405.42 5.9% 1,225.79 16.3% 3,382.97 0.1% 15.34 1.9% 392.11 Onion Creek 37.6% 9,304.66 14.5% 3,587.65 22.1% 5,456.88 7.7% 1,903.73 17.7% 4,374.70 0.4% 109.08 Damman 36.9% 5,030.36 11.1% 1,519.68 20.7% 2,817.87 2.2% 293.81 25.3% 3,449.52 0.2% 20.85 3.7% 507.13 Evergreen (Stevens) 36.8% 6,341.60 13.9% 2,390.23 23.7% 4,086.34 6.2% 1,060.13 18.8% 3,231.29 0.6% 104.80 Roosevelt 22.9% 4,772.88 16.8% 3,499.00 21.1% 4,378.35 7.2% 1,489.45 30.1% 6,265.61 0.1% 25.53 1.8% 368.02 Starbuck 27.9% 7,069.74 16.6% 4,199.03 21.6% 5,471.14 10.3% 2,621.44 23.0% 5,827.58 0.6% 152.16 Index 29.9% 10,950.65 26.1% 9,558.94 20.8% 7,633.11 4.6% 1,694.07 17.7% 6,481.37 0.3% 102.89 0.6% 226.85 Palisades 20.7% 5,727.82 18.3% 5,046.18 20.4% 5,626.13 10.1% 2,779.61 30.4% 8,409.85 0.1% 37.14 Queets-Clearwater 30.2% 10,675.79 19.7% 6,947.95 22.6% 7,981.78 4.6% 1,629.34 22.5% 7,961.22 0.3% 110.03 Benge 36.5% 10,154.93 11.3% 3,150.25 15.8% 4,402.87 13.9% 3,866.89 22.5% 6,257.44 0.1% 27.30 Star 35.4% 9,832.68 12.6% 3,491.21 22.9% 6,360.16 9.8% 2,718.72 18.9% 5,235.25 0.0% 3.80 0.4% 99.00 Dixie 22.3% 10,928.34 25.3% 12,431.78 23.8% 11,674.32 5.7% 2,784.38 22.6% 11,077.35 0.4% 194.31 0.0% 1.35 Stehekin 25.6% 5,090.57 18.7% 3,715.82 12.9% 2,567.18 2.9% 583.29 39.6% 7,865.69 0.3% 64.64 Shaw 28.2% 14,781.06 25.0% 13,072.23 21.5% 11,240.60 6.6% 3,473.27 17.4% 9,096.64 0.4% 197.05 0.9% 474.40
44 35.4% 9,565.48 17.3% 4,670.83 22.3% 6,010.09 6.2% 1,664.55 17.9% 4,827.96 0.3% 75.33 0.6% 173.77
Except where otherwise noted, the School District & ESD Financial Reporting Summary for 2019–20 by Office of Superintendent of Public Instructions is licensed under a Creative Commons Attribution 4.0 International License.
173
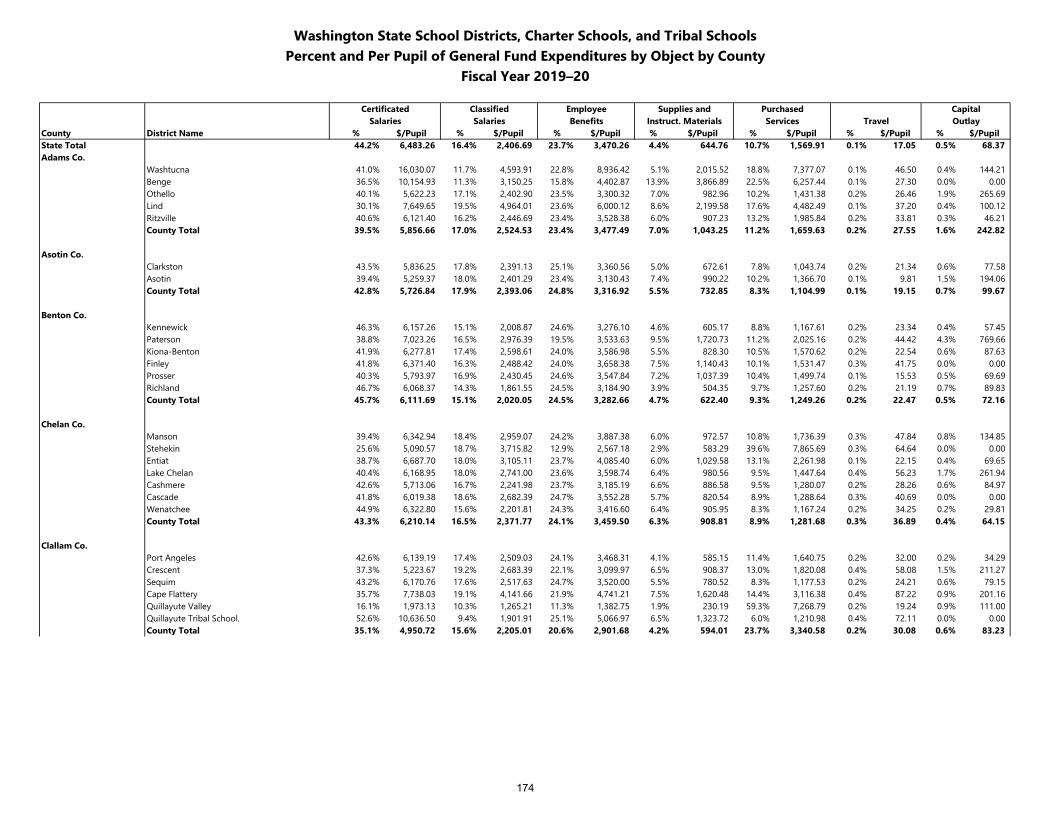
Washington State School Districts, Charter Schools, and Tribal SchoolsPercent and Per Pupil of General Fund Expenditures by Object by County
Fiscal Year 2019–20
Certificated Classified Employee Supplies and Purchased CapitalSalaries Salaries Benefits Instruct. Materials Services Travel Outlay
County District Name % $/Pupil % $/Pupil % $/Pupil % $/Pupil % $/Pupil % $/Pupil % $/PupilState Total 44.2% 6,483.26 16.4% 2,406.69 23.7% 3,470.26 4.4% 644.76 10.7% 1,569.91 0.1% 17.05 0.5% 68.37 Adams Co.
Washtucna 41.0% 16,030.07 11.7% 4,593.91 22.8% 8,936.42 5.1% 2,015.52 18.8% 7,377.07 0.1% 46.50 0.4% 144.21Benge 36.5% 10,154.93 11.3% 3,150.25 15.8% 4,402.87 13.9% 3,866.89 22.5% 6,257.44 0.1% 27.30 0.0% 0.00Othello 40.1% 5,622.23 17.1% 2,402.90 23.5% 3,300.32 7.0% 982.96 10.2% 1,431.38 0.2% 26.46 1.9% 265.69Lind 30.1% 7,649.65 19.5% 4,964.01 23.6% 6,000.12 8.6% 2,199.58 17.6% 4,482.49 0.1% 37.20 0.4% 100.12Ritzville 40.6% 6,121.40 16.2% 2,446.69 23.4% 3,528.38 6.0% 907.23 13.2% 1,985.84 0.2% 33.81 0.3% 46.21County Total 39.5% 5,856.66 17.0% 2,524.53 23.4% 3,477.49 7.0% 1,043.25 11.2% 1,659.63 0.2% 27.55 1.6% 242.82
Asotin Co.Clarkston 43.5% 5,836.25 17.8% 2,391.13 25.1% 3,360.56 5.0% 672.61 7.8% 1,043.74 0.2% 21.34 0.6% 77.58Asotin 39.4% 5,259.37 18.0% 2,401.29 23.4% 3,130.43 7.4% 990.22 10.2% 1,366.70 0.1% 9.81 1.5% 194.06County Total 42.8% 5,726.84 17.9% 2,393.06 24.8% 3,316.92 5.5% 732.85 8.3% 1,104.99 0.1% 19.15 0.7% 99.67
Benton Co.Kennewick 46.3% 6,157.26 15.1% 2,008.87 24.6% 3,276.10 4.6% 605.17 8.8% 1,167.61 0.2% 23.34 0.4% 57.45Paterson 38.8% 7,023.26 16.5% 2,976.39 19.5% 3,533.63 9.5% 1,720.73 11.2% 2,025.16 0.2% 44.42 4.3% 769.66Kiona-Benton 41.9% 6,277.81 17.4% 2,598.61 24.0% 3,586.98 5.5% 828.30 10.5% 1,570.62 0.2% 22.54 0.6% 87.63Finley 41.8% 6,371.40 16.3% 2,488.42 24.0% 3,658.38 7.5% 1,140.43 10.1% 1,531.47 0.3% 41.75 0.0% 0.00Prosser 40.3% 5,793.97 16.9% 2,430.45 24.6% 3,547.84 7.2% 1,037.39 10.4% 1,499.74 0.1% 15.53 0.5% 69.69Richland 46.7% 6,068.37 14.3% 1,861.55 24.5% 3,184.90 3.9% 504.35 9.7% 1,257.60 0.2% 21.19 0.7% 89.83County Total 45.7% 6,111.69 15.1% 2,020.05 24.5% 3,282.66 4.7% 622.40 9.3% 1,249.26 0.2% 22.47 0.5% 72.16
Chelan Co.Manson 39.4% 6,342.94 18.4% 2,959.07 24.2% 3,887.38 6.0% 972.57 10.8% 1,736.39 0.3% 47.84 0.8% 134.85Stehekin 25.6% 5,090.57 18.7% 3,715.82 12.9% 2,567.18 2.9% 583.29 39.6% 7,865.69 0.3% 64.64 0.0% 0.00Entiat 38.7% 6,687.70 18.0% 3,105.11 23.7% 4,085.40 6.0% 1,029.58 13.1% 2,261.98 0.1% 22.15 0.4% 69.65Lake Chelan 40.4% 6,168.95 18.0% 2,741.00 23.6% 3,598.74 6.4% 980.56 9.5% 1,447.64 0.4% 56.23 1.7% 261.94Cashmere 42.6% 5,713.06 16.7% 2,241.98 23.7% 3,185.19 6.6% 886.58 9.5% 1,280.07 0.2% 28.26 0.6% 84.97Cascade 41.8% 6,019.38 18.6% 2,682.39 24.7% 3,552.28 5.7% 820.54 8.9% 1,288.64 0.3% 40.69 0.0% 0.00Wenatchee 44.9% 6,322.80 15.6% 2,201.81 24.3% 3,416.60 6.4% 905.95 8.3% 1,167.24 0.2% 34.25 0.2% 29.81County Total 43.3% 6,210.14 16.5% 2,371.77 24.1% 3,459.50 6.3% 908.81 8.9% 1,281.68 0.3% 36.89 0.4% 64.15
Clallam Co.Port Angeles 42.6% 6,139.19 17.4% 2,509.03 24.1% 3,468.31 4.1% 585.15 11.4% 1,640.75 0.2% 32.00 0.2% 34.29Crescent 37.3% 5,223.67 19.2% 2,683.39 22.1% 3,099.97 6.5% 908.37 13.0% 1,820.08 0.4% 58.08 1.5% 211.27Sequim 43.2% 6,170.76 17.6% 2,517.63 24.7% 3,520.00 5.5% 780.52 8.3% 1,177.53 0.2% 24.21 0.6% 79.15Cape Flattery 35.7% 7,738.03 19.1% 4,141.66 21.9% 4,741.21 7.5% 1,620.48 14.4% 3,116.38 0.4% 87.22 0.9% 201.16Quillayute Valley 16.1% 1,973.13 10.3% 1,265.21 11.3% 1,382.75 1.9% 230.19 59.3% 7,268.79 0.2% 19.24 0.9% 111.00Quillayute Tribal School. 52.6% 10,636.50 9.4% 1,901.91 25.1% 5,066.97 6.5% 1,323.72 6.0% 1,210.98 0.4% 72.11 0.0% 0.00County Total 35.1% 4,950.72 15.6% 2,205.01 20.6% 2,901.68 4.2% 594.01 23.7% 3,340.58 0.2% 30.08 0.6% 83.23
174
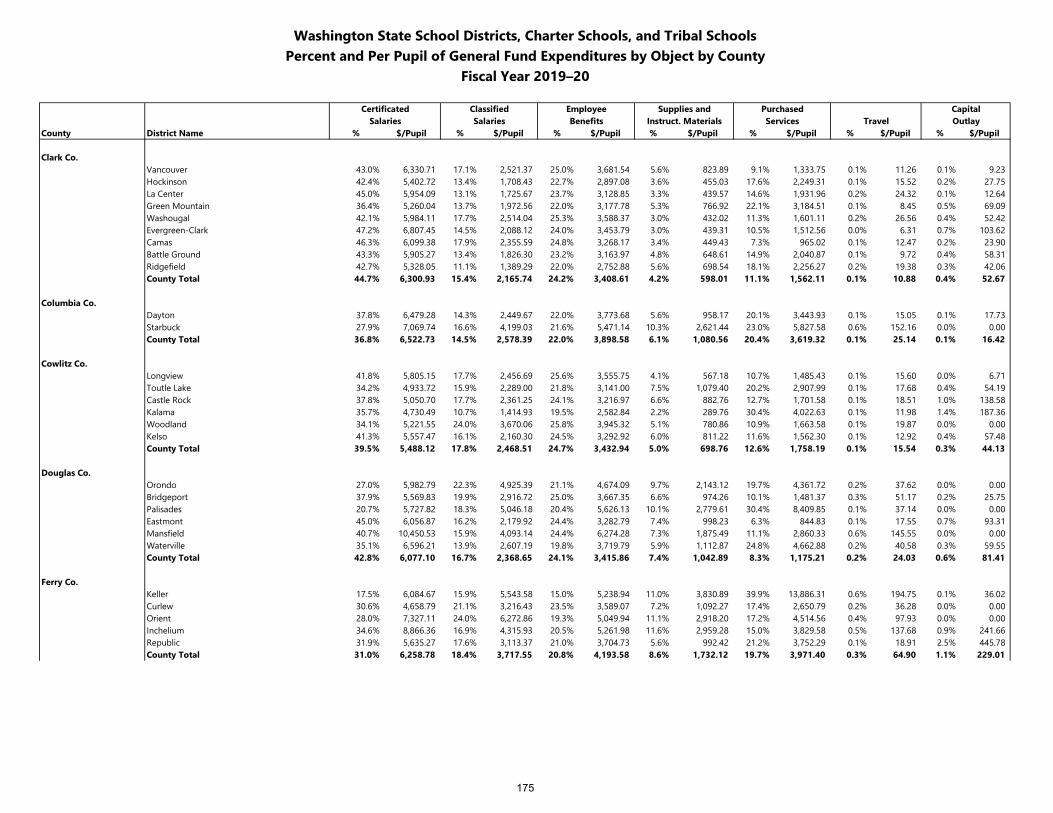
Washington State School Districts, Charter Schools, and Tribal SchoolsPercent and Per Pupil of General Fund Expenditures by Object by County
Fiscal Year 2019–20
Certificated Classified Employee Supplies and Purchased CapitalSalaries Salaries Benefits Instruct. Materials Services Travel Outlay
County District Name % $/Pupil % $/Pupil % $/Pupil % $/Pupil % $/Pupil % $/Pupil % $/Pupil
Clark Co.Vancouver 43.0% 6,330.71 17.1% 2,521.37 25.0% 3,681.54 5.6% 823.89 9.1% 1,333.75 0.1% 11.26 0.1% 9.23Hockinson 42.4% 5,402.72 13.4% 1,708.43 22.7% 2,897.08 3.6% 455.03 17.6% 2,249.31 0.1% 15.52 0.2% 27.75La Center 45.0% 5,954.09 13.1% 1,725.67 23.7% 3,128.85 3.3% 439.57 14.6% 1,931.96 0.2% 24.32 0.1% 12.64Green Mountain 36.4% 5,260.04 13.7% 1,972.56 22.0% 3,177.78 5.3% 766.92 22.1% 3,184.51 0.1% 8.45 0.5% 69.09Washougal 42.1% 5,984.11 17.7% 2,514.04 25.3% 3,588.37 3.0% 432.02 11.3% 1,601.11 0.2% 26.56 0.4% 52.42Evergreen-Clark 47.2% 6,807.45 14.5% 2,088.12 24.0% 3,453.79 3.0% 439.31 10.5% 1,512.56 0.0% 6.31 0.7% 103.62Camas 46.3% 6,099.38 17.9% 2,355.59 24.8% 3,268.17 3.4% 449.43 7.3% 965.02 0.1% 12.47 0.2% 23.90Battle Ground 43.3% 5,905.27 13.4% 1,826.30 23.2% 3,163.97 4.8% 648.61 14.9% 2,040.87 0.1% 9.72 0.4% 58.31Ridgefield 42.7% 5,328.05 11.1% 1,389.29 22.0% 2,752.88 5.6% 698.54 18.1% 2,256.27 0.2% 19.38 0.3% 42.06County Total 44.7% 6,300.93 15.4% 2,165.74 24.2% 3,408.61 4.2% 598.01 11.1% 1,562.11 0.1% 10.88 0.4% 52.67
Columbia Co.Dayton 37.8% 6,479.28 14.3% 2,449.67 22.0% 3,773.68 5.6% 958.17 20.1% 3,443.93 0.1% 15.05 0.1% 17.73Starbuck 27.9% 7,069.74 16.6% 4,199.03 21.6% 5,471.14 10.3% 2,621.44 23.0% 5,827.58 0.6% 152.16 0.0% 0.00County Total 36.8% 6,522.73 14.5% 2,578.39 22.0% 3,898.58 6.1% 1,080.56 20.4% 3,619.32 0.1% 25.14 0.1% 16.42
Cowlitz Co.Longview 41.8% 5,805.15 17.7% 2,456.69 25.6% 3,555.75 4.1% 567.18 10.7% 1,485.43 0.1% 15.60 0.0% 6.71Toutle Lake 34.2% 4,933.72 15.9% 2,289.00 21.8% 3,141.00 7.5% 1,079.40 20.2% 2,907.99 0.1% 17.68 0.4% 54.19Castle Rock 37.8% 5,050.70 17.7% 2,361.25 24.1% 3,216.97 6.6% 882.76 12.7% 1,701.58 0.1% 18.51 1.0% 138.58Kalama 35.7% 4,730.49 10.7% 1,414.93 19.5% 2,582.84 2.2% 289.76 30.4% 4,022.63 0.1% 11.98 1.4% 187.36Woodland 34.1% 5,221.55 24.0% 3,670.06 25.8% 3,945.32 5.1% 780.86 10.9% 1,663.58 0.1% 19.87 0.0% 0.00Kelso 41.3% 5,557.47 16.1% 2,160.30 24.5% 3,292.92 6.0% 811.22 11.6% 1,562.30 0.1% 12.92 0.4% 57.48County Total 39.5% 5,488.12 17.8% 2,468.51 24.7% 3,432.94 5.0% 698.76 12.6% 1,758.19 0.1% 15.54 0.3% 44.13
Douglas Co.Orondo 27.0% 5,982.79 22.3% 4,925.39 21.1% 4,674.09 9.7% 2,143.12 19.7% 4,361.72 0.2% 37.62 0.0% 0.00Bridgeport 37.9% 5,569.83 19.9% 2,916.72 25.0% 3,667.35 6.6% 974.26 10.1% 1,481.37 0.3% 51.17 0.2% 25.75Palisades 20.7% 5,727.82 18.3% 5,046.18 20.4% 5,626.13 10.1% 2,779.61 30.4% 8,409.85 0.1% 37.14 0.0% 0.00Eastmont 45.0% 6,056.87 16.2% 2,179.92 24.4% 3,282.79 7.4% 998.23 6.3% 844.83 0.1% 17.55 0.7% 93.31Mansfield 40.7% 10,450.53 15.9% 4,093.14 24.4% 6,274.28 7.3% 1,875.49 11.1% 2,860.33 0.6% 145.55 0.0% 0.00Waterville 35.1% 6,596.21 13.9% 2,607.19 19.8% 3,719.79 5.9% 1,112.87 24.8% 4,662.88 0.2% 40.58 0.3% 59.55County Total 42.8% 6,077.10 16.7% 2,368.65 24.1% 3,415.86 7.4% 1,042.89 8.3% 1,175.21 0.2% 24.03 0.6% 81.41
Ferry Co.Keller 17.5% 6,084.67 15.9% 5,543.58 15.0% 5,238.94 11.0% 3,830.89 39.9% 13,886.31 0.6% 194.75 0.1% 36.02Curlew 30.6% 4,658.79 21.1% 3,216.43 23.5% 3,589.07 7.2% 1,092.27 17.4% 2,650.79 0.2% 36.28 0.0% 0.00Orient 28.0% 7,327.11 24.0% 6,272.86 19.3% 5,049.94 11.1% 2,918.20 17.2% 4,514.56 0.4% 97.93 0.0% 0.00Inchelium 34.6% 8,866.36 16.9% 4,315.93 20.5% 5,261.98 11.6% 2,959.28 15.0% 3,829.58 0.5% 137.68 0.9% 241.66Republic 31.9% 5,635.27 17.6% 3,113.37 21.0% 3,704.73 5.6% 992.42 21.2% 3,752.29 0.1% 18.91 2.5% 445.78County Total 31.0% 6,258.78 18.4% 3,717.55 20.8% 4,193.58 8.6% 1,732.12 19.7% 3,971.40 0.3% 64.90 1.1% 229.01
175
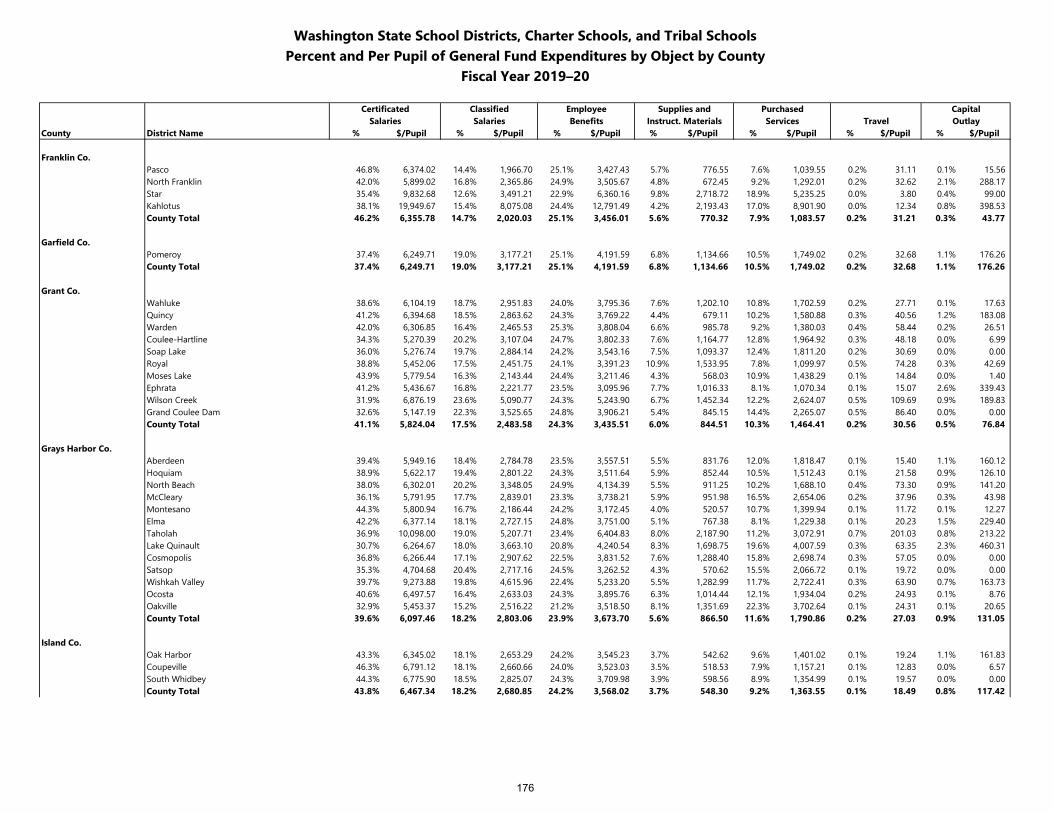
Washington State School Districts, Charter Schools, and Tribal SchoolsPercent and Per Pupil of General Fund Expenditures by Object by County
Fiscal Year 2019–20
Certificated Classified Employee Supplies and Purchased CapitalSalaries Salaries Benefits Instruct. Materials Services Travel Outlay
County District Name % $/Pupil % $/Pupil % $/Pupil % $/Pupil % $/Pupil % $/Pupil % $/Pupil
Franklin Co.Pasco 46.8% 6,374.02 14.4% 1,966.70 25.1% 3,427.43 5.7% 776.55 7.6% 1,039.55 0.2% 31.11 0.1% 15.56North Franklin 42.0% 5,899.02 16.8% 2,365.86 24.9% 3,505.67 4.8% 672.45 9.2% 1,292.01 0.2% 32.62 2.1% 288.17Star 35.4% 9,832.68 12.6% 3,491.21 22.9% 6,360.16 9.8% 2,718.72 18.9% 5,235.25 0.0% 3.80 0.4% 99.00Kahlotus 38.1% 19,949.67 15.4% 8,075.08 24.4% 12,791.49 4.2% 2,193.43 17.0% 8,901.90 0.0% 12.34 0.8% 398.53County Total 46.2% 6,355.78 14.7% 2,020.03 25.1% 3,456.01 5.6% 770.32 7.9% 1,083.57 0.2% 31.21 0.3% 43.77
Garfield Co.Pomeroy 37.4% 6,249.71 19.0% 3,177.21 25.1% 4,191.59 6.8% 1,134.66 10.5% 1,749.02 0.2% 32.68 1.1% 176.26County Total 37.4% 6,249.71 19.0% 3,177.21 25.1% 4,191.59 6.8% 1,134.66 10.5% 1,749.02 0.2% 32.68 1.1% 176.26
Grant Co.Wahluke 38.6% 6,104.19 18.7% 2,951.83 24.0% 3,795.36 7.6% 1,202.10 10.8% 1,702.59 0.2% 27.71 0.1% 17.63Quincy 41.2% 6,394.68 18.5% 2,863.62 24.3% 3,769.22 4.4% 679.11 10.2% 1,580.88 0.3% 40.56 1.2% 183.08Warden 42.0% 6,306.85 16.4% 2,465.53 25.3% 3,808.04 6.6% 985.78 9.2% 1,380.03 0.4% 58.44 0.2% 26.51Coulee-Hartline 34.3% 5,270.39 20.2% 3,107.04 24.7% 3,802.33 7.6% 1,164.77 12.8% 1,964.92 0.3% 48.18 0.0% 6.99Soap Lake 36.0% 5,276.74 19.7% 2,884.14 24.2% 3,543.16 7.5% 1,093.37 12.4% 1,811.20 0.2% 30.69 0.0% 0.00Royal 38.8% 5,452.06 17.5% 2,451.75 24.1% 3,391.23 10.9% 1,533.95 7.8% 1,099.97 0.5% 74.28 0.3% 42.69Moses Lake 43.9% 5,779.54 16.3% 2,143.44 24.4% 3,211.46 4.3% 568.03 10.9% 1,438.29 0.1% 14.84 0.0% 1.40Ephrata 41.2% 5,436.67 16.8% 2,221.77 23.5% 3,095.96 7.7% 1,016.33 8.1% 1,070.34 0.1% 15.07 2.6% 339.43Wilson Creek 31.9% 6,876.19 23.6% 5,090.77 24.3% 5,243.90 6.7% 1,452.34 12.2% 2,624.07 0.5% 109.69 0.9% 189.83Grand Coulee Dam 32.6% 5,147.19 22.3% 3,525.65 24.8% 3,906.21 5.4% 845.15 14.4% 2,265.07 0.5% 86.40 0.0% 0.00County Total 41.1% 5,824.04 17.5% 2,483.58 24.3% 3,435.51 6.0% 844.51 10.3% 1,464.41 0.2% 30.56 0.5% 76.84
Grays Harbor Co.Aberdeen 39.4% 5,949.16 18.4% 2,784.78 23.5% 3,557.51 5.5% 831.76 12.0% 1,818.47 0.1% 15.40 1.1% 160.12Hoquiam 38.9% 5,622.17 19.4% 2,801.22 24.3% 3,511.64 5.9% 852.44 10.5% 1,512.43 0.1% 21.58 0.9% 126.10North Beach 38.0% 6,302.01 20.2% 3,348.05 24.9% 4,134.39 5.5% 911.25 10.2% 1,688.10 0.4% 73.30 0.9% 141.20McCleary 36.1% 5,791.95 17.7% 2,839.01 23.3% 3,738.21 5.9% 951.98 16.5% 2,654.06 0.2% 37.96 0.3% 43.98Montesano 44.3% 5,800.94 16.7% 2,186.44 24.2% 3,172.45 4.0% 520.57 10.7% 1,399.94 0.1% 11.72 0.1% 12.27Elma 42.2% 6,377.14 18.1% 2,727.15 24.8% 3,751.00 5.1% 767.38 8.1% 1,229.38 0.1% 20.23 1.5% 229.40Taholah 36.9% 10,098.00 19.0% 5,207.71 23.4% 6,404.83 8.0% 2,187.90 11.2% 3,072.91 0.7% 201.03 0.8% 213.22Lake Quinault 30.7% 6,264.67 18.0% 3,663.10 20.8% 4,240.54 8.3% 1,698.75 19.6% 4,007.59 0.3% 63.35 2.3% 460.31Cosmopolis 36.8% 6,266.44 17.1% 2,907.62 22.5% 3,831.52 7.6% 1,288.40 15.8% 2,698.74 0.3% 57.05 0.0% 0.00Satsop 35.3% 4,704.68 20.4% 2,717.16 24.5% 3,262.52 4.3% 570.62 15.5% 2,066.72 0.1% 19.72 0.0% 0.00Wishkah Valley 39.7% 9,273.88 19.8% 4,615.96 22.4% 5,233.20 5.5% 1,282.99 11.7% 2,722.41 0.3% 63.90 0.7% 163.73Ocosta 40.6% 6,497.57 16.4% 2,633.03 24.3% 3,895.76 6.3% 1,014.44 12.1% 1,934.04 0.2% 24.93 0.1% 8.76Oakville 32.9% 5,453.37 15.2% 2,516.22 21.2% 3,518.50 8.1% 1,351.69 22.3% 3,702.64 0.1% 24.31 0.1% 20.65County Total 39.6% 6,097.46 18.2% 2,803.06 23.9% 3,673.70 5.6% 866.50 11.6% 1,790.86 0.2% 27.03 0.9% 131.05
Island Co.Oak Harbor 43.3% 6,345.02 18.1% 2,653.29 24.2% 3,545.23 3.7% 542.62 9.6% 1,401.02 0.1% 19.24 1.1% 161.83Coupeville 46.3% 6,791.12 18.1% 2,660.66 24.0% 3,523.03 3.5% 518.53 7.9% 1,157.21 0.1% 12.83 0.0% 6.57South Whidbey 44.3% 6,775.90 18.5% 2,825.07 24.3% 3,709.98 3.9% 598.56 8.9% 1,354.99 0.1% 19.57 0.0% 0.00County Total 43.8% 6,467.34 18.2% 2,680.85 24.2% 3,568.02 3.7% 548.30 9.2% 1,363.55 0.1% 18.49 0.8% 117.42
176
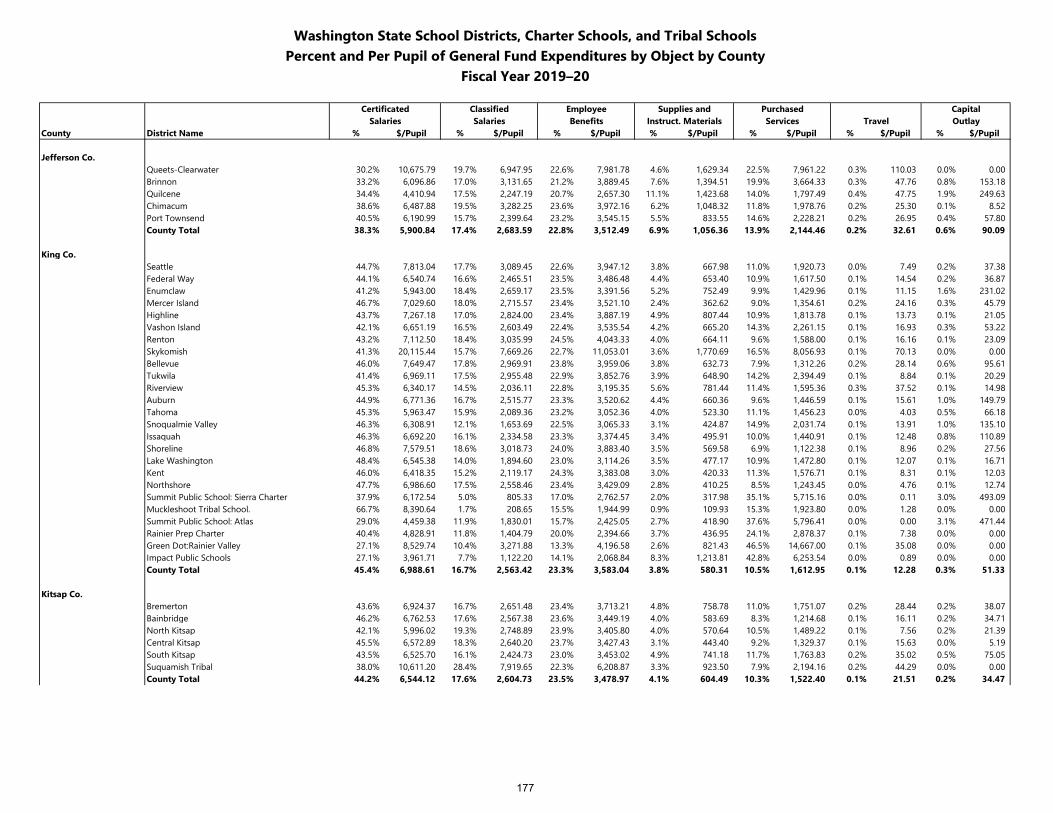
Washington State School Districts, Charter Schools, and Tribal SchoolsPercent and Per Pupil of General Fund Expenditures by Object by County
Fiscal Year 2019–20
Certificated Classified Employee Supplies and Purchased CapitalSalaries Salaries Benefits Instruct. Materials Services Travel Outlay
County District Name % $/Pupil % $/Pupil % $/Pupil % $/Pupil % $/Pupil % $/Pupil % $/Pupil
Jefferson Co.Queets-Clearwater 30.2% 10,675.79 19.7% 6,947.95 22.6% 7,981.78 4.6% 1,629.34 22.5% 7,961.22 0.3% 110.03 0.0% 0.00Brinnon 33.2% 6,096.86 17.0% 3,131.65 21.2% 3,889.45 7.6% 1,394.51 19.9% 3,664.33 0.3% 47.76 0.8% 153.18Quilcene 34.4% 4,410.94 17.5% 2,247.19 20.7% 2,657.30 11.1% 1,423.68 14.0% 1,797.49 0.4% 47.75 1.9% 249.63Chimacum 38.6% 6,487.88 19.5% 3,282.25 23.6% 3,972.16 6.2% 1,048.32 11.8% 1,978.76 0.2% 25.30 0.1% 8.52Port Townsend 40.5% 6,190.99 15.7% 2,399.64 23.2% 3,545.15 5.5% 833.55 14.6% 2,228.21 0.2% 26.95 0.4% 57.80County Total 38.3% 5,900.84 17.4% 2,683.59 22.8% 3,512.49 6.9% 1,056.36 13.9% 2,144.46 0.2% 32.61 0.6% 90.09
King Co.Seattle 44.7% 7,813.04 17.7% 3,089.45 22.6% 3,947.12 3.8% 667.98 11.0% 1,920.73 0.0% 7.49 0.2% 37.38Federal Way 44.1% 6,540.74 16.6% 2,465.51 23.5% 3,486.48 4.4% 653.40 10.9% 1,617.50 0.1% 14.54 0.2% 36.87Enumclaw 41.2% 5,943.00 18.4% 2,659.17 23.5% 3,391.56 5.2% 752.49 9.9% 1,429.96 0.1% 11.15 1.6% 231.02Mercer Island 46.7% 7,029.60 18.0% 2,715.57 23.4% 3,521.10 2.4% 362.62 9.0% 1,354.61 0.2% 24.16 0.3% 45.79Highline 43.7% 7,267.18 17.0% 2,824.00 23.4% 3,887.19 4.9% 807.44 10.9% 1,813.78 0.1% 13.73 0.1% 21.05Vashon Island 42.1% 6,651.19 16.5% 2,603.49 22.4% 3,535.54 4.2% 665.20 14.3% 2,261.15 0.1% 16.93 0.3% 53.22Renton 43.2% 7,112.50 18.4% 3,035.99 24.5% 4,043.33 4.0% 664.11 9.6% 1,588.00 0.1% 16.16 0.1% 23.09Skykomish 41.3% 20,115.44 15.7% 7,669.26 22.7% 11,053.01 3.6% 1,770.69 16.5% 8,056.93 0.1% 70.13 0.0% 0.00Bellevue 46.0% 7,649.47 17.8% 2,969.91 23.8% 3,959.06 3.8% 632.73 7.9% 1,312.26 0.2% 28.14 0.6% 95.61Tukwila 41.4% 6,969.11 17.5% 2,955.48 22.9% 3,852.76 3.9% 648.90 14.2% 2,394.49 0.1% 8.84 0.1% 20.29Riverview 45.3% 6,340.17 14.5% 2,036.11 22.8% 3,195.35 5.6% 781.44 11.4% 1,595.36 0.3% 37.52 0.1% 14.98Auburn 44.9% 6,771.36 16.7% 2,515.77 23.3% 3,520.62 4.4% 660.36 9.6% 1,446.59 0.1% 15.61 1.0% 149.79Tahoma 45.3% 5,963.47 15.9% 2,089.36 23.2% 3,052.36 4.0% 523.30 11.1% 1,456.23 0.0% 4.03 0.5% 66.18Snoqualmie Valley 46.3% 6,308.91 12.1% 1,653.69 22.5% 3,065.33 3.1% 424.87 14.9% 2,031.74 0.1% 13.91 1.0% 135.10Issaquah 46.3% 6,692.20 16.1% 2,334.58 23.3% 3,374.45 3.4% 495.91 10.0% 1,440.91 0.1% 12.48 0.8% 110.89Shoreline 46.8% 7,579.51 18.6% 3,018.73 24.0% 3,883.40 3.5% 569.58 6.9% 1,122.38 0.1% 8.96 0.2% 27.56Lake Washington 48.4% 6,545.38 14.0% 1,894.60 23.0% 3,114.26 3.5% 477.17 10.9% 1,472.80 0.1% 12.07 0.1% 16.71Kent 46.0% 6,418.35 15.2% 2,119.17 24.3% 3,383.08 3.0% 420.33 11.3% 1,576.71 0.1% 8.31 0.1% 12.03Northshore 47.7% 6,986.60 17.5% 2,558.46 23.4% 3,429.09 2.8% 410.25 8.5% 1,243.45 0.0% 4.76 0.1% 12.74Summit Public School: Sierra Charter 37.9% 6,172.54 5.0% 805.33 17.0% 2,762.57 2.0% 317.98 35.1% 5,715.16 0.0% 0.11 3.0% 493.09Muckleshoot Tribal School. 66.7% 8,390.64 1.7% 208.65 15.5% 1,944.99 0.9% 109.93 15.3% 1,923.80 0.0% 1.28 0.0% 0.00Summit Public School: Atlas 29.0% 4,459.38 11.9% 1,830.01 15.7% 2,425.05 2.7% 418.90 37.6% 5,796.41 0.0% 0.00 3.1% 471.44Rainier Prep Charter 40.4% 4,828.91 11.8% 1,404.79 20.0% 2,394.66 3.7% 436.95 24.1% 2,878.37 0.1% 7.38 0.0% 0.00Green Dot:Rainier Valley 27.1% 8,529.74 10.4% 3,271.88 13.3% 4,196.58 2.6% 821.43 46.5% 14,667.00 0.1% 35.08 0.0% 0.00Impact Public Schools 27.1% 3,961.71 7.7% 1,122.20 14.1% 2,068.84 8.3% 1,213.81 42.8% 6,253.54 0.0% 0.89 0.0% 0.00County Total 45.4% 6,988.61 16.7% 2,563.42 23.3% 3,583.04 3.8% 580.31 10.5% 1,612.95 0.1% 12.28 0.3% 51.33
Kitsap Co.Bremerton 43.6% 6,924.37 16.7% 2,651.48 23.4% 3,713.21 4.8% 758.78 11.0% 1,751.07 0.2% 28.44 0.2% 38.07Bainbridge 46.2% 6,762.53 17.6% 2,567.38 23.6% 3,449.19 4.0% 583.69 8.3% 1,214.68 0.1% 16.11 0.2% 34.71North Kitsap 42.1% 5,996.02 19.3% 2,748.89 23.9% 3,405.80 4.0% 570.64 10.5% 1,489.22 0.1% 7.56 0.2% 21.39Central Kitsap 45.5% 6,572.89 18.3% 2,640.20 23.7% 3,427.43 3.1% 443.40 9.2% 1,329.37 0.1% 15.63 0.0% 5.19South Kitsap 43.5% 6,525.70 16.1% 2,424.73 23.0% 3,453.02 4.9% 741.18 11.7% 1,763.83 0.2% 35.02 0.5% 75.05Suquamish Tribal 38.0% 10,611.20 28.4% 7,919.65 22.3% 6,208.87 3.3% 923.50 7.9% 2,194.16 0.2% 44.29 0.0% 0.00County Total 44.2% 6,544.12 17.6% 2,604.73 23.5% 3,478.97 4.1% 604.49 10.3% 1,522.40 0.1% 21.51 0.2% 34.47
177
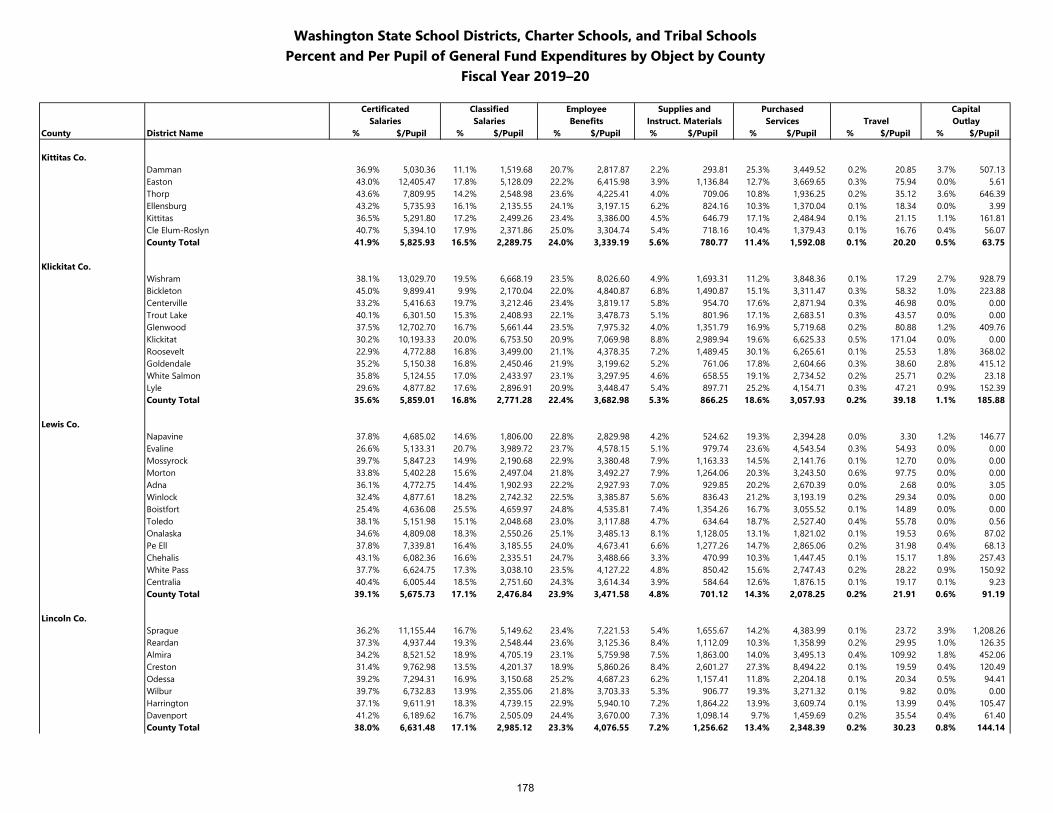
Washington State School Districts, Charter Schools, and Tribal SchoolsPercent and Per Pupil of General Fund Expenditures by Object by County
Fiscal Year 2019–20
Certificated Classified Employee Supplies and Purchased CapitalSalaries Salaries Benefits Instruct. Materials Services Travel Outlay
County District Name % $/Pupil % $/Pupil % $/Pupil % $/Pupil % $/Pupil % $/Pupil % $/Pupil
Kittitas Co.Damman 36.9% 5,030.36 11.1% 1,519.68 20.7% 2,817.87 2.2% 293.81 25.3% 3,449.52 0.2% 20.85 3.7% 507.13Easton 43.0% 12,405.47 17.8% 5,128.09 22.2% 6,415.98 3.9% 1,136.84 12.7% 3,669.65 0.3% 75.94 0.0% 5.61Thorp 43.6% 7,809.95 14.2% 2,548.98 23.6% 4,225.41 4.0% 709.06 10.8% 1,936.25 0.2% 35.12 3.6% 646.39Ellensburg 43.2% 5,735.93 16.1% 2,135.55 24.1% 3,197.15 6.2% 824.16 10.3% 1,370.04 0.1% 18.34 0.0% 3.99Kittitas 36.5% 5,291.80 17.2% 2,499.26 23.4% 3,386.00 4.5% 646.79 17.1% 2,484.94 0.1% 21.15 1.1% 161.81Cle Elum-Roslyn 40.7% 5,394.10 17.9% 2,371.86 25.0% 3,304.74 5.4% 718.16 10.4% 1,379.43 0.1% 16.76 0.4% 56.07County Total 41.9% 5,825.93 16.5% 2,289.75 24.0% 3,339.19 5.6% 780.77 11.4% 1,592.08 0.1% 20.20 0.5% 63.75
Klickitat Co.Wishram 38.1% 13,029.70 19.5% 6,668.19 23.5% 8,026.60 4.9% 1,693.31 11.2% 3,848.36 0.1% 17.29 2.7% 928.79Bickleton 45.0% 9,899.41 9.9% 2,170.04 22.0% 4,840.87 6.8% 1,490.87 15.1% 3,311.47 0.3% 58.32 1.0% 223.88Centerville 33.2% 5,416.63 19.7% 3,212.46 23.4% 3,819.17 5.8% 954.70 17.6% 2,871.94 0.3% 46.98 0.0% 0.00Trout Lake 40.1% 6,301.50 15.3% 2,408.93 22.1% 3,478.73 5.1% 801.96 17.1% 2,683.51 0.3% 43.57 0.0% 0.00Glenwood 37.5% 12,702.70 16.7% 5,661.44 23.5% 7,975.32 4.0% 1,351.79 16.9% 5,719.68 0.2% 80.88 1.2% 409.76Klickitat 30.2% 10,193.33 20.0% 6,753.50 20.9% 7,069.98 8.8% 2,989.94 19.6% 6,625.33 0.5% 171.04 0.0% 0.00Roosevelt 22.9% 4,772.88 16.8% 3,499.00 21.1% 4,378.35 7.2% 1,489.45 30.1% 6,265.61 0.1% 25.53 1.8% 368.02Goldendale 35.2% 5,150.38 16.8% 2,450.46 21.9% 3,199.62 5.2% 761.06 17.8% 2,604.66 0.3% 38.60 2.8% 415.12White Salmon 35.8% 5,124.55 17.0% 2,433.97 23.1% 3,297.95 4.6% 658.55 19.1% 2,734.52 0.2% 25.71 0.2% 23.18Lyle 29.6% 4,877.82 17.6% 2,896.91 20.9% 3,448.47 5.4% 897.71 25.2% 4,154.71 0.3% 47.21 0.9% 152.39County Total 35.6% 5,859.01 16.8% 2,771.28 22.4% 3,682.98 5.3% 866.25 18.6% 3,057.93 0.2% 39.18 1.1% 185.88
Lewis Co.Napavine 37.8% 4,685.02 14.6% 1,806.00 22.8% 2,829.98 4.2% 524.62 19.3% 2,394.28 0.0% 3.30 1.2% 146.77Evaline 26.6% 5,133.31 20.7% 3,989.72 23.7% 4,578.15 5.1% 979.74 23.6% 4,543.54 0.3% 54.93 0.0% 0.00Mossyrock 39.7% 5,847.23 14.9% 2,190.68 22.9% 3,380.48 7.9% 1,163.33 14.5% 2,141.76 0.1% 12.70 0.0% 0.00Morton 33.8% 5,402.28 15.6% 2,497.04 21.8% 3,492.27 7.9% 1,264.06 20.3% 3,243.50 0.6% 97.75 0.0% 0.00Adna 36.1% 4,772.75 14.4% 1,902.93 22.2% 2,927.93 7.0% 929.85 20.2% 2,670.39 0.0% 2.68 0.0% 3.05Winlock 32.4% 4,877.61 18.2% 2,742.32 22.5% 3,385.87 5.6% 836.43 21.2% 3,193.19 0.2% 29.34 0.0% 0.00Boistfort 25.4% 4,636.08 25.5% 4,659.97 24.8% 4,535.81 7.4% 1,354.26 16.7% 3,055.52 0.1% 14.89 0.0% 0.00Toledo 38.1% 5,151.98 15.1% 2,048.68 23.0% 3,117.88 4.7% 634.64 18.7% 2,527.40 0.4% 55.78 0.0% 0.56Onalaska 34.6% 4,809.08 18.3% 2,550.26 25.1% 3,485.13 8.1% 1,128.05 13.1% 1,821.02 0.1% 19.53 0.6% 87.02Pe Ell 37.8% 7,339.81 16.4% 3,185.55 24.0% 4,673.41 6.6% 1,277.26 14.7% 2,865.06 0.2% 31.98 0.4% 68.13Chehalis 43.1% 6,082.36 16.6% 2,335.51 24.7% 3,488.66 3.3% 470.99 10.3% 1,447.45 0.1% 15.17 1.8% 257.43White Pass 37.7% 6,624.75 17.3% 3,038.10 23.5% 4,127.22 4.8% 850.42 15.6% 2,747.43 0.2% 28.22 0.9% 150.92Centralia 40.4% 6,005.44 18.5% 2,751.60 24.3% 3,614.34 3.9% 584.64 12.6% 1,876.15 0.1% 19.17 0.1% 9.23County Total 39.1% 5,675.73 17.1% 2,476.84 23.9% 3,471.58 4.8% 701.12 14.3% 2,078.25 0.2% 21.91 0.6% 91.19
Lincoln Co.Sprague 36.2% 11,155.44 16.7% 5,149.62 23.4% 7,221.53 5.4% 1,655.67 14.2% 4,383.99 0.1% 23.72 3.9% 1,208.26Reardan 37.3% 4,937.44 19.3% 2,548.44 23.6% 3,125.36 8.4% 1,112.09 10.3% 1,358.99 0.2% 29.95 1.0% 126.35Almira 34.2% 8,521.52 18.9% 4,705.19 23.1% 5,759.98 7.5% 1,863.00 14.0% 3,495.13 0.4% 109.92 1.8% 452.06Creston 31.4% 9,762.98 13.5% 4,201.37 18.9% 5,860.26 8.4% 2,601.27 27.3% 8,494.22 0.1% 19.59 0.4% 120.49Odessa 39.2% 7,294.31 16.9% 3,150.68 25.2% 4,687.23 6.2% 1,157.41 11.8% 2,204.18 0.1% 20.34 0.5% 94.41Wilbur 39.7% 6,732.83 13.9% 2,355.06 21.8% 3,703.33 5.3% 906.77 19.3% 3,271.32 0.1% 9.82 0.0% 0.00Harrington 37.1% 9,611.91 18.3% 4,739.15 22.9% 5,940.10 7.2% 1,864.22 13.9% 3,609.74 0.1% 13.99 0.4% 105.47Davenport 41.2% 6,189.62 16.7% 2,505.09 24.4% 3,670.00 7.3% 1,098.14 9.7% 1,459.69 0.2% 35.54 0.4% 61.40County Total 38.0% 6,631.48 17.1% 2,985.12 23.3% 4,076.55 7.2% 1,256.62 13.4% 2,348.39 0.2% 30.23 0.8% 144.14
178
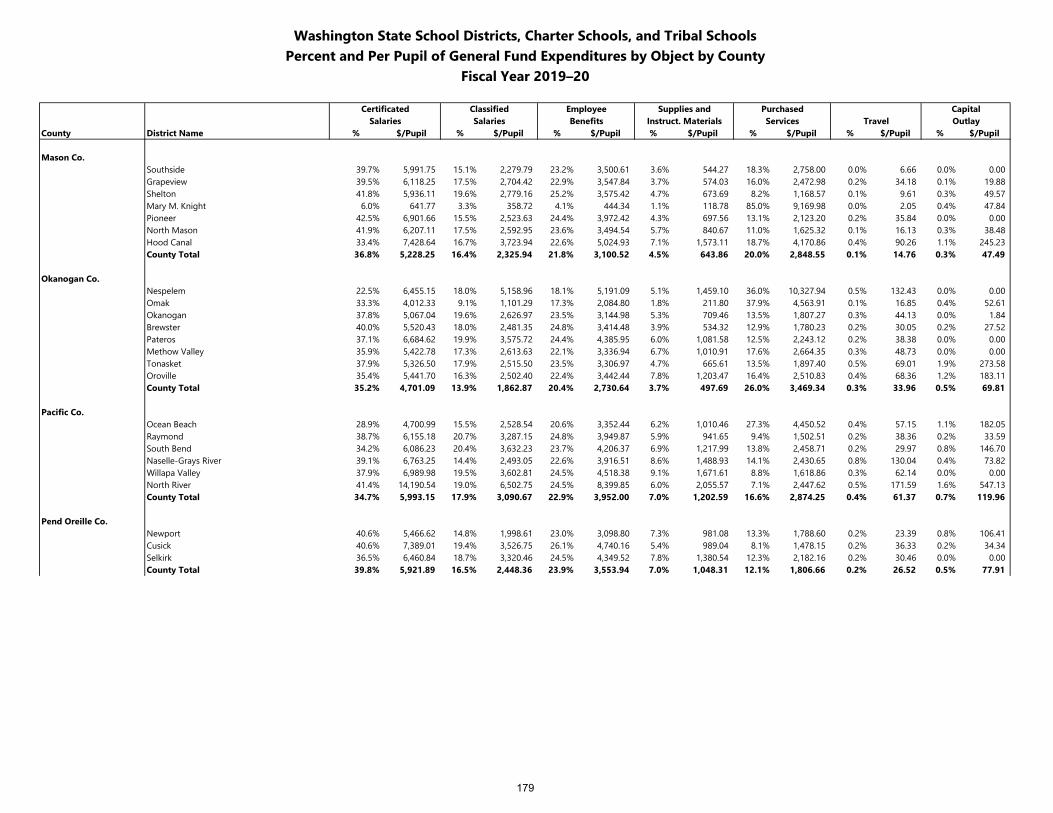
Washington State School Districts, Charter Schools, and Tribal SchoolsPercent and Per Pupil of General Fund Expenditures by Object by County
Fiscal Year 2019–20
Certificated Classified Employee Supplies and Purchased CapitalSalaries Salaries Benefits Instruct. Materials Services Travel Outlay
County District Name % $/Pupil % $/Pupil % $/Pupil % $/Pupil % $/Pupil % $/Pupil % $/Pupil
Mason Co.Southside 39.7% 5,991.75 15.1% 2,279.79 23.2% 3,500.61 3.6% 544.27 18.3% 2,758.00 0.0% 6.66 0.0% 0.00Grapeview 39.5% 6,118.25 17.5% 2,704.42 22.9% 3,547.84 3.7% 574.03 16.0% 2,472.98 0.2% 34.18 0.1% 19.88Shelton 41.8% 5,936.11 19.6% 2,779.16 25.2% 3,575.42 4.7% 673.69 8.2% 1,168.57 0.1% 9.61 0.3% 49.57Mary M. Knight 6.0% 641.77 3.3% 358.72 4.1% 444.34 1.1% 118.78 85.0% 9,169.98 0.0% 2.05 0.4% 47.84Pioneer 42.5% 6,901.66 15.5% 2,523.63 24.4% 3,972.42 4.3% 697.56 13.1% 2,123.20 0.2% 35.84 0.0% 0.00North Mason 41.9% 6,207.11 17.5% 2,592.95 23.6% 3,494.54 5.7% 840.67 11.0% 1,625.32 0.1% 16.13 0.3% 38.48Hood Canal 33.4% 7,428.64 16.7% 3,723.94 22.6% 5,024.93 7.1% 1,573.11 18.7% 4,170.86 0.4% 90.26 1.1% 245.23County Total 36.8% 5,228.25 16.4% 2,325.94 21.8% 3,100.52 4.5% 643.86 20.0% 2,848.55 0.1% 14.76 0.3% 47.49
Okanogan Co.Nespelem 22.5% 6,455.15 18.0% 5,158.96 18.1% 5,191.09 5.1% 1,459.10 36.0% 10,327.94 0.5% 132.43 0.0% 0.00Omak 33.3% 4,012.33 9.1% 1,101.29 17.3% 2,084.80 1.8% 211.80 37.9% 4,563.91 0.1% 16.85 0.4% 52.61Okanogan 37.8% 5,067.04 19.6% 2,626.97 23.5% 3,144.98 5.3% 709.46 13.5% 1,807.27 0.3% 44.13 0.0% 1.84Brewster 40.0% 5,520.43 18.0% 2,481.35 24.8% 3,414.48 3.9% 534.32 12.9% 1,780.23 0.2% 30.05 0.2% 27.52Pateros 37.1% 6,684.62 19.9% 3,575.72 24.4% 4,385.95 6.0% 1,081.58 12.5% 2,243.12 0.2% 38.38 0.0% 0.00Methow Valley 35.9% 5,422.78 17.3% 2,613.63 22.1% 3,336.94 6.7% 1,010.91 17.6% 2,664.35 0.3% 48.73 0.0% 0.00Tonasket 37.9% 5,326.50 17.9% 2,515.50 23.5% 3,306.97 4.7% 665.61 13.5% 1,897.40 0.5% 69.01 1.9% 273.58Oroville 35.4% 5,441.70 16.3% 2,502.40 22.4% 3,442.44 7.8% 1,203.47 16.4% 2,510.83 0.4% 68.36 1.2% 183.11County Total 35.2% 4,701.09 13.9% 1,862.87 20.4% 2,730.64 3.7% 497.69 26.0% 3,469.34 0.3% 33.96 0.5% 69.81
Pacific Co.Ocean Beach 28.9% 4,700.99 15.5% 2,528.54 20.6% 3,352.44 6.2% 1,010.46 27.3% 4,450.52 0.4% 57.15 1.1% 182.05Raymond 38.7% 6,155.18 20.7% 3,287.15 24.8% 3,949.87 5.9% 941.65 9.4% 1,502.51 0.2% 38.36 0.2% 33.59South Bend 34.2% 6,086.23 20.4% 3,632.23 23.7% 4,206.37 6.9% 1,217.99 13.8% 2,458.71 0.2% 29.97 0.8% 146.70Naselle-Grays River 39.1% 6,763.25 14.4% 2,493.05 22.6% 3,916.51 8.6% 1,488.93 14.1% 2,430.65 0.8% 130.04 0.4% 73.82Willapa Valley 37.9% 6,989.98 19.5% 3,602.81 24.5% 4,518.38 9.1% 1,671.61 8.8% 1,618.86 0.3% 62.14 0.0% 0.00North River 41.4% 14,190.54 19.0% 6,502.75 24.5% 8,399.85 6.0% 2,055.57 7.1% 2,447.62 0.5% 171.59 1.6% 547.13County Total 34.7% 5,993.15 17.9% 3,090.67 22.9% 3,952.00 7.0% 1,202.59 16.6% 2,874.25 0.4% 61.37 0.7% 119.96
Pend Oreille Co.Newport 40.6% 5,466.62 14.8% 1,998.61 23.0% 3,098.80 7.3% 981.08 13.3% 1,788.60 0.2% 23.39 0.8% 106.41Cusick 40.6% 7,389.01 19.4% 3,526.75 26.1% 4,740.16 5.4% 989.04 8.1% 1,478.15 0.2% 36.33 0.2% 34.34Selkirk 36.5% 6,460.84 18.7% 3,320.46 24.5% 4,349.52 7.8% 1,380.54 12.3% 2,182.16 0.2% 30.46 0.0% 0.00County Total 39.8% 5,921.89 16.5% 2,448.36 23.9% 3,553.94 7.0% 1,048.31 12.1% 1,806.66 0.2% 26.52 0.5% 77.91
179
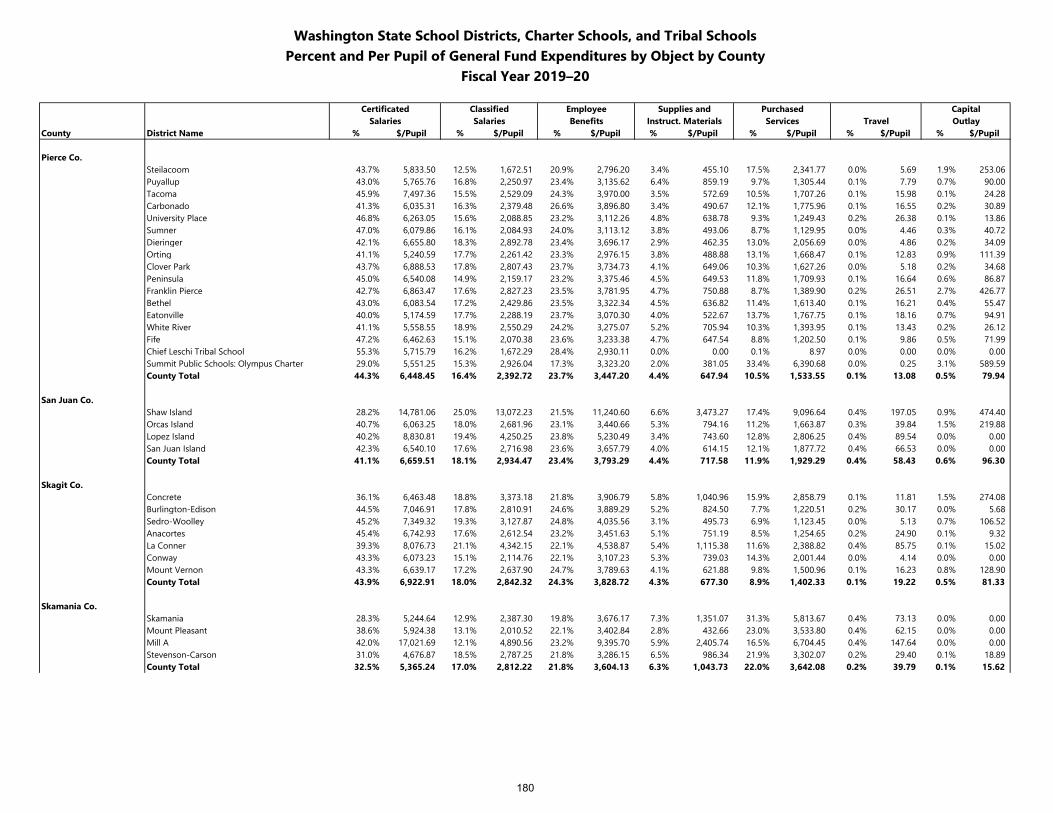
Washington State School Districts, Charter Schools, and Tribal SchoolsPercent and Per Pupil of General Fund Expenditures by Object by County
Fiscal Year 2019–20
Certificated Classified Employee Supplies and Purchased CapitalSalaries Salaries Benefits Instruct. Materials Services Travel Outlay
County District Name % $/Pupil % $/Pupil % $/Pupil % $/Pupil % $/Pupil % $/Pupil % $/Pupil
Pierce Co.Steilacoom 43.7% 5,833.50 12.5% 1,672.51 20.9% 2,796.20 3.4% 455.10 17.5% 2,341.77 0.0% 5.69 1.9% 253.06Puyallup 43.0% 5,765.76 16.8% 2,250.97 23.4% 3,135.62 6.4% 859.19 9.7% 1,305.44 0.1% 7.79 0.7% 90.00Tacoma 45.9% 7,497.36 15.5% 2,529.09 24.3% 3,970.00 3.5% 572.69 10.5% 1,707.26 0.1% 15.98 0.1% 24.28Carbonado 41.3% 6,035.31 16.3% 2,379.48 26.6% 3,896.80 3.4% 490.67 12.1% 1,775.96 0.1% 16.55 0.2% 30.89University Place 46.8% 6,263.05 15.6% 2,088.85 23.2% 3,112.26 4.8% 638.78 9.3% 1,249.43 0.2% 26.38 0.1% 13.86Sumner 47.0% 6,079.86 16.1% 2,084.93 24.0% 3,113.12 3.8% 493.06 8.7% 1,129.95 0.0% 4.46 0.3% 40.72Dieringer 42.1% 6,655.80 18.3% 2,892.78 23.4% 3,696.17 2.9% 462.35 13.0% 2,056.69 0.0% 4.86 0.2% 34.09Orting 41.1% 5,240.59 17.7% 2,261.42 23.3% 2,976.15 3.8% 488.88 13.1% 1,668.47 0.1% 12.83 0.9% 111.39Clover Park 43.7% 6,888.53 17.8% 2,807.43 23.7% 3,734.73 4.1% 649.06 10.3% 1,627.26 0.0% 5.18 0.2% 34.68Peninsula 45.0% 6,540.08 14.9% 2,159.17 23.2% 3,375.46 4.5% 649.53 11.8% 1,709.93 0.1% 16.64 0.6% 86.87Franklin Pierce 42.7% 6,863.47 17.6% 2,827.23 23.5% 3,781.95 4.7% 750.88 8.7% 1,389.90 0.2% 26.51 2.7% 426.77Bethel 43.0% 6,083.54 17.2% 2,429.86 23.5% 3,322.34 4.5% 636.82 11.4% 1,613.40 0.1% 16.21 0.4% 55.47Eatonville 40.0% 5,174.59 17.7% 2,288.19 23.7% 3,070.30 4.0% 522.67 13.7% 1,767.75 0.1% 18.16 0.7% 94.91White River 41.1% 5,558.55 18.9% 2,550.29 24.2% 3,275.07 5.2% 705.94 10.3% 1,393.95 0.1% 13.43 0.2% 26.12Fife 47.2% 6,462.63 15.1% 2,070.38 23.6% 3,233.38 4.7% 647.54 8.8% 1,202.50 0.1% 9.86 0.5% 71.99Chief Leschi Tribal School 55.3% 5,715.79 16.2% 1,672.29 28.4% 2,930.11 0.0% 0.00 0.1% 8.97 0.0% 0.00 0.0% 0.00Summit Public Schools: Olympus Charter 29.0% 5,551.25 15.3% 2,926.04 17.3% 3,323.20 2.0% 381.05 33.4% 6,390.68 0.0% 0.25 3.1% 589.59County Total 44.3% 6,448.45 16.4% 2,392.72 23.7% 3,447.20 4.4% 647.94 10.5% 1,533.55 0.1% 13.08 0.5% 79.94
San Juan Co.Shaw Island 28.2% 14,781.06 25.0% 13,072.23 21.5% 11,240.60 6.6% 3,473.27 17.4% 9,096.64 0.4% 197.05 0.9% 474.40Orcas Island 40.7% 6,063.25 18.0% 2,681.96 23.1% 3,440.66 5.3% 794.16 11.2% 1,663.87 0.3% 39.84 1.5% 219.88Lopez Island 40.2% 8,830.81 19.4% 4,250.25 23.8% 5,230.49 3.4% 743.60 12.8% 2,806.25 0.4% 89.54 0.0% 0.00San Juan Island 42.3% 6,540.10 17.6% 2,716.98 23.6% 3,657.79 4.0% 614.15 12.1% 1,877.72 0.4% 66.53 0.0% 0.00County Total 41.1% 6,659.51 18.1% 2,934.47 23.4% 3,793.29 4.4% 717.58 11.9% 1,929.29 0.4% 58.43 0.6% 96.30
Skagit Co.Concrete 36.1% 6,463.48 18.8% 3,373.18 21.8% 3,906.79 5.8% 1,040.96 15.9% 2,858.79 0.1% 11.81 1.5% 274.08Burlington-Edison 44.5% 7,046.91 17.8% 2,810.91 24.6% 3,889.29 5.2% 824.50 7.7% 1,220.51 0.2% 30.17 0.0% 5.68Sedro-Woolley 45.2% 7,349.32 19.3% 3,127.87 24.8% 4,035.56 3.1% 495.73 6.9% 1,123.45 0.0% 5.13 0.7% 106.52Anacortes 45.4% 6,742.93 17.6% 2,612.54 23.2% 3,451.63 5.1% 751.19 8.5% 1,254.65 0.2% 24.90 0.1% 9.32La Conner 39.3% 8,076.73 21.1% 4,342.15 22.1% 4,538.87 5.4% 1,115.38 11.6% 2,388.82 0.4% 85.75 0.1% 15.02Conway 43.3% 6,073.23 15.1% 2,114.76 22.1% 3,107.23 5.3% 739.03 14.3% 2,001.44 0.0% 4.14 0.0% 0.00Mount Vernon 43.3% 6,639.17 17.2% 2,637.90 24.7% 3,789.63 4.1% 621.88 9.8% 1,500.96 0.1% 16.23 0.8% 128.90County Total 43.9% 6,922.91 18.0% 2,842.32 24.3% 3,828.72 4.3% 677.30 8.9% 1,402.33 0.1% 19.22 0.5% 81.33
Skamania Co.Skamania 28.3% 5,244.64 12.9% 2,387.30 19.8% 3,676.17 7.3% 1,351.07 31.3% 5,813.67 0.4% 73.13 0.0% 0.00Mount Pleasant 38.6% 5,924.38 13.1% 2,010.52 22.1% 3,402.84 2.8% 432.66 23.0% 3,533.80 0.4% 62.15 0.0% 0.00Mill A 42.0% 17,021.69 12.1% 4,890.56 23.2% 9,395.70 5.9% 2,405.74 16.5% 6,704.45 0.4% 147.64 0.0% 0.00Stevenson-Carson 31.0% 4,676.87 18.5% 2,787.25 21.8% 3,286.15 6.5% 986.34 21.9% 3,302.07 0.2% 29.40 0.1% 18.89County Total 32.5% 5,365.24 17.0% 2,812.22 21.8% 3,604.13 6.3% 1,043.73 22.0% 3,642.08 0.2% 39.79 0.1% 15.62
180
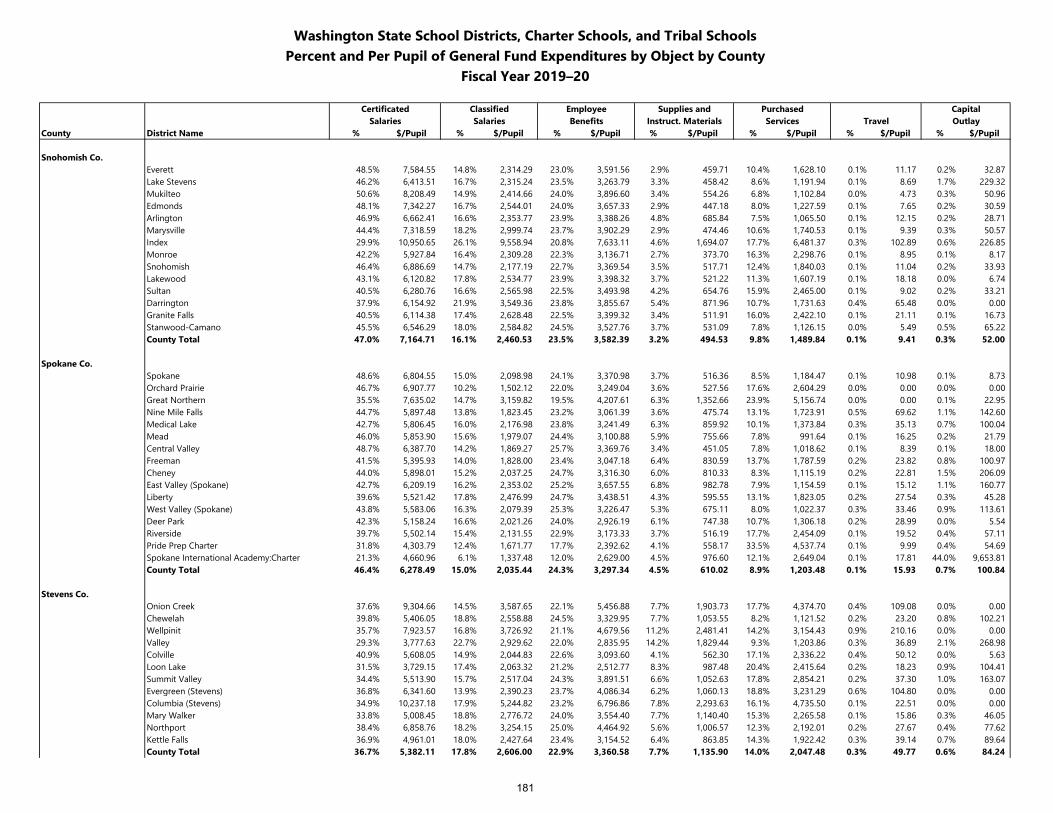
Washington State School Districts, Charter Schools, and Tribal SchoolsPercent and Per Pupil of General Fund Expenditures by Object by County
Fiscal Year 2019–20
Certificated Classified Employee Supplies and Purchased CapitalSalaries Salaries Benefits Instruct. Materials Services Travel Outlay
County District Name % $/Pupil % $/Pupil % $/Pupil % $/Pupil % $/Pupil % $/Pupil % $/Pupil
Snohomish Co.Everett 48.5% 7,584.55 14.8% 2,314.29 23.0% 3,591.56 2.9% 459.71 10.4% 1,628.10 0.1% 11.17 0.2% 32.87Lake Stevens 46.2% 6,413.51 16.7% 2,315.24 23.5% 3,263.79 3.3% 458.42 8.6% 1,191.94 0.1% 8.69 1.7% 229.32Mukilteo 50.6% 8,208.49 14.9% 2,414.66 24.0% 3,896.60 3.4% 554.26 6.8% 1,102.84 0.0% 4.73 0.3% 50.96Edmonds 48.1% 7,342.27 16.7% 2,544.01 24.0% 3,657.33 2.9% 447.18 8.0% 1,227.59 0.1% 7.65 0.2% 30.59Arlington 46.9% 6,662.41 16.6% 2,353.77 23.9% 3,388.26 4.8% 685.84 7.5% 1,065.50 0.1% 12.15 0.2% 28.71Marysville 44.4% 7,318.59 18.2% 2,999.74 23.7% 3,902.29 2.9% 474.46 10.6% 1,740.53 0.1% 9.39 0.3% 50.57Index 29.9% 10,950.65 26.1% 9,558.94 20.8% 7,633.11 4.6% 1,694.07 17.7% 6,481.37 0.3% 102.89 0.6% 226.85Monroe 42.2% 5,927.84 16.4% 2,309.28 22.3% 3,136.71 2.7% 373.70 16.3% 2,298.76 0.1% 8.95 0.1% 8.17Snohomish 46.4% 6,886.69 14.7% 2,177.19 22.7% 3,369.54 3.5% 517.71 12.4% 1,840.03 0.1% 11.04 0.2% 33.93Lakewood 43.1% 6,120.82 17.8% 2,534.77 23.9% 3,398.32 3.7% 521.22 11.3% 1,607.19 0.1% 18.18 0.0% 6.74Sultan 40.5% 6,280.76 16.6% 2,565.98 22.5% 3,493.98 4.2% 654.76 15.9% 2,465.00 0.1% 9.02 0.2% 33.21Darrington 37.9% 6,154.92 21.9% 3,549.36 23.8% 3,855.67 5.4% 871.96 10.7% 1,731.63 0.4% 65.48 0.0% 0.00Granite Falls 40.5% 6,114.38 17.4% 2,628.48 22.5% 3,399.32 3.4% 511.91 16.0% 2,422.10 0.1% 21.11 0.1% 16.73Stanwood-Camano 45.5% 6,546.29 18.0% 2,584.82 24.5% 3,527.76 3.7% 531.09 7.8% 1,126.15 0.0% 5.49 0.5% 65.22County Total 47.0% 7,164.71 16.1% 2,460.53 23.5% 3,582.39 3.2% 494.53 9.8% 1,489.84 0.1% 9.41 0.3% 52.00
Spokane Co.Spokane 48.6% 6,804.55 15.0% 2,098.98 24.1% 3,370.98 3.7% 516.36 8.5% 1,184.47 0.1% 10.98 0.1% 8.73Orchard Prairie 46.7% 6,907.77 10.2% 1,502.12 22.0% 3,249.04 3.6% 527.56 17.6% 2,604.29 0.0% 0.00 0.0% 0.00Great Northern 35.5% 7,635.02 14.7% 3,159.82 19.5% 4,207.61 6.3% 1,352.66 23.9% 5,156.74 0.0% 0.00 0.1% 22.95Nine Mile Falls 44.7% 5,897.48 13.8% 1,823.45 23.2% 3,061.39 3.6% 475.74 13.1% 1,723.91 0.5% 69.62 1.1% 142.60Medical Lake 42.7% 5,806.45 16.0% 2,176.98 23.8% 3,241.49 6.3% 859.92 10.1% 1,373.84 0.3% 35.13 0.7% 100.04Mead 46.0% 5,853.90 15.6% 1,979.07 24.4% 3,100.88 5.9% 755.66 7.8% 991.64 0.1% 16.25 0.2% 21.79Central Valley 48.7% 6,387.70 14.2% 1,869.27 25.7% 3,369.76 3.4% 451.05 7.8% 1,018.62 0.1% 8.39 0.1% 18.00Freeman 41.5% 5,395.93 14.0% 1,828.00 23.4% 3,047.18 6.4% 830.59 13.7% 1,787.59 0.2% 23.82 0.8% 100.97Cheney 44.0% 5,898.01 15.2% 2,037.25 24.7% 3,316.30 6.0% 810.33 8.3% 1,115.19 0.2% 22.81 1.5% 206.09East Valley (Spokane) 42.7% 6,209.19 16.2% 2,353.02 25.2% 3,657.55 6.8% 982.78 7.9% 1,154.59 0.1% 15.12 1.1% 160.77Liberty 39.6% 5,521.42 17.8% 2,476.99 24.7% 3,438.51 4.3% 595.55 13.1% 1,823.05 0.2% 27.54 0.3% 45.28West Valley (Spokane) 43.8% 5,583.06 16.3% 2,079.39 25.3% 3,226.47 5.3% 675.11 8.0% 1,022.37 0.3% 33.46 0.9% 113.61Deer Park 42.3% 5,158.24 16.6% 2,021.26 24.0% 2,926.19 6.1% 747.38 10.7% 1,306.18 0.2% 28.99 0.0% 5.54Riverside 39.7% 5,502.14 15.4% 2,131.55 22.9% 3,173.33 3.7% 516.19 17.7% 2,454.09 0.1% 19.52 0.4% 57.11Pride Prep Charter 31.8% 4,303.79 12.4% 1,671.77 17.7% 2,392.62 4.1% 558.17 33.5% 4,537.74 0.1% 9.99 0.4% 54.69Spokane International Academy:Charter 21.3% 4,660.96 6.1% 1,337.48 12.0% 2,629.00 4.5% 976.60 12.1% 2,649.04 0.1% 17.81 44.0% 9,653.81County Total 46.4% 6,278.49 15.0% 2,035.44 24.3% 3,297.34 4.5% 610.02 8.9% 1,203.48 0.1% 15.93 0.7% 100.84
Stevens Co.Onion Creek 37.6% 9,304.66 14.5% 3,587.65 22.1% 5,456.88 7.7% 1,903.73 17.7% 4,374.70 0.4% 109.08 0.0% 0.00Chewelah 39.8% 5,406.05 18.8% 2,558.88 24.5% 3,329.95 7.7% 1,053.55 8.2% 1,121.52 0.2% 23.20 0.8% 102.21Wellpinit 35.7% 7,923.57 16.8% 3,726.92 21.1% 4,679.56 11.2% 2,481.41 14.2% 3,154.43 0.9% 210.16 0.0% 0.00Valley 29.3% 3,777.63 22.7% 2,929.62 22.0% 2,835.95 14.2% 1,829.44 9.3% 1,203.86 0.3% 36.89 2.1% 268.98Colville 40.9% 5,608.05 14.9% 2,044.83 22.6% 3,093.60 4.1% 562.30 17.1% 2,336.22 0.4% 50.12 0.0% 5.63Loon Lake 31.5% 3,729.15 17.4% 2,063.32 21.2% 2,512.77 8.3% 987.48 20.4% 2,415.64 0.2% 18.23 0.9% 104.41Summit Valley 34.4% 5,513.90 15.7% 2,517.04 24.3% 3,891.51 6.6% 1,052.63 17.8% 2,854.21 0.2% 37.30 1.0% 163.07Evergreen (Stevens) 36.8% 6,341.60 13.9% 2,390.23 23.7% 4,086.34 6.2% 1,060.13 18.8% 3,231.29 0.6% 104.80 0.0% 0.00Columbia (Stevens) 34.9% 10,237.18 17.9% 5,244.82 23.2% 6,796.86 7.8% 2,293.63 16.1% 4,735.50 0.1% 22.51 0.0% 0.00Mary Walker 33.8% 5,008.45 18.8% 2,776.72 24.0% 3,554.40 7.7% 1,140.40 15.3% 2,265.58 0.1% 15.86 0.3% 46.05Northport 38.4% 6,858.76 18.2% 3,254.15 25.0% 4,464.92 5.6% 1,006.57 12.3% 2,192.01 0.2% 27.67 0.4% 77.62Kettle Falls 36.9% 4,961.01 18.0% 2,427.64 23.4% 3,154.52 6.4% 863.85 14.3% 1,922.42 0.3% 39.14 0.7% 89.64County Total 36.7% 5,382.11 17.8% 2,606.00 22.9% 3,360.58 7.7% 1,135.90 14.0% 2,047.48 0.3% 49.77 0.6% 84.24
181
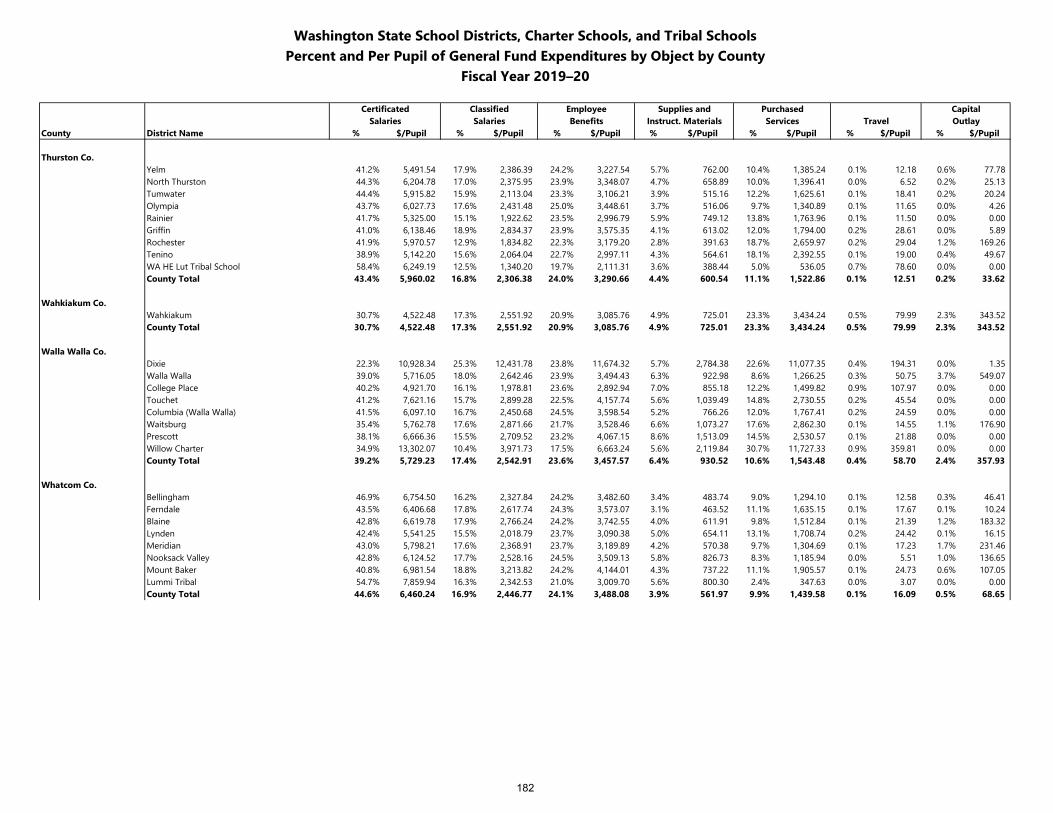
Washington State School Districts, Charter Schools, and Tribal SchoolsPercent and Per Pupil of General Fund Expenditures by Object by County
Fiscal Year 2019–20
Certificated Classified Employee Supplies and Purchased CapitalSalaries Salaries Benefits Instruct. Materials Services Travel Outlay
County District Name % $/Pupil % $/Pupil % $/Pupil % $/Pupil % $/Pupil % $/Pupil % $/Pupil
Thurston Co.Yelm 41.2% 5,491.54 17.9% 2,386.39 24.2% 3,227.54 5.7% 762.00 10.4% 1,385.24 0.1% 12.18 0.6% 77.78North Thurston 44.3% 6,204.78 17.0% 2,375.95 23.9% 3,348.07 4.7% 658.89 10.0% 1,396.41 0.0% 6.52 0.2% 25.13Tumwater 44.4% 5,915.82 15.9% 2,113.04 23.3% 3,106.21 3.9% 515.16 12.2% 1,625.61 0.1% 18.41 0.2% 20.24Olympia 43.7% 6,027.73 17.6% 2,431.48 25.0% 3,448.61 3.7% 516.06 9.7% 1,340.89 0.1% 11.65 0.0% 4.26Rainier 41.7% 5,325.00 15.1% 1,922.62 23.5% 2,996.79 5.9% 749.12 13.8% 1,763.96 0.1% 11.50 0.0% 0.00Griffin 41.0% 6,138.46 18.9% 2,834.37 23.9% 3,575.35 4.1% 613.02 12.0% 1,794.00 0.2% 28.61 0.0% 5.89Rochester 41.9% 5,970.57 12.9% 1,834.82 22.3% 3,179.20 2.8% 391.63 18.7% 2,659.97 0.2% 29.04 1.2% 169.26Tenino 38.9% 5,142.20 15.6% 2,064.04 22.7% 2,997.11 4.3% 564.61 18.1% 2,392.55 0.1% 19.00 0.4% 49.67WA HE Lut Tribal School 58.4% 6,249.19 12.5% 1,340.20 19.7% 2,111.31 3.6% 388.44 5.0% 536.05 0.7% 78.60 0.0% 0.00County Total 43.4% 5,960.02 16.8% 2,306.38 24.0% 3,290.66 4.4% 600.54 11.1% 1,522.86 0.1% 12.51 0.2% 33.62
Wahkiakum Co.Wahkiakum 30.7% 4,522.48 17.3% 2,551.92 20.9% 3,085.76 4.9% 725.01 23.3% 3,434.24 0.5% 79.99 2.3% 343.52County Total 30.7% 4,522.48 17.3% 2,551.92 20.9% 3,085.76 4.9% 725.01 23.3% 3,434.24 0.5% 79.99 2.3% 343.52
Walla Walla Co.Dixie 22.3% 10,928.34 25.3% 12,431.78 23.8% 11,674.32 5.7% 2,784.38 22.6% 11,077.35 0.4% 194.31 0.0% 1.35Walla Walla 39.0% 5,716.05 18.0% 2,642.46 23.9% 3,494.43 6.3% 922.98 8.6% 1,266.25 0.3% 50.75 3.7% 549.07College Place 40.2% 4,921.70 16.1% 1,978.81 23.6% 2,892.94 7.0% 855.18 12.2% 1,499.82 0.9% 107.97 0.0% 0.00Touchet 41.2% 7,621.16 15.7% 2,899.28 22.5% 4,157.74 5.6% 1,039.49 14.8% 2,730.55 0.2% 45.54 0.0% 0.00Columbia (Walla Walla) 41.5% 6,097.10 16.7% 2,450.68 24.5% 3,598.54 5.2% 766.26 12.0% 1,767.41 0.2% 24.59 0.0% 0.00Waitsburg 35.4% 5,762.78 17.6% 2,871.66 21.7% 3,528.46 6.6% 1,073.27 17.6% 2,862.30 0.1% 14.55 1.1% 176.90Prescott 38.1% 6,666.36 15.5% 2,709.52 23.2% 4,067.15 8.6% 1,513.09 14.5% 2,530.57 0.1% 21.88 0.0% 0.00Willow Charter 34.9% 13,302.07 10.4% 3,971.73 17.5% 6,663.24 5.6% 2,119.84 30.7% 11,727.33 0.9% 359.81 0.0% 0.00County Total 39.2% 5,729.23 17.4% 2,542.91 23.6% 3,457.57 6.4% 930.52 10.6% 1,543.48 0.4% 58.70 2.4% 357.93
Whatcom Co.Bellingham 46.9% 6,754.50 16.2% 2,327.84 24.2% 3,482.60 3.4% 483.74 9.0% 1,294.10 0.1% 12.58 0.3% 46.41Ferndale 43.5% 6,406.68 17.8% 2,617.74 24.3% 3,573.07 3.1% 463.52 11.1% 1,635.15 0.1% 17.67 0.1% 10.24Blaine 42.8% 6,619.78 17.9% 2,766.24 24.2% 3,742.55 4.0% 611.91 9.8% 1,512.84 0.1% 21.39 1.2% 183.32Lynden 42.4% 5,541.25 15.5% 2,018.79 23.7% 3,090.38 5.0% 654.11 13.1% 1,708.74 0.2% 24.42 0.1% 16.15Meridian 43.0% 5,798.21 17.6% 2,368.91 23.7% 3,189.89 4.2% 570.38 9.7% 1,304.69 0.1% 17.23 1.7% 231.46Nooksack Valley 42.8% 6,124.52 17.7% 2,528.16 24.5% 3,509.13 5.8% 826.73 8.3% 1,185.94 0.0% 5.51 1.0% 136.65Mount Baker 40.8% 6,981.54 18.8% 3,213.82 24.2% 4,144.01 4.3% 737.22 11.1% 1,905.57 0.1% 24.73 0.6% 107.05Lummi Tribal 54.7% 7,859.94 16.3% 2,342.53 21.0% 3,009.70 5.6% 800.30 2.4% 347.63 0.0% 3.07 0.0% 0.00County Total 44.6% 6,460.24 16.9% 2,446.77 24.1% 3,488.08 3.9% 561.97 9.9% 1,439.58 0.1% 16.09 0.5% 68.65
182
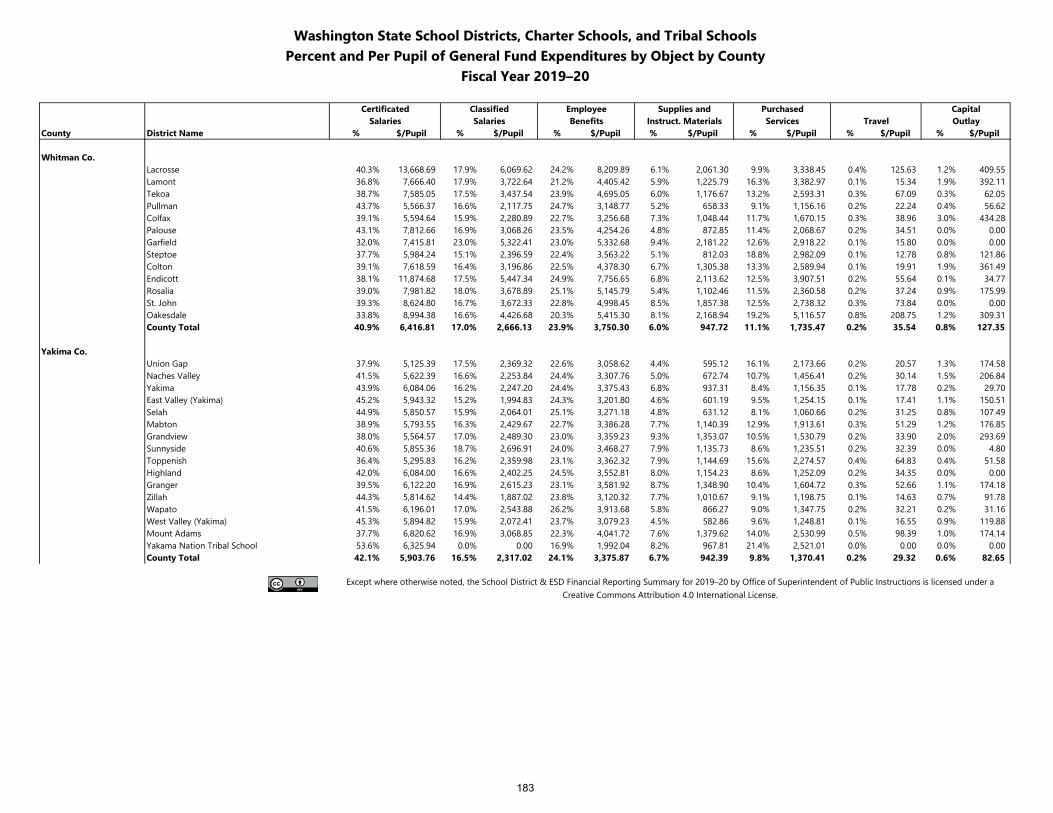
Washington State School Districts, Charter Schools, and Tribal SchoolsPercent and Per Pupil of General Fund Expenditures by Object by County
Fiscal Year 2019–20
Certificated Classified Employee Supplies and Purchased CapitalSalaries Salaries Benefits Instruct. Materials Services Travel Outlay
County District Name % $/Pupil % $/Pupil % $/Pupil % $/Pupil % $/Pupil % $/Pupil % $/Pupil
Whitman Co.Lacrosse 40.3% 13,668.69 17.9% 6,069.62 24.2% 8,209.89 6.1% 2,061.30 9.9% 3,338.45 0.4% 125.63 1.2% 409.55Lamont 36.8% 7,666.40 17.9% 3,722.64 21.2% 4,405.42 5.9% 1,225.79 16.3% 3,382.97 0.1% 15.34 1.9% 392.11Tekoa 38.7% 7,585.05 17.5% 3,437.54 23.9% 4,695.05 6.0% 1,176.67 13.2% 2,593.31 0.3% 67.09 0.3% 62.05Pullman 43.7% 5,566.37 16.6% 2,117.75 24.7% 3,148.77 5.2% 658.33 9.1% 1,156.16 0.2% 22.24 0.4% 56.62Colfax 39.1% 5,594.64 15.9% 2,280.89 22.7% 3,256.68 7.3% 1,048.44 11.7% 1,670.15 0.3% 38.96 3.0% 434.28Palouse 43.1% 7,812.66 16.9% 3,068.26 23.5% 4,254.26 4.8% 872.85 11.4% 2,068.67 0.2% 34.51 0.0% 0.00Garfield 32.0% 7,415.81 23.0% 5,322.41 23.0% 5,332.68 9.4% 2,181.22 12.6% 2,918.22 0.1% 15.80 0.0% 0.00Steptoe 37.7% 5,984.24 15.1% 2,396.59 22.4% 3,563.22 5.1% 812.03 18.8% 2,982.09 0.1% 12.78 0.8% 121.86Colton 39.1% 7,618.59 16.4% 3,196.86 22.5% 4,378.30 6.7% 1,305.38 13.3% 2,589.94 0.1% 19.91 1.9% 361.49Endicott 38.1% 11,874.68 17.5% 5,447.34 24.9% 7,756.65 6.8% 2,113.62 12.5% 3,907.51 0.2% 55.64 0.1% 34.77Rosalia 39.0% 7,981.82 18.0% 3,678.89 25.1% 5,145.79 5.4% 1,102.46 11.5% 2,360.58 0.2% 37.24 0.9% 175.99St. John 39.3% 8,624.80 16.7% 3,672.33 22.8% 4,998.45 8.5% 1,857.38 12.5% 2,738.32 0.3% 73.84 0.0% 0.00Oakesdale 33.8% 8,994.38 16.6% 4,426.68 20.3% 5,415.30 8.1% 2,168.94 19.2% 5,116.57 0.8% 208.75 1.2% 309.31County Total 40.9% 6,416.81 17.0% 2,666.13 23.9% 3,750.30 6.0% 947.72 11.1% 1,735.47 0.2% 35.54 0.8% 127.35
Yakima Co.Union Gap 37.9% 5,125.39 17.5% 2,369.32 22.6% 3,058.62 4.4% 595.12 16.1% 2,173.66 0.2% 20.57 1.3% 174.58Naches Valley 41.5% 5,622.39 16.6% 2,253.84 24.4% 3,307.76 5.0% 672.74 10.7% 1,456.41 0.2% 30.14 1.5% 206.84Yakima 43.9% 6,084.06 16.2% 2,247.20 24.4% 3,375.43 6.8% 937.31 8.4% 1,156.35 0.1% 17.78 0.2% 29.70East Valley (Yakima) 45.2% 5,943.32 15.2% 1,994.83 24.3% 3,201.80 4.6% 601.19 9.5% 1,254.15 0.1% 17.41 1.1% 150.51Selah 44.9% 5,850.57 15.9% 2,064.01 25.1% 3,271.18 4.8% 631.12 8.1% 1,060.66 0.2% 31.25 0.8% 107.49Mabton 38.9% 5,793.55 16.3% 2,429.67 22.7% 3,386.28 7.7% 1,140.39 12.9% 1,913.61 0.3% 51.29 1.2% 176.85Grandview 38.0% 5,564.57 17.0% 2,489.30 23.0% 3,359.23 9.3% 1,353.07 10.5% 1,530.79 0.2% 33.90 2.0% 293.69Sunnyside 40.6% 5,855.36 18.7% 2,696.91 24.0% 3,468.27 7.9% 1,135.73 8.6% 1,235.51 0.2% 32.39 0.0% 4.80Toppenish 36.4% 5,295.83 16.2% 2,359.98 23.1% 3,362.32 7.9% 1,144.69 15.6% 2,274.57 0.4% 64.83 0.4% 51.58Highland 42.0% 6,084.00 16.6% 2,402.25 24.5% 3,552.81 8.0% 1,154.23 8.6% 1,252.09 0.2% 34.35 0.0% 0.00Granger 39.5% 6,122.20 16.9% 2,615.23 23.1% 3,581.92 8.7% 1,348.90 10.4% 1,604.72 0.3% 52.66 1.1% 174.18Zillah 44.3% 5,814.62 14.4% 1,887.02 23.8% 3,120.32 7.7% 1,010.67 9.1% 1,198.75 0.1% 14.63 0.7% 91.78Wapato 41.5% 6,196.01 17.0% 2,543.88 26.2% 3,913.68 5.8% 866.27 9.0% 1,347.75 0.2% 32.21 0.2% 31.16West Valley (Yakima) 45.3% 5,894.82 15.9% 2,072.41 23.7% 3,079.23 4.5% 582.86 9.6% 1,248.81 0.1% 16.55 0.9% 119.88Mount Adams 37.7% 6,820.62 16.9% 3,068.85 22.3% 4,041.72 7.6% 1,379.62 14.0% 2,530.99 0.5% 98.39 1.0% 174.14Yakama Nation Tribal School 53.6% 6,325.94 0.0% 0.00 16.9% 1,992.04 8.2% 967.81 21.4% 2,521.01 0.0% 0.00 0.0% 0.00County Total 42.1% 5,903.76 16.5% 2,317.02 24.1% 3,375.87 6.7% 942.39 9.8% 1,370.41 0.2% 29.32 0.6% 82.65
Except where otherwise noted, the School District & ESD Financial Reporting Summary for 2019–20 by Office of Superintendent of Public Instructions is licensed under a Creative Commons Attribution 4.0 International License.
183
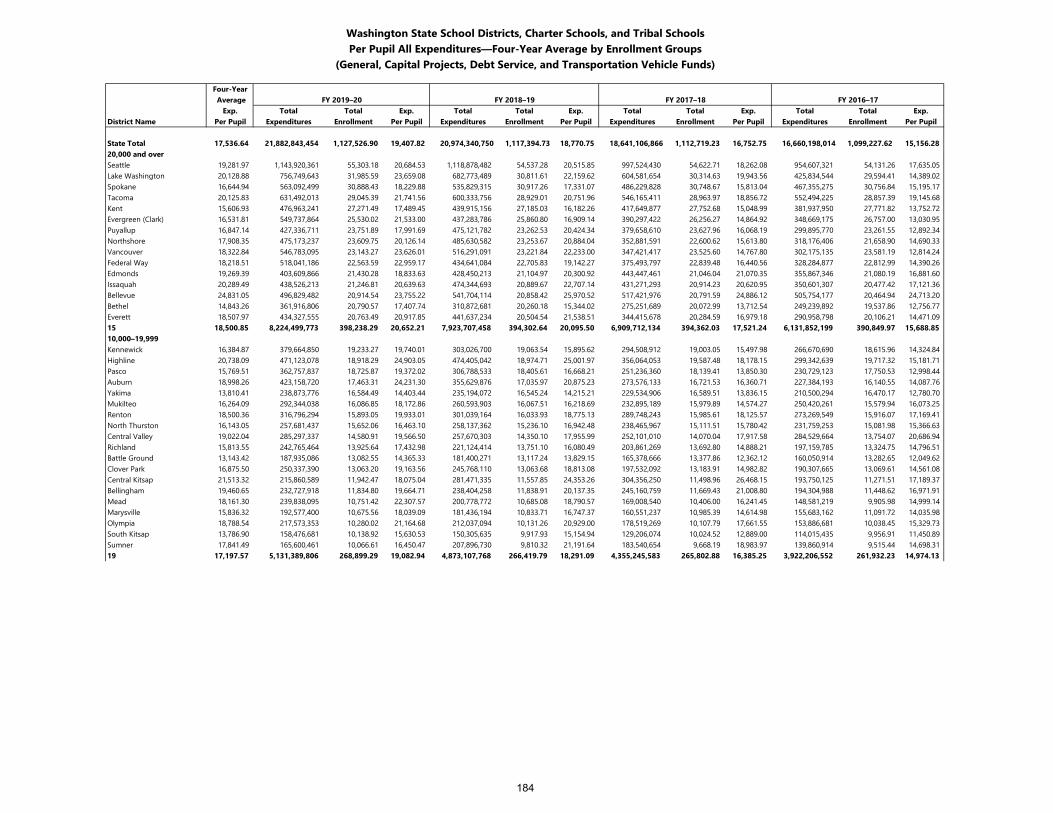
Washington State School Districts, Charter Schools, and Tribal SchoolsPer Pupil All Expenditures—Four-Year Average by Enrollment Groups
(General, Capital Projects, Debt Service, and Transportation Vehicle Funds)
Four-Year Average FY 2019–20 FY 2018–19 FY 2017–18 FY 2016–17
Exp. Total Total Exp. Total Total Exp. Total Total Exp. Total Total Exp.District Name Per Pupil Expenditures Enrollment Per Pupil Expenditures Enrollment Per Pupil Expenditures Enrollment Per Pupil Expenditures Enrollment Per Pupil
State Total 17,536.64 21,882,843,454 1,127,526.90 19,407.82 20,974,340,750 1,117,394.73 18,770.75 18,641,106,866 1,112,719.23 16,752.75 16,660,198,014 1,099,227.62 15,156.2820,000 and overSeattle 19,281.97 1,143,920,361 55,303.18 20,684.53 1,118,878,482 54,537.28 20,515.85 997,524,430 54,622.71 18,262.08 954,607,321 54,131.26 17,635.05Lake Washington 20,128.88 756,749,643 31,985.59 23,659.08 682,773,489 30,811.61 22,159.62 604,581,654 30,314.63 19,943.56 425,834,544 29,594.41 14,389.02Spokane 16,644.94 563,092,499 30,888.43 18,229.88 535,829,315 30,917.26 17,331.07 486,229,828 30,748.67 15,813.04 467,355,275 30,756.84 15,195.17Tacoma 20,125.83 631,492,013 29,045.39 21,741.56 600,333,756 28,929.01 20,751.96 546,165,411 28,963.97 18,856.72 552,494,225 28,857.39 19,145.68Kent 15,606.93 476,963,241 27,271.49 17,489.45 439,915,156 27,185.03 16,182.26 417,649,877 27,752.68 15,048.99 381,937,950 27,771.82 13,752.72Evergreen (Clark) 16,531.81 549,737,864 25,530.02 21,533.00 437,283,786 25,860.80 16,909.14 390,297,422 26,256.27 14,864.92 348,669,175 26,757.00 13,030.95Puyallup 16,847.14 427,336,711 23,751.89 17,991.69 475,121,782 23,262.53 20,424.34 379,658,610 23,627.96 16,068.19 299,895,770 23,261.55 12,892.34Northshore 17,908.35 475,173,237 23,609.75 20,126.14 485,630,582 23,253.67 20,884.04 352,881,591 22,600.62 15,613.80 318,176,406 21,658.90 14,690.33Vancouver 18,322.84 546,783,095 23,143.27 23,626.01 516,291,091 23,221.84 22,233.00 347,421,417 23,525.60 14,767.80 302,175,135 23,581.19 12,814.24Federal Way 18,218.51 518,041,186 22,563.59 22,959.17 434,641,084 22,705.83 19,142.27 375,493,797 22,839.48 16,440.56 328,284,877 22,812.99 14,390.26Edmonds 19,269.39 403,609,866 21,430.28 18,833.63 428,450,213 21,104.97 20,300.92 443,447,461 21,046.04 21,070.35 355,867,346 21,080.19 16,881.60Issaquah 20,289.49 438,526,213 21,246.81 20,639.63 474,344,693 20,889.67 22,707.14 431,271,293 20,914.23 20,620.95 350,601,307 20,477.42 17,121.36Bellevue 24,831.05 496,829,482 20,914.54 23,755.22 541,704,114 20,858.42 25,970.52 517,421,976 20,791.59 24,886.12 505,754,177 20,464.94 24,713.20Bethel 14,843.26 361,916,806 20,790.57 17,407.74 310,872,681 20,260.18 15,344.02 275,251,689 20,072.99 13,712.54 249,239,892 19,537.86 12,756.77Everett 18,507.97 434,327,555 20,763.49 20,917.85 441,637,234 20,504.54 21,538.51 344,415,678 20,284.59 16,979.18 290,958,798 20,106.21 14,471.0915 18,500.85 8,224,499,773 398,238.29 20,652.21 7,923,707,458 394,302.64 20,095.50 6,909,712,134 394,362.03 17,521.24 6,131,852,199 390,849.97 15,688.8510,000–19,999Kennewick 16,384.87 379,664,850 19,233.27 19,740.01 303,026,700 19,063.54 15,895.62 294,508,912 19,003.05 15,497.98 266,670,690 18,615.96 14,324.84Highline 20,738.09 471,123,078 18,918.29 24,903.05 474,405,042 18,974.71 25,001.97 356,064,053 19,587.48 18,178.15 299,342,639 19,717.32 15,181.71Pasco 15,769.51 362,757,837 18,725.87 19,372.02 306,788,533 18,405.61 16,668.21 251,236,360 18,139.41 13,850.30 230,729,123 17,750.53 12,998.44Auburn 18,998.26 423,158,720 17,463.31 24,231.30 355,629,876 17,035.97 20,875.23 273,576,133 16,721.53 16,360.71 227,384,193 16,140.55 14,087.76Yakima 13,810.41 238,873,776 16,584.49 14,403.44 235,194,072 16,545.24 14,215.21 229,534,906 16,589.51 13,836.15 210,500,294 16,470.17 12,780.70Mukilteo 16,264.09 292,344,038 16,086.85 18,172.86 260,593,903 16,067.51 16,218.69 232,895,189 15,979.89 14,574.27 250,420,261 15,579.94 16,073.25Renton 18,500.36 316,796,294 15,893.05 19,933.01 301,039,164 16,033.93 18,775.13 289,748,243 15,985.61 18,125.57 273,269,549 15,916.07 17,169.41North Thurston 16,143.05 257,681,437 15,652.06 16,463.10 258,137,362 15,236.10 16,942.48 238,465,967 15,111.51 15,780.42 231,759,253 15,081.98 15,366.63Central Valley 19,022.04 285,297,337 14,580.91 19,566.50 257,670,303 14,350.10 17,955.99 252,101,010 14,070.04 17,917.58 284,529,664 13,754.07 20,686.94Richland 15,813.55 242,765,464 13,925.64 17,432.98 221,124,414 13,751.10 16,080.49 203,861,269 13,692.80 14,888.21 197,159,785 13,324.75 14,796.51Battle Ground 13,143.42 187,935,086 13,082.55 14,365.33 181,400,271 13,117.24 13,829.15 165,378,666 13,377.86 12,362.12 160,050,914 13,282.65 12,049.62Clover Park 16,875.50 250,337,390 13,063.20 19,163.56 245,768,110 13,063.68 18,813.08 197,532,092 13,183.91 14,982.82 190,307,665 13,069.61 14,561.08Central Kitsap 21,513.32 215,860,589 11,942.47 18,075.04 281,471,335 11,557.85 24,353.26 304,356,250 11,498.96 26,468.15 193,750,125 11,271.51 17,189.37Bellingham 19,460.65 232,727,918 11,834.80 19,664.71 238,404,258 11,838.91 20,137.35 245,160,759 11,669.43 21,008.80 194,304,988 11,448.62 16,971.91Mead 18,161.30 239,838,095 10,751.42 22,307.57 200,778,772 10,685.08 18,790.57 169,008,540 10,406.00 16,241.45 148,581,219 9,905.98 14,999.14Marysville 15,836.32 192,577,400 10,675.56 18,039.09 181,436,194 10,833.71 16,747.37 160,551,237 10,985.39 14,614.98 155,683,162 11,091.72 14,035.98Olympia 18,788.54 217,573,353 10,280.02 21,164.68 212,037,094 10,131.26 20,929.00 178,519,269 10,107.79 17,661.55 153,886,681 10,038.45 15,329.73South Kitsap 13,786.90 158,476,681 10,138.92 15,630.53 150,305,635 9,917.93 15,154.94 129,206,074 10,024.52 12,889.00 114,015,435 9,956.91 11,450.89Sumner 17,841.49 165,600,461 10,066.61 16,450.47 207,896,730 9,810.32 21,191.64 183,540,654 9,668.19 18,983.97 139,860,914 9,515.44 14,698.3119 17,197.57 5,131,389,806 268,899.29 19,082.94 4,873,107,768 266,419.79 18,291.09 4,355,245,583 265,802.88 16,385.25 3,922,206,552 261,932.23 14,974.13
184
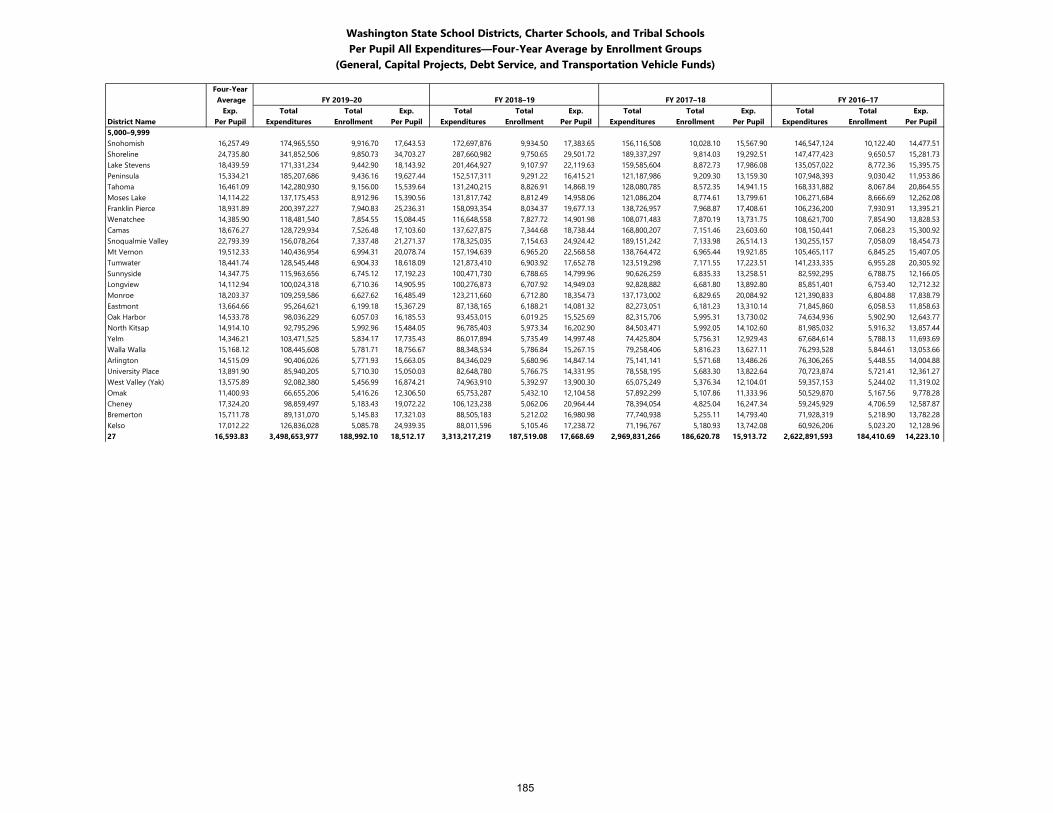
Washington State School Districts, Charter Schools, and Tribal SchoolsPer Pupil All Expenditures—Four-Year Average by Enrollment Groups
(General, Capital Projects, Debt Service, and Transportation Vehicle Funds)
Four-Year Average FY 2019–20 FY 2018–19 FY 2017–18 FY 2016–17
Exp. Total Total Exp. Total Total Exp. Total Total Exp. Total Total Exp.District Name Per Pupil Expenditures Enrollment Per Pupil Expenditures Enrollment Per Pupil Expenditures Enrollment Per Pupil Expenditures Enrollment Per Pupil5,000–9,999Snohomish 16,257.49 174,965,550 9,916.70 17,643.53 172,697,876 9,934.50 17,383.65 156,116,508 10,028.10 15,567.90 146,547,124 10,122.40 14,477.51Shoreline 24,735.80 341,852,506 9,850.73 34,703.27 287,660,982 9,750.65 29,501.72 189,337,297 9,814.03 19,292.51 147,477,423 9,650.57 15,281.73Lake Stevens 18,439.59 171,331,234 9,442.90 18,143.92 201,464,927 9,107.97 22,119.63 159,585,604 8,872.73 17,986.08 135,057,022 8,772.36 15,395.75Peninsula 15,334.21 185,207,686 9,436.16 19,627.44 152,517,311 9,291.22 16,415.21 121,187,986 9,209.30 13,159.30 107,948,393 9,030.42 11,953.86Tahoma 16,461.09 142,280,930 9,156.00 15,539.64 131,240,215 8,826.91 14,868.19 128,080,785 8,572.35 14,941.15 168,331,882 8,067.84 20,864.55Moses Lake 14,114.22 137,175,453 8,912.96 15,390.56 131,817,742 8,812.49 14,958.06 121,086,204 8,774.61 13,799.61 106,271,684 8,666.69 12,262.08Franklin Pierce 18,931.89 200,397,227 7,940.83 25,236.31 158,093,354 8,034.37 19,677.13 138,726,957 7,968.87 17,408.61 106,236,200 7,930.91 13,395.21Wenatchee 14,385.90 118,481,540 7,854.55 15,084.45 116,648,558 7,827.72 14,901.98 108,071,483 7,870.19 13,731.75 108,621,700 7,854.90 13,828.53Camas 18,676.27 128,729,934 7,526.48 17,103.60 137,627,875 7,344.68 18,738.44 168,800,207 7,151.46 23,603.60 108,150,441 7,068.23 15,300.92Snoqualmie Valley 22,793.39 156,078,264 7,337.48 21,271.37 178,325,035 7,154.63 24,924.42 189,151,242 7,133.98 26,514.13 130,255,157 7,058.09 18,454.73Mt Vernon 19,512.33 140,436,954 6,994.31 20,078.74 157,194,639 6,965.20 22,568.58 138,764,472 6,965.44 19,921.85 105,465,117 6,845.25 15,407.05Tumwater 18,441.74 128,545,448 6,904.33 18,618.09 121,873,410 6,903.92 17,652.78 123,519,298 7,171.55 17,223.51 141,233,335 6,955.28 20,305.92Sunnyside 14,347.75 115,963,656 6,745.12 17,192.23 100,471,730 6,788.65 14,799.96 90,626,259 6,835.33 13,258.51 82,592,295 6,788.75 12,166.05Longview 14,112.94 100,024,318 6,710.36 14,905.95 100,276,873 6,707.92 14,949.03 92,828,882 6,681.80 13,892.80 85,851,401 6,753.40 12,712.32Monroe 18,203.37 109,259,586 6,627.62 16,485.49 123,211,660 6,712.80 18,354.73 137,173,002 6,829.65 20,084.92 121,390,833 6,804.88 17,838.79Eastmont 13,664.66 95,264,621 6,199.18 15,367.29 87,138,165 6,188.21 14,081.32 82,273,051 6,181.23 13,310.14 71,845,860 6,058.53 11,858.63Oak Harbor 14,533.78 98,036,229 6,057.03 16,185.53 93,453,015 6,019.25 15,525.69 82,315,706 5,995.31 13,730.02 74,634,936 5,902.90 12,643.77North Kitsap 14,914.10 92,795,296 5,992.96 15,484.05 96,785,403 5,973.34 16,202.90 84,503,471 5,992.05 14,102.60 81,985,032 5,916.32 13,857.44Yelm 14,346.21 103,471,525 5,834.17 17,735.43 86,017,894 5,735.49 14,997.48 74,425,804 5,756.31 12,929.43 67,684,614 5,788.13 11,693.69Walla Walla 15,168.12 108,445,608 5,781.71 18,756.67 88,348,534 5,786.84 15,267.15 79,258,406 5,816.23 13,627.11 76,293,528 5,844.61 13,053.66Arlington 14,515.09 90,406,026 5,771.93 15,663.05 84,346,029 5,680.96 14,847.14 75,141,141 5,571.68 13,486.26 76,306,265 5,448.55 14,004.88University Place 13,891.90 85,940,205 5,710.30 15,050.03 82,648,780 5,766.75 14,331.95 78,558,195 5,683.30 13,822.64 70,723,874 5,721.41 12,361.27West Valley (Yak) 13,575.89 92,082,380 5,456.99 16,874.21 74,963,910 5,392.97 13,900.30 65,075,249 5,376.34 12,104.01 59,357,153 5,244.02 11,319.02Omak 11,400.93 66,655,206 5,416.26 12,306.50 65,753,287 5,432.10 12,104.58 57,892,299 5,107.86 11,333.96 50,529,870 5,167.56 9,778.28Cheney 17,324.20 98,859,497 5,183.43 19,072.22 106,123,238 5,062.06 20,964.44 78,394,054 4,825.04 16,247.34 59,245,929 4,706.59 12,587.87Bremerton 15,711.78 89,131,070 5,145.83 17,321.03 88,505,183 5,212.02 16,980.98 77,740,938 5,255.11 14,793.40 71,928,319 5,218.90 13,782.28Kelso 17,012.22 126,836,028 5,085.78 24,939.35 88,011,596 5,105.46 17,238.72 71,196,767 5,180.93 13,742.08 60,926,206 5,023.20 12,128.9627 16,593.83 3,498,653,977 188,992.10 18,512.17 3,313,217,219 187,519.08 17,668.69 2,969,831,266 186,620.78 15,913.72 2,622,891,593 184,410.69 14,223.10
185
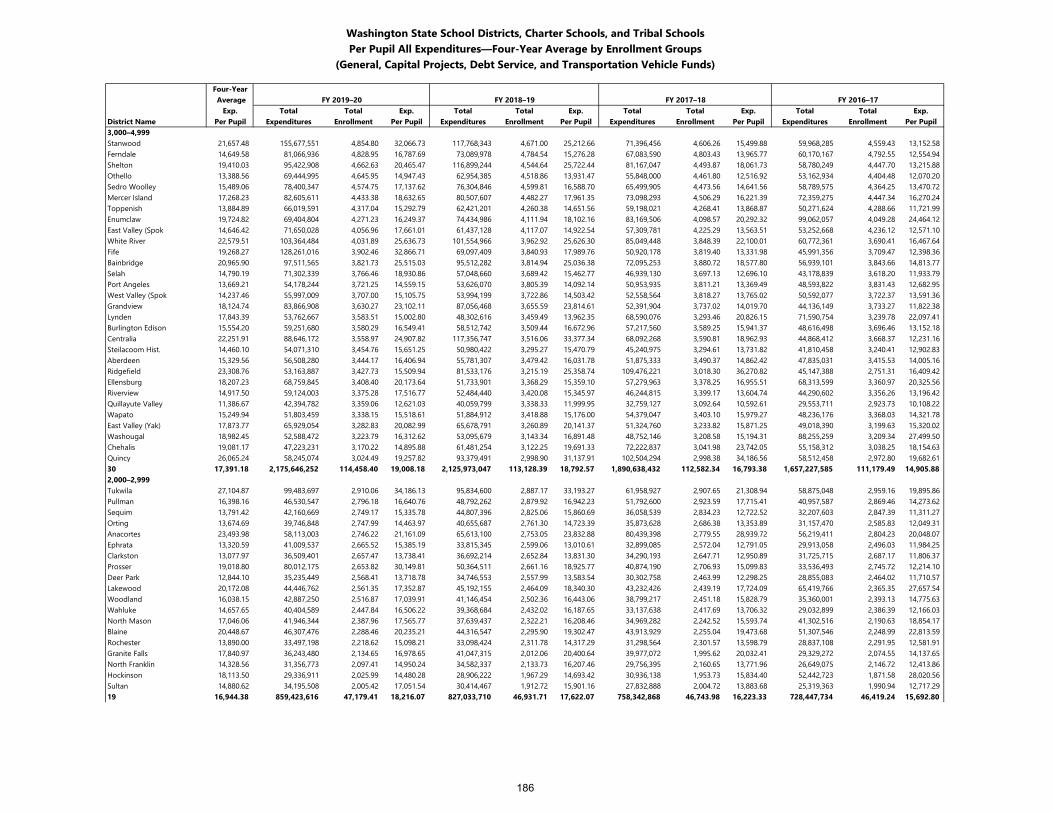
Washington State School Districts, Charter Schools, and Tribal SchoolsPer Pupil All Expenditures—Four-Year Average by Enrollment Groups
(General, Capital Projects, Debt Service, and Transportation Vehicle Funds)
Four-Year Average FY 2019–20 FY 2018–19 FY 2017–18 FY 2016–17
Exp. Total Total Exp. Total Total Exp. Total Total Exp. Total Total Exp.District Name Per Pupil Expenditures Enrollment Per Pupil Expenditures Enrollment Per Pupil Expenditures Enrollment Per Pupil Expenditures Enrollment Per Pupil3,000–4,999Stanwood 21,657.48 155,677,551 4,854.80 32,066.73 117,768,343 4,671.00 25,212.66 71,396,456 4,606.26 15,499.88 59,968,285 4,559.43 13,152.58Ferndale 14,649.58 81,066,936 4,828.95 16,787.69 73,089,978 4,784.54 15,276.28 67,083,590 4,803.43 13,965.77 60,170,167 4,792.55 12,554.94Shelton 19,410.03 95,422,908 4,662.63 20,465.47 116,899,244 4,544.64 25,722.44 81,167,047 4,493.87 18,061.73 58,780,249 4,447.70 13,215.88Othello 13,388.56 69,444,995 4,645.95 14,947.43 62,954,385 4,518.86 13,931.47 55,848,000 4,461.80 12,516.92 53,162,934 4,404.48 12,070.20Sedro Woolley 15,489.06 78,400,347 4,574.75 17,137.62 76,304,846 4,599.81 16,588.70 65,499,905 4,473.56 14,641.56 58,789,575 4,364.25 13,470.72Mercer Island 17,268.23 82,605,611 4,433.38 18,632.65 80,507,607 4,482.27 17,961.35 73,098,293 4,506.29 16,221.39 72,359,275 4,447.34 16,270.24Toppenish 13,884.89 66,019,591 4,317.04 15,292.79 62,421,201 4,260.38 14,651.56 59,198,021 4,268.41 13,868.87 50,271,624 4,288.66 11,721.99Enumclaw 19,724.82 69,404,804 4,271.23 16,249.37 74,434,986 4,111.94 18,102.16 83,169,506 4,098.57 20,292.32 99,062,057 4,049.28 24,464.12East Valley (Spok 14,646.42 71,650,028 4,056.96 17,661.01 61,437,128 4,117.07 14,922.54 57,309,781 4,225.29 13,563.51 53,252,668 4,236.12 12,571.10White River 22,579.51 103,364,484 4,031.89 25,636.73 101,554,966 3,962.92 25,626.30 85,049,448 3,848.39 22,100.01 60,772,361 3,690.41 16,467.64Fife 19,268.27 128,261,016 3,902.46 32,866.71 69,097,409 3,840.93 17,989.76 50,920,178 3,819.40 13,331.98 45,991,356 3,709.47 12,398.36Bainbridge 20,965.90 97,511,565 3,821.73 25,515.03 95,512,282 3,814.94 25,036.38 72,095,253 3,880.72 18,577.80 56,939,101 3,843.66 14,813.77Selah 14,790.19 71,302,339 3,766.46 18,930.86 57,048,660 3,689.42 15,462.77 46,939,130 3,697.13 12,696.10 43,178,839 3,618.20 11,933.79Port Angeles 13,669.21 54,178,244 3,721.25 14,559.15 53,626,070 3,805.39 14,092.14 50,953,935 3,811.21 13,369.49 48,593,822 3,831.43 12,682.95West Valley (Spok 14,237.46 55,997,009 3,707.00 15,105.75 53,994,199 3,722.86 14,503.42 52,558,564 3,818.27 13,765.02 50,592,077 3,722.37 13,591.36Grandview 18,124.74 83,866,908 3,630.27 23,102.11 87,056,468 3,655.59 23,814.61 52,391,904 3,737.02 14,019.70 44,136,149 3,733.27 11,822.38Lynden 17,843.39 53,762,667 3,583.51 15,002.80 48,302,616 3,459.49 13,962.35 68,590,076 3,293.46 20,826.15 71,590,754 3,239.78 22,097.41Burlington Edison 15,554.20 59,251,680 3,580.29 16,549.41 58,512,742 3,509.44 16,672.96 57,217,560 3,589.25 15,941.37 48,616,498 3,696.46 13,152.18Centralia 22,251.91 88,646,172 3,558.97 24,907.82 117,356,747 3,516.06 33,377.34 68,092,268 3,590.81 18,962.93 44,868,412 3,668.37 12,231.16Steilacoom Hist. 14,460.10 54,071,310 3,454.76 15,651.25 50,980,422 3,295.27 15,470.79 45,240,975 3,294.61 13,731.82 41,810,458 3,240.41 12,902.83Aberdeen 15,329.56 56,508,280 3,444.17 16,406.94 55,781,307 3,479.42 16,031.78 51,875,333 3,490.37 14,862.42 47,835,031 3,415.53 14,005.16Ridgefield 23,308.76 53,163,887 3,427.73 15,509.94 81,533,176 3,215.19 25,358.74 109,476,221 3,018.30 36,270.82 45,147,388 2,751.31 16,409.42Ellensburg 18,207.23 68,759,845 3,408.40 20,173.64 51,733,901 3,368.29 15,359.10 57,279,963 3,378.25 16,955.51 68,313,599 3,360.97 20,325.56Riverview 14,917.50 59,124,003 3,375.28 17,516.77 52,484,440 3,420.08 15,345.97 46,244,815 3,399.17 13,604.74 44,290,602 3,356.26 13,196.42Quillayute Valley 11,386.67 42,394,782 3,359.06 12,621.03 40,059,799 3,338.33 11,999.95 32,759,127 3,092.64 10,592.61 29,553,711 2,923.73 10,108.22Wapato 15,249.94 51,803,459 3,338.15 15,518.61 51,884,912 3,418.88 15,176.00 54,379,047 3,403.10 15,979.27 48,236,176 3,368.03 14,321.78East Valley (Yak) 17,873.77 65,929,054 3,282.83 20,082.99 65,678,791 3,260.89 20,141.37 51,324,760 3,233.82 15,871.25 49,018,390 3,199.63 15,320.02Washougal 18,982.45 52,588,472 3,223.79 16,312.62 53,095,679 3,143.34 16,891.48 48,752,146 3,208.58 15,194.31 88,255,259 3,209.34 27,499.50Chehalis 19,081.17 47,223,231 3,170.22 14,895.88 61,481,254 3,122.25 19,691.33 72,222,837 3,041.98 23,742.05 55,158,312 3,038.25 18,154.63Quincy 26,065.24 58,245,074 3,024.49 19,257.82 93,379,491 2,998.90 31,137.91 102,504,294 2,998.38 34,186.56 58,512,458 2,972.80 19,682.6130 17,391.18 2,175,646,252 114,458.40 19,008.18 2,125,973,047 113,128.39 18,792.57 1,890,638,432 112,582.34 16,793.38 1,657,227,585 111,179.49 14,905.882,000–2,999Tukwila 27,104.87 99,483,697 2,910.06 34,186.13 95,834,600 2,887.17 33,193.27 61,958,927 2,907.65 21,308.94 58,875,048 2,959.16 19,895.86Pullman 16,398.16 46,530,547 2,796.18 16,640.76 48,792,262 2,879.92 16,942.23 51,792,600 2,923.59 17,715.41 40,957,587 2,869.46 14,273.62Sequim 13,791.42 42,160,669 2,749.17 15,335.78 44,807,396 2,825.06 15,860.69 36,058,539 2,834.23 12,722.52 32,207,603 2,847.39 11,311.27Orting 13,674.69 39,746,848 2,747.99 14,463.97 40,655,687 2,761.30 14,723.39 35,873,628 2,686.38 13,353.89 31,157,470 2,585.83 12,049.31Anacortes 23,493.98 58,113,003 2,746.22 21,161.09 65,613,100 2,753.05 23,832.88 80,439,398 2,779.55 28,939.72 56,219,411 2,804.23 20,048.07Ephrata 13,320.59 41,009,537 2,665.52 15,385.19 33,815,345 2,599.06 13,010.61 32,899,085 2,572.04 12,791.05 29,913,058 2,496.03 11,984.25Clarkston 13,077.97 36,509,401 2,657.47 13,738.41 36,692,214 2,652.84 13,831.30 34,290,193 2,647.71 12,950.89 31,725,715 2,687.17 11,806.37Prosser 19,018.80 80,012,175 2,653.82 30,149.81 50,364,511 2,661.16 18,925.77 40,874,190 2,706.93 15,099.83 33,536,493 2,745.72 12,214.10Deer Park 12,844.10 35,235,449 2,568.41 13,718.78 34,746,553 2,557.99 13,583.54 30,302,758 2,463.99 12,298.25 28,855,083 2,464.02 11,710.57Lakewood 20,172.08 44,446,762 2,561.35 17,352.87 45,192,155 2,464.09 18,340.30 43,232,426 2,439.19 17,724.09 65,419,766 2,365.35 27,657.54Woodland 16,038.15 42,887,250 2,516.87 17,039.91 41,146,454 2,502.36 16,443.06 38,799,217 2,451.18 15,828.79 35,360,001 2,393.13 14,775.63Wahluke 14,657.65 40,404,589 2,447.84 16,506.22 39,368,684 2,432.02 16,187.65 33,137,638 2,417.69 13,706.32 29,032,899 2,386.39 12,166.03North Mason 17,046.06 41,946,344 2,387.96 17,565.77 37,639,437 2,322.21 16,208.46 34,969,282 2,242.52 15,593.74 41,302,516 2,190.63 18,854.17Blaine 20,448.67 46,307,476 2,288.46 20,235.21 44,316,547 2,295.90 19,302.47 43,913,929 2,255.04 19,473.68 51,307,546 2,248.99 22,813.59Rochester 13,890.00 33,497,198 2,218.62 15,098.21 33,098,424 2,311.78 14,317.29 31,298,564 2,301.57 13,598.79 28,837,108 2,291.95 12,581.91Granite Falls 17,840.97 36,243,480 2,134.65 16,978.65 41,047,315 2,012.06 20,400.64 39,977,072 1,995.62 20,032.41 29,329,272 2,074.55 14,137.65North Franklin 14,328.56 31,356,773 2,097.41 14,950.24 34,582,337 2,133.73 16,207.46 29,756,395 2,160.65 13,771.96 26,649,075 2,146.72 12,413.86Hockinson 18,113.50 29,336,911 2,025.99 14,480.28 28,906,222 1,967.29 14,693.42 30,936,138 1,953.73 15,834.40 52,442,723 1,871.58 28,020.56Sultan 14,880.62 34,195,508 2,005.42 17,051.54 30,414,467 1,912.72 15,901.16 27,832,888 2,004.72 13,883.68 25,319,363 1,990.94 12,717.2919 16,944.38 859,423,616 47,179.41 18,216.07 827,033,710 46,931.71 17,622.07 758,342,868 46,743.98 16,223.33 728,447,734 46,419.24 15,692.80
186
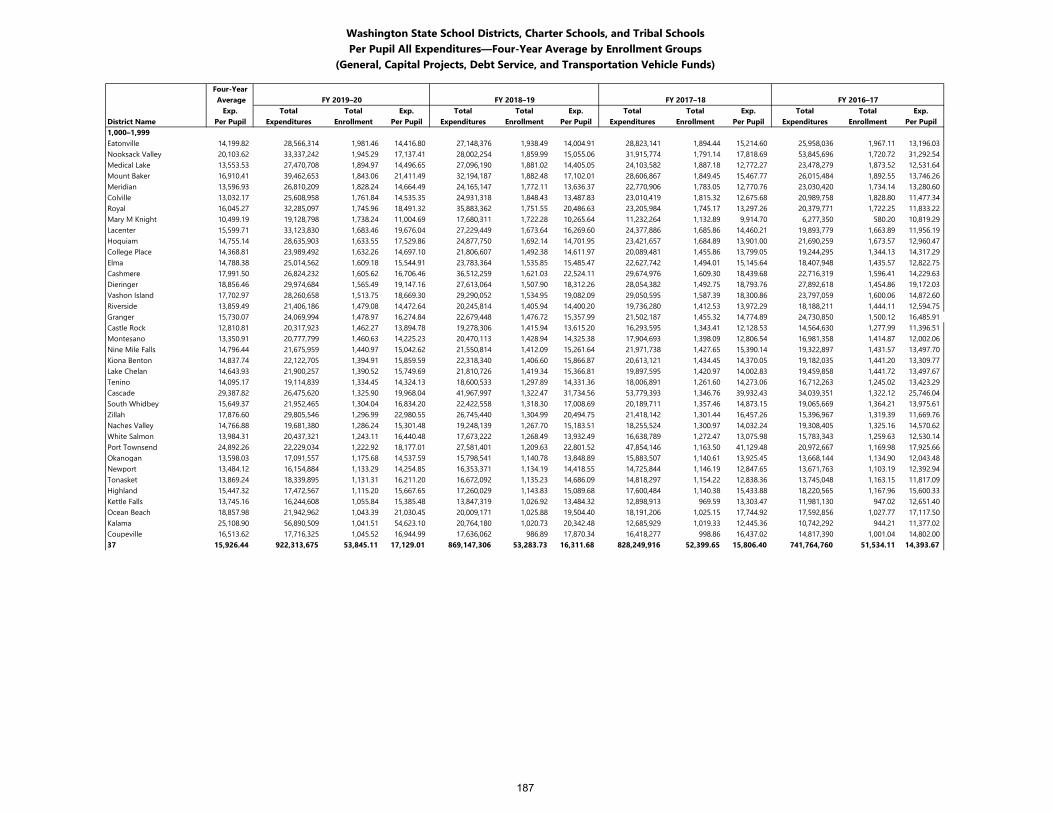
Washington State School Districts, Charter Schools, and Tribal SchoolsPer Pupil All Expenditures—Four-Year Average by Enrollment Groups
(General, Capital Projects, Debt Service, and Transportation Vehicle Funds)
Four-Year Average FY 2019–20 FY 2018–19 FY 2017–18 FY 2016–17
Exp. Total Total Exp. Total Total Exp. Total Total Exp. Total Total Exp.District Name Per Pupil Expenditures Enrollment Per Pupil Expenditures Enrollment Per Pupil Expenditures Enrollment Per Pupil Expenditures Enrollment Per Pupil1,000–1,999Eatonville 14,199.82 28,566,314 1,981.46 14,416.80 27,148,376 1,938.49 14,004.91 28,823,141 1,894.44 15,214.60 25,958,036 1,967.11 13,196.03Nooksack Valley 20,103.62 33,337,242 1,945.29 17,137.41 28,002,254 1,859.99 15,055.06 31,915,774 1,791.14 17,818.69 53,845,696 1,720.72 31,292.54Medical Lake 13,553.53 27,470,708 1,894.97 14,496.65 27,096,190 1,881.02 14,405.05 24,103,582 1,887.18 12,772.27 23,478,279 1,873.52 12,531.64Mount Baker 16,910.41 39,462,653 1,843.06 21,411.49 32,194,187 1,882.48 17,102.01 28,606,867 1,849.45 15,467.77 26,015,484 1,892.55 13,746.26Meridian 13,596.93 26,810,209 1,828.24 14,664.49 24,165,147 1,772.11 13,636.37 22,770,906 1,783.05 12,770.76 23,030,420 1,734.14 13,280.60Colville 13,032.17 25,608,958 1,761.84 14,535.35 24,931,318 1,848.43 13,487.83 23,010,419 1,815.32 12,675.68 20,989,758 1,828.80 11,477.34Royal 16,045.27 32,285,097 1,745.96 18,491.32 35,883,362 1,751.55 20,486.63 23,205,984 1,745.17 13,297.26 20,379,771 1,722.25 11,833.22Mary M Knight 10,499.19 19,128,798 1,738.24 11,004.69 17,680,311 1,722.28 10,265.64 11,232,264 1,132.89 9,914.70 6,277,350 580.20 10,819.29Lacenter 15,599.71 33,123,830 1,683.46 19,676.04 27,229,449 1,673.64 16,269.60 24,377,886 1,685.86 14,460.21 19,893,779 1,663.89 11,956.19Hoquiam 14,755.14 28,635,903 1,633.55 17,529.86 24,877,750 1,692.14 14,701.95 23,421,657 1,684.89 13,901.00 21,690,259 1,673.57 12,960.47College Place 14,368.81 23,989,492 1,632.26 14,697.10 21,806,607 1,492.38 14,611.97 20,089,481 1,455.86 13,799.05 19,244,295 1,344.13 14,317.29Elma 14,788.38 25,014,562 1,609.18 15,544.91 23,783,364 1,535.85 15,485.47 22,627,742 1,494.01 15,145.64 18,407,948 1,435.57 12,822.75Cashmere 17,991.50 26,824,232 1,605.62 16,706.46 36,512,259 1,621.03 22,524.11 29,674,976 1,609.30 18,439.68 22,716,319 1,596.41 14,229.63Dieringer 18,856.46 29,974,684 1,565.49 19,147.16 27,613,064 1,507.90 18,312.26 28,054,382 1,492.75 18,793.76 27,892,618 1,454.86 19,172.03Vashon Island 17,702.97 28,260,658 1,513.75 18,669.30 29,290,052 1,534.95 19,082.09 29,050,595 1,587.39 18,300.86 23,797,059 1,600.06 14,872.60Riverside 13,859.49 21,406,186 1,479.08 14,472.64 20,245,814 1,405.94 14,400.20 19,736,280 1,412.53 13,972.29 18,188,211 1,444.11 12,594.75Granger 15,730.07 24,069,994 1,478.97 16,274.84 22,679,448 1,476.72 15,357.99 21,502,187 1,455.32 14,774.89 24,730,850 1,500.12 16,485.91Castle Rock 12,810.81 20,317,923 1,462.27 13,894.78 19,278,306 1,415.94 13,615.20 16,293,595 1,343.41 12,128.53 14,564,630 1,277.99 11,396.51Montesano 13,350.91 20,777,799 1,460.63 14,225.23 20,470,113 1,428.94 14,325.38 17,904,693 1,398.09 12,806.54 16,981,358 1,414.87 12,002.06Nine Mile Falls 14,796.44 21,675,959 1,440.97 15,042.62 21,550,814 1,412.09 15,261.64 21,971,738 1,427.65 15,390.14 19,322,897 1,431.57 13,497.70Kiona Benton 14,837.74 22,122,705 1,394.91 15,859.59 22,318,340 1,406.60 15,866.87 20,613,121 1,434.45 14,370.05 19,182,035 1,441.20 13,309.77Lake Chelan 14,643.93 21,900,257 1,390.52 15,749.69 21,810,726 1,419.34 15,366.81 19,897,595 1,420.97 14,002.83 19,459,858 1,441.72 13,497.67Tenino 14,095.17 19,114,839 1,334.45 14,324.13 18,600,533 1,297.89 14,331.36 18,006,891 1,261.60 14,273.06 16,712,263 1,245.02 13,423.29Cascade 29,387.82 26,475,620 1,325.90 19,968.04 41,967,997 1,322.47 31,734.56 53,779,393 1,346.76 39,932.43 34,039,351 1,322.12 25,746.04South Whidbey 15,649.37 21,952,465 1,304.04 16,834.20 22,422,558 1,318.30 17,008.69 20,189,711 1,357.46 14,873.15 19,065,669 1,364.21 13,975.61Zillah 17,876.60 29,805,546 1,296.99 22,980.55 26,745,440 1,304.99 20,494.75 21,418,142 1,301.44 16,457.26 15,396,967 1,319.39 11,669.76Naches Valley 14,766.88 19,681,380 1,286.24 15,301.48 19,248,139 1,267.70 15,183.51 18,255,524 1,300.97 14,032.24 19,308,405 1,325.16 14,570.62White Salmon 13,984.31 20,437,321 1,243.11 16,440.48 17,673,222 1,268.49 13,932.49 16,638,789 1,272.47 13,075.98 15,783,343 1,259.63 12,530.14Port Townsend 24,892.26 22,229,034 1,222.92 18,177.01 27,581,401 1,209.63 22,801.52 47,854,146 1,163.50 41,129.48 20,972,667 1,169.98 17,925.66Okanogan 13,598.03 17,091,557 1,175.68 14,537.59 15,798,541 1,140.78 13,848.89 15,883,507 1,140.61 13,925.45 13,668,144 1,134.90 12,043.48Newport 13,484.12 16,154,884 1,133.29 14,254.85 16,353,371 1,134.19 14,418.55 14,725,844 1,146.19 12,847.65 13,671,763 1,103.19 12,392.94Tonasket 13,869.24 18,339,895 1,131.31 16,211.20 16,672,092 1,135.23 14,686.09 14,818,297 1,154.22 12,838.36 13,745,048 1,163.15 11,817.09Highland 15,447.32 17,472,567 1,115.20 15,667.65 17,260,029 1,143.83 15,089.68 17,600,484 1,140.38 15,433.88 18,220,565 1,167.96 15,600.33Kettle Falls 13,745.16 16,244,608 1,055.84 15,385.48 13,847,319 1,026.92 13,484.32 12,898,913 969.59 13,303.47 11,981,130 947.02 12,651.40Ocean Beach 18,857.98 21,942,962 1,043.39 21,030.45 20,009,171 1,025.88 19,504.40 18,191,206 1,025.15 17,744.92 17,592,856 1,027.77 17,117.50Kalama 25,108.90 56,890,509 1,041.51 54,623.10 20,764,180 1,020.73 20,342.48 12,685,929 1,019.33 12,445.36 10,742,292 944.21 11,377.02Coupeville 16,513.62 17,716,325 1,045.52 16,944.99 17,636,062 986.89 17,870.34 16,418,277 998.86 16,437.02 14,817,390 1,001.04 14,802.0037 15,926.44 922,313,675 53,845.11 17,129.01 869,147,306 53,283.73 16,311.68 828,249,916 52,399.65 15,806.40 741,764,760 51,534.11 14,393.67
187
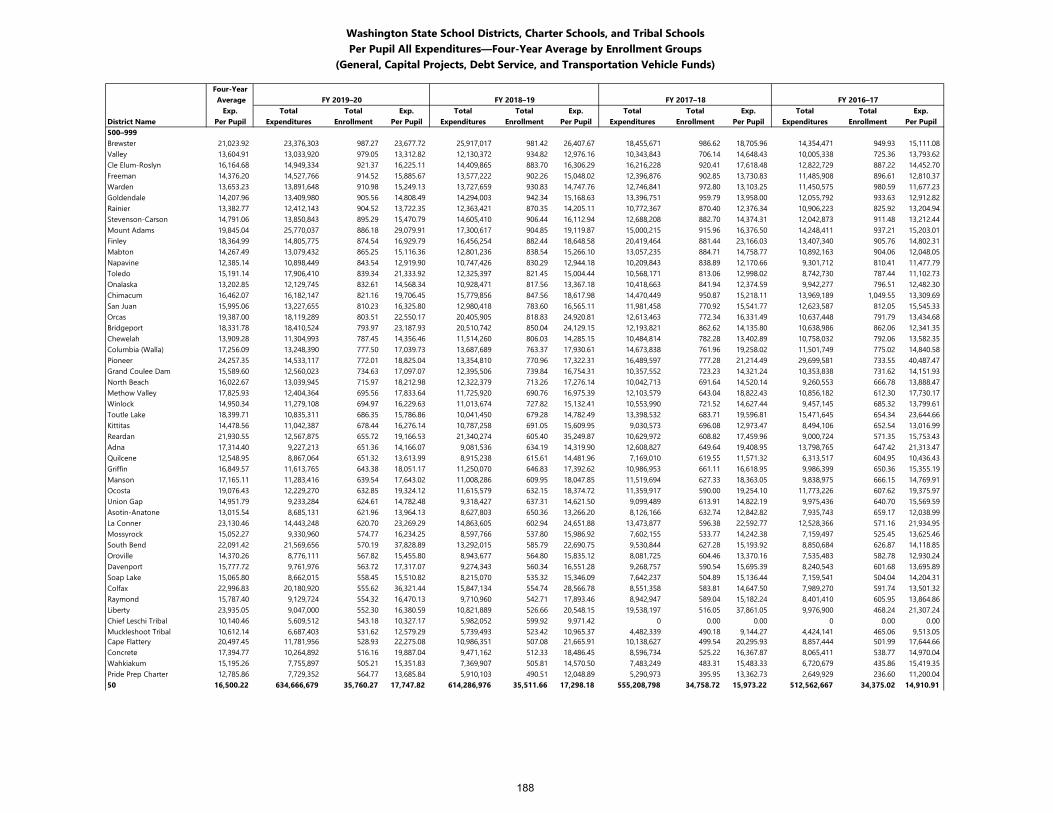
Washington State School Districts, Charter Schools, and Tribal SchoolsPer Pupil All Expenditures—Four-Year Average by Enrollment Groups
(General, Capital Projects, Debt Service, and Transportation Vehicle Funds)
Four-Year Average FY 2019–20 FY 2018–19 FY 2017–18 FY 2016–17
Exp. Total Total Exp. Total Total Exp. Total Total Exp. Total Total Exp.District Name Per Pupil Expenditures Enrollment Per Pupil Expenditures Enrollment Per Pupil Expenditures Enrollment Per Pupil Expenditures Enrollment Per Pupil500–999Brewster 21,023.92 23,376,303 987.27 23,677.72 25,917,017 981.42 26,407.67 18,455,671 986.62 18,705.96 14,354,471 949.93 15,111.08Valley 13,604.91 13,033,920 979.05 13,312.82 12,130,372 934.82 12,976.16 10,343,843 706.14 14,648.43 10,005,338 725.36 13,793.62Cle Elum-Roslyn 16,164.68 14,949,334 921.37 16,225.11 14,409,865 883.70 16,306.29 16,216,228 920.41 17,618.48 12,822,729 887.22 14,452.70Freeman 14,376.20 14,527,766 914.52 15,885.67 13,577,222 902.26 15,048.02 12,396,876 902.85 13,730.83 11,485,908 896.61 12,810.37Warden 13,653.23 13,891,648 910.98 15,249.13 13,727,659 930.83 14,747.76 12,746,841 972.80 13,103.25 11,450,575 980.59 11,677.23Goldendale 14,207.96 13,409,980 905.56 14,808.49 14,294,003 942.34 15,168.63 13,396,751 959.79 13,958.00 12,055,792 933.63 12,912.82Rainier 13,382.77 12,412,143 904.52 13,722.35 12,363,421 870.35 14,205.11 10,772,367 870.40 12,376.34 10,906,223 825.92 13,204.94Stevenson-Carson 14,791.06 13,850,843 895.29 15,470.79 14,605,410 906.44 16,112.94 12,688,208 882.70 14,374.31 12,042,873 911.48 13,212.44Mount Adams 19,845.04 25,770,037 886.18 29,079.91 17,300,617 904.85 19,119.87 15,000,215 915.96 16,376.50 14,248,411 937.21 15,203.01Finley 18,364.99 14,805,775 874.54 16,929.79 16,456,254 882.44 18,648.58 20,419,464 881.44 23,166.03 13,407,340 905.76 14,802.31Mabton 14,267.49 13,079,432 865.25 15,116.36 12,801,236 838.54 15,266.10 13,057,235 884.71 14,758.77 10,892,163 904.06 12,048.05Napavine 12,385.14 10,898,449 843.54 12,919.90 10,747,426 830.29 12,944.18 10,209,843 838.89 12,170.66 9,301,712 810.41 11,477.79Toledo 15,191.14 17,906,410 839.34 21,333.92 12,325,397 821.45 15,004.44 10,568,171 813.06 12,998.02 8,742,730 787.44 11,102.73Onalaska 13,202.85 12,129,745 832.61 14,568.34 10,928,471 817.56 13,367.18 10,418,663 841.94 12,374.59 9,942,277 796.51 12,482.30Chimacum 16,462.07 16,182,147 821.16 19,706.45 15,779,856 847.56 18,617.98 14,470,449 950.87 15,218.11 13,969,189 1,049.55 13,309.69San Juan 15,995.06 13,227,655 810.23 16,325.80 12,980,418 783.60 16,565.11 11,981,458 770.92 15,541.77 12,623,587 812.05 15,545.33Orcas 19,387.00 18,119,289 803.51 22,550.17 20,405,905 818.83 24,920.81 12,613,463 772.34 16,331.49 10,637,448 791.79 13,434.68Bridgeport 18,331.78 18,410,524 793.97 23,187.93 20,510,742 850.04 24,129.15 12,193,821 862.62 14,135.80 10,638,986 862.06 12,341.35Chewelah 13,909.28 11,304,993 787.45 14,356.46 11,514,260 806.03 14,285.15 10,484,814 782.28 13,402.89 10,758,032 792.06 13,582.35Columbia (Walla) 17,256.09 13,248,390 777.50 17,039.73 13,687,689 763.37 17,930.61 14,673,838 761.96 19,258.02 11,501,749 775.02 14,840.58Pioneer 24,257.35 14,533,117 772.01 18,825.04 13,354,810 770.96 17,322.31 16,489,597 777.28 21,214.49 29,699,581 733.55 40,487.47Grand Coulee Dam 15,589.60 12,560,023 734.63 17,097.07 12,395,506 739.84 16,754.31 10,357,552 723.23 14,321.24 10,353,838 731.62 14,151.93North Beach 16,022.67 13,039,945 715.97 18,212.98 12,322,379 713.26 17,276.14 10,042,713 691.64 14,520.14 9,260,553 666.78 13,888.47Methow Valley 17,825.93 12,404,364 695.56 17,833.64 11,725,920 690.76 16,975.39 12,103,579 643.04 18,822.43 10,856,182 612.30 17,730.17Winlock 14,950.34 11,279,108 694.97 16,229.63 11,013,674 727.82 15,132.41 10,553,990 721.52 14,627.44 9,457,145 685.32 13,799.61Toutle Lake 18,399.71 10,835,311 686.35 15,786.86 10,041,450 679.28 14,782.49 13,398,532 683.71 19,596.81 15,471,645 654.34 23,644.66Kittitas 14,478.56 11,042,387 678.44 16,276.14 10,787,258 691.05 15,609.95 9,030,573 696.08 12,973.47 8,494,106 652.54 13,016.99Reardan 21,930.55 12,567,875 655.72 19,166.53 21,340,274 605.40 35,249.87 10,629,972 608.82 17,459.96 9,000,724 571.35 15,753.43Adna 17,314.40 9,227,213 651.36 14,166.07 9,081,536 634.19 14,319.90 12,608,827 649.64 19,408.95 13,798,765 647.42 21,313.47Quilcene 12,548.95 8,867,064 651.32 13,613.99 8,915,238 615.61 14,481.96 7,169,010 619.55 11,571.32 6,313,517 604.95 10,436.43Griffin 16,849.57 11,613,765 643.38 18,051.17 11,250,070 646.83 17,392.62 10,986,953 661.11 16,618.95 9,986,399 650.36 15,355.19Manson 17,165.11 11,283,416 639.54 17,643.02 11,008,286 609.95 18,047.85 11,519,694 627.33 18,363.05 9,838,975 666.15 14,769.91Ocosta 19,076.43 12,229,270 632.85 19,324.12 11,615,579 632.15 18,374.72 11,359,917 590.00 19,254.10 11,773,226 607.62 19,375.97Union Gap 14,951.79 9,233,284 624.61 14,782.48 9,318,427 637.31 14,621.50 9,099,489 613.91 14,822.19 9,975,436 640.70 15,569.59Asotin-Anatone 13,015.54 8,685,131 621.96 13,964.13 8,627,803 650.36 13,266.20 8,126,166 632.74 12,842.82 7,935,743 659.17 12,038.99La Conner 23,130.46 14,443,248 620.70 23,269.29 14,863,605 602.94 24,651.88 13,473,877 596.38 22,592.77 12,528,366 571.16 21,934.95Mossyrock 15,052.27 9,330,960 574.77 16,234.25 8,597,766 537.80 15,986.92 7,602,155 533.77 14,242.38 7,159,497 525.45 13,625.46South Bend 22,091.42 21,569,656 570.19 37,828.89 13,292,015 585.79 22,690.75 9,530,844 627.28 15,193.92 8,850,684 626.87 14,118.85Oroville 14,370.26 8,776,111 567.82 15,455.80 8,943,677 564.80 15,835.12 8,081,725 604.46 13,370.16 7,535,483 582.78 12,930.24Davenport 15,777.72 9,761,976 563.72 17,317.07 9,274,343 560.34 16,551.28 9,268,757 590.54 15,695.39 8,240,543 601.68 13,695.89Soap Lake 15,065.80 8,662,015 558.45 15,510.82 8,215,070 535.32 15,346.09 7,642,237 504.89 15,136.44 7,159,541 504.04 14,204.31Colfax 22,996.83 20,180,920 555.62 36,321.44 15,847,134 554.74 28,566.78 8,551,358 583.81 14,647.50 7,989,270 591.74 13,501.32Raymond 15,787.40 9,129,724 554.32 16,470.13 9,710,960 542.71 17,893.46 8,942,947 589.04 15,182.24 8,401,410 605.95 13,864.86Liberty 23,935.05 9,047,000 552.30 16,380.59 10,821,889 526.66 20,548.15 19,538,197 516.05 37,861.05 9,976,900 468.24 21,307.24Chief Leschi Tribal 10,140.46 5,609,512 543.18 10,327.17 5,982,052 599.92 9,971.42 0 0.00 0.00 0 0.00 0.00Muckleshoot Tribal 10,612.14 6,687,403 531.62 12,579.29 5,739,493 523.42 10,965.37 4,482,339 490.18 9,144.27 4,424,141 465.06 9,513.05Cape Flattery 20,497.45 11,781,956 528.93 22,275.08 10,986,351 507.08 21,665.91 10,138,627 499.54 20,295.93 8,857,444 501.99 17,644.66Concrete 17,394.77 10,264,892 516.16 19,887.04 9,471,162 512.33 18,486.45 8,596,734 525.22 16,367.87 8,065,411 538.77 14,970.04Wahkiakum 15,195.26 7,755,897 505.21 15,351.83 7,369,907 505.81 14,570.50 7,483,249 483.31 15,483.33 6,720,679 435.86 15,419.35Pride Prep Charter 12,785.86 7,729,352 564.77 13,685.84 5,910,103 490.51 12,048.89 5,290,973 395.95 13,362.73 2,649,929 236.60 11,200.0450 16,500.22 634,666,679 35,760.27 17,747.82 614,286,976 35,511.66 17,298.18 555,208,798 34,758.72 15,973.22 512,562,667 34,375.02 14,910.91
188
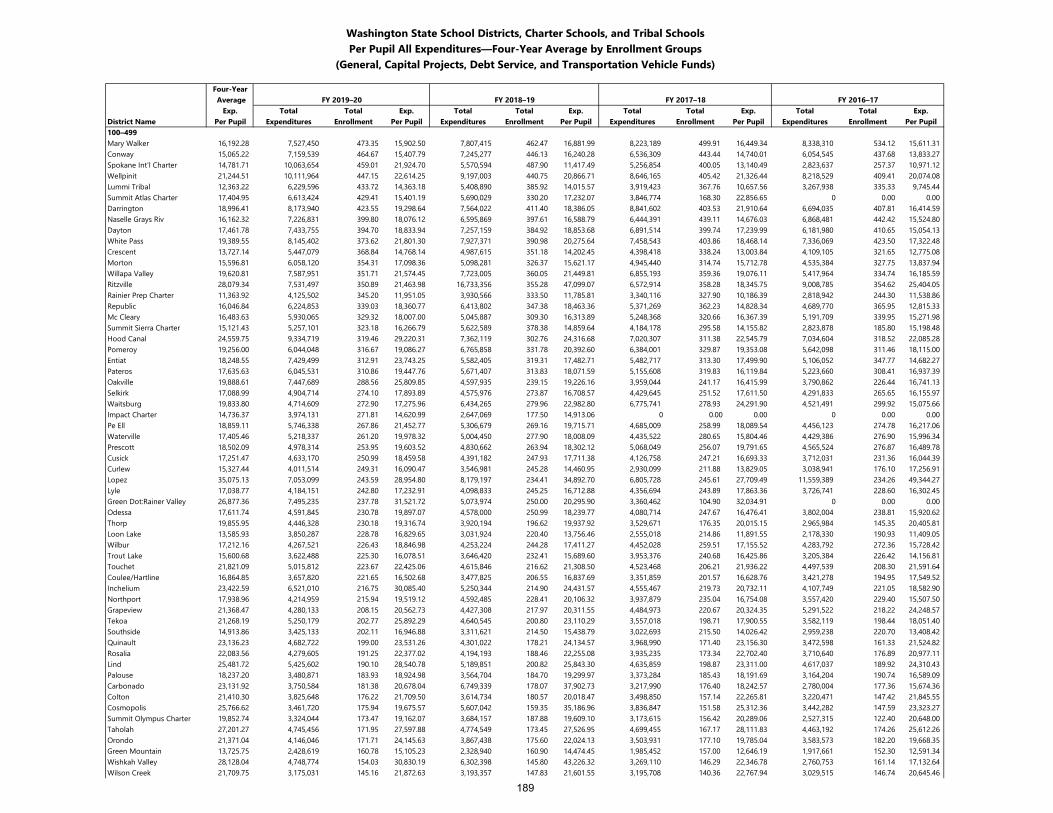
Washington State School Districts, Charter Schools, and Tribal SchoolsPer Pupil All Expenditures—Four-Year Average by Enrollment Groups
(General, Capital Projects, Debt Service, and Transportation Vehicle Funds)
Four-Year Average FY 2019–20 FY 2018–19 FY 2017–18 FY 2016–17
Exp. Total Total Exp. Total Total Exp. Total Total Exp. Total Total Exp.District Name Per Pupil Expenditures Enrollment Per Pupil Expenditures Enrollment Per Pupil Expenditures Enrollment Per Pupil Expenditures Enrollment Per Pupil100–499Mary Walker 16,192.28 7,527,450 473.35 15,902.50 7,807,415 462.47 16,881.99 8,223,189 499.91 16,449.34 8,338,310 534.12 15,611.31Conway 15,065.22 7,159,539 464.67 15,407.79 7,245,277 446.13 16,240.28 6,536,309 443.44 14,740.01 6,054,545 437.68 13,833.27Spokane Int'l Charter 14,781.71 10,063,654 459.01 21,924.70 5,570,594 487.90 11,417.49 5,256,854 400.05 13,140.49 2,823,637 257.37 10,971.12Wellpinit 21,244.51 10,111,964 447.15 22,614.25 9,197,003 440.75 20,866.71 8,646,165 405.42 21,326.44 8,218,529 409.41 20,074.08Lummi Tribal 12,363.22 6,229,596 433.72 14,363.18 5,408,890 385.92 14,015.57 3,919,423 367.76 10,657.56 3,267,938 335.33 9,745.44Summit Atlas Charter 17,404.95 6,613,424 429.41 15,401.19 5,690,029 330.20 17,232.07 3,846,774 168.30 22,856.65 0 0.00 0.00Darrington 18,996.41 8,173,940 423.55 19,298.64 7,564,022 411.40 18,386.05 8,841,602 403.53 21,910.64 6,694,035 407.81 16,414.59Naselle Grays Riv 16,162.32 7,226,831 399.80 18,076.12 6,595,869 397.61 16,588.79 6,444,391 439.11 14,676.03 6,868,481 442.42 15,524.80Dayton 17,461.78 7,433,755 394.70 18,833.94 7,257,159 384.92 18,853.68 6,891,514 399.74 17,239.99 6,181,980 410.65 15,054.13White Pass 19,389.55 8,145,402 373.62 21,801.30 7,927,371 390.98 20,275.64 7,458,543 403.86 18,468.14 7,336,069 423.50 17,322.48Crescent 13,727.14 5,447,079 368.84 14,768.14 4,987,615 351.18 14,202.45 4,398,418 338.24 13,003.84 4,109,105 321.65 12,775.08Morton 15,596.81 6,058,120 354.31 17,098.36 5,098,281 326.37 15,621.17 4,945,440 314.74 15,712.78 4,535,384 327.75 13,837.94Willapa Valley 19,620.81 7,587,951 351.71 21,574.45 7,723,005 360.05 21,449.81 6,855,193 359.36 19,076.11 5,417,964 334.74 16,185.59Ritzville 28,079.34 7,531,497 350.89 21,463.98 16,733,356 355.28 47,099.07 6,572,914 358.28 18,345.75 9,008,785 354.62 25,404.05Rainier Prep Charter 11,363.92 4,125,502 345.20 11,951.05 3,930,566 333.50 11,785.81 3,340,116 327.90 10,186.39 2,818,942 244.30 11,538.86Republic 16,046.84 6,224,853 339.03 18,360.77 6,413,802 347.38 18,463.36 5,371,269 362.23 14,828.34 4,689,770 365.95 12,815.33Mc Cleary 16,483.63 5,930,065 329.32 18,007.00 5,045,887 309.30 16,313.89 5,248,368 320.66 16,367.39 5,191,709 339.95 15,271.98Summit Sierra Charter 15,121.43 5,257,101 323.18 16,266.79 5,622,589 378.38 14,859.64 4,184,178 295.58 14,155.82 2,823,878 185.80 15,198.48Hood Canal 24,559.75 9,334,719 319.46 29,220.31 7,362,119 302.76 24,316.68 7,020,307 311.38 22,545.79 7,034,604 318.52 22,085.28Pomeroy 19,256.00 6,044,048 316.67 19,086.27 6,765,858 331.78 20,392.60 6,384,001 329.87 19,353.08 5,642,098 311.46 18,115.00Entiat 18,248.55 7,429,499 312.91 23,743.25 5,582,405 319.31 17,482.71 5,482,717 313.30 17,499.90 5,106,052 347.77 14,682.27Pateros 17,635.63 6,045,531 310.86 19,447.76 5,671,407 313.83 18,071.59 5,155,608 319.83 16,119.84 5,223,660 308.41 16,937.39Oakville 19,888.61 7,447,689 288.56 25,809.85 4,597,935 239.15 19,226.16 3,959,044 241.17 16,415.99 3,790,862 226.44 16,741.13Selkirk 17,088.99 4,904,714 274.10 17,893.89 4,575,976 273.87 16,708.57 4,429,645 251.52 17,611.50 4,291,833 265.65 16,155.97Waitsburg 19,833.80 4,714,609 272.90 17,275.96 6,434,265 279.96 22,982.80 6,775,741 278.93 24,291.90 4,521,491 299.92 15,075.66Impact Charter 14,736.37 3,974,131 271.81 14,620.99 2,647,069 177.50 14,913.06 0 0.00 0.00 0 0.00 0.00Pe Ell 18,859.11 5,746,338 267.86 21,452.77 5,306,679 269.16 19,715.71 4,685,009 258.99 18,089.54 4,456,123 274.78 16,217.06Waterville 17,405.46 5,218,337 261.20 19,978.32 5,004,450 277.90 18,008.09 4,435,522 280.65 15,804.46 4,429,386 276.90 15,996.34Prescott 18,502.09 4,978,314 253.95 19,603.52 4,830,662 263.94 18,302.12 5,068,049 256.07 19,791.65 4,565,524 276.87 16,489.78Cusick 17,251.47 4,633,170 250.99 18,459.58 4,391,182 247.93 17,711.38 4,126,758 247.21 16,693.33 3,712,031 231.36 16,044.39Curlew 15,327.44 4,011,514 249.31 16,090.47 3,546,981 245.28 14,460.95 2,930,099 211.88 13,829.05 3,038,941 176.10 17,256.91Lopez 35,075.13 7,053,099 243.59 28,954.80 8,179,197 234.41 34,892.70 6,805,728 245.61 27,709.49 11,559,389 234.26 49,344.27Lyle 17,038.77 4,184,151 242.80 17,232.91 4,098,833 245.25 16,712.88 4,356,694 243.89 17,863.36 3,726,741 228.60 16,302.45Green Dot:Rainer Valley 26,877.36 7,495,235 237.78 31,521.72 5,073,974 250.00 20,295.90 3,360,462 104.90 32,034.91 0 0.00 0.00Odessa 17,611.74 4,591,845 230.78 19,897.07 4,578,000 250.99 18,239.77 4,080,714 247.67 16,476.41 3,802,004 238.81 15,920.62Thorp 19,855.95 4,446,328 230.18 19,316.74 3,920,194 196.62 19,937.92 3,529,671 176.35 20,015.15 2,965,984 145.35 20,405.81Loon Lake 13,585.93 3,850,287 228.78 16,829.65 3,031,924 220.40 13,756.46 2,555,018 214.86 11,891.55 2,178,330 190.93 11,409.05Wilbur 17,212.16 4,267,521 226.43 18,846.98 4,253,224 244.28 17,411.27 4,452,028 259.51 17,155.52 4,283,792 272.36 15,728.42Trout Lake 15,600.68 3,622,488 225.30 16,078.51 3,646,420 232.41 15,689.60 3,953,376 240.68 16,425.86 3,205,384 226.42 14,156.81Touchet 21,821.09 5,015,812 223.67 22,425.06 4,615,846 216.62 21,308.50 4,523,468 206.21 21,936.22 4,497,539 208.30 21,591.64Coulee/Hartline 16,864.85 3,657,820 221.65 16,502.68 3,477,825 206.55 16,837.69 3,351,859 201.57 16,628.76 3,421,278 194.95 17,549.52Inchelium 23,422.59 6,521,010 216.75 30,085.40 5,250,344 214.90 24,431.57 4,555,467 219.73 20,732.11 4,107,749 221.05 18,582.90Northport 17,938.96 4,214,959 215.94 19,519.12 4,592,485 228.41 20,106.32 3,937,879 235.04 16,754.08 3,557,420 229.40 15,507.50Grapeview 21,368.47 4,280,133 208.15 20,562.73 4,427,308 217.97 20,311.55 4,484,973 220.67 20,324.35 5,291,522 218.22 24,248.57Tekoa 21,268.19 5,250,179 202.77 25,892.29 4,640,545 200.80 23,110.29 3,557,018 198.71 17,900.55 3,582,119 198.44 18,051.40Southside 14,913.86 3,425,133 202.11 16,946.88 3,311,621 214.50 15,438.79 3,022,693 215.50 14,026.42 2,959,238 220.70 13,408.42Quinault 23,136.23 4,682,722 199.00 23,531.26 4,301,022 178.21 24,134.57 3,968,990 171.40 23,156.30 3,472,598 161.33 21,524.82Rosalia 22,083.56 4,279,605 191.25 22,377.02 4,194,193 188.46 22,255.08 3,935,235 173.34 22,702.40 3,710,640 176.89 20,977.11Lind 25,481.72 5,425,602 190.10 28,540.78 5,189,851 200.82 25,843.30 4,635,859 198.87 23,311.00 4,617,037 189.92 24,310.43Palouse 18,237.20 3,480,871 183.93 18,924.98 3,564,704 184.70 19,299.97 3,373,284 185.43 18,191.69 3,164,204 190.74 16,589.09Carbonado 23,131.92 3,750,584 181.38 20,678.04 6,749,339 178.07 37,902.73 3,217,990 176.40 18,242.57 2,780,004 177.36 15,674.36Colton 21,410.30 3,825,648 176.22 21,709.50 3,614,734 180.57 20,018.47 3,498,850 157.14 22,265.81 3,220,471 147.42 21,845.55Cosmopolis 25,766.62 3,461,720 175.94 19,675.57 5,607,042 159.35 35,186.96 3,836,847 151.58 25,312.36 3,442,282 147.59 23,323.27Summit Olympus Charter 19,852.74 3,324,044 173.47 19,162.07 3,684,157 187.88 19,609.10 3,173,615 156.42 20,289.06 2,527,315 122.40 20,648.00Taholah 27,201.27 4,745,456 171.95 27,597.88 4,774,549 173.45 27,526.95 4,699,455 167.17 28,111.83 4,463,192 174.26 25,612.26Orondo 21,371.04 4,146,046 171.71 24,145.63 3,867,438 175.60 22,024.13 3,503,931 177.10 19,785.04 3,583,573 182.20 19,668.35Green Mountain 13,725.75 2,428,619 160.78 15,105.23 2,328,940 160.90 14,474.45 1,985,452 157.00 12,646.19 1,917,661 152.30 12,591.34Wishkah Valley 28,128.04 4,748,774 154.03 30,830.19 6,302,398 145.80 43,226.32 3,269,110 146.29 22,346.78 2,760,753 161.14 17,132.64Wilson Creek 21,709.75 3,175,031 145.16 21,872.63 3,193,357 147.83 21,601.55 3,195,708 140.36 22,767.94 3,029,515 146.74 20,645.46
189
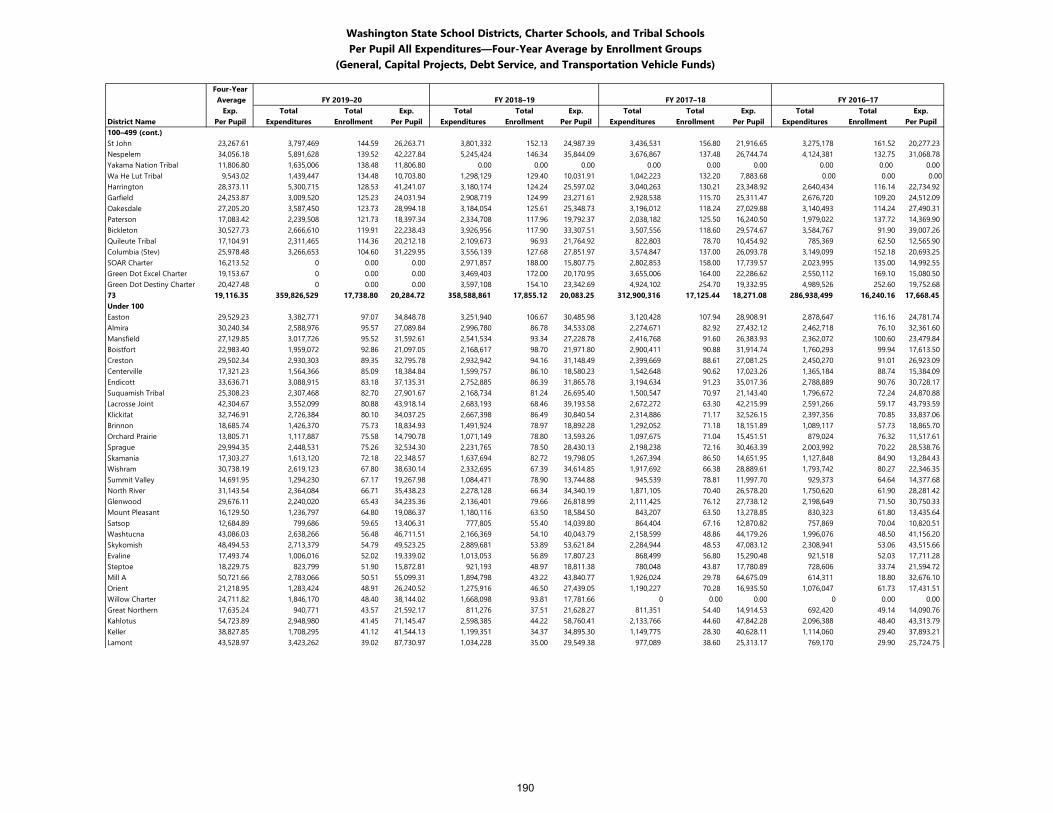
Washington State School Districts, Charter Schools, and Tribal SchoolsPer Pupil All Expenditures—Four-Year Average by Enrollment Groups
(General, Capital Projects, Debt Service, and Transportation Vehicle Funds)
Four-Year Average FY 2019–20 FY 2018–19 FY 2017–18 FY 2016–17
Exp. Total Total Exp. Total Total Exp. Total Total Exp. Total Total Exp.District Name Per Pupil Expenditures Enrollment Per Pupil Expenditures Enrollment Per Pupil Expenditures Enrollment Per Pupil Expenditures Enrollment Per Pupil100–499 (cont.)St John 23,267.61 3,797,469 144.59 26,263.71 3,801,332 152.13 24,987.39 3,436,531 156.80 21,916.65 3,275,178 161.52 20,277.23Nespelem 34,056.18 5,891,628 139.52 42,227.84 5,245,424 146.34 35,844.09 3,676,867 137.48 26,744.74 4,124,381 132.75 31,068.78Yakama Nation Tribal 11,806.80 1,635,006 138.48 11,806.80 0.00 0.00 0.00 0.00 0.00 0.00 0.00 0.00 0.00Wa He Lut Tribal 9,543.02 1,439,447 134.48 10,703.80 1,298,129 129.40 10,031.91 1,042,223 132.20 7,883.68 0.00 0.00 0.00Harrington 28,373.11 5,300,715 128.53 41,241.07 3,180,174 124.24 25,597.02 3,040,263 130.21 23,348.92 2,640,434 116.14 22,734.92Garfield 24,253.87 3,009,520 125.23 24,031.94 2,908,719 124.99 23,271.61 2,928,538 115.70 25,311.47 2,676,720 109.20 24,512.09Oakesdale 27,205.20 3,587,450 123.73 28,994.18 3,184,054 125.61 25,348.73 3,196,012 118.24 27,029.88 3,140,493 114.24 27,490.31Paterson 17,083.42 2,239,508 121.73 18,397.34 2,334,708 117.96 19,792.37 2,038,182 125.50 16,240.50 1,979,022 137.72 14,369.90Bickleton 30,527.73 2,666,610 119.91 22,238.43 3,926,956 117.90 33,307.51 3,507,556 118.60 29,574.67 3,584,767 91.90 39,007.26Quileute Tribal 17,104.91 2,311,465 114.36 20,212.18 2,109,673 96.93 21,764.92 822,803 78.70 10,454.92 785,369 62.50 12,565.90Columbia (Stev) 25,978.48 3,266,653 104.60 31,229.95 3,556,139 127.68 27,851.97 3,574,847 137.00 26,093.78 3,149,099 152.18 20,693.25SOAR Charter 16,213.52 0 0.00 0.00 2,971,857 188.00 15,807.75 2,802,853 158.00 17,739.57 2,023,995 135.00 14,992.55Green Dot Excel Charter 19,153.67 0 0.00 0.00 3,469,403 172.00 20,170.95 3,655,006 164.00 22,286.62 2,550,112 169.10 15,080.50Green Dot Destiny Charter 20,427.48 0 0.00 0.00 3,597,108 154.10 23,342.69 4,924,102 254.70 19,332.95 4,989,526 252.60 19,752.6873 19,116.35 359,826,529 17,738.80 20,284.72 358,588,861 17,855.12 20,083.25 312,900,316 17,125.44 18,271.08 286,938,499 16,240.16 17,668.45Under 100Easton 29,529.23 3,382,771 97.07 34,848.78 3,251,940 106.67 30,485.98 3,120,428 107.94 28,908.91 2,878,647 116.16 24,781.74Almira 30,240.34 2,588,976 95.57 27,089.84 2,996,780 86.78 34,533.08 2,274,671 82.92 27,432.12 2,462,718 76.10 32,361.60Mansfield 27,129.85 3,017,726 95.52 31,592.61 2,541,534 93.34 27,228.78 2,416,768 91.60 26,383.93 2,362,072 100.60 23,479.84Boistfort 22,983.40 1,959,072 92.86 21,097.05 2,168,617 98.70 21,971.80 2,900,411 90.88 31,914.74 1,760,293 99.94 17,613.50Creston 29,502.34 2,930,303 89.35 32,795.78 2,932,942 94.16 31,148.49 2,399,669 88.61 27,081.25 2,450,270 91.01 26,923.09Centerville 17,321.23 1,564,366 85.09 18,384.84 1,599,757 86.10 18,580.23 1,542,648 90.62 17,023.26 1,365,184 88.74 15,384.09Endicott 33,636.71 3,088,915 83.18 37,135.31 2,752,885 86.39 31,865.78 3,194,634 91.23 35,017.36 2,788,889 90.76 30,728.17Suquamish Tribal 25,308.23 2,307,468 82.70 27,901.67 2,168,734 81.24 26,695.40 1,500,547 70.97 21,143.40 1,796,672 72.24 24,870.88Lacrosse Joint 42,304.67 3,552,099 80.88 43,918.14 2,683,193 68.46 39,193.58 2,672,272 63.30 42,215.99 2,591,266 59.17 43,793.59Klickitat 32,746.91 2,726,384 80.10 34,037.25 2,667,398 86.49 30,840.54 2,314,886 71.17 32,526.15 2,397,356 70.85 33,837.06Brinnon 18,685.74 1,426,370 75.73 18,834.93 1,491,924 78.97 18,892.28 1,292,052 71.18 18,151.89 1,089,117 57.73 18,865.70Orchard Prairie 13,805.71 1,117,887 75.58 14,790.78 1,071,149 78.80 13,593.26 1,097,675 71.04 15,451.51 879,024 76.32 11,517.61Sprague 29,994.35 2,448,531 75.26 32,534.30 2,231,765 78.50 28,430.13 2,198,238 72.16 30,463.39 2,003,992 70.22 28,538.76Skamania 17,303.27 1,613,120 72.18 22,348.57 1,637,694 82.72 19,798.05 1,267,394 86.50 14,651.95 1,127,848 84.90 13,284.43Wishram 30,738.19 2,619,123 67.80 38,630.14 2,332,695 67.39 34,614.85 1,917,692 66.38 28,889.61 1,793,742 80.27 22,346.35Summit Valley 14,691.95 1,294,230 67.17 19,267.98 1,084,471 78.90 13,744.88 945,539 78.81 11,997.70 929,373 64.64 14,377.68North River 31,143.54 2,364,084 66.71 35,438.23 2,278,128 66.34 34,340.19 1,871,105 70.40 26,578.20 1,750,620 61.90 28,281.42Glenwood 29,676.11 2,240,020 65.43 34,235.36 2,136,401 79.66 26,818.99 2,111,425 76.12 27,738.12 2,198,649 71.50 30,750.33Mount Pleasant 16,129.50 1,236,797 64.80 19,086.37 1,180,116 63.50 18,584.50 843,207 63.50 13,278.85 830,323 61.80 13,435.64Satsop 12,684.89 799,686 59.65 13,406.31 777,805 55.40 14,039.80 864,404 67.16 12,870.82 757,869 70.04 10,820.51Washtucna 43,086.03 2,638,266 56.48 46,711.51 2,166,369 54.10 40,043.79 2,158,599 48.86 44,179.26 1,996,076 48.50 41,156.20Skykomish 48,494.53 2,713,379 54.79 49,523.25 2,889,681 53.89 53,621.84 2,284,944 48.53 47,083.12 2,308,941 53.06 43,515.66Evaline 17,493.74 1,006,016 52.02 19,339.02 1,013,053 56.89 17,807.23 868,499 56.80 15,290.48 921,518 52.03 17,711.28Steptoe 18,229.75 823,799 51.90 15,872.81 921,193 48.97 18,811.38 780,048 43.87 17,780.89 728,606 33.74 21,594.72Mill A 50,721.66 2,783,066 50.51 55,099.31 1,894,798 43.22 43,840.77 1,926,024 29.78 64,675.09 614,311 18.80 32,676.10Orient 21,218.95 1,283,424 48.91 26,240.52 1,275,916 46.50 27,439.05 1,190,227 70.28 16,935.50 1,076,047 61.73 17,431.51Willow Charter 24,711.82 1,846,170 48.40 38,144.02 1,668,098 93.81 17,781.66 0 0.00 0.00 0 0.00 0.00Great Northern 17,635.24 940,771 43.57 21,592.17 811,276 37.51 21,628.27 811,351 54.40 14,914.53 692,420 49.14 14,090.76Kahlotus 54,723.89 2,948,980 41.45 71,145.47 2,598,385 44.22 58,760.41 2,133,766 44.60 47,842.28 2,096,388 48.40 43,313.79Keller 38,827.85 1,708,295 41.12 41,544.13 1,199,351 34.37 34,895.30 1,149,775 28.30 40,628.11 1,114,060 29.40 37,893.21Lamont 43,528.97 3,423,262 39.02 87,730.97 1,034,228 35.00 29,549.38 977,089 38.60 25,313.17 769,170 29.90 25,724.75
190
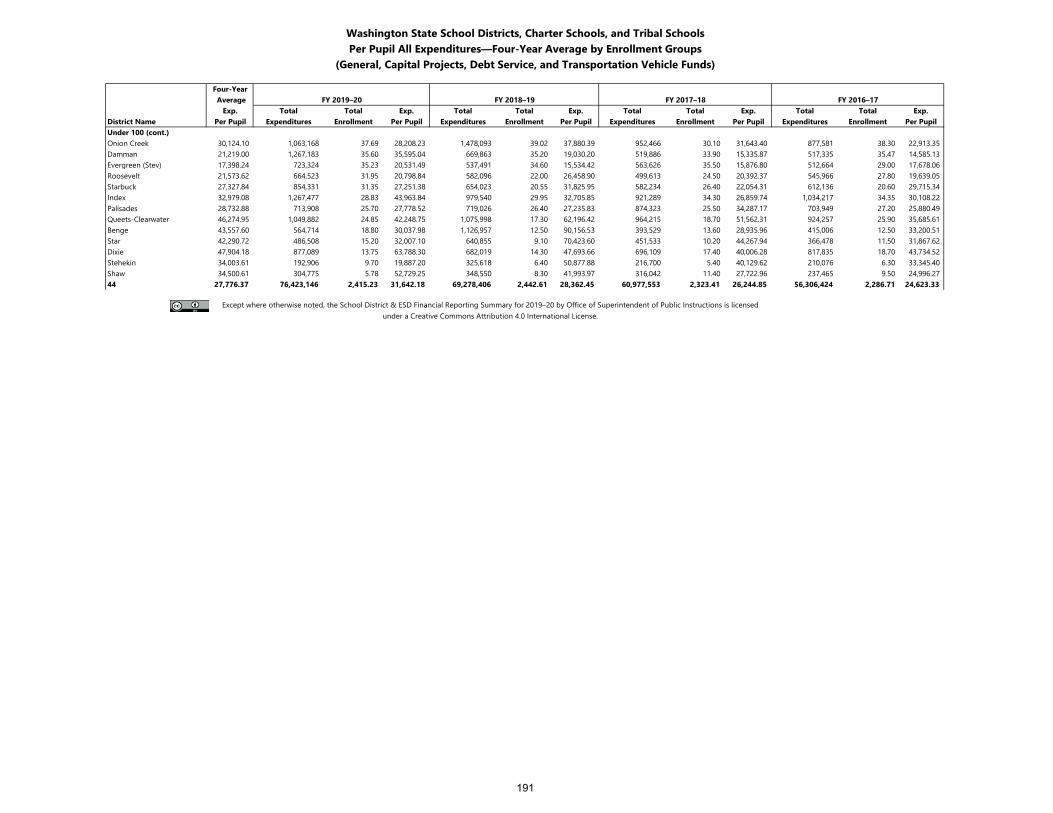
Washington State School Districts, Charter Schools, and Tribal SchoolsPer Pupil All Expenditures—Four-Year Average by Enrollment Groups
(General, Capital Projects, Debt Service, and Transportation Vehicle Funds)
Four-Year Average FY 2019–20 FY 2018–19 FY 2017–18 FY 2016–17
Exp. Total Total Exp. Total Total Exp. Total Total Exp. Total Total Exp.District Name Per Pupil Expenditures Enrollment Per Pupil Expenditures Enrollment Per Pupil Expenditures Enrollment Per Pupil Expenditures Enrollment Per PupilUnder 100 (cont.)Onion Creek 30,124.10 1,063,168 37.69 28,208.23 1,478,093 39.02 37,880.39 952,466 30.10 31,643.40 877,581 38.30 22,913.35Damman 21,219.00 1,267,183 35.60 35,595.04 669,863 35.20 19,030.20 519,886 33.90 15,335.87 517,335 35.47 14,585.13Evergreen (Stev) 17,398.24 723,324 35.23 20,531.49 537,491 34.60 15,534.42 563,626 35.50 15,876.80 512,664 29.00 17,678.06Roosevelt 21,573.62 664,523 31.95 20,798.84 582,096 22.00 26,458.90 499,613 24.50 20,392.37 545,966 27.80 19,639.05Starbuck 27,327.84 854,331 31.35 27,251.38 654,023 20.55 31,825.95 582,234 26.40 22,054.31 612,136 20.60 29,715.34Index 32,979.08 1,267,477 28.83 43,963.84 979,540 29.95 32,705.85 921,289 34.30 26,859.74 1,034,217 34.35 30,108.22Palisades 28,732.88 713,908 25.70 27,778.52 719,026 26.40 27,235.83 874,323 25.50 34,287.17 703,949 27.20 25,880.49Queets-Clearwater 46,274.95 1,049,882 24.85 42,248.75 1,075,998 17.30 62,196.42 964,215 18.70 51,562.31 924,257 25.90 35,685.61Benge 43,557.60 564,714 18.80 30,037.98 1,126,957 12.50 90,156.53 393,529 13.60 28,935.96 415,006 12.50 33,200.51Star 42,290.72 486,508 15.20 32,007.10 640,855 9.10 70,423.60 451,533 10.20 44,267.94 366,478 11.50 31,867.62Dixie 47,904.18 877,089 13.75 63,788.30 682,019 14.30 47,693.66 696,109 17.40 40,006.28 817,835 18.70 43,734.52Stehekin 34,003.61 192,906 9.70 19,887.20 325,618 6.40 50,877.88 216,700 5.40 40,129.62 210,076 6.30 33,345.40Shaw 34,500.61 304,775 5.78 52,729.25 348,550 8.30 41,993.97 316,042 11.40 27,722.96 237,465 9.50 24,996.2744 27,776.37 76,423,146 2,415.23 31,642.18 69,278,406 2,442.61 28,362.45 60,977,553 2,323.41 26,244.85 56,306,424 2,286.71 24,623.33
Except where otherwise noted, the School District & ESD Financial Reporting Summary for 2019–20 by Office of Superintendent of Public Instructions is licensed under a Creative Commons Attribution 4.0 International License.
191
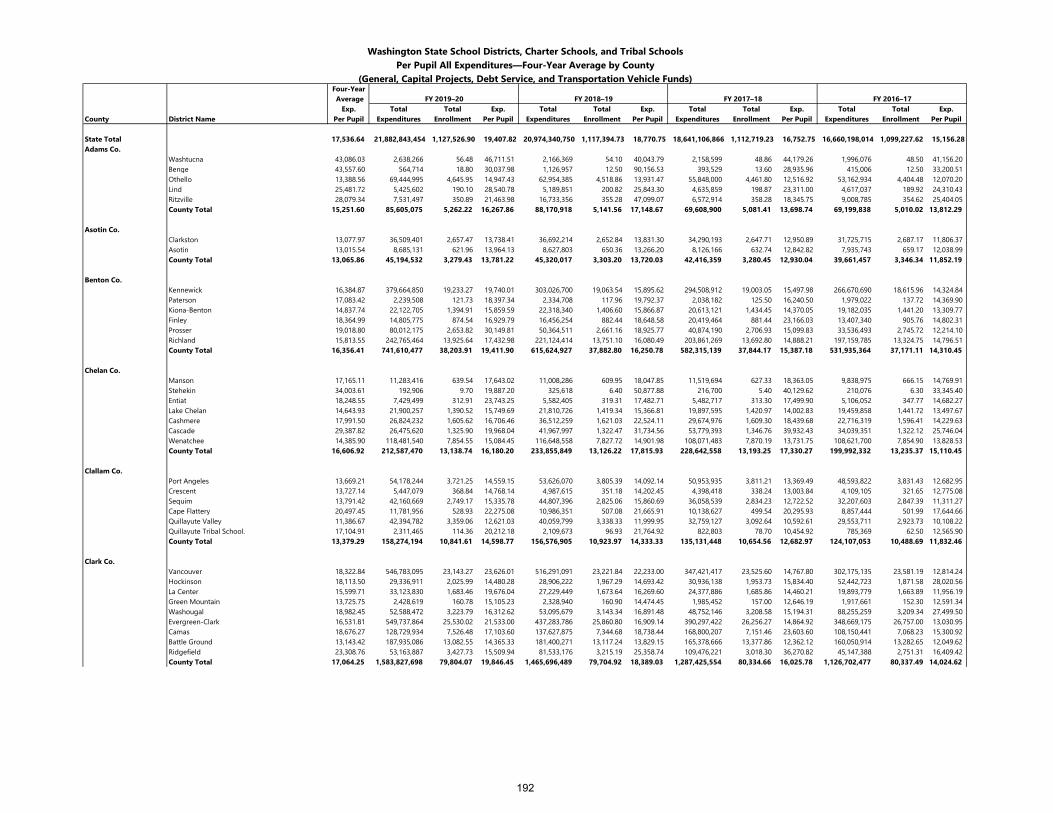
Washington State School Districts, Charter Schools, and Tribal SchoolsPer Pupil All Expenditures—Four-Year Average by County
(General, Capital Projects, Debt Service, and Transportation Vehicle Funds)Four-Year Average FY 2019–20 FY 2018–19 FY 2017–18 FY 2016–17
Exp. Total Total Exp. Total Total Exp. Total Total Exp. Total Total Exp.County District Name Per Pupil Expenditures Enrollment Per Pupil Expenditures Enrollment Per Pupil Expenditures Enrollment Per Pupil Expenditures Enrollment Per Pupil
State Total 17,536.64 21,882,843,454 1,127,526.90 19,407.82 20,974,340,750 1,117,394.73 18,770.75 18,641,106,866 1,112,719.23 16,752.75 16,660,198,014 1,099,227.62 15,156.28Adams Co.
Washtucna 43,086.03 2,638,266 56.48 46,711.51 2,166,369 54.10 40,043.79 2,158,599 48.86 44,179.26 1,996,076 48.50 41,156.20Benge 43,557.60 564,714 18.80 30,037.98 1,126,957 12.50 90,156.53 393,529 13.60 28,935.96 415,006 12.50 33,200.51Othello 13,388.56 69,444,995 4,645.95 14,947.43 62,954,385 4,518.86 13,931.47 55,848,000 4,461.80 12,516.92 53,162,934 4,404.48 12,070.20Lind 25,481.72 5,425,602 190.10 28,540.78 5,189,851 200.82 25,843.30 4,635,859 198.87 23,311.00 4,617,037 189.92 24,310.43Ritzville 28,079.34 7,531,497 350.89 21,463.98 16,733,356 355.28 47,099.07 6,572,914 358.28 18,345.75 9,008,785 354.62 25,404.05County Total 15,251.60 85,605,075 5,262.22 16,267.86 88,170,918 5,141.56 17,148.67 69,608,900 5,081.41 13,698.74 69,199,838 5,010.02 13,812.29
Asotin Co.Clarkston 13,077.97 36,509,401 2,657.47 13,738.41 36,692,214 2,652.84 13,831.30 34,290,193 2,647.71 12,950.89 31,725,715 2,687.17 11,806.37Asotin 13,015.54 8,685,131 621.96 13,964.13 8,627,803 650.36 13,266.20 8,126,166 632.74 12,842.82 7,935,743 659.17 12,038.99County Total 13,065.86 45,194,532 3,279.43 13,781.22 45,320,017 3,303.20 13,720.03 42,416,359 3,280.45 12,930.04 39,661,457 3,346.34 11,852.19
Benton Co.Kennewick 16,384.87 379,664,850 19,233.27 19,740.01 303,026,700 19,063.54 15,895.62 294,508,912 19,003.05 15,497.98 266,670,690 18,615.96 14,324.84Paterson 17,083.42 2,239,508 121.73 18,397.34 2,334,708 117.96 19,792.37 2,038,182 125.50 16,240.50 1,979,022 137.72 14,369.90Kiona-Benton 14,837.74 22,122,705 1,394.91 15,859.59 22,318,340 1,406.60 15,866.87 20,613,121 1,434.45 14,370.05 19,182,035 1,441.20 13,309.77Finley 18,364.99 14,805,775 874.54 16,929.79 16,456,254 882.44 18,648.58 20,419,464 881.44 23,166.03 13,407,340 905.76 14,802.31Prosser 19,018.80 80,012,175 2,653.82 30,149.81 50,364,511 2,661.16 18,925.77 40,874,190 2,706.93 15,099.83 33,536,493 2,745.72 12,214.10Richland 15,813.55 242,765,464 13,925.64 17,432.98 221,124,414 13,751.10 16,080.49 203,861,269 13,692.80 14,888.21 197,159,785 13,324.75 14,796.51County Total 16,356.41 741,610,477 38,203.91 19,411.90 615,624,927 37,882.80 16,250.78 582,315,139 37,844.17 15,387.18 531,935,364 37,171.11 14,310.45
Chelan Co.Manson 17,165.11 11,283,416 639.54 17,643.02 11,008,286 609.95 18,047.85 11,519,694 627.33 18,363.05 9,838,975 666.15 14,769.91Stehekin 34,003.61 192,906 9.70 19,887.20 325,618 6.40 50,877.88 216,700 5.40 40,129.62 210,076 6.30 33,345.40Entiat 18,248.55 7,429,499 312.91 23,743.25 5,582,405 319.31 17,482.71 5,482,717 313.30 17,499.90 5,106,052 347.77 14,682.27Lake Chelan 14,643.93 21,900,257 1,390.52 15,749.69 21,810,726 1,419.34 15,366.81 19,897,595 1,420.97 14,002.83 19,459,858 1,441.72 13,497.67Cashmere 17,991.50 26,824,232 1,605.62 16,706.46 36,512,259 1,621.03 22,524.11 29,674,976 1,609.30 18,439.68 22,716,319 1,596.41 14,229.63Cascade 29,387.82 26,475,620 1,325.90 19,968.04 41,967,997 1,322.47 31,734.56 53,779,393 1,346.76 39,932.43 34,039,351 1,322.12 25,746.04Wenatchee 14,385.90 118,481,540 7,854.55 15,084.45 116,648,558 7,827.72 14,901.98 108,071,483 7,870.19 13,731.75 108,621,700 7,854.90 13,828.53County Total 16,606.92 212,587,470 13,138.74 16,180.20 233,855,849 13,126.22 17,815.93 228,642,558 13,193.25 17,330.27 199,992,332 13,235.37 15,110.45
Clallam Co.Port Angeles 13,669.21 54,178,244 3,721.25 14,559.15 53,626,070 3,805.39 14,092.14 50,953,935 3,811.21 13,369.49 48,593,822 3,831.43 12,682.95Crescent 13,727.14 5,447,079 368.84 14,768.14 4,987,615 351.18 14,202.45 4,398,418 338.24 13,003.84 4,109,105 321.65 12,775.08Sequim 13,791.42 42,160,669 2,749.17 15,335.78 44,807,396 2,825.06 15,860.69 36,058,539 2,834.23 12,722.52 32,207,603 2,847.39 11,311.27Cape Flattery 20,497.45 11,781,956 528.93 22,275.08 10,986,351 507.08 21,665.91 10,138,627 499.54 20,295.93 8,857,444 501.99 17,644.66Quillayute Valley 11,386.67 42,394,782 3,359.06 12,621.03 40,059,799 3,338.33 11,999.95 32,759,127 3,092.64 10,592.61 29,553,711 2,923.73 10,108.22Quillayute Tribal School. 17,104.91 2,311,465 114.36 20,212.18 2,109,673 96.93 21,764.92 822,803 78.70 10,454.92 785,369 62.50 12,565.90County Total 13,379.29 158,274,194 10,841.61 14,598.77 156,576,905 10,923.97 14,333.33 135,131,448 10,654.56 12,682.97 124,107,053 10,488.69 11,832.46
Clark Co.Vancouver 18,322.84 546,783,095 23,143.27 23,626.01 516,291,091 23,221.84 22,233.00 347,421,417 23,525.60 14,767.80 302,175,135 23,581.19 12,814.24Hockinson 18,113.50 29,336,911 2,025.99 14,480.28 28,906,222 1,967.29 14,693.42 30,936,138 1,953.73 15,834.40 52,442,723 1,871.58 28,020.56La Center 15,599.71 33,123,830 1,683.46 19,676.04 27,229,449 1,673.64 16,269.60 24,377,886 1,685.86 14,460.21 19,893,779 1,663.89 11,956.19Green Mountain 13,725.75 2,428,619 160.78 15,105.23 2,328,940 160.90 14,474.45 1,985,452 157.00 12,646.19 1,917,661 152.30 12,591.34Washougal 18,982.45 52,588,472 3,223.79 16,312.62 53,095,679 3,143.34 16,891.48 48,752,146 3,208.58 15,194.31 88,255,259 3,209.34 27,499.50Evergreen-Clark 16,531.81 549,737,864 25,530.02 21,533.00 437,283,786 25,860.80 16,909.14 390,297,422 26,256.27 14,864.92 348,669,175 26,757.00 13,030.95Camas 18,676.27 128,729,934 7,526.48 17,103.60 137,627,875 7,344.68 18,738.44 168,800,207 7,151.46 23,603.60 108,150,441 7,068.23 15,300.92Battle Ground 13,143.42 187,935,086 13,082.55 14,365.33 181,400,271 13,117.24 13,829.15 165,378,666 13,377.86 12,362.12 160,050,914 13,282.65 12,049.62Ridgefield 23,308.76 53,163,887 3,427.73 15,509.94 81,533,176 3,215.19 25,358.74 109,476,221 3,018.30 36,270.82 45,147,388 2,751.31 16,409.42County Total 17,064.25 1,583,827,698 79,804.07 19,846.45 1,465,696,489 79,704.92 18,389.03 1,287,425,554 80,334.66 16,025.78 1,126,702,477 80,337.49 14,024.62
192
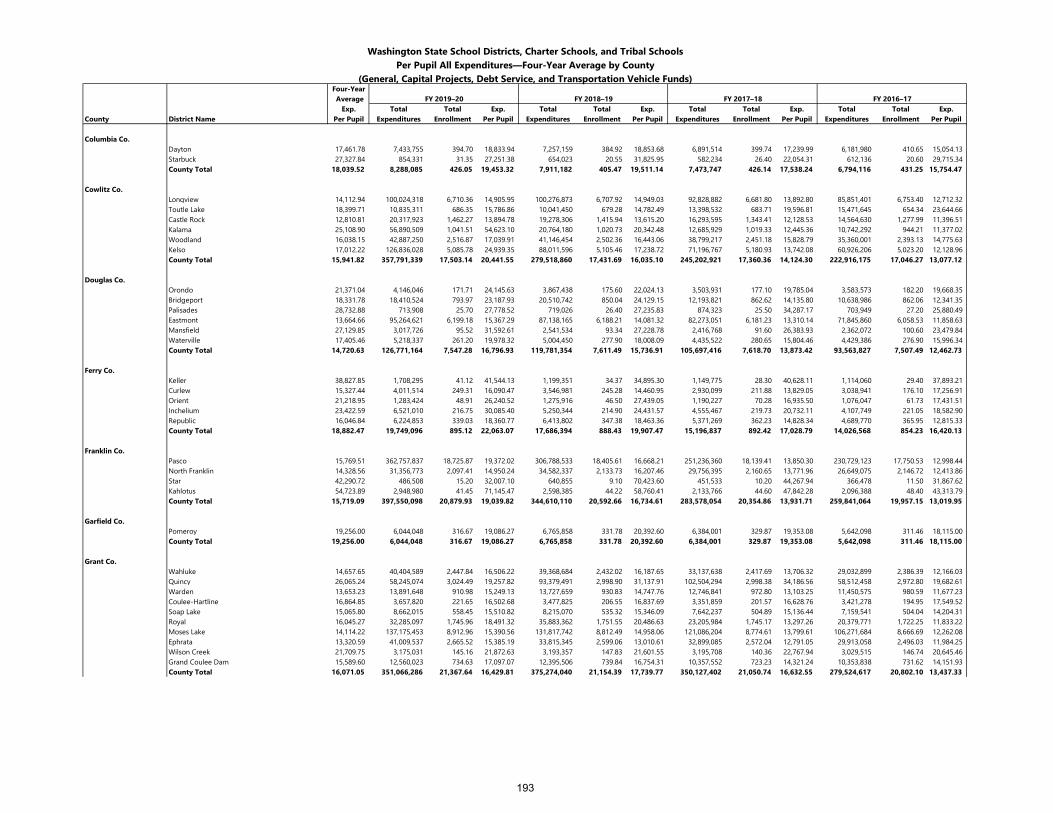
Washington State School Districts, Charter Schools, and Tribal SchoolsPer Pupil All Expenditures—Four-Year Average by County
(General, Capital Projects, Debt Service, and Transportation Vehicle Funds)Four-Year Average FY 2019–20 FY 2018–19 FY 2017–18 FY 2016–17
Exp. Total Total Exp. Total Total Exp. Total Total Exp. Total Total Exp.County District Name Per Pupil Expenditures Enrollment Per Pupil Expenditures Enrollment Per Pupil Expenditures Enrollment Per Pupil Expenditures Enrollment Per Pupil
Columbia Co.Dayton 17,461.78 7,433,755 394.70 18,833.94 7,257,159 384.92 18,853.68 6,891,514 399.74 17,239.99 6,181,980 410.65 15,054.13Starbuck 27,327.84 854,331 31.35 27,251.38 654,023 20.55 31,825.95 582,234 26.40 22,054.31 612,136 20.60 29,715.34County Total 18,039.52 8,288,085 426.05 19,453.32 7,911,182 405.47 19,511.14 7,473,747 426.14 17,538.24 6,794,116 431.25 15,754.47
Cowlitz Co.Longview 14,112.94 100,024,318 6,710.36 14,905.95 100,276,873 6,707.92 14,949.03 92,828,882 6,681.80 13,892.80 85,851,401 6,753.40 12,712.32Toutle Lake 18,399.71 10,835,311 686.35 15,786.86 10,041,450 679.28 14,782.49 13,398,532 683.71 19,596.81 15,471,645 654.34 23,644.66Castle Rock 12,810.81 20,317,923 1,462.27 13,894.78 19,278,306 1,415.94 13,615.20 16,293,595 1,343.41 12,128.53 14,564,630 1,277.99 11,396.51Kalama 25,108.90 56,890,509 1,041.51 54,623.10 20,764,180 1,020.73 20,342.48 12,685,929 1,019.33 12,445.36 10,742,292 944.21 11,377.02Woodland 16,038.15 42,887,250 2,516.87 17,039.91 41,146,454 2,502.36 16,443.06 38,799,217 2,451.18 15,828.79 35,360,001 2,393.13 14,775.63Kelso 17,012.22 126,836,028 5,085.78 24,939.35 88,011,596 5,105.46 17,238.72 71,196,767 5,180.93 13,742.08 60,926,206 5,023.20 12,128.96County Total 15,941.82 357,791,339 17,503.14 20,441.55 279,518,860 17,431.69 16,035.10 245,202,921 17,360.36 14,124.30 222,916,175 17,046.27 13,077.12
Douglas Co.Orondo 21,371.04 4,146,046 171.71 24,145.63 3,867,438 175.60 22,024.13 3,503,931 177.10 19,785.04 3,583,573 182.20 19,668.35Bridgeport 18,331.78 18,410,524 793.97 23,187.93 20,510,742 850.04 24,129.15 12,193,821 862.62 14,135.80 10,638,986 862.06 12,341.35Palisades 28,732.88 713,908 25.70 27,778.52 719,026 26.40 27,235.83 874,323 25.50 34,287.17 703,949 27.20 25,880.49Eastmont 13,664.66 95,264,621 6,199.18 15,367.29 87,138,165 6,188.21 14,081.32 82,273,051 6,181.23 13,310.14 71,845,860 6,058.53 11,858.63Mansfield 27,129.85 3,017,726 95.52 31,592.61 2,541,534 93.34 27,228.78 2,416,768 91.60 26,383.93 2,362,072 100.60 23,479.84Waterville 17,405.46 5,218,337 261.20 19,978.32 5,004,450 277.90 18,008.09 4,435,522 280.65 15,804.46 4,429,386 276.90 15,996.34County Total 14,720.63 126,771,164 7,547.28 16,796.93 119,781,354 7,611.49 15,736.91 105,697,416 7,618.70 13,873.42 93,563,827 7,507.49 12,462.73
Ferry Co.Keller 38,827.85 1,708,295 41.12 41,544.13 1,199,351 34.37 34,895.30 1,149,775 28.30 40,628.11 1,114,060 29.40 37,893.21Curlew 15,327.44 4,011,514 249.31 16,090.47 3,546,981 245.28 14,460.95 2,930,099 211.88 13,829.05 3,038,941 176.10 17,256.91Orient 21,218.95 1,283,424 48.91 26,240.52 1,275,916 46.50 27,439.05 1,190,227 70.28 16,935.50 1,076,047 61.73 17,431.51Inchelium 23,422.59 6,521,010 216.75 30,085.40 5,250,344 214.90 24,431.57 4,555,467 219.73 20,732.11 4,107,749 221.05 18,582.90Republic 16,046.84 6,224,853 339.03 18,360.77 6,413,802 347.38 18,463.36 5,371,269 362.23 14,828.34 4,689,770 365.95 12,815.33County Total 18,882.47 19,749,096 895.12 22,063.07 17,686,394 888.43 19,907.47 15,196,837 892.42 17,028.79 14,026,568 854.23 16,420.13
Franklin Co.Pasco 15,769.51 362,757,837 18,725.87 19,372.02 306,788,533 18,405.61 16,668.21 251,236,360 18,139.41 13,850.30 230,729,123 17,750.53 12,998.44North Franklin 14,328.56 31,356,773 2,097.41 14,950.24 34,582,337 2,133.73 16,207.46 29,756,395 2,160.65 13,771.96 26,649,075 2,146.72 12,413.86Star 42,290.72 486,508 15.20 32,007.10 640,855 9.10 70,423.60 451,533 10.20 44,267.94 366,478 11.50 31,867.62Kahlotus 54,723.89 2,948,980 41.45 71,145.47 2,598,385 44.22 58,760.41 2,133,766 44.60 47,842.28 2,096,388 48.40 43,313.79County Total 15,719.09 397,550,098 20,879.93 19,039.82 344,610,110 20,592.66 16,734.61 283,578,054 20,354.86 13,931.71 259,841,064 19,957.15 13,019.95
Garfield Co.Pomeroy 19,256.00 6,044,048 316.67 19,086.27 6,765,858 331.78 20,392.60 6,384,001 329.87 19,353.08 5,642,098 311.46 18,115.00County Total 19,256.00 6,044,048 316.67 19,086.27 6,765,858 331.78 20,392.60 6,384,001 329.87 19,353.08 5,642,098 311.46 18,115.00
Grant Co.Wahluke 14,657.65 40,404,589 2,447.84 16,506.22 39,368,684 2,432.02 16,187.65 33,137,638 2,417.69 13,706.32 29,032,899 2,386.39 12,166.03Quincy 26,065.24 58,245,074 3,024.49 19,257.82 93,379,491 2,998.90 31,137.91 102,504,294 2,998.38 34,186.56 58,512,458 2,972.80 19,682.61Warden 13,653.23 13,891,648 910.98 15,249.13 13,727,659 930.83 14,747.76 12,746,841 972.80 13,103.25 11,450,575 980.59 11,677.23Coulee-Hartline 16,864.85 3,657,820 221.65 16,502.68 3,477,825 206.55 16,837.69 3,351,859 201.57 16,628.76 3,421,278 194.95 17,549.52Soap Lake 15,065.80 8,662,015 558.45 15,510.82 8,215,070 535.32 15,346.09 7,642,237 504.89 15,136.44 7,159,541 504.04 14,204.31Royal 16,045.27 32,285,097 1,745.96 18,491.32 35,883,362 1,751.55 20,486.63 23,205,984 1,745.17 13,297.26 20,379,771 1,722.25 11,833.22Moses Lake 14,114.22 137,175,453 8,912.96 15,390.56 131,817,742 8,812.49 14,958.06 121,086,204 8,774.61 13,799.61 106,271,684 8,666.69 12,262.08Ephrata 13,320.59 41,009,537 2,665.52 15,385.19 33,815,345 2,599.06 13,010.61 32,899,085 2,572.04 12,791.05 29,913,058 2,496.03 11,984.25Wilson Creek 21,709.75 3,175,031 145.16 21,872.63 3,193,357 147.83 21,601.55 3,195,708 140.36 22,767.94 3,029,515 146.74 20,645.46Grand Coulee Dam 15,589.60 12,560,023 734.63 17,097.07 12,395,506 739.84 16,754.31 10,357,552 723.23 14,321.24 10,353,838 731.62 14,151.93County Total 16,071.05 351,066,286 21,367.64 16,429.81 375,274,040 21,154.39 17,739.77 350,127,402 21,050.74 16,632.55 279,524,617 20,802.10 13,437.33
193
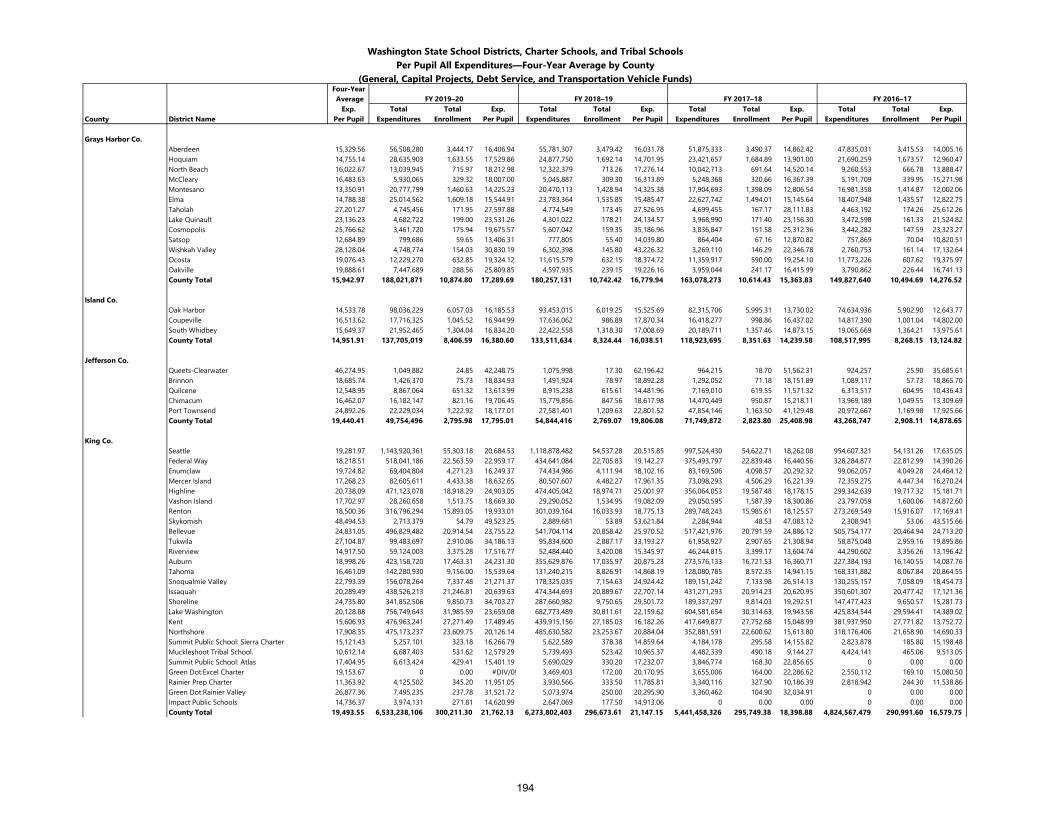
Washington State School Districts, Charter Schools, and Tribal SchoolsPer Pupil All Expenditures—Four-Year Average by County
(General, Capital Projects, Debt Service, and Transportation Vehicle Funds)Four-Year Average FY 2019–20 FY 2018–19 FY 2017–18 FY 2016–17
Exp. Total Total Exp. Total Total Exp. Total Total Exp. Total Total Exp.County District Name Per Pupil Expenditures Enrollment Per Pupil Expenditures Enrollment Per Pupil Expenditures Enrollment Per Pupil Expenditures Enrollment Per Pupil
Grays Harbor Co.Aberdeen 15,329.56 56,508,280 3,444.17 16,406.94 55,781,307 3,479.42 16,031.78 51,875,333 3,490.37 14,862.42 47,835,031 3,415.53 14,005.16Hoquiam 14,755.14 28,635,903 1,633.55 17,529.86 24,877,750 1,692.14 14,701.95 23,421,657 1,684.89 13,901.00 21,690,259 1,673.57 12,960.47North Beach 16,022.67 13,039,945 715.97 18,212.98 12,322,379 713.26 17,276.14 10,042,713 691.64 14,520.14 9,260,553 666.78 13,888.47McCleary 16,483.63 5,930,065 329.32 18,007.00 5,045,887 309.30 16,313.89 5,248,368 320.66 16,367.39 5,191,709 339.95 15,271.98Montesano 13,350.91 20,777,799 1,460.63 14,225.23 20,470,113 1,428.94 14,325.38 17,904,693 1,398.09 12,806.54 16,981,358 1,414.87 12,002.06Elma 14,788.38 25,014,562 1,609.18 15,544.91 23,783,364 1,535.85 15,485.47 22,627,742 1,494.01 15,145.64 18,407,948 1,435.57 12,822.75Taholah 27,201.27 4,745,456 171.95 27,597.88 4,774,549 173.45 27,526.95 4,699,455 167.17 28,111.83 4,463,192 174.26 25,612.26Lake Quinault 23,136.23 4,682,722 199.00 23,531.26 4,301,022 178.21 24,134.57 3,968,990 171.40 23,156.30 3,472,598 161.33 21,524.82Cosmopolis 25,766.62 3,461,720 175.94 19,675.57 5,607,042 159.35 35,186.96 3,836,847 151.58 25,312.36 3,442,282 147.59 23,323.27Satsop 12,684.89 799,686 59.65 13,406.31 777,805 55.40 14,039.80 864,404 67.16 12,870.82 757,869 70.04 10,820.51Wishkah Valley 28,128.04 4,748,774 154.03 30,830.19 6,302,398 145.80 43,226.32 3,269,110 146.29 22,346.78 2,760,753 161.14 17,132.64Ocosta 19,076.43 12,229,270 632.85 19,324.12 11,615,579 632.15 18,374.72 11,359,917 590.00 19,254.10 11,773,226 607.62 19,375.97Oakville 19,888.61 7,447,689 288.56 25,809.85 4,597,935 239.15 19,226.16 3,959,044 241.17 16,415.99 3,790,862 226.44 16,741.13County Total 15,942.97 188,021,871 10,874.80 17,289.69 180,257,131 10,742.42 16,779.94 163,078,273 10,614.43 15,363.83 149,827,640 10,494.69 14,276.52
Island Co.Oak Harbor 14,533.78 98,036,229 6,057.03 16,185.53 93,453,015 6,019.25 15,525.69 82,315,706 5,995.31 13,730.02 74,634,936 5,902.90 12,643.77Coupeville 16,513.62 17,716,325 1,045.52 16,944.99 17,636,062 986.89 17,870.34 16,418,277 998.86 16,437.02 14,817,390 1,001.04 14,802.00South Whidbey 15,649.37 21,952,465 1,304.04 16,834.20 22,422,558 1,318.30 17,008.69 20,189,711 1,357.46 14,873.15 19,065,669 1,364.21 13,975.61County Total 14,951.91 137,705,019 8,406.59 16,380.60 133,511,634 8,324.44 16,038.51 118,923,695 8,351.63 14,239.58 108,517,995 8,268.15 13,124.82
Jefferson Co.Queets-Clearwater 46,274.95 1,049,882 24.85 42,248.75 1,075,998 17.30 62,196.42 964,215 18.70 51,562.31 924,257 25.90 35,685.61Brinnon 18,685.74 1,426,370 75.73 18,834.93 1,491,924 78.97 18,892.28 1,292,052 71.18 18,151.89 1,089,117 57.73 18,865.70Quilcene 12,548.95 8,867,064 651.32 13,613.99 8,915,238 615.61 14,481.96 7,169,010 619.55 11,571.32 6,313,517 604.95 10,436.43Chimacum 16,462.07 16,182,147 821.16 19,706.45 15,779,856 847.56 18,617.98 14,470,449 950.87 15,218.11 13,969,189 1,049.55 13,309.69Port Townsend 24,892.26 22,229,034 1,222.92 18,177.01 27,581,401 1,209.63 22,801.52 47,854,146 1,163.50 41,129.48 20,972,667 1,169.98 17,925.66County Total 19,440.41 49,754,496 2,795.98 17,795.01 54,844,416 2,769.07 19,806.08 71,749,872 2,823.80 25,408.98 43,268,747 2,908.11 14,878.65
King Co.Seattle 19,281.97 1,143,920,361 55,303.18 20,684.53 1,118,878,482 54,537.28 20,515.85 997,524,430 54,622.71 18,262.08 954,607,321 54,131.26 17,635.05Federal Way 18,218.51 518,041,186 22,563.59 22,959.17 434,641,084 22,705.83 19,142.27 375,493,797 22,839.48 16,440.56 328,284,877 22,812.99 14,390.26Enumclaw 19,724.82 69,404,804 4,271.23 16,249.37 74,434,986 4,111.94 18,102.16 83,169,506 4,098.57 20,292.32 99,062,057 4,049.28 24,464.12Mercer Island 17,268.23 82,605,611 4,433.38 18,632.65 80,507,607 4,482.27 17,961.35 73,098,293 4,506.29 16,221.39 72,359,275 4,447.34 16,270.24Highline 20,738.09 471,123,078 18,918.29 24,903.05 474,405,042 18,974.71 25,001.97 356,064,053 19,587.48 18,178.15 299,342,639 19,717.32 15,181.71Vashon Island 17,702.97 28,260,658 1,513.75 18,669.30 29,290,052 1,534.95 19,082.09 29,050,595 1,587.39 18,300.86 23,797,059 1,600.06 14,872.60Renton 18,500.36 316,796,294 15,893.05 19,933.01 301,039,164 16,033.93 18,775.13 289,748,243 15,985.61 18,125.57 273,269,549 15,916.07 17,169.41Skykomish 48,494.53 2,713,379 54.79 49,523.25 2,889,681 53.89 53,621.84 2,284,944 48.53 47,083.12 2,308,941 53.06 43,515.66Bellevue 24,831.05 496,829,482 20,914.54 23,755.22 541,704,114 20,858.42 25,970.52 517,421,976 20,791.59 24,886.12 505,754,177 20,464.94 24,713.20Tukwila 27,104.87 99,483,697 2,910.06 34,186.13 95,834,600 2,887.17 33,193.27 61,958,927 2,907.65 21,308.94 58,875,048 2,959.16 19,895.86Riverview 14,917.50 59,124,003 3,375.28 17,516.77 52,484,440 3,420.08 15,345.97 46,244,815 3,399.17 13,604.74 44,290,602 3,356.26 13,196.42Auburn 18,998.26 423,158,720 17,463.31 24,231.30 355,629,876 17,035.97 20,875.23 273,576,133 16,721.53 16,360.71 227,384,193 16,140.55 14,087.76Tahoma 16,461.09 142,280,930 9,156.00 15,539.64 131,240,215 8,826.91 14,868.19 128,080,785 8,572.35 14,941.15 168,331,882 8,067.84 20,864.55Snoqualmie Valley 22,793.39 156,078,264 7,337.48 21,271.37 178,325,035 7,154.63 24,924.42 189,151,242 7,133.98 26,514.13 130,255,157 7,058.09 18,454.73Issaquah 20,289.49 438,526,213 21,246.81 20,639.63 474,344,693 20,889.67 22,707.14 431,271,293 20,914.23 20,620.95 350,601,307 20,477.42 17,121.36Shoreline 24,735.80 341,852,506 9,850.73 34,703.27 287,660,982 9,750.65 29,501.72 189,337,297 9,814.03 19,292.51 147,477,423 9,650.57 15,281.73Lake Washington 20,128.88 756,749,643 31,985.59 23,659.08 682,773,489 30,811.61 22,159.62 604,581,654 30,314.63 19,943.56 425,834,544 29,594.41 14,389.02Kent 15,606.93 476,963,241 27,271.49 17,489.45 439,915,156 27,185.03 16,182.26 417,649,877 27,752.68 15,048.99 381,937,950 27,771.82 13,752.72Northshore 17,908.35 475,173,237 23,609.75 20,126.14 485,630,582 23,253.67 20,884.04 352,881,591 22,600.62 15,613.80 318,176,406 21,658.90 14,690.33Summit Public School: Sierra Charter 15,121.43 5,257,101 323.18 16,266.79 5,622,589 378.38 14,859.64 4,184,178 295.58 14,155.82 2,823,878 185.80 15,198.48Muckleshoot Tribal School. 10,612.14 6,687,403 531.62 12,579.29 5,739,493 523.42 10,965.37 4,482,339 490.18 9,144.27 4,424,141 465.06 9,513.05Summit Public School: Atlas 17,404.95 6,613,424 429.41 15,401.19 5,690,029 330.20 17,232.07 3,846,774 168.30 22,856.65 0 0.00 0.00Green Dot:Excel Charter 19,153.67 0 0.00 #DIV/0! 3,469,403 172.00 20,170.95 3,655,006 164.00 22,286.62 2,550,112 169.10 15,080.50Rainier Prep Charter 11,363.92 4,125,502 345.20 11,951.05 3,930,566 333.50 11,785.81 3,340,116 327.90 10,186.39 2,818,942 244.30 11,538.86Green Dot:Rainier Valley 26,877.36 7,495,235 237.78 31,521.72 5,073,974 250.00 20,295.90 3,360,462 104.90 32,034.91 0 0.00 0.00Impact Public Schools 14,736.37 3,974,131 271.81 14,620.99 2,647,069 177.50 14,913.06 0 0.00 0.00 0 0.00 0.00County Total 19,493.55 6,533,238,106 300,211.30 21,762.13 6,273,802,403 296,673.61 21,147.15 5,441,458,326 295,749.38 18,398.88 4,824,567,479 290,991.60 16,579.75
194
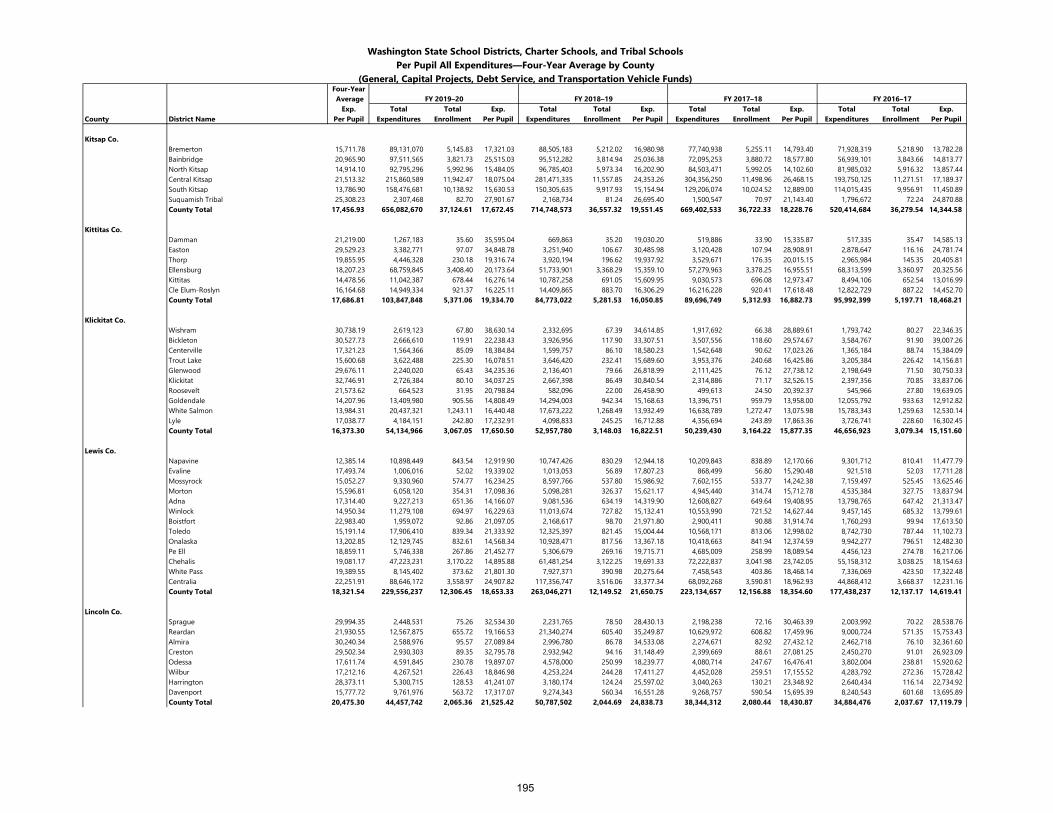
Washington State School Districts, Charter Schools, and Tribal SchoolsPer Pupil All Expenditures—Four-Year Average by County
(General, Capital Projects, Debt Service, and Transportation Vehicle Funds)Four-Year Average FY 2019–20 FY 2018–19 FY 2017–18 FY 2016–17
Exp. Total Total Exp. Total Total Exp. Total Total Exp. Total Total Exp.County District Name Per Pupil Expenditures Enrollment Per Pupil Expenditures Enrollment Per Pupil Expenditures Enrollment Per Pupil Expenditures Enrollment Per Pupil
Kitsap Co.Bremerton 15,711.78 89,131,070 5,145.83 17,321.03 88,505,183 5,212.02 16,980.98 77,740,938 5,255.11 14,793.40 71,928,319 5,218.90 13,782.28Bainbridge 20,965.90 97,511,565 3,821.73 25,515.03 95,512,282 3,814.94 25,036.38 72,095,253 3,880.72 18,577.80 56,939,101 3,843.66 14,813.77North Kitsap 14,914.10 92,795,296 5,992.96 15,484.05 96,785,403 5,973.34 16,202.90 84,503,471 5,992.05 14,102.60 81,985,032 5,916.32 13,857.44Central Kitsap 21,513.32 215,860,589 11,942.47 18,075.04 281,471,335 11,557.85 24,353.26 304,356,250 11,498.96 26,468.15 193,750,125 11,271.51 17,189.37South Kitsap 13,786.90 158,476,681 10,138.92 15,630.53 150,305,635 9,917.93 15,154.94 129,206,074 10,024.52 12,889.00 114,015,435 9,956.91 11,450.89Suquamish Tribal 25,308.23 2,307,468 82.70 27,901.67 2,168,734 81.24 26,695.40 1,500,547 70.97 21,143.40 1,796,672 72.24 24,870.88County Total 17,456.93 656,082,670 37,124.61 17,672.45 714,748,573 36,557.32 19,551.45 669,402,533 36,722.33 18,228.76 520,414,684 36,279.54 14,344.58
Kittitas Co.Damman 21,219.00 1,267,183 35.60 35,595.04 669,863 35.20 19,030.20 519,886 33.90 15,335.87 517,335 35.47 14,585.13Easton 29,529.23 3,382,771 97.07 34,848.78 3,251,940 106.67 30,485.98 3,120,428 107.94 28,908.91 2,878,647 116.16 24,781.74Thorp 19,855.95 4,446,328 230.18 19,316.74 3,920,194 196.62 19,937.92 3,529,671 176.35 20,015.15 2,965,984 145.35 20,405.81Ellensburg 18,207.23 68,759,845 3,408.40 20,173.64 51,733,901 3,368.29 15,359.10 57,279,963 3,378.25 16,955.51 68,313,599 3,360.97 20,325.56Kittitas 14,478.56 11,042,387 678.44 16,276.14 10,787,258 691.05 15,609.95 9,030,573 696.08 12,973.47 8,494,106 652.54 13,016.99Cle Elum-Roslyn 16,164.68 14,949,334 921.37 16,225.11 14,409,865 883.70 16,306.29 16,216,228 920.41 17,618.48 12,822,729 887.22 14,452.70County Total 17,686.81 103,847,848 5,371.06 19,334.70 84,773,022 5,281.53 16,050.85 89,696,749 5,312.93 16,882.73 95,992,399 5,197.71 18,468.21
Klickitat Co.Wishram 30,738.19 2,619,123 67.80 38,630.14 2,332,695 67.39 34,614.85 1,917,692 66.38 28,889.61 1,793,742 80.27 22,346.35Bickleton 30,527.73 2,666,610 119.91 22,238.43 3,926,956 117.90 33,307.51 3,507,556 118.60 29,574.67 3,584,767 91.90 39,007.26Centerville 17,321.23 1,564,366 85.09 18,384.84 1,599,757 86.10 18,580.23 1,542,648 90.62 17,023.26 1,365,184 88.74 15,384.09Trout Lake 15,600.68 3,622,488 225.30 16,078.51 3,646,420 232.41 15,689.60 3,953,376 240.68 16,425.86 3,205,384 226.42 14,156.81Glenwood 29,676.11 2,240,020 65.43 34,235.36 2,136,401 79.66 26,818.99 2,111,425 76.12 27,738.12 2,198,649 71.50 30,750.33Klickitat 32,746.91 2,726,384 80.10 34,037.25 2,667,398 86.49 30,840.54 2,314,886 71.17 32,526.15 2,397,356 70.85 33,837.06Roosevelt 21,573.62 664,523 31.95 20,798.84 582,096 22.00 26,458.90 499,613 24.50 20,392.37 545,966 27.80 19,639.05Goldendale 14,207.96 13,409,980 905.56 14,808.49 14,294,003 942.34 15,168.63 13,396,751 959.79 13,958.00 12,055,792 933.63 12,912.82White Salmon 13,984.31 20,437,321 1,243.11 16,440.48 17,673,222 1,268.49 13,932.49 16,638,789 1,272.47 13,075.98 15,783,343 1,259.63 12,530.14Lyle 17,038.77 4,184,151 242.80 17,232.91 4,098,833 245.25 16,712.88 4,356,694 243.89 17,863.36 3,726,741 228.60 16,302.45County Total 16,373.30 54,134,966 3,067.05 17,650.50 52,957,780 3,148.03 16,822.51 50,239,430 3,164.22 15,877.35 46,656,923 3,079.34 15,151.60
Lewis Co.Napavine 12,385.14 10,898,449 843.54 12,919.90 10,747,426 830.29 12,944.18 10,209,843 838.89 12,170.66 9,301,712 810.41 11,477.79Evaline 17,493.74 1,006,016 52.02 19,339.02 1,013,053 56.89 17,807.23 868,499 56.80 15,290.48 921,518 52.03 17,711.28Mossyrock 15,052.27 9,330,960 574.77 16,234.25 8,597,766 537.80 15,986.92 7,602,155 533.77 14,242.38 7,159,497 525.45 13,625.46Morton 15,596.81 6,058,120 354.31 17,098.36 5,098,281 326.37 15,621.17 4,945,440 314.74 15,712.78 4,535,384 327.75 13,837.94Adna 17,314.40 9,227,213 651.36 14,166.07 9,081,536 634.19 14,319.90 12,608,827 649.64 19,408.95 13,798,765 647.42 21,313.47Winlock 14,950.34 11,279,108 694.97 16,229.63 11,013,674 727.82 15,132.41 10,553,990 721.52 14,627.44 9,457,145 685.32 13,799.61Boistfort 22,983.40 1,959,072 92.86 21,097.05 2,168,617 98.70 21,971.80 2,900,411 90.88 31,914.74 1,760,293 99.94 17,613.50Toledo 15,191.14 17,906,410 839.34 21,333.92 12,325,397 821.45 15,004.44 10,568,171 813.06 12,998.02 8,742,730 787.44 11,102.73Onalaska 13,202.85 12,129,745 832.61 14,568.34 10,928,471 817.56 13,367.18 10,418,663 841.94 12,374.59 9,942,277 796.51 12,482.30Pe Ell 18,859.11 5,746,338 267.86 21,452.77 5,306,679 269.16 19,715.71 4,685,009 258.99 18,089.54 4,456,123 274.78 16,217.06Chehalis 19,081.17 47,223,231 3,170.22 14,895.88 61,481,254 3,122.25 19,691.33 72,222,837 3,041.98 23,742.05 55,158,312 3,038.25 18,154.63White Pass 19,389.55 8,145,402 373.62 21,801.30 7,927,371 390.98 20,275.64 7,458,543 403.86 18,468.14 7,336,069 423.50 17,322.48Centralia 22,251.91 88,646,172 3,558.97 24,907.82 117,356,747 3,516.06 33,377.34 68,092,268 3,590.81 18,962.93 44,868,412 3,668.37 12,231.16County Total 18,321.54 229,556,237 12,306.45 18,653.33 263,046,271 12,149.52 21,650.75 223,134,657 12,156.88 18,354.60 177,438,237 12,137.17 14,619.41
Lincoln Co.Sprague 29,994.35 2,448,531 75.26 32,534.30 2,231,765 78.50 28,430.13 2,198,238 72.16 30,463.39 2,003,992 70.22 28,538.76Reardan 21,930.55 12,567,875 655.72 19,166.53 21,340,274 605.40 35,249.87 10,629,972 608.82 17,459.96 9,000,724 571.35 15,753.43Almira 30,240.34 2,588,976 95.57 27,089.84 2,996,780 86.78 34,533.08 2,274,671 82.92 27,432.12 2,462,718 76.10 32,361.60Creston 29,502.34 2,930,303 89.35 32,795.78 2,932,942 94.16 31,148.49 2,399,669 88.61 27,081.25 2,450,270 91.01 26,923.09Odessa 17,611.74 4,591,845 230.78 19,897.07 4,578,000 250.99 18,239.77 4,080,714 247.67 16,476.41 3,802,004 238.81 15,920.62Wilbur 17,212.16 4,267,521 226.43 18,846.98 4,253,224 244.28 17,411.27 4,452,028 259.51 17,155.52 4,283,792 272.36 15,728.42Harrington 28,373.11 5,300,715 128.53 41,241.07 3,180,174 124.24 25,597.02 3,040,263 130.21 23,348.92 2,640,434 116.14 22,734.92Davenport 15,777.72 9,761,976 563.72 17,317.07 9,274,343 560.34 16,551.28 9,268,757 590.54 15,695.39 8,240,543 601.68 13,695.89County Total 20,475.30 44,457,742 2,065.36 21,525.42 50,787,502 2,044.69 24,838.73 38,344,312 2,080.44 18,430.87 34,884,476 2,037.67 17,119.79
195
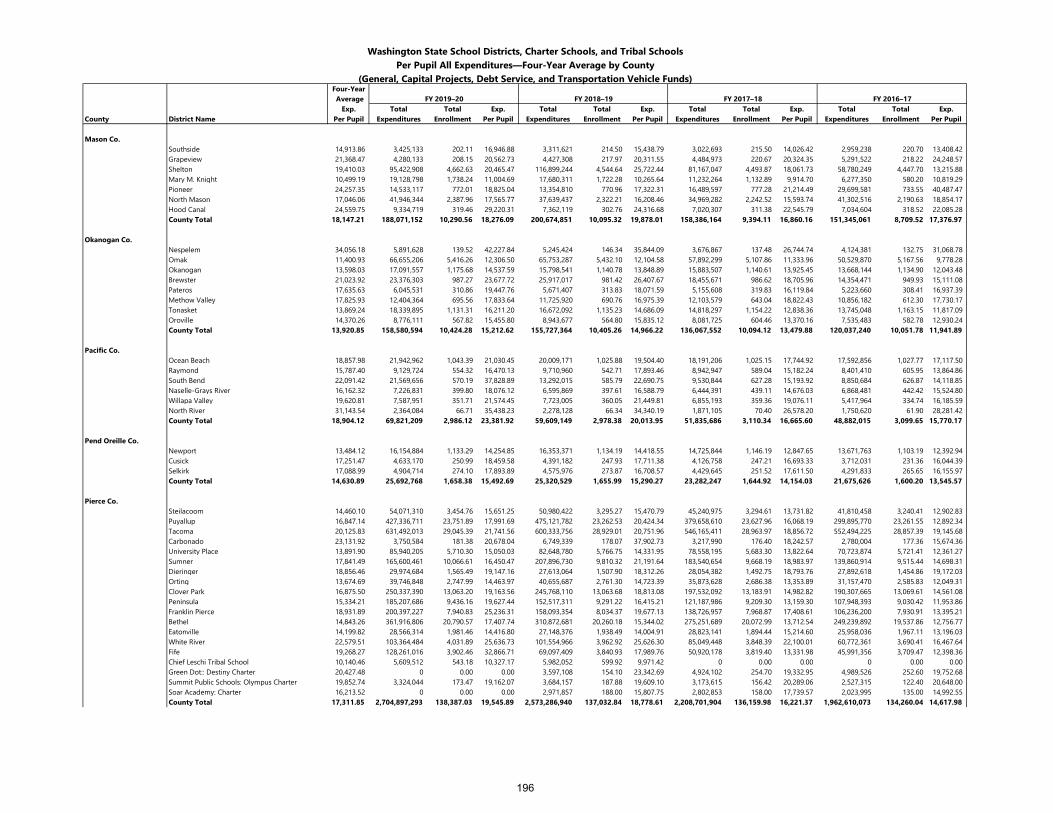
Washington State School Districts, Charter Schools, and Tribal SchoolsPer Pupil All Expenditures—Four-Year Average by County
(General, Capital Projects, Debt Service, and Transportation Vehicle Funds)Four-Year Average FY 2019–20 FY 2018–19 FY 2017–18 FY 2016–17
Exp. Total Total Exp. Total Total Exp. Total Total Exp. Total Total Exp.County District Name Per Pupil Expenditures Enrollment Per Pupil Expenditures Enrollment Per Pupil Expenditures Enrollment Per Pupil Expenditures Enrollment Per Pupil
Mason Co.Southside 14,913.86 3,425,133 202.11 16,946.88 3,311,621 214.50 15,438.79 3,022,693 215.50 14,026.42 2,959,238 220.70 13,408.42Grapeview 21,368.47 4,280,133 208.15 20,562.73 4,427,308 217.97 20,311.55 4,484,973 220.67 20,324.35 5,291,522 218.22 24,248.57Shelton 19,410.03 95,422,908 4,662.63 20,465.47 116,899,244 4,544.64 25,722.44 81,167,047 4,493.87 18,061.73 58,780,249 4,447.70 13,215.88Mary M. Knight 10,499.19 19,128,798 1,738.24 11,004.69 17,680,311 1,722.28 10,265.64 11,232,264 1,132.89 9,914.70 6,277,350 580.20 10,819.29Pioneer 24,257.35 14,533,117 772.01 18,825.04 13,354,810 770.96 17,322.31 16,489,597 777.28 21,214.49 29,699,581 733.55 40,487.47North Mason 17,046.06 41,946,344 2,387.96 17,565.77 37,639,437 2,322.21 16,208.46 34,969,282 2,242.52 15,593.74 41,302,516 2,190.63 18,854.17Hood Canal 24,559.75 9,334,719 319.46 29,220.31 7,362,119 302.76 24,316.68 7,020,307 311.38 22,545.79 7,034,604 318.52 22,085.28County Total 18,147.21 188,071,152 10,290.56 18,276.09 200,674,851 10,095.32 19,878.01 158,386,164 9,394.11 16,860.16 151,345,061 8,709.52 17,376.97
Okanogan Co.Nespelem 34,056.18 5,891,628 139.52 42,227.84 5,245,424 146.34 35,844.09 3,676,867 137.48 26,744.74 4,124,381 132.75 31,068.78Omak 11,400.93 66,655,206 5,416.26 12,306.50 65,753,287 5,432.10 12,104.58 57,892,299 5,107.86 11,333.96 50,529,870 5,167.56 9,778.28Okanogan 13,598.03 17,091,557 1,175.68 14,537.59 15,798,541 1,140.78 13,848.89 15,883,507 1,140.61 13,925.45 13,668,144 1,134.90 12,043.48Brewster 21,023.92 23,376,303 987.27 23,677.72 25,917,017 981.42 26,407.67 18,455,671 986.62 18,705.96 14,354,471 949.93 15,111.08Pateros 17,635.63 6,045,531 310.86 19,447.76 5,671,407 313.83 18,071.59 5,155,608 319.83 16,119.84 5,223,660 308.41 16,937.39Methow Valley 17,825.93 12,404,364 695.56 17,833.64 11,725,920 690.76 16,975.39 12,103,579 643.04 18,822.43 10,856,182 612.30 17,730.17Tonasket 13,869.24 18,339,895 1,131.31 16,211.20 16,672,092 1,135.23 14,686.09 14,818,297 1,154.22 12,838.36 13,745,048 1,163.15 11,817.09Oroville 14,370.26 8,776,111 567.82 15,455.80 8,943,677 564.80 15,835.12 8,081,725 604.46 13,370.16 7,535,483 582.78 12,930.24County Total 13,920.85 158,580,594 10,424.28 15,212.62 155,727,364 10,405.26 14,966.22 136,067,552 10,094.12 13,479.88 120,037,240 10,051.78 11,941.89
Pacific Co.Ocean Beach 18,857.98 21,942,962 1,043.39 21,030.45 20,009,171 1,025.88 19,504.40 18,191,206 1,025.15 17,744.92 17,592,856 1,027.77 17,117.50Raymond 15,787.40 9,129,724 554.32 16,470.13 9,710,960 542.71 17,893.46 8,942,947 589.04 15,182.24 8,401,410 605.95 13,864.86South Bend 22,091.42 21,569,656 570.19 37,828.89 13,292,015 585.79 22,690.75 9,530,844 627.28 15,193.92 8,850,684 626.87 14,118.85Naselle-Grays River 16,162.32 7,226,831 399.80 18,076.12 6,595,869 397.61 16,588.79 6,444,391 439.11 14,676.03 6,868,481 442.42 15,524.80Willapa Valley 19,620.81 7,587,951 351.71 21,574.45 7,723,005 360.05 21,449.81 6,855,193 359.36 19,076.11 5,417,964 334.74 16,185.59North River 31,143.54 2,364,084 66.71 35,438.23 2,278,128 66.34 34,340.19 1,871,105 70.40 26,578.20 1,750,620 61.90 28,281.42County Total 18,904.12 69,821,209 2,986.12 23,381.92 59,609,149 2,978.38 20,013.95 51,835,686 3,110.34 16,665.60 48,882,015 3,099.65 15,770.17
Pend Oreille Co.Newport 13,484.12 16,154,884 1,133.29 14,254.85 16,353,371 1,134.19 14,418.55 14,725,844 1,146.19 12,847.65 13,671,763 1,103.19 12,392.94Cusick 17,251.47 4,633,170 250.99 18,459.58 4,391,182 247.93 17,711.38 4,126,758 247.21 16,693.33 3,712,031 231.36 16,044.39Selkirk 17,088.99 4,904,714 274.10 17,893.89 4,575,976 273.87 16,708.57 4,429,645 251.52 17,611.50 4,291,833 265.65 16,155.97County Total 14,630.89 25,692,768 1,658.38 15,492.69 25,320,529 1,655.99 15,290.27 23,282,247 1,644.92 14,154.03 21,675,626 1,600.20 13,545.57
Pierce Co.Steilacoom 14,460.10 54,071,310 3,454.76 15,651.25 50,980,422 3,295.27 15,470.79 45,240,975 3,294.61 13,731.82 41,810,458 3,240.41 12,902.83Puyallup 16,847.14 427,336,711 23,751.89 17,991.69 475,121,782 23,262.53 20,424.34 379,658,610 23,627.96 16,068.19 299,895,770 23,261.55 12,892.34Tacoma 20,125.83 631,492,013 29,045.39 21,741.56 600,333,756 28,929.01 20,751.96 546,165,411 28,963.97 18,856.72 552,494,225 28,857.39 19,145.68Carbonado 23,131.92 3,750,584 181.38 20,678.04 6,749,339 178.07 37,902.73 3,217,990 176.40 18,242.57 2,780,004 177.36 15,674.36University Place 13,891.90 85,940,205 5,710.30 15,050.03 82,648,780 5,766.75 14,331.95 78,558,195 5,683.30 13,822.64 70,723,874 5,721.41 12,361.27Sumner 17,841.49 165,600,461 10,066.61 16,450.47 207,896,730 9,810.32 21,191.64 183,540,654 9,668.19 18,983.97 139,860,914 9,515.44 14,698.31Dieringer 18,856.46 29,974,684 1,565.49 19,147.16 27,613,064 1,507.90 18,312.26 28,054,382 1,492.75 18,793.76 27,892,618 1,454.86 19,172.03Orting 13,674.69 39,746,848 2,747.99 14,463.97 40,655,687 2,761.30 14,723.39 35,873,628 2,686.38 13,353.89 31,157,470 2,585.83 12,049.31Clover Park 16,875.50 250,337,390 13,063.20 19,163.56 245,768,110 13,063.68 18,813.08 197,532,092 13,183.91 14,982.82 190,307,665 13,069.61 14,561.08Peninsula 15,334.21 185,207,686 9,436.16 19,627.44 152,517,311 9,291.22 16,415.21 121,187,986 9,209.30 13,159.30 107,948,393 9,030.42 11,953.86Franklin Pierce 18,931.89 200,397,227 7,940.83 25,236.31 158,093,354 8,034.37 19,677.13 138,726,957 7,968.87 17,408.61 106,236,200 7,930.91 13,395.21Bethel 14,843.26 361,916,806 20,790.57 17,407.74 310,872,681 20,260.18 15,344.02 275,251,689 20,072.99 13,712.54 249,239,892 19,537.86 12,756.77Eatonville 14,199.82 28,566,314 1,981.46 14,416.80 27,148,376 1,938.49 14,004.91 28,823,141 1,894.44 15,214.60 25,958,036 1,967.11 13,196.03White River 22,579.51 103,364,484 4,031.89 25,636.73 101,554,966 3,962.92 25,626.30 85,049,448 3,848.39 22,100.01 60,772,361 3,690.41 16,467.64Fife 19,268.27 128,261,016 3,902.46 32,866.71 69,097,409 3,840.93 17,989.76 50,920,178 3,819.40 13,331.98 45,991,356 3,709.47 12,398.36Chief Leschi Tribal School 10,140.46 5,609,512 543.18 10,327.17 5,982,052 599.92 9,971.42 0 0.00 0.00 0 0.00 0.00Green Dot:: Destiny Charter 20,427.48 0 0.00 0.00 3,597,108 154.10 23,342.69 4,924,102 254.70 19,332.95 4,989,526 252.60 19,752.68Summit Public Schools: Olympus Charter 19,852.74 3,324,044 173.47 19,162.07 3,684,157 187.88 19,609.10 3,173,615 156.42 20,289.06 2,527,315 122.40 20,648.00Soar Academy: Charter 16,213.52 0 0.00 0.00 2,971,857 188.00 15,807.75 2,802,853 158.00 17,739.57 2,023,995 135.00 14,992.55County Total 17,311.85 2,704,897,293 138,387.03 19,545.89 2,573,286,940 137,032.84 18,778.61 2,208,701,904 136,159.98 16,221.37 1,962,610,073 134,260.04 14,617.98
196
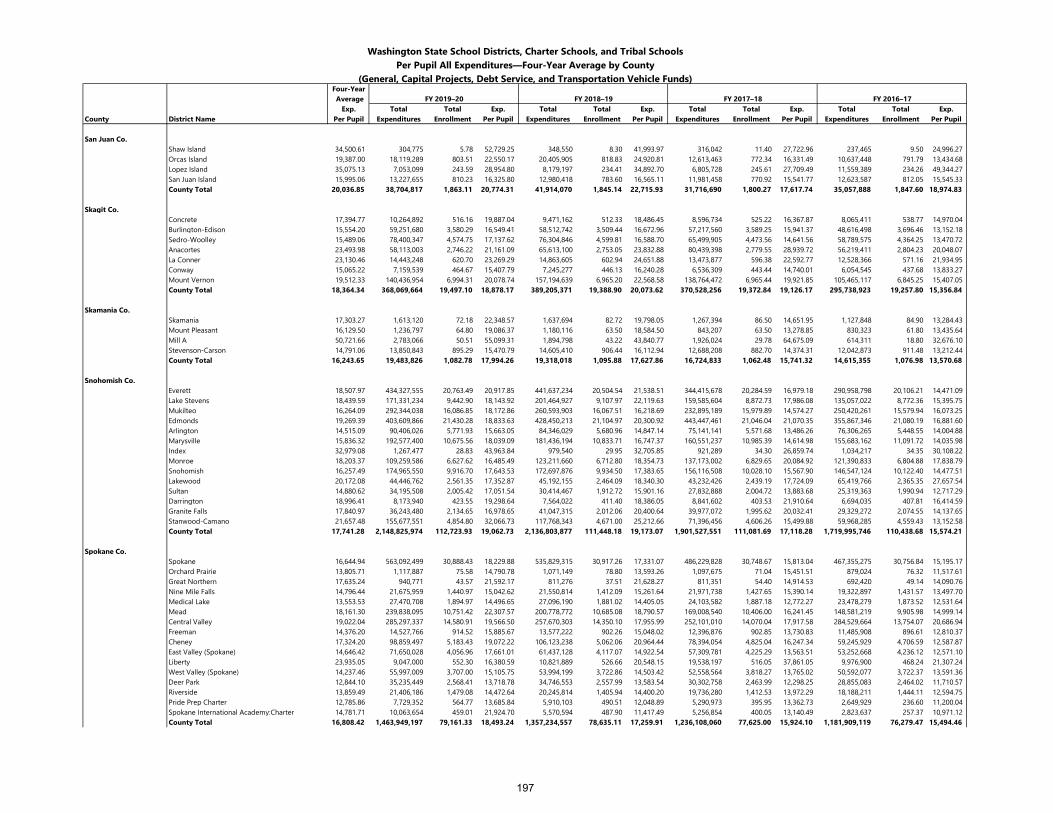
Washington State School Districts, Charter Schools, and Tribal SchoolsPer Pupil All Expenditures—Four-Year Average by County
(General, Capital Projects, Debt Service, and Transportation Vehicle Funds)Four-Year Average FY 2019–20 FY 2018–19 FY 2017–18 FY 2016–17
Exp. Total Total Exp. Total Total Exp. Total Total Exp. Total Total Exp.County District Name Per Pupil Expenditures Enrollment Per Pupil Expenditures Enrollment Per Pupil Expenditures Enrollment Per Pupil Expenditures Enrollment Per Pupil
San Juan Co.Shaw Island 34,500.61 304,775 5.78 52,729.25 348,550 8.30 41,993.97 316,042 11.40 27,722.96 237,465 9.50 24,996.27Orcas Island 19,387.00 18,119,289 803.51 22,550.17 20,405,905 818.83 24,920.81 12,613,463 772.34 16,331.49 10,637,448 791.79 13,434.68Lopez Island 35,075.13 7,053,099 243.59 28,954.80 8,179,197 234.41 34,892.70 6,805,728 245.61 27,709.49 11,559,389 234.26 49,344.27San Juan Island 15,995.06 13,227,655 810.23 16,325.80 12,980,418 783.60 16,565.11 11,981,458 770.92 15,541.77 12,623,587 812.05 15,545.33County Total 20,036.85 38,704,817 1,863.11 20,774.31 41,914,070 1,845.14 22,715.93 31,716,690 1,800.27 17,617.74 35,057,888 1,847.60 18,974.83
Skagit Co.Concrete 17,394.77 10,264,892 516.16 19,887.04 9,471,162 512.33 18,486.45 8,596,734 525.22 16,367.87 8,065,411 538.77 14,970.04Burlington-Edison 15,554.20 59,251,680 3,580.29 16,549.41 58,512,742 3,509.44 16,672.96 57,217,560 3,589.25 15,941.37 48,616,498 3,696.46 13,152.18Sedro-Woolley 15,489.06 78,400,347 4,574.75 17,137.62 76,304,846 4,599.81 16,588.70 65,499,905 4,473.56 14,641.56 58,789,575 4,364.25 13,470.72Anacortes 23,493.98 58,113,003 2,746.22 21,161.09 65,613,100 2,753.05 23,832.88 80,439,398 2,779.55 28,939.72 56,219,411 2,804.23 20,048.07La Conner 23,130.46 14,443,248 620.70 23,269.29 14,863,605 602.94 24,651.88 13,473,877 596.38 22,592.77 12,528,366 571.16 21,934.95Conway 15,065.22 7,159,539 464.67 15,407.79 7,245,277 446.13 16,240.28 6,536,309 443.44 14,740.01 6,054,545 437.68 13,833.27Mount Vernon 19,512.33 140,436,954 6,994.31 20,078.74 157,194,639 6,965.20 22,568.58 138,764,472 6,965.44 19,921.85 105,465,117 6,845.25 15,407.05County Total 18,364.34 368,069,664 19,497.10 18,878.17 389,205,371 19,388.90 20,073.62 370,528,256 19,372.84 19,126.17 295,738,923 19,257.80 15,356.84
Skamania Co.Skamania 17,303.27 1,613,120 72.18 22,348.57 1,637,694 82.72 19,798.05 1,267,394 86.50 14,651.95 1,127,848 84.90 13,284.43Mount Pleasant 16,129.50 1,236,797 64.80 19,086.37 1,180,116 63.50 18,584.50 843,207 63.50 13,278.85 830,323 61.80 13,435.64Mill A 50,721.66 2,783,066 50.51 55,099.31 1,894,798 43.22 43,840.77 1,926,024 29.78 64,675.09 614,311 18.80 32,676.10Stevenson-Carson 14,791.06 13,850,843 895.29 15,470.79 14,605,410 906.44 16,112.94 12,688,208 882.70 14,374.31 12,042,873 911.48 13,212.44County Total 16,243.65 19,483,826 1,082.78 17,994.26 19,318,018 1,095.88 17,627.86 16,724,833 1,062.48 15,741.32 14,615,355 1,076.98 13,570.68
Snohomish Co.Everett 18,507.97 434,327,555 20,763.49 20,917.85 441,637,234 20,504.54 21,538.51 344,415,678 20,284.59 16,979.18 290,958,798 20,106.21 14,471.09Lake Stevens 18,439.59 171,331,234 9,442.90 18,143.92 201,464,927 9,107.97 22,119.63 159,585,604 8,872.73 17,986.08 135,057,022 8,772.36 15,395.75Mukilteo 16,264.09 292,344,038 16,086.85 18,172.86 260,593,903 16,067.51 16,218.69 232,895,189 15,979.89 14,574.27 250,420,261 15,579.94 16,073.25Edmonds 19,269.39 403,609,866 21,430.28 18,833.63 428,450,213 21,104.97 20,300.92 443,447,461 21,046.04 21,070.35 355,867,346 21,080.19 16,881.60Arlington 14,515.09 90,406,026 5,771.93 15,663.05 84,346,029 5,680.96 14,847.14 75,141,141 5,571.68 13,486.26 76,306,265 5,448.55 14,004.88Marysville 15,836.32 192,577,400 10,675.56 18,039.09 181,436,194 10,833.71 16,747.37 160,551,237 10,985.39 14,614.98 155,683,162 11,091.72 14,035.98Index 32,979.08 1,267,477 28.83 43,963.84 979,540 29.95 32,705.85 921,289 34.30 26,859.74 1,034,217 34.35 30,108.22Monroe 18,203.37 109,259,586 6,627.62 16,485.49 123,211,660 6,712.80 18,354.73 137,173,002 6,829.65 20,084.92 121,390,833 6,804.88 17,838.79Snohomish 16,257.49 174,965,550 9,916.70 17,643.53 172,697,876 9,934.50 17,383.65 156,116,508 10,028.10 15,567.90 146,547,124 10,122.40 14,477.51Lakewood 20,172.08 44,446,762 2,561.35 17,352.87 45,192,155 2,464.09 18,340.30 43,232,426 2,439.19 17,724.09 65,419,766 2,365.35 27,657.54Sultan 14,880.62 34,195,508 2,005.42 17,051.54 30,414,467 1,912.72 15,901.16 27,832,888 2,004.72 13,883.68 25,319,363 1,990.94 12,717.29Darrington 18,996.41 8,173,940 423.55 19,298.64 7,564,022 411.40 18,386.05 8,841,602 403.53 21,910.64 6,694,035 407.81 16,414.59Granite Falls 17,840.97 36,243,480 2,134.65 16,978.65 41,047,315 2,012.06 20,400.64 39,977,072 1,995.62 20,032.41 29,329,272 2,074.55 14,137.65Stanwood-Camano 21,657.48 155,677,551 4,854.80 32,066.73 117,768,343 4,671.00 25,212.66 71,396,456 4,606.26 15,499.88 59,968,285 4,559.43 13,152.58County Total 17,741.28 2,148,825,974 112,723.93 19,062.73 2,136,803,877 111,448.18 19,173.07 1,901,527,551 111,081.69 17,118.28 1,719,995,746 110,438.68 15,574.21
Spokane Co.Spokane 16,644.94 563,092,499 30,888.43 18,229.88 535,829,315 30,917.26 17,331.07 486,229,828 30,748.67 15,813.04 467,355,275 30,756.84 15,195.17Orchard Prairie 13,805.71 1,117,887 75.58 14,790.78 1,071,149 78.80 13,593.26 1,097,675 71.04 15,451.51 879,024 76.32 11,517.61Great Northern 17,635.24 940,771 43.57 21,592.17 811,276 37.51 21,628.27 811,351 54.40 14,914.53 692,420 49.14 14,090.76Nine Mile Falls 14,796.44 21,675,959 1,440.97 15,042.62 21,550,814 1,412.09 15,261.64 21,971,738 1,427.65 15,390.14 19,322,897 1,431.57 13,497.70Medical Lake 13,553.53 27,470,708 1,894.97 14,496.65 27,096,190 1,881.02 14,405.05 24,103,582 1,887.18 12,772.27 23,478,279 1,873.52 12,531.64Mead 18,161.30 239,838,095 10,751.42 22,307.57 200,778,772 10,685.08 18,790.57 169,008,540 10,406.00 16,241.45 148,581,219 9,905.98 14,999.14Central Valley 19,022.04 285,297,337 14,580.91 19,566.50 257,670,303 14,350.10 17,955.99 252,101,010 14,070.04 17,917.58 284,529,664 13,754.07 20,686.94Freeman 14,376.20 14,527,766 914.52 15,885.67 13,577,222 902.26 15,048.02 12,396,876 902.85 13,730.83 11,485,908 896.61 12,810.37Cheney 17,324.20 98,859,497 5,183.43 19,072.22 106,123,238 5,062.06 20,964.44 78,394,054 4,825.04 16,247.34 59,245,929 4,706.59 12,587.87East Valley (Spokane) 14,646.42 71,650,028 4,056.96 17,661.01 61,437,128 4,117.07 14,922.54 57,309,781 4,225.29 13,563.51 53,252,668 4,236.12 12,571.10Liberty 23,935.05 9,047,000 552.30 16,380.59 10,821,889 526.66 20,548.15 19,538,197 516.05 37,861.05 9,976,900 468.24 21,307.24West Valley (Spokane) 14,237.46 55,997,009 3,707.00 15,105.75 53,994,199 3,722.86 14,503.42 52,558,564 3,818.27 13,765.02 50,592,077 3,722.37 13,591.36Deer Park 12,844.10 35,235,449 2,568.41 13,718.78 34,746,553 2,557.99 13,583.54 30,302,758 2,463.99 12,298.25 28,855,083 2,464.02 11,710.57Riverside 13,859.49 21,406,186 1,479.08 14,472.64 20,245,814 1,405.94 14,400.20 19,736,280 1,412.53 13,972.29 18,188,211 1,444.11 12,594.75Pride Prep Charter 12,785.86 7,729,352 564.77 13,685.84 5,910,103 490.51 12,048.89 5,290,973 395.95 13,362.73 2,649,929 236.60 11,200.04Spokane International Academy:Charter 14,781.71 10,063,654 459.01 21,924.70 5,570,594 487.90 11,417.49 5,256,854 400.05 13,140.49 2,823,637 257.37 10,971.12County Total 16,808.42 1,463,949,197 79,161.33 18,493.24 1,357,234,557 78,635.11 17,259.91 1,236,108,060 77,625.00 15,924.10 1,181,909,119 76,279.47 15,494.46
197

Washington State School Districts, Charter Schools, and Tribal SchoolsPer Pupil All Expenditures—Four-Year Average by County
(General, Capital Projects, Debt Service, and Transportation Vehicle Funds)Four-Year Average FY 2019–20 FY 2018–19 FY 2017–18 FY 2016–17
Exp. Total Total Exp. Total Total Exp. Total Total Exp. Total Total Exp.County District Name Per Pupil Expenditures Enrollment Per Pupil Expenditures Enrollment Per Pupil Expenditures Enrollment Per Pupil Expenditures Enrollment Per Pupil
Stevens Co.Onion Creek 30,124.10 1,063,168 37.69 28,208.23 1,478,093 39.02 37,880.39 952,466 30.10 31,643.40 877,581 38.30 22,913.35Chewelah 13,909.28 11,304,993 787.45 14,356.46 11,514,260 806.03 14,285.15 10,484,814 782.28 13,402.89 10,758,032 792.06 13,582.35Wellpinit 21,244.51 10,111,964 447.15 22,614.25 9,197,003 440.75 20,866.71 8,646,165 405.42 21,326.44 8,218,529 409.41 20,074.08Valley 13,604.91 13,033,920 979.05 13,312.82 12,130,372 934.82 12,976.16 10,343,843 706.14 14,648.43 10,005,338 725.36 13,793.62Colville 13,032.17 25,608,958 1,761.84 14,535.35 24,931,318 1,848.43 13,487.83 23,010,419 1,815.32 12,675.68 20,989,758 1,828.80 11,477.34Loon Lake 13,585.93 3,850,287 228.78 16,829.65 3,031,924 220.40 13,756.46 2,555,018 214.86 11,891.55 2,178,330 190.93 11,409.05Summit Valley 14,691.95 1,294,230 67.17 19,267.98 1,084,471 78.90 13,744.88 945,539 78.81 11,997.70 929,373 64.64 14,377.68Evergreen (Stevens) 17,398.24 723,324 35.23 20,531.49 537,491 34.60 15,534.42 563,626 35.50 15,876.80 512,664 29.00 17,678.06Columbia (Stevens) 25,978.48 3,266,653 104.60 31,229.95 3,556,139 127.68 27,851.97 3,574,847 137.00 26,093.78 3,149,099 152.18 20,693.25Mary Walker 16,192.28 7,527,450 473.35 15,902.50 7,807,415 462.47 16,881.99 8,223,189 499.91 16,449.34 8,338,310 534.12 15,611.31Northport 17,938.96 4,214,959 215.94 19,519.12 4,592,485 228.41 20,106.32 3,937,879 235.04 16,754.08 3,557,420 229.40 15,507.50Kettle Falls 13,745.16 16,244,608 1,055.84 15,385.48 13,847,319 1,026.92 13,484.32 12,898,913 969.59 13,303.47 11,981,130 947.02 12,651.40County Total 14,801.57 98,244,514 6,194.09 15,861.01 93,708,291 6,248.43 14,997.09 86,136,719 5,909.97 14,574.81 81,495,564 5,941.22 13,716.97
Thurston Co.Yelm 14,346.21 103,471,525 5,834.17 17,735.43 86,017,894 5,735.49 14,997.48 74,425,804 5,756.31 12,929.43 67,684,614 5,788.13 11,693.69North Thurston 16,143.05 257,681,437 15,652.06 16,463.10 258,137,362 15,236.10 16,942.48 238,465,967 15,111.51 15,780.42 231,759,253 15,081.98 15,366.63Tumwater 18,441.74 128,545,448 6,904.33 18,618.09 121,873,410 6,903.92 17,652.78 123,519,298 7,171.55 17,223.51 141,233,335 6,955.28 20,305.92Olympia 18,788.54 217,573,353 10,280.02 21,164.68 212,037,094 10,131.26 20,929.00 178,519,269 10,107.79 17,661.55 153,886,681 10,038.45 15,329.73Rainier 13,382.77 12,412,143 904.52 13,722.35 12,363,421 870.35 14,205.11 10,772,367 870.40 12,376.34 10,906,223 825.92 13,204.94Griffin 16,849.57 11,613,765 643.38 18,051.17 11,250,070 646.83 17,392.62 10,986,953 661.11 16,618.95 9,986,399 650.36 15,355.19Rochester 13,890.00 33,497,198 2,218.62 15,098.21 33,098,424 2,311.78 14,317.29 31,298,564 2,301.57 13,598.79 28,837,108 2,291.95 12,581.91Tenino 14,095.17 19,114,839 1,334.45 14,324.13 18,600,533 1,297.89 14,331.36 18,006,891 1,261.60 14,273.06 16,712,263 1,245.02 13,423.29WA HE Lut Tribal School 9,543.02 1,439,447 134.48 10,703.80 1,298,129 129.40 10,031.91 1,042,223 132.20 7,883.68 0 0.00 0.00County Total 16,653.59 785,349,154 43,906.03 17,887.05 754,676,338 43,263.02 17,443.91 687,037,336 43,374.04 15,839.83 661,005,876 42,877.09 15,416.30
Wahkiakum Co.Wahkiakum 15,195.26 7,755,897 505.21 15,351.83 7,369,907 505.81 14,570.50 7,483,249 483.31 15,483.33 6,720,679 435.86 15,419.35County Total 15,195.26 7,755,897 505.21 15,351.83 7,369,907 505.81 14,570.50 7,483,249 483.31 15,483.33 6,720,679 435.86 15,419.35
Walla Walla Co.Dixie 47,904.18 877,089 13.75 63,788.30 682,019 14.30 47,693.66 696,109 17.40 40,006.28 817,835 18.70 43,734.52Walla Walla 15,168.12 108,445,608 5,781.71 18,756.67 88,348,534 5,786.84 15,267.15 79,258,406 5,816.23 13,627.11 76,293,528 5,844.61 13,053.66College Place 14,368.81 23,989,492 1,632.26 14,697.10 21,806,607 1,492.38 14,611.97 20,089,481 1,455.86 13,799.05 19,244,295 1,344.13 14,317.29Touchet 21,821.09 5,015,812 223.67 22,425.06 4,615,846 216.62 21,308.50 4,523,468 206.21 21,936.22 4,497,539 208.30 21,591.64Columbia (Walla Walla) 17,256.09 13,248,390 777.50 17,039.73 13,687,689 763.37 17,930.61 14,673,838 761.96 19,258.02 11,501,749 775.02 14,840.58Waitsburg 19,833.80 4,714,609 272.90 17,275.96 6,434,265 279.96 22,982.80 6,775,741 278.93 24,291.90 4,521,491 299.92 15,075.66Prescott 18,502.09 4,978,314 253.95 19,603.52 4,830,662 263.94 18,302.12 5,068,049 256.07 19,791.65 4,565,524 276.87 16,489.78Willow Charter 24,711.82 1,846,170 48.40 38,144.02 1,668,098 93.81 17,781.66 0 0.00 0.00 0 0.00 0.00County Total 15,721.14 163,115,484 9,004.14 18,115.61 142,073,719 8,911.22 15,943.24 131,085,092 8,792.66 14,908.47 121,441,961 8,767.55 13,851.30
Whatcom Co.Bellingham 19,460.65 232,727,918 11,834.80 19,664.71 238,404,258 11,838.91 20,137.35 245,160,759 11,669.43 21,008.80 194,304,988 11,448.62 16,971.91Ferndale 14,649.58 81,066,936 4,828.95 16,787.69 73,089,978 4,784.54 15,276.28 67,083,590 4,803.43 13,965.77 60,170,167 4,792.55 12,554.94Blaine 20,448.67 46,307,476 2,288.46 20,235.21 44,316,547 2,295.90 19,302.47 43,913,929 2,255.04 19,473.68 51,307,546 2,248.99 22,813.59Lynden 17,843.39 53,762,667 3,583.51 15,002.80 48,302,616 3,459.49 13,962.35 68,590,076 3,293.46 20,826.15 71,590,754 3,239.78 22,097.41Meridian 13,596.93 26,810,209 1,828.24 14,664.49 24,165,147 1,772.11 13,636.37 22,770,906 1,783.05 12,770.76 23,030,420 1,734.14 13,280.60Nooksack Valley 20,103.62 33,337,242 1,945.29 17,137.41 28,002,254 1,859.99 15,055.06 31,915,774 1,791.14 17,818.69 53,845,696 1,720.72 31,292.54Mount Baker 16,910.41 39,462,653 1,843.06 21,411.49 32,194,187 1,882.48 17,102.01 28,606,867 1,849.45 15,467.77 26,015,484 1,892.55 13,746.26Lummi Tribal 12,363.22 6,229,596 433.72 14,363.18 5,408,890 385.92 14,015.57 3,919,423 367.76 10,657.56 3,267,938 335.33 9,745.44County Total 17,923.71 519,704,697 28,586.03 18,180.37 493,883,877 28,279.34 17,464.48 511,961,324 27,812.76 18,407.43 483,532,992 27,412.68 17,639.03
198
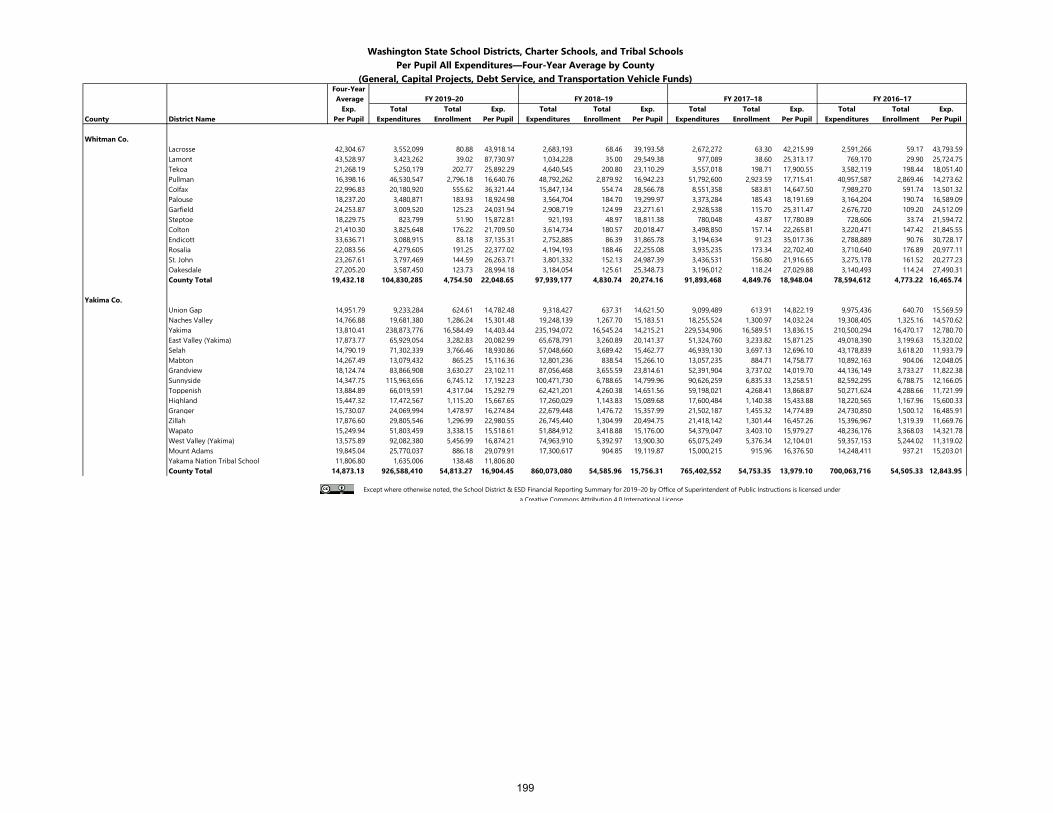
Washington State School Districts, Charter Schools, and Tribal SchoolsPer Pupil All Expenditures—Four-Year Average by County
(General, Capital Projects, Debt Service, and Transportation Vehicle Funds)Four-Year Average FY 2019–20 FY 2018–19 FY 2017–18 FY 2016–17
Exp. Total Total Exp. Total Total Exp. Total Total Exp. Total Total Exp.County District Name Per Pupil Expenditures Enrollment Per Pupil Expenditures Enrollment Per Pupil Expenditures Enrollment Per Pupil Expenditures Enrollment Per Pupil
Whitman Co.Lacrosse 42,304.67 3,552,099 80.88 43,918.14 2,683,193 68.46 39,193.58 2,672,272 63.30 42,215.99 2,591,266 59.17 43,793.59Lamont 43,528.97 3,423,262 39.02 87,730.97 1,034,228 35.00 29,549.38 977,089 38.60 25,313.17 769,170 29.90 25,724.75Tekoa 21,268.19 5,250,179 202.77 25,892.29 4,640,545 200.80 23,110.29 3,557,018 198.71 17,900.55 3,582,119 198.44 18,051.40Pullman 16,398.16 46,530,547 2,796.18 16,640.76 48,792,262 2,879.92 16,942.23 51,792,600 2,923.59 17,715.41 40,957,587 2,869.46 14,273.62Colfax 22,996.83 20,180,920 555.62 36,321.44 15,847,134 554.74 28,566.78 8,551,358 583.81 14,647.50 7,989,270 591.74 13,501.32Palouse 18,237.20 3,480,871 183.93 18,924.98 3,564,704 184.70 19,299.97 3,373,284 185.43 18,191.69 3,164,204 190.74 16,589.09Garfield 24,253.87 3,009,520 125.23 24,031.94 2,908,719 124.99 23,271.61 2,928,538 115.70 25,311.47 2,676,720 109.20 24,512.09Steptoe 18,229.75 823,799 51.90 15,872.81 921,193 48.97 18,811.38 780,048 43.87 17,780.89 728,606 33.74 21,594.72Colton 21,410.30 3,825,648 176.22 21,709.50 3,614,734 180.57 20,018.47 3,498,850 157.14 22,265.81 3,220,471 147.42 21,845.55Endicott 33,636.71 3,088,915 83.18 37,135.31 2,752,885 86.39 31,865.78 3,194,634 91.23 35,017.36 2,788,889 90.76 30,728.17Rosalia 22,083.56 4,279,605 191.25 22,377.02 4,194,193 188.46 22,255.08 3,935,235 173.34 22,702.40 3,710,640 176.89 20,977.11St. John 23,267.61 3,797,469 144.59 26,263.71 3,801,332 152.13 24,987.39 3,436,531 156.80 21,916.65 3,275,178 161.52 20,277.23Oakesdale 27,205.20 3,587,450 123.73 28,994.18 3,184,054 125.61 25,348.73 3,196,012 118.24 27,029.88 3,140,493 114.24 27,490.31County Total 19,432.18 104,830,285 4,754.50 22,048.65 97,939,177 4,830.74 20,274.16 91,893,468 4,849.76 18,948.04 78,594,612 4,773.22 16,465.74
Yakima Co.Union Gap 14,951.79 9,233,284 624.61 14,782.48 9,318,427 637.31 14,621.50 9,099,489 613.91 14,822.19 9,975,436 640.70 15,569.59Naches Valley 14,766.88 19,681,380 1,286.24 15,301.48 19,248,139 1,267.70 15,183.51 18,255,524 1,300.97 14,032.24 19,308,405 1,325.16 14,570.62Yakima 13,810.41 238,873,776 16,584.49 14,403.44 235,194,072 16,545.24 14,215.21 229,534,906 16,589.51 13,836.15 210,500,294 16,470.17 12,780.70East Valley (Yakima) 17,873.77 65,929,054 3,282.83 20,082.99 65,678,791 3,260.89 20,141.37 51,324,760 3,233.82 15,871.25 49,018,390 3,199.63 15,320.02Selah 14,790.19 71,302,339 3,766.46 18,930.86 57,048,660 3,689.42 15,462.77 46,939,130 3,697.13 12,696.10 43,178,839 3,618.20 11,933.79Mabton 14,267.49 13,079,432 865.25 15,116.36 12,801,236 838.54 15,266.10 13,057,235 884.71 14,758.77 10,892,163 904.06 12,048.05Grandview 18,124.74 83,866,908 3,630.27 23,102.11 87,056,468 3,655.59 23,814.61 52,391,904 3,737.02 14,019.70 44,136,149 3,733.27 11,822.38Sunnyside 14,347.75 115,963,656 6,745.12 17,192.23 100,471,730 6,788.65 14,799.96 90,626,259 6,835.33 13,258.51 82,592,295 6,788.75 12,166.05Toppenish 13,884.89 66,019,591 4,317.04 15,292.79 62,421,201 4,260.38 14,651.56 59,198,021 4,268.41 13,868.87 50,271,624 4,288.66 11,721.99Highland 15,447.32 17,472,567 1,115.20 15,667.65 17,260,029 1,143.83 15,089.68 17,600,484 1,140.38 15,433.88 18,220,565 1,167.96 15,600.33Granger 15,730.07 24,069,994 1,478.97 16,274.84 22,679,448 1,476.72 15,357.99 21,502,187 1,455.32 14,774.89 24,730,850 1,500.12 16,485.91Zillah 17,876.60 29,805,546 1,296.99 22,980.55 26,745,440 1,304.99 20,494.75 21,418,142 1,301.44 16,457.26 15,396,967 1,319.39 11,669.76Wapato 15,249.94 51,803,459 3,338.15 15,518.61 51,884,912 3,418.88 15,176.00 54,379,047 3,403.10 15,979.27 48,236,176 3,368.03 14,321.78West Valley (Yakima) 13,575.89 92,082,380 5,456.99 16,874.21 74,963,910 5,392.97 13,900.30 65,075,249 5,376.34 12,104.01 59,357,153 5,244.02 11,319.02Mount Adams 19,845.04 25,770,037 886.18 29,079.91 17,300,617 904.85 19,119.87 15,000,215 915.96 16,376.50 14,248,411 937.21 15,203.01Yakama Nation Tribal School 11,806.80 1,635,006 138.48 11,806.80County Total 14,873.13 926,588,410 54,813.27 16,904.45 860,073,080 54,585.96 15,756.31 765,402,552 54,753.35 13,979.10 700,063,716 54,505.33 12,843.95
Except where otherwise noted, the School District & ESD Financial Reporting Summary for 2019–20 by Office of Superintendent of Public Instructions is licensed undera Creative Commons Attribution 4.0 International License.
199
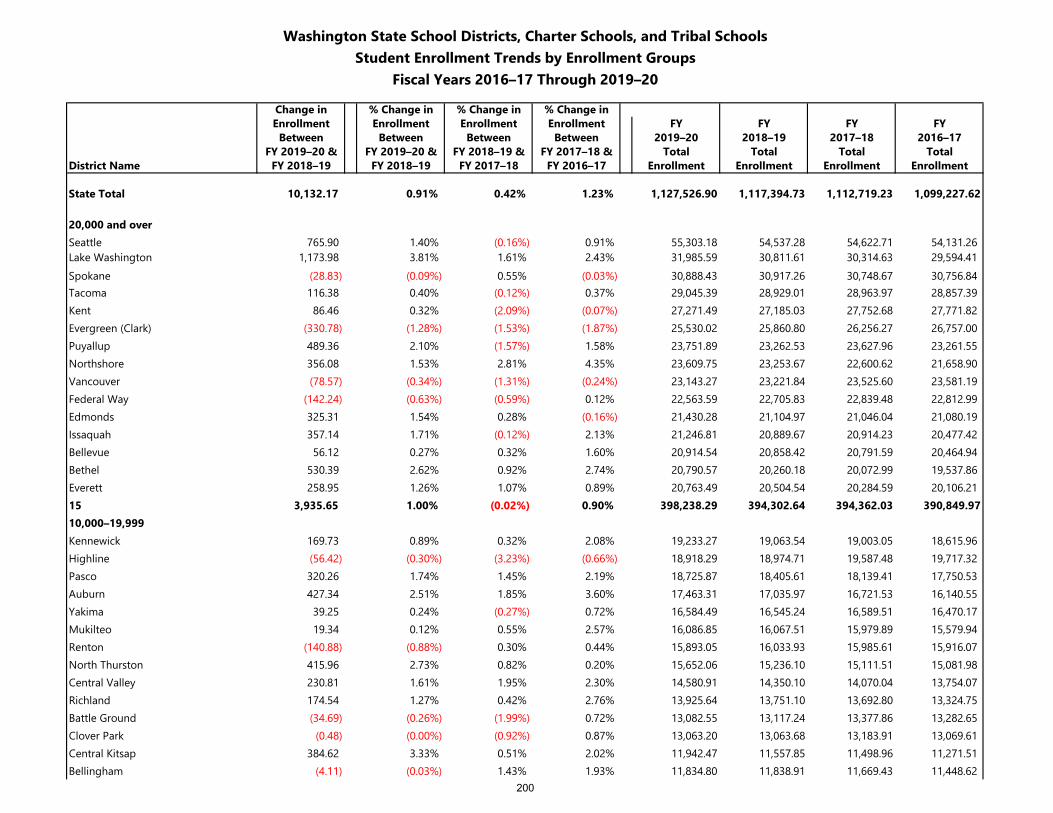
Washington State School Districts, Charter Schools, and Tribal SchoolsStudent Enrollment Trends by Enrollment Groups
Fiscal Years 2016–17 Through 2019–20
Change in % Change in % Change in % Change inEnrollment Enrollment Enrollment Enrollment FY FY FY FY
Between Between Between Between 2019–20 2018–19 2017–18 2016–17FY 2019–20 & FY 2019–20 & FY 2018–19 & FY 2017–18 & Total Total Total Total
District Name FY 2018–19 FY 2018–19 FY 2017–18 FY 2016–17 Enrollment Enrollment Enrollment Enrollment
State Total 10,132.17 0.91% 0.42% 1.23% 1,127,526.90 1,117,394.73 1,112,719.23 1,099,227.62
20,000 and overSeattle 765.90 1.40% (0.16%) 0.91% 55,303.18 54,537.28 54,622.71 54,131.26 Lake Washington 1,173.98 3.81% 1.61% 2.43% 31,985.59 30,811.61 30,314.63 29,594.41 Spokane (28.83) (0.09%) 0.55% (0.03%) 30,888.43 30,917.26 30,748.67 30,756.84 Tacoma 116.38 0.40% (0.12%) 0.37% 29,045.39 28,929.01 28,963.97 28,857.39 Kent 86.46 0.32% (2.09%) (0.07%) 27,271.49 27,185.03 27,752.68 27,771.82 Evergreen (Clark) (330.78) (1.28%) (1.53%) (1.87%) 25,530.02 25,860.80 26,256.27 26,757.00 Puyallup 489.36 2.10% (1.57%) 1.58% 23,751.89 23,262.53 23,627.96 23,261.55 Northshore 356.08 1.53% 2.81% 4.35% 23,609.75 23,253.67 22,600.62 21,658.90 Vancouver (78.57) (0.34%) (1.31%) (0.24%) 23,143.27 23,221.84 23,525.60 23,581.19 Federal Way (142.24) (0.63%) (0.59%) 0.12% 22,563.59 22,705.83 22,839.48 22,812.99 Edmonds 325.31 1.54% 0.28% (0.16%) 21,430.28 21,104.97 21,046.04 21,080.19 Issaquah 357.14 1.71% (0.12%) 2.13% 21,246.81 20,889.67 20,914.23 20,477.42 Bellevue 56.12 0.27% 0.32% 1.60% 20,914.54 20,858.42 20,791.59 20,464.94 Bethel 530.39 2.62% 0.92% 2.74% 20,790.57 20,260.18 20,072.99 19,537.86 Everett 258.95 1.26% 1.07% 0.89% 20,763.49 20,504.54 20,284.59 20,106.21 15 3,935.65 1.00% (0.02%) 0.90% 398,238.29 394,302.64 394,362.03 390,849.9710,000–19,999Kennewick 169.73 0.89% 0.32% 2.08% 19,233.27 19,063.54 19,003.05 18,615.96 Highline (56.42) (0.30%) (3.23%) (0.66%) 18,918.29 18,974.71 19,587.48 19,717.32 Pasco 320.26 1.74% 1.45% 2.19% 18,725.87 18,405.61 18,139.41 17,750.53 Auburn 427.34 2.51% 1.85% 3.60% 17,463.31 17,035.97 16,721.53 16,140.55 Yakima 39.25 0.24% (0.27%) 0.72% 16,584.49 16,545.24 16,589.51 16,470.17 Mukilteo 19.34 0.12% 0.55% 2.57% 16,086.85 16,067.51 15,979.89 15,579.94 Renton (140.88) (0.88%) 0.30% 0.44% 15,893.05 16,033.93 15,985.61 15,916.07 North Thurston 415.96 2.73% 0.82% 0.20% 15,652.06 15,236.10 15,111.51 15,081.98 Central Valley 230.81 1.61% 1.95% 2.30% 14,580.91 14,350.10 14,070.04 13,754.07 Richland 174.54 1.27% 0.42% 2.76% 13,925.64 13,751.10 13,692.80 13,324.75 Battle Ground (34.69) (0.26%) (1.99%) 0.72% 13,082.55 13,117.24 13,377.86 13,282.65 Clover Park (0.48) (0.00%) (0.92%) 0.87% 13,063.20 13,063.68 13,183.91 13,069.61 Central Kitsap 384.62 3.33% 0.51% 2.02% 11,942.47 11,557.85 11,498.96 11,271.51 Bellingham (4.11) (0.03%) 1.43% 1.93% 11,834.80 11,838.91 11,669.43 11,448.62
200
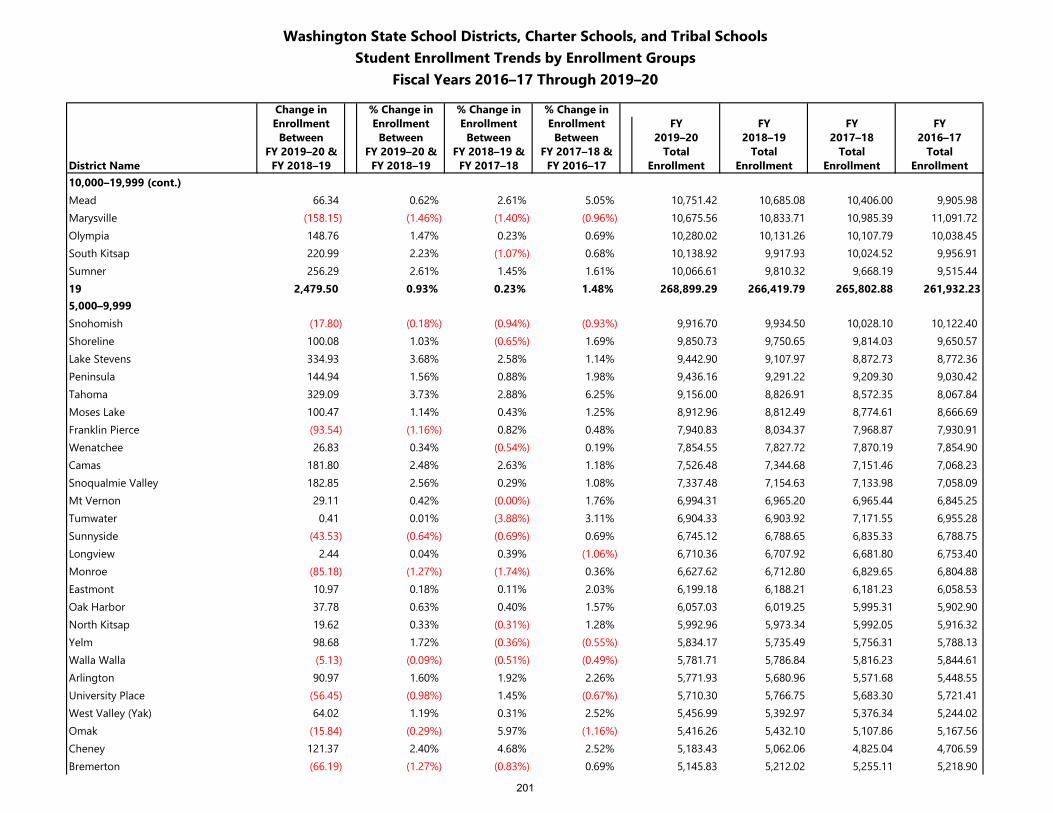
Washington State School Districts, Charter Schools, and Tribal SchoolsStudent Enrollment Trends by Enrollment Groups
Fiscal Years 2016–17 Through 2019–20
Change in % Change in % Change in % Change inEnrollment Enrollment Enrollment Enrollment FY FY FY FY
Between Between Between Between 2019–20 2018–19 2017–18 2016–17FY 2019–20 & FY 2019–20 & FY 2018–19 & FY 2017–18 & Total Total Total Total
District Name FY 2018–19 FY 2018–19 FY 2017–18 FY 2016–17 Enrollment Enrollment Enrollment Enrollment10,000–19,999 (cont.)Mead 66.34 0.62% 2.61% 5.05% 10,751.42 10,685.08 10,406.00 9,905.98 Marysville (158.15) (1.46%) (1.40%) (0.96%) 10,675.56 10,833.71 10,985.39 11,091.72 Olympia 148.76 1.47% 0.23% 0.69% 10,280.02 10,131.26 10,107.79 10,038.45 South Kitsap 220.99 2.23% (1.07%) 0.68% 10,138.92 9,917.93 10,024.52 9,956.91 Sumner 256.29 2.61% 1.45% 1.61% 10,066.61 9,810.32 9,668.19 9,515.44 19 2,479.50 0.93% 0.23% 1.48% 268,899.29 266,419.79 265,802.88 261,932.235,000–9,999Snohomish (17.80) (0.18%) (0.94%) (0.93%) 9,916.70 9,934.50 10,028.10 10,122.40 Shoreline 100.08 1.03% (0.65%) 1.69% 9,850.73 9,750.65 9,814.03 9,650.57 Lake Stevens 334.93 3.68% 2.58% 1.14% 9,442.90 9,107.97 8,872.73 8,772.36 Peninsula 144.94 1.56% 0.88% 1.98% 9,436.16 9,291.22 9,209.30 9,030.42 Tahoma 329.09 3.73% 2.88% 6.25% 9,156.00 8,826.91 8,572.35 8,067.84 Moses Lake 100.47 1.14% 0.43% 1.25% 8,912.96 8,812.49 8,774.61 8,666.69 Franklin Pierce (93.54) (1.16%) 0.82% 0.48% 7,940.83 8,034.37 7,968.87 7,930.91 Wenatchee 26.83 0.34% (0.54%) 0.19% 7,854.55 7,827.72 7,870.19 7,854.90 Camas 181.80 2.48% 2.63% 1.18% 7,526.48 7,344.68 7,151.46 7,068.23 Snoqualmie Valley 182.85 2.56% 0.29% 1.08% 7,337.48 7,154.63 7,133.98 7,058.09 Mt Vernon 29.11 0.42% (0.00%) 1.76% 6,994.31 6,965.20 6,965.44 6,845.25 Tumwater 0.41 0.01% (3.88%) 3.11% 6,904.33 6,903.92 7,171.55 6,955.28 Sunnyside (43.53) (0.64%) (0.69%) 0.69% 6,745.12 6,788.65 6,835.33 6,788.75 Longview 2.44 0.04% 0.39% (1.06%) 6,710.36 6,707.92 6,681.80 6,753.40 Monroe (85.18) (1.27%) (1.74%) 0.36% 6,627.62 6,712.80 6,829.65 6,804.88 Eastmont 10.97 0.18% 0.11% 2.03% 6,199.18 6,188.21 6,181.23 6,058.53 Oak Harbor 37.78 0.63% 0.40% 1.57% 6,057.03 6,019.25 5,995.31 5,902.90 North Kitsap 19.62 0.33% (0.31%) 1.28% 5,992.96 5,973.34 5,992.05 5,916.32 Yelm 98.68 1.72% (0.36%) (0.55%) 5,834.17 5,735.49 5,756.31 5,788.13 Walla Walla (5.13) (0.09%) (0.51%) (0.49%) 5,781.71 5,786.84 5,816.23 5,844.61 Arlington 90.97 1.60% 1.92% 2.26% 5,771.93 5,680.96 5,571.68 5,448.55 University Place (56.45) (0.98%) 1.45% (0.67%) 5,710.30 5,766.75 5,683.30 5,721.41 West Valley (Yak) 64.02 1.19% 0.31% 2.52% 5,456.99 5,392.97 5,376.34 5,244.02 Omak (15.84) (0.29%) 5.97% (1.16%) 5,416.26 5,432.10 5,107.86 5,167.56 Cheney 121.37 2.40% 4.68% 2.52% 5,183.43 5,062.06 4,825.04 4,706.59 Bremerton (66.19) (1.27%) (0.83%) 0.69% 5,145.83 5,212.02 5,255.11 5,218.90
201
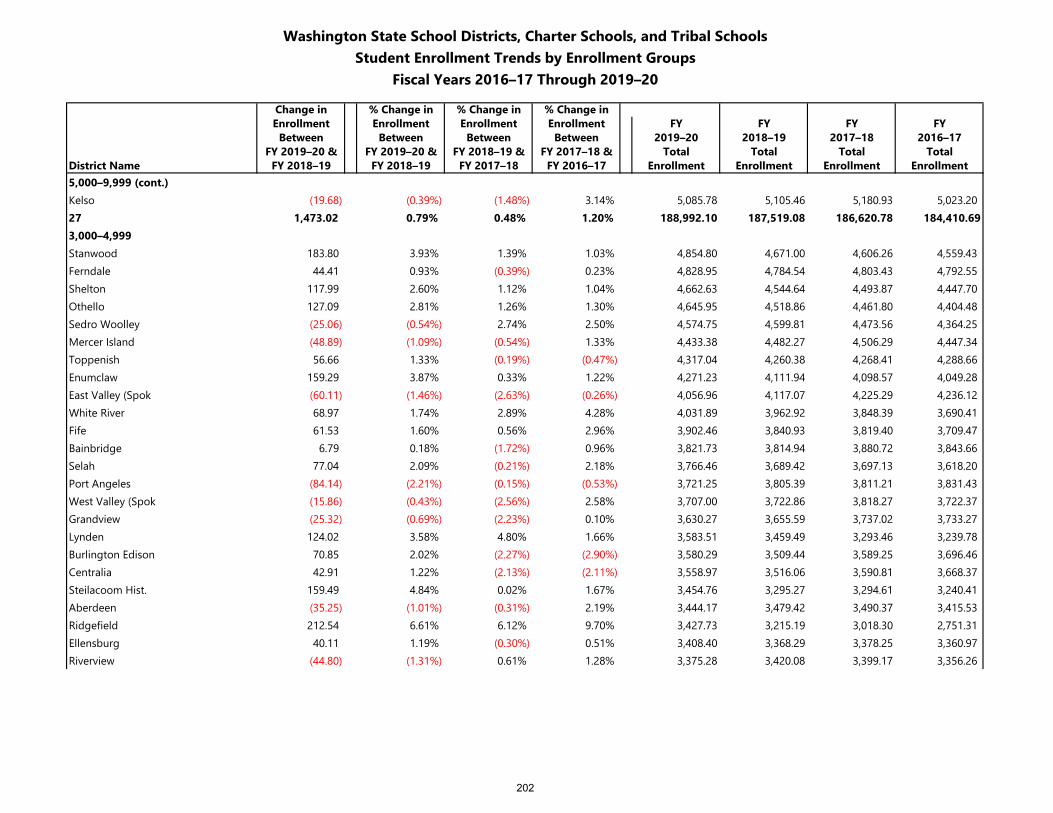
Washington State School Districts, Charter Schools, and Tribal SchoolsStudent Enrollment Trends by Enrollment Groups
Fiscal Years 2016–17 Through 2019–20
Change in % Change in % Change in % Change inEnrollment Enrollment Enrollment Enrollment FY FY FY FY
Between Between Between Between 2019–20 2018–19 2017–18 2016–17FY 2019–20 & FY 2019–20 & FY 2018–19 & FY 2017–18 & Total Total Total Total
District Name FY 2018–19 FY 2018–19 FY 2017–18 FY 2016–17 Enrollment Enrollment Enrollment Enrollment5,000–9,999 (cont.)Kelso (19.68) (0.39%) (1.48%) 3.14% 5,085.78 5,105.46 5,180.93 5,023.20 27 1,473.02 0.79% 0.48% 1.20% 188,992.10 187,519.08 186,620.78 184,410.693,000–4,999Stanwood 183.80 3.93% 1.39% 1.03% 4,854.80 4,671.00 4,606.26 4,559.43 Ferndale 44.41 0.93% (0.39%) 0.23% 4,828.95 4,784.54 4,803.43 4,792.55 Shelton 117.99 2.60% 1.12% 1.04% 4,662.63 4,544.64 4,493.87 4,447.70 Othello 127.09 2.81% 1.26% 1.30% 4,645.95 4,518.86 4,461.80 4,404.48 Sedro Woolley (25.06) (0.54%) 2.74% 2.50% 4,574.75 4,599.81 4,473.56 4,364.25 Mercer Island (48.89) (1.09%) (0.54%) 1.33% 4,433.38 4,482.27 4,506.29 4,447.34 Toppenish 56.66 1.33% (0.19%) (0.47%) 4,317.04 4,260.38 4,268.41 4,288.66 Enumclaw 159.29 3.87% 0.33% 1.22% 4,271.23 4,111.94 4,098.57 4,049.28 East Valley (Spok (60.11) (1.46%) (2.63%) (0.26%) 4,056.96 4,117.07 4,225.29 4,236.12 White River 68.97 1.74% 2.89% 4.28% 4,031.89 3,962.92 3,848.39 3,690.41 Fife 61.53 1.60% 0.56% 2.96% 3,902.46 3,840.93 3,819.40 3,709.47 Bainbridge 6.79 0.18% (1.72%) 0.96% 3,821.73 3,814.94 3,880.72 3,843.66 Selah 77.04 2.09% (0.21%) 2.18% 3,766.46 3,689.42 3,697.13 3,618.20 Port Angeles (84.14) (2.21%) (0.15%) (0.53%) 3,721.25 3,805.39 3,811.21 3,831.43 West Valley (Spok (15.86) (0.43%) (2.56%) 2.58% 3,707.00 3,722.86 3,818.27 3,722.37 Grandview (25.32) (0.69%) (2.23%) 0.10% 3,630.27 3,655.59 3,737.02 3,733.27 Lynden 124.02 3.58% 4.80% 1.66% 3,583.51 3,459.49 3,293.46 3,239.78 Burlington Edison 70.85 2.02% (2.27%) (2.90%) 3,580.29 3,509.44 3,589.25 3,696.46 Centralia 42.91 1.22% (2.13%) (2.11%) 3,558.97 3,516.06 3,590.81 3,668.37 Steilacoom Hist. 159.49 4.84% 0.02% 1.67% 3,454.76 3,295.27 3,294.61 3,240.41 Aberdeen (35.25) (1.01%) (0.31%) 2.19% 3,444.17 3,479.42 3,490.37 3,415.53 Ridgefield 212.54 6.61% 6.12% 9.70% 3,427.73 3,215.19 3,018.30 2,751.31 Ellensburg 40.11 1.19% (0.30%) 0.51% 3,408.40 3,368.29 3,378.25 3,360.97 Riverview (44.80) (1.31%) 0.61% 1.28% 3,375.28 3,420.08 3,399.17 3,356.26
202
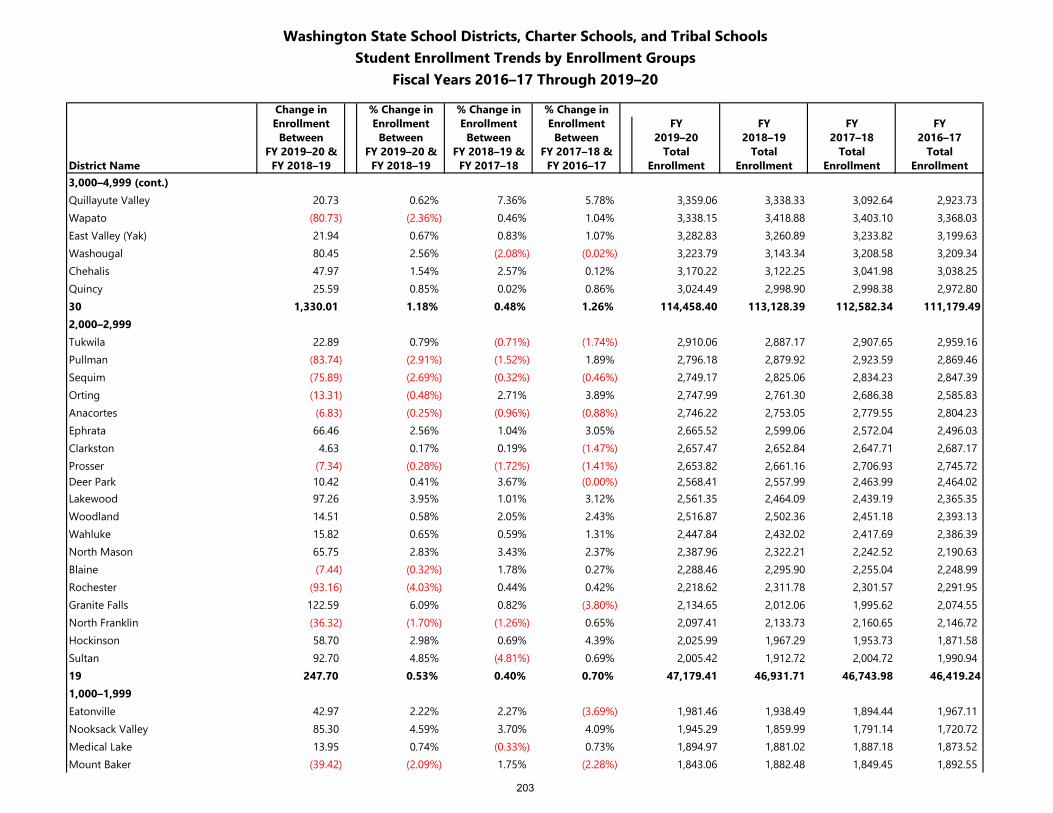
Washington State School Districts, Charter Schools, and Tribal SchoolsStudent Enrollment Trends by Enrollment Groups
Fiscal Years 2016–17 Through 2019–20
Change in % Change in % Change in % Change inEnrollment Enrollment Enrollment Enrollment FY FY FY FY
Between Between Between Between 2019–20 2018–19 2017–18 2016–17FY 2019–20 & FY 2019–20 & FY 2018–19 & FY 2017–18 & Total Total Total Total
District Name FY 2018–19 FY 2018–19 FY 2017–18 FY 2016–17 Enrollment Enrollment Enrollment Enrollment3,000–4,999 (cont.)Quillayute Valley 20.73 0.62% 7.36% 5.78% 3,359.06 3,338.33 3,092.64 2,923.73 Wapato (80.73) (2.36%) 0.46% 1.04% 3,338.15 3,418.88 3,403.10 3,368.03 East Valley (Yak) 21.94 0.67% 0.83% 1.07% 3,282.83 3,260.89 3,233.82 3,199.63 Washougal 80.45 2.56% (2.08%) (0.02%) 3,223.79 3,143.34 3,208.58 3,209.34 Chehalis 47.97 1.54% 2.57% 0.12% 3,170.22 3,122.25 3,041.98 3,038.25 Quincy 25.59 0.85% 0.02% 0.86% 3,024.49 2,998.90 2,998.38 2,972.80 30 1,330.01 1.18% 0.48% 1.26% 114,458.40 113,128.39 112,582.34 111,179.492,000–2,999Tukwila 22.89 0.79% (0.71%) (1.74%) 2,910.06 2,887.17 2,907.65 2,959.16 Pullman (83.74) (2.91%) (1.52%) 1.89% 2,796.18 2,879.92 2,923.59 2,869.46 Sequim (75.89) (2.69%) (0.32%) (0.46%) 2,749.17 2,825.06 2,834.23 2,847.39 Orting (13.31) (0.48%) 2.71% 3.89% 2,747.99 2,761.30 2,686.38 2,585.83 Anacortes (6.83) (0.25%) (0.96%) (0.88%) 2,746.22 2,753.05 2,779.55 2,804.23 Ephrata 66.46 2.56% 1.04% 3.05% 2,665.52 2,599.06 2,572.04 2,496.03 Clarkston 4.63 0.17% 0.19% (1.47%) 2,657.47 2,652.84 2,647.71 2,687.17 Prosser (7.34) (0.28%) (1.72%) (1.41%) 2,653.82 2,661.16 2,706.93 2,745.72 Deer Park 10.42 0.41% 3.67% (0.00%) 2,568.41 2,557.99 2,463.99 2,464.02 Lakewood 97.26 3.95% 1.01% 3.12% 2,561.35 2,464.09 2,439.19 2,365.35 Woodland 14.51 0.58% 2.05% 2.43% 2,516.87 2,502.36 2,451.18 2,393.13 Wahluke 15.82 0.65% 0.59% 1.31% 2,447.84 2,432.02 2,417.69 2,386.39 North Mason 65.75 2.83% 3.43% 2.37% 2,387.96 2,322.21 2,242.52 2,190.63 Blaine (7.44) (0.32%) 1.78% 0.27% 2,288.46 2,295.90 2,255.04 2,248.99 Rochester (93.16) (4.03%) 0.44% 0.42% 2,218.62 2,311.78 2,301.57 2,291.95 Granite Falls 122.59 6.09% 0.82% (3.80%) 2,134.65 2,012.06 1,995.62 2,074.55 North Franklin (36.32) (1.70%) (1.26%) 0.65% 2,097.41 2,133.73 2,160.65 2,146.72 Hockinson 58.70 2.98% 0.69% 4.39% 2,025.99 1,967.29 1,953.73 1,871.58 Sultan 92.70 4.85% (4.81%) 0.69% 2,005.42 1,912.72 2,004.72 1,990.94 19 247.70 0.53% 0.40% 0.70% 47,179.41 46,931.71 46,743.98 46,419.241,000–1,999Eatonville 42.97 2.22% 2.27% (3.69%) 1,981.46 1,938.49 1,894.44 1,967.11 Nooksack Valley 85.30 4.59% 3.70% 4.09% 1,945.29 1,859.99 1,791.14 1,720.72 Medical Lake 13.95 0.74% (0.33%) 0.73% 1,894.97 1,881.02 1,887.18 1,873.52 Mount Baker (39.42) (2.09%) 1.75% (2.28%) 1,843.06 1,882.48 1,849.45 1,892.55
203
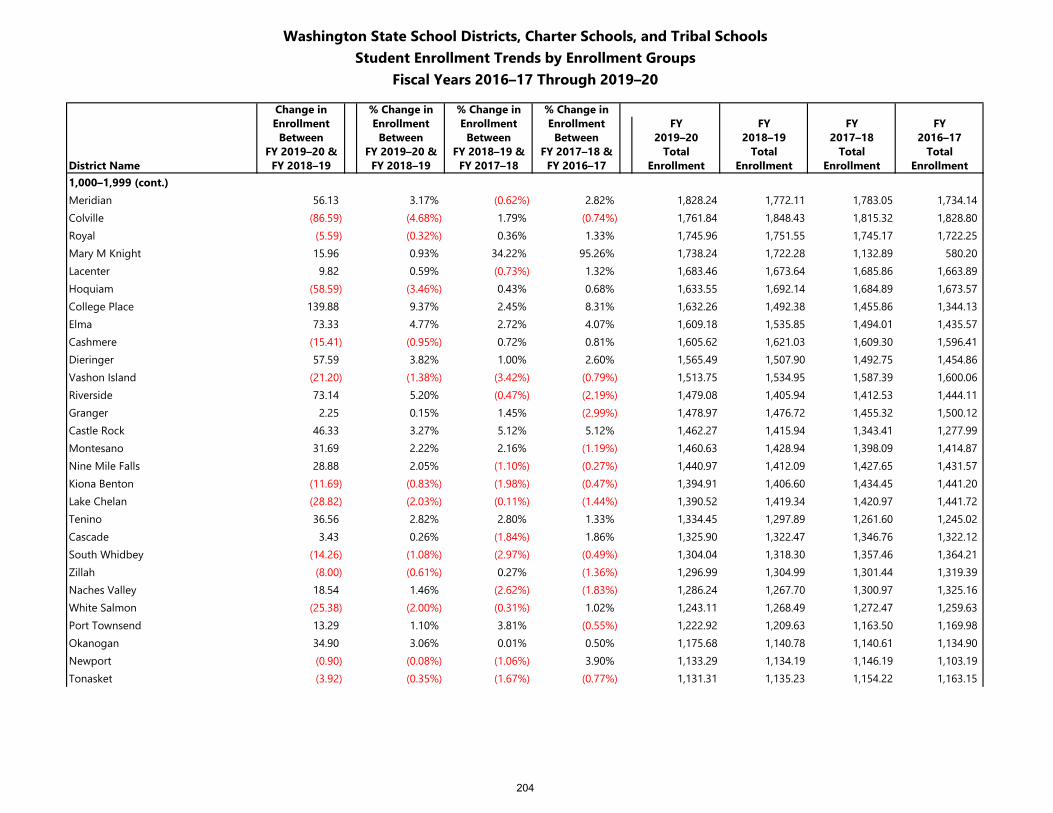
Washington State School Districts, Charter Schools, and Tribal SchoolsStudent Enrollment Trends by Enrollment Groups
Fiscal Years 2016–17 Through 2019–20
Change in % Change in % Change in % Change inEnrollment Enrollment Enrollment Enrollment FY FY FY FY
Between Between Between Between 2019–20 2018–19 2017–18 2016–17FY 2019–20 & FY 2019–20 & FY 2018–19 & FY 2017–18 & Total Total Total Total
District Name FY 2018–19 FY 2018–19 FY 2017–18 FY 2016–17 Enrollment Enrollment Enrollment Enrollment1,000–1,999 (cont.)Meridian 56.13 3.17% (0.62%) 2.82% 1,828.24 1,772.11 1,783.05 1,734.14 Colville (86.59) (4.68%) 1.79% (0.74%) 1,761.84 1,848.43 1,815.32 1,828.80 Royal (5.59) (0.32%) 0.36% 1.33% 1,745.96 1,751.55 1,745.17 1,722.25 Mary M Knight 15.96 0.93% 34.22% 95.26% 1,738.24 1,722.28 1,132.89 580.20 Lacenter 9.82 0.59% (0.73%) 1.32% 1,683.46 1,673.64 1,685.86 1,663.89 Hoquiam (58.59) (3.46%) 0.43% 0.68% 1,633.55 1,692.14 1,684.89 1,673.57 College Place 139.88 9.37% 2.45% 8.31% 1,632.26 1,492.38 1,455.86 1,344.13 Elma 73.33 4.77% 2.72% 4.07% 1,609.18 1,535.85 1,494.01 1,435.57 Cashmere (15.41) (0.95%) 0.72% 0.81% 1,605.62 1,621.03 1,609.30 1,596.41 Dieringer 57.59 3.82% 1.00% 2.60% 1,565.49 1,507.90 1,492.75 1,454.86 Vashon Island (21.20) (1.38%) (3.42%) (0.79%) 1,513.75 1,534.95 1,587.39 1,600.06 Riverside 73.14 5.20% (0.47%) (2.19%) 1,479.08 1,405.94 1,412.53 1,444.11 Granger 2.25 0.15% 1.45% (2.99%) 1,478.97 1,476.72 1,455.32 1,500.12 Castle Rock 46.33 3.27% 5.12% 5.12% 1,462.27 1,415.94 1,343.41 1,277.99 Montesano 31.69 2.22% 2.16% (1.19%) 1,460.63 1,428.94 1,398.09 1,414.87 Nine Mile Falls 28.88 2.05% (1.10%) (0.27%) 1,440.97 1,412.09 1,427.65 1,431.57 Kiona Benton (11.69) (0.83%) (1.98%) (0.47%) 1,394.91 1,406.60 1,434.45 1,441.20 Lake Chelan (28.82) (2.03%) (0.11%) (1.44%) 1,390.52 1,419.34 1,420.97 1,441.72 Tenino 36.56 2.82% 2.80% 1.33% 1,334.45 1,297.89 1,261.60 1,245.02 Cascade 3.43 0.26% (1.84%) 1.86% 1,325.90 1,322.47 1,346.76 1,322.12 South Whidbey (14.26) (1.08%) (2.97%) (0.49%) 1,304.04 1,318.30 1,357.46 1,364.21 Zillah (8.00) (0.61%) 0.27% (1.36%) 1,296.99 1,304.99 1,301.44 1,319.39 Naches Valley 18.54 1.46% (2.62%) (1.83%) 1,286.24 1,267.70 1,300.97 1,325.16 White Salmon (25.38) (2.00%) (0.31%) 1.02% 1,243.11 1,268.49 1,272.47 1,259.63 Port Townsend 13.29 1.10% 3.81% (0.55%) 1,222.92 1,209.63 1,163.50 1,169.98 Okanogan 34.90 3.06% 0.01% 0.50% 1,175.68 1,140.78 1,140.61 1,134.90 Newport (0.90) (0.08%) (1.06%) 3.90% 1,133.29 1,134.19 1,146.19 1,103.19 Tonasket (3.92) (0.35%) (1.67%) (0.77%) 1,131.31 1,135.23 1,154.22 1,163.15
204
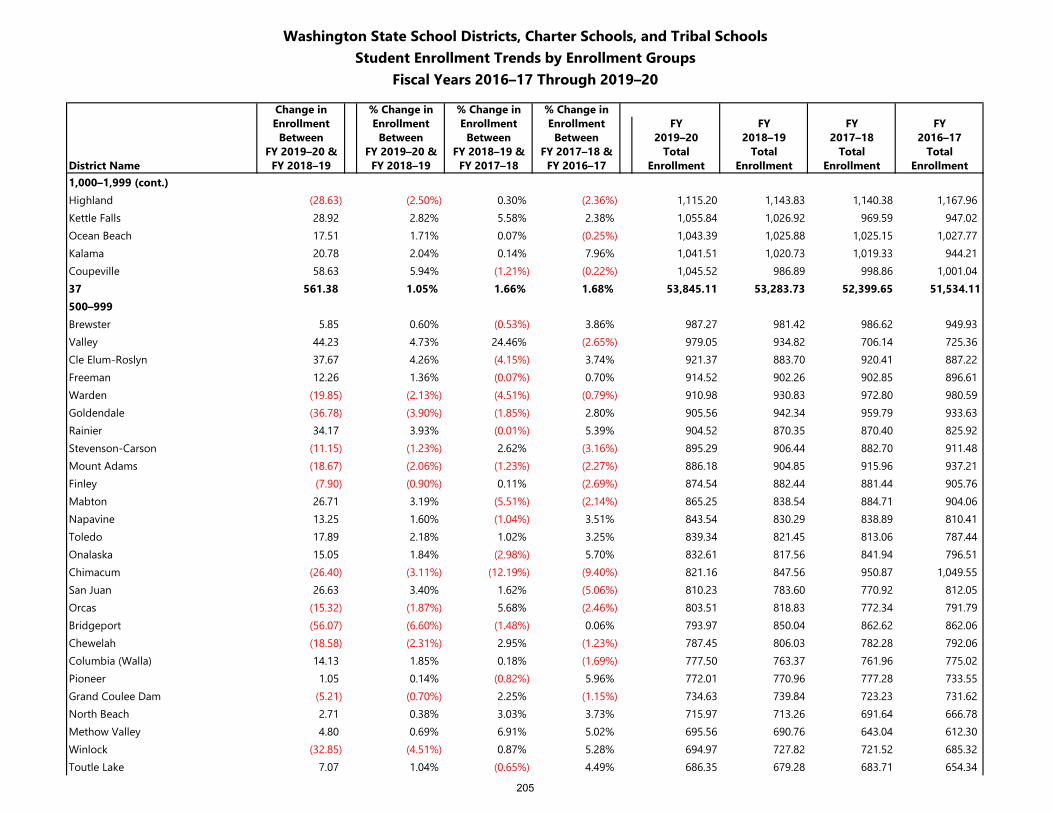
Washington State School Districts, Charter Schools, and Tribal SchoolsStudent Enrollment Trends by Enrollment Groups
Fiscal Years 2016–17 Through 2019–20
Change in % Change in % Change in % Change inEnrollment Enrollment Enrollment Enrollment FY FY FY FY
Between Between Between Between 2019–20 2018–19 2017–18 2016–17FY 2019–20 & FY 2019–20 & FY 2018–19 & FY 2017–18 & Total Total Total Total
District Name FY 2018–19 FY 2018–19 FY 2017–18 FY 2016–17 Enrollment Enrollment Enrollment Enrollment1,000–1,999 (cont.)Highland (28.63) (2.50%) 0.30% (2.36%) 1,115.20 1,143.83 1,140.38 1,167.96 Kettle Falls 28.92 2.82% 5.58% 2.38% 1,055.84 1,026.92 969.59 947.02 Ocean Beach 17.51 1.71% 0.07% (0.25%) 1,043.39 1,025.88 1,025.15 1,027.77 Kalama 20.78 2.04% 0.14% 7.96% 1,041.51 1,020.73 1,019.33 944.21 Coupeville 58.63 5.94% (1.21%) (0.22%) 1,045.52 986.89 998.86 1,001.04 37 561.38 1.05% 1.66% 1.68% 53,845.11 53,283.73 52,399.65 51,534.11500–999Brewster 5.85 0.60% (0.53%) 3.86% 987.27 981.42 986.62 949.93 Valley 44.23 4.73% 24.46% (2.65%) 979.05 934.82 706.14 725.36 Cle Elum-Roslyn 37.67 4.26% (4.15%) 3.74% 921.37 883.70 920.41 887.22 Freeman 12.26 1.36% (0.07%) 0.70% 914.52 902.26 902.85 896.61 Warden (19.85) (2.13%) (4.51%) (0.79%) 910.98 930.83 972.80 980.59 Goldendale (36.78) (3.90%) (1.85%) 2.80% 905.56 942.34 959.79 933.63 Rainier 34.17 3.93% (0.01%) 5.39% 904.52 870.35 870.40 825.92 Stevenson-Carson (11.15) (1.23%) 2.62% (3.16%) 895.29 906.44 882.70 911.48 Mount Adams (18.67) (2.06%) (1.23%) (2.27%) 886.18 904.85 915.96 937.21 Finley (7.90) (0.90%) 0.11% (2.69%) 874.54 882.44 881.44 905.76 Mabton 26.71 3.19% (5.51%) (2.14%) 865.25 838.54 884.71 904.06 Napavine 13.25 1.60% (1.04%) 3.51% 843.54 830.29 838.89 810.41 Toledo 17.89 2.18% 1.02% 3.25% 839.34 821.45 813.06 787.44 Onalaska 15.05 1.84% (2.98%) 5.70% 832.61 817.56 841.94 796.51 Chimacum (26.40) (3.11%) (12.19%) (9.40%) 821.16 847.56 950.87 1,049.55 San Juan 26.63 3.40% 1.62% (5.06%) 810.23 783.60 770.92 812.05 Orcas (15.32) (1.87%) 5.68% (2.46%) 803.51 818.83 772.34 791.79 Bridgeport (56.07) (6.60%) (1.48%) 0.06% 793.97 850.04 862.62 862.06 Chewelah (18.58) (2.31%) 2.95% (1.23%) 787.45 806.03 782.28 792.06 Columbia (Walla) 14.13 1.85% 0.18% (1.69%) 777.50 763.37 761.96 775.02 Pioneer 1.05 0.14% (0.82%) 5.96% 772.01 770.96 777.28 733.55 Grand Coulee Dam (5.21) (0.70%) 2.25% (1.15%) 734.63 739.84 723.23 731.62 North Beach 2.71 0.38% 3.03% 3.73% 715.97 713.26 691.64 666.78 Methow Valley 4.80 0.69% 6.91% 5.02% 695.56 690.76 643.04 612.30 Winlock (32.85) (4.51%) 0.87% 5.28% 694.97 727.82 721.52 685.32 Toutle Lake 7.07 1.04% (0.65%) 4.49% 686.35 679.28 683.71 654.34
205
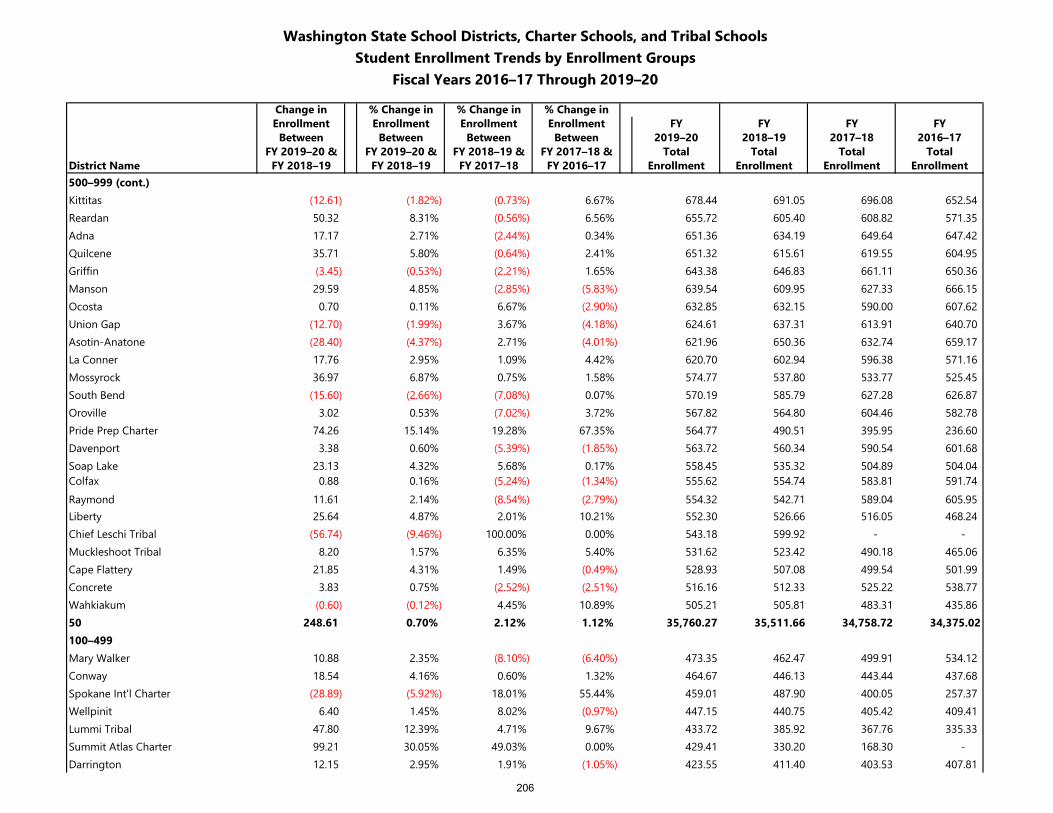
Washington State School Districts, Charter Schools, and Tribal SchoolsStudent Enrollment Trends by Enrollment Groups
Fiscal Years 2016–17 Through 2019–20
Change in % Change in % Change in % Change inEnrollment Enrollment Enrollment Enrollment FY FY FY FY
Between Between Between Between 2019–20 2018–19 2017–18 2016–17FY 2019–20 & FY 2019–20 & FY 2018–19 & FY 2017–18 & Total Total Total Total
District Name FY 2018–19 FY 2018–19 FY 2017–18 FY 2016–17 Enrollment Enrollment Enrollment Enrollment500–999 (cont.)Kittitas (12.61) (1.82%) (0.73%) 6.67% 678.44 691.05 696.08 652.54 Reardan 50.32 8.31% (0.56%) 6.56% 655.72 605.40 608.82 571.35 Adna 17.17 2.71% (2.44%) 0.34% 651.36 634.19 649.64 647.42 Quilcene 35.71 5.80% (0.64%) 2.41% 651.32 615.61 619.55 604.95 Griffin (3.45) (0.53%) (2.21%) 1.65% 643.38 646.83 661.11 650.36 Manson 29.59 4.85% (2.85%) (5.83%) 639.54 609.95 627.33 666.15 Ocosta 0.70 0.11% 6.67% (2.90%) 632.85 632.15 590.00 607.62 Union Gap (12.70) (1.99%) 3.67% (4.18%) 624.61 637.31 613.91 640.70 Asotin-Anatone (28.40) (4.37%) 2.71% (4.01%) 621.96 650.36 632.74 659.17 La Conner 17.76 2.95% 1.09% 4.42% 620.70 602.94 596.38 571.16 Mossyrock 36.97 6.87% 0.75% 1.58% 574.77 537.80 533.77 525.45 South Bend (15.60) (2.66%) (7.08%) 0.07% 570.19 585.79 627.28 626.87 Oroville 3.02 0.53% (7.02%) 3.72% 567.82 564.80 604.46 582.78 Pride Prep Charter 74.26 15.14% 19.28% 67.35% 564.77 490.51 395.95 236.60 Davenport 3.38 0.60% (5.39%) (1.85%) 563.72 560.34 590.54 601.68 Soap Lake 23.13 4.32% 5.68% 0.17% 558.45 535.32 504.89 504.04 Colfax 0.88 0.16% (5.24%) (1.34%) 555.62 554.74 583.81 591.74 Raymond 11.61 2.14% (8.54%) (2.79%) 554.32 542.71 589.04 605.95 Liberty 25.64 4.87% 2.01% 10.21% 552.30 526.66 516.05 468.24 Chief Leschi Tribal (56.74) (9.46%) 100.00% 0.00% 543.18 599.92 - - Muckleshoot Tribal 8.20 1.57% 6.35% 5.40% 531.62 523.42 490.18 465.06 Cape Flattery 21.85 4.31% 1.49% (0.49%) 528.93 507.08 499.54 501.99 Concrete 3.83 0.75% (2.52%) (2.51%) 516.16 512.33 525.22 538.77 Wahkiakum (0.60) (0.12%) 4.45% 10.89% 505.21 505.81 483.31 435.86 50 248.61 0.70% 2.12% 1.12% 35,760.27 35,511.66 34,758.72 34,375.02100–499Mary Walker 10.88 2.35% (8.10%) (6.40%) 473.35 462.47 499.91 534.12 Conway 18.54 4.16% 0.60% 1.32% 464.67 446.13 443.44 437.68 Spokane Int'l Charter (28.89) (5.92%) 18.01% 55.44% 459.01 487.90 400.05 257.37 Wellpinit 6.40 1.45% 8.02% (0.97%) 447.15 440.75 405.42 409.41 Lummi Tribal 47.80 12.39% 4.71% 9.67% 433.72 385.92 367.76 335.33 Summit Atlas Charter 99.21 30.05% 49.03% 0.00% 429.41 330.20 168.30 - Darrington 12.15 2.95% 1.91% (1.05%) 423.55 411.40 403.53 407.81
206
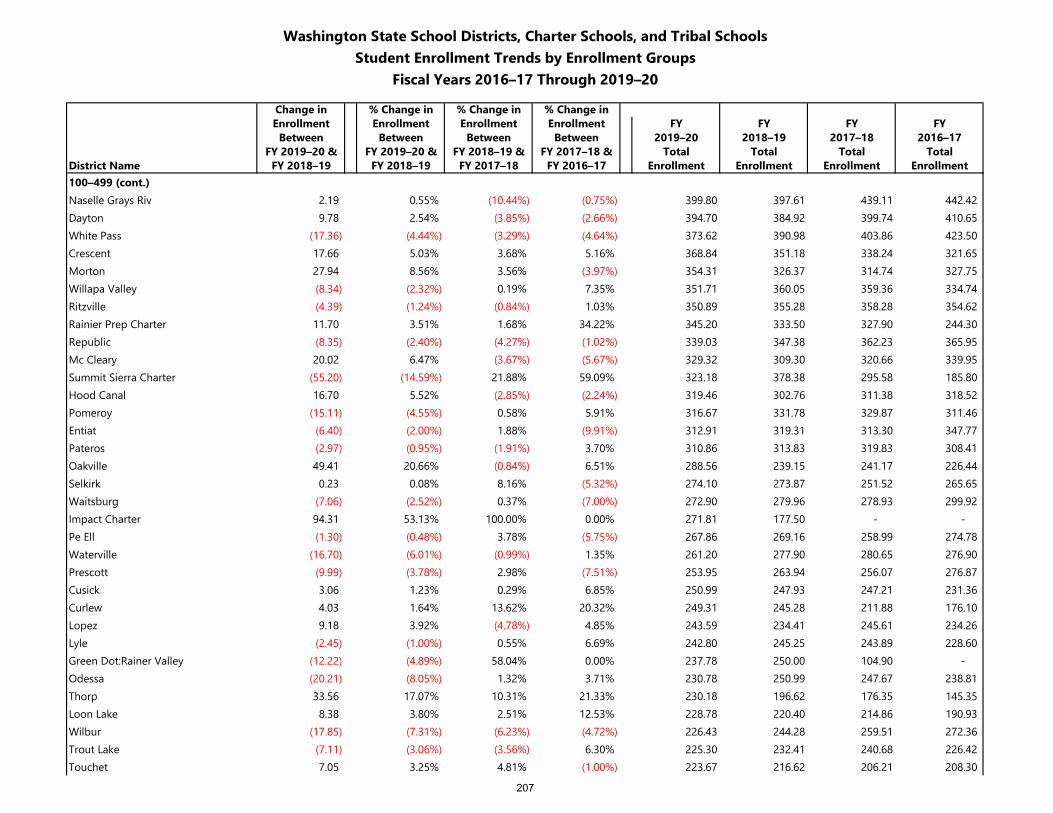
Washington State School Districts, Charter Schools, and Tribal SchoolsStudent Enrollment Trends by Enrollment Groups
Fiscal Years 2016–17 Through 2019–20
Change in % Change in % Change in % Change inEnrollment Enrollment Enrollment Enrollment FY FY FY FY
Between Between Between Between 2019–20 2018–19 2017–18 2016–17FY 2019–20 & FY 2019–20 & FY 2018–19 & FY 2017–18 & Total Total Total Total
District Name FY 2018–19 FY 2018–19 FY 2017–18 FY 2016–17 Enrollment Enrollment Enrollment Enrollment100–499 (cont.)Naselle Grays Riv 2.19 0.55% (10.44%) (0.75%) 399.80 397.61 439.11 442.42 Dayton 9.78 2.54% (3.85%) (2.66%) 394.70 384.92 399.74 410.65 White Pass (17.36) (4.44%) (3.29%) (4.64%) 373.62 390.98 403.86 423.50 Crescent 17.66 5.03% 3.68% 5.16% 368.84 351.18 338.24 321.65 Morton 27.94 8.56% 3.56% (3.97%) 354.31 326.37 314.74 327.75 Willapa Valley (8.34) (2.32%) 0.19% 7.35% 351.71 360.05 359.36 334.74 Ritzville (4.39) (1.24%) (0.84%) 1.03% 350.89 355.28 358.28 354.62 Rainier Prep Charter 11.70 3.51% 1.68% 34.22% 345.20 333.50 327.90 244.30 Republic (8.35) (2.40%) (4.27%) (1.02%) 339.03 347.38 362.23 365.95 Mc Cleary 20.02 6.47% (3.67%) (5.67%) 329.32 309.30 320.66 339.95 Summit Sierra Charter (55.20) (14.59%) 21.88% 59.09% 323.18 378.38 295.58 185.80 Hood Canal 16.70 5.52% (2.85%) (2.24%) 319.46 302.76 311.38 318.52 Pomeroy (15.11) (4.55%) 0.58% 5.91% 316.67 331.78 329.87 311.46 Entiat (6.40) (2.00%) 1.88% (9.91%) 312.91 319.31 313.30 347.77 Pateros (2.97) (0.95%) (1.91%) 3.70% 310.86 313.83 319.83 308.41 Oakville 49.41 20.66% (0.84%) 6.51% 288.56 239.15 241.17 226.44 Selkirk 0.23 0.08% 8.16% (5.32%) 274.10 273.87 251.52 265.65 Waitsburg (7.06) (2.52%) 0.37% (7.00%) 272.90 279.96 278.93 299.92 Impact Charter 94.31 53.13% 100.00% 0.00% 271.81 177.50 - - Pe Ell (1.30) (0.48%) 3.78% (5.75%) 267.86 269.16 258.99 274.78 Waterville (16.70) (6.01%) (0.99%) 1.35% 261.20 277.90 280.65 276.90 Prescott (9.99) (3.78%) 2.98% (7.51%) 253.95 263.94 256.07 276.87 Cusick 3.06 1.23% 0.29% 6.85% 250.99 247.93 247.21 231.36 Curlew 4.03 1.64% 13.62% 20.32% 249.31 245.28 211.88 176.10 Lopez 9.18 3.92% (4.78%) 4.85% 243.59 234.41 245.61 234.26 Lyle (2.45) (1.00%) 0.55% 6.69% 242.80 245.25 243.89 228.60 Green Dot:Rainer Valley (12.22) (4.89%) 58.04% 0.00% 237.78 250.00 104.90 - Odessa (20.21) (8.05%) 1.32% 3.71% 230.78 250.99 247.67 238.81 Thorp 33.56 17.07% 10.31% 21.33% 230.18 196.62 176.35 145.35 Loon Lake 8.38 3.80% 2.51% 12.53% 228.78 220.40 214.86 190.93 Wilbur (17.85) (7.31%) (6.23%) (4.72%) 226.43 244.28 259.51 272.36 Trout Lake (7.11) (3.06%) (3.56%) 6.30% 225.30 232.41 240.68 226.42 Touchet 7.05 3.25% 4.81% (1.00%) 223.67 216.62 206.21 208.30
207
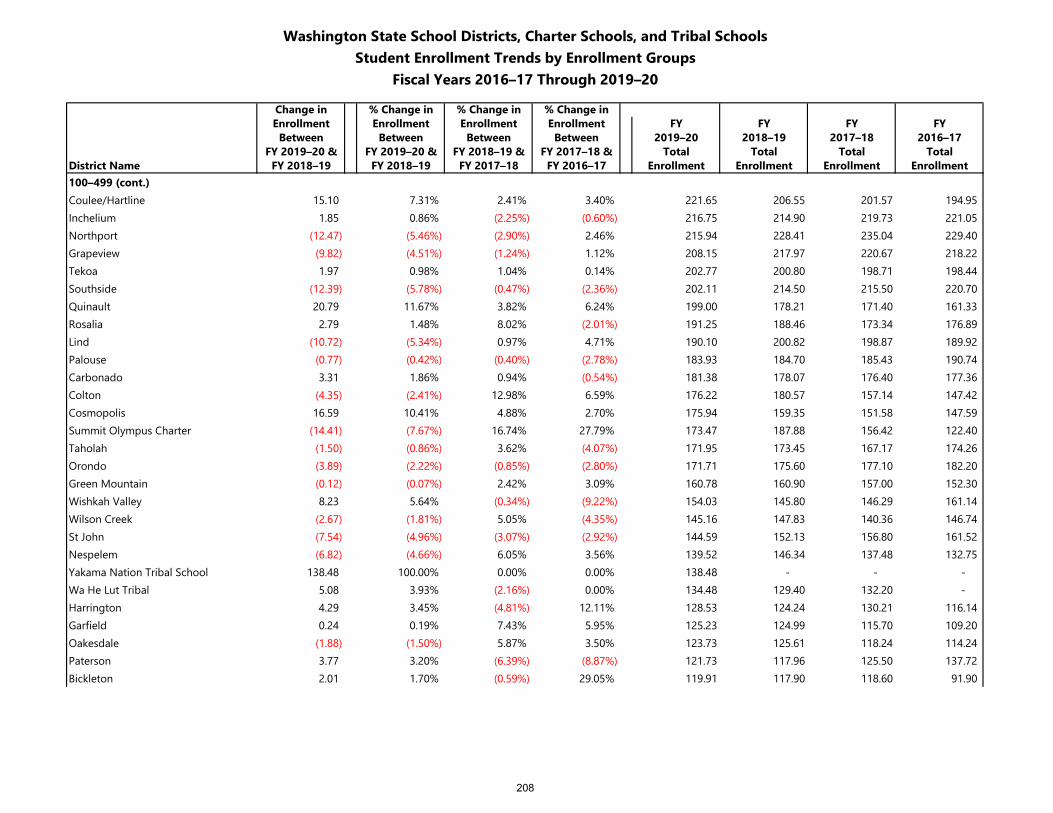
Washington State School Districts, Charter Schools, and Tribal SchoolsStudent Enrollment Trends by Enrollment Groups
Fiscal Years 2016–17 Through 2019–20
Change in % Change in % Change in % Change inEnrollment Enrollment Enrollment Enrollment FY FY FY FY
Between Between Between Between 2019–20 2018–19 2017–18 2016–17FY 2019–20 & FY 2019–20 & FY 2018–19 & FY 2017–18 & Total Total Total Total
District Name FY 2018–19 FY 2018–19 FY 2017–18 FY 2016–17 Enrollment Enrollment Enrollment Enrollment100–499 (cont.)Coulee/Hartline 15.10 7.31% 2.41% 3.40% 221.65 206.55 201.57 194.95 Inchelium 1.85 0.86% (2.25%) (0.60%) 216.75 214.90 219.73 221.05 Northport (12.47) (5.46%) (2.90%) 2.46% 215.94 228.41 235.04 229.40 Grapeview (9.82) (4.51%) (1.24%) 1.12% 208.15 217.97 220.67 218.22 Tekoa 1.97 0.98% 1.04% 0.14% 202.77 200.80 198.71 198.44 Southside (12.39) (5.78%) (0.47%) (2.36%) 202.11 214.50 215.50 220.70 Quinault 20.79 11.67% 3.82% 6.24% 199.00 178.21 171.40 161.33 Rosalia 2.79 1.48% 8.02% (2.01%) 191.25 188.46 173.34 176.89 Lind (10.72) (5.34%) 0.97% 4.71% 190.10 200.82 198.87 189.92 Palouse (0.77) (0.42%) (0.40%) (2.78%) 183.93 184.70 185.43 190.74 Carbonado 3.31 1.86% 0.94% (0.54%) 181.38 178.07 176.40 177.36 Colton (4.35) (2.41%) 12.98% 6.59% 176.22 180.57 157.14 147.42 Cosmopolis 16.59 10.41% 4.88% 2.70% 175.94 159.35 151.58 147.59 Summit Olympus Charter (14.41) (7.67%) 16.74% 27.79% 173.47 187.88 156.42 122.40 Taholah (1.50) (0.86%) 3.62% (4.07%) 171.95 173.45 167.17 174.26 Orondo (3.89) (2.22%) (0.85%) (2.80%) 171.71 175.60 177.10 182.20 Green Mountain (0.12) (0.07%) 2.42% 3.09% 160.78 160.90 157.00 152.30 Wishkah Valley 8.23 5.64% (0.34%) (9.22%) 154.03 145.80 146.29 161.14 Wilson Creek (2.67) (1.81%) 5.05% (4.35%) 145.16 147.83 140.36 146.74 St John (7.54) (4.96%) (3.07%) (2.92%) 144.59 152.13 156.80 161.52 Nespelem (6.82) (4.66%) 6.05% 3.56% 139.52 146.34 137.48 132.75 Yakama Nation Tribal School 138.48 100.00% 0.00% 0.00% 138.48 - - - Wa He Lut Tribal 5.08 3.93% (2.16%) 0.00% 134.48 129.40 132.20 - Harrington 4.29 3.45% (4.81%) 12.11% 128.53 124.24 130.21 116.14 Garfield 0.24 0.19% 7.43% 5.95% 125.23 124.99 115.70 109.20 Oakesdale (1.88) (1.50%) 5.87% 3.50% 123.73 125.61 118.24 114.24 Paterson 3.77 3.20% (6.39%) (8.87%) 121.73 117.96 125.50 137.72 Bickleton 2.01 1.70% (0.59%) 29.05% 119.91 117.90 118.60 91.90
208
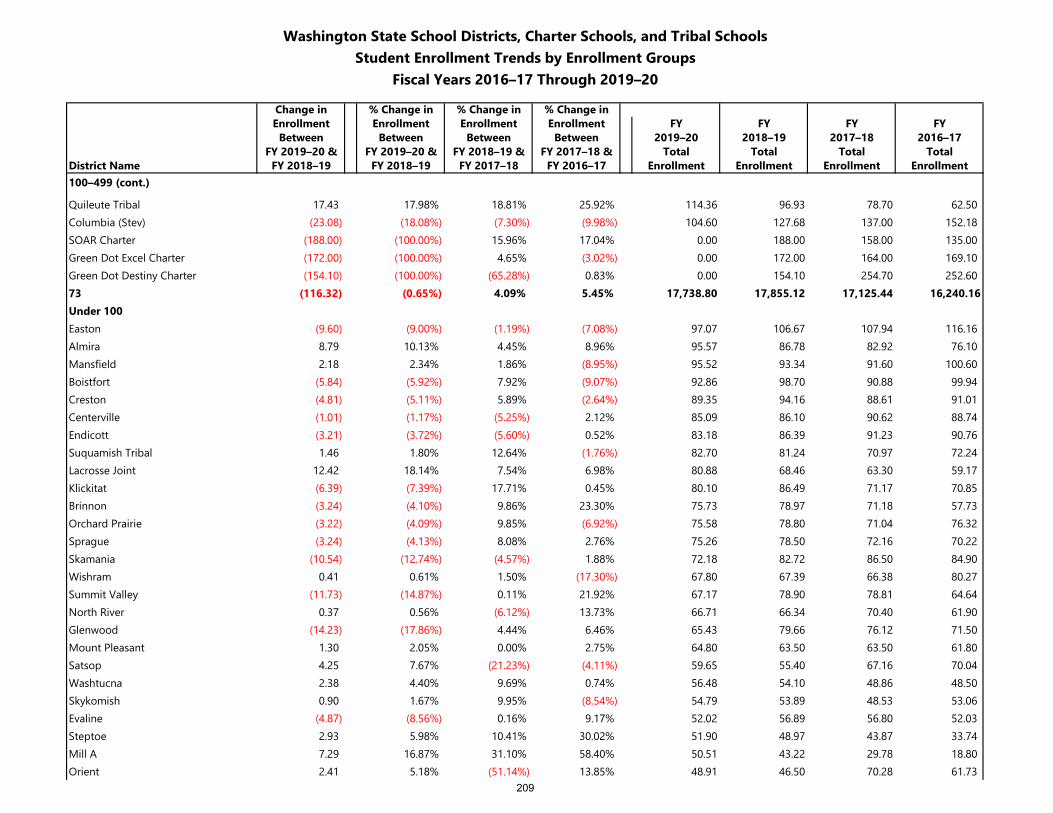
Washington State School Districts, Charter Schools, and Tribal SchoolsStudent Enrollment Trends by Enrollment Groups
Fiscal Years 2016–17 Through 2019–20
Change in % Change in % Change in % Change inEnrollment Enrollment Enrollment Enrollment FY FY FY FY
Between Between Between Between 2019–20 2018–19 2017–18 2016–17FY 2019–20 & FY 2019–20 & FY 2018–19 & FY 2017–18 & Total Total Total Total
District Name FY 2018–19 FY 2018–19 FY 2017–18 FY 2016–17 Enrollment Enrollment Enrollment Enrollment100–499 (cont.)
Quileute Tribal 17.43 17.98% 18.81% 25.92% 114.36 96.93 78.70 62.50 Columbia (Stev) (23.08) (18.08%) (7.30%) (9.98%) 104.60 127.68 137.00 152.18 SOAR Charter (188.00) (100.00%) 15.96% 17.04% 0.00 188.00 158.00 135.00 Green Dot Excel Charter (172.00) (100.00%) 4.65% (3.02%) 0.00 172.00 164.00 169.10 Green Dot Destiny Charter (154.10) (100.00%) (65.28%) 0.83% 0.00 154.10 254.70 252.60 73 (116.32) (0.65%) 4.09% 5.45% 17,738.80 17,855.12 17,125.44 16,240.16Under 100Easton (9.60) (9.00%) (1.19%) (7.08%) 97.07 106.67 107.94 116.16 Almira 8.79 10.13% 4.45% 8.96% 95.57 86.78 82.92 76.10 Mansfield 2.18 2.34% 1.86% (8.95%) 95.52 93.34 91.60 100.60 Boistfort (5.84) (5.92%) 7.92% (9.07%) 92.86 98.70 90.88 99.94 Creston (4.81) (5.11%) 5.89% (2.64%) 89.35 94.16 88.61 91.01 Centerville (1.01) (1.17%) (5.25%) 2.12% 85.09 86.10 90.62 88.74 Endicott (3.21) (3.72%) (5.60%) 0.52% 83.18 86.39 91.23 90.76 Suquamish Tribal 1.46 1.80% 12.64% (1.76%) 82.70 81.24 70.97 72.24 Lacrosse Joint 12.42 18.14% 7.54% 6.98% 80.88 68.46 63.30 59.17 Klickitat (6.39) (7.39%) 17.71% 0.45% 80.10 86.49 71.17 70.85 Brinnon (3.24) (4.10%) 9.86% 23.30% 75.73 78.97 71.18 57.73 Orchard Prairie (3.22) (4.09%) 9.85% (6.92%) 75.58 78.80 71.04 76.32 Sprague (3.24) (4.13%) 8.08% 2.76% 75.26 78.50 72.16 70.22 Skamania (10.54) (12.74%) (4.57%) 1.88% 72.18 82.72 86.50 84.90 Wishram 0.41 0.61% 1.50% (17.30%) 67.80 67.39 66.38 80.27 Summit Valley (11.73) (14.87%) 0.11% 21.92% 67.17 78.90 78.81 64.64 North River 0.37 0.56% (6.12%) 13.73% 66.71 66.34 70.40 61.90 Glenwood (14.23) (17.86%) 4.44% 6.46% 65.43 79.66 76.12 71.50 Mount Pleasant 1.30 2.05% 0.00% 2.75% 64.80 63.50 63.50 61.80 Satsop 4.25 7.67% (21.23%) (4.11%) 59.65 55.40 67.16 70.04 Washtucna 2.38 4.40% 9.69% 0.74% 56.48 54.10 48.86 48.50 Skykomish 0.90 1.67% 9.95% (8.54%) 54.79 53.89 48.53 53.06 Evaline (4.87) (8.56%) 0.16% 9.17% 52.02 56.89 56.80 52.03 Steptoe 2.93 5.98% 10.41% 30.02% 51.90 48.97 43.87 33.74 Mill A 7.29 16.87% 31.10% 58.40% 50.51 43.22 29.78 18.80 Orient 2.41 5.18% (51.14%) 13.85% 48.91 46.50 70.28 61.73
209
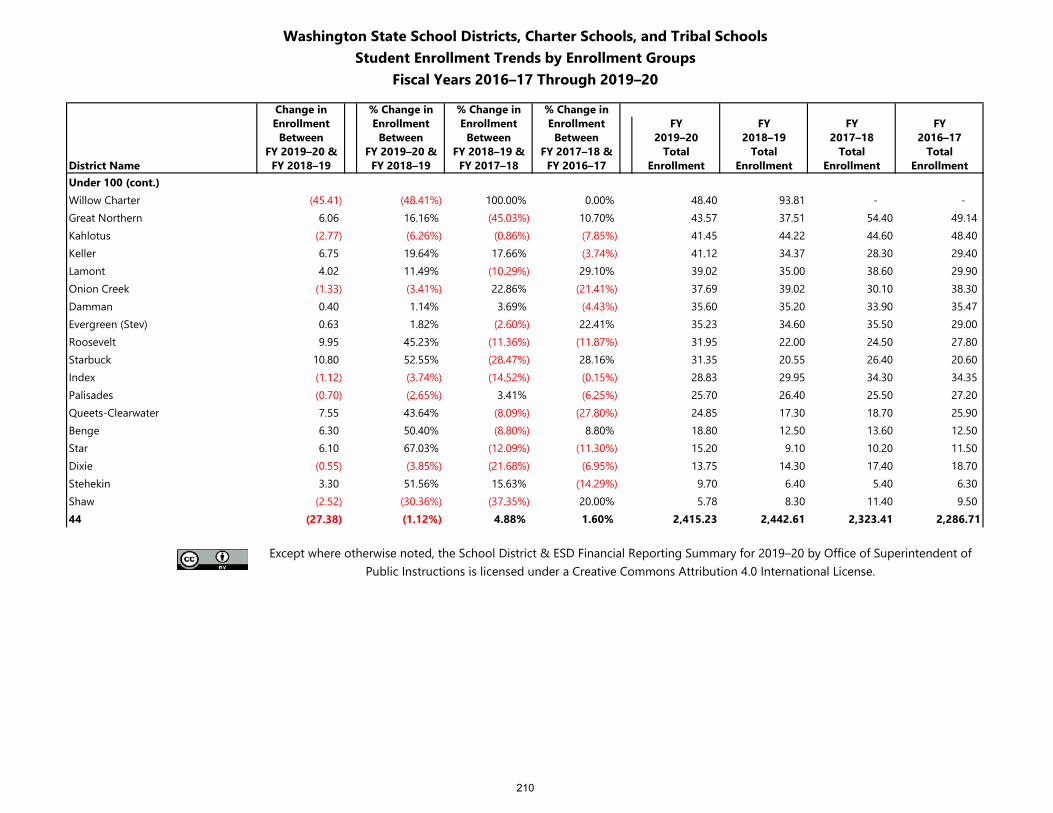
Washington State School Districts, Charter Schools, and Tribal SchoolsStudent Enrollment Trends by Enrollment Groups
Fiscal Years 2016–17 Through 2019–20
Change in % Change in % Change in % Change inEnrollment Enrollment Enrollment Enrollment FY FY FY FY
Between Between Between Between 2019–20 2018–19 2017–18 2016–17FY 2019–20 & FY 2019–20 & FY 2018–19 & FY 2017–18 & Total Total Total Total
District Name FY 2018–19 FY 2018–19 FY 2017–18 FY 2016–17 Enrollment Enrollment Enrollment EnrollmentUnder 100 (cont.)Willow Charter (45.41) (48.41%) 100.00% 0.00% 48.40 93.81 - - Great Northern 6.06 16.16% (45.03%) 10.70% 43.57 37.51 54.40 49.14 Kahlotus (2.77) (6.26%) (0.86%) (7.85%) 41.45 44.22 44.60 48.40 Keller 6.75 19.64% 17.66% (3.74%) 41.12 34.37 28.30 29.40 Lamont 4.02 11.49% (10.29%) 29.10% 39.02 35.00 38.60 29.90 Onion Creek (1.33) (3.41%) 22.86% (21.41%) 37.69 39.02 30.10 38.30 Damman 0.40 1.14% 3.69% (4.43%) 35.60 35.20 33.90 35.47 Evergreen (Stev) 0.63 1.82% (2.60%) 22.41% 35.23 34.60 35.50 29.00 Roosevelt 9.95 45.23% (11.36%) (11.87%) 31.95 22.00 24.50 27.80 Starbuck 10.80 52.55% (28.47%) 28.16% 31.35 20.55 26.40 20.60 Index (1.12) (3.74%) (14.52%) (0.15%) 28.83 29.95 34.30 34.35 Palisades (0.70) (2.65%) 3.41% (6.25%) 25.70 26.40 25.50 27.20 Queets-Clearwater 7.55 43.64% (8.09%) (27.80%) 24.85 17.30 18.70 25.90 Benge 6.30 50.40% (8.80%) 8.80% 18.80 12.50 13.60 12.50 Star 6.10 67.03% (12.09%) (11.30%) 15.20 9.10 10.20 11.50 Dixie (0.55) (3.85%) (21.68%) (6.95%) 13.75 14.30 17.40 18.70 Stehekin 3.30 51.56% 15.63% (14.29%) 9.70 6.40 5.40 6.30 Shaw (2.52) (30.36%) (37.35%) 20.00% 5.78 8.30 11.40 9.50 44 (27.38) (1.12%) 4.88% 1.60% 2,415.23 2,442.61 2,323.41 2,286.71
Except where otherwise noted, the School District & ESD Financial Reporting Summary for 2019–20 by Office of Superintendent of Public Instructions is licensed under a Creative Commons Attribution 4.0 International License.
210
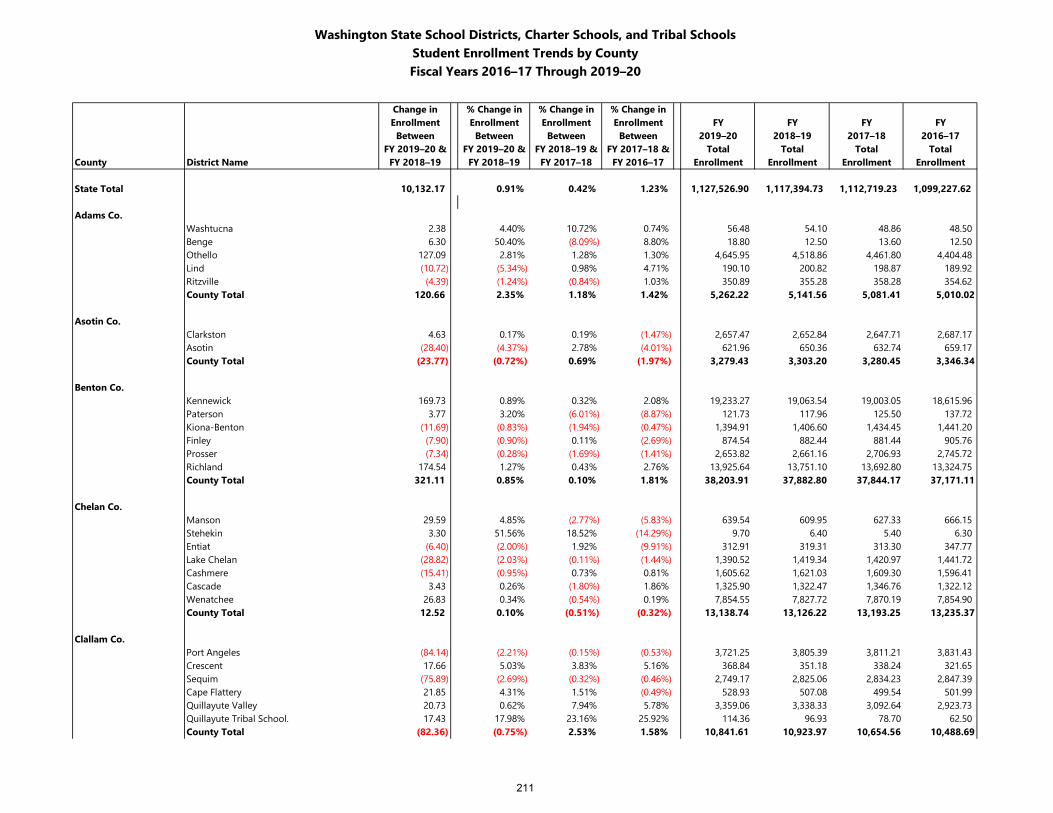
Washington State School Districts, Charter Schools, and Tribal SchoolsStudent Enrollment Trends by CountyFiscal Years 2016–17 Through 2019–20
Change in % Change in % Change in % Change inEnrollment Enrollment Enrollment Enrollment FY FY FY FY
Between Between Between Between 2019–20 2018–19 2017–18 2016–17FY 2019–20 & FY 2019–20 & FY 2018–19 & FY 2017–18 & Total Total Total Total
County District Name FY 2018–19 FY 2018–19 FY 2017–18 FY 2016–17 Enrollment Enrollment Enrollment Enrollment
State Total 10,132.17 0.91% 0.42% 1.23% 1,127,526.90 1,117,394.73 1,112,719.23 1,099,227.62
Adams Co.Washtucna 2.38 4.40% 10.72% 0.74% 56.48 54.10 48.86 48.50 Benge 6.30 50.40% (8.09%) 8.80% 18.80 12.50 13.60 12.50 Othello 127.09 2.81% 1.28% 1.30% 4,645.95 4,518.86 4,461.80 4,404.48 Lind (10.72) (5.34%) 0.98% 4.71% 190.10 200.82 198.87 189.92 Ritzville (4.39) (1.24%) (0.84%) 1.03% 350.89 355.28 358.28 354.62 County Total 120.66 2.35% 1.18% 1.42% 5,262.22 5,141.56 5,081.41 5,010.02
Asotin Co.Clarkston 4.63 0.17% 0.19% (1.47%) 2,657.47 2,652.84 2,647.71 2,687.17 Asotin (28.40) (4.37%) 2.78% (4.01%) 621.96 650.36 632.74 659.17 County Total (23.77) (0.72%) 0.69% (1.97%) 3,279.43 3,303.20 3,280.45 3,346.34
Benton Co.Kennewick 169.73 0.89% 0.32% 2.08% 19,233.27 19,063.54 19,003.05 18,615.96 Paterson 3.77 3.20% (6.01%) (8.87%) 121.73 117.96 125.50 137.72 Kiona-Benton (11.69) (0.83%) (1.94%) (0.47%) 1,394.91 1,406.60 1,434.45 1,441.20 Finley (7.90) (0.90%) 0.11% (2.69%) 874.54 882.44 881.44 905.76 Prosser (7.34) (0.28%) (1.69%) (1.41%) 2,653.82 2,661.16 2,706.93 2,745.72 Richland 174.54 1.27% 0.43% 2.76% 13,925.64 13,751.10 13,692.80 13,324.75 County Total 321.11 0.85% 0.10% 1.81% 38,203.91 37,882.80 37,844.17 37,171.11
Chelan Co.Manson 29.59 4.85% (2.77%) (5.83%) 639.54 609.95 627.33 666.15 Stehekin 3.30 51.56% 18.52% (14.29%) 9.70 6.40 5.40 6.30 Entiat (6.40) (2.00%) 1.92% (9.91%) 312.91 319.31 313.30 347.77 Lake Chelan (28.82) (2.03%) (0.11%) (1.44%) 1,390.52 1,419.34 1,420.97 1,441.72 Cashmere (15.41) (0.95%) 0.73% 0.81% 1,605.62 1,621.03 1,609.30 1,596.41 Cascade 3.43 0.26% (1.80%) 1.86% 1,325.90 1,322.47 1,346.76 1,322.12 Wenatchee 26.83 0.34% (0.54%) 0.19% 7,854.55 7,827.72 7,870.19 7,854.90 County Total 12.52 0.10% (0.51%) (0.32%) 13,138.74 13,126.22 13,193.25 13,235.37
Clallam Co.Port Angeles (84.14) (2.21%) (0.15%) (0.53%) 3,721.25 3,805.39 3,811.21 3,831.43 Crescent 17.66 5.03% 3.83% 5.16% 368.84 351.18 338.24 321.65 Sequim (75.89) (2.69%) (0.32%) (0.46%) 2,749.17 2,825.06 2,834.23 2,847.39 Cape Flattery 21.85 4.31% 1.51% (0.49%) 528.93 507.08 499.54 501.99 Quillayute Valley 20.73 0.62% 7.94% 5.78% 3,359.06 3,338.33 3,092.64 2,923.73 Quillayute Tribal School. 17.43 17.98% 23.16% 25.92% 114.36 96.93 78.70 62.50 County Total (82.36) (0.75%) 2.53% 1.58% 10,841.61 10,923.97 10,654.56 10,488.69
211
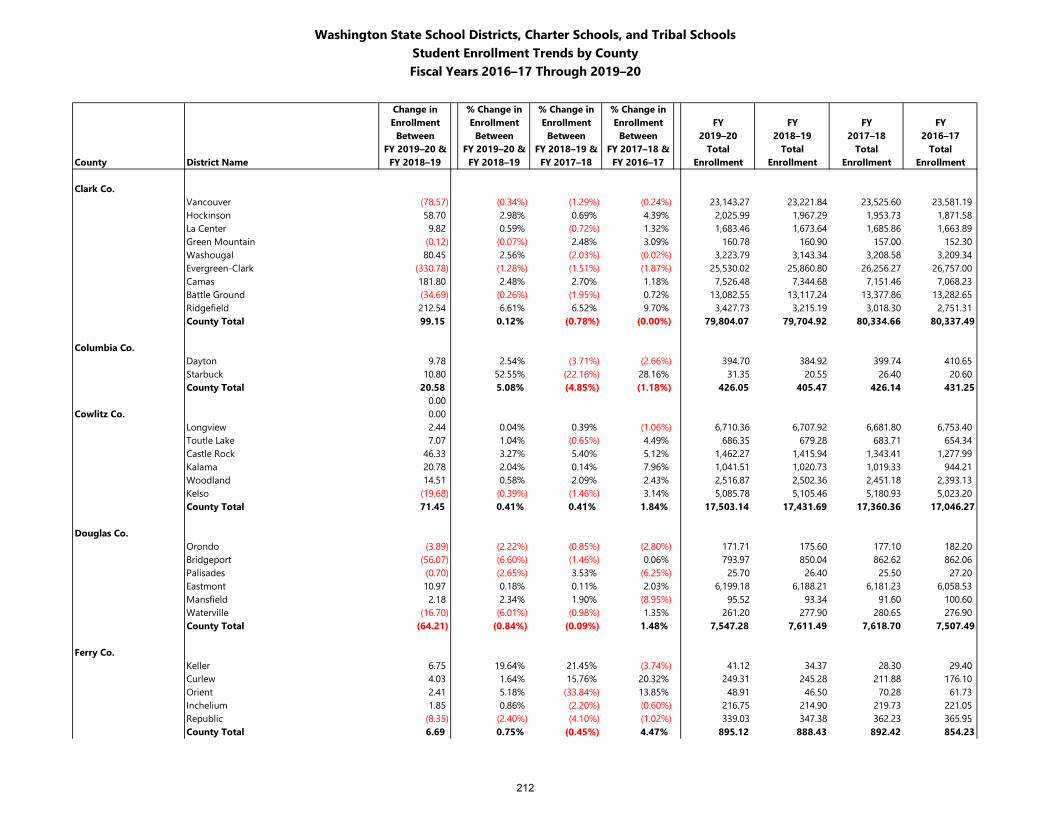
Washington State School Districts, Charter Schools, and Tribal SchoolsStudent Enrollment Trends by CountyFiscal Years 2016–17 Through 2019–20
Change in % Change in % Change in % Change inEnrollment Enrollment Enrollment Enrollment FY FY FY FY
Between Between Between Between 2019–20 2018–19 2017–18 2016–17FY 2019–20 & FY 2019–20 & FY 2018–19 & FY 2017–18 & Total Total Total Total
County District Name FY 2018–19 FY 2018–19 FY 2017–18 FY 2016–17 Enrollment Enrollment Enrollment Enrollment
Clark Co.Vancouver (78.57) (0.34%) (1.29%) (0.24%) 23,143.27 23,221.84 23,525.60 23,581.19 Hockinson 58.70 2.98% 0.69% 4.39% 2,025.99 1,967.29 1,953.73 1,871.58 La Center 9.82 0.59% (0.72%) 1.32% 1,683.46 1,673.64 1,685.86 1,663.89 Green Mountain (0.12) (0.07%) 2.48% 3.09% 160.78 160.90 157.00 152.30 Washougal 80.45 2.56% (2.03%) (0.02%) 3,223.79 3,143.34 3,208.58 3,209.34 Evergreen-Clark (330.78) (1.28%) (1.51%) (1.87%) 25,530.02 25,860.80 26,256.27 26,757.00 Camas 181.80 2.48% 2.70% 1.18% 7,526.48 7,344.68 7,151.46 7,068.23 Battle Ground (34.69) (0.26%) (1.95%) 0.72% 13,082.55 13,117.24 13,377.86 13,282.65 Ridgefield 212.54 6.61% 6.52% 9.70% 3,427.73 3,215.19 3,018.30 2,751.31 County Total 99.15 0.12% (0.78%) (0.00%) 79,804.07 79,704.92 80,334.66 80,337.49
Columbia Co.Dayton 9.78 2.54% (3.71%) (2.66%) 394.70 384.92 399.74 410.65 Starbuck 10.80 52.55% (22.16%) 28.16% 31.35 20.55 26.40 20.60 County Total 20.58 5.08% (4.85%) (1.18%) 426.05 405.47 426.14 431.25
0.00Cowlitz Co. 0.00
Longview 2.44 0.04% 0.39% (1.06%) 6,710.36 6,707.92 6,681.80 6,753.40 Toutle Lake 7.07 1.04% (0.65%) 4.49% 686.35 679.28 683.71 654.34 Castle Rock 46.33 3.27% 5.40% 5.12% 1,462.27 1,415.94 1,343.41 1,277.99 Kalama 20.78 2.04% 0.14% 7.96% 1,041.51 1,020.73 1,019.33 944.21 Woodland 14.51 0.58% 2.09% 2.43% 2,516.87 2,502.36 2,451.18 2,393.13 Kelso (19.68) (0.39%) (1.46%) 3.14% 5,085.78 5,105.46 5,180.93 5,023.20 County Total 71.45 0.41% 0.41% 1.84% 17,503.14 17,431.69 17,360.36 17,046.27
Douglas Co.Orondo (3.89) (2.22%) (0.85%) (2.80%) 171.71 175.60 177.10 182.20 Bridgeport (56.07) (6.60%) (1.46%) 0.06% 793.97 850.04 862.62 862.06 Palisades (0.70) (2.65%) 3.53% (6.25%) 25.70 26.40 25.50 27.20 Eastmont 10.97 0.18% 0.11% 2.03% 6,199.18 6,188.21 6,181.23 6,058.53 Mansfield 2.18 2.34% 1.90% (8.95%) 95.52 93.34 91.60 100.60 Waterville (16.70) (6.01%) (0.98%) 1.35% 261.20 277.90 280.65 276.90 County Total (64.21) (0.84%) (0.09%) 1.48% 7,547.28 7,611.49 7,618.70 7,507.49
Ferry Co.Keller 6.75 19.64% 21.45% (3.74%) 41.12 34.37 28.30 29.40 Curlew 4.03 1.64% 15.76% 20.32% 249.31 245.28 211.88 176.10 Orient 2.41 5.18% (33.84%) 13.85% 48.91 46.50 70.28 61.73 Inchelium 1.85 0.86% (2.20%) (0.60%) 216.75 214.90 219.73 221.05 Republic (8.35) (2.40%) (4.10%) (1.02%) 339.03 347.38 362.23 365.95 County Total 6.69 0.75% (0.45%) 4.47% 895.12 888.43 892.42 854.23
212
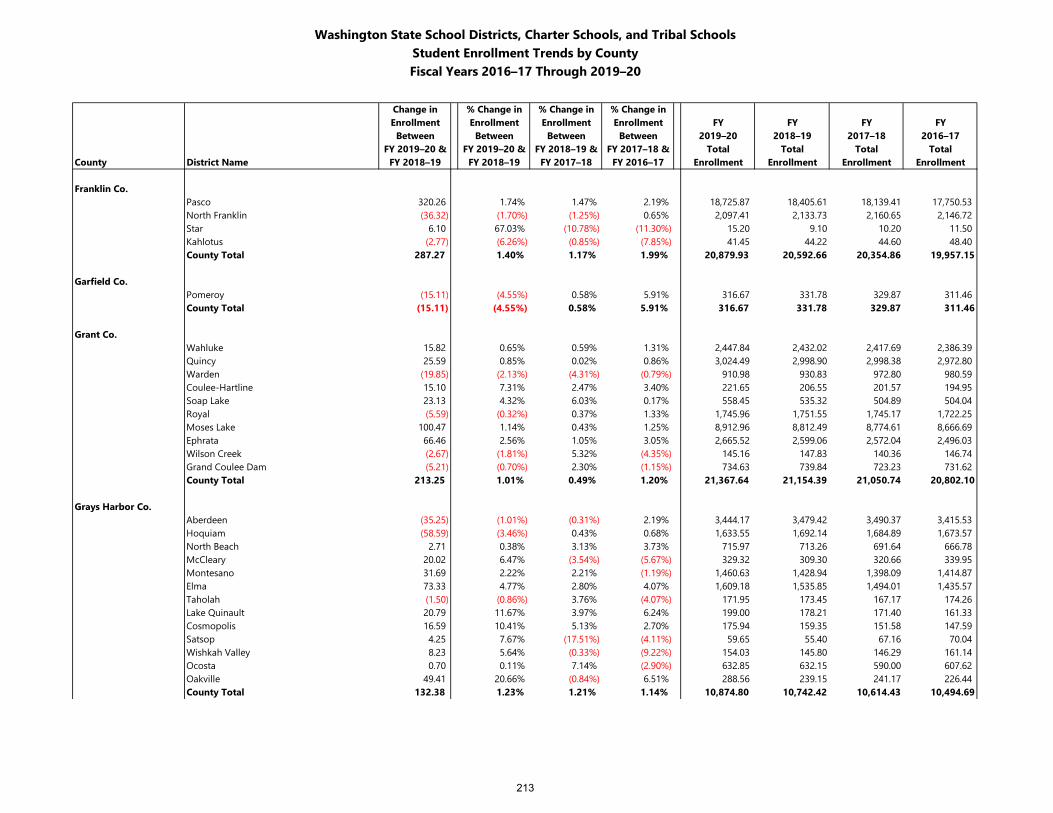
Washington State School Districts, Charter Schools, and Tribal SchoolsStudent Enrollment Trends by CountyFiscal Years 2016–17 Through 2019–20
Change in % Change in % Change in % Change inEnrollment Enrollment Enrollment Enrollment FY FY FY FY
Between Between Between Between 2019–20 2018–19 2017–18 2016–17FY 2019–20 & FY 2019–20 & FY 2018–19 & FY 2017–18 & Total Total Total Total
County District Name FY 2018–19 FY 2018–19 FY 2017–18 FY 2016–17 Enrollment Enrollment Enrollment Enrollment
Franklin Co.Pasco 320.26 1.74% 1.47% 2.19% 18,725.87 18,405.61 18,139.41 17,750.53 North Franklin (36.32) (1.70%) (1.25%) 0.65% 2,097.41 2,133.73 2,160.65 2,146.72 Star 6.10 67.03% (10.78%) (11.30%) 15.20 9.10 10.20 11.50 Kahlotus (2.77) (6.26%) (0.85%) (7.85%) 41.45 44.22 44.60 48.40 County Total 287.27 1.40% 1.17% 1.99% 20,879.93 20,592.66 20,354.86 19,957.15
Garfield Co.Pomeroy (15.11) (4.55%) 0.58% 5.91% 316.67 331.78 329.87 311.46 County Total (15.11) (4.55%) 0.58% 5.91% 316.67 331.78 329.87 311.46
Grant Co.Wahluke 15.82 0.65% 0.59% 1.31% 2,447.84 2,432.02 2,417.69 2,386.39 Quincy 25.59 0.85% 0.02% 0.86% 3,024.49 2,998.90 2,998.38 2,972.80 Warden (19.85) (2.13%) (4.31%) (0.79%) 910.98 930.83 972.80 980.59 Coulee-Hartline 15.10 7.31% 2.47% 3.40% 221.65 206.55 201.57 194.95 Soap Lake 23.13 4.32% 6.03% 0.17% 558.45 535.32 504.89 504.04 Royal (5.59) (0.32%) 0.37% 1.33% 1,745.96 1,751.55 1,745.17 1,722.25 Moses Lake 100.47 1.14% 0.43% 1.25% 8,912.96 8,812.49 8,774.61 8,666.69 Ephrata 66.46 2.56% 1.05% 3.05% 2,665.52 2,599.06 2,572.04 2,496.03 Wilson Creek (2.67) (1.81%) 5.32% (4.35%) 145.16 147.83 140.36 146.74 Grand Coulee Dam (5.21) (0.70%) 2.30% (1.15%) 734.63 739.84 723.23 731.62 County Total 213.25 1.01% 0.49% 1.20% 21,367.64 21,154.39 21,050.74 20,802.10
Grays Harbor Co.Aberdeen (35.25) (1.01%) (0.31%) 2.19% 3,444.17 3,479.42 3,490.37 3,415.53 Hoquiam (58.59) (3.46%) 0.43% 0.68% 1,633.55 1,692.14 1,684.89 1,673.57 North Beach 2.71 0.38% 3.13% 3.73% 715.97 713.26 691.64 666.78 McCleary 20.02 6.47% (3.54%) (5.67%) 329.32 309.30 320.66 339.95 Montesano 31.69 2.22% 2.21% (1.19%) 1,460.63 1,428.94 1,398.09 1,414.87 Elma 73.33 4.77% 2.80% 4.07% 1,609.18 1,535.85 1,494.01 1,435.57 Taholah (1.50) (0.86%) 3.76% (4.07%) 171.95 173.45 167.17 174.26 Lake Quinault 20.79 11.67% 3.97% 6.24% 199.00 178.21 171.40 161.33 Cosmopolis 16.59 10.41% 5.13% 2.70% 175.94 159.35 151.58 147.59 Satsop 4.25 7.67% (17.51%) (4.11%) 59.65 55.40 67.16 70.04 Wishkah Valley 8.23 5.64% (0.33%) (9.22%) 154.03 145.80 146.29 161.14 Ocosta 0.70 0.11% 7.14% (2.90%) 632.85 632.15 590.00 607.62 Oakville 49.41 20.66% (0.84%) 6.51% 288.56 239.15 241.17 226.44 County Total 132.38 1.23% 1.21% 1.14% 10,874.80 10,742.42 10,614.43 10,494.69
213
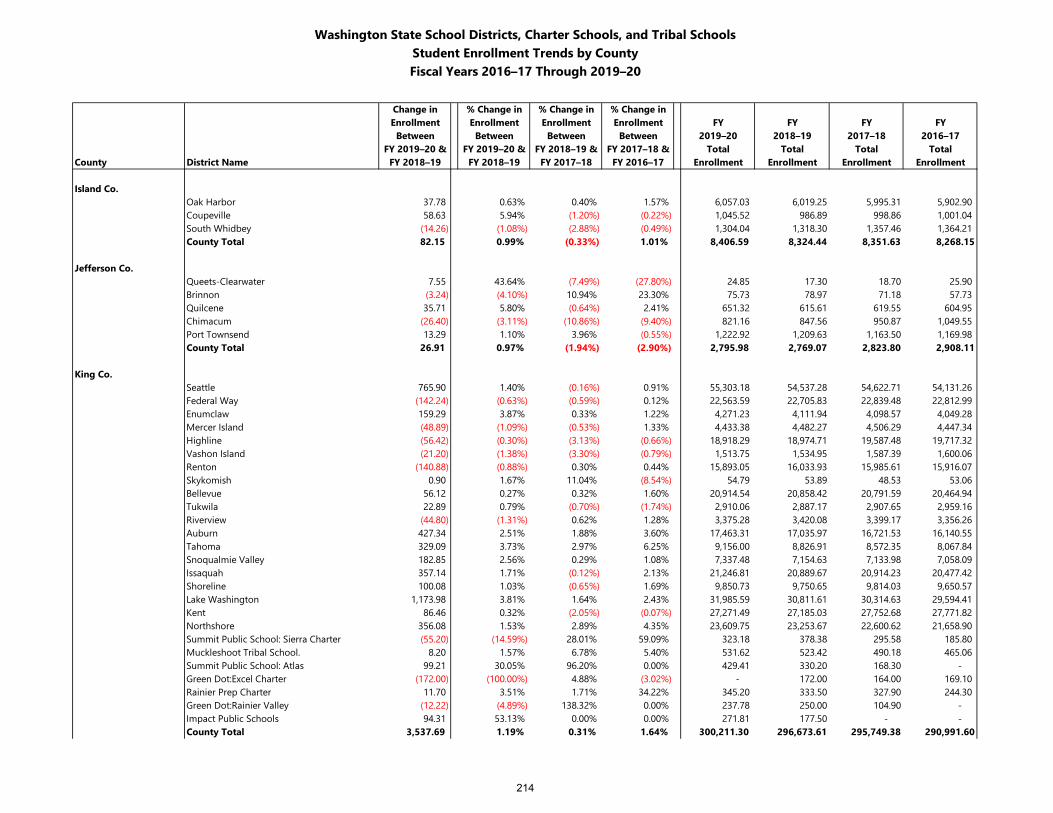
Washington State School Districts, Charter Schools, and Tribal SchoolsStudent Enrollment Trends by CountyFiscal Years 2016–17 Through 2019–20
Change in % Change in % Change in % Change inEnrollment Enrollment Enrollment Enrollment FY FY FY FY
Between Between Between Between 2019–20 2018–19 2017–18 2016–17FY 2019–20 & FY 2019–20 & FY 2018–19 & FY 2017–18 & Total Total Total Total
County District Name FY 2018–19 FY 2018–19 FY 2017–18 FY 2016–17 Enrollment Enrollment Enrollment Enrollment
Island Co.Oak Harbor 37.78 0.63% 0.40% 1.57% 6,057.03 6,019.25 5,995.31 5,902.90 Coupeville 58.63 5.94% (1.20%) (0.22%) 1,045.52 986.89 998.86 1,001.04 South Whidbey (14.26) (1.08%) (2.88%) (0.49%) 1,304.04 1,318.30 1,357.46 1,364.21 County Total 82.15 0.99% (0.33%) 1.01% 8,406.59 8,324.44 8,351.63 8,268.15
Jefferson Co.Queets-Clearwater 7.55 43.64% (7.49%) (27.80%) 24.85 17.30 18.70 25.90 Brinnon (3.24) (4.10%) 10.94% 23.30% 75.73 78.97 71.18 57.73 Quilcene 35.71 5.80% (0.64%) 2.41% 651.32 615.61 619.55 604.95 Chimacum (26.40) (3.11%) (10.86%) (9.40%) 821.16 847.56 950.87 1,049.55 Port Townsend 13.29 1.10% 3.96% (0.55%) 1,222.92 1,209.63 1,163.50 1,169.98 County Total 26.91 0.97% (1.94%) (2.90%) 2,795.98 2,769.07 2,823.80 2,908.11
King Co.Seattle 765.90 1.40% (0.16%) 0.91% 55,303.18 54,537.28 54,622.71 54,131.26 Federal Way (142.24) (0.63%) (0.59%) 0.12% 22,563.59 22,705.83 22,839.48 22,812.99 Enumclaw 159.29 3.87% 0.33% 1.22% 4,271.23 4,111.94 4,098.57 4,049.28 Mercer Island (48.89) (1.09%) (0.53%) 1.33% 4,433.38 4,482.27 4,506.29 4,447.34 Highline (56.42) (0.30%) (3.13%) (0.66%) 18,918.29 18,974.71 19,587.48 19,717.32 Vashon Island (21.20) (1.38%) (3.30%) (0.79%) 1,513.75 1,534.95 1,587.39 1,600.06 Renton (140.88) (0.88%) 0.30% 0.44% 15,893.05 16,033.93 15,985.61 15,916.07 Skykomish 0.90 1.67% 11.04% (8.54%) 54.79 53.89 48.53 53.06 Bellevue 56.12 0.27% 0.32% 1.60% 20,914.54 20,858.42 20,791.59 20,464.94 Tukwila 22.89 0.79% (0.70%) (1.74%) 2,910.06 2,887.17 2,907.65 2,959.16 Riverview (44.80) (1.31%) 0.62% 1.28% 3,375.28 3,420.08 3,399.17 3,356.26 Auburn 427.34 2.51% 1.88% 3.60% 17,463.31 17,035.97 16,721.53 16,140.55 Tahoma 329.09 3.73% 2.97% 6.25% 9,156.00 8,826.91 8,572.35 8,067.84 Snoqualmie Valley 182.85 2.56% 0.29% 1.08% 7,337.48 7,154.63 7,133.98 7,058.09 Issaquah 357.14 1.71% (0.12%) 2.13% 21,246.81 20,889.67 20,914.23 20,477.42 Shoreline 100.08 1.03% (0.65%) 1.69% 9,850.73 9,750.65 9,814.03 9,650.57 Lake Washington 1,173.98 3.81% 1.64% 2.43% 31,985.59 30,811.61 30,314.63 29,594.41 Kent 86.46 0.32% (2.05%) (0.07%) 27,271.49 27,185.03 27,752.68 27,771.82 Northshore 356.08 1.53% 2.89% 4.35% 23,609.75 23,253.67 22,600.62 21,658.90 Summit Public School: Sierra Charter (55.20) (14.59%) 28.01% 59.09% 323.18 378.38 295.58 185.80 Muckleshoot Tribal School. 8.20 1.57% 6.78% 5.40% 531.62 523.42 490.18 465.06 Summit Public School: Atlas 99.21 30.05% 96.20% 0.00% 429.41 330.20 168.30 - Green Dot:Excel Charter (172.00) (100.00%) 4.88% (3.02%) - 172.00 164.00 169.10 Rainier Prep Charter 11.70 3.51% 1.71% 34.22% 345.20 333.50 327.90 244.30 Green Dot:Rainier Valley (12.22) (4.89%) 138.32% 0.00% 237.78 250.00 104.90 - Impact Public Schools 94.31 53.13% 0.00% 0.00% 271.81 177.50 - - County Total 3,537.69 1.19% 0.31% 1.64% 300,211.30 296,673.61 295,749.38 290,991.60
214
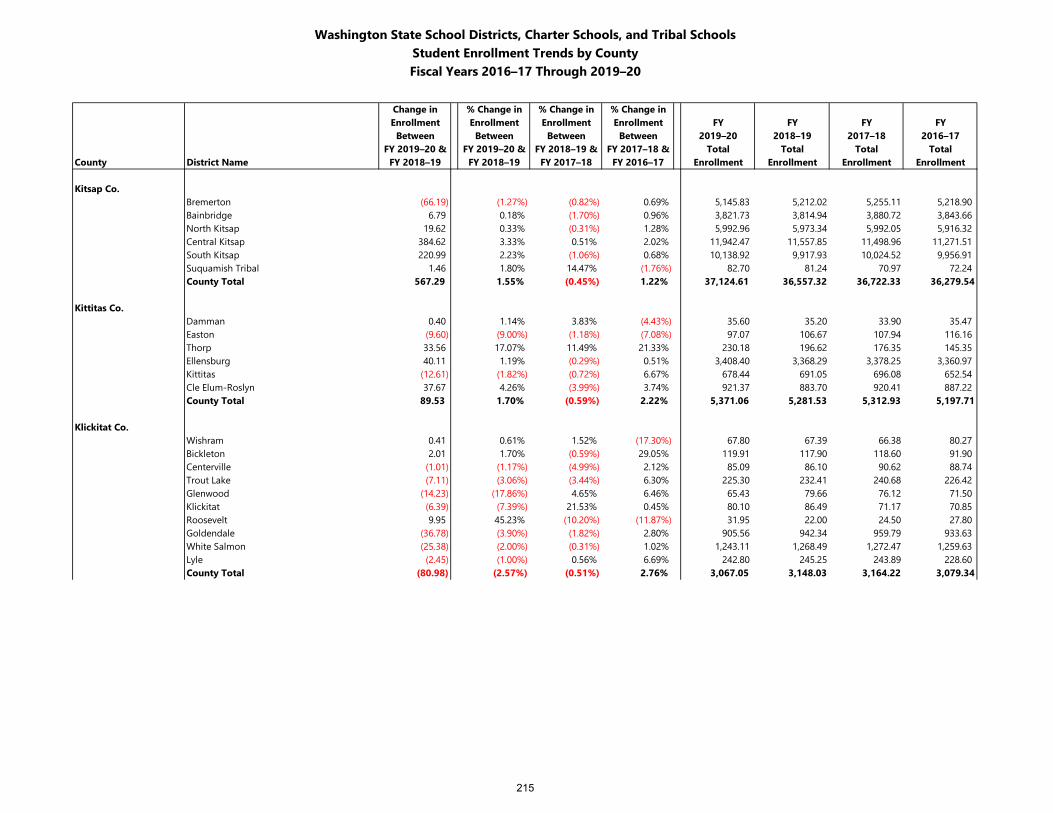
Washington State School Districts, Charter Schools, and Tribal SchoolsStudent Enrollment Trends by CountyFiscal Years 2016–17 Through 2019–20
Change in % Change in % Change in % Change inEnrollment Enrollment Enrollment Enrollment FY FY FY FY
Between Between Between Between 2019–20 2018–19 2017–18 2016–17FY 2019–20 & FY 2019–20 & FY 2018–19 & FY 2017–18 & Total Total Total Total
County District Name FY 2018–19 FY 2018–19 FY 2017–18 FY 2016–17 Enrollment Enrollment Enrollment Enrollment
Kitsap Co.Bremerton (66.19) (1.27%) (0.82%) 0.69% 5,145.83 5,212.02 5,255.11 5,218.90 Bainbridge 6.79 0.18% (1.70%) 0.96% 3,821.73 3,814.94 3,880.72 3,843.66 North Kitsap 19.62 0.33% (0.31%) 1.28% 5,992.96 5,973.34 5,992.05 5,916.32 Central Kitsap 384.62 3.33% 0.51% 2.02% 11,942.47 11,557.85 11,498.96 11,271.51 South Kitsap 220.99 2.23% (1.06%) 0.68% 10,138.92 9,917.93 10,024.52 9,956.91 Suquamish Tribal 1.46 1.80% 14.47% (1.76%) 82.70 81.24 70.97 72.24 County Total 567.29 1.55% (0.45%) 1.22% 37,124.61 36,557.32 36,722.33 36,279.54
Kittitas Co.Damman 0.40 1.14% 3.83% (4.43%) 35.60 35.20 33.90 35.47 Easton (9.60) (9.00%) (1.18%) (7.08%) 97.07 106.67 107.94 116.16 Thorp 33.56 17.07% 11.49% 21.33% 230.18 196.62 176.35 145.35 Ellensburg 40.11 1.19% (0.29%) 0.51% 3,408.40 3,368.29 3,378.25 3,360.97 Kittitas (12.61) (1.82%) (0.72%) 6.67% 678.44 691.05 696.08 652.54 Cle Elum-Roslyn 37.67 4.26% (3.99%) 3.74% 921.37 883.70 920.41 887.22 County Total 89.53 1.70% (0.59%) 2.22% 5,371.06 5,281.53 5,312.93 5,197.71
Klickitat Co.Wishram 0.41 0.61% 1.52% (17.30%) 67.80 67.39 66.38 80.27 Bickleton 2.01 1.70% (0.59%) 29.05% 119.91 117.90 118.60 91.90 Centerville (1.01) (1.17%) (4.99%) 2.12% 85.09 86.10 90.62 88.74 Trout Lake (7.11) (3.06%) (3.44%) 6.30% 225.30 232.41 240.68 226.42 Glenwood (14.23) (17.86%) 4.65% 6.46% 65.43 79.66 76.12 71.50 Klickitat (6.39) (7.39%) 21.53% 0.45% 80.10 86.49 71.17 70.85 Roosevelt 9.95 45.23% (10.20%) (11.87%) 31.95 22.00 24.50 27.80 Goldendale (36.78) (3.90%) (1.82%) 2.80% 905.56 942.34 959.79 933.63 White Salmon (25.38) (2.00%) (0.31%) 1.02% 1,243.11 1,268.49 1,272.47 1,259.63 Lyle (2.45) (1.00%) 0.56% 6.69% 242.80 245.25 243.89 228.60 County Total (80.98) (2.57%) (0.51%) 2.76% 3,067.05 3,148.03 3,164.22 3,079.34
215
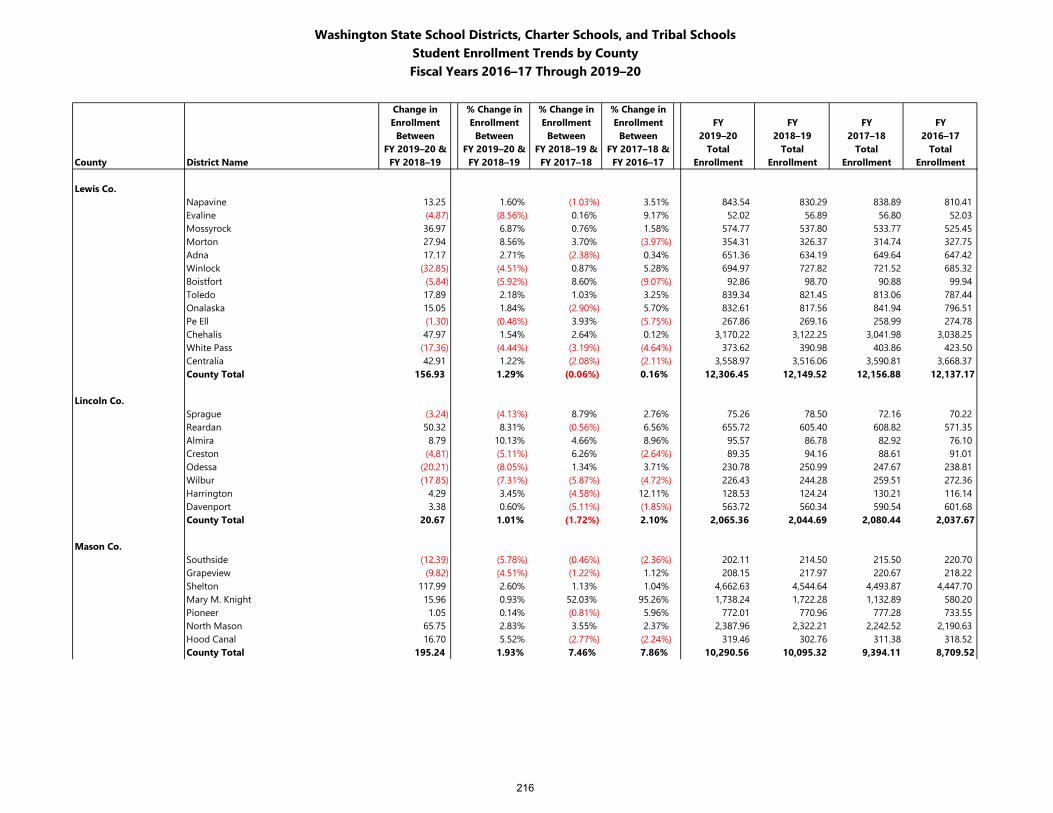
Washington State School Districts, Charter Schools, and Tribal SchoolsStudent Enrollment Trends by CountyFiscal Years 2016–17 Through 2019–20
Change in % Change in % Change in % Change inEnrollment Enrollment Enrollment Enrollment FY FY FY FY
Between Between Between Between 2019–20 2018–19 2017–18 2016–17FY 2019–20 & FY 2019–20 & FY 2018–19 & FY 2017–18 & Total Total Total Total
County District Name FY 2018–19 FY 2018–19 FY 2017–18 FY 2016–17 Enrollment Enrollment Enrollment Enrollment
Lewis Co.Napavine 13.25 1.60% (1.03%) 3.51% 843.54 830.29 838.89 810.41 Evaline (4.87) (8.56%) 0.16% 9.17% 52.02 56.89 56.80 52.03 Mossyrock 36.97 6.87% 0.76% 1.58% 574.77 537.80 533.77 525.45 Morton 27.94 8.56% 3.70% (3.97%) 354.31 326.37 314.74 327.75 Adna 17.17 2.71% (2.38%) 0.34% 651.36 634.19 649.64 647.42 Winlock (32.85) (4.51%) 0.87% 5.28% 694.97 727.82 721.52 685.32 Boistfort (5.84) (5.92%) 8.60% (9.07%) 92.86 98.70 90.88 99.94 Toledo 17.89 2.18% 1.03% 3.25% 839.34 821.45 813.06 787.44 Onalaska 15.05 1.84% (2.90%) 5.70% 832.61 817.56 841.94 796.51 Pe Ell (1.30) (0.48%) 3.93% (5.75%) 267.86 269.16 258.99 274.78 Chehalis 47.97 1.54% 2.64% 0.12% 3,170.22 3,122.25 3,041.98 3,038.25 White Pass (17.36) (4.44%) (3.19%) (4.64%) 373.62 390.98 403.86 423.50 Centralia 42.91 1.22% (2.08%) (2.11%) 3,558.97 3,516.06 3,590.81 3,668.37 County Total 156.93 1.29% (0.06%) 0.16% 12,306.45 12,149.52 12,156.88 12,137.17
Lincoln Co.Sprague (3.24) (4.13%) 8.79% 2.76% 75.26 78.50 72.16 70.22 Reardan 50.32 8.31% (0.56%) 6.56% 655.72 605.40 608.82 571.35 Almira 8.79 10.13% 4.66% 8.96% 95.57 86.78 82.92 76.10 Creston (4.81) (5.11%) 6.26% (2.64%) 89.35 94.16 88.61 91.01 Odessa (20.21) (8.05%) 1.34% 3.71% 230.78 250.99 247.67 238.81 Wilbur (17.85) (7.31%) (5.87%) (4.72%) 226.43 244.28 259.51 272.36 Harrington 4.29 3.45% (4.58%) 12.11% 128.53 124.24 130.21 116.14 Davenport 3.38 0.60% (5.11%) (1.85%) 563.72 560.34 590.54 601.68 County Total 20.67 1.01% (1.72%) 2.10% 2,065.36 2,044.69 2,080.44 2,037.67
Mason Co.Southside (12.39) (5.78%) (0.46%) (2.36%) 202.11 214.50 215.50 220.70 Grapeview (9.82) (4.51%) (1.22%) 1.12% 208.15 217.97 220.67 218.22 Shelton 117.99 2.60% 1.13% 1.04% 4,662.63 4,544.64 4,493.87 4,447.70 Mary M. Knight 15.96 0.93% 52.03% 95.26% 1,738.24 1,722.28 1,132.89 580.20 Pioneer 1.05 0.14% (0.81%) 5.96% 772.01 770.96 777.28 733.55 North Mason 65.75 2.83% 3.55% 2.37% 2,387.96 2,322.21 2,242.52 2,190.63 Hood Canal 16.70 5.52% (2.77%) (2.24%) 319.46 302.76 311.38 318.52 County Total 195.24 1.93% 7.46% 7.86% 10,290.56 10,095.32 9,394.11 8,709.52
216
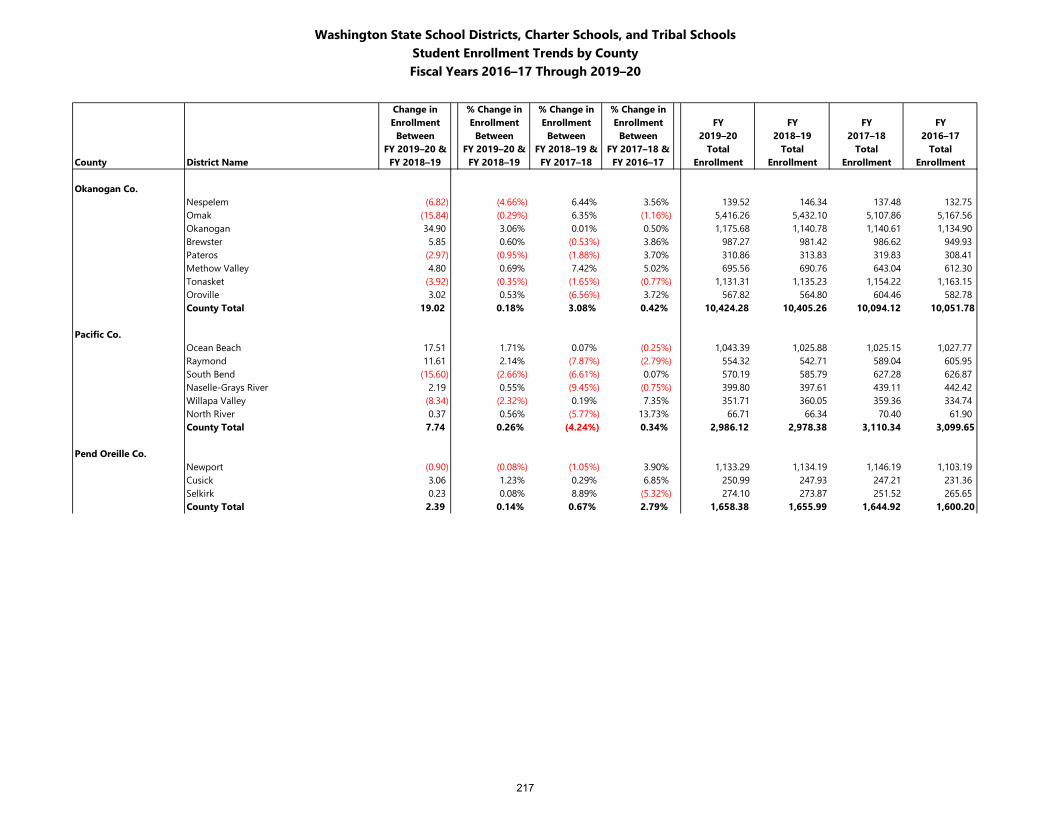
Washington State School Districts, Charter Schools, and Tribal SchoolsStudent Enrollment Trends by CountyFiscal Years 2016–17 Through 2019–20
Change in % Change in % Change in % Change inEnrollment Enrollment Enrollment Enrollment FY FY FY FY
Between Between Between Between 2019–20 2018–19 2017–18 2016–17FY 2019–20 & FY 2019–20 & FY 2018–19 & FY 2017–18 & Total Total Total Total
County District Name FY 2018–19 FY 2018–19 FY 2017–18 FY 2016–17 Enrollment Enrollment Enrollment Enrollment
Okanogan Co.Nespelem (6.82) (4.66%) 6.44% 3.56% 139.52 146.34 137.48 132.75 Omak (15.84) (0.29%) 6.35% (1.16%) 5,416.26 5,432.10 5,107.86 5,167.56 Okanogan 34.90 3.06% 0.01% 0.50% 1,175.68 1,140.78 1,140.61 1,134.90 Brewster 5.85 0.60% (0.53%) 3.86% 987.27 981.42 986.62 949.93 Pateros (2.97) (0.95%) (1.88%) 3.70% 310.86 313.83 319.83 308.41 Methow Valley 4.80 0.69% 7.42% 5.02% 695.56 690.76 643.04 612.30 Tonasket (3.92) (0.35%) (1.65%) (0.77%) 1,131.31 1,135.23 1,154.22 1,163.15 Oroville 3.02 0.53% (6.56%) 3.72% 567.82 564.80 604.46 582.78 County Total 19.02 0.18% 3.08% 0.42% 10,424.28 10,405.26 10,094.12 10,051.78
Pacific Co.Ocean Beach 17.51 1.71% 0.07% (0.25%) 1,043.39 1,025.88 1,025.15 1,027.77 Raymond 11.61 2.14% (7.87%) (2.79%) 554.32 542.71 589.04 605.95 South Bend (15.60) (2.66%) (6.61%) 0.07% 570.19 585.79 627.28 626.87 Naselle-Grays River 2.19 0.55% (9.45%) (0.75%) 399.80 397.61 439.11 442.42 Willapa Valley (8.34) (2.32%) 0.19% 7.35% 351.71 360.05 359.36 334.74 North River 0.37 0.56% (5.77%) 13.73% 66.71 66.34 70.40 61.90 County Total 7.74 0.26% (4.24%) 0.34% 2,986.12 2,978.38 3,110.34 3,099.65
Pend Oreille Co.Newport (0.90) (0.08%) (1.05%) 3.90% 1,133.29 1,134.19 1,146.19 1,103.19 Cusick 3.06 1.23% 0.29% 6.85% 250.99 247.93 247.21 231.36 Selkirk 0.23 0.08% 8.89% (5.32%) 274.10 273.87 251.52 265.65 County Total 2.39 0.14% 0.67% 2.79% 1,658.38 1,655.99 1,644.92 1,600.20
217
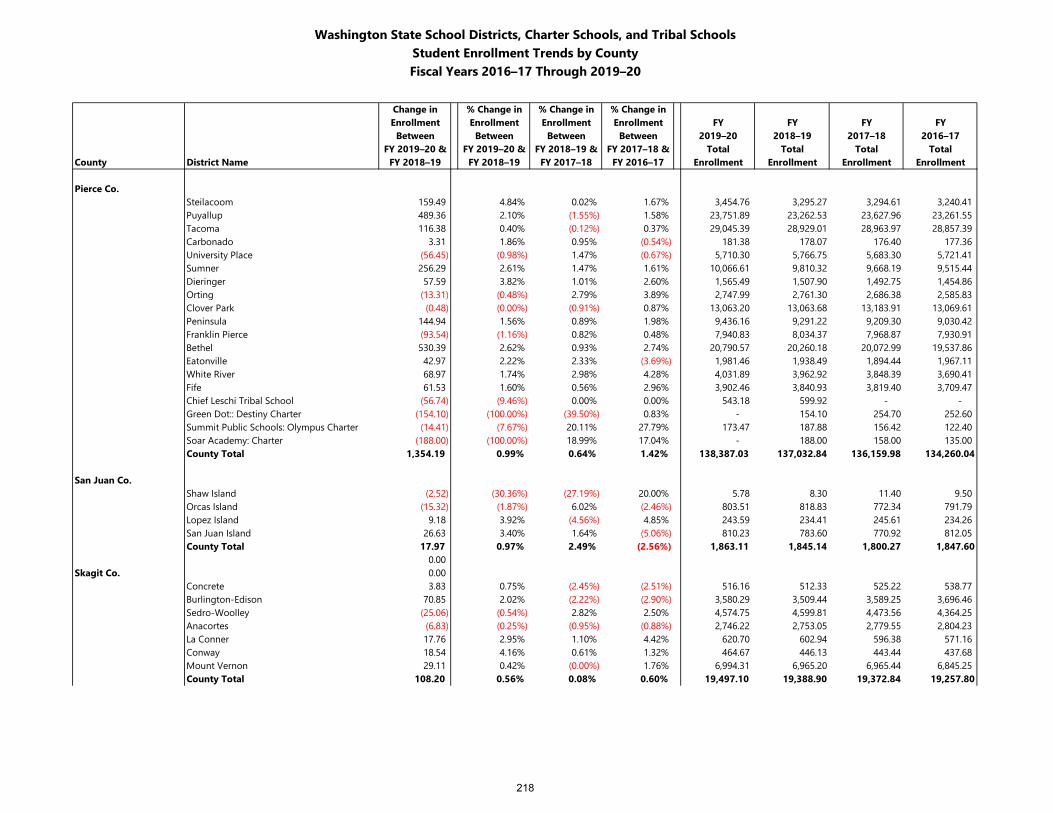
Washington State School Districts, Charter Schools, and Tribal SchoolsStudent Enrollment Trends by CountyFiscal Years 2016–17 Through 2019–20
Change in % Change in % Change in % Change inEnrollment Enrollment Enrollment Enrollment FY FY FY FY
Between Between Between Between 2019–20 2018–19 2017–18 2016–17FY 2019–20 & FY 2019–20 & FY 2018–19 & FY 2017–18 & Total Total Total Total
County District Name FY 2018–19 FY 2018–19 FY 2017–18 FY 2016–17 Enrollment Enrollment Enrollment Enrollment
Pierce Co.Steilacoom 159.49 4.84% 0.02% 1.67% 3,454.76 3,295.27 3,294.61 3,240.41 Puyallup 489.36 2.10% (1.55%) 1.58% 23,751.89 23,262.53 23,627.96 23,261.55 Tacoma 116.38 0.40% (0.12%) 0.37% 29,045.39 28,929.01 28,963.97 28,857.39 Carbonado 3.31 1.86% 0.95% (0.54%) 181.38 178.07 176.40 177.36 University Place (56.45) (0.98%) 1.47% (0.67%) 5,710.30 5,766.75 5,683.30 5,721.41 Sumner 256.29 2.61% 1.47% 1.61% 10,066.61 9,810.32 9,668.19 9,515.44 Dieringer 57.59 3.82% 1.01% 2.60% 1,565.49 1,507.90 1,492.75 1,454.86 Orting (13.31) (0.48%) 2.79% 3.89% 2,747.99 2,761.30 2,686.38 2,585.83 Clover Park (0.48) (0.00%) (0.91%) 0.87% 13,063.20 13,063.68 13,183.91 13,069.61 Peninsula 144.94 1.56% 0.89% 1.98% 9,436.16 9,291.22 9,209.30 9,030.42 Franklin Pierce (93.54) (1.16%) 0.82% 0.48% 7,940.83 8,034.37 7,968.87 7,930.91 Bethel 530.39 2.62% 0.93% 2.74% 20,790.57 20,260.18 20,072.99 19,537.86 Eatonville 42.97 2.22% 2.33% (3.69%) 1,981.46 1,938.49 1,894.44 1,967.11 White River 68.97 1.74% 2.98% 4.28% 4,031.89 3,962.92 3,848.39 3,690.41 Fife 61.53 1.60% 0.56% 2.96% 3,902.46 3,840.93 3,819.40 3,709.47 Chief Leschi Tribal School (56.74) (9.46%) 0.00% 0.00% 543.18 599.92 - - Green Dot:: Destiny Charter (154.10) (100.00%) (39.50%) 0.83% - 154.10 254.70 252.60 Summit Public Schools: Olympus Charter (14.41) (7.67%) 20.11% 27.79% 173.47 187.88 156.42 122.40 Soar Academy: Charter (188.00) (100.00%) 18.99% 17.04% - 188.00 158.00 135.00 County Total 1,354.19 0.99% 0.64% 1.42% 138,387.03 137,032.84 136,159.98 134,260.04
San Juan Co.Shaw Island (2.52) (30.36%) (27.19%) 20.00% 5.78 8.30 11.40 9.50 Orcas Island (15.32) (1.87%) 6.02% (2.46%) 803.51 818.83 772.34 791.79 Lopez Island 9.18 3.92% (4.56%) 4.85% 243.59 234.41 245.61 234.26 San Juan Island 26.63 3.40% 1.64% (5.06%) 810.23 783.60 770.92 812.05 County Total 17.97 0.97% 2.49% (2.56%) 1,863.11 1,845.14 1,800.27 1,847.60
0.00Skagit Co. 0.00
Concrete 3.83 0.75% (2.45%) (2.51%) 516.16 512.33 525.22 538.77 Burlington-Edison 70.85 2.02% (2.22%) (2.90%) 3,580.29 3,509.44 3,589.25 3,696.46 Sedro-Woolley (25.06) (0.54%) 2.82% 2.50% 4,574.75 4,599.81 4,473.56 4,364.25 Anacortes (6.83) (0.25%) (0.95%) (0.88%) 2,746.22 2,753.05 2,779.55 2,804.23 La Conner 17.76 2.95% 1.10% 4.42% 620.70 602.94 596.38 571.16 Conway 18.54 4.16% 0.61% 1.32% 464.67 446.13 443.44 437.68 Mount Vernon 29.11 0.42% (0.00%) 1.76% 6,994.31 6,965.20 6,965.44 6,845.25 County Total 108.20 0.56% 0.08% 0.60% 19,497.10 19,388.90 19,372.84 19,257.80
218
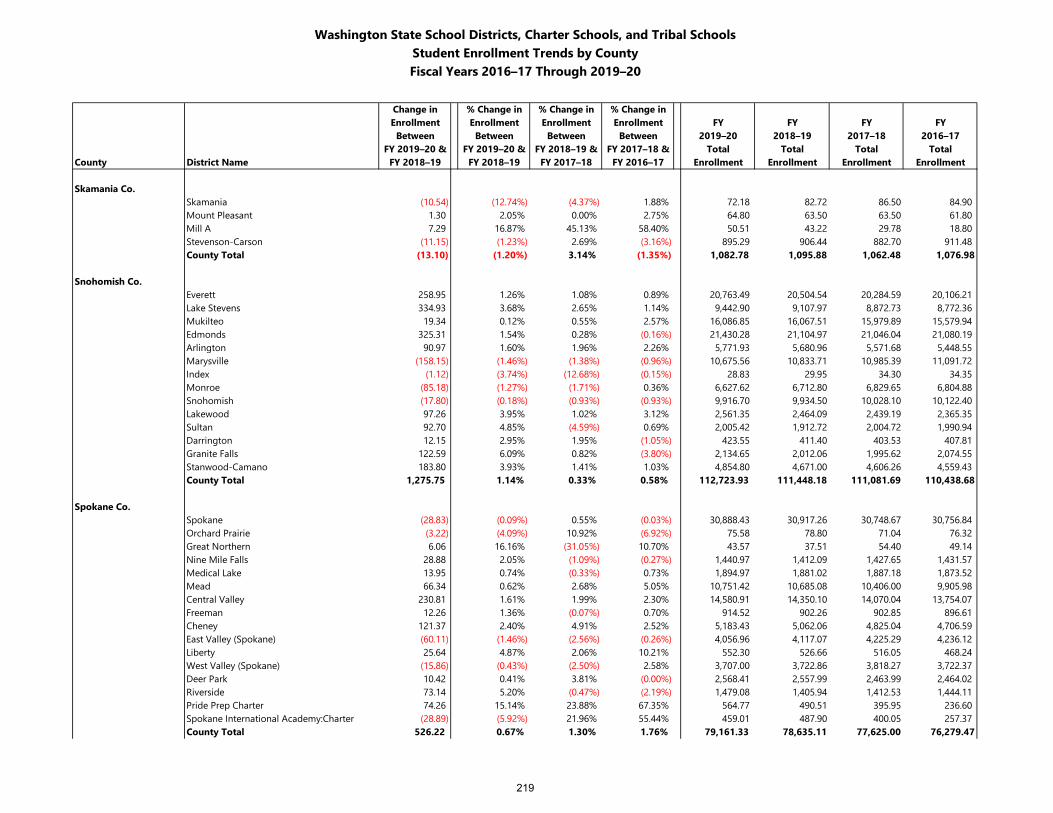
Washington State School Districts, Charter Schools, and Tribal SchoolsStudent Enrollment Trends by CountyFiscal Years 2016–17 Through 2019–20
Change in % Change in % Change in % Change inEnrollment Enrollment Enrollment Enrollment FY FY FY FY
Between Between Between Between 2019–20 2018–19 2017–18 2016–17FY 2019–20 & FY 2019–20 & FY 2018–19 & FY 2017–18 & Total Total Total Total
County District Name FY 2018–19 FY 2018–19 FY 2017–18 FY 2016–17 Enrollment Enrollment Enrollment Enrollment
Skamania Co.Skamania (10.54) (12.74%) (4.37%) 1.88% 72.18 82.72 86.50 84.90 Mount Pleasant 1.30 2.05% 0.00% 2.75% 64.80 63.50 63.50 61.80 Mill A 7.29 16.87% 45.13% 58.40% 50.51 43.22 29.78 18.80 Stevenson-Carson (11.15) (1.23%) 2.69% (3.16%) 895.29 906.44 882.70 911.48 County Total (13.10) (1.20%) 3.14% (1.35%) 1,082.78 1,095.88 1,062.48 1,076.98
Snohomish Co.Everett 258.95 1.26% 1.08% 0.89% 20,763.49 20,504.54 20,284.59 20,106.21 Lake Stevens 334.93 3.68% 2.65% 1.14% 9,442.90 9,107.97 8,872.73 8,772.36 Mukilteo 19.34 0.12% 0.55% 2.57% 16,086.85 16,067.51 15,979.89 15,579.94 Edmonds 325.31 1.54% 0.28% (0.16%) 21,430.28 21,104.97 21,046.04 21,080.19 Arlington 90.97 1.60% 1.96% 2.26% 5,771.93 5,680.96 5,571.68 5,448.55 Marysville (158.15) (1.46%) (1.38%) (0.96%) 10,675.56 10,833.71 10,985.39 11,091.72 Index (1.12) (3.74%) (12.68%) (0.15%) 28.83 29.95 34.30 34.35 Monroe (85.18) (1.27%) (1.71%) 0.36% 6,627.62 6,712.80 6,829.65 6,804.88 Snohomish (17.80) (0.18%) (0.93%) (0.93%) 9,916.70 9,934.50 10,028.10 10,122.40 Lakewood 97.26 3.95% 1.02% 3.12% 2,561.35 2,464.09 2,439.19 2,365.35 Sultan 92.70 4.85% (4.59%) 0.69% 2,005.42 1,912.72 2,004.72 1,990.94 Darrington 12.15 2.95% 1.95% (1.05%) 423.55 411.40 403.53 407.81 Granite Falls 122.59 6.09% 0.82% (3.80%) 2,134.65 2,012.06 1,995.62 2,074.55 Stanwood-Camano 183.80 3.93% 1.41% 1.03% 4,854.80 4,671.00 4,606.26 4,559.43 County Total 1,275.75 1.14% 0.33% 0.58% 112,723.93 111,448.18 111,081.69 110,438.68
Spokane Co.Spokane (28.83) (0.09%) 0.55% (0.03%) 30,888.43 30,917.26 30,748.67 30,756.84 Orchard Prairie (3.22) (4.09%) 10.92% (6.92%) 75.58 78.80 71.04 76.32 Great Northern 6.06 16.16% (31.05%) 10.70% 43.57 37.51 54.40 49.14 Nine Mile Falls 28.88 2.05% (1.09%) (0.27%) 1,440.97 1,412.09 1,427.65 1,431.57 Medical Lake 13.95 0.74% (0.33%) 0.73% 1,894.97 1,881.02 1,887.18 1,873.52 Mead 66.34 0.62% 2.68% 5.05% 10,751.42 10,685.08 10,406.00 9,905.98 Central Valley 230.81 1.61% 1.99% 2.30% 14,580.91 14,350.10 14,070.04 13,754.07 Freeman 12.26 1.36% (0.07%) 0.70% 914.52 902.26 902.85 896.61 Cheney 121.37 2.40% 4.91% 2.52% 5,183.43 5,062.06 4,825.04 4,706.59 East Valley (Spokane) (60.11) (1.46%) (2.56%) (0.26%) 4,056.96 4,117.07 4,225.29 4,236.12 Liberty 25.64 4.87% 2.06% 10.21% 552.30 526.66 516.05 468.24 West Valley (Spokane) (15.86) (0.43%) (2.50%) 2.58% 3,707.00 3,722.86 3,818.27 3,722.37 Deer Park 10.42 0.41% 3.81% (0.00%) 2,568.41 2,557.99 2,463.99 2,464.02 Riverside 73.14 5.20% (0.47%) (2.19%) 1,479.08 1,405.94 1,412.53 1,444.11 Pride Prep Charter 74.26 15.14% 23.88% 67.35% 564.77 490.51 395.95 236.60 Spokane International Academy:Charter (28.89) (5.92%) 21.96% 55.44% 459.01 487.90 400.05 257.37 County Total 526.22 0.67% 1.30% 1.76% 79,161.33 78,635.11 77,625.00 76,279.47
219
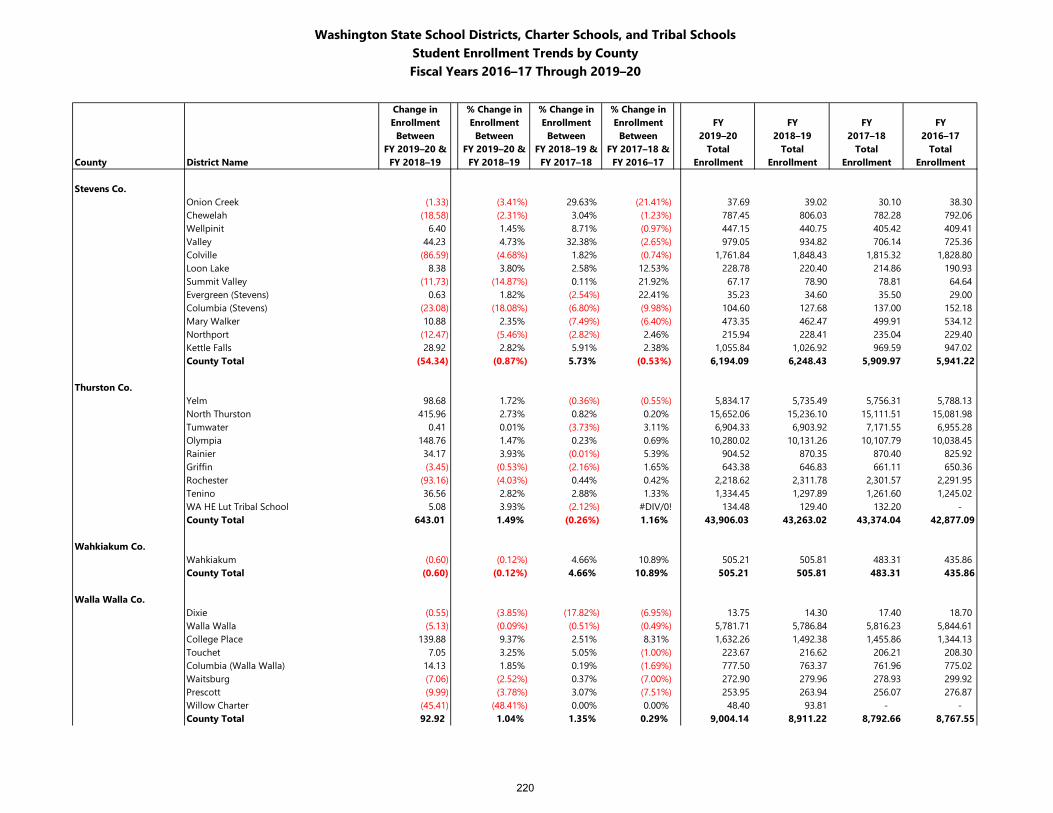
Washington State School Districts, Charter Schools, and Tribal SchoolsStudent Enrollment Trends by CountyFiscal Years 2016–17 Through 2019–20
Change in % Change in % Change in % Change inEnrollment Enrollment Enrollment Enrollment FY FY FY FY
Between Between Between Between 2019–20 2018–19 2017–18 2016–17FY 2019–20 & FY 2019–20 & FY 2018–19 & FY 2017–18 & Total Total Total Total
County District Name FY 2018–19 FY 2018–19 FY 2017–18 FY 2016–17 Enrollment Enrollment Enrollment Enrollment
Stevens Co.Onion Creek (1.33) (3.41%) 29.63% (21.41%) 37.69 39.02 30.10 38.30 Chewelah (18.58) (2.31%) 3.04% (1.23%) 787.45 806.03 782.28 792.06 Wellpinit 6.40 1.45% 8.71% (0.97%) 447.15 440.75 405.42 409.41 Valley 44.23 4.73% 32.38% (2.65%) 979.05 934.82 706.14 725.36 Colville (86.59) (4.68%) 1.82% (0.74%) 1,761.84 1,848.43 1,815.32 1,828.80 Loon Lake 8.38 3.80% 2.58% 12.53% 228.78 220.40 214.86 190.93 Summit Valley (11.73) (14.87%) 0.11% 21.92% 67.17 78.90 78.81 64.64 Evergreen (Stevens) 0.63 1.82% (2.54%) 22.41% 35.23 34.60 35.50 29.00 Columbia (Stevens) (23.08) (18.08%) (6.80%) (9.98%) 104.60 127.68 137.00 152.18 Mary Walker 10.88 2.35% (7.49%) (6.40%) 473.35 462.47 499.91 534.12 Northport (12.47) (5.46%) (2.82%) 2.46% 215.94 228.41 235.04 229.40 Kettle Falls 28.92 2.82% 5.91% 2.38% 1,055.84 1,026.92 969.59 947.02 County Total (54.34) (0.87%) 5.73% (0.53%) 6,194.09 6,248.43 5,909.97 5,941.22
Thurston Co.Yelm 98.68 1.72% (0.36%) (0.55%) 5,834.17 5,735.49 5,756.31 5,788.13 North Thurston 415.96 2.73% 0.82% 0.20% 15,652.06 15,236.10 15,111.51 15,081.98 Tumwater 0.41 0.01% (3.73%) 3.11% 6,904.33 6,903.92 7,171.55 6,955.28 Olympia 148.76 1.47% 0.23% 0.69% 10,280.02 10,131.26 10,107.79 10,038.45 Rainier 34.17 3.93% (0.01%) 5.39% 904.52 870.35 870.40 825.92 Griffin (3.45) (0.53%) (2.16%) 1.65% 643.38 646.83 661.11 650.36 Rochester (93.16) (4.03%) 0.44% 0.42% 2,218.62 2,311.78 2,301.57 2,291.95 Tenino 36.56 2.82% 2.88% 1.33% 1,334.45 1,297.89 1,261.60 1,245.02 WA HE Lut Tribal School 5.08 3.93% (2.12%) #DIV/0! 134.48 129.40 132.20 - County Total 643.01 1.49% (0.26%) 1.16% 43,906.03 43,263.02 43,374.04 42,877.09
Wahkiakum Co.Wahkiakum (0.60) (0.12%) 4.66% 10.89% 505.21 505.81 483.31 435.86 County Total (0.60) (0.12%) 4.66% 10.89% 505.21 505.81 483.31 435.86
Walla Walla Co.Dixie (0.55) (3.85%) (17.82%) (6.95%) 13.75 14.30 17.40 18.70 Walla Walla (5.13) (0.09%) (0.51%) (0.49%) 5,781.71 5,786.84 5,816.23 5,844.61 College Place 139.88 9.37% 2.51% 8.31% 1,632.26 1,492.38 1,455.86 1,344.13 Touchet 7.05 3.25% 5.05% (1.00%) 223.67 216.62 206.21 208.30 Columbia (Walla Walla) 14.13 1.85% 0.19% (1.69%) 777.50 763.37 761.96 775.02 Waitsburg (7.06) (2.52%) 0.37% (7.00%) 272.90 279.96 278.93 299.92 Prescott (9.99) (3.78%) 3.07% (7.51%) 253.95 263.94 256.07 276.87 Willow Charter (45.41) (48.41%) 0.00% 0.00% 48.40 93.81 - - County Total 92.92 1.04% 1.35% 0.29% 9,004.14 8,911.22 8,792.66 8,767.55
220
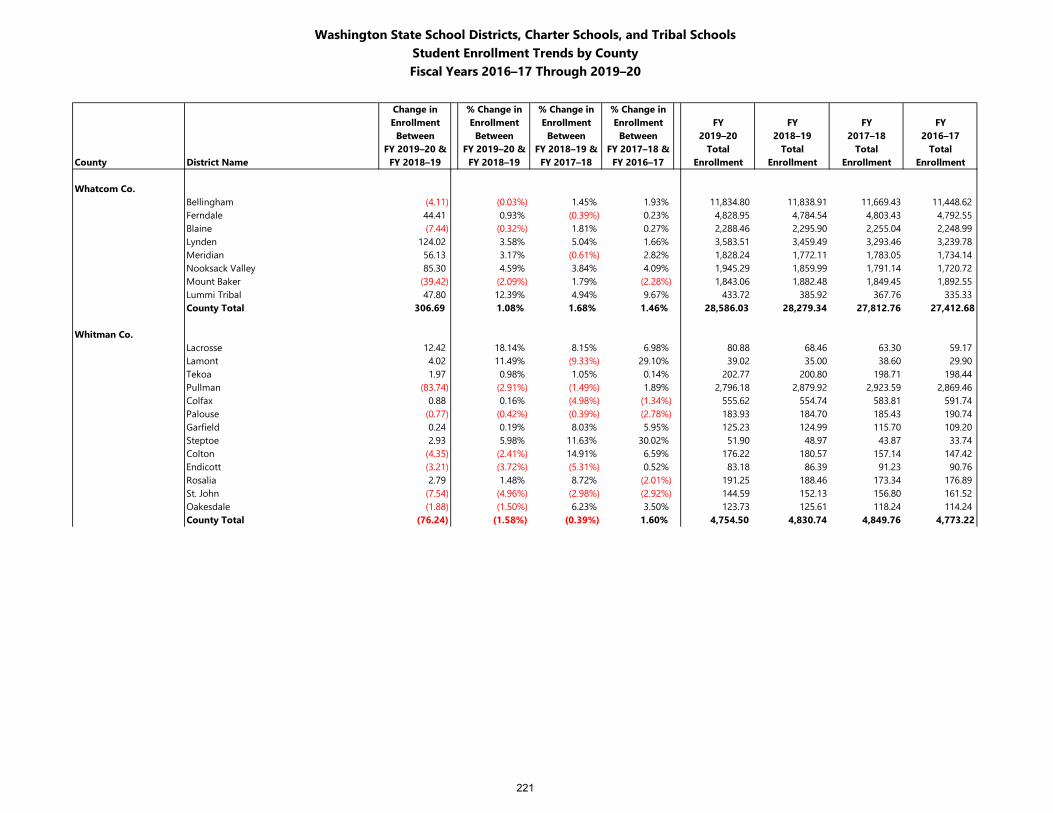
Washington State School Districts, Charter Schools, and Tribal SchoolsStudent Enrollment Trends by CountyFiscal Years 2016–17 Through 2019–20
Change in % Change in % Change in % Change inEnrollment Enrollment Enrollment Enrollment FY FY FY FY
Between Between Between Between 2019–20 2018–19 2017–18 2016–17FY 2019–20 & FY 2019–20 & FY 2018–19 & FY 2017–18 & Total Total Total Total
County District Name FY 2018–19 FY 2018–19 FY 2017–18 FY 2016–17 Enrollment Enrollment Enrollment Enrollment
Whatcom Co.Bellingham (4.11) (0.03%) 1.45% 1.93% 11,834.80 11,838.91 11,669.43 11,448.62 Ferndale 44.41 0.93% (0.39%) 0.23% 4,828.95 4,784.54 4,803.43 4,792.55 Blaine (7.44) (0.32%) 1.81% 0.27% 2,288.46 2,295.90 2,255.04 2,248.99 Lynden 124.02 3.58% 5.04% 1.66% 3,583.51 3,459.49 3,293.46 3,239.78 Meridian 56.13 3.17% (0.61%) 2.82% 1,828.24 1,772.11 1,783.05 1,734.14 Nooksack Valley 85.30 4.59% 3.84% 4.09% 1,945.29 1,859.99 1,791.14 1,720.72 Mount Baker (39.42) (2.09%) 1.79% (2.28%) 1,843.06 1,882.48 1,849.45 1,892.55 Lummi Tribal 47.80 12.39% 4.94% 9.67% 433.72 385.92 367.76 335.33 County Total 306.69 1.08% 1.68% 1.46% 28,586.03 28,279.34 27,812.76 27,412.68
Whitman Co.Lacrosse 12.42 18.14% 8.15% 6.98% 80.88 68.46 63.30 59.17 Lamont 4.02 11.49% (9.33%) 29.10% 39.02 35.00 38.60 29.90 Tekoa 1.97 0.98% 1.05% 0.14% 202.77 200.80 198.71 198.44 Pullman (83.74) (2.91%) (1.49%) 1.89% 2,796.18 2,879.92 2,923.59 2,869.46 Colfax 0.88 0.16% (4.98%) (1.34%) 555.62 554.74 583.81 591.74 Palouse (0.77) (0.42%) (0.39%) (2.78%) 183.93 184.70 185.43 190.74 Garfield 0.24 0.19% 8.03% 5.95% 125.23 124.99 115.70 109.20 Steptoe 2.93 5.98% 11.63% 30.02% 51.90 48.97 43.87 33.74 Colton (4.35) (2.41%) 14.91% 6.59% 176.22 180.57 157.14 147.42 Endicott (3.21) (3.72%) (5.31%) 0.52% 83.18 86.39 91.23 90.76 Rosalia 2.79 1.48% 8.72% (2.01%) 191.25 188.46 173.34 176.89 St. John (7.54) (4.96%) (2.98%) (2.92%) 144.59 152.13 156.80 161.52 Oakesdale (1.88) (1.50%) 6.23% 3.50% 123.73 125.61 118.24 114.24 County Total (76.24) (1.58%) (0.39%) 1.60% 4,754.50 4,830.74 4,849.76 4,773.22
221
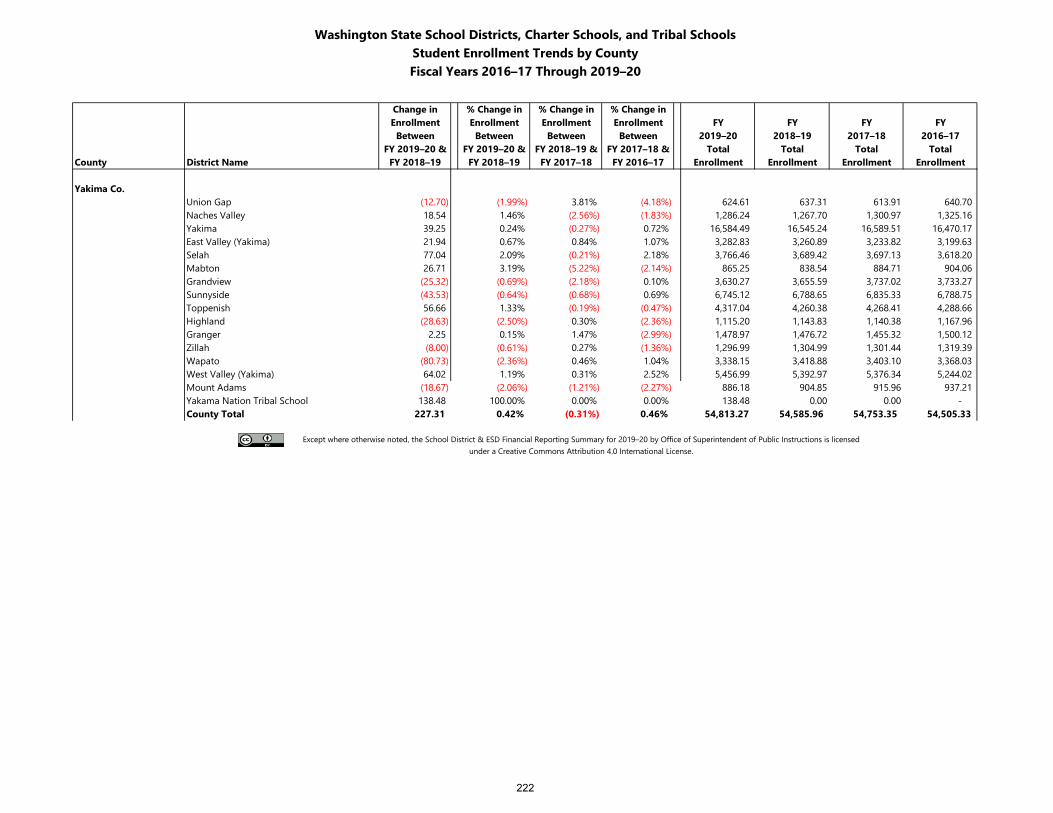
Washington State School Districts, Charter Schools, and Tribal SchoolsStudent Enrollment Trends by CountyFiscal Years 2016–17 Through 2019–20
Change in % Change in % Change in % Change inEnrollment Enrollment Enrollment Enrollment FY FY FY FY
Between Between Between Between 2019–20 2018–19 2017–18 2016–17FY 2019–20 & FY 2019–20 & FY 2018–19 & FY 2017–18 & Total Total Total Total
County District Name FY 2018–19 FY 2018–19 FY 2017–18 FY 2016–17 Enrollment Enrollment Enrollment Enrollment
Yakima Co.Union Gap (12.70) (1.99%) 3.81% (4.18%) 624.61 637.31 613.91 640.70 Naches Valley 18.54 1.46% (2.56%) (1.83%) 1,286.24 1,267.70 1,300.97 1,325.16 Yakima 39.25 0.24% (0.27%) 0.72% 16,584.49 16,545.24 16,589.51 16,470.17 East Valley (Yakima) 21.94 0.67% 0.84% 1.07% 3,282.83 3,260.89 3,233.82 3,199.63 Selah 77.04 2.09% (0.21%) 2.18% 3,766.46 3,689.42 3,697.13 3,618.20 Mabton 26.71 3.19% (5.22%) (2.14%) 865.25 838.54 884.71 904.06 Grandview (25.32) (0.69%) (2.18%) 0.10% 3,630.27 3,655.59 3,737.02 3,733.27 Sunnyside (43.53) (0.64%) (0.68%) 0.69% 6,745.12 6,788.65 6,835.33 6,788.75 Toppenish 56.66 1.33% (0.19%) (0.47%) 4,317.04 4,260.38 4,268.41 4,288.66 Highland (28.63) (2.50%) 0.30% (2.36%) 1,115.20 1,143.83 1,140.38 1,167.96 Granger 2.25 0.15% 1.47% (2.99%) 1,478.97 1,476.72 1,455.32 1,500.12 Zillah (8.00) (0.61%) 0.27% (1.36%) 1,296.99 1,304.99 1,301.44 1,319.39 Wapato (80.73) (2.36%) 0.46% 1.04% 3,338.15 3,418.88 3,403.10 3,368.03 West Valley (Yakima) 64.02 1.19% 0.31% 2.52% 5,456.99 5,392.97 5,376.34 5,244.02 Mount Adams (18.67) (2.06%) (1.21%) (2.27%) 886.18 904.85 915.96 937.21 Yakama Nation Tribal School 138.48 100.00% 0.00% 0.00% 138.48 0.00 0.00 - County Total 227.31 0.42% (0.31%) 0.46% 54,813.27 54,585.96 54,753.35 54,505.33
Except where otherwise noted, the School District & ESD Financial Reporting Summary for 2019–20 by Office of Superintendent of Public Instructions is licensed under a Creative Commons Attribution 4.0 International License.
222
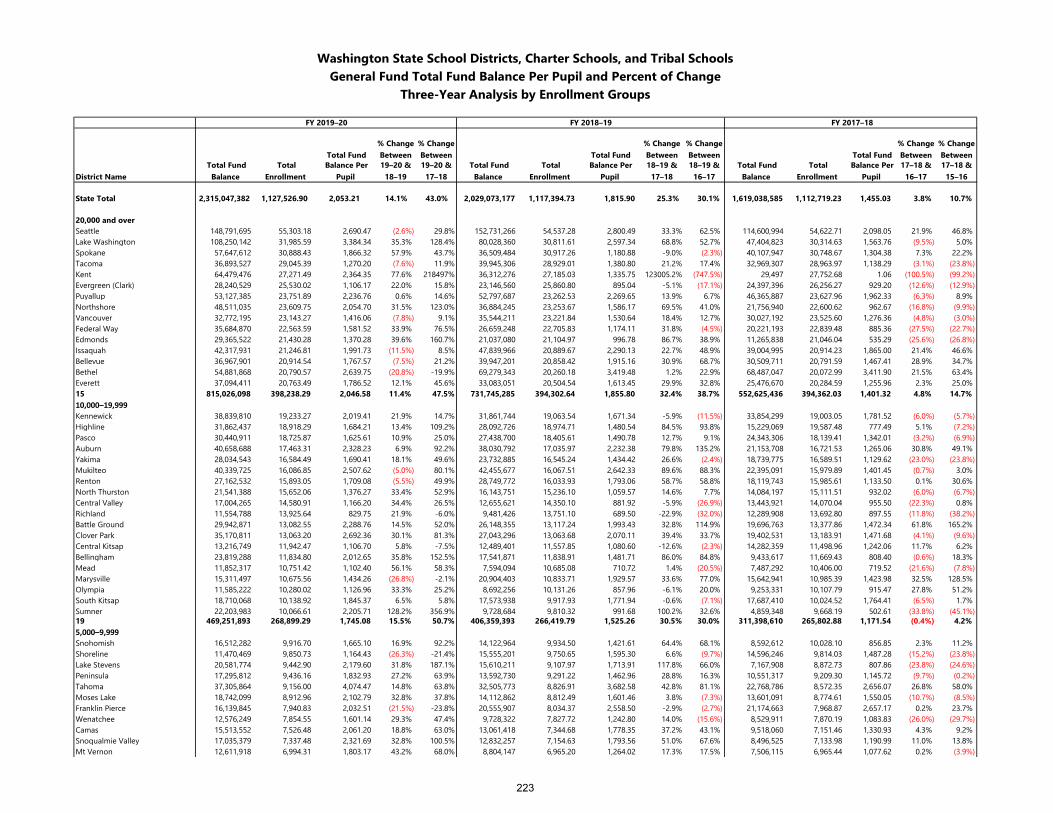
Washington State School Districts, Charter Schools, and Tribal SchoolsGeneral Fund Total Fund Balance Per Pupil and Percent of Change
Three-Year Analysis by Enrollment Groups
FY 2019–20 FY 2018–19 FY 2017–18
Total Fund % Change Between
% Change Between Total Fund
% Change Between
% Change Between Total Fund
% Change Between
% Change Between
District Name Total Fund
Balance Total
Enrollment Balance Per
Pupil 19–20 &
18–1919–20 &
17–18 Total Fund
Balance Total
Enrollment Balance Per
Pupil 18–19 &
17–1818–19 &
16–17 Total Fund
Balance Total
Enrollment Balance Per
Pupil 17–18 &
16–1717–18 &
15–16
State Total 2,315,047,382 1,127,526.90 2,053.21 14.1% 43.0% 2,029,073,177 1,117,394.73 1,815.90 25.3% 30.1% 1,619,038,585 1,112,719.23 1,455.03 3.8% 10.7%
20,000 and overSeattle 148,791,695 55,303.18 2,690.47 (2.6%) 29.8% 152,731,266 54,537.28 2,800.49 33.3% 62.5% 114,600,994 54,622.71 2,098.05 21.9% 46.8%Lake Washington 108,250,142 31,985.59 3,384.34 35.3% 128.4% 80,028,360 30,811.61 2,597.34 68.8% 52.7% 47,404,823 30,314.63 1,563.76 (9.5%) 5.0%Spokane 57,647,612 30,888.43 1,866.32 57.9% 43.7% 36,509,484 30,917.26 1,180.88 -9.0% (2.3%) 40,107,947 30,748.67 1,304.38 7.3% 22.2%Tacoma 36,893,527 29,045.39 1,270.20 (7.6%) 11.9% 39,945,306 28,929.01 1,380.80 21.2% 17.4% 32,969,307 28,963.97 1,138.29 (3.1%) (23.8%) Kent 64,479,476 27,271.49 2,364.35 77.6% 218497% 36,312,276 27,185.03 1,335.75 123005.2% (747.5%) 29,497 27,752.68 1.06 (100.5%) (99.2%) Evergreen (Clark) 28,240,529 25,530.02 1,106.17 22.0% 15.8% 23,146,560 25,860.80 895.04 -5.1% (17.1%) 24,397,396 26,256.27 929.20 (12.6%) (12.9%) Puyallup 53,127,385 23,751.89 2,236.76 0.6% 14.6% 52,797,687 23,262.53 2,269.65 13.9% 6.7% 46,365,887 23,627.96 1,962.33 (6.3%) 8.9%Northshore 48,511,035 23,609.75 2,054.70 31.5% 123.0% 36,884,245 23,253.67 1,586.17 69.5% 41.0% 21,756,940 22,600.62 962.67 (16.8%) (9.9%) Vancouver 32,772,195 23,143.27 1,416.06 (7.8%) 9.1% 35,544,211 23,221.84 1,530.64 18.4% 12.7% 30,027,192 23,525.60 1,276.36 (4.8%) (3.0%) Federal Way 35,684,870 22,563.59 1,581.52 33.9% 76.5% 26,659,248 22,705.83 1,174.11 31.8% (4.5%) 20,221,193 22,839.48 885.36 (27.5%) (22.7%) Edmonds 29,365,522 21,430.28 1,370.28 39.6% 160.7% 21,037,080 21,104.97 996.78 86.7% 38.9% 11,265,838 21,046.04 535.29 (25.6%) (26.8%) Issaquah 42,317,931 21,246.81 1,991.73 (11.5%) 8.5% 47,839,966 20,889.67 2,290.13 22.7% 48.9% 39,004,995 20,914.23 1,865.00 21.4% 46.6%Bellevue 36,967,901 20,914.54 1,767.57 (7.5%) 21.2% 39,947,201 20,858.42 1,915.16 30.9% 68.7% 30,509,711 20,791.59 1,467.41 28.9% 34.7%Bethel 54,881,868 20,790.57 2,639.75 (20.8%) -19.9% 69,279,343 20,260.18 3,419.48 1.2% 22.9% 68,487,047 20,072.99 3,411.90 21.5% 63.4%Everett 37,094,411 20,763.49 1,786.52 12.1% 45.6% 33,083,051 20,504.54 1,613.45 29.9% 32.8% 25,476,670 20,284.59 1,255.96 2.3% 25.0%15 815,026,098 398,238.29 2,046.58 11.4% 47.5% 731,745,285 394,302.64 1,855.80 32.4% 38.7% 552,625,436 394,362.03 1,401.32 4.8% 14.7%10,000–19,999Kennewick 38,839,810 19,233.27 2,019.41 21.9% 14.7% 31,861,744 19,063.54 1,671.34 -5.9% (11.5%) 33,854,299 19,003.05 1,781.52 (6.0%) (5.7%) Highline 31,862,437 18,918.29 1,684.21 13.4% 109.2% 28,092,726 18,974.71 1,480.54 84.5% 93.8% 15,229,069 19,587.48 777.49 5.1% (7.2%) Pasco 30,440,911 18,725.87 1,625.61 10.9% 25.0% 27,438,700 18,405.61 1,490.78 12.7% 9.1% 24,343,306 18,139.41 1,342.01 (3.2%) (6.9%) Auburn 40,658,688 17,463.31 2,328.23 6.9% 92.2% 38,030,792 17,035.97 2,232.38 79.8% 135.2% 21,153,708 16,721.53 1,265.06 30.8% 49.1%Yakima 28,034,543 16,584.49 1,690.41 18.1% 49.6% 23,732,885 16,545.24 1,434.42 26.6% (2.4%) 18,739,775 16,589.51 1,129.62 (23.0%) (23.8%) Mukilteo 40,339,725 16,086.85 2,507.62 (5.0%) 80.1% 42,455,677 16,067.51 2,642.33 89.6% 88.3% 22,395,091 15,979.89 1,401.45 (0.7%) 3.0%Renton 27,162,532 15,893.05 1,709.08 (5.5%) 49.9% 28,749,772 16,033.93 1,793.06 58.7% 58.8% 18,119,743 15,985.61 1,133.50 0.1% 30.6%North Thurston 21,541,388 15,652.06 1,376.27 33.4% 52.9% 16,143,751 15,236.10 1,059.57 14.6% 7.7% 14,084,197 15,111.51 932.02 (6.0%) (6.7%) Central Valley 17,004,265 14,580.91 1,166.20 34.4% 26.5% 12,655,621 14,350.10 881.92 -5.9% (26.9%) 13,443,921 14,070.04 955.50 (22.3%) 0.8%Richland 11,554,788 13,925.64 829.75 21.9% -6.0% 9,481,426 13,751.10 689.50 -22.9% (32.0%) 12,289,908 13,692.80 897.55 (11.8%) (38.2%) Battle Ground 29,942,871 13,082.55 2,288.76 14.5% 52.0% 26,148,355 13,117.24 1,993.43 32.8% 114.9% 19,696,763 13,377.86 1,472.34 61.8% 165.2%Clover Park 35,170,811 13,063.20 2,692.36 30.1% 81.3% 27,043,296 13,063.68 2,070.11 39.4% 33.7% 19,402,531 13,183.91 1,471.68 (4.1%) (9.6%) Central Kitsap 13,216,749 11,942.47 1,106.70 5.8% -7.5% 12,489,401 11,557.85 1,080.60 -12.6% (2.3%) 14,282,359 11,498.96 1,242.06 11.7% 6.2%Bellingham 23,819,288 11,834.80 2,012.65 35.8% 152.5% 17,541,871 11,838.91 1,481.71 86.0% 84.8% 9,433,617 11,669.43 808.40 (0.6%) 18.3%Mead 11,852,317 10,751.42 1,102.40 56.1% 58.3% 7,594,094 10,685.08 710.72 1.4% (20.5%) 7,487,292 10,406.00 719.52 (21.6%) (7.8%) Marysville 15,311,497 10,675.56 1,434.26 (26.8%) -2.1% 20,904,403 10,833.71 1,929.57 33.6% 77.0% 15,642,941 10,985.39 1,423.98 32.5% 128.5%Olympia 11,585,222 10,280.02 1,126.96 33.3% 25.2% 8,692,256 10,131.26 857.96 -6.1% 20.0% 9,253,331 10,107.79 915.47 27.8% 51.2%South Kitsap 18,710,068 10,138.92 1,845.37 6.5% 5.8% 17,573,938 9,917.93 1,771.94 -0.6% (7.1%) 17,687,410 10,024.52 1,764.41 (6.5%) 1.7%Sumner 22,203,983 10,066.61 2,205.71 128.2% 356.9% 9,728,684 9,810.32 991.68 100.2% 32.6% 4,859,348 9,668.19 502.61 (33.8%) (45.1%) 19 469,251,893 268,899.29 1,745.08 15.5% 50.7% 406,359,393 266,419.79 1,525.26 30.5% 30.0% 311,398,610 265,802.88 1,171.54 (0.4%) 4.2%5,000–9,999Snohomish 16,512,282 9,916.70 1,665.10 16.9% 92.2% 14,122,964 9,934.50 1,421.61 64.4% 68.1% 8,592,612 10,028.10 856.85 2.3% 11.2%Shoreline 11,470,469 9,850.73 1,164.43 (26.3%) -21.4% 15,555,201 9,750.65 1,595.30 6.6% (9.7%) 14,596,246 9,814.03 1,487.28 (15.2%) (23.8%) Lake Stevens 20,581,774 9,442.90 2,179.60 31.8% 187.1% 15,610,211 9,107.97 1,713.91 117.8% 66.0% 7,167,908 8,872.73 807.86 (23.8%) (24.6%) Peninsula 17,295,812 9,436.16 1,832.93 27.2% 63.9% 13,592,730 9,291.22 1,462.96 28.8% 16.3% 10,551,317 9,209.30 1,145.72 (9.7%) (0.2%) Tahoma 37,305,864 9,156.00 4,074.47 14.8% 63.8% 32,505,773 8,826.91 3,682.58 42.8% 81.1% 22,768,786 8,572.35 2,656.07 26.8% 58.0%Moses Lake 18,742,099 8,912.96 2,102.79 32.8% 37.8% 14,112,862 8,812.49 1,601.46 3.8% (7.3%) 13,601,091 8,774.61 1,550.05 (10.7%) (8.5%) Franklin Pierce 16,139,845 7,940.83 2,032.51 (21.5%) -23.8% 20,555,907 8,034.37 2,558.50 -2.9% (2.7%) 21,174,663 7,968.87 2,657.17 0.2% 23.7%Wenatchee 12,576,249 7,854.55 1,601.14 29.3% 47.4% 9,728,322 7,827.72 1,242.80 14.0% (15.6%) 8,529,911 7,870.19 1,083.83 (26.0%) (29.7%) Camas 15,513,552 7,526.48 2,061.20 18.8% 63.0% 13,061,418 7,344.68 1,778.35 37.2% 43.1% 9,518,060 7,151.46 1,330.93 4.3% 9.2%Snoqualmie Valley 17,035,379 7,337.48 2,321.69 32.8% 100.5% 12,832,257 7,154.63 1,793.56 51.0% 67.6% 8,496,525 7,133.98 1,190.99 11.0% 13.8%Mt Vernon 12,611,918 6,994.31 1,803.17 43.2% 68.0% 8,804,147 6,965.20 1,264.02 17.3% 17.5% 7,506,115 6,965.44 1,077.62 0.2% (3.9%)
223
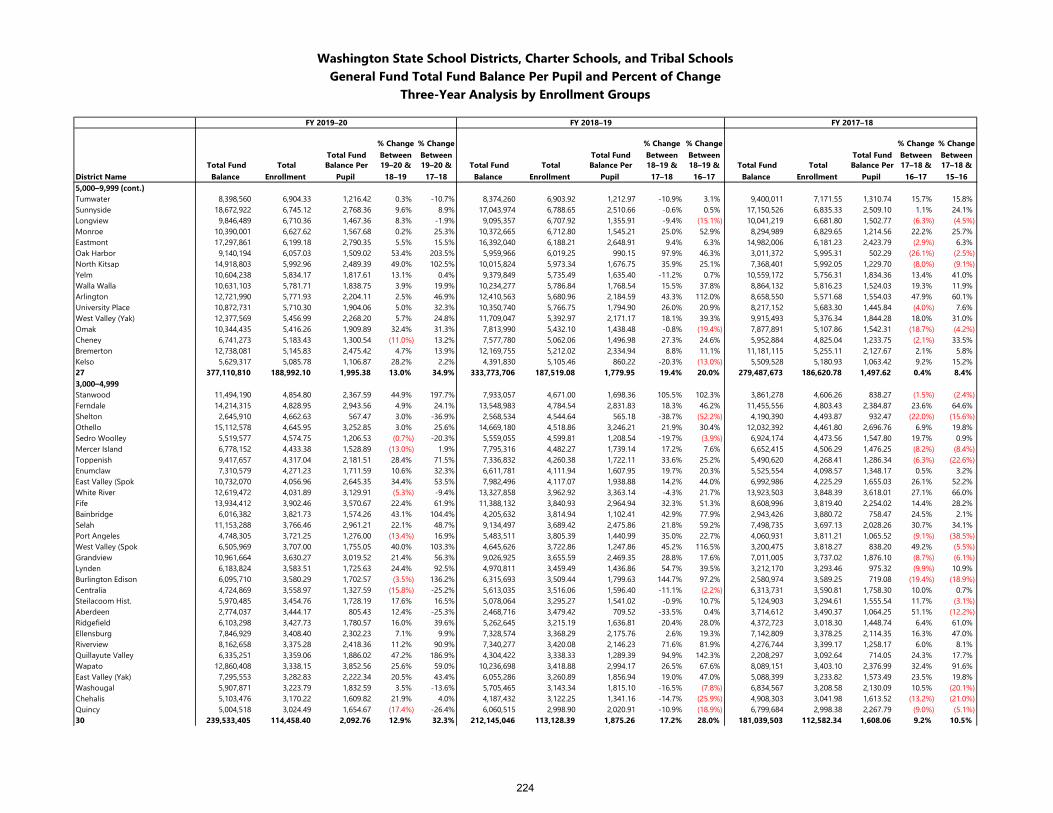
Washington State School Districts, Charter Schools, and Tribal SchoolsGeneral Fund Total Fund Balance Per Pupil and Percent of Change
Three-Year Analysis by Enrollment Groups
FY 2019–20 FY 2018–19 FY 2017–18
Total Fund % Change Between
% Change Between Total Fund
% Change Between
% Change Between Total Fund
% Change Between
% Change Between
District Name Total Fund
Balance Total
Enrollment Balance Per
Pupil 19–20 &
18–1919–20 &
17–18 Total Fund
Balance Total
Enrollment Balance Per
Pupil 18–19 &
17–1818–19 &
16–17 Total Fund
Balance Total
Enrollment Balance Per
Pupil 17–18 &
16–1717–18 &
15–165,000–9,999 (cont.)Tumwater 8,398,560 6,904.33 1,216.42 0.3% -10.7% 8,374,260 6,903.92 1,212.97 -10.9% 3.1% 9,400,011 7,171.55 1,310.74 15.7% 15.8%Sunnyside 18,672,922 6,745.12 2,768.36 9.6% 8.9% 17,043,974 6,788.65 2,510.66 -0.6% 0.5% 17,150,526 6,835.33 2,509.10 1.1% 24.1%Longview 9,846,489 6,710.36 1,467.36 8.3% -1.9% 9,095,357 6,707.92 1,355.91 -9.4% (15.1%) 10,041,219 6,681.80 1,502.77 (6.3%) (4.5%) Monroe 10,390,001 6,627.62 1,567.68 0.2% 25.3% 10,372,665 6,712.80 1,545.21 25.0% 52.9% 8,294,989 6,829.65 1,214.56 22.2% 25.7%Eastmont 17,297,861 6,199.18 2,790.35 5.5% 15.5% 16,392,040 6,188.21 2,648.91 9.4% 6.3% 14,982,006 6,181.23 2,423.79 (2.9%) 6.3%Oak Harbor 9,140,194 6,057.03 1,509.02 53.4% 203.5% 5,959,966 6,019.25 990.15 97.9% 46.3% 3,011,372 5,995.31 502.29 (26.1%) (2.5%) North Kitsap 14,918,803 5,992.96 2,489.39 49.0% 102.5% 10,015,824 5,973.34 1,676.75 35.9% 25.1% 7,368,401 5,992.05 1,229.70 (8.0%) (9.1%) Yelm 10,604,238 5,834.17 1,817.61 13.1% 0.4% 9,379,849 5,735.49 1,635.40 -11.2% 0.7% 10,559,172 5,756.31 1,834.36 13.4% 41.0%Walla Walla 10,631,103 5,781.71 1,838.75 3.9% 19.9% 10,234,277 5,786.84 1,768.54 15.5% 37.8% 8,864,132 5,816.23 1,524.03 19.3% 11.9%Arlington 12,721,990 5,771.93 2,204.11 2.5% 46.9% 12,410,563 5,680.96 2,184.59 43.3% 112.0% 8,658,550 5,571.68 1,554.03 47.9% 60.1%University Place 10,872,731 5,710.30 1,904.06 5.0% 32.3% 10,350,740 5,766.75 1,794.90 26.0% 20.9% 8,217,152 5,683.30 1,445.84 (4.0%) 7.6%West Valley (Yak) 12,377,569 5,456.99 2,268.20 5.7% 24.8% 11,709,047 5,392.97 2,171.17 18.1% 39.3% 9,915,493 5,376.34 1,844.28 18.0% 31.0%Omak 10,344,435 5,416.26 1,909.89 32.4% 31.3% 7,813,990 5,432.10 1,438.48 -0.8% (19.4%) 7,877,891 5,107.86 1,542.31 (18.7%) (4.2%) Cheney 6,741,273 5,183.43 1,300.54 (11.0%) 13.2% 7,577,780 5,062.06 1,496.98 27.3% 24.6% 5,952,884 4,825.04 1,233.75 (2.1%) 33.5%Bremerton 12,738,081 5,145.83 2,475.42 4.7% 13.9% 12,169,755 5,212.02 2,334.94 8.8% 11.1% 11,181,115 5,255.11 2,127.67 2.1% 5.8%Kelso 5,629,317 5,085.78 1,106.87 28.2% 2.2% 4,391,830 5,105.46 860.22 -20.3% (13.0%) 5,509,528 5,180.93 1,063.42 9.2% 15.2%27 377,110,810 188,992.10 1,995.38 13.0% 34.9% 333,773,706 187,519.08 1,779.95 19.4% 20.0% 279,487,673 186,620.78 1,497.62 0.4% 8.4%3,000–4,999Stanwood 11,494,190 4,854.80 2,367.59 44.9% 197.7% 7,933,057 4,671.00 1,698.36 105.5% 102.3% 3,861,278 4,606.26 838.27 (1.5%) (2.4%) Ferndale 14,214,315 4,828.95 2,943.56 4.9% 24.1% 13,548,983 4,784.54 2,831.83 18.3% 46.2% 11,455,556 4,803.43 2,384.87 23.6% 64.6%Shelton 2,645,910 4,662.63 567.47 3.0% -36.9% 2,568,534 4,544.64 565.18 -38.7% (52.2%) 4,190,390 4,493.87 932.47 (22.0%) (15.6%) Othello 15,112,578 4,645.95 3,252.85 3.0% 25.6% 14,669,180 4,518.86 3,246.21 21.9% 30.4% 12,032,392 4,461.80 2,696.76 6.9% 19.8%Sedro Woolley 5,519,577 4,574.75 1,206.53 (0.7%) -20.3% 5,559,055 4,599.81 1,208.54 -19.7% (3.9%) 6,924,174 4,473.56 1,547.80 19.7% 0.9%Mercer Island 6,778,152 4,433.38 1,528.89 (13.0%) 1.9% 7,795,316 4,482.27 1,739.14 17.2% 7.6% 6,652,415 4,506.29 1,476.25 (8.2%) (8.4%) Toppenish 9,417,657 4,317.04 2,181.51 28.4% 71.5% 7,336,832 4,260.38 1,722.11 33.6% 25.2% 5,490,620 4,268.41 1,286.34 (6.3%) (22.6%) Enumclaw 7,310,579 4,271.23 1,711.59 10.6% 32.3% 6,611,781 4,111.94 1,607.95 19.7% 20.3% 5,525,554 4,098.57 1,348.17 0.5% 3.2%East Valley (Spok 10,732,070 4,056.96 2,645.35 34.4% 53.5% 7,982,496 4,117.07 1,938.88 14.2% 44.0% 6,992,986 4,225.29 1,655.03 26.1% 52.2%White River 12,619,472 4,031.89 3,129.91 (5.3%) -9.4% 13,327,858 3,962.92 3,363.14 -4.3% 21.7% 13,923,503 3,848.39 3,618.01 27.1% 66.0%Fife 13,934,412 3,902.46 3,570.67 22.4% 61.9% 11,388,132 3,840.93 2,964.94 32.3% 51.3% 8,608,996 3,819.40 2,254.02 14.4% 28.2%Bainbridge 6,016,382 3,821.73 1,574.26 43.1% 104.4% 4,205,632 3,814.94 1,102.41 42.9% 77.9% 2,943,426 3,880.72 758.47 24.5% 2.1%Selah 11,153,288 3,766.46 2,961.21 22.1% 48.7% 9,134,497 3,689.42 2,475.86 21.8% 59.2% 7,498,735 3,697.13 2,028.26 30.7% 34.1%Port Angeles 4,748,305 3,721.25 1,276.00 (13.4%) 16.9% 5,483,511 3,805.39 1,440.99 35.0% 22.7% 4,060,931 3,811.21 1,065.52 (9.1%) (38.5%) West Valley (Spok 6,505,969 3,707.00 1,755.05 40.0% 103.3% 4,645,626 3,722.86 1,247.86 45.2% 116.5% 3,200,475 3,818.27 838.20 49.2% (5.5%) Grandview 10,961,664 3,630.27 3,019.52 21.4% 56.3% 9,026,925 3,655.59 2,469.35 28.8% 17.6% 7,011,005 3,737.02 1,876.10 (8.7%) (6.1%) Lynden 6,183,824 3,583.51 1,725.63 24.4% 92.5% 4,970,811 3,459.49 1,436.86 54.7% 39.5% 3,212,170 3,293.46 975.32 (9.9%) 10.9%Burlington Edison 6,095,710 3,580.29 1,702.57 (3.5%) 136.2% 6,315,693 3,509.44 1,799.63 144.7% 97.2% 2,580,974 3,589.25 719.08 (19.4%) (18.9%) Centralia 4,724,869 3,558.97 1,327.59 (15.8%) -25.2% 5,613,035 3,516.06 1,596.40 -11.1% (2.2%) 6,313,731 3,590.81 1,758.30 10.0% 0.7%Steilacoom Hist. 5,970,485 3,454.76 1,728.19 17.6% 16.5% 5,078,064 3,295.27 1,541.02 -0.9% 10.7% 5,124,903 3,294.61 1,555.54 11.7% (3.1%) Aberdeen 2,774,037 3,444.17 805.43 12.4% -25.3% 2,468,716 3,479.42 709.52 -33.5% 0.4% 3,714,612 3,490.37 1,064.25 51.1% (12.2%) Ridgefield 6,103,298 3,427.73 1,780.57 16.0% 39.6% 5,262,645 3,215.19 1,636.81 20.4% 28.0% 4,372,723 3,018.30 1,448.74 6.4% 61.0%Ellensburg 7,846,929 3,408.40 2,302.23 7.1% 9.9% 7,328,574 3,368.29 2,175.76 2.6% 19.3% 7,142,809 3,378.25 2,114.35 16.3% 47.0%Riverview 8,162,658 3,375.28 2,418.36 11.2% 90.9% 7,340,277 3,420.08 2,146.23 71.6% 81.9% 4,276,744 3,399.17 1,258.17 6.0% 8.1%Quillayute Valley 6,335,251 3,359.06 1,886.02 47.2% 186.9% 4,304,422 3,338.33 1,289.39 94.9% 142.3% 2,208,297 3,092.64 714.05 24.3% 17.7%Wapato 12,860,408 3,338.15 3,852.56 25.6% 59.0% 10,236,698 3,418.88 2,994.17 26.5% 67.6% 8,089,151 3,403.10 2,376.99 32.4% 91.6%East Valley (Yak) 7,295,553 3,282.83 2,222.34 20.5% 43.4% 6,055,286 3,260.89 1,856.94 19.0% 47.0% 5,088,399 3,233.82 1,573.49 23.5% 19.8%Washougal 5,907,871 3,223.79 1,832.59 3.5% -13.6% 5,705,465 3,143.34 1,815.10 -16.5% (7.8%) 6,834,567 3,208.58 2,130.09 10.5% (20.1%) Chehalis 5,103,476 3,170.22 1,609.82 21.9% 4.0% 4,187,432 3,122.25 1,341.16 -14.7% (25.9%) 4,908,303 3,041.98 1,613.52 (13.2%) (21.0%) Quincy 5,004,518 3,024.49 1,654.67 (17.4%) -26.4% 6,060,515 2,998.90 2,020.91 -10.9% (18.9%) 6,799,684 2,998.38 2,267.79 (9.0%) (5.1%) 30 239,533,405 114,458.40 2,092.76 12.9% 32.3% 212,145,046 113,128.39 1,875.26 17.2% 28.0% 181,039,503 112,582.34 1,608.06 9.2% 10.5%
224
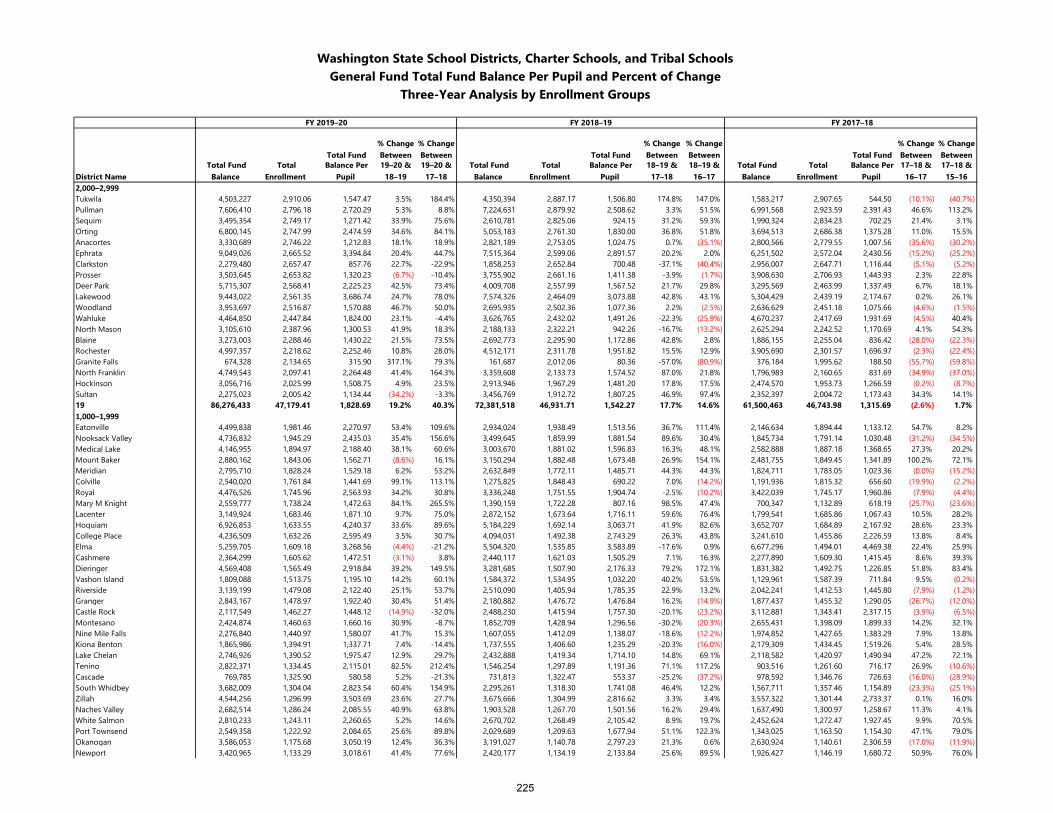
Washington State School Districts, Charter Schools, and Tribal SchoolsGeneral Fund Total Fund Balance Per Pupil and Percent of Change
Three-Year Analysis by Enrollment Groups
FY 2019–20 FY 2018–19 FY 2017–18
Total Fund % Change Between
% Change Between Total Fund
% Change Between
% Change Between Total Fund
% Change Between
% Change Between
District Name Total Fund
Balance Total
Enrollment Balance Per
Pupil 19–20 &
18–1919–20 &
17–18 Total Fund
Balance Total
Enrollment Balance Per
Pupil 18–19 &
17–1818–19 &
16–17 Total Fund
Balance Total
Enrollment Balance Per
Pupil 17–18 &
16–1717–18 &
15–162,000–2,999Tukwila 4,503,227 2,910.06 1,547.47 3.5% 184.4% 4,350,394 2,887.17 1,506.80 174.8% 147.0% 1,583,217 2,907.65 544.50 (10.1%) (40.7%) Pullman 7,606,410 2,796.18 2,720.29 5.3% 8.8% 7,224,631 2,879.92 2,508.62 3.3% 51.5% 6,991,568 2,923.59 2,391.43 46.6% 113.2%Sequim 3,495,354 2,749.17 1,271.42 33.9% 75.6% 2,610,781 2,825.06 924.15 31.2% 59.3% 1,990,324 2,834.23 702.25 21.4% 3.1%Orting 6,800,145 2,747.99 2,474.59 34.6% 84.1% 5,053,183 2,761.30 1,830.00 36.8% 51.8% 3,694,513 2,686.38 1,375.28 11.0% 15.5%Anacortes 3,330,689 2,746.22 1,212.83 18.1% 18.9% 2,821,189 2,753.05 1,024.75 0.7% (35.1%) 2,800,566 2,779.55 1,007.56 (35.6%) (30.2%) Ephrata 9,049,026 2,665.52 3,394.84 20.4% 44.7% 7,515,364 2,599.06 2,891.57 20.2% 2.0% 6,251,502 2,572.04 2,430.56 (15.2%) (25.2%) Clarkston 2,279,480 2,657.47 857.76 22.7% -22.9% 1,858,253 2,652.84 700.48 -37.1% (40.4%) 2,956,007 2,647.71 1,116.44 (5.1%) (5.2%) Prosser 3,503,645 2,653.82 1,320.23 (6.7%) -10.4% 3,755,902 2,661.16 1,411.38 -3.9% (1.7%) 3,908,630 2,706.93 1,443.93 2.3% 22.8%Deer Park 5,715,307 2,568.41 2,225.23 42.5% 73.4% 4,009,708 2,557.99 1,567.52 21.7% 29.8% 3,295,569 2,463.99 1,337.49 6.7% 18.1%Lakewood 9,443,022 2,561.35 3,686.74 24.7% 78.0% 7,574,326 2,464.09 3,073.88 42.8% 43.1% 5,304,429 2,439.19 2,174.67 0.2% 26.1%Woodland 3,953,697 2,516.87 1,570.88 46.7% 50.0% 2,695,935 2,502.36 1,077.36 2.2% (2.5%) 2,636,629 2,451.18 1,075.66 (4.6%) (1.5%) Wahluke 4,464,850 2,447.84 1,824.00 23.1% -4.4% 3,626,765 2,432.02 1,491.26 -22.3% (25.9%) 4,670,237 2,417.69 1,931.69 (4.5%) 40.4%North Mason 3,105,610 2,387.96 1,300.53 41.9% 18.3% 2,188,133 2,322.21 942.26 -16.7% (13.2%) 2,625,294 2,242.52 1,170.69 4.1% 54.3%Blaine 3,273,003 2,288.46 1,430.22 21.5% 73.5% 2,692,773 2,295.90 1,172.86 42.8% 2.8% 1,886,155 2,255.04 836.42 (28.0%) (22.3%) Rochester 4,997,357 2,218.62 2,252.46 10.8% 28.0% 4,512,171 2,311.78 1,951.82 15.5% 12.9% 3,905,690 2,301.57 1,696.97 (2.3%) (22.4%) Granite Falls 674,328 2,134.65 315.90 317.1% 79.3% 161,687 2,012.06 80.36 -57.0% (80.9%) 376,184 1,995.62 188.50 (55.7%) (59.8%) North Franklin 4,749,543 2,097.41 2,264.48 41.4% 164.3% 3,359,608 2,133.73 1,574.52 87.0% 21.8% 1,796,983 2,160.65 831.69 (34.9%) (37.0%) Hockinson 3,056,716 2,025.99 1,508.75 4.9% 23.5% 2,913,946 1,967.29 1,481.20 17.8% 17.5% 2,474,570 1,953.73 1,266.59 (0.2%) (8.7%) Sultan 2,275,023 2,005.42 1,134.44 (34.2%) -3.3% 3,456,769 1,912.72 1,807.25 46.9% 97.4% 2,352,397 2,004.72 1,173.43 34.3% 14.1%19 86,276,433 47,179.41 1,828.69 19.2% 40.3% 72,381,518 46,931.71 1,542.27 17.7% 14.6% 61,500,463 46,743.98 1,315.69 (2.6%) 1.7%1,000–1,999Eatonville 4,499,838 1,981.46 2,270.97 53.4% 109.6% 2,934,024 1,938.49 1,513.56 36.7% 111.4% 2,146,634 1,894.44 1,133.12 54.7% 8.2%Nooksack Valley 4,736,832 1,945.29 2,435.03 35.4% 156.6% 3,499,645 1,859.99 1,881.54 89.6% 30.4% 1,845,734 1,791.14 1,030.48 (31.2%) (34.5%) Medical Lake 4,146,955 1,894.97 2,188.40 38.1% 60.6% 3,003,670 1,881.02 1,596.83 16.3% 48.1% 2,582,888 1,887.18 1,368.65 27.3% 20.2%Mount Baker 2,880,162 1,843.06 1,562.71 (8.6%) 16.1% 3,150,294 1,882.48 1,673.48 26.9% 154.1% 2,481,755 1,849.45 1,341.89 100.2% 72.1%Meridian 2,795,710 1,828.24 1,529.18 6.2% 53.2% 2,632,849 1,772.11 1,485.71 44.3% 44.3% 1,824,711 1,783.05 1,023.36 (0.0%) (15.2%) Colville 2,540,020 1,761.84 1,441.69 99.1% 113.1% 1,275,825 1,848.43 690.22 7.0% (14.2%) 1,191,936 1,815.32 656.60 (19.9%) (2.2%) Royal 4,476,526 1,745.96 2,563.93 34.2% 30.8% 3,336,248 1,751.55 1,904.74 -2.5% (10.2%) 3,422,039 1,745.17 1,960.86 (7.9%) (4.4%) Mary M Knight 2,559,777 1,738.24 1,472.63 84.1% 265.5% 1,390,159 1,722.28 807.16 98.5% 47.4% 700,347 1,132.89 618.19 (25.7%) (23.6%) Lacenter 3,149,924 1,683.46 1,871.10 9.7% 75.0% 2,872,152 1,673.64 1,716.11 59.6% 76.4% 1,799,541 1,685.86 1,067.43 10.5% 28.2%Hoquiam 6,926,853 1,633.55 4,240.37 33.6% 89.6% 5,184,229 1,692.14 3,063.71 41.9% 82.6% 3,652,707 1,684.89 2,167.92 28.6% 23.3%College Place 4,236,509 1,632.26 2,595.49 3.5% 30.7% 4,094,031 1,492.38 2,743.29 26.3% 43.8% 3,241,610 1,455.86 2,226.59 13.8% 8.4%Elma 5,259,705 1,609.18 3,268.56 (4.4%) -21.2% 5,504,320 1,535.85 3,583.89 -17.6% 0.9% 6,677,296 1,494.01 4,469.38 22.4% 25.9%Cashmere 2,364,299 1,605.62 1,472.51 (3.1%) 3.8% 2,440,117 1,621.03 1,505.29 7.1% 16.3% 2,277,890 1,609.30 1,415.45 8.6% 39.3%Dieringer 4,569,408 1,565.49 2,918.84 39.2% 149.5% 3,281,685 1,507.90 2,176.33 79.2% 172.1% 1,831,382 1,492.75 1,226.85 51.8% 83.4%Vashon Island 1,809,088 1,513.75 1,195.10 14.2% 60.1% 1,584,372 1,534.95 1,032.20 40.2% 53.5% 1,129,961 1,587.39 711.84 9.5% (0.2%) Riverside 3,139,199 1,479.08 2,122.40 25.1% 53.7% 2,510,090 1,405.94 1,785.35 22.9% 13.2% 2,042,241 1,412.53 1,445.80 (7.9%) (1.2%) Granger 2,843,167 1,478.97 1,922.40 30.4% 51.4% 2,180,882 1,476.72 1,476.84 16.2% (14.9%) 1,877,437 1,455.32 1,290.05 (26.7%) (12.0%) Castle Rock 2,117,549 1,462.27 1,448.12 (14.9%) -32.0% 2,488,230 1,415.94 1,757.30 -20.1% (23.2%) 3,112,881 1,343.41 2,317.15 (3.9%) (6.5%) Montesano 2,424,874 1,460.63 1,660.16 30.9% -8.7% 1,852,709 1,428.94 1,296.56 -30.2% (20.3%) 2,655,431 1,398.09 1,899.33 14.2% 32.1%Nine Mile Falls 2,276,840 1,440.97 1,580.07 41.7% 15.3% 1,607,055 1,412.09 1,138.07 -18.6% (12.2%) 1,974,852 1,427.65 1,383.29 7.9% 13.8%Kiona Benton 1,865,986 1,394.91 1,337.71 7.4% -14.4% 1,737,555 1,406.60 1,235.29 -20.3% (16.0%) 2,179,309 1,434.45 1,519.26 5.4% 28.5%Lake Chelan 2,746,926 1,390.52 1,975.47 12.9% 29.7% 2,432,888 1,419.34 1,714.10 14.8% 69.1% 2,118,582 1,420.97 1,490.94 47.2% 72.1%Tenino 2,822,371 1,334.45 2,115.01 82.5% 212.4% 1,546,254 1,297.89 1,191.36 71.1% 117.2% 903,516 1,261.60 716.17 26.9% (10.6%) Cascade 769,785 1,325.90 580.58 5.2% -21.3% 731,813 1,322.47 553.37 -25.2% (37.2%) 978,592 1,346.76 726.63 (16.0%) (28.9%) South Whidbey 3,682,009 1,304.04 2,823.54 60.4% 134.9% 2,295,261 1,318.30 1,741.08 46.4% 12.2% 1,567,711 1,357.46 1,154.89 (23.3%) (25.1%) Zillah 4,544,256 1,296.99 3,503.69 23.6% 27.7% 3,675,666 1,304.99 2,816.62 3.3% 3.4% 3,557,322 1,301.44 2,733.37 0.1% 16.0%Naches Valley 2,682,514 1,286.24 2,085.55 40.9% 63.8% 1,903,528 1,267.70 1,501.56 16.2% 29.4% 1,637,490 1,300.97 1,258.67 11.3% 4.1%White Salmon 2,810,233 1,243.11 2,260.65 5.2% 14.6% 2,670,702 1,268.49 2,105.42 8.9% 19.7% 2,452,624 1,272.47 1,927.45 9.9% 70.5%Port Townsend 2,549,358 1,222.92 2,084.65 25.6% 89.8% 2,029,689 1,209.63 1,677.94 51.1% 122.3% 1,343,025 1,163.50 1,154.30 47.1% 79.0%Okanogan 3,586,053 1,175.68 3,050.19 12.4% 36.3% 3,191,027 1,140.78 2,797.23 21.3% 0.6% 2,630,924 1,140.61 2,306.59 (17.0%) (11.9%) Newport 3,420,965 1,133.29 3,018.61 41.4% 77.6% 2,420,177 1,134.19 2,133.84 25.6% 89.5% 1,926,427 1,146.19 1,680.72 50.9% 76.0%
225
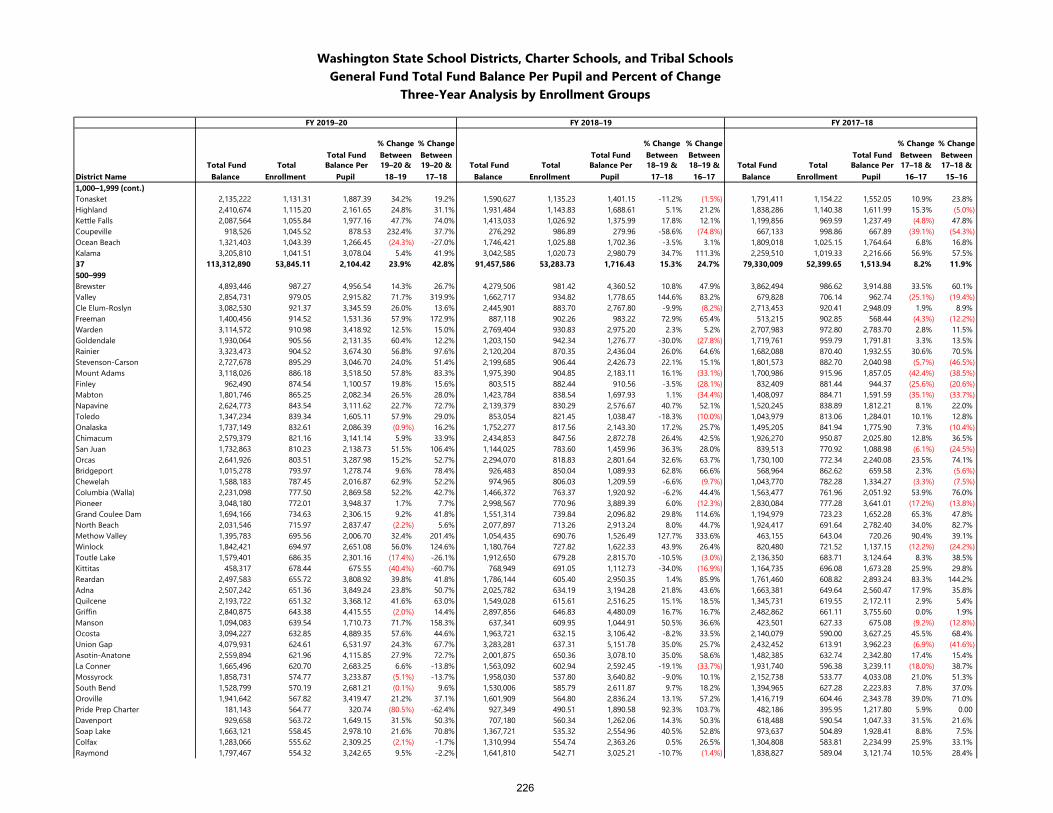
Washington State School Districts, Charter Schools, and Tribal SchoolsGeneral Fund Total Fund Balance Per Pupil and Percent of Change
Three-Year Analysis by Enrollment Groups
FY 2019–20 FY 2018–19 FY 2017–18
Total Fund % Change Between
% Change Between Total Fund
% Change Between
% Change Between Total Fund
% Change Between
% Change Between
District Name Total Fund
Balance Total
Enrollment Balance Per
Pupil 19–20 &
18–1919–20 &
17–18 Total Fund
Balance Total
Enrollment Balance Per
Pupil 18–19 &
17–1818–19 &
16–17 Total Fund
Balance Total
Enrollment Balance Per
Pupil 17–18 &
16–1717–18 &
15–161,000–1,999 (cont.)Tonasket 2,135,222 1,131.31 1,887.39 34.2% 19.2% 1,590,627 1,135.23 1,401.15 -11.2% (1.5%) 1,791,411 1,154.22 1,552.05 10.9% 23.8%Highland 2,410,674 1,115.20 2,161.65 24.8% 31.1% 1,931,484 1,143.83 1,688.61 5.1% 21.2% 1,838,286 1,140.38 1,611.99 15.3% (5.0%) Kettle Falls 2,087,564 1,055.84 1,977.16 47.7% 74.0% 1,413,033 1,026.92 1,375.99 17.8% 12.1% 1,199,856 969.59 1,237.49 (4.8%) 47.8%Coupeville 918,526 1,045.52 878.53 232.4% 37.7% 276,292 986.89 279.96 -58.6% (74.8%) 667,133 998.86 667.89 (39.1%) (54.3%) Ocean Beach 1,321,403 1,043.39 1,266.45 (24.3%) -27.0% 1,746,421 1,025.88 1,702.36 -3.5% 3.1% 1,809,018 1,025.15 1,764.64 6.8% 16.8%Kalama 3,205,810 1,041.51 3,078.04 5.4% 41.9% 3,042,585 1,020.73 2,980.79 34.7% 111.3% 2,259,510 1,019.33 2,216.66 56.9% 57.5%37 113,312,890 53,845.11 2,104.42 23.9% 42.8% 91,457,586 53,283.73 1,716.43 15.3% 24.7% 79,330,009 52,399.65 1,513.94 8.2% 11.9%500–999Brewster 4,893,446 987.27 4,956.54 14.3% 26.7% 4,279,506 981.42 4,360.52 10.8% 47.9% 3,862,494 986.62 3,914.88 33.5% 60.1%Valley 2,854,731 979.05 2,915.82 71.7% 319.9% 1,662,717 934.82 1,778.65 144.6% 83.2% 679,828 706.14 962.74 (25.1%) (19.4%) Cle Elum-Roslyn 3,082,530 921.37 3,345.59 26.0% 13.6% 2,445,901 883.70 2,767.80 -9.9% (8.2%) 2,713,453 920.41 2,948.09 1.9% 8.9%Freeman 1,400,456 914.52 1,531.36 57.9% 172.9% 887,118 902.26 983.22 72.9% 65.4% 513,215 902.85 568.44 (4.3%) (12.2%) Warden 3,114,572 910.98 3,418.92 12.5% 15.0% 2,769,404 930.83 2,975.20 2.3% 5.2% 2,707,983 972.80 2,783.70 2.8% 11.5%Goldendale 1,930,064 905.56 2,131.35 60.4% 12.2% 1,203,150 942.34 1,276.77 -30.0% (27.8%) 1,719,761 959.79 1,791.81 3.3% 13.5%Rainier 3,323,473 904.52 3,674.30 56.8% 97.6% 2,120,204 870.35 2,436.04 26.0% 64.6% 1,682,088 870.40 1,932.55 30.6% 70.5%Stevenson-Carson 2,727,678 895.29 3,046.70 24.0% 51.4% 2,199,685 906.44 2,426.73 22.1% 15.1% 1,801,573 882.70 2,040.98 (5.7%) (46.5%) Mount Adams 3,118,026 886.18 3,518.50 57.8% 83.3% 1,975,390 904.85 2,183.11 16.1% (33.1%) 1,700,986 915.96 1,857.05 (42.4%) (38.5%) Finley 962,490 874.54 1,100.57 19.8% 15.6% 803,515 882.44 910.56 -3.5% (28.1%) 832,409 881.44 944.37 (25.6%) (20.6%) Mabton 1,801,746 865.25 2,082.34 26.5% 28.0% 1,423,784 838.54 1,697.93 1.1% (34.4%) 1,408,097 884.71 1,591.59 (35.1%) (33.7%) Napavine 2,624,773 843.54 3,111.62 22.7% 72.7% 2,139,379 830.29 2,576.67 40.7% 52.1% 1,520,245 838.89 1,812.21 8.1% 22.0%Toledo 1,347,234 839.34 1,605.11 57.9% 29.0% 853,054 821.45 1,038.47 -18.3% (10.0%) 1,043,979 813.06 1,284.01 10.1% 12.8%Onalaska 1,737,149 832.61 2,086.39 (0.9%) 16.2% 1,752,277 817.56 2,143.30 17.2% 25.7% 1,495,205 841.94 1,775.90 7.3% (10.4%) Chimacum 2,579,379 821.16 3,141.14 5.9% 33.9% 2,434,853 847.56 2,872.78 26.4% 42.5% 1,926,270 950.87 2,025.80 12.8% 36.5%San Juan 1,732,863 810.23 2,138.73 51.5% 106.4% 1,144,025 783.60 1,459.96 36.3% 28.0% 839,513 770.92 1,088.98 (6.1%) (24.5%) Orcas 2,641,926 803.51 3,287.98 15.2% 52.7% 2,294,070 818.83 2,801.64 32.6% 63.7% 1,730,100 772.34 2,240.08 23.5% 74.1%Bridgeport 1,015,278 793.97 1,278.74 9.6% 78.4% 926,483 850.04 1,089.93 62.8% 66.6% 568,964 862.62 659.58 2.3% (5.6%) Chewelah 1,588,183 787.45 2,016.87 62.9% 52.2% 974,965 806.03 1,209.59 -6.6% (9.7%) 1,043,770 782.28 1,334.27 (3.3%) (7.5%) Columbia (Walla) 2,231,098 777.50 2,869.58 52.2% 42.7% 1,466,372 763.37 1,920.92 -6.2% 44.4% 1,563,477 761.96 2,051.92 53.9% 76.0%Pioneer 3,048,180 772.01 3,948.37 1.7% 7.7% 2,998,567 770.96 3,889.39 6.0% (12.3%) 2,830,084 777.28 3,641.01 (17.2%) (13.8%) Grand Coulee Dam 1,694,166 734.63 2,306.15 9.2% 41.8% 1,551,314 739.84 2,096.82 29.8% 114.6% 1,194,979 723.23 1,652.28 65.3% 47.8%North Beach 2,031,546 715.97 2,837.47 (2.2%) 5.6% 2,077,897 713.26 2,913.24 8.0% 44.7% 1,924,417 691.64 2,782.40 34.0% 82.7%Methow Valley 1,395,783 695.56 2,006.70 32.4% 201.4% 1,054,435 690.76 1,526.49 127.7% 333.6% 463,155 643.04 720.26 90.4% 39.1%Winlock 1,842,421 694.97 2,651.08 56.0% 124.6% 1,180,764 727.82 1,622.33 43.9% 26.4% 820,480 721.52 1,137.15 (12.2%) (24.2%) Toutle Lake 1,579,401 686.35 2,301.16 (17.4%) -26.1% 1,912,650 679.28 2,815.70 -10.5% (3.0%) 2,136,350 683.71 3,124.64 8.3% 38.5%Kittitas 458,317 678.44 675.55 (40.4%) -60.7% 768,949 691.05 1,112.73 -34.0% (16.9%) 1,164,735 696.08 1,673.28 25.9% 29.8%Reardan 2,497,583 655.72 3,808.92 39.8% 41.8% 1,786,144 605.40 2,950.35 1.4% 85.9% 1,761,460 608.82 2,893.24 83.3% 144.2%Adna 2,507,242 651.36 3,849.24 23.8% 50.7% 2,025,782 634.19 3,194.28 21.8% 43.6% 1,663,381 649.64 2,560.47 17.9% 35.8%Quilcene 2,193,722 651.32 3,368.12 41.6% 63.0% 1,549,028 615.61 2,516.25 15.1% 18.5% 1,345,731 619.55 2,172.11 2.9% 5.4%Griffin 2,840,875 643.38 4,415.55 (2.0%) 14.4% 2,897,856 646.83 4,480.09 16.7% 16.7% 2,482,862 661.11 3,755.60 0.0% 1.9%Manson 1,094,083 639.54 1,710.73 71.7% 158.3% 637,341 609.95 1,044.91 50.5% 36.6% 423,501 627.33 675.08 (9.2%) (12.8%) Ocosta 3,094,227 632.85 4,889.35 57.6% 44.6% 1,963,721 632.15 3,106.42 -8.2% 33.5% 2,140,079 590.00 3,627.25 45.5% 68.4%Union Gap 4,079,931 624.61 6,531.97 24.3% 67.7% 3,283,281 637.31 5,151.78 35.0% 25.7% 2,432,452 613.91 3,962.23 (6.9%) (41.6%) Asotin-Anatone 2,559,894 621.96 4,115.85 27.9% 72.7% 2,001,875 650.36 3,078.10 35.0% 58.6% 1,482,385 632.74 2,342.80 17.4% 15.4%La Conner 1,665,496 620.70 2,683.25 6.6% -13.8% 1,563,092 602.94 2,592.45 -19.1% (33.7%) 1,931,740 596.38 3,239.11 (18.0%) 38.7%Mossyrock 1,858,731 574.77 3,233.87 (5.1%) -13.7% 1,958,030 537.80 3,640.82 -9.0% 10.1% 2,152,738 533.77 4,033.08 21.0% 51.3%South Bend 1,528,799 570.19 2,681.21 (0.1%) 9.6% 1,530,006 585.79 2,611.87 9.7% 18.2% 1,394,965 627.28 2,223.83 7.8% 37.0%Oroville 1,941,642 567.82 3,419.47 21.2% 37.1% 1,601,909 564.80 2,836.24 13.1% 57.2% 1,416,719 604.46 2,343.78 39.0% 71.0%Pride Prep Charter 181,143 564.77 320.74 (80.5%) -62.4% 927,349 490.51 1,890.58 92.3% 103.7% 482,186 395.95 1,217.80 5.9% 0.00Davenport 929,658 563.72 1,649.15 31.5% 50.3% 707,180 560.34 1,262.06 14.3% 50.3% 618,488 590.54 1,047.33 31.5% 21.6%Soap Lake 1,663,121 558.45 2,978.10 21.6% 70.8% 1,367,721 535.32 2,554.96 40.5% 52.8% 973,637 504.89 1,928.41 8.8% 7.5%Colfax 1,283,066 555.62 2,309.25 (2.1%) -1.7% 1,310,994 554.74 2,363.26 0.5% 26.5% 1,304,808 583.81 2,234.99 25.9% 33.1%Raymond 1,797,467 554.32 3,242.65 9.5% -2.2% 1,641,810 542.71 3,025.21 -10.7% (1.4%) 1,838,827 589.04 3,121.74 10.5% 28.4%
226
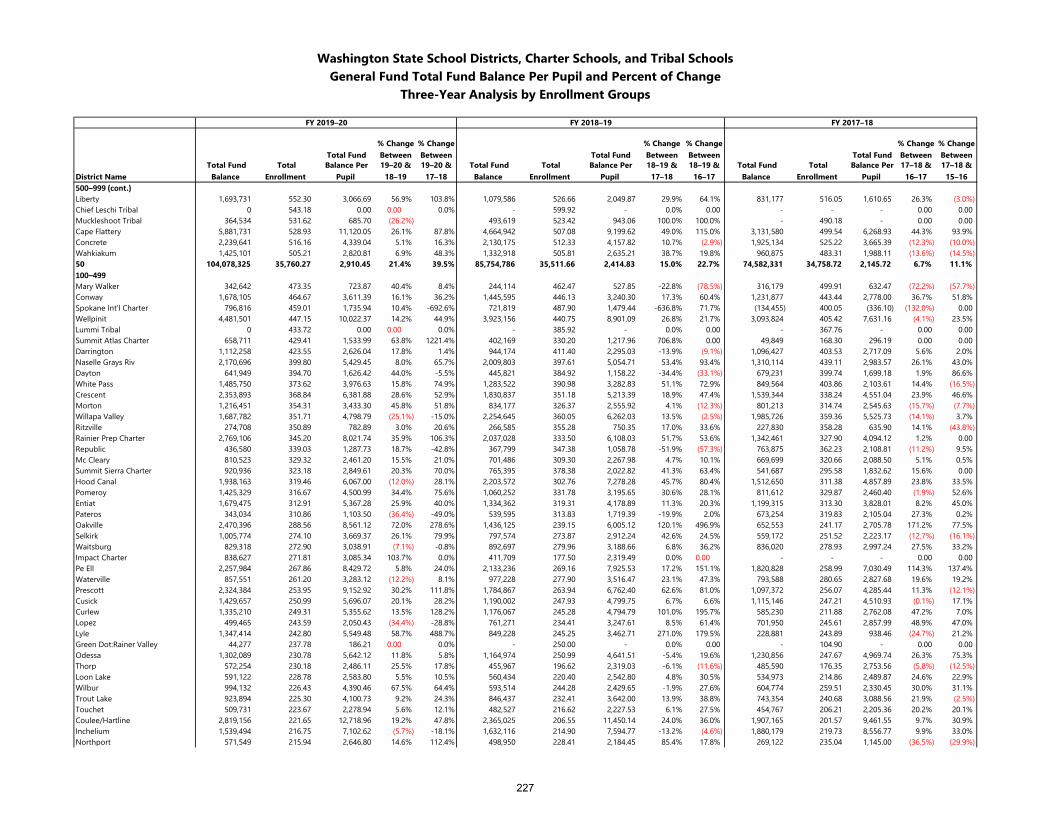
Washington State School Districts, Charter Schools, and Tribal SchoolsGeneral Fund Total Fund Balance Per Pupil and Percent of Change
Three-Year Analysis by Enrollment Groups
FY 2019–20 FY 2018–19 FY 2017–18
Total Fund % Change Between
% Change Between Total Fund
% Change Between
% Change Between Total Fund
% Change Between
% Change Between
District Name Total Fund
Balance Total
Enrollment Balance Per
Pupil 19–20 &
18–1919–20 &
17–18 Total Fund
Balance Total
Enrollment Balance Per
Pupil 18–19 &
17–1818–19 &
16–17 Total Fund
Balance Total
Enrollment Balance Per
Pupil 17–18 &
16–1717–18 &
15–16500–999 (cont.)Liberty 1,693,731 552.30 3,066.69 56.9% 103.8% 1,079,586 526.66 2,049.87 29.9% 64.1% 831,177 516.05 1,610.65 26.3% (3.0%) Chief Leschi Tribal 0 543.18 0.00 0.00 0.0% - 599.92 - 0.0% 0.00 - - - 0.00 0.00Muckleshoot Tribal 364,534 531.62 685.70 (26.2%) 493,619 523.42 943.06 100.0% 100.0% - 490.18 - 0.00 0.00Cape Flattery 5,881,731 528.93 11,120.05 26.1% 87.8% 4,664,942 507.08 9,199.62 49.0% 115.0% 3,131,580 499.54 6,268.93 44.3% 93.9%Concrete 2,239,641 516.16 4,339.04 5.1% 16.3% 2,130,175 512.33 4,157.82 10.7% (2.9%) 1,925,134 525.22 3,665.39 (12.3%) (10.0%) Wahkiakum 1,425,101 505.21 2,820.81 6.9% 48.3% 1,332,918 505.81 2,635.21 38.7% 19.8% 960,875 483.31 1,988.11 (13.6%) (14.5%) 50 104,078,325 35,760.27 2,910.45 21.4% 39.5% 85,754,786 35,511.66 2,414.83 15.0% 22.7% 74,582,331 34,758.72 2,145.72 6.7% 11.1%100–499Mary Walker 342,642 473.35 723.87 40.4% 8.4% 244,114 462.47 527.85 -22.8% (78.5%) 316,179 499.91 632.47 (72.2%) (57.7%) Conway 1,678,105 464.67 3,611.39 16.1% 36.2% 1,445,595 446.13 3,240.30 17.3% 60.4% 1,231,877 443.44 2,778.00 36.7% 51.8%Spokane Int'l Charter 796,816 459.01 1,735.94 10.4% -692.6% 721,819 487.90 1,479.44 -636.8% 71.7% (134,455) 400.05 (336.10) (132.0%) 0.00Wellpinit 4,481,501 447.15 10,022.37 14.2% 44.9% 3,923,156 440.75 8,901.09 26.8% 21.7% 3,093,824 405.42 7,631.16 (4.1%) 23.5%Lummi Tribal 0 433.72 0.00 0.00 0.0% - 385.92 - 0.0% 0.00 - 367.76 - 0.00 0.00Summit Atlas Charter 658,711 429.41 1,533.99 63.8% 1221.4% 402,169 330.20 1,217.96 706.8% 0.00 49,849 168.30 296.19 0.00 0.00Darrington 1,112,258 423.55 2,626.04 17.8% 1.4% 944,174 411.40 2,295.03 -13.9% (9.1%) 1,096,427 403.53 2,717.09 5.6% 2.0%Naselle Grays Riv 2,170,696 399.80 5,429.45 8.0% 65.7% 2,009,803 397.61 5,054.71 53.4% 93.4% 1,310,114 439.11 2,983.57 26.1% 43.0%Dayton 641,949 394.70 1,626.42 44.0% -5.5% 445,821 384.92 1,158.22 -34.4% (33.1%) 679,231 399.74 1,699.18 1.9% 86.6%White Pass 1,485,750 373.62 3,976.63 15.8% 74.9% 1,283,522 390.98 3,282.83 51.1% 72.9% 849,564 403.86 2,103.61 14.4% (16.5%) Crescent 2,353,893 368.84 6,381.88 28.6% 52.9% 1,830,837 351.18 5,213.39 18.9% 47.4% 1,539,344 338.24 4,551.04 23.9% 46.6%Morton 1,216,451 354.31 3,433.30 45.8% 51.8% 834,177 326.37 2,555.92 4.1% (12.3%) 801,213 314.74 2,545.63 (15.7%) (7.7%) Willapa Valley 1,687,782 351.71 4,798.79 (25.1%) -15.0% 2,254,645 360.05 6,262.03 13.5% (2.5%) 1,985,726 359.36 5,525.73 (14.1%) 3.7%Ritzville 274,708 350.89 782.89 3.0% 20.6% 266,585 355.28 750.35 17.0% 33.6% 227,830 358.28 635.90 14.1% (43.8%) Rainier Prep Charter 2,769,106 345.20 8,021.74 35.9% 106.3% 2,037,028 333.50 6,108.03 51.7% 53.6% 1,342,461 327.90 4,094.12 1.2% 0.00Republic 436,580 339.03 1,287.73 18.7% -42.8% 367,799 347.38 1,058.78 -51.9% (57.3%) 763,875 362.23 2,108.81 (11.2%) 9.5%Mc Cleary 810,523 329.32 2,461.20 15.5% 21.0% 701,486 309.30 2,267.98 4.7% 10.1% 669,699 320.66 2,088.50 5.1% 0.5%Summit Sierra Charter 920,936 323.18 2,849.61 20.3% 70.0% 765,395 378.38 2,022.82 41.3% 63.4% 541,687 295.58 1,832.62 15.6% 0.00Hood Canal 1,938,163 319.46 6,067.00 (12.0%) 28.1% 2,203,572 302.76 7,278.28 45.7% 80.4% 1,512,650 311.38 4,857.89 23.8% 33.5%Pomeroy 1,425,329 316.67 4,500.99 34.4% 75.6% 1,060,252 331.78 3,195.65 30.6% 28.1% 811,612 329.87 2,460.40 (1.9%) 52.6%Entiat 1,679,475 312.91 5,367.28 25.9% 40.0% 1,334,362 319.31 4,178.89 11.3% 20.3% 1,199,315 313.30 3,828.01 8.2% 45.0%Pateros 343,034 310.86 1,103.50 (36.4%) -49.0% 539,595 313.83 1,719.39 -19.9% 2.0% 673,254 319.83 2,105.04 27.3% 0.2%Oakville 2,470,396 288.56 8,561.12 72.0% 278.6% 1,436,125 239.15 6,005.12 120.1% 496.9% 652,553 241.17 2,705.78 171.2% 77.5%Selkirk 1,005,774 274.10 3,669.37 26.1% 79.9% 797,574 273.87 2,912.24 42.6% 24.5% 559,172 251.52 2,223.17 (12.7%) (16.1%) Waitsburg 829,318 272.90 3,038.91 (7.1%) -0.8% 892,697 279.96 3,188.66 6.8% 36.2% 836,020 278.93 2,997.24 27.5% 33.2%Impact Charter 838,627 271.81 3,085.34 103.7% 0.0% 411,709 177.50 2,319.49 0.0% 0.00 - - - 0.00 0.00Pe Ell 2,257,984 267.86 8,429.72 5.8% 24.0% 2,133,236 269.16 7,925.53 17.2% 151.1% 1,820,828 258.99 7,030.49 114.3% 137.4%Waterville 857,551 261.20 3,283.12 (12.2%) 8.1% 977,228 277.90 3,516.47 23.1% 47.3% 793,588 280.65 2,827.68 19.6% 19.2%Prescott 2,324,384 253.95 9,152.92 30.2% 111.8% 1,784,867 263.94 6,762.40 62.6% 81.0% 1,097,372 256.07 4,285.44 11.3% (12.1%) Cusick 1,429,657 250.99 5,696.07 20.1% 28.2% 1,190,002 247.93 4,799.75 6.7% 6.6% 1,115,146 247.21 4,510.93 (0.1%) 17.1%Curlew 1,335,210 249.31 5,355.62 13.5% 128.2% 1,176,067 245.28 4,794.79 101.0% 195.7% 585,230 211.88 2,762.08 47.2% 7.0%Lopez 499,465 243.59 2,050.43 (34.4%) -28.8% 761,271 234.41 3,247.61 8.5% 61.4% 701,950 245.61 2,857.99 48.9% 47.0%Lyle 1,347,414 242.80 5,549.48 58.7% 488.7% 849,228 245.25 3,462.71 271.0% 179.5% 228,881 243.89 938.46 (24.7%) 21.2%Green Dot:Rainer Valley 44,277 237.78 186.21 0.00 0.0% - 250.00 - 0.0% 0.00 - 104.90 - 0.00 0.00Odessa 1,302,089 230.78 5,642.12 11.8% 5.8% 1,164,974 250.99 4,641.51 -5.4% 19.6% 1,230,856 247.67 4,969.74 26.3% 75.3%Thorp 572,254 230.18 2,486.11 25.5% 17.8% 455,967 196.62 2,319.03 -6.1% (11.6%) 485,590 176.35 2,753.56 (5.8%) (12.5%) Loon Lake 591,122 228.78 2,583.80 5.5% 10.5% 560,434 220.40 2,542.80 4.8% 30.5% 534,973 214.86 2,489.87 24.6% 22.9%Wilbur 994,132 226.43 4,390.46 67.5% 64.4% 593,514 244.28 2,429.65 -1.9% 27.6% 604,774 259.51 2,330.45 30.0% 31.1%Trout Lake 923,894 225.30 4,100.73 9.2% 24.3% 846,437 232.41 3,642.00 13.9% 38.8% 743,354 240.68 3,088.56 21.9% (2.5%) Touchet 509,731 223.67 2,278.94 5.6% 12.1% 482,527 216.62 2,227.53 6.1% 27.5% 454,767 206.21 2,205.36 20.2% 20.1%Coulee/Hartline 2,819,156 221.65 12,718.96 19.2% 47.8% 2,365,025 206.55 11,450.14 24.0% 36.0% 1,907,165 201.57 9,461.55 9.7% 30.9%Inchelium 1,539,494 216.75 7,102.62 (5.7%) -18.1% 1,632,116 214.90 7,594.77 -13.2% (4.6%) 1,880,179 219.73 8,556.77 9.9% 33.0%Northport 571,549 215.94 2,646.80 14.6% 112.4% 498,950 228.41 2,184.45 85.4% 17.8% 269,122 235.04 1,145.00 (36.5%) (29.9%)
227
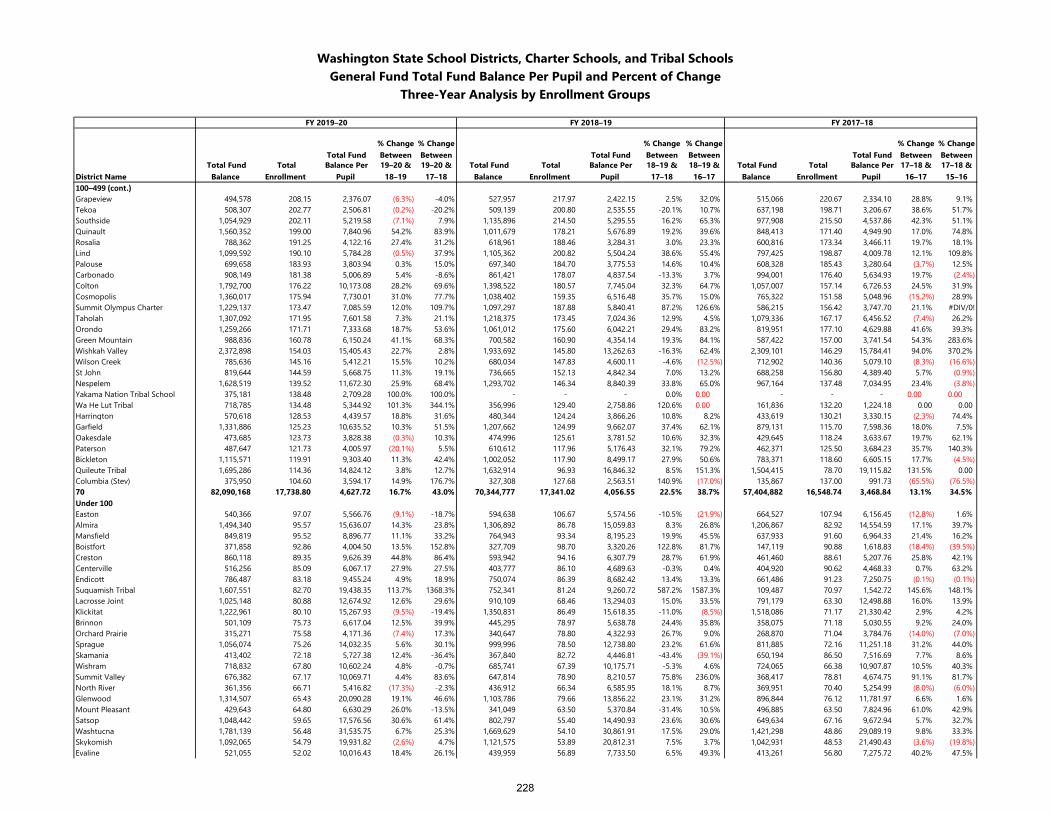
Washington State School Districts, Charter Schools, and Tribal SchoolsGeneral Fund Total Fund Balance Per Pupil and Percent of Change
Three-Year Analysis by Enrollment Groups
FY 2019–20 FY 2018–19 FY 2017–18
Total Fund % Change Between
% Change Between Total Fund
% Change Between
% Change Between Total Fund
% Change Between
% Change Between
District Name Total Fund
Balance Total
Enrollment Balance Per
Pupil 19–20 &
18–1919–20 &
17–18 Total Fund
Balance Total
Enrollment Balance Per
Pupil 18–19 &
17–1818–19 &
16–17 Total Fund
Balance Total
Enrollment Balance Per
Pupil 17–18 &
16–1717–18 &
15–16100–499 (cont.)Grapeview 494,578 208.15 2,376.07 (6.3%) -4.0% 527,957 217.97 2,422.15 2.5% 32.0% 515,066 220.67 2,334.10 28.8% 9.1%Tekoa 508,307 202.77 2,506.81 (0.2%) -20.2% 509,139 200.80 2,535.55 -20.1% 10.7% 637,198 198.71 3,206.67 38.6% 51.7%Southside 1,054,929 202.11 5,219.58 (7.1%) 7.9% 1,135,896 214.50 5,295.55 16.2% 65.3% 977,908 215.50 4,537.86 42.3% 51.1%Quinault 1,560,352 199.00 7,840.96 54.2% 83.9% 1,011,679 178.21 5,676.89 19.2% 39.6% 848,413 171.40 4,949.90 17.0% 74.8%Rosalia 788,362 191.25 4,122.16 27.4% 31.2% 618,961 188.46 3,284.31 3.0% 23.3% 600,816 173.34 3,466.11 19.7% 18.1%Lind 1,099,592 190.10 5,784.28 (0.5%) 37.9% 1,105,362 200.82 5,504.24 38.6% 55.4% 797,425 198.87 4,009.78 12.1% 109.8%Palouse 699,658 183.93 3,803.94 0.3% 15.0% 697,340 184.70 3,775.53 14.6% 10.4% 608,328 185.43 3,280.64 (3.7%) 12.5%Carbonado 908,149 181.38 5,006.89 5.4% -8.6% 861,421 178.07 4,837.54 -13.3% 3.7% 994,001 176.40 5,634.93 19.7% (2.4%) Colton 1,792,700 176.22 10,173.08 28.2% 69.6% 1,398,522 180.57 7,745.04 32.3% 64.7% 1,057,007 157.14 6,726.53 24.5% 31.9%Cosmopolis 1,360,017 175.94 7,730.01 31.0% 77.7% 1,038,402 159.35 6,516.48 35.7% 15.0% 765,322 151.58 5,048.96 (15.2%) 28.9%Summit Olympus Charter 1,229,137 173.47 7,085.59 12.0% 109.7% 1,097,297 187.88 5,840.41 87.2% 126.6% 586,215 156.42 3,747.70 21.1% #DIV/0!Taholah 1,307,092 171.95 7,601.58 7.3% 21.1% 1,218,375 173.45 7,024.36 12.9% 4.5% 1,079,336 167.17 6,456.52 (7.4%) 26.2%Orondo 1,259,266 171.71 7,333.68 18.7% 53.6% 1,061,012 175.60 6,042.21 29.4% 83.2% 819,951 177.10 4,629.88 41.6% 39.3%Green Mountain 988,836 160.78 6,150.24 41.1% 68.3% 700,582 160.90 4,354.14 19.3% 84.1% 587,422 157.00 3,741.54 54.3% 283.6%Wishkah Valley 2,372,898 154.03 15,405.43 22.7% 2.8% 1,933,692 145.80 13,262.63 -16.3% 62.4% 2,309,101 146.29 15,784.41 94.0% 370.2%Wilson Creek 785,636 145.16 5,412.21 15.5% 10.2% 680,034 147.83 4,600.11 -4.6% (12.5%) 712,902 140.36 5,079.10 (8.3%) (16.6%) St John 819,644 144.59 5,668.75 11.3% 19.1% 736,665 152.13 4,842.34 7.0% 13.2% 688,258 156.80 4,389.40 5.7% (0.9%) Nespelem 1,628,519 139.52 11,672.30 25.9% 68.4% 1,293,702 146.34 8,840.39 33.8% 65.0% 967,164 137.48 7,034.95 23.4% (3.8%) Yakama Nation Tribal School 375,181 138.48 2,709.28 100.0% 100.0% - - - 0.0% 0.00 - - - 0.00 0.00 Wa He Lut Tribal 718,785 134.48 5,344.92 101.3% 344.1% 356,996 129.40 2,758.86 120.6% 0.00 161,836 132.20 1,224.18 0.00 0.00Harrington 570,618 128.53 4,439.57 18.8% 31.6% 480,344 124.24 3,866.26 10.8% 8.2% 433,619 130.21 3,330.15 (2.3%) 74.4%Garfield 1,331,886 125.23 10,635.52 10.3% 51.5% 1,207,662 124.99 9,662.07 37.4% 62.1% 879,131 115.70 7,598.36 18.0% 7.5%Oakesdale 473,685 123.73 3,828.38 (0.3%) 10.3% 474,996 125.61 3,781.52 10.6% 32.3% 429,645 118.24 3,633.67 19.7% 62.1%Paterson 487,647 121.73 4,005.97 (20.1%) 5.5% 610,612 117.96 5,176.43 32.1% 79.2% 462,371 125.50 3,684.23 35.7% 140.3%Bickleton 1,115,571 119.91 9,303.40 11.3% 42.4% 1,002,052 117.90 8,499.17 27.9% 50.6% 783,371 118.60 6,605.15 17.7% (4.5%) Quileute Tribal 1,695,286 114.36 14,824.12 3.8% 12.7% 1,632,914 96.93 16,846.32 8.5% 151.3% 1,504,415 78.70 19,115.82 131.5% 0.00Columbia (Stev) 375,950 104.60 3,594.17 14.9% 176.7% 327,308 127.68 2,563.51 140.9% (17.0%) 135,867 137.00 991.73 (65.5%) (76.5%) 70 82,090,168 17,738.80 4,627.72 16.7% 43.0% 70,344,777 17,341.02 4,056.55 22.5% 38.7% 57,404,882 16,548.74 3,468.84 13.1% 34.5%Under 100Easton 540,366 97.07 5,566.76 (9.1%) -18.7% 594,638 106.67 5,574.56 -10.5% (21.9%) 664,527 107.94 6,156.45 (12.8%) 1.6%Almira 1,494,340 95.57 15,636.07 14.3% 23.8% 1,306,892 86.78 15,059.83 8.3% 26.8% 1,206,867 82.92 14,554.59 17.1% 39.7%Mansfield 849,819 95.52 8,896.77 11.1% 33.2% 764,943 93.34 8,195.23 19.9% 45.5% 637,933 91.60 6,964.33 21.4% 16.2%Boistfort 371,858 92.86 4,004.50 13.5% 152.8% 327,709 98.70 3,320.26 122.8% 81.7% 147,119 90.88 1,618.83 (18.4%) (39.5%) Creston 860,118 89.35 9,626.39 44.8% 86.4% 593,942 94.16 6,307.79 28.7% 61.9% 461,460 88.61 5,207.76 25.8% 42.1%Centerville 516,256 85.09 6,067.17 27.9% 27.5% 403,777 86.10 4,689.63 -0.3% 0.4% 404,920 90.62 4,468.33 0.7% 63.2%Endicott 786,487 83.18 9,455.24 4.9% 18.9% 750,074 86.39 8,682.42 13.4% 13.3% 661,486 91.23 7,250.75 (0.1%) (0.1%) Suquamish Tribal 1,607,551 82.70 19,438.35 113.7% 1368.3% 752,341 81.24 9,260.72 587.2% 1587.3% 109,487 70.97 1,542.72 145.6% 148.1%Lacrosse Joint 1,025,148 80.88 12,674.92 12.6% 29.6% 910,109 68.46 13,294.03 15.0% 33.5% 791,179 63.30 12,498.88 16.0% 13.9%Klickitat 1,222,961 80.10 15,267.93 (9.5%) -19.4% 1,350,831 86.49 15,618.35 -11.0% (8.5%) 1,518,086 71.17 21,330.42 2.9% 4.2%Brinnon 501,109 75.73 6,617.04 12.5% 39.9% 445,295 78.97 5,638.78 24.4% 35.8% 358,075 71.18 5,030.55 9.2% 24.0%Orchard Prairie 315,271 75.58 4,171.36 (7.4%) 17.3% 340,647 78.80 4,322.93 26.7% 9.0% 268,870 71.04 3,784.76 (14.0%) (7.0%) Sprague 1,056,074 75.26 14,032.35 5.6% 30.1% 999,996 78.50 12,738.80 23.2% 61.6% 811,885 72.16 11,251.18 31.2% 44.0%Skamania 413,402 72.18 5,727.38 12.4% -36.4% 367,840 82.72 4,446.81 -43.4% (39.1%) 650,194 86.50 7,516.69 7.7% 8.6%Wishram 718,832 67.80 10,602.24 4.8% -0.7% 685,741 67.39 10,175.71 -5.3% 4.6% 724,065 66.38 10,907.87 10.5% 40.3%Summit Valley 676,382 67.17 10,069.71 4.4% 83.6% 647,814 78.90 8,210.57 75.8% 236.0% 368,417 78.81 4,674.75 91.1% 81.7%North River 361,356 66.71 5,416.82 (17.3%) -2.3% 436,912 66.34 6,585.95 18.1% 8.7% 369,951 70.40 5,254.99 (8.0%) (6.0%) Glenwood 1,314,507 65.43 20,090.28 19.1% 46.6% 1,103,786 79.66 13,856.22 23.1% 31.2% 896,844 76.12 11,781.97 6.6% 1.6%Mount Pleasant 429,643 64.80 6,630.29 26.0% -13.5% 341,049 63.50 5,370.84 -31.4% 10.5% 496,885 63.50 7,824.96 61.0% 42.9%Satsop 1,048,442 59.65 17,576.56 30.6% 61.4% 802,797 55.40 14,490.93 23.6% 30.6% 649,634 67.16 9,672.94 5.7% 32.7%Washtucna 1,781,139 56.48 31,535.75 6.7% 25.3% 1,669,629 54.10 30,861.91 17.5% 29.0% 1,421,298 48.86 29,089.19 9.8% 33.3%Skykomish 1,092,065 54.79 19,931.82 (2.6%) 4.7% 1,121,575 53.89 20,812.31 7.5% 3.7% 1,042,931 48.53 21,490.43 (3.6%) (19.8%) Evaline 521,055 52.02 10,016.43 18.4% 26.1% 439,959 56.89 7,733.50 6.5% 49.3% 413,261 56.80 7,275.72 40.2% 47.5%
228
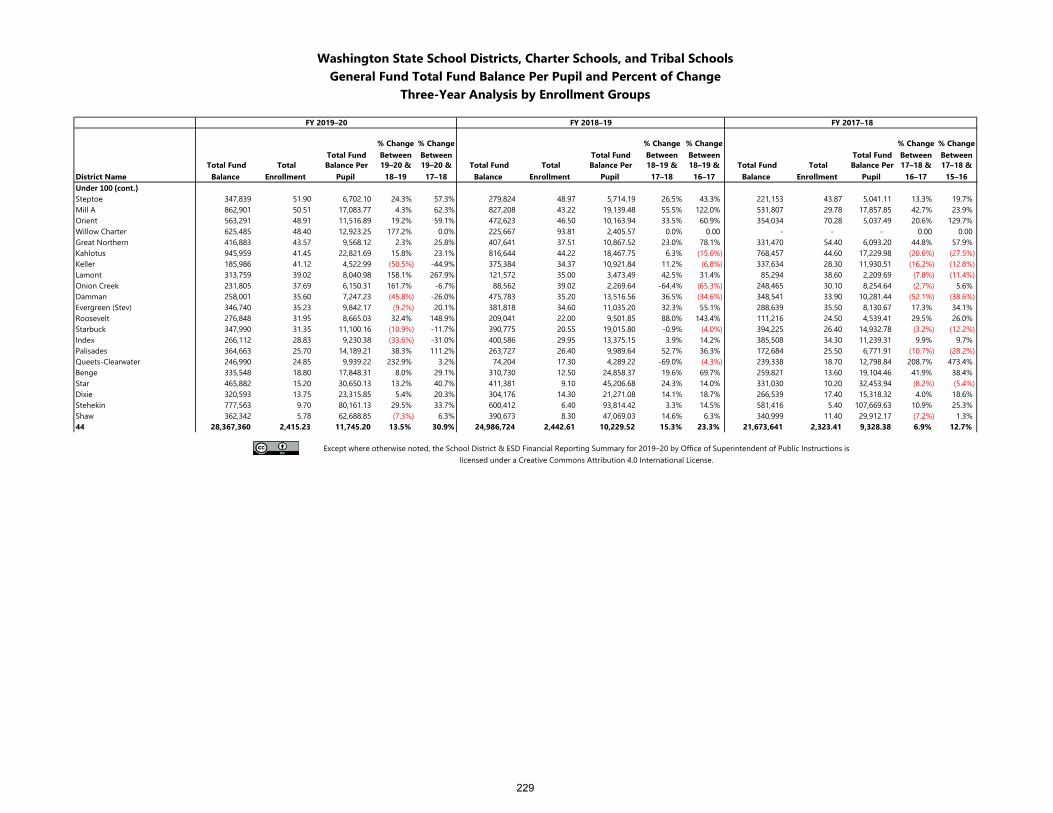
Washington State School Districts, Charter Schools, and Tribal SchoolsGeneral Fund Total Fund Balance Per Pupil and Percent of Change
Three-Year Analysis by Enrollment Groups
FY 2019–20 FY 2018–19 FY 2017–18
Total Fund % Change Between
% Change Between Total Fund
% Change Between
% Change Between Total Fund
% Change Between
% Change Between
District Name Total Fund
Balance Total
Enrollment Balance Per
Pupil 19–20 &
18–1919–20 &
17–18 Total Fund
Balance Total
Enrollment Balance Per
Pupil 18–19 &
17–1818–19 &
16–17 Total Fund
Balance Total
Enrollment Balance Per
Pupil 17–18 &
16–1717–18 &
15–16Under 100 (cont.)Steptoe 347,839 51.90 6,702.10 24.3% 57.3% 279,824 48.97 5,714.19 26.5% 43.3% 221,153 43.87 5,041.11 13.3% 19.7%Mill A 862,901 50.51 17,083.77 4.3% 62.3% 827,208 43.22 19,139.48 55.5% 122.0% 531,807 29.78 17,857.85 42.7% 23.9%Orient 563,291 48.91 11,516.89 19.2% 59.1% 472,623 46.50 10,163.94 33.5% 60.9% 354,034 70.28 5,037.49 20.6% 129.7%Willow Charter 625,485 48.40 12,923.25 177.2% 0.0% 225,667 93.81 2,405.57 0.0% 0.00 - - - 0.00 0.00Great Northern 416,883 43.57 9,568.12 2.3% 25.8% 407,641 37.51 10,867.52 23.0% 78.1% 331,470 54.40 6,093.20 44.8% 57.9%Kahlotus 945,959 41.45 22,821.69 15.8% 23.1% 816,644 44.22 18,467.75 6.3% (15.6%) 768,457 44.60 17,229.98 (20.6%) (27.5%) Keller 185,986 41.12 4,522.99 (50.5%) -44.9% 375,384 34.37 10,921.84 11.2% (6.8%) 337,634 28.30 11,930.51 (16.2%) (12.8%) Lamont 313,759 39.02 8,040.98 158.1% 267.9% 121,572 35.00 3,473.49 42.5% 31.4% 85,294 38.60 2,209.69 (7.8%) (11.4%) Onion Creek 231,805 37.69 6,150.31 161.7% -6.7% 88,562 39.02 2,269.64 -64.4% (65.3%) 248,465 30.10 8,254.64 (2.7%) 5.6%Damman 258,001 35.60 7,247.23 (45.8%) -26.0% 475,783 35.20 13,516.56 36.5% (34.6%) 348,541 33.90 10,281.44 (52.1%) (38.6%) Evergreen (Stev) 346,740 35.23 9,842.17 (9.2%) 20.1% 381,818 34.60 11,035.20 32.3% 55.1% 288,639 35.50 8,130.67 17.3% 34.1%Roosevelt 276,848 31.95 8,665.03 32.4% 148.9% 209,041 22.00 9,501.85 88.0% 143.4% 111,216 24.50 4,539.41 29.5% 26.0%Starbuck 347,990 31.35 11,100.16 (10.9%) -11.7% 390,775 20.55 19,015.80 -0.9% (4.0%) 394,225 26.40 14,932.78 (3.2%) (12.2%) Index 266,112 28.83 9,230.38 (33.6%) -31.0% 400,586 29.95 13,375.15 3.9% 14.2% 385,508 34.30 11,239.31 9.9% 9.7%Palisades 364,663 25.70 14,189.21 38.3% 111.2% 263,727 26.40 9,989.64 52.7% 36.3% 172,684 25.50 6,771.91 (10.7%) (28.2%) Queets-Clearwater 246,990 24.85 9,939.22 232.9% 3.2% 74,204 17.30 4,289.22 -69.0% (4.3%) 239,338 18.70 12,798.84 208.7% 473.4%Benge 335,548 18.80 17,848.31 8.0% 29.1% 310,730 12.50 24,858.37 19.6% 69.7% 259,821 13.60 19,104.46 41.9% 38.4%Star 465,882 15.20 30,650.13 13.2% 40.7% 411,381 9.10 45,206.68 24.3% 14.0% 331,030 10.20 32,453.94 (8.2%) (5.4%) Dixie 320,593 13.75 23,315.85 5.4% 20.3% 304,176 14.30 21,271.08 14.1% 18.7% 266,539 17.40 15,318.32 4.0% 18.6%Stehekin 777,563 9.70 80,161.13 29.5% 33.7% 600,412 6.40 93,814.42 3.3% 14.5% 581,416 5.40 107,669.63 10.9% 25.3%Shaw 362,342 5.78 62,688.85 (7.3%) 6.3% 390,673 8.30 47,069.03 14.6% 6.3% 340,999 11.40 29,912.17 (7.2%) 1.3%44 28,367,360 2,415.23 11,745.20 13.5% 30.9% 24,986,724 2,442.61 10,229.52 15.3% 23.3% 21,673,641 2,323.41 9,328.38 6.9% 12.7%
Except where otherwise noted, the School District & ESD Financial Reporting Summary for 2019–20 by Office of Superintendent of Public Instructions is licensed under a Creative Commons Attribution 4.0 International License.
229
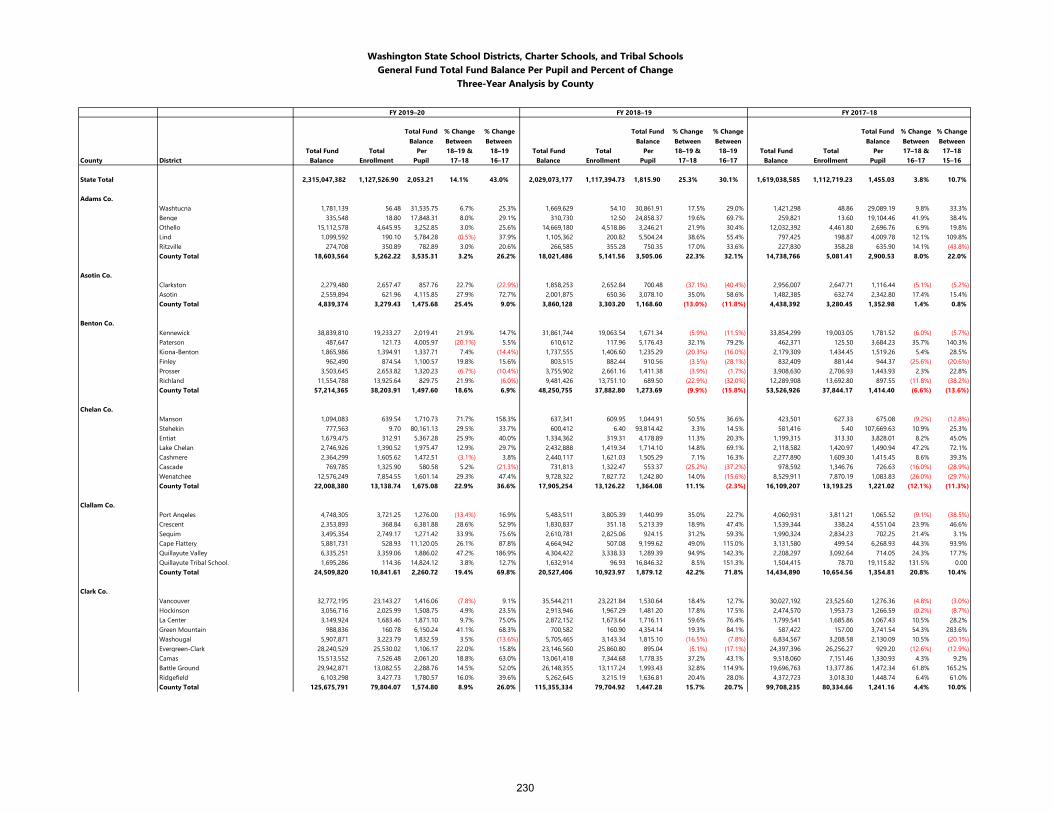
Washington State School Districts, Charter Schools, and Tribal SchoolsGeneral Fund Total Fund Balance Per Pupil and Percent of Change
Three-Year Analysis by County
FY 2019–20 FY 2018–19 FY 2017–18
Total Fund Balance
% Change Between
% Change Between
Total Fund Balance
% Change Between
% Change Between
Total Fund Balance
% Change Between
% Change Between
Total Fund Total Per 18–19 & 18–19 Total Fund Total Per 18–19 & 18–19 Total Fund Total Per 17–18 & 17–18County District Balance Enrollment Pupil 17–18 16–17 Balance Enrollment Pupil 17–18 16–17 Balance Enrollment Pupil 16–17 15–16
State Total 2,315,047,382 1,127,526.90 2,053.21 14.1% 43.0% 2,029,073,177 1,117,394.73 1,815.90 25.3% 30.1% 1,619,038,585 1,112,719.23 1,455.03 3.8% 10.7%
Adams Co.Washtucna 1,781,139 56.48 31,535.75 6.7% 25.3% 1,669,629 54.10 30,861.91 17.5% 29.0% 1,421,298 48.86 29,089.19 9.8% 33.3%Benge 335,548 18.80 17,848.31 8.0% 29.1% 310,730 12.50 24,858.37 19.6% 69.7% 259,821 13.60 19,104.46 41.9% 38.4%Othello 15,112,578 4,645.95 3,252.85 3.0% 25.6% 14,669,180 4,518.86 3,246.21 21.9% 30.4% 12,032,392 4,461.80 2,696.76 6.9% 19.8%Lind 1,099,592 190.10 5,784.28 (0.5%) 37.9% 1,105,362 200.82 5,504.24 38.6% 55.4% 797,425 198.87 4,009.78 12.1% 109.8%Ritzville 274,708 350.89 782.89 3.0% 20.6% 266,585 355.28 750.35 17.0% 33.6% 227,830 358.28 635.90 14.1% (43.8%) County Total 18,603,564 5,262.22 3,535.31 3.2% 26.2% 18,021,486 5,141.56 3,505.06 22.3% 32.1% 14,738,766 5,081.41 2,900.53 8.0% 22.0%
Asotin Co.Clarkston 2,279,480 2,657.47 857.76 22.7% (22.9%) 1,858,253 2,652.84 700.48 (37.1%) (40.4%) 2,956,007 2,647.71 1,116.44 (5.1%) (5.2%) Asotin 2,559,894 621.96 4,115.85 27.9% 72.7% 2,001,875 650.36 3,078.10 35.0% 58.6% 1,482,385 632.74 2,342.80 17.4% 15.4%County Total 4,839,374 3,279.43 1,475.68 25.4% 9.0% 3,860,128 3,303.20 1,168.60 (13.0%) (11.8%) 4,438,392 3,280.45 1,352.98 1.4% 0.8%
Benton Co.Kennewick 38,839,810 19,233.27 2,019.41 21.9% 14.7% 31,861,744 19,063.54 1,671.34 (5.9%) (11.5%) 33,854,299 19,003.05 1,781.52 (6.0%) (5.7%) Paterson 487,647 121.73 4,005.97 (20.1%) 5.5% 610,612 117.96 5,176.43 32.1% 79.2% 462,371 125.50 3,684.23 35.7% 140.3%Kiona-Benton 1,865,986 1,394.91 1,337.71 7.4% (14.4%) 1,737,555 1,406.60 1,235.29 (20.3%) (16.0%) 2,179,309 1,434.45 1,519.26 5.4% 28.5%Finley 962,490 874.54 1,100.57 19.8% 15.6% 803,515 882.44 910.56 (3.5%) (28.1%) 832,409 881.44 944.37 (25.6%) (20.6%) Prosser 3,503,645 2,653.82 1,320.23 (6.7%) (10.4%) 3,755,902 2,661.16 1,411.38 (3.9%) (1.7%) 3,908,630 2,706.93 1,443.93 2.3% 22.8%Richland 11,554,788 13,925.64 829.75 21.9% (6.0%) 9,481,426 13,751.10 689.50 (22.9%) (32.0%) 12,289,908 13,692.80 897.55 (11.8%) (38.2%) County Total 57,214,365 38,203.91 1,497.60 18.6% 6.9% 48,250,755 37,882.80 1,273.69 (9.9%) (15.8%) 53,526,926 37,844.17 1,414.40 (6.6%) (13.6%)
Chelan Co.Manson 1,094,083 639.54 1,710.73 71.7% 158.3% 637,341 609.95 1,044.91 50.5% 36.6% 423,501 627.33 675.08 (9.2%) (12.8%) Stehekin 777,563 9.70 80,161.13 29.5% 33.7% 600,412 6.40 93,814.42 3.3% 14.5% 581,416 5.40 107,669.63 10.9% 25.3%Entiat 1,679,475 312.91 5,367.28 25.9% 40.0% 1,334,362 319.31 4,178.89 11.3% 20.3% 1,199,315 313.30 3,828.01 8.2% 45.0%Lake Chelan 2,746,926 1,390.52 1,975.47 12.9% 29.7% 2,432,888 1,419.34 1,714.10 14.8% 69.1% 2,118,582 1,420.97 1,490.94 47.2% 72.1%Cashmere 2,364,299 1,605.62 1,472.51 (3.1%) 3.8% 2,440,117 1,621.03 1,505.29 7.1% 16.3% 2,277,890 1,609.30 1,415.45 8.6% 39.3%Cascade 769,785 1,325.90 580.58 5.2% (21.3%) 731,813 1,322.47 553.37 (25.2%) (37.2%) 978,592 1,346.76 726.63 (16.0%) (28.9%) Wenatchee 12,576,249 7,854.55 1,601.14 29.3% 47.4% 9,728,322 7,827.72 1,242.80 14.0% (15.6%) 8,529,911 7,870.19 1,083.83 (26.0%) (29.7%) County Total 22,008,380 13,138.74 1,675.08 22.9% 36.6% 17,905,254 13,126.22 1,364.08 11.1% (2.3%) 16,109,207 13,193.25 1,221.02 (12.1%) (11.3%)
Clallam Co.Port Angeles 4,748,305 3,721.25 1,276.00 (13.4%) 16.9% 5,483,511 3,805.39 1,440.99 35.0% 22.7% 4,060,931 3,811.21 1,065.52 (9.1%) (38.5%) Crescent 2,353,893 368.84 6,381.88 28.6% 52.9% 1,830,837 351.18 5,213.39 18.9% 47.4% 1,539,344 338.24 4,551.04 23.9% 46.6%Sequim 3,495,354 2,749.17 1,271.42 33.9% 75.6% 2,610,781 2,825.06 924.15 31.2% 59.3% 1,990,324 2,834.23 702.25 21.4% 3.1%Cape Flattery 5,881,731 528.93 11,120.05 26.1% 87.8% 4,664,942 507.08 9,199.62 49.0% 115.0% 3,131,580 499.54 6,268.93 44.3% 93.9%Quillayute Valley 6,335,251 3,359.06 1,886.02 47.2% 186.9% 4,304,422 3,338.33 1,289.39 94.9% 142.3% 2,208,297 3,092.64 714.05 24.3% 17.7%Quillayute Tribal School. 1,695,286 114.36 14,824.12 3.8% 12.7% 1,632,914 96.93 16,846.32 8.5% 151.3% 1,504,415 78.70 19,115.82 131.5% 0.00County Total 24,509,820 10,841.61 2,260.72 19.4% 69.8% 20,527,406 10,923.97 1,879.12 42.2% 71.8% 14,434,890 10,654.56 1,354.81 20.8% 10.4%
Clark Co.Vancouver 32,772,195 23,143.27 1,416.06 (7.8%) 9.1% 35,544,211 23,221.84 1,530.64 18.4% 12.7% 30,027,192 23,525.60 1,276.36 (4.8%) (3.0%) Hockinson 3,056,716 2,025.99 1,508.75 4.9% 23.5% 2,913,946 1,967.29 1,481.20 17.8% 17.5% 2,474,570 1,953.73 1,266.59 (0.2%) (8.7%) La Center 3,149,924 1,683.46 1,871.10 9.7% 75.0% 2,872,152 1,673.64 1,716.11 59.6% 76.4% 1,799,541 1,685.86 1,067.43 10.5% 28.2%Green Mountain 988,836 160.78 6,150.24 41.1% 68.3% 700,582 160.90 4,354.14 19.3% 84.1% 587,422 157.00 3,741.54 54.3% 283.6%Washougal 5,907,871 3,223.79 1,832.59 3.5% (13.6%) 5,705,465 3,143.34 1,815.10 (16.5%) (7.8%) 6,834,567 3,208.58 2,130.09 10.5% (20.1%) Evergreen-Clark 28,240,529 25,530.02 1,106.17 22.0% 15.8% 23,146,560 25,860.80 895.04 (5.1%) (17.1%) 24,397,396 26,256.27 929.20 (12.6%) (12.9%) Camas 15,513,552 7,526.48 2,061.20 18.8% 63.0% 13,061,418 7,344.68 1,778.35 37.2% 43.1% 9,518,060 7,151.46 1,330.93 4.3% 9.2%Battle Ground 29,942,871 13,082.55 2,288.76 14.5% 52.0% 26,148,355 13,117.24 1,993.43 32.8% 114.9% 19,696,763 13,377.86 1,472.34 61.8% 165.2%Ridgefield 6,103,298 3,427.73 1,780.57 16.0% 39.6% 5,262,645 3,215.19 1,636.81 20.4% 28.0% 4,372,723 3,018.30 1,448.74 6.4% 61.0%County Total 125,675,791 79,804.07 1,574.80 8.9% 26.0% 115,355,334 79,704.92 1,447.28 15.7% 20.7% 99,708,235 80,334.66 1,241.16 4.4% 10.0%
230
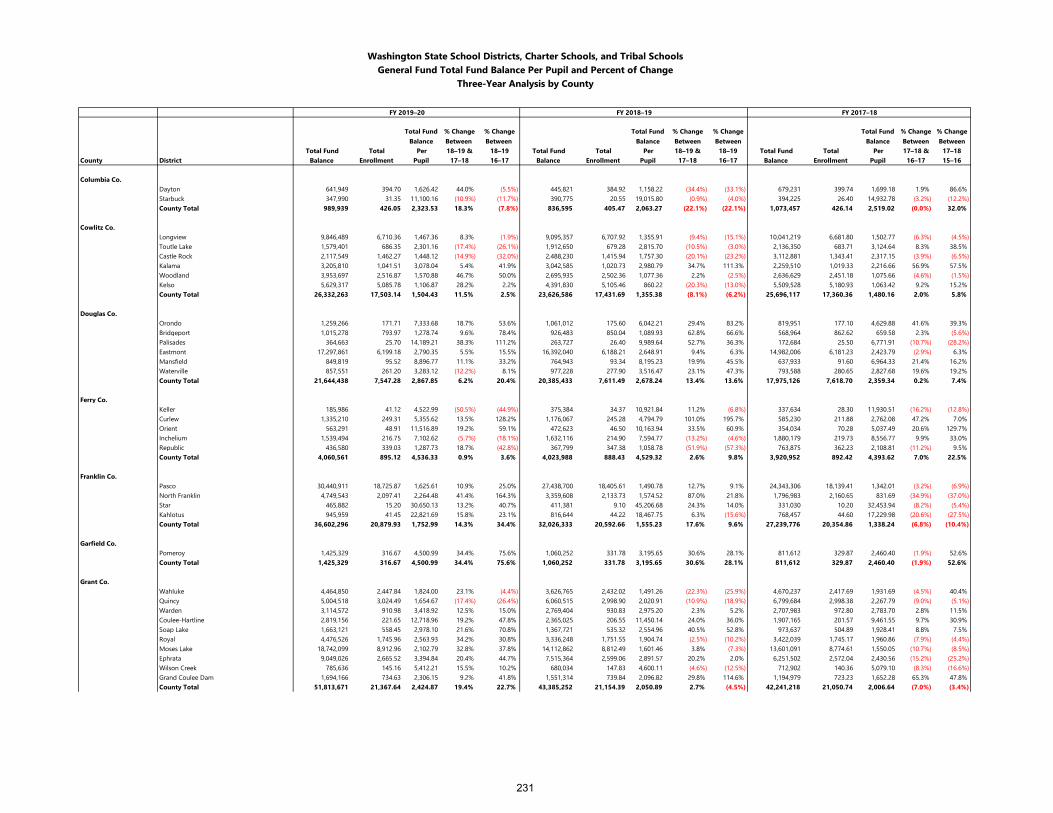
Washington State School Districts, Charter Schools, and Tribal SchoolsGeneral Fund Total Fund Balance Per Pupil and Percent of Change
Three-Year Analysis by County
FY 2019–20 FY 2018–19 FY 2017–18
Total Fund Balance
% Change Between
% Change Between
Total Fund Balance
% Change Between
% Change Between
Total Fund Balance
% Change Between
% Change Between
Total Fund Total Per 18–19 & 18–19 Total Fund Total Per 18–19 & 18–19 Total Fund Total Per 17–18 & 17–18County District Balance Enrollment Pupil 17–18 16–17 Balance Enrollment Pupil 17–18 16–17 Balance Enrollment Pupil 16–17 15–16
Columbia Co.Dayton 641,949 394.70 1,626.42 44.0% (5.5%) 445,821 384.92 1,158.22 (34.4%) (33.1%) 679,231 399.74 1,699.18 1.9% 86.6%Starbuck 347,990 31.35 11,100.16 (10.9%) (11.7%) 390,775 20.55 19,015.80 (0.9%) (4.0%) 394,225 26.40 14,932.78 (3.2%) (12.2%) County Total 989,939 426.05 2,323.53 18.3% (7.8%) 836,595 405.47 2,063.27 (22.1%) (22.1%) 1,073,457 426.14 2,519.02 (0.0%) 32.0%
Cowlitz Co.Longview 9,846,489 6,710.36 1,467.36 8.3% (1.9%) 9,095,357 6,707.92 1,355.91 (9.4%) (15.1%) 10,041,219 6,681.80 1,502.77 (6.3%) (4.5%) Toutle Lake 1,579,401 686.35 2,301.16 (17.4%) (26.1%) 1,912,650 679.28 2,815.70 (10.5%) (3.0%) 2,136,350 683.71 3,124.64 8.3% 38.5%Castle Rock 2,117,549 1,462.27 1,448.12 (14.9%) (32.0%) 2,488,230 1,415.94 1,757.30 (20.1%) (23.2%) 3,112,881 1,343.41 2,317.15 (3.9%) (6.5%) Kalama 3,205,810 1,041.51 3,078.04 5.4% 41.9% 3,042,585 1,020.73 2,980.79 34.7% 111.3% 2,259,510 1,019.33 2,216.66 56.9% 57.5%Woodland 3,953,697 2,516.87 1,570.88 46.7% 50.0% 2,695,935 2,502.36 1,077.36 2.2% (2.5%) 2,636,629 2,451.18 1,075.66 (4.6%) (1.5%) Kelso 5,629,317 5,085.78 1,106.87 28.2% 2.2% 4,391,830 5,105.46 860.22 (20.3%) (13.0%) 5,509,528 5,180.93 1,063.42 9.2% 15.2%County Total 26,332,263 17,503.14 1,504.43 11.5% 2.5% 23,626,586 17,431.69 1,355.38 (8.1%) (6.2%) 25,696,117 17,360.36 1,480.16 2.0% 5.8%
Douglas Co.Orondo 1,259,266 171.71 7,333.68 18.7% 53.6% 1,061,012 175.60 6,042.21 29.4% 83.2% 819,951 177.10 4,629.88 41.6% 39.3%Bridgeport 1,015,278 793.97 1,278.74 9.6% 78.4% 926,483 850.04 1,089.93 62.8% 66.6% 568,964 862.62 659.58 2.3% (5.6%) Palisades 364,663 25.70 14,189.21 38.3% 111.2% 263,727 26.40 9,989.64 52.7% 36.3% 172,684 25.50 6,771.91 (10.7%) (28.2%) Eastmont 17,297,861 6,199.18 2,790.35 5.5% 15.5% 16,392,040 6,188.21 2,648.91 9.4% 6.3% 14,982,006 6,181.23 2,423.79 (2.9%) 6.3%Mansfield 849,819 95.52 8,896.77 11.1% 33.2% 764,943 93.34 8,195.23 19.9% 45.5% 637,933 91.60 6,964.33 21.4% 16.2%Waterville 857,551 261.20 3,283.12 (12.2%) 8.1% 977,228 277.90 3,516.47 23.1% 47.3% 793,588 280.65 2,827.68 19.6% 19.2%County Total 21,644,438 7,547.28 2,867.85 6.2% 20.4% 20,385,433 7,611.49 2,678.24 13.4% 13.6% 17,975,126 7,618.70 2,359.34 0.2% 7.4%
Ferry Co.Keller 185,986 41.12 4,522.99 (50.5%) (44.9%) 375,384 34.37 10,921.84 11.2% (6.8%) 337,634 28.30 11,930.51 (16.2%) (12.8%) Curlew 1,335,210 249.31 5,355.62 13.5% 128.2% 1,176,067 245.28 4,794.79 101.0% 195.7% 585,230 211.88 2,762.08 47.2% 7.0%Orient 563,291 48.91 11,516.89 19.2% 59.1% 472,623 46.50 10,163.94 33.5% 60.9% 354,034 70.28 5,037.49 20.6% 129.7%Inchelium 1,539,494 216.75 7,102.62 (5.7%) (18.1%) 1,632,116 214.90 7,594.77 (13.2%) (4.6%) 1,880,179 219.73 8,556.77 9.9% 33.0%Republic 436,580 339.03 1,287.73 18.7% (42.8%) 367,799 347.38 1,058.78 (51.9%) (57.3%) 763,875 362.23 2,108.81 (11.2%) 9.5%County Total 4,060,561 895.12 4,536.33 0.9% 3.6% 4,023,988 888.43 4,529.32 2.6% 9.8% 3,920,952 892.42 4,393.62 7.0% 22.5%
Franklin Co.Pasco 30,440,911 18,725.87 1,625.61 10.9% 25.0% 27,438,700 18,405.61 1,490.78 12.7% 9.1% 24,343,306 18,139.41 1,342.01 (3.2%) (6.9%) North Franklin 4,749,543 2,097.41 2,264.48 41.4% 164.3% 3,359,608 2,133.73 1,574.52 87.0% 21.8% 1,796,983 2,160.65 831.69 (34.9%) (37.0%) Star 465,882 15.20 30,650.13 13.2% 40.7% 411,381 9.10 45,206.68 24.3% 14.0% 331,030 10.20 32,453.94 (8.2%) (5.4%) Kahlotus 945,959 41.45 22,821.69 15.8% 23.1% 816,644 44.22 18,467.75 6.3% (15.6%) 768,457 44.60 17,229.98 (20.6%) (27.5%) County Total 36,602,296 20,879.93 1,752.99 14.3% 34.4% 32,026,333 20,592.66 1,555.23 17.6% 9.6% 27,239,776 20,354.86 1,338.24 (6.8%) (10.4%)
Garfield Co.Pomeroy 1,425,329 316.67 4,500.99 34.4% 75.6% 1,060,252 331.78 3,195.65 30.6% 28.1% 811,612 329.87 2,460.40 (1.9%) 52.6%County Total 1,425,329 316.67 4,500.99 34.4% 75.6% 1,060,252 331.78 3,195.65 30.6% 28.1% 811,612 329.87 2,460.40 (1.9%) 52.6%
Grant Co.Wahluke 4,464,850 2,447.84 1,824.00 23.1% (4.4%) 3,626,765 2,432.02 1,491.26 (22.3%) (25.9%) 4,670,237 2,417.69 1,931.69 (4.5%) 40.4%Quincy 5,004,518 3,024.49 1,654.67 (17.4%) (26.4%) 6,060,515 2,998.90 2,020.91 (10.9%) (18.9%) 6,799,684 2,998.38 2,267.79 (9.0%) (5.1%) Warden 3,114,572 910.98 3,418.92 12.5% 15.0% 2,769,404 930.83 2,975.20 2.3% 5.2% 2,707,983 972.80 2,783.70 2.8% 11.5%Coulee-Hartline 2,819,156 221.65 12,718.96 19.2% 47.8% 2,365,025 206.55 11,450.14 24.0% 36.0% 1,907,165 201.57 9,461.55 9.7% 30.9%Soap Lake 1,663,121 558.45 2,978.10 21.6% 70.8% 1,367,721 535.32 2,554.96 40.5% 52.8% 973,637 504.89 1,928.41 8.8% 7.5%Royal 4,476,526 1,745.96 2,563.93 34.2% 30.8% 3,336,248 1,751.55 1,904.74 (2.5%) (10.2%) 3,422,039 1,745.17 1,960.86 (7.9%) (4.4%) Moses Lake 18,742,099 8,912.96 2,102.79 32.8% 37.8% 14,112,862 8,812.49 1,601.46 3.8% (7.3%) 13,601,091 8,774.61 1,550.05 (10.7%) (8.5%) Ephrata 9,049,026 2,665.52 3,394.84 20.4% 44.7% 7,515,364 2,599.06 2,891.57 20.2% 2.0% 6,251,502 2,572.04 2,430.56 (15.2%) (25.2%) Wilson Creek 785,636 145.16 5,412.21 15.5% 10.2% 680,034 147.83 4,600.11 (4.6%) (12.5%) 712,902 140.36 5,079.10 (8.3%) (16.6%) Grand Coulee Dam 1,694,166 734.63 2,306.15 9.2% 41.8% 1,551,314 739.84 2,096.82 29.8% 114.6% 1,194,979 723.23 1,652.28 65.3% 47.8%County Total 51,813,671 21,367.64 2,424.87 19.4% 22.7% 43,385,252 21,154.39 2,050.89 2.7% (4.5%) 42,241,218 21,050.74 2,006.64 (7.0%) (3.4%)
231
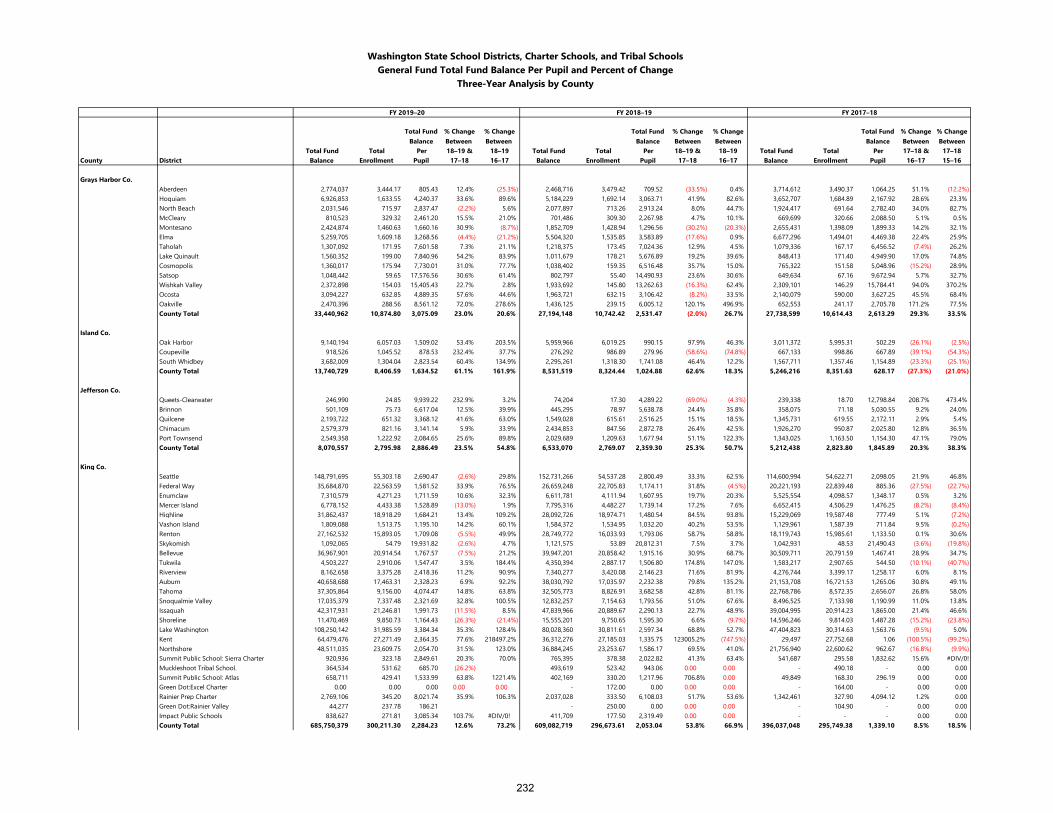
Washington State School Districts, Charter Schools, and Tribal SchoolsGeneral Fund Total Fund Balance Per Pupil and Percent of Change
Three-Year Analysis by County
FY 2019–20 FY 2018–19 FY 2017–18
Total Fund Balance
% Change Between
% Change Between
Total Fund Balance
% Change Between
% Change Between
Total Fund Balance
% Change Between
% Change Between
Total Fund Total Per 18–19 & 18–19 Total Fund Total Per 18–19 & 18–19 Total Fund Total Per 17–18 & 17–18County District Balance Enrollment Pupil 17–18 16–17 Balance Enrollment Pupil 17–18 16–17 Balance Enrollment Pupil 16–17 15–16
Grays Harbor Co.Aberdeen 2,774,037 3,444.17 805.43 12.4% (25.3%) 2,468,716 3,479.42 709.52 (33.5%) 0.4% 3,714,612 3,490.37 1,064.25 51.1% (12.2%) Hoquiam 6,926,853 1,633.55 4,240.37 33.6% 89.6% 5,184,229 1,692.14 3,063.71 41.9% 82.6% 3,652,707 1,684.89 2,167.92 28.6% 23.3%North Beach 2,031,546 715.97 2,837.47 (2.2%) 5.6% 2,077,897 713.26 2,913.24 8.0% 44.7% 1,924,417 691.64 2,782.40 34.0% 82.7%McCleary 810,523 329.32 2,461.20 15.5% 21.0% 701,486 309.30 2,267.98 4.7% 10.1% 669,699 320.66 2,088.50 5.1% 0.5%Montesano 2,424,874 1,460.63 1,660.16 30.9% (8.7%) 1,852,709 1,428.94 1,296.56 (30.2%) (20.3%) 2,655,431 1,398.09 1,899.33 14.2% 32.1%Elma 5,259,705 1,609.18 3,268.56 (4.4%) (21.2%) 5,504,320 1,535.85 3,583.89 (17.6%) 0.9% 6,677,296 1,494.01 4,469.38 22.4% 25.9%Taholah 1,307,092 171.95 7,601.58 7.3% 21.1% 1,218,375 173.45 7,024.36 12.9% 4.5% 1,079,336 167.17 6,456.52 (7.4%) 26.2%Lake Quinault 1,560,352 199.00 7,840.96 54.2% 83.9% 1,011,679 178.21 5,676.89 19.2% 39.6% 848,413 171.40 4,949.90 17.0% 74.8%Cosmopolis 1,360,017 175.94 7,730.01 31.0% 77.7% 1,038,402 159.35 6,516.48 35.7% 15.0% 765,322 151.58 5,048.96 (15.2%) 28.9%Satsop 1,048,442 59.65 17,576.56 30.6% 61.4% 802,797 55.40 14,490.93 23.6% 30.6% 649,634 67.16 9,672.94 5.7% 32.7%Wishkah Valley 2,372,898 154.03 15,405.43 22.7% 2.8% 1,933,692 145.80 13,262.63 (16.3%) 62.4% 2,309,101 146.29 15,784.41 94.0% 370.2%Ocosta 3,094,227 632.85 4,889.35 57.6% 44.6% 1,963,721 632.15 3,106.42 (8.2%) 33.5% 2,140,079 590.00 3,627.25 45.5% 68.4%Oakville 2,470,396 288.56 8,561.12 72.0% 278.6% 1,436,125 239.15 6,005.12 120.1% 496.9% 652,553 241.17 2,705.78 171.2% 77.5%County Total 33,440,962 10,874.80 3,075.09 23.0% 20.6% 27,194,148 10,742.42 2,531.47 (2.0%) 26.7% 27,738,599 10,614.43 2,613.29 29.3% 33.5%
Island Co.Oak Harbor 9,140,194 6,057.03 1,509.02 53.4% 203.5% 5,959,966 6,019.25 990.15 97.9% 46.3% 3,011,372 5,995.31 502.29 (26.1%) (2.5%) Coupeville 918,526 1,045.52 878.53 232.4% 37.7% 276,292 986.89 279.96 (58.6%) (74.8%) 667,133 998.86 667.89 (39.1%) (54.3%) South Whidbey 3,682,009 1,304.04 2,823.54 60.4% 134.9% 2,295,261 1,318.30 1,741.08 46.4% 12.2% 1,567,711 1,357.46 1,154.89 (23.3%) (25.1%) County Total 13,740,729 8,406.59 1,634.52 61.1% 161.9% 8,531,519 8,324.44 1,024.88 62.6% 18.3% 5,246,216 8,351.63 628.17 (27.3%) (21.0%)
Jefferson Co.Queets-Clearwater 246,990 24.85 9,939.22 232.9% 3.2% 74,204 17.30 4,289.22 (69.0%) (4.3%) 239,338 18.70 12,798.84 208.7% 473.4%Brinnon 501,109 75.73 6,617.04 12.5% 39.9% 445,295 78.97 5,638.78 24.4% 35.8% 358,075 71.18 5,030.55 9.2% 24.0%Quilcene 2,193,722 651.32 3,368.12 41.6% 63.0% 1,549,028 615.61 2,516.25 15.1% 18.5% 1,345,731 619.55 2,172.11 2.9% 5.4%Chimacum 2,579,379 821.16 3,141.14 5.9% 33.9% 2,434,853 847.56 2,872.78 26.4% 42.5% 1,926,270 950.87 2,025.80 12.8% 36.5%Port Townsend 2,549,358 1,222.92 2,084.65 25.6% 89.8% 2,029,689 1,209.63 1,677.94 51.1% 122.3% 1,343,025 1,163.50 1,154.30 47.1% 79.0%County Total 8,070,557 2,795.98 2,886.49 23.5% 54.8% 6,533,070 2,769.07 2,359.30 25.3% 50.7% 5,212,438 2,823.80 1,845.89 20.3% 38.3%
King Co.Seattle 148,791,695 55,303.18 2,690.47 (2.6%) 29.8% 152,731,266 54,537.28 2,800.49 33.3% 62.5% 114,600,994 54,622.71 2,098.05 21.9% 46.8%Federal Way 35,684,870 22,563.59 1,581.52 33.9% 76.5% 26,659,248 22,705.83 1,174.11 31.8% (4.5%) 20,221,193 22,839.48 885.36 (27.5%) (22.7%) Enumclaw 7,310,579 4,271.23 1,711.59 10.6% 32.3% 6,611,781 4,111.94 1,607.95 19.7% 20.3% 5,525,554 4,098.57 1,348.17 0.5% 3.2%Mercer Island 6,778,152 4,433.38 1,528.89 (13.0%) 1.9% 7,795,316 4,482.27 1,739.14 17.2% 7.6% 6,652,415 4,506.29 1,476.25 (8.2%) (8.4%) Highline 31,862,437 18,918.29 1,684.21 13.4% 109.2% 28,092,726 18,974.71 1,480.54 84.5% 93.8% 15,229,069 19,587.48 777.49 5.1% (7.2%) Vashon Island 1,809,088 1,513.75 1,195.10 14.2% 60.1% 1,584,372 1,534.95 1,032.20 40.2% 53.5% 1,129,961 1,587.39 711.84 9.5% (0.2%) Renton 27,162,532 15,893.05 1,709.08 (5.5%) 49.9% 28,749,772 16,033.93 1,793.06 58.7% 58.8% 18,119,743 15,985.61 1,133.50 0.1% 30.6%Skykomish 1,092,065 54.79 19,931.82 (2.6%) 4.7% 1,121,575 53.89 20,812.31 7.5% 3.7% 1,042,931 48.53 21,490.43 (3.6%) (19.8%) Bellevue 36,967,901 20,914.54 1,767.57 (7.5%) 21.2% 39,947,201 20,858.42 1,915.16 30.9% 68.7% 30,509,711 20,791.59 1,467.41 28.9% 34.7%Tukwila 4,503,227 2,910.06 1,547.47 3.5% 184.4% 4,350,394 2,887.17 1,506.80 174.8% 147.0% 1,583,217 2,907.65 544.50 (10.1%) (40.7%) Riverview 8,162,658 3,375.28 2,418.36 11.2% 90.9% 7,340,277 3,420.08 2,146.23 71.6% 81.9% 4,276,744 3,399.17 1,258.17 6.0% 8.1%Auburn 40,658,688 17,463.31 2,328.23 6.9% 92.2% 38,030,792 17,035.97 2,232.38 79.8% 135.2% 21,153,708 16,721.53 1,265.06 30.8% 49.1%Tahoma 37,305,864 9,156.00 4,074.47 14.8% 63.8% 32,505,773 8,826.91 3,682.58 42.8% 81.1% 22,768,786 8,572.35 2,656.07 26.8% 58.0%Snoqualmie Valley 17,035,379 7,337.48 2,321.69 32.8% 100.5% 12,832,257 7,154.63 1,793.56 51.0% 67.6% 8,496,525 7,133.98 1,190.99 11.0% 13.8%Issaquah 42,317,931 21,246.81 1,991.73 (11.5%) 8.5% 47,839,966 20,889.67 2,290.13 22.7% 48.9% 39,004,995 20,914.23 1,865.00 21.4% 46.6%Shoreline 11,470,469 9,850.73 1,164.43 (26.3%) (21.4%) 15,555,201 9,750.65 1,595.30 6.6% (9.7%) 14,596,246 9,814.03 1,487.28 (15.2%) (23.8%) Lake Washington 108,250,142 31,985.59 3,384.34 35.3% 128.4% 80,028,360 30,811.61 2,597.34 68.8% 52.7% 47,404,823 30,314.63 1,563.76 (9.5%) 5.0%Kent 64,479,476 27,271.49 2,364.35 77.6% 218497.2% 36,312,276 27,185.03 1,335.75 123005.2% (747.5%) 29,497 27,752.68 1.06 (100.5%) (99.2%) Northshore 48,511,035 23,609.75 2,054.70 31.5% 123.0% 36,884,245 23,253.67 1,586.17 69.5% 41.0% 21,756,940 22,600.62 962.67 (16.8%) (9.9%) Summit Public School: Sierra Charter 920,936 323.18 2,849.61 20.3% 70.0% 765,395 378.38 2,022.82 41.3% 63.4% 541,687 295.58 1,832.62 15.6% #DIV/0!Muckleshoot Tribal School. 364,534 531.62 685.70 (26.2%) 493,619 523.42 943.06 0.00 0.00 - 490.18 - 0.00 0.00Summit Public School: Atlas 658,711 429.41 1,533.99 63.8% 1221.4% 402,169 330.20 1,217.96 706.8% 0.00 49,849 168.30 296.19 0.00 0.00Green Dot:Excel Charter 0.00 0.00 0.00 0.00 0.00 - 172.00 0.00 0.00 0.00 - 164.00 - 0.00 0.00Rainier Prep Charter 2,769,106 345.20 8,021.74 35.9% 106.3% 2,037,028 333.50 6,108.03 51.7% 53.6% 1,342,461 327.90 4,094.12 1.2% 0.00Green Dot:Rainier Valley 44,277 237.78 186.21 - 250.00 0.00 0.00 0.00 - 104.90 - 0.00 0.00Impact Public Schools 838,627 271.81 3,085.34 103.7% #DIV/0! 411,709 177.50 2,319.49 0.00 0.00 - - - 0.00 0.00County Total 685,750,379 300,211.30 2,284.23 12.6% 73.2% 609,082,719 296,673.61 2,053.04 53.8% 66.9% 396,037,048 295,749.38 1,339.10 8.5% 18.5%
232
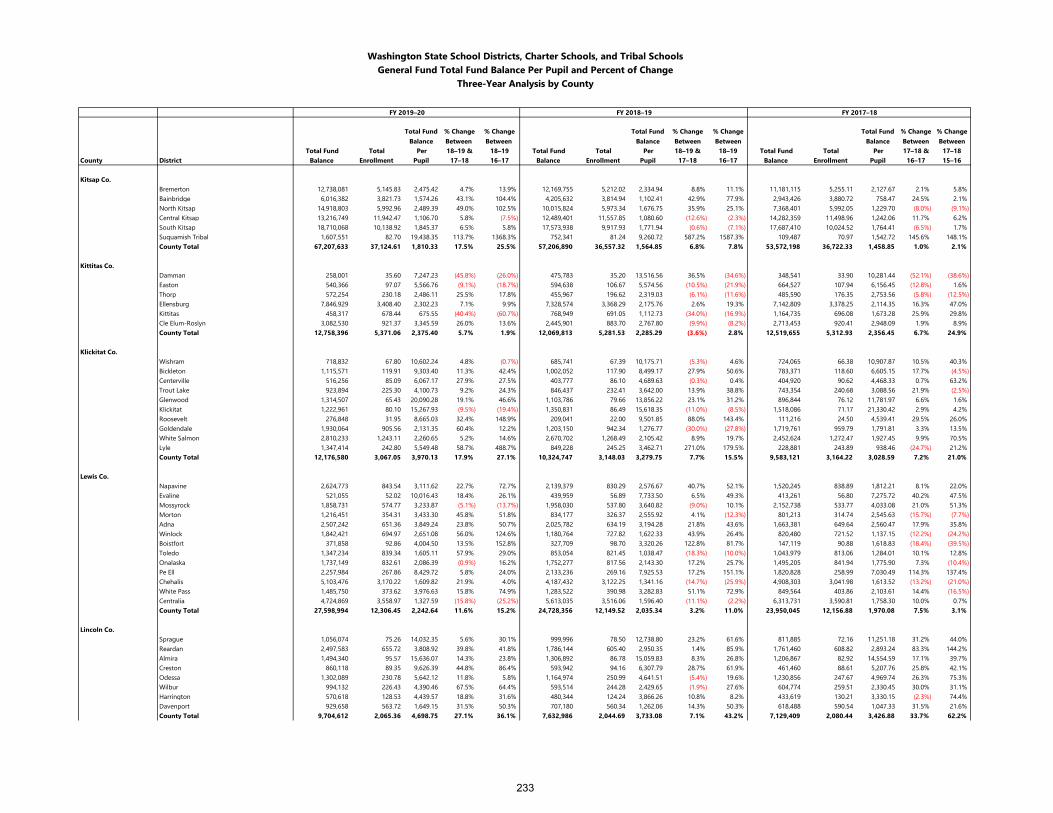
Washington State School Districts, Charter Schools, and Tribal SchoolsGeneral Fund Total Fund Balance Per Pupil and Percent of Change
Three-Year Analysis by County
FY 2019–20 FY 2018–19 FY 2017–18
Total Fund Balance
% Change Between
% Change Between
Total Fund Balance
% Change Between
% Change Between
Total Fund Balance
% Change Between
% Change Between
Total Fund Total Per 18–19 & 18–19 Total Fund Total Per 18–19 & 18–19 Total Fund Total Per 17–18 & 17–18County District Balance Enrollment Pupil 17–18 16–17 Balance Enrollment Pupil 17–18 16–17 Balance Enrollment Pupil 16–17 15–16
Kitsap Co.Bremerton 12,738,081 5,145.83 2,475.42 4.7% 13.9% 12,169,755 5,212.02 2,334.94 8.8% 11.1% 11,181,115 5,255.11 2,127.67 2.1% 5.8%Bainbridge 6,016,382 3,821.73 1,574.26 43.1% 104.4% 4,205,632 3,814.94 1,102.41 42.9% 77.9% 2,943,426 3,880.72 758.47 24.5% 2.1%North Kitsap 14,918,803 5,992.96 2,489.39 49.0% 102.5% 10,015,824 5,973.34 1,676.75 35.9% 25.1% 7,368,401 5,992.05 1,229.70 (8.0%) (9.1%) Central Kitsap 13,216,749 11,942.47 1,106.70 5.8% (7.5%) 12,489,401 11,557.85 1,080.60 (12.6%) (2.3%) 14,282,359 11,498.96 1,242.06 11.7% 6.2%South Kitsap 18,710,068 10,138.92 1,845.37 6.5% 5.8% 17,573,938 9,917.93 1,771.94 (0.6%) (7.1%) 17,687,410 10,024.52 1,764.41 (6.5%) 1.7%Suquamish Tribal 1,607,551 82.70 19,438.35 113.7% 1368.3% 752,341 81.24 9,260.72 587.2% 1587.3% 109,487 70.97 1,542.72 145.6% 148.1%County Total 67,207,633 37,124.61 1,810.33 17.5% 25.5% 57,206,890 36,557.32 1,564.85 6.8% 7.8% 53,572,198 36,722.33 1,458.85 1.0% 2.1%
Kittitas Co.Damman 258,001 35.60 7,247.23 (45.8%) (26.0%) 475,783 35.20 13,516.56 36.5% (34.6%) 348,541 33.90 10,281.44 (52.1%) (38.6%) Easton 540,366 97.07 5,566.76 (9.1%) (18.7%) 594,638 106.67 5,574.56 (10.5%) (21.9%) 664,527 107.94 6,156.45 (12.8%) 1.6%Thorp 572,254 230.18 2,486.11 25.5% 17.8% 455,967 196.62 2,319.03 (6.1%) (11.6%) 485,590 176.35 2,753.56 (5.8%) (12.5%) Ellensburg 7,846,929 3,408.40 2,302.23 7.1% 9.9% 7,328,574 3,368.29 2,175.76 2.6% 19.3% 7,142,809 3,378.25 2,114.35 16.3% 47.0%Kittitas 458,317 678.44 675.55 (40.4%) (60.7%) 768,949 691.05 1,112.73 (34.0%) (16.9%) 1,164,735 696.08 1,673.28 25.9% 29.8%Cle Elum-Roslyn 3,082,530 921.37 3,345.59 26.0% 13.6% 2,445,901 883.70 2,767.80 (9.9%) (8.2%) 2,713,453 920.41 2,948.09 1.9% 8.9%County Total 12,758,396 5,371.06 2,375.40 5.7% 1.9% 12,069,813 5,281.53 2,285.29 (3.6%) 2.8% 12,519,655 5,312.93 2,356.45 6.7% 24.9%
Klickitat Co.Wishram 718,832 67.80 10,602.24 4.8% (0.7%) 685,741 67.39 10,175.71 (5.3%) 4.6% 724,065 66.38 10,907.87 10.5% 40.3%Bickleton 1,115,571 119.91 9,303.40 11.3% 42.4% 1,002,052 117.90 8,499.17 27.9% 50.6% 783,371 118.60 6,605.15 17.7% (4.5%) Centerville 516,256 85.09 6,067.17 27.9% 27.5% 403,777 86.10 4,689.63 (0.3%) 0.4% 404,920 90.62 4,468.33 0.7% 63.2%Trout Lake 923,894 225.30 4,100.73 9.2% 24.3% 846,437 232.41 3,642.00 13.9% 38.8% 743,354 240.68 3,088.56 21.9% (2.5%) Glenwood 1,314,507 65.43 20,090.28 19.1% 46.6% 1,103,786 79.66 13,856.22 23.1% 31.2% 896,844 76.12 11,781.97 6.6% 1.6%Klickitat 1,222,961 80.10 15,267.93 (9.5%) (19.4%) 1,350,831 86.49 15,618.35 (11.0%) (8.5%) 1,518,086 71.17 21,330.42 2.9% 4.2%Roosevelt 276,848 31.95 8,665.03 32.4% 148.9% 209,041 22.00 9,501.85 88.0% 143.4% 111,216 24.50 4,539.41 29.5% 26.0%Goldendale 1,930,064 905.56 2,131.35 60.4% 12.2% 1,203,150 942.34 1,276.77 (30.0%) (27.8%) 1,719,761 959.79 1,791.81 3.3% 13.5%White Salmon 2,810,233 1,243.11 2,260.65 5.2% 14.6% 2,670,702 1,268.49 2,105.42 8.9% 19.7% 2,452,624 1,272.47 1,927.45 9.9% 70.5%Lyle 1,347,414 242.80 5,549.48 58.7% 488.7% 849,228 245.25 3,462.71 271.0% 179.5% 228,881 243.89 938.46 (24.7%) 21.2%County Total 12,176,580 3,067.05 3,970.13 17.9% 27.1% 10,324,747 3,148.03 3,279.75 7.7% 15.5% 9,583,121 3,164.22 3,028.59 7.2% 21.0%
Lewis Co.Napavine 2,624,773 843.54 3,111.62 22.7% 72.7% 2,139,379 830.29 2,576.67 40.7% 52.1% 1,520,245 838.89 1,812.21 8.1% 22.0%Evaline 521,055 52.02 10,016.43 18.4% 26.1% 439,959 56.89 7,733.50 6.5% 49.3% 413,261 56.80 7,275.72 40.2% 47.5%Mossyrock 1,858,731 574.77 3,233.87 (5.1%) (13.7%) 1,958,030 537.80 3,640.82 (9.0%) 10.1% 2,152,738 533.77 4,033.08 21.0% 51.3%Morton 1,216,451 354.31 3,433.30 45.8% 51.8% 834,177 326.37 2,555.92 4.1% (12.3%) 801,213 314.74 2,545.63 (15.7%) (7.7%) Adna 2,507,242 651.36 3,849.24 23.8% 50.7% 2,025,782 634.19 3,194.28 21.8% 43.6% 1,663,381 649.64 2,560.47 17.9% 35.8%Winlock 1,842,421 694.97 2,651.08 56.0% 124.6% 1,180,764 727.82 1,622.33 43.9% 26.4% 820,480 721.52 1,137.15 (12.2%) (24.2%) Boistfort 371,858 92.86 4,004.50 13.5% 152.8% 327,709 98.70 3,320.26 122.8% 81.7% 147,119 90.88 1,618.83 (18.4%) (39.5%) Toledo 1,347,234 839.34 1,605.11 57.9% 29.0% 853,054 821.45 1,038.47 (18.3%) (10.0%) 1,043,979 813.06 1,284.01 10.1% 12.8%Onalaska 1,737,149 832.61 2,086.39 (0.9%) 16.2% 1,752,277 817.56 2,143.30 17.2% 25.7% 1,495,205 841.94 1,775.90 7.3% (10.4%) Pe Ell 2,257,984 267.86 8,429.72 5.8% 24.0% 2,133,236 269.16 7,925.53 17.2% 151.1% 1,820,828 258.99 7,030.49 114.3% 137.4%Chehalis 5,103,476 3,170.22 1,609.82 21.9% 4.0% 4,187,432 3,122.25 1,341.16 (14.7%) (25.9%) 4,908,303 3,041.98 1,613.52 (13.2%) (21.0%) White Pass 1,485,750 373.62 3,976.63 15.8% 74.9% 1,283,522 390.98 3,282.83 51.1% 72.9% 849,564 403.86 2,103.61 14.4% (16.5%) Centralia 4,724,869 3,558.97 1,327.59 (15.8%) (25.2%) 5,613,035 3,516.06 1,596.40 (11.1%) (2.2%) 6,313,731 3,590.81 1,758.30 10.0% 0.7%County Total 27,598,994 12,306.45 2,242.64 11.6% 15.2% 24,728,356 12,149.52 2,035.34 3.2% 11.0% 23,950,045 12,156.88 1,970.08 7.5% 3.1%
Lincoln Co.Sprague 1,056,074 75.26 14,032.35 5.6% 30.1% 999,996 78.50 12,738.80 23.2% 61.6% 811,885 72.16 11,251.18 31.2% 44.0%Reardan 2,497,583 655.72 3,808.92 39.8% 41.8% 1,786,144 605.40 2,950.35 1.4% 85.9% 1,761,460 608.82 2,893.24 83.3% 144.2%Almira 1,494,340 95.57 15,636.07 14.3% 23.8% 1,306,892 86.78 15,059.83 8.3% 26.8% 1,206,867 82.92 14,554.59 17.1% 39.7%Creston 860,118 89.35 9,626.39 44.8% 86.4% 593,942 94.16 6,307.79 28.7% 61.9% 461,460 88.61 5,207.76 25.8% 42.1%Odessa 1,302,089 230.78 5,642.12 11.8% 5.8% 1,164,974 250.99 4,641.51 (5.4%) 19.6% 1,230,856 247.67 4,969.74 26.3% 75.3%Wilbur 994,132 226.43 4,390.46 67.5% 64.4% 593,514 244.28 2,429.65 (1.9%) 27.6% 604,774 259.51 2,330.45 30.0% 31.1%Harrington 570,618 128.53 4,439.57 18.8% 31.6% 480,344 124.24 3,866.26 10.8% 8.2% 433,619 130.21 3,330.15 (2.3%) 74.4%Davenport 929,658 563.72 1,649.15 31.5% 50.3% 707,180 560.34 1,262.06 14.3% 50.3% 618,488 590.54 1,047.33 31.5% 21.6%County Total 9,704,612 2,065.36 4,698.75 27.1% 36.1% 7,632,986 2,044.69 3,733.08 7.1% 43.2% 7,129,409 2,080.44 3,426.88 33.7% 62.2%
233
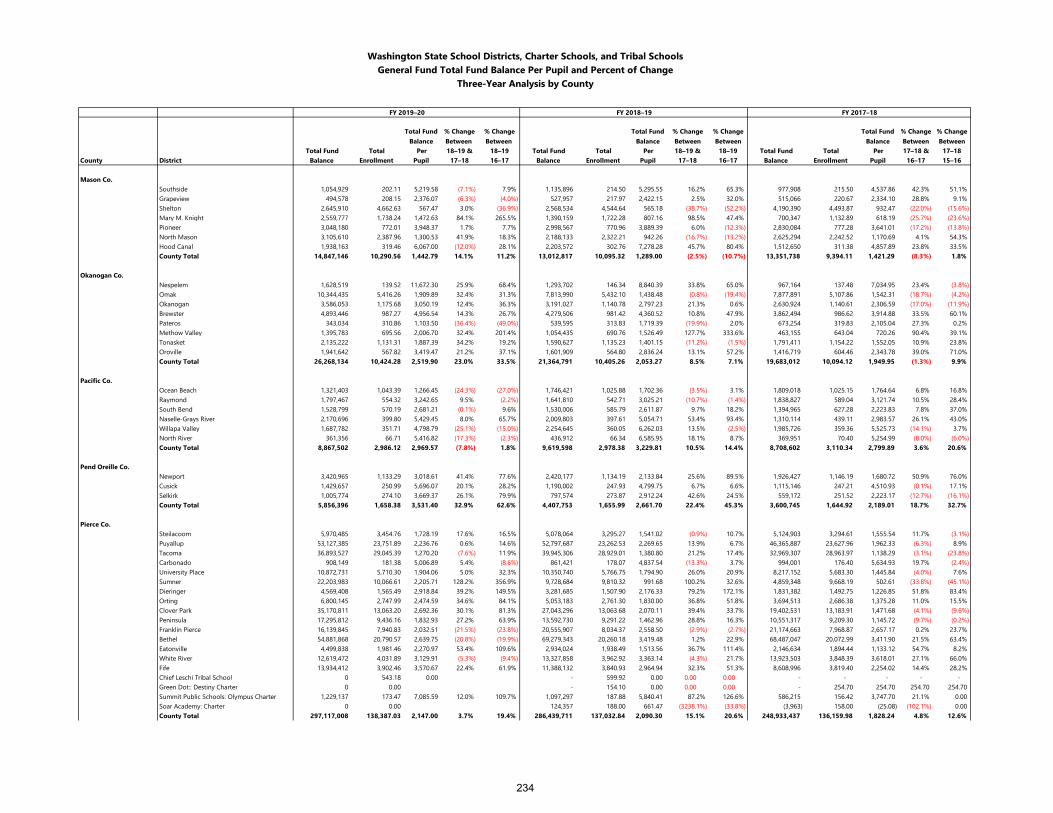
Washington State School Districts, Charter Schools, and Tribal SchoolsGeneral Fund Total Fund Balance Per Pupil and Percent of Change
Three-Year Analysis by County
FY 2019–20 FY 2018–19 FY 2017–18
Total Fund Balance
% Change Between
% Change Between
Total Fund Balance
% Change Between
% Change Between
Total Fund Balance
% Change Between
% Change Between
Total Fund Total Per 18–19 & 18–19 Total Fund Total Per 18–19 & 18–19 Total Fund Total Per 17–18 & 17–18County District Balance Enrollment Pupil 17–18 16–17 Balance Enrollment Pupil 17–18 16–17 Balance Enrollment Pupil 16–17 15–16
Mason Co.Southside 1,054,929 202.11 5,219.58 (7.1%) 7.9% 1,135,896 214.50 5,295.55 16.2% 65.3% 977,908 215.50 4,537.86 42.3% 51.1%Grapeview 494,578 208.15 2,376.07 (6.3%) (4.0%) 527,957 217.97 2,422.15 2.5% 32.0% 515,066 220.67 2,334.10 28.8% 9.1%Shelton 2,645,910 4,662.63 567.47 3.0% (36.9%) 2,568,534 4,544.64 565.18 (38.7%) (52.2%) 4,190,390 4,493.87 932.47 (22.0%) (15.6%) Mary M. Knight 2,559,777 1,738.24 1,472.63 84.1% 265.5% 1,390,159 1,722.28 807.16 98.5% 47.4% 700,347 1,132.89 618.19 (25.7%) (23.6%) Pioneer 3,048,180 772.01 3,948.37 1.7% 7.7% 2,998,567 770.96 3,889.39 6.0% (12.3%) 2,830,084 777.28 3,641.01 (17.2%) (13.8%) North Mason 3,105,610 2,387.96 1,300.53 41.9% 18.3% 2,188,133 2,322.21 942.26 (16.7%) (13.2%) 2,625,294 2,242.52 1,170.69 4.1% 54.3%Hood Canal 1,938,163 319.46 6,067.00 (12.0%) 28.1% 2,203,572 302.76 7,278.28 45.7% 80.4% 1,512,650 311.38 4,857.89 23.8% 33.5%County Total 14,847,146 10,290.56 1,442.79 14.1% 11.2% 13,012,817 10,095.32 1,289.00 (2.5%) (10.7%) 13,351,738 9,394.11 1,421.29 (8.3%) 1.8%
Okanogan Co.Nespelem 1,628,519 139.52 11,672.30 25.9% 68.4% 1,293,702 146.34 8,840.39 33.8% 65.0% 967,164 137.48 7,034.95 23.4% (3.8%) Omak 10,344,435 5,416.26 1,909.89 32.4% 31.3% 7,813,990 5,432.10 1,438.48 (0.8%) (19.4%) 7,877,891 5,107.86 1,542.31 (18.7%) (4.2%) Okanogan 3,586,053 1,175.68 3,050.19 12.4% 36.3% 3,191,027 1,140.78 2,797.23 21.3% 0.6% 2,630,924 1,140.61 2,306.59 (17.0%) (11.9%) Brewster 4,893,446 987.27 4,956.54 14.3% 26.7% 4,279,506 981.42 4,360.52 10.8% 47.9% 3,862,494 986.62 3,914.88 33.5% 60.1%Pateros 343,034 310.86 1,103.50 (36.4%) (49.0%) 539,595 313.83 1,719.39 (19.9%) 2.0% 673,254 319.83 2,105.04 27.3% 0.2%Methow Valley 1,395,783 695.56 2,006.70 32.4% 201.4% 1,054,435 690.76 1,526.49 127.7% 333.6% 463,155 643.04 720.26 90.4% 39.1%Tonasket 2,135,222 1,131.31 1,887.39 34.2% 19.2% 1,590,627 1,135.23 1,401.15 (11.2%) (1.5%) 1,791,411 1,154.22 1,552.05 10.9% 23.8%Oroville 1,941,642 567.82 3,419.47 21.2% 37.1% 1,601,909 564.80 2,836.24 13.1% 57.2% 1,416,719 604.46 2,343.78 39.0% 71.0%County Total 26,268,134 10,424.28 2,519.90 23.0% 33.5% 21,364,791 10,405.26 2,053.27 8.5% 7.1% 19,683,012 10,094.12 1,949.95 (1.3%) 9.9%
Pacific Co.Ocean Beach 1,321,403 1,043.39 1,266.45 (24.3%) (27.0%) 1,746,421 1,025.88 1,702.36 (3.5%) 3.1% 1,809,018 1,025.15 1,764.64 6.8% 16.8%Raymond 1,797,467 554.32 3,242.65 9.5% (2.2%) 1,641,810 542.71 3,025.21 (10.7%) (1.4%) 1,838,827 589.04 3,121.74 10.5% 28.4%South Bend 1,528,799 570.19 2,681.21 (0.1%) 9.6% 1,530,006 585.79 2,611.87 9.7% 18.2% 1,394,965 627.28 2,223.83 7.8% 37.0%Naselle-Grays River 2,170,696 399.80 5,429.45 8.0% 65.7% 2,009,803 397.61 5,054.71 53.4% 93.4% 1,310,114 439.11 2,983.57 26.1% 43.0%Willapa Valley 1,687,782 351.71 4,798.79 (25.1%) (15.0%) 2,254,645 360.05 6,262.03 13.5% (2.5%) 1,985,726 359.36 5,525.73 (14.1%) 3.7%North River 361,356 66.71 5,416.82 (17.3%) (2.3%) 436,912 66.34 6,585.95 18.1% 8.7% 369,951 70.40 5,254.99 (8.0%) (6.0%) County Total 8,867,502 2,986.12 2,969.57 (7.8%) 1.8% 9,619,598 2,978.38 3,229.81 10.5% 14.4% 8,708,602 3,110.34 2,799.89 3.6% 20.6%
Pend Oreille Co.Newport 3,420,965 1,133.29 3,018.61 41.4% 77.6% 2,420,177 1,134.19 2,133.84 25.6% 89.5% 1,926,427 1,146.19 1,680.72 50.9% 76.0%Cusick 1,429,657 250.99 5,696.07 20.1% 28.2% 1,190,002 247.93 4,799.75 6.7% 6.6% 1,115,146 247.21 4,510.93 (0.1%) 17.1%Selkirk 1,005,774 274.10 3,669.37 26.1% 79.9% 797,574 273.87 2,912.24 42.6% 24.5% 559,172 251.52 2,223.17 (12.7%) (16.1%) County Total 5,856,396 1,658.38 3,531.40 32.9% 62.6% 4,407,753 1,655.99 2,661.70 22.4% 45.3% 3,600,745 1,644.92 2,189.01 18.7% 32.7%
Pierce Co.Steilacoom 5,970,485 3,454.76 1,728.19 17.6% 16.5% 5,078,064 3,295.27 1,541.02 (0.9%) 10.7% 5,124,903 3,294.61 1,555.54 11.7% (3.1%) Puyallup 53,127,385 23,751.89 2,236.76 0.6% 14.6% 52,797,687 23,262.53 2,269.65 13.9% 6.7% 46,365,887 23,627.96 1,962.33 (6.3%) 8.9%Tacoma 36,893,527 29,045.39 1,270.20 (7.6%) 11.9% 39,945,306 28,929.01 1,380.80 21.2% 17.4% 32,969,307 28,963.97 1,138.29 (3.1%) (23.8%) Carbonado 908,149 181.38 5,006.89 5.4% (8.6%) 861,421 178.07 4,837.54 (13.3%) 3.7% 994,001 176.40 5,634.93 19.7% (2.4%) University Place 10,872,731 5,710.30 1,904.06 5.0% 32.3% 10,350,740 5,766.75 1,794.90 26.0% 20.9% 8,217,152 5,683.30 1,445.84 (4.0%) 7.6%Sumner 22,203,983 10,066.61 2,205.71 128.2% 356.9% 9,728,684 9,810.32 991.68 100.2% 32.6% 4,859,348 9,668.19 502.61 (33.8%) (45.1%) Dieringer 4,569,408 1,565.49 2,918.84 39.2% 149.5% 3,281,685 1,507.90 2,176.33 79.2% 172.1% 1,831,382 1,492.75 1,226.85 51.8% 83.4%Orting 6,800,145 2,747.99 2,474.59 34.6% 84.1% 5,053,183 2,761.30 1,830.00 36.8% 51.8% 3,694,513 2,686.38 1,375.28 11.0% 15.5%Clover Park 35,170,811 13,063.20 2,692.36 30.1% 81.3% 27,043,296 13,063.68 2,070.11 39.4% 33.7% 19,402,531 13,183.91 1,471.68 (4.1%) (9.6%) Peninsula 17,295,812 9,436.16 1,832.93 27.2% 63.9% 13,592,730 9,291.22 1,462.96 28.8% 16.3% 10,551,317 9,209.30 1,145.72 (9.7%) (0.2%) Franklin Pierce 16,139,845 7,940.83 2,032.51 (21.5%) (23.8%) 20,555,907 8,034.37 2,558.50 (2.9%) (2.7%) 21,174,663 7,968.87 2,657.17 0.2% 23.7%Bethel 54,881,868 20,790.57 2,639.75 (20.8%) (19.9%) 69,279,343 20,260.18 3,419.48 1.2% 22.9% 68,487,047 20,072.99 3,411.90 21.5% 63.4%Eatonville 4,499,838 1,981.46 2,270.97 53.4% 109.6% 2,934,024 1,938.49 1,513.56 36.7% 111.4% 2,146,634 1,894.44 1,133.12 54.7% 8.2%White River 12,619,472 4,031.89 3,129.91 (5.3%) (9.4%) 13,327,858 3,962.92 3,363.14 (4.3%) 21.7% 13,923,503 3,848.39 3,618.01 27.1% 66.0%Fife 13,934,412 3,902.46 3,570.67 22.4% 61.9% 11,388,132 3,840.93 2,964.94 32.3% 51.3% 8,608,996 3,819.40 2,254.02 14.4% 28.2%Chief Leschi Tribal School 0 543.18 0.00 - 599.92 0.00 0.00 0.00 - - - - - Green Dot:: Destiny Charter 0 0.00 - 154.10 0.00 0.00 0.00 - 254.70 254.70 254.70 254.70 Summit Public Schools: Olympus Charter 1,229,137 173.47 7,085.59 12.0% 109.7% 1,097,297 187.88 5,840.41 87.2% 126.6% 586,215 156.42 3,747.70 21.1% 0.00Soar Academy: Charter 0 0.00 124,357 188.00 661.47 (3238.1%) (33.8%) (3,963) 158.00 (25.08) (102.1%) 0.00County Total 297,117,008 138,387.03 2,147.00 3.7% 19.4% 286,439,711 137,032.84 2,090.30 15.1% 20.6% 248,933,437 136,159.98 1,828.24 4.8% 12.6%
234
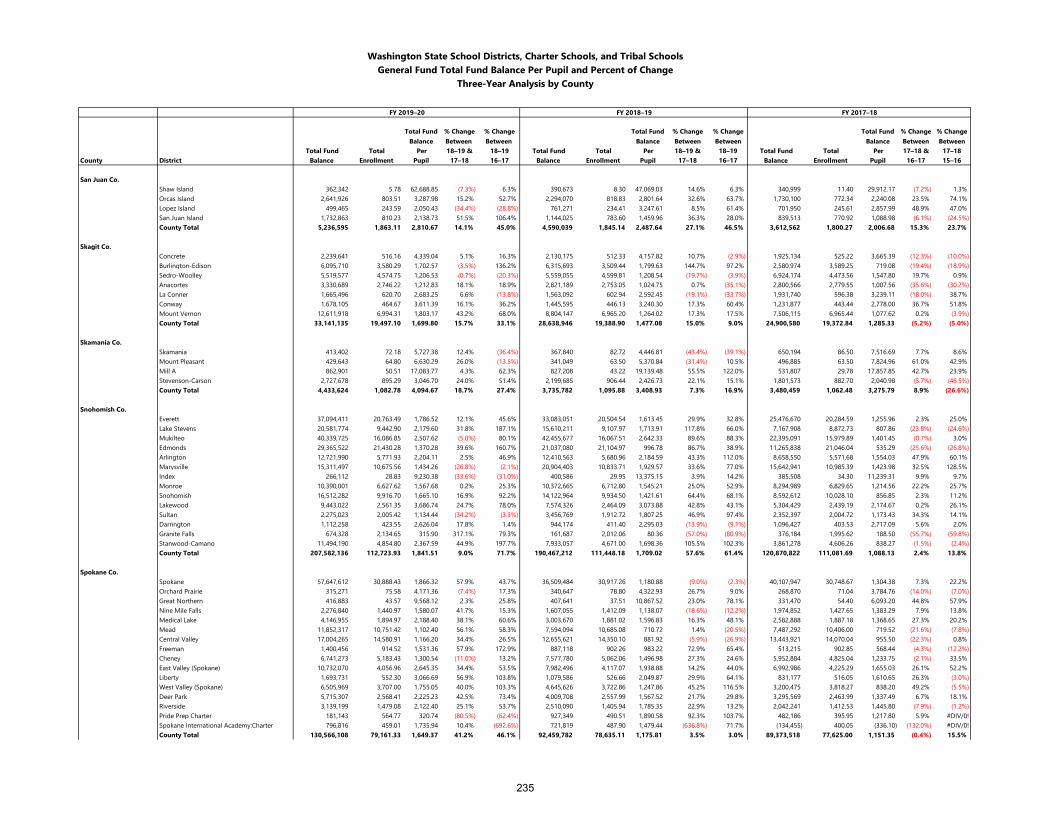
Washington State School Districts, Charter Schools, and Tribal SchoolsGeneral Fund Total Fund Balance Per Pupil and Percent of Change
Three-Year Analysis by County
FY 2019–20 FY 2018–19 FY 2017–18
Total Fund Balance
% Change Between
% Change Between
Total Fund Balance
% Change Between
% Change Between
Total Fund Balance
% Change Between
% Change Between
Total Fund Total Per 18–19 & 18–19 Total Fund Total Per 18–19 & 18–19 Total Fund Total Per 17–18 & 17–18County District Balance Enrollment Pupil 17–18 16–17 Balance Enrollment Pupil 17–18 16–17 Balance Enrollment Pupil 16–17 15–16
San Juan Co.Shaw Island 362,342 5.78 62,688.85 (7.3%) 6.3% 390,673 8.30 47,069.03 14.6% 6.3% 340,999 11.40 29,912.17 (7.2%) 1.3%Orcas Island 2,641,926 803.51 3,287.98 15.2% 52.7% 2,294,070 818.83 2,801.64 32.6% 63.7% 1,730,100 772.34 2,240.08 23.5% 74.1%Lopez Island 499,465 243.59 2,050.43 (34.4%) (28.8%) 761,271 234.41 3,247.61 8.5% 61.4% 701,950 245.61 2,857.99 48.9% 47.0%San Juan Island 1,732,863 810.23 2,138.73 51.5% 106.4% 1,144,025 783.60 1,459.96 36.3% 28.0% 839,513 770.92 1,088.98 (6.1%) (24.5%) County Total 5,236,595 1,863.11 2,810.67 14.1% 45.0% 4,590,039 1,845.14 2,487.64 27.1% 46.5% 3,612,562 1,800.27 2,006.68 15.3% 23.7%
Skagit Co.Concrete 2,239,641 516.16 4,339.04 5.1% 16.3% 2,130,175 512.33 4,157.82 10.7% (2.9%) 1,925,134 525.22 3,665.39 (12.3%) (10.0%) Burlington-Edison 6,095,710 3,580.29 1,702.57 (3.5%) 136.2% 6,315,693 3,509.44 1,799.63 144.7% 97.2% 2,580,974 3,589.25 719.08 (19.4%) (18.9%) Sedro-Woolley 5,519,577 4,574.75 1,206.53 (0.7%) (20.3%) 5,559,055 4,599.81 1,208.54 (19.7%) (3.9%) 6,924,174 4,473.56 1,547.80 19.7% 0.9%Anacortes 3,330,689 2,746.22 1,212.83 18.1% 18.9% 2,821,189 2,753.05 1,024.75 0.7% (35.1%) 2,800,566 2,779.55 1,007.56 (35.6%) (30.2%) La Conner 1,665,496 620.70 2,683.25 6.6% (13.8%) 1,563,092 602.94 2,592.45 (19.1%) (33.7%) 1,931,740 596.38 3,239.11 (18.0%) 38.7%Conway 1,678,105 464.67 3,611.39 16.1% 36.2% 1,445,595 446.13 3,240.30 17.3% 60.4% 1,231,877 443.44 2,778.00 36.7% 51.8%Mount Vernon 12,611,918 6,994.31 1,803.17 43.2% 68.0% 8,804,147 6,965.20 1,264.02 17.3% 17.5% 7,506,115 6,965.44 1,077.62 0.2% (3.9%) County Total 33,141,135 19,497.10 1,699.80 15.7% 33.1% 28,638,946 19,388.90 1,477.08 15.0% 9.0% 24,900,580 19,372.84 1,285.33 (5.2%) (5.0%)
Skamania Co.Skamania 413,402 72.18 5,727.38 12.4% (36.4%) 367,840 82.72 4,446.81 (43.4%) (39.1%) 650,194 86.50 7,516.69 7.7% 8.6%Mount Pleasant 429,643 64.80 6,630.29 26.0% (13.5%) 341,049 63.50 5,370.84 (31.4%) 10.5% 496,885 63.50 7,824.96 61.0% 42.9%Mill A 862,901 50.51 17,083.77 4.3% 62.3% 827,208 43.22 19,139.48 55.5% 122.0% 531,807 29.78 17,857.85 42.7% 23.9%Stevenson-Carson 2,727,678 895.29 3,046.70 24.0% 51.4% 2,199,685 906.44 2,426.73 22.1% 15.1% 1,801,573 882.70 2,040.98 (5.7%) (46.5%) County Total 4,433,624 1,082.78 4,094.67 18.7% 27.4% 3,735,782 1,095.88 3,408.93 7.3% 16.9% 3,480,459 1,062.48 3,275.79 8.9% (26.6%)
Snohomish Co.Everett 37,094,411 20,763.49 1,786.52 12.1% 45.6% 33,083,051 20,504.54 1,613.45 29.9% 32.8% 25,476,670 20,284.59 1,255.96 2.3% 25.0%Lake Stevens 20,581,774 9,442.90 2,179.60 31.8% 187.1% 15,610,211 9,107.97 1,713.91 117.8% 66.0% 7,167,908 8,872.73 807.86 (23.8%) (24.6%) Mukilteo 40,339,725 16,086.85 2,507.62 (5.0%) 80.1% 42,455,677 16,067.51 2,642.33 89.6% 88.3% 22,395,091 15,979.89 1,401.45 (0.7%) 3.0%Edmonds 29,365,522 21,430.28 1,370.28 39.6% 160.7% 21,037,080 21,104.97 996.78 86.7% 38.9% 11,265,838 21,046.04 535.29 (25.6%) (26.8%) Arlington 12,721,990 5,771.93 2,204.11 2.5% 46.9% 12,410,563 5,680.96 2,184.59 43.3% 112.0% 8,658,550 5,571.68 1,554.03 47.9% 60.1%Marysville 15,311,497 10,675.56 1,434.26 (26.8%) (2.1%) 20,904,403 10,833.71 1,929.57 33.6% 77.0% 15,642,941 10,985.39 1,423.98 32.5% 128.5%Index 266,112 28.83 9,230.38 (33.6%) (31.0%) 400,586 29.95 13,375.15 3.9% 14.2% 385,508 34.30 11,239.31 9.9% 9.7%Monroe 10,390,001 6,627.62 1,567.68 0.2% 25.3% 10,372,665 6,712.80 1,545.21 25.0% 52.9% 8,294,989 6,829.65 1,214.56 22.2% 25.7%Snohomish 16,512,282 9,916.70 1,665.10 16.9% 92.2% 14,122,964 9,934.50 1,421.61 64.4% 68.1% 8,592,612 10,028.10 856.85 2.3% 11.2%Lakewood 9,443,022 2,561.35 3,686.74 24.7% 78.0% 7,574,326 2,464.09 3,073.88 42.8% 43.1% 5,304,429 2,439.19 2,174.67 0.2% 26.1%Sultan 2,275,023 2,005.42 1,134.44 (34.2%) (3.3%) 3,456,769 1,912.72 1,807.25 46.9% 97.4% 2,352,397 2,004.72 1,173.43 34.3% 14.1%Darrington 1,112,258 423.55 2,626.04 17.8% 1.4% 944,174 411.40 2,295.03 (13.9%) (9.1%) 1,096,427 403.53 2,717.09 5.6% 2.0%Granite Falls 674,328 2,134.65 315.90 317.1% 79.3% 161,687 2,012.06 80.36 (57.0%) (80.9%) 376,184 1,995.62 188.50 (55.7%) (59.8%) Stanwood-Camano 11,494,190 4,854.80 2,367.59 44.9% 197.7% 7,933,057 4,671.00 1,698.36 105.5% 102.3% 3,861,278 4,606.26 838.27 (1.5%) (2.4%) County Total 207,582,136 112,723.93 1,841.51 9.0% 71.7% 190,467,212 111,448.18 1,709.02 57.6% 61.4% 120,870,822 111,081.69 1,088.13 2.4% 13.8%
Spokane Co.Spokane 57,647,612 30,888.43 1,866.32 57.9% 43.7% 36,509,484 30,917.26 1,180.88 (9.0%) (2.3%) 40,107,947 30,748.67 1,304.38 7.3% 22.2%Orchard Prairie 315,271 75.58 4,171.36 (7.4%) 17.3% 340,647 78.80 4,322.93 26.7% 9.0% 268,870 71.04 3,784.76 (14.0%) (7.0%) Great Northern 416,883 43.57 9,568.12 2.3% 25.8% 407,641 37.51 10,867.52 23.0% 78.1% 331,470 54.40 6,093.20 44.8% 57.9%Nine Mile Falls 2,276,840 1,440.97 1,580.07 41.7% 15.3% 1,607,055 1,412.09 1,138.07 (18.6%) (12.2%) 1,974,852 1,427.65 1,383.29 7.9% 13.8%Medical Lake 4,146,955 1,894.97 2,188.40 38.1% 60.6% 3,003,670 1,881.02 1,596.83 16.3% 48.1% 2,582,888 1,887.18 1,368.65 27.3% 20.2%Mead 11,852,317 10,751.42 1,102.40 56.1% 58.3% 7,594,094 10,685.08 710.72 1.4% (20.5%) 7,487,292 10,406.00 719.52 (21.6%) (7.8%) Central Valley 17,004,265 14,580.91 1,166.20 34.4% 26.5% 12,655,621 14,350.10 881.92 (5.9%) (26.9%) 13,443,921 14,070.04 955.50 (22.3%) 0.8%Freeman 1,400,456 914.52 1,531.36 57.9% 172.9% 887,118 902.26 983.22 72.9% 65.4% 513,215 902.85 568.44 (4.3%) (12.2%) Cheney 6,741,273 5,183.43 1,300.54 (11.0%) 13.2% 7,577,780 5,062.06 1,496.98 27.3% 24.6% 5,952,884 4,825.04 1,233.75 (2.1%) 33.5%East Valley (Spokane) 10,732,070 4,056.96 2,645.35 34.4% 53.5% 7,982,496 4,117.07 1,938.88 14.2% 44.0% 6,992,986 4,225.29 1,655.03 26.1% 52.2%Liberty 1,693,731 552.30 3,066.69 56.9% 103.8% 1,079,586 526.66 2,049.87 29.9% 64.1% 831,177 516.05 1,610.65 26.3% (3.0%) West Valley (Spokane) 6,505,969 3,707.00 1,755.05 40.0% 103.3% 4,645,626 3,722.86 1,247.86 45.2% 116.5% 3,200,475 3,818.27 838.20 49.2% (5.5%) Deer Park 5,715,307 2,568.41 2,225.23 42.5% 73.4% 4,009,708 2,557.99 1,567.52 21.7% 29.8% 3,295,569 2,463.99 1,337.49 6.7% 18.1%Riverside 3,139,199 1,479.08 2,122.40 25.1% 53.7% 2,510,090 1,405.94 1,785.35 22.9% 13.2% 2,042,241 1,412.53 1,445.80 (7.9%) (1.2%) Pride Prep Charter 181,143 564.77 320.74 (80.5%) (62.4%) 927,349 490.51 1,890.58 92.3% 103.7% 482,186 395.95 1,217.80 5.9% #DIV/0!Spokane International Academy:Charter 796,816 459.01 1,735.94 10.4% (692.6%) 721,819 487.90 1,479.44 (636.8%) 71.7% (134,455) 400.05 (336.10) (132.0%) #DIV/0!County Total 130,566,108 79,161.33 1,649.37 41.2% 46.1% 92,459,782 78,635.11 1,175.81 3.5% 3.0% 89,373,518 77,625.00 1,151.35 (0.4%) 15.5%
235
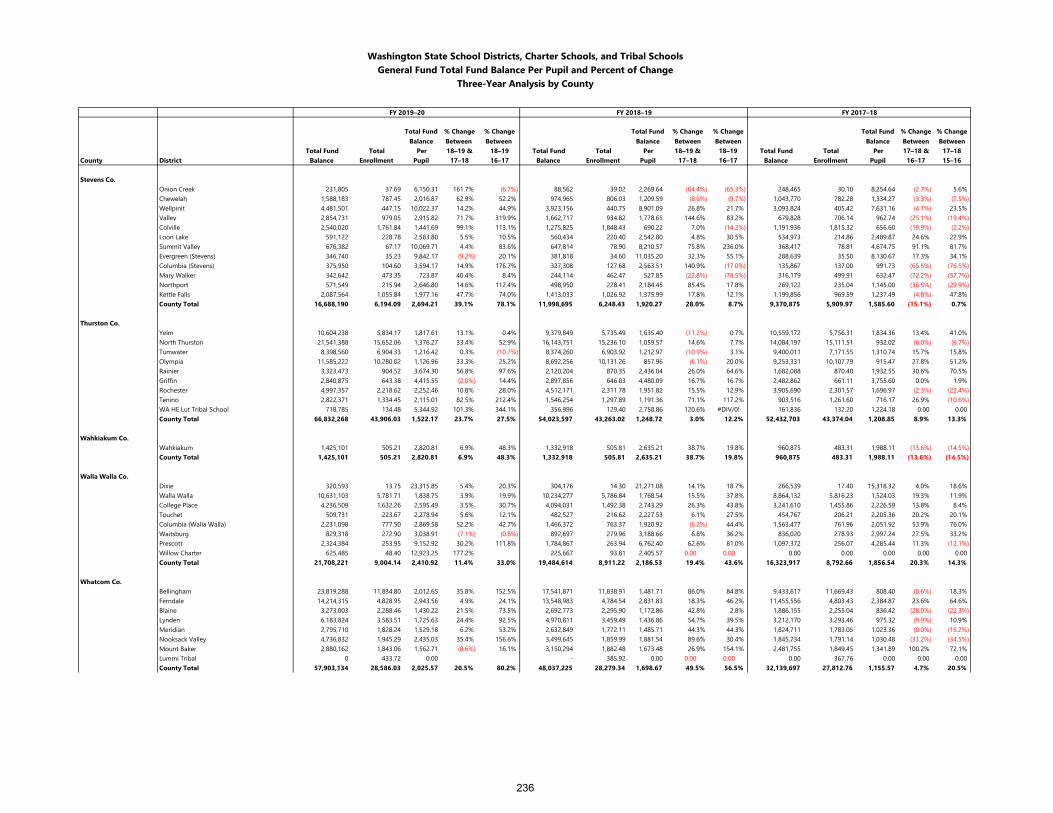
Washington State School Districts, Charter Schools, and Tribal SchoolsGeneral Fund Total Fund Balance Per Pupil and Percent of Change
Three-Year Analysis by County
FY 2019–20 FY 2018–19 FY 2017–18
Total Fund Balance
% Change Between
% Change Between
Total Fund Balance
% Change Between
% Change Between
Total Fund Balance
% Change Between
% Change Between
Total Fund Total Per 18–19 & 18–19 Total Fund Total Per 18–19 & 18–19 Total Fund Total Per 17–18 & 17–18County District Balance Enrollment Pupil 17–18 16–17 Balance Enrollment Pupil 17–18 16–17 Balance Enrollment Pupil 16–17 15–16
Stevens Co.Onion Creek 231,805 37.69 6,150.31 161.7% (6.7%) 88,562 39.02 2,269.64 (64.4%) (65.3%) 248,465 30.10 8,254.64 (2.7%) 5.6%Chewelah 1,588,183 787.45 2,016.87 62.9% 52.2% 974,965 806.03 1,209.59 (6.6%) (9.7%) 1,043,770 782.28 1,334.27 (3.3%) (7.5%) Wellpinit 4,481,501 447.15 10,022.37 14.2% 44.9% 3,923,156 440.75 8,901.09 26.8% 21.7% 3,093,824 405.42 7,631.16 (4.1%) 23.5%Valley 2,854,731 979.05 2,915.82 71.7% 319.9% 1,662,717 934.82 1,778.65 144.6% 83.2% 679,828 706.14 962.74 (25.1%) (19.4%) Colville 2,540,020 1,761.84 1,441.69 99.1% 113.1% 1,275,825 1,848.43 690.22 7.0% (14.2%) 1,191,936 1,815.32 656.60 (19.9%) (2.2%) Loon Lake 591,122 228.78 2,583.80 5.5% 10.5% 560,434 220.40 2,542.80 4.8% 30.5% 534,973 214.86 2,489.87 24.6% 22.9%Summit Valley 676,382 67.17 10,069.71 4.4% 83.6% 647,814 78.90 8,210.57 75.8% 236.0% 368,417 78.81 4,674.75 91.1% 81.7%Evergreen (Stevens) 346,740 35.23 9,842.17 (9.2%) 20.1% 381,818 34.60 11,035.20 32.3% 55.1% 288,639 35.50 8,130.67 17.3% 34.1%Columbia (Stevens) 375,950 104.60 3,594.17 14.9% 176.7% 327,308 127.68 2,563.51 140.9% (17.0%) 135,867 137.00 991.73 (65.5%) (76.5%) Mary Walker 342,642 473.35 723.87 40.4% 8.4% 244,114 462.47 527.85 (22.8%) (78.5%) 316,179 499.91 632.47 (72.2%) (57.7%) Northport 571,549 215.94 2,646.80 14.6% 112.4% 498,950 228.41 2,184.45 85.4% 17.8% 269,122 235.04 1,145.00 (36.5%) (29.9%) Kettle Falls 2,087,564 1,055.84 1,977.16 47.7% 74.0% 1,413,033 1,026.92 1,375.99 17.8% 12.1% 1,199,856 969.59 1,237.49 (4.8%) 47.8%County Total 16,688,190 6,194.09 2,694.21 39.1% 78.1% 11,998,695 6,248.43 1,920.27 28.0% 8.7% 9,370,875 5,909.97 1,585.60 (15.1%) 0.7%
Thurston Co.Yelm 10,604,238 5,834.17 1,817.61 13.1% 0.4% 9,379,849 5,735.49 1,635.40 (11.2%) 0.7% 10,559,172 5,756.31 1,834.36 13.4% 41.0%North Thurston 21,541,388 15,652.06 1,376.27 33.4% 52.9% 16,143,751 15,236.10 1,059.57 14.6% 7.7% 14,084,197 15,111.51 932.02 (6.0%) (6.7%) Tumwater 8,398,560 6,904.33 1,216.42 0.3% (10.7%) 8,374,260 6,903.92 1,212.97 (10.9%) 3.1% 9,400,011 7,171.55 1,310.74 15.7% 15.8%Olympia 11,585,222 10,280.02 1,126.96 33.3% 25.2% 8,692,256 10,131.26 857.96 (6.1%) 20.0% 9,253,331 10,107.79 915.47 27.8% 51.2%Rainier 3,323,473 904.52 3,674.30 56.8% 97.6% 2,120,204 870.35 2,436.04 26.0% 64.6% 1,682,088 870.40 1,932.55 30.6% 70.5%Griffin 2,840,875 643.38 4,415.55 (2.0%) 14.4% 2,897,856 646.83 4,480.09 16.7% 16.7% 2,482,862 661.11 3,755.60 0.0% 1.9%Rochester 4,997,357 2,218.62 2,252.46 10.8% 28.0% 4,512,171 2,311.78 1,951.82 15.5% 12.9% 3,905,690 2,301.57 1,696.97 (2.3%) (22.4%) Tenino 2,822,371 1,334.45 2,115.01 82.5% 212.4% 1,546,254 1,297.89 1,191.36 71.1% 117.2% 903,516 1,261.60 716.17 26.9% (10.6%) WA HE Lut Tribal School 718,785 134.48 5,344.92 101.3% 344.1% 356,996 129.40 2,758.86 120.6% #DIV/0! 161,836 132.20 1,224.18 0.00 0.00County Total 66,832,268 43,906.03 1,522.17 23.7% 27.5% 54,023,597 43,263.02 1,248.72 3.0% 12.2% 52,432,703 43,374.04 1,208.85 8.9% 13.3%
Wahkiakum Co.Wahkiakum 1,425,101 505.21 2,820.81 6.9% 48.3% 1,332,918 505.81 2,635.21 38.7% 19.8% 960,875 483.31 1,988.11 (13.6%) (14.5%) County Total 1,425,101 505.21 2,820.81 6.9% 48.3% 1,332,918 505.81 2,635.21 38.7% 19.8% 960,875 483.31 1,988.11 (13.6%) (14.5%)
Walla Walla Co.Dixie 320,593 13.75 23,315.85 5.4% 20.3% 304,176 14.30 21,271.08 14.1% 18.7% 266,539 17.40 15,318.32 4.0% 18.6%Walla Walla 10,631,103 5,781.71 1,838.75 3.9% 19.9% 10,234,277 5,786.84 1,768.54 15.5% 37.8% 8,864,132 5,816.23 1,524.03 19.3% 11.9%College Place 4,236,509 1,632.26 2,595.49 3.5% 30.7% 4,094,031 1,492.38 2,743.29 26.3% 43.8% 3,241,610 1,455.86 2,226.59 13.8% 8.4%Touchet 509,731 223.67 2,278.94 5.6% 12.1% 482,527 216.62 2,227.53 6.1% 27.5% 454,767 206.21 2,205.36 20.2% 20.1%Columbia (Walla Walla) 2,231,098 777.50 2,869.58 52.2% 42.7% 1,466,372 763.37 1,920.92 (6.2%) 44.4% 1,563,477 761.96 2,051.92 53.9% 76.0%Waitsburg 829,318 272.90 3,038.91 (7.1%) (0.8%) 892,697 279.96 3,188.66 6.8% 36.2% 836,020 278.93 2,997.24 27.5% 33.2%Prescott 2,324,384 253.95 9,152.92 30.2% 111.8% 1,784,867 263.94 6,762.40 62.6% 81.0% 1,097,372 256.07 4,285.44 11.3% (12.1%) Willow Charter 625,485 48.40 12,923.25 177.2% 225,667 93.81 2,405.57 0.00 0.00 0.00 0.00 0.00 0.00 0.00County Total 21,708,221 9,004.14 2,410.92 11.4% 33.0% 19,484,614 8,911.22 2,186.53 19.4% 43.6% 16,323,917 8,792.66 1,856.54 20.3% 14.3%
Whatcom Co.Bellingham 23,819,288 11,834.80 2,012.65 35.8% 152.5% 17,541,871 11,838.91 1,481.71 86.0% 84.8% 9,433,617 11,669.43 808.40 (0.6%) 18.3%Ferndale 14,214,315 4,828.95 2,943.56 4.9% 24.1% 13,548,983 4,784.54 2,831.83 18.3% 46.2% 11,455,556 4,803.43 2,384.87 23.6% 64.6%Blaine 3,273,003 2,288.46 1,430.22 21.5% 73.5% 2,692,773 2,295.90 1,172.86 42.8% 2.8% 1,886,155 2,255.04 836.42 (28.0%) (22.3%) Lynden 6,183,824 3,583.51 1,725.63 24.4% 92.5% 4,970,811 3,459.49 1,436.86 54.7% 39.5% 3,212,170 3,293.46 975.32 (9.9%) 10.9%Meridian 2,795,710 1,828.24 1,529.18 6.2% 53.2% 2,632,849 1,772.11 1,485.71 44.3% 44.3% 1,824,711 1,783.05 1,023.36 (0.0%) (15.2%) Nooksack Valley 4,736,832 1,945.29 2,435.03 35.4% 156.6% 3,499,645 1,859.99 1,881.54 89.6% 30.4% 1,845,734 1,791.14 1,030.48 (31.2%) (34.5%) Mount Baker 2,880,162 1,843.06 1,562.71 (8.6%) 16.1% 3,150,294 1,882.48 1,673.48 26.9% 154.1% 2,481,755 1,849.45 1,341.89 100.2% 72.1%Lummi Tribal 0 433.72 0.00 - 385.92 0.00 0.00 0.00 0.00 367.76 0.00 0.00 0.00County Total 57,903,134 28,586.03 2,025.57 20.5% 80.2% 48,037,225 28,279.34 1,698.67 49.5% 56.5% 32,139,697 27,812.76 1,155.57 4.7% 20.5%
236
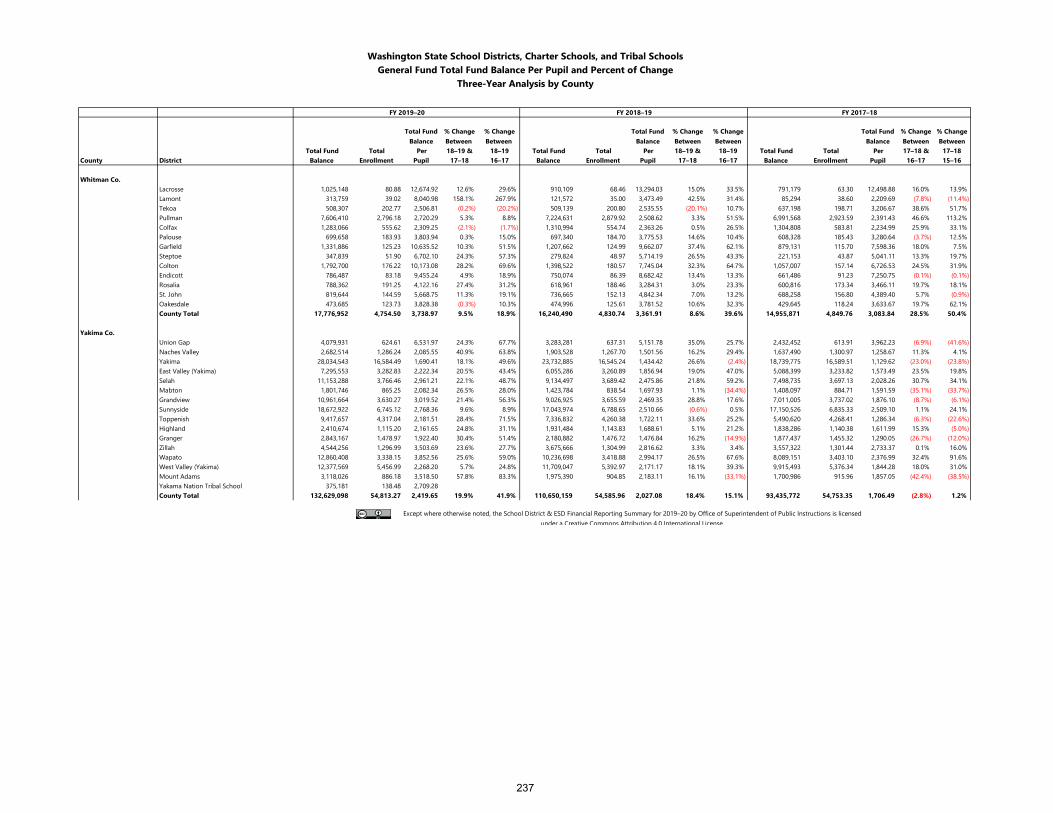
Washington State School Districts, Charter Schools, and Tribal SchoolsGeneral Fund Total Fund Balance Per Pupil and Percent of Change
Three-Year Analysis by County
FY 2019–20 FY 2018–19 FY 2017–18
Total Fund Balance
% Change Between
% Change Between
Total Fund Balance
% Change Between
% Change Between
Total Fund Balance
% Change Between
% Change Between
Total Fund Total Per 18–19 & 18–19 Total Fund Total Per 18–19 & 18–19 Total Fund Total Per 17–18 & 17–18County District Balance Enrollment Pupil 17–18 16–17 Balance Enrollment Pupil 17–18 16–17 Balance Enrollment Pupil 16–17 15–16
Whitman Co.Lacrosse 1,025,148 80.88 12,674.92 12.6% 29.6% 910,109 68.46 13,294.03 15.0% 33.5% 791,179 63.30 12,498.88 16.0% 13.9%Lamont 313,759 39.02 8,040.98 158.1% 267.9% 121,572 35.00 3,473.49 42.5% 31.4% 85,294 38.60 2,209.69 (7.8%) (11.4%) Tekoa 508,307 202.77 2,506.81 (0.2%) (20.2%) 509,139 200.80 2,535.55 (20.1%) 10.7% 637,198 198.71 3,206.67 38.6% 51.7%Pullman 7,606,410 2,796.18 2,720.29 5.3% 8.8% 7,224,631 2,879.92 2,508.62 3.3% 51.5% 6,991,568 2,923.59 2,391.43 46.6% 113.2%Colfax 1,283,066 555.62 2,309.25 (2.1%) (1.7%) 1,310,994 554.74 2,363.26 0.5% 26.5% 1,304,808 583.81 2,234.99 25.9% 33.1%Palouse 699,658 183.93 3,803.94 0.3% 15.0% 697,340 184.70 3,775.53 14.6% 10.4% 608,328 185.43 3,280.64 (3.7%) 12.5%Garfield 1,331,886 125.23 10,635.52 10.3% 51.5% 1,207,662 124.99 9,662.07 37.4% 62.1% 879,131 115.70 7,598.36 18.0% 7.5%Steptoe 347,839 51.90 6,702.10 24.3% 57.3% 279,824 48.97 5,714.19 26.5% 43.3% 221,153 43.87 5,041.11 13.3% 19.7%Colton 1,792,700 176.22 10,173.08 28.2% 69.6% 1,398,522 180.57 7,745.04 32.3% 64.7% 1,057,007 157.14 6,726.53 24.5% 31.9%Endicott 786,487 83.18 9,455.24 4.9% 18.9% 750,074 86.39 8,682.42 13.4% 13.3% 661,486 91.23 7,250.75 (0.1%) (0.1%) Rosalia 788,362 191.25 4,122.16 27.4% 31.2% 618,961 188.46 3,284.31 3.0% 23.3% 600,816 173.34 3,466.11 19.7% 18.1%St. John 819,644 144.59 5,668.75 11.3% 19.1% 736,665 152.13 4,842.34 7.0% 13.2% 688,258 156.80 4,389.40 5.7% (0.9%) Oakesdale 473,685 123.73 3,828.38 (0.3%) 10.3% 474,996 125.61 3,781.52 10.6% 32.3% 429,645 118.24 3,633.67 19.7% 62.1%County Total 17,776,952 4,754.50 3,738.97 9.5% 18.9% 16,240,490 4,830.74 3,361.91 8.6% 39.6% 14,955,871 4,849.76 3,083.84 28.5% 50.4%
Yakima Co.Union Gap 4,079,931 624.61 6,531.97 24.3% 67.7% 3,283,281 637.31 5,151.78 35.0% 25.7% 2,432,452 613.91 3,962.23 (6.9%) (41.6%) Naches Valley 2,682,514 1,286.24 2,085.55 40.9% 63.8% 1,903,528 1,267.70 1,501.56 16.2% 29.4% 1,637,490 1,300.97 1,258.67 11.3% 4.1%Yakima 28,034,543 16,584.49 1,690.41 18.1% 49.6% 23,732,885 16,545.24 1,434.42 26.6% (2.4%) 18,739,775 16,589.51 1,129.62 (23.0%) (23.8%) East Valley (Yakima) 7,295,553 3,282.83 2,222.34 20.5% 43.4% 6,055,286 3,260.89 1,856.94 19.0% 47.0% 5,088,399 3,233.82 1,573.49 23.5% 19.8%Selah 11,153,288 3,766.46 2,961.21 22.1% 48.7% 9,134,497 3,689.42 2,475.86 21.8% 59.2% 7,498,735 3,697.13 2,028.26 30.7% 34.1%Mabton 1,801,746 865.25 2,082.34 26.5% 28.0% 1,423,784 838.54 1,697.93 1.1% (34.4%) 1,408,097 884.71 1,591.59 (35.1%) (33.7%) Grandview 10,961,664 3,630.27 3,019.52 21.4% 56.3% 9,026,925 3,655.59 2,469.35 28.8% 17.6% 7,011,005 3,737.02 1,876.10 (8.7%) (6.1%) Sunnyside 18,672,922 6,745.12 2,768.36 9.6% 8.9% 17,043,974 6,788.65 2,510.66 (0.6%) 0.5% 17,150,526 6,835.33 2,509.10 1.1% 24.1%Toppenish 9,417,657 4,317.04 2,181.51 28.4% 71.5% 7,336,832 4,260.38 1,722.11 33.6% 25.2% 5,490,620 4,268.41 1,286.34 (6.3%) (22.6%) Highland 2,410,674 1,115.20 2,161.65 24.8% 31.1% 1,931,484 1,143.83 1,688.61 5.1% 21.2% 1,838,286 1,140.38 1,611.99 15.3% (5.0%) Granger 2,843,167 1,478.97 1,922.40 30.4% 51.4% 2,180,882 1,476.72 1,476.84 16.2% (14.9%) 1,877,437 1,455.32 1,290.05 (26.7%) (12.0%) Zillah 4,544,256 1,296.99 3,503.69 23.6% 27.7% 3,675,666 1,304.99 2,816.62 3.3% 3.4% 3,557,322 1,301.44 2,733.37 0.1% 16.0%Wapato 12,860,408 3,338.15 3,852.56 25.6% 59.0% 10,236,698 3,418.88 2,994.17 26.5% 67.6% 8,089,151 3,403.10 2,376.99 32.4% 91.6%West Valley (Yakima) 12,377,569 5,456.99 2,268.20 5.7% 24.8% 11,709,047 5,392.97 2,171.17 18.1% 39.3% 9,915,493 5,376.34 1,844.28 18.0% 31.0%Mount Adams 3,118,026 886.18 3,518.50 57.8% 83.3% 1,975,390 904.85 2,183.11 16.1% (33.1%) 1,700,986 915.96 1,857.05 (42.4%) (38.5%) Yakama Nation Tribal School 375,181 138.48 2,709.28County Total 132,629,098 54,813.27 2,419.65 19.9% 41.9% 110,650,159 54,585.96 2,027.08 18.4% 15.1% 93,435,772 54,753.35 1,706.49 (2.8%) 1.2%
Except where otherwise noted, the School District & ESD Financial Reporting Summary for 2019–20 by Office of Superintendent of Public Instructions is licensed under a Creative Commons Attribution 4.0 International License.
237
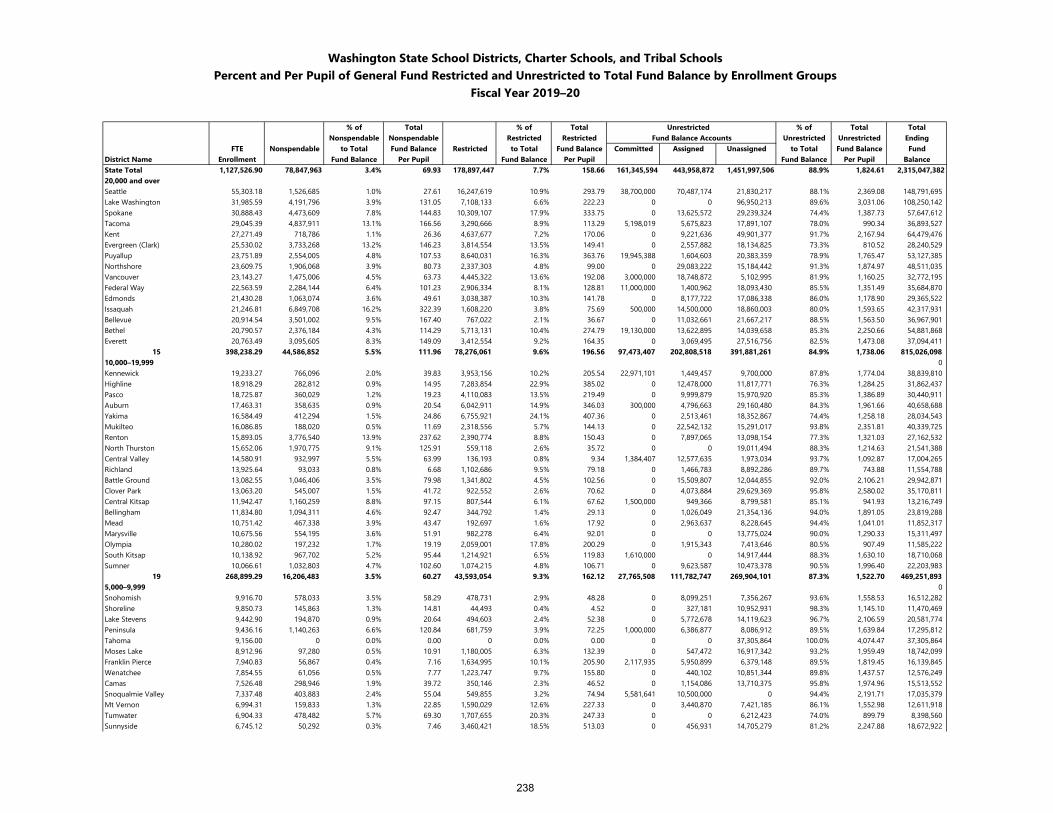
Washington State School Districts, Charter Schools, and Tribal SchoolsPercent and Per Pupil of General Fund Restricted and Unrestricted to Total Fund Balance by Enrollment Groups
Fiscal Year 2019–20
% of Total % of Total Unrestricted % of Total TotalNonspendable Nonspendable Restricted Restricted Fund Balance Accounts Unrestricted Unrestricted Ending
FTE Nonspendable to Total Fund Balance Restricted to Total Fund Balance Committed Assigned Unassigned to Total Fund Balance FundDistrict Name Enrollment Fund Balance Per Pupil Fund Balance Per Pupil Fund Balance Per Pupil BalanceState Total 1,127,526.90 78,847,963 3.4% 69.93 178,897,447 7.7% 158.66 161,345,594 443,958,872 1,451,997,506 88.9% 1,824.61 2,315,047,38220,000 and overSeattle 55,303.18 1,526,685 1.0% 27.61 16,247,619 10.9% 293.79 38,700,000 70,487,174 21,830,217 88.1% 2,369.08 148,791,695Lake Washington 31,985.59 4,191,796 3.9% 131.05 7,108,133 6.6% 222.23 0 0 96,950,213 89.6% 3,031.06 108,250,142Spokane 30,888.43 4,473,609 7.8% 144.83 10,309,107 17.9% 333.75 0 13,625,572 29,239,324 74.4% 1,387.73 57,647,612Tacoma 29,045.39 4,837,911 13.1% 166.56 3,290,666 8.9% 113.29 5,198,019 5,675,823 17,891,107 78.0% 990.34 36,893,527Kent 27,271.49 718,786 1.1% 26.36 4,637,677 7.2% 170.06 0 9,221,636 49,901,377 91.7% 2,167.94 64,479,476Evergreen (Clark) 25,530.02 3,733,268 13.2% 146.23 3,814,554 13.5% 149.41 0 2,557,882 18,134,825 73.3% 810.52 28,240,529Puyallup 23,751.89 2,554,005 4.8% 107.53 8,640,031 16.3% 363.76 19,945,388 1,604,603 20,383,359 78.9% 1,765.47 53,127,385Northshore 23,609.75 1,906,068 3.9% 80.73 2,337,303 4.8% 99.00 0 29,083,222 15,184,442 91.3% 1,874.97 48,511,035Vancouver 23,143.27 1,475,006 4.5% 63.73 4,445,322 13.6% 192.08 3,000,000 18,748,872 5,102,995 81.9% 1,160.25 32,772,195Federal Way 22,563.59 2,284,144 6.4% 101.23 2,906,334 8.1% 128.81 11,000,000 1,400,962 18,093,430 85.5% 1,351.49 35,684,870Edmonds 21,430.28 1,063,074 3.6% 49.61 3,038,387 10.3% 141.78 0 8,177,722 17,086,338 86.0% 1,178.90 29,365,522Issaquah 21,246.81 6,849,708 16.2% 322.39 1,608,220 3.8% 75.69 500,000 14,500,000 18,860,003 80.0% 1,593.65 42,317,931Bellevue 20,914.54 3,501,002 9.5% 167.40 767,022 2.1% 36.67 0 11,032,661 21,667,217 88.5% 1,563.50 36,967,901Bethel 20,790.57 2,376,184 4.3% 114.29 5,713,131 10.4% 274.79 19,130,000 13,622,895 14,039,658 85.3% 2,250.66 54,881,868Everett 20,763.49 3,095,605 8.3% 149.09 3,412,554 9.2% 164.35 0 3,069,495 27,516,756 82.5% 1,473.08 37,094,411
15 398,238.29 44,586,852 5.5% 111.96 78,276,061 9.6% 196.56 97,473,407 202,808,518 391,881,261 84.9% 1,738.06 815,026,09810,000–19,999 0Kennewick 19,233.27 766,096 2.0% 39.83 3,953,156 10.2% 205.54 22,971,101 1,449,457 9,700,000 87.8% 1,774.04 38,839,810Highline 18,918.29 282,812 0.9% 14.95 7,283,854 22.9% 385.02 0 12,478,000 11,817,771 76.3% 1,284.25 31,862,437Pasco 18,725.87 360,029 1.2% 19.23 4,110,083 13.5% 219.49 0 9,999,879 15,970,920 85.3% 1,386.89 30,440,911Auburn 17,463.31 358,635 0.9% 20.54 6,042,911 14.9% 346.03 300,000 4,796,663 29,160,480 84.3% 1,961.66 40,658,688Yakima 16,584.49 412,294 1.5% 24.86 6,755,921 24.1% 407.36 0 2,513,461 18,352,867 74.4% 1,258.18 28,034,543Mukilteo 16,086.85 188,020 0.5% 11.69 2,318,556 5.7% 144.13 0 22,542,132 15,291,017 93.8% 2,351.81 40,339,725Renton 15,893.05 3,776,540 13.9% 237.62 2,390,774 8.8% 150.43 0 7,897,065 13,098,154 77.3% 1,321.03 27,162,532North Thurston 15,652.06 1,970,775 9.1% 125.91 559,118 2.6% 35.72 0 0 19,011,494 88.3% 1,214.63 21,541,388Central Valley 14,580.91 932,997 5.5% 63.99 136,193 0.8% 9.34 1,384,407 12,577,635 1,973,034 93.7% 1,092.87 17,004,265Richland 13,925.64 93,033 0.8% 6.68 1,102,686 9.5% 79.18 0 1,466,783 8,892,286 89.7% 743.88 11,554,788Battle Ground 13,082.55 1,046,406 3.5% 79.98 1,341,802 4.5% 102.56 0 15,509,807 12,044,855 92.0% 2,106.21 29,942,871Clover Park 13,063.20 545,007 1.5% 41.72 922,552 2.6% 70.62 0 4,073,884 29,629,369 95.8% 2,580.02 35,170,811Central Kitsap 11,942.47 1,160,259 8.8% 97.15 807,544 6.1% 67.62 1,500,000 949,366 8,799,581 85.1% 941.93 13,216,749Bellingham 11,834.80 1,094,311 4.6% 92.47 344,792 1.4% 29.13 0 1,026,049 21,354,136 94.0% 1,891.05 23,819,288Mead 10,751.42 467,338 3.9% 43.47 192,697 1.6% 17.92 0 2,963,637 8,228,645 94.4% 1,041.01 11,852,317Marysville 10,675.56 554,195 3.6% 51.91 982,278 6.4% 92.01 0 0 13,775,024 90.0% 1,290.33 15,311,497Olympia 10,280.02 197,232 1.7% 19.19 2,059,001 17.8% 200.29 0 1,915,343 7,413,646 80.5% 907.49 11,585,222South Kitsap 10,138.92 967,702 5.2% 95.44 1,214,921 6.5% 119.83 1,610,000 0 14,917,444 88.3% 1,630.10 18,710,068Sumner 10,066.61 1,032,803 4.7% 102.60 1,074,215 4.8% 106.71 0 9,623,587 10,473,378 90.5% 1,996.40 22,203,983
19 268,899.29 16,206,483 3.5% 60.27 43,593,054 9.3% 162.12 27,765,508 111,782,747 269,904,101 87.3% 1,522.70 469,251,8935,000–9,999 0Snohomish 9,916.70 578,033 3.5% 58.29 478,731 2.9% 48.28 0 8,099,251 7,356,267 93.6% 1,558.53 16,512,282Shoreline 9,850.73 145,863 1.3% 14.81 44,493 0.4% 4.52 0 327,181 10,952,931 98.3% 1,145.10 11,470,469Lake Stevens 9,442.90 194,870 0.9% 20.64 494,603 2.4% 52.38 0 5,772,678 14,119,623 96.7% 2,106.59 20,581,774Peninsula 9,436.16 1,140,263 6.6% 120.84 681,759 3.9% 72.25 1,000,000 6,386,877 8,086,912 89.5% 1,639.84 17,295,812Tahoma 9,156.00 0 0.0% 0.00 0 0.0% 0.00 0 0 37,305,864 100.0% 4,074.47 37,305,864Moses Lake 8,912.96 97,280 0.5% 10.91 1,180,005 6.3% 132.39 0 547,472 16,917,342 93.2% 1,959.49 18,742,099Franklin Pierce 7,940.83 56,867 0.4% 7.16 1,634,995 10.1% 205.90 2,117,935 5,950,899 6,379,148 89.5% 1,819.45 16,139,845Wenatchee 7,854.55 61,056 0.5% 7.77 1,223,747 9.7% 155.80 0 440,102 10,851,344 89.8% 1,437.57 12,576,249Camas 7,526.48 298,946 1.9% 39.72 350,146 2.3% 46.52 0 1,154,086 13,710,375 95.8% 1,974.96 15,513,552Snoqualmie Valley 7,337.48 403,883 2.4% 55.04 549,855 3.2% 74.94 5,581,641 10,500,000 0 94.4% 2,191.71 17,035,379Mt Vernon 6,994.31 159,833 1.3% 22.85 1,590,029 12.6% 227.33 0 3,440,870 7,421,185 86.1% 1,552.98 12,611,918Tumwater 6,904.33 478,482 5.7% 69.30 1,707,655 20.3% 247.33 0 0 6,212,423 74.0% 899.79 8,398,560Sunnyside 6,745.12 50,292 0.3% 7.46 3,460,421 18.5% 513.03 0 456,931 14,705,279 81.2% 2,247.88 18,672,922
238
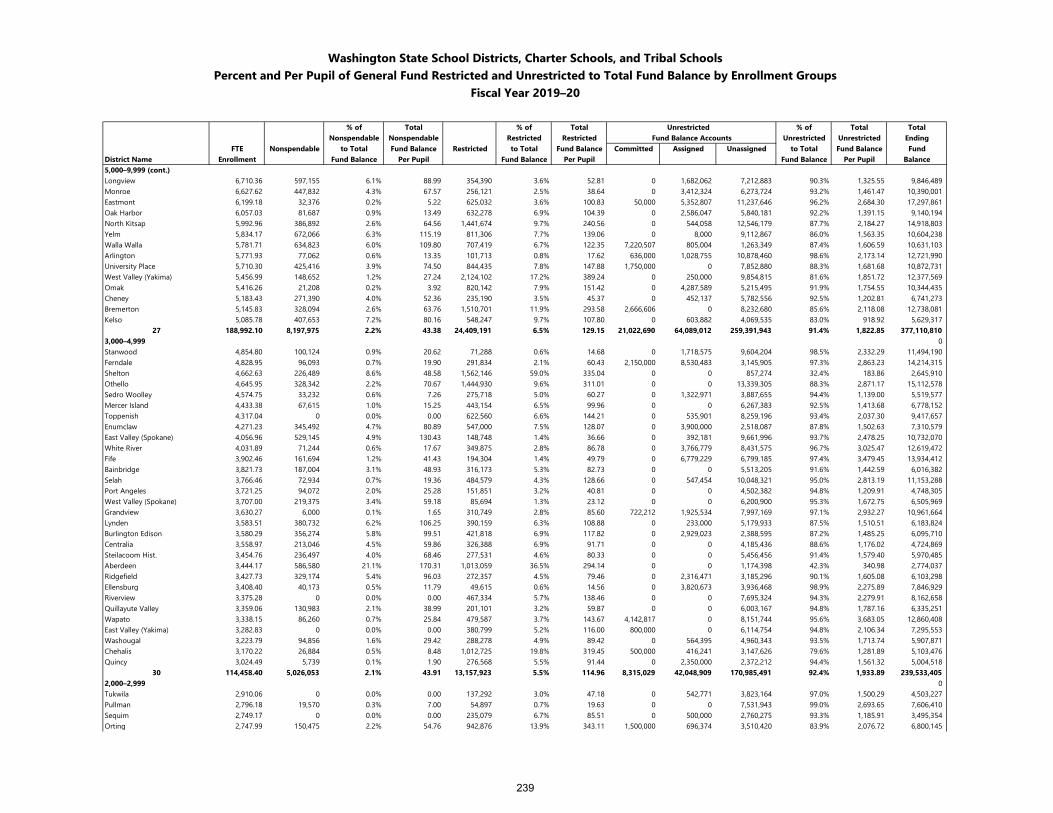
Washington State School Districts, Charter Schools, and Tribal SchoolsPercent and Per Pupil of General Fund Restricted and Unrestricted to Total Fund Balance by Enrollment Groups
Fiscal Year 2019–20
% of Total % of Total Unrestricted % of Total TotalNonspendable Nonspendable Restricted Restricted Fund Balance Accounts Unrestricted Unrestricted Ending
FTE Nonspendable to Total Fund Balance Restricted to Total Fund Balance Committed Assigned Unassigned to Total Fund Balance FundDistrict Name Enrollment Fund Balance Per Pupil Fund Balance Per Pupil Fund Balance Per Pupil Balance5,000–9,999 (cont.)Longview 6,710.36 597,155 6.1% 88.99 354,390 3.6% 52.81 0 1,682,062 7,212,883 90.3% 1,325.55 9,846,489Monroe 6,627.62 447,832 4.3% 67.57 256,121 2.5% 38.64 0 3,412,324 6,273,724 93.2% 1,461.47 10,390,001Eastmont 6,199.18 32,376 0.2% 5.22 625,032 3.6% 100.83 50,000 5,352,807 11,237,646 96.2% 2,684.30 17,297,861Oak Harbor 6,057.03 81,687 0.9% 13.49 632,278 6.9% 104.39 0 2,586,047 5,840,181 92.2% 1,391.15 9,140,194North Kitsap 5,992.96 386,892 2.6% 64.56 1,441,674 9.7% 240.56 0 544,058 12,546,179 87.7% 2,184.27 14,918,803Yelm 5,834.17 672,066 6.3% 115.19 811,306 7.7% 139.06 0 8,000 9,112,867 86.0% 1,563.35 10,604,238Walla Walla 5,781.71 634,823 6.0% 109.80 707,419 6.7% 122.35 7,220,507 805,004 1,263,349 87.4% 1,606.59 10,631,103Arlington 5,771.93 77,062 0.6% 13.35 101,713 0.8% 17.62 636,000 1,028,755 10,878,460 98.6% 2,173.14 12,721,990University Place 5,710.30 425,416 3.9% 74.50 844,435 7.8% 147.88 1,750,000 0 7,852,880 88.3% 1,681.68 10,872,731West Valley (Yakima) 5,456.99 148,652 1.2% 27.24 2,124,102 17.2% 389.24 0 250,000 9,854,815 81.6% 1,851.72 12,377,569Omak 5,416.26 21,208 0.2% 3.92 820,142 7.9% 151.42 0 4,287,589 5,215,495 91.9% 1,754.55 10,344,435Cheney 5,183.43 271,390 4.0% 52.36 235,190 3.5% 45.37 0 452,137 5,782,556 92.5% 1,202.81 6,741,273Bremerton 5,145.83 328,094 2.6% 63.76 1,510,701 11.9% 293.58 2,666,606 0 8,232,680 85.6% 2,118.08 12,738,081Kelso 5,085.78 407,653 7.2% 80.16 548,247 9.7% 107.80 0 603,882 4,069,535 83.0% 918.92 5,629,317
27 188,992.10 8,197,975 2.2% 43.38 24,409,191 6.5% 129.15 21,022,690 64,089,012 259,391,943 91.4% 1,822.85 377,110,8103,000–4,999 0Stanwood 4,854.80 100,124 0.9% 20.62 71,288 0.6% 14.68 0 1,718,575 9,604,204 98.5% 2,332.29 11,494,190Ferndale 4,828.95 96,093 0.7% 19.90 291,834 2.1% 60.43 2,150,000 8,530,483 3,145,905 97.3% 2,863.23 14,214,315Shelton 4,662.63 226,489 8.6% 48.58 1,562,146 59.0% 335.04 0 0 857,274 32.4% 183.86 2,645,910Othello 4,645.95 328,342 2.2% 70.67 1,444,930 9.6% 311.01 0 0 13,339,305 88.3% 2,871.17 15,112,578Sedro Woolley 4,574.75 33,232 0.6% 7.26 275,718 5.0% 60.27 0 1,322,971 3,887,655 94.4% 1,139.00 5,519,577Mercer Island 4,433.38 67,615 1.0% 15.25 443,154 6.5% 99.96 0 0 6,267,383 92.5% 1,413.68 6,778,152Toppenish 4,317.04 0 0.0% 0.00 622,560 6.6% 144.21 0 535,901 8,259,196 93.4% 2,037.30 9,417,657Enumclaw 4,271.23 345,492 4.7% 80.89 547,000 7.5% 128.07 0 3,900,000 2,518,087 87.8% 1,502.63 7,310,579East Valley (Spokane) 4,056.96 529,145 4.9% 130.43 148,748 1.4% 36.66 0 392,181 9,661,996 93.7% 2,478.25 10,732,070White River 4,031.89 71,244 0.6% 17.67 349,875 2.8% 86.78 0 3,766,779 8,431,575 96.7% 3,025.47 12,619,472Fife 3,902.46 161,694 1.2% 41.43 194,304 1.4% 49.79 0 6,779,229 6,799,185 97.4% 3,479.45 13,934,412Bainbridge 3,821.73 187,004 3.1% 48.93 316,173 5.3% 82.73 0 0 5,513,205 91.6% 1,442.59 6,016,382Selah 3,766.46 72,934 0.7% 19.36 484,579 4.3% 128.66 0 547,454 10,048,321 95.0% 2,813.19 11,153,288Port Angeles 3,721.25 94,072 2.0% 25.28 151,851 3.2% 40.81 0 0 4,502,382 94.8% 1,209.91 4,748,305West Valley (Spokane) 3,707.00 219,375 3.4% 59.18 85,694 1.3% 23.12 0 0 6,200,900 95.3% 1,672.75 6,505,969Grandview 3,630.27 6,000 0.1% 1.65 310,749 2.8% 85.60 722,212 1,925,534 7,997,169 97.1% 2,932.27 10,961,664Lynden 3,583.51 380,732 6.2% 106.25 390,159 6.3% 108.88 0 233,000 5,179,933 87.5% 1,510.51 6,183,824Burlington Edison 3,580.29 356,274 5.8% 99.51 421,818 6.9% 117.82 0 2,929,023 2,388,595 87.2% 1,485.25 6,095,710Centralia 3,558.97 213,046 4.5% 59.86 326,388 6.9% 91.71 0 0 4,185,436 88.6% 1,176.02 4,724,869Steilacoom Hist. 3,454.76 236,497 4.0% 68.46 277,531 4.6% 80.33 0 0 5,456,456 91.4% 1,579.40 5,970,485Aberdeen 3,444.17 586,580 21.1% 170.31 1,013,059 36.5% 294.14 0 0 1,174,398 42.3% 340.98 2,774,037Ridgefield 3,427.73 329,174 5.4% 96.03 272,357 4.5% 79.46 0 2,316,471 3,185,296 90.1% 1,605.08 6,103,298Ellensburg 3,408.40 40,173 0.5% 11.79 49,615 0.6% 14.56 0 3,820,673 3,936,468 98.9% 2,275.89 7,846,929Riverview 3,375.28 0 0.0% 0.00 467,334 5.7% 138.46 0 0 7,695,324 94.3% 2,279.91 8,162,658Quillayute Valley 3,359.06 130,983 2.1% 38.99 201,101 3.2% 59.87 0 0 6,003,167 94.8% 1,787.16 6,335,251Wapato 3,338.15 86,260 0.7% 25.84 479,587 3.7% 143.67 4,142,817 0 8,151,744 95.6% 3,683.05 12,860,408East Valley (Yakima) 3,282.83 0 0.0% 0.00 380,799 5.2% 116.00 800,000 0 6,114,754 94.8% 2,106.34 7,295,553Washougal 3,223.79 94,856 1.6% 29.42 288,278 4.9% 89.42 0 564,395 4,960,343 93.5% 1,713.74 5,907,871Chehalis 3,170.22 26,884 0.5% 8.48 1,012,725 19.8% 319.45 500,000 416,241 3,147,626 79.6% 1,281.89 5,103,476Quincy 3,024.49 5,739 0.1% 1.90 276,568 5.5% 91.44 0 2,350,000 2,372,212 94.4% 1,561.32 5,004,518
30 114,458.40 5,026,053 2.1% 43.91 13,157,923 5.5% 114.96 8,315,029 42,048,909 170,985,491 92.4% 1,933.89 239,533,4052,000–2,999 0Tukwila 2,910.06 0 0.0% 0.00 137,292 3.0% 47.18 0 542,771 3,823,164 97.0% 1,500.29 4,503,227Pullman 2,796.18 19,570 0.3% 7.00 54,897 0.7% 19.63 0 0 7,531,943 99.0% 2,693.65 7,606,410Sequim 2,749.17 0 0.0% 0.00 235,079 6.7% 85.51 0 500,000 2,760,275 93.3% 1,185.91 3,495,354Orting 2,747.99 150,475 2.2% 54.76 942,876 13.9% 343.11 1,500,000 696,374 3,510,420 83.9% 2,076.72 6,800,145
239
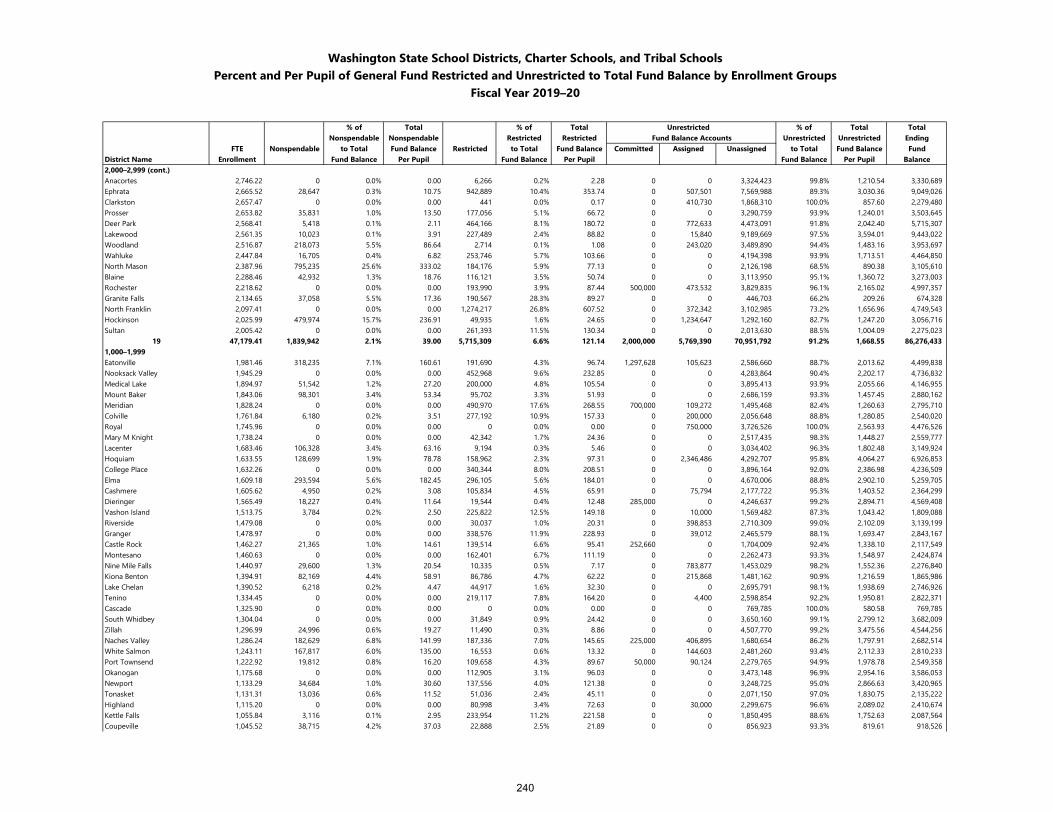
Washington State School Districts, Charter Schools, and Tribal SchoolsPercent and Per Pupil of General Fund Restricted and Unrestricted to Total Fund Balance by Enrollment Groups
Fiscal Year 2019–20
% of Total % of Total Unrestricted % of Total TotalNonspendable Nonspendable Restricted Restricted Fund Balance Accounts Unrestricted Unrestricted Ending
FTE Nonspendable to Total Fund Balance Restricted to Total Fund Balance Committed Assigned Unassigned to Total Fund Balance FundDistrict Name Enrollment Fund Balance Per Pupil Fund Balance Per Pupil Fund Balance Per Pupil Balance2,000–2,999 (cont.)Anacortes 2,746.22 0 0.0% 0.00 6,266 0.2% 2.28 0 0 3,324,423 99.8% 1,210.54 3,330,689Ephrata 2,665.52 28,647 0.3% 10.75 942,889 10.4% 353.74 0 507,501 7,569,988 89.3% 3,030.36 9,049,026Clarkston 2,657.47 0 0.0% 0.00 441 0.0% 0.17 0 410,730 1,868,310 100.0% 857.60 2,279,480Prosser 2,653.82 35,831 1.0% 13.50 177,056 5.1% 66.72 0 0 3,290,759 93.9% 1,240.01 3,503,645Deer Park 2,568.41 5,418 0.1% 2.11 464,166 8.1% 180.72 0 772,633 4,473,091 91.8% 2,042.40 5,715,307Lakewood 2,561.35 10,023 0.1% 3.91 227,489 2.4% 88.82 0 15,840 9,189,669 97.5% 3,594.01 9,443,022Woodland 2,516.87 218,073 5.5% 86.64 2,714 0.1% 1.08 0 243,020 3,489,890 94.4% 1,483.16 3,953,697Wahluke 2,447.84 16,705 0.4% 6.82 253,746 5.7% 103.66 0 0 4,194,398 93.9% 1,713.51 4,464,850North Mason 2,387.96 795,235 25.6% 333.02 184,176 5.9% 77.13 0 0 2,126,198 68.5% 890.38 3,105,610Blaine 2,288.46 42,932 1.3% 18.76 116,121 3.5% 50.74 0 0 3,113,950 95.1% 1,360.72 3,273,003Rochester 2,218.62 0 0.0% 0.00 193,990 3.9% 87.44 500,000 473,532 3,829,835 96.1% 2,165.02 4,997,357Granite Falls 2,134.65 37,058 5.5% 17.36 190,567 28.3% 89.27 0 0 446,703 66.2% 209.26 674,328North Franklin 2,097.41 0 0.0% 0.00 1,274,217 26.8% 607.52 0 372,342 3,102,985 73.2% 1,656.96 4,749,543Hockinson 2,025.99 479,974 15.7% 236.91 49,935 1.6% 24.65 0 1,234,647 1,292,160 82.7% 1,247.20 3,056,716Sultan 2,005.42 0 0.0% 0.00 261,393 11.5% 130.34 0 0 2,013,630 88.5% 1,004.09 2,275,023
19 47,179.41 1,839,942 2.1% 39.00 5,715,309 6.6% 121.14 2,000,000 5,769,390 70,951,792 91.2% 1,668.55 86,276,4331,000–1,999Eatonville 1,981.46 318,235 7.1% 160.61 191,690 4.3% 96.74 1,297,628 105,623 2,586,660 88.7% 2,013.62 4,499,838Nooksack Valley 1,945.29 0 0.0% 0.00 452,968 9.6% 232.85 0 0 4,283,864 90.4% 2,202.17 4,736,832Medical Lake 1,894.97 51,542 1.2% 27.20 200,000 4.8% 105.54 0 0 3,895,413 93.9% 2,055.66 4,146,955Mount Baker 1,843.06 98,301 3.4% 53.34 95,702 3.3% 51.93 0 0 2,686,159 93.3% 1,457.45 2,880,162Meridian 1,828.24 0 0.0% 0.00 490,970 17.6% 268.55 700,000 109,272 1,495,468 82.4% 1,260.63 2,795,710Colville 1,761.84 6,180 0.2% 3.51 277,192 10.9% 157.33 0 200,000 2,056,648 88.8% 1,280.85 2,540,020Royal 1,745.96 0 0.0% 0.00 0 0.0% 0.00 0 750,000 3,726,526 100.0% 2,563.93 4,476,526Mary M Knight 1,738.24 0 0.0% 0.00 42,342 1.7% 24.36 0 0 2,517,435 98.3% 1,448.27 2,559,777Lacenter 1,683.46 106,328 3.4% 63.16 9,194 0.3% 5.46 0 0 3,034,402 96.3% 1,802.48 3,149,924Hoquiam 1,633.55 128,699 1.9% 78.78 158,962 2.3% 97.31 0 2,346,486 4,292,707 95.8% 4,064.27 6,926,853College Place 1,632.26 0 0.0% 0.00 340,344 8.0% 208.51 0 0 3,896,164 92.0% 2,386.98 4,236,509Elma 1,609.18 293,594 5.6% 182.45 296,105 5.6% 184.01 0 0 4,670,006 88.8% 2,902.10 5,259,705Cashmere 1,605.62 4,950 0.2% 3.08 105,834 4.5% 65.91 0 75,794 2,177,722 95.3% 1,403.52 2,364,299Dieringer 1,565.49 18,227 0.4% 11.64 19,544 0.4% 12.48 285,000 0 4,246,637 99.2% 2,894.71 4,569,408Vashon Island 1,513.75 3,784 0.2% 2.50 225,822 12.5% 149.18 0 10,000 1,569,482 87.3% 1,043.42 1,809,088Riverside 1,479.08 0 0.0% 0.00 30,037 1.0% 20.31 0 398,853 2,710,309 99.0% 2,102.09 3,139,199Granger 1,478.97 0 0.0% 0.00 338,576 11.9% 228.93 0 39,012 2,465,579 88.1% 1,693.47 2,843,167Castle Rock 1,462.27 21,365 1.0% 14.61 139,514 6.6% 95.41 252,660 0 1,704,009 92.4% 1,338.10 2,117,549Montesano 1,460.63 0 0.0% 0.00 162,401 6.7% 111.19 0 0 2,262,473 93.3% 1,548.97 2,424,874Nine Mile Falls 1,440.97 29,600 1.3% 20.54 10,335 0.5% 7.17 0 783,877 1,453,029 98.2% 1,552.36 2,276,840Kiona Benton 1,394.91 82,169 4.4% 58.91 86,786 4.7% 62.22 0 215,868 1,481,162 90.9% 1,216.59 1,865,986Lake Chelan 1,390.52 6,218 0.2% 4.47 44,917 1.6% 32.30 0 0 2,695,791 98.1% 1,938.69 2,746,926Tenino 1,334.45 0 0.0% 0.00 219,117 7.8% 164.20 0 4,400 2,598,854 92.2% 1,950.81 2,822,371Cascade 1,325.90 0 0.0% 0.00 0 0.0% 0.00 0 0 769,785 100.0% 580.58 769,785South Whidbey 1,304.04 0 0.0% 0.00 31,849 0.9% 24.42 0 0 3,650,160 99.1% 2,799.12 3,682,009Zillah 1,296.99 24,996 0.6% 19.27 11,490 0.3% 8.86 0 0 4,507,770 99.2% 3,475.56 4,544,256Naches Valley 1,286.24 182,629 6.8% 141.99 187,336 7.0% 145.65 225,000 406,895 1,680,654 86.2% 1,797.91 2,682,514White Salmon 1,243.11 167,817 6.0% 135.00 16,553 0.6% 13.32 0 144,603 2,481,260 93.4% 2,112.33 2,810,233Port Townsend 1,222.92 19,812 0.8% 16.20 109,658 4.3% 89.67 50,000 90,124 2,279,765 94.9% 1,978.78 2,549,358Okanogan 1,175.68 0 0.0% 0.00 112,905 3.1% 96.03 0 0 3,473,148 96.9% 2,954.16 3,586,053Newport 1,133.29 34,684 1.0% 30.60 137,556 4.0% 121.38 0 0 3,248,725 95.0% 2,866.63 3,420,965Tonasket 1,131.31 13,036 0.6% 11.52 51,036 2.4% 45.11 0 0 2,071,150 97.0% 1,830.75 2,135,222Highland 1,115.20 0 0.0% 0.00 80,998 3.4% 72.63 0 30,000 2,299,675 96.6% 2,089.02 2,410,674Kettle Falls 1,055.84 3,116 0.1% 2.95 233,954 11.2% 221.58 0 0 1,850,495 88.6% 1,752.63 2,087,564Coupeville 1,045.52 38,715 4.2% 37.03 22,888 2.5% 21.89 0 0 856,923 93.3% 819.61 918,526
240
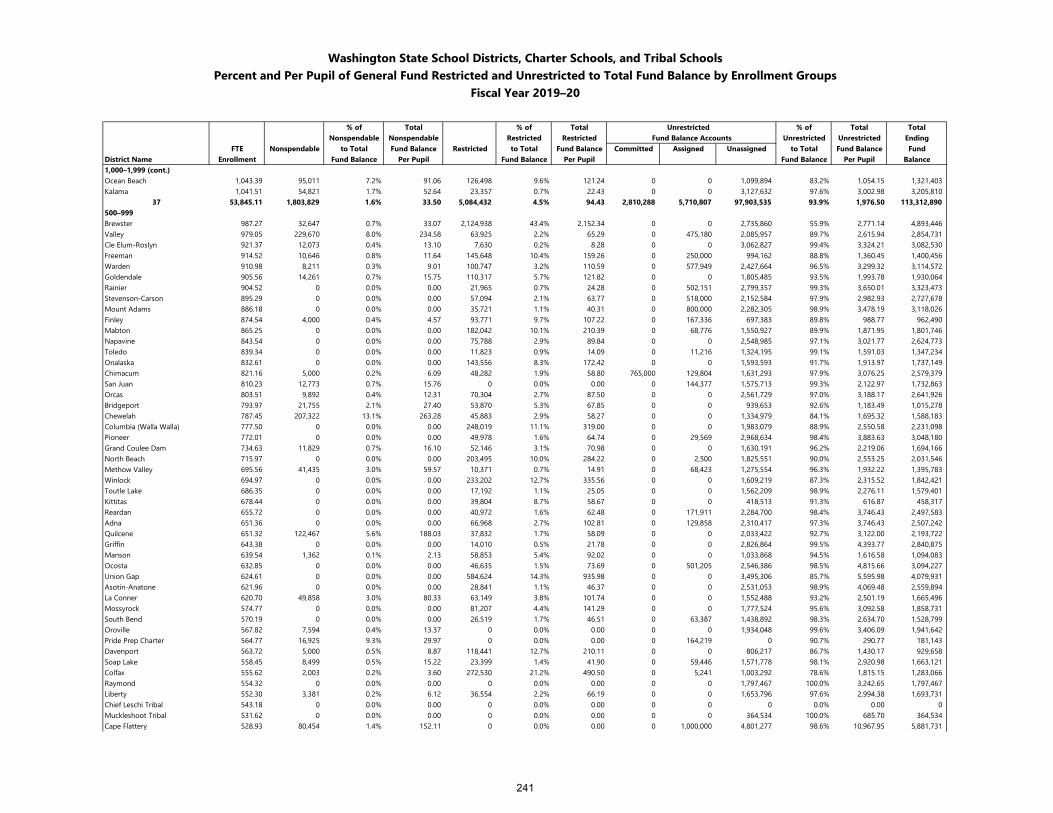
Washington State School Districts, Charter Schools, and Tribal SchoolsPercent and Per Pupil of General Fund Restricted and Unrestricted to Total Fund Balance by Enrollment Groups
Fiscal Year 2019–20
% of Total % of Total Unrestricted % of Total TotalNonspendable Nonspendable Restricted Restricted Fund Balance Accounts Unrestricted Unrestricted Ending
FTE Nonspendable to Total Fund Balance Restricted to Total Fund Balance Committed Assigned Unassigned to Total Fund Balance FundDistrict Name Enrollment Fund Balance Per Pupil Fund Balance Per Pupil Fund Balance Per Pupil Balance1,000–1,999 (cont.)Ocean Beach 1,043.39 95,011 7.2% 91.06 126,498 9.6% 121.24 0 0 1,099,894 83.2% 1,054.15 1,321,403Kalama 1,041.51 54,821 1.7% 52.64 23,357 0.7% 22.43 0 0 3,127,632 97.6% 3,002.98 3,205,810
37 53,845.11 1,803,829 1.6% 33.50 5,084,432 4.5% 94.43 2,810,288 5,710,807 97,903,535 93.9% 1,976.50 113,312,890500–999Brewster 987.27 32,647 0.7% 33.07 2,124,938 43.4% 2,152.34 0 0 2,735,860 55.9% 2,771.14 4,893,446Valley 979.05 229,670 8.0% 234.58 63,925 2.2% 65.29 0 475,180 2,085,957 89.7% 2,615.94 2,854,731Cle Elum-Roslyn 921.37 12,073 0.4% 13.10 7,630 0.2% 8.28 0 0 3,062,827 99.4% 3,324.21 3,082,530Freeman 914.52 10,646 0.8% 11.64 145,648 10.4% 159.26 0 250,000 994,162 88.8% 1,360.45 1,400,456Warden 910.98 8,211 0.3% 9.01 100,747 3.2% 110.59 0 577,949 2,427,664 96.5% 3,299.32 3,114,572Goldendale 905.56 14,261 0.7% 15.75 110,317 5.7% 121.82 0 0 1,805,485 93.5% 1,993.78 1,930,064Rainier 904.52 0 0.0% 0.00 21,965 0.7% 24.28 0 502,151 2,799,357 99.3% 3,650.01 3,323,473Stevenson-Carson 895.29 0 0.0% 0.00 57,094 2.1% 63.77 0 518,000 2,152,584 97.9% 2,982.93 2,727,678Mount Adams 886.18 0 0.0% 0.00 35,721 1.1% 40.31 0 800,000 2,282,305 98.9% 3,478.19 3,118,026Finley 874.54 4,000 0.4% 4.57 93,771 9.7% 107.22 0 167,336 697,383 89.8% 988.77 962,490Mabton 865.25 0 0.0% 0.00 182,042 10.1% 210.39 0 68,776 1,550,927 89.9% 1,871.95 1,801,746Napavine 843.54 0 0.0% 0.00 75,788 2.9% 89.84 0 0 2,548,985 97.1% 3,021.77 2,624,773Toledo 839.34 0 0.0% 0.00 11,823 0.9% 14.09 0 11,216 1,324,195 99.1% 1,591.03 1,347,234Onalaska 832.61 0 0.0% 0.00 143,556 8.3% 172.42 0 0 1,593,593 91.7% 1,913.97 1,737,149Chimacum 821.16 5,000 0.2% 6.09 48,282 1.9% 58.80 765,000 129,804 1,631,293 97.9% 3,076.25 2,579,379San Juan 810.23 12,773 0.7% 15.76 0 0.0% 0.00 0 144,377 1,575,713 99.3% 2,122.97 1,732,863Orcas 803.51 9,892 0.4% 12.31 70,304 2.7% 87.50 0 0 2,561,729 97.0% 3,188.17 2,641,926Bridgeport 793.97 21,755 2.1% 27.40 53,870 5.3% 67.85 0 0 939,653 92.6% 1,183.49 1,015,278Chewelah 787.45 207,322 13.1% 263.28 45,883 2.9% 58.27 0 0 1,334,979 84.1% 1,695.32 1,588,183Columbia (Walla Walla) 777.50 0 0.0% 0.00 248,019 11.1% 319.00 0 0 1,983,079 88.9% 2,550.58 2,231,098Pioneer 772.01 0 0.0% 0.00 49,978 1.6% 64.74 0 29,569 2,968,634 98.4% 3,883.63 3,048,180Grand Coulee Dam 734.63 11,829 0.7% 16.10 52,146 3.1% 70.98 0 0 1,630,191 96.2% 2,219.06 1,694,166North Beach 715.97 0 0.0% 0.00 203,495 10.0% 284.22 0 2,500 1,825,551 90.0% 2,553.25 2,031,546Methow Valley 695.56 41,435 3.0% 59.57 10,371 0.7% 14.91 0 68,423 1,275,554 96.3% 1,932.22 1,395,783Winlock 694.97 0 0.0% 0.00 233,202 12.7% 335.56 0 0 1,609,219 87.3% 2,315.52 1,842,421Toutle Lake 686.35 0 0.0% 0.00 17,192 1.1% 25.05 0 0 1,562,209 98.9% 2,276.11 1,579,401Kittitas 678.44 0 0.0% 0.00 39,804 8.7% 58.67 0 0 418,513 91.3% 616.87 458,317Reardan 655.72 0 0.0% 0.00 40,972 1.6% 62.48 0 171,911 2,284,700 98.4% 3,746.43 2,497,583Adna 651.36 0 0.0% 0.00 66,968 2.7% 102.81 0 129,858 2,310,417 97.3% 3,746.43 2,507,242Quilcene 651.32 122,467 5.6% 188.03 37,832 1.7% 58.09 0 0 2,033,422 92.7% 3,122.00 2,193,722Griffin 643.38 0 0.0% 0.00 14,010 0.5% 21.78 0 0 2,826,864 99.5% 4,393.77 2,840,875Manson 639.54 1,362 0.1% 2.13 58,853 5.4% 92.02 0 0 1,033,868 94.5% 1,616.58 1,094,083Ocosta 632.85 0 0.0% 0.00 46,635 1.5% 73.69 0 501,205 2,546,386 98.5% 4,815.66 3,094,227Union Gap 624.61 0 0.0% 0.00 584,624 14.3% 935.98 0 0 3,495,306 85.7% 5,595.98 4,079,931Asotin-Anatone 621.96 0 0.0% 0.00 28,841 1.1% 46.37 0 0 2,531,053 98.9% 4,069.48 2,559,894La Conner 620.70 49,858 3.0% 80.33 63,149 3.8% 101.74 0 0 1,552,488 93.2% 2,501.19 1,665,496Mossyrock 574.77 0 0.0% 0.00 81,207 4.4% 141.29 0 0 1,777,524 95.6% 3,092.58 1,858,731South Bend 570.19 0 0.0% 0.00 26,519 1.7% 46.51 0 63,387 1,438,892 98.3% 2,634.70 1,528,799Oroville 567.82 7,594 0.4% 13.37 0 0.0% 0.00 0 0 1,934,048 99.6% 3,406.09 1,941,642Pride Prep Charter 564.77 16,925 9.3% 29.97 0 0.0% 0.00 0 164,219 0 90.7% 290.77 181,143Davenport 563.72 5,000 0.5% 8.87 118,441 12.7% 210.11 0 0 806,217 86.7% 1,430.17 929,658Soap Lake 558.45 8,499 0.5% 15.22 23,399 1.4% 41.90 0 59,446 1,571,778 98.1% 2,920.98 1,663,121Colfax 555.62 2,003 0.2% 3.60 272,530 21.2% 490.50 0 5,241 1,003,292 78.6% 1,815.15 1,283,066Raymond 554.32 0 0.0% 0.00 0 0.0% 0.00 0 0 1,797,467 100.0% 3,242.65 1,797,467Liberty 552.30 3,381 0.2% 6.12 36,554 2.2% 66.19 0 0 1,653,796 97.6% 2,994.38 1,693,731Chief Leschi Tribal 543.18 0 0.0% 0.00 0 0.0% 0.00 0 0 0 0.0% 0.00 0Muckleshoot Tribal 531.62 0 0.0% 0.00 0 0.0% 0.00 0 0 364,534 100.0% 685.70 364,534Cape Flattery 528.93 80,454 1.4% 152.11 0 0.0% 0.00 0 1,000,000 4,801,277 98.6% 10,967.95 5,881,731
241
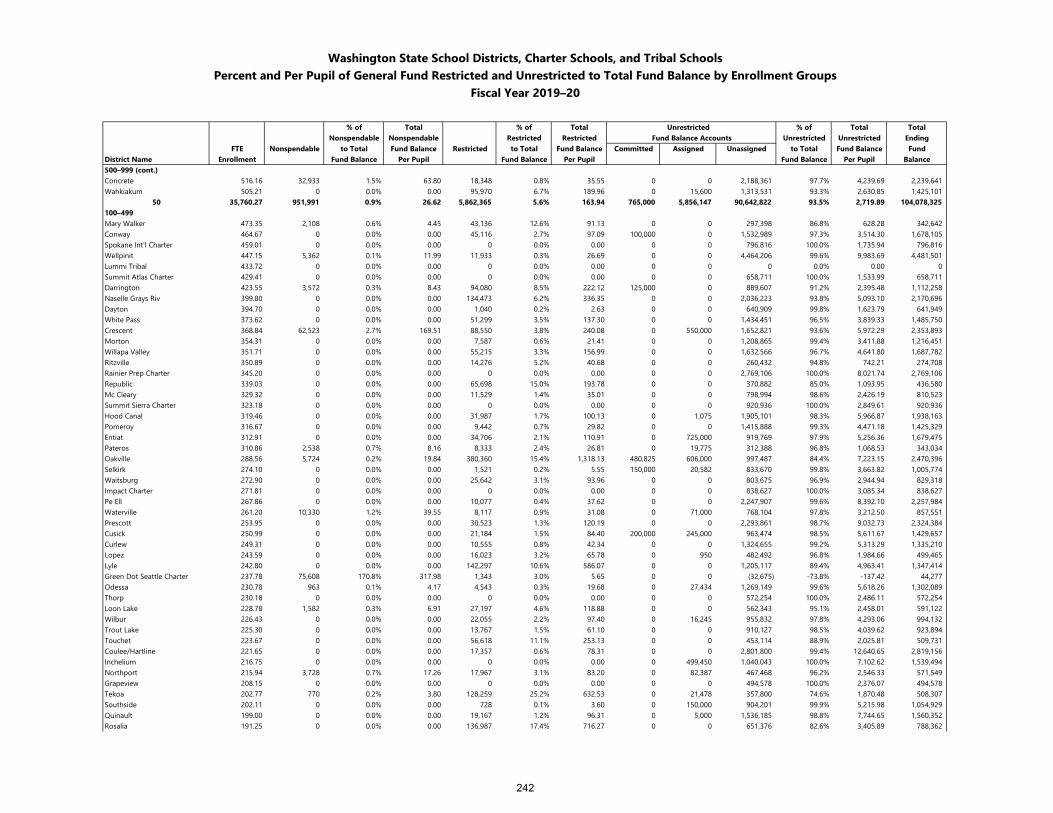
Washington State School Districts, Charter Schools, and Tribal SchoolsPercent and Per Pupil of General Fund Restricted and Unrestricted to Total Fund Balance by Enrollment Groups
Fiscal Year 2019–20
% of Total % of Total Unrestricted % of Total TotalNonspendable Nonspendable Restricted Restricted Fund Balance Accounts Unrestricted Unrestricted Ending
FTE Nonspendable to Total Fund Balance Restricted to Total Fund Balance Committed Assigned Unassigned to Total Fund Balance FundDistrict Name Enrollment Fund Balance Per Pupil Fund Balance Per Pupil Fund Balance Per Pupil Balance500–999 (cont.)Concrete 516.16 32,933 1.5% 63.80 18,348 0.8% 35.55 0 0 2,188,361 97.7% 4,239.69 2,239,641Wahkiakum 505.21 0 0.0% 0.00 95,970 6.7% 189.96 0 15,600 1,313,531 93.3% 2,630.85 1,425,101
50 35,760.27 951,991 0.9% 26.62 5,862,365 5.6% 163.94 765,000 5,856,147 90,642,822 93.5% 2,719.89 104,078,325100–499Mary Walker 473.35 2,108 0.6% 4.45 43,136 12.6% 91.13 0 0 297,398 86.8% 628.28 342,642Conway 464.67 0 0.0% 0.00 45,116 2.7% 97.09 100,000 0 1,532,989 97.3% 3,514.30 1,678,105Spokane Int'l Charter 459.01 0 0.0% 0.00 0 0.0% 0.00 0 0 796,816 100.0% 1,735.94 796,816Wellpinit 447.15 5,362 0.1% 11.99 11,933 0.3% 26.69 0 0 4,464,206 99.6% 9,983.69 4,481,501Lummi Tribal 433.72 0 0.0% 0.00 0 0.0% 0.00 0 0 0 0.0% 0.00 0Summit Atlas Charter 429.41 0 0.0% 0.00 0 0.0% 0.00 0 0 658,711 100.0% 1,533.99 658,711Darrington 423.55 3,572 0.3% 8.43 94,080 8.5% 222.12 125,000 0 889,607 91.2% 2,395.48 1,112,258Naselle Grays Riv 399.80 0 0.0% 0.00 134,473 6.2% 336.35 0 0 2,036,223 93.8% 5,093.10 2,170,696Dayton 394.70 0 0.0% 0.00 1,040 0.2% 2.63 0 0 640,909 99.8% 1,623.79 641,949White Pass 373.62 0 0.0% 0.00 51,299 3.5% 137.30 0 0 1,434,451 96.5% 3,839.33 1,485,750Crescent 368.84 62,523 2.7% 169.51 88,550 3.8% 240.08 0 550,000 1,652,821 93.6% 5,972.29 2,353,893Morton 354.31 0 0.0% 0.00 7,587 0.6% 21.41 0 0 1,208,865 99.4% 3,411.88 1,216,451Willapa Valley 351.71 0 0.0% 0.00 55,215 3.3% 156.99 0 0 1,632,566 96.7% 4,641.80 1,687,782Ritzville 350.89 0 0.0% 0.00 14,276 5.2% 40.68 0 0 260,432 94.8% 742.21 274,708Rainier Prep Charter 345.20 0 0.0% 0.00 0 0.0% 0.00 0 0 2,769,106 100.0% 8,021.74 2,769,106Republic 339.03 0 0.0% 0.00 65,698 15.0% 193.78 0 0 370,882 85.0% 1,093.95 436,580Mc Cleary 329.32 0 0.0% 0.00 11,529 1.4% 35.01 0 0 798,994 98.6% 2,426.19 810,523Summit Sierra Charter 323.18 0 0.0% 0.00 0 0.0% 0.00 0 0 920,936 100.0% 2,849.61 920,936Hood Canal 319.46 0 0.0% 0.00 31,987 1.7% 100.13 0 1,075 1,905,101 98.3% 5,966.87 1,938,163Pomeroy 316.67 0 0.0% 0.00 9,442 0.7% 29.82 0 0 1,415,888 99.3% 4,471.18 1,425,329Entiat 312.91 0 0.0% 0.00 34,706 2.1% 110.91 0 725,000 919,769 97.9% 5,256.36 1,679,475Pateros 310.86 2,538 0.7% 8.16 8,333 2.4% 26.81 0 19,775 312,388 96.8% 1,068.53 343,034Oakville 288.56 5,724 0.2% 19.84 380,360 15.4% 1,318.13 480,825 606,000 997,487 84.4% 7,223.15 2,470,396Selkirk 274.10 0 0.0% 0.00 1,521 0.2% 5.55 150,000 20,582 833,670 99.8% 3,663.82 1,005,774Waitsburg 272.90 0 0.0% 0.00 25,642 3.1% 93.96 0 0 803,675 96.9% 2,944.94 829,318Impact Charter 271.81 0 0.0% 0.00 0 0.0% 0.00 0 0 838,627 100.0% 3,085.34 838,627Pe Ell 267.86 0 0.0% 0.00 10,077 0.4% 37.62 0 0 2,247,907 99.6% 8,392.10 2,257,984Waterville 261.20 10,330 1.2% 39.55 8,117 0.9% 31.08 0 71,000 768,104 97.8% 3,212.50 857,551Prescott 253.95 0 0.0% 0.00 30,523 1.3% 120.19 0 0 2,293,861 98.7% 9,032.73 2,324,384Cusick 250.99 0 0.0% 0.00 21,184 1.5% 84.40 200,000 245,000 963,474 98.5% 5,611.67 1,429,657Curlew 249.31 0 0.0% 0.00 10,555 0.8% 42.34 0 0 1,324,655 99.2% 5,313.29 1,335,210Lopez 243.59 0 0.0% 0.00 16,023 3.2% 65.78 0 950 482,492 96.8% 1,984.66 499,465Lyle 242.80 0 0.0% 0.00 142,297 10.6% 586.07 0 0 1,205,117 89.4% 4,963.41 1,347,414Green Dot Seattle Charter 237.78 75,608 170.8% 317.98 1,343 3.0% 5.65 0 0 (32,675) -73.8% -137.42 44,277Odessa 230.78 963 0.1% 4.17 4,543 0.3% 19.68 0 27,434 1,269,149 99.6% 5,618.26 1,302,089Thorp 230.18 0 0.0% 0.00 0 0.0% 0.00 0 0 572,254 100.0% 2,486.11 572,254Loon Lake 228.78 1,582 0.3% 6.91 27,197 4.6% 118.88 0 0 562,343 95.1% 2,458.01 591,122Wilbur 226.43 0 0.0% 0.00 22,055 2.2% 97.40 0 16,245 955,832 97.8% 4,293.06 994,132Trout Lake 225.30 0 0.0% 0.00 13,767 1.5% 61.10 0 0 910,127 98.5% 4,039.62 923,894Touchet 223.67 0 0.0% 0.00 56,618 11.1% 253.13 0 0 453,114 88.9% 2,025.81 509,731Coulee/Hartline 221.65 0 0.0% 0.00 17,357 0.6% 78.31 0 0 2,801,800 99.4% 12,640.65 2,819,156Inchelium 216.75 0 0.0% 0.00 0 0.0% 0.00 0 499,450 1,040,043 100.0% 7,102.62 1,539,494Northport 215.94 3,728 0.7% 17.26 17,967 3.1% 83.20 0 82,387 467,468 96.2% 2,546.33 571,549Grapeview 208.15 0 0.0% 0.00 0 0.0% 0.00 0 0 494,578 100.0% 2,376.07 494,578Tekoa 202.77 770 0.2% 3.80 128,259 25.2% 632.53 0 21,478 357,800 74.6% 1,870.48 508,307Southside 202.11 0 0.0% 0.00 728 0.1% 3.60 0 150,000 904,201 99.9% 5,215.98 1,054,929Quinault 199.00 0 0.0% 0.00 19,167 1.2% 96.31 0 5,000 1,536,185 98.8% 7,744.65 1,560,352Rosalia 191.25 0 0.0% 0.00 136,987 17.4% 716.27 0 0 651,376 82.6% 3,405.89 788,362
242
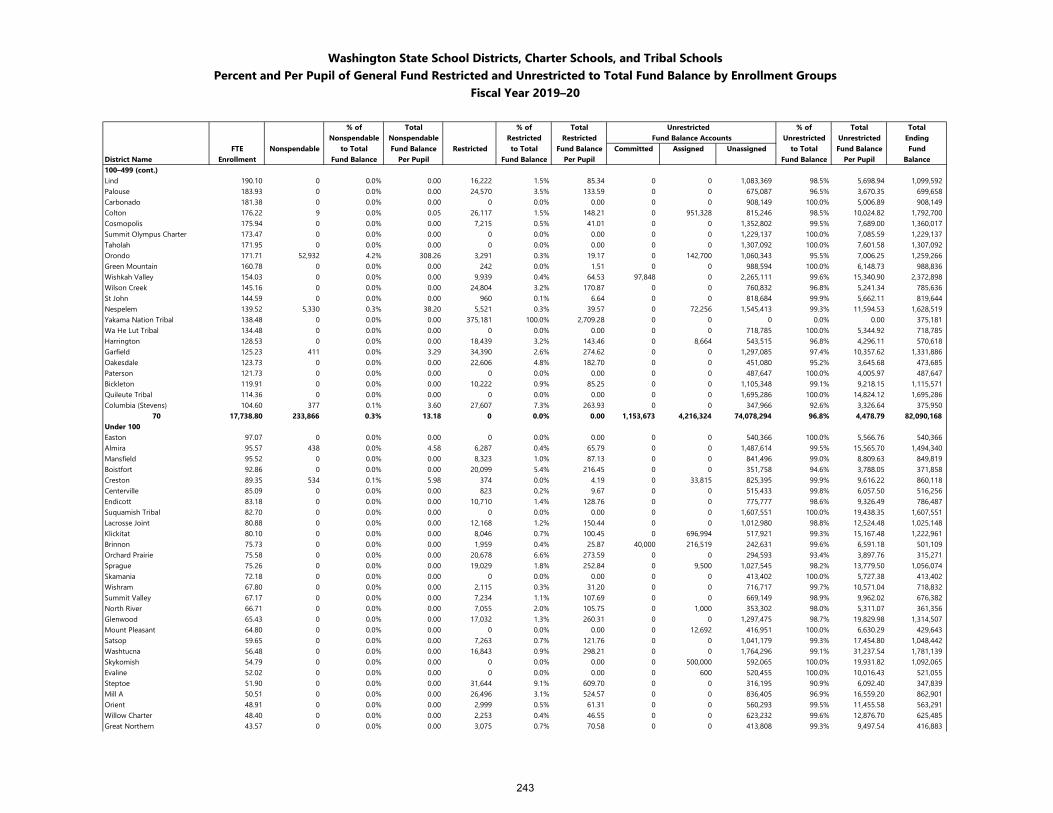
Washington State School Districts, Charter Schools, and Tribal SchoolsPercent and Per Pupil of General Fund Restricted and Unrestricted to Total Fund Balance by Enrollment Groups
Fiscal Year 2019–20
% of Total % of Total Unrestricted % of Total TotalNonspendable Nonspendable Restricted Restricted Fund Balance Accounts Unrestricted Unrestricted Ending
FTE Nonspendable to Total Fund Balance Restricted to Total Fund Balance Committed Assigned Unassigned to Total Fund Balance FundDistrict Name Enrollment Fund Balance Per Pupil Fund Balance Per Pupil Fund Balance Per Pupil Balance100–499 (cont.)Lind 190.10 0 0.0% 0.00 16,222 1.5% 85.34 0 0 1,083,369 98.5% 5,698.94 1,099,592Palouse 183.93 0 0.0% 0.00 24,570 3.5% 133.59 0 0 675,087 96.5% 3,670.35 699,658Carbonado 181.38 0 0.0% 0.00 0 0.0% 0.00 0 0 908,149 100.0% 5,006.89 908,149Colton 176.22 9 0.0% 0.05 26,117 1.5% 148.21 0 951,328 815,246 98.5% 10,024.82 1,792,700Cosmopolis 175.94 0 0.0% 0.00 7,215 0.5% 41.01 0 0 1,352,802 99.5% 7,689.00 1,360,017Summit Olympus Charter 173.47 0 0.0% 0.00 0 0.0% 0.00 0 0 1,229,137 100.0% 7,085.59 1,229,137Taholah 171.95 0 0.0% 0.00 0 0.0% 0.00 0 0 1,307,092 100.0% 7,601.58 1,307,092Orondo 171.71 52,932 4.2% 308.26 3,291 0.3% 19.17 0 142,700 1,060,343 95.5% 7,006.25 1,259,266Green Mountain 160.78 0 0.0% 0.00 242 0.0% 1.51 0 0 988,594 100.0% 6,148.73 988,836Wishkah Valley 154.03 0 0.0% 0.00 9,939 0.4% 64.53 97,848 0 2,265,111 99.6% 15,340.90 2,372,898Wilson Creek 145.16 0 0.0% 0.00 24,804 3.2% 170.87 0 0 760,832 96.8% 5,241.34 785,636St John 144.59 0 0.0% 0.00 960 0.1% 6.64 0 0 818,684 99.9% 5,662.11 819,644Nespelem 139.52 5,330 0.3% 38.20 5,521 0.3% 39.57 0 72,256 1,545,413 99.3% 11,594.53 1,628,519Yakama Nation Tribal 138.48 0 0.0% 0.00 375,181 100.0% 2,709.28 0 0 0 0.0% 0.00 375,181Wa He Lut Tribal 134.48 0 0.0% 0.00 0 0.0% 0.00 0 0 718,785 100.0% 5,344.92 718,785Harrington 128.53 0 0.0% 0.00 18,439 3.2% 143.46 0 8,664 543,515 96.8% 4,296.11 570,618Garfield 125.23 411 0.0% 3.29 34,390 2.6% 274.62 0 0 1,297,085 97.4% 10,357.62 1,331,886Oakesdale 123.73 0 0.0% 0.00 22,606 4.8% 182.70 0 0 451,080 95.2% 3,645.68 473,685Paterson 121.73 0 0.0% 0.00 0 0.0% 0.00 0 0 487,647 100.0% 4,005.97 487,647Bickleton 119.91 0 0.0% 0.00 10,222 0.9% 85.25 0 0 1,105,348 99.1% 9,218.15 1,115,571Quileute Tribal 114.36 0 0.0% 0.00 0 0.0% 0.00 0 0 1,695,286 100.0% 14,824.12 1,695,286Columbia (Stevens) 104.60 377 0.1% 3.60 27,607 7.3% 263.93 0 0 347,966 92.6% 3,326.64 375,950
70 17,738.80 233,866 0.3% 13.18 0 0.0% 0.00 1,153,673 4,216,324 74,078,294 96.8% 4,478.79 82,090,168Under 100Easton 97.07 0 0.0% 0.00 0 0.0% 0.00 0 0 540,366 100.0% 5,566.76 540,366Almira 95.57 438 0.0% 4.58 6,287 0.4% 65.79 0 0 1,487,614 99.5% 15,565.70 1,494,340Mansfield 95.52 0 0.0% 0.00 8,323 1.0% 87.13 0 0 841,496 99.0% 8,809.63 849,819Boistfort 92.86 0 0.0% 0.00 20,099 5.4% 216.45 0 0 351,758 94.6% 3,788.05 371,858Creston 89.35 534 0.1% 5.98 374 0.0% 4.19 0 33,815 825,395 99.9% 9,616.22 860,118Centerville 85.09 0 0.0% 0.00 823 0.2% 9.67 0 0 515,433 99.8% 6,057.50 516,256Endicott 83.18 0 0.0% 0.00 10,710 1.4% 128.76 0 0 775,777 98.6% 9,326.49 786,487Suquamish Tribal 82.70 0 0.0% 0.00 0 0.0% 0.00 0 0 1,607,551 100.0% 19,438.35 1,607,551Lacrosse Joint 80.88 0 0.0% 0.00 12,168 1.2% 150.44 0 0 1,012,980 98.8% 12,524.48 1,025,148Klickitat 80.10 0 0.0% 0.00 8,046 0.7% 100.45 0 696,994 517,921 99.3% 15,167.48 1,222,961Brinnon 75.73 0 0.0% 0.00 1,959 0.4% 25.87 40,000 216,519 242,631 99.6% 6,591.18 501,109Orchard Prairie 75.58 0 0.0% 0.00 20,678 6.6% 273.59 0 0 294,593 93.4% 3,897.76 315,271Sprague 75.26 0 0.0% 0.00 19,029 1.8% 252.84 0 9,500 1,027,545 98.2% 13,779.50 1,056,074Skamania 72.18 0 0.0% 0.00 0 0.0% 0.00 0 0 413,402 100.0% 5,727.38 413,402Wishram 67.80 0 0.0% 0.00 2,115 0.3% 31.20 0 0 716,717 99.7% 10,571.04 718,832Summit Valley 67.17 0 0.0% 0.00 7,234 1.1% 107.69 0 0 669,149 98.9% 9,962.02 676,382North River 66.71 0 0.0% 0.00 7,055 2.0% 105.75 0 1,000 353,302 98.0% 5,311.07 361,356Glenwood 65.43 0 0.0% 0.00 17,032 1.3% 260.31 0 0 1,297,475 98.7% 19,829.98 1,314,507Mount Pleasant 64.80 0 0.0% 0.00 0 0.0% 0.00 0 12,692 416,951 100.0% 6,630.29 429,643Satsop 59.65 0 0.0% 0.00 7,263 0.7% 121.76 0 0 1,041,179 99.3% 17,454.80 1,048,442Washtucna 56.48 0 0.0% 0.00 16,843 0.9% 298.21 0 0 1,764,296 99.1% 31,237.54 1,781,139Skykomish 54.79 0 0.0% 0.00 0 0.0% 0.00 0 500,000 592,065 100.0% 19,931.82 1,092,065Evaline 52.02 0 0.0% 0.00 0 0.0% 0.00 0 600 520,455 100.0% 10,016.43 521,055Steptoe 51.90 0 0.0% 0.00 31,644 9.1% 609.70 0 0 316,195 90.9% 6,092.40 347,839Mill A 50.51 0 0.0% 0.00 26,496 3.1% 524.57 0 0 836,405 96.9% 16,559.20 862,901Orient 48.91 0 0.0% 0.00 2,999 0.5% 61.31 0 0 560,293 99.5% 11,455.58 563,291Willow Charter 48.40 0 0.0% 0.00 2,253 0.4% 46.55 0 0 623,232 99.6% 12,876.70 625,485Great Northern 43.57 0 0.0% 0.00 3,075 0.7% 70.58 0 0 413,808 99.3% 9,497.54 416,883
243
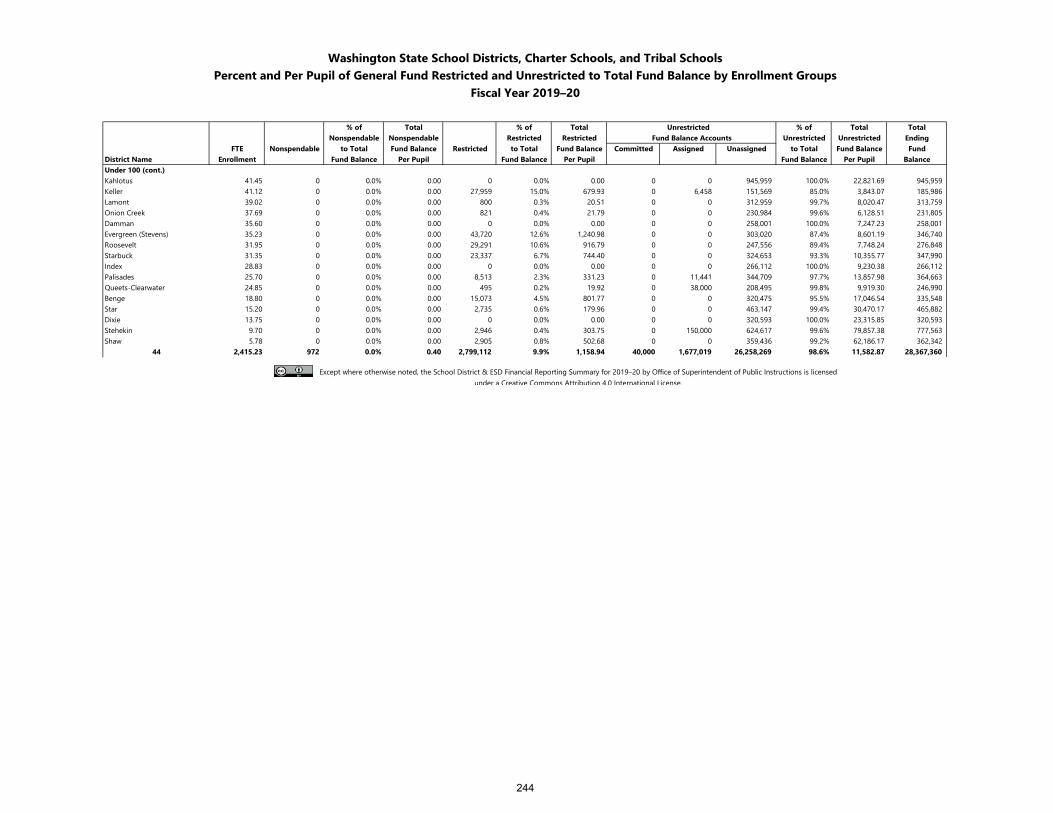
Washington State School Districts, Charter Schools, and Tribal SchoolsPercent and Per Pupil of General Fund Restricted and Unrestricted to Total Fund Balance by Enrollment Groups
Fiscal Year 2019–20
% of Total % of Total Unrestricted % of Total TotalNonspendable Nonspendable Restricted Restricted Fund Balance Accounts Unrestricted Unrestricted Ending
FTE Nonspendable to Total Fund Balance Restricted to Total Fund Balance Committed Assigned Unassigned to Total Fund Balance FundDistrict Name Enrollment Fund Balance Per Pupil Fund Balance Per Pupil Fund Balance Per Pupil BalanceUnder 100 (cont.)Kahlotus 41.45 0 0.0% 0.00 0 0.0% 0.00 0 0 945,959 100.0% 22,821.69 945,959Keller 41.12 0 0.0% 0.00 27,959 15.0% 679.93 0 6,458 151,569 85.0% 3,843.07 185,986Lamont 39.02 0 0.0% 0.00 800 0.3% 20.51 0 0 312,959 99.7% 8,020.47 313,759Onion Creek 37.69 0 0.0% 0.00 821 0.4% 21.79 0 0 230,984 99.6% 6,128.51 231,805Damman 35.60 0 0.0% 0.00 0 0.0% 0.00 0 0 258,001 100.0% 7,247.23 258,001Evergreen (Stevens) 35.23 0 0.0% 0.00 43,720 12.6% 1,240.98 0 0 303,020 87.4% 8,601.19 346,740Roosevelt 31.95 0 0.0% 0.00 29,291 10.6% 916.79 0 0 247,556 89.4% 7,748.24 276,848Starbuck 31.35 0 0.0% 0.00 23,337 6.7% 744.40 0 0 324,653 93.3% 10,355.77 347,990Index 28.83 0 0.0% 0.00 0 0.0% 0.00 0 0 266,112 100.0% 9,230.38 266,112Palisades 25.70 0 0.0% 0.00 8,513 2.3% 331.23 0 11,441 344,709 97.7% 13,857.98 364,663Queets-Clearwater 24.85 0 0.0% 0.00 495 0.2% 19.92 0 38,000 208,495 99.8% 9,919.30 246,990Benge 18.80 0 0.0% 0.00 15,073 4.5% 801.77 0 0 320,475 95.5% 17,046.54 335,548Star 15.20 0 0.0% 0.00 2,735 0.6% 179.96 0 0 463,147 99.4% 30,470.17 465,882Dixie 13.75 0 0.0% 0.00 0 0.0% 0.00 0 0 320,593 100.0% 23,315.85 320,593Stehekin 9.70 0 0.0% 0.00 2,946 0.4% 303.75 0 150,000 624,617 99.6% 79,857.38 777,563Shaw 5.78 0 0.0% 0.00 2,905 0.8% 502.68 0 0 359,436 99.2% 62,186.17 362,342
44 2,415.23 972 0.0% 0.40 2,799,112 9.9% 1,158.94 40,000 1,677,019 26,258,269 98.6% 11,582.87 28,367,360
Except where otherwise noted, the School District & ESD Financial Reporting Summary for 2019–20 by Office of Superintendent of Public Instructions is licensed under a Creative Commons Attribution 4.0 International License.
244
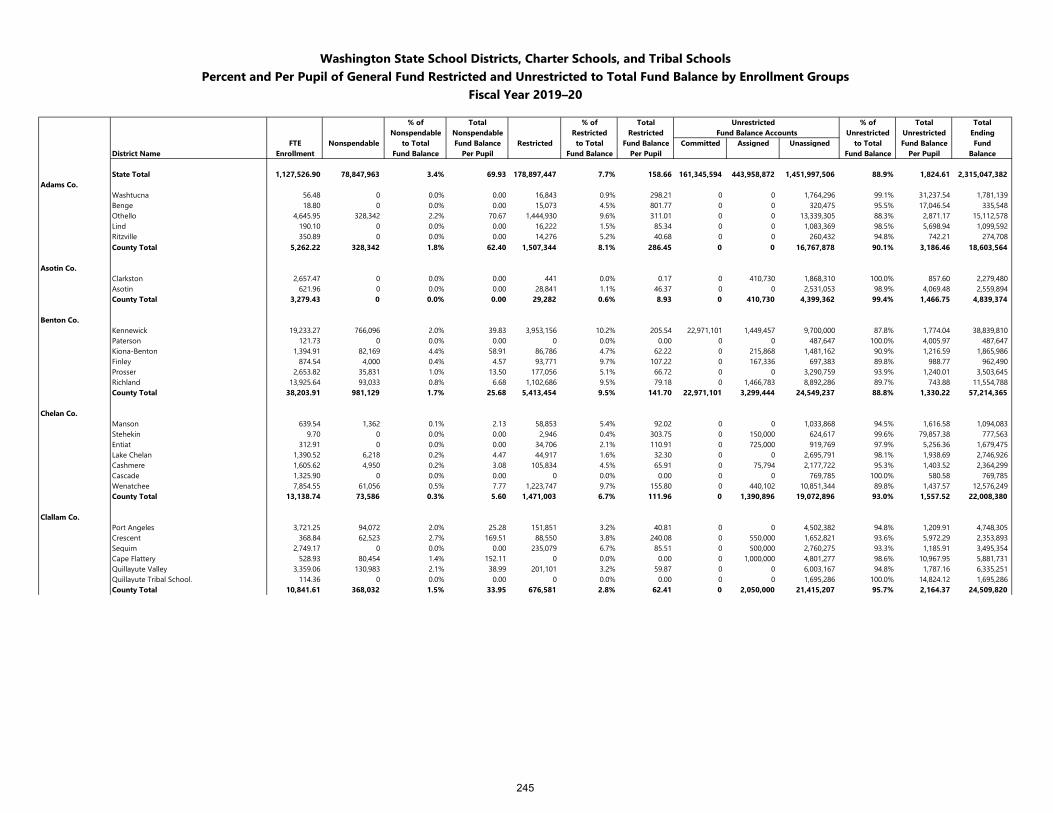
Washington State School Districts, Charter Schools, and Tribal SchoolsPercent and Per Pupil of General Fund Restricted and Unrestricted to Total Fund Balance by Enrollment Groups
Fiscal Year 2019–20
% of Total % of Total Unrestricted % of Total TotalNonspendable Nonspendable Restricted Restricted Fund Balance Accounts Unrestricted Unrestricted Ending
FTE Nonspendable to Total Fund Balance Restricted to Total Fund Balance Committed Assigned Unassigned to Total Fund Balance FundDistrict Name Enrollment Fund Balance Per Pupil Fund Balance Per Pupil Fund Balance Per Pupil Balance
State Total 1,127,526.90 78,847,963 3.4% 69.93 178,897,447 7.7% 158.66 161,345,594 443,958,872 1,451,997,506 88.9% 1,824.61 2,315,047,382Adams Co.
Washtucna 56.48 0 0.0% 0.00 16,843 0.9% 298.21 0 0 1,764,296 99.1% 31,237.54 1,781,139Benge 18.80 0 0.0% 0.00 15,073 4.5% 801.77 0 0 320,475 95.5% 17,046.54 335,548Othello 4,645.95 328,342 2.2% 70.67 1,444,930 9.6% 311.01 0 0 13,339,305 88.3% 2,871.17 15,112,578Lind 190.10 0 0.0% 0.00 16,222 1.5% 85.34 0 0 1,083,369 98.5% 5,698.94 1,099,592Ritzville 350.89 0 0.0% 0.00 14,276 5.2% 40.68 0 0 260,432 94.8% 742.21 274,708County Total 5,262.22 328,342 1.8% 62.40 1,507,344 8.1% 286.45 0 0 16,767,878 90.1% 3,186.46 18,603,564
Asotin Co.Clarkston 2,657.47 0 0.0% 0.00 441 0.0% 0.17 0 410,730 1,868,310 100.0% 857.60 2,279,480Asotin 621.96 0 0.0% 0.00 28,841 1.1% 46.37 0 0 2,531,053 98.9% 4,069.48 2,559,894County Total 3,279.43 0 0.0% 0.00 29,282 0.6% 8.93 0 410,730 4,399,362 99.4% 1,466.75 4,839,374
Benton Co.Kennewick 19,233.27 766,096 2.0% 39.83 3,953,156 10.2% 205.54 22,971,101 1,449,457 9,700,000 87.8% 1,774.04 38,839,810Paterson 121.73 0 0.0% 0.00 0 0.0% 0.00 0 0 487,647 100.0% 4,005.97 487,647Kiona-Benton 1,394.91 82,169 4.4% 58.91 86,786 4.7% 62.22 0 215,868 1,481,162 90.9% 1,216.59 1,865,986Finley 874.54 4,000 0.4% 4.57 93,771 9.7% 107.22 0 167,336 697,383 89.8% 988.77 962,490Prosser 2,653.82 35,831 1.0% 13.50 177,056 5.1% 66.72 0 0 3,290,759 93.9% 1,240.01 3,503,645Richland 13,925.64 93,033 0.8% 6.68 1,102,686 9.5% 79.18 0 1,466,783 8,892,286 89.7% 743.88 11,554,788County Total 38,203.91 981,129 1.7% 25.68 5,413,454 9.5% 141.70 22,971,101 3,299,444 24,549,237 88.8% 1,330.22 57,214,365
Chelan Co.Manson 639.54 1,362 0.1% 2.13 58,853 5.4% 92.02 0 0 1,033,868 94.5% 1,616.58 1,094,083Stehekin 9.70 0 0.0% 0.00 2,946 0.4% 303.75 0 150,000 624,617 99.6% 79,857.38 777,563Entiat 312.91 0 0.0% 0.00 34,706 2.1% 110.91 0 725,000 919,769 97.9% 5,256.36 1,679,475Lake Chelan 1,390.52 6,218 0.2% 4.47 44,917 1.6% 32.30 0 0 2,695,791 98.1% 1,938.69 2,746,926Cashmere 1,605.62 4,950 0.2% 3.08 105,834 4.5% 65.91 0 75,794 2,177,722 95.3% 1,403.52 2,364,299Cascade 1,325.90 0 0.0% 0.00 0 0.0% 0.00 0 0 769,785 100.0% 580.58 769,785Wenatchee 7,854.55 61,056 0.5% 7.77 1,223,747 9.7% 155.80 0 440,102 10,851,344 89.8% 1,437.57 12,576,249County Total 13,138.74 73,586 0.3% 5.60 1,471,003 6.7% 111.96 0 1,390,896 19,072,896 93.0% 1,557.52 22,008,380
Clallam Co.Port Angeles 3,721.25 94,072 2.0% 25.28 151,851 3.2% 40.81 0 0 4,502,382 94.8% 1,209.91 4,748,305Crescent 368.84 62,523 2.7% 169.51 88,550 3.8% 240.08 0 550,000 1,652,821 93.6% 5,972.29 2,353,893Sequim 2,749.17 0 0.0% 0.00 235,079 6.7% 85.51 0 500,000 2,760,275 93.3% 1,185.91 3,495,354Cape Flattery 528.93 80,454 1.4% 152.11 0 0.0% 0.00 0 1,000,000 4,801,277 98.6% 10,967.95 5,881,731Quillayute Valley 3,359.06 130,983 2.1% 38.99 201,101 3.2% 59.87 0 0 6,003,167 94.8% 1,787.16 6,335,251Quillayute Tribal School. 114.36 0 0.0% 0.00 0 0.0% 0.00 0 0 1,695,286 100.0% 14,824.12 1,695,286County Total 10,841.61 368,032 1.5% 33.95 676,581 2.8% 62.41 0 2,050,000 21,415,207 95.7% 2,164.37 24,509,820
245
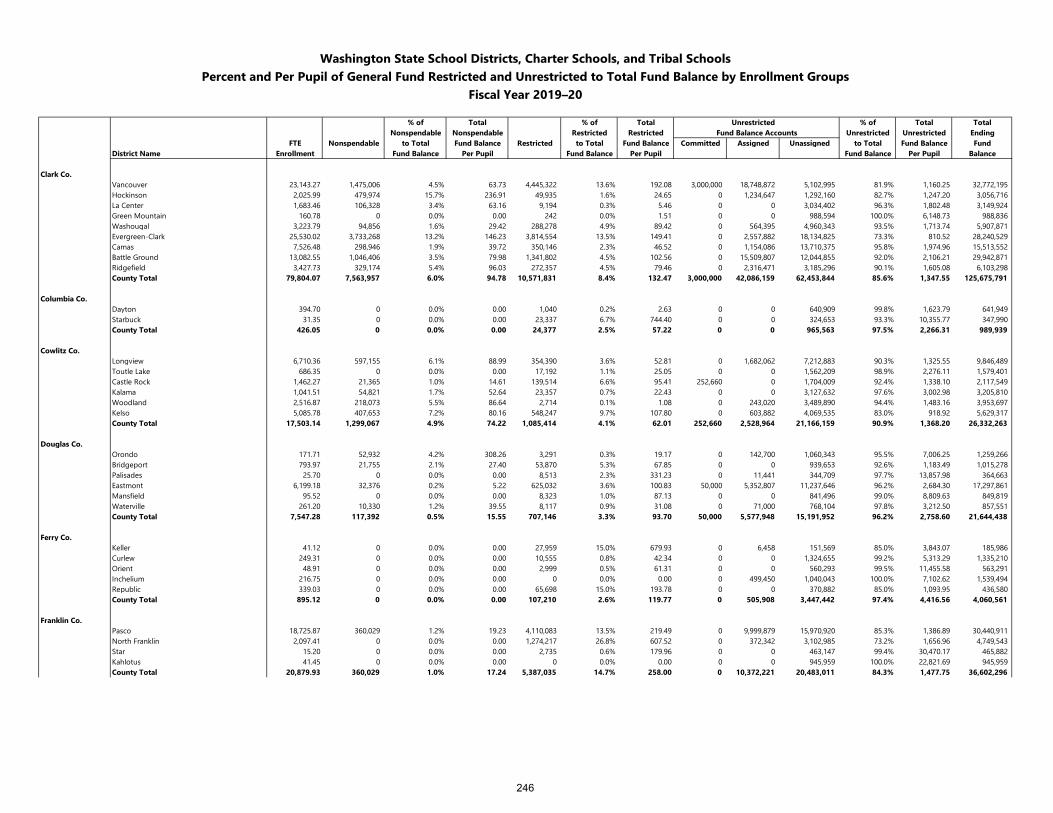
Washington State School Districts, Charter Schools, and Tribal SchoolsPercent and Per Pupil of General Fund Restricted and Unrestricted to Total Fund Balance by Enrollment Groups
Fiscal Year 2019–20
% of Total % of Total Unrestricted % of Total TotalNonspendable Nonspendable Restricted Restricted Fund Balance Accounts Unrestricted Unrestricted Ending
FTE Nonspendable to Total Fund Balance Restricted to Total Fund Balance Committed Assigned Unassigned to Total Fund Balance FundDistrict Name Enrollment Fund Balance Per Pupil Fund Balance Per Pupil Fund Balance Per Pupil Balance
Clark Co.Vancouver 23,143.27 1,475,006 4.5% 63.73 4,445,322 13.6% 192.08 3,000,000 18,748,872 5,102,995 81.9% 1,160.25 32,772,195Hockinson 2,025.99 479,974 15.7% 236.91 49,935 1.6% 24.65 0 1,234,647 1,292,160 82.7% 1,247.20 3,056,716La Center 1,683.46 106,328 3.4% 63.16 9,194 0.3% 5.46 0 0 3,034,402 96.3% 1,802.48 3,149,924Green Mountain 160.78 0 0.0% 0.00 242 0.0% 1.51 0 0 988,594 100.0% 6,148.73 988,836Washougal 3,223.79 94,856 1.6% 29.42 288,278 4.9% 89.42 0 564,395 4,960,343 93.5% 1,713.74 5,907,871Evergreen-Clark 25,530.02 3,733,268 13.2% 146.23 3,814,554 13.5% 149.41 0 2,557,882 18,134,825 73.3% 810.52 28,240,529Camas 7,526.48 298,946 1.9% 39.72 350,146 2.3% 46.52 0 1,154,086 13,710,375 95.8% 1,974.96 15,513,552Battle Ground 13,082.55 1,046,406 3.5% 79.98 1,341,802 4.5% 102.56 0 15,509,807 12,044,855 92.0% 2,106.21 29,942,871Ridgefield 3,427.73 329,174 5.4% 96.03 272,357 4.5% 79.46 0 2,316,471 3,185,296 90.1% 1,605.08 6,103,298County Total 79,804.07 7,563,957 6.0% 94.78 10,571,831 8.4% 132.47 3,000,000 42,086,159 62,453,844 85.6% 1,347.55 125,675,791
Columbia Co.Dayton 394.70 0 0.0% 0.00 1,040 0.2% 2.63 0 0 640,909 99.8% 1,623.79 641,949Starbuck 31.35 0 0.0% 0.00 23,337 6.7% 744.40 0 0 324,653 93.3% 10,355.77 347,990County Total 426.05 0 0.0% 0.00 24,377 2.5% 57.22 0 0 965,563 97.5% 2,266.31 989,939
Cowlitz Co.Longview 6,710.36 597,155 6.1% 88.99 354,390 3.6% 52.81 0 1,682,062 7,212,883 90.3% 1,325.55 9,846,489Toutle Lake 686.35 0 0.0% 0.00 17,192 1.1% 25.05 0 0 1,562,209 98.9% 2,276.11 1,579,401Castle Rock 1,462.27 21,365 1.0% 14.61 139,514 6.6% 95.41 252,660 0 1,704,009 92.4% 1,338.10 2,117,549Kalama 1,041.51 54,821 1.7% 52.64 23,357 0.7% 22.43 0 0 3,127,632 97.6% 3,002.98 3,205,810Woodland 2,516.87 218,073 5.5% 86.64 2,714 0.1% 1.08 0 243,020 3,489,890 94.4% 1,483.16 3,953,697Kelso 5,085.78 407,653 7.2% 80.16 548,247 9.7% 107.80 0 603,882 4,069,535 83.0% 918.92 5,629,317County Total 17,503.14 1,299,067 4.9% 74.22 1,085,414 4.1% 62.01 252,660 2,528,964 21,166,159 90.9% 1,368.20 26,332,263
Douglas Co.Orondo 171.71 52,932 4.2% 308.26 3,291 0.3% 19.17 0 142,700 1,060,343 95.5% 7,006.25 1,259,266Bridgeport 793.97 21,755 2.1% 27.40 53,870 5.3% 67.85 0 0 939,653 92.6% 1,183.49 1,015,278Palisades 25.70 0 0.0% 0.00 8,513 2.3% 331.23 0 11,441 344,709 97.7% 13,857.98 364,663Eastmont 6,199.18 32,376 0.2% 5.22 625,032 3.6% 100.83 50,000 5,352,807 11,237,646 96.2% 2,684.30 17,297,861Mansfield 95.52 0 0.0% 0.00 8,323 1.0% 87.13 0 0 841,496 99.0% 8,809.63 849,819Waterville 261.20 10,330 1.2% 39.55 8,117 0.9% 31.08 0 71,000 768,104 97.8% 3,212.50 857,551County Total 7,547.28 117,392 0.5% 15.55 707,146 3.3% 93.70 50,000 5,577,948 15,191,952 96.2% 2,758.60 21,644,438
Ferry Co.Keller 41.12 0 0.0% 0.00 27,959 15.0% 679.93 0 6,458 151,569 85.0% 3,843.07 185,986Curlew 249.31 0 0.0% 0.00 10,555 0.8% 42.34 0 0 1,324,655 99.2% 5,313.29 1,335,210Orient 48.91 0 0.0% 0.00 2,999 0.5% 61.31 0 0 560,293 99.5% 11,455.58 563,291Inchelium 216.75 0 0.0% 0.00 0 0.0% 0.00 0 499,450 1,040,043 100.0% 7,102.62 1,539,494Republic 339.03 0 0.0% 0.00 65,698 15.0% 193.78 0 0 370,882 85.0% 1,093.95 436,580County Total 895.12 0 0.0% 0.00 107,210 2.6% 119.77 0 505,908 3,447,442 97.4% 4,416.56 4,060,561
Franklin Co.Pasco 18,725.87 360,029 1.2% 19.23 4,110,083 13.5% 219.49 0 9,999,879 15,970,920 85.3% 1,386.89 30,440,911North Franklin 2,097.41 0 0.0% 0.00 1,274,217 26.8% 607.52 0 372,342 3,102,985 73.2% 1,656.96 4,749,543Star 15.20 0 0.0% 0.00 2,735 0.6% 179.96 0 0 463,147 99.4% 30,470.17 465,882Kahlotus 41.45 0 0.0% 0.00 0 0.0% 0.00 0 0 945,959 100.0% 22,821.69 945,959County Total 20,879.93 360,029 1.0% 17.24 5,387,035 14.7% 258.00 0 10,372,221 20,483,011 84.3% 1,477.75 36,602,296
246
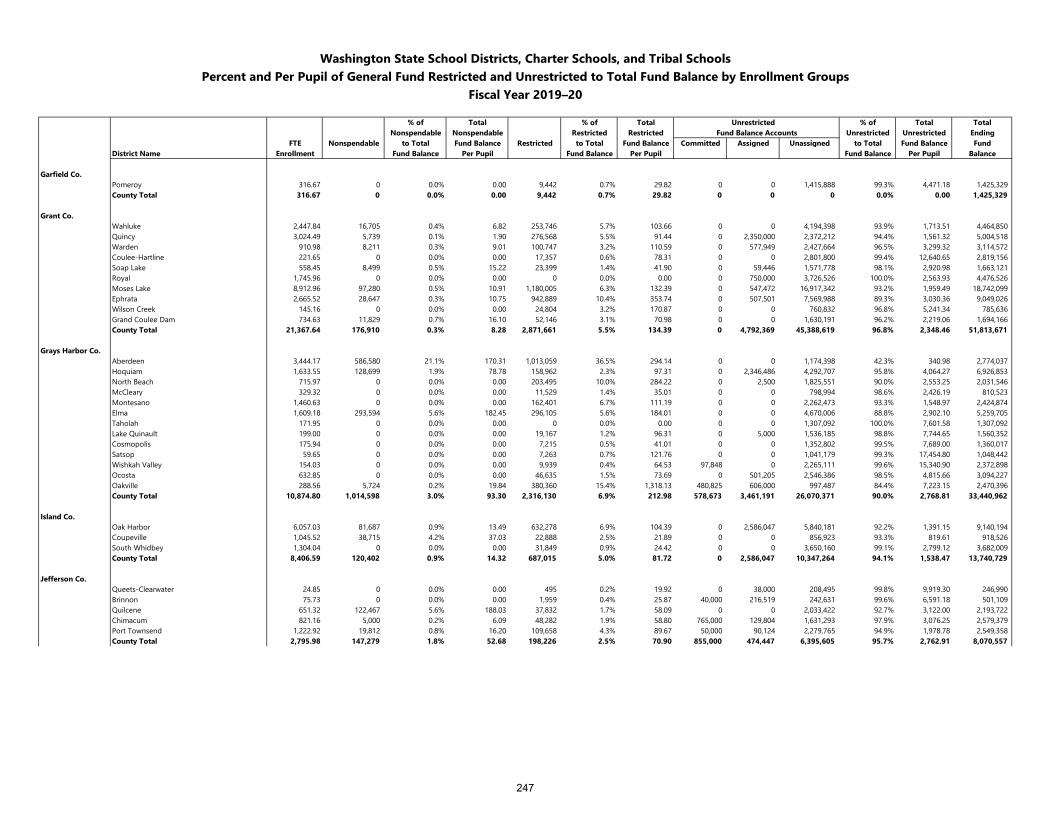
Washington State School Districts, Charter Schools, and Tribal SchoolsPercent and Per Pupil of General Fund Restricted and Unrestricted to Total Fund Balance by Enrollment Groups
Fiscal Year 2019–20
% of Total % of Total Unrestricted % of Total TotalNonspendable Nonspendable Restricted Restricted Fund Balance Accounts Unrestricted Unrestricted Ending
FTE Nonspendable to Total Fund Balance Restricted to Total Fund Balance Committed Assigned Unassigned to Total Fund Balance FundDistrict Name Enrollment Fund Balance Per Pupil Fund Balance Per Pupil Fund Balance Per Pupil Balance
Garfield Co.Pomeroy 316.67 0 0.0% 0.00 9,442 0.7% 29.82 0 0 1,415,888 99.3% 4,471.18 1,425,329County Total 316.67 0 0.0% 0.00 9,442 0.7% 29.82 0 0 0 0.0% 0.00 1,425,329
Grant Co.Wahluke 2,447.84 16,705 0.4% 6.82 253,746 5.7% 103.66 0 0 4,194,398 93.9% 1,713.51 4,464,850Quincy 3,024.49 5,739 0.1% 1.90 276,568 5.5% 91.44 0 2,350,000 2,372,212 94.4% 1,561.32 5,004,518Warden 910.98 8,211 0.3% 9.01 100,747 3.2% 110.59 0 577,949 2,427,664 96.5% 3,299.32 3,114,572Coulee-Hartline 221.65 0 0.0% 0.00 17,357 0.6% 78.31 0 0 2,801,800 99.4% 12,640.65 2,819,156Soap Lake 558.45 8,499 0.5% 15.22 23,399 1.4% 41.90 0 59,446 1,571,778 98.1% 2,920.98 1,663,121Royal 1,745.96 0 0.0% 0.00 0 0.0% 0.00 0 750,000 3,726,526 100.0% 2,563.93 4,476,526Moses Lake 8,912.96 97,280 0.5% 10.91 1,180,005 6.3% 132.39 0 547,472 16,917,342 93.2% 1,959.49 18,742,099Ephrata 2,665.52 28,647 0.3% 10.75 942,889 10.4% 353.74 0 507,501 7,569,988 89.3% 3,030.36 9,049,026Wilson Creek 145.16 0 0.0% 0.00 24,804 3.2% 170.87 0 0 760,832 96.8% 5,241.34 785,636Grand Coulee Dam 734.63 11,829 0.7% 16.10 52,146 3.1% 70.98 0 0 1,630,191 96.2% 2,219.06 1,694,166County Total 21,367.64 176,910 0.3% 8.28 2,871,661 5.5% 134.39 0 4,792,369 45,388,619 96.8% 2,348.46 51,813,671
Grays Harbor Co.Aberdeen 3,444.17 586,580 21.1% 170.31 1,013,059 36.5% 294.14 0 0 1,174,398 42.3% 340.98 2,774,037Hoquiam 1,633.55 128,699 1.9% 78.78 158,962 2.3% 97.31 0 2,346,486 4,292,707 95.8% 4,064.27 6,926,853North Beach 715.97 0 0.0% 0.00 203,495 10.0% 284.22 0 2,500 1,825,551 90.0% 2,553.25 2,031,546McCleary 329.32 0 0.0% 0.00 11,529 1.4% 35.01 0 0 798,994 98.6% 2,426.19 810,523Montesano 1,460.63 0 0.0% 0.00 162,401 6.7% 111.19 0 0 2,262,473 93.3% 1,548.97 2,424,874Elma 1,609.18 293,594 5.6% 182.45 296,105 5.6% 184.01 0 0 4,670,006 88.8% 2,902.10 5,259,705Taholah 171.95 0 0.0% 0.00 0 0.0% 0.00 0 0 1,307,092 100.0% 7,601.58 1,307,092Lake Quinault 199.00 0 0.0% 0.00 19,167 1.2% 96.31 0 5,000 1,536,185 98.8% 7,744.65 1,560,352Cosmopolis 175.94 0 0.0% 0.00 7,215 0.5% 41.01 0 0 1,352,802 99.5% 7,689.00 1,360,017Satsop 59.65 0 0.0% 0.00 7,263 0.7% 121.76 0 0 1,041,179 99.3% 17,454.80 1,048,442Wishkah Valley 154.03 0 0.0% 0.00 9,939 0.4% 64.53 97,848 0 2,265,111 99.6% 15,340.90 2,372,898Ocosta 632.85 0 0.0% 0.00 46,635 1.5% 73.69 0 501,205 2,546,386 98.5% 4,815.66 3,094,227Oakville 288.56 5,724 0.2% 19.84 380,360 15.4% 1,318.13 480,825 606,000 997,487 84.4% 7,223.15 2,470,396County Total 10,874.80 1,014,598 3.0% 93.30 2,316,130 6.9% 212.98 578,673 3,461,191 26,070,371 90.0% 2,768.81 33,440,962
Island Co.Oak Harbor 6,057.03 81,687 0.9% 13.49 632,278 6.9% 104.39 0 2,586,047 5,840,181 92.2% 1,391.15 9,140,194Coupeville 1,045.52 38,715 4.2% 37.03 22,888 2.5% 21.89 0 0 856,923 93.3% 819.61 918,526South Whidbey 1,304.04 0 0.0% 0.00 31,849 0.9% 24.42 0 0 3,650,160 99.1% 2,799.12 3,682,009County Total 8,406.59 120,402 0.9% 14.32 687,015 5.0% 81.72 0 2,586,047 10,347,264 94.1% 1,538.47 13,740,729
Jefferson Co.Queets-Clearwater 24.85 0 0.0% 0.00 495 0.2% 19.92 0 38,000 208,495 99.8% 9,919.30 246,990Brinnon 75.73 0 0.0% 0.00 1,959 0.4% 25.87 40,000 216,519 242,631 99.6% 6,591.18 501,109Quilcene 651.32 122,467 5.6% 188.03 37,832 1.7% 58.09 0 0 2,033,422 92.7% 3,122.00 2,193,722Chimacum 821.16 5,000 0.2% 6.09 48,282 1.9% 58.80 765,000 129,804 1,631,293 97.9% 3,076.25 2,579,379Port Townsend 1,222.92 19,812 0.8% 16.20 109,658 4.3% 89.67 50,000 90,124 2,279,765 94.9% 1,978.78 2,549,358County Total 2,795.98 147,279 1.8% 52.68 198,226 2.5% 70.90 855,000 474,447 6,395,605 95.7% 2,762.91 8,070,557
247
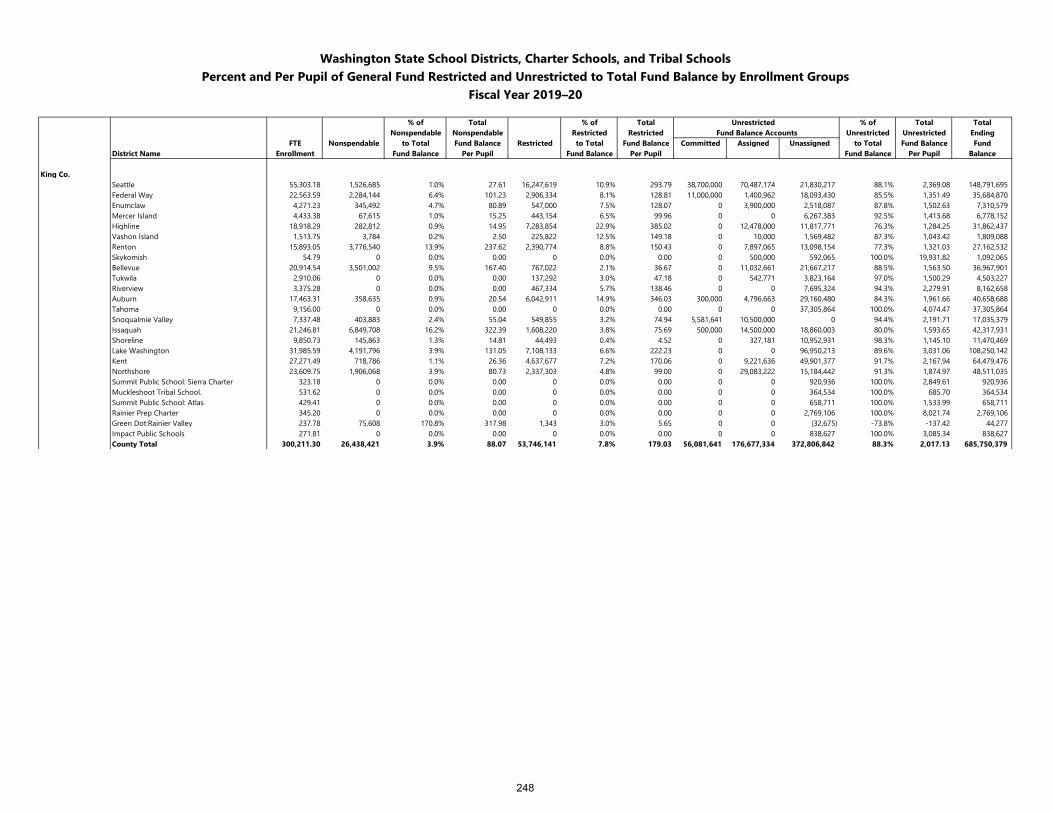
Washington State School Districts, Charter Schools, and Tribal SchoolsPercent and Per Pupil of General Fund Restricted and Unrestricted to Total Fund Balance by Enrollment Groups
Fiscal Year 2019–20
% of Total % of Total Unrestricted % of Total TotalNonspendable Nonspendable Restricted Restricted Fund Balance Accounts Unrestricted Unrestricted Ending
FTE Nonspendable to Total Fund Balance Restricted to Total Fund Balance Committed Assigned Unassigned to Total Fund Balance FundDistrict Name Enrollment Fund Balance Per Pupil Fund Balance Per Pupil Fund Balance Per Pupil Balance
King Co.Seattle 55,303.18 1,526,685 1.0% 27.61 16,247,619 10.9% 293.79 38,700,000 70,487,174 21,830,217 88.1% 2,369.08 148,791,695Federal Way 22,563.59 2,284,144 6.4% 101.23 2,906,334 8.1% 128.81 11,000,000 1,400,962 18,093,430 85.5% 1,351.49 35,684,870Enumclaw 4,271.23 345,492 4.7% 80.89 547,000 7.5% 128.07 0 3,900,000 2,518,087 87.8% 1,502.63 7,310,579Mercer Island 4,433.38 67,615 1.0% 15.25 443,154 6.5% 99.96 0 0 6,267,383 92.5% 1,413.68 6,778,152Highline 18,918.29 282,812 0.9% 14.95 7,283,854 22.9% 385.02 0 12,478,000 11,817,771 76.3% 1,284.25 31,862,437Vashon Island 1,513.75 3,784 0.2% 2.50 225,822 12.5% 149.18 0 10,000 1,569,482 87.3% 1,043.42 1,809,088Renton 15,893.05 3,776,540 13.9% 237.62 2,390,774 8.8% 150.43 0 7,897,065 13,098,154 77.3% 1,321.03 27,162,532Skykomish 54.79 0 0.0% 0.00 0 0.0% 0.00 0 500,000 592,065 100.0% 19,931.82 1,092,065Bellevue 20,914.54 3,501,002 9.5% 167.40 767,022 2.1% 36.67 0 11,032,661 21,667,217 88.5% 1,563.50 36,967,901Tukwila 2,910.06 0 0.0% 0.00 137,292 3.0% 47.18 0 542,771 3,823,164 97.0% 1,500.29 4,503,227Riverview 3,375.28 0 0.0% 0.00 467,334 5.7% 138.46 0 0 7,695,324 94.3% 2,279.91 8,162,658Auburn 17,463.31 358,635 0.9% 20.54 6,042,911 14.9% 346.03 300,000 4,796,663 29,160,480 84.3% 1,961.66 40,658,688Tahoma 9,156.00 0 0.0% 0.00 0 0.0% 0.00 0 0 37,305,864 100.0% 4,074.47 37,305,864Snoqualmie Valley 7,337.48 403,883 2.4% 55.04 549,855 3.2% 74.94 5,581,641 10,500,000 0 94.4% 2,191.71 17,035,379Issaquah 21,246.81 6,849,708 16.2% 322.39 1,608,220 3.8% 75.69 500,000 14,500,000 18,860,003 80.0% 1,593.65 42,317,931Shoreline 9,850.73 145,863 1.3% 14.81 44,493 0.4% 4.52 0 327,181 10,952,931 98.3% 1,145.10 11,470,469Lake Washington 31,985.59 4,191,796 3.9% 131.05 7,108,133 6.6% 222.23 0 0 96,950,213 89.6% 3,031.06 108,250,142Kent 27,271.49 718,786 1.1% 26.36 4,637,677 7.2% 170.06 0 9,221,636 49,901,377 91.7% 2,167.94 64,479,476Northshore 23,609.75 1,906,068 3.9% 80.73 2,337,303 4.8% 99.00 0 29,083,222 15,184,442 91.3% 1,874.97 48,511,035Summit Public School: Sierra Charter 323.18 0 0.0% 0.00 0 0.0% 0.00 0 0 920,936 100.0% 2,849.61 920,936Muckleshoot Tribal School. 531.62 0 0.0% 0.00 0 0.0% 0.00 0 0 364,534 100.0% 685.70 364,534Summit Public School: Atlas 429.41 0 0.0% 0.00 0 0.0% 0.00 0 0 658,711 100.0% 1,533.99 658,711Rainier Prep Charter 345.20 0 0.0% 0.00 0 0.0% 0.00 0 0 2,769,106 100.0% 8,021.74 2,769,106Green Dot:Rainier Valley 237.78 75,608 170.8% 317.98 1,343 3.0% 5.65 0 0 (32,675) -73.8% -137.42 44,277Impact Public Schools 271.81 0 0.0% 0.00 0 0.0% 0.00 0 0 838,627 100.0% 3,085.34 838,627County Total 300,211.30 26,438,421 3.9% 88.07 53,746,141 7.8% 179.03 56,081,641 176,677,334 372,806,842 88.3% 2,017.13 685,750,379
248
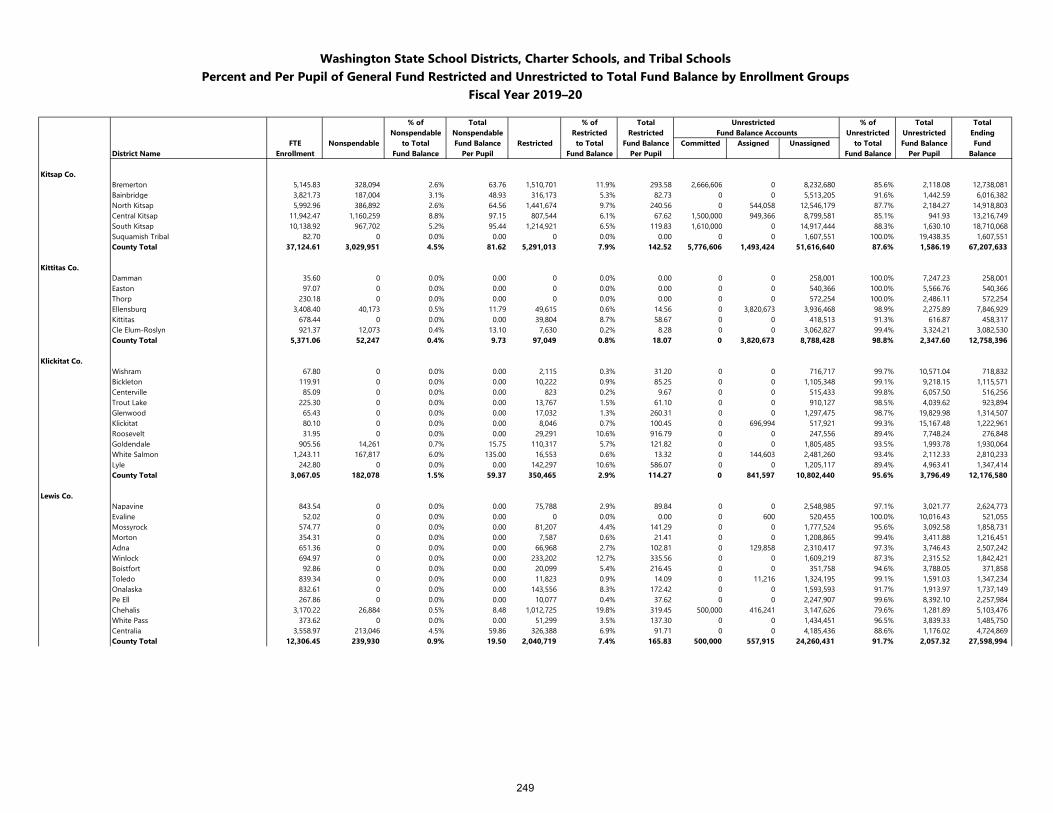
Washington State School Districts, Charter Schools, and Tribal SchoolsPercent and Per Pupil of General Fund Restricted and Unrestricted to Total Fund Balance by Enrollment Groups
Fiscal Year 2019–20
% of Total % of Total Unrestricted % of Total TotalNonspendable Nonspendable Restricted Restricted Fund Balance Accounts Unrestricted Unrestricted Ending
FTE Nonspendable to Total Fund Balance Restricted to Total Fund Balance Committed Assigned Unassigned to Total Fund Balance FundDistrict Name Enrollment Fund Balance Per Pupil Fund Balance Per Pupil Fund Balance Per Pupil Balance
Kitsap Co.Bremerton 5,145.83 328,094 2.6% 63.76 1,510,701 11.9% 293.58 2,666,606 0 8,232,680 85.6% 2,118.08 12,738,081Bainbridge 3,821.73 187,004 3.1% 48.93 316,173 5.3% 82.73 0 0 5,513,205 91.6% 1,442.59 6,016,382North Kitsap 5,992.96 386,892 2.6% 64.56 1,441,674 9.7% 240.56 0 544,058 12,546,179 87.7% 2,184.27 14,918,803Central Kitsap 11,942.47 1,160,259 8.8% 97.15 807,544 6.1% 67.62 1,500,000 949,366 8,799,581 85.1% 941.93 13,216,749South Kitsap 10,138.92 967,702 5.2% 95.44 1,214,921 6.5% 119.83 1,610,000 0 14,917,444 88.3% 1,630.10 18,710,068Suquamish Tribal 82.70 0 0.0% 0.00 0 0.0% 0.00 0 0 1,607,551 100.0% 19,438.35 1,607,551County Total 37,124.61 3,029,951 4.5% 81.62 5,291,013 7.9% 142.52 5,776,606 1,493,424 51,616,640 87.6% 1,586.19 67,207,633
Kittitas Co.Damman 35.60 0 0.0% 0.00 0 0.0% 0.00 0 0 258,001 100.0% 7,247.23 258,001Easton 97.07 0 0.0% 0.00 0 0.0% 0.00 0 0 540,366 100.0% 5,566.76 540,366Thorp 230.18 0 0.0% 0.00 0 0.0% 0.00 0 0 572,254 100.0% 2,486.11 572,254Ellensburg 3,408.40 40,173 0.5% 11.79 49,615 0.6% 14.56 0 3,820,673 3,936,468 98.9% 2,275.89 7,846,929Kittitas 678.44 0 0.0% 0.00 39,804 8.7% 58.67 0 0 418,513 91.3% 616.87 458,317Cle Elum-Roslyn 921.37 12,073 0.4% 13.10 7,630 0.2% 8.28 0 0 3,062,827 99.4% 3,324.21 3,082,530County Total 5,371.06 52,247 0.4% 9.73 97,049 0.8% 18.07 0 3,820,673 8,788,428 98.8% 2,347.60 12,758,396
Klickitat Co.Wishram 67.80 0 0.0% 0.00 2,115 0.3% 31.20 0 0 716,717 99.7% 10,571.04 718,832Bickleton 119.91 0 0.0% 0.00 10,222 0.9% 85.25 0 0 1,105,348 99.1% 9,218.15 1,115,571Centerville 85.09 0 0.0% 0.00 823 0.2% 9.67 0 0 515,433 99.8% 6,057.50 516,256Trout Lake 225.30 0 0.0% 0.00 13,767 1.5% 61.10 0 0 910,127 98.5% 4,039.62 923,894Glenwood 65.43 0 0.0% 0.00 17,032 1.3% 260.31 0 0 1,297,475 98.7% 19,829.98 1,314,507Klickitat 80.10 0 0.0% 0.00 8,046 0.7% 100.45 0 696,994 517,921 99.3% 15,167.48 1,222,961Roosevelt 31.95 0 0.0% 0.00 29,291 10.6% 916.79 0 0 247,556 89.4% 7,748.24 276,848Goldendale 905.56 14,261 0.7% 15.75 110,317 5.7% 121.82 0 0 1,805,485 93.5% 1,993.78 1,930,064White Salmon 1,243.11 167,817 6.0% 135.00 16,553 0.6% 13.32 0 144,603 2,481,260 93.4% 2,112.33 2,810,233Lyle 242.80 0 0.0% 0.00 142,297 10.6% 586.07 0 0 1,205,117 89.4% 4,963.41 1,347,414County Total 3,067.05 182,078 1.5% 59.37 350,465 2.9% 114.27 0 841,597 10,802,440 95.6% 3,796.49 12,176,580
Lewis Co.Napavine 843.54 0 0.0% 0.00 75,788 2.9% 89.84 0 0 2,548,985 97.1% 3,021.77 2,624,773Evaline 52.02 0 0.0% 0.00 0 0.0% 0.00 0 600 520,455 100.0% 10,016.43 521,055Mossyrock 574.77 0 0.0% 0.00 81,207 4.4% 141.29 0 0 1,777,524 95.6% 3,092.58 1,858,731Morton 354.31 0 0.0% 0.00 7,587 0.6% 21.41 0 0 1,208,865 99.4% 3,411.88 1,216,451Adna 651.36 0 0.0% 0.00 66,968 2.7% 102.81 0 129,858 2,310,417 97.3% 3,746.43 2,507,242Winlock 694.97 0 0.0% 0.00 233,202 12.7% 335.56 0 0 1,609,219 87.3% 2,315.52 1,842,421Boistfort 92.86 0 0.0% 0.00 20,099 5.4% 216.45 0 0 351,758 94.6% 3,788.05 371,858Toledo 839.34 0 0.0% 0.00 11,823 0.9% 14.09 0 11,216 1,324,195 99.1% 1,591.03 1,347,234Onalaska 832.61 0 0.0% 0.00 143,556 8.3% 172.42 0 0 1,593,593 91.7% 1,913.97 1,737,149Pe Ell 267.86 0 0.0% 0.00 10,077 0.4% 37.62 0 0 2,247,907 99.6% 8,392.10 2,257,984Chehalis 3,170.22 26,884 0.5% 8.48 1,012,725 19.8% 319.45 500,000 416,241 3,147,626 79.6% 1,281.89 5,103,476White Pass 373.62 0 0.0% 0.00 51,299 3.5% 137.30 0 0 1,434,451 96.5% 3,839.33 1,485,750Centralia 3,558.97 213,046 4.5% 59.86 326,388 6.9% 91.71 0 0 4,185,436 88.6% 1,176.02 4,724,869County Total 12,306.45 239,930 0.9% 19.50 2,040,719 7.4% 165.83 500,000 557,915 24,260,431 91.7% 2,057.32 27,598,994
249
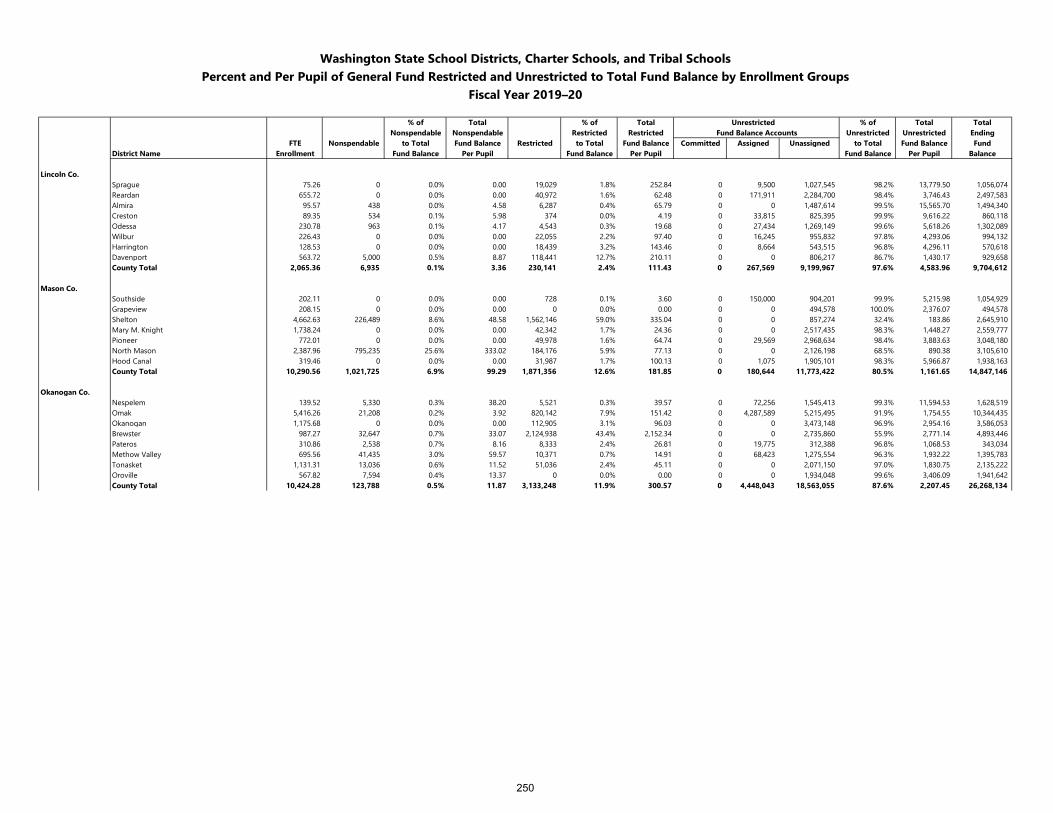
Washington State School Districts, Charter Schools, and Tribal SchoolsPercent and Per Pupil of General Fund Restricted and Unrestricted to Total Fund Balance by Enrollment Groups
Fiscal Year 2019–20
% of Total % of Total Unrestricted % of Total TotalNonspendable Nonspendable Restricted Restricted Fund Balance Accounts Unrestricted Unrestricted Ending
FTE Nonspendable to Total Fund Balance Restricted to Total Fund Balance Committed Assigned Unassigned to Total Fund Balance FundDistrict Name Enrollment Fund Balance Per Pupil Fund Balance Per Pupil Fund Balance Per Pupil Balance
Lincoln Co.Sprague 75.26 0 0.0% 0.00 19,029 1.8% 252.84 0 9,500 1,027,545 98.2% 13,779.50 1,056,074Reardan 655.72 0 0.0% 0.00 40,972 1.6% 62.48 0 171,911 2,284,700 98.4% 3,746.43 2,497,583Almira 95.57 438 0.0% 4.58 6,287 0.4% 65.79 0 0 1,487,614 99.5% 15,565.70 1,494,340Creston 89.35 534 0.1% 5.98 374 0.0% 4.19 0 33,815 825,395 99.9% 9,616.22 860,118Odessa 230.78 963 0.1% 4.17 4,543 0.3% 19.68 0 27,434 1,269,149 99.6% 5,618.26 1,302,089Wilbur 226.43 0 0.0% 0.00 22,055 2.2% 97.40 0 16,245 955,832 97.8% 4,293.06 994,132Harrington 128.53 0 0.0% 0.00 18,439 3.2% 143.46 0 8,664 543,515 96.8% 4,296.11 570,618Davenport 563.72 5,000 0.5% 8.87 118,441 12.7% 210.11 0 0 806,217 86.7% 1,430.17 929,658County Total 2,065.36 6,935 0.1% 3.36 230,141 2.4% 111.43 0 267,569 9,199,967 97.6% 4,583.96 9,704,612
Mason Co.Southside 202.11 0 0.0% 0.00 728 0.1% 3.60 0 150,000 904,201 99.9% 5,215.98 1,054,929Grapeview 208.15 0 0.0% 0.00 0 0.0% 0.00 0 0 494,578 100.0% 2,376.07 494,578Shelton 4,662.63 226,489 8.6% 48.58 1,562,146 59.0% 335.04 0 0 857,274 32.4% 183.86 2,645,910Mary M. Knight 1,738.24 0 0.0% 0.00 42,342 1.7% 24.36 0 0 2,517,435 98.3% 1,448.27 2,559,777Pioneer 772.01 0 0.0% 0.00 49,978 1.6% 64.74 0 29,569 2,968,634 98.4% 3,883.63 3,048,180North Mason 2,387.96 795,235 25.6% 333.02 184,176 5.9% 77.13 0 0 2,126,198 68.5% 890.38 3,105,610Hood Canal 319.46 0 0.0% 0.00 31,987 1.7% 100.13 0 1,075 1,905,101 98.3% 5,966.87 1,938,163County Total 10,290.56 1,021,725 6.9% 99.29 1,871,356 12.6% 181.85 0 180,644 11,773,422 80.5% 1,161.65 14,847,146
Okanogan Co.Nespelem 139.52 5,330 0.3% 38.20 5,521 0.3% 39.57 0 72,256 1,545,413 99.3% 11,594.53 1,628,519Omak 5,416.26 21,208 0.2% 3.92 820,142 7.9% 151.42 0 4,287,589 5,215,495 91.9% 1,754.55 10,344,435Okanogan 1,175.68 0 0.0% 0.00 112,905 3.1% 96.03 0 0 3,473,148 96.9% 2,954.16 3,586,053Brewster 987.27 32,647 0.7% 33.07 2,124,938 43.4% 2,152.34 0 0 2,735,860 55.9% 2,771.14 4,893,446Pateros 310.86 2,538 0.7% 8.16 8,333 2.4% 26.81 0 19,775 312,388 96.8% 1,068.53 343,034Methow Valley 695.56 41,435 3.0% 59.57 10,371 0.7% 14.91 0 68,423 1,275,554 96.3% 1,932.22 1,395,783Tonasket 1,131.31 13,036 0.6% 11.52 51,036 2.4% 45.11 0 0 2,071,150 97.0% 1,830.75 2,135,222Oroville 567.82 7,594 0.4% 13.37 0 0.0% 0.00 0 0 1,934,048 99.6% 3,406.09 1,941,642County Total 10,424.28 123,788 0.5% 11.87 3,133,248 11.9% 300.57 0 4,448,043 18,563,055 87.6% 2,207.45 26,268,134
250
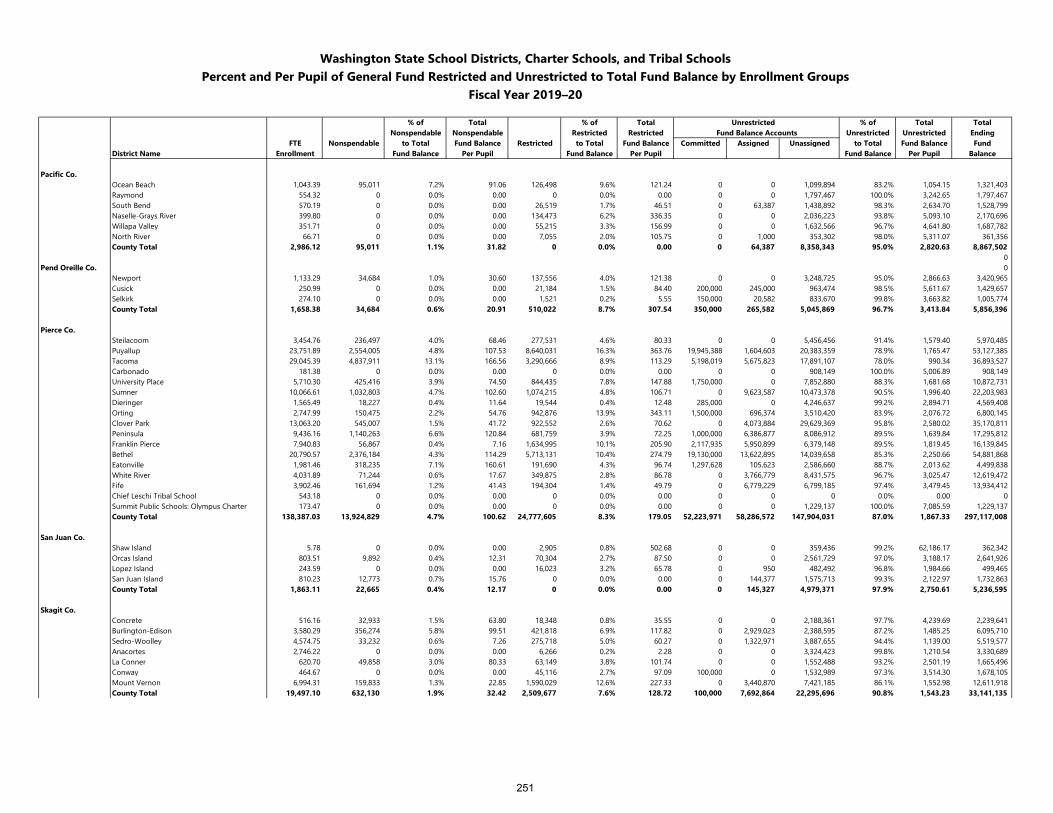
Washington State School Districts, Charter Schools, and Tribal SchoolsPercent and Per Pupil of General Fund Restricted and Unrestricted to Total Fund Balance by Enrollment Groups
Fiscal Year 2019–20
% of Total % of Total Unrestricted % of Total TotalNonspendable Nonspendable Restricted Restricted Fund Balance Accounts Unrestricted Unrestricted Ending
FTE Nonspendable to Total Fund Balance Restricted to Total Fund Balance Committed Assigned Unassigned to Total Fund Balance FundDistrict Name Enrollment Fund Balance Per Pupil Fund Balance Per Pupil Fund Balance Per Pupil Balance
Pacific Co.Ocean Beach 1,043.39 95,011 7.2% 91.06 126,498 9.6% 121.24 0 0 1,099,894 83.2% 1,054.15 1,321,403Raymond 554.32 0 0.0% 0.00 0 0.0% 0.00 0 0 1,797,467 100.0% 3,242.65 1,797,467South Bend 570.19 0 0.0% 0.00 26,519 1.7% 46.51 0 63,387 1,438,892 98.3% 2,634.70 1,528,799Naselle-Grays River 399.80 0 0.0% 0.00 134,473 6.2% 336.35 0 0 2,036,223 93.8% 5,093.10 2,170,696Willapa Valley 351.71 0 0.0% 0.00 55,215 3.3% 156.99 0 0 1,632,566 96.7% 4,641.80 1,687,782North River 66.71 0 0.0% 0.00 7,055 2.0% 105.75 0 1,000 353,302 98.0% 5,311.07 361,356County Total 2,986.12 95,011 1.1% 31.82 0 0.0% 0.00 0 64,387 8,358,343 95.0% 2,820.63 8,867,502
0Pend Oreille Co. 0
Newport 1,133.29 34,684 1.0% 30.60 137,556 4.0% 121.38 0 0 3,248,725 95.0% 2,866.63 3,420,965Cusick 250.99 0 0.0% 0.00 21,184 1.5% 84.40 200,000 245,000 963,474 98.5% 5,611.67 1,429,657Selkirk 274.10 0 0.0% 0.00 1,521 0.2% 5.55 150,000 20,582 833,670 99.8% 3,663.82 1,005,774County Total 1,658.38 34,684 0.6% 20.91 510,022 8.7% 307.54 350,000 265,582 5,045,869 96.7% 3,413.84 5,856,396
Pierce Co.Steilacoom 3,454.76 236,497 4.0% 68.46 277,531 4.6% 80.33 0 0 5,456,456 91.4% 1,579.40 5,970,485Puyallup 23,751.89 2,554,005 4.8% 107.53 8,640,031 16.3% 363.76 19,945,388 1,604,603 20,383,359 78.9% 1,765.47 53,127,385Tacoma 29,045.39 4,837,911 13.1% 166.56 3,290,666 8.9% 113.29 5,198,019 5,675,823 17,891,107 78.0% 990.34 36,893,527Carbonado 181.38 0 0.0% 0.00 0 0.0% 0.00 0 0 908,149 100.0% 5,006.89 908,149University Place 5,710.30 425,416 3.9% 74.50 844,435 7.8% 147.88 1,750,000 0 7,852,880 88.3% 1,681.68 10,872,731Sumner 10,066.61 1,032,803 4.7% 102.60 1,074,215 4.8% 106.71 0 9,623,587 10,473,378 90.5% 1,996.40 22,203,983Dieringer 1,565.49 18,227 0.4% 11.64 19,544 0.4% 12.48 285,000 0 4,246,637 99.2% 2,894.71 4,569,408Orting 2,747.99 150,475 2.2% 54.76 942,876 13.9% 343.11 1,500,000 696,374 3,510,420 83.9% 2,076.72 6,800,145Clover Park 13,063.20 545,007 1.5% 41.72 922,552 2.6% 70.62 0 4,073,884 29,629,369 95.8% 2,580.02 35,170,811Peninsula 9,436.16 1,140,263 6.6% 120.84 681,759 3.9% 72.25 1,000,000 6,386,877 8,086,912 89.5% 1,639.84 17,295,812Franklin Pierce 7,940.83 56,867 0.4% 7.16 1,634,995 10.1% 205.90 2,117,935 5,950,899 6,379,148 89.5% 1,819.45 16,139,845Bethel 20,790.57 2,376,184 4.3% 114.29 5,713,131 10.4% 274.79 19,130,000 13,622,895 14,039,658 85.3% 2,250.66 54,881,868Eatonville 1,981.46 318,235 7.1% 160.61 191,690 4.3% 96.74 1,297,628 105,623 2,586,660 88.7% 2,013.62 4,499,838White River 4,031.89 71,244 0.6% 17.67 349,875 2.8% 86.78 0 3,766,779 8,431,575 96.7% 3,025.47 12,619,472Fife 3,902.46 161,694 1.2% 41.43 194,304 1.4% 49.79 0 6,779,229 6,799,185 97.4% 3,479.45 13,934,412Chief Leschi Tribal School 543.18 0 0.0% 0.00 0 0.0% 0.00 0 0 0 0.0% 0.00 0Summit Public Schools: Olympus Charter 173.47 0 0.0% 0.00 0 0.0% 0.00 0 0 1,229,137 100.0% 7,085.59 1,229,137County Total 138,387.03 13,924,829 4.7% 100.62 24,777,605 8.3% 179.05 52,223,971 58,286,572 147,904,031 87.0% 1,867.33 297,117,008
San Juan Co.Shaw Island 5.78 0 0.0% 0.00 2,905 0.8% 502.68 0 0 359,436 99.2% 62,186.17 362,342Orcas Island 803.51 9,892 0.4% 12.31 70,304 2.7% 87.50 0 0 2,561,729 97.0% 3,188.17 2,641,926Lopez Island 243.59 0 0.0% 0.00 16,023 3.2% 65.78 0 950 482,492 96.8% 1,984.66 499,465San Juan Island 810.23 12,773 0.7% 15.76 0 0.0% 0.00 0 144,377 1,575,713 99.3% 2,122.97 1,732,863County Total 1,863.11 22,665 0.4% 12.17 0 0.0% 0.00 0 145,327 4,979,371 97.9% 2,750.61 5,236,595
Skagit Co.Concrete 516.16 32,933 1.5% 63.80 18,348 0.8% 35.55 0 0 2,188,361 97.7% 4,239.69 2,239,641Burlington-Edison 3,580.29 356,274 5.8% 99.51 421,818 6.9% 117.82 0 2,929,023 2,388,595 87.2% 1,485.25 6,095,710Sedro-Woolley 4,574.75 33,232 0.6% 7.26 275,718 5.0% 60.27 0 1,322,971 3,887,655 94.4% 1,139.00 5,519,577Anacortes 2,746.22 0 0.0% 0.00 6,266 0.2% 2.28 0 0 3,324,423 99.8% 1,210.54 3,330,689La Conner 620.70 49,858 3.0% 80.33 63,149 3.8% 101.74 0 0 1,552,488 93.2% 2,501.19 1,665,496Conway 464.67 0 0.0% 0.00 45,116 2.7% 97.09 100,000 0 1,532,989 97.3% 3,514.30 1,678,105Mount Vernon 6,994.31 159,833 1.3% 22.85 1,590,029 12.6% 227.33 0 3,440,870 7,421,185 86.1% 1,552.98 12,611,918County Total 19,497.10 632,130 1.9% 32.42 2,509,677 7.6% 128.72 100,000 7,692,864 22,295,696 90.8% 1,543.23 33,141,135
251
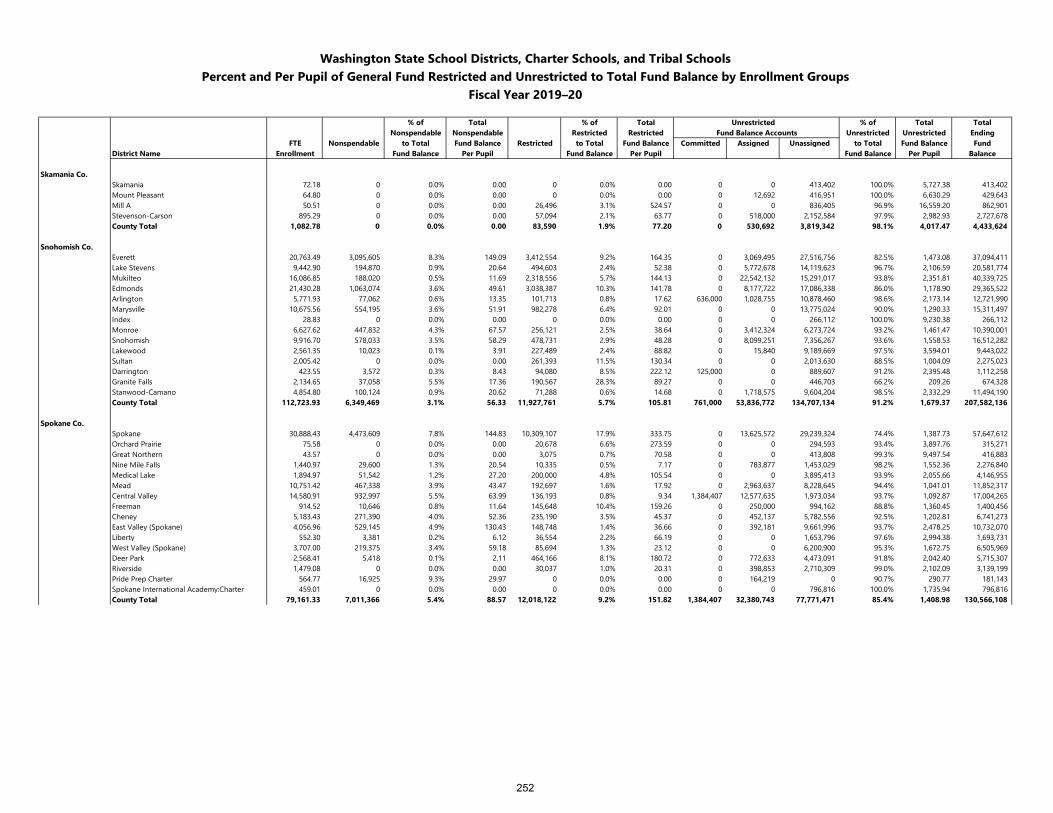
Washington State School Districts, Charter Schools, and Tribal SchoolsPercent and Per Pupil of General Fund Restricted and Unrestricted to Total Fund Balance by Enrollment Groups
Fiscal Year 2019–20
% of Total % of Total Unrestricted % of Total TotalNonspendable Nonspendable Restricted Restricted Fund Balance Accounts Unrestricted Unrestricted Ending
FTE Nonspendable to Total Fund Balance Restricted to Total Fund Balance Committed Assigned Unassigned to Total Fund Balance FundDistrict Name Enrollment Fund Balance Per Pupil Fund Balance Per Pupil Fund Balance Per Pupil Balance
Skamania Co.Skamania 72.18 0 0.0% 0.00 0 0.0% 0.00 0 0 413,402 100.0% 5,727.38 413,402Mount Pleasant 64.80 0 0.0% 0.00 0 0.0% 0.00 0 12,692 416,951 100.0% 6,630.29 429,643Mill A 50.51 0 0.0% 0.00 26,496 3.1% 524.57 0 0 836,405 96.9% 16,559.20 862,901Stevenson-Carson 895.29 0 0.0% 0.00 57,094 2.1% 63.77 0 518,000 2,152,584 97.9% 2,982.93 2,727,678County Total 1,082.78 0 0.0% 0.00 83,590 1.9% 77.20 0 530,692 3,819,342 98.1% 4,017.47 4,433,624
Snohomish Co.Everett 20,763.49 3,095,605 8.3% 149.09 3,412,554 9.2% 164.35 0 3,069,495 27,516,756 82.5% 1,473.08 37,094,411Lake Stevens 9,442.90 194,870 0.9% 20.64 494,603 2.4% 52.38 0 5,772,678 14,119,623 96.7% 2,106.59 20,581,774Mukilteo 16,086.85 188,020 0.5% 11.69 2,318,556 5.7% 144.13 0 22,542,132 15,291,017 93.8% 2,351.81 40,339,725Edmonds 21,430.28 1,063,074 3.6% 49.61 3,038,387 10.3% 141.78 0 8,177,722 17,086,338 86.0% 1,178.90 29,365,522Arlington 5,771.93 77,062 0.6% 13.35 101,713 0.8% 17.62 636,000 1,028,755 10,878,460 98.6% 2,173.14 12,721,990Marysville 10,675.56 554,195 3.6% 51.91 982,278 6.4% 92.01 0 0 13,775,024 90.0% 1,290.33 15,311,497Index 28.83 0 0.0% 0.00 0 0.0% 0.00 0 0 266,112 100.0% 9,230.38 266,112Monroe 6,627.62 447,832 4.3% 67.57 256,121 2.5% 38.64 0 3,412,324 6,273,724 93.2% 1,461.47 10,390,001Snohomish 9,916.70 578,033 3.5% 58.29 478,731 2.9% 48.28 0 8,099,251 7,356,267 93.6% 1,558.53 16,512,282Lakewood 2,561.35 10,023 0.1% 3.91 227,489 2.4% 88.82 0 15,840 9,189,669 97.5% 3,594.01 9,443,022Sultan 2,005.42 0 0.0% 0.00 261,393 11.5% 130.34 0 0 2,013,630 88.5% 1,004.09 2,275,023Darrington 423.55 3,572 0.3% 8.43 94,080 8.5% 222.12 125,000 0 889,607 91.2% 2,395.48 1,112,258Granite Falls 2,134.65 37,058 5.5% 17.36 190,567 28.3% 89.27 0 0 446,703 66.2% 209.26 674,328Stanwood-Camano 4,854.80 100,124 0.9% 20.62 71,288 0.6% 14.68 0 1,718,575 9,604,204 98.5% 2,332.29 11,494,190County Total 112,723.93 6,349,469 3.1% 56.33 11,927,761 5.7% 105.81 761,000 53,836,772 134,707,134 91.2% 1,679.37 207,582,136
Spokane Co.Spokane 30,888.43 4,473,609 7.8% 144.83 10,309,107 17.9% 333.75 0 13,625,572 29,239,324 74.4% 1,387.73 57,647,612Orchard Prairie 75.58 0 0.0% 0.00 20,678 6.6% 273.59 0 0 294,593 93.4% 3,897.76 315,271Great Northern 43.57 0 0.0% 0.00 3,075 0.7% 70.58 0 0 413,808 99.3% 9,497.54 416,883Nine Mile Falls 1,440.97 29,600 1.3% 20.54 10,335 0.5% 7.17 0 783,877 1,453,029 98.2% 1,552.36 2,276,840Medical Lake 1,894.97 51,542 1.2% 27.20 200,000 4.8% 105.54 0 0 3,895,413 93.9% 2,055.66 4,146,955Mead 10,751.42 467,338 3.9% 43.47 192,697 1.6% 17.92 0 2,963,637 8,228,645 94.4% 1,041.01 11,852,317Central Valley 14,580.91 932,997 5.5% 63.99 136,193 0.8% 9.34 1,384,407 12,577,635 1,973,034 93.7% 1,092.87 17,004,265Freeman 914.52 10,646 0.8% 11.64 145,648 10.4% 159.26 0 250,000 994,162 88.8% 1,360.45 1,400,456Cheney 5,183.43 271,390 4.0% 52.36 235,190 3.5% 45.37 0 452,137 5,782,556 92.5% 1,202.81 6,741,273East Valley (Spokane) 4,056.96 529,145 4.9% 130.43 148,748 1.4% 36.66 0 392,181 9,661,996 93.7% 2,478.25 10,732,070Liberty 552.30 3,381 0.2% 6.12 36,554 2.2% 66.19 0 0 1,653,796 97.6% 2,994.38 1,693,731West Valley (Spokane) 3,707.00 219,375 3.4% 59.18 85,694 1.3% 23.12 0 0 6,200,900 95.3% 1,672.75 6,505,969Deer Park 2,568.41 5,418 0.1% 2.11 464,166 8.1% 180.72 0 772,633 4,473,091 91.8% 2,042.40 5,715,307Riverside 1,479.08 0 0.0% 0.00 30,037 1.0% 20.31 0 398,853 2,710,309 99.0% 2,102.09 3,139,199Pride Prep Charter 564.77 16,925 9.3% 29.97 0 0.0% 0.00 0 164,219 0 90.7% 290.77 181,143Spokane International Academy:Charter 459.01 0 0.0% 0.00 0 0.0% 0.00 0 0 796,816 100.0% 1,735.94 796,816County Total 79,161.33 7,011,366 5.4% 88.57 12,018,122 9.2% 151.82 1,384,407 32,380,743 77,771,471 85.4% 1,408.98 130,566,108
252
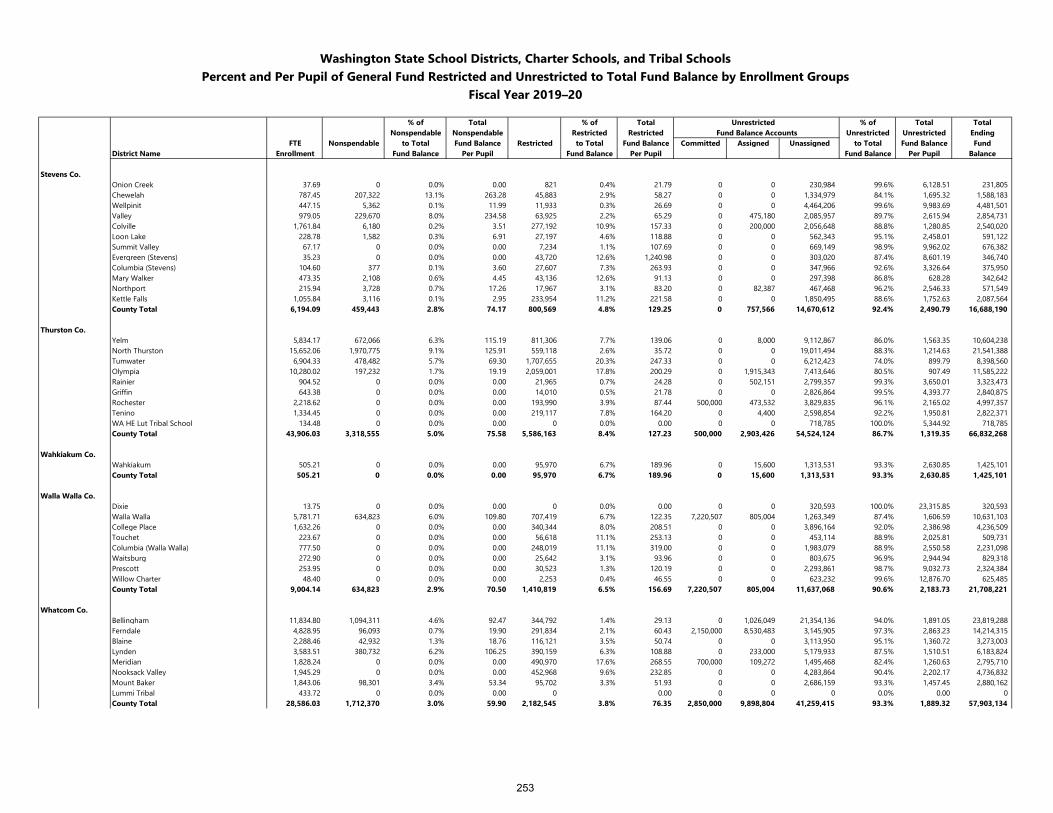
Washington State School Districts, Charter Schools, and Tribal SchoolsPercent and Per Pupil of General Fund Restricted and Unrestricted to Total Fund Balance by Enrollment Groups
Fiscal Year 2019–20
% of Total % of Total Unrestricted % of Total TotalNonspendable Nonspendable Restricted Restricted Fund Balance Accounts Unrestricted Unrestricted Ending
FTE Nonspendable to Total Fund Balance Restricted to Total Fund Balance Committed Assigned Unassigned to Total Fund Balance FundDistrict Name Enrollment Fund Balance Per Pupil Fund Balance Per Pupil Fund Balance Per Pupil Balance
Stevens Co.Onion Creek 37.69 0 0.0% 0.00 821 0.4% 21.79 0 0 230,984 99.6% 6,128.51 231,805Chewelah 787.45 207,322 13.1% 263.28 45,883 2.9% 58.27 0 0 1,334,979 84.1% 1,695.32 1,588,183Wellpinit 447.15 5,362 0.1% 11.99 11,933 0.3% 26.69 0 0 4,464,206 99.6% 9,983.69 4,481,501Valley 979.05 229,670 8.0% 234.58 63,925 2.2% 65.29 0 475,180 2,085,957 89.7% 2,615.94 2,854,731Colville 1,761.84 6,180 0.2% 3.51 277,192 10.9% 157.33 0 200,000 2,056,648 88.8% 1,280.85 2,540,020Loon Lake 228.78 1,582 0.3% 6.91 27,197 4.6% 118.88 0 0 562,343 95.1% 2,458.01 591,122Summit Valley 67.17 0 0.0% 0.00 7,234 1.1% 107.69 0 0 669,149 98.9% 9,962.02 676,382Evergreen (Stevens) 35.23 0 0.0% 0.00 43,720 12.6% 1,240.98 0 0 303,020 87.4% 8,601.19 346,740Columbia (Stevens) 104.60 377 0.1% 3.60 27,607 7.3% 263.93 0 0 347,966 92.6% 3,326.64 375,950Mary Walker 473.35 2,108 0.6% 4.45 43,136 12.6% 91.13 0 0 297,398 86.8% 628.28 342,642Northport 215.94 3,728 0.7% 17.26 17,967 3.1% 83.20 0 82,387 467,468 96.2% 2,546.33 571,549Kettle Falls 1,055.84 3,116 0.1% 2.95 233,954 11.2% 221.58 0 0 1,850,495 88.6% 1,752.63 2,087,564County Total 6,194.09 459,443 2.8% 74.17 800,569 4.8% 129.25 0 757,566 14,670,612 92.4% 2,490.79 16,688,190
Thurston Co.Yelm 5,834.17 672,066 6.3% 115.19 811,306 7.7% 139.06 0 8,000 9,112,867 86.0% 1,563.35 10,604,238North Thurston 15,652.06 1,970,775 9.1% 125.91 559,118 2.6% 35.72 0 0 19,011,494 88.3% 1,214.63 21,541,388Tumwater 6,904.33 478,482 5.7% 69.30 1,707,655 20.3% 247.33 0 0 6,212,423 74.0% 899.79 8,398,560Olympia 10,280.02 197,232 1.7% 19.19 2,059,001 17.8% 200.29 0 1,915,343 7,413,646 80.5% 907.49 11,585,222Rainier 904.52 0 0.0% 0.00 21,965 0.7% 24.28 0 502,151 2,799,357 99.3% 3,650.01 3,323,473Griffin 643.38 0 0.0% 0.00 14,010 0.5% 21.78 0 0 2,826,864 99.5% 4,393.77 2,840,875Rochester 2,218.62 0 0.0% 0.00 193,990 3.9% 87.44 500,000 473,532 3,829,835 96.1% 2,165.02 4,997,357Tenino 1,334.45 0 0.0% 0.00 219,117 7.8% 164.20 0 4,400 2,598,854 92.2% 1,950.81 2,822,371WA HE Lut Tribal School 134.48 0 0.0% 0.00 0 0.0% 0.00 0 0 718,785 100.0% 5,344.92 718,785County Total 43,906.03 3,318,555 5.0% 75.58 5,586,163 8.4% 127.23 500,000 2,903,426 54,524,124 86.7% 1,319.35 66,832,268
Wahkiakum Co.Wahkiakum 505.21 0 0.0% 0.00 95,970 6.7% 189.96 0 15,600 1,313,531 93.3% 2,630.85 1,425,101County Total 505.21 0 0.0% 0.00 95,970 6.7% 189.96 0 15,600 1,313,531 93.3% 2,630.85 1,425,101
Walla Walla Co.Dixie 13.75 0 0.0% 0.00 0 0.0% 0.00 0 0 320,593 100.0% 23,315.85 320,593Walla Walla 5,781.71 634,823 6.0% 109.80 707,419 6.7% 122.35 7,220,507 805,004 1,263,349 87.4% 1,606.59 10,631,103College Place 1,632.26 0 0.0% 0.00 340,344 8.0% 208.51 0 0 3,896,164 92.0% 2,386.98 4,236,509Touchet 223.67 0 0.0% 0.00 56,618 11.1% 253.13 0 0 453,114 88.9% 2,025.81 509,731Columbia (Walla Walla) 777.50 0 0.0% 0.00 248,019 11.1% 319.00 0 0 1,983,079 88.9% 2,550.58 2,231,098Waitsburg 272.90 0 0.0% 0.00 25,642 3.1% 93.96 0 0 803,675 96.9% 2,944.94 829,318Prescott 253.95 0 0.0% 0.00 30,523 1.3% 120.19 0 0 2,293,861 98.7% 9,032.73 2,324,384Willow Charter 48.40 0 0.0% 0.00 2,253 0.4% 46.55 0 0 623,232 99.6% 12,876.70 625,485County Total 9,004.14 634,823 2.9% 70.50 1,410,819 6.5% 156.69 7,220,507 805,004 11,637,068 90.6% 2,183.73 21,708,221
Whatcom Co.Bellingham 11,834.80 1,094,311 4.6% 92.47 344,792 1.4% 29.13 0 1,026,049 21,354,136 94.0% 1,891.05 23,819,288Ferndale 4,828.95 96,093 0.7% 19.90 291,834 2.1% 60.43 2,150,000 8,530,483 3,145,905 97.3% 2,863.23 14,214,315Blaine 2,288.46 42,932 1.3% 18.76 116,121 3.5% 50.74 0 0 3,113,950 95.1% 1,360.72 3,273,003Lynden 3,583.51 380,732 6.2% 106.25 390,159 6.3% 108.88 0 233,000 5,179,933 87.5% 1,510.51 6,183,824Meridian 1,828.24 0 0.0% 0.00 490,970 17.6% 268.55 700,000 109,272 1,495,468 82.4% 1,260.63 2,795,710Nooksack Valley 1,945.29 0 0.0% 0.00 452,968 9.6% 232.85 0 0 4,283,864 90.4% 2,202.17 4,736,832Mount Baker 1,843.06 98,301 3.4% 53.34 95,702 3.3% 51.93 0 0 2,686,159 93.3% 1,457.45 2,880,162Lummi Tribal 433.72 0 0.0% 0.00 0 0.00 0 0 0 0.0% 0.00 0County Total 28,586.03 1,712,370 3.0% 59.90 2,182,545 3.8% 76.35 2,850,000 9,898,804 41,259,415 93.3% 1,889.32 57,903,134
253
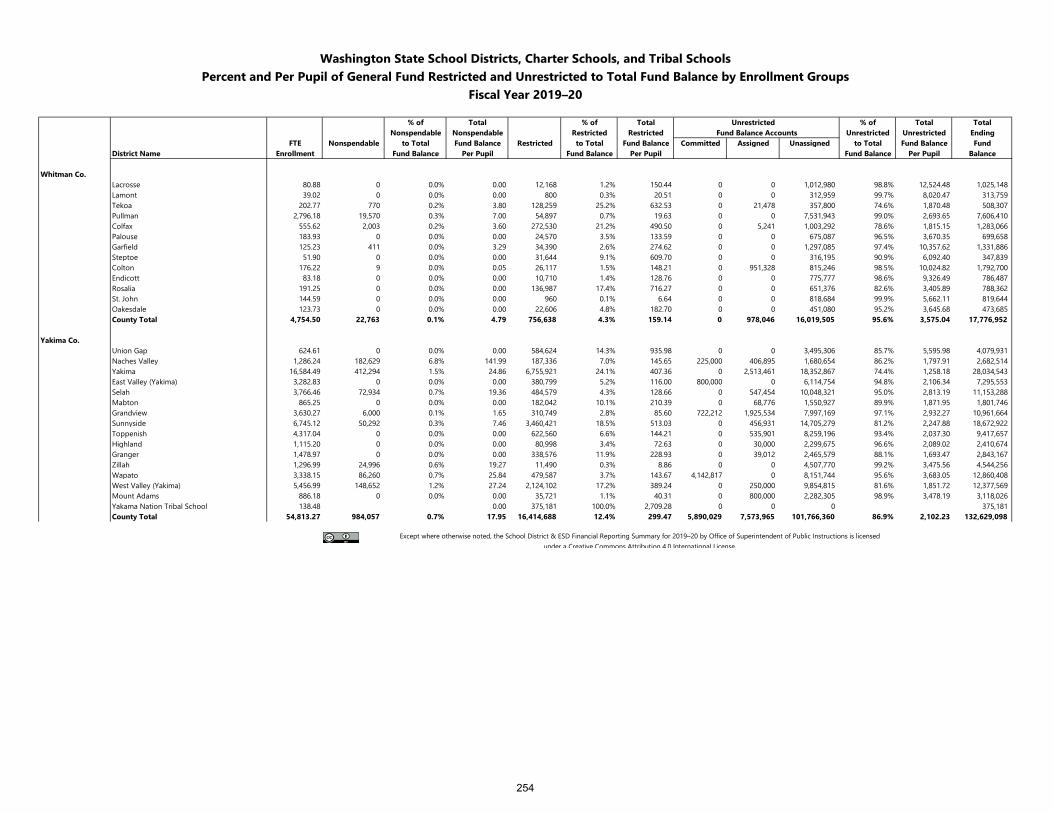
Washington State School Districts, Charter Schools, and Tribal SchoolsPercent and Per Pupil of General Fund Restricted and Unrestricted to Total Fund Balance by Enrollment Groups
Fiscal Year 2019–20
% of Total % of Total Unrestricted % of Total TotalNonspendable Nonspendable Restricted Restricted Fund Balance Accounts Unrestricted Unrestricted Ending
FTE Nonspendable to Total Fund Balance Restricted to Total Fund Balance Committed Assigned Unassigned to Total Fund Balance FundDistrict Name Enrollment Fund Balance Per Pupil Fund Balance Per Pupil Fund Balance Per Pupil Balance
Whitman Co.Lacrosse 80.88 0 0.0% 0.00 12,168 1.2% 150.44 0 0 1,012,980 98.8% 12,524.48 1,025,148Lamont 39.02 0 0.0% 0.00 800 0.3% 20.51 0 0 312,959 99.7% 8,020.47 313,759Tekoa 202.77 770 0.2% 3.80 128,259 25.2% 632.53 0 21,478 357,800 74.6% 1,870.48 508,307Pullman 2,796.18 19,570 0.3% 7.00 54,897 0.7% 19.63 0 0 7,531,943 99.0% 2,693.65 7,606,410Colfax 555.62 2,003 0.2% 3.60 272,530 21.2% 490.50 0 5,241 1,003,292 78.6% 1,815.15 1,283,066Palouse 183.93 0 0.0% 0.00 24,570 3.5% 133.59 0 0 675,087 96.5% 3,670.35 699,658Garfield 125.23 411 0.0% 3.29 34,390 2.6% 274.62 0 0 1,297,085 97.4% 10,357.62 1,331,886Steptoe 51.90 0 0.0% 0.00 31,644 9.1% 609.70 0 0 316,195 90.9% 6,092.40 347,839Colton 176.22 9 0.0% 0.05 26,117 1.5% 148.21 0 951,328 815,246 98.5% 10,024.82 1,792,700Endicott 83.18 0 0.0% 0.00 10,710 1.4% 128.76 0 0 775,777 98.6% 9,326.49 786,487Rosalia 191.25 0 0.0% 0.00 136,987 17.4% 716.27 0 0 651,376 82.6% 3,405.89 788,362St. John 144.59 0 0.0% 0.00 960 0.1% 6.64 0 0 818,684 99.9% 5,662.11 819,644Oakesdale 123.73 0 0.0% 0.00 22,606 4.8% 182.70 0 0 451,080 95.2% 3,645.68 473,685County Total 4,754.50 22,763 0.1% 4.79 756,638 4.3% 159.14 0 978,046 16,019,505 95.6% 3,575.04 17,776,952
Yakima Co.Union Gap 624.61 0 0.0% 0.00 584,624 14.3% 935.98 0 0 3,495,306 85.7% 5,595.98 4,079,931Naches Valley 1,286.24 182,629 6.8% 141.99 187,336 7.0% 145.65 225,000 406,895 1,680,654 86.2% 1,797.91 2,682,514Yakima 16,584.49 412,294 1.5% 24.86 6,755,921 24.1% 407.36 0 2,513,461 18,352,867 74.4% 1,258.18 28,034,543East Valley (Yakima) 3,282.83 0 0.0% 0.00 380,799 5.2% 116.00 800,000 0 6,114,754 94.8% 2,106.34 7,295,553Selah 3,766.46 72,934 0.7% 19.36 484,579 4.3% 128.66 0 547,454 10,048,321 95.0% 2,813.19 11,153,288Mabton 865.25 0 0.0% 0.00 182,042 10.1% 210.39 0 68,776 1,550,927 89.9% 1,871.95 1,801,746Grandview 3,630.27 6,000 0.1% 1.65 310,749 2.8% 85.60 722,212 1,925,534 7,997,169 97.1% 2,932.27 10,961,664Sunnyside 6,745.12 50,292 0.3% 7.46 3,460,421 18.5% 513.03 0 456,931 14,705,279 81.2% 2,247.88 18,672,922Toppenish 4,317.04 0 0.0% 0.00 622,560 6.6% 144.21 0 535,901 8,259,196 93.4% 2,037.30 9,417,657Highland 1,115.20 0 0.0% 0.00 80,998 3.4% 72.63 0 30,000 2,299,675 96.6% 2,089.02 2,410,674Granger 1,478.97 0 0.0% 0.00 338,576 11.9% 228.93 0 39,012 2,465,579 88.1% 1,693.47 2,843,167Zillah 1,296.99 24,996 0.6% 19.27 11,490 0.3% 8.86 0 0 4,507,770 99.2% 3,475.56 4,544,256Wapato 3,338.15 86,260 0.7% 25.84 479,587 3.7% 143.67 4,142,817 0 8,151,744 95.6% 3,683.05 12,860,408West Valley (Yakima) 5,456.99 148,652 1.2% 27.24 2,124,102 17.2% 389.24 0 250,000 9,854,815 81.6% 1,851.72 12,377,569Mount Adams 886.18 0 0.0% 0.00 35,721 1.1% 40.31 0 800,000 2,282,305 98.9% 3,478.19 3,118,026Yakama Nation Tribal School 138.48 0.00 375,181 100.0% 2,709.28 0 0 0 375,181County Total 54,813.27 984,057 0.7% 17.95 16,414,688 12.4% 299.47 5,890,029 7,573,965 101,766,360 86.9% 2,102.23 132,629,098
Except where otherwise noted, the School District & ESD Financial Reporting Summary for 2019–20 by Office of Superintendent of Public Instructions is licensed under a Creative Commons Attribution 4.0 International License.
254
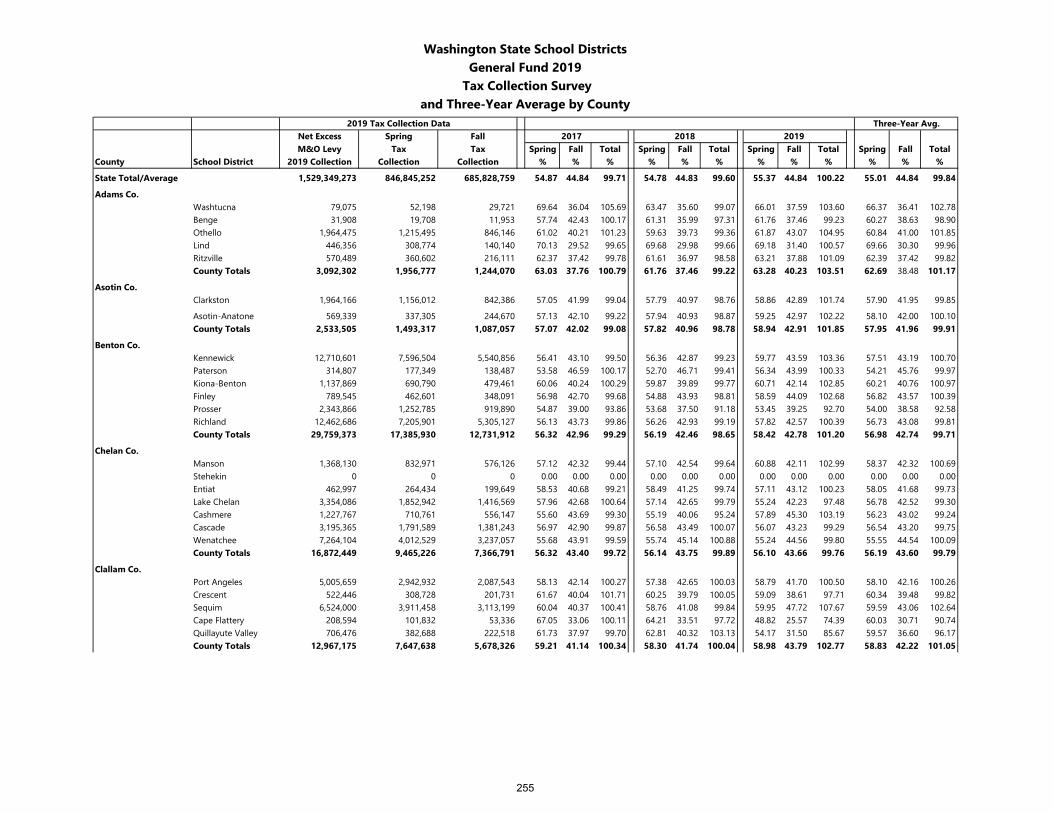
Washington State School DistrictsGeneral Fund 2019
Tax Collection Surveyand Three-Year Average by County
2019 Tax Collection Data Three-Year Avg.Net Excess Spring Fall 2017 2018 2019M&O Levy Tax Tax Spring Fall Total Spring Fall Total Spring Fall Total Spring Fall Total
County School District 2019 Collection Collection Collection % % % % % % % % % % % %
State Total/Average 1,529,349,273 846,845,252 685,828,759 54.87 44.84 99.71 54.78 44.83 99.60 55.37 44.84 100.22 55.01 44.84 99.84
Adams Co.Washtucna 79,075 52,198 29,721 69.64 36.04 105.69 63.47 35.60 99.07 66.01 37.59 103.60 66.37 36.41 102.78Benge 31,908 19,708 11,953 57.74 42.43 100.17 61.31 35.99 97.31 61.76 37.46 99.23 60.27 38.63 98.90Othello 1,964,475 1,215,495 846,146 61.02 40.21 101.23 59.63 39.73 99.36 61.87 43.07 104.95 60.84 41.00 101.85Lind 446,356 308,774 140,140 70.13 29.52 99.65 69.68 29.98 99.66 69.18 31.40 100.57 69.66 30.30 99.96Ritzville 570,489 360,602 216,111 62.37 37.42 99.78 61.61 36.97 98.58 63.21 37.88 101.09 62.39 37.42 99.82County Totals 3,092,302 1,956,777 1,244,070 63.03 37.76 100.79 61.76 37.46 99.22 63.28 40.23 103.51 62.69 38.48 101.17
Asotin Co.Clarkston 1,964,166 1,156,012 842,386 57.05 41.99 99.04 57.79 40.97 98.76 58.86 42.89 101.74 57.90 41.95 99.85
Asotin-Anatone 569,339 337,305 244,670 57.13 42.10 99.22 57.94 40.93 98.87 59.25 42.97 102.22 58.10 42.00 100.10County Totals 2,533,505 1,493,317 1,087,057 57.07 42.02 99.08 57.82 40.96 98.78 58.94 42.91 101.85 57.95 41.96 99.91
Benton Co.Kennewick 12,710,601 7,596,504 5,540,856 56.41 43.10 99.50 56.36 42.87 99.23 59.77 43.59 103.36 57.51 43.19 100.70Paterson 314,807 177,349 138,487 53.58 46.59 100.17 52.70 46.71 99.41 56.34 43.99 100.33 54.21 45.76 99.97Kiona-Benton 1,137,869 690,790 479,461 60.06 40.24 100.29 59.87 39.89 99.77 60.71 42.14 102.85 60.21 40.76 100.97Finley 789,545 462,601 348,091 56.98 42.70 99.68 54.88 43.93 98.81 58.59 44.09 102.68 56.82 43.57 100.39Prosser 2,343,866 1,252,785 919,890 54.87 39.00 93.86 53.68 37.50 91.18 53.45 39.25 92.70 54.00 38.58 92.58Richland 12,462,686 7,205,901 5,305,127 56.13 43.73 99.86 56.26 42.93 99.19 57.82 42.57 100.39 56.73 43.08 99.81County Totals 29,759,373 17,385,930 12,731,912 56.32 42.96 99.29 56.19 42.46 98.65 58.42 42.78 101.20 56.98 42.74 99.71
Chelan Co.Manson 1,368,130 832,971 576,126 57.12 42.32 99.44 57.10 42.54 99.64 60.88 42.11 102.99 58.37 42.32 100.69Stehekin 0 0 0 0.00 0.00 0.00 0.00 0.00 0.00 0.00 0.00 0.00 0.00 0.00 0.00Entiat 462,997 264,434 199,649 58.53 40.68 99.21 58.49 41.25 99.74 57.11 43.12 100.23 58.05 41.68 99.73Lake Chelan 3,354,086 1,852,942 1,416,569 57.96 42.68 100.64 57.14 42.65 99.79 55.24 42.23 97.48 56.78 42.52 99.30Cashmere 1,227,767 710,761 556,147 55.60 43.69 99.30 55.19 40.06 95.24 57.89 45.30 103.19 56.23 43.02 99.24Cascade 3,195,365 1,791,589 1,381,243 56.97 42.90 99.87 56.58 43.49 100.07 56.07 43.23 99.29 56.54 43.20 99.75Wenatchee 7,264,104 4,012,529 3,237,057 55.68 43.91 99.59 55.74 45.14 100.88 55.24 44.56 99.80 55.55 44.54 100.09County Totals 16,872,449 9,465,226 7,366,791 56.32 43.40 99.72 56.14 43.75 99.89 56.10 43.66 99.76 56.19 43.60 99.79
Clallam Co.Port Angeles 5,005,659 2,942,932 2,087,543 58.13 42.14 100.27 57.38 42.65 100.03 58.79 41.70 100.50 58.10 42.16 100.26Crescent 522,446 308,728 201,731 61.67 40.04 101.71 60.25 39.79 100.05 59.09 38.61 97.71 60.34 39.48 99.82Sequim 6,524,000 3,911,458 3,113,199 60.04 40.37 100.41 58.76 41.08 99.84 59.95 47.72 107.67 59.59 43.06 102.64Cape Flattery 208,594 101,832 53,336 67.05 33.06 100.11 64.21 33.51 97.72 48.82 25.57 74.39 60.03 30.71 90.74Quillayute Valley 706,476 382,688 222,518 61.73 37.97 99.70 62.81 40.32 103.13 54.17 31.50 85.67 59.57 36.60 96.17County Totals 12,967,175 7,647,638 5,678,326 59.21 41.14 100.34 58.30 41.74 100.04 58.98 43.79 102.77 58.83 42.22 101.05
255
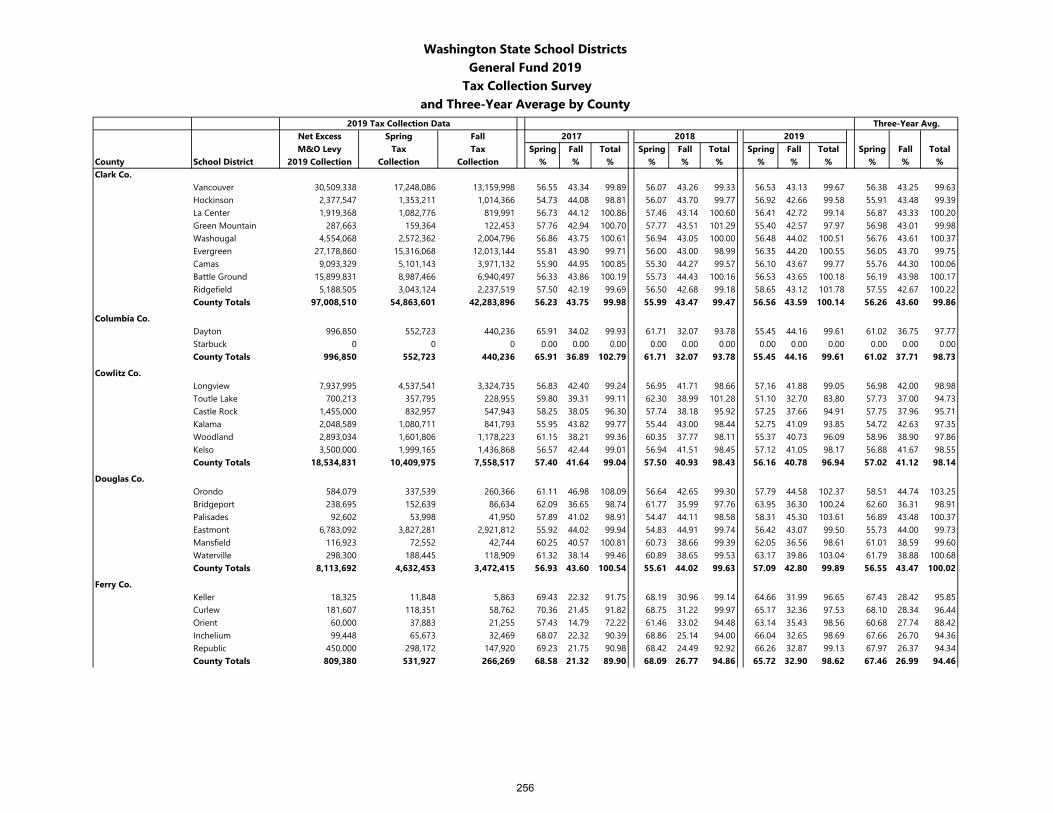
Washington State School DistrictsGeneral Fund 2019
Tax Collection Surveyand Three-Year Average by County
2019 Tax Collection Data Three-Year Avg.Net Excess Spring Fall 2017 2018 2019M&O Levy Tax Tax Spring Fall Total Spring Fall Total Spring Fall Total Spring Fall Total
County School District 2019 Collection Collection Collection % % % % % % % % % % % %Clark Co.
Vancouver 30,509,338 17,248,086 13,159,998 56.55 43.34 99.89 56.07 43.26 99.33 56.53 43.13 99.67 56.38 43.25 99.63Hockinson 2,377,547 1,353,211 1,014,366 54.73 44.08 98.81 56.07 43.70 99.77 56.92 42.66 99.58 55.91 43.48 99.39La Center 1,919,368 1,082,776 819,991 56.73 44.12 100.86 57.46 43.14 100.60 56.41 42.72 99.14 56.87 43.33 100.20Green Mountain 287,663 159,364 122,453 57.76 42.94 100.70 57.77 43.51 101.29 55.40 42.57 97.97 56.98 43.01 99.98Washougal 4,554,068 2,572,362 2,004,796 56.86 43.75 100.61 56.94 43.05 100.00 56.48 44.02 100.51 56.76 43.61 100.37Evergreen 27,178,860 15,316,068 12,013,144 55.81 43.90 99.71 56.00 43.00 98.99 56.35 44.20 100.55 56.05 43.70 99.75Camas 9,093,329 5,101,143 3,971,132 55.90 44.95 100.85 55.30 44.27 99.57 56.10 43.67 99.77 55.76 44.30 100.06Battle Ground 15,899,831 8,987,466 6,940,497 56.33 43.86 100.19 55.73 44.43 100.16 56.53 43.65 100.18 56.19 43.98 100.17Ridgefield 5,188,505 3,043,124 2,237,519 57.50 42.19 99.69 56.50 42.68 99.18 58.65 43.12 101.78 57.55 42.67 100.22County Totals 97,008,510 54,863,601 42,283,896 56.23 43.75 99.98 55.99 43.47 99.47 56.56 43.59 100.14 56.26 43.60 99.86
Columbia Co.Dayton 996,850 552,723 440,236 65.91 34.02 99.93 61.71 32.07 93.78 55.45 44.16 99.61 61.02 36.75 97.77Starbuck 0 0 0 0.00 0.00 0.00 0.00 0.00 0.00 0.00 0.00 0.00 0.00 0.00 0.00County Totals 996,850 552,723 440,236 65.91 36.89 102.79 61.71 32.07 93.78 55.45 44.16 99.61 61.02 37.71 98.73
Cowlitz Co.Longview 7,937,995 4,537,541 3,324,735 56.83 42.40 99.24 56.95 41.71 98.66 57.16 41.88 99.05 56.98 42.00 98.98Toutle Lake 700,213 357,795 228,955 59.80 39.31 99.11 62.30 38.99 101.28 51.10 32.70 83.80 57.73 37.00 94.73Castle Rock 1,455,000 832,957 547,943 58.25 38.05 96.30 57.74 38.18 95.92 57.25 37.66 94.91 57.75 37.96 95.71Kalama 2,048,589 1,080,711 841,793 55.95 43.82 99.77 55.44 43.00 98.44 52.75 41.09 93.85 54.72 42.63 97.35Woodland 2,893,034 1,601,806 1,178,223 61.15 38.21 99.36 60.35 37.77 98.11 55.37 40.73 96.09 58.96 38.90 97.86Kelso 3,500,000 1,999,165 1,436,868 56.57 42.44 99.01 56.94 41.51 98.45 57.12 41.05 98.17 56.88 41.67 98.55County Totals 18,534,831 10,409,975 7,558,517 57.40 41.64 99.04 57.50 40.93 98.43 56.16 40.78 96.94 57.02 41.12 98.14
Douglas Co.Orondo 584,079 337,539 260,366 61.11 46.98 108.09 56.64 42.65 99.30 57.79 44.58 102.37 58.51 44.74 103.25Bridgeport 238,695 152,639 86,634 62.09 36.65 98.74 61.77 35.99 97.76 63.95 36.30 100.24 62.60 36.31 98.91Palisades 92,602 53,998 41,950 57.89 41.02 98.91 54.47 44.11 98.58 58.31 45.30 103.61 56.89 43.48 100.37Eastmont 6,783,092 3,827,281 2,921,812 55.92 44.02 99.94 54.83 44.91 99.74 56.42 43.07 99.50 55.73 44.00 99.73Mansfield 116,923 72,552 42,744 60.25 40.57 100.81 60.73 38.66 99.39 62.05 36.56 98.61 61.01 38.59 99.60Waterville 298,300 188,445 118,909 61.32 38.14 99.46 60.89 38.65 99.53 63.17 39.86 103.04 61.79 38.88 100.68County Totals 8,113,692 4,632,453 3,472,415 56.93 43.60 100.54 55.61 44.02 99.63 57.09 42.80 99.89 56.55 43.47 100.02
Ferry Co.Keller 18,325 11,848 5,863 69.43 22.32 91.75 68.19 30.96 99.14 64.66 31.99 96.65 67.43 28.42 95.85Curlew 181,607 118,351 58,762 70.36 21.45 91.82 68.75 31.22 99.97 65.17 32.36 97.53 68.10 28.34 96.44Orient 60,000 37,883 21,255 57.43 14.79 72.22 61.46 33.02 94.48 63.14 35.43 98.56 60.68 27.74 88.42Inchelium 99,448 65,673 32,469 68.07 22.32 90.39 68.86 25.14 94.00 66.04 32.65 98.69 67.66 26.70 94.36Republic 450,000 298,172 147,920 69.23 21.75 90.98 68.42 24.49 92.92 66.26 32.87 99.13 67.97 26.37 94.34County Totals 809,380 531,927 266,269 68.58 21.32 89.90 68.09 26.77 94.86 65.72 32.90 98.62 67.46 26.99 94.46
256

Washington State School DistrictsGeneral Fund 2019
Tax Collection Surveyand Three-Year Average by County
2019 Tax Collection Data Three-Year Avg.Net Excess Spring Fall 2017 2018 2019M&O Levy Tax Tax Spring Fall Total Spring Fall Total Spring Fall Total Spring Fall Total
County School District 2019 Collection Collection Collection % % % % % % % % % % % %Franklin Co.
Pasco 10,537,658 6,246,898 4,608,883 56.88 42.61 99.50 57.27 42.54 99.82 59.28 43.74 103.02 57.81 42.96 100.78North Franklin 1,750,673 1,056,832 724,437 60.21 39.60 99.81 59.95 40.00 99.96 60.37 41.38 101.75 60.18 40.33 100.50Star 0 0 0 0.00 0.00 0.00 0.00 0.00 0.00 0.00 0.00 0.00 0.00 0.00 0.00Kahlotus 75,000 50,512 24,368 65.52 34.59 100.11 65.48 34.63 100.11 67.35 32.49 99.84 66.11 33.90 100.02County Totals 12,363,331 7,354,242 5,357,688 57.18 42.34 99.52 57.52 42.31 99.83 59.48 43.34 102.82 58.06 42.66 100.72
Garfield Co.Pomeroy 798,175 441,885 354,937 55.08 44.73 99.82 55.52 43.77 99.29 55.36 44.47 99.83 55.32 44.32 99.65County Totals 798,175 441,885 354,937 55.08 44.73 99.82 55.52 43.77 99.29 55.36 44.47 99.83 55.32 44.32 99.65
Grant Co.Wahluke 1,017,576 614,210 424,947 57.11 41.37 98.49 58.07 41.90 99.97 60.36 41.76 102.12 58.51 41.68 100.19Quincy 6,485,279 3,548,239 2,795,604 54.98 44.67 99.65 54.06 44.36 98.42 54.71 43.11 97.82 54.58 44.05 98.63Warden 723,425 416,377 305,856 55.60 38.63 94.22 55.75 36.39 92.14 57.56 42.28 99.84 56.30 39.10 95.40Coulee-Hartline 327,918 229,688 109,024 66.20 32.96 99.16 66.05 32.85 98.89 70.04 33.25 103.29 67.43 33.02 100.45Soap Lake 311,909 224,239 112,743 63.62 37.74 101.36 62.42 36.38 98.80 71.89 36.15 108.04 65.98 36.75 102.73Royal 1,209,207 697,522 511,836 57.82 42.74 100.56 56.99 40.87 97.86 57.68 42.33 100.01 57.50 41.98 99.48Moses Lake 6,154,329 3,734,793 2,694,686 56.61 44.37 100.98 56.32 43.05 99.37 60.69 43.79 104.47 57.87 43.74 101.61Ephrata 1,379,280 936,404 571,087 59.26 40.61 99.87 60.21 40.23 100.44 67.89 41.40 109.30 62.45 40.75 103.20Wilson Creek 127,425 88,871 53,106 64.21 35.68 99.89 64.09 36.76 100.86 69.74 41.68 111.42 66.01 38.04 104.06Grand Coulee Dam 431,252 330,630 152,762 63.74 35.88 99.62 63.84 37.38 101.22 76.67 35.42 112.09 68.08 36.23 104.31County Totals 18,167,600 10,820,973 7,731,649 57.14 42.97 100.11 56.87 42.14 99.02 59.56 42.56 102.12 57.86 42.56 100.42
Grays Harbor Co.Aberdeen 1,907,092 1,188,076 794,135 57.92 43.03 100.96 56.86 42.00 98.86 62.30 41.64 103.94 59.03 42.23 101.25Hoquiam 960,301 591,697 373,737 59.08 43.63 102.72 57.13 42.00 99.12 61.62 38.92 100.53 59.28 41.52 100.79North Beach 1,705,500 1,033,378 646,220 57.63 42.97 100.61 59.78 39.40 99.17 60.59 37.89 98.48 59.33 40.09 99.42McCleary 357,766 210,659 218,304 57.86 43.19 101.04 55.49 44.07 99.55 58.88 61.02 119.90 57.41 49.42 106.83Montesano 1,103,991 640,915 435,003 57.18 42.43 99.62 59.20 39.35 98.55 58.05 39.40 97.46 58.14 40.40 98.54Elma 1,325,769 749,794 562,618 57.54 42.22 99.76 56.32 43.39 99.71 56.56 42.44 98.99 56.80 42.68 99.49Taholah 23,304 15,941 8,671 57.19 42.82 100.01 64.34 35.54 99.88 68.40 37.21 105.61 63.31 38.52 101.83Lake Quinault 204,509 91,557 54,874 56.65 42.75 99.40 64.71 38.44 103.15 44.77 26.83 71.60 55.37 36.01 91.38Cosmopolis 277,728 168,211 88,211 60.17 44.82 104.99 58.64 41.70 100.34 60.57 31.76 92.33 59.80 39.43 99.22Satsop 71,961 38,734 26,586 56.25 41.52 97.76 58.46 39.67 98.13 53.83 36.94 90.77 56.18 39.38 95.55Wishkah Valley 144,511 75,818 44,913 56.93 42.23 99.16 59.42 42.64 102.06 52.47 31.08 83.54 56.27 38.65 94.92Ocosta 1,143,619 718,581 422,460 58.85 42.08 100.93 61.10 39.97 101.06 62.83 36.94 99.77 60.93 39.66 100.59Oakville 269,996 154,232 94,015 57.00 41.74 98.74 61.24 39.34 100.58 57.12 34.82 91.94 58.45 38.63 97.09County Totals 9,496,046 5,677,592 3,769,746 58.02 42.86 100.88 58.11 41.40 99.50 59.79 39.70 99.49 58.64 41.32 99.95
257
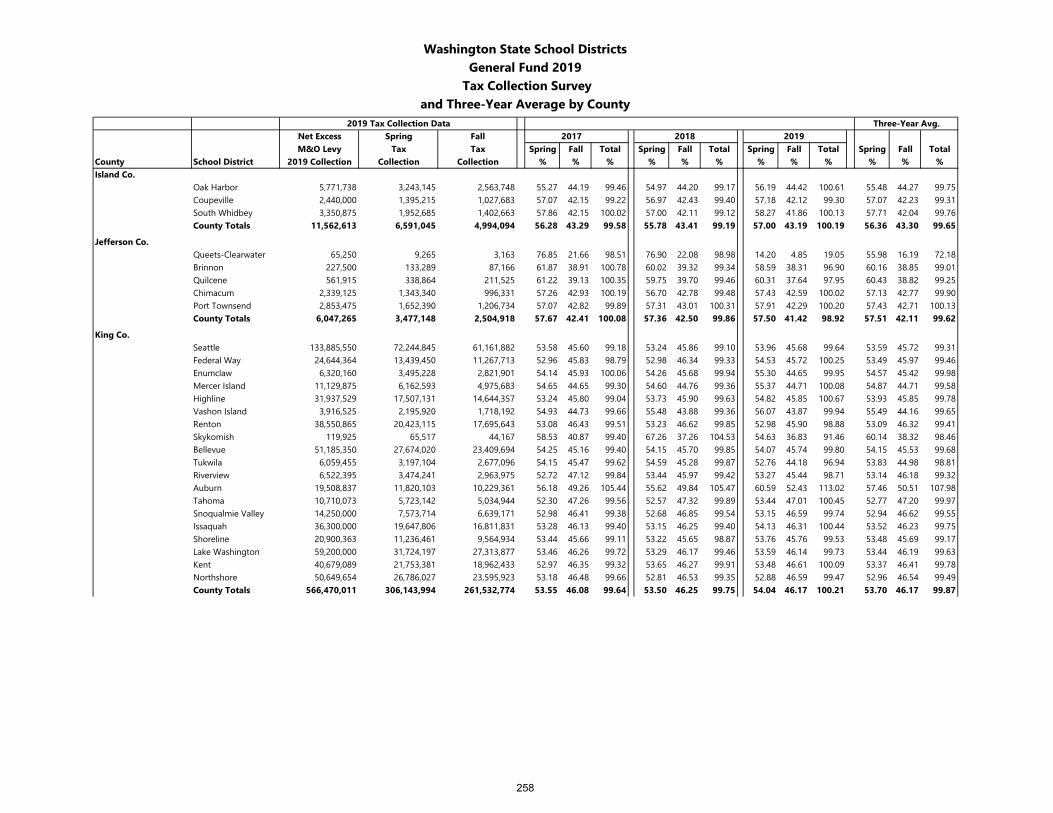
Washington State School DistrictsGeneral Fund 2019
Tax Collection Surveyand Three-Year Average by County
2019 Tax Collection Data Three-Year Avg.Net Excess Spring Fall 2017 2018 2019M&O Levy Tax Tax Spring Fall Total Spring Fall Total Spring Fall Total Spring Fall Total
County School District 2019 Collection Collection Collection % % % % % % % % % % % %Island Co.
Oak Harbor 5,771,738 3,243,145 2,563,748 55.27 44.19 99.46 54.97 44.20 99.17 56.19 44.42 100.61 55.48 44.27 99.75Coupeville 2,440,000 1,395,215 1,027,683 57.07 42.15 99.22 56.97 42.43 99.40 57.18 42.12 99.30 57.07 42.23 99.31South Whidbey 3,350,875 1,952,685 1,402,663 57.86 42.15 100.02 57.00 42.11 99.12 58.27 41.86 100.13 57.71 42.04 99.76County Totals 11,562,613 6,591,045 4,994,094 56.28 43.29 99.58 55.78 43.41 99.19 57.00 43.19 100.19 56.36 43.30 99.65
Jefferson Co.Queets-Clearwater 65,250 9,265 3,163 76.85 21.66 98.51 76.90 22.08 98.98 14.20 4.85 19.05 55.98 16.19 72.18Brinnon 227,500 133,289 87,166 61.87 38.91 100.78 60.02 39.32 99.34 58.59 38.31 96.90 60.16 38.85 99.01Quilcene 561,915 338,864 211,525 61.22 39.13 100.35 59.75 39.70 99.46 60.31 37.64 97.95 60.43 38.82 99.25Chimacum 2,339,125 1,343,340 996,331 57.26 42.93 100.19 56.70 42.78 99.48 57.43 42.59 100.02 57.13 42.77 99.90Port Townsend 2,853,475 1,652,390 1,206,734 57.07 42.82 99.89 57.31 43.01 100.31 57.91 42.29 100.20 57.43 42.71 100.13County Totals 6,047,265 3,477,148 2,504,918 57.67 42.41 100.08 57.36 42.50 99.86 57.50 41.42 98.92 57.51 42.11 99.62
King Co.Seattle 133,885,550 72,244,845 61,161,882 53.58 45.60 99.18 53.24 45.86 99.10 53.96 45.68 99.64 53.59 45.72 99.31Federal Way 24,644,364 13,439,450 11,267,713 52.96 45.83 98.79 52.98 46.34 99.33 54.53 45.72 100.25 53.49 45.97 99.46Enumclaw 6,320,160 3,495,228 2,821,901 54.14 45.93 100.06 54.26 45.68 99.94 55.30 44.65 99.95 54.57 45.42 99.98Mercer Island 11,129,875 6,162,593 4,975,683 54.65 44.65 99.30 54.60 44.76 99.36 55.37 44.71 100.08 54.87 44.71 99.58Highline 31,937,529 17,507,131 14,644,357 53.24 45.80 99.04 53.73 45.90 99.63 54.82 45.85 100.67 53.93 45.85 99.78Vashon Island 3,916,525 2,195,920 1,718,192 54.93 44.73 99.66 55.48 43.88 99.36 56.07 43.87 99.94 55.49 44.16 99.65Renton 38,550,865 20,423,115 17,695,643 53.08 46.43 99.51 53.23 46.62 99.85 52.98 45.90 98.88 53.09 46.32 99.41Skykomish 119,925 65,517 44,167 58.53 40.87 99.40 67.26 37.26 104.53 54.63 36.83 91.46 60.14 38.32 98.46Bellevue 51,185,350 27,674,020 23,409,694 54.25 45.16 99.40 54.15 45.70 99.85 54.07 45.74 99.80 54.15 45.53 99.68Tukwila 6,059,455 3,197,104 2,677,096 54.15 45.47 99.62 54.59 45.28 99.87 52.76 44.18 96.94 53.83 44.98 98.81Riverview 6,522,395 3,474,241 2,963,975 52.72 47.12 99.84 53.44 45.97 99.42 53.27 45.44 98.71 53.14 46.18 99.32Auburn 19,508,837 11,820,103 10,229,361 56.18 49.26 105.44 55.62 49.84 105.47 60.59 52.43 113.02 57.46 50.51 107.98Tahoma 10,710,073 5,723,142 5,034,944 52.30 47.26 99.56 52.57 47.32 99.89 53.44 47.01 100.45 52.77 47.20 99.97Snoqualmie Valley 14,250,000 7,573,714 6,639,171 52.98 46.41 99.38 52.68 46.85 99.54 53.15 46.59 99.74 52.94 46.62 99.55Issaquah 36,300,000 19,647,806 16,811,831 53.28 46.13 99.40 53.15 46.25 99.40 54.13 46.31 100.44 53.52 46.23 99.75Shoreline 20,900,363 11,236,461 9,564,934 53.44 45.66 99.11 53.22 45.65 98.87 53.76 45.76 99.53 53.48 45.69 99.17Lake Washington 59,200,000 31,724,197 27,313,877 53.46 46.26 99.72 53.29 46.17 99.46 53.59 46.14 99.73 53.44 46.19 99.63Kent 40,679,089 21,753,381 18,962,433 52.97 46.35 99.32 53.65 46.27 99.91 53.48 46.61 100.09 53.37 46.41 99.78Northshore 50,649,654 26,786,027 23,595,923 53.18 46.48 99.66 52.81 46.53 99.35 52.88 46.59 99.47 52.96 46.54 99.49County Totals 566,470,011 306,143,994 261,532,774 53.55 46.08 99.64 53.50 46.25 99.75 54.04 46.17 100.21 53.70 46.17 99.87
258
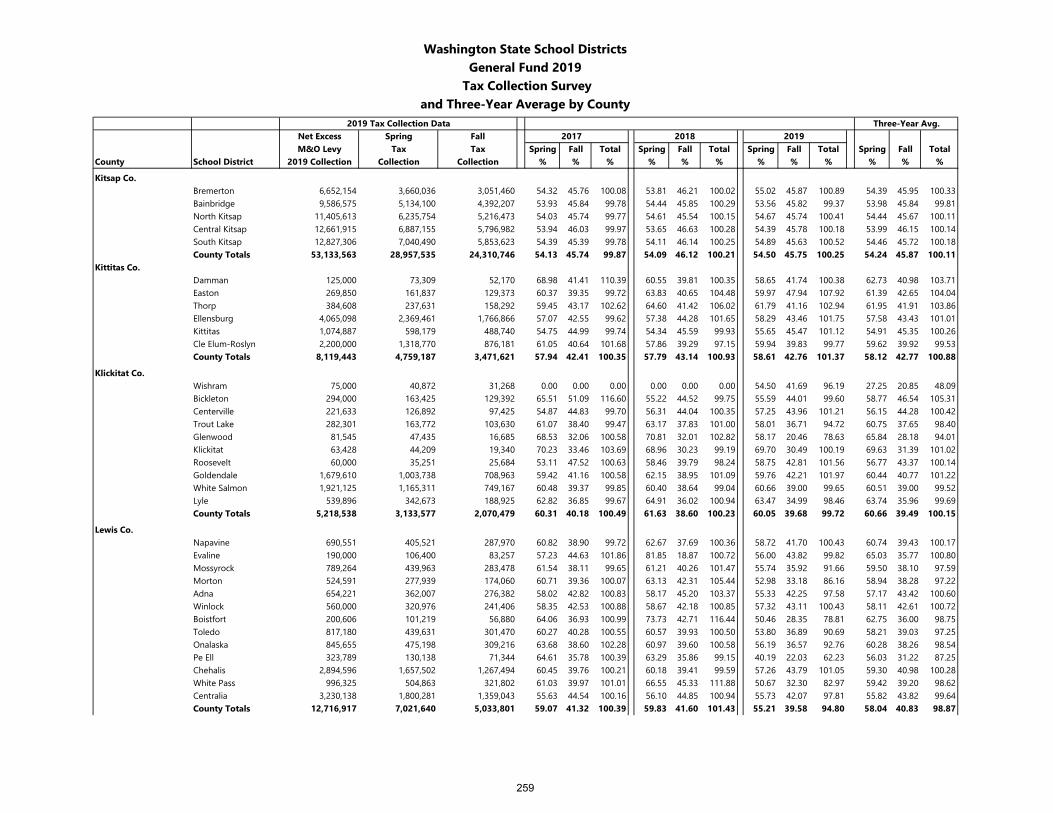
Washington State School DistrictsGeneral Fund 2019
Tax Collection Surveyand Three-Year Average by County
2019 Tax Collection Data Three-Year Avg.Net Excess Spring Fall 2017 2018 2019M&O Levy Tax Tax Spring Fall Total Spring Fall Total Spring Fall Total Spring Fall Total
County School District 2019 Collection Collection Collection % % % % % % % % % % % %
Kitsap Co.Bremerton 6,652,154 3,660,036 3,051,460 54.32 45.76 100.08 53.81 46.21 100.02 55.02 45.87 100.89 54.39 45.95 100.33Bainbridge 9,586,575 5,134,100 4,392,207 53.93 45.84 99.78 54.44 45.85 100.29 53.56 45.82 99.37 53.98 45.84 99.81North Kitsap 11,405,613 6,235,754 5,216,473 54.03 45.74 99.77 54.61 45.54 100.15 54.67 45.74 100.41 54.44 45.67 100.11Central Kitsap 12,661,915 6,887,155 5,796,982 53.94 46.03 99.97 53.65 46.63 100.28 54.39 45.78 100.18 53.99 46.15 100.14South Kitsap 12,827,306 7,040,490 5,853,623 54.39 45.39 99.78 54.11 46.14 100.25 54.89 45.63 100.52 54.46 45.72 100.18County Totals 53,133,563 28,957,535 24,310,746 54.13 45.74 99.87 54.09 46.12 100.21 54.50 45.75 100.25 54.24 45.87 100.11
Kittitas Co.Damman 125,000 73,309 52,170 68.98 41.41 110.39 60.55 39.81 100.35 58.65 41.74 100.38 62.73 40.98 103.71Easton 269,850 161,837 129,373 60.37 39.35 99.72 63.83 40.65 104.48 59.97 47.94 107.92 61.39 42.65 104.04Thorp 384,608 237,631 158,292 59.45 43.17 102.62 64.60 41.42 106.02 61.79 41.16 102.94 61.95 41.91 103.86Ellensburg 4,065,098 2,369,461 1,766,866 57.07 42.55 99.62 57.38 44.28 101.65 58.29 43.46 101.75 57.58 43.43 101.01Kittitas 1,074,887 598,179 488,740 54.75 44.99 99.74 54.34 45.59 99.93 55.65 45.47 101.12 54.91 45.35 100.26Cle Elum-Roslyn 2,200,000 1,318,770 876,181 61.05 40.64 101.68 57.86 39.29 97.15 59.94 39.83 99.77 59.62 39.92 99.53County Totals 8,119,443 4,759,187 3,471,621 57.94 42.41 100.35 57.79 43.14 100.93 58.61 42.76 101.37 58.12 42.77 100.88
Klickitat Co.Wishram 75,000 40,872 31,268 0.00 0.00 0.00 0.00 0.00 0.00 54.50 41.69 96.19 27.25 20.85 48.09Bickleton 294,000 163,425 129,392 65.51 51.09 116.60 55.22 44.52 99.75 55.59 44.01 99.60 58.77 46.54 105.31Centerville 221,633 126,892 97,425 54.87 44.83 99.70 56.31 44.04 100.35 57.25 43.96 101.21 56.15 44.28 100.42Trout Lake 282,301 163,772 103,630 61.07 38.40 99.47 63.17 37.83 101.00 58.01 36.71 94.72 60.75 37.65 98.40Glenwood 81,545 47,435 16,685 68.53 32.06 100.58 70.81 32.01 102.82 58.17 20.46 78.63 65.84 28.18 94.01Klickitat 63,428 44,209 19,340 70.23 33.46 103.69 68.96 30.23 99.19 69.70 30.49 100.19 69.63 31.39 101.02Roosevelt 60,000 35,251 25,684 53.11 47.52 100.63 58.46 39.79 98.24 58.75 42.81 101.56 56.77 43.37 100.14Goldendale 1,679,610 1,003,738 708,963 59.42 41.16 100.58 62.15 38.95 101.09 59.76 42.21 101.97 60.44 40.77 101.22White Salmon 1,921,125 1,165,311 749,167 60.48 39.37 99.85 60.40 38.64 99.04 60.66 39.00 99.65 60.51 39.00 99.52Lyle 539,896 342,673 188,925 62.82 36.85 99.67 64.91 36.02 100.94 63.47 34.99 98.46 63.74 35.96 99.69County Totals 5,218,538 3,133,577 2,070,479 60.31 40.18 100.49 61.63 38.60 100.23 60.05 39.68 99.72 60.66 39.49 100.15
Lewis Co.Napavine 690,551 405,521 287,970 60.82 38.90 99.72 62.67 37.69 100.36 58.72 41.70 100.43 60.74 39.43 100.17Evaline 190,000 106,400 83,257 57.23 44.63 101.86 81.85 18.87 100.72 56.00 43.82 99.82 65.03 35.77 100.80Mossyrock 789,264 439,963 283,478 61.54 38.11 99.65 61.21 40.26 101.47 55.74 35.92 91.66 59.50 38.10 97.59Morton 524,591 277,939 174,060 60.71 39.36 100.07 63.13 42.31 105.44 52.98 33.18 86.16 58.94 38.28 97.22Adna 654,221 362,007 276,382 58.02 42.82 100.83 58.17 45.20 103.37 55.33 42.25 97.58 57.17 43.42 100.60Winlock 560,000 320,976 241,406 58.35 42.53 100.88 58.67 42.18 100.85 57.32 43.11 100.43 58.11 42.61 100.72Boistfort 200,606 101,219 56,880 64.06 36.93 100.99 73.73 42.71 116.44 50.46 28.35 78.81 62.75 36.00 98.75Toledo 817,180 439,631 301,470 60.27 40.28 100.55 60.57 39.93 100.50 53.80 36.89 90.69 58.21 39.03 97.25Onalaska 845,655 475,198 309,216 63.68 38.60 102.28 60.97 39.60 100.58 56.19 36.57 92.76 60.28 38.26 98.54Pe Ell 323,789 130,138 71,344 64.61 35.78 100.39 63.29 35.86 99.15 40.19 22.03 62.23 56.03 31.22 87.25Chehalis 2,894,596 1,657,502 1,267,494 60.45 39.76 100.21 60.18 39.41 99.59 57.26 43.79 101.05 59.30 40.98 100.28White Pass 996,325 504,863 321,802 61.03 39.97 101.01 66.55 45.33 111.88 50.67 32.30 82.97 59.42 39.20 98.62Centralia 3,230,138 1,800,281 1,359,043 55.63 44.54 100.16 56.10 44.85 100.94 55.73 42.07 97.81 55.82 43.82 99.64County Totals 12,716,917 7,021,640 5,033,801 59.07 41.32 100.39 59.83 41.60 101.43 55.21 39.58 94.80 58.04 40.83 98.87
259
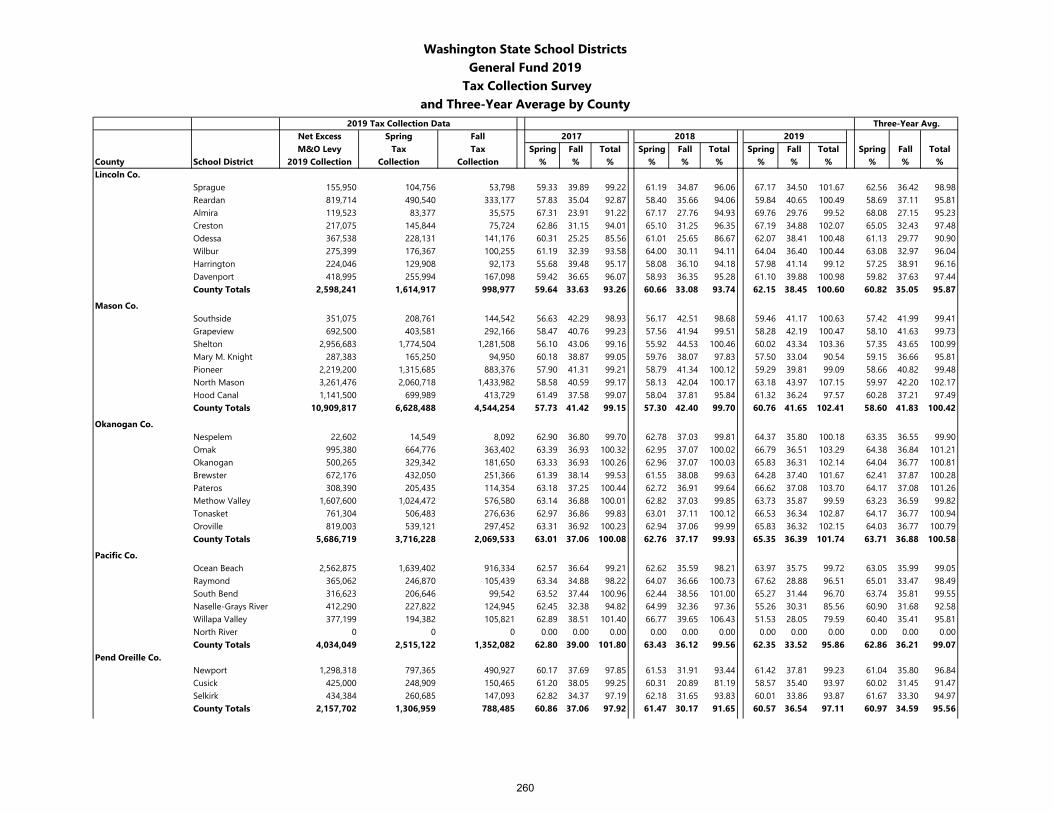
Washington State School DistrictsGeneral Fund 2019
Tax Collection Surveyand Three-Year Average by County
2019 Tax Collection Data Three-Year Avg.Net Excess Spring Fall 2017 2018 2019M&O Levy Tax Tax Spring Fall Total Spring Fall Total Spring Fall Total Spring Fall Total
County School District 2019 Collection Collection Collection % % % % % % % % % % % %Lincoln Co.
Sprague 155,950 104,756 53,798 59.33 39.89 99.22 61.19 34.87 96.06 67.17 34.50 101.67 62.56 36.42 98.98Reardan 819,714 490,540 333,177 57.83 35.04 92.87 58.40 35.66 94.06 59.84 40.65 100.49 58.69 37.11 95.81Almira 119,523 83,377 35,575 67.31 23.91 91.22 67.17 27.76 94.93 69.76 29.76 99.52 68.08 27.15 95.23Creston 217,075 145,844 75,724 62.86 31.15 94.01 65.10 31.25 96.35 67.19 34.88 102.07 65.05 32.43 97.48Odessa 367,538 228,131 141,176 60.31 25.25 85.56 61.01 25.65 86.67 62.07 38.41 100.48 61.13 29.77 90.90Wilbur 275,399 176,367 100,255 61.19 32.39 93.58 64.00 30.11 94.11 64.04 36.40 100.44 63.08 32.97 96.04Harrington 224,046 129,908 92,173 55.68 39.48 95.17 58.08 36.10 94.18 57.98 41.14 99.12 57.25 38.91 96.16Davenport 418,995 255,994 167,098 59.42 36.65 96.07 58.93 36.35 95.28 61.10 39.88 100.98 59.82 37.63 97.44County Totals 2,598,241 1,614,917 998,977 59.64 33.63 93.26 60.66 33.08 93.74 62.15 38.45 100.60 60.82 35.05 95.87
Mason Co.Southside 351,075 208,761 144,542 56.63 42.29 98.93 56.17 42.51 98.68 59.46 41.17 100.63 57.42 41.99 99.41Grapeview 692,500 403,581 292,166 58.47 40.76 99.23 57.56 41.94 99.51 58.28 42.19 100.47 58.10 41.63 99.73Shelton 2,956,683 1,774,504 1,281,508 56.10 43.06 99.16 55.92 44.53 100.46 60.02 43.34 103.36 57.35 43.65 100.99Mary M. Knight 287,383 165,250 94,950 60.18 38.87 99.05 59.76 38.07 97.83 57.50 33.04 90.54 59.15 36.66 95.81Pioneer 2,219,200 1,315,685 883,376 57.90 41.31 99.21 58.79 41.34 100.12 59.29 39.81 99.09 58.66 40.82 99.48North Mason 3,261,476 2,060,718 1,433,982 58.58 40.59 99.17 58.13 42.04 100.17 63.18 43.97 107.15 59.97 42.20 102.17Hood Canal 1,141,500 699,989 413,729 61.49 37.58 99.07 58.04 37.81 95.84 61.32 36.24 97.57 60.28 37.21 97.49County Totals 10,909,817 6,628,488 4,544,254 57.73 41.42 99.15 57.30 42.40 99.70 60.76 41.65 102.41 58.60 41.83 100.42
Okanogan Co.Nespelem 22,602 14,549 8,092 62.90 36.80 99.70 62.78 37.03 99.81 64.37 35.80 100.18 63.35 36.55 99.90Omak 995,380 664,776 363,402 63.39 36.93 100.32 62.95 37.07 100.02 66.79 36.51 103.29 64.38 36.84 101.21Okanogan 500,265 329,342 181,650 63.33 36.93 100.26 62.96 37.07 100.03 65.83 36.31 102.14 64.04 36.77 100.81Brewster 672,176 432,050 251,366 61.39 38.14 99.53 61.55 38.08 99.63 64.28 37.40 101.67 62.41 37.87 100.28Pateros 308,390 205,435 114,354 63.18 37.25 100.44 62.72 36.91 99.64 66.62 37.08 103.70 64.17 37.08 101.26Methow Valley 1,607,600 1,024,472 576,580 63.14 36.88 100.01 62.82 37.03 99.85 63.73 35.87 99.59 63.23 36.59 99.82Tonasket 761,304 506,483 276,636 62.97 36.86 99.83 63.01 37.11 100.12 66.53 36.34 102.87 64.17 36.77 100.94Oroville 819,003 539,121 297,452 63.31 36.92 100.23 62.94 37.06 99.99 65.83 36.32 102.15 64.03 36.77 100.79County Totals 5,686,719 3,716,228 2,069,533 63.01 37.06 100.08 62.76 37.17 99.93 65.35 36.39 101.74 63.71 36.88 100.58
Pacific Co.Ocean Beach 2,562,875 1,639,402 916,334 62.57 36.64 99.21 62.62 35.59 98.21 63.97 35.75 99.72 63.05 35.99 99.05Raymond 365,062 246,870 105,439 63.34 34.88 98.22 64.07 36.66 100.73 67.62 28.88 96.51 65.01 33.47 98.49South Bend 316,623 206,646 99,542 63.52 37.44 100.96 62.44 38.56 101.00 65.27 31.44 96.70 63.74 35.81 99.55Naselle-Grays River 412,290 227,822 124,945 62.45 32.38 94.82 64.99 32.36 97.36 55.26 30.31 85.56 60.90 31.68 92.58Willapa Valley 377,199 194,382 105,821 62.89 38.51 101.40 66.77 39.65 106.43 51.53 28.05 79.59 60.40 35.41 95.81North River 0 0 0 0.00 0.00 0.00 0.00 0.00 0.00 0.00 0.00 0.00 0.00 0.00 0.00County Totals 4,034,049 2,515,122 1,352,082 62.80 39.00 101.80 63.43 36.12 99.56 62.35 33.52 95.86 62.86 36.21 99.07
Pend Oreille Co.Newport 1,298,318 797,365 490,927 60.17 37.69 97.85 61.53 31.91 93.44 61.42 37.81 99.23 61.04 35.80 96.84Cusick 425,000 248,909 150,465 61.20 38.05 99.25 60.31 20.89 81.19 58.57 35.40 93.97 60.02 31.45 91.47Selkirk 434,384 260,685 147,093 62.82 34.37 97.19 62.18 31.65 93.83 60.01 33.86 93.87 61.67 33.30 94.97County Totals 2,157,702 1,306,959 788,485 60.86 37.06 97.92 61.47 30.17 91.65 60.57 36.54 97.11 60.97 34.59 95.56
260
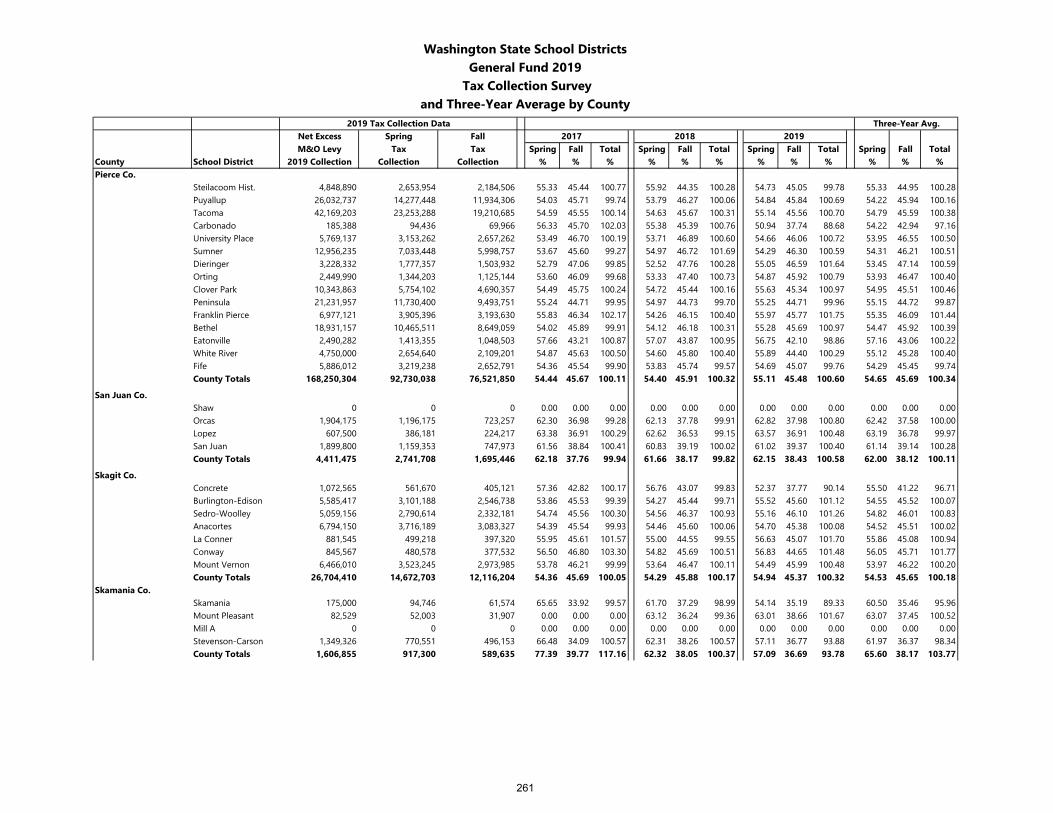
Washington State School DistrictsGeneral Fund 2019
Tax Collection Surveyand Three-Year Average by County
2019 Tax Collection Data Three-Year Avg.Net Excess Spring Fall 2017 2018 2019M&O Levy Tax Tax Spring Fall Total Spring Fall Total Spring Fall Total Spring Fall Total
County School District 2019 Collection Collection Collection % % % % % % % % % % % %Pierce Co.
Steilacoom Hist. 4,848,890 2,653,954 2,184,506 55.33 45.44 100.77 55.92 44.35 100.28 54.73 45.05 99.78 55.33 44.95 100.28Puyallup 26,032,737 14,277,448 11,934,306 54.03 45.71 99.74 53.79 46.27 100.06 54.84 45.84 100.69 54.22 45.94 100.16Tacoma 42,169,203 23,253,288 19,210,685 54.59 45.55 100.14 54.63 45.67 100.31 55.14 45.56 100.70 54.79 45.59 100.38Carbonado 185,388 94,436 69,966 56.33 45.70 102.03 55.38 45.39 100.76 50.94 37.74 88.68 54.22 42.94 97.16University Place 5,769,137 3,153,262 2,657,262 53.49 46.70 100.19 53.71 46.89 100.60 54.66 46.06 100.72 53.95 46.55 100.50Sumner 12,956,235 7,033,448 5,998,757 53.67 45.60 99.27 54.97 46.72 101.69 54.29 46.30 100.59 54.31 46.21 100.51Dieringer 3,228,332 1,777,357 1,503,932 52.79 47.06 99.85 52.52 47.76 100.28 55.05 46.59 101.64 53.45 47.14 100.59Orting 2,449,990 1,344,203 1,125,144 53.60 46.09 99.68 53.33 47.40 100.73 54.87 45.92 100.79 53.93 46.47 100.40Clover Park 10,343,863 5,754,102 4,690,357 54.49 45.75 100.24 54.72 45.44 100.16 55.63 45.34 100.97 54.95 45.51 100.46Peninsula 21,231,957 11,730,400 9,493,751 55.24 44.71 99.95 54.97 44.73 99.70 55.25 44.71 99.96 55.15 44.72 99.87Franklin Pierce 6,977,121 3,905,396 3,193,630 55.83 46.34 102.17 54.26 46.15 100.40 55.97 45.77 101.75 55.35 46.09 101.44Bethel 18,931,157 10,465,511 8,649,059 54.02 45.89 99.91 54.12 46.18 100.31 55.28 45.69 100.97 54.47 45.92 100.39Eatonville 2,490,282 1,413,355 1,048,503 57.66 43.21 100.87 57.07 43.87 100.95 56.75 42.10 98.86 57.16 43.06 100.22White River 4,750,000 2,654,640 2,109,201 54.87 45.63 100.50 54.60 45.80 100.40 55.89 44.40 100.29 55.12 45.28 100.40Fife 5,886,012 3,219,238 2,652,791 54.36 45.54 99.90 53.83 45.74 99.57 54.69 45.07 99.76 54.29 45.45 99.74County Totals 168,250,304 92,730,038 76,521,850 54.44 45.67 100.11 54.40 45.91 100.32 55.11 45.48 100.60 54.65 45.69 100.34
San Juan Co.Shaw 0 0 0 0.00 0.00 0.00 0.00 0.00 0.00 0.00 0.00 0.00 0.00 0.00 0.00Orcas 1,904,175 1,196,175 723,257 62.30 36.98 99.28 62.13 37.78 99.91 62.82 37.98 100.80 62.42 37.58 100.00Lopez 607,500 386,181 224,217 63.38 36.91 100.29 62.62 36.53 99.15 63.57 36.91 100.48 63.19 36.78 99.97San Juan 1,899,800 1,159,353 747,973 61.56 38.84 100.41 60.83 39.19 100.02 61.02 39.37 100.40 61.14 39.14 100.28County Totals 4,411,475 2,741,708 1,695,446 62.18 37.76 99.94 61.66 38.17 99.82 62.15 38.43 100.58 62.00 38.12 100.11
Skagit Co.Concrete 1,072,565 561,670 405,121 57.36 42.82 100.17 56.76 43.07 99.83 52.37 37.77 90.14 55.50 41.22 96.71Burlington-Edison 5,585,417 3,101,188 2,546,738 53.86 45.53 99.39 54.27 45.44 99.71 55.52 45.60 101.12 54.55 45.52 100.07Sedro-Woolley 5,059,156 2,790,614 2,332,181 54.74 45.56 100.30 54.56 46.37 100.93 55.16 46.10 101.26 54.82 46.01 100.83Anacortes 6,794,150 3,716,189 3,083,327 54.39 45.54 99.93 54.46 45.60 100.06 54.70 45.38 100.08 54.52 45.51 100.02La Conner 881,545 499,218 397,320 55.95 45.61 101.57 55.00 44.55 99.55 56.63 45.07 101.70 55.86 45.08 100.94Conway 845,567 480,578 377,532 56.50 46.80 103.30 54.82 45.69 100.51 56.83 44.65 101.48 56.05 45.71 101.77Mount Vernon 6,466,010 3,523,245 2,973,985 53.78 46.21 99.99 53.64 46.47 100.11 54.49 45.99 100.48 53.97 46.22 100.20County Totals 26,704,410 14,672,703 12,116,204 54.36 45.69 100.05 54.29 45.88 100.17 54.94 45.37 100.32 54.53 45.65 100.18
Skamania Co.Skamania 175,000 94,746 61,574 65.65 33.92 99.57 61.70 37.29 98.99 54.14 35.19 89.33 60.50 35.46 95.96Mount Pleasant 82,529 52,003 31,907 0.00 0.00 0.00 63.12 36.24 99.36 63.01 38.66 101.67 63.07 37.45 100.52Mill A 0 0 0 0.00 0.00 0.00 0.00 0.00 0.00 0.00 0.00 0.00 0.00 0.00 0.00Stevenson-Carson 1,349,326 770,551 496,153 66.48 34.09 100.57 62.31 38.26 100.57 57.11 36.77 93.88 61.97 36.37 98.34County Totals 1,606,855 917,300 589,635 77.39 39.77 117.16 62.32 38.05 100.37 57.09 36.69 93.78 65.60 38.17 103.77
261
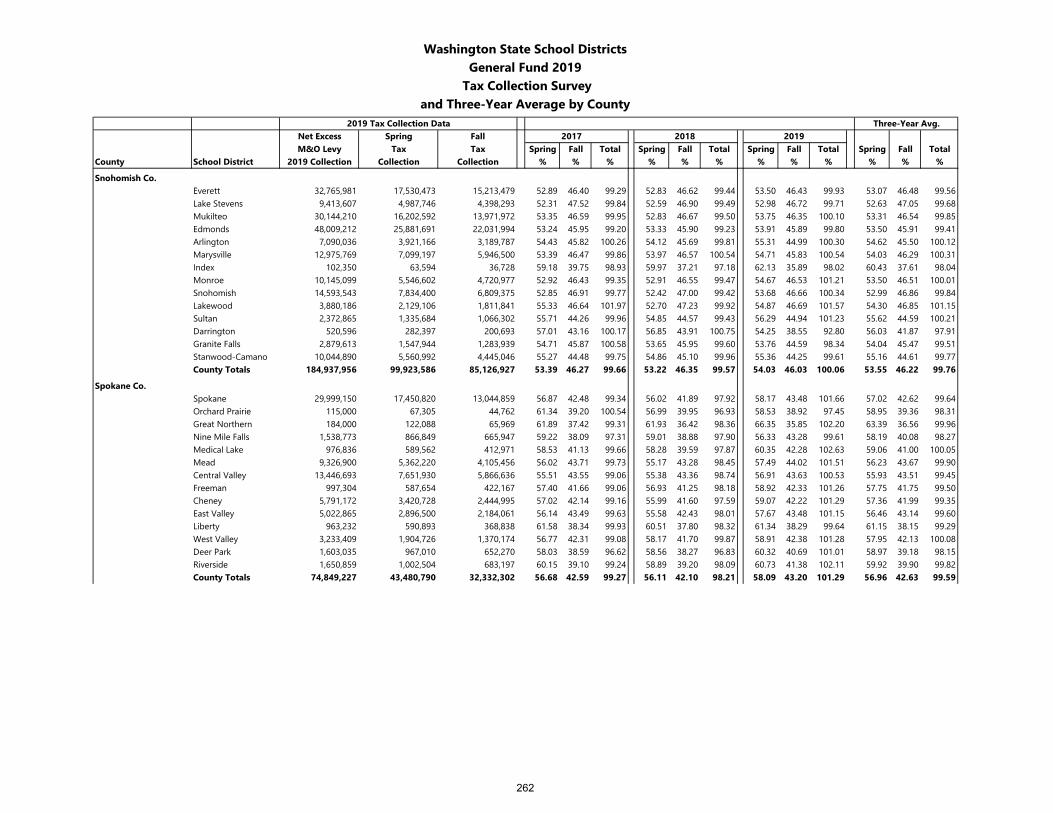
Washington State School DistrictsGeneral Fund 2019
Tax Collection Surveyand Three-Year Average by County
2019 Tax Collection Data Three-Year Avg.Net Excess Spring Fall 2017 2018 2019M&O Levy Tax Tax Spring Fall Total Spring Fall Total Spring Fall Total Spring Fall Total
County School District 2019 Collection Collection Collection % % % % % % % % % % % %
Snohomish Co.Everett 32,765,981 17,530,473 15,213,479 52.89 46.40 99.29 52.83 46.62 99.44 53.50 46.43 99.93 53.07 46.48 99.56Lake Stevens 9,413,607 4,987,746 4,398,293 52.31 47.52 99.84 52.59 46.90 99.49 52.98 46.72 99.71 52.63 47.05 99.68Mukilteo 30,144,210 16,202,592 13,971,972 53.35 46.59 99.95 52.83 46.67 99.50 53.75 46.35 100.10 53.31 46.54 99.85Edmonds 48,009,212 25,881,691 22,031,994 53.24 45.95 99.20 53.33 45.90 99.23 53.91 45.89 99.80 53.50 45.91 99.41Arlington 7,090,036 3,921,166 3,189,787 54.43 45.82 100.26 54.12 45.69 99.81 55.31 44.99 100.30 54.62 45.50 100.12Marysville 12,975,769 7,099,197 5,946,500 53.39 46.47 99.86 53.97 46.57 100.54 54.71 45.83 100.54 54.03 46.29 100.31Index 102,350 63,594 36,728 59.18 39.75 98.93 59.97 37.21 97.18 62.13 35.89 98.02 60.43 37.61 98.04Monroe 10,145,099 5,546,602 4,720,977 52.92 46.43 99.35 52.91 46.55 99.47 54.67 46.53 101.21 53.50 46.51 100.01Snohomish 14,593,543 7,834,400 6,809,375 52.85 46.91 99.77 52.42 47.00 99.42 53.68 46.66 100.34 52.99 46.86 99.84Lakewood 3,880,186 2,129,106 1,811,841 55.33 46.64 101.97 52.70 47.23 99.92 54.87 46.69 101.57 54.30 46.85 101.15Sultan 2,372,865 1,335,684 1,066,302 55.71 44.26 99.96 54.85 44.57 99.43 56.29 44.94 101.23 55.62 44.59 100.21Darrington 520,596 282,397 200,693 57.01 43.16 100.17 56.85 43.91 100.75 54.25 38.55 92.80 56.03 41.87 97.91Granite Falls 2,879,613 1,547,944 1,283,939 54.71 45.87 100.58 53.65 45.95 99.60 53.76 44.59 98.34 54.04 45.47 99.51Stanwood-Camano 10,044,890 5,560,992 4,445,046 55.27 44.48 99.75 54.86 45.10 99.96 55.36 44.25 99.61 55.16 44.61 99.77County Totals 184,937,956 99,923,586 85,126,927 53.39 46.27 99.66 53.22 46.35 99.57 54.03 46.03 100.06 53.55 46.22 99.76
Spokane Co.Spokane 29,999,150 17,450,820 13,044,859 56.87 42.48 99.34 56.02 41.89 97.92 58.17 43.48 101.66 57.02 42.62 99.64Orchard Prairie 115,000 67,305 44,762 61.34 39.20 100.54 56.99 39.95 96.93 58.53 38.92 97.45 58.95 39.36 98.31Great Northern 184,000 122,088 65,969 61.89 37.42 99.31 61.93 36.42 98.36 66.35 35.85 102.20 63.39 36.56 99.96Nine Mile Falls 1,538,773 866,849 665,947 59.22 38.09 97.31 59.01 38.88 97.90 56.33 43.28 99.61 58.19 40.08 98.27Medical Lake 976,836 589,562 412,971 58.53 41.13 99.66 58.28 39.59 97.87 60.35 42.28 102.63 59.06 41.00 100.05Mead 9,326,900 5,362,220 4,105,456 56.02 43.71 99.73 55.17 43.28 98.45 57.49 44.02 101.51 56.23 43.67 99.90Central Valley 13,446,693 7,651,930 5,866,636 55.51 43.55 99.06 55.38 43.36 98.74 56.91 43.63 100.53 55.93 43.51 99.45Freeman 997,304 587,654 422,167 57.40 41.66 99.06 56.93 41.25 98.18 58.92 42.33 101.26 57.75 41.75 99.50Cheney 5,791,172 3,420,728 2,444,995 57.02 42.14 99.16 55.99 41.60 97.59 59.07 42.22 101.29 57.36 41.99 99.35East Valley 5,022,865 2,896,500 2,184,061 56.14 43.49 99.63 55.58 42.43 98.01 57.67 43.48 101.15 56.46 43.14 99.60Liberty 963,232 590,893 368,838 61.58 38.34 99.93 60.51 37.80 98.32 61.34 38.29 99.64 61.15 38.15 99.29West Valley 3,233,409 1,904,726 1,370,174 56.77 42.31 99.08 58.17 41.70 99.87 58.91 42.38 101.28 57.95 42.13 100.08Deer Park 1,603,035 967,010 652,270 58.03 38.59 96.62 58.56 38.27 96.83 60.32 40.69 101.01 58.97 39.18 98.15Riverside 1,650,859 1,002,504 683,197 60.15 39.10 99.24 58.89 39.20 98.09 60.73 41.38 102.11 59.92 39.90 99.82County Totals 74,849,227 43,480,790 32,332,302 56.68 42.59 99.27 56.11 42.10 98.21 58.09 43.20 101.29 56.96 42.63 99.59
262
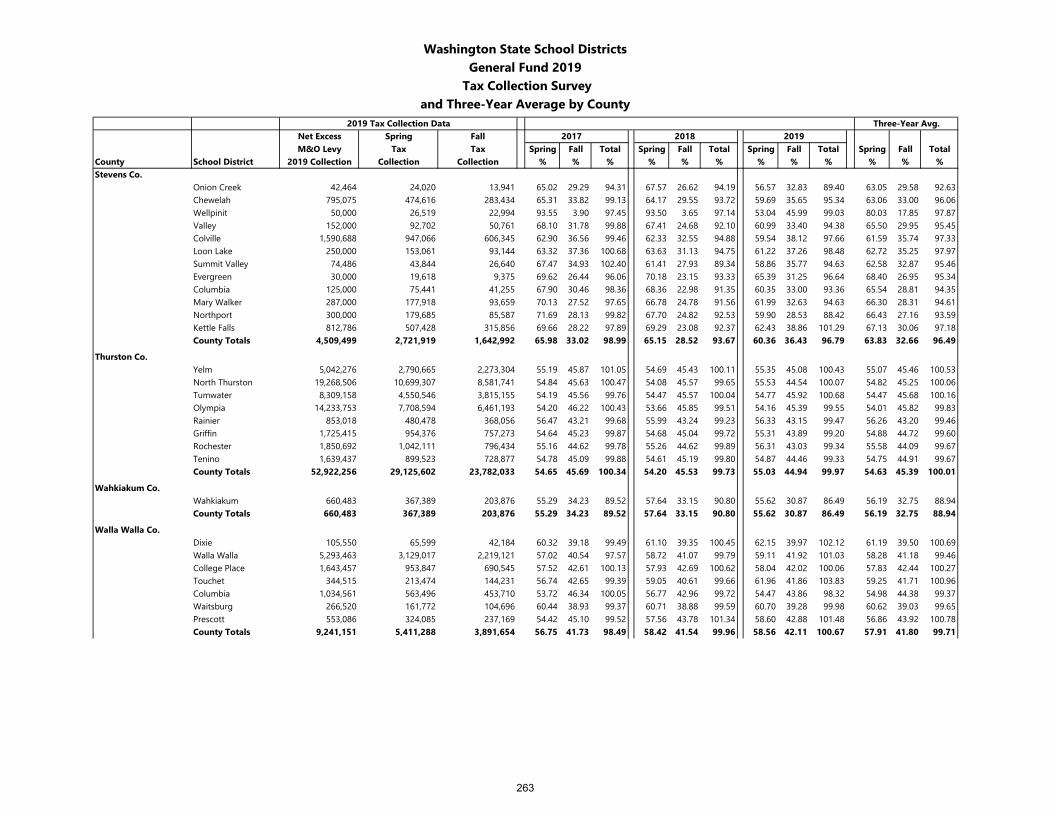
Washington State School DistrictsGeneral Fund 2019
Tax Collection Surveyand Three-Year Average by County
2019 Tax Collection Data Three-Year Avg.Net Excess Spring Fall 2017 2018 2019M&O Levy Tax Tax Spring Fall Total Spring Fall Total Spring Fall Total Spring Fall Total
County School District 2019 Collection Collection Collection % % % % % % % % % % % %Stevens Co.
Onion Creek 42,464 24,020 13,941 65.02 29.29 94.31 67.57 26.62 94.19 56.57 32.83 89.40 63.05 29.58 92.63Chewelah 795,075 474,616 283,434 65.31 33.82 99.13 64.17 29.55 93.72 59.69 35.65 95.34 63.06 33.00 96.06Wellpinit 50,000 26,519 22,994 93.55 3.90 97.45 93.50 3.65 97.14 53.04 45.99 99.03 80.03 17.85 97.87Valley 152,000 92,702 50,761 68.10 31.78 99.88 67.41 24.68 92.10 60.99 33.40 94.38 65.50 29.95 95.45Colville 1,590,688 947,066 606,345 62.90 36.56 99.46 62.33 32.55 94.88 59.54 38.12 97.66 61.59 35.74 97.33Loon Lake 250,000 153,061 93,144 63.32 37.36 100.68 63.63 31.13 94.75 61.22 37.26 98.48 62.72 35.25 97.97Summit Valley 74,486 43,844 26,640 67.47 34.93 102.40 61.41 27.93 89.34 58.86 35.77 94.63 62.58 32.87 95.46Evergreen 30,000 19,618 9,375 69.62 26.44 96.06 70.18 23.15 93.33 65.39 31.25 96.64 68.40 26.95 95.34Columbia 125,000 75,441 41,255 67.90 30.46 98.36 68.36 22.98 91.35 60.35 33.00 93.36 65.54 28.81 94.35Mary Walker 287,000 177,918 93,659 70.13 27.52 97.65 66.78 24.78 91.56 61.99 32.63 94.63 66.30 28.31 94.61Northport 300,000 179,685 85,587 71.69 28.13 99.82 67.70 24.82 92.53 59.90 28.53 88.42 66.43 27.16 93.59Kettle Falls 812,786 507,428 315,856 69.66 28.22 97.89 69.29 23.08 92.37 62.43 38.86 101.29 67.13 30.06 97.18County Totals 4,509,499 2,721,919 1,642,992 65.98 33.02 98.99 65.15 28.52 93.67 60.36 36.43 96.79 63.83 32.66 96.49
Thurston Co.Yelm 5,042,276 2,790,665 2,273,304 55.19 45.87 101.05 54.69 45.43 100.11 55.35 45.08 100.43 55.07 45.46 100.53North Thurston 19,268,506 10,699,307 8,581,741 54.84 45.63 100.47 54.08 45.57 99.65 55.53 44.54 100.07 54.82 45.25 100.06Tumwater 8,309,158 4,550,546 3,815,155 54.19 45.56 99.76 54.47 45.57 100.04 54.77 45.92 100.68 54.47 45.68 100.16Olympia 14,233,753 7,708,594 6,461,193 54.20 46.22 100.43 53.66 45.85 99.51 54.16 45.39 99.55 54.01 45.82 99.83Rainier 853,018 480,478 368,056 56.47 43.21 99.68 55.99 43.24 99.23 56.33 43.15 99.47 56.26 43.20 99.46Griffin 1,725,415 954,376 757,273 54.64 45.23 99.87 54.68 45.04 99.72 55.31 43.89 99.20 54.88 44.72 99.60Rochester 1,850,692 1,042,111 796,434 55.16 44.62 99.78 55.26 44.62 99.89 56.31 43.03 99.34 55.58 44.09 99.67Tenino 1,639,437 899,523 728,877 54.78 45.09 99.88 54.61 45.19 99.80 54.87 44.46 99.33 54.75 44.91 99.67County Totals 52,922,256 29,125,602 23,782,033 54.65 45.69 100.34 54.20 45.53 99.73 55.03 44.94 99.97 54.63 45.39 100.01
Wahkiakum Co.Wahkiakum 660,483 367,389 203,876 55.29 34.23 89.52 57.64 33.15 90.80 55.62 30.87 86.49 56.19 32.75 88.94County Totals 660,483 367,389 203,876 55.29 34.23 89.52 57.64 33.15 90.80 55.62 30.87 86.49 56.19 32.75 88.94
Walla Walla Co.Dixie 105,550 65,599 42,184 60.32 39.18 99.49 61.10 39.35 100.45 62.15 39.97 102.12 61.19 39.50 100.69Walla Walla 5,293,463 3,129,017 2,219,121 57.02 40.54 97.57 58.72 41.07 99.79 59.11 41.92 101.03 58.28 41.18 99.46College Place 1,643,457 953,847 690,545 57.52 42.61 100.13 57.93 42.69 100.62 58.04 42.02 100.06 57.83 42.44 100.27Touchet 344,515 213,474 144,231 56.74 42.65 99.39 59.05 40.61 99.66 61.96 41.86 103.83 59.25 41.71 100.96Columbia 1,034,561 563,496 453,710 53.72 46.34 100.05 56.77 42.96 99.72 54.47 43.86 98.32 54.98 44.38 99.37Waitsburg 266,520 161,772 104,696 60.44 38.93 99.37 60.71 38.88 99.59 60.70 39.28 99.98 60.62 39.03 99.65Prescott 553,086 324,085 237,169 54.42 45.10 99.52 57.56 43.78 101.34 58.60 42.88 101.48 56.86 43.92 100.78County Totals 9,241,151 5,411,288 3,891,654 56.75 41.73 98.49 58.42 41.54 99.96 58.56 42.11 100.67 57.91 41.80 99.71
263
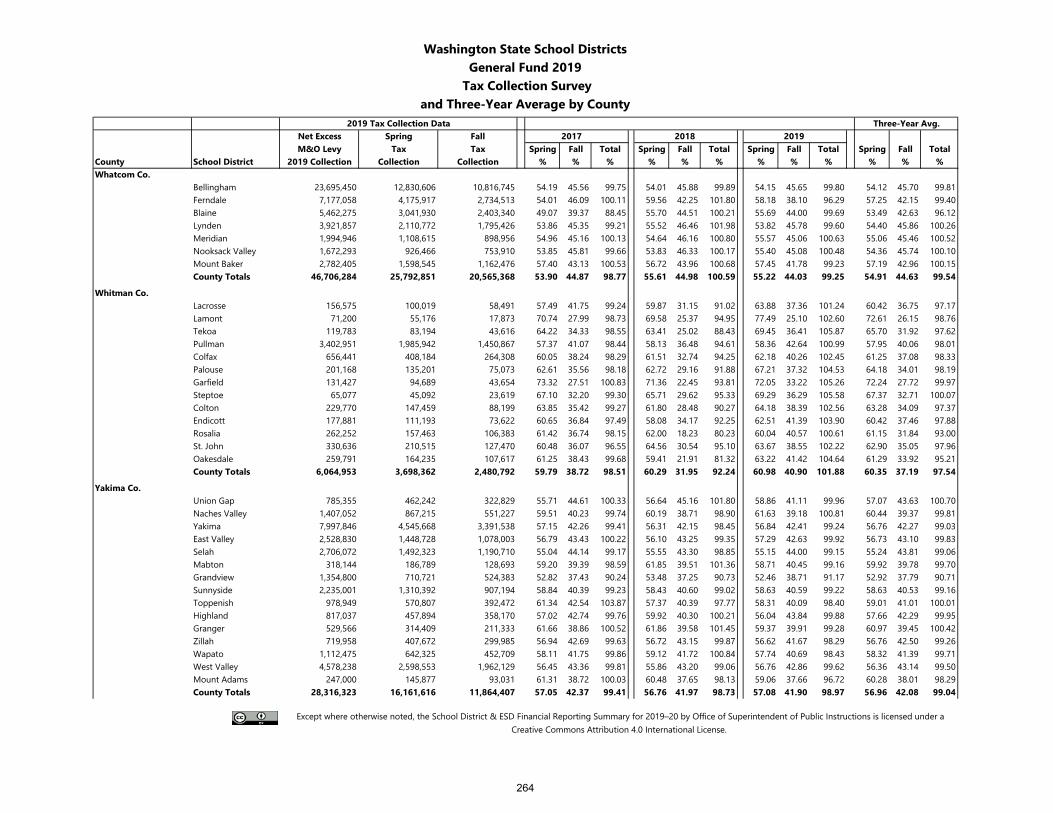
Washington State School DistrictsGeneral Fund 2019
Tax Collection Surveyand Three-Year Average by County
2019 Tax Collection Data Three-Year Avg.Net Excess Spring Fall 2017 2018 2019M&O Levy Tax Tax Spring Fall Total Spring Fall Total Spring Fall Total Spring Fall Total
County School District 2019 Collection Collection Collection % % % % % % % % % % % %Whatcom Co.
Bellingham 23,695,450 12,830,606 10,816,745 54.19 45.56 99.75 54.01 45.88 99.89 54.15 45.65 99.80 54.12 45.70 99.81Ferndale 7,177,058 4,175,917 2,734,513 54.01 46.09 100.11 59.56 42.25 101.80 58.18 38.10 96.29 57.25 42.15 99.40Blaine 5,462,275 3,041,930 2,403,340 49.07 39.37 88.45 55.70 44.51 100.21 55.69 44.00 99.69 53.49 42.63 96.12Lynden 3,921,857 2,110,772 1,795,426 53.86 45.35 99.21 55.52 46.46 101.98 53.82 45.78 99.60 54.40 45.86 100.26Meridian 1,994,946 1,108,615 898,956 54.96 45.16 100.13 54.64 46.16 100.80 55.57 45.06 100.63 55.06 45.46 100.52Nooksack Valley 1,672,293 926,466 753,910 53.85 45.81 99.66 53.83 46.33 100.17 55.40 45.08 100.48 54.36 45.74 100.10Mount Baker 2,782,405 1,598,545 1,162,476 57.40 43.13 100.53 56.72 43.96 100.68 57.45 41.78 99.23 57.19 42.96 100.15County Totals 46,706,284 25,792,851 20,565,368 53.90 44.87 98.77 55.61 44.98 100.59 55.22 44.03 99.25 54.91 44.63 99.54
Whitman Co.Lacrosse 156,575 100,019 58,491 57.49 41.75 99.24 59.87 31.15 91.02 63.88 37.36 101.24 60.42 36.75 97.17Lamont 71,200 55,176 17,873 70.74 27.99 98.73 69.58 25.37 94.95 77.49 25.10 102.60 72.61 26.15 98.76Tekoa 119,783 83,194 43,616 64.22 34.33 98.55 63.41 25.02 88.43 69.45 36.41 105.87 65.70 31.92 97.62Pullman 3,402,951 1,985,942 1,450,867 57.37 41.07 98.44 58.13 36.48 94.61 58.36 42.64 100.99 57.95 40.06 98.01Colfax 656,441 408,184 264,308 60.05 38.24 98.29 61.51 32.74 94.25 62.18 40.26 102.45 61.25 37.08 98.33Palouse 201,168 135,201 75,073 62.61 35.56 98.18 62.72 29.16 91.88 67.21 37.32 104.53 64.18 34.01 98.19Garfield 131,427 94,689 43,654 73.32 27.51 100.83 71.36 22.45 93.81 72.05 33.22 105.26 72.24 27.72 99.97Steptoe 65,077 45,092 23,619 67.10 32.20 99.30 65.71 29.62 95.33 69.29 36.29 105.58 67.37 32.71 100.07Colton 229,770 147,459 88,199 63.85 35.42 99.27 61.80 28.48 90.27 64.18 38.39 102.56 63.28 34.09 97.37Endicott 177,881 111,193 73,622 60.65 36.84 97.49 58.08 34.17 92.25 62.51 41.39 103.90 60.42 37.46 97.88Rosalia 262,252 157,463 106,383 61.42 36.74 98.15 62.00 18.23 80.23 60.04 40.57 100.61 61.15 31.84 93.00St. John 330,636 210,515 127,470 60.48 36.07 96.55 64.56 30.54 95.10 63.67 38.55 102.22 62.90 35.05 97.96Oakesdale 259,791 164,235 107,617 61.25 38.43 99.68 59.41 21.91 81.32 63.22 41.42 104.64 61.29 33.92 95.21County Totals 6,064,953 3,698,362 2,480,792 59.79 38.72 98.51 60.29 31.95 92.24 60.98 40.90 101.88 60.35 37.19 97.54
Yakima Co.Union Gap 785,355 462,242 322,829 55.71 44.61 100.33 56.64 45.16 101.80 58.86 41.11 99.96 57.07 43.63 100.70Naches Valley 1,407,052 867,215 551,227 59.51 40.23 99.74 60.19 38.71 98.90 61.63 39.18 100.81 60.44 39.37 99.81Yakima 7,997,846 4,545,668 3,391,538 57.15 42.26 99.41 56.31 42.15 98.45 56.84 42.41 99.24 56.76 42.27 99.03East Valley 2,528,830 1,448,728 1,078,003 56.79 43.43 100.22 56.10 43.25 99.35 57.29 42.63 99.92 56.73 43.10 99.83Selah 2,706,072 1,492,323 1,190,710 55.04 44.14 99.17 55.55 43.30 98.85 55.15 44.00 99.15 55.24 43.81 99.06Mabton 318,144 186,789 128,693 59.20 39.39 98.59 61.85 39.51 101.36 58.71 40.45 99.16 59.92 39.78 99.70Grandview 1,354,800 710,721 524,383 52.82 37.43 90.24 53.48 37.25 90.73 52.46 38.71 91.17 52.92 37.79 90.71Sunnyside 2,235,001 1,310,392 907,194 58.84 40.39 99.23 58.43 40.60 99.02 58.63 40.59 99.22 58.63 40.53 99.16Toppenish 978,949 570,807 392,472 61.34 42.54 103.87 57.37 40.39 97.77 58.31 40.09 98.40 59.01 41.01 100.01Highland 817,037 457,894 358,170 57.02 42.74 99.76 59.92 40.30 100.21 56.04 43.84 99.88 57.66 42.29 99.95Granger 529,566 314,409 211,333 61.66 38.86 100.52 61.86 39.58 101.45 59.37 39.91 99.28 60.97 39.45 100.42Zillah 719,958 407,672 299,985 56.94 42.69 99.63 56.72 43.15 99.87 56.62 41.67 98.29 56.76 42.50 99.26Wapato 1,112,475 642,325 452,709 58.11 41.75 99.86 59.12 41.72 100.84 57.74 40.69 98.43 58.32 41.39 99.71West Valley 4,578,238 2,598,553 1,962,129 56.45 43.36 99.81 55.86 43.20 99.06 56.76 42.86 99.62 56.36 43.14 99.50Mount Adams 247,000 145,877 93,031 61.31 38.72 100.03 60.48 37.65 98.13 59.06 37.66 96.72 60.28 38.01 98.29County Totals 28,316,323 16,161,616 11,864,407 57.05 42.37 99.41 56.76 41.97 98.73 57.08 41.90 98.97 56.96 42.08 99.04
Except where otherwise noted, the School District & ESD Financial Reporting Summary for 2019–20 by Office of Superintendent of Public Instructions is licensed under a Creative Commons Attribution 4.0 International License.
264
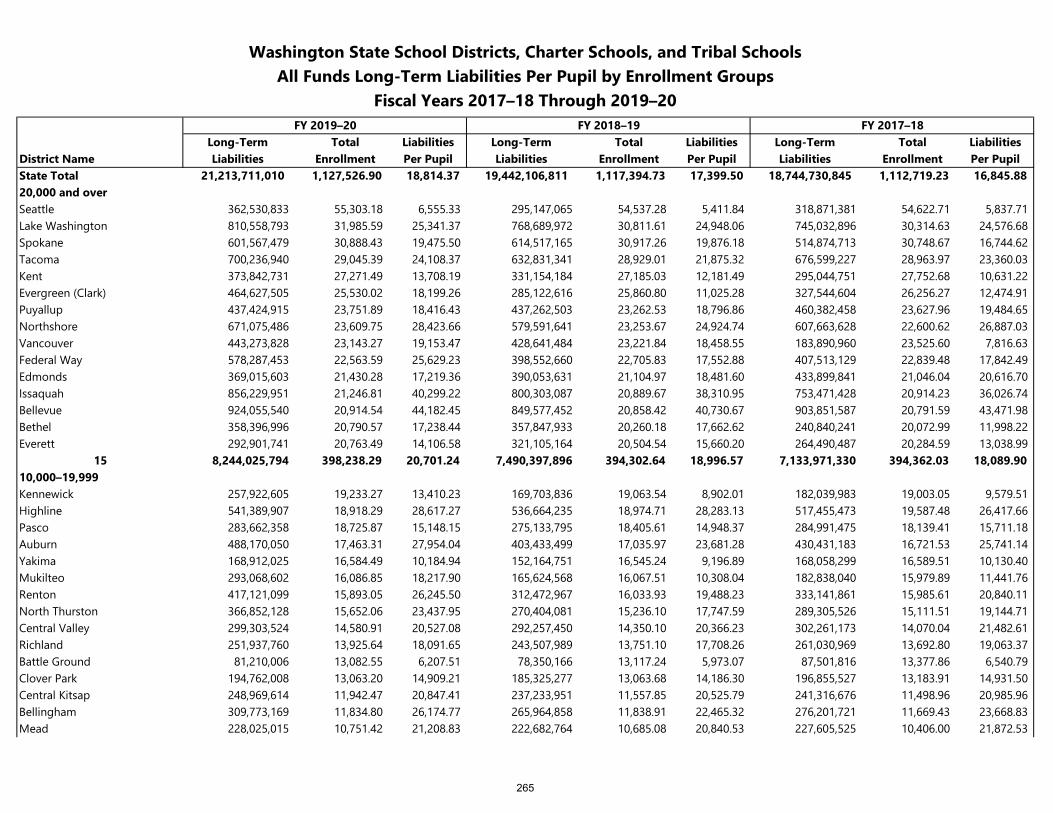
Washington State School Districts, Charter Schools, and Tribal SchoolsAll Funds Long-Term Liabilities Per Pupil by Enrollment Groups
Fiscal Years 2017–18 Through 2019–20FY 2019–20 FY 2018–19 FY 2017–18
Long-Term Total Liabilities Long-Term Total Liabilities Long-Term Total LiabilitiesDistrict Name Liabilities Enrollment Per Pupil Liabilities Enrollment Per Pupil Liabilities Enrollment Per PupilState Total 21,213,711,010 1,127,526.90 18,814.37 19,442,106,811 1,117,394.73 17,399.50 18,744,730,845 1,112,719.23 16,845.8820,000 and overSeattle 362,530,833 55,303.18 6,555.33 295,147,065 54,537.28 5,411.84 318,871,381 54,622.71 5,837.71Lake Washington 810,558,793 31,985.59 25,341.37 768,689,972 30,811.61 24,948.06 745,032,896 30,314.63 24,576.68Spokane 601,567,479 30,888.43 19,475.50 614,517,165 30,917.26 19,876.18 514,874,713 30,748.67 16,744.62Tacoma 700,236,940 29,045.39 24,108.37 632,831,341 28,929.01 21,875.32 676,599,227 28,963.97 23,360.03Kent 373,842,731 27,271.49 13,708.19 331,154,184 27,185.03 12,181.49 295,044,751 27,752.68 10,631.22Evergreen (Clark) 464,627,505 25,530.02 18,199.26 285,122,616 25,860.80 11,025.28 327,544,604 26,256.27 12,474.91Puyallup 437,424,915 23,751.89 18,416.43 437,262,503 23,262.53 18,796.86 460,382,458 23,627.96 19,484.65Northshore 671,075,486 23,609.75 28,423.66 579,591,641 23,253.67 24,924.74 607,663,628 22,600.62 26,887.03Vancouver 443,273,828 23,143.27 19,153.47 428,641,484 23,221.84 18,458.55 183,890,960 23,525.60 7,816.63Federal Way 578,287,453 22,563.59 25,629.23 398,552,660 22,705.83 17,552.88 407,513,129 22,839.48 17,842.49Edmonds 369,015,603 21,430.28 17,219.36 390,053,631 21,104.97 18,481.60 433,899,841 21,046.04 20,616.70Issaquah 856,229,951 21,246.81 40,299.22 800,303,087 20,889.67 38,310.95 753,471,428 20,914.23 36,026.74Bellevue 924,055,540 20,914.54 44,182.45 849,577,452 20,858.42 40,730.67 903,851,587 20,791.59 43,471.98Bethel 358,396,996 20,790.57 17,238.44 357,847,933 20,260.18 17,662.62 240,840,241 20,072.99 11,998.22Everett 292,901,741 20,763.49 14,106.58 321,105,164 20,504.54 15,660.20 264,490,487 20,284.59 13,038.99
15 8,244,025,794 398,238.29 20,701.24 7,490,397,896 394,302.64 18,996.57 7,133,971,330 394,362.03 18,089.9010,000–19,999Kennewick 257,922,605 19,233.27 13,410.23 169,703,836 19,063.54 8,902.01 182,039,983 19,003.05 9,579.51Highline 541,389,907 18,918.29 28,617.27 536,664,235 18,974.71 28,283.13 517,455,473 19,587.48 26,417.66Pasco 283,662,358 18,725.87 15,148.15 275,133,795 18,405.61 14,948.37 284,991,475 18,139.41 15,711.18Auburn 488,170,050 17,463.31 27,954.04 403,433,499 17,035.97 23,681.28 430,431,183 16,721.53 25,741.14Yakima 168,912,025 16,584.49 10,184.94 152,164,751 16,545.24 9,196.89 168,058,299 16,589.51 10,130.40Mukilteo 293,068,602 16,086.85 18,217.90 165,624,568 16,067.51 10,308.04 182,838,040 15,979.89 11,441.76Renton 417,121,099 15,893.05 26,245.50 312,472,967 16,033.93 19,488.23 333,141,861 15,985.61 20,840.11North Thurston 366,852,128 15,652.06 23,437.95 270,404,081 15,236.10 17,747.59 289,305,526 15,111.51 19,144.71Central Valley 299,303,524 14,580.91 20,527.08 292,257,450 14,350.10 20,366.23 302,261,173 14,070.04 21,482.61Richland 251,937,760 13,925.64 18,091.65 243,507,989 13,751.10 17,708.26 261,030,969 13,692.80 19,063.37Battle Ground 81,210,006 13,082.55 6,207.51 78,350,166 13,117.24 5,973.07 87,501,816 13,377.86 6,540.79Clover Park 194,762,008 13,063.20 14,909.21 185,325,277 13,063.68 14,186.30 196,855,527 13,183.91 14,931.50Central Kitsap 248,969,614 11,942.47 20,847.41 237,233,951 11,557.85 20,525.79 241,316,676 11,498.96 20,985.96Bellingham 309,773,169 11,834.80 26,174.77 265,964,858 11,838.91 22,465.32 276,201,721 11,669.43 23,668.83Mead 228,025,015 10,751.42 21,208.83 222,682,764 10,685.08 20,840.53 227,605,525 10,406.00 21,872.53
265
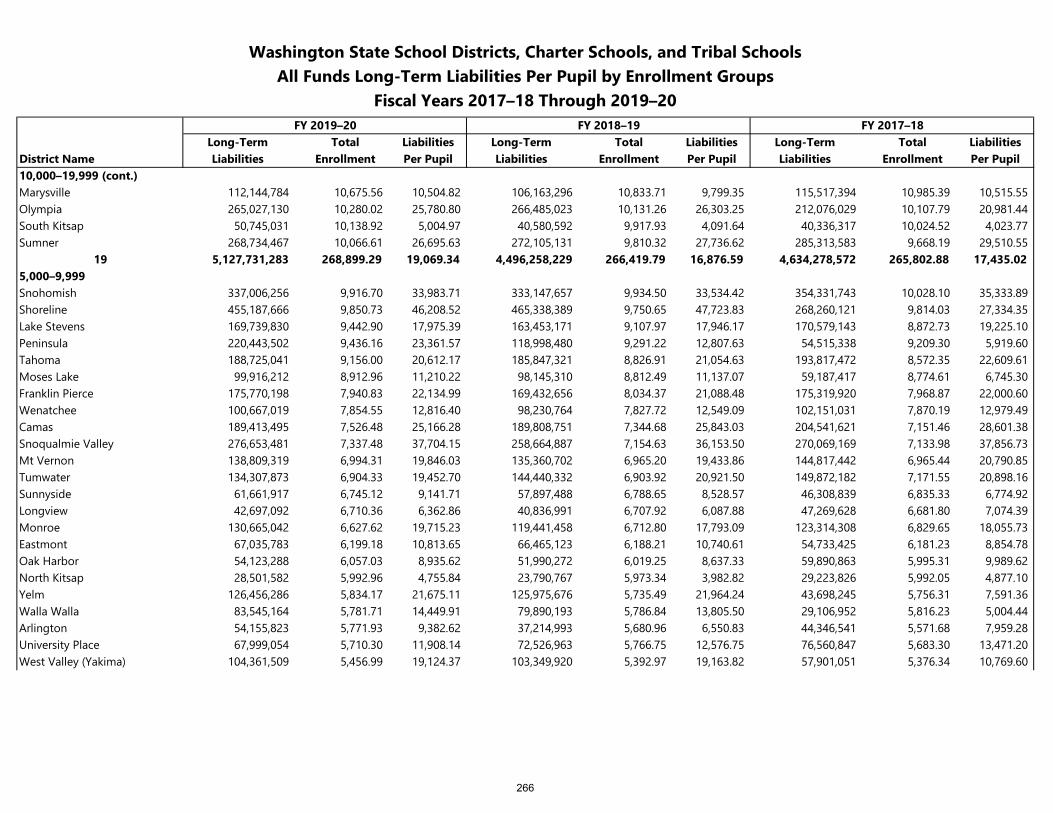
Washington State School Districts, Charter Schools, and Tribal SchoolsAll Funds Long-Term Liabilities Per Pupil by Enrollment Groups
Fiscal Years 2017–18 Through 2019–20FY 2019–20 FY 2018–19 FY 2017–18
Long-Term Total Liabilities Long-Term Total Liabilities Long-Term Total LiabilitiesDistrict Name Liabilities Enrollment Per Pupil Liabilities Enrollment Per Pupil Liabilities Enrollment Per Pupil10,000–19,999 (cont.)Marysville 112,144,784 10,675.56 10,504.82 106,163,296 10,833.71 9,799.35 115,517,394 10,985.39 10,515.55Olympia 265,027,130 10,280.02 25,780.80 266,485,023 10,131.26 26,303.25 212,076,029 10,107.79 20,981.44South Kitsap 50,745,031 10,138.92 5,004.97 40,580,592 9,917.93 4,091.64 40,336,317 10,024.52 4,023.77Sumner 268,734,467 10,066.61 26,695.63 272,105,131 9,810.32 27,736.62 285,313,583 9,668.19 29,510.55
19 5,127,731,283 268,899.29 19,069.34 4,496,258,229 266,419.79 16,876.59 4,634,278,572 265,802.88 17,435.025,000–9,999Snohomish 337,006,256 9,916.70 33,983.71 333,147,657 9,934.50 33,534.42 354,331,743 10,028.10 35,333.89Shoreline 455,187,666 9,850.73 46,208.52 465,338,389 9,750.65 47,723.83 268,260,121 9,814.03 27,334.35Lake Stevens 169,739,830 9,442.90 17,975.39 163,453,171 9,107.97 17,946.17 170,579,143 8,872.73 19,225.10Peninsula 220,443,502 9,436.16 23,361.57 118,998,480 9,291.22 12,807.63 54,515,338 9,209.30 5,919.60Tahoma 188,725,041 9,156.00 20,612.17 185,847,321 8,826.91 21,054.63 193,817,472 8,572.35 22,609.61Moses Lake 99,916,212 8,912.96 11,210.22 98,145,310 8,812.49 11,137.07 59,187,417 8,774.61 6,745.30Franklin Pierce 175,770,198 7,940.83 22,134.99 169,432,656 8,034.37 21,088.48 175,319,920 7,968.87 22,000.60Wenatchee 100,667,019 7,854.55 12,816.40 98,230,764 7,827.72 12,549.09 102,151,031 7,870.19 12,979.49Camas 189,413,495 7,526.48 25,166.28 189,808,751 7,344.68 25,843.03 204,541,621 7,151.46 28,601.38Snoqualmie Valley 276,653,481 7,337.48 37,704.15 258,664,887 7,154.63 36,153.50 270,069,169 7,133.98 37,856.73Mt Vernon 138,809,319 6,994.31 19,846.03 135,360,702 6,965.20 19,433.86 144,817,442 6,965.44 20,790.85Tumwater 134,307,873 6,904.33 19,452.70 144,440,332 6,903.92 20,921.50 149,872,182 7,171.55 20,898.16Sunnyside 61,661,917 6,745.12 9,141.71 57,897,488 6,788.65 8,528.57 46,308,839 6,835.33 6,774.92Longview 42,697,092 6,710.36 6,362.86 40,836,991 6,707.92 6,087.88 47,269,628 6,681.80 7,074.39Monroe 130,665,042 6,627.62 19,715.23 119,441,458 6,712.80 17,793.09 123,314,308 6,829.65 18,055.73Eastmont 67,035,783 6,199.18 10,813.65 66,465,123 6,188.21 10,740.61 54,733,425 6,181.23 8,854.78Oak Harbor 54,123,288 6,057.03 8,935.62 51,990,272 6,019.25 8,637.33 59,890,863 5,995.31 9,989.62North Kitsap 28,501,582 5,992.96 4,755.84 23,790,767 5,973.34 3,982.82 29,223,826 5,992.05 4,877.10Yelm 126,456,286 5,834.17 21,675.11 125,975,676 5,735.49 21,964.24 43,698,245 5,756.31 7,591.36Walla Walla 83,545,164 5,781.71 14,449.91 79,890,193 5,786.84 13,805.50 29,106,952 5,816.23 5,004.44Arlington 54,155,823 5,771.93 9,382.62 37,214,993 5,680.96 6,550.83 44,346,541 5,571.68 7,959.28University Place 67,999,054 5,710.30 11,908.14 72,526,963 5,766.75 12,576.75 76,560,847 5,683.30 13,471.20West Valley (Yakima) 104,361,509 5,456.99 19,124.37 103,349,920 5,392.97 19,163.82 57,901,051 5,376.34 10,769.60
266
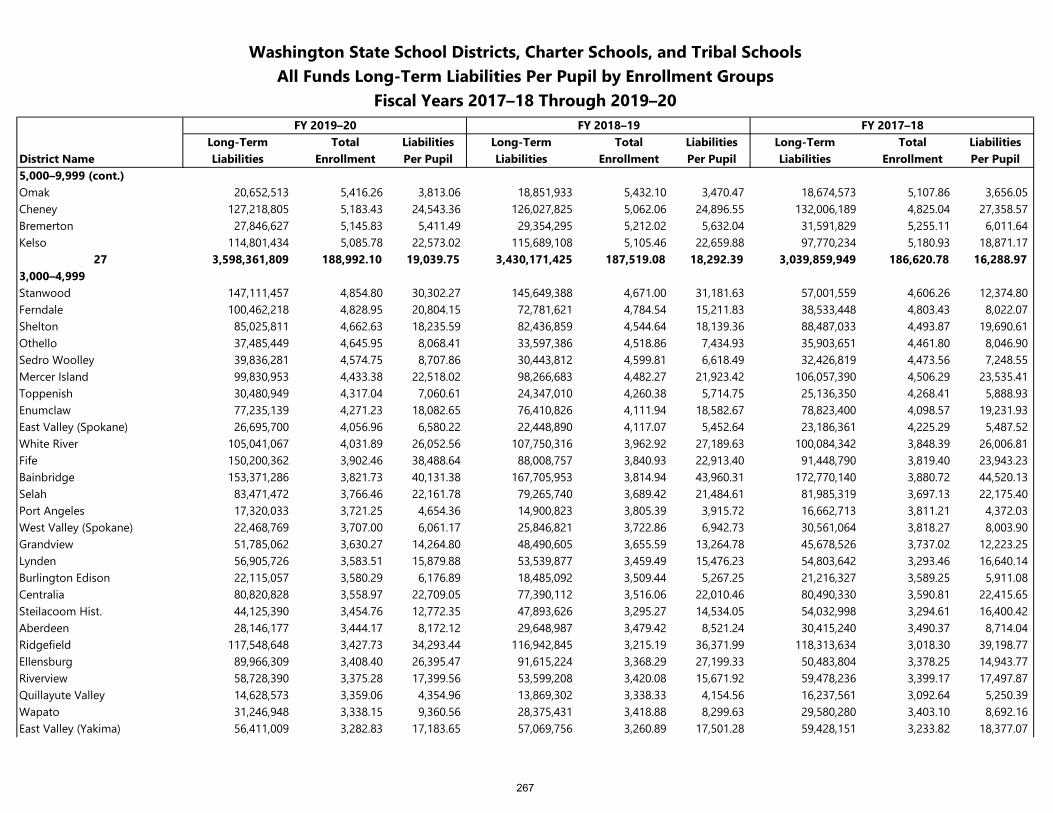
Washington State School Districts, Charter Schools, and Tribal SchoolsAll Funds Long-Term Liabilities Per Pupil by Enrollment Groups
Fiscal Years 2017–18 Through 2019–20FY 2019–20 FY 2018–19 FY 2017–18
Long-Term Total Liabilities Long-Term Total Liabilities Long-Term Total LiabilitiesDistrict Name Liabilities Enrollment Per Pupil Liabilities Enrollment Per Pupil Liabilities Enrollment Per Pupil5,000–9,999 (cont.)Omak 20,652,513 5,416.26 3,813.06 18,851,933 5,432.10 3,470.47 18,674,573 5,107.86 3,656.05Cheney 127,218,805 5,183.43 24,543.36 126,027,825 5,062.06 24,896.55 132,006,189 4,825.04 27,358.57Bremerton 27,846,627 5,145.83 5,411.49 29,354,295 5,212.02 5,632.04 31,591,829 5,255.11 6,011.64Kelso 114,801,434 5,085.78 22,573.02 115,689,108 5,105.46 22,659.88 97,770,234 5,180.93 18,871.17
27 3,598,361,809 188,992.10 19,039.75 3,430,171,425 187,519.08 18,292.39 3,039,859,949 186,620.78 16,288.973,000–4,999Stanwood 147,111,457 4,854.80 30,302.27 145,649,388 4,671.00 31,181.63 57,001,559 4,606.26 12,374.80Ferndale 100,462,218 4,828.95 20,804.15 72,781,621 4,784.54 15,211.83 38,533,448 4,803.43 8,022.07Shelton 85,025,811 4,662.63 18,235.59 82,436,859 4,544.64 18,139.36 88,487,033 4,493.87 19,690.61Othello 37,485,449 4,645.95 8,068.41 33,597,386 4,518.86 7,434.93 35,903,651 4,461.80 8,046.90Sedro Woolley 39,836,281 4,574.75 8,707.86 30,443,812 4,599.81 6,618.49 32,426,819 4,473.56 7,248.55Mercer Island 99,830,953 4,433.38 22,518.02 98,266,683 4,482.27 21,923.42 106,057,390 4,506.29 23,535.41Toppenish 30,480,949 4,317.04 7,060.61 24,347,010 4,260.38 5,714.75 25,136,350 4,268.41 5,888.93Enumclaw 77,235,139 4,271.23 18,082.65 76,410,826 4,111.94 18,582.67 78,823,400 4,098.57 19,231.93East Valley (Spokane) 26,695,700 4,056.96 6,580.22 22,448,890 4,117.07 5,452.64 23,186,361 4,225.29 5,487.52White River 105,041,067 4,031.89 26,052.56 107,750,316 3,962.92 27,189.63 100,084,342 3,848.39 26,006.81Fife 150,200,362 3,902.46 38,488.64 88,008,757 3,840.93 22,913.40 91,448,790 3,819.40 23,943.23Bainbridge 153,371,286 3,821.73 40,131.38 167,705,953 3,814.94 43,960.31 172,770,140 3,880.72 44,520.13Selah 83,471,472 3,766.46 22,161.78 79,265,740 3,689.42 21,484.61 81,985,319 3,697.13 22,175.40Port Angeles 17,320,033 3,721.25 4,654.36 14,900,823 3,805.39 3,915.72 16,662,713 3,811.21 4,372.03West Valley (Spokane) 22,468,769 3,707.00 6,061.17 25,846,821 3,722.86 6,942.73 30,561,064 3,818.27 8,003.90Grandview 51,785,062 3,630.27 14,264.80 48,490,605 3,655.59 13,264.78 45,678,526 3,737.02 12,223.25Lynden 56,905,726 3,583.51 15,879.88 53,539,877 3,459.49 15,476.23 54,803,642 3,293.46 16,640.14Burlington Edison 22,115,057 3,580.29 6,176.89 18,485,092 3,509.44 5,267.25 21,216,327 3,589.25 5,911.08Centralia 80,820,828 3,558.97 22,709.05 77,390,112 3,516.06 22,010.46 80,490,330 3,590.81 22,415.65Steilacoom Hist. 44,125,390 3,454.76 12,772.35 47,893,626 3,295.27 14,534.05 54,032,998 3,294.61 16,400.42Aberdeen 28,146,177 3,444.17 8,172.12 29,648,987 3,479.42 8,521.24 30,415,240 3,490.37 8,714.04Ridgefield 117,548,648 3,427.73 34,293.44 116,942,845 3,215.19 36,371.99 118,313,634 3,018.30 39,198.77Ellensburg 89,966,309 3,408.40 26,395.47 91,615,224 3,368.29 27,199.33 50,483,804 3,378.25 14,943.77Riverview 58,728,390 3,375.28 17,399.56 53,599,208 3,420.08 15,671.92 59,478,236 3,399.17 17,497.87Quillayute Valley 14,628,573 3,359.06 4,354.96 13,869,302 3,338.33 4,154.56 16,237,561 3,092.64 5,250.39Wapato 31,246,948 3,338.15 9,360.56 28,375,431 3,418.88 8,299.63 29,580,280 3,403.10 8,692.16East Valley (Yakima) 56,411,009 3,282.83 17,183.65 57,069,756 3,260.89 17,501.28 59,428,151 3,233.82 18,377.07
267
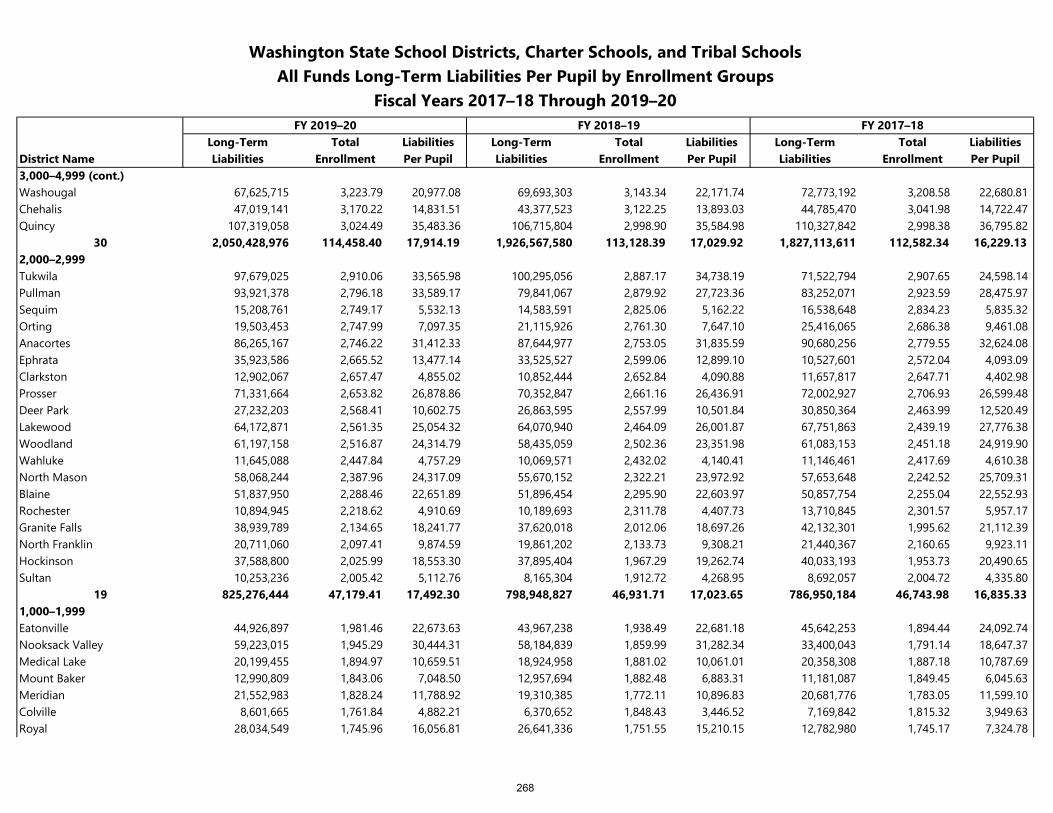
Washington State School Districts, Charter Schools, and Tribal SchoolsAll Funds Long-Term Liabilities Per Pupil by Enrollment Groups
Fiscal Years 2017–18 Through 2019–20FY 2019–20 FY 2018–19 FY 2017–18
Long-Term Total Liabilities Long-Term Total Liabilities Long-Term Total LiabilitiesDistrict Name Liabilities Enrollment Per Pupil Liabilities Enrollment Per Pupil Liabilities Enrollment Per Pupil3,000–4,999 (cont.)Washougal 67,625,715 3,223.79 20,977.08 69,693,303 3,143.34 22,171.74 72,773,192 3,208.58 22,680.81Chehalis 47,019,141 3,170.22 14,831.51 43,377,523 3,122.25 13,893.03 44,785,470 3,041.98 14,722.47Quincy 107,319,058 3,024.49 35,483.36 106,715,804 2,998.90 35,584.98 110,327,842 2,998.38 36,795.82
30 2,050,428,976 114,458.40 17,914.19 1,926,567,580 113,128.39 17,029.92 1,827,113,611 112,582.34 16,229.132,000–2,999Tukwila 97,679,025 2,910.06 33,565.98 100,295,056 2,887.17 34,738.19 71,522,794 2,907.65 24,598.14Pullman 93,921,378 2,796.18 33,589.17 79,841,067 2,879.92 27,723.36 83,252,071 2,923.59 28,475.97Sequim 15,208,761 2,749.17 5,532.13 14,583,591 2,825.06 5,162.22 16,538,648 2,834.23 5,835.32Orting 19,503,453 2,747.99 7,097.35 21,115,926 2,761.30 7,647.10 25,416,065 2,686.38 9,461.08Anacortes 86,265,167 2,746.22 31,412.33 87,644,977 2,753.05 31,835.59 90,680,256 2,779.55 32,624.08Ephrata 35,923,586 2,665.52 13,477.14 33,525,527 2,599.06 12,899.10 10,527,601 2,572.04 4,093.09Clarkston 12,902,067 2,657.47 4,855.02 10,852,444 2,652.84 4,090.88 11,657,817 2,647.71 4,402.98Prosser 71,331,664 2,653.82 26,878.86 70,352,847 2,661.16 26,436.91 72,002,927 2,706.93 26,599.48Deer Park 27,232,203 2,568.41 10,602.75 26,863,595 2,557.99 10,501.84 30,850,364 2,463.99 12,520.49Lakewood 64,172,871 2,561.35 25,054.32 64,070,940 2,464.09 26,001.87 67,751,863 2,439.19 27,776.38Woodland 61,197,158 2,516.87 24,314.79 58,435,059 2,502.36 23,351.98 61,083,153 2,451.18 24,919.90Wahluke 11,645,088 2,447.84 4,757.29 10,069,571 2,432.02 4,140.41 11,146,461 2,417.69 4,610.38North Mason 58,068,244 2,387.96 24,317.09 55,670,152 2,322.21 23,972.92 57,653,648 2,242.52 25,709.31Blaine 51,837,950 2,288.46 22,651.89 51,896,454 2,295.90 22,603.97 50,857,754 2,255.04 22,552.93Rochester 10,894,945 2,218.62 4,910.69 10,189,693 2,311.78 4,407.73 13,710,845 2,301.57 5,957.17Granite Falls 38,939,789 2,134.65 18,241.77 37,620,018 2,012.06 18,697.26 42,132,301 1,995.62 21,112.39North Franklin 20,711,060 2,097.41 9,874.59 19,861,202 2,133.73 9,308.21 21,440,367 2,160.65 9,923.11Hockinson 37,588,800 2,025.99 18,553.30 37,895,404 1,967.29 19,262.74 40,033,193 1,953.73 20,490.65Sultan 10,253,236 2,005.42 5,112.76 8,165,304 1,912.72 4,268.95 8,692,057 2,004.72 4,335.80
19 825,276,444 47,179.41 17,492.30 798,948,827 46,931.71 17,023.65 786,950,184 46,743.98 16,835.331,000–1,999Eatonville 44,926,897 1,981.46 22,673.63 43,967,238 1,938.49 22,681.18 45,642,253 1,894.44 24,092.74Nooksack Valley 59,223,015 1,945.29 30,444.31 58,184,839 1,859.99 31,282.34 33,400,043 1,791.14 18,647.37Medical Lake 20,199,455 1,894.97 10,659.51 18,924,958 1,881.02 10,061.01 20,358,308 1,887.18 10,787.69Mount Baker 12,990,809 1,843.06 7,048.50 12,957,694 1,882.48 6,883.31 11,181,087 1,849.45 6,045.63Meridian 21,552,983 1,828.24 11,788.92 19,310,385 1,772.11 10,896.83 20,681,776 1,783.05 11,599.10Colville 8,601,665 1,761.84 4,882.21 6,370,652 1,848.43 3,446.52 7,169,842 1,815.32 3,949.63Royal 28,034,549 1,745.96 16,056.81 26,641,336 1,751.55 15,210.15 12,782,980 1,745.17 7,324.78
268
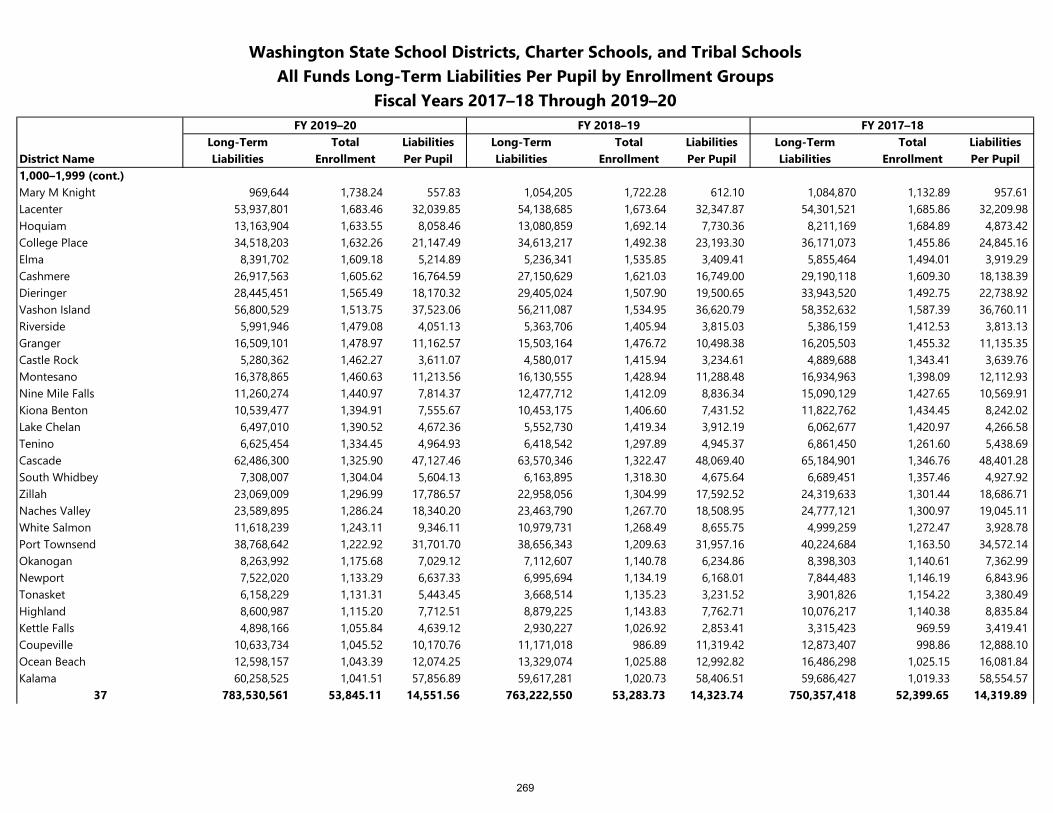
Washington State School Districts, Charter Schools, and Tribal SchoolsAll Funds Long-Term Liabilities Per Pupil by Enrollment Groups
Fiscal Years 2017–18 Through 2019–20FY 2019–20 FY 2018–19 FY 2017–18
Long-Term Total Liabilities Long-Term Total Liabilities Long-Term Total LiabilitiesDistrict Name Liabilities Enrollment Per Pupil Liabilities Enrollment Per Pupil Liabilities Enrollment Per Pupil1,000–1,999 (cont.)Mary M Knight 969,644 1,738.24 557.83 1,054,205 1,722.28 612.10 1,084,870 1,132.89 957.61Lacenter 53,937,801 1,683.46 32,039.85 54,138,685 1,673.64 32,347.87 54,301,521 1,685.86 32,209.98Hoquiam 13,163,904 1,633.55 8,058.46 13,080,859 1,692.14 7,730.36 8,211,169 1,684.89 4,873.42College Place 34,518,203 1,632.26 21,147.49 34,613,217 1,492.38 23,193.30 36,171,073 1,455.86 24,845.16Elma 8,391,702 1,609.18 5,214.89 5,236,341 1,535.85 3,409.41 5,855,464 1,494.01 3,919.29Cashmere 26,917,563 1,605.62 16,764.59 27,150,629 1,621.03 16,749.00 29,190,118 1,609.30 18,138.39Dieringer 28,445,451 1,565.49 18,170.32 29,405,024 1,507.90 19,500.65 33,943,520 1,492.75 22,738.92Vashon Island 56,800,529 1,513.75 37,523.06 56,211,087 1,534.95 36,620.79 58,352,632 1,587.39 36,760.11Riverside 5,991,946 1,479.08 4,051.13 5,363,706 1,405.94 3,815.03 5,386,159 1,412.53 3,813.13Granger 16,509,101 1,478.97 11,162.57 15,503,164 1,476.72 10,498.38 16,205,503 1,455.32 11,135.35Castle Rock 5,280,362 1,462.27 3,611.07 4,580,017 1,415.94 3,234.61 4,889,688 1,343.41 3,639.76Montesano 16,378,865 1,460.63 11,213.56 16,130,555 1,428.94 11,288.48 16,934,963 1,398.09 12,112.93Nine Mile Falls 11,260,274 1,440.97 7,814.37 12,477,712 1,412.09 8,836.34 15,090,129 1,427.65 10,569.91Kiona Benton 10,539,477 1,394.91 7,555.67 10,453,175 1,406.60 7,431.52 11,822,762 1,434.45 8,242.02Lake Chelan 6,497,010 1,390.52 4,672.36 5,552,730 1,419.34 3,912.19 6,062,677 1,420.97 4,266.58Tenino 6,625,454 1,334.45 4,964.93 6,418,542 1,297.89 4,945.37 6,861,450 1,261.60 5,438.69Cascade 62,486,300 1,325.90 47,127.46 63,570,346 1,322.47 48,069.40 65,184,901 1,346.76 48,401.28South Whidbey 7,308,007 1,304.04 5,604.13 6,163,895 1,318.30 4,675.64 6,689,451 1,357.46 4,927.92Zillah 23,069,009 1,296.99 17,786.57 22,958,056 1,304.99 17,592.52 24,319,633 1,301.44 18,686.71Naches Valley 23,589,895 1,286.24 18,340.20 23,463,790 1,267.70 18,508.95 24,777,121 1,300.97 19,045.11White Salmon 11,618,239 1,243.11 9,346.11 10,979,731 1,268.49 8,655.75 4,999,259 1,272.47 3,928.78Port Townsend 38,768,642 1,222.92 31,701.70 38,656,343 1,209.63 31,957.16 40,224,684 1,163.50 34,572.14Okanogan 8,263,992 1,175.68 7,029.12 7,112,607 1,140.78 6,234.86 8,398,303 1,140.61 7,362.99Newport 7,522,020 1,133.29 6,637.33 6,995,694 1,134.19 6,168.01 7,844,483 1,146.19 6,843.96Tonasket 6,158,229 1,131.31 5,443.45 3,668,514 1,135.23 3,231.52 3,901,826 1,154.22 3,380.49Highland 8,600,987 1,115.20 7,712.51 8,879,225 1,143.83 7,762.71 10,076,217 1,140.38 8,835.84Kettle Falls 4,898,166 1,055.84 4,639.12 2,930,227 1,026.92 2,853.41 3,315,423 969.59 3,419.41Coupeville 10,633,734 1,045.52 10,170.76 11,171,018 986.89 11,319.42 12,873,407 998.86 12,888.10Ocean Beach 12,598,157 1,043.39 12,074.25 13,329,074 1,025.88 12,992.82 16,486,298 1,025.15 16,081.84Kalama 60,258,525 1,041.51 57,856.89 59,617,281 1,020.73 58,406.51 59,686,427 1,019.33 58,554.57
37 783,530,561 53,845.11 14,551.56 763,222,550 53,283.73 14,323.74 750,357,418 52,399.65 14,319.89
269
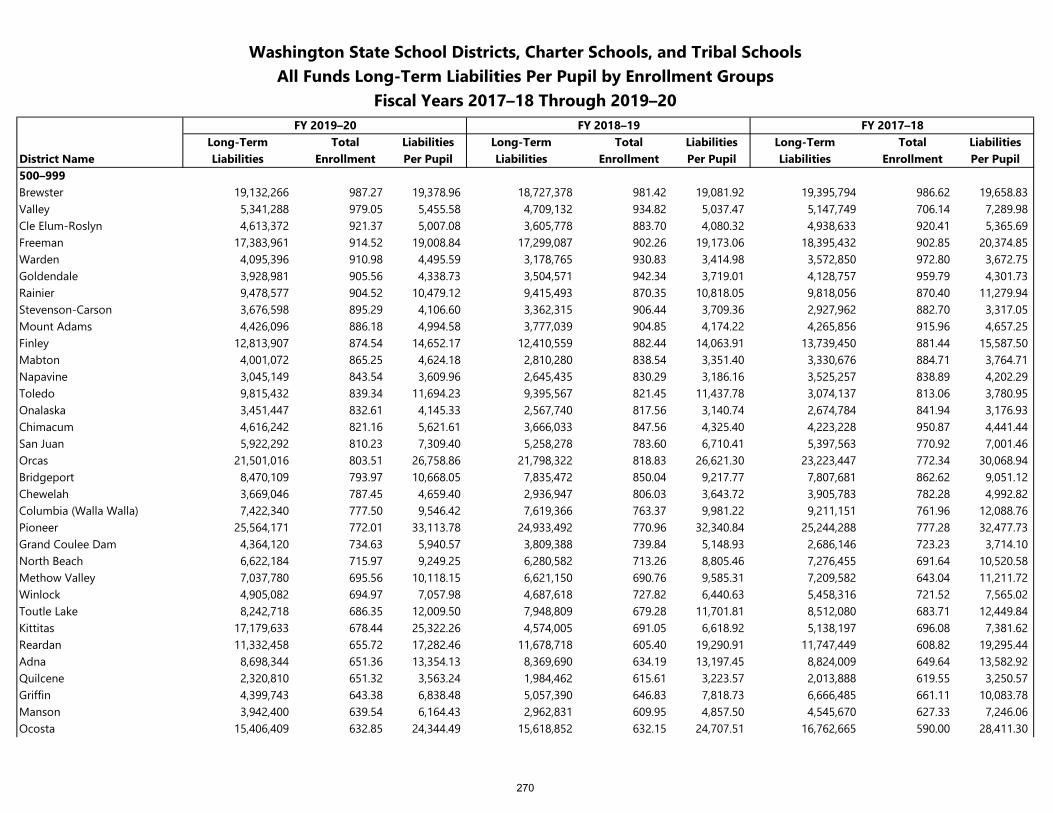
Washington State School Districts, Charter Schools, and Tribal SchoolsAll Funds Long-Term Liabilities Per Pupil by Enrollment Groups
Fiscal Years 2017–18 Through 2019–20FY 2019–20 FY 2018–19 FY 2017–18
Long-Term Total Liabilities Long-Term Total Liabilities Long-Term Total LiabilitiesDistrict Name Liabilities Enrollment Per Pupil Liabilities Enrollment Per Pupil Liabilities Enrollment Per Pupil500–999Brewster 19,132,266 987.27 19,378.96 18,727,378 981.42 19,081.92 19,395,794 986.62 19,658.83Valley 5,341,288 979.05 5,455.58 4,709,132 934.82 5,037.47 5,147,749 706.14 7,289.98Cle Elum-Roslyn 4,613,372 921.37 5,007.08 3,605,778 883.70 4,080.32 4,938,633 920.41 5,365.69Freeman 17,383,961 914.52 19,008.84 17,299,087 902.26 19,173.06 18,395,432 902.85 20,374.85Warden 4,095,396 910.98 4,495.59 3,178,765 930.83 3,414.98 3,572,850 972.80 3,672.75Goldendale 3,928,981 905.56 4,338.73 3,504,571 942.34 3,719.01 4,128,757 959.79 4,301.73Rainier 9,478,577 904.52 10,479.12 9,415,493 870.35 10,818.05 9,818,056 870.40 11,279.94Stevenson-Carson 3,676,598 895.29 4,106.60 3,362,315 906.44 3,709.36 2,927,962 882.70 3,317.05Mount Adams 4,426,096 886.18 4,994.58 3,777,039 904.85 4,174.22 4,265,856 915.96 4,657.25Finley 12,813,907 874.54 14,652.17 12,410,559 882.44 14,063.91 13,739,450 881.44 15,587.50Mabton 4,001,072 865.25 4,624.18 2,810,280 838.54 3,351.40 3,330,676 884.71 3,764.71Napavine 3,045,149 843.54 3,609.96 2,645,435 830.29 3,186.16 3,525,257 838.89 4,202.29Toledo 9,815,432 839.34 11,694.23 9,395,567 821.45 11,437.78 3,074,137 813.06 3,780.95Onalaska 3,451,447 832.61 4,145.33 2,567,740 817.56 3,140.74 2,674,784 841.94 3,176.93Chimacum 4,616,242 821.16 5,621.61 3,666,033 847.56 4,325.40 4,223,228 950.87 4,441.44San Juan 5,922,292 810.23 7,309.40 5,258,278 783.60 6,710.41 5,397,563 770.92 7,001.46Orcas 21,501,016 803.51 26,758.86 21,798,322 818.83 26,621.30 23,223,447 772.34 30,068.94Bridgeport 8,470,109 793.97 10,668.05 7,835,472 850.04 9,217.77 7,807,681 862.62 9,051.12Chewelah 3,669,046 787.45 4,659.40 2,936,947 806.03 3,643.72 3,905,783 782.28 4,992.82Columbia (Walla Walla) 7,422,340 777.50 9,546.42 7,619,366 763.37 9,981.22 9,211,151 761.96 12,088.76Pioneer 25,564,171 772.01 33,113.78 24,933,492 770.96 32,340.84 25,244,288 777.28 32,477.73Grand Coulee Dam 4,364,120 734.63 5,940.57 3,809,388 739.84 5,148.93 2,686,146 723.23 3,714.10North Beach 6,622,184 715.97 9,249.25 6,280,582 713.26 8,805.46 7,276,455 691.64 10,520.58Methow Valley 7,037,780 695.56 10,118.15 6,621,150 690.76 9,585.31 7,209,582 643.04 11,211.72Winlock 4,905,082 694.97 7,057.98 4,687,618 727.82 6,440.63 5,458,316 721.52 7,565.02Toutle Lake 8,242,718 686.35 12,009.50 7,948,809 679.28 11,701.81 8,512,080 683.71 12,449.84Kittitas 17,179,633 678.44 25,322.26 4,574,005 691.05 6,618.92 5,138,197 696.08 7,381.62Reardan 11,332,458 655.72 17,282.46 11,678,718 605.40 19,290.91 11,747,449 608.82 19,295.44Adna 8,698,344 651.36 13,354.13 8,369,690 634.19 13,197.45 8,824,009 649.64 13,582.92Quilcene 2,320,810 651.32 3,563.24 1,984,462 615.61 3,223.57 2,013,888 619.55 3,250.57Griffin 4,399,743 643.38 6,838.48 5,057,390 646.83 7,818.73 6,666,485 661.11 10,083.78Manson 3,942,400 639.54 6,164.43 2,962,831 609.95 4,857.50 4,545,670 627.33 7,246.06Ocosta 15,406,409 632.85 24,344.49 15,618,852 632.15 24,707.51 16,762,665 590.00 28,411.30
270
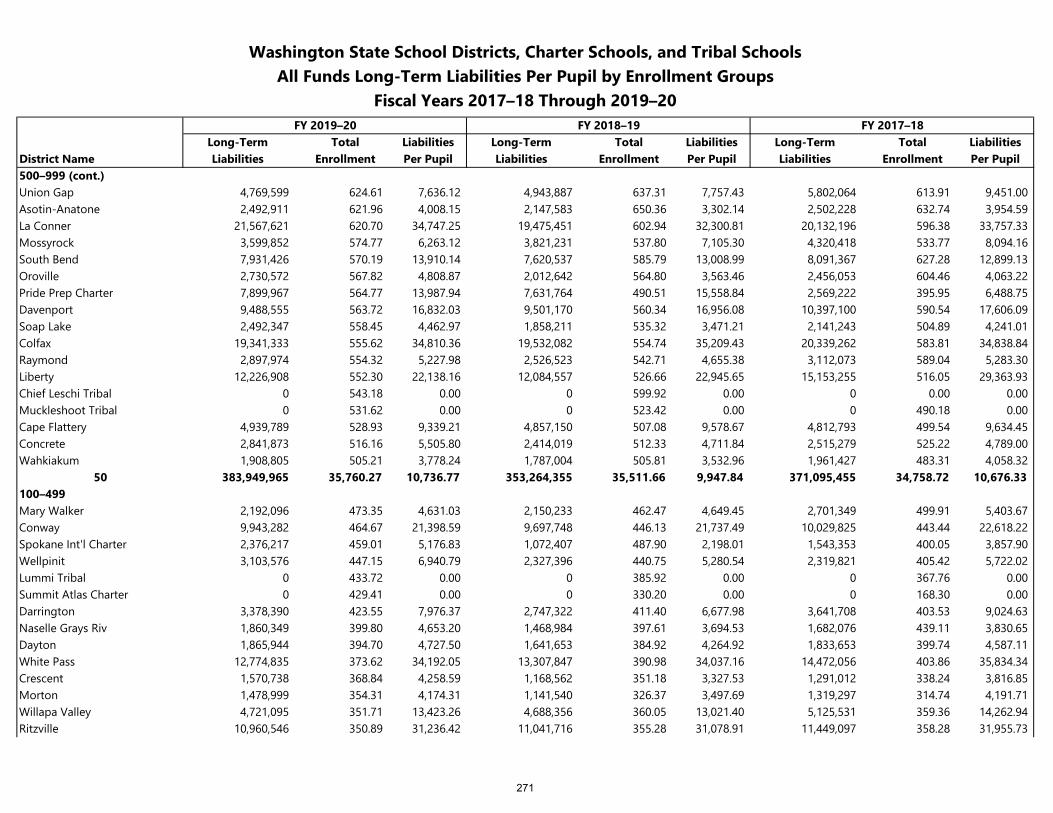
Washington State School Districts, Charter Schools, and Tribal SchoolsAll Funds Long-Term Liabilities Per Pupil by Enrollment Groups
Fiscal Years 2017–18 Through 2019–20FY 2019–20 FY 2018–19 FY 2017–18
Long-Term Total Liabilities Long-Term Total Liabilities Long-Term Total LiabilitiesDistrict Name Liabilities Enrollment Per Pupil Liabilities Enrollment Per Pupil Liabilities Enrollment Per Pupil500–999 (cont.)Union Gap 4,769,599 624.61 7,636.12 4,943,887 637.31 7,757.43 5,802,064 613.91 9,451.00Asotin-Anatone 2,492,911 621.96 4,008.15 2,147,583 650.36 3,302.14 2,502,228 632.74 3,954.59La Conner 21,567,621 620.70 34,747.25 19,475,451 602.94 32,300.81 20,132,196 596.38 33,757.33Mossyrock 3,599,852 574.77 6,263.12 3,821,231 537.80 7,105.30 4,320,418 533.77 8,094.16South Bend 7,931,426 570.19 13,910.14 7,620,537 585.79 13,008.99 8,091,367 627.28 12,899.13Oroville 2,730,572 567.82 4,808.87 2,012,642 564.80 3,563.46 2,456,053 604.46 4,063.22Pride Prep Charter 7,899,967 564.77 13,987.94 7,631,764 490.51 15,558.84 2,569,222 395.95 6,488.75Davenport 9,488,555 563.72 16,832.03 9,501,170 560.34 16,956.08 10,397,100 590.54 17,606.09Soap Lake 2,492,347 558.45 4,462.97 1,858,211 535.32 3,471.21 2,141,243 504.89 4,241.01Colfax 19,341,333 555.62 34,810.36 19,532,082 554.74 35,209.43 20,339,262 583.81 34,838.84Raymond 2,897,974 554.32 5,227.98 2,526,523 542.71 4,655.38 3,112,073 589.04 5,283.30Liberty 12,226,908 552.30 22,138.16 12,084,557 526.66 22,945.65 15,153,255 516.05 29,363.93Chief Leschi Tribal 0 543.18 0.00 0 599.92 0.00 0 0.00 0.00Muckleshoot Tribal 0 531.62 0.00 0 523.42 0.00 0 490.18 0.00Cape Flattery 4,939,789 528.93 9,339.21 4,857,150 507.08 9,578.67 4,812,793 499.54 9,634.45Concrete 2,841,873 516.16 5,505.80 2,414,019 512.33 4,711.84 2,515,279 525.22 4,789.00Wahkiakum 1,908,805 505.21 3,778.24 1,787,004 505.81 3,532.96 1,961,427 483.31 4,058.32
50 383,949,965 35,760.27 10,736.77 353,264,355 35,511.66 9,947.84 371,095,455 34,758.72 10,676.33100–499Mary Walker 2,192,096 473.35 4,631.03 2,150,233 462.47 4,649.45 2,701,349 499.91 5,403.67Conway 9,943,282 464.67 21,398.59 9,697,748 446.13 21,737.49 10,029,825 443.44 22,618.22Spokane Int'l Charter 2,376,217 459.01 5,176.83 1,072,407 487.90 2,198.01 1,543,353 400.05 3,857.90Wellpinit 3,103,576 447.15 6,940.79 2,327,396 440.75 5,280.54 2,319,821 405.42 5,722.02Lummi Tribal 0 433.72 0.00 0 385.92 0.00 0 367.76 0.00Summit Atlas Charter 0 429.41 0.00 0 330.20 0.00 0 168.30 0.00Darrington 3,378,390 423.55 7,976.37 2,747,322 411.40 6,677.98 3,641,708 403.53 9,024.63Naselle Grays Riv 1,860,349 399.80 4,653.20 1,468,984 397.61 3,694.53 1,682,076 439.11 3,830.65Dayton 1,865,944 394.70 4,727.50 1,641,653 384.92 4,264.92 1,833,653 399.74 4,587.11White Pass 12,774,835 373.62 34,192.05 13,307,847 390.98 34,037.16 14,472,056 403.86 35,834.34Crescent 1,570,738 368.84 4,258.59 1,168,562 351.18 3,327.53 1,291,012 338.24 3,816.85Morton 1,478,999 354.31 4,174.31 1,141,540 326.37 3,497.69 1,319,297 314.74 4,191.71Willapa Valley 4,721,095 351.71 13,423.26 4,688,356 360.05 13,021.40 5,125,531 359.36 14,262.94Ritzville 10,960,546 350.89 31,236.42 11,041,716 355.28 31,078.91 11,449,097 358.28 31,955.73
271

Washington State School Districts, Charter Schools, and Tribal SchoolsAll Funds Long-Term Liabilities Per Pupil by Enrollment Groups
Fiscal Years 2017–18 Through 2019–20FY 2019–20 FY 2018–19 FY 2017–18
Long-Term Total Liabilities Long-Term Total Liabilities Long-Term Total LiabilitiesDistrict Name Liabilities Enrollment Per Pupil Liabilities Enrollment Per Pupil Liabilities Enrollment Per Pupil100–499 (cont.)Rainier Prep Charter 1,075,572 345.20 3,115.79 905,059 333.50 2,713.82 893,469 327.90 2,724.82Republic 1,576,525 339.03 4,650.11 1,394,288 347.38 4,013.72 1,499,081 362.23 4,138.48Mc Cleary 4,965,832 329.32 15,079.05 4,939,516 309.30 15,969.98 5,474,904 320.66 17,073.86Summit Sierra Charter 0 323.18 0.00 2,340,435 378.38 6,185.41 1,903,370 295.58 6,439.44Hood Canal 3,345,207 319.46 10,471.44 3,733,633 302.76 12,331.99 4,689,756 311.38 15,061.20Pomeroy 3,792,688 316.67 11,976.78 3,874,401 331.78 11,677.62 4,537,496 329.87 13,755.41Entiat 10,539,079 312.91 33,680.86 5,416,174 319.31 16,962.12 5,944,801 313.30 18,974.79Pateros 2,611,135 310.86 8,399.71 1,818,187 313.83 5,793.54 2,164,956 319.83 6,769.08Oakville 6,150,217 288.56 21,313.48 1,067,595 239.15 4,464.12 1,204,552 241.17 4,994.62Selkirk 1,374,265 274.10 5,013.74 1,008,042 273.87 3,680.73 1,434,305 251.52 5,702.55Waitsburg 4,664,706 272.90 17,093.10 4,493,144 279.96 16,049.24 4,812,545 278.93 17,253.59Impact Charter 0 271.81 0.00 934,628 177.50 5,265.51 0 0.00 0.00Pe Ell 2,599,934 267.86 9,706.32 2,475,445 269.16 9,196.93 2,744,806 258.99 10,598.11Waterville 1,278,138 261.20 4,893.33 962,709 277.90 3,464.23 1,263,215 280.65 4,501.03Prescott 3,427,121 253.95 13,495.26 3,463,946 263.94 13,123.99 3,969,142 256.07 15,500.22Cusick 1,460,909 250.99 5,820.59 1,047,948 247.93 4,226.79 1,381,059 247.21 5,586.58Curlew 1,116,722 249.31 4,479.25 734,371 245.28 2,994.01 813,169 211.88 3,837.87Lopez 9,566,113 243.59 39,271.37 9,589,145 234.41 40,907.58 11,167,522 245.61 45,468.52Lyle 1,049,408 242.80 4,322.11 1,062,152 245.25 4,330.90 1,236,851 243.89 5,071.35Green Dot Seattle Charter 10,854 237.78 45.65 10,598 250.00 42.39 10,781 104.90 102.78Odessa 1,420,639 230.78 6,155.81 1,099,488 250.99 4,380.61 1,261,204 247.67 5,092.28Thorp 1,375,337 230.18 5,975.05 1,030,476 196.62 5,240.95 1,078,590 176.35 6,116.19Loon Lake 1,240,242 228.78 5,421.11 1,248,596 220.40 5,665.14 478,962 214.86 2,229.18Wilbur 1,297,424 226.43 5,729.91 1,117,963 244.28 4,576.56 1,316,958 259.51 5,074.79Trout Lake 1,191,600 225.30 5,288.95 1,037,812 232.41 4,465.43 1,208,630 240.68 5,021.73Touchet 7,473,120 223.67 33,411.37 7,776,097 216.62 35,897.41 8,160,442 206.21 39,573.46Coulee/Hartline 890,879 221.65 4,019.31 718,540 206.55 3,478.77 868,177 201.57 4,307.07Inchelium 1,431,609 216.75 6,604.88 1,073,366 214.90 4,994.72 1,347,296 219.73 6,131.60Northport 1,679,361 215.94 7,776.98 1,594,463 228.41 6,980.70 1,643,065 235.04 6,990.57Grapeview 11,274,921 208.15 54,167.29 11,353,589 217.97 52,087.85 11,777,131 220.67 53,369.88Tekoa 1,067,627 202.77 5,265.21 946,420 200.80 4,713.25 1,066,006 198.71 5,364.63Southside 1,791,572 202.11 8,864.34 1,801,092 214.50 8,396.70 2,186,799 215.50 10,147.56Quinault 1,167,443 199.00 5,866.55 1,021,536 178.21 5,732.20 1,284,326 171.40 7,493.15
272
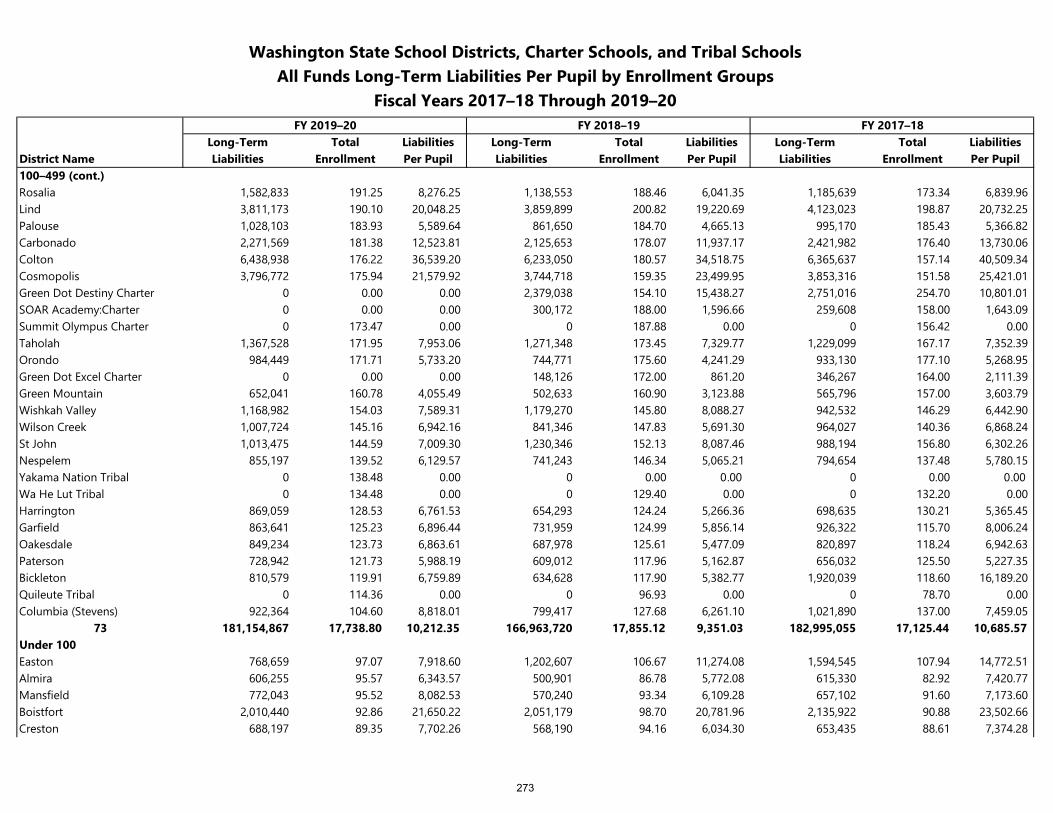
Washington State School Districts, Charter Schools, and Tribal SchoolsAll Funds Long-Term Liabilities Per Pupil by Enrollment Groups
Fiscal Years 2017–18 Through 2019–20FY 2019–20 FY 2018–19 FY 2017–18
Long-Term Total Liabilities Long-Term Total Liabilities Long-Term Total LiabilitiesDistrict Name Liabilities Enrollment Per Pupil Liabilities Enrollment Per Pupil Liabilities Enrollment Per Pupil100–499 (cont.)Rosalia 1,582,833 191.25 8,276.25 1,138,553 188.46 6,041.35 1,185,639 173.34 6,839.96Lind 3,811,173 190.10 20,048.25 3,859,899 200.82 19,220.69 4,123,023 198.87 20,732.25Palouse 1,028,103 183.93 5,589.64 861,650 184.70 4,665.13 995,170 185.43 5,366.82Carbonado 2,271,569 181.38 12,523.81 2,125,653 178.07 11,937.17 2,421,982 176.40 13,730.06Colton 6,438,938 176.22 36,539.20 6,233,050 180.57 34,518.75 6,365,637 157.14 40,509.34Cosmopolis 3,796,772 175.94 21,579.92 3,744,718 159.35 23,499.95 3,853,316 151.58 25,421.01Green Dot Destiny Charter 0 0.00 0.00 2,379,038 154.10 15,438.27 2,751,016 254.70 10,801.01SOAR Academy:Charter 0 0.00 0.00 300,172 188.00 1,596.66 259,608 158.00 1,643.09Summit Olympus Charter 0 173.47 0.00 0 187.88 0.00 0 156.42 0.00Taholah 1,367,528 171.95 7,953.06 1,271,348 173.45 7,329.77 1,229,099 167.17 7,352.39Orondo 984,449 171.71 5,733.20 744,771 175.60 4,241.29 933,130 177.10 5,268.95Green Dot Excel Charter 0 0.00 0.00 148,126 172.00 861.20 346,267 164.00 2,111.39Green Mountain 652,041 160.78 4,055.49 502,633 160.90 3,123.88 565,796 157.00 3,603.79Wishkah Valley 1,168,982 154.03 7,589.31 1,179,270 145.80 8,088.27 942,532 146.29 6,442.90Wilson Creek 1,007,724 145.16 6,942.16 841,346 147.83 5,691.30 964,027 140.36 6,868.24St John 1,013,475 144.59 7,009.30 1,230,346 152.13 8,087.46 988,194 156.80 6,302.26Nespelem 855,197 139.52 6,129.57 741,243 146.34 5,065.21 794,654 137.48 5,780.15Yakama Nation Tribal 0 138.48 0.00 0 0.00 0.00 0 0.00 0.00Wa He Lut Tribal 0 134.48 0.00 0 129.40 0.00 0 132.20 0.00Harrington 869,059 128.53 6,761.53 654,293 124.24 5,266.36 698,635 130.21 5,365.45Garfield 863,641 125.23 6,896.44 731,959 124.99 5,856.14 926,322 115.70 8,006.24Oakesdale 849,234 123.73 6,863.61 687,978 125.61 5,477.09 820,897 118.24 6,942.63Paterson 728,942 121.73 5,988.19 609,012 117.96 5,162.87 656,032 125.50 5,227.35Bickleton 810,579 119.91 6,759.89 634,628 117.90 5,382.77 1,920,039 118.60 16,189.20Quileute Tribal 0 114.36 0.00 0 96.93 0.00 0 78.70 0.00Columbia (Stevens) 922,364 104.60 8,818.01 799,417 127.68 6,261.10 1,021,890 137.00 7,459.05
73 181,154,867 17,738.80 10,212.35 166,963,720 17,855.12 9,351.03 182,995,055 17,125.44 10,685.57Under 100Easton 768,659 97.07 7,918.60 1,202,607 106.67 11,274.08 1,594,545 107.94 14,772.51Almira 606,255 95.57 6,343.57 500,901 86.78 5,772.08 615,330 82.92 7,420.77Mansfield 772,043 95.52 8,082.53 570,240 93.34 6,109.28 657,102 91.60 7,173.60Boistfort 2,010,440 92.86 21,650.22 2,051,179 98.70 20,781.96 2,135,922 90.88 23,502.66Creston 688,197 89.35 7,702.26 568,190 94.16 6,034.30 653,435 88.61 7,374.28
273
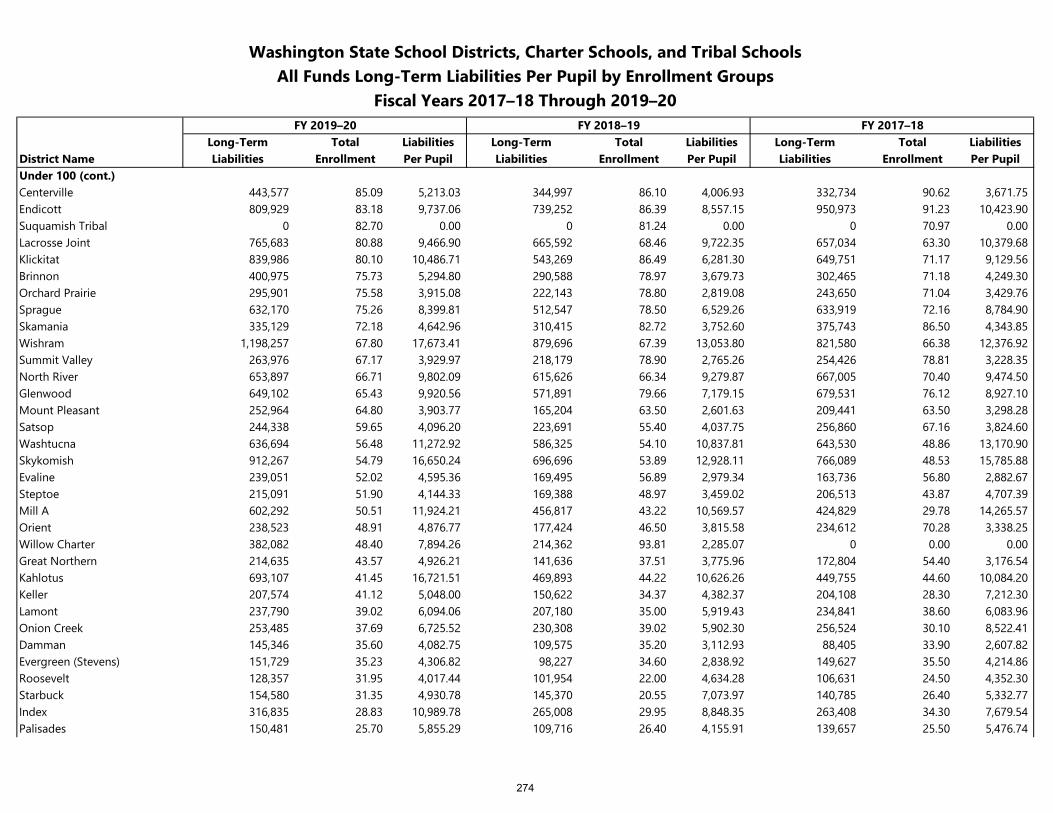
Washington State School Districts, Charter Schools, and Tribal SchoolsAll Funds Long-Term Liabilities Per Pupil by Enrollment Groups
Fiscal Years 2017–18 Through 2019–20FY 2019–20 FY 2018–19 FY 2017–18
Long-Term Total Liabilities Long-Term Total Liabilities Long-Term Total LiabilitiesDistrict Name Liabilities Enrollment Per Pupil Liabilities Enrollment Per Pupil Liabilities Enrollment Per PupilUnder 100 (cont.)Centerville 443,577 85.09 5,213.03 344,997 86.10 4,006.93 332,734 90.62 3,671.75Endicott 809,929 83.18 9,737.06 739,252 86.39 8,557.15 950,973 91.23 10,423.90Suquamish Tribal 0 82.70 0.00 0 81.24 0.00 0 70.97 0.00Lacrosse Joint 765,683 80.88 9,466.90 665,592 68.46 9,722.35 657,034 63.30 10,379.68Klickitat 839,986 80.10 10,486.71 543,269 86.49 6,281.30 649,751 71.17 9,129.56Brinnon 400,975 75.73 5,294.80 290,588 78.97 3,679.73 302,465 71.18 4,249.30Orchard Prairie 295,901 75.58 3,915.08 222,143 78.80 2,819.08 243,650 71.04 3,429.76Sprague 632,170 75.26 8,399.81 512,547 78.50 6,529.26 633,919 72.16 8,784.90Skamania 335,129 72.18 4,642.96 310,415 82.72 3,752.60 375,743 86.50 4,343.85Wishram 1,198,257 67.80 17,673.41 879,696 67.39 13,053.80 821,580 66.38 12,376.92Summit Valley 263,976 67.17 3,929.97 218,179 78.90 2,765.26 254,426 78.81 3,228.35North River 653,897 66.71 9,802.09 615,626 66.34 9,279.87 667,005 70.40 9,474.50Glenwood 649,102 65.43 9,920.56 571,891 79.66 7,179.15 679,531 76.12 8,927.10Mount Pleasant 252,964 64.80 3,903.77 165,204 63.50 2,601.63 209,441 63.50 3,298.28Satsop 244,338 59.65 4,096.20 223,691 55.40 4,037.75 256,860 67.16 3,824.60Washtucna 636,694 56.48 11,272.92 586,325 54.10 10,837.81 643,530 48.86 13,170.90Skykomish 912,267 54.79 16,650.24 696,696 53.89 12,928.11 766,089 48.53 15,785.88Evaline 239,051 52.02 4,595.36 169,495 56.89 2,979.34 163,736 56.80 2,882.67Steptoe 215,091 51.90 4,144.33 169,388 48.97 3,459.02 206,513 43.87 4,707.39Mill A 602,292 50.51 11,924.21 456,817 43.22 10,569.57 424,829 29.78 14,265.57Orient 238,523 48.91 4,876.77 177,424 46.50 3,815.58 234,612 70.28 3,338.25Willow Charter 382,082 48.40 7,894.26 214,362 93.81 2,285.07 0 0.00 0.00Great Northern 214,635 43.57 4,926.21 141,636 37.51 3,775.96 172,804 54.40 3,176.54Kahlotus 693,107 41.45 16,721.51 469,893 44.22 10,626.26 449,755 44.60 10,084.20Keller 207,574 41.12 5,048.00 150,622 34.37 4,382.37 204,108 28.30 7,212.30Lamont 237,790 39.02 6,094.06 207,180 35.00 5,919.43 234,841 38.60 6,083.96Onion Creek 253,485 37.69 6,725.52 230,308 39.02 5,902.30 256,524 30.10 8,522.41Damman 145,346 35.60 4,082.75 109,575 35.20 3,112.93 88,405 33.90 2,607.82Evergreen (Stevens) 151,729 35.23 4,306.82 98,227 34.60 2,838.92 149,627 35.50 4,214.86Roosevelt 128,357 31.95 4,017.44 101,954 22.00 4,634.28 106,631 24.50 4,352.30Starbuck 154,580 31.35 4,930.78 145,370 20.55 7,073.97 140,785 26.40 5,332.77Index 316,835 28.83 10,989.78 265,008 29.95 8,848.35 263,408 34.30 7,679.54Palisades 150,481 25.70 5,855.29 109,716 26.40 4,155.91 139,657 25.50 5,476.74
274
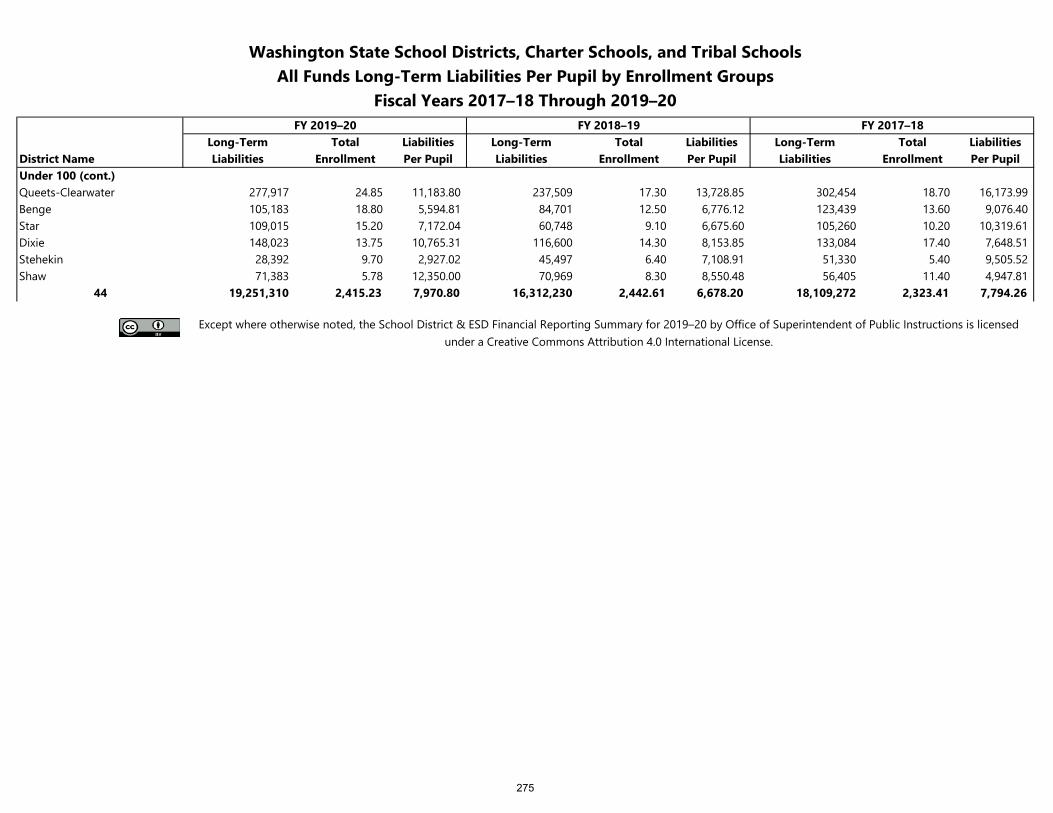
Washington State School Districts, Charter Schools, and Tribal SchoolsAll Funds Long-Term Liabilities Per Pupil by Enrollment Groups
Fiscal Years 2017–18 Through 2019–20FY 2019–20 FY 2018–19 FY 2017–18
Long-Term Total Liabilities Long-Term Total Liabilities Long-Term Total LiabilitiesDistrict Name Liabilities Enrollment Per Pupil Liabilities Enrollment Per Pupil Liabilities Enrollment Per PupilUnder 100 (cont.)Queets-Clearwater 277,917 24.85 11,183.80 237,509 17.30 13,728.85 302,454 18.70 16,173.99Benge 105,183 18.80 5,594.81 84,701 12.50 6,776.12 123,439 13.60 9,076.40Star 109,015 15.20 7,172.04 60,748 9.10 6,675.60 105,260 10.20 10,319.61Dixie 148,023 13.75 10,765.31 116,600 14.30 8,153.85 133,084 17.40 7,648.51Stehekin 28,392 9.70 2,927.02 45,497 6.40 7,108.91 51,330 5.40 9,505.52Shaw 71,383 5.78 12,350.00 70,969 8.30 8,550.48 56,405 11.40 4,947.81
44 19,251,310 2,415.23 7,970.80 16,312,230 2,442.61 6,678.20 18,109,272 2,323.41 7,794.26
Except where otherwise noted, the School District & ESD Financial Reporting Summary for 2019–20 by Office of Superintendent of Public Instructions is licensed under a Creative Commons Attribution 4.0 International License.
275
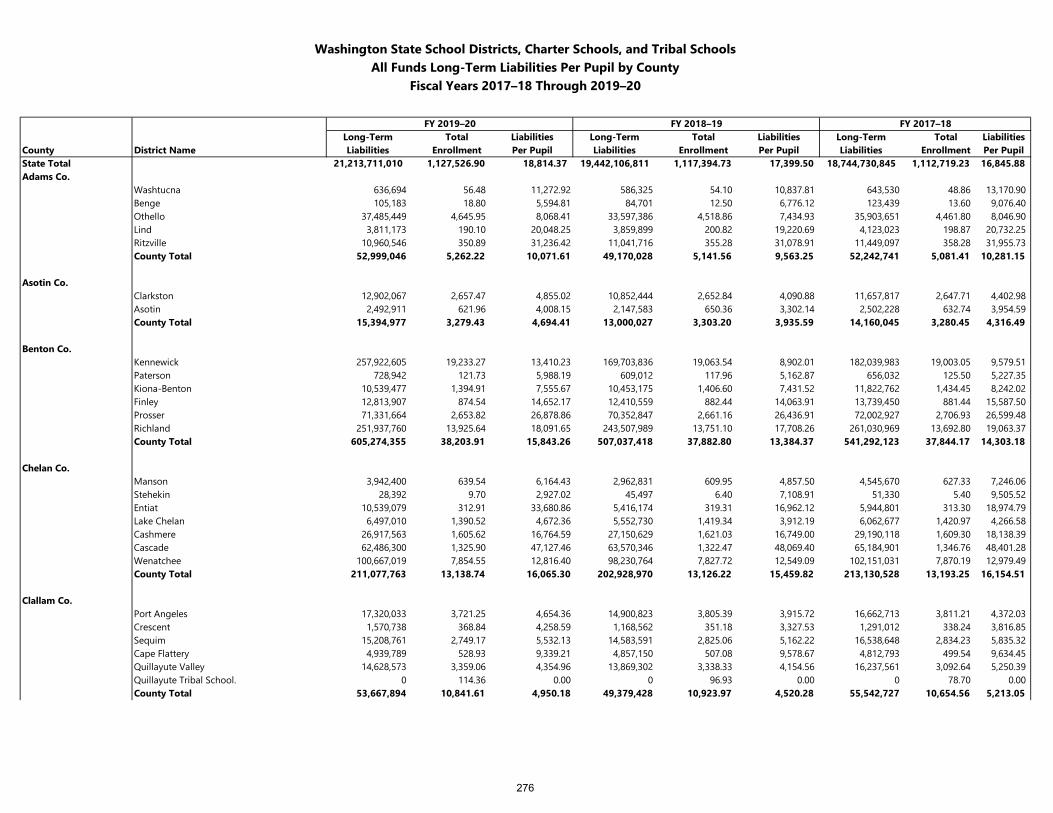
Washington State School Districts, Charter Schools, and Tribal SchoolsAll Funds Long-Term Liabilities Per Pupil by County
Fiscal Years 2017–18 Through 2019–20
FY 2019–20 FY 2018–19 FY 2017–18Long-Term Total Liabilities Long-Term Total Liabilities Long-Term Total Liabilities
County District Name Liabilities Enrollment Per Pupil Liabilities Enrollment Per Pupil Liabilities Enrollment Per PupilState Total 21,213,711,010 1,127,526.90 18,814.37 19,442,106,811 1,117,394.73 17,399.50 18,744,730,845 1,112,719.23 16,845.88Adams Co.
Washtucna 636,694 56.48 11,272.92 586,325 54.10 10,837.81 643,530 48.86 13,170.90Benge 105,183 18.80 5,594.81 84,701 12.50 6,776.12 123,439 13.60 9,076.40Othello 37,485,449 4,645.95 8,068.41 33,597,386 4,518.86 7,434.93 35,903,651 4,461.80 8,046.90Lind 3,811,173 190.10 20,048.25 3,859,899 200.82 19,220.69 4,123,023 198.87 20,732.25Ritzville 10,960,546 350.89 31,236.42 11,041,716 355.28 31,078.91 11,449,097 358.28 31,955.73County Total 52,999,046 5,262.22 10,071.61 49,170,028 5,141.56 9,563.25 52,242,741 5,081.41 10,281.15
Asotin Co.Clarkston 12,902,067 2,657.47 4,855.02 10,852,444 2,652.84 4,090.88 11,657,817 2,647.71 4,402.98Asotin 2,492,911 621.96 4,008.15 2,147,583 650.36 3,302.14 2,502,228 632.74 3,954.59County Total 15,394,977 3,279.43 4,694.41 13,000,027 3,303.20 3,935.59 14,160,045 3,280.45 4,316.49
Benton Co.Kennewick 257,922,605 19,233.27 13,410.23 169,703,836 19,063.54 8,902.01 182,039,983 19,003.05 9,579.51Paterson 728,942 121.73 5,988.19 609,012 117.96 5,162.87 656,032 125.50 5,227.35Kiona-Benton 10,539,477 1,394.91 7,555.67 10,453,175 1,406.60 7,431.52 11,822,762 1,434.45 8,242.02Finley 12,813,907 874.54 14,652.17 12,410,559 882.44 14,063.91 13,739,450 881.44 15,587.50Prosser 71,331,664 2,653.82 26,878.86 70,352,847 2,661.16 26,436.91 72,002,927 2,706.93 26,599.48Richland 251,937,760 13,925.64 18,091.65 243,507,989 13,751.10 17,708.26 261,030,969 13,692.80 19,063.37County Total 605,274,355 38,203.91 15,843.26 507,037,418 37,882.80 13,384.37 541,292,123 37,844.17 14,303.18
Chelan Co.Manson 3,942,400 639.54 6,164.43 2,962,831 609.95 4,857.50 4,545,670 627.33 7,246.06Stehekin 28,392 9.70 2,927.02 45,497 6.40 7,108.91 51,330 5.40 9,505.52Entiat 10,539,079 312.91 33,680.86 5,416,174 319.31 16,962.12 5,944,801 313.30 18,974.79Lake Chelan 6,497,010 1,390.52 4,672.36 5,552,730 1,419.34 3,912.19 6,062,677 1,420.97 4,266.58Cashmere 26,917,563 1,605.62 16,764.59 27,150,629 1,621.03 16,749.00 29,190,118 1,609.30 18,138.39Cascade 62,486,300 1,325.90 47,127.46 63,570,346 1,322.47 48,069.40 65,184,901 1,346.76 48,401.28Wenatchee 100,667,019 7,854.55 12,816.40 98,230,764 7,827.72 12,549.09 102,151,031 7,870.19 12,979.49County Total 211,077,763 13,138.74 16,065.30 202,928,970 13,126.22 15,459.82 213,130,528 13,193.25 16,154.51
Clallam Co.Port Angeles 17,320,033 3,721.25 4,654.36 14,900,823 3,805.39 3,915.72 16,662,713 3,811.21 4,372.03Crescent 1,570,738 368.84 4,258.59 1,168,562 351.18 3,327.53 1,291,012 338.24 3,816.85Sequim 15,208,761 2,749.17 5,532.13 14,583,591 2,825.06 5,162.22 16,538,648 2,834.23 5,835.32Cape Flattery 4,939,789 528.93 9,339.21 4,857,150 507.08 9,578.67 4,812,793 499.54 9,634.45Quillayute Valley 14,628,573 3,359.06 4,354.96 13,869,302 3,338.33 4,154.56 16,237,561 3,092.64 5,250.39Quillayute Tribal School. 0 114.36 0.00 0 96.93 0.00 0 78.70 0.00County Total 53,667,894 10,841.61 4,950.18 49,379,428 10,923.97 4,520.28 55,542,727 10,654.56 5,213.05
276
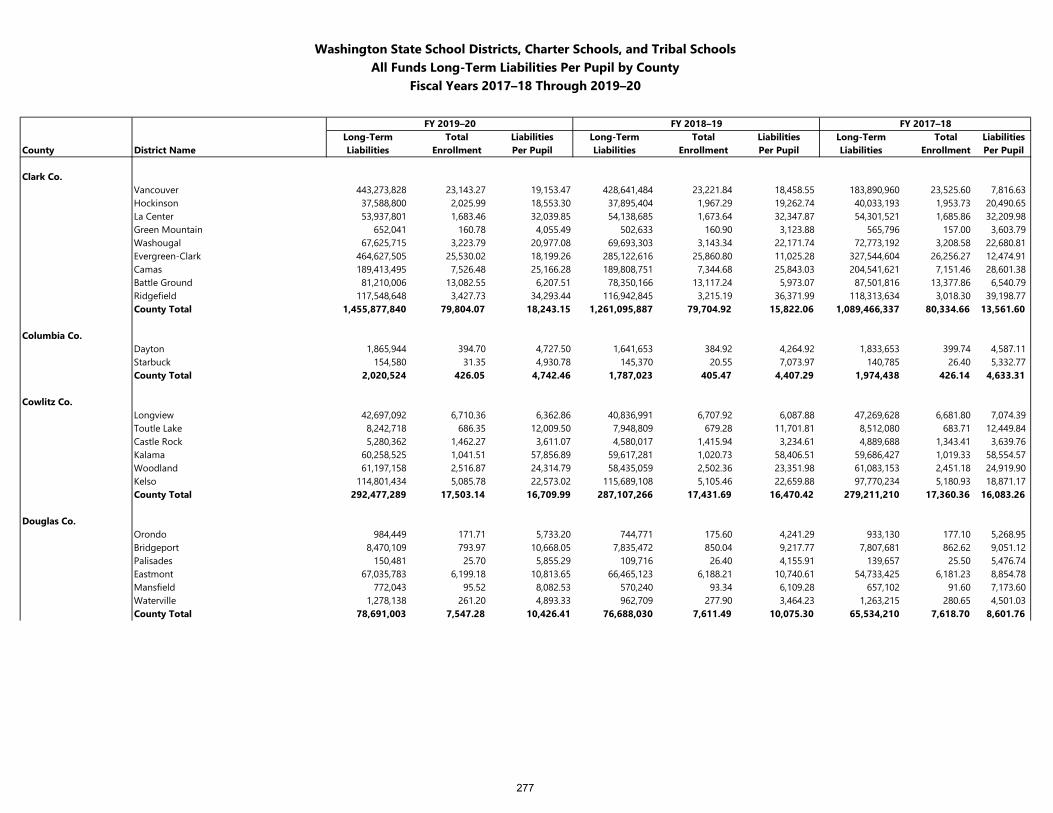
Washington State School Districts, Charter Schools, and Tribal SchoolsAll Funds Long-Term Liabilities Per Pupil by County
Fiscal Years 2017–18 Through 2019–20
FY 2019–20 FY 2018–19 FY 2017–18Long-Term Total Liabilities Long-Term Total Liabilities Long-Term Total Liabilities
County District Name Liabilities Enrollment Per Pupil Liabilities Enrollment Per Pupil Liabilities Enrollment Per Pupil
Clark Co.Vancouver 443,273,828 23,143.27 19,153.47 428,641,484 23,221.84 18,458.55 183,890,960 23,525.60 7,816.63Hockinson 37,588,800 2,025.99 18,553.30 37,895,404 1,967.29 19,262.74 40,033,193 1,953.73 20,490.65La Center 53,937,801 1,683.46 32,039.85 54,138,685 1,673.64 32,347.87 54,301,521 1,685.86 32,209.98Green Mountain 652,041 160.78 4,055.49 502,633 160.90 3,123.88 565,796 157.00 3,603.79Washougal 67,625,715 3,223.79 20,977.08 69,693,303 3,143.34 22,171.74 72,773,192 3,208.58 22,680.81Evergreen-Clark 464,627,505 25,530.02 18,199.26 285,122,616 25,860.80 11,025.28 327,544,604 26,256.27 12,474.91Camas 189,413,495 7,526.48 25,166.28 189,808,751 7,344.68 25,843.03 204,541,621 7,151.46 28,601.38Battle Ground 81,210,006 13,082.55 6,207.51 78,350,166 13,117.24 5,973.07 87,501,816 13,377.86 6,540.79Ridgefield 117,548,648 3,427.73 34,293.44 116,942,845 3,215.19 36,371.99 118,313,634 3,018.30 39,198.77County Total 1,455,877,840 79,804.07 18,243.15 1,261,095,887 79,704.92 15,822.06 1,089,466,337 80,334.66 13,561.60
Columbia Co.Dayton 1,865,944 394.70 4,727.50 1,641,653 384.92 4,264.92 1,833,653 399.74 4,587.11Starbuck 154,580 31.35 4,930.78 145,370 20.55 7,073.97 140,785 26.40 5,332.77County Total 2,020,524 426.05 4,742.46 1,787,023 405.47 4,407.29 1,974,438 426.14 4,633.31
Cowlitz Co.Longview 42,697,092 6,710.36 6,362.86 40,836,991 6,707.92 6,087.88 47,269,628 6,681.80 7,074.39Toutle Lake 8,242,718 686.35 12,009.50 7,948,809 679.28 11,701.81 8,512,080 683.71 12,449.84Castle Rock 5,280,362 1,462.27 3,611.07 4,580,017 1,415.94 3,234.61 4,889,688 1,343.41 3,639.76Kalama 60,258,525 1,041.51 57,856.89 59,617,281 1,020.73 58,406.51 59,686,427 1,019.33 58,554.57Woodland 61,197,158 2,516.87 24,314.79 58,435,059 2,502.36 23,351.98 61,083,153 2,451.18 24,919.90Kelso 114,801,434 5,085.78 22,573.02 115,689,108 5,105.46 22,659.88 97,770,234 5,180.93 18,871.17County Total 292,477,289 17,503.14 16,709.99 287,107,266 17,431.69 16,470.42 279,211,210 17,360.36 16,083.26
Douglas Co.Orondo 984,449 171.71 5,733.20 744,771 175.60 4,241.29 933,130 177.10 5,268.95Bridgeport 8,470,109 793.97 10,668.05 7,835,472 850.04 9,217.77 7,807,681 862.62 9,051.12Palisades 150,481 25.70 5,855.29 109,716 26.40 4,155.91 139,657 25.50 5,476.74Eastmont 67,035,783 6,199.18 10,813.65 66,465,123 6,188.21 10,740.61 54,733,425 6,181.23 8,854.78Mansfield 772,043 95.52 8,082.53 570,240 93.34 6,109.28 657,102 91.60 7,173.60Waterville 1,278,138 261.20 4,893.33 962,709 277.90 3,464.23 1,263,215 280.65 4,501.03County Total 78,691,003 7,547.28 10,426.41 76,688,030 7,611.49 10,075.30 65,534,210 7,618.70 8,601.76
277
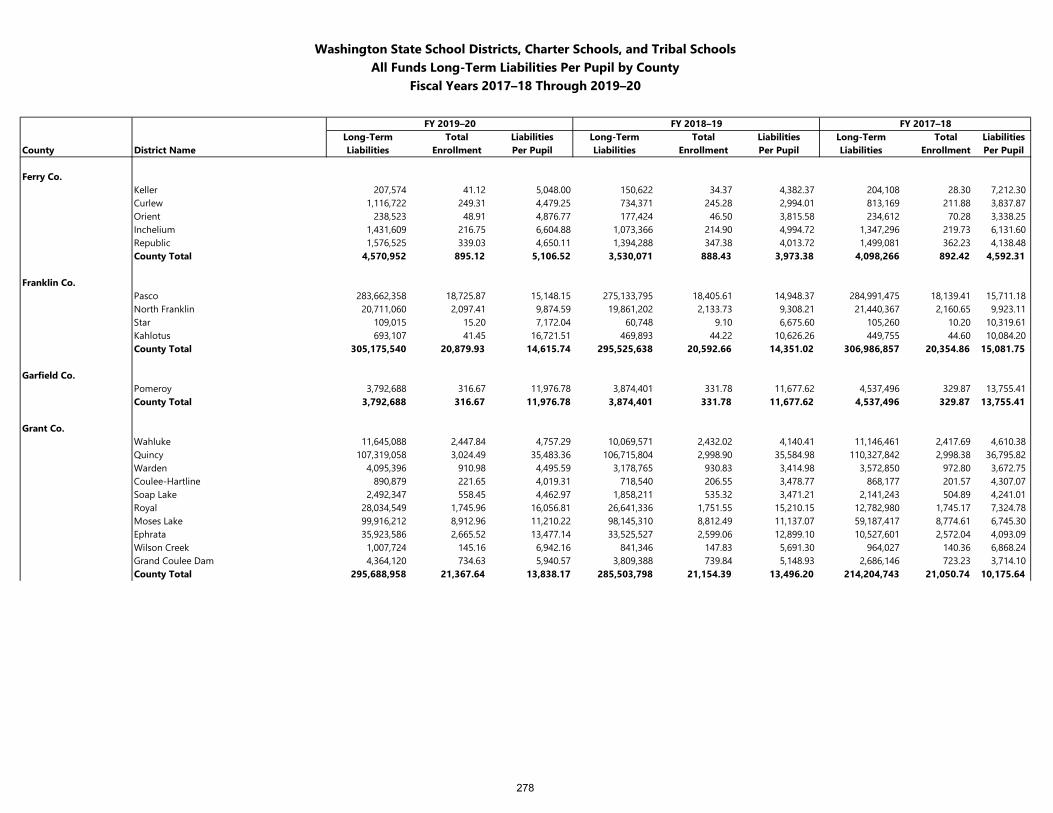
Washington State School Districts, Charter Schools, and Tribal SchoolsAll Funds Long-Term Liabilities Per Pupil by County
Fiscal Years 2017–18 Through 2019–20
FY 2019–20 FY 2018–19 FY 2017–18Long-Term Total Liabilities Long-Term Total Liabilities Long-Term Total Liabilities
County District Name Liabilities Enrollment Per Pupil Liabilities Enrollment Per Pupil Liabilities Enrollment Per Pupil
Ferry Co.Keller 207,574 41.12 5,048.00 150,622 34.37 4,382.37 204,108 28.30 7,212.30Curlew 1,116,722 249.31 4,479.25 734,371 245.28 2,994.01 813,169 211.88 3,837.87Orient 238,523 48.91 4,876.77 177,424 46.50 3,815.58 234,612 70.28 3,338.25Inchelium 1,431,609 216.75 6,604.88 1,073,366 214.90 4,994.72 1,347,296 219.73 6,131.60Republic 1,576,525 339.03 4,650.11 1,394,288 347.38 4,013.72 1,499,081 362.23 4,138.48County Total 4,570,952 895.12 5,106.52 3,530,071 888.43 3,973.38 4,098,266 892.42 4,592.31
Franklin Co.Pasco 283,662,358 18,725.87 15,148.15 275,133,795 18,405.61 14,948.37 284,991,475 18,139.41 15,711.18North Franklin 20,711,060 2,097.41 9,874.59 19,861,202 2,133.73 9,308.21 21,440,367 2,160.65 9,923.11Star 109,015 15.20 7,172.04 60,748 9.10 6,675.60 105,260 10.20 10,319.61Kahlotus 693,107 41.45 16,721.51 469,893 44.22 10,626.26 449,755 44.60 10,084.20County Total 305,175,540 20,879.93 14,615.74 295,525,638 20,592.66 14,351.02 306,986,857 20,354.86 15,081.75
Garfield Co.Pomeroy 3,792,688 316.67 11,976.78 3,874,401 331.78 11,677.62 4,537,496 329.87 13,755.41County Total 3,792,688 316.67 11,976.78 3,874,401 331.78 11,677.62 4,537,496 329.87 13,755.41
Grant Co.Wahluke 11,645,088 2,447.84 4,757.29 10,069,571 2,432.02 4,140.41 11,146,461 2,417.69 4,610.38Quincy 107,319,058 3,024.49 35,483.36 106,715,804 2,998.90 35,584.98 110,327,842 2,998.38 36,795.82Warden 4,095,396 910.98 4,495.59 3,178,765 930.83 3,414.98 3,572,850 972.80 3,672.75Coulee-Hartline 890,879 221.65 4,019.31 718,540 206.55 3,478.77 868,177 201.57 4,307.07Soap Lake 2,492,347 558.45 4,462.97 1,858,211 535.32 3,471.21 2,141,243 504.89 4,241.01Royal 28,034,549 1,745.96 16,056.81 26,641,336 1,751.55 15,210.15 12,782,980 1,745.17 7,324.78Moses Lake 99,916,212 8,912.96 11,210.22 98,145,310 8,812.49 11,137.07 59,187,417 8,774.61 6,745.30Ephrata 35,923,586 2,665.52 13,477.14 33,525,527 2,599.06 12,899.10 10,527,601 2,572.04 4,093.09Wilson Creek 1,007,724 145.16 6,942.16 841,346 147.83 5,691.30 964,027 140.36 6,868.24Grand Coulee Dam 4,364,120 734.63 5,940.57 3,809,388 739.84 5,148.93 2,686,146 723.23 3,714.10County Total 295,688,958 21,367.64 13,838.17 285,503,798 21,154.39 13,496.20 214,204,743 21,050.74 10,175.64
278
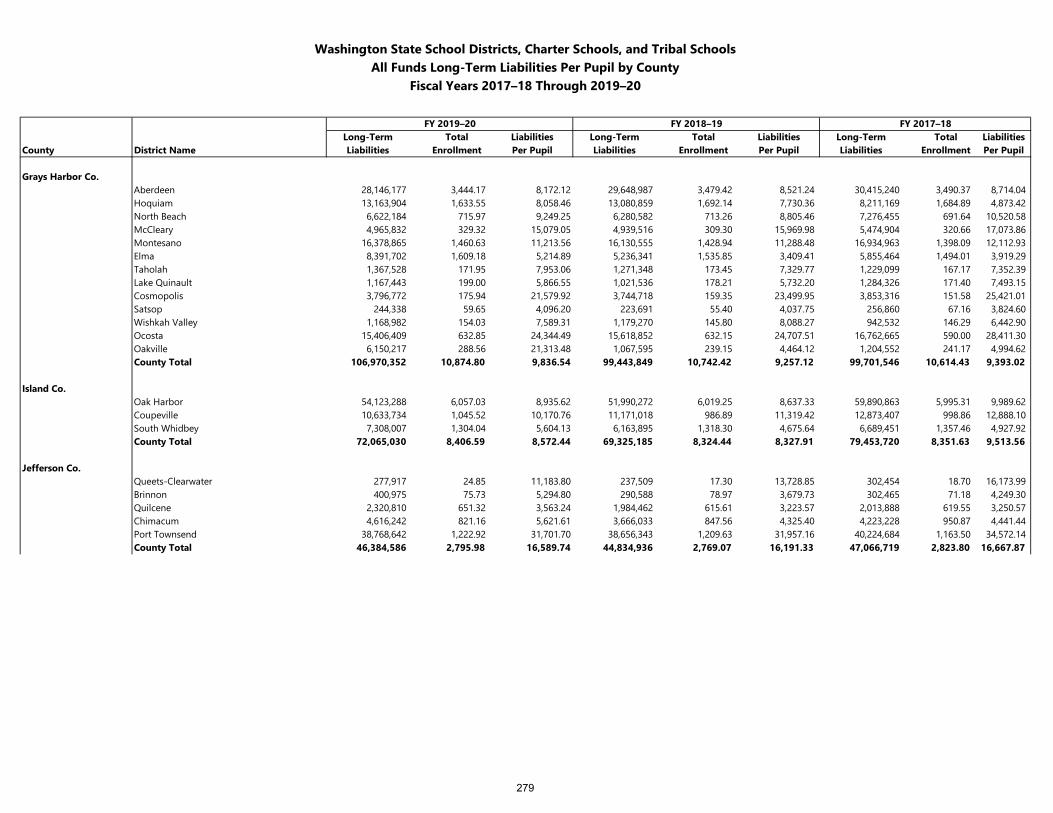
Washington State School Districts, Charter Schools, and Tribal SchoolsAll Funds Long-Term Liabilities Per Pupil by County
Fiscal Years 2017–18 Through 2019–20
FY 2019–20 FY 2018–19 FY 2017–18Long-Term Total Liabilities Long-Term Total Liabilities Long-Term Total Liabilities
County District Name Liabilities Enrollment Per Pupil Liabilities Enrollment Per Pupil Liabilities Enrollment Per Pupil
Grays Harbor Co.Aberdeen 28,146,177 3,444.17 8,172.12 29,648,987 3,479.42 8,521.24 30,415,240 3,490.37 8,714.04Hoquiam 13,163,904 1,633.55 8,058.46 13,080,859 1,692.14 7,730.36 8,211,169 1,684.89 4,873.42North Beach 6,622,184 715.97 9,249.25 6,280,582 713.26 8,805.46 7,276,455 691.64 10,520.58McCleary 4,965,832 329.32 15,079.05 4,939,516 309.30 15,969.98 5,474,904 320.66 17,073.86Montesano 16,378,865 1,460.63 11,213.56 16,130,555 1,428.94 11,288.48 16,934,963 1,398.09 12,112.93Elma 8,391,702 1,609.18 5,214.89 5,236,341 1,535.85 3,409.41 5,855,464 1,494.01 3,919.29Taholah 1,367,528 171.95 7,953.06 1,271,348 173.45 7,329.77 1,229,099 167.17 7,352.39Lake Quinault 1,167,443 199.00 5,866.55 1,021,536 178.21 5,732.20 1,284,326 171.40 7,493.15Cosmopolis 3,796,772 175.94 21,579.92 3,744,718 159.35 23,499.95 3,853,316 151.58 25,421.01Satsop 244,338 59.65 4,096.20 223,691 55.40 4,037.75 256,860 67.16 3,824.60Wishkah Valley 1,168,982 154.03 7,589.31 1,179,270 145.80 8,088.27 942,532 146.29 6,442.90Ocosta 15,406,409 632.85 24,344.49 15,618,852 632.15 24,707.51 16,762,665 590.00 28,411.30Oakville 6,150,217 288.56 21,313.48 1,067,595 239.15 4,464.12 1,204,552 241.17 4,994.62County Total 106,970,352 10,874.80 9,836.54 99,443,849 10,742.42 9,257.12 99,701,546 10,614.43 9,393.02
Island Co.Oak Harbor 54,123,288 6,057.03 8,935.62 51,990,272 6,019.25 8,637.33 59,890,863 5,995.31 9,989.62Coupeville 10,633,734 1,045.52 10,170.76 11,171,018 986.89 11,319.42 12,873,407 998.86 12,888.10South Whidbey 7,308,007 1,304.04 5,604.13 6,163,895 1,318.30 4,675.64 6,689,451 1,357.46 4,927.92County Total 72,065,030 8,406.59 8,572.44 69,325,185 8,324.44 8,327.91 79,453,720 8,351.63 9,513.56
Jefferson Co.Queets-Clearwater 277,917 24.85 11,183.80 237,509 17.30 13,728.85 302,454 18.70 16,173.99Brinnon 400,975 75.73 5,294.80 290,588 78.97 3,679.73 302,465 71.18 4,249.30Quilcene 2,320,810 651.32 3,563.24 1,984,462 615.61 3,223.57 2,013,888 619.55 3,250.57Chimacum 4,616,242 821.16 5,621.61 3,666,033 847.56 4,325.40 4,223,228 950.87 4,441.44Port Townsend 38,768,642 1,222.92 31,701.70 38,656,343 1,209.63 31,957.16 40,224,684 1,163.50 34,572.14County Total 46,384,586 2,795.98 16,589.74 44,834,936 2,769.07 16,191.33 47,066,719 2,823.80 16,667.87
279
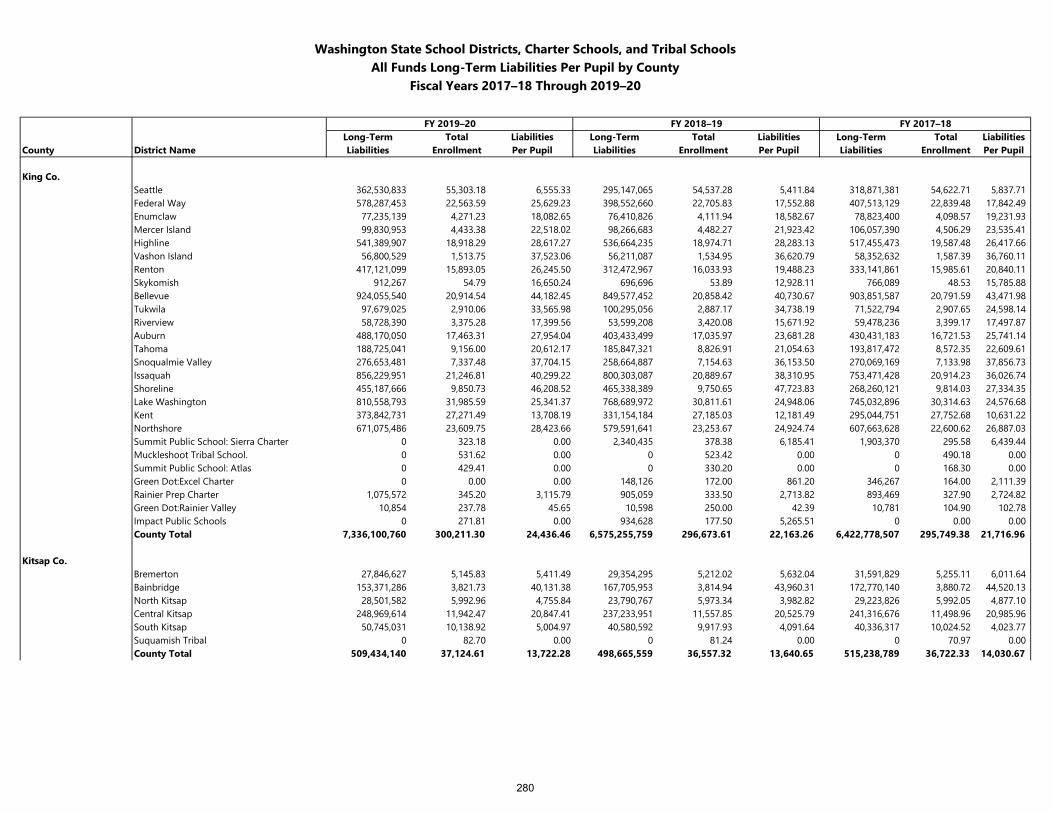
Washington State School Districts, Charter Schools, and Tribal SchoolsAll Funds Long-Term Liabilities Per Pupil by County
Fiscal Years 2017–18 Through 2019–20
FY 2019–20 FY 2018–19 FY 2017–18Long-Term Total Liabilities Long-Term Total Liabilities Long-Term Total Liabilities
County District Name Liabilities Enrollment Per Pupil Liabilities Enrollment Per Pupil Liabilities Enrollment Per Pupil
King Co.Seattle 362,530,833 55,303.18 6,555.33 295,147,065 54,537.28 5,411.84 318,871,381 54,622.71 5,837.71Federal Way 578,287,453 22,563.59 25,629.23 398,552,660 22,705.83 17,552.88 407,513,129 22,839.48 17,842.49Enumclaw 77,235,139 4,271.23 18,082.65 76,410,826 4,111.94 18,582.67 78,823,400 4,098.57 19,231.93Mercer Island 99,830,953 4,433.38 22,518.02 98,266,683 4,482.27 21,923.42 106,057,390 4,506.29 23,535.41Highline 541,389,907 18,918.29 28,617.27 536,664,235 18,974.71 28,283.13 517,455,473 19,587.48 26,417.66Vashon Island 56,800,529 1,513.75 37,523.06 56,211,087 1,534.95 36,620.79 58,352,632 1,587.39 36,760.11Renton 417,121,099 15,893.05 26,245.50 312,472,967 16,033.93 19,488.23 333,141,861 15,985.61 20,840.11Skykomish 912,267 54.79 16,650.24 696,696 53.89 12,928.11 766,089 48.53 15,785.88Bellevue 924,055,540 20,914.54 44,182.45 849,577,452 20,858.42 40,730.67 903,851,587 20,791.59 43,471.98Tukwila 97,679,025 2,910.06 33,565.98 100,295,056 2,887.17 34,738.19 71,522,794 2,907.65 24,598.14Riverview 58,728,390 3,375.28 17,399.56 53,599,208 3,420.08 15,671.92 59,478,236 3,399.17 17,497.87Auburn 488,170,050 17,463.31 27,954.04 403,433,499 17,035.97 23,681.28 430,431,183 16,721.53 25,741.14Tahoma 188,725,041 9,156.00 20,612.17 185,847,321 8,826.91 21,054.63 193,817,472 8,572.35 22,609.61Snoqualmie Valley 276,653,481 7,337.48 37,704.15 258,664,887 7,154.63 36,153.50 270,069,169 7,133.98 37,856.73Issaquah 856,229,951 21,246.81 40,299.22 800,303,087 20,889.67 38,310.95 753,471,428 20,914.23 36,026.74Shoreline 455,187,666 9,850.73 46,208.52 465,338,389 9,750.65 47,723.83 268,260,121 9,814.03 27,334.35Lake Washington 810,558,793 31,985.59 25,341.37 768,689,972 30,811.61 24,948.06 745,032,896 30,314.63 24,576.68Kent 373,842,731 27,271.49 13,708.19 331,154,184 27,185.03 12,181.49 295,044,751 27,752.68 10,631.22Northshore 671,075,486 23,609.75 28,423.66 579,591,641 23,253.67 24,924.74 607,663,628 22,600.62 26,887.03Summit Public School: Sierra Charter 0 323.18 0.00 2,340,435 378.38 6,185.41 1,903,370 295.58 6,439.44Muckleshoot Tribal School. 0 531.62 0.00 0 523.42 0.00 0 490.18 0.00Summit Public School: Atlas 0 429.41 0.00 0 330.20 0.00 0 168.30 0.00Green Dot:Excel Charter 0 0.00 0.00 148,126 172.00 861.20 346,267 164.00 2,111.39Rainier Prep Charter 1,075,572 345.20 3,115.79 905,059 333.50 2,713.82 893,469 327.90 2,724.82Green Dot:Rainier Valley 10,854 237.78 45.65 10,598 250.00 42.39 10,781 104.90 102.78Impact Public Schools 0 271.81 0.00 934,628 177.50 5,265.51 0 0.00 0.00County Total 7,336,100,760 300,211.30 24,436.46 6,575,255,759 296,673.61 22,163.26 6,422,778,507 295,749.38 21,716.96
Kitsap Co.Bremerton 27,846,627 5,145.83 5,411.49 29,354,295 5,212.02 5,632.04 31,591,829 5,255.11 6,011.64Bainbridge 153,371,286 3,821.73 40,131.38 167,705,953 3,814.94 43,960.31 172,770,140 3,880.72 44,520.13North Kitsap 28,501,582 5,992.96 4,755.84 23,790,767 5,973.34 3,982.82 29,223,826 5,992.05 4,877.10Central Kitsap 248,969,614 11,942.47 20,847.41 237,233,951 11,557.85 20,525.79 241,316,676 11,498.96 20,985.96South Kitsap 50,745,031 10,138.92 5,004.97 40,580,592 9,917.93 4,091.64 40,336,317 10,024.52 4,023.77Suquamish Tribal 0 82.70 0.00 0 81.24 0.00 0 70.97 0.00County Total 509,434,140 37,124.61 13,722.28 498,665,559 36,557.32 13,640.65 515,238,789 36,722.33 14,030.67
280
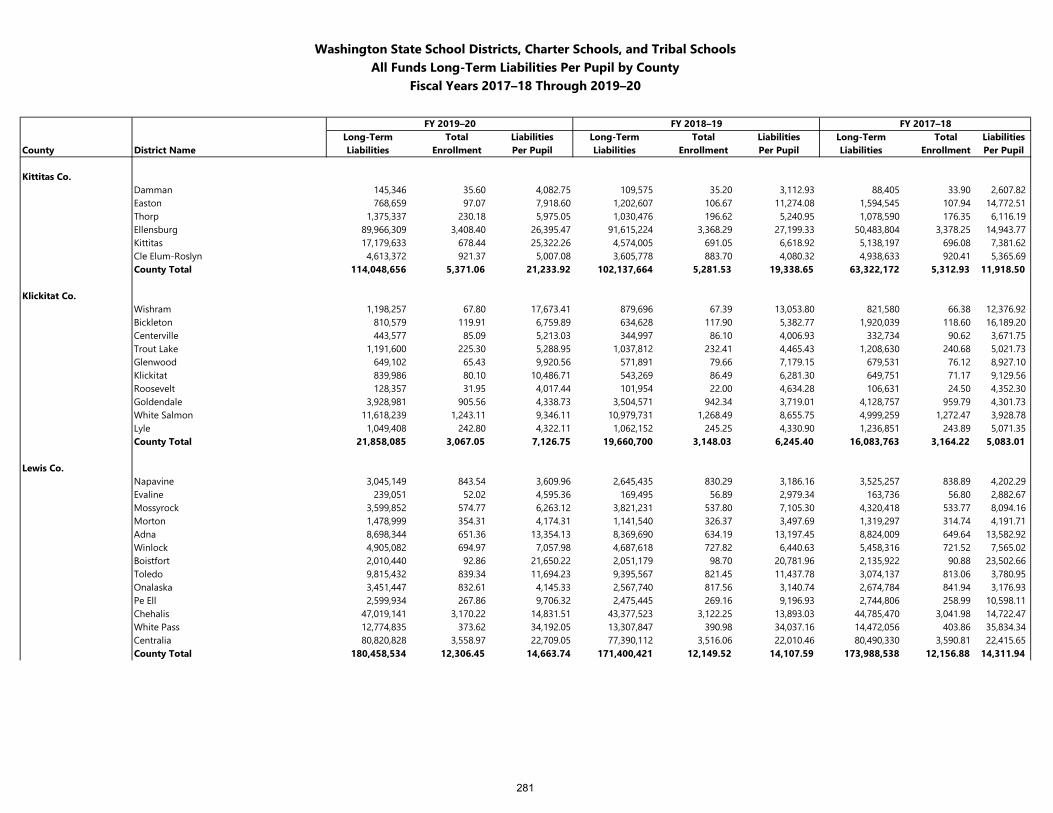
Washington State School Districts, Charter Schools, and Tribal SchoolsAll Funds Long-Term Liabilities Per Pupil by County
Fiscal Years 2017–18 Through 2019–20
FY 2019–20 FY 2018–19 FY 2017–18Long-Term Total Liabilities Long-Term Total Liabilities Long-Term Total Liabilities
County District Name Liabilities Enrollment Per Pupil Liabilities Enrollment Per Pupil Liabilities Enrollment Per Pupil
Kittitas Co.Damman 145,346 35.60 4,082.75 109,575 35.20 3,112.93 88,405 33.90 2,607.82Easton 768,659 97.07 7,918.60 1,202,607 106.67 11,274.08 1,594,545 107.94 14,772.51Thorp 1,375,337 230.18 5,975.05 1,030,476 196.62 5,240.95 1,078,590 176.35 6,116.19Ellensburg 89,966,309 3,408.40 26,395.47 91,615,224 3,368.29 27,199.33 50,483,804 3,378.25 14,943.77Kittitas 17,179,633 678.44 25,322.26 4,574,005 691.05 6,618.92 5,138,197 696.08 7,381.62Cle Elum-Roslyn 4,613,372 921.37 5,007.08 3,605,778 883.70 4,080.32 4,938,633 920.41 5,365.69County Total 114,048,656 5,371.06 21,233.92 102,137,664 5,281.53 19,338.65 63,322,172 5,312.93 11,918.50
Klickitat Co.Wishram 1,198,257 67.80 17,673.41 879,696 67.39 13,053.80 821,580 66.38 12,376.92Bickleton 810,579 119.91 6,759.89 634,628 117.90 5,382.77 1,920,039 118.60 16,189.20Centerville 443,577 85.09 5,213.03 344,997 86.10 4,006.93 332,734 90.62 3,671.75Trout Lake 1,191,600 225.30 5,288.95 1,037,812 232.41 4,465.43 1,208,630 240.68 5,021.73Glenwood 649,102 65.43 9,920.56 571,891 79.66 7,179.15 679,531 76.12 8,927.10Klickitat 839,986 80.10 10,486.71 543,269 86.49 6,281.30 649,751 71.17 9,129.56Roosevelt 128,357 31.95 4,017.44 101,954 22.00 4,634.28 106,631 24.50 4,352.30Goldendale 3,928,981 905.56 4,338.73 3,504,571 942.34 3,719.01 4,128,757 959.79 4,301.73White Salmon 11,618,239 1,243.11 9,346.11 10,979,731 1,268.49 8,655.75 4,999,259 1,272.47 3,928.78Lyle 1,049,408 242.80 4,322.11 1,062,152 245.25 4,330.90 1,236,851 243.89 5,071.35County Total 21,858,085 3,067.05 7,126.75 19,660,700 3,148.03 6,245.40 16,083,763 3,164.22 5,083.01
Lewis Co.Napavine 3,045,149 843.54 3,609.96 2,645,435 830.29 3,186.16 3,525,257 838.89 4,202.29Evaline 239,051 52.02 4,595.36 169,495 56.89 2,979.34 163,736 56.80 2,882.67Mossyrock 3,599,852 574.77 6,263.12 3,821,231 537.80 7,105.30 4,320,418 533.77 8,094.16Morton 1,478,999 354.31 4,174.31 1,141,540 326.37 3,497.69 1,319,297 314.74 4,191.71Adna 8,698,344 651.36 13,354.13 8,369,690 634.19 13,197.45 8,824,009 649.64 13,582.92Winlock 4,905,082 694.97 7,057.98 4,687,618 727.82 6,440.63 5,458,316 721.52 7,565.02Boistfort 2,010,440 92.86 21,650.22 2,051,179 98.70 20,781.96 2,135,922 90.88 23,502.66Toledo 9,815,432 839.34 11,694.23 9,395,567 821.45 11,437.78 3,074,137 813.06 3,780.95Onalaska 3,451,447 832.61 4,145.33 2,567,740 817.56 3,140.74 2,674,784 841.94 3,176.93Pe Ell 2,599,934 267.86 9,706.32 2,475,445 269.16 9,196.93 2,744,806 258.99 10,598.11Chehalis 47,019,141 3,170.22 14,831.51 43,377,523 3,122.25 13,893.03 44,785,470 3,041.98 14,722.47White Pass 12,774,835 373.62 34,192.05 13,307,847 390.98 34,037.16 14,472,056 403.86 35,834.34Centralia 80,820,828 3,558.97 22,709.05 77,390,112 3,516.06 22,010.46 80,490,330 3,590.81 22,415.65County Total 180,458,534 12,306.45 14,663.74 171,400,421 12,149.52 14,107.59 173,988,538 12,156.88 14,311.94
281
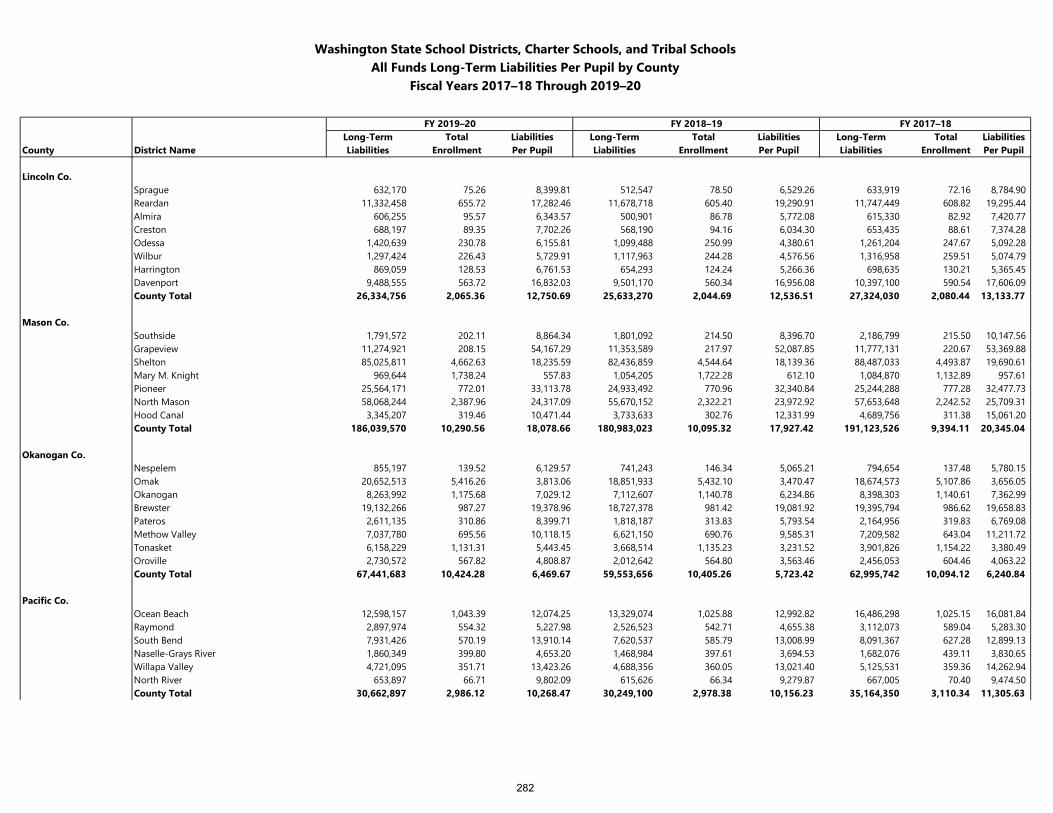
Washington State School Districts, Charter Schools, and Tribal SchoolsAll Funds Long-Term Liabilities Per Pupil by County
Fiscal Years 2017–18 Through 2019–20
FY 2019–20 FY 2018–19 FY 2017–18Long-Term Total Liabilities Long-Term Total Liabilities Long-Term Total Liabilities
County District Name Liabilities Enrollment Per Pupil Liabilities Enrollment Per Pupil Liabilities Enrollment Per Pupil
Lincoln Co.Sprague 632,170 75.26 8,399.81 512,547 78.50 6,529.26 633,919 72.16 8,784.90Reardan 11,332,458 655.72 17,282.46 11,678,718 605.40 19,290.91 11,747,449 608.82 19,295.44Almira 606,255 95.57 6,343.57 500,901 86.78 5,772.08 615,330 82.92 7,420.77Creston 688,197 89.35 7,702.26 568,190 94.16 6,034.30 653,435 88.61 7,374.28Odessa 1,420,639 230.78 6,155.81 1,099,488 250.99 4,380.61 1,261,204 247.67 5,092.28Wilbur 1,297,424 226.43 5,729.91 1,117,963 244.28 4,576.56 1,316,958 259.51 5,074.79Harrington 869,059 128.53 6,761.53 654,293 124.24 5,266.36 698,635 130.21 5,365.45Davenport 9,488,555 563.72 16,832.03 9,501,170 560.34 16,956.08 10,397,100 590.54 17,606.09County Total 26,334,756 2,065.36 12,750.69 25,633,270 2,044.69 12,536.51 27,324,030 2,080.44 13,133.77
Mason Co.Southside 1,791,572 202.11 8,864.34 1,801,092 214.50 8,396.70 2,186,799 215.50 10,147.56Grapeview 11,274,921 208.15 54,167.29 11,353,589 217.97 52,087.85 11,777,131 220.67 53,369.88Shelton 85,025,811 4,662.63 18,235.59 82,436,859 4,544.64 18,139.36 88,487,033 4,493.87 19,690.61Mary M. Knight 969,644 1,738.24 557.83 1,054,205 1,722.28 612.10 1,084,870 1,132.89 957.61Pioneer 25,564,171 772.01 33,113.78 24,933,492 770.96 32,340.84 25,244,288 777.28 32,477.73North Mason 58,068,244 2,387.96 24,317.09 55,670,152 2,322.21 23,972.92 57,653,648 2,242.52 25,709.31Hood Canal 3,345,207 319.46 10,471.44 3,733,633 302.76 12,331.99 4,689,756 311.38 15,061.20County Total 186,039,570 10,290.56 18,078.66 180,983,023 10,095.32 17,927.42 191,123,526 9,394.11 20,345.04
Okanogan Co.Nespelem 855,197 139.52 6,129.57 741,243 146.34 5,065.21 794,654 137.48 5,780.15Omak 20,652,513 5,416.26 3,813.06 18,851,933 5,432.10 3,470.47 18,674,573 5,107.86 3,656.05Okanogan 8,263,992 1,175.68 7,029.12 7,112,607 1,140.78 6,234.86 8,398,303 1,140.61 7,362.99Brewster 19,132,266 987.27 19,378.96 18,727,378 981.42 19,081.92 19,395,794 986.62 19,658.83Pateros 2,611,135 310.86 8,399.71 1,818,187 313.83 5,793.54 2,164,956 319.83 6,769.08Methow Valley 7,037,780 695.56 10,118.15 6,621,150 690.76 9,585.31 7,209,582 643.04 11,211.72Tonasket 6,158,229 1,131.31 5,443.45 3,668,514 1,135.23 3,231.52 3,901,826 1,154.22 3,380.49Oroville 2,730,572 567.82 4,808.87 2,012,642 564.80 3,563.46 2,456,053 604.46 4,063.22County Total 67,441,683 10,424.28 6,469.67 59,553,656 10,405.26 5,723.42 62,995,742 10,094.12 6,240.84
Pacific Co.Ocean Beach 12,598,157 1,043.39 12,074.25 13,329,074 1,025.88 12,992.82 16,486,298 1,025.15 16,081.84Raymond 2,897,974 554.32 5,227.98 2,526,523 542.71 4,655.38 3,112,073 589.04 5,283.30South Bend 7,931,426 570.19 13,910.14 7,620,537 585.79 13,008.99 8,091,367 627.28 12,899.13Naselle-Grays River 1,860,349 399.80 4,653.20 1,468,984 397.61 3,694.53 1,682,076 439.11 3,830.65Willapa Valley 4,721,095 351.71 13,423.26 4,688,356 360.05 13,021.40 5,125,531 359.36 14,262.94North River 653,897 66.71 9,802.09 615,626 66.34 9,279.87 667,005 70.40 9,474.50County Total 30,662,897 2,986.12 10,268.47 30,249,100 2,978.38 10,156.23 35,164,350 3,110.34 11,305.63
282
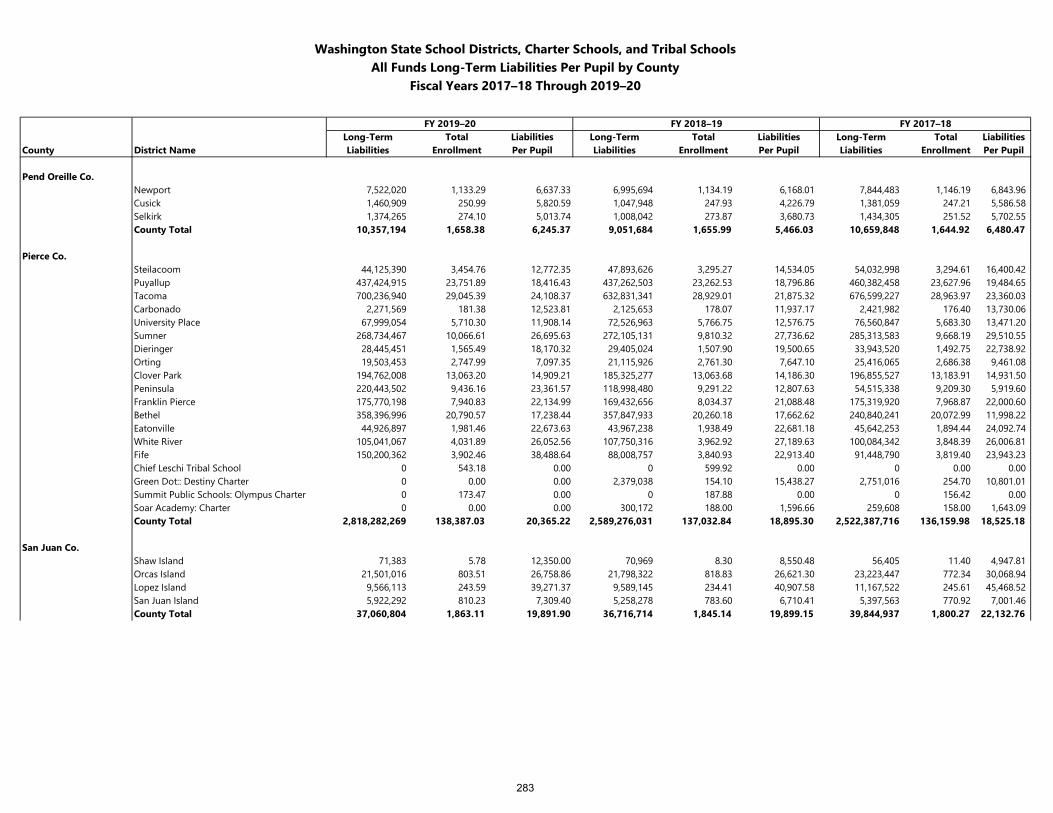
Washington State School Districts, Charter Schools, and Tribal SchoolsAll Funds Long-Term Liabilities Per Pupil by County
Fiscal Years 2017–18 Through 2019–20
FY 2019–20 FY 2018–19 FY 2017–18Long-Term Total Liabilities Long-Term Total Liabilities Long-Term Total Liabilities
County District Name Liabilities Enrollment Per Pupil Liabilities Enrollment Per Pupil Liabilities Enrollment Per Pupil
Pend Oreille Co.Newport 7,522,020 1,133.29 6,637.33 6,995,694 1,134.19 6,168.01 7,844,483 1,146.19 6,843.96Cusick 1,460,909 250.99 5,820.59 1,047,948 247.93 4,226.79 1,381,059 247.21 5,586.58Selkirk 1,374,265 274.10 5,013.74 1,008,042 273.87 3,680.73 1,434,305 251.52 5,702.55County Total 10,357,194 1,658.38 6,245.37 9,051,684 1,655.99 5,466.03 10,659,848 1,644.92 6,480.47
Pierce Co.Steilacoom 44,125,390 3,454.76 12,772.35 47,893,626 3,295.27 14,534.05 54,032,998 3,294.61 16,400.42Puyallup 437,424,915 23,751.89 18,416.43 437,262,503 23,262.53 18,796.86 460,382,458 23,627.96 19,484.65Tacoma 700,236,940 29,045.39 24,108.37 632,831,341 28,929.01 21,875.32 676,599,227 28,963.97 23,360.03Carbonado 2,271,569 181.38 12,523.81 2,125,653 178.07 11,937.17 2,421,982 176.40 13,730.06University Place 67,999,054 5,710.30 11,908.14 72,526,963 5,766.75 12,576.75 76,560,847 5,683.30 13,471.20Sumner 268,734,467 10,066.61 26,695.63 272,105,131 9,810.32 27,736.62 285,313,583 9,668.19 29,510.55Dieringer 28,445,451 1,565.49 18,170.32 29,405,024 1,507.90 19,500.65 33,943,520 1,492.75 22,738.92Orting 19,503,453 2,747.99 7,097.35 21,115,926 2,761.30 7,647.10 25,416,065 2,686.38 9,461.08Clover Park 194,762,008 13,063.20 14,909.21 185,325,277 13,063.68 14,186.30 196,855,527 13,183.91 14,931.50Peninsula 220,443,502 9,436.16 23,361.57 118,998,480 9,291.22 12,807.63 54,515,338 9,209.30 5,919.60Franklin Pierce 175,770,198 7,940.83 22,134.99 169,432,656 8,034.37 21,088.48 175,319,920 7,968.87 22,000.60Bethel 358,396,996 20,790.57 17,238.44 357,847,933 20,260.18 17,662.62 240,840,241 20,072.99 11,998.22Eatonville 44,926,897 1,981.46 22,673.63 43,967,238 1,938.49 22,681.18 45,642,253 1,894.44 24,092.74White River 105,041,067 4,031.89 26,052.56 107,750,316 3,962.92 27,189.63 100,084,342 3,848.39 26,006.81Fife 150,200,362 3,902.46 38,488.64 88,008,757 3,840.93 22,913.40 91,448,790 3,819.40 23,943.23Chief Leschi Tribal School 0 543.18 0.00 0 599.92 0.00 0 0.00 0.00Green Dot:: Destiny Charter 0 0.00 0.00 2,379,038 154.10 15,438.27 2,751,016 254.70 10,801.01Summit Public Schools: Olympus Charter 0 173.47 0.00 0 187.88 0.00 0 156.42 0.00Soar Academy: Charter 0 0.00 0.00 300,172 188.00 1,596.66 259,608 158.00 1,643.09County Total 2,818,282,269 138,387.03 20,365.22 2,589,276,031 137,032.84 18,895.30 2,522,387,716 136,159.98 18,525.18
San Juan Co.Shaw Island 71,383 5.78 12,350.00 70,969 8.30 8,550.48 56,405 11.40 4,947.81Orcas Island 21,501,016 803.51 26,758.86 21,798,322 818.83 26,621.30 23,223,447 772.34 30,068.94Lopez Island 9,566,113 243.59 39,271.37 9,589,145 234.41 40,907.58 11,167,522 245.61 45,468.52San Juan Island 5,922,292 810.23 7,309.40 5,258,278 783.60 6,710.41 5,397,563 770.92 7,001.46County Total 37,060,804 1,863.11 19,891.90 36,716,714 1,845.14 19,899.15 39,844,937 1,800.27 22,132.76
283
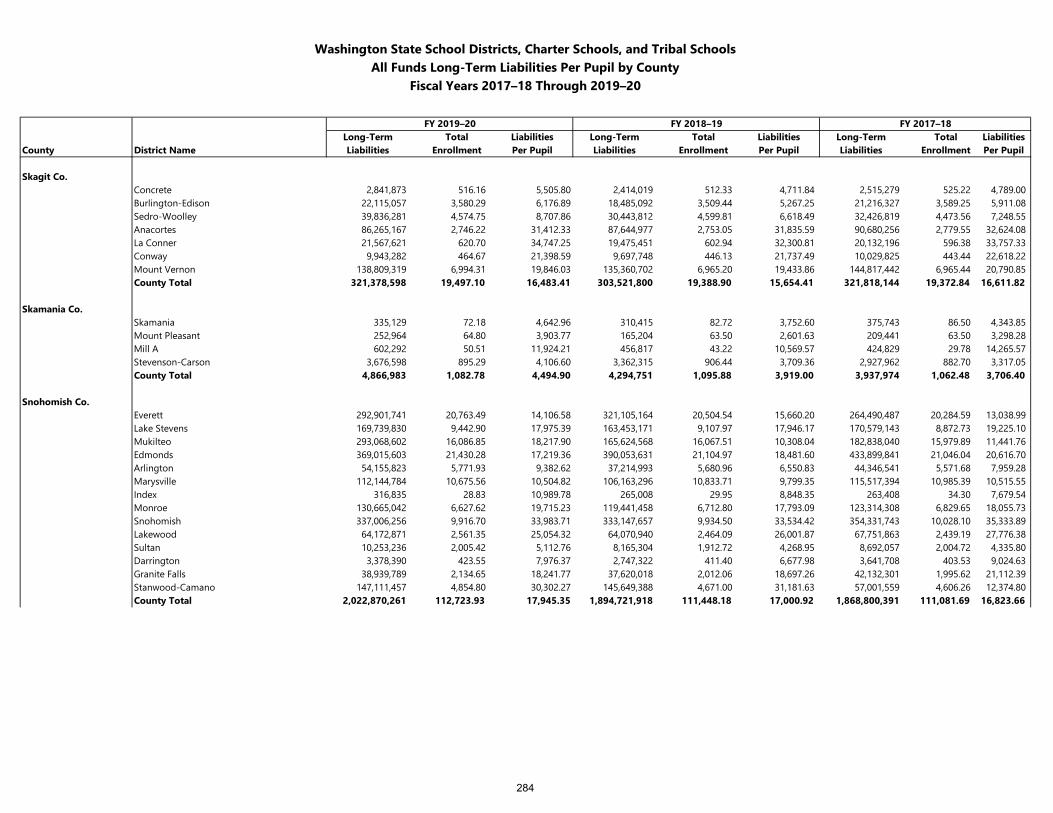
Washington State School Districts, Charter Schools, and Tribal SchoolsAll Funds Long-Term Liabilities Per Pupil by County
Fiscal Years 2017–18 Through 2019–20
FY 2019–20 FY 2018–19 FY 2017–18Long-Term Total Liabilities Long-Term Total Liabilities Long-Term Total Liabilities
County District Name Liabilities Enrollment Per Pupil Liabilities Enrollment Per Pupil Liabilities Enrollment Per Pupil
Skagit Co.Concrete 2,841,873 516.16 5,505.80 2,414,019 512.33 4,711.84 2,515,279 525.22 4,789.00Burlington-Edison 22,115,057 3,580.29 6,176.89 18,485,092 3,509.44 5,267.25 21,216,327 3,589.25 5,911.08Sedro-Woolley 39,836,281 4,574.75 8,707.86 30,443,812 4,599.81 6,618.49 32,426,819 4,473.56 7,248.55Anacortes 86,265,167 2,746.22 31,412.33 87,644,977 2,753.05 31,835.59 90,680,256 2,779.55 32,624.08La Conner 21,567,621 620.70 34,747.25 19,475,451 602.94 32,300.81 20,132,196 596.38 33,757.33Conway 9,943,282 464.67 21,398.59 9,697,748 446.13 21,737.49 10,029,825 443.44 22,618.22Mount Vernon 138,809,319 6,994.31 19,846.03 135,360,702 6,965.20 19,433.86 144,817,442 6,965.44 20,790.85County Total 321,378,598 19,497.10 16,483.41 303,521,800 19,388.90 15,654.41 321,818,144 19,372.84 16,611.82
Skamania Co.Skamania 335,129 72.18 4,642.96 310,415 82.72 3,752.60 375,743 86.50 4,343.85Mount Pleasant 252,964 64.80 3,903.77 165,204 63.50 2,601.63 209,441 63.50 3,298.28Mill A 602,292 50.51 11,924.21 456,817 43.22 10,569.57 424,829 29.78 14,265.57Stevenson-Carson 3,676,598 895.29 4,106.60 3,362,315 906.44 3,709.36 2,927,962 882.70 3,317.05County Total 4,866,983 1,082.78 4,494.90 4,294,751 1,095.88 3,919.00 3,937,974 1,062.48 3,706.40
Snohomish Co.Everett 292,901,741 20,763.49 14,106.58 321,105,164 20,504.54 15,660.20 264,490,487 20,284.59 13,038.99Lake Stevens 169,739,830 9,442.90 17,975.39 163,453,171 9,107.97 17,946.17 170,579,143 8,872.73 19,225.10Mukilteo 293,068,602 16,086.85 18,217.90 165,624,568 16,067.51 10,308.04 182,838,040 15,979.89 11,441.76Edmonds 369,015,603 21,430.28 17,219.36 390,053,631 21,104.97 18,481.60 433,899,841 21,046.04 20,616.70Arlington 54,155,823 5,771.93 9,382.62 37,214,993 5,680.96 6,550.83 44,346,541 5,571.68 7,959.28Marysville 112,144,784 10,675.56 10,504.82 106,163,296 10,833.71 9,799.35 115,517,394 10,985.39 10,515.55Index 316,835 28.83 10,989.78 265,008 29.95 8,848.35 263,408 34.30 7,679.54Monroe 130,665,042 6,627.62 19,715.23 119,441,458 6,712.80 17,793.09 123,314,308 6,829.65 18,055.73Snohomish 337,006,256 9,916.70 33,983.71 333,147,657 9,934.50 33,534.42 354,331,743 10,028.10 35,333.89Lakewood 64,172,871 2,561.35 25,054.32 64,070,940 2,464.09 26,001.87 67,751,863 2,439.19 27,776.38Sultan 10,253,236 2,005.42 5,112.76 8,165,304 1,912.72 4,268.95 8,692,057 2,004.72 4,335.80Darrington 3,378,390 423.55 7,976.37 2,747,322 411.40 6,677.98 3,641,708 403.53 9,024.63Granite Falls 38,939,789 2,134.65 18,241.77 37,620,018 2,012.06 18,697.26 42,132,301 1,995.62 21,112.39Stanwood-Camano 147,111,457 4,854.80 30,302.27 145,649,388 4,671.00 31,181.63 57,001,559 4,606.26 12,374.80County Total 2,022,870,261 112,723.93 17,945.35 1,894,721,918 111,448.18 17,000.92 1,868,800,391 111,081.69 16,823.66
284
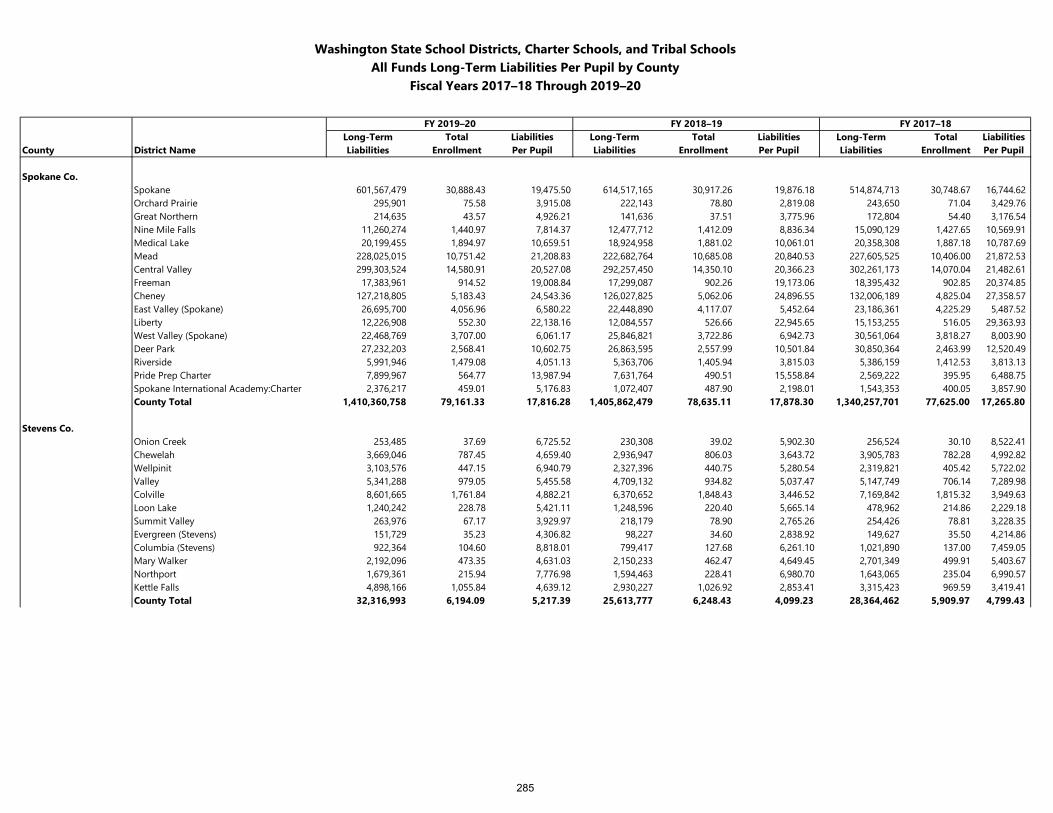
Washington State School Districts, Charter Schools, and Tribal SchoolsAll Funds Long-Term Liabilities Per Pupil by County
Fiscal Years 2017–18 Through 2019–20
FY 2019–20 FY 2018–19 FY 2017–18Long-Term Total Liabilities Long-Term Total Liabilities Long-Term Total Liabilities
County District Name Liabilities Enrollment Per Pupil Liabilities Enrollment Per Pupil Liabilities Enrollment Per Pupil
Spokane Co.Spokane 601,567,479 30,888.43 19,475.50 614,517,165 30,917.26 19,876.18 514,874,713 30,748.67 16,744.62Orchard Prairie 295,901 75.58 3,915.08 222,143 78.80 2,819.08 243,650 71.04 3,429.76Great Northern 214,635 43.57 4,926.21 141,636 37.51 3,775.96 172,804 54.40 3,176.54Nine Mile Falls 11,260,274 1,440.97 7,814.37 12,477,712 1,412.09 8,836.34 15,090,129 1,427.65 10,569.91Medical Lake 20,199,455 1,894.97 10,659.51 18,924,958 1,881.02 10,061.01 20,358,308 1,887.18 10,787.69Mead 228,025,015 10,751.42 21,208.83 222,682,764 10,685.08 20,840.53 227,605,525 10,406.00 21,872.53Central Valley 299,303,524 14,580.91 20,527.08 292,257,450 14,350.10 20,366.23 302,261,173 14,070.04 21,482.61Freeman 17,383,961 914.52 19,008.84 17,299,087 902.26 19,173.06 18,395,432 902.85 20,374.85Cheney 127,218,805 5,183.43 24,543.36 126,027,825 5,062.06 24,896.55 132,006,189 4,825.04 27,358.57East Valley (Spokane) 26,695,700 4,056.96 6,580.22 22,448,890 4,117.07 5,452.64 23,186,361 4,225.29 5,487.52Liberty 12,226,908 552.30 22,138.16 12,084,557 526.66 22,945.65 15,153,255 516.05 29,363.93West Valley (Spokane) 22,468,769 3,707.00 6,061.17 25,846,821 3,722.86 6,942.73 30,561,064 3,818.27 8,003.90Deer Park 27,232,203 2,568.41 10,602.75 26,863,595 2,557.99 10,501.84 30,850,364 2,463.99 12,520.49Riverside 5,991,946 1,479.08 4,051.13 5,363,706 1,405.94 3,815.03 5,386,159 1,412.53 3,813.13Pride Prep Charter 7,899,967 564.77 13,987.94 7,631,764 490.51 15,558.84 2,569,222 395.95 6,488.75Spokane International Academy:Charter 2,376,217 459.01 5,176.83 1,072,407 487.90 2,198.01 1,543,353 400.05 3,857.90County Total 1,410,360,758 79,161.33 17,816.28 1,405,862,479 78,635.11 17,878.30 1,340,257,701 77,625.00 17,265.80
Stevens Co.Onion Creek 253,485 37.69 6,725.52 230,308 39.02 5,902.30 256,524 30.10 8,522.41Chewelah 3,669,046 787.45 4,659.40 2,936,947 806.03 3,643.72 3,905,783 782.28 4,992.82Wellpinit 3,103,576 447.15 6,940.79 2,327,396 440.75 5,280.54 2,319,821 405.42 5,722.02Valley 5,341,288 979.05 5,455.58 4,709,132 934.82 5,037.47 5,147,749 706.14 7,289.98Colville 8,601,665 1,761.84 4,882.21 6,370,652 1,848.43 3,446.52 7,169,842 1,815.32 3,949.63Loon Lake 1,240,242 228.78 5,421.11 1,248,596 220.40 5,665.14 478,962 214.86 2,229.18Summit Valley 263,976 67.17 3,929.97 218,179 78.90 2,765.26 254,426 78.81 3,228.35Evergreen (Stevens) 151,729 35.23 4,306.82 98,227 34.60 2,838.92 149,627 35.50 4,214.86Columbia (Stevens) 922,364 104.60 8,818.01 799,417 127.68 6,261.10 1,021,890 137.00 7,459.05Mary Walker 2,192,096 473.35 4,631.03 2,150,233 462.47 4,649.45 2,701,349 499.91 5,403.67Northport 1,679,361 215.94 7,776.98 1,594,463 228.41 6,980.70 1,643,065 235.04 6,990.57Kettle Falls 4,898,166 1,055.84 4,639.12 2,930,227 1,026.92 2,853.41 3,315,423 969.59 3,419.41County Total 32,316,993 6,194.09 5,217.39 25,613,777 6,248.43 4,099.23 28,364,462 5,909.97 4,799.43
285
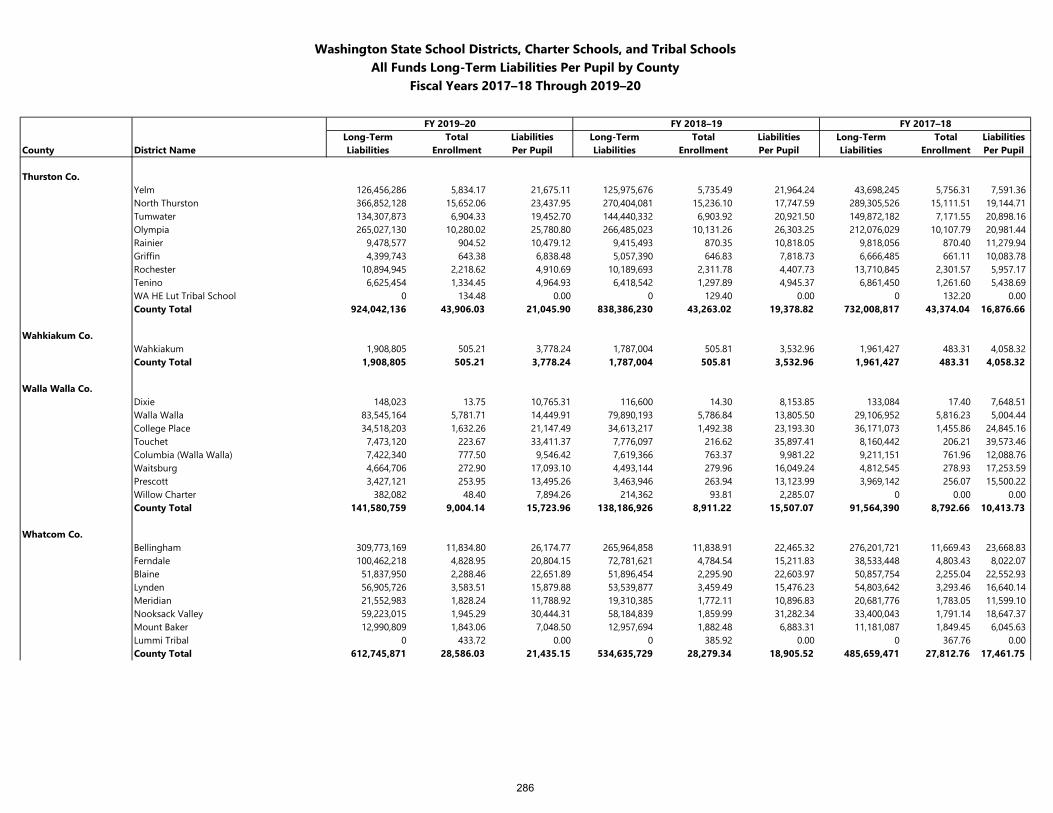
Washington State School Districts, Charter Schools, and Tribal SchoolsAll Funds Long-Term Liabilities Per Pupil by County
Fiscal Years 2017–18 Through 2019–20
FY 2019–20 FY 2018–19 FY 2017–18Long-Term Total Liabilities Long-Term Total Liabilities Long-Term Total Liabilities
County District Name Liabilities Enrollment Per Pupil Liabilities Enrollment Per Pupil Liabilities Enrollment Per Pupil
Thurston Co.Yelm 126,456,286 5,834.17 21,675.11 125,975,676 5,735.49 21,964.24 43,698,245 5,756.31 7,591.36North Thurston 366,852,128 15,652.06 23,437.95 270,404,081 15,236.10 17,747.59 289,305,526 15,111.51 19,144.71Tumwater 134,307,873 6,904.33 19,452.70 144,440,332 6,903.92 20,921.50 149,872,182 7,171.55 20,898.16Olympia 265,027,130 10,280.02 25,780.80 266,485,023 10,131.26 26,303.25 212,076,029 10,107.79 20,981.44Rainier 9,478,577 904.52 10,479.12 9,415,493 870.35 10,818.05 9,818,056 870.40 11,279.94Griffin 4,399,743 643.38 6,838.48 5,057,390 646.83 7,818.73 6,666,485 661.11 10,083.78Rochester 10,894,945 2,218.62 4,910.69 10,189,693 2,311.78 4,407.73 13,710,845 2,301.57 5,957.17Tenino 6,625,454 1,334.45 4,964.93 6,418,542 1,297.89 4,945.37 6,861,450 1,261.60 5,438.69WA HE Lut Tribal School 0 134.48 0.00 0 129.40 0.00 0 132.20 0.00County Total 924,042,136 43,906.03 21,045.90 838,386,230 43,263.02 19,378.82 732,008,817 43,374.04 16,876.66
Wahkiakum Co.Wahkiakum 1,908,805 505.21 3,778.24 1,787,004 505.81 3,532.96 1,961,427 483.31 4,058.32County Total 1,908,805 505.21 3,778.24 1,787,004 505.81 3,532.96 1,961,427 483.31 4,058.32
Walla Walla Co.Dixie 148,023 13.75 10,765.31 116,600 14.30 8,153.85 133,084 17.40 7,648.51Walla Walla 83,545,164 5,781.71 14,449.91 79,890,193 5,786.84 13,805.50 29,106,952 5,816.23 5,004.44College Place 34,518,203 1,632.26 21,147.49 34,613,217 1,492.38 23,193.30 36,171,073 1,455.86 24,845.16Touchet 7,473,120 223.67 33,411.37 7,776,097 216.62 35,897.41 8,160,442 206.21 39,573.46Columbia (Walla Walla) 7,422,340 777.50 9,546.42 7,619,366 763.37 9,981.22 9,211,151 761.96 12,088.76Waitsburg 4,664,706 272.90 17,093.10 4,493,144 279.96 16,049.24 4,812,545 278.93 17,253.59Prescott 3,427,121 253.95 13,495.26 3,463,946 263.94 13,123.99 3,969,142 256.07 15,500.22Willow Charter 382,082 48.40 7,894.26 214,362 93.81 2,285.07 0 0.00 0.00County Total 141,580,759 9,004.14 15,723.96 138,186,926 8,911.22 15,507.07 91,564,390 8,792.66 10,413.73
Whatcom Co.Bellingham 309,773,169 11,834.80 26,174.77 265,964,858 11,838.91 22,465.32 276,201,721 11,669.43 23,668.83Ferndale 100,462,218 4,828.95 20,804.15 72,781,621 4,784.54 15,211.83 38,533,448 4,803.43 8,022.07Blaine 51,837,950 2,288.46 22,651.89 51,896,454 2,295.90 22,603.97 50,857,754 2,255.04 22,552.93Lynden 56,905,726 3,583.51 15,879.88 53,539,877 3,459.49 15,476.23 54,803,642 3,293.46 16,640.14Meridian 21,552,983 1,828.24 11,788.92 19,310,385 1,772.11 10,896.83 20,681,776 1,783.05 11,599.10Nooksack Valley 59,223,015 1,945.29 30,444.31 58,184,839 1,859.99 31,282.34 33,400,043 1,791.14 18,647.37Mount Baker 12,990,809 1,843.06 7,048.50 12,957,694 1,882.48 6,883.31 11,181,087 1,849.45 6,045.63Lummi Tribal 0 433.72 0.00 0 385.92 0.00 0 367.76 0.00County Total 612,745,871 28,586.03 21,435.15 534,635,729 28,279.34 18,905.52 485,659,471 27,812.76 17,461.75
286
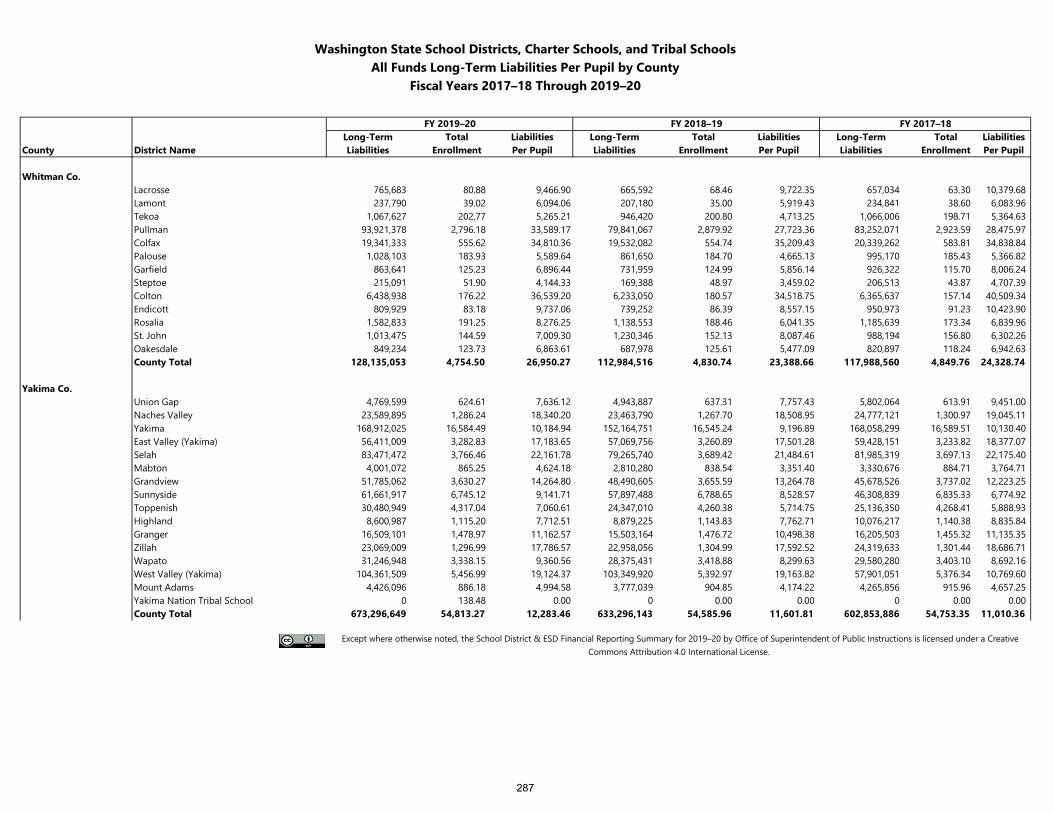
Washington State School Districts, Charter Schools, and Tribal SchoolsAll Funds Long-Term Liabilities Per Pupil by County
Fiscal Years 2017–18 Through 2019–20
FY 2019–20 FY 2018–19 FY 2017–18Long-Term Total Liabilities Long-Term Total Liabilities Long-Term Total Liabilities
County District Name Liabilities Enrollment Per Pupil Liabilities Enrollment Per Pupil Liabilities Enrollment Per Pupil
Whitman Co.Lacrosse 765,683 80.88 9,466.90 665,592 68.46 9,722.35 657,034 63.30 10,379.68Lamont 237,790 39.02 6,094.06 207,180 35.00 5,919.43 234,841 38.60 6,083.96Tekoa 1,067,627 202.77 5,265.21 946,420 200.80 4,713.25 1,066,006 198.71 5,364.63Pullman 93,921,378 2,796.18 33,589.17 79,841,067 2,879.92 27,723.36 83,252,071 2,923.59 28,475.97Colfax 19,341,333 555.62 34,810.36 19,532,082 554.74 35,209.43 20,339,262 583.81 34,838.84Palouse 1,028,103 183.93 5,589.64 861,650 184.70 4,665.13 995,170 185.43 5,366.82Garfield 863,641 125.23 6,896.44 731,959 124.99 5,856.14 926,322 115.70 8,006.24Steptoe 215,091 51.90 4,144.33 169,388 48.97 3,459.02 206,513 43.87 4,707.39Colton 6,438,938 176.22 36,539.20 6,233,050 180.57 34,518.75 6,365,637 157.14 40,509.34Endicott 809,929 83.18 9,737.06 739,252 86.39 8,557.15 950,973 91.23 10,423.90Rosalia 1,582,833 191.25 8,276.25 1,138,553 188.46 6,041.35 1,185,639 173.34 6,839.96St. John 1,013,475 144.59 7,009.30 1,230,346 152.13 8,087.46 988,194 156.80 6,302.26Oakesdale 849,234 123.73 6,863.61 687,978 125.61 5,477.09 820,897 118.24 6,942.63County Total 128,135,053 4,754.50 26,950.27 112,984,516 4,830.74 23,388.66 117,988,560 4,849.76 24,328.74
Yakima Co.Union Gap 4,769,599 624.61 7,636.12 4,943,887 637.31 7,757.43 5,802,064 613.91 9,451.00Naches Valley 23,589,895 1,286.24 18,340.20 23,463,790 1,267.70 18,508.95 24,777,121 1,300.97 19,045.11Yakima 168,912,025 16,584.49 10,184.94 152,164,751 16,545.24 9,196.89 168,058,299 16,589.51 10,130.40East Valley (Yakima) 56,411,009 3,282.83 17,183.65 57,069,756 3,260.89 17,501.28 59,428,151 3,233.82 18,377.07Selah 83,471,472 3,766.46 22,161.78 79,265,740 3,689.42 21,484.61 81,985,319 3,697.13 22,175.40Mabton 4,001,072 865.25 4,624.18 2,810,280 838.54 3,351.40 3,330,676 884.71 3,764.71Grandview 51,785,062 3,630.27 14,264.80 48,490,605 3,655.59 13,264.78 45,678,526 3,737.02 12,223.25Sunnyside 61,661,917 6,745.12 9,141.71 57,897,488 6,788.65 8,528.57 46,308,839 6,835.33 6,774.92Toppenish 30,480,949 4,317.04 7,060.61 24,347,010 4,260.38 5,714.75 25,136,350 4,268.41 5,888.93Highland 8,600,987 1,115.20 7,712.51 8,879,225 1,143.83 7,762.71 10,076,217 1,140.38 8,835.84Granger 16,509,101 1,478.97 11,162.57 15,503,164 1,476.72 10,498.38 16,205,503 1,455.32 11,135.35Zillah 23,069,009 1,296.99 17,786.57 22,958,056 1,304.99 17,592.52 24,319,633 1,301.44 18,686.71Wapato 31,246,948 3,338.15 9,360.56 28,375,431 3,418.88 8,299.63 29,580,280 3,403.10 8,692.16West Valley (Yakima) 104,361,509 5,456.99 19,124.37 103,349,920 5,392.97 19,163.82 57,901,051 5,376.34 10,769.60Mount Adams 4,426,096 886.18 4,994.58 3,777,039 904.85 4,174.22 4,265,856 915.96 4,657.25Yakima Nation Tribal School 0 138.48 0.00 0 0.00 0.00 0 0.00 0.00County Total 673,296,649 54,813.27 12,283.46 633,296,143 54,585.96 11,601.81 602,853,886 54,753.35 11,010.36
Except where otherwise noted, the School District & ESD Financial Reporting Summary for 2019–20 by Office of Superintendent of Public Instructions is licensed under a Creative Commons Attribution 4.0 International License.
287
Related Documents