Section 3B- Modules 12/13 Unemployment

Welcome message from author
This document is posted to help you gain knowledge. Please leave a comment to let me know what you think about it! Share it to your friends and learn new things together.
Transcript
Section 3B- Modules 12/13
Unemployment
Unemployment
Chapter Outline
Unemployment• Calculation of Unemployment• Categories of Unemployment• Types of Unemployment• Full/Natural/Actual Unemployment
LABOR MARKET INDICATORS
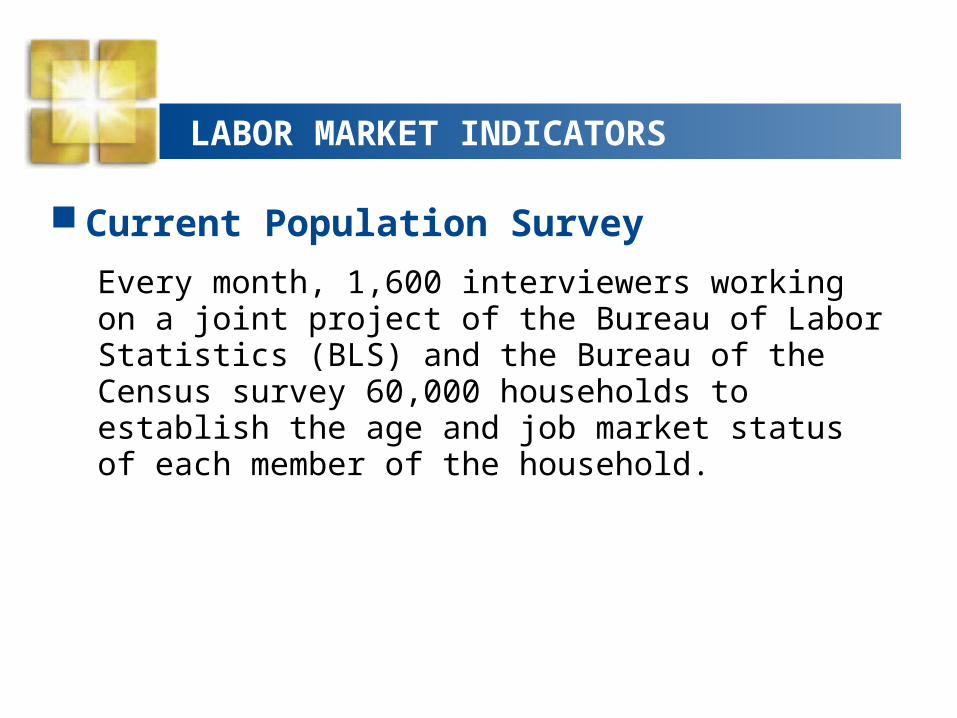
Current Population Survey
Every month, 1,600 interviewers working on a joint project of the Bureau of Labor Statistics (BLS) and the Bureau of the Census survey 60,000 households to establish the age and job market status of each member of the household.
LABOR MARKET INDICATORS
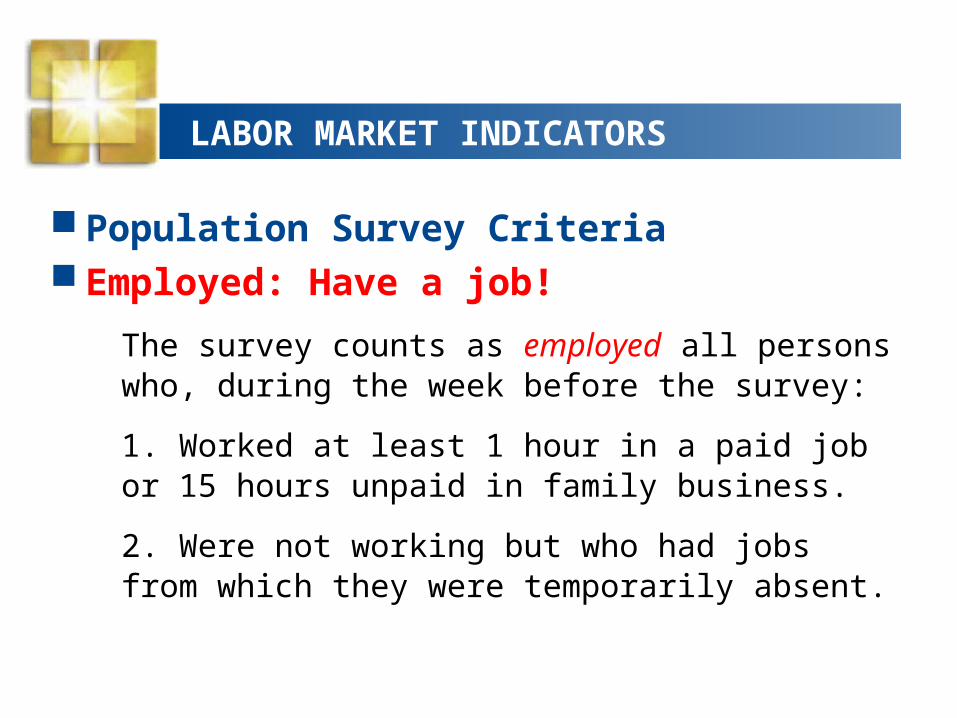
Population Survey Criteria Employed: Have a job!
The survey counts as employed all persons who, during the week before the survey:
1. Worked at least 1 hour in a paid job or 15 hours unpaid in family business.
2. Were not working but who had jobs from which they were temporarily absent.
LABOR MARKET INDICATORS
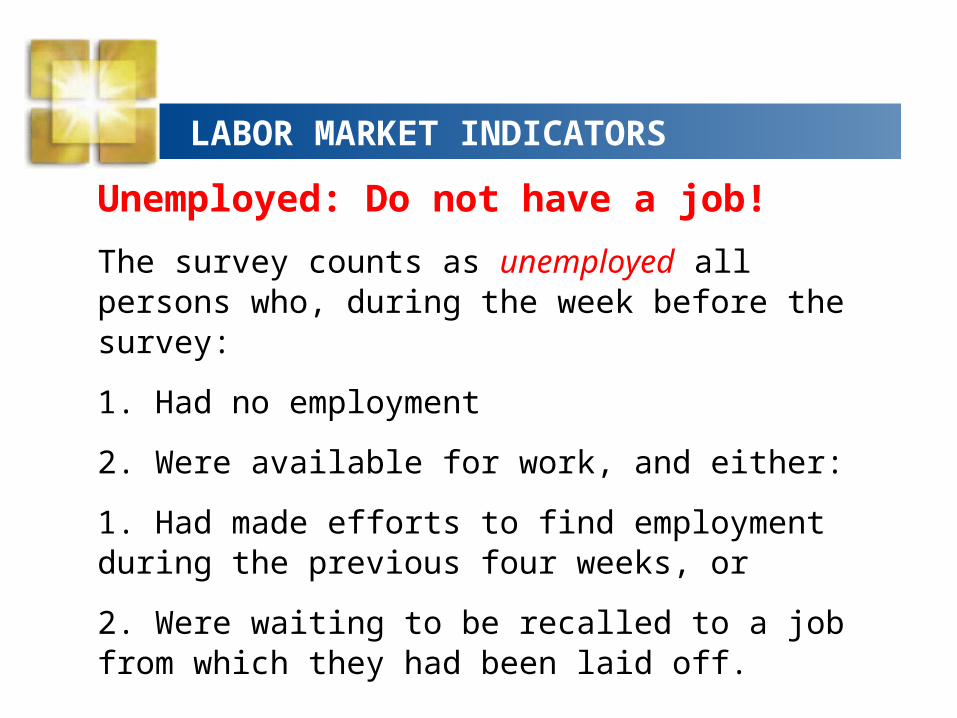
Unemployed: Do not have a job!
The survey counts as unemployed all persons who, during the week before the survey:
1. Had no employment
2. Were available for work, and either:
1. Had made efforts to find employment during the previous four weeks, or
2. Were waiting to be recalled to a job from which they had been laid off.
Unemployment
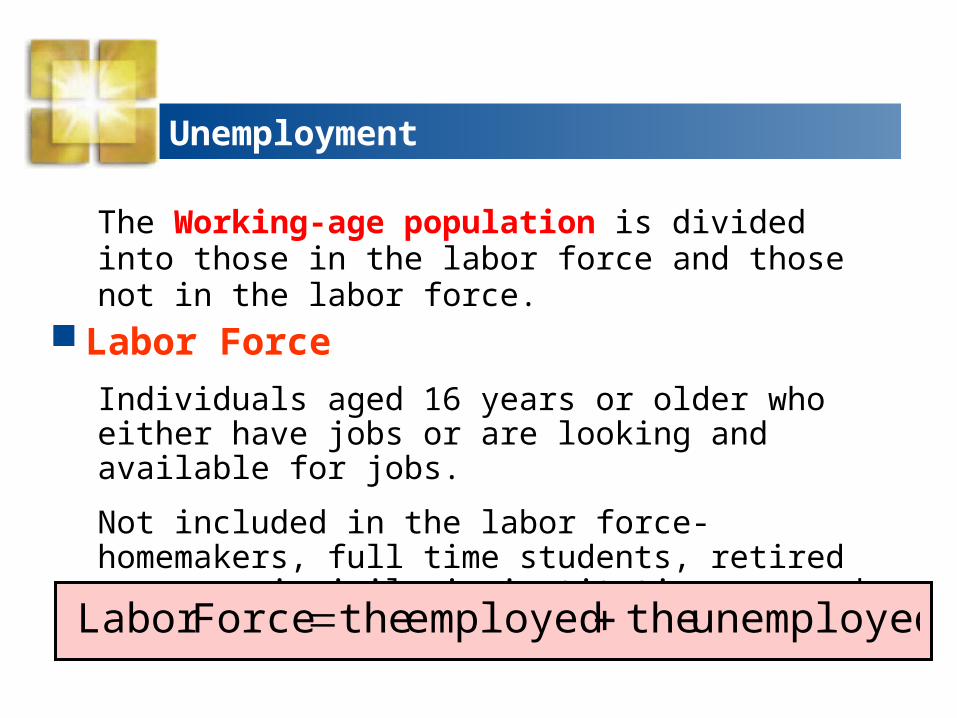
The Working-age population is divided into those in the labor force and those not in the labor force.
Labor Force
Individuals aged 16 years or older who either have jobs or are looking and available for jobs.
Not included in the labor force- homemakers, full time students, retired persons, in jail, in institutions, armed forces, disabled.
unemployed the employed the Force Labor
LABOR MARKET INDICATORS
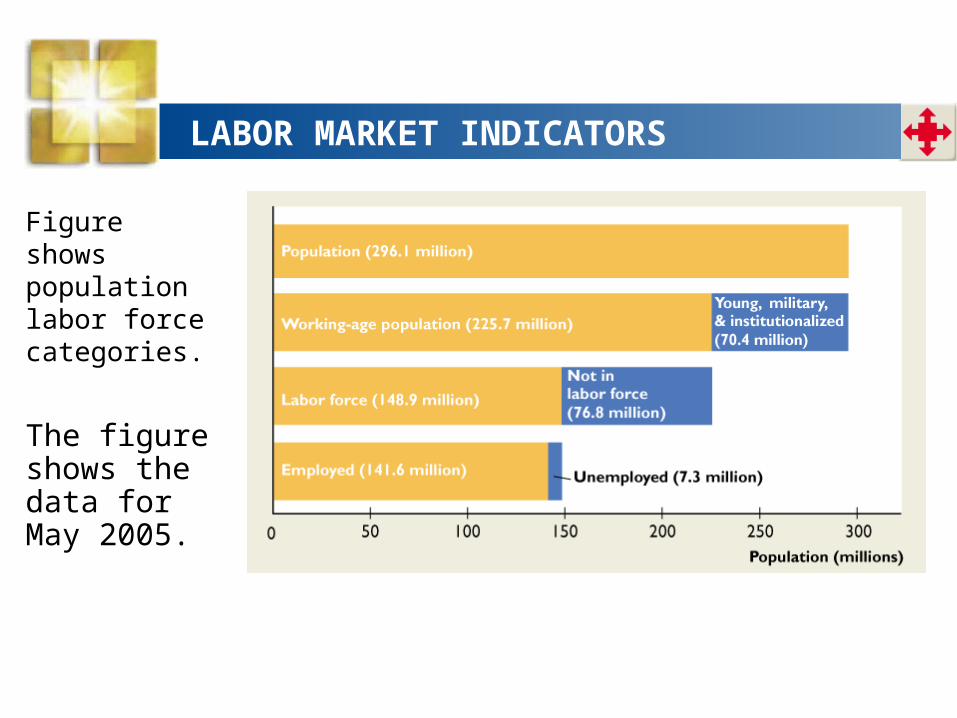
Figure shows population labor force categories.
The figure shows the data for May 2005.
Unemployment
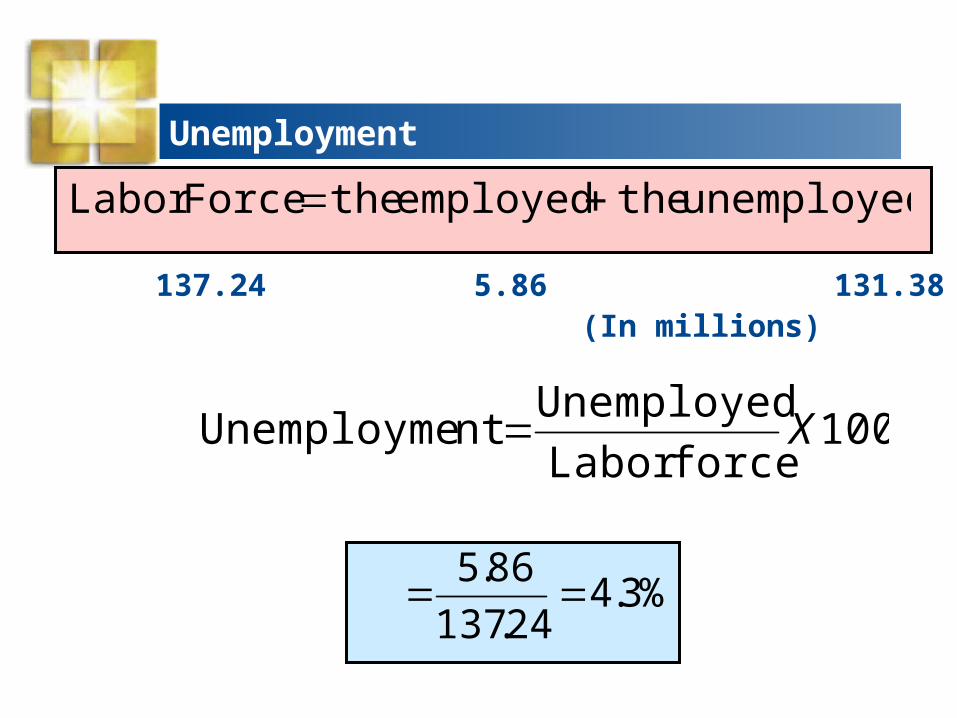
137.24 5.86 131.38 (In millions)
unemployed the employed the Force Labor
100Xforce Labor
Unemployed ntUnemployme
%3.424.137
86.5
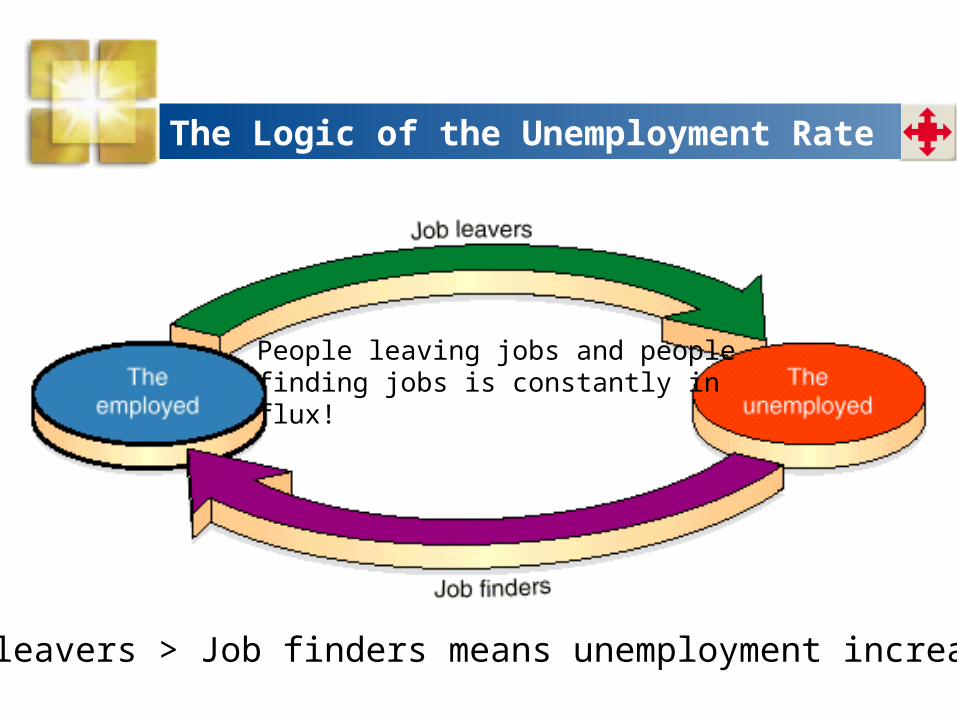
The Logic of the Unemployment Rate
People leaving jobs and peoplefinding jobs is constantly in flux!
Job leavers > Job finders means unemployment increases.
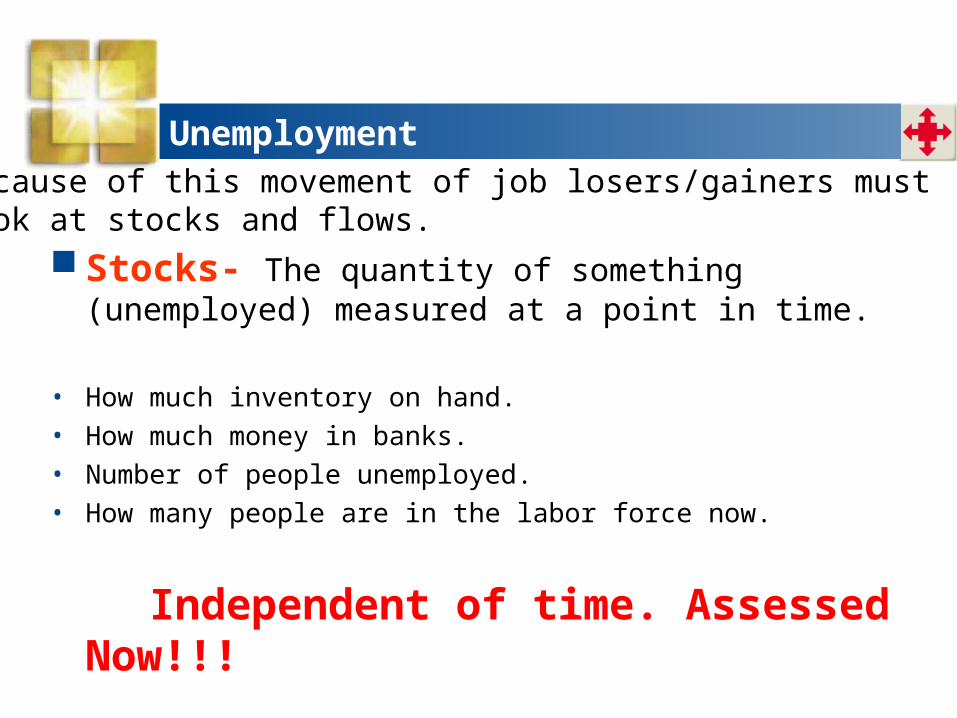
Unemployment
Stocks- The quantity of something (unemployed) measured at a point in time.
• How much inventory on hand.• How much money in banks.• Number of people unemployed.• How many people are in the labor force now.
Independent of time. Assessed Now!!!
Because of this movement of job losers/gainers mustlook at stocks and flows.
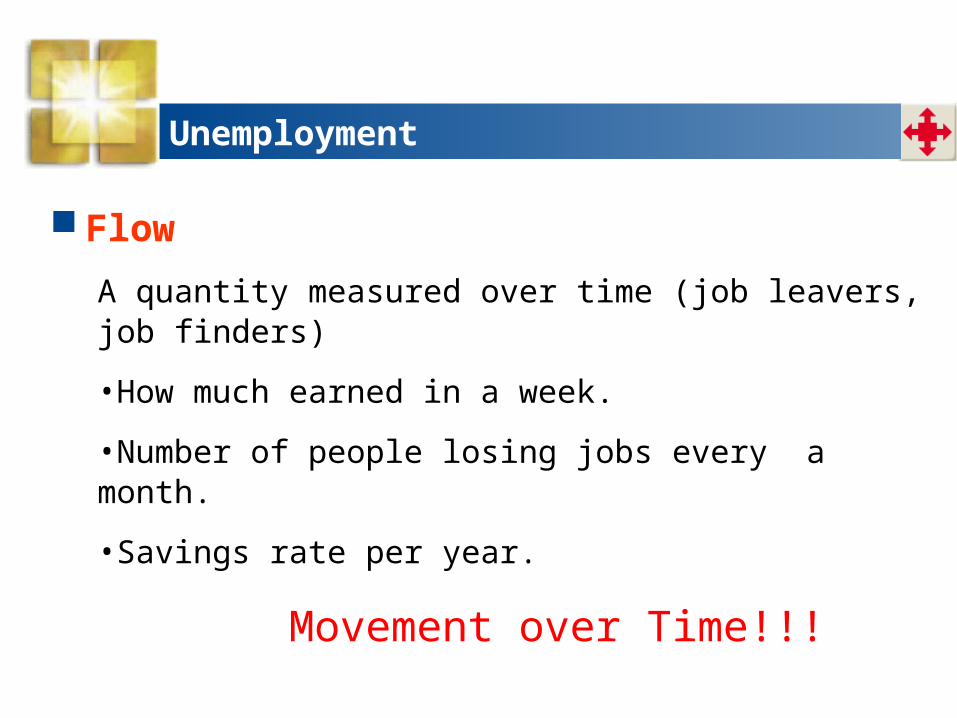
Unemployment
Flow
A quantity measured over time (job leavers, job finders)
•How much earned in a week.
•Number of people losing jobs every a month.
•Savings rate per year.
Movement over Time!!!
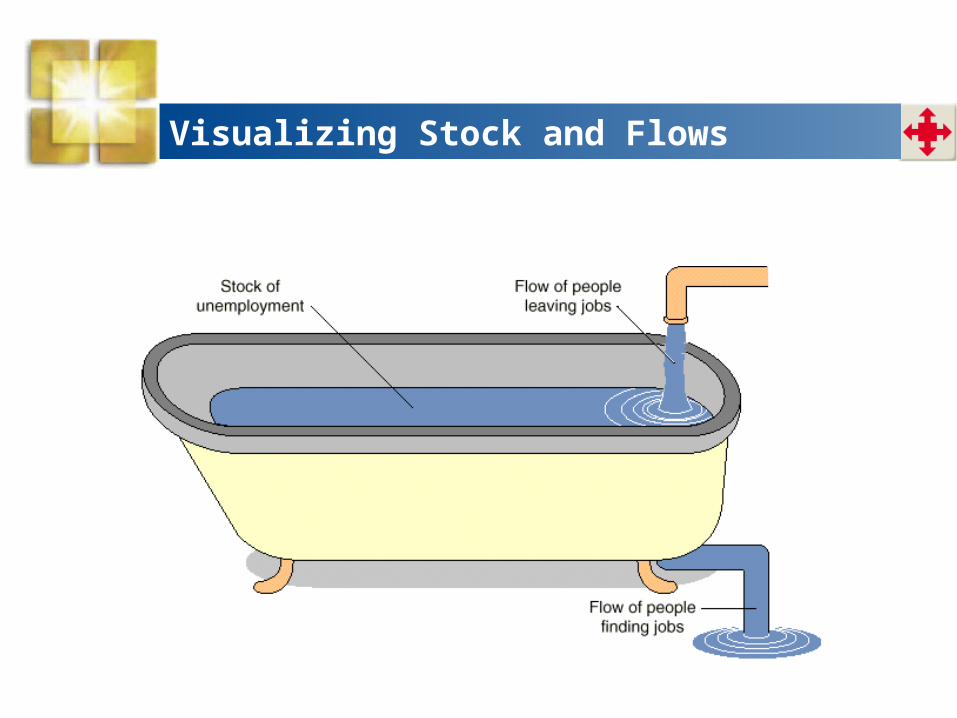
Visualizing Stock and Flows
Unemployment
Unemployment Categories
1) Job loser
2) Reentrant
3) Job leaver
4) New entrant
Unemployment
Job Loser
An individual whose employment was involuntarily terminated or who was laid off
• 40-60% of the unemployed
Unemployment
Reentrant
An individual who has worked a full-time job before but left the labor force and has now reentered it looking for a job
• 20-30% of the unemployed
Unemployment
Job Leaver
An individual who voluntarily ended employment
• Less than 10% to around 15% of the unemployed
Unemployment
New Entrant
An individual who has never worked a full-time job for two weeks or longer
• 10-13% of the unemployed
SOURCES AND TYPES OF UNEMPLOYMENT
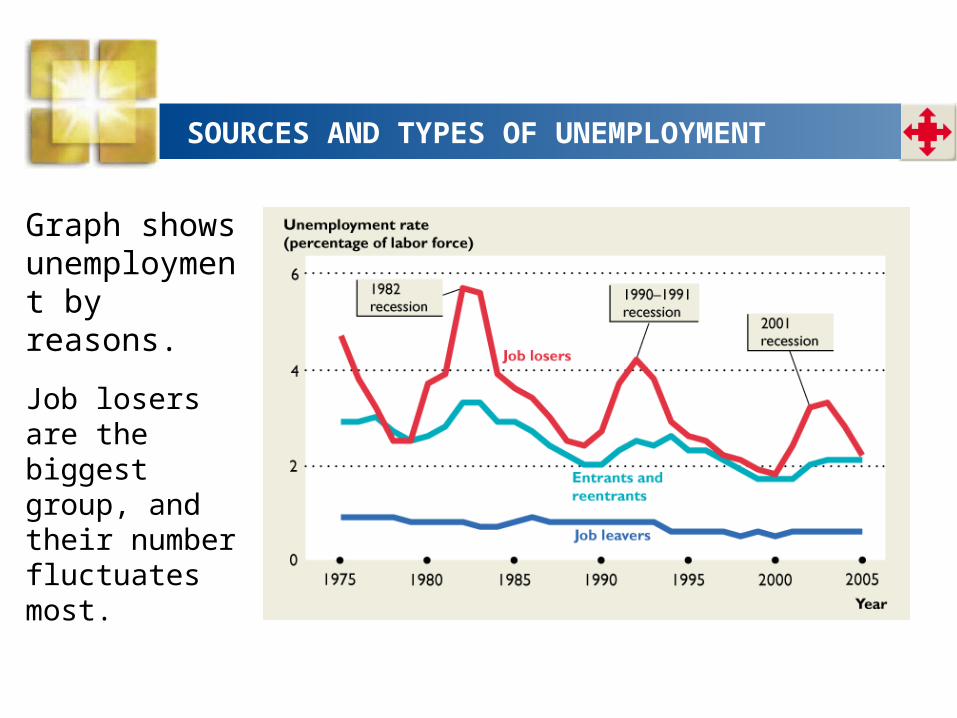
Graph shows unemployment by reasons.
Job losers are the biggest group, and their number fluctuates most.
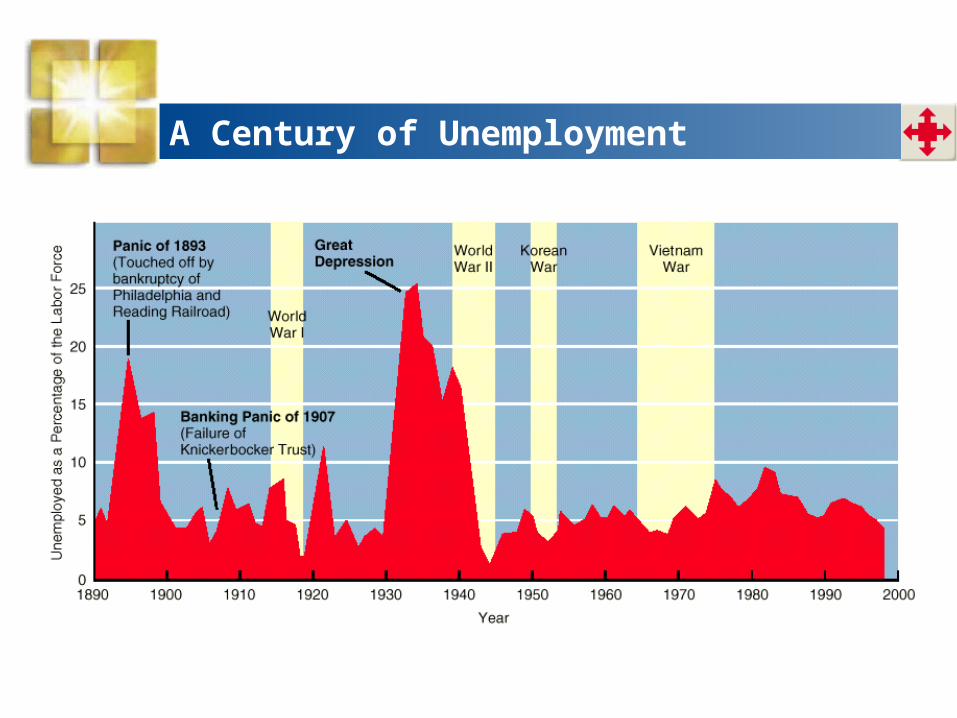
A Century of Unemployment
Unemployment
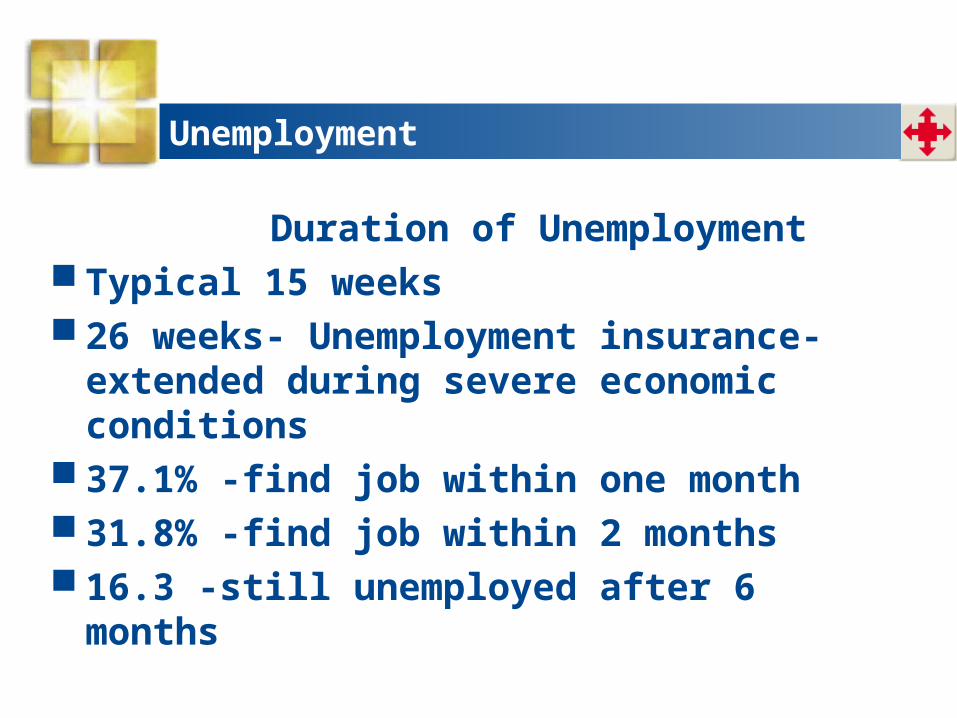
Duration of Unemployment Typical 15 weeks 26 weeks- Unemployment insurance-
extended during severe economic conditions 37.1% -find job within one month 31.8% -find job within 2 months 16.3 -still unemployed after 6 months
LABOR TRENDS AND FLUCTUATIONS
Unemployment
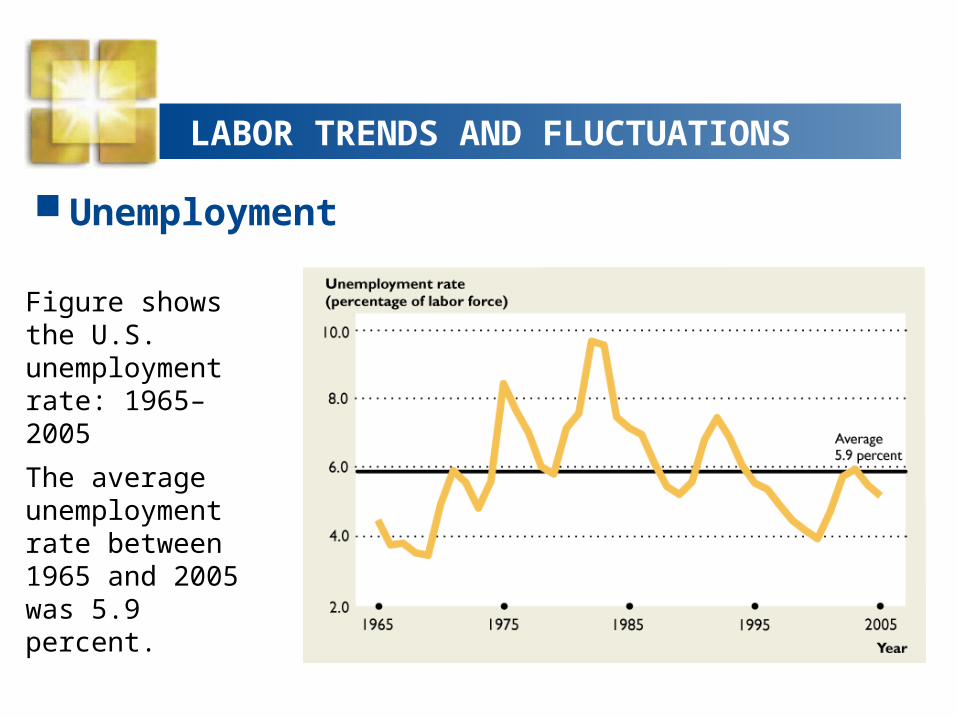
Figure shows the U.S. unemployment rate: 1965–2005
The average unemployment rate between 1965 and 2005 was 5.9 percent.
LABOR TRENDS AND FLUCTUATIONS
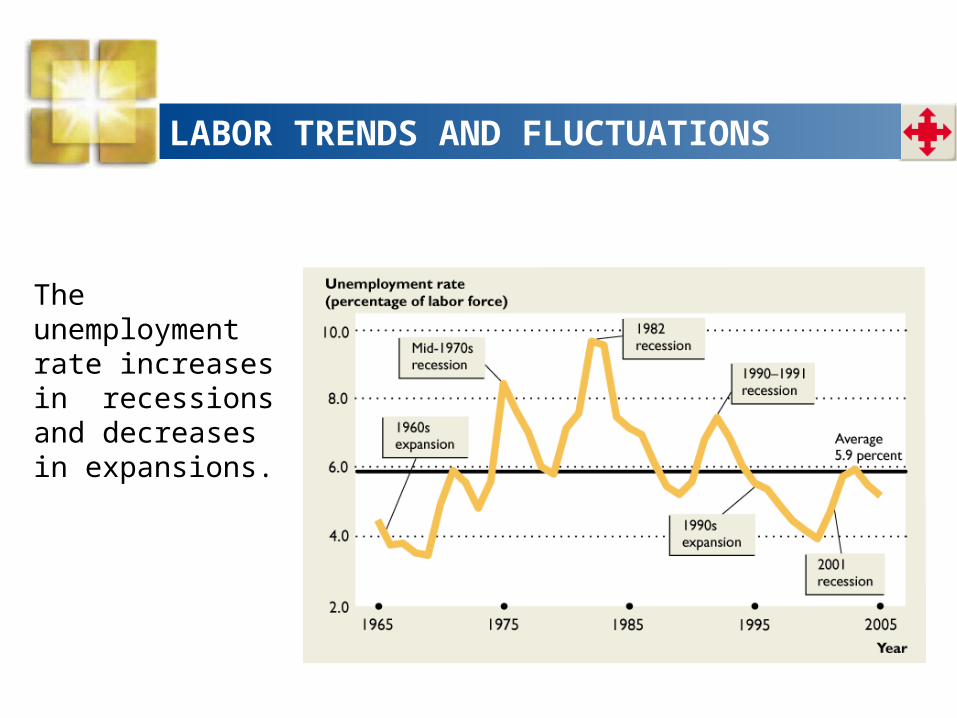
The unemployment rate increases in recessions and decreases in expansions.
LABOR MARKET INDICATORS
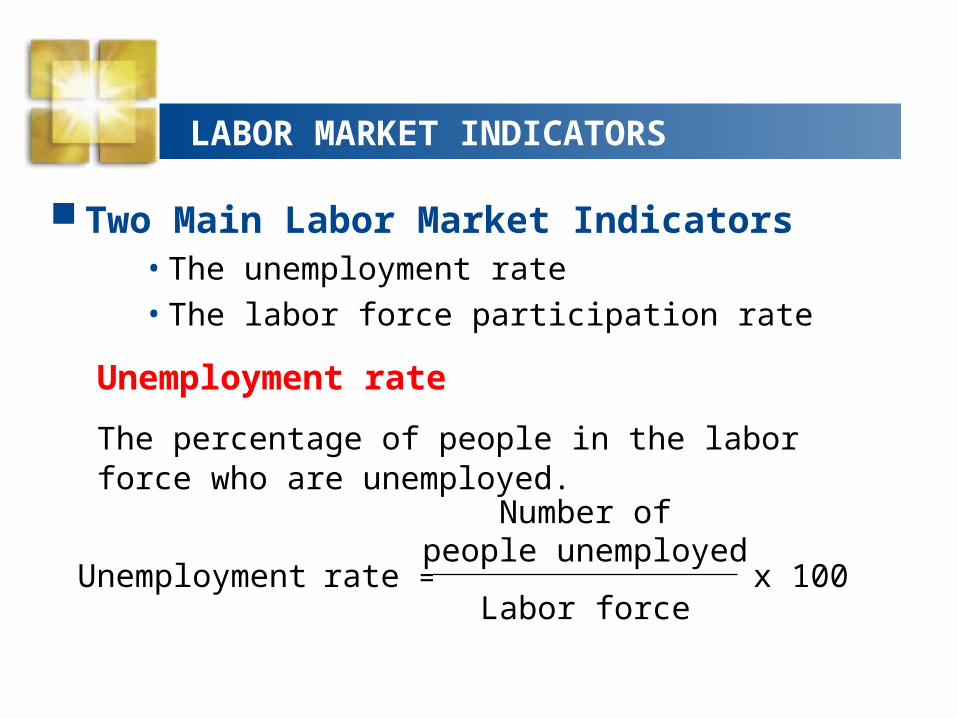
Two Main Labor Market Indicators• The unemployment rate• The labor force participation rate
Unemployment rate
The percentage of people in the labor force who are unemployed.
Unemployment rate =
Number ofpeople unemployed
x 100Labor force
Unemployment Issues
* Factors that give a false read on the unemployment rate
Duration of Unemployment: The average duration for all employed workers over the past decade is 15.2 weeks. The duration of unemployment increases when the overall activity slows down and falls when it speeds up.
Discouraged worker: A person who does not have a job, is available to work, but has not made efforts to find a job within the previous four weeks. Not counted as part of the labor force. Makes the unemployment rate lower than it actually is, would be higher if counted.
Unemployment Issues
Semi-Hidden Unemployment- Part-time workers who would rather work full-time, but cannot find a full-time job. These workers are counted as fully employed, but should be counted as half a worker. Understates the unemployment rate.
Overemployment- Persons who work more than 40 hours a week or who have two jobs. These workers are only counted as one worker. Should be counted as two workers. Overstates the unemployment rate.
LABOR MARKET INDICATORS
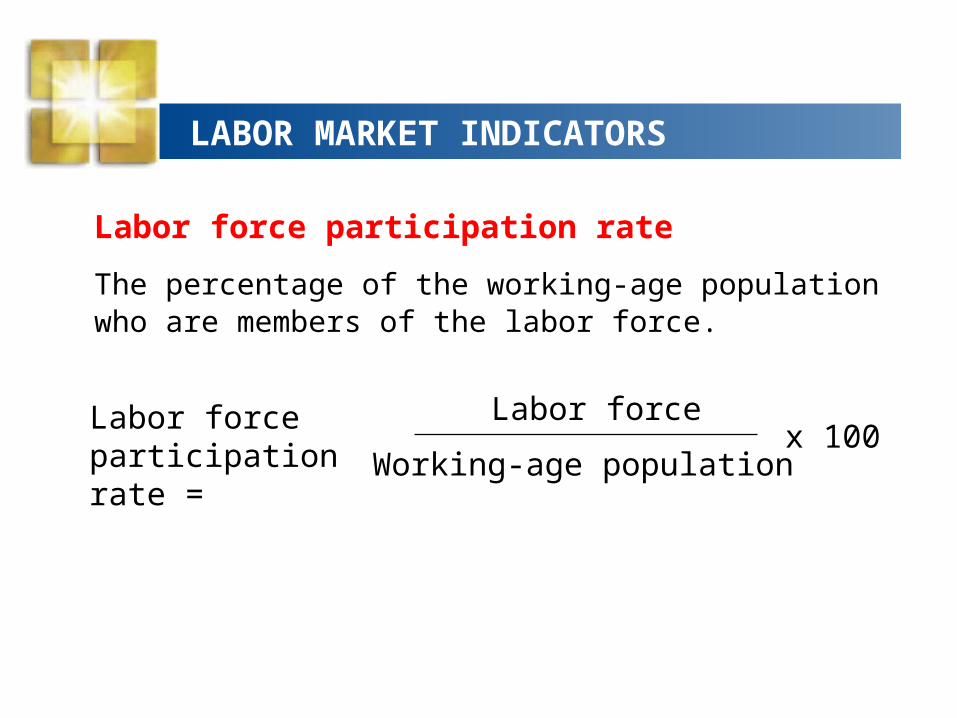
Labor force participation rate
The percentage of the working-age population who are members of the labor force.
Labor force participation rate = Working-age population
x 100Labor force
LABOR TRENDS AND FLUCTUATIONS
The Participation Rate
The participation rate increased from 59 percent during the 1960s to 67 percent the 2000.
Since 2000, the participation rate has fallen slightly.
Between 1965 and 1999, the participation rate for women increased from 39 percent to 60 percent.
Between 1965 and 2005, the participation rate for men decreased from 81 percent to 73 percent.
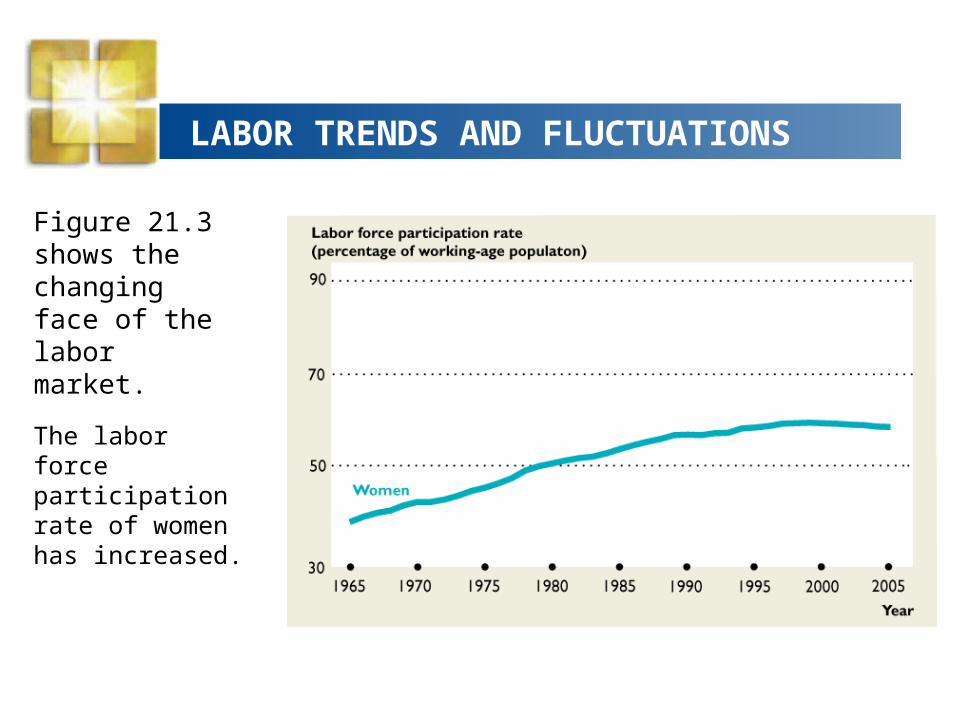
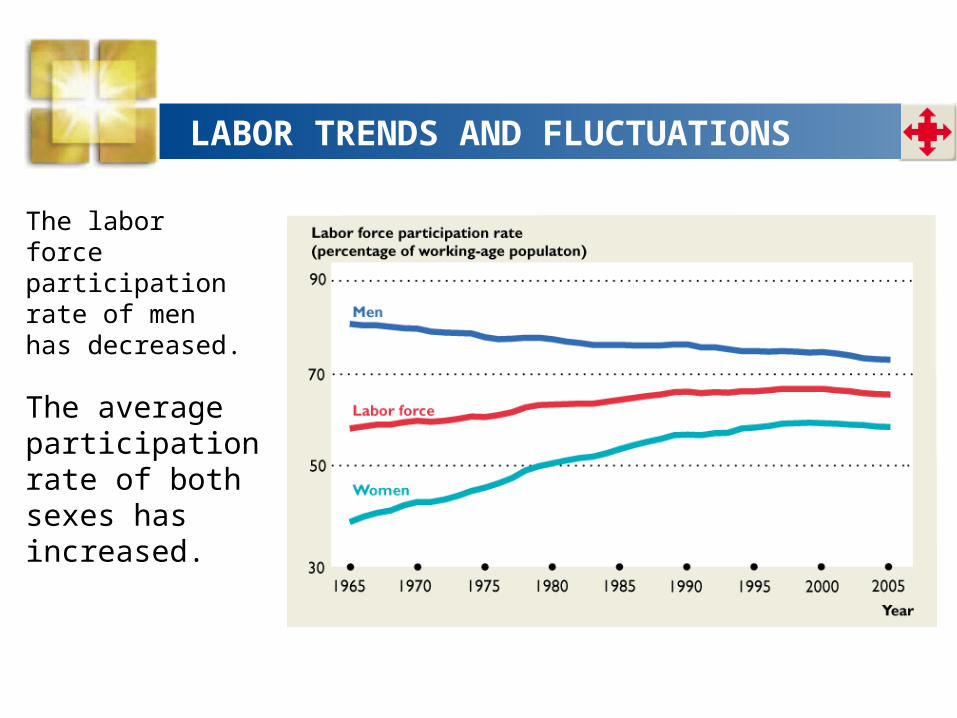
LABOR TRENDS AND FLUCTUATIONS
Figure 21.3 shows the changing face of the labor market.
The labor force participation rate of women has increased.
LABOR TRENDS AND FLUCTUATIONS
The labor force participation rate of men has decreased.
The average participation rate of both sexes hasincreased.
SOURCES AND TYPES OF UNEMPLOYMENT
Types of Unemployment
Frictional unemployment
The unemployment that arises from normal labor turnover—from people entering and leaving the labor force and from the ongoing creation and destruction of jobs.
Structural unemployment
The unemployment that arises when changes in technology or international competition change the skills needed to perform jobs or change the locations of jobs.
SOURCES AND TYPES OF UNEMPLOYMENT
Seasonal unemployment
The unemployment that arises because of seasonal weather patterns.
Cyclical unemployment
The fluctuating unemployment over the business cycle that increases during a recession and decreases during an expansion.
Unemployment
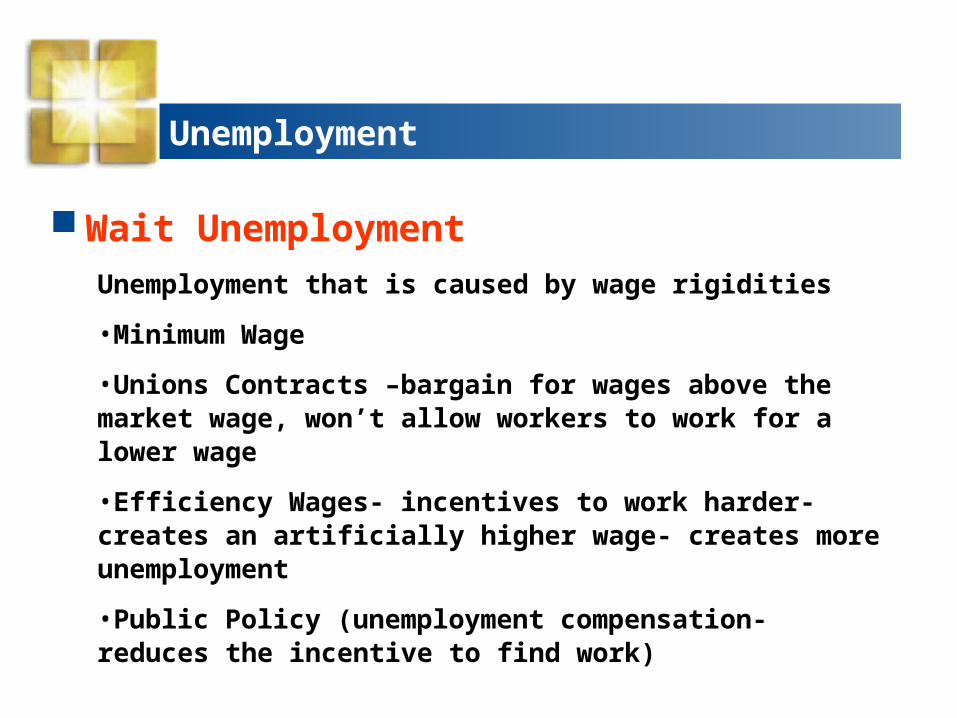
Wait Unemployment
Unemployment that is caused by wage rigidities
•Minimum Wage
•Unions Contracts –bargain for wages above the market wage, won’t allow workers to work for a lower wage
•Efficiency Wages- incentives to work harder- creates an artificially higher wage- creates more unemployment
•Public Policy (unemployment compensation- reduces the incentive to find work)
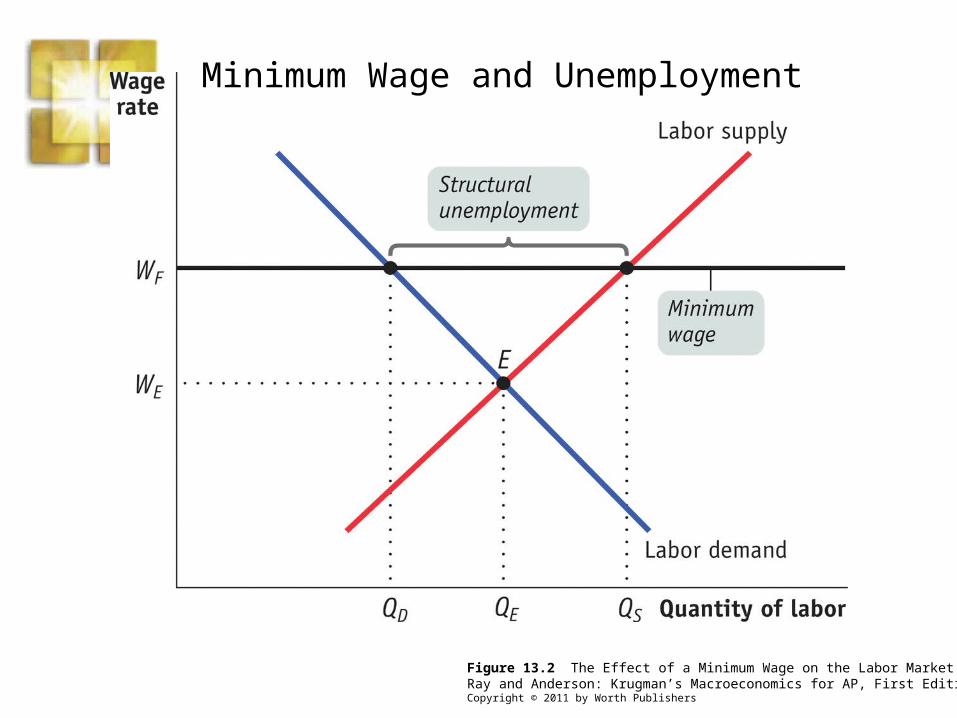
Figure 13.2 The Effect of a Minimum Wage on the Labor MarketRay and Anderson: Krugman’s Macroeconomics for AP, First EditionCopyright © 2011 by Worth Publishers
Minimum Wage and Unemployment
SOURCES AND TYPES OF UNEMPLOYMENT
Full Employment
Full employment
When there is no cyclical unemployment or, equivalently, when all the unemployment is frictional or structural.
Natural unemployment rate
The unemployment rate when the economy is at full employment.
Actual Unemployment rate
Full employment + cyclical unemployment
SOURCES AND TYPES OF UNEMPLOYMENT
Unemployment and Real GDP
Cyclical unemployment is the fluctuating unemployment over the business cycle—unemployment increases during recessions and decreases during expansions.
At full employment, there is no cyclical unemployment.
At the business cycle trough, cyclical unemployment is positive.
At the business cycle peak, cyclical unemployment is negative.
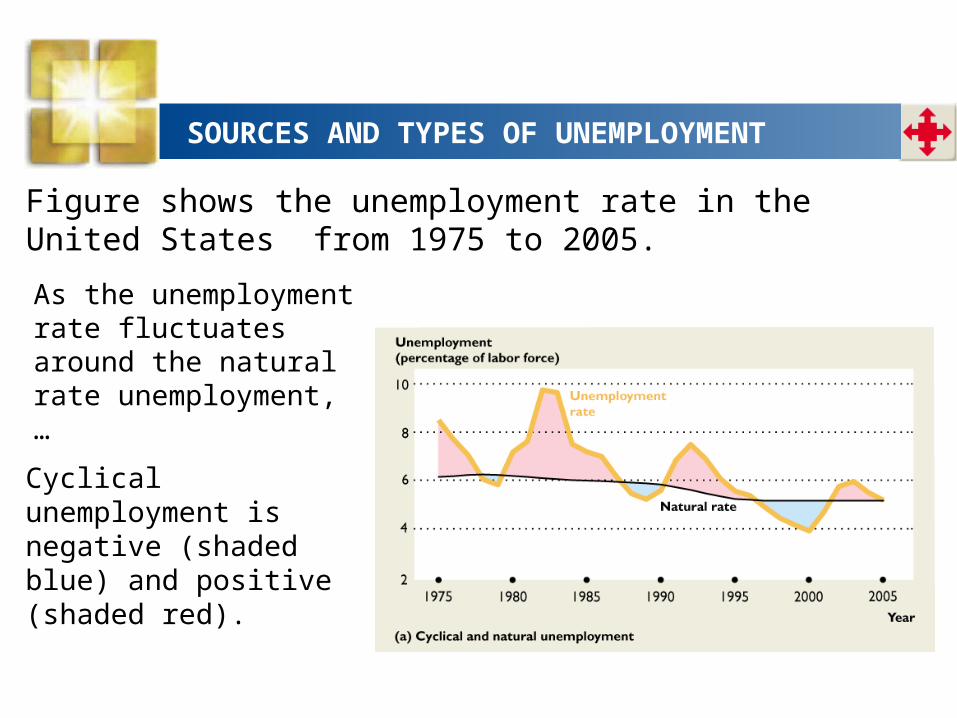
Figure shows the unemployment rate in the United States from 1975 to 2005.
As the unemployment rate fluctuatesaround the natural rate unemployment, …
SOURCES AND TYPES OF UNEMPLOYMENT
Cyclical unemployment is negative (shaded blue) and positive (shaded red).
SOURCES AND TYPES OF UNEMPLOYMENT
Potential GDP is the level of real GDP that the economy would produce if it were at full employment.
Because the unemployment rate fluctuates around the natural unemployment rate, real GDP fluctuates around potential GDP:
• When the unemployment rate is above the natural rate, real GDP is below potential GDP.
• When the unemployment rate is below the natural unemployment rate, real GDP is above potential GDP.
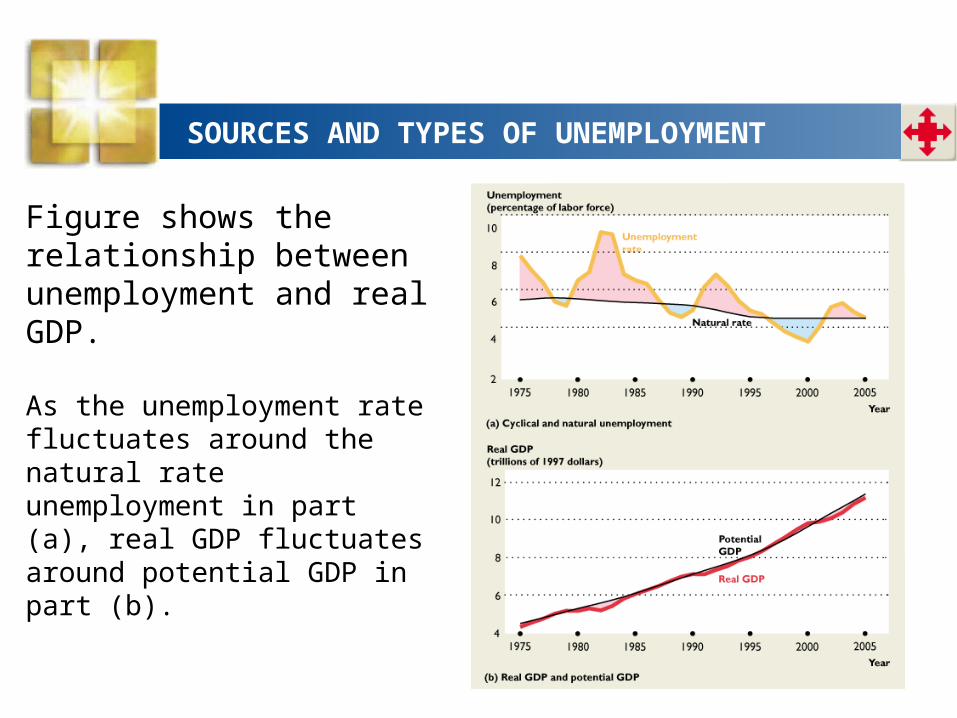
Figure shows the relationship between unemployment and real GDP.
As the unemployment rate fluctuates around the natural rate unemployment in part (a), real GDP fluctuates around potential GDP in part (b).
SOURCES AND TYPES OF UNEMPLOYMENT
Related Documents