Reliable power when and where you need it. Clean and simple. Second Quarter Fiscal Year 2018 Earnings Call November 2, 2017

Welcome message from author
This document is posted to help you gain knowledge. Please leave a comment to let me know what you think about it! Share it to your friends and learn new things together.
Transcript

Reliable power when and where you need it. Clean and simple.
Second Quarter Fiscal Year 2018Earnings Call
November 2, 2017
Safe Harbor Statement
This presentation contains “forward-looking statements” regarding future events or financial performance of the
Company, within the meaning of the Safe Harbor provisions of the Private Securities Litigation Reform Act of 1995.
These statements relate to, among other things, Capstone’s competitive advantage, increased dependence on
distributed generation, achievement of Company’s three-pronged business profitability plan, including: continued
cost reductions, adoption of Company’s Signature Series product and accessories offerings, and the success of
Capstone Energy Finance; increasing revenues from: geographic and market diversification, Capstone Energy
Finance, Aftermarket Service growth, the Sell-to-Win Program, FPP Contracts, new spare parts programs, spare
parts price increases, and Signature Series upgrade kits; attainment of Company’s continuous improvement
business initiatives, including: capitalizing on Capstone Energy Finance, cost reductions, increase CHP product
sales, increase in FPP service revenue, increase in spare parts revenue, closing out of the C200 reliability
program, continuous and ongoing product development efforts, balance sheet management and cash burn
minimization efforts; and achievement of Adjusted EBITDA breakeven and profitability.
Forward-looking statements may be identified by words such as “believe,” “expect," "objective," "intend," "targeted,"
"plan" and similar phrases.
These forward-looking statements are subject to numerous assumptions, risks and uncertainties described in
Company's Form 10-K, Form 10-Q and other recent filings with the Securities and Exchange Commission that may
cause Company's actual results to be materially different from any future results expressed or implied in such
statements. Because of the risks and uncertainties, Company cautions you not to place undue reliance on these
statements, which speak only as of today. The Company undertakes no obligation, and specifically disclaims any
obligation, to release any revision to any forward-looking statements to reflect events or circumstances after the
date of this conference call or to reflect the occurrence of unanticipated events.
Q2FY2018 Business Highlights
3
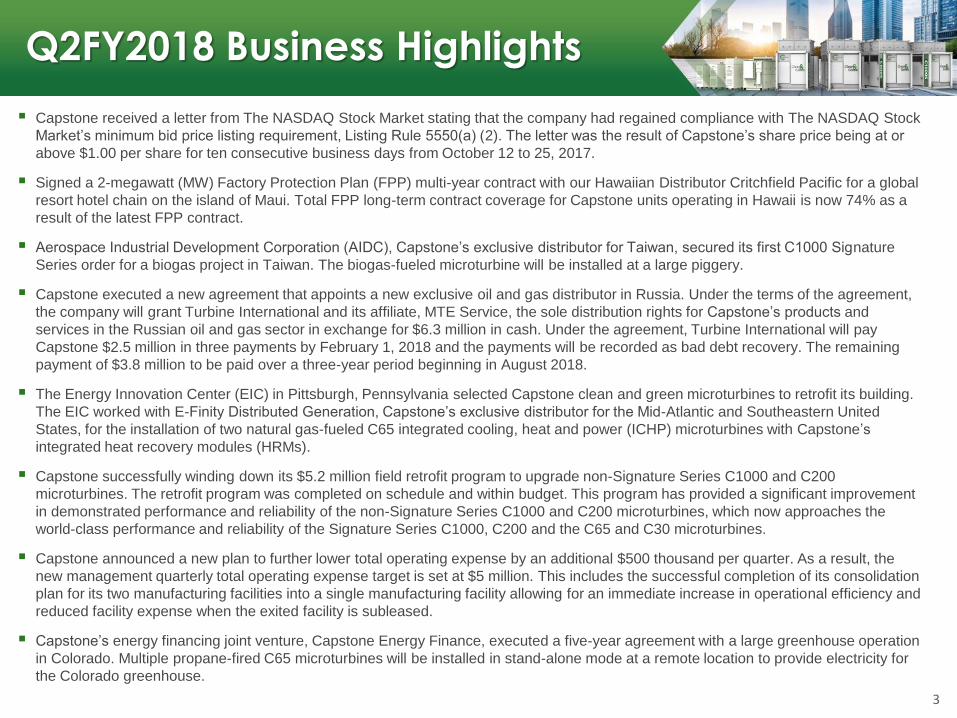
Capstone received a letter from The NASDAQ Stock Market stating that the company had regained compliance with The NASDAQ Stock
Market’s minimum bid price listing requirement, Listing Rule 5550(a) (2). The letter was the result of Capstone’s share price being at or
above $1.00 per share for ten consecutive business days from October 12 to 25, 2017.
Signed a 2-megawatt (MW) Factory Protection Plan (FPP) multi-year contract with our Hawaiian Distributor Critchfield Pacific for a global
resort hotel chain on the island of Maui. Total FPP long-term contract coverage for Capstone units operating in Hawaii is now 74% as a
result of the latest FPP contract.
Aerospace Industrial Development Corporation (AIDC), Capstone’s exclusive distributor for Taiwan, secured its first C1000 Signature
Series order for a biogas project in Taiwan. The biogas-fueled microturbine will be installed at a large piggery.
Capstone executed a new agreement that appoints a new exclusive oil and gas distributor in Russia. Under the terms of the agreement,
the company will grant Turbine International and its affiliate, MTE Service, the sole distribution rights for Capstone’s products and
services in the Russian oil and gas sector in exchange for $6.3 million in cash. Under the agreement, Turbine International will pay
Capstone $2.5 million in three payments by February 1, 2018 and the payments will be recorded as bad debt recovery. The remaining
payment of $3.8 million to be paid over a three-year period beginning in August 2018.
The Energy Innovation Center (EIC) in Pittsburgh, Pennsylvania selected Capstone clean and green microturbines to retrofit its building.
The EIC worked with E-Finity Distributed Generation, Capstone’s exclusive distributor for the Mid-Atlantic and Southeastern United
States, for the installation of two natural gas-fueled C65 integrated cooling, heat and power (ICHP) microturbines with Capstone’s
integrated heat recovery modules (HRMs).
Capstone successfully winding down its $5.2 million field retrofit program to upgrade non-Signature Series C1000 and C200
microturbines. The retrofit program was completed on schedule and within budget. This program has provided a significant improvement
in demonstrated performance and reliability of the non-Signature Series C1000 and C200 microturbines, which now approaches the
world-class performance and reliability of the Signature Series C1000, C200 and the C65 and C30 microturbines.
Capstone announced a new plan to further lower total operating expense by an additional $500 thousand per quarter. As a result, the
new management quarterly total operating expense target is set at $5 million. This includes the successful completion of its consolidation
plan for its two manufacturing facilities into a single manufacturing facility allowing for an immediate increase in operational efficiency and
reduced facility expense when the exited facility is subleased.
Capstone’s energy financing joint venture, Capstone Energy Finance, executed a five-year agreement with a large greenhouse operation
in Colorado. Multiple propane-fired C65 microturbines will be installed in stand-alone mode at a remote location to provide electricity for
the Colorado greenhouse.
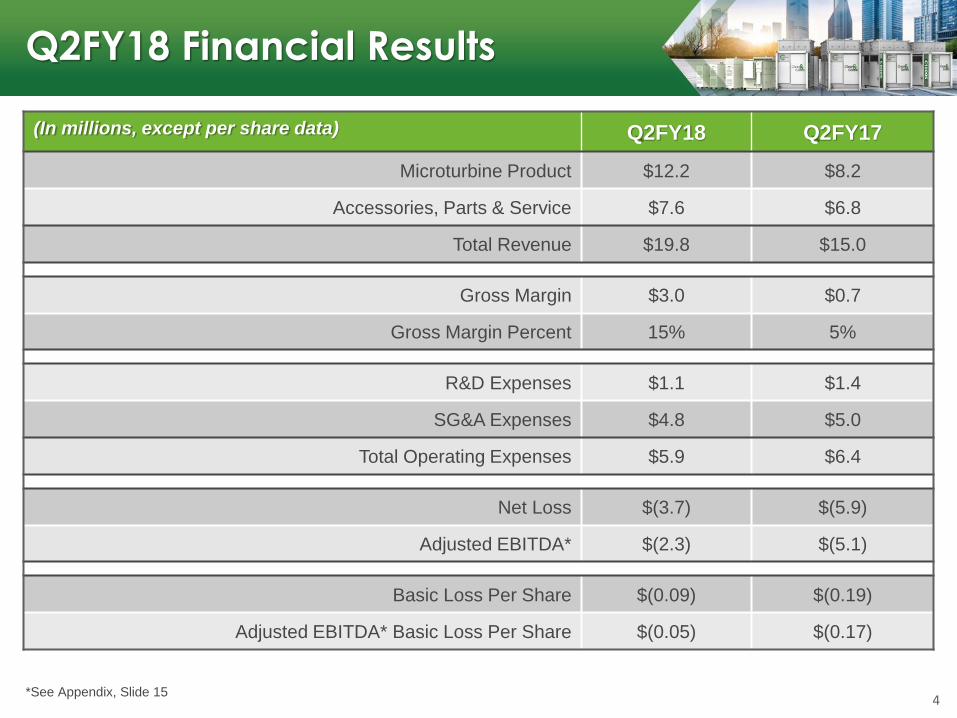
(In millions, except per share data) Q2FY18 Q2FY17
Microturbine Product $12.2 $8.2
Accessories, Parts & Service $7.6 $6.8
Total Revenue $19.8 $15.0
Gross Margin $3.0 $0.7
Gross Margin Percent 15% 5%
R&D Expenses $1.1 $1.4
SG&A Expenses $4.8 $5.0
Total Operating Expenses $5.9 $6.4
Net Loss $(3.7) $(5.9)
Adjusted EBITDA* $(2.3) $(5.1)
Basic Loss Per Share $(0.09) $(0.19)
Adjusted EBITDA* Basic Loss Per Share $(0.05) $(0.17)
Q2FY18 Financial Results
*See Appendix, Slide 154
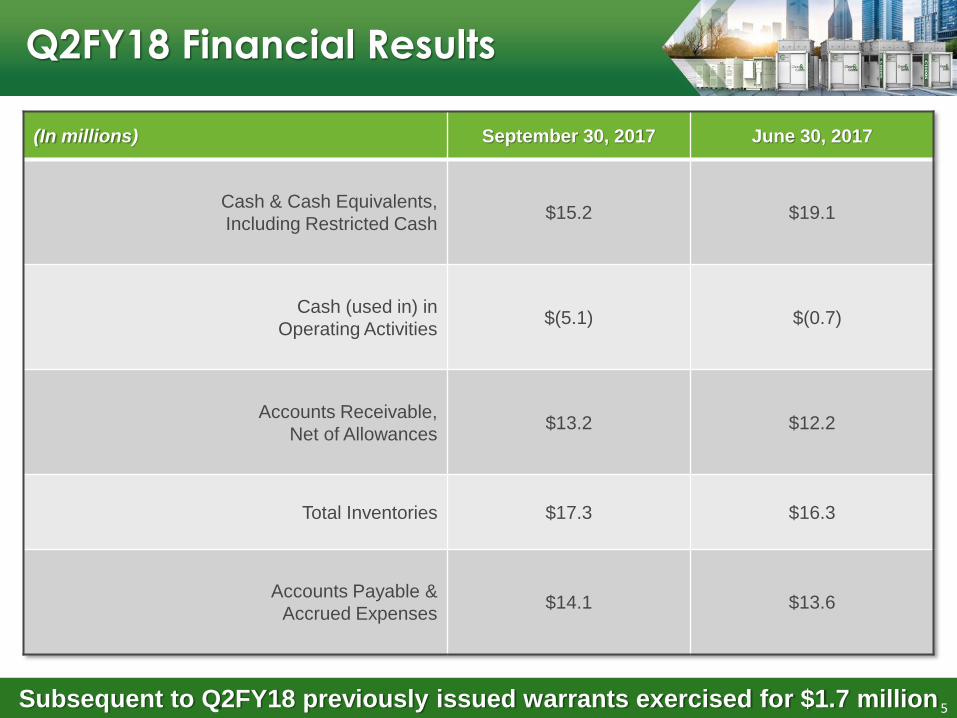
(In millions) September 30, 2017 June 30, 2017
Cash & Cash Equivalents,
Including Restricted Cash$15.2 $19.1
Cash (used in) in
Operating Activities$(5.1) $(0.7)
Accounts Receivable,
Net of Allowances$13.2 $12.2
Total Inventories $17.3 $16.3
Accounts Payable &
Accrued Expenses$14.1 $13.6
Q2FY18 Financial Results
Subsequent to Q2FY18 previously issued warrants exercised for $1.7 million 5
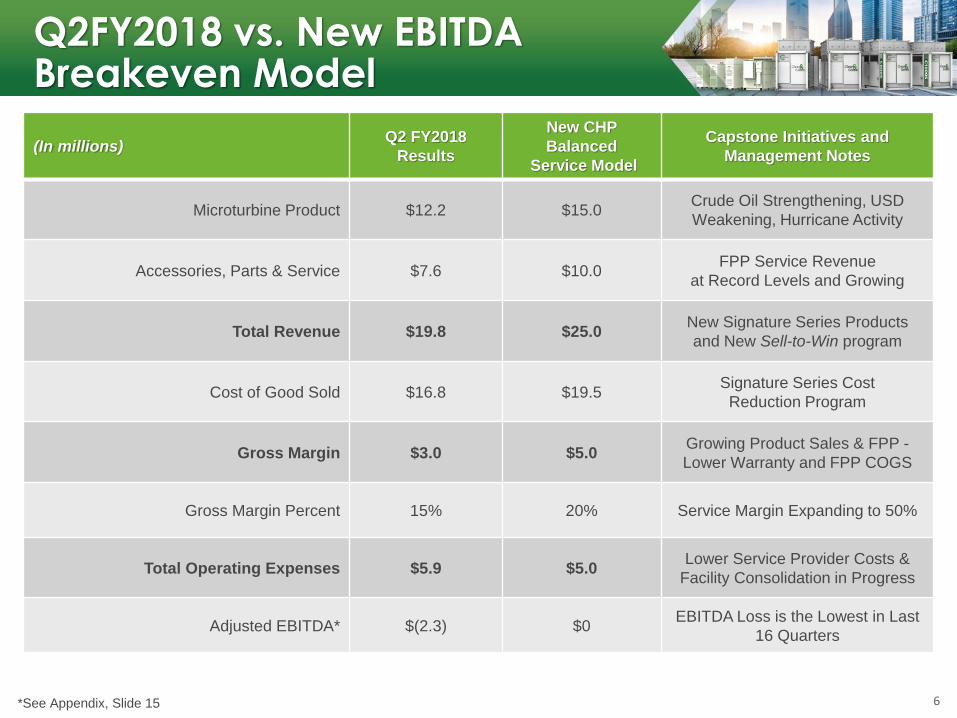
(In millions) Q2 FY2018
Results
New CHP
Balanced
Service Model
Capstone Initiatives and
Management Notes
Microturbine Product $12.2 $15.0Crude Oil Strengthening, USD
Weakening, Hurricane Activity
Accessories, Parts & Service $7.6 $10.0FPP Service Revenue
at Record Levels and Growing
Total Revenue $19.8 $25.0New Signature Series Products
and New Sell-to-Win program
Cost of Good Sold $16.8 $19.5Signature Series Cost
Reduction Program
Gross Margin $3.0 $5.0Growing Product Sales & FPP -
Lower Warranty and FPP COGS
Gross Margin Percent 15% 20% Service Margin Expanding to 50%
Total Operating Expenses $5.9 $5.0Lower Service Provider Costs &
Facility Consolidation in Progress
Adjusted EBITDA* $(2.3) $0EBITDA Loss is the Lowest in Last
16 Quarters
6
Q2FY2018 vs. New EBITDABreakeven Model
*See Appendix, Slide 15
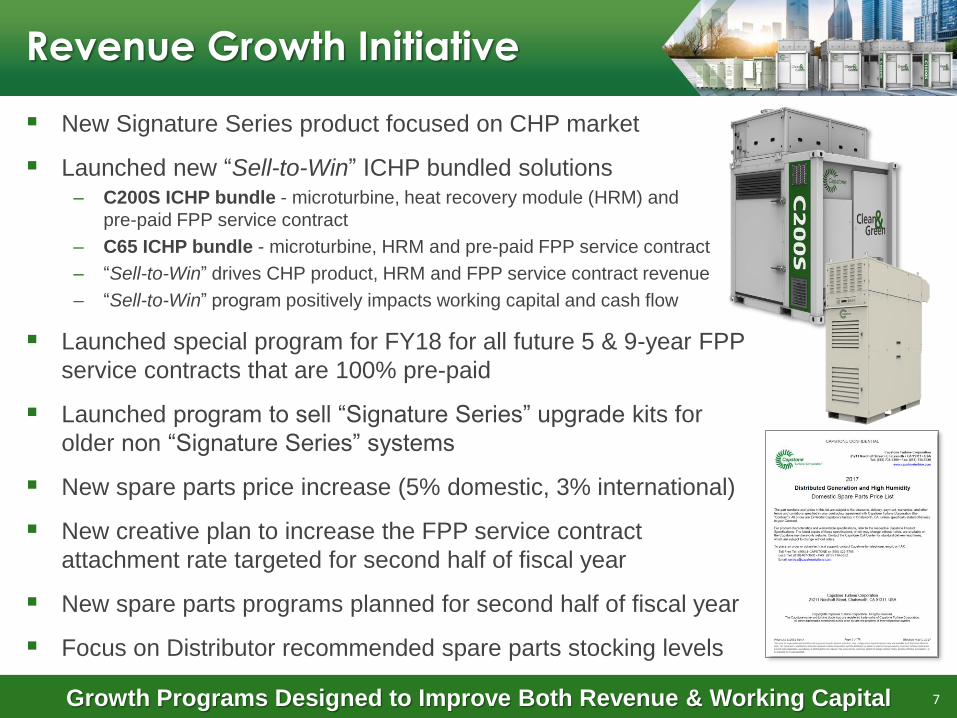
New Signature Series product focused on CHP market
Launched new “Sell-to-Win” ICHP bundled solutions– C200S ICHP bundle - microturbine, heat recovery module (HRM) and
pre-paid FPP service contract
– C65 ICHP bundle - microturbine, HRM and pre-paid FPP service contract
– “Sell-to-Win” drives CHP product, HRM and FPP service contract revenue
– “Sell-to-Win” program positively impacts working capital and cash flow
Launched special program for FY18 for all future 5 & 9-year FPP
service contracts that are 100% pre-paid
Launched program to sell “Signature Series” upgrade kits for
older non “Signature Series” systems
New spare parts price increase (5% domestic, 3% international)
New creative plan to increase the FPP service contract
attachment rate targeted for second half of fiscal year
New spare parts programs planned for second half of fiscal year
Focus on Distributor recommended spare parts stocking levels
Growth Programs Designed to Improve Both Revenue & Working Capital
Revenue Growth Initiative
7
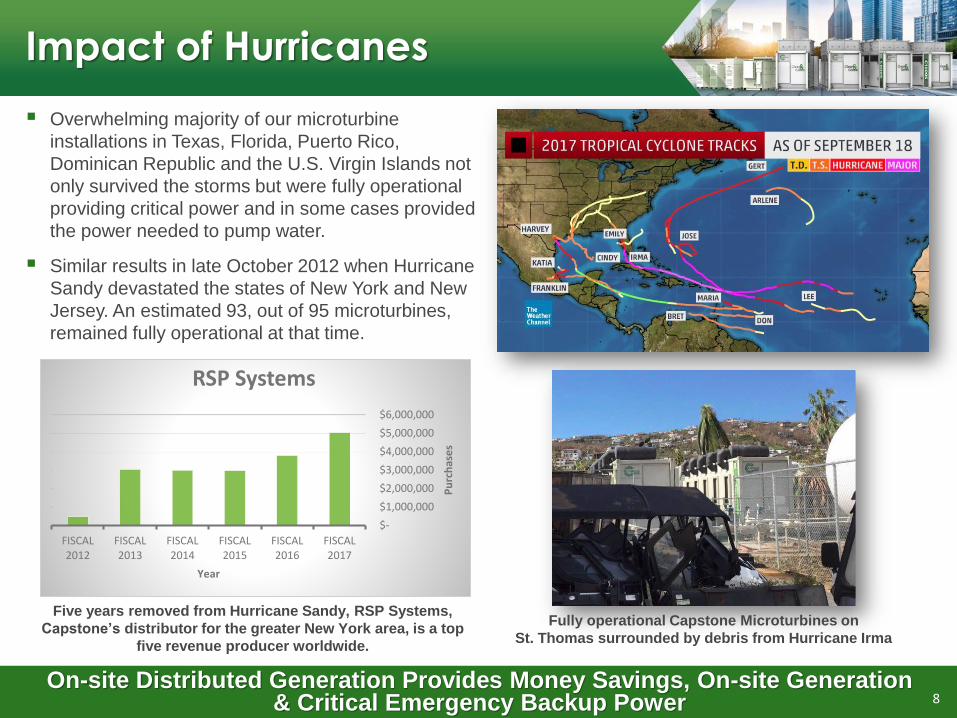
Impact of Hurricanes
Five years removed from Hurricane Sandy, RSP Systems,
Capstone’s distributor for the greater New York area, is a top
five revenue producer worldwide.
$-
$1,000,000
$2,000,000
$3,000,000
$4,000,000
$5,000,000
$6,000,000
FISCAL 2017
FISCAL 2016
FISCAL 2015
FISCAL 2014
FISCAL 2013
FISCAL 2012
Pu
rch
ase
s
Year
RSP Systems
Overwhelming majority of our microturbine
installations in Texas, Florida, Puerto Rico,
Dominican Republic and the U.S. Virgin Islands not
only survived the storms but were fully operational
providing critical power and in some cases provided
the power needed to pump water.
Similar results in late October 2012 when Hurricane
Sandy devastated the states of New York and New
Jersey. An estimated 93, out of 95 microturbines,
remained fully operational at that time.
On-site Distributed Generation Provides Money Savings, On-site Generation & Critical Emergency Backup Power
Fully operational Capstone Microturbines on
St. Thomas surrounded by debris from Hurricane Irma
8
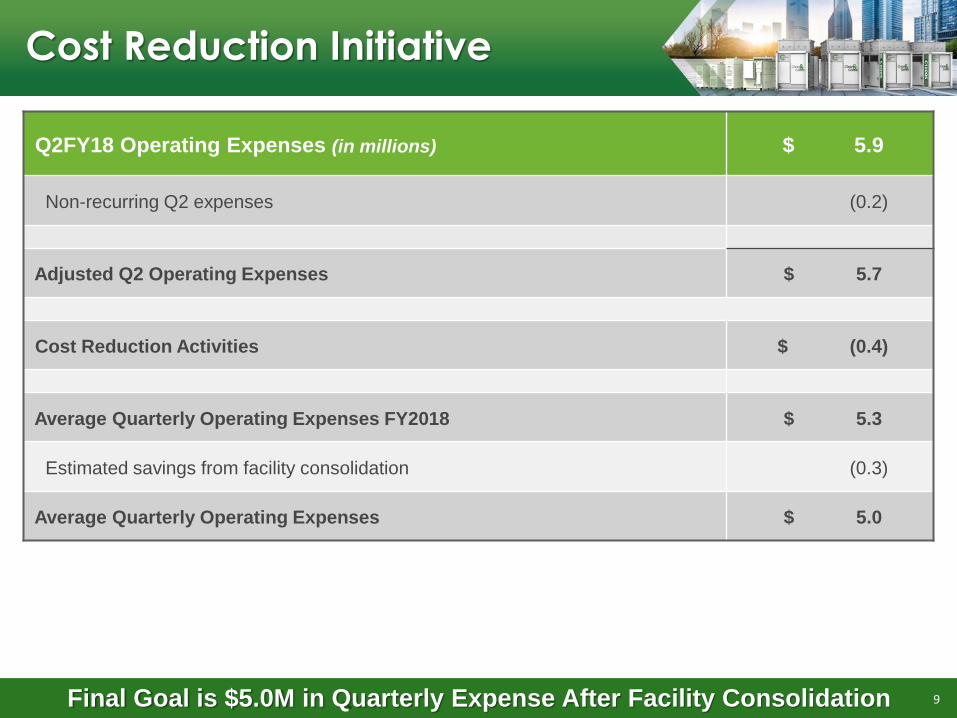
Cost Reduction Initiative
Q2FY18 Operating Expenses (in millions) $ 5.9
Non-recurring Q2 expenses (0.2)
Adjusted Q2 Operating Expenses $ 5.7
Cost Reduction Activities $ (0.4)
Average Quarterly Operating Expenses FY2018 $ 5.3
Estimated savings from facility consolidation (0.3)
Average Quarterly Operating Expenses $ 5.0
Final Goal is $5.0M in Quarterly Expense After Facility Consolidation 9
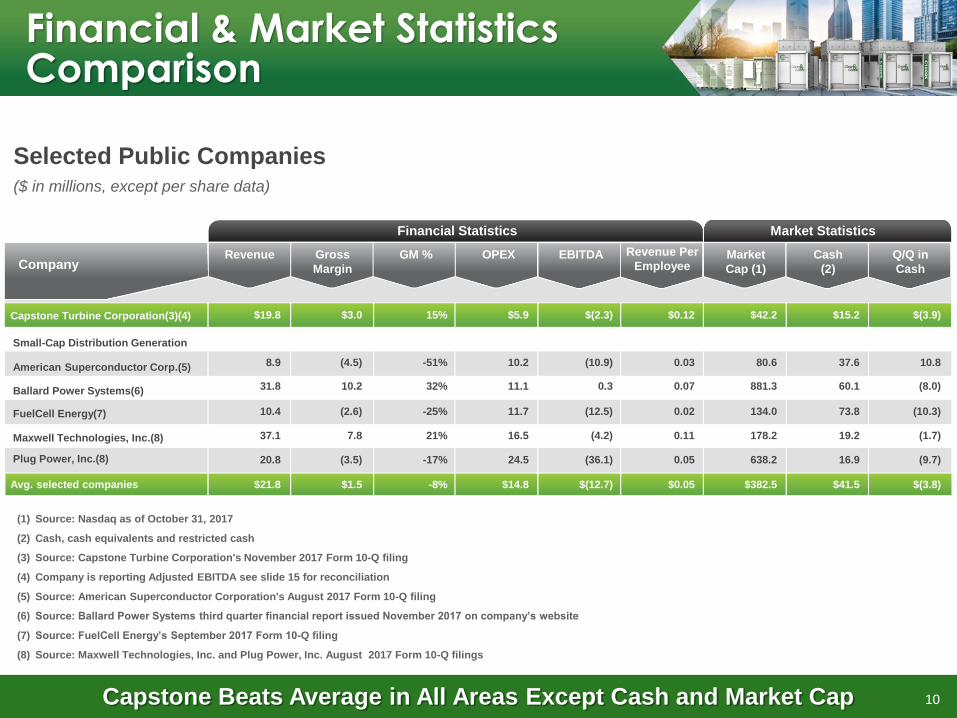
Capstone Beats Average in All Areas Except Cash and Market Cap
(1) Source: Nasdaq as of October 31, 2017
(2) Cash, cash equivalents and restricted cash
(3) Source: Capstone Turbine Corporation's November 2017 Form 10-Q filing
(4) Company is reporting Adjusted EBITDA see slide 15 for reconciliation
(5) Source: American Superconductor Corporation's August 2017 Form 10-Q filing
(6) Source: Ballard Power Systems third quarter financial report issued November 2017 on company’s website
(7) Source: FuelCell Energy’s September 2017 Form 10-Q filing
(8) Source: Maxwell Technologies, Inc. and Plug Power, Inc. August 2017 Form 10-Q filings
$19.8
8.9
37.1
10.4
20.8
$21.8
$3.0
(4.5)
7.8
(2.6)
(3.5)
$1.5
15%
-51%
21%
-25%
-17%
-8%
$0.12
0.03
0.11
0.02
0.05
$0.05
$42.2
80.6
178.2
134.0
638.2
$382.5
$15.2
37.6
19.2
73.8
16.9
$41.5
$(3.9)
10.8
(1.7)
(10.3)
(9.7)
$(3.8)
Selected Public Companies($ in millions, except per share data)
Financial Statistics Market Statistics
Company
Capstone Turbine Corporation(3)(4)
Small-Cap Distribution Generation
American Superconductor Corp.(5)
Maxwell Technologies, Inc.(8)
Revenue Gross
Margin
GM % OPEX EBITDA Market
Cap (1)
Cash
(2)
Q/Q in
Cash
Plug Power, Inc.(8)
FuelCell Energy(7)
Avg. selected companies
Revenue Per
Employee
$5.9
10.2
16.5
11.7
24.5
$14.8
$(2.3)
(10.9)
(4.2)
(12.5)
(36.1)
$(12.7)
Financial & Market Statistics Comparison
10
31.8 10.2 32% 0.07 881.3 60.1 (8.0)Ballard Power Systems(6) 11.1 0.3
APPENDIX
11

Kenworth Class 7 Track Testing
12
Series Hybrid Design65kW Range Extender47kWh Li-Ion Battery Pack220kW Traction Motor
CNG Fuel for Microturbine Level II On-board Plug-in Charging Regenerative Braking Main Advantage is in Stop & Go
Delivery Applications
Video can be viewed at https://www.capstoneturbine.com/news/in-the-news/detail/6610/a-capstone-c65-microturbine-provides-extended-range-by
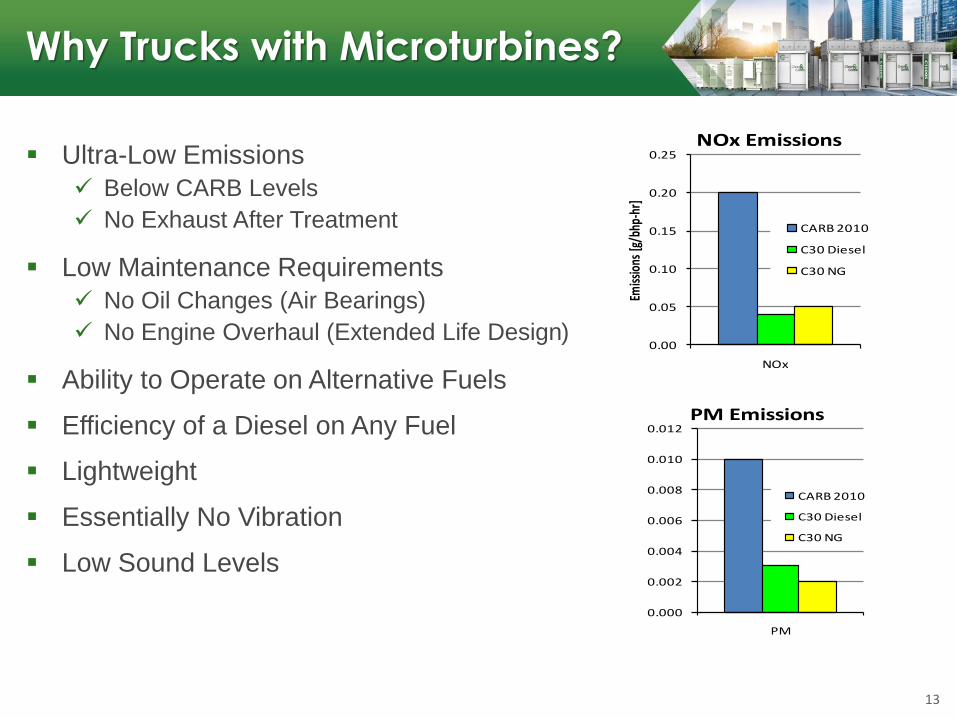
Why Trucks with Microturbines?
13
Ultra-Low Emissions
Below CARB Levels
No Exhaust After Treatment
Low Maintenance Requirements
No Oil Changes (Air Bearings)
No Engine Overhaul (Extended Life Design)
Ability to Operate on Alternative Fuels
Efficiency of a Diesel on Any Fuel
Lightweight
Essentially No Vibration
Low Sound Levels
0.00
0.05
0.10
0.15
0.20
0.25
NOx
Emiss
ions
[g/b
hp-h
r]
NOx Emissions
CARB 2010
C30 Diesel
C30 NG
0.000
0.002
0.004
0.006
0.008
0.010
0.012
PMEm
issio
ns [g
/bhp
-hr]
PM Emissions
CARB 2010
C30 Diesel
C30 NG
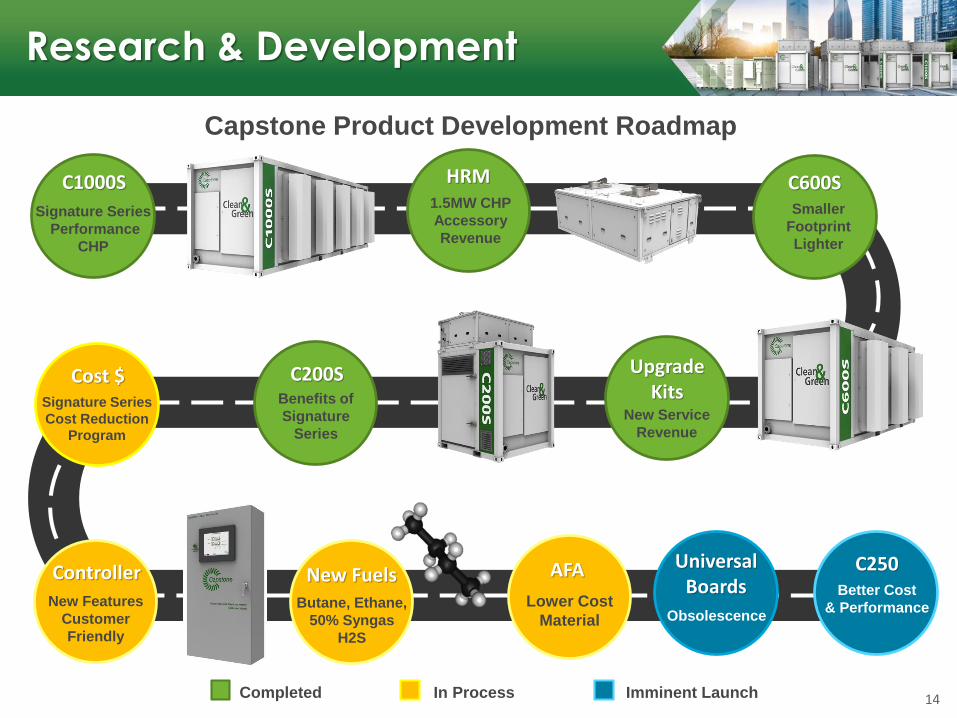
Capstone Product Development Roadmap
Controller
New Features
Customer
Friendly
1.5MW CHP
Accessory
Revenue
New FuelsButane, Ethane,
50% Syngas
H2S
HRMC1000S
Signature Series
Performance
CHP
AFA
Lower Cost
Material
C250Better Cost
& Performance
Universal Boards
Obsolescence
C200SBenefits of
Signature
Series
Signature Series
Cost ReductionProgram
Cost $
C600SSmaller
Footprint
Lighter
UpgradeKits
New Service
Revenue
Completed In Process Imminent Launch
Research & Development
14
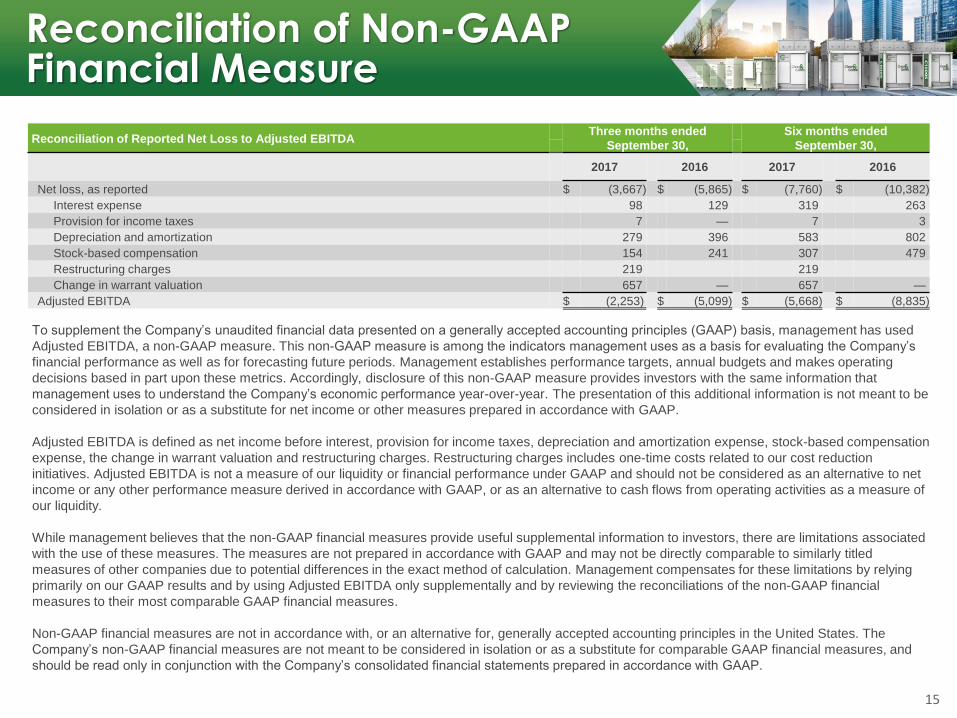
To supplement the Company’s unaudited financial data presented on a generally accepted accounting principles (GAAP) basis, management has used
Adjusted EBITDA, a non-GAAP measure. This non-GAAP measure is among the indicators management uses as a basis for evaluating the Company’s
financial performance as well as for forecasting future periods. Management establishes performance targets, annual budgets and makes operating
decisions based in part upon these metrics. Accordingly, disclosure of this non-GAAP measure provides investors with the same information that
management uses to understand the Company’s economic performance year-over-year. The presentation of this additional information is not meant to be
considered in isolation or as a substitute for net income or other measures prepared in accordance with GAAP.
Adjusted EBITDA is defined as net income before interest, provision for income taxes, depreciation and amortization expense, stock-based compensation
expense, the change in warrant valuation and restructuring charges. Restructuring charges includes one-time costs related to our cost reduction
initiatives. Adjusted EBITDA is not a measure of our liquidity or financial performance under GAAP and should not be considered as an alternative to net
income or any other performance measure derived in accordance with GAAP, or as an alternative to cash flows from operating activities as a measure of
our liquidity.
While management believes that the non-GAAP financial measures provide useful supplemental information to investors, there are limitations associated
with the use of these measures. The measures are not prepared in accordance with GAAP and may not be directly comparable to similarly titled
measures of other companies due to potential differences in the exact method of calculation. Management compensates for these limitations by relying
primarily on our GAAP results and by using Adjusted EBITDA only supplementally and by reviewing the reconciliations of the non-GAAP financial
measures to their most comparable GAAP financial measures.
Non-GAAP financial measures are not in accordance with, or an alternative for, generally accepted accounting principles in the United States. The
Company’s non-GAAP financial measures are not meant to be considered in isolation or as a substitute for comparable GAAP financial measures, and
should be read only in conjunction with the Company’s consolidated financial statements prepared in accordance with GAAP.
Reconciliation of Non-GAAP Financial Measure
15
Reconciliation of Reported Net Loss to Adjusted EBITDAThree months ended
September 30,
Six months ended
September 30,
2017 2016 2017 2016
Net loss, as reported $ (3,667) $ (5,865) $ (7,760) $ (10,382)
Interest expense 98 129 319 263
Provision for income taxes 7 — 7 3
Depreciation and amortization 279 396 583 802
Stock-based compensation 154 241 307 479
Restructuring charges 219 219
Change in warrant valuation 657 — 657 —
Adjusted EBITDA $ (2,253) $ (5,099) $ (5,668) $ (8,835)
Related Documents


