Boston Partners Large Cap Value Equity Second Quarter 2018

Welcome message from author
This document is posted to help you gain knowledge. Please leave a comment to let me know what you think about it! Share it to your friends and learn new things together.
Transcript

Boston Partners Large Cap Value Equity
Second Quarter 2018
team updated 4/25/16

Boston Partners Large Cap Value EquityTable of Contents
Boston Partners n
Section
i. Firm Overview 1
ii. Philosophy and Process 5
Appendix
i. Large Cap Value Portfolio
ii. Large Cap Value Investment Performance
iii. Concentrated Large Cap Value Equity Portfolio
iv. Supplemental Information
v. Biographical Information
vi. Investment Strategies Performance, Fee Schedules and Performance Disclosures

Boston Partners n 1
Who We AreA Focused Investment Organization
• Founded in 1995
• One philosophy and investment process that pre-dates our founding and has been in place for 30 years
• All established disciplines have outperformed their benchmark since inception2
• 152 employees: Boston, New York, California, and London
1 Data as of June 30, 2018.Assets Under Management include: Boston Partners ($94.9 B); WPG Partners ($1.7 B); and Redwood ($0.1 B).2 Boston Partners' established disciplines are defi ned as the disciplines that started the year the fi rm was founded (1995): Large Cap Value Equity; Premium Equity; Mid Cap Value Equity; and Small Cap Value Equity. Organizational information can be found in the appendix.
$96.7 Billion Assets Under Management1

Boston Partners n 2
Boston PartnersProfi le: June 30, 2018
* Key investment professionals have worked together since the founding of Boston Partners in 1995 and years before at a prior fi rm, where the investment philosophy was established.Assets Under Management include: Boston Partners ($94.9 B); WPG Partners ($1.7 B); and Redwood ($0.1 B). Organizational information can be found in the appendix.
Disciplines Assets ($ Millions)
Large Cap Value, Concentrated Large Cap Value, 130/30 Large Cap Value $34,030
Premium Equity (U.S. All-Cap Value) $13,930
Mid Cap Value $23,453
Small Cap, Small Cap II, Small-Mid Cap $5,066
U.S. Long/Short $7,880
Global, International, Concentrated International $8,801
Global Long/Short, International Long/Short $1,556
Emerging Markets Long/Short, Emerging Markets $209
Value equity expertise founded in the early 1980s*
Consistent and repeatable investment philosophy across all disciplines
Integrated bottom-up, fundamental and quantitative research
Expertise of a boutique with the depth of aglobal fi rm
Investment Profi le $96.7 Billion Assets Under Management

Boston Partners n 3
Boston PartnersRelative Performance through June 30, 2018
1 Inception dates are as follows: Large Cap Value is June 1, 1995; Premium Equity is June 1, 1995; Mid Cap Value is May 1, 1995; Small Cap Value Equity is July 1, 1995; Small Cap Value Equity II is July 1, 1998; Small/Mid Cap Value is April 1, 1999; Global Equity USA is July 1, 2008; International Equity is July 1, 2008; Long/Short Research is April 1, 2002 and Global Long/Short Equity is July 1, 2013.2 Net total return indices reinvest dividends after the deduction of withholding taxes, using (for international indices) a tax rate applicable to non-resident institutional investorswho do not benefi t from double taxation treaties.3 The Exposure-Adjusted S&P 500 Index is not an actual index. It is a supplemental benchmark created by multiplying the average monthly net exposure of the BP Long/Short Research by the actual S&P 500 Index return for the same period. Average Exposure is as follows: 1 Year at 50.33%; 3 Year at 48.75%; 5 Year at 49.03% 7 Year at 49.73%; 10 Year at 48.69%; and Since Inception at 43.96%.4 The Exposure-Adjusted MSCI World Index is not an actual index. It is a supplemental benchmark created by multiplying the average monthly net exposure of the BP Global Long/Short by the actual MSCI World Index return for the same period. Average Exposure is as follows: 1 Year at 49.73%; 3 Year at 46.02%; 5 Year at 45.61%; and Since Inception at 45.61%.Performance is supplemental to the GIPS® compliant presentation herein. Relative performance refl ects composite results versus noted benchmark and individual portfolio results will vary. Past performance is not an indication of future results. Please refer to the last appendix for other important disclosures.
Relative Performance - Gross of Fees (%)
1Year
3Year
5Year
7Year
10Year
Since Inception1
Large Cap Value vs. Russell 1000® Value Index 3.58 0.67 0.74 1.23 2.13 1.55
Premium Equity vs. Russell 3000® Value Index 2.44 2.10 2.76 2.11 3.37 3.74
Mid Cap Value vs. Russell Midcap® Value Index 0.74 1.46 2.47 2.04 3.49 2.18
Small Cap Value Equity vs. Russell 2000® Value Index -3.42 -1.98 0.46 0.70 2.38 2.92
Small Cap Value Equity II vs. Russell 2000® Value Index -1.69 -0.86 1.19 1.63 2.87 4.13
Small/Mid Cap Value vs. Russell 2500™ Value Index -1.88 -0.14 1.03 1.19 1.85 1.26
Global Equity USA vs. MSCI World Index - Net2 -2.80 -0.80 1.17 1.74 2.09 2.09
International Equity vs. MSCI EAFE Index - Net2 -0.08 0.28 1.62 2.60 1.94 1.94
Long/Short Research vs. S&P 500 Index (Exposure Adjusted)3 -3.20 -1.09 0.81 1.60 3.31 4.47
Global Long/Short vs. MSCI World Index (Exposure Adjusted)4 -3.03 0.28 1.86 — — 1.86
Boston Partners n 4
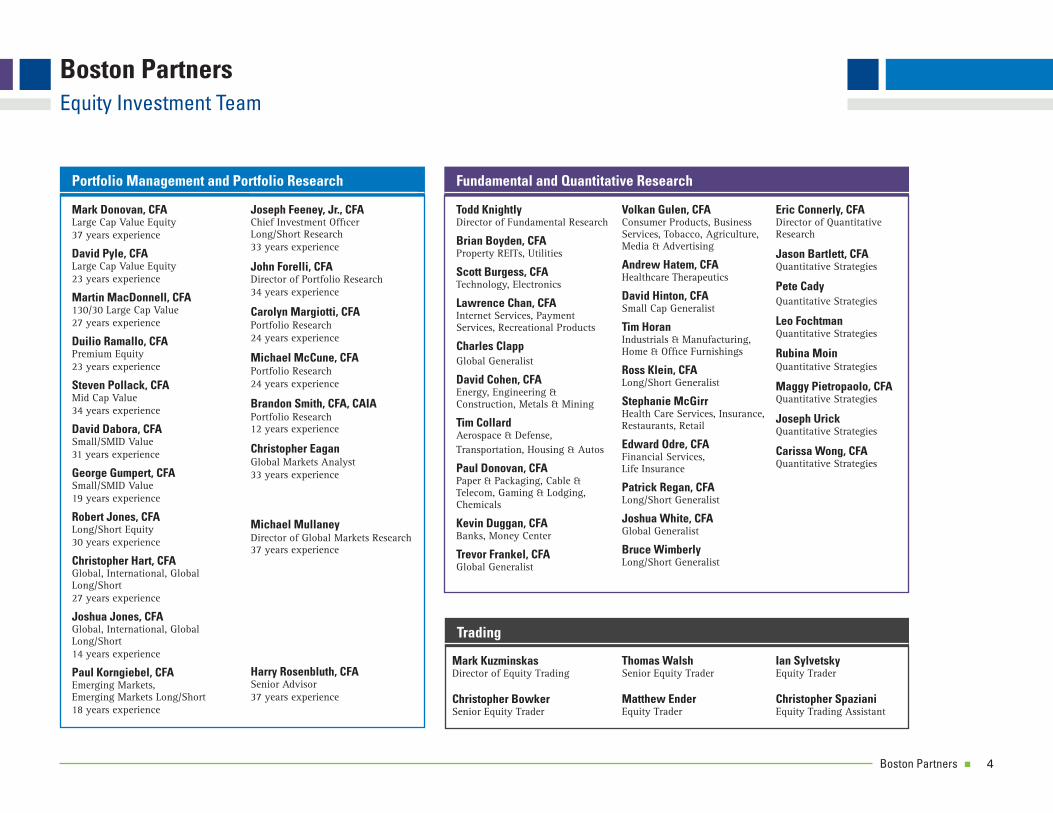
Boston PartnersEquity Investment Team
Mark Donovan, CFALarge Cap Value Equity37 years experience
David Pyle, CFALarge Cap Value Equity23 years experience
Martin MacDonnell, CFA130/30 Large Cap Value27 years experience
Duilio Ramallo, CFAPremium Equity23 years experience
Steven Pollack, CFAMid Cap Value34 years experience
David Dabora, CFASmall/SMID Value31 years experience
George Gumpert, CFASmall/SMID Value19 years experience
Robert Jones, CFALong/Short Equity30 years experience
Christopher Hart, CFAGlobal, International, Global Long/Short27 years experience
Joshua Jones, CFAGlobal, International, Global Long/Short14 years experience
Paul Korngiebel, CFAEmerging Markets,Emerging Markets Long/Short18 years experience
Portfolio Management and Portfolio Research
Todd KnightlyDirector of Fundamental Research
Brian Boyden, CFAProperty REITs, Utilities
Scott Burgess, CFATechnology, Electronics
Lawrence Chan, CFAInternet Services, Payment Services, Recreational Products
Charles ClappGlobal Generalist
David Cohen, CFAEnergy, Engineering & Construction, Metals & Mining
Tim CollardAerospace & Defense, Transportation, Housing & Autos
Paul Donovan, CFAPaper & Packaging, Cable & Telecom, Gaming & Lodging, Chemicals
Kevin Duggan, CFABanks, Money Center
Trevor Frankel, CFAGlobal Generalist
Volkan Gulen, CFAConsumer Products, Business Services, Tobacco, Agriculture, Media & Advertising
Andrew Hatem, CFAHealthcare Therapeutics
David Hinton, CFASmall Cap Generalist
Tim HoranIndustrials & Manufacturing,Home & Offi ce Furnishings
Ross Klein, CFALong/Short Generalist
Stephanie McGirrHealth Care Services, Insurance, Restaurants, Retail
Edward Odre, CFAFinancial Services, Life Insurance
Patrick Regan, CFALong/Short Generalist
Joshua White, CFAGlobal Generalist
Bruce WimberlyLong/Short Generalist
Fundamental and Quantitative Research
Mark KuzminskasDirector of Equity Trading
Christopher BowkerSenior Equity Trader
Trading
Joseph Feeney, Jr., CFAChief Investment Offi cerLong/Short Research 33 years experience
John Forelli, CFADirector of Portfolio Research34 years experience
Carolyn Margiotti, CFAPortfolio Research24 years experience
Michael McCune, CFAPortfolio Research24 years experience
Brandon Smith, CFA, CAIAPortfolio Research12 years experience
Christopher EaganGlobal Markets Analyst33 years experience
Michael MullaneyDirector of Global Markets Research37 years experience
Eric Connerly, CFADirector of QuantitativeResearch
Jason Bartlett, CFAQuantitative Strategies
Pete CadyQuantitative Strategies
Leo FochtmanQuantitative Strategies
Rubina MoinQuantitative Strategies
Maggy Pietropaolo, CFAQuantitative Strategies
Joseph UrickQuantitative Strategies
Carissa Wong, CFAQuantitative Strategies
Thomas WalshSenior Equity Trader
Matthew EnderEquity Trader
Ian SylvetskyEquity Trader
Christopher SpazianiEquity Trading Assistant
Harry Rosenbluth, CFASenior Advisor 37 years experience

Boston Partners n 5
Boston PartnersPhilosophical Foundations: August 20, 1987
What works is what beats the market averages over reasonably long time periods: value works and "momentum" works.
Quantitative methods should be the primary tool to focus fundamental analysis effort.
Fundamental analysis works when it is fi rmly grounded in value and momentum thinking.
We all should be of one investment faith. Parties to the investment process who stray from the fl ock or commit acts of heresy should fi nd a new religion outside our church.
Fundamental Truths
This is an illustration of actual letter which illustrates the formation of Boston Partners' investment philosophy. The letter does not outline actual objectives or investment strategy and is not a guarantee of performance.
Boston Partners n 6
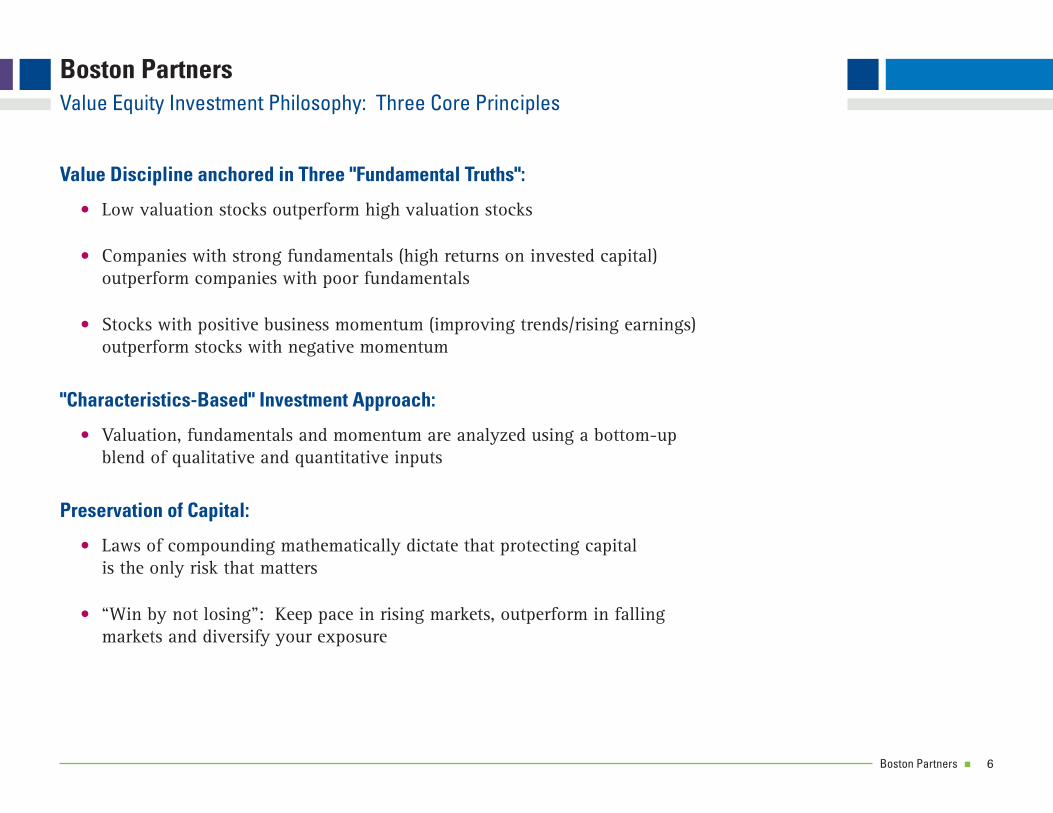
Boston PartnersValue Equity Investment Philosophy: Three Core Principles
Value Discipline anchored in Three "Fundamental Truths":
• Low valuation stocks outperform high valuation stocks
• Companies with strong fundamentals (high returns on invested capital) outperform companies with poor fundamentals
• Stocks with positive business momentum (improving trends/rising earnings)outperform stocks with negative momentum
"Characteristics-Based" Investment Approach:
• Valuation, fundamentals and momentum are analyzed using a bottom-upblend of qualitative and quantitative inputs
Preservation of Capital:
• Laws of compounding mathematically dictate that protecting capitalis the only risk that matters
• “Win by not losing": Keep pace in rising markets, outperform in fallingmarkets and diversify your exposure
Boston Partners n 7
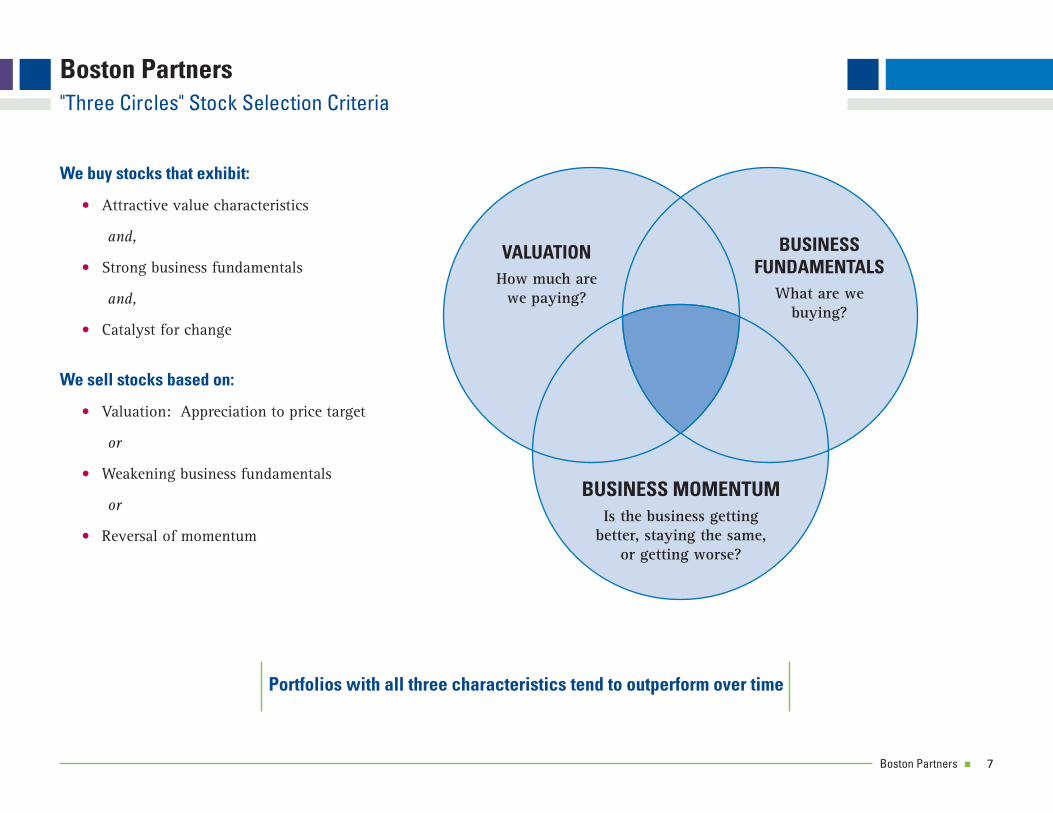
Boston Partners"Three Circles" Stock Selection Criteria
We buy stocks that exhibit:
• Attractive value characteristics
and,
• Strong business fundamentals
and,
• Catalyst for change
We sell stocks based on:
• Valuation: Appreciation to price target
or
• Weakening business fundamentals
or
• Reversal of momentum
Portfolios with all three characteristics tend to outperform over time
BUSINESSFUNDAMENTALS
What are webuying?
VALUATIONHow much are
we paying?
BUSINESS MOMENTUMIs the business getting
better, staying the same,or getting worse?

Boston Partners n 8
Boston PartnersStock Selection Process
QuantitativeAnalysis Fundamental Analysis
Investment Universe
Validate Positive Characteristics
FactSet: Historical fi nancial statements, ratios, stock performance, earnings
revisions
Fundamental ResearchIdentify Catalyst
Determine Appropriate Valuation
Set Target Price
InvestmentDecision
• Statistical ranking based on composite score of three factors:
Valuation: Multiples of earnings, cash fl ow, book value
Momentum: Earnings surprise and estimate revisions
Fundamentals: Operating returns on operating assets (OROA)
• Target RichEnvironment
• Valuation: How much are we paying?
EV to Sales, Px to Earnings, EV to Cash fl ow, Px to Book, etc.
• Momentum: Is the business improvingor deteriorating?
Trend analysis: Profi t margins, asset turnover, working capital, debt structure
• Business Fundamentals:What are we buying?
Sales and earnings growth, profi tability, liquidity, capital structure, intangible assets, ROIC/OROA
• 10-Ks, 10-Qs, SEC fi lings
• Press releases, Conference call transcripts, Street events
• Management interviews
• On-site company visits
• Third-party research
• Internal models/projections
• Channel/supplier checks
• Construct portfolio
• Monitor existing holdings
• Evaluate company/industry developments
• Review/Adjust target prices

Boston Partners n 9
Boston Partners Large Cap Value EquityPortfolio Risk Controls
Portfolio risk controls can be customized to meet specific client guidelines.
Preserve Capital:
• Consistent execution of "Three Circles" investment process
- Emphasis on individual company risk
- Stocks are sold when any one of three characteristics are no longer present
- Portfolio characteristics managed using quantitative tools
• Broad diversification
• Liquidity of positions is actively monitored
Guideline Parameters:
• Account holdings in any one issuer shall not exceed the greater of the Benchmark weight plus 1 percentage point or 5% of the Account, measured at market value, in either case, determined at the time of purchase
• No individual economic sector (as defined for purposes of the Benchmark) shall represent more than the greater of the weight in such Benchmark or 35% of the Account determined at the time of purchase
- Non U.S. equity securities and ADRs will not comprise more than 15% of the market value of the portfolio, determined at the time of each purchase
• Cash will typically not represent more than 10% of the market value of the portfolio
We Do Not:
• Set tracking error limits: Tracking error is not always an accurate measure of active risk
• Remain sector neutral: If large parts of the market are unattractive, we will not invest there
Needs review: 1Q & 3Q

Boston Partners n 10
Boston PartnersDistinguishing Characteristics
Boston Partners Distinguishes Itself Through:
• An analytical advantage: in-house, bottom-up research employing an effective blend of quantitative and fundamental inputs
• A consistent and repeatable investment process guided by our fundamental truths: valuation, fundamentals, and business momentum
• The experience and familiarity of its investment team
• A risk averse approach: proven ability to protect clients’ investment principal in declining markets

Boston Partners n
i. Large Cap Value Portfolio
ii. Large Cap Value Investment Performance
iii. Concentrated Large Cap Value Equity Portfolio
iv. Supplemental Information
v. Biographical Information
vi. Investment Strategies Performance, Fee Schedules and Performance Disclosures
Boston Partners Large Cap Value EquityAppendix
"Three Circles"
An attractive valuation,strong businessfundamentals,and positive businessmomentum. Porfolios withall three characteristics tendto outperform over time.
Valuation
Business Momentum
Fundamentals
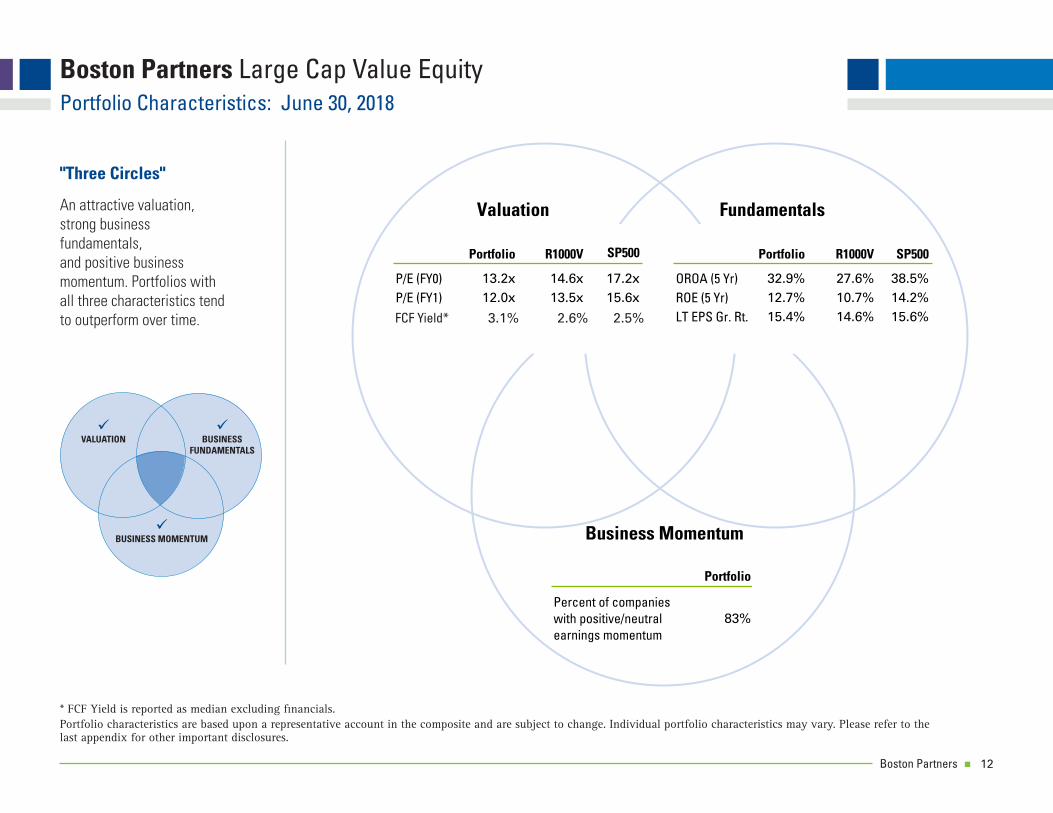
Portfolio R1000V SP500
13.2x 14.6xP/E (FY0)
P/E (FY1)
P/B
12.0x 13.5x
2.0x 2.1x
17.2x
15.6x
3.3x
Portfolio R1000V SP500
32.9% 27.6%OROA (5 Yr)
ROE (5 Yr)
LT EPS Gr. Rt.
12.7% 10.7%
15.4% 14.6%
38.5%
14.2%
15.6%
Portfolio
83%Percent of companieswith positive/neutralearnings momentum
Toyota Motor Sales USA RetirementPortfolio Characteristics: As of June 30, 2018
Please refer to the back for important disclosures.BP Large Cap Value Equity
FCF Yield* 3.1% 2.6% 2.5%
Boston Partners n 12
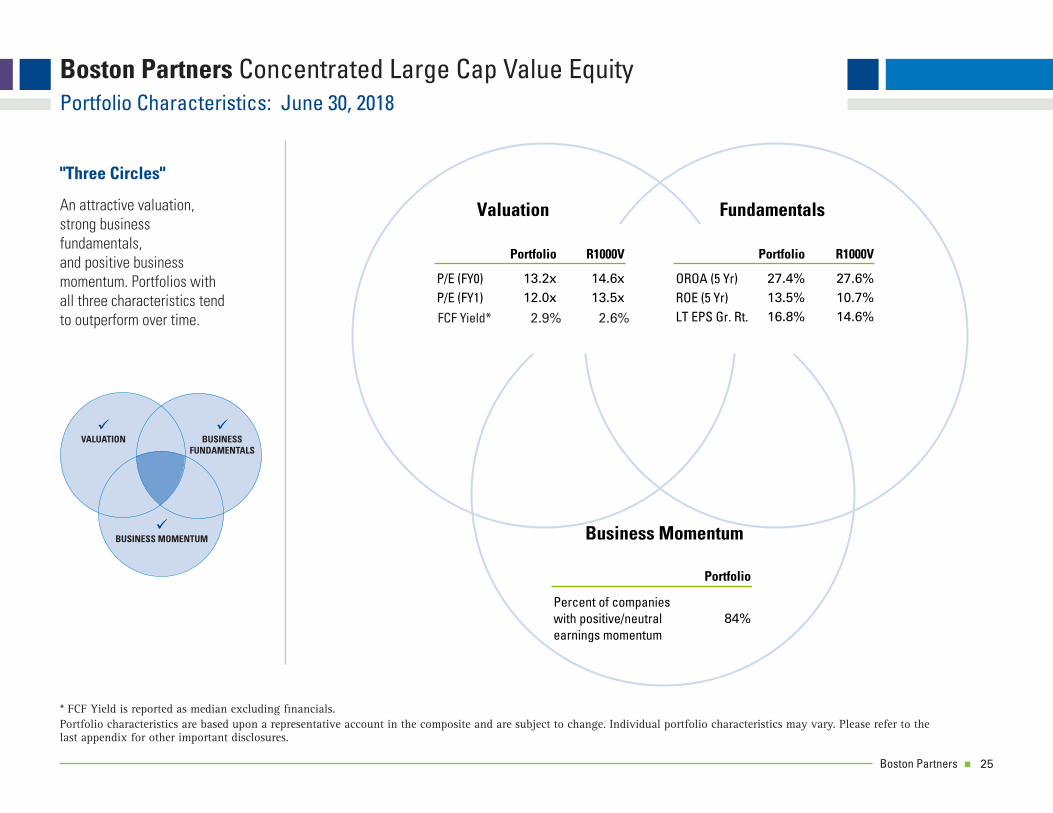
Boston Partners Large Cap Value EquityPortfolio Characteristics: June 30, 2018
* FCF Yield is reported as median excluding financials.Portfolio characteristics are based upon a representative account in the composite and are subject to change. Individual portfolio characteristics may vary. Please refer to the last appendix for other important disclosures.
"Three Circles"
An attractive valuation, strong business fundamentals, and positive business momentum. Portfolios with all three characteristics tend to outperform over time.
BUSINESS
FUNDAMENTALS
BUSINESS MOMENTUM
VALUATION

Boston Partners n 13
Boston Partners Large Cap Value EquityLargest Active Positions: June 30, 2018
Source: Boston Partners Quantitative Research Group.Active weight is the absolute value of the portfolio's weight as compared to the Index's weight for a given stock. The stocks listed as not held reflect the largest holdings in the Russell 1000® Value Index not held by the portfolio. Portfolio holdings are based upon a representative account in the composite and are subject to change. Individual portfolio characteristics may vary. The specific securities identified and described do not represent all of the securities purchased, sold or recommended for advisory clients. It should not be assumed that investments in these sectors or securities were or will be profitable. This information is supplemental to the GIPS® compliant presentation herein. Please refer to the last appendix for other important disclosures.
StockLCV
% Portfolio
Russell 1000® Value Index
% BenchmarkActive Weight
Percentage
Citigroup Inc. 3.6 1.3 2.3
Bank of America Corporation 4.3 2.1 2.2
Royal Dutch Shell Plc 2.2 0.0 2.2
TE Connectivity Ltd. 1.8 0.0 1.8
Cisco Systems, Inc. 3.3 1.6 1.7
Andeavor Corporation 1.8 0.1 1.7
Johnson & Johnson 3.7 2.1 1.6
NetApp Inc. 1.5 0.0 1.5
Berkshire Hathaway Inc. 3.9 2.4 1.5
Wells Fargo & Company 3.2 1.9 1.3
Total 29.3% 11.5% 17.8%
What We Own What We Do Not Own
Russell 1000® Value Index
S&P 500 Index
Portfolio Active Share % Versus:
69% 77%
Stock
Russell 1000® Value Index
% Benchmark
Exxon Mobil Corporation 2.7
AT&T Inc. 1.8
Intel Corporation 1.8
The Procter & Gamble Company 1.5
DowDuPont Inc. 1.2
Philip Morris International Inc. 1.0
Wal-Mart Stores Inc. 0.9
General Electric Company 0.9
Medtronic, Inc. 0.9
Abbott Laboratories 0.8
Total 13.5%

Sector Weightings (% of Portfolio)Largest Holdings (%)
0.6
2.1
14.2
1.6
14.7
30.9
13.1
4.8
0.6
1.1
2.8
6.6
4.8
6.3
1.5
10.3
5.1
12.7
23.1
10.6
8.1
5.9
1.6
5.2
5.9
3.9
3.3
2.1
24.4
2.8
13.4
15.4
6.0
11.9
6.9
1.1
3.7
6.8
2.3
Utilities
Transportation
Technology
REITs
Health Care
Finance
Energy
Consumer Services
Consumer Non-Durables
Consumer Durables
Communications
Capital Goods
Basic Industries
Portfolio R1000V SP500
Bank of America Corp 4.3
Berkshire Hathaway Inc Cl B 3.9
JPMorgan Chase & Co 3.8
Johnson & Johnson 3.7
Citigroup Inc 3.6
Cisco Systems Inc 3.3
Wells Fargo & Co 3.2
Chevron Corp 2.9
Pfizer Inc 2.6
Royal Dutch Shell Plc 2.2
33.5Total
Number of Securities
SP500
82 505
Wtd. Avg. Mkt. Cap ($M) $133,449
2.0%
$198,898
Dividend Yield 2.2%
40.8%Turnover (Trailing 1 Year)
Portfolio
Portfolio Statistics
-
729
R1000V
$110,697
2.5%
-
Toyota Motor Sales USA RetirementPortfolio Characteristics: As of June 30, 2018
BP Large Cap Value EquityPlease refer to the back for important disclosures.
Boston Partners n 14
Boston Partners Large Cap Value EquityPortfolio Characteristics: June 30, 2018
Portfolio characteristics and sector weightings are based upon a representative account in the composite and are subject to change. Individual portfolio characteristics may vary. The specific securities identified and described do not represent all of the securities purchased, sold or recommended for advisory clients. It should not be assumed that investments in these sectors or securities were or will be profitable. This information is supplemental to the GIPS® compliant presentation herein. Please refer to the last appendix for other important disclosures.
Weighted Average
Large Cap Value $133.4 B
Russell 1000® Value Index $110.7 B
S&P 500 Index $198.9 B
Market Capitalization
Sector Weightings (%)Largest Stock Holdings (%)

Rio Tinto Plc 0.5
⇑ FMC Corp 0.5
Barrick Gold Corp 0.4
Methanex Corp 0.8
Nutrien Ltd 0.6
Steel Dynamics Inc 1.1
WestRock Co 0.9
Celanese Corp 0.0∅
DowDuPont Inc 0.0∅
Basic Industries 4.8
Boeing Co 1.0
Dover Corp 0.5
Owens Corning 0.3
⇑ Cummins Inc 1.4
⇑ United Technologies Corp 1.8
CEMEX SAB de CV 0.5
CRH Plc 0.6
Raytheon Co 0.5
Arconic Inc 0.0∅
General Dynamics Corp 0.0∅
L3 Technologies Inc 0.0∅
Spirit AeroSystems Holdings Inc 0.0∅
Capital Goods 6.6
⇑ Comcast Corp Cl A 1.6
Verizon Communications Inc 1.2
Liberty Latin America Ltd 0.0∅
Communications 2.8
BorgWarner Inc⇓ 0.4
Fiat Chrysler Automobiles NV 0.6
Consumer Durables 1.1
Coca-Cola European Partners Plc 0.6
Consumer Non-Durables 0.6
Consumer Services 4.8
Consumer Services (cont...)
Lowe's Companies Inc 0.6
Wyndham Destinations Inc 0.5
Wyndham Hotels & Resorts Inc 0.5
Home Depot Inc⇓ 0.3
TJX Companies Inc⇓ 0.5
CVS Health Corp 1.6
eBay Inc 0.8
CBS Corp Cl B 0.0∅
Energy 13.1
Apergy Corp 0.3
Cimarex Energy Co 0.7
Marathon Oil Corp 0.8
⇑ ConocoPhillips 1.8
⇑ EQT Corp 0.8
Andeavor 1.8
Chevron Corp 2.9
Energen Corp 0.6
Marathon Petroleum Corp 1.2
Royal Dutch Shell Plc 2.2
Diamondback Energy Inc 0.0∅
Finance 30.9
⇑ Allstate Corporation 1.6
⇑ American International Group Inc 1.2
⇑ Wells Fargo & Co 3.2
XL Group Ltd⇓ 0.2
American Express Co 1.2
Bank of America Corp 4.3
Berkshire Hathaway Inc Cl B 3.9
Capital One Financial Corp 0.9
Chubb Ltd 1.1
Citigroup Inc 3.6
Discover Financial Services Inc 1.1
Everest Re Group Ltd 0.8
Finance (cont...)
Goldman Sachs Group Inc 1.3
JPMorgan Chase & Co 3.8
KeyCorp 0.7
Lloyds Banking Group Plc 0.5
Regions Financial Corp 1.2
TD Ameritrade Holding Corp 0.5
Synchrony Financial 0.0∅
Health Care 14.7
Novartis AG 0.7
⇑ McKesson Corp 0.9
Anthem Inc 1.1
Cigna Corp 1.0
Gilead Sciences Inc 1.2
Johnson & Johnson 3.7
Laboratory Corp of America Hldgs 1.1
Merck & Co Inc 1.9
Pfizer Inc 2.6
UnitedHealth Group Inc 0.6
Cardinal Health Inc 0.0∅
REITs 1.6
SL Green Realty Corp 0.9
⇑ Equity Residential 0.7
Technology 14.2
Booking Holdings Inc⇓ 0.3
ABB Ltd 0.4
Alphabet Inc 0.6
Avnet Inc 0.3
Cisco Systems Inc 3.3
DXC Technology Co 1.2
Eaton Corp Plc 0.8
HP Inc 1.2
Microsoft Corp 0.9
Technology (cont...)
NetApp Inc 1.5
Oracle Corp 1.9
TE Connectivity Ltd 1.8
Flex Ltd 0.0∅
Perspecta Inc 0.0∅
Transportation 2.1
Delta Air Lines Inc 1.2
Southwest Airlines Co 0.9
Utilities 0.6
⇑ Edison International 0.6
Account Summary: April 1, 2018 through June 30, 2018
Toyota Motor Sales USA Retirement
New HoldingKey: ⇓= |== |♦ Increased Position | Unchanged=∅⇑ LiquidatedDecreased Position |
BP Large Cap Value EquityPlease refer to the back for important disclosures.
Boston Partners n 15
Boston Partners Large Cap Value EquityPortfolio Holdings (Percent of Portfolio): April 1 through June 30, 2018
Security holdings as of June 30, 2018 are based upon a representative account in the composite and are subject to change. Values are percent of portfolio and are rounded to one decimal place. It should not be assumed that an investment in these securities was or will be profitable. This information is supplemental to the GIPS® compliant presentation herein.

Boston Partners n 16
Calendar Year Performance (%)
2009201220152016 2010201120142017 20082013
Large Cap Value - Gross of Fees 26.7521.27-4.0814.74 13.751.2911.8520.07 -32.9537.14
Large Cap Value - Net of Fees 26.3020.66-4.3714.40 13.360.8211.4919.71 -33.1736.64
Russell 1000® Value Index 19.6917.51-3.8317.34 15.510.3913.4513.66 -36.8532.53
S&P 500 Index 26.4616.001.3811.96 15.062.1113.6921.83 -37.0032.39
Annualized Performance (%)
3Year
7Year
5Year
10Year
SinceInception*
1Year
2Q2018
YTD2018
Large Cap Value - Gross of Fees 10.92-0.18 10.35 8.93 11.08 12.50 10.62-1.77
Large Cap Value - Net of Fees 10.54-0.26 10.01 8.60 10.73 12.10 10.22-1.92
Russell 1000® Value Index 9.371.18 6.77 8.26 10.34 11.27 8.49-1.69
S&P 500 Index 9.373.43 14.37 11.93 13.42 13.23 10.172.65
Boston Partners Large Cap Value EquityInvestment Performance through June 30, 2018
* Inception date is June 1, 1995.Boston Partners has prepared and presented this report in compliance with the GIPS®. Returns reflect composite results and individual portfolio results will vary. Past performance is not an indication of future results. Please refer to the appendix for other important disclosures.

Boston Partners n 17
Boston Partners Large Cap Value EquityPerformance Attribution: Second Quarter 2018
Large Cap Value 4.89 6.49 2.50 1.60 0.63 4.50 12.87 32.64 14.76 1.10 15.16 2.24 0.61 100.00%
Russell 1000® Value Index
2.98 6.14 3.35 1.51 5.78 7.20 11.19 26.39 13.28 4.90 9.71 1.39 6.18 100.00%
Relative Weight 1.91 0.36 -0.85 0.09 -5.15 -2.70 1.68 6.25 1.48 -3.79 5.45 0.85 -5.57
Large Cap Value 5.04 -10.39 0.84 -11.48 -1.67 3.02 13.15 -3.41 1.28 4.05 -0.09 -9.85 0.34 -0.10%
Russell 1000® Value Index
2.21 -2.86 -3.67 -1.38 -3.96 3.04 14.49 -3.51 2.47 8.35 -1.08 -0.50 4.94 1.18%
Sector Allocation 0.02 -0.04 0.03 0.02 0.27 -0.01 0.20 -0.29 0.00 -0.26 -0.09 -0.02 -0.19 -0.36%
Stock Selection 0.13 -0.54 0.11 -0.14 0.01 -0.05 -0.15 0.04 -0.18 -0.05 0.15 -0.22 -0.03 -0.92%
= -1.28%
Capit
al Goo
ds
Basic
Indu
stries
Commun
icatio
nsCo
nsum
er D
urab
lesCo
nsum
er N
on-D
urab
lesCo
nsum
er S
ervic
esEn
ergy
Finan
ce
Wei
ghtin
gsRe
turn
sCo
ntri
butio
n
Health
Car
eRE
ITs
Tech
nolog
y
Trans
porta
tion
Utilitie
s
Tota
l
Attribution is calculated using end of day security prices and returns shown are equity only and exclude cash. Results are from a representative account in the composite and are gross of fees. Individual portfolio results may vary. The information is supplemental to the GIPS® compliant presentation herein. Past performance is not an indication of future results. Please refer to the last appendix for other important disclosures.

Boston Partners n 18
Boston Partners Large Cap Value EquityPerformance Attribution: Year to Date as of June 30, 2018
Large Cap Value 5.40 6.49 2.68 1.65 0.62 5.06 11.98 32.93 14.29 0.57 15.96 2.04 0.36 100.00%
Russell 1000® Value Index
2.95 6.26 3.33 1.53 6.00 7.44 10.76 26.70 13.33 4.72 9.50 1.38 6.10 100.00%
Relative Weight 2.45 0.23 -0.66 0.12 -5.38 -2.38 1.22 6.23 0.96 -4.15 6.46 0.66 -5.74
Large Cap Value 0.87 -12.46 -10.68 -13.02 3.66 -0.84 10.08 -4.08 -4.03 4.17 4.03 -15.11 1.06 -1.78%
Russell 1000® Value Index
-3.10 -8.26 -10.64 -10.74 -11.03 0.54 8.41 -4.68 0.47 0.38 4.75 -2.34 0.74 -1.69%
Sector Allocation -0.03 -0.05 0.05 0.00 0.53 0.00 0.19 -0.22 0.01 -0.04 0.54 0.00 -0.10 0.89%
Stock Selection 0.20 -0.35 -0.01 -0.04 0.09 -0.11 0.13 0.19 -0.62 -0.05 -0.11 -0.28 -0.03 -0.97%
= -0.09%
Capit
al Goo
ds
Basic
Indu
stries
Commun
icatio
nsCo
nsum
er D
urab
lesCo
nsum
er N
on-D
urab
lesCo
nsum
er S
ervic
esEn
ergy
Finan
ce
Wei
ghtin
gsRe
turn
sCo
ntri
butio
n
Health
Car
eRE
ITs
Tech
nolog
y
Trans
porta
tion
Utilitie
s
Tota
l
Attribution is calculated using end of day security prices and returns shown are equity only and exclude cash. Results are from a representative account in the composite and are gross of fees. Individual portfolio results may vary. The information is supplemental to the GIPS® compliant presentation herein. Past performance is not an indication of future results. Please refer to the last appendix for other important disclosures.
Boston Partners n 19
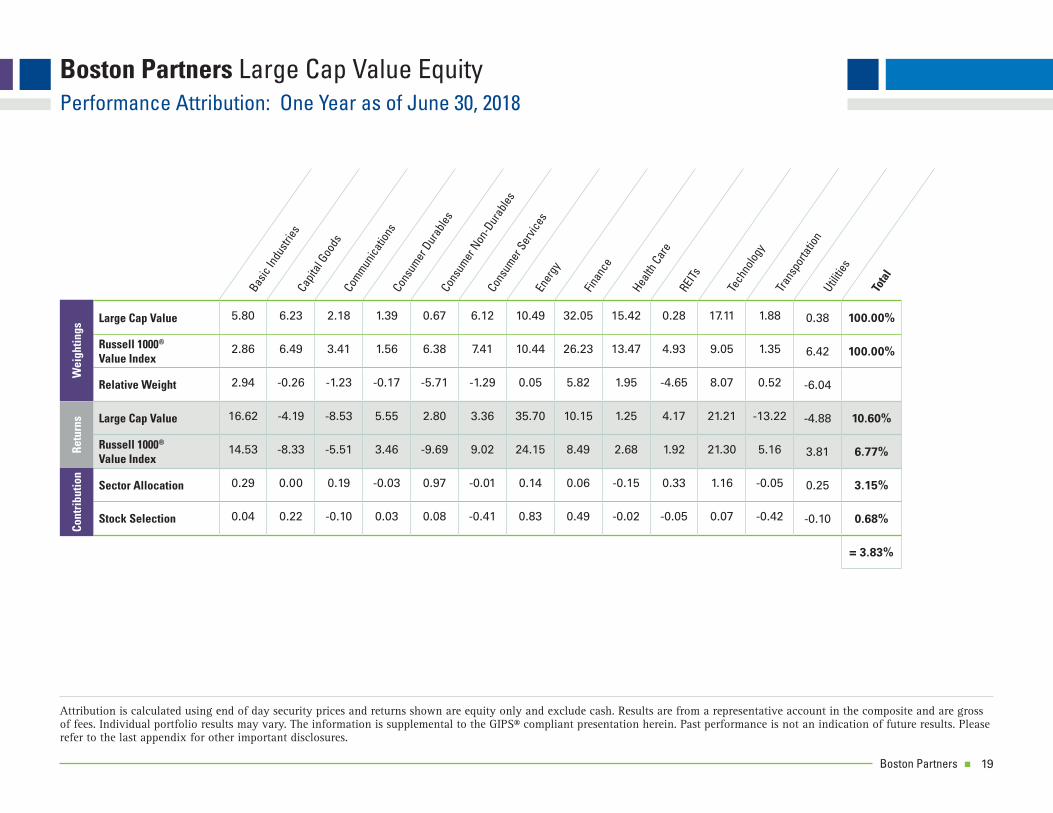
Boston Partners Large Cap Value EquityPerformance Attribution: One Year as of June 30, 2018
Large Cap Value 5.80 6.23 2.18 1.39 0.67 6.12 10.49 32.05 15.42 0.28 17.11 1.88 0.38 100.00%
Russell 1000® Value Index
2.86 6.49 3.41 1.56 6.38 7.41 10.44 26.23 13.47 4.93 9.05 1.35 6.42 100.00%
Relative Weight 2.94 -0.26 -1.23 -0.17 -5.71 -1.29 0.05 5.82 1.95 -4.65 8.07 0.52 -6.04
Large Cap Value 16.62 -4.19 -8.53 5.55 2.80 3.36 35.70 10.15 1.25 4.17 21.21 -13.22 -4.88 10.60%
Russell 1000® Value Index
14.53 -8.33 -5.51 3.46 -9.69 9.02 24.15 8.49 2.68 1.92 21.30 5.16 3.81 6.77%
Sector Allocation 0.29 0.00 0.19 -0.03 0.97 -0.01 0.14 0.06 -0.15 0.33 1.16 -0.05 0.25 3.15%
Stock Selection 0.04 0.22 -0.10 0.03 0.08 -0.41 0.83 0.49 -0.02 -0.05 0.07 -0.42 -0.10 0.68%
= 3.83%
Capit
al Goo
ds
Basic
Indu
stries
Commun
icatio
nsCo
nsum
er D
urab
lesCo
nsum
er N
on-D
urab
lesCo
nsum
er S
ervic
esEn
ergy
Finan
ce
Wei
ghtin
gsRe
turn
sCo
ntri
butio
n
Health
Car
eRE
ITs
Tech
nolog
y
Trans
porta
tion
Utilitie
s
Tota
l
Attribution is calculated using end of day security prices and returns shown are equity only and exclude cash. Results are from a representative account in the composite and are gross of fees. Individual portfolio results may vary. The information is supplemental to the GIPS® compliant presentation herein. Past performance is not an indication of future results. Please refer to the last appendix for other important disclosures.

Boston Partners n 20Boston Partners n 18
Boston Partners Large Cap Value EquityPerformance Attribution: Calendar Year 2017
Large Cap Value 6.54 5.41 1.63 1.54 0.70 7.06 9.66 29.24 16.38 0.00 19.33 1.95 0.56 100.00%
Russell 1000® Value Index 2.90 6.92 3.61 1.51 6.88 6.12 10.82 26.13 12.12 5.09 9.34 1.78 6.80 100.00%
Relative Weight 3.64 -1.51 -1.98 0.04 -6.18 0.95 -1.16 3.11 4.26 -5.09 9.99 0.18 -6.24
Large Cap Value 23.75 22.52 11.56 41.07 29.99 12.38 10.88 19.51 18.75 0.00 34.00 10.11 -8.08 20.50%
Russell 1000® Value Index 26.03 3.98 -2.49 21.55 11.26 15.09 -1.19 20.88 18.37 6.07 28.16 22.78 10.76 13.66%
Sector Allocation 0.37 0.08 0.47 -0.04 0.13 0.06 0.07 0.45 0.57 0.40 1.23 -0.05 0.18 3.91%
Stock Selection -0.12 0.99 0.22 0.35 0.14 -0.25 1.21 -0.32 0.09 0.00 1.14 -0.37 -0.14 2.94%
= 6.84%
Capit
al Goo
ds
Basic
Indu
stries
Commun
icatio
nsCo
nsum
er D
urab
lesCo
nsum
er N
on-D
urab
lesCo
nsum
er S
ervic
esEn
ergy
Finan
ce
Wei
ghtin
gsRe
turn
sCo
ntri
butio
n
Health
Car
eRE
ITs
Tech
nolog
y
Trans
porta
tion
Utilitie
s
Tota
l
Attribution is calculated using end of day security prices and returns shown are equity only and exclude cash. Results are from a representative account in the composite and are gross of fees. Individual portfolio results may vary. The information is supplemental to the GIPS® compliant presentation herein. Past performance is not an indication of future results. Please refer to the last appendix for other important disclosures.
Boston Partners n 21
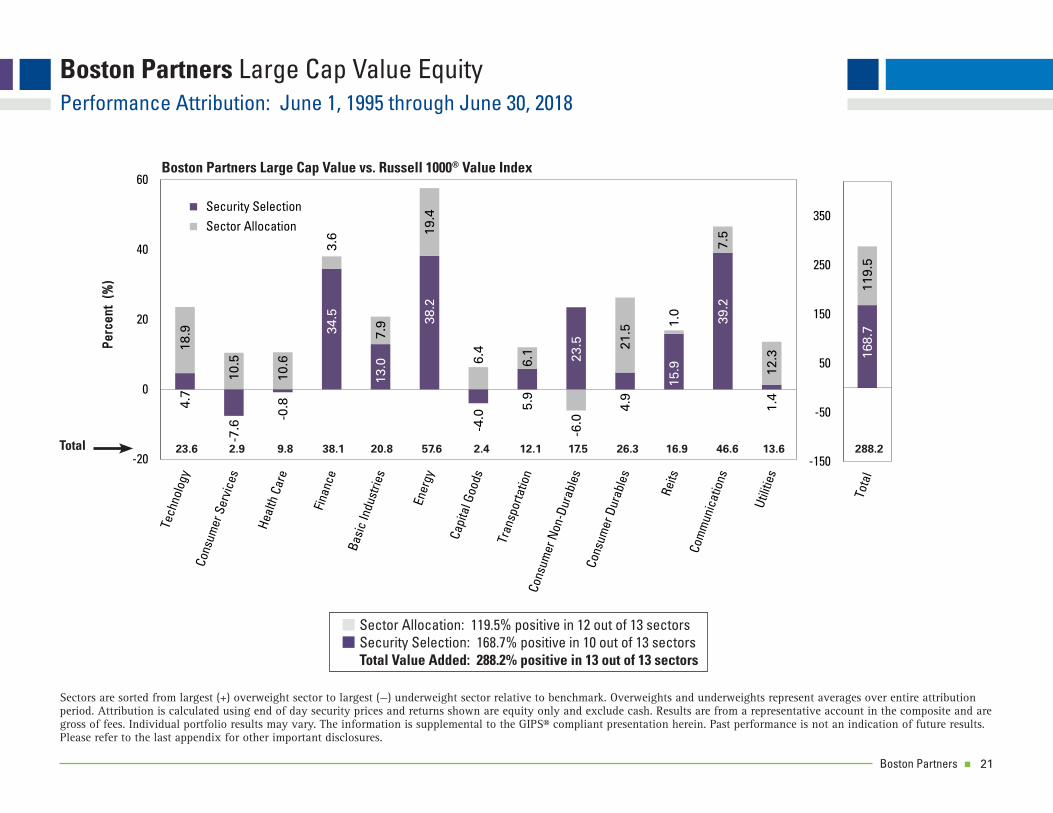
Boston Partners Large Cap Value EquityPerformance Attribution: June 1, 1995 through June 30, 2018
4.7
-7.6
-0.8
34.5
13.0
38.2
-4.0
5.9
23.5
4.9
15.9
39.2
1.4
18.9
10.5
10.6
3.6
7.9
19.4
6.4
6.1
-6.0
21.5
1.0
7.5
12.3
-20
0
20
40
60
Perc
ent
(%)
Security Selection Sector Allocation
168.
711
9.5
-150
-50
50
150
250
350
Sectors are sorted from largest (+) overweight sector to largest (—) underweight sector relative to benchmark. Overweights and underweights represent averages over entire attribution period. Attribution is calculated using end of day security prices and returns shown are equity only and exclude cash. Results are from a representative account in the composite and are gross of fees. Individual portfolio results may vary. The information is supplemental to the GIPS® compliant presentation herein. Past performance is not an indication of future results. Please refer to the last appendix for other important disclosures.
Boston Partners Large Cap Value vs. Russell 1000® Value Index
Sector Allocation: 119.5% positive in 12 out of 13 sectorsSecurity Selection: 168.7% positive in 10 out of 13 sectorsTotal Value Added: 288.2% positive in 13 out of 13 sectors
Total 23.6 2.9 9.8 38.1 20.8 57.6 2.4 12.1 17.5 26.3 16.9 46.6 13.6 288.2
Boston Partners n 22
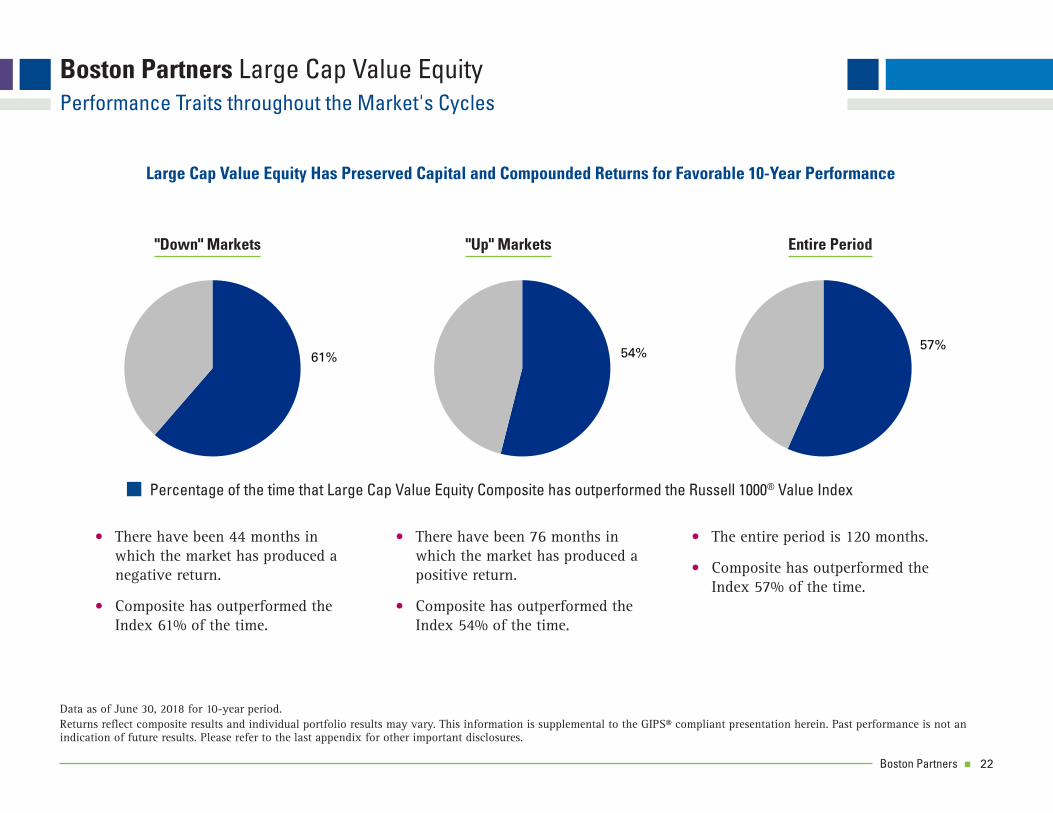
Boston Partners Large Cap Value EquityPerformance Traits throughout the Market's Cycles
61% 54%57%
Large Cap Value Equity Has Preserved Capital and Compounded Returns for Favorable 10-Year Performance
Data as of June 30, 2018 for 10-year period.Returns reflect composite results and individual portfolio results may vary. This information is supplemental to the GIPS® compliant presentation herein. Past performance is not an indication of future results. Please refer to the last appendix for other important disclosures.
Percentage of the time that Large Cap Value Equity Composite has outperformed the Russell 1000® Value Index
• There have been 44 months in which the market has produced a negative return.
• Composite has outperformed the Index 61% of the time.
• There have been 76 months in which the market has produced a positive return.
• Composite has outperformed the Index 54% of the time.
• The entire period is 120 months.
• Composite has outperformed the Index 57% of the time.
"Down" Markets "Up" Markets Entire Period

Boston Partners n
Boston PartnersConcentrated Large Cap Value Equity

Boston Partners n 24Boston Partners n 11
Boston Partners Concentrated Large Cap Value EquityPortfolio Risk Controls
Portfolio risk controls can be customized to meet specifi c client guidelines.
Preserve Capital:
• Consistent execution of "Three Circles" investment process
- Emphasis on individual company risk
- Stocks are sold when any one of three characteristics are no longer present
- Portfolio characteristics managed using quantitative tools
• Broad diversifi cation
• Liquidity of positions is actively monitored
Guideline Parameters:
• No holding shall represent more than a 10% weight in the portfolio
• Positions will be initiated at 1% or greater
• No individual economic sector shall exceed 3x Index weight or 40% of the portfolio
• Non U.S. equity securities and ADRs will not comprise more than 20% of the total portfolio
• The portfolio will target 35-40 holdings
• Cash will not represent more than 10% of the total portfolio
We Do Not:
• Set tracking error limits: Tracking error is not always an accurate measure of active risk
• Remain sector neutral: If large parts of the market are unattractive, we will not invest there
Boston Partners n 25Boston Partners n 12
"Three Circles"
An attractive valuation,strong businessfundamentals,and positive businessmomentum. Porfolios withall three characteristics tendto outperform over time.
Valuation
Business Momentum
Fundamentals
Portfolio R1000V
13.2x 14.6xP/E (FY0)
P/E (FY1)
P/B
12.0x 13.5x
1.9x 2.1x
Portfolio R1000V
27.4% 27.6%OROA (5 Yr)
ROE (5 Yr)
LT EPS Gr. Rt.
13.5% 10.7%
16.8% 14.6%
Portfolio
84%Percent of companieswith positive/neutralearnings momentum
Boston Partners Concentrated Large Cap ValuePortfolio Characteristics: As of June 30, 2018
Please refer to the back for important disclosures.BP Concentrated Large Cap Value
FCF Yield* 2.9% 2.6%
Boston Partners Concentrated Large Cap Value EquityPortfolio Characteristics: June 30, 2018
* FCF Yield is reported as median excluding fi nancials.Portfolio characteristics are based upon a representative account in the composite and are subject to change. Individual portfolio characteristics may vary. Please refer to the last appendix for other important disclosures.
"Three Circles"
An attractive valuation, strong business fundamentals, and positive business momentum. Portfolios with all three characteristics tend to outperform over time.
BUSINESS
FUNDAMENTALS
BUSINESS MOMENTUM
VALUATION

Boston Partners n 26Boston Partners n 13
Sector Weightings (% of Portfolio)Largest Holdings (%)
0.0
3.8
16.1
0.0
12.9
32.7
16.0
1.5
0.0
0.0
4.2
8.8
2.5
6.3
1.5
10.3
5.1
12.7
23.1
10.6
8.1
5.9
1.6
5.2
5.9
3.9
Utilities
Transportation
Technology
REITs
Health Care
Finance
Energy
Consumer Services
Consumer Non-Durables
Consumer Durables
Communications
Capital Goods
Basic Industries
Portfolio R1000V
Bank of America Corp 6.6
Berkshire Hathaway Inc Cl B 5.4
JPMorgan Chase & Co 5.4
Johnson & Johnson 4.9
Citigroup Inc 4.2
Cisco Systems Inc 4.2
Anthem Inc 3.8
Chevron Corp 3.3
Royal Dutch Shell Plc 3.2
Andeavor 3.1
44.1Total
Number of Securities
R1000V
38 729
Wtd. Avg. Mkt. Cap ($M) $154,645
2.5%
$110,697
Dividend Yield 2.0%
41.3%Turnover (Trailing 1 Year)
Portfolio
Portfolio Statistics
-
Boston Partners Concentrated Large Cap ValuePortfolio Characteristics: As of June 30, 2018
BP Concentrated Large Cap ValuePlease refer to the back for important disclosures.
Boston Partners Concentrated Large Cap Value EquityPortfolio Characteristics: June 30, 2018
Portfolio characteristics and sector weightings are based upon a representative account in the composite and are subject to change. Individual portfolio characteristics may vary. The specifi c securities identifi ed and described do not represent all of the securities purchased, sold or recommended for advisory clients. It should not be assumed that investments in these sectors or securities were or will be profi table. This information is supplemental to the GIPS® compliant presentation herein. Please refer to the last appendix for other important disclosures.
Weighted Average
Concentrated Large Cap Value Equity $154.6 B
Russell 1000® Value Index $110.7 B
Market Capitalization
Sector Weightings (%)Largest Stock Holdings (%)

Boston Partners n 27Boston Partners n 14
Steel Dynamics Inc⇓ 1.2
WestRock Co 1.3
Celanese Corp 0.0∅
Basic Industries 2.5
Boeing Co 2.4
CRH Plc 1.3
Owens Corning 1.0
⇑ Cummins Inc 2.3
United Technologies Corp 2.0
Raytheon Co 0.0∅
Capital Goods 8.8
⇑ Comcast Corp Cl A 2.6
Verizon Communications Inc 1.6
Communications 4.2
eBay Inc 1.5
Consumer Services 1.5
ConocoPhillips 2.6
⇑ EQT Corp 2.1
⇑ Royal Dutch Shell Plc 3.2
Andeavor 3.1
Chevron Corp 3.3
Marathon Petroleum Corp 1.9
Diamondback Energy Inc 0.0∅
Energy 16.0
Allstate Corporation 2.7
⇑ American International Group Inc 2.7
⇑ Chubb Ltd 1.9
⇑ Discover Financial Services Inc 2.2
⇑ Goldman Sachs Group Inc 1.6
Bank of America Corp⇓ 6.6
Citigroup Inc⇓ 4.2
JPMorgan Chase & Co⇓ 5.4
Finance 32.7
Finance (cont...)
Berkshire Hathaway Inc Cl B 5.4
Health Care 12.9
⇑ Anthem Inc 3.8
Cigna Corp 2.1
Gilead Sciences Inc 2.1
Johnson & Johnson 4.9
Merck & Co Inc 0.0∅
Technology 16.1
⇑ DXC Technology Co 2.5
Alphabet Inc⇓ 1.6
Booking Holdings Inc⇓ 1.2
Microsoft Corp⇓ 2.2
Cisco Systems Inc 4.2
Eaton Corp Plc 1.7
TE Connectivity Ltd 2.6
Oracle Corp 0.0∅
Perspecta Inc 0.0∅
Transportation 3.8
Delta Air Lines Inc 2.2
Southwest Airlines Co 1.6
Account Summary: April 1, 2018 through June 30, 2018
Boston Partners Concentrated Large Cap Value
New HoldingKey: ⇓= |== |♦ Increased Position | Unchanged=∅⇑ LiquidatedDecreased Position |
BP Concentrated Large Cap ValuePlease refer to the back for important disclosures.
Boston Partners Concentrated Large Cap Value EquityPortfolio Holdings (Percent of Portfolio): April 1 through June 30, 2018
Security holdings as of June 30, 2018 are based upon a representative account in the composite and are subject to change. Values are percent of portfolio and are rounded to one decimal place. It should not be assumed that an investment in these securities was or will be profi table. This information is supplemental to the GIPS® compliant presentation herein.

Boston Partners n 28Boston Partners n 16
Boston Partners Concentrated Large Cap Value EquityInvestment Performance through June 30, 2018
* Inception date is July 1, 2017.Boston Partners has prepared and presented this report in compliance with the GIPS®. Returns refl ect composite results and individual portfolio results will vary. Past performance is not an indication of future results. Please refer to the appendix for other important disclosures.
Annualized Performance (%)
2Q2018
YTD2018
Since Inception*
Concentrated Large Cap Value - Gross of Fees -1.22 -2.23 11.17
Concentrated Large Cap Value - Net of Fees -1.39 -2.57 10.41
Russell 1000® Value Index 1.18 -1.69 6.77
Boston Partners n 29Boston Partners n 1
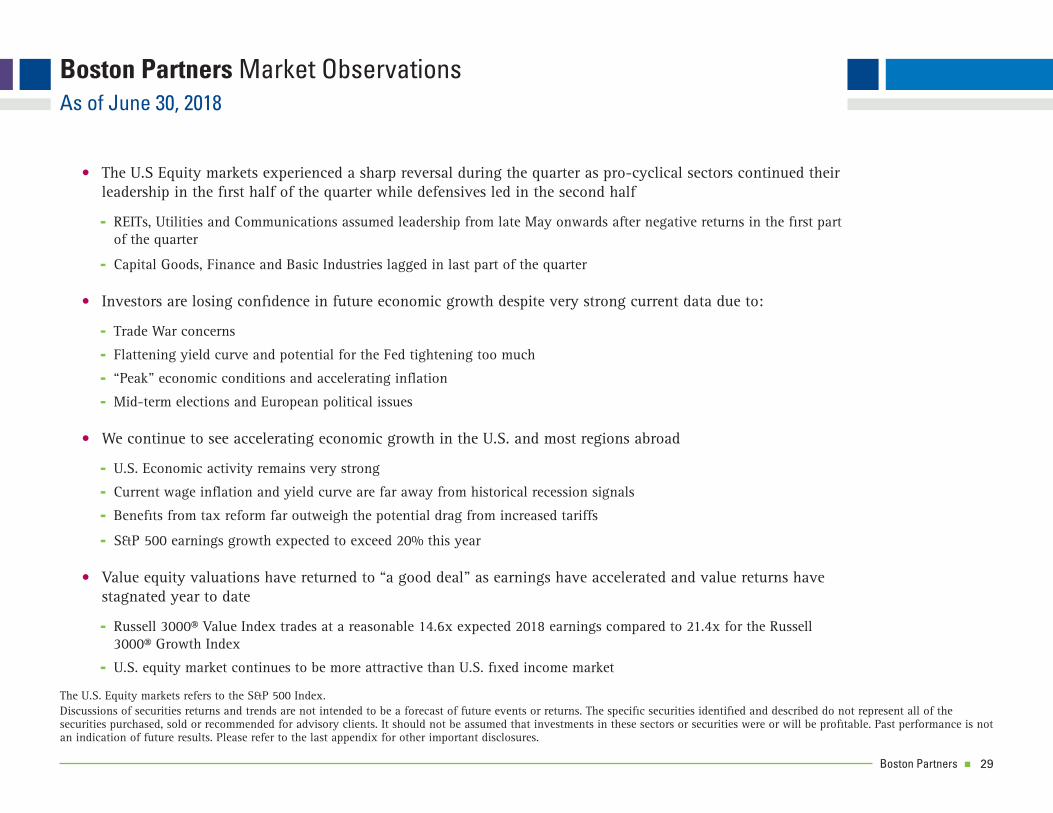
Boston Partners Market ObservationsAs of June 30, 2018
The U.S. Equity markets refers to the S&P 500 Index.Discussions of securities returns and trends are not intended to be a forecast of future events or returns. The specifi c securities identifi ed and described do not represent all of the securities purchased, sold or recommended for advisory clients. It should not be assumed that investments in these sectors or securities were or will be profi table. Past performance is not an indication of future results. Please refer to the last appendix for other important disclosures.
• The U.S Equity markets experienced a sharp reversal during the quarter as pro-cyclical sectors continued their leadership in the fi rst half of the quarter while defensives led in the second half
- REITs, Utilities and Communications assumed leadership from late May onwards after negative returns in the fi rst part of the quarter
- Capital Goods, Finance and Basic Industries lagged in last part of the quarter
• Investors are losing confi dence in future economic growth despite very strong current data due to:
- Trade War concerns
- Flattening yield curve and potential for the Fed tightening too much
- “Peak” economic conditions and accelerating infl ation
- Mid-term elections and European political issues
• We continue to see accelerating economic growth in the U.S. and most regions abroad
- U.S. Economic activity remains very strong
- Current wage infl ation and yield curve are far away from historical recession signals
- Benefi ts from tax reform far outweigh the potential drag from increased tariffs
- S&P 500 earnings growth expected to exceed 20% this year
• Value equity valuations have returned to “a good deal” as earnings have accelerated and value returns have stagnated year to date
- Russell 3000® Value Index trades at a reasonable 14.6x expected 2018 earnings compared to 21.4x for the Russell 3000® Growth Index
- U.S. equity market continues to be more attractive than U.S. fi xed income market

Boston Partners n 30Boston Partners n 2
Market Reversal: Pro-cyclical Sectors Lead in First Half of the Quarter While Defensives Assume Leadership After Tariff Rhetoric Picks Up
Source: Boston Partners.Past performance is not an indication of future results. Please refer to the last appendix for other important disclosures.
-10
-5
0
5
10
15
20
Energy Technology Basic Industries Transportation ConsumerServices
Finance Health Care Capital Goods ConsumerDurables
REITs Utilities Communications Consumer Non-Durables
(%)
S&P 500 Sector Returns April 1, 2018 - May 22, 2018 and May 23, 2018 - June 30, 2018
4/1/18-5/22/18 5/23/18-6/30/18
Energy Technology Basic Transportation Consumer Finance Health Care Capital Consumer REITs Utilities Communication Consumer Industries Services Goods Durables Non-Durables

Boston Partners n 31Boston Partners n 9
0
-5
-4
-3
-2
-1
0
1
2
3
4
CFN
AI T
hree
Mon
th M
ovin
g A
vera
ge
Federal Reserve National Activity Index
Federal Reserve National Activity Index
Updated on 7/16/2018 from website
1967 through May 31, 2017.Source: FRB Chicago.Past performance is not an indication of future results.
The Chicago Fed National Activity Index (CFNAI) is a 3 month moving average index designed to gauge overall economic activity and infl ationary pressure. It is a weighted average of 85 indicators of economic activity, measuring production & income, employment, consumption/housing, and sales/inventories. Values above +0.70 indicate above trend growth and infl ationary pressures. Values below -0.70 indicate a recession has begun.

Boston Partners n 32Boston Partners n 4
ISM Purchasing Manager Indices Remain Firmly in Expansion TerritoryAs of June 30, 2018
Source: Institute of Supply Management.Past performance is not an indication of future results. Please refer to the last appendix for other important disclosures.
ISM Purchasing Manager Indices Remain Firmly in Expansion Territory
Source: Institute of Supply Management
Boston Partners Past performance is not an indication of future results. Please refer to the appendix for other important disclosures.
Boston Partners n 33Boston Partners n 5
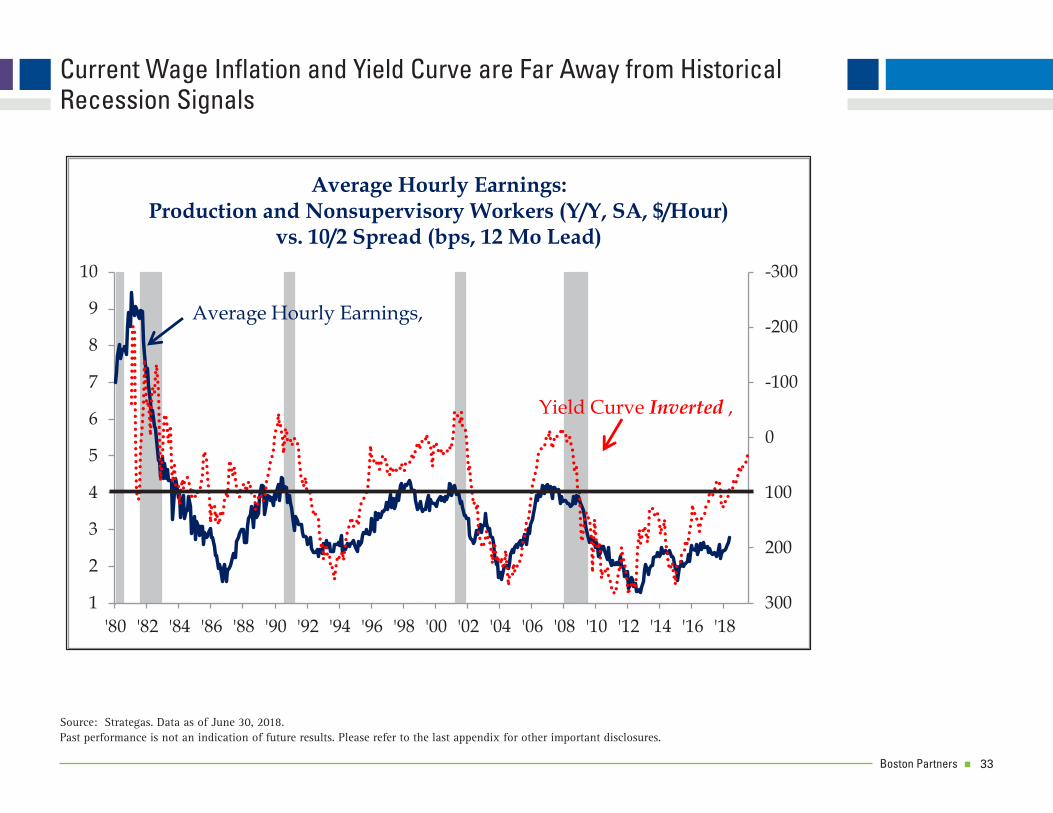
Current Wage Infl ation and Yield Curve are Far Away from Historical Recession Signals
Source: Strategas. Data as of June 30, 2018.Past performance is not an indication of future results. Please refer to the last appendix for other important disclosures.
-300
-200
-100
0
100
200
3001
2
3
4
5
6
7
8
9
10
'80 '82 '84 '86 '88 '90 '92 '94 '96 '98 '00 '02 '04 '06 '08 '10 '12 '14 '16 '18
Average Hourly Earnings: Production and Nonsupervisory Workers (Y/Y, SA, $/Hour)
vs. 10/2 Spread (bps, 12 Mo Lead)
Yield Curve Inverted ,
Average Hourly Earnings,
Boston Partners n 34Boston Partners n 6
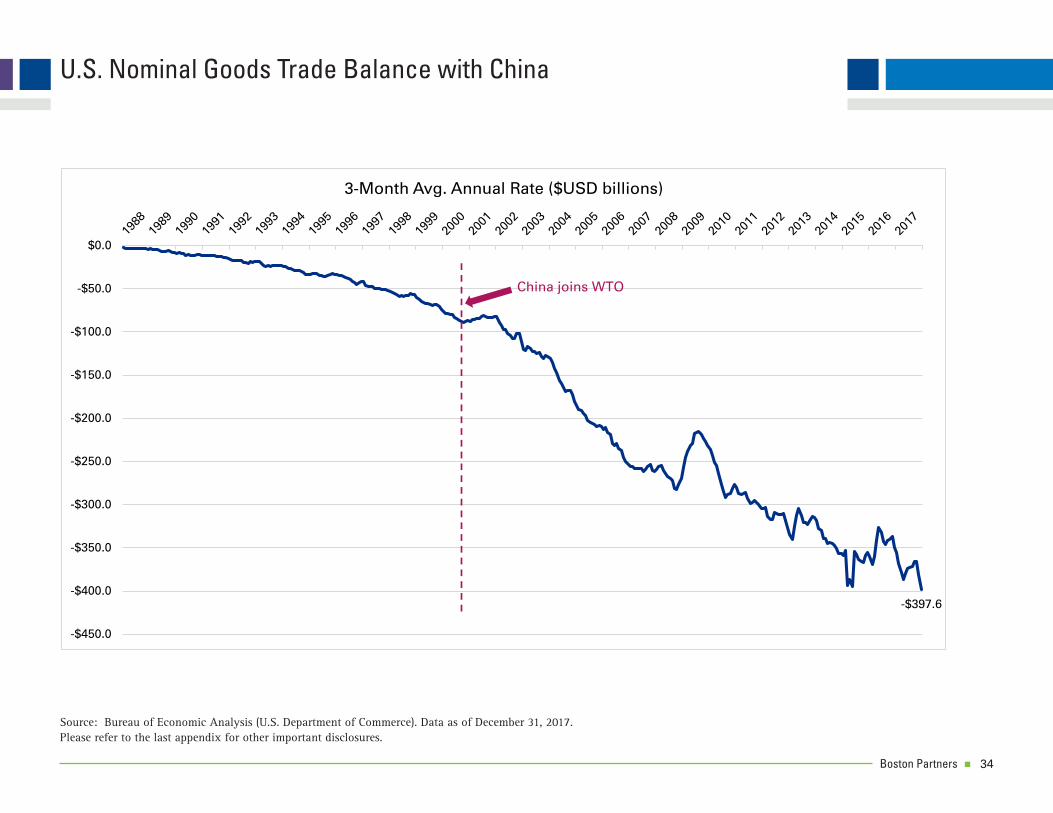
U.S. Nominal Goods Trade Balance with China
Source: Bureau of Economic Analysis (U.S. Department of Commerce). Data as of December 31, 2017. Please refer to the last appendix for other important disclosures.
-$397.6
-$450.0
-$400.0
-$350.0
-$300.0
-$250.0
-$200.0
-$150.0
-$100.0
-$50.0
$0.0
3-Month Avg. Annual Rate ($USD billions)
China joins WTO
Boston Partners n 35Boston Partners n 7
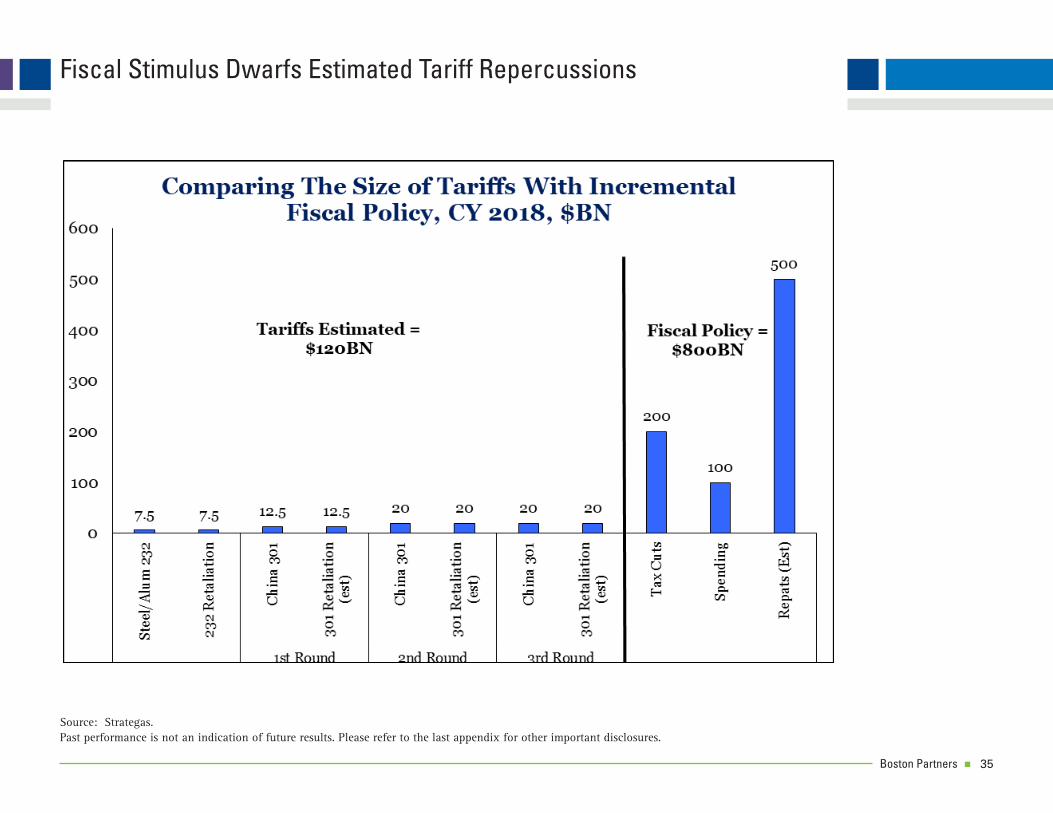
Fiscal Stimulus Dwarfs Estimated Tariff Repercussions
-300
-200
-100
0
100
200
3001
2
3
4
5
6
7
8
9
10
'80 '82 '84 '86 '88 '90 '92 '94 '96 '98 '00 '02 '04 '06 '08 '10 '12 '14 '16 '18
Average Hourly Earnings: Production and Nonsupervisory Workers (Y/Y, SA, $/Hour)
vs. 10/2 Spread (bps, 12 Mo Lead)
Yield Curve Inverted ,
Average Hourly Earnings,
Source: Strategas.Past performance is not an indication of future results. Please refer to the last appendix for other important disclosures.

Boston Partners n 36Boston Partners n 4
Percentile Distribution of S&P Trailing Twelve Month Earnings Multiples, 1957 to Present
Percentile 10% 20% 30% 40% 50% 60% 70% 80% 90% 100%
LTM P/E 9.7 12.1 14.4 16.4 17.0 17.7 18.2 20.2 22.1 29.7
$165 1,601 1,997 2,376 2,706 2,805 2,921 3,003 3,333 3,647 4,901
$161 1,562 1,948 2,318 2,640 2,737 2,850 2,930 3,252 3,558 4,782
$159 1,542 1,924 2,290 2,608 2,703 2,814 2,894 3,212 3,514 4,722
$155 1,504 1,876 2,232 2,542 2,635 2,744 2,821 3,131 3,426 4,604
$151 1,465 1,827 2,174 2,476 2,567 2,673 2,748 3,050 3,337 4,485
$147 1,426 1,779 2,117 2,411 2,499 2,602 2,675 2,969 3,249 4,366
$144 1,397 1,742 2,074 2,362 2,448 2,549 2,621 2,909 3,182 4,277
$141 1,368 1,706 2,030 2,312 2,397 2,496 2,566 2,848 3,116 4,188
$137 1,329 1,658 1,973 2,247 2,329 2,425 2,493 2,767 3,028 4,069
$133 1,290 1,609 1,915 2,181 2,261 2,354 2,421 2,687 2,939 3,950
Percentile Distribution of 10 Year U.S. Treasury Bond Yield, 1957 to Present
Percentile 10% 20% 30% 40% 50% 60% 70% 80% 90% 100%
10 Yr. Yield 9.8% 8.1% 7.3% 6.5% 5.7% 4.8% 4.2% 3.9% 2.8% 1.4%
S&P 500 Fair ValueTargets Based on Trailing Twelve Month Historical Earnings Multiples
P/E multiples are based on S&P 500 trailing 12-month operating EPS estimates from 1957 to present. Source: The Leuthold Group.Data as of June 30, 2018. S&P 500 earnings estimates according to Factset.Please refer to the appendix for other important disclosures.
S&P
500
Earn
ings
Per
Sha
re
YE 2017 A
YE 2018 E
6/30/2018 E

Boston Partners n 37Boston Partners n 9
Value has Outperformed Growth by a Wide Margin Since 1979Growth of $1.00
Source: Boston Partners. Data as of June 30, 2018.Past performance in not an indication of future results. Please refer to the last appendix for other important disclosures.
Russell 1000® Value Index 12.01%
Russell 1000® Growth Index 11.44%
Annualized Return since January 1979
$0
$10
$20
$30
$40
$50
$60
$70
$80
$90
$100
Russell 1000® Value Index
Russell 1000® Growth Index$88.48
$72.19

Boston Partners n 38Boston Partners n 4
The Case for Active ManagementBoston Partners Large Cap Value Equity
$0
$20,000,000
$40,000,000
$60,000,000
$80,000,000
$100,000,000
$120,000,000
1995 1997 1999 2001 2003 2005 2007 2009 2011 2013 2015 2017
Boston Partners LCV Net of Fees as of 6/30/2018
Russell 1000® Value Index as of 6/30/2018
S&P 500 Index as of 6/30/2018
Cumulative Growth of a $10 Million Investment June 1, 1995 to June 30, 2018 (Net of Fees)
$79.1 million
$101.1 million
$79.1 million
This is a hypothetical illustration of $10 million had it been invested in the Boston Partners Large Cap Value strategy since inception on June 1, 1995. The results of this illustration may be changed depending on investment guidelines and cash fl ow. This illustration is net of investment management fees. A GIPS® compliant presentation is contained herein. Past performance is not an indication of future results. Please refer to the appendix for other important disclosures.

Boston Partners n 39Boston Partners n 2Boston Partners n 2
Boston Partners U.S. All Cap Stock Selection ModelRolling 12-Month Top Ranking less Worst Ranking Stock Performance
-40%
-20%
0%
20%
40%
60%
80%
Jul-9
4
Feb-
95
Sep-
95
Apr-9
6
Nov-
96
Jun-
97
Jan-
98
Aug-
98
Mar
-99
Oct-9
9
May
-00
Dec-
00
Jul-0
1
Feb-
02
Sep-
02
Apr-0
3
Nov-
03
Jun-
04
Jan-
05
Aug-
05
Mar
-06
Oct-0
6
May
-07
Dec-
07
Jul-0
8
Feb-
09
Sep-
09
Apr-1
0
Nov-
10
Jun-
11
Jan-
12
Aug-
12
Mar
-13
Oct-1
3
May
-14
Dec-
14
Jul-1
5
Feb-
16
Sep-
16
Apr-1
7
Nov-
17
Jun-
18
ROLL
ING
12 M
ONTH
PERF
ORM
ANCE
Boston Partners US All-Cap Stock Selection ModelRolling 12 Month Performance of Buy-Rated less Sell-Rated Stocks
July 1993 through June 2018
Despite the positive long-term performance, there have been interim periods when the "Sell" candidates outperform the "Buy" candidates.l
Internet & Telecom Bubble
Accounting Scandals: Enron, Worldcom, HealthSouth, Tyco, Freddie Mac Low Volatility/Dividend Bubble
and Top-Line Growth at any Price
The chart above illustrates the monthly rolling 12-month performance spread which is calculated by subtracting the equal-weighted performance of the worst-ranked stocks (deciles 8-10) from the equal-weighted performance of the best-ranked stocks (deciles 1-3) as ranked by the Boston Partners Quantitative Equity Team. The investment universe – all U.S. traded stocks with a market capitalization greater than $200 million – is deciled based on quality, valuation, and business momentum factors and rebalanced monthly. While we have been utilizing a derivation of this model since the fi rm’s inception in 1995, signifi cant model revisions went into effect on December 31, 2012. Performance prior to that date is hypothetical back-test returns, while data displayed beyond this date is not back-tested, but is still generated by the model. All data shown above does not represent the results of actual trading, and in fact, actual results could differ substantially, and there is the potential for loss as well as profi t. The performance does not refl ect management fees, transaction costs, and other fees and expenses a client would have to pay, which reduce returns. Past performance is not an indication of future results.
Annualized as of June 30, 2018 2Q 2018 YTD 2018 1 year 3 year 5 year 10 year
Difference between Best- and Worst-Ranked Stocks -4.9% -3.1% 0.9% 6.4% 7.5% 9.1%
Best-Ranked Stocks and Worst-Ranked Stocks
July 1993 through June 30, 2018

Boston Partners n 40
Boston Partners Large Cap Value EquityActive Share (Annual): June 30, 2018
• Active share measures the percentage of portfolio holdings that differ from a portfolio’s benchmark index.
• Active share can range between 0% (for a passive index fund) to 100%.
• Active share helps to predict performance.
• There is compelling evidence that high active share portfolios outperform their benchmark index while portfolios with low active share underperform.
0
10
20
30
40
50
60
70
80
90
100
1995* 1996 1997 1998 1999 2000 2001 2002 2003 2004 2005 2006 2007 2008 2009 2010 2011 2012 2013 2014 2015 2016 2017 2018 YTD2018
Act
ive
Shar
e (%
)
We actively manage portfolio construction to take full advantage of the investment universe
* Inception is June 1, 1995.Portfolio characteristics are based upon a representative account in the composite and are subject to change. Individual portfolio characteristics may vary. Please refer to the last appendix for other important disclosures.Source: “How Active Is Your Fund Manager? A New Measure That Predicts Performance,” Cramers and Petajisto, Yale School of Management, January 2007.

Boston Partners n 41Boston Partners n
Boston PartnersDefi ned Contribution Plans - Over $6.3 Billion in AUM and More Than 68 Clients*
Vehicles available for value strategies:
• Separate Account
• Collective Trust
• Mutual Fund
Advantages of a Collective Trust Vehicle:
• Daily net asset values (NAVs) from the National Securities Clearing Corp. (NSCC)
• Daily liquidity
• Competitive fees with low operating expenses
- Inclusive of custody and other administrative costs
• Ease of administration
- Experience with a variety of record keepers
- Automated daily NAV feeds available
• Participant education and communication
- Quarterly fact sheet designed specifi cally for DC plan participants
- Customized reporting also available
* As of June 30, 2018. Includes separate account and collective trust defi ned contribution clients. Mutual fund assets are not included.Boston Partners Trust Company is a New Hampshire nondepository trust company pursuant to NH RSA 392 of the Banking Laws of NH and exempt from the defi nition of security under the Securities Act of 1933, Section 3a(2).
J:\Marketing\_Book Production\_VIP\DC Capabilities\2018\033118 DC Capabilities.indd
Boston Partners n 42
Boston PartnersBiographical Information
ExecutivesMark E. Donovan, CFAMr. Donovan is Co-Chief Executive Offi cer of Boston Partners and lead portfolio manager for BP Large Cap Value portfolios. He is responsible for strategic and tactical operating decisions affecting the fi rm. He was one of the founding partners of Boston Partners Asset Management in 1995. He joined the fi rm from The Boston Company where he was Senior Vice President and equity portfolio manager. He also spent fi ve years as a consulting associate with Kaplan, Smith & Associates, and two years as a securities analyst for Value Line Inc. Mr. Donovan holds a B.S. degree in management from Rensselaer Polytechnic Institute. He holds the Chartered Financial Analyst® designation. He has thirty-seven years of investment experience.
Joseph F. Feeney, Jr., CFAMr. Feeney is Co-Chief Executive Offi cer and Chief Investment Offi cer for Boston Partners. He is responsible for the fi rm’s strategic, fi nancial and operating decisions, and all aspects of investment management including the fi rm’s fundamental and quantitative research groups. He was one of the original partners of Boston Partners Asset Management in 1995. Prior to assuming these roles, he was director of research. Mr. Feeney joined the fi rm upon its inception in 1995 from Putnam Investments where he managed mortgage-backed securities portfolios. He began his career at the Bank of Boston where he was a loan offi cer specializing on highly leveraged loan portfolios. Mr. Feeney holds a B.S. degree in fi nance (Summa Cum Laude, Phi Beta Kappa) from the University of New Hampshire and an M.B.A. with High Honors from the University of Chicago. He holds the Chartered Financial Analyst® designation and is past President of
the Fixed Income Management Society of Boston. He has thirty-three years of investment experience.
Portfolio ManagementDavid M. Dabora, CFAMr. Dabora is a senior portfolio manager for Boston Partners Small Cap Value, Small Cap Value II, and Small/Mid Cap Value portfolios as well as the Alpha Blue Capital L.P. product. Prior to managing Boston Partners small cap value portfolios, he was an assistant portfolio manager for Boston Partners Premium Equity product. Additionally, he was a research analyst with responsibility for a wide variety of industries. He was one of the original partners of Boston Partners Asset Management in 1995. He joined the fi rm from The Boston Company Asset Management, Inc. where he was an equity analyst in their Los Angeles and Greenbrae, California offi ces. Mr. Dabora holds a B.S. degree in business administration from Pennsylvania State University and an M.B.A. degree from The Anderson School of Management at the University of California at Los Angeles. He holds the Chartered Financial Analyst® designation. He has thirty-one years of investment experience.
George Gumpert, CFAMr. Gumpert is a portfolio manager for Boston Partners Small Cap Value, Small Cap Value II, and Small/Mid Cap Value portfolios. Prior to managing Boston Partners small cap value portfolios, he was a research analyst and specialized in the small capitalization sectors of the equity market. Mr. Gumpert holds a B.A. degree in economics from Amherst College. He holds the Chartered Financial Analyst® designation. He has nineteen years of investment experience.
Christopher K. Hart, CFAMr. Hart is a senior portfolio manager for Boston Partners Global Equity and International Equity products. Prior to this, he was the portfolio manager for the Boston Partners International Small Cap Value product and before that, an assistant portfolio manager for the Boston Partners Small Cap Value products for three years. Previously, he was a research analyst and specialized in conglomerates, engineering and construction, building, machinery, aerospace & defense, and REITs sectors of the equity market. He joined the fi rm from Fidelity Investments where he was a research analyst. Mr. Hart holds a B.S. degree in fi nance, with a concentration in corporate fi nance from Clemson University. He holds the Chartered Financial Analyst® designation. He has twenty-seven years of investment experience.
Joshua Jones, CFAMr. Jones is a portfolio manager on Boston Partners Global and International products. Prior to this role, he was a research analyst specializing in the energy, metals and mining sectors of the equity market and was a global generalist. He joined the fi rm from Cambridge Associates where he was a consulting associate specializing in hedge fund clients. Mr. Jones holds a B.A. degree in economics from Bowdoin College. He holds the Chartered Financial Analyst® designation. He has fourteen years of investment experience.
Robert T. Jones, CFAMr. Jones is a senior portfolio manager for Boston Partners Long/Short Equity product. Previously, he was the Director of Research and portfolio manager for the Large Cap Value and Large Cap Value Focused products. He was a founding Partner of Boston Partners Asset Management. He joined the fi rm from The Boston Company Asset Management, Inc. where he spent seven

Boston Partners n 43
years as Vice President and equity portfolio manager. Mr. Jones holds a B.A. degree in philosophy from Denison University. He holds the Chartered Financial Analyst® designation. He has thirty years of investment experience.
Paul Korngiebel, CFAMr. Korngiebel is the lead portfolio manager on all Boston Partners Emerging Markets strategies, including Boston Partners Emerging Markets Equity and Emerging Markets Long/Short Equity. He also serves as a supporting member of the greater Global Equity team, providing input on idea generation for various international and global portfolios. Mr. Korngiebel joined the fi rm from Deccan Value Advisors, which he co-founded, and prior to that he worked at Brandes Investment Partners. Both fi rms are dedicated to global value investing. Mr. Korngiebel holds a B.A. from Bowdoin (Phi Beta Kappa), M.A. degrees from Harvard and St. Johns College, and an M.B.A. degree from Northwestern (Beta Gamma Sigma). He holds the Chartered Financial Analyst® designation and has eighteen years of investment experience.
Martin P. MacDonnell, CFAMr. MacDonnell is a portfolio manager for Boston Partners 130/30 Large Cap Value product as well as a research analyst specializing in quantitative strategies. He joined the fi rm from ITS Associates, Inc., where he managed the installation of investment software systems. Prior to that, he spent three years at The Boston Company in the investors services group, as a senior performance consultant. Mr. MacDonnell holds a B.A. degree in economics from Fairfi eld University. He holds the Chartered Financial Analyst® designation. He has twenty-seven years of investment experience.
Steven L. Pollack, CFAMr. Pollack is the equity portfolio manager for Boston Partners Mid Cap Value Equity product. He is in his fi fteenth year with the fi rm. He joined the fi rm from Hughes Investments where he spent twelve years as an equity portfolio manager, managing value equity across the market capitalization spectrum. He also oversaw the outside investment managers who manage assets for Hughes’ pension plan. He began his career at Hughes as an Investment Analyst where he spent four years covering a variety of industries and sectors. Prior to that, he was with Remington, Inc., and Arthur Anderson & Co. Mr. Pollack is a graduate from Georgia Institute of Technology and holds an M.B.A. from The Anderson School of Management at the University of California at Los Angeles. He holds the Chartered Financial Analyst® designation. He has thirty-four years of investment experience.
David J. Pyle, CFAMr. Pyle is a portfolio manager for Boston Partners Large Cap Value portfolios. Prior to assuming this role, he was a research analyst covering the utility, insurance, leisure & lodging, packaging, publishing, and computer equipment & services sectors. Mr. Pyle joined the fi rm from State Street Research where he was a research analyst and associate portfolio manager in their equity value group. Prior to that, he spent fi ve years with Price Waterhouse. Mr. Pyle holds a B.S. degree in business administration from California State University, Chico, and an M.B.A. degree from the Kenan-Flagler School of Business at the University of North Carolina. Mr. Pyle holds the Chartered Financial Analyst® designation. He has twenty-three years of investment experience.
Duilio R. Ramallo, CFAMr. Ramallo is the senior portfolio manager for Boston Partners Premium Equity product. Previously, Mr. Ramallo was the assistant portfolio manager for the Small Cap Value products. Prior to his portfolio management role, Mr. Ramallo was a research analyst for Boston Partners. He joined the fi rm from Deloitte & Touche L.L.P., where he spent three years, most recently in their Los Angeles offi ce. Mr. Ramallo holds a B.A. degree in economics/business from the University of California at Los Angeles and an M.B.A. from the Anderson Graduate School of Management at UCLA. He holds the Chartered Financial Analyst® designation. He is also a Certifi ed Public Accountant (inactive). He has twenty-three years of investment experience.
Harry J. Rosenbluth, CFAMr. Rosenbluth is a senior advisor for Boston Partners Global Equity and International Equity products. Prior to this, he was the portfolio manager for Boston Partners Premium Equity Product and co-manager for our Mid Cap Value Equity product. He was one of the founding partners of Boston Partners Asset Management in 1995. Mr. Rosenbluth joined the fi rm following fourteen years with The Boston Company Asset Management, Inc. as Senior Vice President and the portfolio manager for the Dynamic Equity Fund. Mr. Rosenbluth was also a member of the Equity Policy Group of The Boston Company Asset Management, Inc. Before that, Mr. Rosenbluth was a consultant for Arthur Andersen & Company. Mr. Rosenbluth holds a B.A. degree in Economics from George Washington University and an M.B.A. from The Amos Tuck School of Business Administration at Dartmouth College. He holds the Chartered Financial Analyst® designation. He has thirty-seven years of investment experience.
Boston PartnersBiographical Information (continued)

Boston Partners n 44
Portfolio ResearchJohn C. Forelli, CFAMr. Forelli is the Director of Portfolio Research for Boston Partners. In this position, he directs our team of investment professionals in formulating, developing, and communicating the investment narrative for Boston Partners. Prior to this role, he was a senior portfolio analyst and has extensive experience with all of the fi rm’s strategies. Mr. Forelli has 12 years of experience as a portfolio manager focused on large cap equities. He joined the fi rm from Independence Investments where he was large cap core portfolio manager, senior partner and member of the investment committee. Mr. Forelli was also a research analyst specializing in health care, chemical, capital goods and industrial companies. He began his career as an investment banker with Prudential Securities focusing on raising capital for emerging growth companies and merger and acquisition transactions. Mr. Forelli holds a B.A. degree in economics from Dartmouth College and an M.B.A. degree from the Tuck School of Business at Dartmouth College. He holds the Chartered Financial Analyst® designation and FINRA licenses 7 and 66. He has thirty-four years of industry experience.
Carolyn Margiotti, CFAMs. Margiotti is a senior portfolio analyst for Boston Partners and has extensive experience with all of the fi rm’s strategies. Ms. Margiotti also serves as a member of the relationship management team managing a number of the fi rm’s key relationships. Prior to joining the fi rm in 2005, Ms. Margiotti was the manager of investments for PG&E Corporation where she managed over $12 billion in pension, 401(k) and taxable trust assets. Her primary responsibilities included strategic asset allocation, investment strategy recommendations and investment
manager selection and oversight. Ms. Margiotti is a member of the Financial Women of San Francisco, serving as Scholarship Committee team leader for many years. She has been an adjunct professor at the University of San Francisco and an instructor for the CFA review program. Ms. Margiotti holds a B.S. degree in industrial management and fi nance from Purdue University and an M.B.A. degree from the McLaren School of Business at the University of San Francisco. She holds the Chartered Financial Analyst® designation, FINRA licenses 7 and 63, and has twenty-four years of industry experience.
Mike McCune, CFAMr. McCune is a portfolio analyst for Boston Partners and has extensive experience with all of the fi rm’s strategies. He began his career at Boston Partners in 2003 as a quantitative analyst, and later became a portfolio manager with the WPG Partners’ Quantitative Equity Group. Additionally, Mr. McCune has spent time as the U.S.-based Client Portfolio Manager for Robeco’s fundamental Emerging Markets and quantitative strategies. Prior to joining Boston Partners, Mr. McCune was a quantitative analyst at Deutsche Asset Management. Mr. McCune holds a BSc degree in fi nance from Villanova University and an M.B.A. from New York University. He holds the Chartered Financial Analyst designation. Mr. McCune has twenty-four years of industry experience.
Brandon Smith, CFA, CAIAMr. Smith is a portfolio analyst for Boston Partners and has extensive experience with all of the fi rm's strategies. Prior to this, Mr. Smith was a Vice President and senior investment analyst at Envestnet Asset Management. Before that, Mr. Smith held investment analyst roles within the fund of hedge funds groups at Gottex Fund Management and Columbia Partners
Investment Management. Mr. Smith holds a B.A. degree in government from Dartmouth College. He holds the Chartered Financial Analyst® and Chartered Alternative Investment Analyst designations. Mr. Smith has twelve years of industry experience.
Christopher EaganMr. Eagan is a global markets analyst for Boston Partners. He will be examining markets with a macro perspective. He joined the fi rm from Boenning & Scattergood Inc. where he was a managing director. Before that he was with Jessup & Lamont Securities and prior to that with Bank of America. He spent fi fteen years with Fidelity Capital Markets as a vice president, supervising an equity trading desk. Mr. Eagan began his career in New York City at Prudential Securities before moving onto Nomura Securities. He holds a B.A. degree in economics from the College of the Holy Cross and has thirty-three years of investment experience.
Michael A. MullaneyMr. Mullaney is the director of global markets research for Boston Partners. He rejoined the fi rm from Fiduciary Trust Company where he was chief investment offi cer with responsibilities that included setting the fi rms overall investment policy practices and establishing both strategic and tactical asset allocation targets for client portfolios. Prior to that, Mr. Mullaney was the director of fi xed income with Boston Partners Asset Management. Prior to joining Boston Partners, Mr. Mullaney was managing director and senior investment strategist at Putnam Investments, specializing in portfolio strategy and key account portfolio management. Before that, he was a senior consultant with Chase Econometrics/ Interactive Data Corporation, focusing on quantitative methodologies in fi xed income and equity management. Mr. Mullaney holds a B.S. degree (Cum Laude) in
Boston PartnersBiographical Information (continued)

Boston Partners n 45
biological sciences from Boston University and an M.B.A. in Finance from Babson College. He has a total of thirty-seven years of investment experience.
ResearchEric S. Connerly, CFAMr. Connerly is the director of quantitative research for Boston Partners. Prior to assuming this role, he was a research analyst covering the fi nancial, electronics, defense, transportation, and energy sectors and managed a merger arbitrage portfolio. He joined the fi rm from John Hancock Mutual Funds where he was an analyst and assisted in the management of a small cap portfolio. Prior to that, he was a senior equity analyst at SEI Investments overseeing their small cap equity portfolios. Mr. Connerly holds a BSFS degree Cum Laude in development economics from Georgetown University and an MBA degree in security analysis and investment management, Beta Gamma Sigma, from Columbia Business School. He holds the Chartered Financial Analyst® designation. He has twenty-fi ve years of experience.
Todd KnightlyMr. Knightly is the director of fundamental research for Boston Partners. Prior to assuming this role, he was a research analyst covering in the gaming, lodging and leisure sectors of the equity market. He joined the fi rm from Credit Suisse First Boston where he was a portfolio manager in the global proprietary trading group. In this role, he managed a long-short portfolio designed to achieve absolute returns using bottom-up security selection strategies. Prior to that, he worked as a market maker in Credit Suisse's international equity department. Before receiving his M.B.A., Mr. Knightly worked for Sumitomo Bank and Sumitomo Securities in fi xed
income sales. Mr. Knightly holds a B.B.A. in fi nance from the University of Massachusetts and holds an M.B.A. from Columbia University. He has twenty-nine years of experience.
Jason Bartlett, CFAMr. Bartlett is a quantitative analyst with Boston Partners, specializing in quantitative strategies. Prior to this, he was an operations analyst in the fi rm’s operations group. Mr. Bartlett joined the fi rm from Thomson Financial where he was an earnings assistant. Mr. Bartlett holds a B.S. degree in fi nance from Bentley College. He holds the Chartered Financial Analyst® designation. He has sixteen years of experience.
Brian R. Boyden, CFA, FRM, CAIAMr. Boyden is an equity analyst with Boston Partners, specializing in property REITs and utilities sectors of the equity market. He joined the fi rm from Eaton Vance Management where he was an equity product manager responsible for supporting the institutional product development effort. Prior to that, Mr. Boyden worked at Meketa Investment Group, where he was responsible for investment manager research, and The Boston Company Asset Management where he held the positions of quantitative analyst and assistant portfolio manager. Mr. Boyden holds a B.A. degree in economics and a B.S. degree in fi nance from Stonehill College. He has also received his M.S. in fi nance from Bentley University. He holds the Chartered Financial Analyst®, Financial Risk Manager and Chartered Alternative Investment Analyst designations. He has twenty years of experience.
Scott E. Burgess, CFAMr. Burgess is an equity analyst with Boston Partners, specializing in the technology and electronics sectors of the equity market. He joined the fi rm after spending three
years with Putnam Investments where he was a senior investment associate. Mr. Burgess holds a B.S. degree in economics and a B.S. degree in chemical engineering from The Wharton School and The School of Engineering and Applied Science, respectively, at the University of Pennsylvania. He also holds an M.B.A. degree from the University of Chicago Graduate School of Business. He holds the Chartered Financial Analyst® designation. He has nineteen years of experience.
Pete CadyMr. Cady is a quantitative analyst with Boston Partners, specializing in quantitative strategies. Prior to this, he was an intern in the fi rm’s quantitative research group for two years. He holds a B.S. degree in business administration with concentrations in accounting and fi nance from Northeastern University. He is a candidate for the Chartered Financial Analyst® designation. He has three years of industry experience.
Lawrence K. Chan, CFAMr. Chan is an equity analyst with Boston Partners, specializing in internet services, payment services and recreational products sectors of the equity market. He joined the fi rm from Foothill Capital (a division of Wells Fargo) where he was an assistant account executive. Mr. Chan holds a B.S. degree in business administration from the University of Southern California, with an emphasis in fi nance and business economics. He holds the Chartered Financial Analyst® designation. He has nineteen years of experience.
Charles ClappMr. Clapp is a global equity analyst with Boston Partners, specializing in the Non-U.S. consumer sector of the equity market. He joined the fi rm after spending three years at Fidelity Investments where he was a research
Boston PartnersBiographical Information (continued)

Boston Partners n 46
associate specializing in the paper & packaging, business services, and publishing sectors across equity and high yield securities. Mr. Clapp holds a B.B.A degree in fi nance and risk management from the University of Wisconsin-Madison. He is a candidate for the Chartered Financial Analyst® designation and has three years of industry experience.
David T. Cohen, CFAMr. Cohen is an equity analyst with Boston Partners, specializing in the energy, engineering & construction, metals & mining sectors of the equity market. He joined the fi rm from Loomis Sayles where he was a portfolio manager for a global energy hedge fund and an equity analyst covering the energy, materials, and industrials sectors. Prior to joining Loomis Sayles, Mr. Cohen was a consultant relations coordinator at MFS Investment Management. He received a B.A. degree from the University of Michigan and his M.S. degree from Brandeis University. He holds the Chartered Financial Analyst® designation. He has fourteen years of experience.
Tim CollardMr. Collard is an equity analyst with Boston Partners, specializing in the aerospace & defense, transportation, housing and automobile sectors of the equity market. He joined the fi rm from Shellback Capital where he was a founding partner and equity analyst. Prior to that, Mr. Collard worked as a research analyst at Vinik Asset Management and Diamondback Capital Management. He began his career in investment banking, working for America’s Growth Capital. Mr. Collard holds a B.A. degree in American Studies from Middlebury College. He has thirteen years of experience.
Paul Donovan, CFAMr. Donovan is an equity analyst with Boston Partners, specializing in the paper & packaging, cable & telecom, gaming & lodging and chemicals sector of the equity market. Prior to this position, he was an associate on the Business Analytics and Strategy team at Sanford Bernstein in New York City. Mr. Donovan holds a B.S. degree in business administration with a concentration in fi nance from Loyola University Maryland. He holds the Chartered Financial Analyst® designation. He has seven years of industry experience.
Kevin Duggan, CFAMr. Duggan is an equity analyst with Boston Partners, specializing in banks and money center sectors of the equity market. He joined the fi rm from Fidelity Investments where he held several positions, most recently as a complex securities analyst. Prior to that, he was with State Street where he was an accounting manager. Mr. Duggan holds a B.S. degree in business administration from Boston University. He holds the Chartered Financial Analyst® designation. He hastwenty-three years of industry experience.
Leo Fochtman, Jr. Mr. Fochtman is a quantitative analyst with Boston Partners, specializing in quantitative strategies. Prior to this position, he was a senior quantitative equity analyst and assistant portfolio manager with the Weiss Peck & Greer division. Before this, he spent eight years in a similar role at State Street Research & Management. Additional affi liations include one and a half years as a quantitative analyst at Moore Capital Management and almost eight years at Kidder, Peabody, fi rst as a programmer analyst and then as a quantitative analyst in the equity research group. Mr. Fochtman began his career as an instructor and programmer with IBM. He holds
a B.S. degree in computer science from Pace University and an M.S. degree in fi nance from Boston College. Mr. Fochtman has thirty-two years of investment experience.
Trevor Frankel, CFAMr. Frankel is an equity analyst with Boston Partners and is a global generalist. Prior to joining the fi rm, he worked as a research analyst at Highfi elds Capital specializing in the energy and materials sectors. He began his career doing quantitative research for Federated Investors – MDT Advisers. Mr. Frankel holds an A.B. in economics with a secondary fi eld in mathematical sciences from Harvard University and an M.B.A degree from the MIT Sloan School of Management. He holds the Chartered Financial Analyst® designation and has eight years of industry experience.
Volkan Gulen, CFAMr. Gulen is an equity analyst with Boston Partners specializing in the consumer products, tobacco, agriculture, business services, media and advertising sectors of the equity market. He joined the fi rm from Fidelity Investments where he was a research analyst with coverage of the consumer sector with roles spanning equity and high yield securities. Mr. Gulen holds a B.B.A. degree in fi nance from the University of Massachusetts, Amherst. He holds the Chartered Financial Analyst® designation and has twelve years of investment experience.
Andrew G. Hatem, CFAMr. Hatem is an equity analyst with Boston Partners specializing in the healthcare therapeutics sectors of the equity market. He joined the fi rm from Adage Capital where he managed a long/short healthcare portfolio. Mr. Hatem began his career at Fidelity Investments where he spent eighteen years with the fi rm and covered a variety
Boston PartnersBiographical Information (continued)

Boston Partners n 47
of industries including consumer, fi nancial services, industrials, and healthcare. While at Fidelity, he also managed the Select Air Transportation, the Select Defense and Aerospace, and the Select Medical Delivery Funds. Mr. Hatem holds a B.S. degree in marketing and english as well as an M.S. in fi nance from Boston College. He holds the Chartered Financial Analyst® designation. He has twenty-three years of experience.
David C. Hinton, CFAMr. Hinton is an equity analyst with Boston Partners, specializing in the small capitalization sector of the equity market. He joined the fi rm from positions at Metcalf & Eddy, Inc. and LTV Steel Co. Inc. Mr. Hinton holds a B.S. degree in chemical engineering from Northwestern University and an M.B.A. degree from the Amos Tuck School of Business at Dartmouth College. He holds the Chartered Financial Analyst® designation. He has sixteen years of investment experience.
Timothy J. HoranMr. Horan is an equity analyst with Boston Partners, specializing in industrials and manufacturing, home & offi ce furnishings sectors of the equity market. He rejoined the fi rm after spending two years at BNP Paribas Investment Partners as a senior equity portfolio manager. Prior to that, Mr. Horan spent nine years at Pioneer Investments as an equity portfolio manager. Before that, he was an equity analyst at Boston Partners and an associate portfolio manager with State Street Research. Mr. Horan holds a B.A. from the University of Massachusetts at Amherst and an M.B.A. from the Sawyer School of Business at Suffolk University. He has twenty-one years of experience.
Ross Klein, CFAMr. Klein is a long/short generalist with Boston Partners specializing in fundamental research of stocks held in our Long/Short Equity product. Prior to this, he was an equity analyst with the same focus on our Long/Short Equity product, but was under more specifi c direction from the Senior Portfolio Manager on the product. Mr. Klein holds a B.S. degree in business management with a concentration in fi nance from Babson College. He holds the Chartered Financial Analyst® designation. He has eight years of industry experience.
Stephanie McGirrMs. McGirr is an equity analyst with Boston Partners, specializing in health care services, insurance, restaurants and retail sectors of the equity market. Before assuming this role, she was a research and quantitative assistant in the fi rm’s research group. She joined the fi rm from Arthur Andersen where she was an operations associate. Ms. McGirr holds a bachelor's degree in English from Colgate University. She has sixteen years of experience.
Rubina MoinMs. Moin is a quantitative analyst with Boston Partners, specializing in data analysis and data integrity. She joined the fi rm from SSgA where she worked exclusively with relational databases, data analysis, mapping, back testing and reporting. Before that, she was with Kuberre Systems, a data management and analytics company, where she was a senior database administrator/data analyst. Prior to that, Ms. Moin was with Ameriprise Financials, where she managed and maintained their VISION database for eleven years. Ms. Rubina holds a Master degree from UMass, Boston and a BSc in Biology from the University of Karachi, Pakistan. She also took many graduate level Computer science courses and has eighteen years of industry experience.
Edward Odre, CFAMr. Odre is an equity analyst with Boston Partners, specializing in the fi nancial services and life insurance sectors of the equity market. He joined the fi rm from Macquarie Securities Group where he was a senior research associate with coverage of specialty fi nance. Mr. Odre holds a B.A. degree in economics from Hamilton College. He holds the Chartered Financial Analyst® designation. He has nine years of industry experience.
Maggy A. Pietropaolo, CFAMs. Pietropaolo is a quantitative analyst with Boston Partners, specializing in quantitative strategies. She joined the fi rm after spending four years with Putnam Investments, where she was an Assistant Vice President and quantitative analyst. Prior to that, she was a database analyst and program analyst at Wellington Management Company and Colonial Management. Ms. Pietropaolo holds a B.A. degree in economics from Cornell University and an M.B.A. degree from Boston University. She holds the Chartered Financial Analyst® designation. She has twenty-eight years of experience.
Patrick Regan, CFAMr. Regan is a long/short generalist with Boston Partners specializing in fundamental research of stocks held in our Long/Short Equity product. He rejoined the fi rm after spending nearly six years with Westfi eld Capital, where he managed the fi nancial sector sleeves of their small, small/mid, mid, large and all cap funds. He was also a voting member on the Westfi eld Investment Committee. Before that, Mr. Regan was a research analyst with Boston Partners Asset Management for ten years where he covered numerous market sectors, including the fi nancial, consumer, and software sectors. He began his post graduate career at Broadview International, LLC where he was an associate specializing in technology
Boston PartnersBiographical Information (continued)

Boston Partners n 48
Boston PartnersBiographical Information (continued)
mergers and acquisitions. Mr. Regan holds a B.A. degree in economics from Colby College, and an M.B.A. degree from The Wharton School at the University of Pennsylvania. He holds the Chartered Financial Analyst® designation. He has over twenty-three years of industry experience.
Joseph UrickMr. Urick is a quantitative analyst with Boston Partners, specializing in quantitative strategies. He joined the fi rm from Putnam Investments where he was a Vision database architect. Prior to that, he spent ten years at State Street Global Advisors. Mr. Urick holds a B.S. degree in computer science from Northeastern University. Mr. Urick has twenty-nine years of industry experience, specializing in quantitative and fundamental software research.
Joshua White, CFAMr. White is a equity analyst with Boston Partners serving as a global generalist. Mr. White holds a B.A. degree in mathematics from Middlebury College. He holds the Chartered Financial Analyst® designation and has twelve years of experience.
Bruce WimberlyMr. Wimberly is a long/short generalist with Boston Partners specializing in fundamental research of stocks held in our Long/Short Equity product. He joined the fi rm from American Century Investments where he was a vice president and senior portfolio manager on their large cap growth fund. Mr. Wimberly holds a B.A. degree from Middlebury College, an M.B.A. degree from Northwestern University and an M.E. degree from Rockhurst University. He has twenty-six years of investment experience.
Carissa Wong, CFAMs. Wong is a quantitative analyst with Boston Partners specializing in quantitative strategies. She joined Boston Partners seventeen years ago. Prior to assuming this role, she was a marketing associate in the fi rm’s performance measurement group. She joined the fi rm from State Street Bank, where she was a performance analyst. Ms. Wong holds a B.S. degree in business administration from Boston University. She holds the Chartered Financial Analyst® designation and has seventeen years of experience.
TradingMark S. KuzminskasMr. Kuzminskas is the director of equity trading for Boston Partners. His responsibilities include overseeing trading desks in Boston and NY; managing the technological and regulatory change as it impacts trading and the investment process; and heading up the Trade Management Oversight Committee which is charged with ensuring that Trading complies with the fi rm's best execution practices. Prior to joining the fi rm in 2000, Mr. Kuzminskas spent 10 years in various trading roles on both the buy-side and sell-side. These positions involved trading equities at Numeric Investors and The Boston Company; futures and options at Aetna; and running Listed Equity Block Trading at Wessels, Arnold and Henderson. Mr. Kuzminskas holds a B.S. degree in Finance from PennState University. He is a member of the NASDAQ OMX Institutional Traders Advisory Council, the National Organization of Investment Professionals, and the Boston Securities Traders Association. Mr. Kuzminskas has over twenty-eight years of investment experience.
Christopher BowkerMr. Bowker is a senior equity trader for Boston Partners. Prior to assuming this role, he worked as an operations associate in the fi rm’s operations department. He joined the fi rm from Putnam Investments where he was a corporate actions analyst. Mr. Bowker holds a B.A. degree in economics from Stonehill College. He has nineteen years of experience.
Thomas WalshMr. Walsh is a senior equity trader for Boston Partners. He joined the fi rm from Fleet Investment Advisors where he was an equity trader. Prior to that, he held positions with Salomon Smith Barney, The Boston Company Asset Management, and Mellon Trust. Mr. Walsh holds a B.A. degree in economics from Tufts University and an M.S. in Finance from the Sawyer School of Business at Suffolk University. Mr. Walsh holds the Chartered Market Technician designation. He has twenty-four years of experience.
Matthew EnderMr. Ender is an equity trader for Boston Partners. Prior to assuming this role, he held several positions in trading including a junior equity trader and an equity trading assistant and before that as an analyst in the fi rm's compliance department. Mr. Ender holds a B.S. degree in fi nance from Northeastern University. He has nine years of industry experience.
Ian SylvetskyMr. Sylvetsky is an equity trader for Boston Partners. Prior to assuming this role, he worked as an equity trading assistant and before that as an analyst in the fi rm’s compliance department. Mr. Sylvetsky holds a B.S. degree in business administration from Northeastern University. He has nine years of industry experience.

Boston Partners n 49
Boston PartnersBiographical Information (continued)
Christopher SpazianiMr. Spaziani is an equity trading assistant for Boston Partners. Prior to assuming this role, he worked as an RFP writer/database coordinator in the fi rm's marketing services department. Mr. Spaziani holds a B.S. degree in economics-fi nance from Bentley University. He is a candidate for the Chartered Financial Analyst® designation. He has fi ve years of industry experience.

Boston Partners n 50
Boston PartnersEquity Investment Performance through June 30, 2018
Performance (%)
2Q2018
YTD2018
1Year
3Year
5Year
7Year
10Year
Since Inception* 2017 2016 2015 2014 2013 2012 2011 2010 2009 2008
Large Cap Value - Gross of Fees -0.18 -1.77 10.35 8.93 11.08 12.50 10.62 10.92 20.07 14.74 -4.08 11.85 37.14 21.27 1.29 13.75 26.75 -32.95
Large Cap Value - Net of Fees -0.26 -1.92 10.01 8.60 10.73 12.10 10.22 10.54 19.71 14.40 -4.37 11.49 36.64 20.66 0.82 13.36 26.30 -33.17
Russell 1000® Value Index 1.18 -1.69 6.77 8.26 10.34 11.27 8.49 9.37 13.66 17.34 -3.83 13.45 32.53 17.51 0.39 15.51 19.69 -36.85
S&P 500 Index 3.43 2.65 14.37 11.93 13.42 13.23 10.17 9.37 21.83 11.96 1.38 13.69 32.39 16.00 2.11 15.06 26.46 -37.00
130/30 Large Cap Value- Gross of Fees -1.88 -4.44 7.93 8.50 11.23 13.14 11.28 8.83 21.82 14.05 -3.69 14.52 38.71 21.67 2.06 12.90 25.46 -29.44
130/30 Large Cap Value - Net of Fees -1.94 -4.55 7.68 8.25 10.99 12.90 10.89 8.36 21.53 13.79 -3.90 14.31 38.46 21.40 1.82 12.37 24.24 -30.16
Russell 1000® Value Index 1.18 -1.69 6.77 8.26 10.34 11.27 8.49 6.09 13.66 17.34 -3.83 13.45 32.53 17.51 0.39 15.51 19.69 -36.85
Premium Equity - Gross of Fees 0.20 -0.05 9.69 10.58 13.16 13.36 11.97 13.17 18.91 15.73 1.71 13.22 39.73 16.27 -1.01 14.78 33.16 -26.62
Premium Equity - Net of Fees 0.06 -0.34 9.05 9.95 12.54 12.75 11.37 12.61 18.22 15.08 1.15 12.65 39.04 15.72 -1.55 14.18 32.45 -27.05
Russell 3000® Value Index 1.71 -1.16 7.25 8.48 10.40 11.25 8.60 9.43 13.19 18.40 -4.13 12.70 32.69 17.55 -0.10 16.23 19.76 -36.25
S&P 500 Index 3.43 2.65 14.37 11.93 13.42 13.23 10.17 9.37 21.83 11.96 1.38 13.69 32.39 16.00 2.11 15.06 26.46 -37.00
Mid Cap Value - Gross of Fees -0.51 -0.77 8.34 10.26 13.74 13.74 13.55 13.58 16.55 16.29 2.84 14.37 41.04 19.78 1.68 24.79 42.04 -31.84
Mid Cap Value - Net of Fees -0.60 -0.95 7.97 9.88 13.35 13.24 12.96 12.90 16.16 15.90 2.49 14.00 40.48 18.90 0.88 23.93 41.13 -32.36
Russell Midcap® Value Index 2.41 -0.16 7.60 8.80 11.27 11.70 10.06 11.40 13.34 20.00 -4.78 14.75 33.46 18.51 -1.38 24.75 34.21 -38.45
Small/Mid Cap Value -Gross of Fees 2.52 0.49 9.61 9.62 11.81 12.26 11.95 11.63 13.64 25.35 -3.06 5.34 35.33 23.97 -1.57 18.07 43.89 -30.65
Small/Mid Cap Value - Net of Fees 2.36 0.16 8.89 8.91 11.07 11.50 11.13 10.82 12.90 24.51 -3.71 4.65 34.37 23.08 -2.31 17.05 42.69 -31.31
Russell 2500™ Value Index 5.80 3.00 11.49 9.76 10.78 11.07 10.10 10.37 10.36 25.20 -5.49 7.11 33.32 19.21 -3.36 24.82 27.67 -31.99
Russell 2500™ Index 5.71 5.46 16.24 10.30 12.29 11.85 10.74 10.05 16.81 17.59 -2.90 7.07 36.80 17.88 -2.51 26.71 34.38 -36.79
* Inception dates are as follows: Large Cap Value is June 1, 1995; 130/30 Large Cap Value is March 1, 2007; Premium Equity is June 1, 1995; Mid Cap Value is May 1, 1995;and Small/Mid Cap Value is April 1, 1999.Boston Partners has prepared and presented this report in compliance with the GIPS®. Returns refl ect composite results and individual portfolio results will vary.Past performance is not an indication of future results. Please refer to the last appendix for other important disclosures.

Boston Partners n 51
Boston PartnersEquity Investment Performance through June 30, 2018 (continued)
Performance (%)
2Q2018
YTD2018
1Year
3Year
5Year
7Year
10Year
Since Inception1 2017 2016 2015 2014 2013 2012 2011 2010 2009 2008
Small Cap Value - Gross of Fees 3.39 1.62 9.68 9.24 11.64 11.80 12.26 13.36 11.29 25.63 -3.77 4.76 35.27 22.85 -2.13 22.50 44.74 -30.18
Small Cap Value - Net of Fees 3.21 1.27 8.92 8.43 10.80 10.93 11.36 12.45 10.49 24.69 -4.53 3.93 34.21 21.85 -2.93 21.45 43.49 -30.82
Russell 2000® Value Index 8.30 5.44 13.10 11.22 11.18 11.10 9.88 10.44 7.84 31.74 -7.47 4.22 34.52 18.05 -5.50 24.50 20.56 -28.92
Russell 2000® Index 7.75 7.66 17.57 10.96 12.46 11.83 10.60 9.39 14.65 21.31 -4.41 4.89 38.82 16.35 -4.18 26.85 27.16 -33.79
Small Cap Value Equity II- Gross of Fees 4.37 2.85 11.41 10.36 12.37 12.73 12.75 12.80 11.05 27.35 -3.27 5.35 36.53 24.54 -2.29 20.32 49.82 -33.80
Small Cap Value Equity II- Net of Fees 4.13 2.37 10.40 9.35 11.34 11.68 11.65 11.64 10.05 26.21 -4.19 4.37 35.28 23.42 -3.45 19.09 48.31 -34.53
Russell 2000® Value Index 8.30 5.44 13.10 11.22 11.18 11.10 9.88 8.67 7.84 31.74 -7.47 4.22 34.52 18.05 -5.50 24.50 20.56 -28.92
Long/Short Equity - Gross of Fees -0.26 -4.95 3.22 9.09 7.03 8.85 14.19 12.99 5.41 25.71 1.15 7.16 10.37 15.40 8.68 29.54 85.95 -20.03
Long/Short Equity - Net of Fees -0.50 -5.45 2.11 7.86 5.87 7.65 12.61 10.42 4.30 24.03 0.17 6.04 9.17 14.06 7.39 26.55 81.74 -21.71
S&P 500 Index 3.43 2.65 14.37 11.93 13.42 13.23 10.17 7.13 21.83 11.96 1.38 13.69 32.39 16.00 2.11 15.06 26.46 -37.00
Long/Short Research- Gross of Fees -2.35 -2.78 4.03 4.73 7.39 8.18 8.26 7.82 11.63 5.21 3.02 8.68 19.70 14.73 5.35 9.33 18.67 -8.46
Long/Short Research- Net of Fees -2.66 -3.39 2.75 3.44 6.07 6.85 6.93 6.49 10.27 3.91 1.74 7.34 18.23 13.32 4.05 7.98 17.22 -9.60
S&P 500 Index 3.43 2.65 14.37 11.93 13.42 13.23 10.17 7.62 21.83 11.96 1.38 13.69 32.39 16.00 2.11 15.06 26.46 -37.00
Emerging Markets Long/Short- Gross of Fees -5.46 -5.65 4.08 7.50 — — — 7.09 27.89 8.08 -3.671 — — — — — — —
Emerging Markets Long/Short- Net of Fees2 -5.82 -6.34 2.59 5.42 — — — 4.99 25.69 5.69 -5.471 — — — — — — —
MSCI Emerging Markets Index - Net3 -7.96 -6.66 8.20 5.60 — — — 4.79 37.29 11.18 -17.971 — — — — — — —
* Inception dates are as follows: Inception dates are as follows: Small Cap Value is July 1, 1995; Small Cap Value Equity II is July 1, 1998; Long/Short Equity is August 1, 1997; Long/Short Research is April 1, 2002; and Emerging Markets Long/Short Equity is March 1, 2015.2 Net of fees is calculated using a model fee of 2.25% annually calculated on a month-end basis.3 Net total return indexes reinvest dividends after the deduction of withholding taxes, using (for international indexes) a tax rate applicable to non-resident institutional investorswho do not benefi t from double taxation treaties. Boston Partners has prepared and presented this report in compliance with the GIPS®. Returns refl ect composite results and individual portfolio results will vary. Past performanceis not an indication of future results. Please refer to the last appendix for other important disclosures.

Boston Partners n 52
Boston PartnersEquity Investment Performance through June 30, 2018 (continued)
Performance (%)
2Q2018
YTD2018
1Year
3Year
5Year
7Year
10Year
Since Inception1 2017 2016 2015 2014 2013 2012 2011 2010 2009 2008
Global Equity - Gross of Fees -0.74 -1.95 8.29 7.68 11.11 10.58 8.35 8.35 21.53 9.47 1.89 5.54 35.12 17.26 -1.77 13.46 29.62 -30.511
Global Equity- Net of Fees -0.91 -2.29 7.55 6.90 10.29 9.76 7.53 7.53 20.67 8.65 1.11 4.74 34.11 16.37 -2.56 12.56 28.60 -30.811
MSCI World Index - Net2 1.73 0.43 11.09 8.48 9.94 8.84 6.26 6.26 22.40 7.51 -0.87 4.94 26.68 15.83 -5.54 11.76 29.99 -33.711
MSCI World Value Index - Net2 -0.20 -3.39 5.56 6.46 7.74 7.29 5.20 5.20 17.10 12.33 -4.82 3.69 26.62 15.51 -5.62 9.02 26.68 -30.561
MSCI ACWI Index - Net2 0.53 -0.43 10.77 8.20 9.42 7.96 5.80 5.80 24.01 7.87 -2.36 4.16 22.80 16.13 -7.35 12.67 34.63 -35.261
International Equity- Gross of Fees -1.73 -4.43 6.76 5.18 8.06 7.49 4.78 4.78 26.38 0.76 3.54 -3.65 31.47 18.67 -6.20 10.63 27.88 -36.511
International Equity- Net of Fees -1.91 -4.77 5.99 4.41 7.27 6.69 3.99 3.99 25.49 0.01 2.77 -4.37 30.51 17.79 -6.89 9.73 26.87 -36.791
MSCI EAFE Index - Net2 -1.24 -2.75 6.84 4.90 6.44 4.89 2.84 2.84 25.03 1.00 -0.81 -4.90 22.78 17.32 -12.14 7.75 31.78 -36.411
MSCI EAFE Value Index - Net2 -2.64 -4.61 4.25 3.30 5.37 3.90 2.17 2.17 21.44 5.02 -5.68 -5.39 22.95 17.69 -12.17 3.25 34.23 -35.161
MSCI ACWI Ex US Index - Net2 -2.61 -3.77 7.28 5.07 5.99 3.81 2.54 2.54 27.19 4.50 -5.66 -3.87 15.29 16.83 -13.71 11.15 41.45 -39.361
Global Long/Short- Gross of Fees -1.81 -3.59 2.48 4.18 6.39 — — 6.39 9.60 4.34 8.73 4.36 8.961 — — — — —
Global Long/Short- Net of Fees -2.30 -4.56 0.45 2.12 4.37 — — 4.37 7.44 2.28 6.59 2.55 8.021 — — — — —
MSCI World Index - Net2 1.73 0.43 11.09 8.48 9.94 — — 9.94 22.40 7.51 -0.87 4.94 16.831 — — — — —
MSCI World Value Index - Net2 -0.20 -3.39 5.56 6.46 7.74 — — 7.74 17.10 12.33 -4.82 3.69 15.741 — — — — —
1 Inception dates are as follows: Global Equity USA is July 1, 2008; International Equity is July 1, 2008; and Global Long/Short Equity is July 1, 2013. 2 Net total return indexes reinvest dividends after the deduction of withholding taxes, using (for international indexes) a tax rate applicable to non-resident institutional investorswho do not benefi t from double taxation treaties.Boston Partners has prepared and presented this report in compliance with the GIPS®. Returns refl ect composite results and individual portfolio results will vary.Returns are shown in USD. Past performance is not an indication of future results. Please refer to the last appendix for other important disclosures.

Boston Partners n 53
Boston PartnersAnnual Fee Schedules
Large Cap Value Equity, Large Cap Concentrated Equity
0.70% First $10 million of assets0.50% Next $40 million0.40% Next $50 million0.30% Thereafter
Mid Cap Value Equity
0.80% First $25 million of assets0.60% Thereafter
Premium Equity
0.80% First $25 million of assets0.60% Next $25 million0.50% Next $50 million0.40% Thereafter
Small Cap Value Equity, Small Cap Value Equity II& Small/Mid Cap Value Equity
1.00% First $25 million of assets0.80% Thereafter
Long/Short Research Equity
1.50% of total assets under management
130/30 Large Cap Value Equity
1.00% First $10 million0.80% Next $40 million0.70% Next $50 million0.60% Thereafter
Long/Short Equity
1% of total assets under managementPlus 20% of return
1 3(c) 11 Fund offered through Boston Partners Trust Company, a subsidiary of Boston Partners Global Investors, Inc. 2 As of December 31, 2017.
Boston Partners Large Cap Value Equity Fund — BPTC Trust1
Fees start at 0.65%
Additional Administrative Expenses2 2.0 bps annually

Boston Partners n 54
Boston Partners Annual Fee Schedules
Global Equity - Separate AccountInternational Equity - Separate Account
0.75% First $25 million of assets0.65% Next $25 million0.55% Next $50 million0.50% Thereafter
Global Equity - Delaware TrustInternational Equity - Delaware Trust
0.75% of total assets under management
Global Long/Short Equity
2.00% of total assets under management
Global Long/Short - Delaware Trust
1.75% of total assets under management
Emerging Markets Long/Short Equity
2.25% of total assets under management
Emerging Markets Equity - Separate Account
0.95% First $25 million of assets0.85% Next $25 million0.75% Next $50 million0.70% Thereafter

Boston Partners n 55
Boston PartnersPerformance Disclosures
Boston Partners Global Investors, Inc. ("Boston Partners") is an Investment Adviser registered with the Securities and Exchange Commission under the Investment Advisers Act of 1940. Registration does not imply a certain level of skill or training. Boston Partners is an indirect , wholly owned subsidiary of ORIX Corporation of Japan (“ORIX"). Boston Partners updated its fi rm description as of January 1, 2015 to refl ect changes in its divisional structure. Boston Partners is comprised of three divisions, Boston Partners, Weiss, Peck & Greer Partners ("WPG"), and Redwood Equity ("Redwood"). Boston Partners claims compliance with the Global Investment Performance Standards (GIPS®) and has prepared and presented this report in compliance with the GIPS® standards. Boston Partners has been independently verifi ed for the periods 2007 through 2016. Verifi cation assesses whether (1) the Firm has complied with all the composite construction requirements of the GIPS® standards on a fi rm-wide basis and (2) the Firm’s policies and procedures are designed to calculate and present performance in compliance with the GIPS® standards. The composites have been examined per the following periods: Boston Partners Large Cap Value Equity, 1995 to 2016; Boston Partners Alpha Extension Large Cap Value Equity, 2012 to 2016; Boston Partners Premium Equity, 1995 to 2016; Boston Partners Mid Cap Value Equity, 1995 to 2006 and 2010 to 2016; Boston Partners Small/Mid Cap Value Equity, 1999 to 2016; Boston Partners Small Cap Value Equity, 1995 to 2016; Boston Partners Small Cap Value II Equity, 1998 to 2016; Boston Partners Long/Short Research, 2011 to 2016; Boston Partners Global Equity II, 2012 to 2016; Boston Partners International Equity II, 2008 to 2016; Boston Partners Global Long/Short, 2013 to 2016; and Boston Partners Emerging Markets Long/Short Equity, 2016. The verifi cation and performance examination reports are available upon request.Past performance is not indicative of future results. This document is not an offering of securities nor is it intended to provide investment advice. It is intended for information purposes only.
Composite Construction(s)Performance results attained at Boston Partners have been linked to the results achieved at Boston Partners Asset Management, the previous entity name, beginning on January 1, 2007 in compliance with the GIPS® standards on performance record portability. Composites include all separately managed and commingled vehicles, fully discretionary, fee-paying accounts under management with a similar investment mandate and an account market value greater than $1 million with the exception of Boston Partners Small Cap Value Equity and Small Cap Value II Equity which have an account market value greater than $5
million. Prior to January 1, 2007 the minimum account size for inclusion in the composite was $5 million. The composites contain proprietary assets. The inception and creation date of the Boston Partners Large Cap Value Equity composite is June 1, 1995. The strategy is composed of securities with market capitalizations primarily greater than $3 billion and is benchmarked against the S&P 500 Index and the Russell 1000® Value Index. Prior to December 1, 1995, there was no minimum market value requirement for inclusion in the Boston Partners Large Cap Value Equity composite. Accounts that did not meet the newly established minimum balance requirement were removed on that date. The inception date and creation date of the Boston Partners Alpha Extension Large Cap Value Equity composite is March 1, 2007. The strategy is an actively managed Large Cap Value strategy that utilized long and short equity position to generate alpha. The strategy is permitted to short 30% of the portfolio and reinvests the proceeds of those shorts into the securities that the manager fi nds attractive, creating a 130% long portfolio and a 30% short portfolio. The strategy is benchmarked against the Russell 1000® Value Index. The inception and creation date of the Boston Partners Premium Equity composite is June 1, 1995. The strategy is a hybrid of Boston Partners’ other equity products. It has the fl exibility to invest across the capitalization spectrum and to invest in securities with equity-like return and risk profi les. Boston Partners Premium Equity is benchmarked against the S&P 500 Index and the Russell 3000® Value Index. The inception and creation date of the Boston Partners Mid Cap Value Equity composite is May 1, 1995. Effective March 1, 2006, the Mid Cap Value Equity strategy is composed of securities primarily in the same market capitalization range, at time of purchase, as the Russell Midcap® Value Index. Effective January 1, 2005 the Boston Partners Mid Cap Value composite revised its benchmark from the Russell 2500™ Value Index to the Russell Midcap® Value Index. The Russell Midcap® Value Index has less of a bias toward smaller capitalization stocks and thus more accurately refl ects the composition of Boston Partners holdings. The inception and creation date of the Boston Partners Small/Mid Cap Value Equity composite is April 1, 1999. The strategy is composed of securities primarily in the $100 million to $10 billion market capitalization range and is benchmarked against the Russell 2500™ Value Index. The inception and creation date of the Boston Partners Small Cap Value Equity composite is July 1, 1995. The strategy is composed of securities primarily in the $100 million to $1.5 billion market capitalization range and is benchmarked against the Russell 2000® Value Index.
The inception date of the Boston Partners Small Cap Value II Equity composite is July 1, 1998. The composite was created in 2000. The strategy is composed of securities primarily in the $10 million to $1 billion market capitalization range and is benchmarked against the Russell 2000® Value Index. The inception date and creation date of the Boston Partners Long/Short Equity composite is August 1, 1997. The strategy is an absolute return product that balances long and short portfolio strategies and seeks to achieve stable absolute returns with approximately half the risk of the S&P 500. However, this product is not risk neutral. It is exposed to style, capitalization, sector and short-implementation risks. Use of the S&P 500 Index is for comparative purposes only since investment returns are not correlated to equity market returns. Prior to October 1, 1998, the composite was managed on a non-fee paying basis. Participant results would have been substantially different if fee waivers were not applied. Commencing on October 1, 1998 and continuing each quarter thereafter, the net of fee calculation includes a model fee for each commingled account included in the composite, and when applicable, the actual fees assessed for each separately managed portfolio included in the composite. The model fee, which is comprised of an investment management fee and performance fee, represents the deduction of the highest fee that could have been earned based on actual results during the performance period. In addition, other expenses typically borne by the commingled accounts, as defi ned in the applicable offering documents, have been applied. However, from time-to-time the commingled accounts may have placed a ceiling on the amount of expenses it had incurred. Although performance fees are paid annually when earned, for presentation of net returns, performance fees, similar to management fees and expenses, are accrued for on a monthly basis. Actual fees may vary. The composite is benchmarked against the S&P 500 Index and the Russell 3000® Value/Russell 3000® Growth for comparative purposes only since the strategy is not correlated to equity market returns. The inception and creation date of the Boston Partners Research Equity composite is April 1, 2002. This strategy is an absolute return product that balances long and short portfolio strategies and seeks to achieve stable absolute returns with approximately half the risk of the S&P 500 Index. The strategy is benchmarked against the S&P 500 Index. The inception and creation date of the Boston Partners Global Equity II composite is July 1, 2008. This strategy is unconstrained and primarily invests in equity securities in the global market without using hedges on currency. The inception date and creation date of the Boston Partners International Equity II composite is July 1, 2008. This strategy is

Boston Partners n 56
Boston PartnersPerformance Disclosures (continued)
unconstrained and primarily invests in non-us markets without using currency hedges. The strategy is benchmarked against the MSCI EAFE Index. From July 1, 2008 to June 30, 2010 the primary benchmarks was MSCI EAFE Value Index and on July 1, 2010 the primary benchmark change to the MSCI EAFE.This change to the MSCI EAFE Index was made retroactively to July 1, 2008. The inception and creation date of the Boston Partners Global Long/Short Equity composite is July 1, 2013. The strategy is composed of securities with market capitalizations primarily greater than $50 million and is benchmarked against the MSCI World Index.The inception and creation of the Boston Partners Emerging Markets Long/Short composite is March 1, 2015. The strategy is composed of securities with market capitalizations primarily greater than $250 million and is benchmarked against the MSCI Emerging Markets Index.The inception and creation of the Boston Partners Emerging Markets Equity composite is July 1, 2017. The strategy is composed of securities with market capitalizations primarily greater than $250 million and is benchmarked against the MSCI Emerging Markets Index.
BenchmarksIndex returns are provided for comparison purposes only to show how the composite’s returns compare to a broad-based index of securities, as the indices do not have costs, fees, or other expenses associated with their performance.In addition, securities held in either index may not be similar to securities held in the composite’s accounts. The S&P 500 Index is an unmanaged index of the common stocks of 500 widely held U.S. companies. All Russell® Indices are registered trademarks of the Frank Russell Company. The Russell® Value Indices typically measure the performance of universes of stocks displaying low price-to-book ratios and low forecasted growth values. The Russell® Growth Indices typically measure the performance of universes of stocks displaying high price-to-book ratios and high forecasted growth values. The Russell 1000® Index measures the performance of the 1,000 largest companies in the Russell 3000® Index. The Russell 3000® Index measures performance of the 3,000 largest U.S. companies based on total market capitalization. The Russell 2500™, and 2000® Indices measure performance of the 2,500 and 2,000 smallest companies in the Russell 3000® Index respectively. The Russell Midcap® Index measures the performance of the 800 smallest companies in the Russell 1000® Index. The MSCI World Index covers the full range of developed, emerging and All Country MSCI International Equity Indices across all size segmentations. MSCI uses a
two-dimensional framework for style segmentation in which value securities are categorized using a multi-factor approach, which uses three variables to defi ne the value investment style characteristics and fi ve variables to defi ne the growth investment style characteristics including forward looking variables. The objective of the index design is to divide constituents of an underlying MSCI Equity Index into respective value and growth indices, each targeting 50% of the free fl oat adjusted market capitalization of the underlying market index. The MSCI EAFE Index is broadly recognized as the pre-eminent benchmark for U.S. investors to measure international equity performance. It comprises the MSCI country indexes capturing large and mid-cap equities across developed markets in Europe, Australasia and the Far East, excluding the U.S. and Canada. The MSCI World Index represents large and mid-cap equity performance across 23 developed markets countries, covering approximately 85% of the free fl oat-adjusted market capitalization in each. This index offers a broad global equity benchmark, without emerging markets exposure.MSCI Emerging Markets Standard Index (net return): The MSCI Emerging Markets indices are designed to measure the type of returns foreign portfolio investors might receive from investing in emerging market stocks that are legally and practically available to them. Constituents for the MSCI series are drawn from the MSCI stock universe based on size, liquidity, and their legal and practical availability to foreign institutional investors. The MSCI ACWI (All Country World Index) is a market capitalization weighted index designed to provide a broad measure of equity-market performance throughout the world. The MSCI ACWI is maintained by Morgan Stanley Capital International, and is comprised of stocks from both developed and emerging markets. Calculation MethodologyAccount returns are market value weighted and calculated on a total return basis using trade date valuations. Returns refl ect the reinvestment of dividends and other earnings, and are net of commissions and transaction costs. Performance is expressed in U.S. Dollars. Short sales are an integral part of the investment strategy and constitute the use of leverage. Accounts are temporarily removed from the composite when a signifi cant cash fl ow occurs, which is typically defi ned as a fl ow that is greater than 10% of the account value that exceeds a threshold of +/- 20 basis points from daily performance of the representative account and a similar account of the same strategy. An account is generally added back to the composite as of the fi rst full month following the signifi cant cash fl ow. Additional
information regarding policies for valuing portfolios, calculating performance, and presenting compliant presentations is available upon request.
Fees and ExpensesComposite returns are provided on a gross and net of fees basis. Account returns will be reduced by any fees and expenses incurred in the management of the account. In general, actual fees may vary depending on the applicable fee schedule and portfolio size. Net of fees returns for commingled vehicles that are members of a composite are calculated using a model fee that is the highest tier in the separate account fee schedule for the strategy. Fees are applied to gross returns at month end.Returns refl ect the reinvestment of dividends and other earnings, and are net of commissions and transaction costs. Performance is expressed in U.S. Dollars. Additional information regarding policies for valuing portfolios, calculating performance, and presenting compliant presentations is available upon request. Investment advisory fees are listed herein and are fully described in Boston Partners’ Form ADV, Part 2.
Composite DispersionThe measurement of composite dispersion is calculated by the weighted average standard deviation of the annual account returns within the composite. Dispersion in composites with less than fi ve accounts included for the entire year is not considered meaningful and is denoted with “N/A”. Prior to January 1, 2007, the measurement of composite dispersion was calculated by determining the difference between the highest and lowest annual account returns within the composite. The three-year annualized standard deviation measures the variability of the composite and the benchmark returns over the preceding 36-month period.

Boston Partners n 57
Boston PartnersPerformance Disclosures (continued)
Small Cap Value Equity:# of Portfoliosin Composite
Total Assets inComposite
% of FirmAUM
Composite Dispersion
2016: 19 $1.2 bn 1% 0.21%2015: 19 $1.0 bn 1% 0.19%2014: 18 $1.1 bn 2% 0.26%2013: 16 $1.1 bn 2% 0.56%2012: 16 $957 mm 3% 0.20%2011: 17 $923 mm 4% 0.08%2010: 16 $682 mm 4% 0.16%2009: 14 $698 mm 4% 0.90%2008: 14 $560 mm 5% 0.20%2007: 15 $856 mm 3% 0.10%
Small Cap Value Equity II:# of Portfoliosin Composite
Total Assets inComposite
% of FirmAUM
Composite Dispersion
2016: 4 $878 mm 1% N/A2015: 3 $478 mm 1% N/A2014: 4 $444 mm 1% N/A2013: 4 $370 mm 1% N/A2012: 4 $304 mm 1% N/A2011: 5 $272 mm 1% 0.10%2010: 6 $300 mm 2% 0.24%2009: 6 $239 mm 1% 0.98%2008: 7 $161 mm 1% 0.20%2007: 7 $320 mm 1% 0.06%
Long/Short Equity:# of Portfoliosin Composite
Total Assets inComposite
% of FirmAUM
Composite Dispersion
2016: 2 $1.1 bn 1% N/A2015: 2 $687 mm 1% N/A2014: 2 $958 mm 1% N/A2013: 2 $965 mm 2% N/A2012: 2 $829 mm 3% N/A2011: 2 $626 mm 3% N/A2010: 2 $440 mm 2% N/A2009: 2 $189 mm 1% N/A2008: 2 $36 mm 0% N/A2007: 2 $75 mm 0% N/A
Small/Mid Cap Value Equity:# of Portfoliosin Composite
Total Assets inComposite
% of FirmAUM
Composite Dispersion
2016: 18 $1.0 bn 1% 0.14%2015: 13 $814 mm 1% 0.14%2014: 10 $499 mm 1% 0.08%2013: 7 $481 mm 1% 0.13%2012: 7 $367 mm 1% 0.08%2011: 7 $327 mm 2% 0.10%2010: 7 $384 mm 2% 0.04%2009: 7 $350 mm 2% 0.32%2008: 5 $200 mm 2% 0.18%2007: 5 $299 mm 1% 0.02%
Long/Short Research:# of Portfoliosin Composite
Total Assets inComposite
% of FirmAUM
Composite Dispersion
2016: 2 $6.9 bn 8% N/A2015: 1 $7.2 bn 9% N/A2014: 1 $6.0 bn 8% N/A2013: 1 $2.9 bn 6% N/A2012: 1 $492 mm 2% N/A2011: 1 $97 mm 0% N/A2010: 1 $9 mm 0% N/A2009: 1 $5 mm 0% N/A2008: 1 $3 mm 0% N/A2007: 1 $4 mm 0% N/A
Global Equity:# of Portfoliosin Composite
Total Assets inComposite
% of FirmAUM
Composite Dispersion
2016: 4 $699 mm 1% N/A2015: 3 $438 mm 1% N/A2014: 1 $27 mm 0% N/A2013: 2 $66 mm 0% N/A2012: 2 $18 mm 0% N/A2011: 1 $8 mm 0% N/A2010: 1 $9 mm 0% N/A2009: 1 $8 mm 0% N/A
*2008: 1 $6mm 0% N/A* 2008 performance period is from July 1.International Equity:
# of Portfoliosin Composite
Total Assets inComposite
% of FirmAUM
Composite Dispersion
2016: 3 $603 mm 1% N/A2015: 1 $261 mm 0% N/A2014: 2 $33 mm 0% N/A2013: 2 $20 mm 0% N/A2012: 2 $18 mm 0% N/A2011: 1 $6 mm 0% N/A2010: 1 $6 mm 0% N/A2009: 1 $6 mm 0% N/A*2008: 1 $4 mm 0% N/A
* 2008 performance period is from July 1.Global Long/Short Equity:
# of Portfoliosin Composite
Total Assets inComposite
% of FirmAUM
Composite Dispersion
2016: 1 $868 mm 1% N/A2015: 1 $629 mm 1% N/A2014: 1 $125 mm 0% N/A*2013: 1 $3 mm 0% N/A
* 2013 performance period is from July 1.
Mid Cap Value Equity:# of Portfoliosin Composite
Total Assets inComposite
% of FirmAUM
Composite Dispersion
2016: 35 $18.5 b 21% 0.09%2015: 37 $15.3 b 20% 0.01%2014: 29 $11.6 b 16% 0.12%2013: 16 $7.6 b 15% 0.24%2012: 9 $2.9 b 10% 0.01%2011: 4 $1.0 b 5% N/A2010: 3 $306 mm 2% N/A2009: 3 $127 mm 1% N/A2008: 3 $85 mm 1% N/A2007: 2 $86 mm 0% N/A
Premium Equity:# of Portfoliosin Composite
Total Assets inComposite
% of FirmAUM
Composite Dispersion
2016: 35 $3.4 bn 4% 0.10%2015: 35 $3.3 bn 4% 0.09%2014: 29 $3.1 bn 4% 0.14%2013: 29 $2.7 bn 5% 0.53%2012: 26 $2.2 bn 7% 0.17%2011: 24 $2.0 bn 9% 0.19%2010: 27 $2.1 bn 12% 0.43%2009: 26 $2.1 bn 12% 0.49%2008: 23 $1.3 bn 11% 0.30%2007: 15 $677 mm 3% 0.12%
130/30 Large Cap Equity:# of Portfoliosin Composite
Total Assets inComposite
% of FirmAUM
Composite Dispersion
2016: 2 $877 mm 1% N/A2015: 2 $933 mm 1% N/A2014: 2 $1.2 bn 2% N/A2013: 1 $845 mm 2% N/A2012: 3 $636 mm 2% N/A2011: 3 $463 mm 2% N/A2010: 1 $17 mm 0% N/A2009: 1 $6 mm 0% N/A2008: 1 $5 mm 0% N/A2007: 1 $7 mm 0% N/A
Large Cap Value Equity:# of Portfoliosin Composite
Total Assets inComposite
% of FirmAUM
Composite Dispersion
2016: 156 $25.3 bn 29% 0.23%2015: 167 $24.6 bn 31% 0.16%2014: 151 $25.2 bn 34% 0.11%2013: 129 $16.5 bn 32% 0.62%2012: 105 $8.6 bn 30% 0.24%2011: 99 $5.1 bn 24% 0.23%2010: 89 $4.8 bn 26% 0.15%2009: 83 $3.5 bn 20% 0.38%2008: 70 $2.1 bn 18% 0.21%2007: 68 $3.4 bn 13% 0.14%
Emerging Markets Long/Short Equity:# of Portfoliosin Composite
Total Assets inComposite
% of FirmAUM
Composite Dispersion
2016: 1 $11 mm 0% N/A*2015: 1 $3 mm 0% N/A
* 2015 performance period is from March 1.

Boston Partners n 58
Boston PartnersPerformance Disclosures (continued)
Annual Fee SchedulesLarge Cap: 70 basis points ("bp") on the fi rst $10 million in assets; 50 bp on the next $40 million; 40 bp on the next $50 million; 30 bp thereafter. 130/30 Large Cap: 100 basis points ("bp") on the fi rst $10 million in assets; 80 bp on the next $40 million; 70 bp on the next $50 million; 60 bp thereafter. Premium Equity: 80 bp on the fi rst $25 million of assets; 60 bp on the next $25 million; 50 bp on the next $50 million; 40 bp thereafter. Mid Cap: 80 bp on the fi rst $25 million of assets; 60 bp thereafter. Small/Mid Cap, Small Cap, and Small Cap II: 100 bp on the fi rst $25 million of assets; 80 bp thereafter. Long/Short: 100 bp on total assets under management; plus 20% profi t participation. Long/Short Research: 150 basis points.
Global Equity and International Equity are: 75 basis points ("bp") on the fi rst $25 million in assets; 65 bp on the next $25 million; 55 bp on the next $50 million; 50 bp thereafter. Global Long/Short: 200 bp on total assets under management. Emerging Markets Long/Short: 225 bp on total assets under management. Emerging Markets Equity are: 95 basis points ("bp") on the fi rst $25 million in assets; 85 bp on the next $25 million; 75 bp on the next $50 million; 70 bp thereafter.
Corporate InformationBoston Partners Global Investors, Inc. (“Boston Partners”) is affi liated with listed corporations through common ownership. ORIX Corporation Europe N.V. services may be offered in the U.S. through Robeco Institutional Asset Management, U.S., an SEC Registered Investment Adviser registered under the Investment Advisers Act of 1940. Transtrend products may be offered in the U.S. through Boston Partners Securities, LLC, member FINRA, SiPC. Harbor Capital Advisers products are distributed by Harbor Funds Distributors, Inc. Boston Partners is authorized to transact as an Investment Adviser and maintains a Securities License by the Government of Guam Department of Revenue and Taxation. It also maintains a Certifi cate of Authority to transact business on Guam as a Foreign Corporation. In addition, Boston Partners is registered in Korea with the Financial Services Commission (FSC).
Firm Assets:Year Assets (mm) Year Assets (mm)2016: $87,222 2011: $21,0982015: $78,363 2010: $18,4192014: $73,250 2009: $17,2072013: $52,334 2008: $11,5402012: $29,023 2007: $26,554
Other DisclosuresBoston Partners has adjusted the S&P and Russell sector classifi cations to group stocks according to similar business product lines and correlation of stock returns. Boston Partners’ classifi cations are similar to the major market indices in terms of breadth but may differ in terms of composition. All product characteristics and sector weightings are calculated using a representative portfolio. Risk statistics are calculated using composite data. Portfolio composition is subject to change and information contained in this publication may not be representative of the current portfolio. Effective January 1, 2011; Boston Partners adopted a signifi cant cash fl ow policy for this composite in accordance with the Global Investment Performance Standards. If an external cash fl ow is greater than or equal to 10.0% of the beginning market value of the portfolio on the day of the fl ow, and greater than or equal to 10.0% of the beginning market value of the composite for that month then the portfolio is removed from the composite for the month that the fl ow occurred. The portfolio is then placed back into the composite in accordance with Firm’s inclusion policies and procedures.Boston Partners changed the names of its composites in August 2016 after the fi rm changed its name.Boston Partners participates in Initial Public Offerings (IPOs) as described in its Form ADV, Part 2. IPO contributions to performance vary from year to year depending on availability and prevailing market conditions. IPO contributions may have a signifi cant positive effect on performance when initially purchased. Such positive performance should not be expected for future performance periods.
Related Documents