Science Fair! Everything you need to know. . .

Science Fair!
Jan 01, 2016
Science Fair!. Everything you need to know. What is a science fair project?. These projects allow students to experiment, make decisions, form and reform hypothesis, test and examine ideas, seek solutions, and most important learn more about themselves and their world. - PowerPoint PPT Presentation
Welcome message from author
This document is posted to help you gain knowledge. Please leave a comment to let me know what you think about it! Share it to your friends and learn new things together.
Transcript
Science Fair!
Everything you need to know. . .
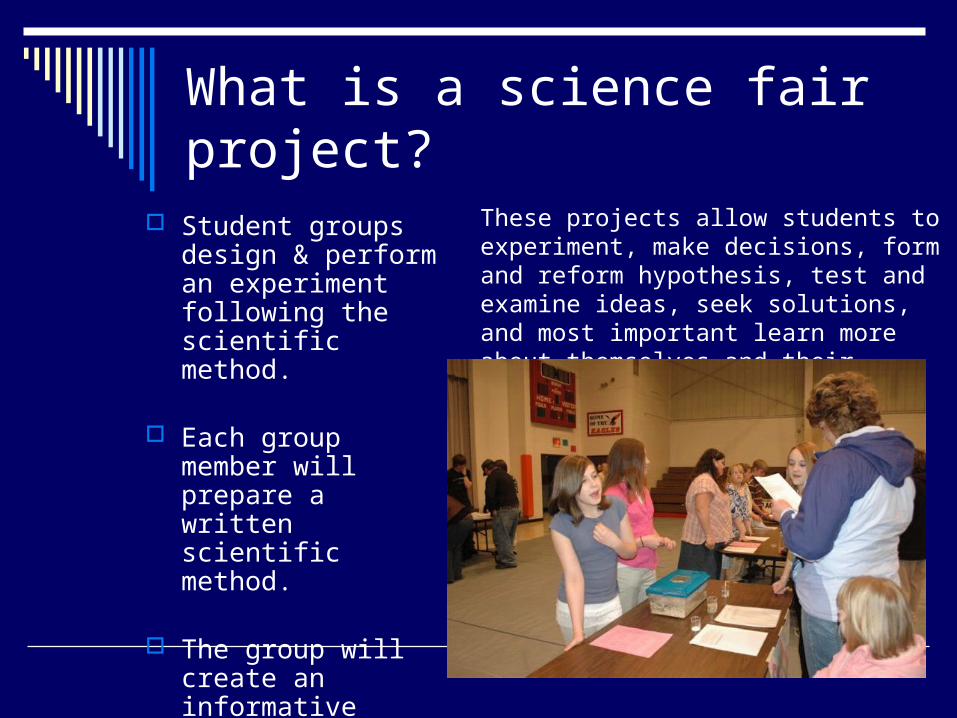
What is a science fair project?
Student groups design & perform an experiment following the scientific method.
Each group member will prepare a written scientific method.
The group will create an informative display about the experiment.
These projects allow students to experiment, make decisions, form and reform hypothesis, test and examine ideas, seek solutions, and most important learn more about themselves and their world.
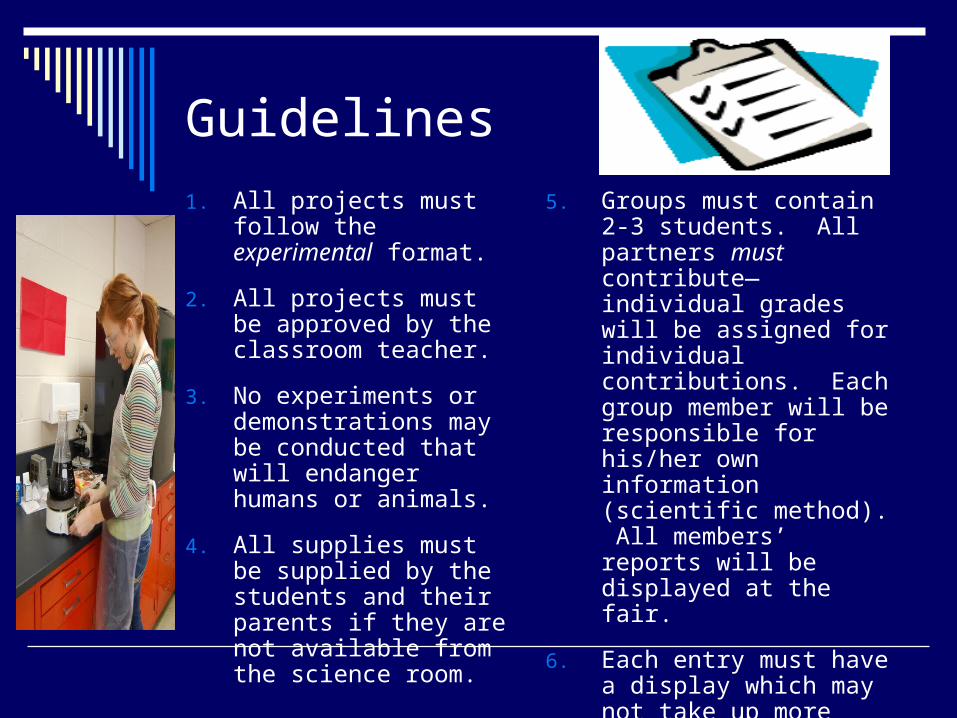
Guidelines
5. Groups must contain 2-3 students. All partners must contribute—individual grades will be assigned for individual contributions. Each group member will be responsible for his/her own information (scientific method). All members’ reports will be displayed at the fair.
6. Each entry must have a display which may not take up more than ½ table.
7. All safety precautions must be followed.
1. All projects must follow the experimental format.
2. All projects must be approved by the classroom teacher.
3. No experiments or demonstrations may be conducted that will endanger humans or animals.
4. All supplies must be supplied by the students and their parents if they are not available from the science room.
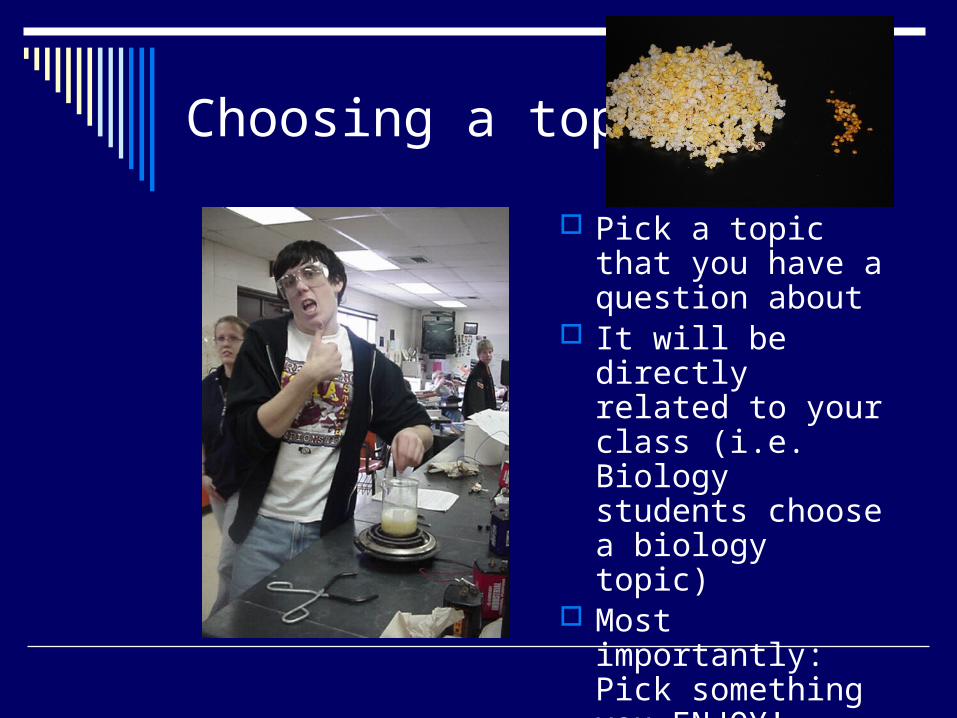
Choosing a topic
Pick a topic that you have a question about
It will be directly related to your class (i.e. Biology students choose a biology topic)
Most importantly: Pick something you ENJOY!
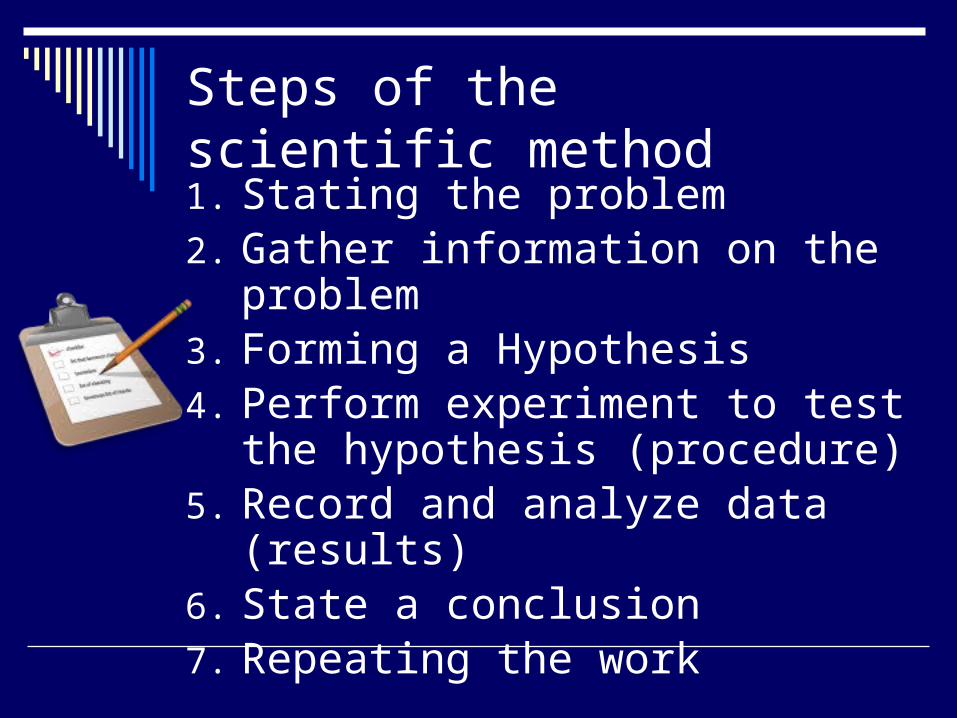
Steps of the scientific method
1. Stating the problem2. Gather information on the problem3. Forming a Hypothesis4. Perform experiment to test the
hypothesis (procedure)5. Record and analyze data (results)6. State a conclusion7. Repeating the work
State the Problem
What do you want to find out?
State the general area of study—no specifics yet
Usually no more than one sentence
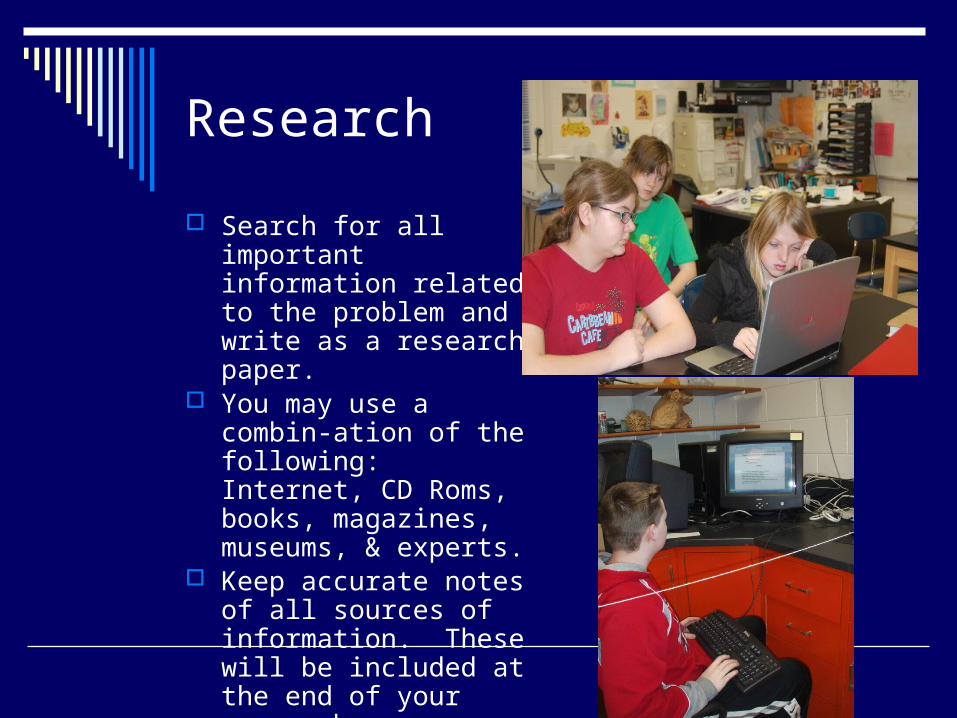
Research
Search for all important information related to the problem and write as a research paper.
You may use a combin-ation of the following: Internet, CD Roms, books, magazines, museums, & experts.
Keep accurate notes of all sources of information. These will be included at the end of your research paper.

Research Rubric
Keep working Almost there Great! Information given Add new ideas
about the general topic
Add other uses or information about topic
Sufficient topics covered
Depth of information
Dig much deeper into information discussed
Give more details about topics
Topics thoroughly covered
Sources Needs to cite sources
Gather information from more sources
Enough sources, cited all
Conventions Rework sentence or paragraph structure
Fix misspellings and punctuation errors
No errors
Make a Hypothesis
Make an intelligent guess
What do you think will happen?
You will build your research around this statement
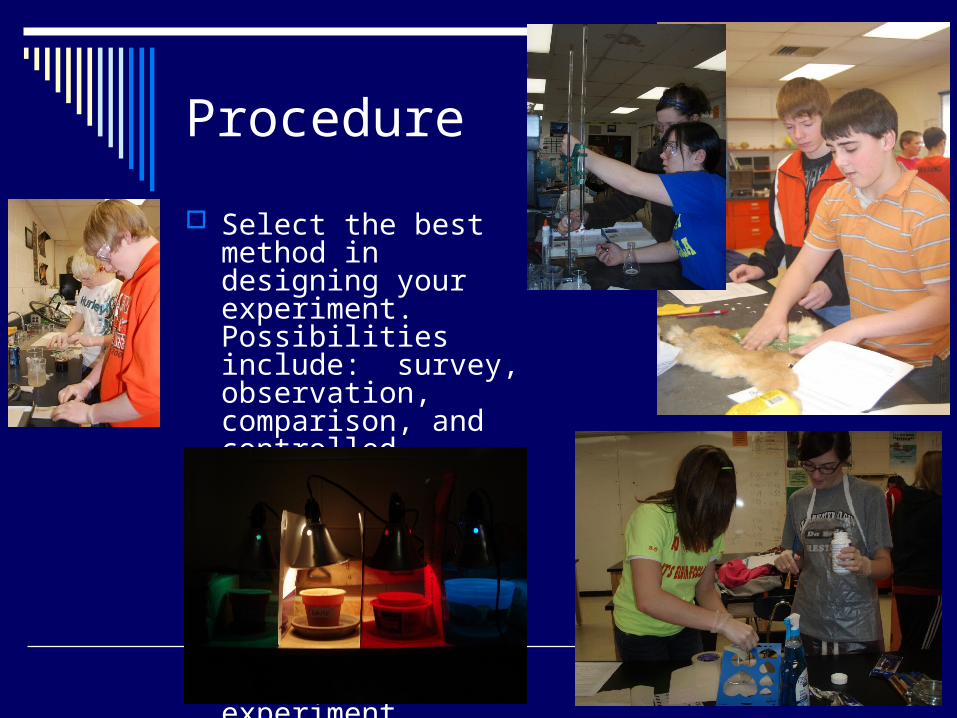
Procedure
Select the best method in designing your experiment. Possibilities include: survey, observation, comparison, and controlled.
Test only one variable Keep a detailed log of
all steps—someone should be able to copy your steps and perform the exact same experiment
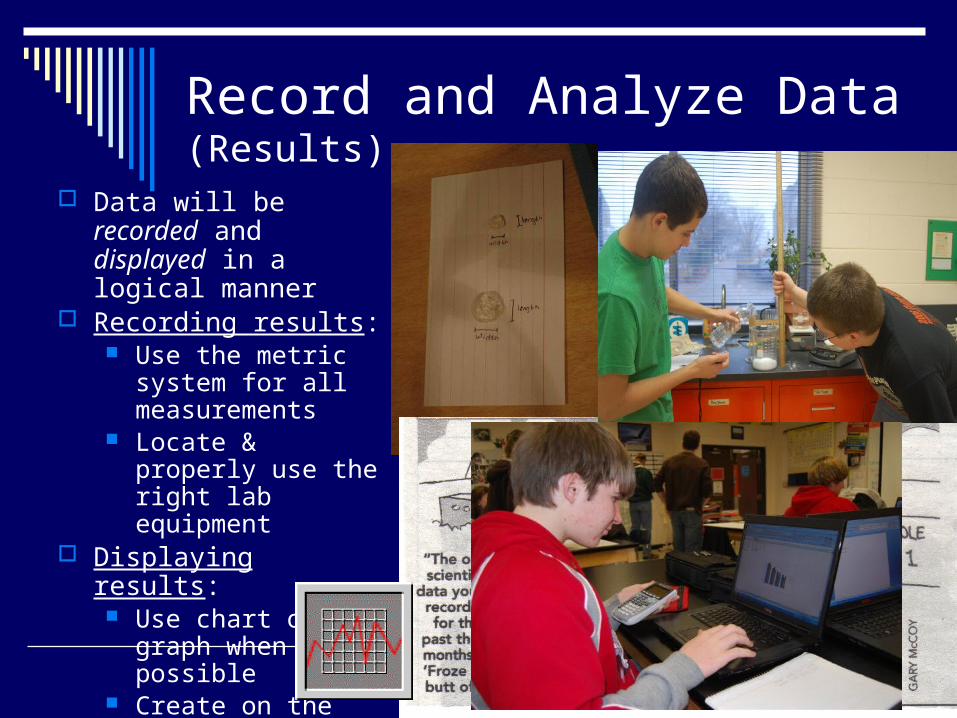
Record and Analyze Data (Results)
Data will be recorded and displayed in a logical manner
Recording results: Use the metric
system for all measurements
Locate & properly use the right lab equipment
Displaying results: Use chart or graph
when possible Create on the
computer

State a Conclusion At the end of your testing, review the results. What happened? Include the following:
Was your hypothesis correct? Why did these results happen? Are your results accurate? Why? What would you do differently next time? Why? What did you learn by conducting this experiment? What are the real-life applications of this experiment?
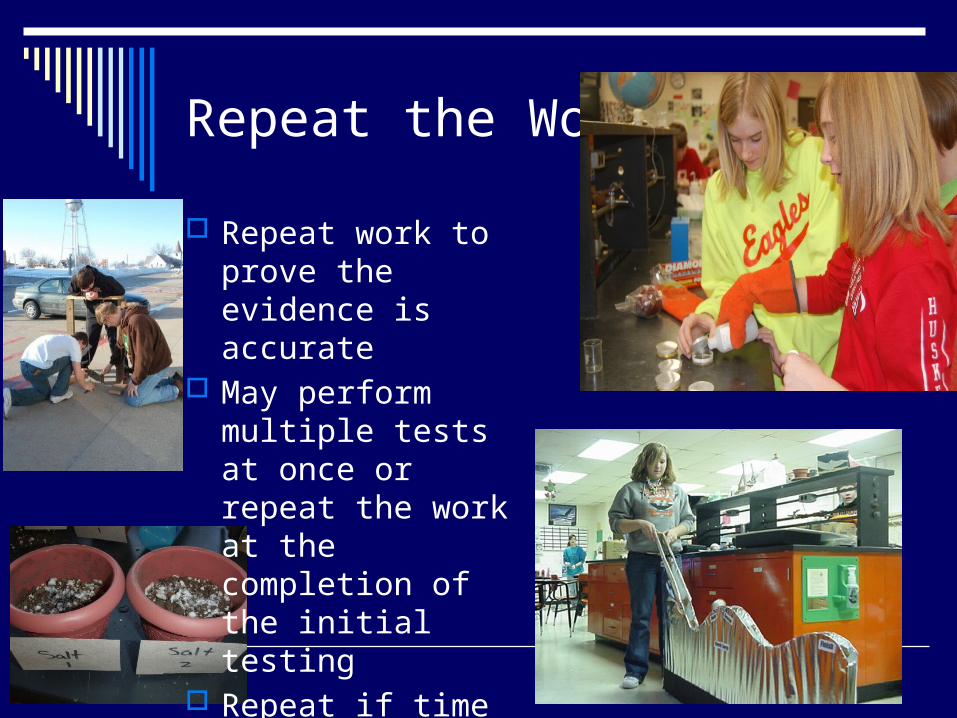
Repeat the Work
Repeat work to prove the evidence is accurate
May perform multiple tests at once or repeat the work at the completion of the initial testing
Repeat if time allows
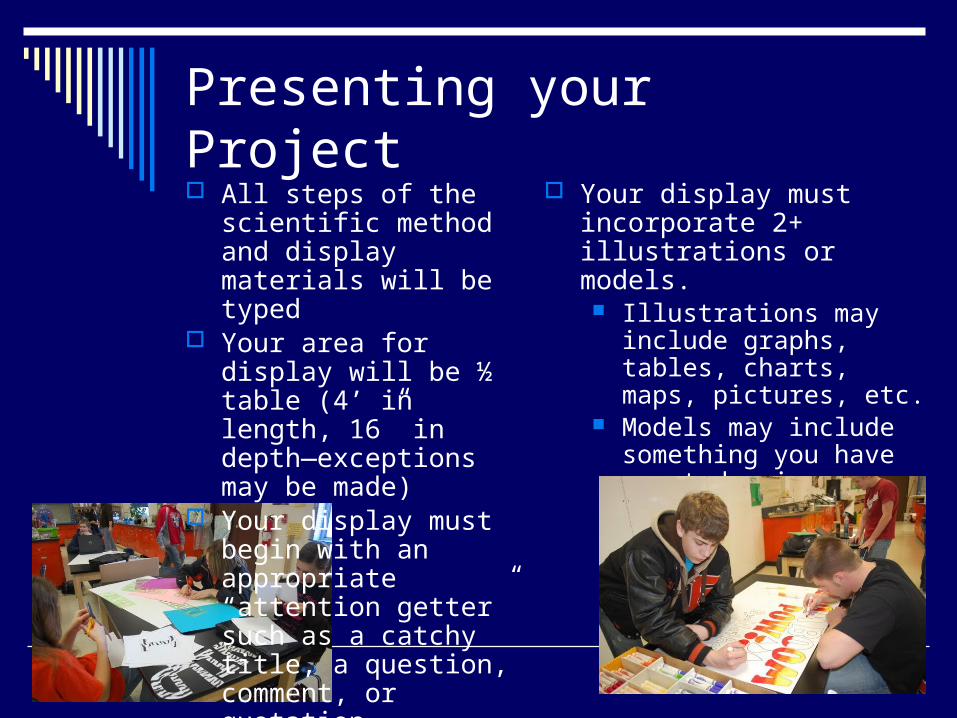
Presenting your Project All steps of the scientific
method and display materials will be typed
Your area for display will be ½ table (4’ in length, 16” in depth—exceptions may be made)
Your display must begin with an appropriate “attention getter” such as a catchy title, a question, comment, or quotation
Your display must incorporate 2+ illustrations or models. Illustrations may include
graphs, tables, charts, maps, pictures, etc.
Models may include something you have created using your new knowledge, or your testing materials themselves.
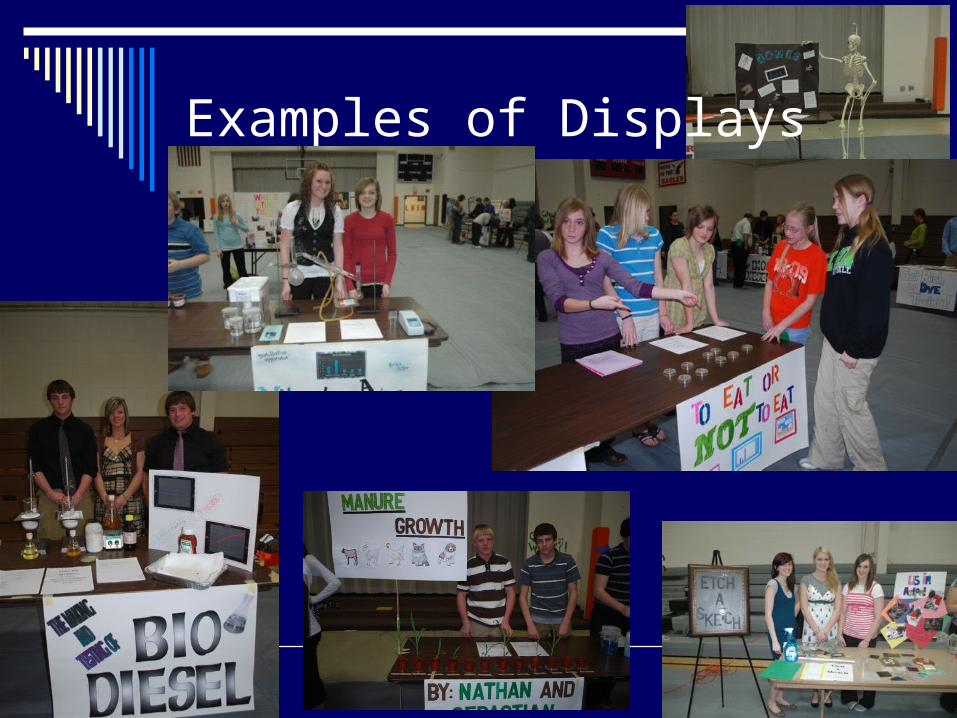
Examples of Displays

Examples of displays (Health Science Meet)
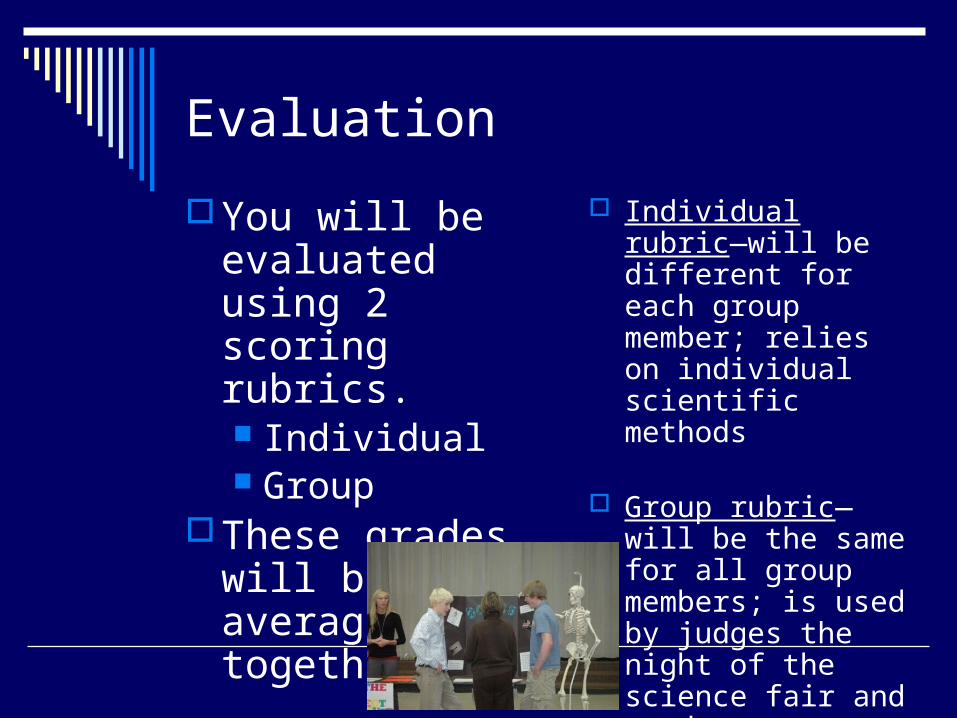
Evaluation
Individual rubric—will be different for each group member; relies on individual scientific methods
Group rubric—will be the same for all group members; is used by judges the night of the science fair and grades presentation
You will be evaluated using 2 scoring rubrics. Individual Group
These grades will be averaged together

Individual RubricTitle of project: Class: Name: PeeWee Herman A Zoom kid Bill Nye Einstein! Deadlines met 0 to 2 deadlines met 3 to 4 deadlines met 5 to 6 deadlines met 7 to 8 deadlines met
Application/de-monstration of the scientific method
Did not use the sequence of the sci. method.
Incorrectly uses the steps in the sci. method or is missing steps.
Correctly uses all steps in the sci. method out of sequence.
Correctly uses all steps in the sci. method in sequence.
Quality of work Steps have insufficient amounts of material or are inaccurate.
Steps have incomplete amounts of material or have major errors.
Steps are devoid of details or have minor errors.
All steps are complete and accurate.
Comments:
Individual grade: __________ = % 300

Group Rubric
Title of project: Class: Group members: Back to the
drawing board Try repeating your work
Team players Next Nobel team
Audience appeal
No ‘attention getter.’ Does not involve audience OR audience cannot relate to presentation.
‘Attention getter’ is present but not effective. Audience is involved but it is meaning-less OR audience has difficulty relating to presentation.
‘Attention getter’ is present. Audience has limited participation OR audience has a lack of interest in presentation.
Appropriate and effective ‘attention getter.’ Audience is involved OR audience has a vested interest in presentation.
Process used Information and process are completely inaccurate.
Information and process lack vital information.
Information and process has minor errors.
Information and process are accurate.
Knowledge Students cannot explain the process used. Students could not answer any questions.
Students attempted to explain the process used. Students attempted to answer questions.
Students explain the process used but have doubts about explana-tions. Students provide plausible answers to questions.
Students are able to explain the process used. Students correctly answer questions.
Appearance Visual displays are distracting or ineffective. Students are dressed inappropriately for a presentation.
Visual displays are neatly done, but do not add to presentation. Students dressed casually.
Visual displays add to presentation. Students dressed nicely.
Overall high effect of visual displays. Students dressed appropriately for a presentation.
Comments:
Group grade: __________ = % 400
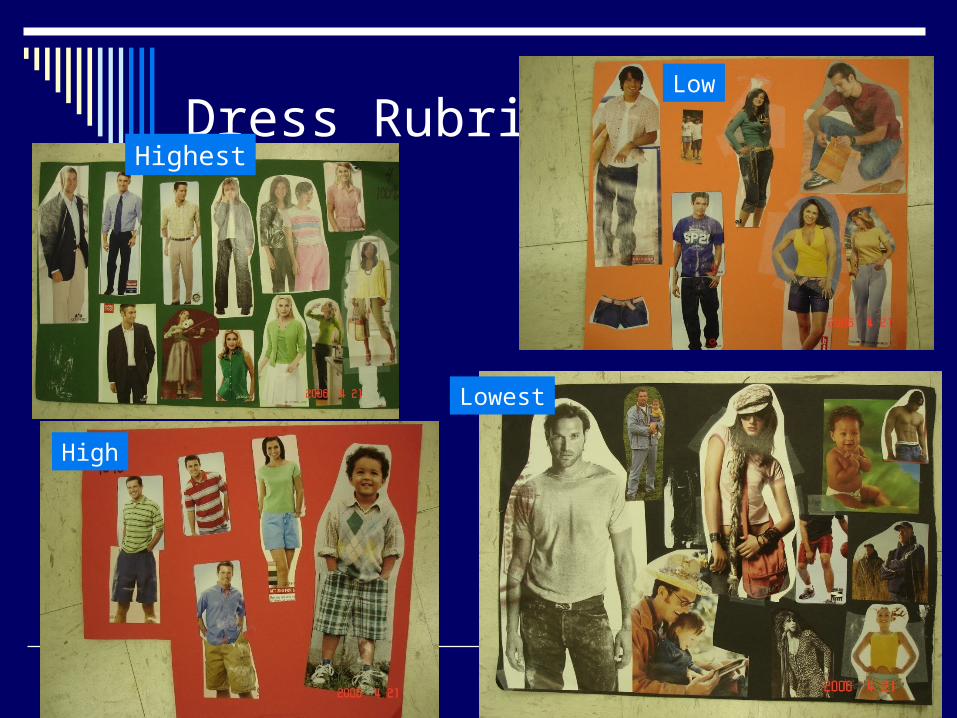
Dress RubricHighest
High
Low
Lowest
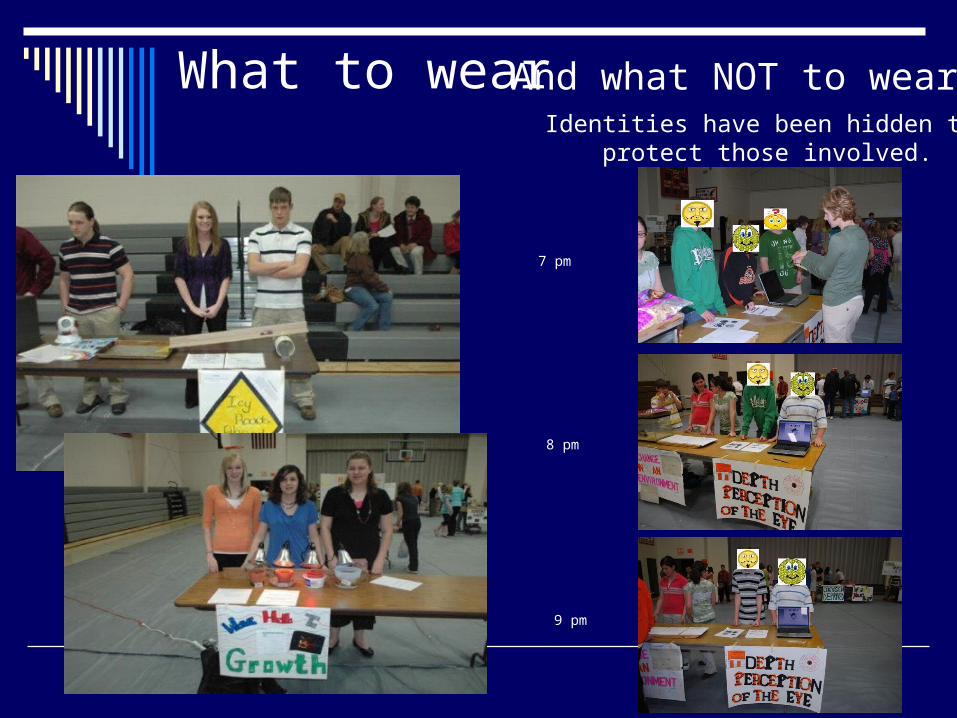
What to wearIdentities have been hidden to
protect those involved.
7 pm
8 pm
9 pm
And what NOT to wear

Science Fair Night

Science Fair Night
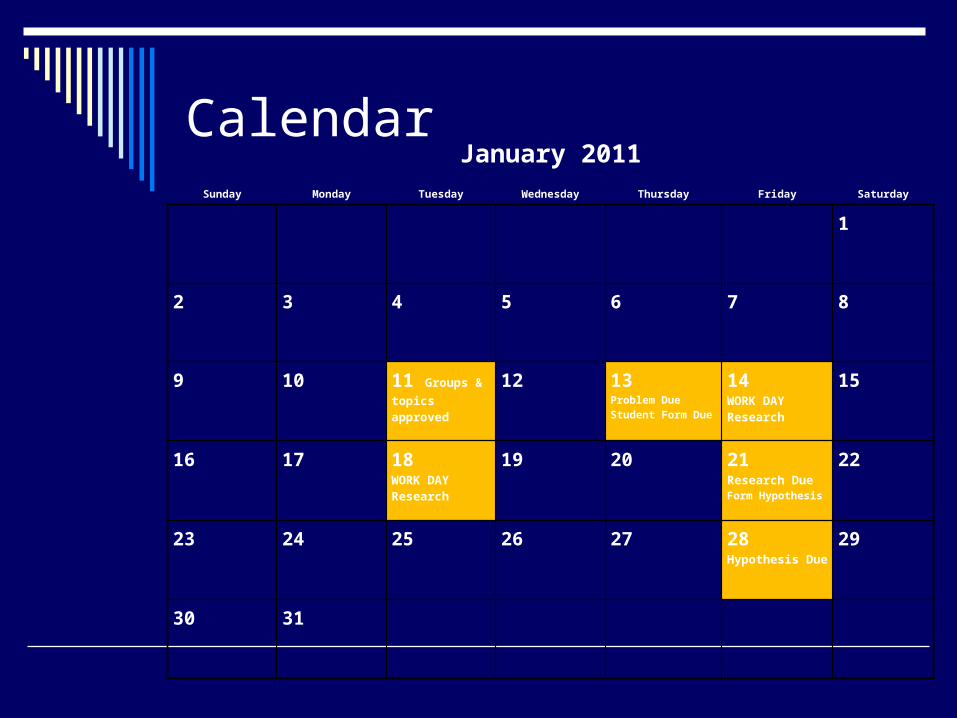
CalendarJanuary 2011
Sunday Monday Tuesday Wednesday Thursday Friday Saturday
1
2 3 4 5 6 7 8
9 10 11 Groups & topics approved
12 13 Problem Due Student Form Due
14WORK DAYResearch
15
16 17 18WORK DAYResearch
19 20 21Research DueForm Hypothesis
22
23 24 25 26 27 28Hypothesis Due
29
30 31

CalendarFebruary 2011
Sunday Monday Tuesday Wednesday Thursday Friday Saturday
1 2 3WORK DAYTesting
4 No School
5
6 71:00 OutSLC
8 9 10WORK DAYTesting
11 12
13 14 15 16WORK DAYTesting
17 18No School
19
20 21 22 23WORK DAYProcedure
24Procedure Due
25 26
27 28No School
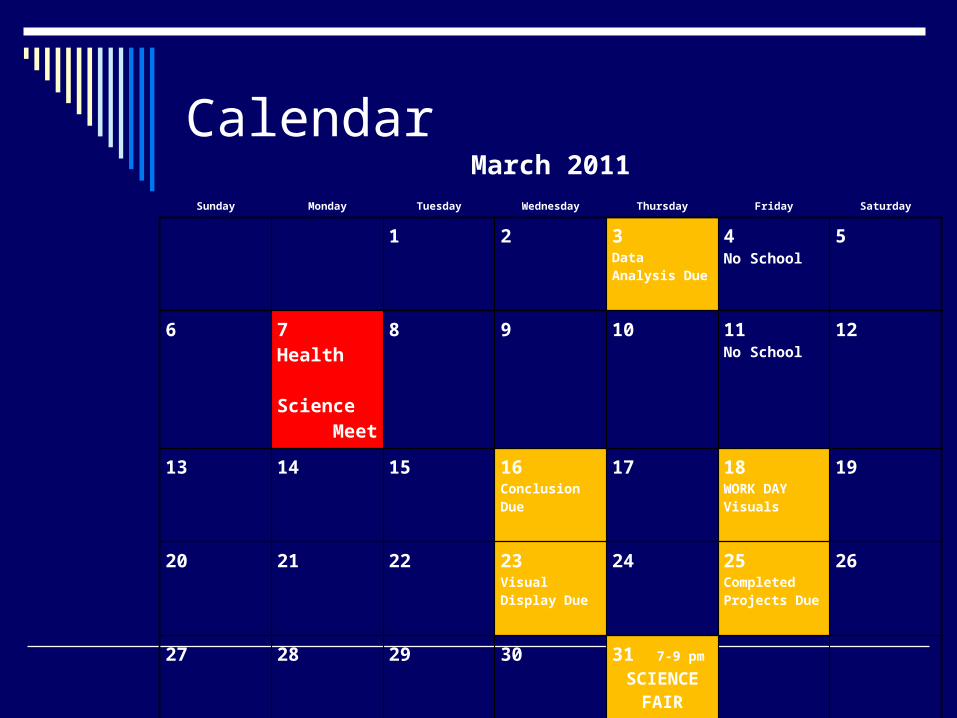
CalendarMarch 2011
Sunday Monday Tuesday Wednesday Thursday Friday Saturday
1 2 3Data Analysis Due
4No School
5
6 7 Health Science Meet
8 9 10 11No School
12
13 14 15 16Conclusion Due
17 18WORK DAYVisuals
19
20 21 22 23Visual Display Due
24 25Completed Projects Due
26
27 28 29 30 31 7-9 pm
SCIENCE FAIR
Related Documents