M. MAY, M. J. TURNER, T. MORRIS: SIFT PARAMETER ANALYSIS 1 Scale Invariant Feature Transform: A Graphical Parameter Analysis Michael May 1 [email protected] Martin J. Turner 2 [email protected] Tim Morris 1 [email protected] 1 The School of Computer Science The University of Manchester Manchester, UK 2 Research Computing Services The University of Manchester Manchester, UK Abstract In this paper we introduce a general purpose graphical processing unit (GPGPU) based method for performing a sweep across a set of the scale invariant feature trans- form (SIFT) parameters for pairs of images. The focus of the paper is the analysis of the data generated using information visualisation techniques including a cross brushing technique between parallel coordinates, scatter plots and histograms. Results have shown us the importance of carefully selecting some parameters depending upon the properties of an image pair while other parameters are shown to be robust to variation. The param- eters chosen by analysis of the sweep data have then been compared to the previously published SIFT’s values and a consistent improvement in accuracy is shown. 1 Introduction The scale invariant feature transform (SIFT) is a feature detection algorithm used for finding correspondence between parts of images thereby allowing image matching. The algorithm generates high dimensional features from patches selected based on pixel values which can then be compared and matched to other features. The algorithm has a set of parameters which can be varied to alter how it behaves and the choice and modification of current favoured values can be used to improve the quality of the results. In the original paper by David Lowe [11] a set of default parameters is given with a variety of images but whether or not these are optimal is not clear. This paper shows the results of sweeps across this parameter space for various images in an effort to find the best parameter selection for differing scenarios. A semi-exhaustive search has been completed by utilising the speed-up provided by a cluster of general pur- pose graphical processing units (GPGPUs) over CPUs. The large amount of data produced has then been analysed using parallel coordinate graphs [8], scatter plots and histograms to uncover patterns to indicate how individual parameters effect the algorithm’s accuracy. c 2010. The copyright of this document resides with its authors. It may be distributed unchanged freely in print or electronic forms.

Welcome message from author
This document is posted to help you gain knowledge. Please leave a comment to let me know what you think about it! Share it to your friends and learn new things together.
Transcript
M. MAY, M. J. TURNER, T. MORRIS: SIFT PARAMETER ANALYSIS 1
Scale Invariant Feature Transform:A Graphical Parameter Analysis
Michael May1
Martin J. Turner2
Tim Morris1
1 The School of Computer ScienceThe University of ManchesterManchester, UK
2 Research Computing ServicesThe University of ManchesterManchester, UK
Abstract
In this paper we introduce a general purpose graphical processing unit (GPGPU)based method for performing a sweep across a set of the scale invariant feature trans-form (SIFT) parameters for pairs of images. The focus of the paper is the analysis ofthe data generated using information visualisation techniques including a cross brushingtechnique between parallel coordinates, scatter plots and histograms. Results have shownus the importance of carefully selecting some parameters depending upon the propertiesof an image pair while other parameters are shown to be robust to variation. The param-eters chosen by analysis of the sweep data have then been compared to the previouslypublished SIFT’s values and a consistent improvement in accuracy is shown.
1 Introduction
The scale invariant feature transform (SIFT) is a feature detection algorithm used for findingcorrespondence between parts of images thereby allowing image matching. The algorithmgenerates high dimensional features from patches selected based on pixel values which canthen be compared and matched to other features. The algorithm has a set of parameters whichcan be varied to alter how it behaves and the choice and modification of current favouredvalues can be used to improve the quality of the results. In the original paper by David Lowe[11] a set of default parameters is given with a variety of images but whether or not these areoptimal is not clear.
This paper shows the results of sweeps across this parameter space for various imagesin an effort to find the best parameter selection for differing scenarios. A semi-exhaustivesearch has been completed by utilising the speed-up provided by a cluster of general pur-pose graphical processing units (GPGPUs) over CPUs. The large amount of data producedhas then been analysed using parallel coordinate graphs [8], scatter plots and histograms touncover patterns to indicate how individual parameters effect the algorithm’s accuracy.
c© 2010. The copyright of this document resides with its authors.It may be distributed unchanged freely in print or electronic forms.
Citation
Citation
{Lowe} 2004
Citation
Citation
{Inselberg} 2009
2 M. MAY, M. J. TURNER, T. MORRIS: SIFT PARAMETER ANALYSIS
2 Scale Invariant Feature TransformThe original SIFT feature detection algorithm developed and pioneered by David Lowe [11]is a four stage process that creates unique and highly descriptive features from an image.These features are designed to be invariant to rotation and are robust to changes in scale,illumination, noise and small changes in viewpoint.
The features can be used to indicate if there is any correspondence between areas withinimages. Clusters of features from an image that are similar to a cluster of features fromanother image may indicate, with a high likelihood, areas that match. This allows objectrecognition to be implemented by comparing features generated from input images to fea-tures generated from images of target objects. The four stages of the SIFT algorithm are asfollows, full details of which are given in Lowe’s paper [11]:
1. Scale-space extrema detection. The first step is to create the Gaussian scale-spacepyramid. Successive blurred images are produced from the convolution of Gaussianfunctions to create multiple octaves. The difference of Gaussian (DoG) is calculatedas the difference between two consecutive images within an octave. The initial set ofcandidate features are selected by comparing each point in the DoG images to its 26neighbours and looking for extrema.
2. Feature localisation. The number of features is reduced in this stage by reducing thenumber of features. Interpolation occurs to locate the exact, sub-pixel, location of thecandidate features before eliminating the points that are in areas of low contrast andthose that are localised along edges.
3. Orientation assignment. One or more orientations for each feature is calculated, aprocess which results in the rotational invariance of the descriptor. The image gradientdirections of the pixels in a feature’s neighbourhood are calculated and added to anorientation histogram with 36 bins. The values in the neighbourhood are Gaussianweighted so those nearer the centre have a greater effect on the resulting orientation.
4. Creating the feature descriptor. The feature descriptor is a 128 dimensional vectorwhich describes the pixel properties of the area surrounding a feature. A 4× 4 array of16 histograms is centred on the feature and rotated to match the orientation calculatedin the previous step. The gradient magnitudes are given a Gaussian weighting, addedto the histograms and normalised to create the descriptor.
To match features often the Euclidean distance between two feature vectors is used tofind the nearest neighbour.
3 SIFT ParametersThe choice of parameter values of SIFT effect the response of the algorithm but exactly howchanges in their values vary the result and accuracy of feature matching has not previouslybeen studied in sufficient detail. Table 1 shows a list of the main intrinsic parameters whichcontrol the response of the algorithm and Lowe’s default parameters [11]. A subset of thesehave been selected as the focus of the parameter sweep. The parameter sweep is the incre-mental adjustment of the parameter values with the output of the algorithm recorded for eachchange.
Citation
Citation
{Lowe} 2004
Citation
Citation
{Lowe} 2004
Citation
Citation
{Lowe} 2004
M. MAY, M. J. TURNER, T. MORRIS: SIFT PARAMETER ANALYSIS 3
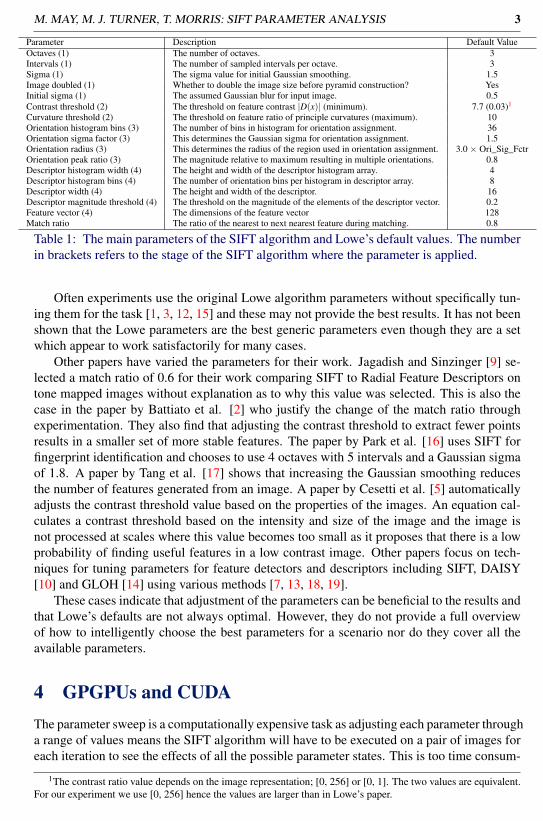
Parameter Description Default ValueOctaves (1) The number of octaves. 3Intervals (1) The number of sampled intervals per octave. 3Sigma (1) The sigma value for initial Gaussian smoothing. 1.5Image doubled (1) Whether to double the image size before pyramid construction? YesInitial sigma (1) The assumed Gaussian blur for input image. 0.5Contrast threshold (2) The threshold on feature contrast |D(x)| (minimum). 7.7 (0.03)1
Curvature threshold (2) The threshold on feature ratio of principle curvatures (maximum). 10Orientation histogram bins (3) The number of bins in histogram for orientation assignment. 36Orientation sigma factor (3) This determines the Gaussian sigma for orientation assignment. 1.5Orientation radius (3) This determines the radius of the region used in orientation assignment. 3.0 × Ori_Sig_FctrOrientation peak ratio (3) The magnitude relative to maximum resulting in multiple orientations. 0.8Descriptor histogram width (4) The height and width of the descriptor histogram array. 4Descriptor histogram bins (4) The number of orientation bins per histogram in descriptor array. 8Descriptor width (4) The height and width of the descriptor. 16Descriptor magnitude threshold (4) The threshold on the magnitude of the elements of the descriptor vector. 0.2Feature vector (4) The dimensions of the feature vector 128Match ratio The ratio of the nearest to next nearest feature during matching. 0.8
Table 1: The main parameters of the SIFT algorithm and Lowe’s default values. The numberin brackets refers to the stage of the SIFT algorithm where the parameter is applied.
Often experiments use the original Lowe algorithm parameters without specifically tun-ing them for the task [1, 3, 12, 15] and these may not provide the best results. It has not beenshown that the Lowe parameters are the best generic parameters even though they are a setwhich appear to work satisfactorily for many cases.
Other papers have varied the parameters for their work. Jagadish and Sinzinger [9] se-lected a match ratio of 0.6 for their work comparing SIFT to Radial Feature Descriptors ontone mapped images without explanation as to why this value was selected. This is also thecase in the paper by Battiato et al. [2] who justify the change of the match ratio throughexperimentation. They also find that adjusting the contrast threshold to extract fewer pointsresults in a smaller set of more stable features. The paper by Park et al. [16] uses SIFT forfingerprint identification and chooses to use 4 octaves with 5 intervals and a Gaussian sigmaof 1.8. A paper by Tang et al. [17] shows that increasing the Gaussian smoothing reducesthe number of features generated from an image. A paper by Cesetti et al. [5] automaticallyadjusts the contrast threshold value based on the properties of the images. An equation cal-culates a contrast threshold based on the intensity and size of the image and the image isnot processed at scales where this value becomes too small as it proposes that there is a lowprobability of finding useful features in a low contrast image. Other papers focus on tech-niques for tuning parameters for feature detectors and descriptors including SIFT, DAISY[10] and GLOH [14] using various methods [7, 13, 18, 19].
These cases indicate that adjustment of the parameters can be beneficial to the results andthat Lowe’s defaults are not always optimal. However, they do not provide a full overviewof how to intelligently choose the best parameters for a scenario nor do they cover all theavailable parameters.
4 GPGPUs and CUDAThe parameter sweep is a computationally expensive task as adjusting each parameter througha range of values means the SIFT algorithm will have to be executed on a pair of images foreach iteration to see the effects of all the possible parameter states. This is too time consum-
1The contrast ratio value depends on the image representation; [0, 256] or [0, 1]. The two values are equivalent.For our experiment we use [0, 256] hence the values are larger than in Lowe’s paper.
Citation
Citation
{Abdel-Hakim and Farag} 2006
Citation
Citation
{Bicego, Lagorio, Grosso, and Tistarelli} 2006
Citation
Citation
{Luo, Ma, Takikawa, Lao, Kawade, and Lu} 2007
Citation
Citation
{Mikolajczyk, Tuytelaars, Schmid, Zisserman, Matas, Schaffalitzky, Kadir, and Gool} 2005
Citation
Citation
{Jagadish and Sinzinger} 2008
Citation
Citation
{Battiato, Gallo, Puglisi, and Scellato} 2007
Citation
Citation
{Park, Pankanti, and Jain} 2008
Citation
Citation
{Tang, Wu, Hor, and Wang} 2008
Citation
Citation
{Cesetti, Frontoni, Mancini, Zingaretti, and Longhi} 2009
Citation
Citation
{Lepetit} 2008
Citation
Citation
{Mikolajczyk and Schmid} 2005
Citation
Citation
{Hua, Brown, and Winder} 2007
Citation
Citation
{Mikolajczyk and Matas} 2007
Citation
Citation
{Winder and Brown} 2007
Citation
Citation
{Winder and Brown} 2009
4 M. MAY, M. J. TURNER, T. MORRIS: SIFT PARAMETER ANALYSIS
ing to be carried out on a CPU in a reasonable time, so general purpose graphics processingunits (GPGPUs) have been used to implement SIFT. The inherent parallelism of many partsof the SIFT algorithm means it lends itself to being implemented on GPGPUs resulting insignificant speed-ups. Tests on a GPU have shown a speed increase for SIFT of up to twentytimes over a CPU2.
The reason why the GPU is so powerful and can be utilised for this project stems fromthe large amounts of money being invested in improving their performance for the gamesindustry. They are mass produced and relatively cheap and have the ability to perform highlyparallel floating point calculations. NVIDIA’s CUDA is a general purpose parallel computingarchitecture that provides the tools required for the coding of parallel code for a GPU andfacilitates its execution in a fraction of the time it would take to execute on a CPU. The codeallows homogeneous execution on both the CPU and GPU so all the resources of the systemcan be taken advantage of and code which is suited to serial execution can still be executedon the CPU. The architecture also allows the use of multiple GPUs in parallel.
SIFT has been shown to be successfully parallelised on the GPU in several cases. Theseinclude the use of CUDA in the cases of CudaSIFT [4] and SiftGPU [20], and the use ofOpenGL textures to store and process the images [6].
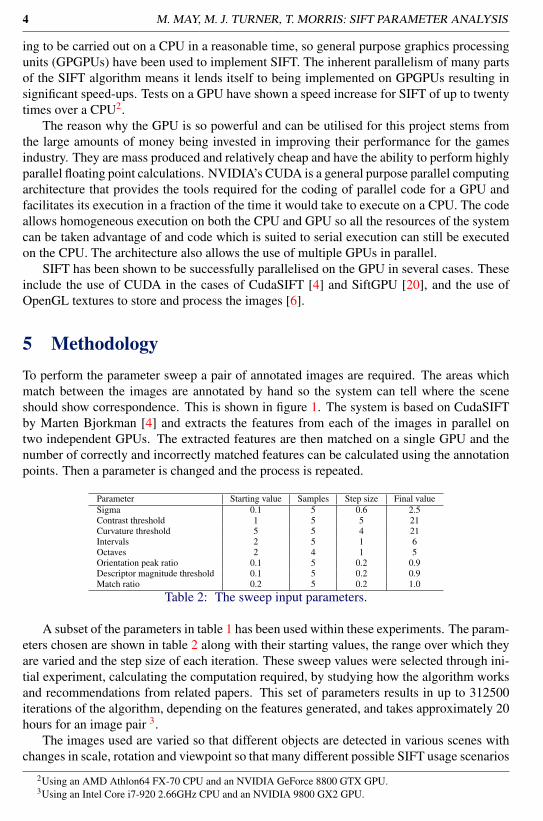
5 MethodologyTo perform the parameter sweep a pair of annotated images are required. The areas whichmatch between the images are annotated by hand so the system can tell where the sceneshould show correspondence. This is shown in figure 1. The system is based on CudaSIFTby Marten Bjorkman [4] and extracts the features from each of the images in parallel ontwo independent GPUs. The extracted features are then matched on a single GPU and thenumber of correctly and incorrectly matched features can be calculated using the annotationpoints. Then a parameter is changed and the process is repeated.
Parameter Starting value Samples Step size Final valueSigma 0.1 5 0.6 2.5Contrast threshold 1 5 5 21Curvature threshold 5 5 4 21Intervals 2 5 1 6Octaves 2 4 1 5Orientation peak ratio 0.1 5 0.2 0.9Descriptor magnitude threshold 0.1 5 0.2 0.9Match ratio 0.2 5 0.2 1.0
Table 2: The sweep input parameters.
A subset of the parameters in table 1 has been used within these experiments. The param-eters chosen are shown in table 2 along with their starting values, the range over which theyare varied and the step size of each iteration. These sweep values were selected through ini-tial experiment, calculating the computation required, by studying how the algorithm worksand recommendations from related papers. This set of parameters results in up to 312500iterations of the algorithm, depending on the features generated, and takes approximately 20hours for an image pair 3.
The images used are varied so that different objects are detected in various scenes withchanges in scale, rotation and viewpoint so that many different possible SIFT usage scenarios
2Using an AMD Athlon64 FX-70 CPU and an NVIDIA GeForce 8800 GTX GPU.3Using an Intel Core i7-920 2.66GHz CPU and an NVIDIA 9800 GX2 GPU.
Citation
Citation
{Bjorkman} 2008
Citation
Citation
{Wu} 2007
Citation
Citation
{Heymann, Maller, Smolic, Froehlich, and Wiegand} 2007
Citation
Citation
{Bjorkman} 2008
M. MAY, M. J. TURNER, T. MORRIS: SIFT PARAMETER ANALYSIS 5
Parameter DescriptionPoints 1 The number of points extracted from the first imagePoints 2 The number of points extracted from the second imageTotal matches The total number of matches between the imagesCorrect matches The number of correct matches between the annotated regionsAnnotated matches The total number of matches from the annotated regions in the first image to the second imageAccuracy The percentage of correct matches in the annotated matches
Table 3: The sweep output parameters.
are covered. This will help indicate which parameters effect the algorithm differently underdifferent circumstances, provide more information about the optimal parameters and helpindicate any trends and correlation across the parameters. The data produced for informationvisualisation analysis has 14 dimensions; one for each of the input and output parameters.There are six output parameters that are generated during the parameter sweep and these aredescribed in table 3.
Figure 1: An example of an image pair with annotation boxes showing corresponding re-gions.
6 Process Employing Information VisualizationTechniques to Gain Insight
This section outlines how the interactive analysis process for analysing results of the param-eter sweeps4. Parallel coordinate graphs [8], scatter plot arrays and histograms have beenused to visualise and analyse the data. Parallel coordinates is a common way of visualisingmultivariate data such as that produced by the parameter sweep. Each parameter has its ownparallel axis and a polygonal line with vertices on the parallel axes represent a point in n-dimensional space. This visualisation method allows correlation between parameters to beviewed with the careful use of brushing.
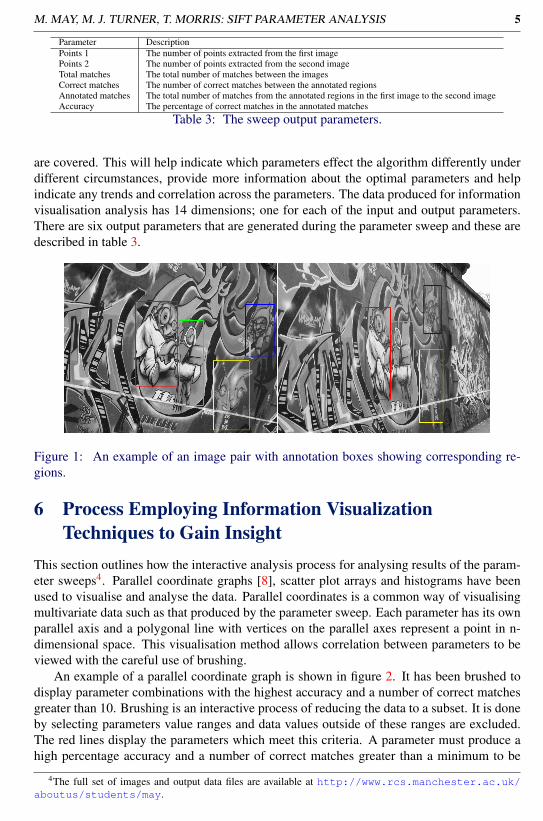
An example of a parallel coordinate graph is shown in figure 2. It has been brushed todisplay parameter combinations with the highest accuracy and a number of correct matchesgreater than 10. Brushing is an interactive process of reducing the data to a subset. It is doneby selecting parameters value ranges and data values outside of these ranges are excluded.The red lines display the parameters which meet this criteria. A parameter must produce ahigh percentage accuracy and a number of correct matches greater than a minimum to be
4The full set of images and output data files are available at http://www.rcs.manchester.ac.uk/aboutus/students/may.
Citation
Citation
{Inselberg} 2009
6 M. MAY, M. J. TURNER, T. MORRIS: SIFT PARAMETER ANALYSIS
Figure 2: Parallel coordinates of a 14 dimensional dataset with 262500 elements. The datais brushed to exclude elements with a very low number of correct matches and low accuracy.
deemed a good selection. The reason that a minimum number of correct matches is requiredis that a single correct match could give an accuracy of 100 percent but would be uselessfor confirming matches between images as a cluster of points are required and a single datapoint could be erroneous. Setting this minimum at 10 eliminates parameter combinationswhich give a high accuracy without enough data to be confident of an image match.
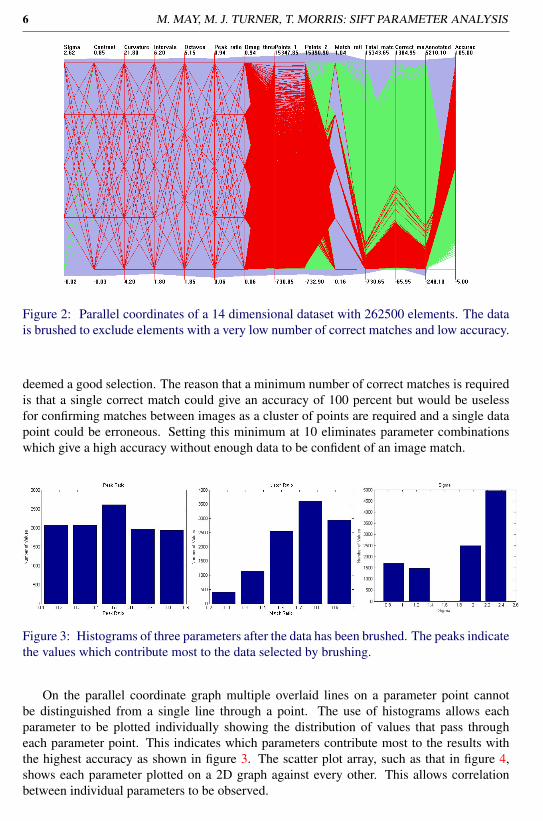
Figure 3: Histograms of three parameters after the data has been brushed. The peaks indicatethe values which contribute most to the data selected by brushing.
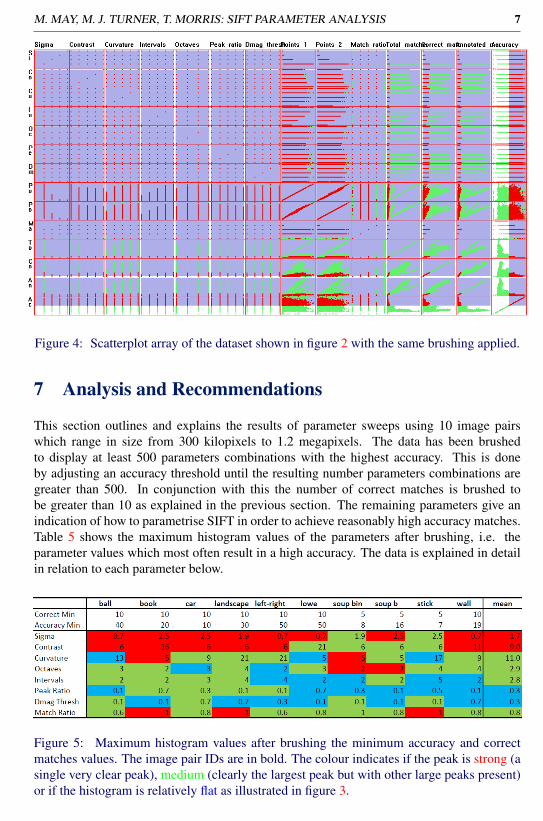
On the parallel coordinate graph multiple overlaid lines on a parameter point cannotbe distinguished from a single line through a point. The use of histograms allows eachparameter to be plotted individually showing the distribution of values that pass througheach parameter point. This indicates which parameters contribute most to the results withthe highest accuracy as shown in figure 3. The scatter plot array, such as that in figure 4,shows each parameter plotted on a 2D graph against every other. This allows correlationbetween individual parameters to be observed.
M. MAY, M. J. TURNER, T. MORRIS: SIFT PARAMETER ANALYSIS 7
Figure 4: Scatterplot array of the dataset shown in figure 2 with the same brushing applied.
7 Analysis and Recommendations
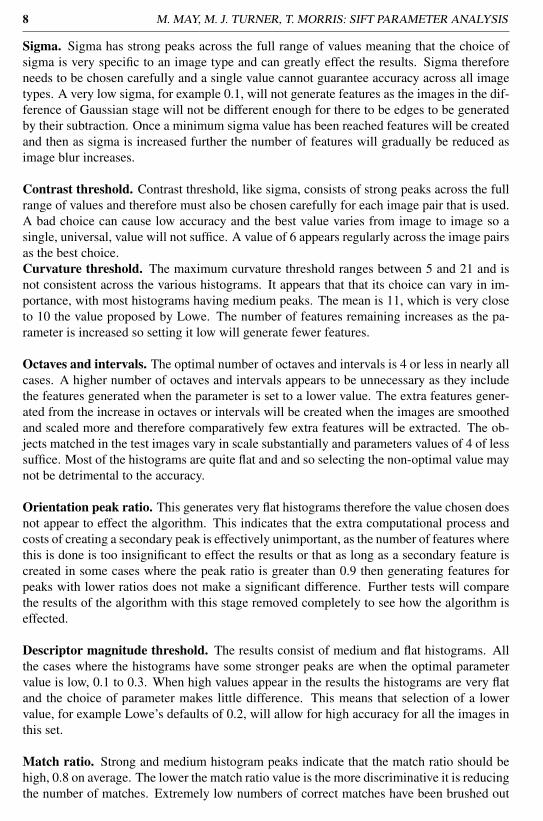
This section outlines and explains the results of parameter sweeps using 10 image pairswhich range in size from 300 kilopixels to 1.2 megapixels. The data has been brushedto display at least 500 parameters combinations with the highest accuracy. This is doneby adjusting an accuracy threshold until the resulting number parameters combinations aregreater than 500. In conjunction with this the number of correct matches is brushed tobe greater than 10 as explained in the previous section. The remaining parameters give anindication of how to parametrise SIFT in order to achieve reasonably high accuracy matches.Table 5 shows the maximum histogram values of the parameters after brushing, i.e. theparameter values which most often result in a high accuracy. The data is explained in detailin relation to each parameter below.
Figure 5: Maximum histogram values after brushing the minimum accuracy and correctmatches values. The image pair IDs are in bold. The colour indicates if the peak is strong (asingle very clear peak), medium (clearly the largest peak but with other large peaks present)or if the histogram is relatively flat as illustrated in figure 3.
8 M. MAY, M. J. TURNER, T. MORRIS: SIFT PARAMETER ANALYSIS
Sigma. Sigma has strong peaks across the full range of values meaning that the choice ofsigma is very specific to an image type and can greatly effect the results. Sigma thereforeneeds to be chosen carefully and a single value cannot guarantee accuracy across all imagetypes. A very low sigma, for example 0.1, will not generate features as the images in the dif-ference of Gaussian stage will not be different enough for there to be edges to be generatedby their subtraction. Once a minimum sigma value has been reached features will be createdand then as sigma is increased further the number of features will gradually be reduced asimage blur increases.
Contrast threshold. Contrast threshold, like sigma, consists of strong peaks across the fullrange of values and therefore must also be chosen carefully for each image pair that is used.A bad choice can cause low accuracy and the best value varies from image to image so asingle, universal, value will not suffice. A value of 6 appears regularly across the image pairsas the best choice.Curvature threshold. The maximum curvature threshold ranges between 5 and 21 and isnot consistent across the various histograms. It appears that that its choice can vary in im-portance, with most histograms having medium peaks. The mean is 11, which is very closeto 10 the value proposed by Lowe. The number of features remaining increases as the pa-rameter is increased so setting it low will generate fewer features.
Octaves and intervals. The optimal number of octaves and intervals is 4 or less in nearly allcases. A higher number of octaves and intervals appears to be unnecessary as they includethe features generated when the parameter is set to a lower value. The extra features gener-ated from the increase in octaves or intervals will be created when the images are smoothedand scaled more and therefore comparatively few extra features will be extracted. The ob-jects matched in the test images vary in scale substantially and parameters values of 4 of lesssuffice. Most of the histograms are quite flat and and so selecting the non-optimal value maynot be detrimental to the accuracy.
Orientation peak ratio. This generates very flat histograms therefore the value chosen doesnot appear to effect the algorithm. This indicates that the extra computational process andcosts of creating a secondary peak is effectively unimportant, as the number of features wherethis is done is too insignificant to effect the results or that as long as a secondary feature iscreated in some cases where the peak ratio is greater than 0.9 then generating features forpeaks with lower ratios does not make a significant difference. Further tests will comparethe results of the algorithm with this stage removed completely to see how the algorithm iseffected.
Descriptor magnitude threshold. The results consist of medium and flat histograms. Allthe cases where the histograms have some stronger peaks are when the optimal parametervalue is low, 0.1 to 0.3. When high values appear in the results the histograms are very flatand the choice of parameter makes little difference. This means that selection of a lowervalue, for example Lowe’s defaults of 0.2, will allow for high accuracy for all the images inthis set.
Match ratio. Strong and medium histogram peaks indicate that the match ratio should behigh, 0.8 on average. The lower the match ratio value is the more discriminative it is reducingthe number of matches. Extremely low numbers of correct matches have been brushed out
M. MAY, M. J. TURNER, T. MORRIS: SIFT PARAMETER ANALYSIS 9
of the data as they do not provide sufficient information to reliably indicate correspondencebetween images. This explains why the match ratio value tends to be high and why it isbetter to select a larger value.
When the parameter selection results in a high number of features being extracted thisis generally detrimental to accuracy. High numbers of features are more likely to result inmismatches as there are more opportunities for the features to match incorrectly. Even if itdoes not effect the accuracy it is beneficial to avoid unnecessary feature extraction as thisresults in more computation. A balance must be found between generating enough featuresto match the target area within the image and too many such that mismatches become morelikely to occur and become overwhelming computationally. The use of parallel coordinates,scatterplots and histograms which are brushed to remove low accuracy points then show thatmany of the parameters combinations which result in a high number of extracted points areautomatically discarded.
A point to note is in relation to the images labeled soup-bin, soup-b and wall and thedata relating to these. For these the minimum correct matches was reduced to a lower value,5, as the accuracy when this was set to 10 was too low and there was not enough data left afterbrushing to draw a conclusion as to the best parameters. This is due to the objects matchedin the images being smaller than in the others and as such a lower number of correct matcheswere obtained from the images. 5 is still a sufficient number to identify the object correctly.Also it is interesting that soup-bin and soup-b, which both use the same image for matchingto different scenes have very similar parameter sweep results.
It should also be noted that while these sweeps took up to 24 hours to complete the timecan be reduced. By removing two parameters from the sweep and setting their values toLowe’s defaults the execution time can be reduced to half an hour. The two parameters thatcan be safely discounted are the orientation peak ratio and descriptor magnitude threshold asvarying their values doesn’t appear to effect the accuracy greatly. This can be seen in table 5which shows that the histograms produced for these parameters are generally quite flat withfew significant peaks.
7.1 Parameter Testing
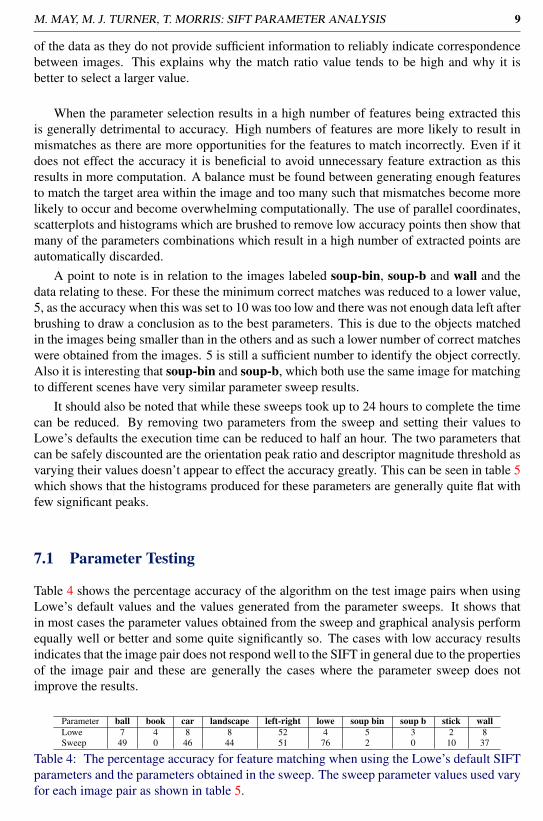
Table 4 shows the percentage accuracy of the algorithm on the test image pairs when usingLowe’s default values and the values generated from the parameter sweeps. It shows thatin most cases the parameter values obtained from the sweep and graphical analysis performequally well or better and some quite significantly so. The cases with low accuracy resultsindicates that the image pair does not respond well to the SIFT in general due to the propertiesof the image pair and these are generally the cases where the parameter sweep does notimprove the results.
Parameter ball book car landscape left-right lowe soup bin soup b stick wallLowe 7 4 8 8 52 4 5 3 2 8Sweep 49 0 46 44 51 76 2 0 10 37
Table 4: The percentage accuracy for feature matching when using the Lowe’s default SIFTparameters and the parameters obtained in the sweep. The sweep parameter values used varyfor each image pair as shown in table 5.
10 M. MAY, M. J. TURNER, T. MORRIS: SIFT PARAMETER ANALYSIS
8 ConclusionsThis interactive technique, it is proposed, should be used to fine tune SIFT in situationswhere the images are of a known type rather than the results in this paper being a solutionto choosing the best parameters for all occasions. The data in table 4 supports this andhighlights the success of the technique. The results show that some parameters such as sigmaand the contrast threshold have strong peaks over the range of values meaning that a singleselection will never suit all situations. It is therefore important to choose such parameterswell to ensure high accuracy. Many of the other parameters are quite flexible and robustwhich means that non-optimum selection may not be detrimental.
Further work will look into how to use this technique to create an intelligent means ofparametrising SIFT based on the properties of an image pair. The aim of this is to allow aSIFT user to reliably set parameters based on the image properties such as the size of theobject, viewpoint or the object type without having to apply this parameter sweep techniquethemselves. Other areas of interest include the effect of other parameters such as the numberof bins in the descriptor, test other ranges and step values and other images types such ashigh dynamic range (HDR) and infrared.
Overall, the parameters of SIFT cannot make an improvement by adjustment if the datais not within the image in the first place thus there is an inherent best match accuracy basedon the image data. However, selecting the wrong parameters can reduce the accuracy ofSIFT as shown in 4. Tuning has been shown to make improvements which may be beneficialto an application with constrained bounds and where the task will be repeated many times tojustify the computationally expensive sweep process. It is also proposed that it is beneficialto use this technique with new untested image types and scenes to generate initial parameterestimates.
References[1] A E Abdel-Hakim and A A Farag. CSIFT: A SIFT Descriptor with Color Invariant
Characteristics. In Proceedings of the 2006 IEEE Computer Society Conference onComputer Vision and Pattern Recognition, volume Volume 2, pages 1978–1983, 2006.ISBN ISSN:1063-6919.
[2] S Battiato, G Gallo, G Puglisi, and S Scellato. SIFT Features Tracking for VideoStabilization. 14th International Conference on Image Analysis and Processing, pages825–830, September 2007.
[3] M Bicego, A Lagorio, E Grosso, and M Tistarelli. On the Use of SIFT Features forFace Authentication, volume 00. IEEE, 2006.
[4] M Bjorkman. Computer Vision and Active Perception Lab, 2008. URL http://www.csc.kth.se/~celle/.
[5] A Cesetti, E Frontoni, A Mancini, P Zingaretti, and S Longhi. A Vision-Based Guid-ance System for UAV Navigation and Safe Landing using Natural Landmarks. Journalof Intelligent and Robotic Systems, 57(1-4):233–257, 2009. ISSN 0921-0296.
[6] S Heymann, K Maller, A Smolic, B Froehlich, and T Wiegand. SIFT implementationand optimization for general-purpose GPU. In Proceedings of the International Con-
M. MAY, M. J. TURNER, T. MORRIS: SIFT PARAMETER ANALYSIS 11
ference in Central Europe on Computer Graphics, Visualization and Computer Vision,2007.
[7] G Hua, M Brown, and S Winder. Discriminant embedding for local image descriptors.In IEEE 11th International Conference on Computer Vision, volume Internatio, pages1–8. Citeseer, 2007.
[8] A Inselberg. Parallel Coordinates - Visual Multidimensional Geometry and Its Appli-cations. Springer, 2009.
[9] K Jagadish and E Sinzinger. Image Matching Using High Dynamic Range Images andRadial Feature Descriptors. In Advances in Visual Computing, pages 359–369. 2008.
[10] V Lepetit. A Fast Local Descriptor for Dense Matching, 2008.
[11] D G Lowe. Distinctive Image Features from Scale-Invariant Keypoints. InternationalJournal of Computer Vision, 60:91–110, 2004.
[12] J Luo, Y Ma, E Takikawa, S Lao, M Kawade, and B Lu. Person-specific sift features forface recognition. Proceedings of the 2006 Conference on Computer Vision and PatternRecognition Workshop, pages 4–7, 2007.
[13] K Mikolajczyk and J Matas. Improving descriptors for fast tree matching by optimallinear projection. In IEEE 11th International Conference on Computer Vision, volumeIEEE 11th, pages 1–8, 2007.
[14] K Mikolajczyk and C Schmid. A Performance Evaluation of Local Descriptors. InIEEE Transactions on Pattern Analysis and Machine Intelligence, pages 1615–1630,2005.
[15] K Mikolajczyk, T Tuytelaars, C Schmid, A Zisserman, J Matas, F Schaffalitzky,T Kadir, and L V Gool. A comparison of affine region detectors. International Journalof Computer Vision, 65:43–72, 2005.
[16] U Park, S Pankanti, and A K Jain. Fingerprint verification using SIFT features. Pro-ceedings of SPIE, 2008. ISSN 0277786X.
[17] C Y Tang, Y L Wu, M K Hor, and W H Wang. Modified sift descriptor for imagematching under interference. In Machine Learning and Cybernetics, 2008 Interna-tional Conference on, volume 6, 2008.
[18] S Winder and M Brown. Learning local image descriptors. In IEEE Conference onComputer Vision and Pattern Recognition, pages 1–8, 2007.
[19] S Winder and M Brown. Picking the best DAISY. In IEEE Conference on ComputerVision and Pattern Recognition, pages 178–185, 2009.
[20] Changchang Wu. SIFT on GPU (siftgpu), 2007. URL http://www.cs.unc.edu/~ccwu/siftgpu/.
Related Documents