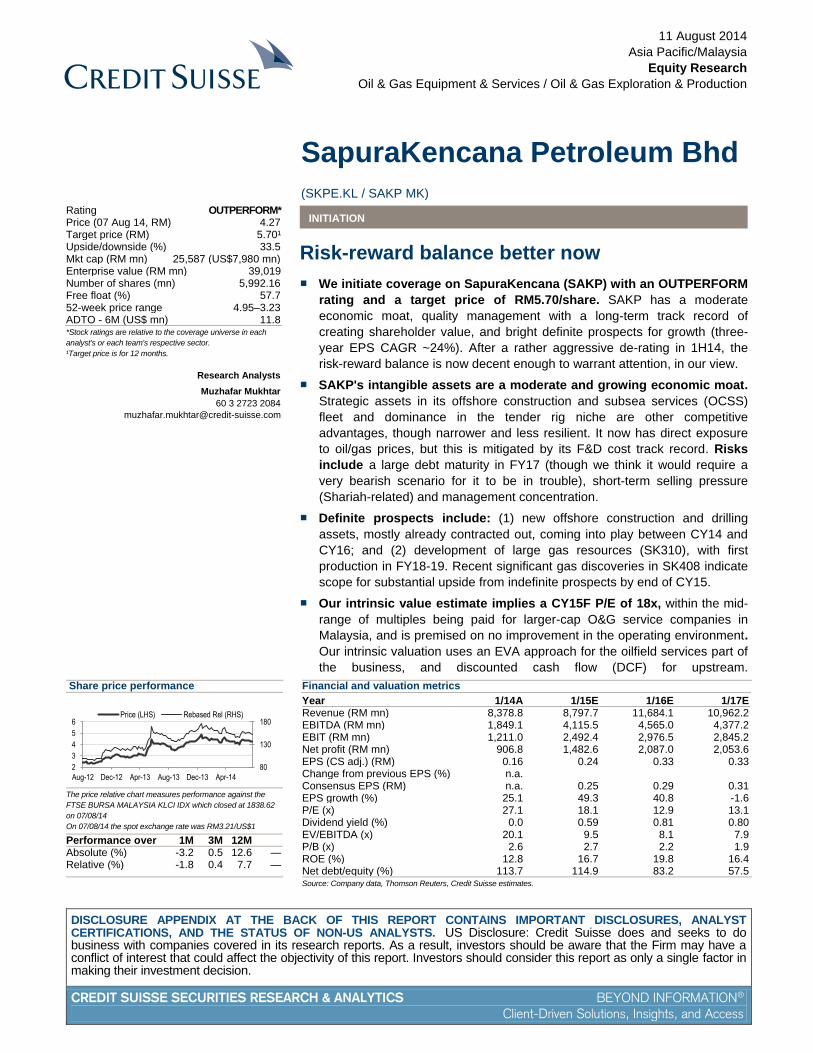
DISCLOSURE APPENDIX AT THE BACK OF THIS REPORT CONTAINS IMPORTANT DISCLOSURES, ANALYST CERTIFICATIONS, AND THE STATUS OF NON-US ANALYSTS. US Disclosure: Credit Suisse does and seeks to do business with companies covered in its research reports. As a result, investors should be aware that the Firm may have a conflict of interest that could affect the objectivity of this report. Investors should consider this report as only a single factor in making their investment decision. CREDIT SUISSE SECURITIES RESEARCH & ANALYTICS BEYOND INFORMATION ® Client-Driven Solutions, Insights, and Access 11 August 2014 Asia Pacific/Malaysia Equity Research Oil & Gas Equipment & Services / Oil & Gas Exploration & Production SapuraKencana Petroleum Bhd (SKPE.KL / SAKP MK) INITIATION Risk-reward balance better now ■ We initiate coverage on SapuraKencana (SAKP) with an OUTPERFORM rating and a target price of RM5.70/share. SAKP has a moderate economic moat, quality management with a long-term track record of creating shareholder value, and bright definite prospects for growth (three- year EPS CAGR ~24%). After a rather aggressive de-rating in 1H14, the risk-reward balance is now decent enough to warrant attention, in our view. ■ SAKP's intangible assets are a moderate and growing economic moat. Strategic assets in its offshore construction and subsea services (OCSS) fleet and dominance in the tender rig niche are other competitive advantages, though narrower and less resilient. It now has direct exposure to oil/gas prices, but this is mitigated by its F&D cost track record. Risks include a large debt maturity in FY17 (though we think it would require a very bearish scenario for it to be in trouble), short-term selling pressure (Shariah-related) and management concentration. ■ Definite prospects include: (1) new offshore construction and drilling assets, mostly already contracted out, coming into play between CY14 and CY16; and (2) development of large gas resources (SK310), with first production in FY18-19. Recent significant gas discoveries in SK408 indicate scope for substantial upside from indefinite prospects by end of CY15. ■ Our intrinsic value estimate implies a CY15F P/E of 18x, within the mid- range of multiples being paid for larger-cap O&G service companies in Malaysia, and is premised on no improvement in the operating environment . Our intrinsic valuation uses an EVA approach for the oilfield services part of the business, and discounted cash flow (DCF) for upstream. Share price performance 80 130 180 2 3 4 5 6 Aug-12 Dec-12 Apr-13 Aug-13 Dec-13 Apr-14 Price (LHS) Rebased Rel (RHS) The price relative chart measures performance against the FTSE BURSA MALAYSIA KLCI IDX which closed at 1838.62 on 07/08/14 On 07/08/14 the spot exchange rate was RM3.21/US$1 Performance over 1M 3M 12M Absolute (%) -3.2 0.5 12.6 — Relative (%) -1.8 0.4 7.7 — Financial and valuation metrics Year 1/14A 1/15E 1/16E 1/17E Revenue (RM mn) 8,378.8 8,797.7 11,684.1 10,962.2 EBITDA (RM mn) 1,849.1 4,115.5 4,565.0 4,377.2 EBIT (RM mn) 1,211.0 2,492.4 2,976.5 2,845.2 Net profit (RM mn) 906.8 1,482.6 2,087.0 2,053.6 EPS (CS adj.) (RM) 0.16 0.24 0.33 0.33 Change from previous EPS (%) n.a. Consensus EPS (RM) n.a. 0.25 0.29 0.31 EPS growth (%) 25.1 49.3 40.8 -1.6 P/E (x) 27.1 18.1 12.9 13.1 Dividend yield (%) 0.0 0.59 0.81 0.80 EV/EBITDA (x) 20.1 9.5 8.1 7.9 P/B (x) 2.6 2.7 2.2 1.9 ROE (%) 12.8 16.7 19.8 16.4 Net debt/equity (%) 113.7 114.9 83.2 57.5 Source: Company data, Thomson Reuters, Credit Suisse estimates. Rating OUTPERFORM* Price (07 Aug 14, RM) 4.27 Target price (RM) 5.70¹ Upside/downside (%) 33.5 Mkt cap (RM mn) 25,587 (US$7,980 mn) Enterprise value (RM mn) 39,019 Number of shares (mn) 5,992.16 Free float (%) 57.7 52-week price range 4.95–3.23 ADTO - 6M (US$ mn) 11.8 *Stock ratings are relative to the coverage universe in each analyst's or each team's respective sector. ¹Target price is for 12 months. Research Analysts Muzhafar Mukhtar 60 3 2723 2084 [email protected]

Welcome message from author
This document is posted to help you gain knowledge. Please leave a comment to let me know what you think about it! Share it to your friends and learn new things together.
Transcript
DISCLOSURE APPENDIX AT THE BACK OF THIS REPORT CONTAINS IMPORTANT DISCLOSURES, ANALYST CERTIFICATIONS, AND THE STATUS OF NON-US ANALYSTS. US Disclosure: Credit Suisse does and seeks to do business with companies covered in its research reports. As a result, investors should be aware that the Firm may have a conflict of interest that could affect the objectivity of this report. Investors should consider this report as only a single factor in making their investment decision.
CREDIT SUISSE SECURITIES RESEARCH & ANALYTICS BEYOND INFORMATION®
Client-Driven Solutions, Insights, and Access
11 August 2014
Asia Pacific/Malaysia
Equity Research
Oil & Gas Equipment & Services / Oil & Gas Exploration & Production
SapuraKencana Petroleum Bhd
(SKPE.KL / SAKP MK) INITIATION
Risk-reward balance better now
■ We initiate coverage on SapuraKencana (SAKP) with an OUTPERFORM
rating and a target price of RM5.70/share. SAKP has a moderate
economic moat, quality management with a long-term track record of
creating shareholder value, and bright definite prospects for growth (three-
year EPS CAGR ~24%). After a rather aggressive de-rating in 1H14, the
risk-reward balance is now decent enough to warrant attention, in our view.
■ SAKP's intangible assets are a moderate and growing economic moat.
Strategic assets in its offshore construction and subsea services (OCSS)
fleet and dominance in the tender rig niche are other competitive
advantages, though narrower and less resilient. It now has direct exposure
to oil/gas prices, but this is mitigated by its F&D cost track record. Risks
include a large debt maturity in FY17 (though we think it would require a
very bearish scenario for it to be in trouble), short-term selling pressure
(Shariah-related) and management concentration.
■ Definite prospects include: (1) new offshore construction and drilling
assets, mostly already contracted out, coming into play between CY14 and
CY16; and (2) development of large gas resources (SK310), with first
production in FY18-19. Recent significant gas discoveries in SK408 indicate
scope for substantial upside from indefinite prospects by end of CY15.
■ Our intrinsic value estimate implies a CY15F P/E of 18x, within the mid-
range of multiples being paid for larger-cap O&G service companies in
Malaysia, and is premised on no improvement in the operating environment.
Our intrinsic valuation uses an EVA approach for the oilfield services part of
the business, and discounted cash flow (DCF) for upstream.
Share price performance
80
130
180
2
3
4
5
6
Aug-12 Dec-12 Apr-13 Aug-13 Dec-13 Apr-14
Price (LHS) Rebased Rel (RHS)
The price relative chart measures performance against the
FTSE BURSA MALAYSIA KLCI IDX which closed at 1838.62
on 07/08/14
On 07/08/14 the spot exchange rate was RM3.21/US$1
Performance over 1M 3M 12M Absolute (%) -3.2 0.5 12.6 — Relative (%) -1.8 0.4 7.7 —
Financial and valuation metrics
Year 1/14A 1/15E 1/16E 1/17E Revenue (RM mn) 8,378.8 8,797.7 11,684.1 10,962.2 EBITDA (RM mn) 1,849.1 4,115.5 4,565.0 4,377.2 EBIT (RM mn) 1,211.0 2,492.4 2,976.5 2,845.2 Net profit (RM mn) 906.8 1,482.6 2,087.0 2,053.6 EPS (CS adj.) (RM) 0.16 0.24 0.33 0.33 Change from previous EPS (%) n.a. Consensus EPS (RM) n.a. 0.25 0.29 0.31 EPS growth (%) 25.1 49.3 40.8 -1.6 P/E (x) 27.1 18.1 12.9 13.1 Dividend yield (%) 0.0 0.59 0.81 0.80 EV/EBITDA (x) 20.1 9.5 8.1 7.9 P/B (x) 2.6 2.7 2.2 1.9 ROE (%) 12.8 16.7 19.8 16.4 Net debt/equity (%) 113.7 114.9 83.2 57.5
Source: Company data, Thomson Reuters, Credit Suisse estimates.
Rating OUTPERFORM* Price (07 Aug 14, RM) 4.27 Target price (RM) 5.70¹ Upside/downside (%) 33.5 Mkt cap (RM mn) 25,587 (US$7,980 mn) Enterprise value (RM mn) 39,019 Number of shares (mn) 5,992.16 Free float (%) 57.7 52-week price range 4.95–3.23 ADTO - 6M (US$ mn) 11.8
*Stock ratings are relative to the coverage universe in each
analyst's or each team's respective sector.
¹Target price is for 12 months.
Research Analysts
Muzhafar Mukhtar
60 3 2723 2084
11 August 2014
SapuraKencana Petroleum Bhd (SKPE.KL / SAKP MK) 2
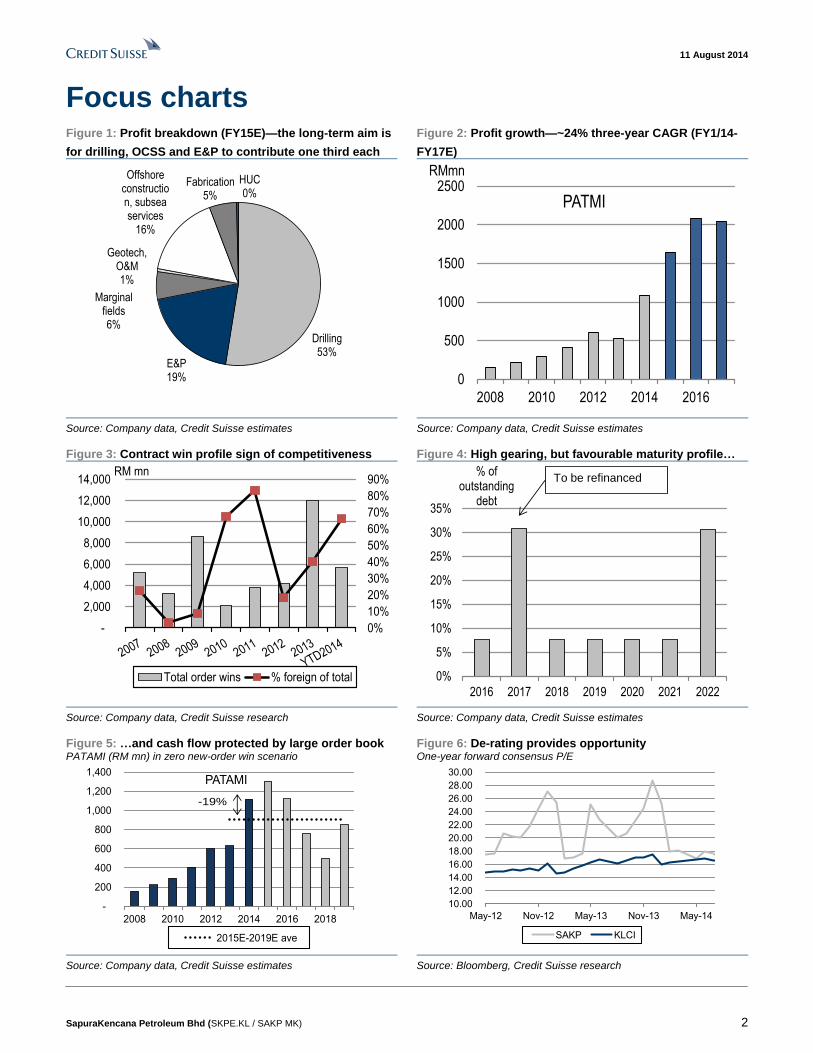
Focus charts Figure 1: Profit breakdown (FY15E)—the long-term aim is
for drilling, OCSS and E&P to contribute one third each
Figure 2: Profit growth—~24% three-year CAGR (FY1/14-
FY17E)
Drilling53%
E&P19%
Marginal fields6%
Geotech, O&M1%
Offshore construction, subsea services
16%
Fabrication5%
HUC0%
0
500
1000
1500
2000
2500
2008 2010 2012 2014 2016
RMmn
PATMI
Source: Company data, Credit Suisse estimates Source: Company data, Credit Suisse estimates
Figure 3: Contract win profile sign of competitiveness Figure 4: High gearing, but favourable maturity profile…
0%
10%
20%
30%
40%
50%
60%
70%
80%
90%
-
2,000
4,000
6,000
8,000
10,000
12,000
14,000RM mn
Total order wins % foreign of total
0%
5%
10%
15%
20%
25%
30%
35%
2016 2017 2018 2019 2020 2021 2022
% of outstanding
debt
To be refinanced
Source: Company data, Credit Suisse research Source: Company data, Credit Suisse estimates
Figure 5: …and cash flow protected by large order book PATAMI (RM mn) in zero new-order win scenario
Figure 6: De-rating provides opportunity One-year forward consensus P/E
-
200
400
600
800
1,000
1,200
1,400
2008 2010 2012 2014 2016 2018
PATAMI
2015E-2019E ave
-19%
10.00
12.00
14.00
16.00
18.00
20.00
22.00
24.00
26.00
28.00
30.00
May-12 Nov-12 May-13 Nov-13 May-14
SAKP KLCI
Source: Company data, Credit Suisse estimates Source: Bloomberg, Credit Suisse research
11 August 2014
SapuraKencana Petroleum Bhd (SKPE.KL / SAKP MK) 3
Risk-reward balance better now How does it make money?
SapuraKencana (SAKP) is an integrated upstream oil & gas company, straddling (1)
oilfield services (it is a contractor for offshore development drilling, offshore construction
and subsea services, fabrication, and hook-up and commissioning, with an increasingly
global footprint), (2) exploration and production (SAKP has working interests in oil & gas
blocks under production sharing contracts in Malaysia) and (3) marginal fields—under risk
service contracts, SAKP and its partners develop marginal oil & gas fields in Malaysia and
operate production facilities in return for a fixed payment; Petronas remains the owner.
Are there any economic moats?
SAKP's most valuable assets are intangible: track record, client relationships and
reputation. This moderate but growing economic moat is based on a genuine ability to
compete (~70% of its order book is outside of Malaysia), and is the result of both organic
cultivation and acquisitions. The moat is widest in the Malaysian upstream segment,
where SAKP is a key player across oilfield services, E&P and marginal fields, and within
the tender rig niche, where it holds 44% of global capacity. In EPCIC, however, larger
players still do not see SAKP as a comparable peer, though trends in its order book and
fleet suggest this might only be a matter of time. Its execution track record in OCSS
leverages on advanced assets in its young fleet, which includes several high-spec
strategic assets either already operational or under construction, whilst the niche nature of
tender rigs will likely allow them to maintain their dominance in this profitable, and less
cyclical, segment. These require consistent fleet renewal however; we are a bit more
sceptical on the long-term durability or relative strength of these competitive advantages.
Where can things go wrong?
Our analysis of the various risks facing investors suggests that most potential problems
are adequately mitigated. The only chink in the armour that we see is related to debt
(chunky maturity in two years), though our analysis suggests that only in an extremely
bearish scenario would this be a real problem, due to the strong earnings visibility from the
outstanding order book. Along with a lower dependence on the domestic market, the high
backlog also protects it more from any decline in domestic capex compared to most
Malaysian peers. The E&P business has demonstrated an above-average ability to find
hydrocarbons in Malaysia, and we believe total underlying production costs are within the
lower region of the cost curve, mitigating SAKP's direct exposure to oil/gas prices. In the
near-term, however, there could be downside risk from further selling pressure ahead of
SAKP's removal from the SC's Shariah-compliant list. Management concentration is a
pertinent risk to note, but we are not sure investors would want it to be mitigated.
How much is it worth?
Our intrinsic value estimate for SAKP is RM5.70/share, which implies a margin of safety of
~30%. We use an Economic Value Added approach for the oilfield services segments and
mostly DCF for the E&P and marginal field assets. Our target price implies a CY15F P/E
multiple of 18x, well within the mid-range of those seen across the larger-cap O&G-related
stocks in Malaysia, where trapped domestic liquidity with a predilection for liquid names
bids up prices for larger companies. The strength of the business, quality of management
and a decent margin of safety arising from the de-rating in 1H14 (possibly Shariah-related),
combine to form an opportunity in our view. A more logical approach is to wait patiently for a
very wide margin of safety before loading up heavily, but in the absence of the ability to adopt a
concentrated portfolio strategy, we believe the risk-reward balance is good enough at the
moment for investors to contemplate putting their money in.
Key moving parts: offshore
drilling, offshore
construction, E&P
Intangible assets are
moderate but growing
economic moats; OCSS
fleet and tender rig niche
support this, though are
much weaker and less
durable advantages
Most risks are well
mitigated; even with zero
new order wins, cashflow is
strong enough
Decent margin of safety;
intrinsic value of RM5.70
11 August 2014
SapuraKencana Petroleum Bhd (SKPE.KL / SAKP MK) 4
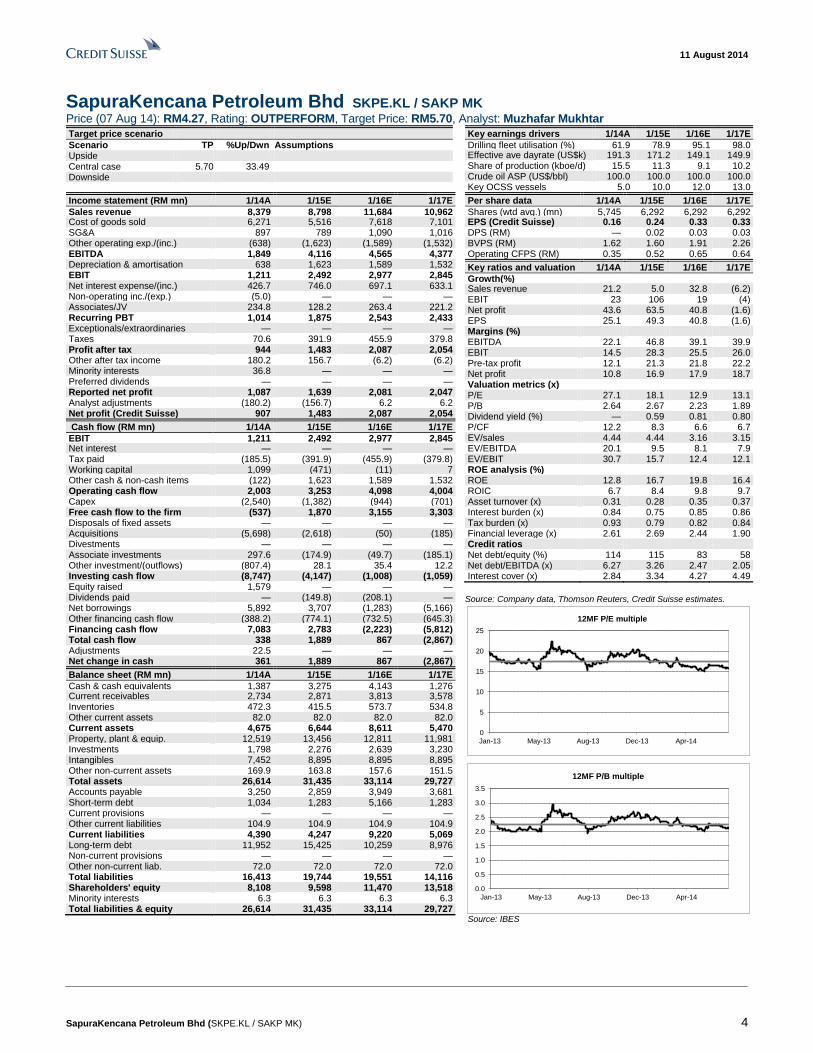
SapuraKencana Petroleum Bhd SKPE.KL / SAKP MK Price (07 Aug 14): RM4.27, Rating: OUTPERFORM, Target Price: RM5.70, Analyst: Muzhafar Mukhtar
Target price scenario
Scenario TP %Up/Dwn Assumptions Upside Central case 5.70 33.49 Downside
Key earnings drivers 1/14A 1/15E 1/16E 1/17E
Drilling fleet utilisation (%) 61.9 78.9 95.1 98.0 Effective ave dayrate (US$k) 191.3 171.2 149.1 149.9 Share of production (kboe/d) 15.5 11.3 9.1 10.2 Crude oil ASP (US$/bbl) 100.0 100.0 100.0 100.0 Key OCSS vessels 5.0 10.0 12.0 13.0
Income statement (RM mn) 1/14A 1/15E 1/16E 1/17E
Sales revenue 8,379 8,798 11,684 10,962 Cost of goods sold 6,271 5,516 7,618 7,101 SG&A 897 789 1,090 1,016 Other operating exp./(inc.) (638) (1,623) (1,589) (1,532) EBITDA 1,849 4,116 4,565 4,377 Depreciation & amortisation 638 1,623 1,589 1,532 EBIT 1,211 2,492 2,977 2,845 Net interest expense/(inc.) 426.7 746.0 697.1 633.1 Non-operating inc./(exp.) (5.0) — — — Associates/JV 234.8 128.2 263.4 221.2 Recurring PBT 1,014 1,875 2,543 2,433 Exceptionals/extraordinaries — — — — Taxes 70.6 391.9 455.9 379.8 Profit after tax 944 1,483 2,087 2,054 Other after tax income 180.2 156.7 (6.2) (6.2) Minority interests 36.8 — — — Preferred dividends — — — — Reported net profit 1,087 1,639 2,081 2,047 Analyst adjustments (180.2) (156.7) 6.2 6.2 Net profit (Credit Suisse) 907 1,483 2,087 2,054
Cash flow (RM mn) 1/14A 1/15E 1/16E 1/17E
EBIT 1,211 2,492 2,977 2,845 Net interest — — — — Tax paid (185.5) (391.9) (455.9) (379.8) Working capital 1,099 (471) (11) 7 Other cash & non-cash items (122) 1,623 1,589 1,532 Operating cash flow 2,003 3,253 4,098 4,004 Capex (2,540) (1,382) (944) (701) Free cash flow to the firm (537) 1,870 3,155 3,303 Disposals of fixed assets — — — — Acquisitions (5,698) (2,618) (50) (185) Divestments — — — — Associate investments 297.6 (174.9) (49.7) (185.1) Other investment/(outflows) (807.4) 28.1 35.4 12.2 Investing cash flow (8,747) (4,147) (1,008) (1,059) Equity raised 1,579 — — — Dividends paid — (149.8) (208.1) — Net borrowings 5,892 3,707 (1,283) (5,166) Other financing cash flow (388.2) (774.1) (732.5) (645.3) Financing cash flow 7,083 2,783 (2,223) (5,812) Total cash flow 338 1,889 867 (2,867) Adjustments 22.5 — — — Net change in cash 361 1,889 867 (2,867)
Balance sheet (RM mn) 1/14A 1/15E 1/16E 1/17E
Cash & cash equivalents 1,387 3,275 4,143 1,276 Current receivables 2,734 2,871 3,813 3,578 Inventories 472.3 415.5 573.7 534.8 Other current assets 82.0 82.0 82.0 82.0 Current assets 4,675 6,644 8,611 5,470 Property, plant & equip. 12,519 13,456 12,811 11,981 Investments 1,798 2,276 2,639 3,230 Intangibles 7,452 8,895 8,895 8,895 Other non-current assets 169.9 163.8 157.6 151.5 Total assets 26,614 31,435 33,114 29,727 Accounts payable 3,250 2,859 3,949 3,681 Short-term debt 1,034 1,283 5,166 1,283 Current provisions — — — — Other current liabilities 104.9 104.9 104.9 104.9 Current liabilities 4,390 4,247 9,220 5,069 Long-term debt 11,952 15,425 10,259 8,976 Non-current provisions — — — — Other non-current liab. 72.0 72.0 72.0 72.0 Total liabilities 16,413 19,744 19,551 14,116 Shareholders' equity 8,108 9,598 11,470 13,518 Minority interests 6.3 6.3 6.3 6.3 Total liabilities & equity 26,614 31,435 33,114 29,727
Per share data 1/14A 1/15E 1/16E 1/17E
Shares (wtd avg.) (mn) 5,745 6,292 6,292 6,292 EPS (Credit Suisse) (RM)
0.16 0.24 0.33 0.33 DPS (RM) — 0.02 0.03 0.03 BVPS (RM) 1.62 1.60 1.91 2.26 Operating CFPS (RM) 0.35 0.52 0.65 0.64
Key ratios and valuation 1/14A 1/15E 1/16E 1/17E
Growth(%) Sales revenue 21.2 5.0 32.8 (6.2) EBIT 23 106 19 (4) Net profit 43.6 63.5 40.8 (1.6) EPS 25.1 49.3 40.8 (1.6) Margins (%) EBITDA 22.1 46.8 39.1 39.9 EBIT 14.5 28.3 25.5 26.0 Pre-tax profit 12.1 21.3 21.8 22.2 Net profit 10.8 16.9 17.9 18.7 Valuation metrics (x) P/E 27.1 18.1 12.9 13.1 P/B 2.64 2.67 2.23 1.89 Dividend yield (%) — 0.59 0.81 0.80 P/CF 12.2 8.3 6.6 6.7 EV/sales 4.44 4.44 3.16 3.15 EV/EBITDA 20.1 9.5 8.1 7.9 EV/EBIT 30.7 15.7 12.4 12.1 ROE analysis (%) ROE 12.8 16.7 19.8 16.4 ROIC 6.7 8.4 9.8 9.7 Asset turnover (x) 0.31 0.28 0.35 0.37 Interest burden (x) 0.84 0.75 0.85 0.86 Tax burden (x) 0.93 0.79 0.82 0.84 Financial leverage (x) 2.61 2.69 2.44 1.90 Credit ratios Net debt/equity (%) 114 115 83 58 Net debt/EBITDA (x) 6.27 3.26 2.47 2.05 Interest cover (x) 2.84 3.34 4.27 4.49
Source: Company data, Thomson Reuters, Credit Suisse estimates.
0
5
10
15
20
25
Jan-13 May-13 Aug-13 Dec-13 Apr-14
12MF P/E multiple
0.0
0.5
1.0
1.5
2.0
2.5
3.0
3.5
Jan-13 May-13 Aug-13 Dec-13 Apr-14
12MF P/B multiple
Source: IBES
11 August 2014
SapuraKencana Petroleum Bhd (SKPE.KL / SAKP MK) 5
How does it make money? Integrated upstream oil & gas company primarily in drilling, offshore construction
and E&P. SAKP is involved in both E&P (exploration and production), and providing
oilfield services (OFS) for other oil companies. It was born from the merger in early 2012
between the two then-rapidly growing Malaysian oilfield services contractors: SapuraCrest
Petroleum (involved in offshore construction, subsea services and offshore drilling) and
Kencana Petroleum (fabrication, marine services and offshore drilling). The management
team is being led by Tan Sri Shahril Shamsuddin (with a 17% stake), who first entered the
O&G industry in 2003 when the Sapura Group acquired a controlling stake in SapuraCrest
(then known as Crest Petroleum, active in O&G since 1991).
The company bought Seadrill’s tender rig business in April 2013 and extended its reach up
the value chain by acquiring Newfield’s Malaysian E&P business in February 2014.
Throughout this transformative period, SAKP has also been organically increasing its fleet
of offshore construction vessels and drilling rigs. The company reports its business
segments as below (with CS-estimated FY15E profit contribution):
Drilling and energy services (~79% of FY15E profit):
■ Drilling (~53%): The biggest contributor to profits, and the most profitable OFS line.
SAKP owns and operates 19 tender rigs, under contract with E&P companies. Tender
rigs are used only for development drilling (i.e. production wells, not exploration wells);
those on barges are suitable only for shallow waters, whilst the semi-subs (a third of
its fleet) can venture further out up to ~6,500 feet of water. Currently, the fleet is
operating mostly in Southeast Asia and West Africa. EBIT margins are wide at ~40-
50%, and firm charters tend to run for at least a year, going as far out as five years
historically. This segment began with a JV with Seadrill in the early 1990s, and
culminated in the acquisition of Seadrill’s entire tender rig business (i.e., including
management) in 2013. SAKP now controls ~44% of global capacity within the tender
rig sector of the global drilling fleet. We estimate its fleet’s cumulative utilisation rate to
be at an impressive 94% so far. One additional tender rig under construction will be
ready in 2015; we have also assumed one of the older rigs will be scrapped by then.
■ E&P (~19%): In February 2014, SAKP completed the acquisition of the Malaysian
business of US-listed Newfield Exploration. The division has a good track record for
exploration and bringing assets to production quickly. It now has interests in eight
blocks across East Malaysia and Eastern Peninsular Malaysia (plus 1 EOR alliance
contract); the portfolio consists of a good mix of producing, development and
exploration assets. Whilst the production profile will naturally decline between FY15
and FY18, we estimate the existing cash balance and the net free cash flows from
producing assets should be more than sufficient to cover both planned development
and exploration capex. By FY18, the current development play (~3tcf of gas initially in
place in SK310) is scheduled to come into production and will eventually be strongly
cash flow positive. At the moment, the project is awaiting the signature of the gas
sales agreement with Petronas. The existing exploration prospect (block SK408)
provides substantial upside potential, with four major gas finds already announced in
June 2014, about half the size of the SK310 resources, and close to the existing
infrastructure. One well has been completed with the results yet to be announced, and
another five wells will be drilled by the end of CY15 in SK408.
■ Marginal fields (~6%): SAKP was awarded the first of the Risk Service Contracts
(RSCs) in Malaysia in 2011 for the Berantai field, in partnership with Petrofac (50:50).
Under the Berantai RSC, the contractors will develop the field at their own cost and
operate the production facilities; in return, they will receive fixed payments for nine
years, based on several key performance indicators including time to first gas, cost
versus budget, production levels, which can result in project IRRs of 12-22%; capex
Integrated upstream oil
company transformed by
M&A in past two years, but
with roots stretching back
two decades ago
Three key moving parts:
offshore drilling, offshore
construction, and E&P.
Dominant player in tender
rig niche, after acquiring
Seadrill's tender rig
business
E&P focused on existing oil
production from four blocks
in Malaysia, and future
development of gas
resources in two blocks off
Sarawak
Marginal field development
in Malaysia under RSCs
offer an good risk-reward
balance
11 August 2014
SapuraKencana Petroleum Bhd (SKPE.KL / SAKP MK) 6
recovery is guaranteed by Petronas. The oil & gas resources remain under Petronas
ownership. On an average, this particular RSC provides only ~5% of profits, according
to our estimate. However, following the success of Berantai, SAKP will continue to bid
for more RSCs, of which at least ~five are still available. The risk-reward balance of
the RSC model is attractive, and the pool of potential domestic participants is limited
(eligibility requirements include a strong execution track record in O&G, financial
strength, and public listing). SAKP has a strong ability to mitigate execution risk with
its solid field development experience as a contractor, newly acquired E&P capabilities
and existing tie-up with Petrofac, which has proven itself to be very successful with the
Cendor and Berantai marginal fields. This segment is quite promising for the group.
■ Geotech, operations & maintenance (~1%): This includes the chartering out of four
surveying vessels, repairing of General Electric gas turbines, repairs/refurbishment of
single-buoy moorings and valves, and the supply/installation/maintenance of the POS
system used by Petronas Dagangan Bhd’s petrol stations. Profit contribution is very
small in this sub-segment.
Offshore construction and subsea services (~16%):
■ Offshore construction (~16%): One of its traditional bread and butter businesses;
practically all of the profit contribution for OCSS comes from installation of pipeline and
production facilities (IPF). SAKP uses a core fleet of wholly- and jointly-owned vessels
(six derrick lay vessels); partners include Subsea 7, Larsen & Toubro and Seadrill. Due
to the limited global availability of these high-cost vessels, particularly for deepwater,
the consolidated EBIT margin for this activity (i.e., with wholly-owned vessels) can be
quite substantial, up to ~25% in Malaysia and ~40% for deepwater work in Brazil, on
our estimates. In Malaysia, SAKP is dominant and routinely secures the lion’s share of
installation contracts. Internationally, the group has a proven competitive ability and (via
its 50:50 JV with Seadrill) has secured two multi-year charters for six hi-spec PLSVs
(pipe-laying support vessels) from Petrobras worth ~US$4.1 bn. The first vessel is
already completed (ahead of original schedule) and should begin contributing to the
bottom line by 3QFYE Jan-15. Additionally, SAKP provides sub-sea installation
services, and underwater inspection/repair/maintenance, using its own diving support
vessels, saturation diving systems and internally-built ROVs.
■ Marine services: This primarily supports SAKP's offshore construction business, with
a small fleet of accommodation work barges, anchor handling tugs, two MOPUs and a
semi-submersible barge.
Fabrication, hook-up and commissioning (~5%):
■ Fabrication (~5%): SAKP is one of the six major offshore fabricator licensees in
Malaysia; it operates a fabrication yard in Lumut on Peninsular Malaysia, which has a
substantial capacity of 90kmt p.a., and holds 50% stake in the 36kmt p.a. Labuan
Shipyard (LSE) in Sabah, East Malaysia. The Lumut yard generally focuses on
offshore platforms, jackets, equipment skids and other O&G structures, whilst LSE's
main business has previously been the construction and repair of vessels, but with an
increasing bias to O&G-related fabrication. In the recent year, this business segment
has been relatively weak due to the delay in major fabrication contracts previously
expected domestically, with the Lumut yard running at less than 50% utilisation;
however, this should begin to pick up to ~80% with the award of recent contracts.
Profit contribution is small; EBIT margins are typically 10-20%.
■ HUC (<1%): Additionally, SAKP can perform hook-up and commissioning (HUC) for
offshore facilities. It currently has a contract to provide ExxonMobil Malaysia with HUC
services between May 2013 and May 2018, worth ~RM300-500 mn.
OCSS is a key engine for
growth, and where SAKP's
strong reputation has its
roots
11 August 2014
SapuraKencana Petroleum Bhd (SKPE.KL / SAKP MK) 7
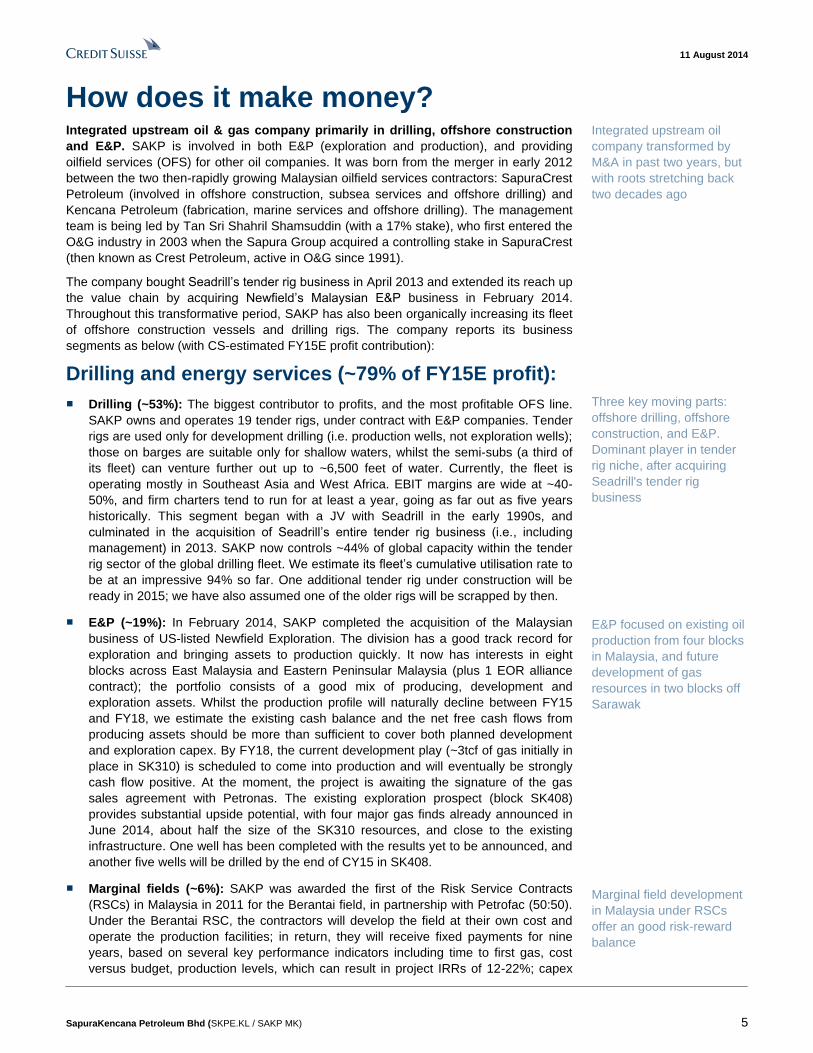
Figure 7: SAKP—upstream value chain participation
Upstream segment Specific activities
Exploration E&P: Gather geological, geophysical and seismic data, appraise prospects, contract out
exploration drilling, evaluate data from wells; holds exploration licenses for 4 blocks in
Malaysia, currently focused on SK408. OFS: provides geotechnical and geophysical surveys
Development OFS: Bread and butter for OFS income - Fabrication of platforms/equipment, transportation and
installation of facilities and pipelines, subsea installations, hook-up and commissioning,
development drilling; E&P: Currently developing discoveries in SK310 and SK408 blocks
offshore Sarawak; Marginal fields: brought Berantai marginal field to production in partnership
with Petrofac, under the RSC (Risk Service Contract) with Petronas. Actively bidding for more
RSCs.
Production E&P: Owns working interests in 4 producing blocks offshore Peninsular Malaysia; operator for 2
of them. Marginal fields: Operating Berantai's production facilities for Petronas under RSC.
OFS: Underwater inspection and repair, maintenance of topsides
Rejuvenation OFS: EOR and brownfield, primarily via drilling of additional production wells
Decommissioning &
abandonment
OFS: Some experience in decommisioning topsides, jackets and pipelines
Source: Company data, Credit Suisse research
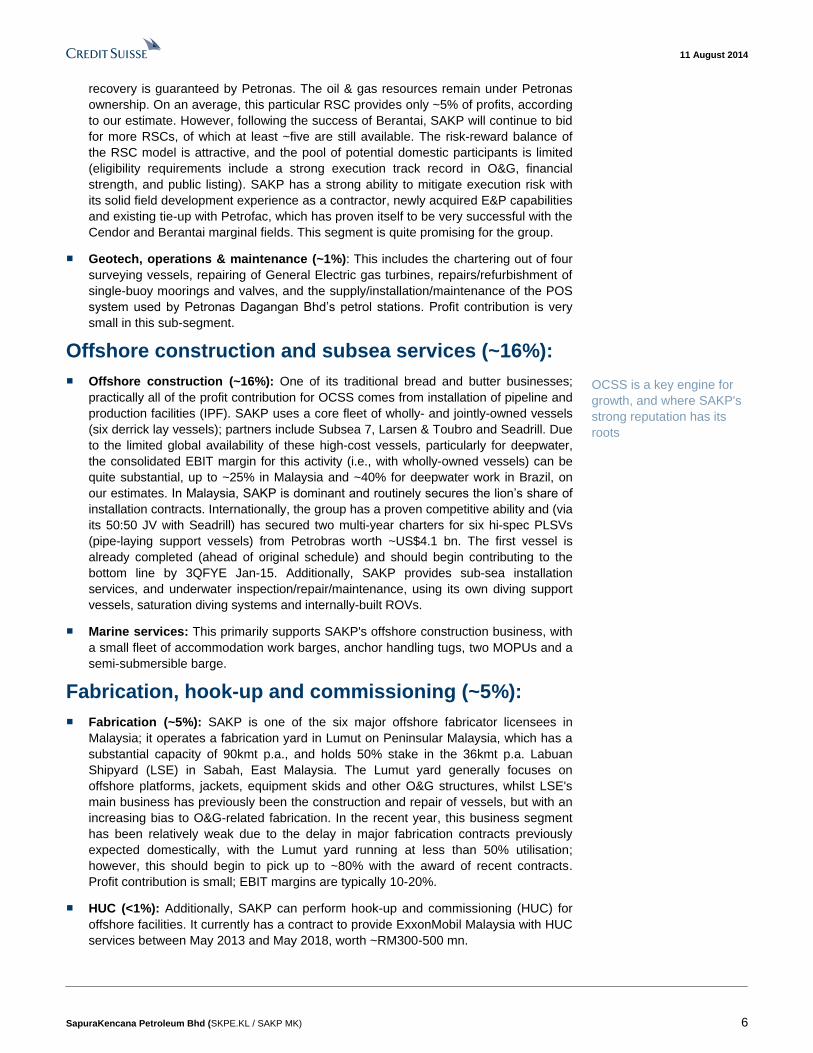
Figure 8: SAKP—OFS (oilfield services) capabilities
Source: Company
11 August 2014
SapuraKencana Petroleum Bhd (SKPE.KL / SAKP MK) 8
Figure 9: SAKP—global presence, though of varying degrees and in different value chain segments
Source: Company
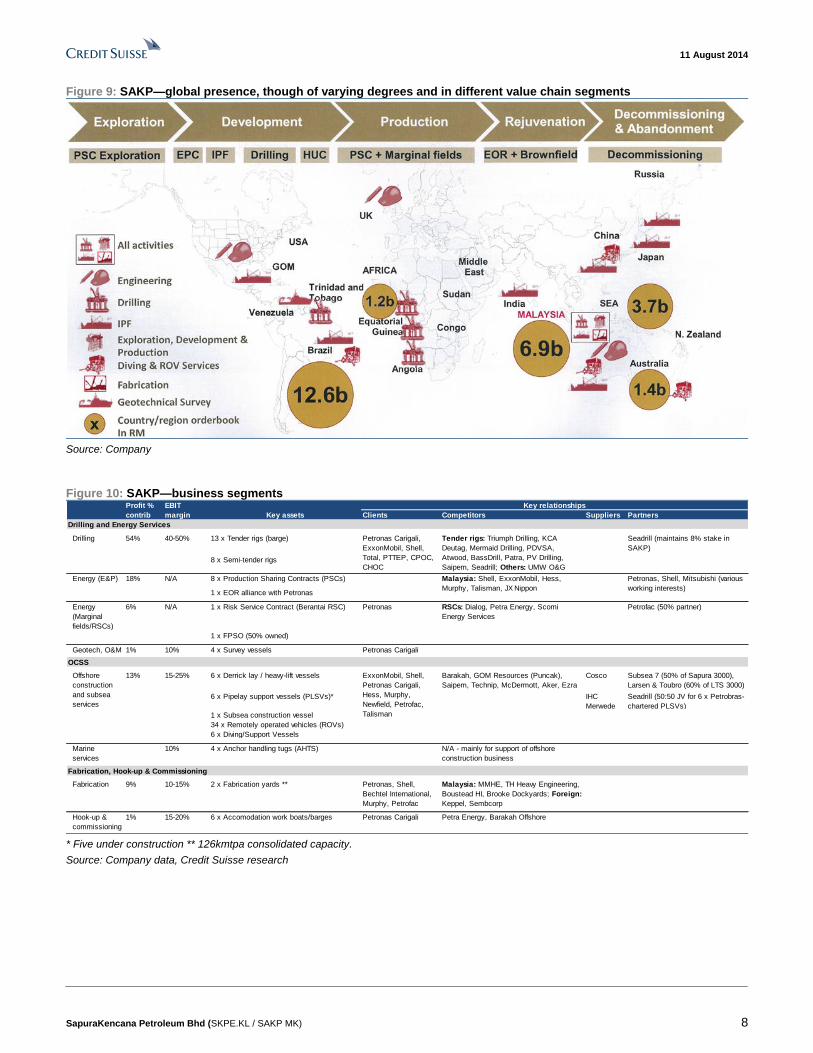
Figure 10: SAKP—business segments
Clients Competitors Suppliers Partners
Drilling and Energy Services
Drilling 54% 40-50% 13 x Tender rigs (barge) Seadrill (maintains 8% stake in
SAKP)
8 x Semi-tender rigs
Energy (E&P) 18% N/A 8 x Production Sharing Contracts (PSCs)
1 x EOR alliance with Petronas
Energy
(Marginal
fields/RSCs)
6% N/A 1 x Risk Service Contract (Berantai RSC) Petronas Petrofac (50% partner)
1 x FPSO (50% owned)
Geotech, O&M 1% 10% 4 x Survey vessels Petronas Carigali
OCSS
13% 15-25% 6 x Derrick lay / heavy-lift vessels Cosco Subsea 7 (50% of Sapura 3000),
Larsen & Toubro (60% of LTS 3000)
6 x Pipelay support vessels (PLSVs)* IHC
Merwede
Seadrill (50:50 JV for 6 x Petrobras-
chartered PLSVs)
1 x Subsea construction vessel
34 x Remotely operated vehicles (ROVs)
6 x Diving/Support Vessels
Marine
services
10% 4 x Anchor handling tugs (AHTS)
Fabrication, Hook-up & Commissioning
Fabrication 9% 10-15% 2 x Fabrication yards ** Petronas, Shell,
Bechtel International,
Murphy, Petrofac
Malaysia: MMHE, TH Heavy Engineering,
Boustead HI, Brooke Dockyards; Foreign:
Keppel, Sembcorp
Hook-up &
commissioning
1% 15-20% 6 x Accomodation work boats/barges Petronas Carigali Petra Energy, Barakah Offshore
N/A - mainly for support of offshore
construction business
Petronas Carigali,
ExxonMobil, Shell,
Total, PTTEP, CPOC,
CHOC
Tender rigs: Triumph Drilling, KCA
Deutag, Mermaid Drilling, PDVSA,
Atwood, BassDrill, Patra, PV Drilling,
Saipem, Seadrill; Others: UMW O&G
EBIT
margin
Profit %
contrib
Malaysia: Shell, ExxonMobil, Hess,
Murphy, Talisman, JX Nippon
Offshore
construction
and subsea
services
Petronas, Shell, Mitsubishi (various
working interests)
RSCs: Dialog, Petra Energy, Scomi
Energy Services
ExxonMobil, Shell,
Petronas Carigali,
Hess, Murphy,
Newfield, Petrofac,
Talisman
Key relationships
Key assets
Barakah, GOM Resources (Puncak),
Saipem, Technip, McDermott, Aker, Ezra
* Five under construction ** 126kmtpa consolidated capacity.
Source: Company data, Credit Suisse research
11 August 2014
SapuraKencana Petroleum Bhd (SKPE.KL / SAKP MK) 9
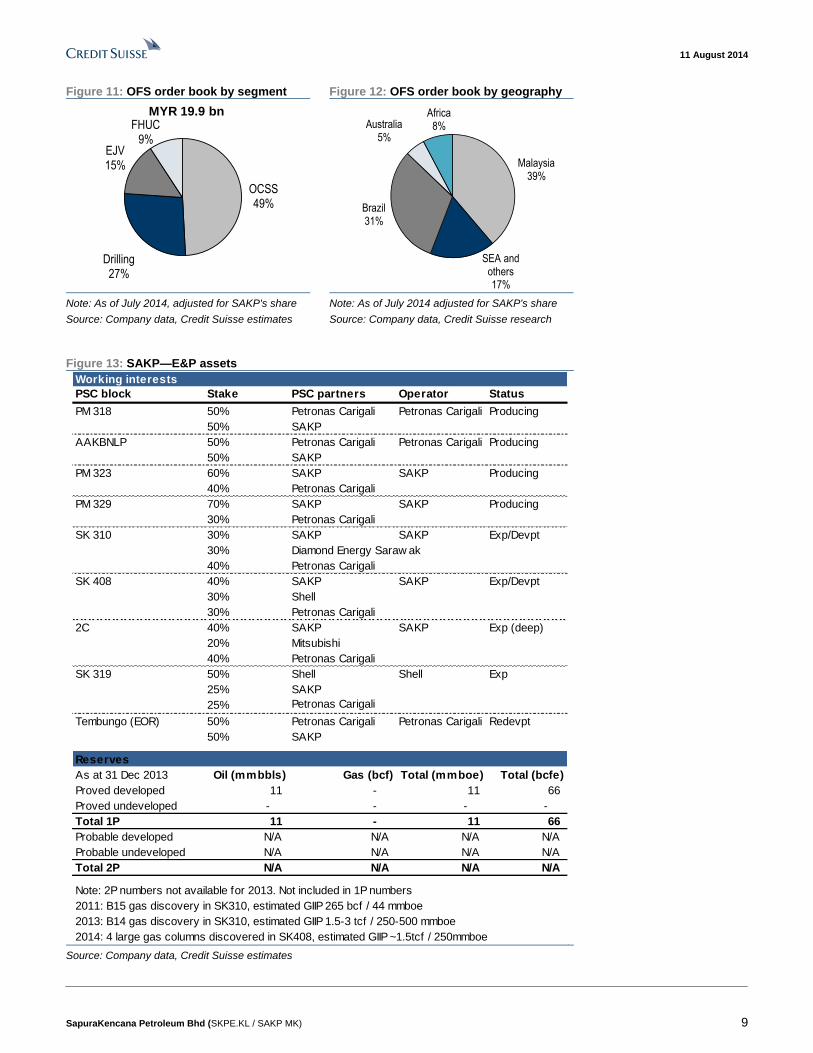
Figure 11: OFS order book by segment Figure 12: OFS order book by geography
OCSS49%
Drilling27%
EJV15%
FHUC9%
MYR 19.9 bn
Malaysia39%
SEA and others17%
Brazil31%
Australia5%
Africa8%
Note: As of July 2014, adjusted for SAKP's share
Source: Company data, Credit Suisse estimates
Note: As of July 2014 adjusted for SAKP's share
Source: Company data, Credit Suisse research
Figure 13: SAKP—E&P assets
Working interests
PSC block Stake PSC partners Operator Status
PM 318 50% Petronas Carigali Petronas Carigali Producing
50% SAKP
AAKBNLP 50% Petronas Carigali Petronas Carigali Producing
50% SAKP
PM 323 60% SAKP SAKP Producing
40% Petronas Carigali
PM 329 70% SAKP SAKP Producing
30% Petronas Carigali
SK 310 30% SAKP SAKP Exp/Devpt
30% Diamond Energy Saraw ak
40% Petronas Carigali
SK 408 40% SAKP SAKP Exp/Devpt
30% Shell
30% Petronas Carigali
2C 40% SAKP SAKP Exp (deep)
20% Mitsubishi
40% Petronas Carigali
SK 319 50% Shell Shell Exp
25% SAKP
25% Petronas Carigali
Tembungo (EOR) 50% Petronas Carigali Petronas Carigali Redevpt
50% SAKP
Reserves
As at 31 Dec 2013 Oil (mmbbls) Gas (bcf) Total (mmboe) Total (bcfe)
Proved developed 11 - 11 66
Proved undeveloped - - - -
Total 1P 11 - 11 66
Probable developed N/A N/A N/A N/A
Probable undeveloped N/A N/A N/A N/A
Total 2P N/A N/A N/A N/A
Note: 2P numbers not available for 2013. Not included in 1P numbers
2011: B15 gas discovery in SK310, estimated GIIP 265 bcf / 44 mmboe
2013: B14 gas discovery in SK310, estimated GIIP 1.5-3 tcf / 250-500 mmboe
2014: 4 large gas columns discovered in SK408, estimated GIIP ~1.5tcf / 250mmboe Source: Company data, Credit Suisse estimates
11 August 2014
SapuraKencana Petroleum Bhd (SKPE.KL / SAKP MK) 10
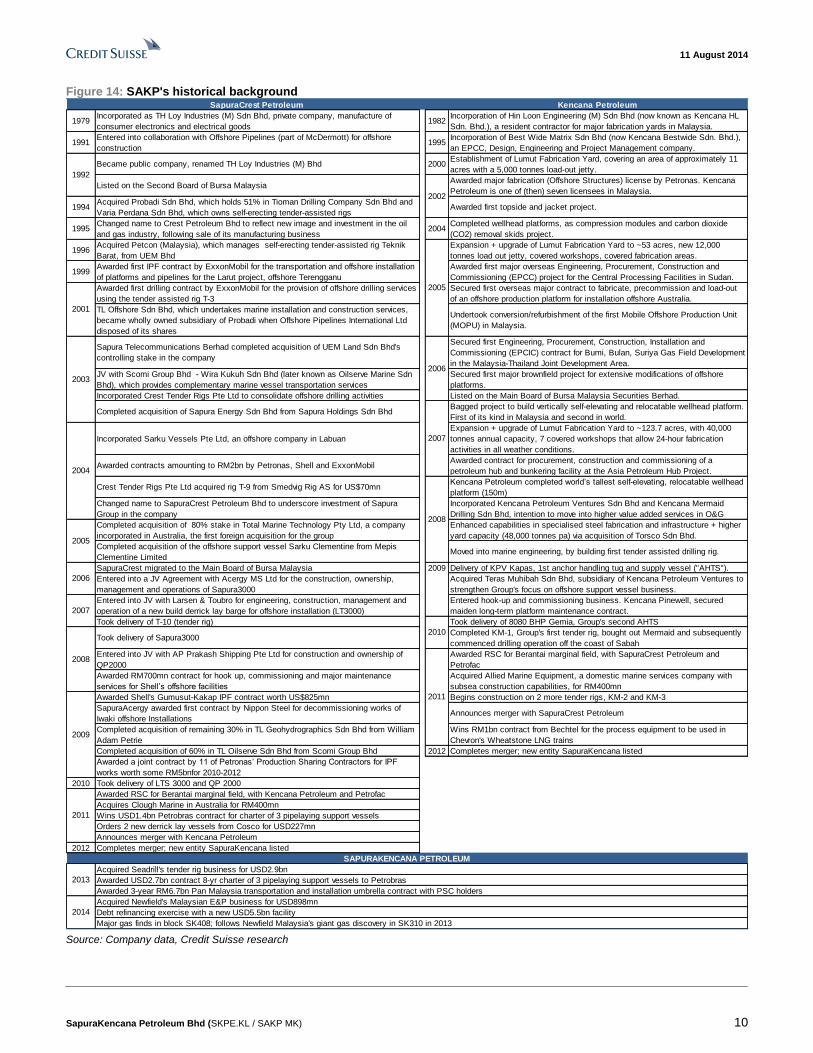
Figure 14: SAKP's historical background SapuraCrest Petroleum Kencana Petroleum
1979Incorporated as TH Loy Industries (M) Sdn Bhd, private company, manufacture of
consumer electronics and electrical goods1982
Incorporation of Hin Loon Engineering (M) Sdn Bhd (now known as Kencana HL
Sdn. Bhd.), a resident contractor for major fabrication yards in Malaysia.
1991Entered into collaboration with Offshore Pipelines (part of McDermott) for offshore
construction1995
Incorporation of Best Wide Matrix Sdn Bhd (now Kencana Bestwide Sdn. Bhd.),
an EPCC, Design, Engineering and Project Management company.
Became public company, renamed TH Loy Industries (M) Bhd 2000Establishment of Lumut Fabrication Yard, covering an area of approximately 11
acres with a 5,000 tonnes load-out jetty.
Listed on the Second Board of Bursa MalaysiaAwarded major fabrication (Offshore Structures) license by Petronas. Kencana
Petroleum is one of (then) seven licensees in Malaysia.
1994Acquired Probadi Sdn Bhd, which holds 51% in Tioman Drilling Company Sdn Bhd and
Varia Perdana Sdn Bhd, which owns self-erecting tender-assisted rigsAwarded first topside and jacket project.
1995Changed name to Crest Petroleum Bhd to reflect new image and investment in the oil
and gas industry, following sale of its manufacturing business2004
Completed wellhead platforms, as compression modules and carbon dioxide
(CO2) removal skids project.
1996Acquired Petcon (Malaysia), which manages self-erecting tender-assisted rig Teknik
Barat, from UEM Bhd
Expansion + upgrade of Lumut Fabrication Yard to ~53 acres, new 12,000
tonnes load out jetty, covered workshops, covered fabrication areas.
1999Awarded first IPF contract by ExxonMobil for the transportation and offshore installation
of platforms and pipelines for the Larut project, offshore Terengganu
Awarded first major overseas Engineering, Procurement, Construction and
Commissioning (EPCC) project for the Central Processing Facilities in Sudan.
Awarded first drilling contract by ExxonMobil for the provision of offshore drilling services
using the tender assisted rig T-3
Secured first overseas major contract to fabricate, precommission and load-out
of an offshore production platform for installation offshore Australia.
TL Offshore Sdn Bhd, which undertakes marine installation and construction services,
became wholly owned subsidiary of Probadi when Offshore Pipelines International Ltd
disposed of its shares
Undertook conversion/refurbishment of the first Mobile Offshore Production Unit
(MOPU) in Malaysia.
Sapura Telecommunications Berhad completed acquisition of UEM Land Sdn Bhd's
controlling stake in the company
Secured first Engineering, Procurement, Construction, Installation and
Commissioning (EPCIC) contract for Bumi, Bulan, Suriya Gas Field Development
in the Malaysia-Thailand Joint Development Area.
JV with Scomi Group Bhd - Wira Kukuh Sdn Bhd (later known as Oilserve Marine Sdn
Bhd), which provides complementary marine vessel transportation services
Secured first major brownfield project for extensive modifications of offshore
platforms.
Incorporated Crest Tender Rigs Pte Ltd to consolidate offshore drilling activities Listed on the Main Board of Bursa Malaysia Securities Berhad.
Completed acquisition of Sapura Energy Sdn Bhd from Sapura Holdings Sdn BhdBagged project to build vertically self-elevating and relocatable wellhead platform.
First of its kind in Malaysia and second in world.
Incorporated Sarku Vessels Pte Ltd, an offshore company in Labuan
Expansion + upgrade of Lumut Fabrication Yard to ~123.7 acres, with 40,000
tonnes annual capacity, 7 covered workshops that allow 24-hour fabrication
activities in all weather conditions.
Awarded contracts amounting to RM2bn by Petronas, Shell and ExxonMobil Awarded contract for procurement, construction and commissioning of a
petroleum hub and bunkering facility at the Asia Petroleum Hub Project.
Crest Tender Rigs Pte Ltd acquired rig T-9 from Smedvig Rig AS for US$70mnKencana Petroleum completed world’s tallest self-elevating, relocatable wellhead
platform (150m)
Changed name to SapuraCrest Petroleum Bhd to underscore investment of Sapura
Group in the company
Incorporated Kencana Petroleum Ventures Sdn Bhd and Kencana Mermaid
Drilling Sdn Bhd, intention to move into higher value added services in O&G
Completed acquisition of 80% stake in Total Marine Technology Pty Ltd, a company
incorporated in Australia, the first foreign acquisition for the group
Enhanced capabilities in specialised steel fabrication and infrastructure + higher
yard capacity (48,000 tonnes pa) via acquisition of Torsco Sdn Bhd.
Completed acquisition of the offshore support vessel Sarku Clementine from Mepis
Clementine LimitedMoved into marine engineering, by building first tender assisted drilling rig.
SapuraCrest migrated to the Main Board of Bursa Malaysia 2009 Delivery of KPV Kapas, 1st anchor handling tug and supply vessel ("AHTS").
Entered into a JV Agreement with Acergy MS Ltd for the construction, ownership,
management and operations of Sapura3000
Acquired Teras Muhibah Sdn Bhd, subsidiary of Kencana Petroleum Ventures to
strengthen Group's focus on offshore support vessel business.
Entered into JV with Larsen & Toubro for engineering, construction, management and
operation of a new build derrick lay barge for offshore installation (LT3000)
Entered hook-up and commissioning business. Kencana Pinewell, secured
maiden long-term platform maintenance contract.
Took delivery of T-10 (tender rig) Took delivery of 8080 BHP Gemia, Group's second AHTS
Took delivery of Sapura3000Completed KM-1, Group's first tender rig, bought out Mermaid and subsequently
commenced drilling operation off the coast of Sabah
Entered into JV with AP Prakash Shipping Pte Ltd for construction and ownership of
QP2000
Awarded RSC for Berantai marginal field, with SapuraCrest Petroleum and
Petrofac
Awarded RM700mn contract for hook up, commissioning and major maintenance
services for Shell’s offshore facilities
Acquired Allied Marine Equipment, a domestic marine services company with
subsea construction capabilities, for RM400mn
Awarded Shell's Gumusut-Kakap IPF contract worth US$825mn Begins construction on 2 more tender rigs, KM-2 and KM-3
SapuraAcergy awarded first contract by Nippon Steel for decommissioning works of
Iwaki offshore InstallationsAnnounces merger with SapuraCrest Petroleum
Completed acquisition of remaining 30% in TL Geohydrographics Sdn Bhd from William
Adam Petrie
Wins RM1bn contract from Bechtel for the process equipment to be used in
Chevron's Wheatstone LNG trains
Completed acquisition of 60% in TL Oilserve Sdn Bhd from Scomi Group Bhd 2012 Completes merger; new entity SapuraKencana listed
Awarded a joint contract by 11 of Petronas’ Production Sharing Contractors for IPF
works worth some RM5bnfor 2010-2012
2010 Took delivery of LTS 3000 and QP 2000
Awarded RSC for Berantai marginal field, with Kencana Petroleum and Petrofac
Acquires Clough Marine in Australia for RM400mn
Wins USD1.4bn Petrobras contract for charter of 3 pipelaying support vessels
Orders 2 new derrick lay vessels from Cosco for USD227mn
Announces merger with Kencana Petroleum
2012 Completes merger; new entity SapuraKencana listed
2002
2010
2011
2009
1992
2001
2003
2004
2007
2005
2007
2008
2005
2006
2006
2011
2008
Debt refinancing exercise with a new USD5.5bn facility
Major gas finds in block SK408; follows Newfield Malaysia's giant gas discovery in SK310 in 2013
2013
2014
SAPURAKENCANA PETROLEUM
Acquired Seadrill's tender rig business for USD2.9bn
Awarded USD2.7bn contract 8-yr charter of 3 pipelaying support vessels to Petrobras
Awarded 3-year RM6.7bn Pan Malaysia transportation and installation umbrella contract with PSC holders
Acquired Newfield's Malaysian E&P business for USD898mn
Source: Company data, Credit Suisse research
1
1 A
ug
us
t 20
14
Sa
pu
raK
en
ca
na P
etro
leu
m B
hd
(SK
PE
.KL / S
AK
P M
K)
11
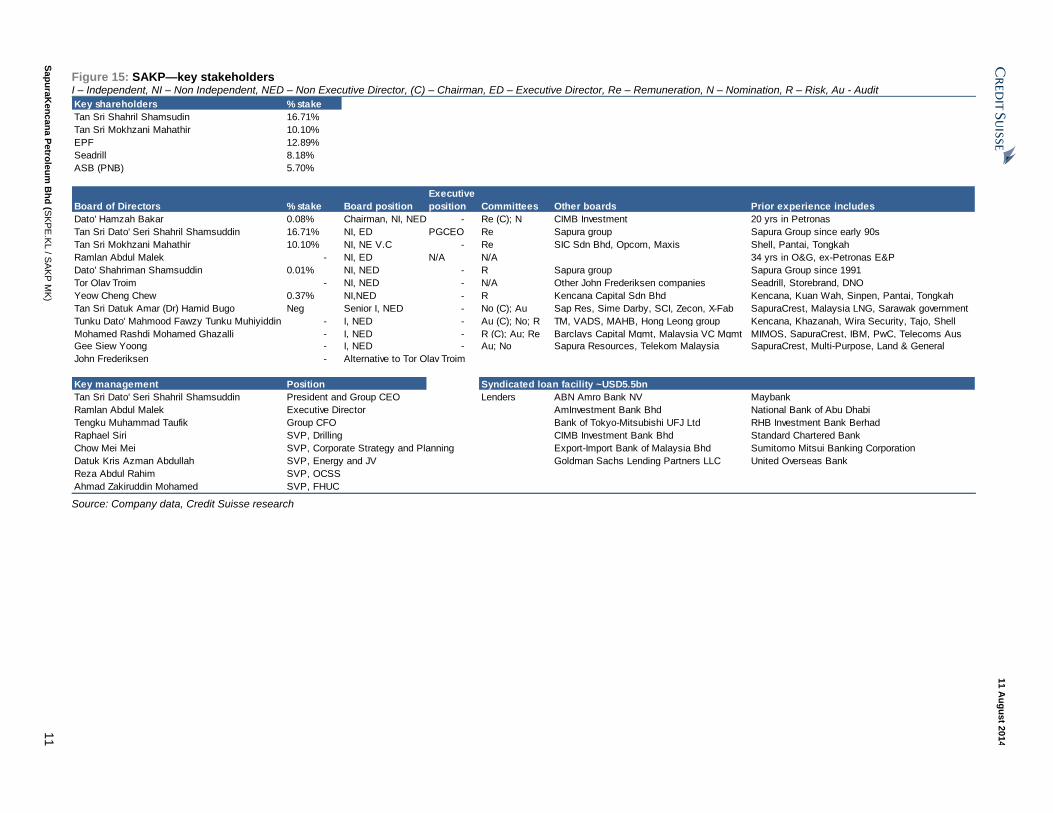
Figure 15: SAKP—key stakeholders I – Independent, NI – Non Independent, NED – Non Executive Director, (C) – Chairman, ED – Executive Director, Re – Remuneration, N – Nomination, R – Risk, Au - Audit
Key shareholders % stake
Tan Sri Shahril Shamsudin 16.71%
Tan Sri Mokhzani Mahathir 10.10%
EPF 12.89%
Seadrill 8.18%
ASB (PNB) 5.70%
Board of Directors % stake Board position
Executive
position Committees Other boards Prior experience includes
Dato' Hamzah Bakar 0.08% Chairman, NI, NED - Re (C); N CIMB Investment 20 yrs in Petronas
Tan Sri Dato' Seri Shahril Shamsuddin 16.71% NI, ED PGCEO Re Sapura group Sapura Group since early 90s
Tan Sri Mokhzani Mahathir 10.10% NI, NE V.C - Re SIC Sdn Bhd, Opcom, Maxis Shell, Pantai, Tongkah
Ramlan Abdul Malek - NI, ED N/A N/A 34 yrs in O&G, ex-Petronas E&P
Dato' Shahriman Shamsuddin 0.01% NI, NED - R Sapura group Sapura Group since 1991
Tor Olav Troim - NI, NED - N/A Other John Frederiksen companies Seadrill, Storebrand, DNO
Yeow Cheng Chew 0.37% NI,NED - R Kencana Capital Sdn Bhd Kencana, Kuan Wah, Sinpen, Pantai, Tongkah
Tan Sri Datuk Amar (Dr) Hamid Bugo Neg Senior I, NED - No (C); Au Sap Res, Sime Darby, SCI, Zecon, X-Fab SapuraCrest, Malaysia LNG, Sarawak government
Tunku Dato' Mahmood Fawzy Tunku Muhiyiddin - I, NED - Au (C); No; R TM, VADS, MAHB, Hong Leong group Kencana, Khazanah, Wira Security, Tajo, Shell
Mohamed Rashdi Mohamed Ghazalli - I, NED - R (C); Au; Re Barclays Capital Mgmt, Malaysia VC Mgmt MIMOS, SapuraCrest, IBM, PwC, Telecoms Aus
Gee Siew Yoong - I, NED - Au; No Sapura Resources, Telekom Malaysia SapuraCrest, Multi-Purpose, Land & General
John Frederiksen - Alternative to Tor Olav Troim
Key management Position Syndicated loan facility ~USD5.5bn
Tan Sri Dato' Seri Shahril Shamsuddin President and Group CEO Lenders ABN Amro Bank NV Maybank
Ramlan Abdul Malek Executive Director AmInvestment Bank Bhd National Bank of Abu Dhabi
Tengku Muhammad Taufik Group CFO Bank of Tokyo-Mitsubishi UFJ Ltd RHB Investment Bank Berhad
Raphael Siri SVP, Drilling CIMB Investment Bank Bhd Standard Chartered Bank
Chow Mei Mei SVP, Corporate Strategy and Planning Export-Import Bank of Malaysia Bhd Sumitomo Mitsui Banking Corporation
Datuk Kris Azman Abdullah SVP, Energy and JV Goldman Sachs Lending Partners LLC United Overseas Bank
Reza Abdul Rahim SVP, OCSS
Ahmad Zakiruddin Mohamed SVP, FHUC Source: Company data, Credit Suisse research
11 August 2014
SapuraKencana Petroleum Bhd (SKPE.KL / SAKP MK) 12
Are there any economic moats? These are the sustainable competitive advantages which will over time produce returns on
capital in excess of returns typically expected on that capital. Moats are not easy to find
and vary in both width and durability, fluctuate with time, and can be eliminated by
competitive destruction (usually in the form of disruptive technology). They result in the
company’s ability to have either strong control over pricing or lower cost (or both) as
compared to peers (more often than not, with some kind of regulatory help). In the case of
SAKP, we believe there is a moderate but growing key economic moat: its intangible
assets (reputation, track record and client relationships). Its possession of hi-spec assets
in the pipe-laying segment and fleet scale in the tender rig segment are also a growing,
though much narrower, economic moat.
Intangible assets: Moderate but growing
Steadily growing track record, reputation, client relationships
Despite its favoured position, SAKP and its precursors (SCRES and KEPB) have not just
relied on protectionism to grow the business; over the past decade, a solid execution track
record with clients has been developed. The most dramatic example of management’s
commitment to clients occurred in 2007. That year, SCRES (mostly involved in OCSS,
back then, plus an offshore drilling JV with Seadrill) incurred its first loss since its takeover
by current SAKP President & CEO Tan Sri Shahril, due to fuel cost volatility and adverse
weather conditions, which had not been sufficiently hedged against. Despite the certainty
of this loss throughout this period (the company lost RM18 mn at the end of the year, after
a profit of RM74 mn the year before), management ensured commitments to clients were
kept. This did not go unnoticed, and TL Offshore (SAKP’s installation subsidiary) has
consistently won the bulk of the Pan-Malaysia installation umbrella contracts since then,
with new contract clauses and ownership of strategic pipe-laying vessels to better control
costs.
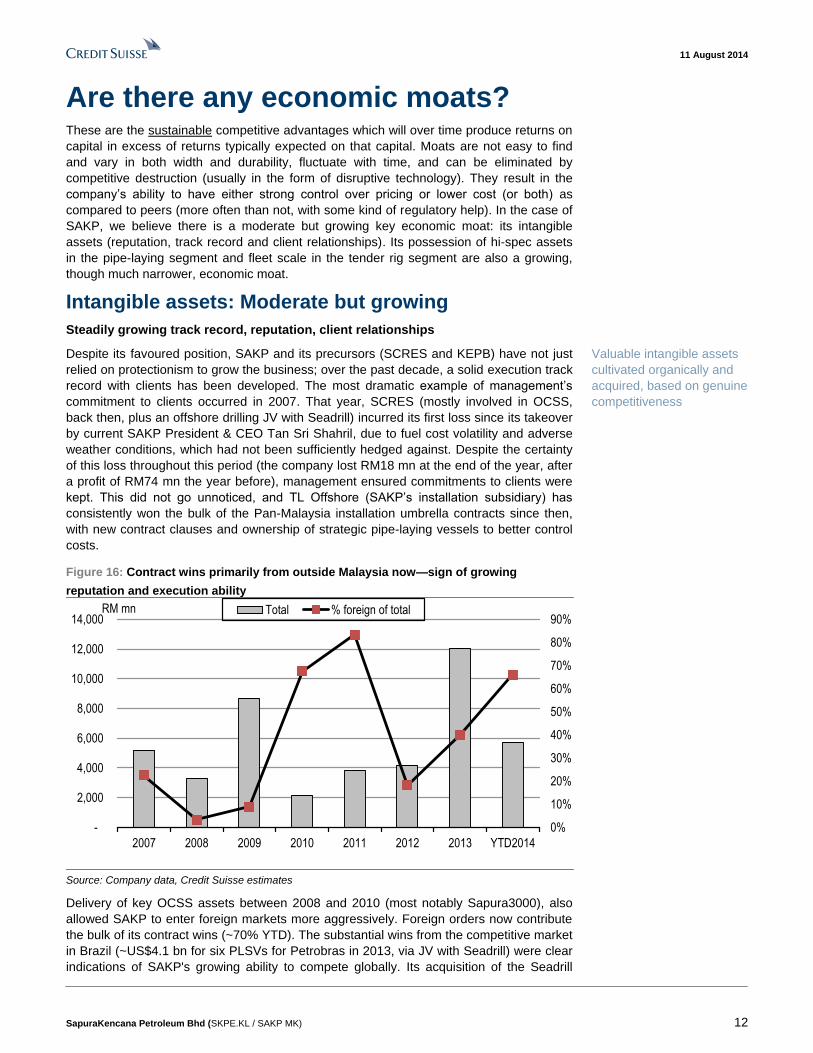
Figure 16: Contract wins primarily from outside Malaysia now—sign of growing
reputation and execution ability
0%
10%
20%
30%
40%
50%
60%
70%
80%
90%
-
2,000
4,000
6,000
8,000
10,000
12,000
14,000
2007 2008 2009 2010 2011 2012 2013 YTD2014
RM mn Total % foreign of total
Source: Company data, Credit Suisse estimates
Delivery of key OCSS assets between 2008 and 2010 (most notably Sapura3000), also
allowed SAKP to enter foreign markets more aggressively. Foreign orders now contribute
the bulk of its contract wins (~70% YTD). The substantial wins from the competitive market
in Brazil (~US$4.1 bn for six PLSVs for Petrobras in 2013, via JV with Seadrill) were clear
indications of SAKP's growing ability to compete globally. Its acquisition of the Seadrill
Valuable intangible assets
cultivated organically and
acquired, based on genuine
competitiveness
11 August 2014
SapuraKencana Petroleum Bhd (SKPE.KL / SAKP MK) 13
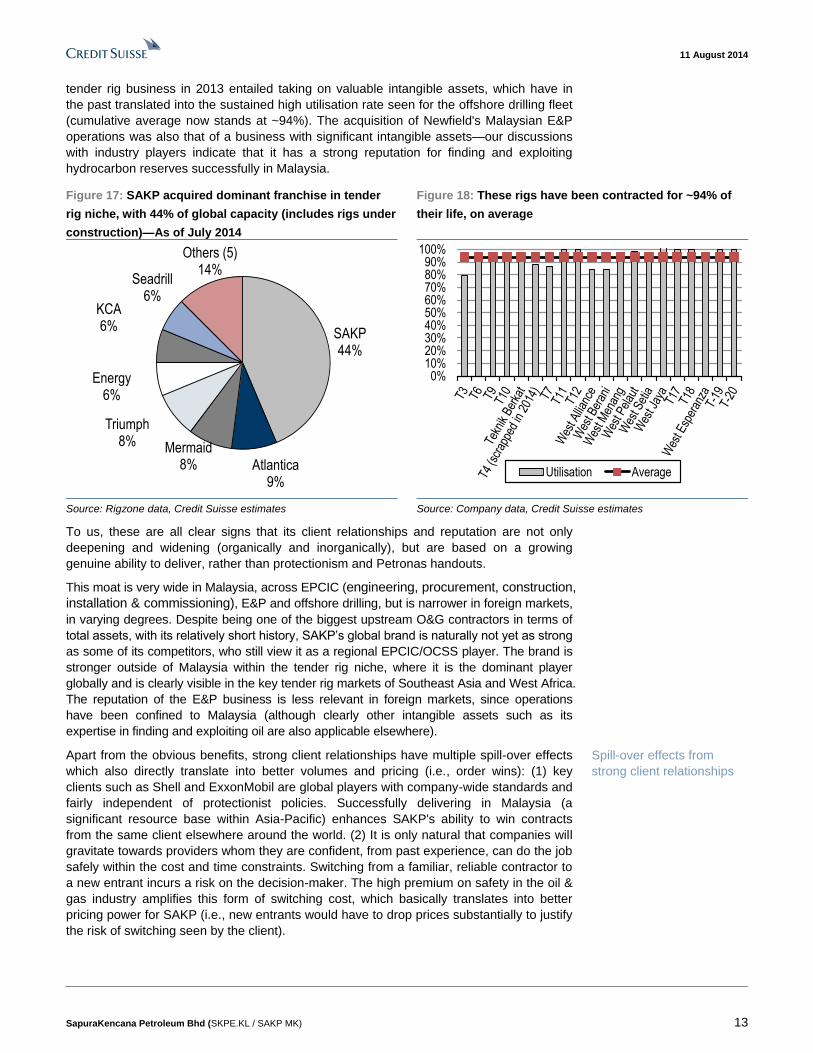
tender rig business in 2013 entailed taking on valuable intangible assets, which have in
the past translated into the sustained high utilisation rate seen for the offshore drilling fleet
(cumulative average now stands at ~94%). The acquisition of Newfield's Malaysian E&P
operations was also that of a business with significant intangible assets—our discussions
with industry players indicate that it has a strong reputation for finding and exploiting
hydrocarbon reserves successfully in Malaysia.
Figure 17: SAKP acquired dominant franchise in tender
rig niche, with 44% of global capacity (includes rigs under
construction)—As of July 2014
Figure 18: These rigs have been contracted for ~94% of
their life, on average
SAKP44%
Atlantica9%
Mermaid8%
Triumph8%
Energy6%
KCA6%
Seadrill6%
Others (5)14%
0%10%20%30%40%50%60%70%80%90%
100%
Utilisation Average
Source: Rigzone data, Credit Suisse estimates Source: Company data, Credit Suisse estimates
To us, these are all clear signs that its client relationships and reputation are not only
deepening and widening (organically and inorganically), but are based on a growing
genuine ability to deliver, rather than protectionism and Petronas handouts.
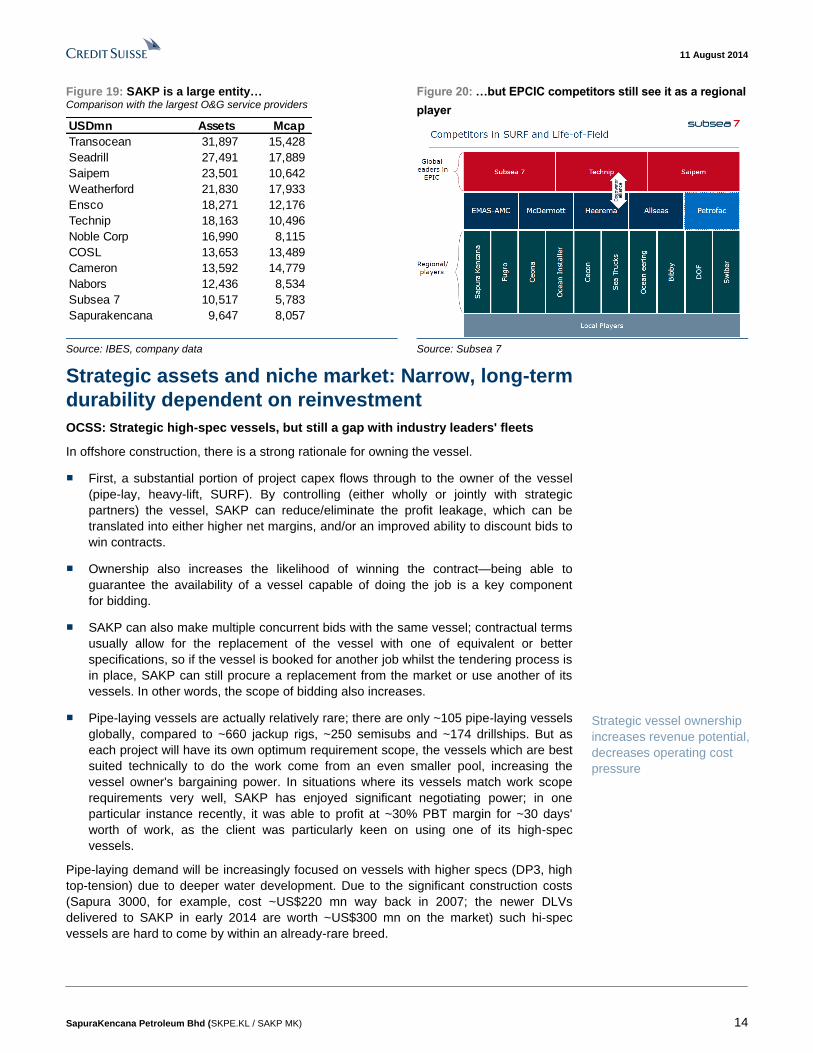
This moat is very wide in Malaysia, across EPCIC (engineering, procurement, construction,
installation & commissioning), E&P and offshore drilling, but is narrower in foreign markets,
in varying degrees. Despite being one of the biggest upstream O&G contractors in terms of
total assets, with its relatively short history, SAKP’s global brand is naturally not yet as strong
as some of its competitors, who still view it as a regional EPCIC/OCSS player. The brand is
stronger outside of Malaysia within the tender rig niche, where it is the dominant player
globally and is clearly visible in the key tender rig markets of Southeast Asia and West Africa.
The reputation of the E&P business is less relevant in foreign markets, since operations
have been confined to Malaysia (although clearly other intangible assets such as its
expertise in finding and exploiting oil are also applicable elsewhere).
Apart from the obvious benefits, strong client relationships have multiple spill-over effects
which also directly translate into better volumes and pricing (i.e., order wins): (1) key
clients such as Shell and ExxonMobil are global players with company-wide standards and
fairly independent of protectionist policies. Successfully delivering in Malaysia (a
significant resource base within Asia-Pacific) enhances SAKP's ability to win contracts
from the same client elsewhere around the world. (2) It is only natural that companies will
gravitate towards providers whom they are confident, from past experience, can do the job
safely within the cost and time constraints. Switching from a familiar, reliable contractor to
a new entrant incurs a risk on the decision-maker. The high premium on safety in the oil &
gas industry amplifies this form of switching cost, which basically translates into better
pricing power for SAKP (i.e., new entrants would have to drop prices substantially to justify
the risk of switching seen by the client).
Spill-over effects from
strong client relationships
11 August 2014
SapuraKencana Petroleum Bhd (SKPE.KL / SAKP MK) 14
Figure 19: SAKP is a large entity… Comparison with the largest O&G service providers
Figure 20: …but EPCIC competitors still see it as a regional
player
USDmn Assets Mcap
Transocean 31,897 15,428
Seadrill 27,491 17,889
Saipem 23,501 10,642
Weatherford 21,830 17,933
Ensco 18,271 12,176
Technip 18,163 10,496
Noble Corp 16,990 8,115
COSL 13,653 13,489
Cameron 13,592 14,779
Nabors 12,436 8,534
Subsea 7 10,517 5,783
Sapurakencana 9,647 8,057
Source: IBES, company data Source: Subsea 7
Strategic assets and niche market: Narrow, long-term
durability dependent on reinvestment
OCSS: Strategic high-spec vessels, but still a gap with industry leaders' fleets
In offshore construction, there is a strong rationale for owning the vessel.
■ First, a substantial portion of project capex flows through to the owner of the vessel
(pipe-lay, heavy-lift, SURF). By controlling (either wholly or jointly with strategic
partners) the vessel, SAKP can reduce/eliminate the profit leakage, which can be
translated into either higher net margins, and/or an improved ability to discount bids to
win contracts.
■ Ownership also increases the likelihood of winning the contract—being able to
guarantee the availability of a vessel capable of doing the job is a key component
for bidding.
■ SAKP can also make multiple concurrent bids with the same vessel; contractual terms
usually allow for the replacement of the vessel with one of equivalent or better
specifications, so if the vessel is booked for another job whilst the tendering process is
in place, SAKP can still procure a replacement from the market or use another of its
vessels. In other words, the scope of bidding also increases.
■ Pipe-laying vessels are actually relatively rare; there are only ~105 pipe-laying vessels
globally, compared to ~660 jackup rigs, ~250 semisubs and ~174 drillships. But as
each project will have its own optimum requirement scope, the vessels which are best
suited technically to do the work come from an even smaller pool, increasing the
vessel owner's bargaining power. In situations where its vessels match work scope
requirements very well, SAKP has enjoyed significant negotiating power; in one
particular instance recently, it was able to profit at ~30% PBT margin for ~30 days'
worth of work, as the client was particularly keen on using one of its high-spec
vessels.
Pipe-laying demand will be increasingly focused on vessels with higher specs (DP3, high
top-tension) due to deeper water development. Due to the significant construction costs
(Sapura 3000, for example, cost ~US$220 mn way back in 2007; the newer DLVs
delivered to SAKP in early 2014 are worth ~US$300 mn on the market) such hi-spec
vessels are hard to come by within an already-rare breed.
Strategic vessel ownership
increases revenue potential,
decreases operating cost
pressure
11 August 2014
SapuraKencana Petroleum Bhd (SKPE.KL / SAKP MK) 15
Vessels which are more flexible in work scope (i.e. capable of doing several types of jobs)
are also strategic, allowing owners a greater ability to maximise utilisation; the flipside is
that these tend to require a larger capital investment upfront.
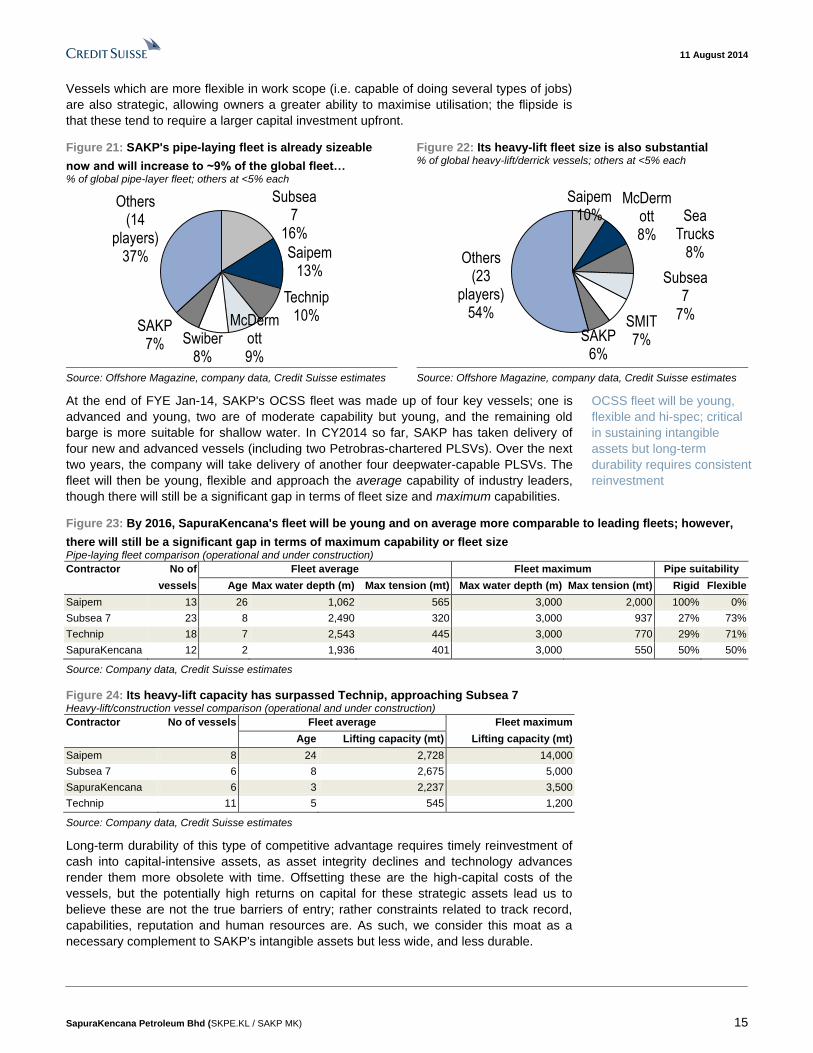
Figure 21: SAKP's pipe-laying fleet is already sizeable
now and will increase to ~9% of the global fleet… % of global pipe-layer fleet; others at <5% each
Figure 22: Its heavy-lift fleet size is also substantial % of global heavy-lift/derrick vessels; others at <5% each
Subsea 7
16%
Saipem13%
Technip10%McDerm
ott9%
Swiber 8%
SAKP7%
Others (14
players)37%
Saipem10%
McDermott8%
Sea Trucks
8%
Subsea 7
7%SMIT7%SAKP
6%
Others (23
players)54%
Source: Offshore Magazine, company data, Credit Suisse estimates Source: Offshore Magazine, company data, Credit Suisse estimates
At the end of FYE Jan-14, SAKP's OCSS fleet was made up of four key vessels; one is
advanced and young, two are of moderate capability but young, and the remaining old
barge is more suitable for shallow water. In CY2014 so far, SAKP has taken delivery of
four new and advanced vessels (including two Petrobras-chartered PLSVs). Over the next
two years, the company will take delivery of another four deepwater-capable PLSVs. The
fleet will then be young, flexible and approach the average capability of industry leaders,
though there will still be a significant gap in terms of fleet size and maximum capabilities.
Figure 23: By 2016, SapuraKencana's fleet will be young and on average more comparable to leading fleets; however,
there will still be a significant gap in terms of maximum capability or fleet size Pipe-laying fleet comparison (operational and under construction)
Contractor No of Fleet average Fleet maximum Pipe suitability
vessels Age Max water depth (m) Max tension (mt) Max water depth (m) Max tension (mt) Rigid Flexible
Saipem 13 26 1,062 565 3,000 2,000 100% 0%
Subsea 7 23 8 2,490 320 3,000 937 27% 73%
Technip 18 7 2,543 445 3,000 770 29% 71%
SapuraKencana 12 2 1,936 401 3,000 550 50% 50%
Source: Company data, Credit Suisse estimates
Figure 24: Its heavy-lift capacity has surpassed Technip, approaching Subsea 7 Heavy-lift/construction vessel comparison (operational and under construction)
Contractor No of vessels Fleet average Fleet maximum
Age Lifting capacity (mt) Lifting capacity (mt)
Saipem 8 24 2,728 14,000
Subsea 7 6 8 2,675 5,000
SapuraKencana 6 3 2,237 3,500
Technip 11 5 545 1,200
Source: Company data, Credit Suisse estimates
Long-term durability of this type of competitive advantage requires timely reinvestment of
cash into capital-intensive assets, as asset integrity declines and technology advances
render them more obsolete with time. Offsetting these are the high-capital costs of the
vessels, but the potentially high returns on capital for these strategic assets lead us to
believe these are not the true barriers of entry; rather constraints related to track record,
capabilities, reputation and human resources are. As such, we consider this moat as a
necessary complement to SAKP's intangible assets but less wide, and less durable.
OCSS fleet will be young,
flexible and hi-spec; critical
in sustaining intangible
assets but long-term
durability requires consistent
reinvestment
11 August 2014
SapuraKencana Petroleum Bhd (SKPE.KL / SAKP MK) 16
Tender rigs: niche with decent prospects, but deeper water evolution unavoidable
In offshore drilling (~50% of earnings), SAKP specialises specifically in tender rigs—these
house the equipment and manpower in a separate hull and requires the transportation of
the drilling package onto a production platform, which eliminates the concept as a feasible
alternative in hydrocarbon exploration, but does provide for a cost-effective alternative in
development drilling compared to jackups, semisubs and platform rigs (drilling packages
integrated into the production platform).
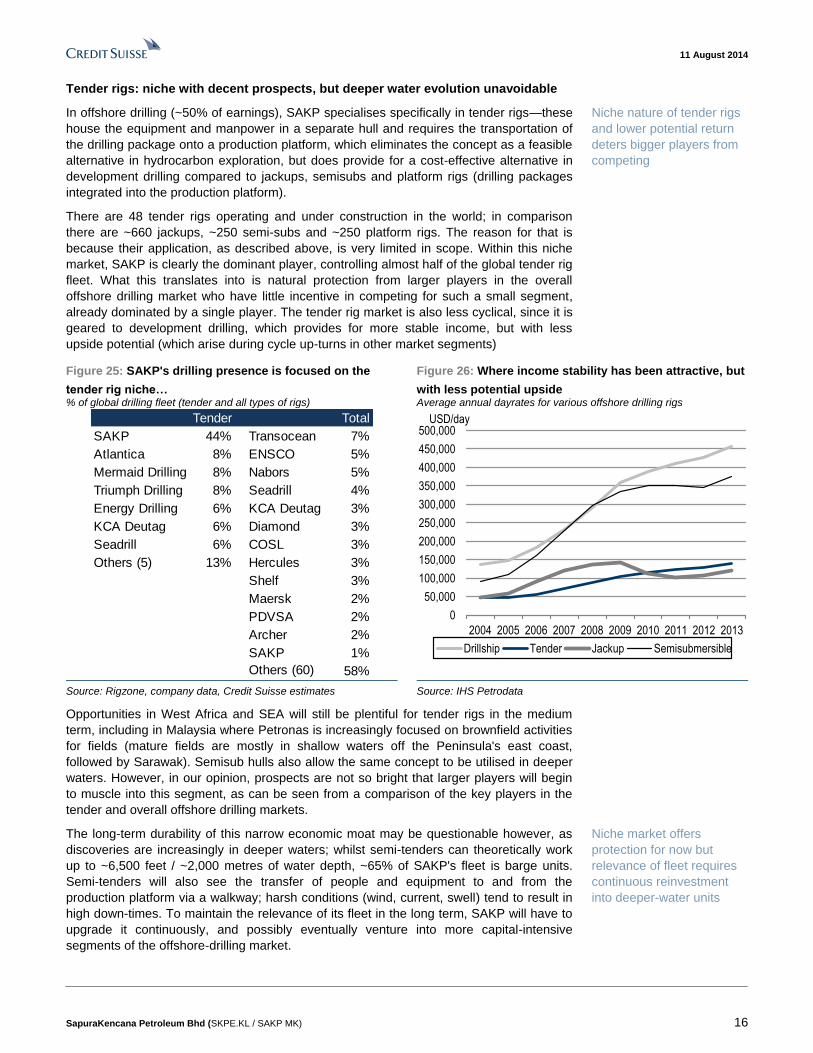
There are 48 tender rigs operating and under construction in the world; in comparison
there are ~660 jackups, ~250 semi-subs and ~250 platform rigs. The reason for that is
because their application, as described above, is very limited in scope. Within this niche
market, SAKP is clearly the dominant player, controlling almost half of the global tender rig
fleet. What this translates into is natural protection from larger players in the overall
offshore drilling market who have little incentive in competing for such a small segment,
already dominated by a single player. The tender rig market is also less cyclical, since it is
geared to development drilling, which provides for more stable income, but with less
upside potential (which arise during cycle up-turns in other market segments)
Figure 25: SAKP's drilling presence is focused on the
tender rig niche… % of global drilling fleet (tender and all types of rigs)
Figure 26: Where income stability has been attractive, but
with less potential upside Average annual dayrates for various offshore drilling rigs
Tender Total
SAKP 44% Transocean 7%
Atlantica 8% ENSCO 5%
Mermaid Drilling 8% Nabors 5%
Triumph Drilling 8% Seadrill 4%
Energy Drilling 6% KCA Deutag 3%
KCA Deutag 6% Diamond 3%
Seadrill 6% COSL 3%
Others (5) 13% Hercules 3%
Shelf 3%
Maersk 2%
PDVSA 2%
Archer 2%
SAKP 1%
Others (60) 58%
0
50,000
100,000
150,000
200,000
250,000
300,000
350,000
400,000
450,000
500,000
2004 2005 2006 2007 2008 2009 2010 2011 2012 2013
USD/day
Drillship Tender Jackup Semisubmersible
Source: Rigzone, company data, Credit Suisse estimates Source: IHS Petrodata
Opportunities in West Africa and SEA will still be plentiful for tender rigs in the medium
term, including in Malaysia where Petronas is increasingly focused on brownfield activities
for fields (mature fields are mostly in shallow waters off the Peninsula's east coast,
followed by Sarawak). Semisub hulls also allow the same concept to be utilised in deeper
waters. However, in our opinion, prospects are not so bright that larger players will begin
to muscle into this segment, as can be seen from a comparison of the key players in the
tender and overall offshore drilling markets.
The long-term durability of this narrow economic moat may be questionable however, as
discoveries are increasingly in deeper waters; whilst semi-tenders can theoretically work
up to ~6,500 feet / ~2,000 metres of water depth, ~65% of SAKP's fleet is barge units.
Semi-tenders will also see the transfer of people and equipment to and from the
production platform via a walkway; harsh conditions (wind, current, swell) tend to result in
high down-times. To maintain the relevance of its fleet in the long term, SAKP will have to
upgrade it continuously, and possibly eventually venture into more capital-intensive
segments of the offshore-drilling market.
Niche nature of tender rigs
and lower potential return
deters bigger players from
competing
Niche market offers
protection for now but
relevance of fleet requires
continuous reinvestment
into deeper-water units
11 August 2014
SapuraKencana Petroleum Bhd (SKPE.KL / SAKP MK) 17
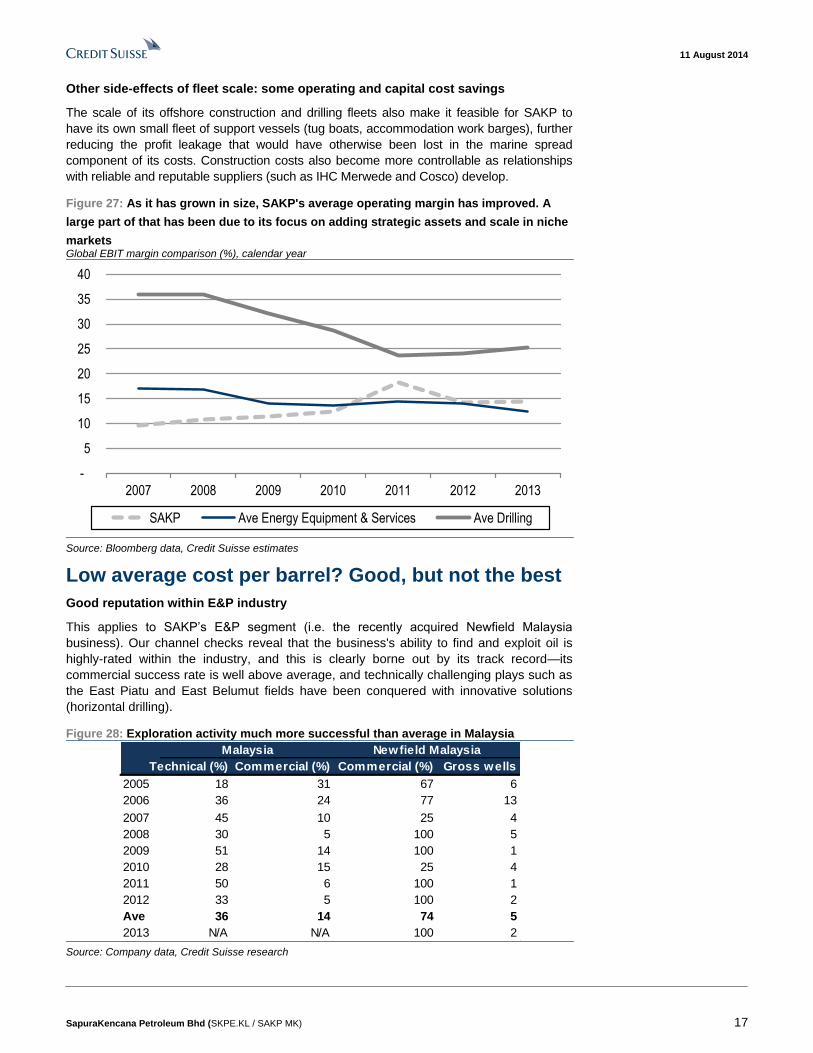
Other side-effects of fleet scale: some operating and capital cost savings
The scale of its offshore construction and drilling fleets also make it feasible for SAKP to
have its own small fleet of support vessels (tug boats, accommodation work barges), further
reducing the profit leakage that would have otherwise been lost in the marine spread
component of its costs. Construction costs also become more controllable as relationships
with reliable and reputable suppliers (such as IHC Merwede and Cosco) develop.
Figure 27: As it has grown in size, SAKP's average operating margin has improved. A
large part of that has been due to its focus on adding strategic assets and scale in niche
markets Global EBIT margin comparison (%), calendar year
-
5
10
15
20
25
30
35
40
2007 2008 2009 2010 2011 2012 2013
SAKP Ave Energy Equipment & Services Ave Drilling
Source: Bloomberg data, Credit Suisse estimates
Low average cost per barrel? Good, but not the best
Good reputation within E&P industry
This applies to SAKP’s E&P segment (i.e. the recently acquired Newfield Malaysia
business). Our channel checks reveal that the business's ability to find and exploit oil is
highly-rated within the industry, and this is clearly borne out by its track record—its
commercial success rate is well above average, and technically challenging plays such as
the East Piatu and East Belumut fields have been conquered with innovative solutions
(horizontal drilling).
Figure 28: Exploration activity much more successful than average in Malaysia
Technical (%) Commercial (%) Commercial (%) Gross wells
2005 18 31 67 6
2006 36 24 77 13
2007 45 10 25 4
2008 30 5 100 5
2009 51 14 100 1
2010 28 15 25 4
2011 50 6 100 1
2012 33 5 100 2
Ave 36 14 74 5
2013 N/A N/A 100 2
Malaysia Newfield Malaysia
Source: Company data, Credit Suisse research
11 August 2014
SapuraKencana Petroleum Bhd (SKPE.KL / SAKP MK) 18
Figure 29: Exploration success also stacks up well versus reputable peers in Asia Talisman data includes Vietnam for a few years
SAKP Murphy Talisman Shell Exxon Chevron Total BP Ave
2006 73 66 57 61 83 88 na 50 71
2007 61 71 54 51 67 75 98 42 67
2008 69 60 22 58 63 70 81 52 65
2009 63 51 11 70 43 72 76 37 60
2010 57 65 22 64 29 74 66 43 55
2011 37 85 70 34 20 77 53 50 47
2012 24 87 100 21 25 75 55 66 49
2013 67 82 81 9 36 81 39 73 48
Net productive exploratory w ells / Total net exploratory w ells (3 year rolling)
AsiaMalaysia
Source: Company data, Credit Suisse estimates
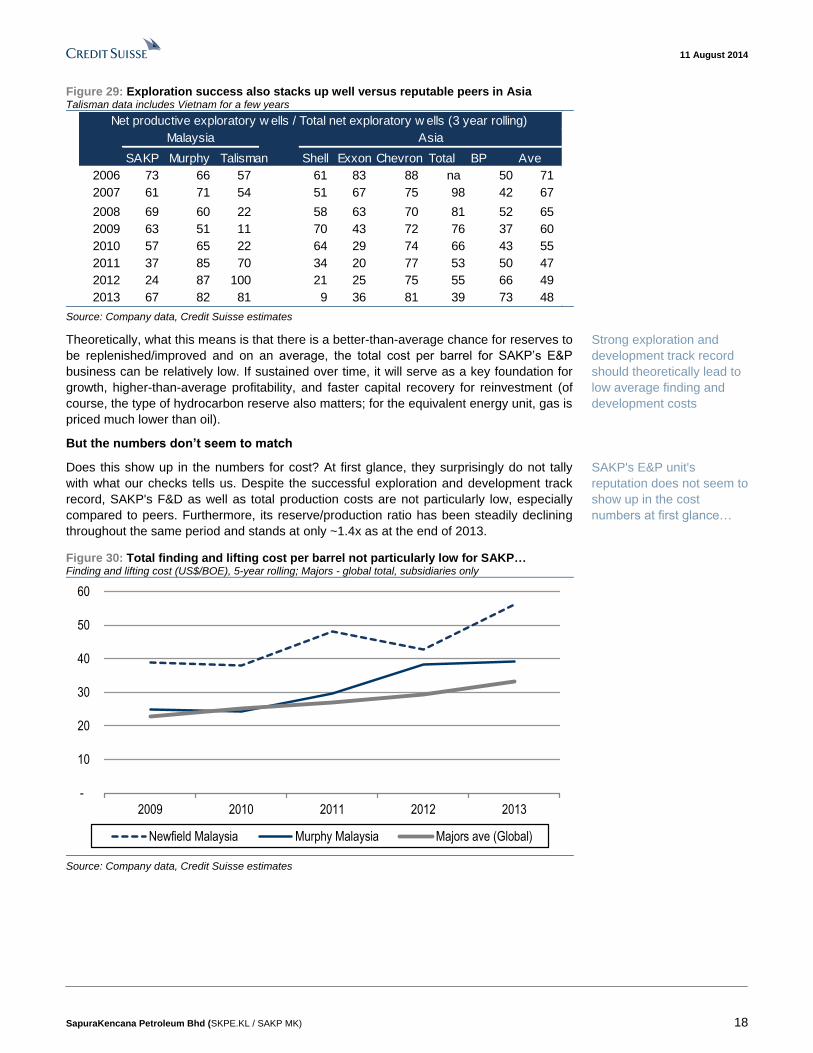
Theoretically, what this means is that there is a better-than-average chance for reserves to
be replenished/improved and on an average, the total cost per barrel for SAKP’s E&P
business can be relatively low. If sustained over time, it will serve as a key foundation for
growth, higher-than-average profitability, and faster capital recovery for reinvestment (of
course, the type of hydrocarbon reserve also matters; for the equivalent energy unit, gas is
priced much lower than oil).
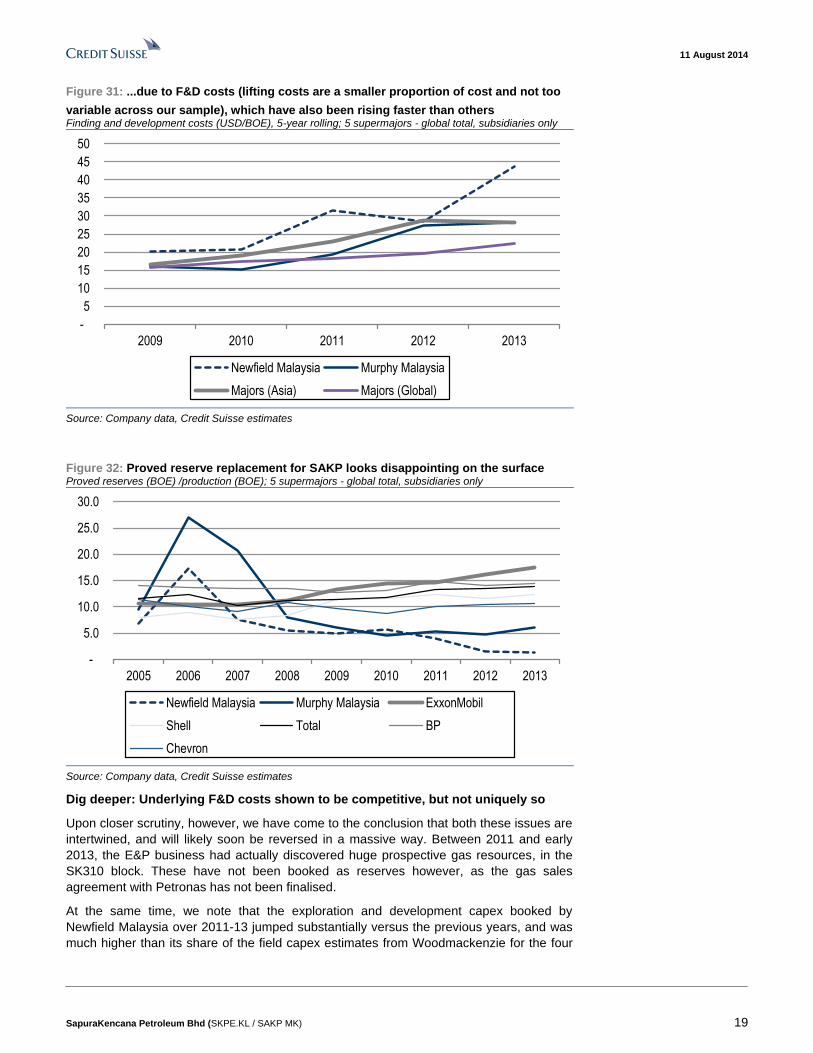
But the numbers don’t seem to match
Does this show up in the numbers for cost? At first glance, they surprisingly do not tally
with what our checks tells us. Despite the successful exploration and development track
record, SAKP's F&D as well as total production costs are not particularly low, especially
compared to peers. Furthermore, its reserve/production ratio has been steadily declining
throughout the same period and stands at only ~1.4x as at the end of 2013.
Figure 30: Total finding and lifting cost per barrel not particularly low for SAKP… Finding and lifting cost (US$/BOE), 5-year rolling; Majors - global total, subsidiaries only
-
10
20
30
40
50
60
2009 2010 2011 2012 2013
Newfield Malaysia Murphy Malaysia Majors ave (Global)
Source: Company data, Credit Suisse estimates
Strong exploration and
development track record
should theoretically lead to
low average finding and
development costs
SAKP's E&P unit's
reputation does not seem to
show up in the cost
numbers at first glance…
11 August 2014
SapuraKencana Petroleum Bhd (SKPE.KL / SAKP MK) 19
Figure 31: ...due to F&D costs (lifting costs are a smaller proportion of cost and not too
variable across our sample), which have also been rising faster than others Finding and development costs (USD/BOE), 5-year rolling; 5 supermajors - global total, subsidiaries only
-
5
10
15
20
25
30
35
40
45
50
2009 2010 2011 2012 2013
Newfield Malaysia Murphy Malaysia
Majors (Asia) Majors (Global)
Source: Company data, Credit Suisse estimates
Figure 32: Proved reserve replacement for SAKP looks disappointing on the surface Proved reserves (BOE) /production (BOE); 5 supermajors - global total, subsidiaries only
-
5.0
10.0
15.0
20.0
25.0
30.0
2005 2006 2007 2008 2009 2010 2011 2012 2013
Newfield Malaysia Murphy Malaysia ExxonMobil
Shell Total BP
Chevron
Source: Company data, Credit Suisse estimates
Dig deeper: Underlying F&D costs shown to be competitive, but not uniquely so
Upon closer scrutiny, however, we have come to the conclusion that both these issues are
intertwined, and will likely soon be reversed in a massive way. Between 2011 and early
2013, the E&P business had actually discovered huge prospective gas resources, in the
SK310 block. These have not been booked as reserves however, as the gas sales
agreement with Petronas has not been finalised.
At the same time, we note that the exploration and development capex booked by
Newfield Malaysia over 2011-13 jumped substantially versus the previous years, and was
much higher than its share of the field capex estimates from Woodmackenzie for the four
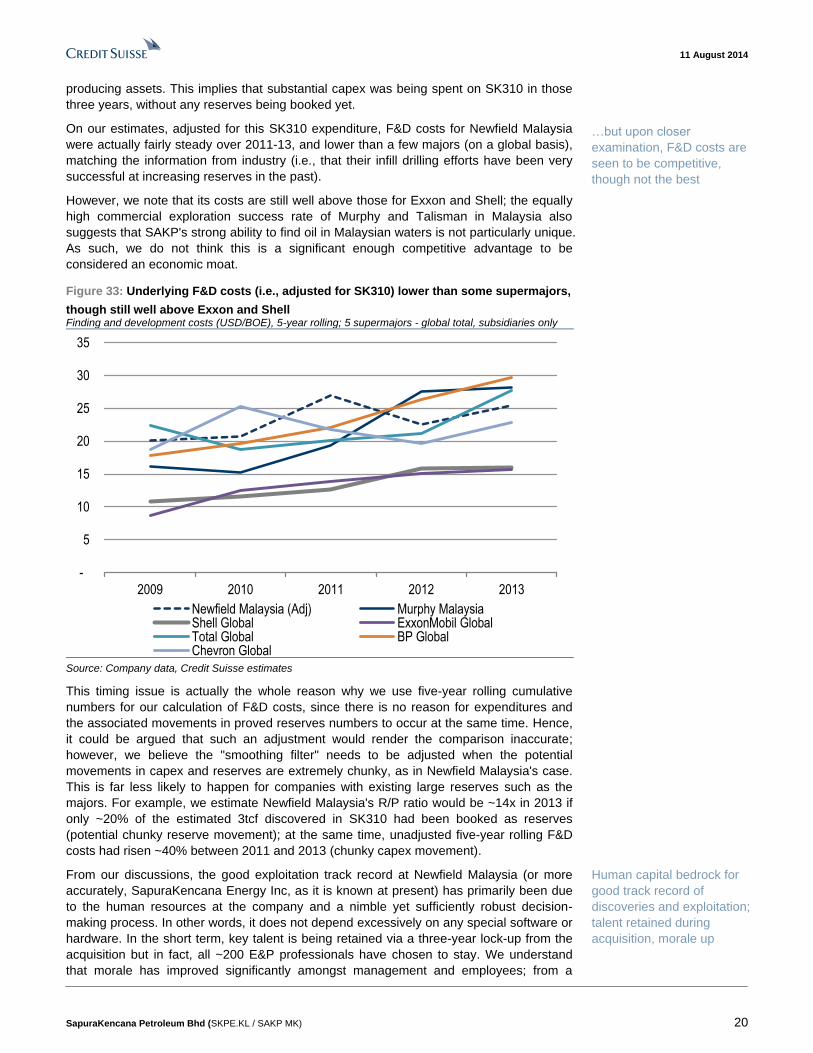
11 August 2014
SapuraKencana Petroleum Bhd (SKPE.KL / SAKP MK) 20
producing assets. This implies that substantial capex was being spent on SK310 in those
three years, without any reserves being booked yet.
On our estimates, adjusted for this SK310 expenditure, F&D costs for Newfield Malaysia
were actually fairly steady over 2011-13, and lower than a few majors (on a global basis),
matching the information from industry (i.e., that their infill drilling efforts have been very
successful at increasing reserves in the past).
However, we note that its costs are still well above those for Exxon and Shell; the equally
high commercial exploration success rate of Murphy and Talisman in Malaysia also
suggests that SAKP's strong ability to find oil in Malaysian waters is not particularly unique.
As such, we do not think this is a significant enough competitive advantage to be
considered an economic moat.
Figure 33: Underlying F&D costs (i.e., adjusted for SK310) lower than some supermajors,
though still well above Exxon and Shell Finding and development costs (USD/BOE), 5-year rolling; 5 supermajors - global total, subsidiaries only
-
5
10
15
20
25
30
35
2009 2010 2011 2012 2013
Newfield Malaysia (Adj) Murphy MalaysiaShell Global ExxonMobil GlobalTotal Global BP GlobalChevron Global
Source: Company data, Credit Suisse estimates
This timing issue is actually the whole reason why we use five-year rolling cumulative
numbers for our calculation of F&D costs, since there is no reason for expenditures and
the associated movements in proved reserves numbers to occur at the same time. Hence,
it could be argued that such an adjustment would render the comparison inaccurate;
however, we believe the "smoothing filter" needs to be adjusted when the potential
movements in capex and reserves are extremely chunky, as in Newfield Malaysia's case.
This is far less likely to happen for companies with existing large reserves such as the
majors. For example, we estimate Newfield Malaysia's R/P ratio would be ~14x in 2013 if
only ~20% of the estimated 3tcf discovered in SK310 had been booked as reserves
(potential chunky reserve movement); at the same time, unadjusted five-year rolling F&D
costs had risen ~40% between 2011 and 2013 (chunky capex movement).
From our discussions, the good exploitation track record at Newfield Malaysia (or more
accurately, SapuraKencana Energy Inc, as it is known at present) has primarily been due
to the human resources at the company and a nimble yet sufficiently robust decision-
making process. In other words, it does not depend excessively on any special software or
hardware. In the short term, key talent is being retained via a three-year lock-up from the
acquisition but in fact, all ~200 E&P professionals have chosen to stay. We understand
that morale has improved significantly amongst management and employees; from a
…but upon closer
examination, F&D costs are
seen to be competitive,
though not the best
Human capital bedrock for
good track record of
discoveries and exploitation;
talent retained during
acquisition, morale up
11 August 2014
SapuraKencana Petroleum Bhd (SKPE.KL / SAKP MK) 21
business that was expected to simply pay out cash to its US parent, management is now
dealing with a shareholder keen on having them grow the business.
We take comfort in SAKP management’s success in talent retention in previous
acquisitions (Seadrill tender rigs: 2,000 professionals; Clough: 100). Equally as importantly,
SAKP's top management has made it clear that the E&P business will be allowed to
operate on a standalone basis, with as little intervention from the group as possible. The
only addition to the E&P management team has been a financial controller who will focus
on the overall Group's interests. Furthermore, an attractive shadow share option scheme
is in place to align the financial interests of SapuraKencana Energy's management with
the Group's shareholders.
Regulatory protection? Not so relevant anymore
Oil & gas activity is usually highly regulated; in Malaysia, all upstream activity is governed
by Petronas, which is appointed the sole custodian of Malaysia’s oil & gas resources. All
services and goods must be procured from licensees. Due to the strategic importance of
the sector, and the obvious benefits of pro-domestic policy, there is also a requirement for
substantial local content/equity across the industry: the cabotage policy, bumiputera
vendor programme, and bumiputera equity requirement are examples of this. This facet of
protection will likely endure in Malaysia, making it easier for SAKP to continue winning
contracts domestically and expand vertically in its key market, since it has developed a
strong working relationship with Petronas, and is controlled by bumiputera shareholders.
Whilst this protection does not extend beyond Malaysia, a strong home base will continue
to provide a firm experiential and financial platform from which SAKP can keep venturing
into other markets overseas.
However, despite our belief that it is highly unlikely that this form of protection will reverse
completely, there are already clear signs that it is being slowly relaxed. And even amongst
those enjoying this protection, a greater degree of competition is being fostered. For
example, in the Pan Malaysia T&I (Transport and Installation) contract award for 2010-12,
SAKP bagged almost all of the packages available; only one small package was awarded
to Global Offshore Malaysia (GOM). In the latest round however, for 2014-16, SAKP still
grabbed the lion's share, but a greater proportion of the work was awarded to two other
domestic competitors (GOM and Barakah Offshore Petroleum). As for engineering and
construction, MMHE (the largest fabrication yard in Malaysia, and a subsidiary of
Petronas) has been finding it hard to win jobs. To a large part this has been the result of
stronger competition seen in contracts tendered out in Malaysia, where foreign players
have been allowed in; projects previously deemed to be "for Malaysians only" were
opened up, resulting in the trend of lower margins seen across the board.
As such, we believe this factor is not durable or strong enough to be considered an
economic moat; furthermore, the considerations that go into license award are not readily
clear, and the potential for manipulation in a tightly-regulated sector is always there. In any
case, SAKP's increasingly foreign exposure makes this less relevant with time.
11 August 2014
SapuraKencana Petroleum Bhd (SKPE.KL / SAKP MK) 22
Where can things go wrong? We tried our best to look for reasons to avoid investing in SAKP, but found most of the
risks well-mitigated. Management concentration and the very high importance of one
particular individual (CEO) to the organisation is something investors should take note of,
although we are not quite sure how this can ever be mitigated. SAKP's debt maturity
profile, a source of concern in prior years, has improved substantially; combined with
progress on its newbuild programme, we see a stronger cash flow profile in the near future,
though in a very bearish scenario (zero order wins, no capex deferral, high dividends in
FY15-FY16), cash flow coverage for the chunky debt maturity in FY17 is not watertight. In
the near-term, despite the de-rating already seen, the stock could face further selling
pressure ahead of its removal from the SC's Shariah compliant list in November.
Is SAKP’s top line growth potential saturated?
Mixed growth potential across EPCIC and drilling markets
A common concern is: after acquisition-fuelled growth, is SAKP's growth potential gone?
We believe growth prospects in EPCIC and drilling are still decent for SAKP. Based on
Woodmackenzie data, we estimate SAKP's existing key offshore construction and
fabrication markets will continue expanding by ~14% in aggregate in 2014-16 (vs 2011-13),
but at much higher rates for certain regions compared to others. SAKP is well placed to
benefit from this; its key OCSS vessels will grow from 5 to 13 by 2016, mostly in Brazil,
where growth is strong. In Malaysia and SEA, where SAKP is dominant, spending will not
surge upwards (we expect annual Malaysian capex to either stagnate or decline from
2013's peak), but aggregate spending in 2014-16 will be similar to 2011-13; the Pan-
Malaysian T&I contract also affords the company significant protection on this front.
For offshore development drilling, Woodmackenzie data suggests SEA will continue to see
similar levels of aggregate spend in 2014-16 (as 2011-13), whilst West Africa will see
higher growth. At the same time, however, SAKP's fleet is unlikely to grow substantially
over the next few years, suggesting its tender rig assets will continue to be well utilised.
Figure 34: Relevant offshore EPCIC capex in existing key* markets for SAKP
US$ mn 2005-07 2008-10 2011-13 2014-16 % growth
Australia–OCSS 2,884 6,794 15,885 14,047 -12%
Brazil–OCSS 6,098 10,951 11,113 19,614 77%
India–OCSS 639 334 150 1,097 631%
Malaysia–EPCIC 5,400 6,814 11,219 11,640 4%
Other SEA–EPCIC 11,075 12,855 15,434 14,840 -4%
Total 26,097 37,748 53,800 61,238 14%
* Sizeable in current order book. Source: Woodmackenzie data, Credit Suisse estimates
Figure 35: Offshore development drilling capex in existing key* markets for SAKP
US$ mn 2005-07 2008-10 2011-13 2014-16 % growth
Malaysia 3,092 4,697 8,209 8,465 3%
Other SEA 7,630 12,470 14,736 15,227 3%
Africa 12,804 18,705 22,896 24,400 7%
Trinidad & Tobago 1,434 1,134 1,493 2,089 40%
Total 24,960 37,006 47,335 50,181 6%
* Sizeable in current order book; only countries SAKP already present is included in Africa
Source: Woodmackenzie data, Credit Suisse research
SAKP has also demonstrated its ability to successfully penetrate new geographies and
segments both organically and inorganically. Recently, it entered the Chinese and Russian
markets for T&I (transportation & installation). In 2012, SAKP had entered the US Gulf of
Mexico via the SapuraAcergy JV with Subsea 7; coupled with the liberalisation of Mexico's
O&G industry, the Gulf of Mexico should be a more interesting prospect considering its
Decent growth opportunities
for SAKP in existing
OCSS/EPCIC markets...
Less so in offshore drilling,
though assets should still be
well utilised
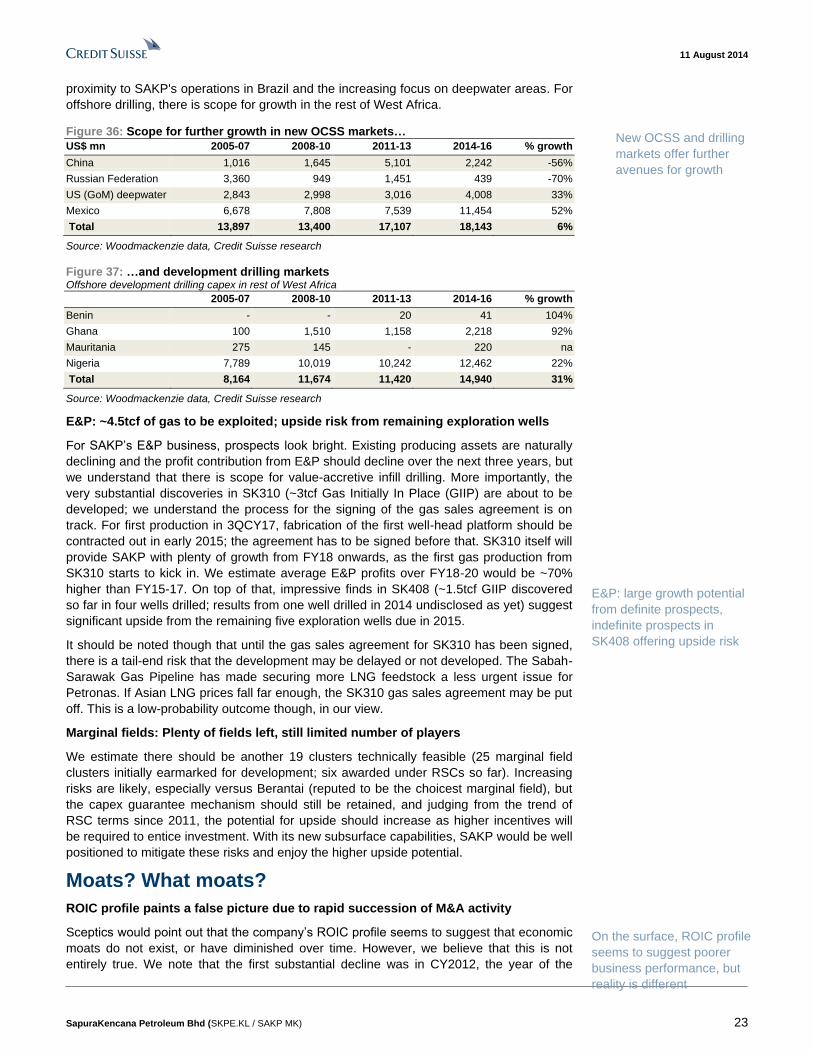
11 August 2014
SapuraKencana Petroleum Bhd (SKPE.KL / SAKP MK) 23
proximity to SAKP's operations in Brazil and the increasing focus on deepwater areas. For
offshore drilling, there is scope for growth in the rest of West Africa.
Figure 36: Scope for further growth in new OCSS markets…
US$ mn 2005-07 2008-10 2011-13 2014-16 % growth
China 1,016 1,645 5,101 2,242 -56%
Russian Federation 3,360 949 1,451 439 -70%
US (GoM) deepwater 2,843 2,998 3,016 4,008 33%
Mexico 6,678 7,808 7,539 11,454 52%
Total 13,897 13,400 17,107 18,143 6%
Source: Woodmackenzie data, Credit Suisse research
Figure 37: …and development drilling markets Offshore development drilling capex in rest of West Africa
2005-07 2008-10 2011-13 2014-16 % growth
Benin - - 20 41 104%
Ghana 100 1,510 1,158 2,218 92%
Mauritania 275 145 - 220 na
Nigeria 7,789 10,019 10,242 12,462 22%
Total 8,164 11,674 11,420 14,940 31%
Source: Woodmackenzie data, Credit Suisse research
E&P: ~4.5tcf of gas to be exploited; upside risk from remaining exploration wells
For SAKP’s E&P business, prospects look bright. Existing producing assets are naturally
declining and the profit contribution from E&P should decline over the next three years, but
we understand that there is scope for value-accretive infill drilling. More importantly, the
very substantial discoveries in SK310 (~3tcf Gas Initially In Place (GIIP) are about to be
developed; we understand the process for the signing of the gas sales agreement is on
track. For first production in 3QCY17, fabrication of the first well-head platform should be
contracted out in early 2015; the agreement has to be signed before that. SK310 itself will
provide SAKP with plenty of growth from FY18 onwards, as the first gas production from
SK310 starts to kick in. We estimate average E&P profits over FY18-20 would be ~70%
higher than FY15-17. On top of that, impressive finds in SK408 (~1.5tcf GIIP discovered
so far in four wells drilled; results from one well drilled in 2014 undisclosed as yet) suggest
significant upside from the remaining five exploration wells due in 2015.
It should be noted though that until the gas sales agreement for SK310 has been signed,
there is a tail-end risk that the development may be delayed or not developed. The Sabah-
Sarawak Gas Pipeline has made securing more LNG feedstock a less urgent issue for
Petronas. If Asian LNG prices fall far enough, the SK310 gas sales agreement may be put
off. This is a low-probability outcome though, in our view.
Marginal fields: Plenty of fields left, still limited number of players
We estimate there should be another 19 clusters technically feasible (25 marginal field
clusters initially earmarked for development; six awarded under RSCs so far). Increasing
risks are likely, especially versus Berantai (reputed to be the choicest marginal field), but
the capex guarantee mechanism should still be retained, and judging from the trend of
RSC terms since 2011, the potential for upside should increase as higher incentives will
be required to entice investment. With its new subsurface capabilities, SAKP would be well
positioned to mitigate these risks and enjoy the higher upside potential.
Moats? What moats?
ROIC profile paints a false picture due to rapid succession of M&A activity
Sceptics would point out that the company’s ROIC profile seems to suggest that economic
moats do not exist, or have diminished over time. However, we believe that this is not
entirely true. We note that the first substantial decline was in CY2012, the year of the
New OCSS and drilling
markets offer further
avenues for growth
E&P: large growth potential
from definite prospects,
indefinite prospects in
SK408 offering upside risk
On the surface, ROIC profile
seems to suggest poorer
business performance, but
reality is different
11 August 2014
SapuraKencana Petroleum Bhd (SKPE.KL / SAKP MK) 24
merger—this saw a distortion to the capital values carried on the books arising from the
merger reserve. Marked deterioration followed in CY2013, post the Seadrill acquisition,
which saw substantial capital raising from both debt and equity. We believe FYE Jan-15
will see ROIC remain depressed, after the significant Newfield transaction in early CY2014,
which required substantial debt drawdown.
Figure 38: Global ROIC comparison (CY)
-
5
10
15
20
25
2007 2008 2009 2010 2011 2012 2013
SAKP Ave Energy Equipment & Services Ave Drilling
Source: Company data, Bloomberg, Credit Suisse estimates
In other words, ROIC has been declining primarily due to massive infusions of capital
(mostly debt) related to these acquisitions. That is, the denominator of the ROIC ratio has
been expanding faster than the numerator. Why? Because though these were purchases
of good businesses, they were done at fair prices. Due to the much bigger contribution to
the group operating profit from these acquired businesses versus the original OCSS and
fabrication platform, it was understandable for the blended ROIC to go down.
Indeed, it is clear from competitors, clients and suppliers that SAKP’s economic moats
have in fact expanded in the past few years; a symptom of this has been SAKP’s order win
profile which has improved tremendously both domestically and internationally with time.
Having said that, if these moats are still there (and are even widening in some cases), but
the purchase prices have rendered it impossible for the group to post the same profitability
on capital as before, does it matter? That is, if these economic moats exist but don’t result
in high ROICs, should we care?
Yes, because fresh capital (either money raised or reinvested earnings) deployed to
expand these good businesses will not suffer from the same issue; there is no "full
valuation" to be paid when subsequent expansion is organic. Hence, if they are
successfully sustained or widened, SAKP’s existing economic moats should allow the
rehabilitation of its ROIC over time.
Margin compression?
External pressures are there, though underlying margins have been protected
Whilst the ROIC decline is mostly from the fair-priced acquisitions in the past two years,
we note that there has been a noticeable decline in operating margins for its core OCSS
division: OCSS EBIT margin in SAKP's reported segmental breakdown has dropped to
only 10% as of FY14, versus 15% a year before. However, based on our checks with the
company, the apparent decline stems from a change in accounting policy; management
fees charged by the corporate HQ is included in the operating profit for FY14 segmental
numbers, but not in FY13. We understand the underlying operating profitability of the core
ROIC can recover as
organic growth resumes
Accounting changes behind
apparent decline in
operating margins for
OCSS. Internal cost
pressures are real
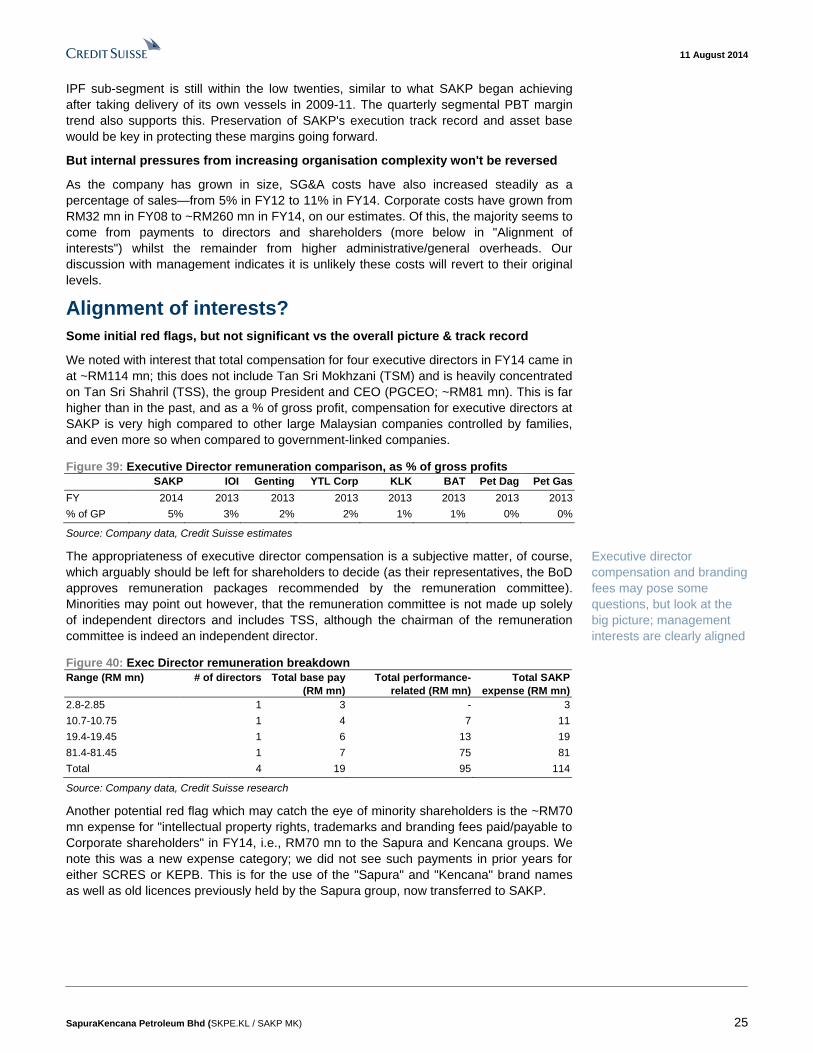
11 August 2014
SapuraKencana Petroleum Bhd (SKPE.KL / SAKP MK) 25
IPF sub-segment is still within the low twenties, similar to what SAKP began achieving
after taking delivery of its own vessels in 2009-11. The quarterly segmental PBT margin
trend also supports this. Preservation of SAKP's execution track record and asset base
would be key in protecting these margins going forward.
But internal pressures from increasing organisation complexity won't be reversed
As the company has grown in size, SG&A costs have also increased steadily as a
percentage of sales—from 5% in FY12 to 11% in FY14. Corporate costs have grown from
RM32 mn in FY08 to ~RM260 mn in FY14, on our estimates. Of this, the majority seems to
come from payments to directors and shareholders (more below in "Alignment of
interests") whilst the remainder from higher administrative/general overheads. Our
discussion with management indicates it is unlikely these costs will revert to their original
levels.
Alignment of interests?
Some initial red flags, but not significant vs the overall picture & track record
We noted with interest that total compensation for four executive directors in FY14 came in
at ~RM114 mn; this does not include Tan Sri Mokhzani (TSM) and is heavily concentrated
on Tan Sri Shahril (TSS), the group President and CEO (PGCEO; ~RM81 mn). This is far
higher than in the past, and as a % of gross profit, compensation for executive directors at
SAKP is very high compared to other large Malaysian companies controlled by families,
and even more so when compared to government-linked companies.
Figure 39: Executive Director remuneration comparison, as % of gross profits
SAKP IOI Genting YTL Corp KLK BAT Pet Dag Pet Gas
FY 2014 2013 2013 2013 2013 2013 2013 2013
% of GP 5% 3% 2% 2% 1% 1% 0% 0%
Source: Company data, Credit Suisse estimates
The appropriateness of executive director compensation is a subjective matter, of course,
which arguably should be left for shareholders to decide (as their representatives, the BoD
approves remuneration packages recommended by the remuneration committee).
Minorities may point out however, that the remuneration committee is not made up solely
of independent directors and includes TSS, although the chairman of the remuneration
committee is indeed an independent director.
Figure 40: Exec Director remuneration breakdown
Range (RM mn) # of directors Total base pay
(RM mn)
Total performance-
related (RM mn)
Total SAKP
expense (RM mn)
2.8-2.85 1 3 - 3
10.7-10.75 1 4 7 11
19.4-19.45 1 6 13 19
81.4-81.45 1 7 75 81
Total 4 19 95 114
Source: Company data, Credit Suisse research
Another potential red flag which may catch the eye of minority shareholders is the ~RM70
mn expense for "intellectual property rights, trademarks and branding fees paid/payable to
Corporate shareholders" in FY14, i.e., RM70 mn to the Sapura and Kencana groups. We
note this was a new expense category; we did not see such payments in prior years for
either SCRES or KEPB. This is for the use of the "Sapura" and "Kencana" brand names
as well as old licences previously held by the Sapura group, now transferred to SAKP.
Executive director
compensation and branding
fees may pose some
questions, but look at the
big picture; management
interests are clearly aligned
11 August 2014
SapuraKencana Petroleum Bhd (SKPE.KL / SAKP MK) 26
If we take a step back and look at the bigger picture, however, all of the above concerns
melt away. Firstly, the compensation for TSS is largely from "Performance-related Fees".
The company does not disclose the KPIs used to determine this bonus, but in an ideal
world, it would be related to creating long-lasting shareholder value. The long-term track
record suggests that top management has achieved this to an incredible degree. The total
returns for those who have stuck with TSS since his takeover of Crest Petroleum, or TSM
since the listing of Kencana Petroleum, are at 11-year and 8-year CAGRs of 48% and
54% p.a., respectively. Even assuming no dividend reinvestments, the gains are still
substantial, at 40% and 53% p.a., respectively.
Secondly, with his 17% stake in SAKP, TSS's interests are far more in line with minority
shareholders than not. This 17% is equivalent to ~RM4 bn at the current share price. Just
a 10% decline in that wipes out several years' worth of branding and director fees. Some
may argue that this 17% is "dead money" i.e., it could never be sold without adversely
affecting the value of the stake itself, but we would point out even at a 50% discount, this
is still a much larger amount of wealth to worry about (reportedly, the bulk of TSS's wealth
is in SAKP shares).
Net-net, we think minorities do not have to worry about misalignment of interests with
management. Having said that, the skew of remuneration towards TSS illustrates a high
degree of dependence on one key person (of the four executive directors in the table
above, only two remain, including TSS) which increases the organisation’s vulnerability to
the risk of management incapacitation. An anecdote of how TSS wants to be informed of
any potentially serious safety issue within a mere ten minutes illustrates just how hands-on
he is—an SAKP without TSS would be a very different animal, we think. This is a key risk
that investors should take note of, although we are not sure they would want it mitigated –
it would be like taking the engine out of your car to eliminate the chances of getting
involved in an automobile accident.
Capex, debt, cash flow: What is the risk of dilution?
High gearing belies strong cash flow coverage from outstanding order book
Relative to its operating cash flows, SAKP's remaining capex plan has moderated
substantially compared to around three years ago; most of the expenditure will be for its
share of the upstream costs (SK310 development and SK408 exploration), the
construction of KM-3 (its third internally-built tender rig) as well as its share of equity for
the Brazilian JV with Seadrill. ~RM4 bn (as of 1Q15) remains to be spent by the JV for the
construction costs for the PLSVs for Petrobras, but most of that will be debt-financed, and
SAKP's share (50%) of the equity contribution will be moderate (we estimate ~RM450 mn
over FY15-18).
Due to its acquisitions, the gearing for SAKP is relatively high at 1.4x (net gearing: 1.3x);
for most investors, this will likely be an initial sticking point.
Long-term shareholders
who have stuck with Tan Sri
Shahril would be sitting on
returns of ~48% p.a. over 11
years
TSS has huge stake in
SAKP, in absolute monetary
terms…
High dependence on key
people is something to note
though
Investors likely to be
concerned about high
gearing and chunky maturity
in FY17
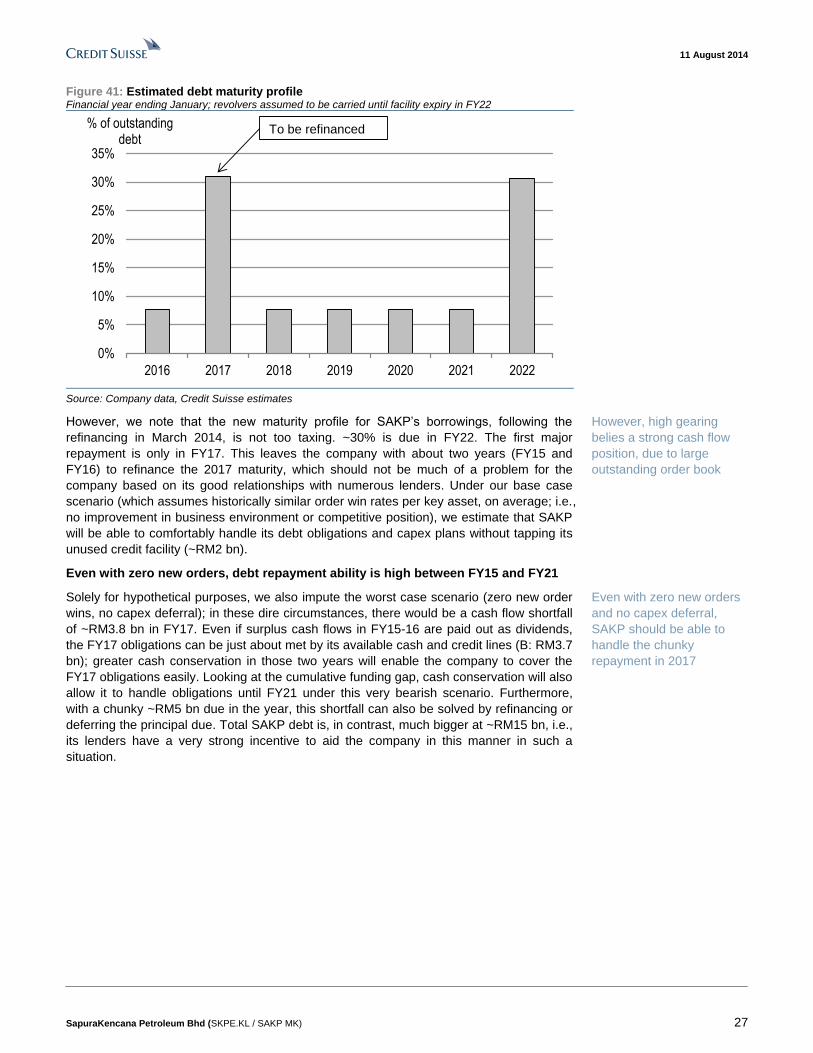
11 August 2014
SapuraKencana Petroleum Bhd (SKPE.KL / SAKP MK) 27
Figure 41: Estimated debt maturity profile Financial year ending January; revolvers assumed to be carried until facility expiry in FY22
0%
5%
10%
15%
20%
25%
30%
35%
2016 2017 2018 2019 2020 2021 2022
% of outstanding debt
To be refinanced
Source: Company data, Credit Suisse estimates
However, we note that the new maturity profile for SAKP’s borrowings, following the
refinancing in March 2014, is not too taxing. ~30% is due in FY22. The first major
repayment is only in FY17. This leaves the company with about two years (FY15 and
FY16) to refinance the 2017 maturity, which should not be much of a problem for the
company based on its good relationships with numerous lenders. Under our base case
scenario (which assumes historically similar order win rates per key asset, on average; i.e.,
no improvement in business environment or competitive position), we estimate that SAKP
will be able to comfortably handle its debt obligations and capex plans without tapping its
unused credit facility (~RM2 bn).
Even with zero new orders, debt repayment ability is high between FY15 and FY21
Solely for hypothetical purposes, we also impute the worst case scenario (zero new order
wins, no capex deferral); in these dire circumstances, there would be a cash flow shortfall
of ~RM3.8 bn in FY17. Even if surplus cash flows in FY15-16 are paid out as dividends,
the FY17 obligations can be just about met by its available cash and credit lines (B: RM3.7
bn); greater cash conservation in those two years will enable the company to cover the
FY17 obligations easily. Looking at the cumulative funding gap, cash conservation will also
allow it to handle obligations until FY21 under this very bearish scenario. Furthermore,
with a chunky ~RM5 bn due in the year, this shortfall can also be solved by refinancing or
deferring the principal due. Total SAKP debt is, in contrast, much bigger at ~RM15 bn, i.e.,
its lenders have a very strong incentive to aid the company in this manner in such a
situation.
However, high gearing
belies a strong cash flow
position, due to large
outstanding order book
Even with zero new orders
and no capex deferral,
SAKP should be able to
handle the chunky
repayment in 2017
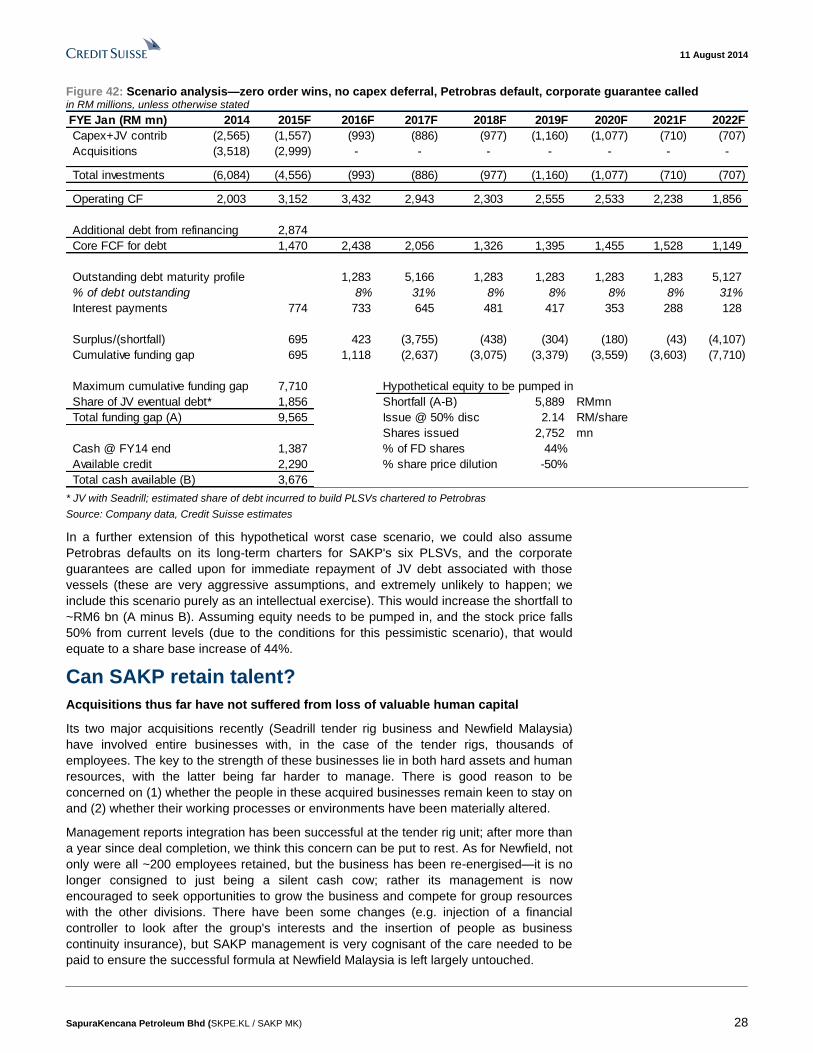
11 August 2014
SapuraKencana Petroleum Bhd (SKPE.KL / SAKP MK) 28
Figure 42: Scenario analysis—zero order wins, no capex deferral, Petrobras default, corporate guarantee called in RM millions, unless otherwise stated
FYE Jan (RM mn) 2014 2015F 2016F 2017F 2018F 2019F 2020F 2021F 2022F
Capex+JV contrib (2,565) (1,557) (993) (886) (977) (1,160) (1,077) (710) (707)
Acquisitions (3,518) (2,999) - - - - - - -
Total investments (6,084) (4,556) (993) (886) (977) (1,160) (1,077) (710) (707)
Operating CF 2,003 3,152 3,432 2,943 2,303 2,555 2,533 2,238 1,856
Additional debt from refinancing 2,874
Core FCF for debt 1,470 2,438 2,056 1,326 1,395 1,455 1,528 1,149
Outstanding debt maturity profile 1,283 5,166 1,283 1,283 1,283 1,283 5,127
% of debt outstanding 8% 31% 8% 8% 8% 8% 31%
Interest payments 774 733 645 481 417 353 288 128
Surplus/(shortfall) 695 423 (3,755) (438) (304) (180) (43) (4,107)
Cumulative funding gap 695 1,118 (2,637) (3,075) (3,379) (3,559) (3,603) (7,710)
Maximum cumulative funding gap 7,710 Hypothetical equity to be pumped in
Share of JV eventual debt* 1,856 Shortfall (A-B) 5,889 RMmn
Total funding gap (A) 9,565 Issue @ 50% disc 2.14 RM/share
Shares issued 2,752 mn
Cash @ FY14 end 1,387 % of FD shares 44%
Available credit 2,290 % share price dilution -50%
Total cash available (B) 3,676 * JV with Seadrill; estimated share of debt incurred to build PLSVs chartered to Petrobras
Source: Company data, Credit Suisse estimates
In a further extension of this hypothetical worst case scenario, we could also assume
Petrobras defaults on its long-term charters for SAKP's six PLSVs, and the corporate
guarantees are called upon for immediate repayment of JV debt associated with those
vessels (these are very aggressive assumptions, and extremely unlikely to happen; we
include this scenario purely as an intellectual exercise). This would increase the shortfall to
~RM6 bn (A minus B). Assuming equity needs to be pumped in, and the stock price falls
50% from current levels (due to the conditions for this pessimistic scenario), that would
equate to a share base increase of 44%.
Can SAKP retain talent?
Acquisitions thus far have not suffered from loss of valuable human capital
Its two major acquisitions recently (Seadrill tender rig business and Newfield Malaysia)
have involved entire businesses with, in the case of the tender rigs, thousands of
employees. The key to the strength of these businesses lie in both hard assets and human
resources, with the latter being far harder to manage. There is good reason to be
concerned on (1) whether the people in these acquired businesses remain keen to stay on
and (2) whether their working processes or environments have been materially altered.
Management reports integration has been successful at the tender rig unit; after more than
a year since deal completion, we think this concern can be put to rest. As for Newfield, not
only were all ~200 employees retained, but the business has been re-energised—it is no
longer consigned to just being a silent cash cow; rather its management is now
encouraged to seek opportunities to grow the business and compete for group resources
with the other divisions. There have been some changes (e.g. injection of a financial
controller to look after the group's interests and the insertion of people as business
continuity insurance), but SAKP management is very cognisant of the care needed to be
paid to ensure the successful formula at Newfield Malaysia is left largely untouched.
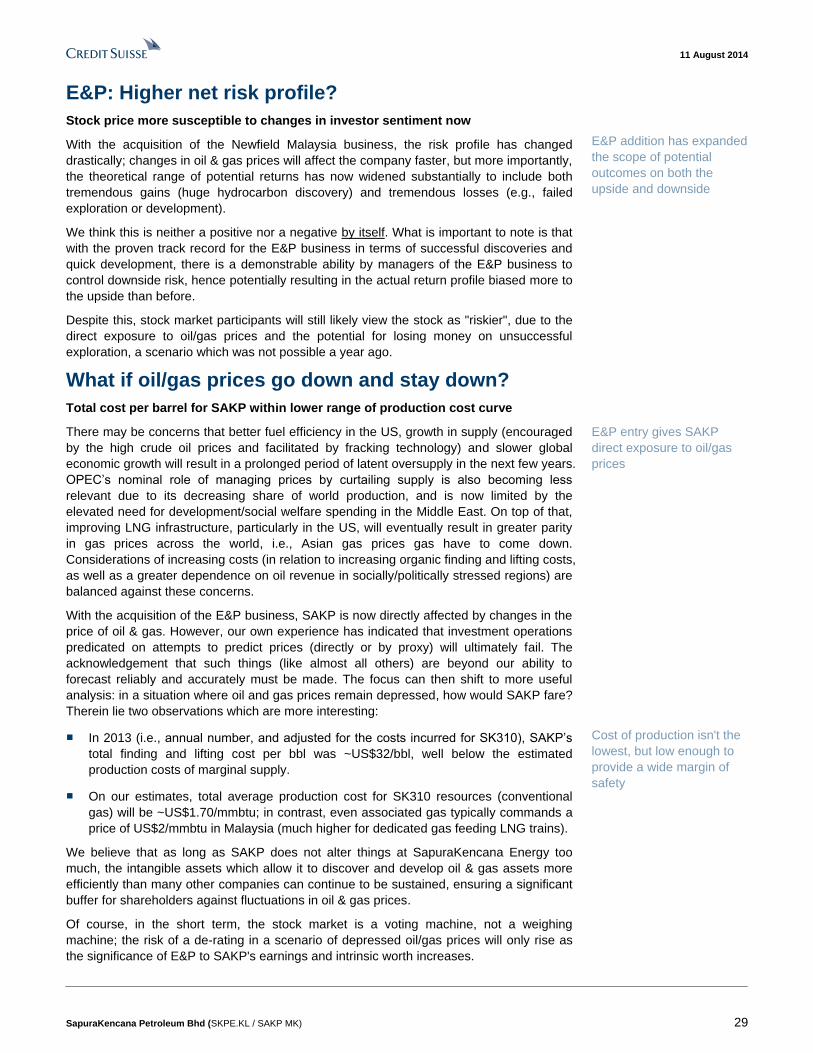
11 August 2014
SapuraKencana Petroleum Bhd (SKPE.KL / SAKP MK) 29
E&P: Higher net risk profile?
Stock price more susceptible to changes in investor sentiment now
With the acquisition of the Newfield Malaysia business, the risk profile has changed
drastically; changes in oil & gas prices will affect the company faster, but more importantly,
the theoretical range of potential returns has now widened substantially to include both
tremendous gains (huge hydrocarbon discovery) and tremendous losses (e.g., failed
exploration or development).
We think this is neither a positive nor a negative by itself. What is important to note is that
with the proven track record for the E&P business in terms of successful discoveries and
quick development, there is a demonstrable ability by managers of the E&P business to
control downside risk, hence potentially resulting in the actual return profile biased more to
the upside than before.
Despite this, stock market participants will still likely view the stock as "riskier", due to the
direct exposure to oil/gas prices and the potential for losing money on unsuccessful
exploration, a scenario which was not possible a year ago.
What if oil/gas prices go down and stay down?
Total cost per barrel for SAKP within lower range of production cost curve
There may be concerns that better fuel efficiency in the US, growth in supply (encouraged
by the high crude oil prices and facilitated by fracking technology) and slower global
economic growth will result in a prolonged period of latent oversupply in the next few years.
OPEC’s nominal role of managing prices by curtailing supply is also becoming less
relevant due to its decreasing share of world production, and is now limited by the
elevated need for development/social welfare spending in the Middle East. On top of that,
improving LNG infrastructure, particularly in the US, will eventually result in greater parity
in gas prices across the world, i.e., Asian gas prices gas have to come down.
Considerations of increasing costs (in relation to increasing organic finding and lifting costs,
as well as a greater dependence on oil revenue in socially/politically stressed regions) are
balanced against these concerns.
With the acquisition of the E&P business, SAKP is now directly affected by changes in the
price of oil & gas. However, our own experience has indicated that investment operations
predicated on attempts to predict prices (directly or by proxy) will ultimately fail. The
acknowledgement that such things (like almost all others) are beyond our ability to
forecast reliably and accurately must be made. The focus can then shift to more useful
analysis: in a situation where oil and gas prices remain depressed, how would SAKP fare?
Therein lie two observations which are more interesting:
■ In 2013 (i.e., annual number, and adjusted for the costs incurred for SK310), SAKP’s
total finding and lifting cost per bbl was ~US$32/bbl, well below the estimated
production costs of marginal supply.
■ On our estimates, total average production cost for SK310 resources (conventional
gas) will be ~US$1.70/mmbtu; in contrast, even associated gas typically commands a
price of US$2/mmbtu in Malaysia (much higher for dedicated gas feeding LNG trains).
We believe that as long as SAKP does not alter things at SapuraKencana Energy too
much, the intangible assets which allow it to discover and develop oil & gas assets more
efficiently than many other companies can continue to be sustained, ensuring a significant
buffer for shareholders against fluctuations in oil & gas prices.
Of course, in the short term, the stock market is a voting machine, not a weighing
machine; the risk of a de-rating in a scenario of depressed oil/gas prices will only rise as
the significance of E&P to SAKP's earnings and intrinsic worth increases.
E&P addition has expanded
the scope of potential
outcomes on both the
upside and downside
E&P entry gives SAKP
direct exposure to oil/gas
prices
Cost of production isn't the
lowest, but low enough to
provide a wide margin of
safety
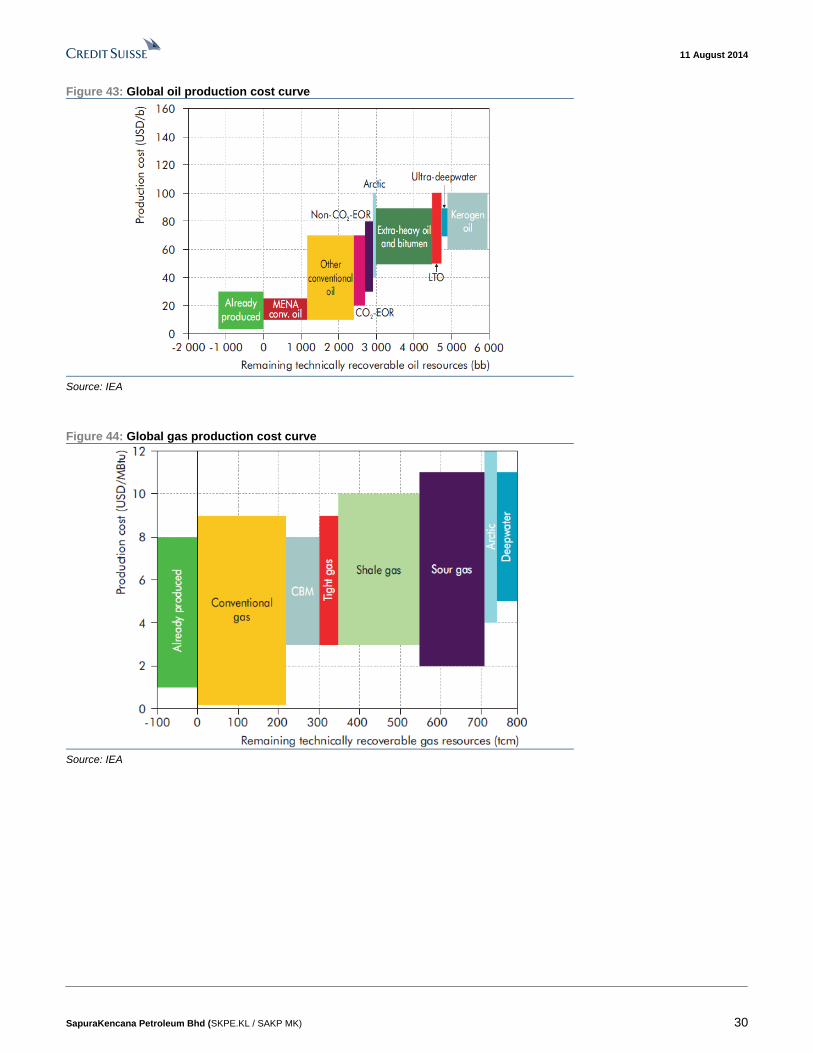
11 August 2014
SapuraKencana Petroleum Bhd (SKPE.KL / SAKP MK) 30
Figure 43: Global oil production cost curve
Source: IEA
Figure 44: Global gas production cost curve
Source: IEA
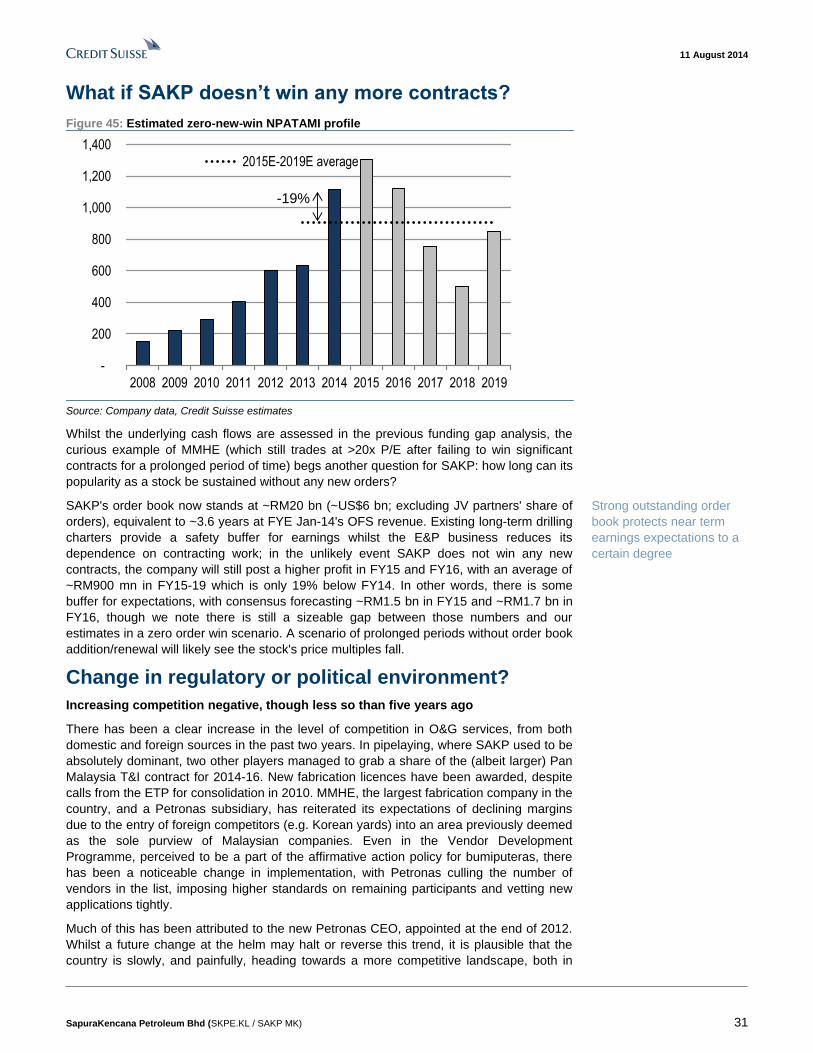
11 August 2014
SapuraKencana Petroleum Bhd (SKPE.KL / SAKP MK) 31
What if SAKP doesn’t win any more contracts?
Figure 45: Estimated zero-new-win NPATAMI profile
-
200
400
600
800
1,000
1,200
1,400
2008 2009 2010 2011 2012 2013 2014 2015 2016 2017 2018 2019
2015E-2019E average
-19%
Source: Company data, Credit Suisse estimates
Whilst the underlying cash flows are assessed in the previous funding gap analysis, the
curious example of MMHE (which still trades at >20x P/E after failing to win significant
contracts for a prolonged period of time) begs another question for SAKP: how long can its
popularity as a stock be sustained without any new orders?
SAKP's order book now stands at ~RM20 bn (~US$6 bn; excluding JV partners' share of
orders), equivalent to ~3.6 years at FYE Jan-14's OFS revenue. Existing long-term drilling
charters provide a safety buffer for earnings whilst the E&P business reduces its
dependence on contracting work; in the unlikely event SAKP does not win any new
contracts, the company will still post a higher profit in FY15 and FY16, with an average of
~RM900 mn in FY15-19 which is only 19% below FY14. In other words, there is some
buffer for expectations, with consensus forecasting ~RM1.5 bn in FY15 and ~RM1.7 bn in
FY16, though we note there is still a sizeable gap between those numbers and our
estimates in a zero order win scenario. A scenario of prolonged periods without order book
addition/renewal will likely see the stock's price multiples fall.
Change in regulatory or political environment?
Increasing competition negative, though less so than five years ago
There has been a clear increase in the level of competition in O&G services, from both
domestic and foreign sources in the past two years. In pipelaying, where SAKP used to be
absolutely dominant, two other players managed to grab a share of the (albeit larger) Pan
Malaysia T&I contract for 2014-16. New fabrication licences have been awarded, despite
calls from the ETP for consolidation in 2010. MMHE, the largest fabrication company in the
country, and a Petronas subsidiary, has reiterated its expectations of declining margins
due to the entry of foreign competitors (e.g. Korean yards) into an area previously deemed
as the sole purview of Malaysian companies. Even in the Vendor Development
Programme, perceived to be a part of the affirmative action policy for bumiputeras, there
has been a noticeable change in implementation, with Petronas culling the number of
vendors in the list, imposing higher standards on remaining participants and vetting new
applications tightly.
Much of this has been attributed to the new Petronas CEO, appointed at the end of 2012.
Whilst a future change at the helm may halt or reverse this trend, it is plausible that the
country is slowly, and painfully, heading towards a more competitive landscape, both in
Strong outstanding order
book protects near term
earnings expectations to a
certain degree
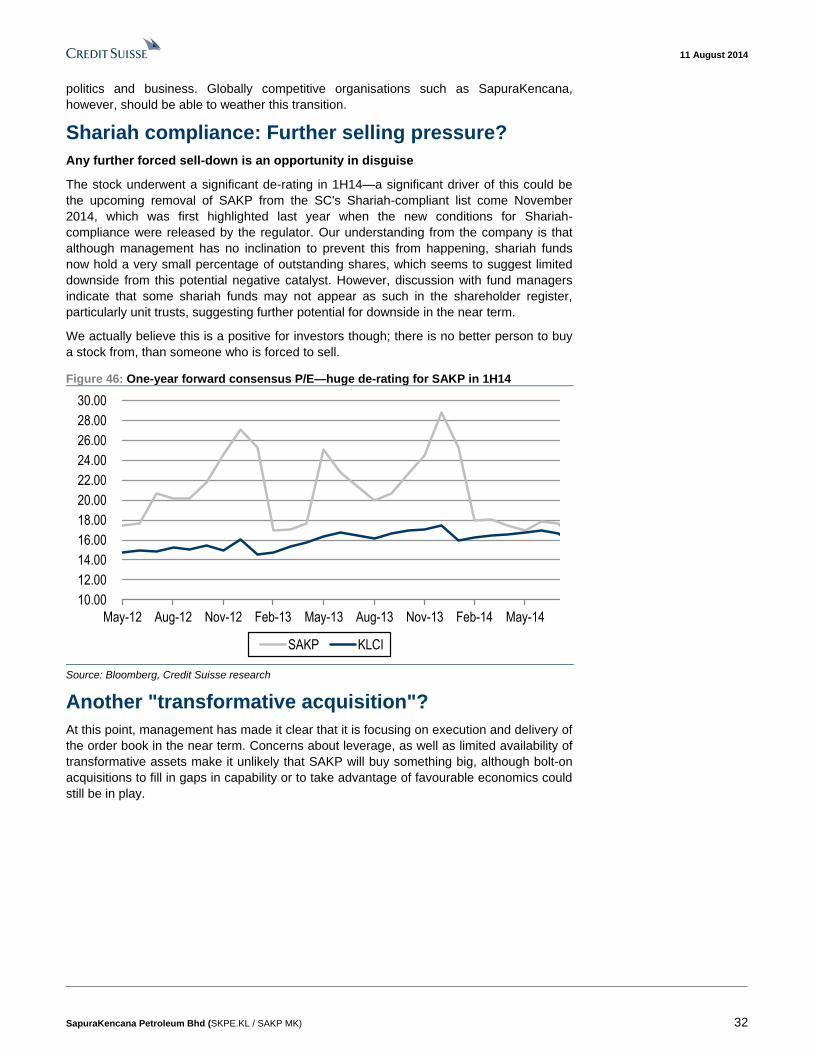
11 August 2014
SapuraKencana Petroleum Bhd (SKPE.KL / SAKP MK) 32
politics and business. Globally competitive organisations such as SapuraKencana,
however, should be able to weather this transition.
Shariah compliance: Further selling pressure?
Any further forced sell-down is an opportunity in disguise
The stock underwent a significant de-rating in 1H14—a significant driver of this could be
the upcoming removal of SAKP from the SC's Shariah-compliant list come November
2014, which was first highlighted last year when the new conditions for Shariah-
compliance were released by the regulator. Our understanding from the company is that
although management has no inclination to prevent this from happening, shariah funds
now hold a very small percentage of outstanding shares, which seems to suggest limited
downside from this potential negative catalyst. However, discussion with fund managers
indicate that some shariah funds may not appear as such in the shareholder register,
particularly unit trusts, suggesting further potential for downside in the near term.
We actually believe this is a positive for investors though; there is no better person to buy
a stock from, than someone who is forced to sell.
Figure 46: One-year forward consensus P/E—huge de-rating for SAKP in 1H14
10.00
12.00
14.00
16.00
18.00
20.00
22.00
24.00
26.00
28.00
30.00
May-12 Aug-12 Nov-12 Feb-13 May-13 Aug-13 Nov-13 Feb-14 May-14
SAKP KLCI
Source: Bloomberg, Credit Suisse research
Another "transformative acquisition"?
At this point, management has made it clear that it is focusing on execution and delivery of
the order book in the near term. Concerns about leverage, as well as limited availability of
transformative assets make it unlikely that SAKP will buy something big, although bolt-on
acquisitions to fill in gaps in capability or to take advantage of favourable economics could
still be in play.
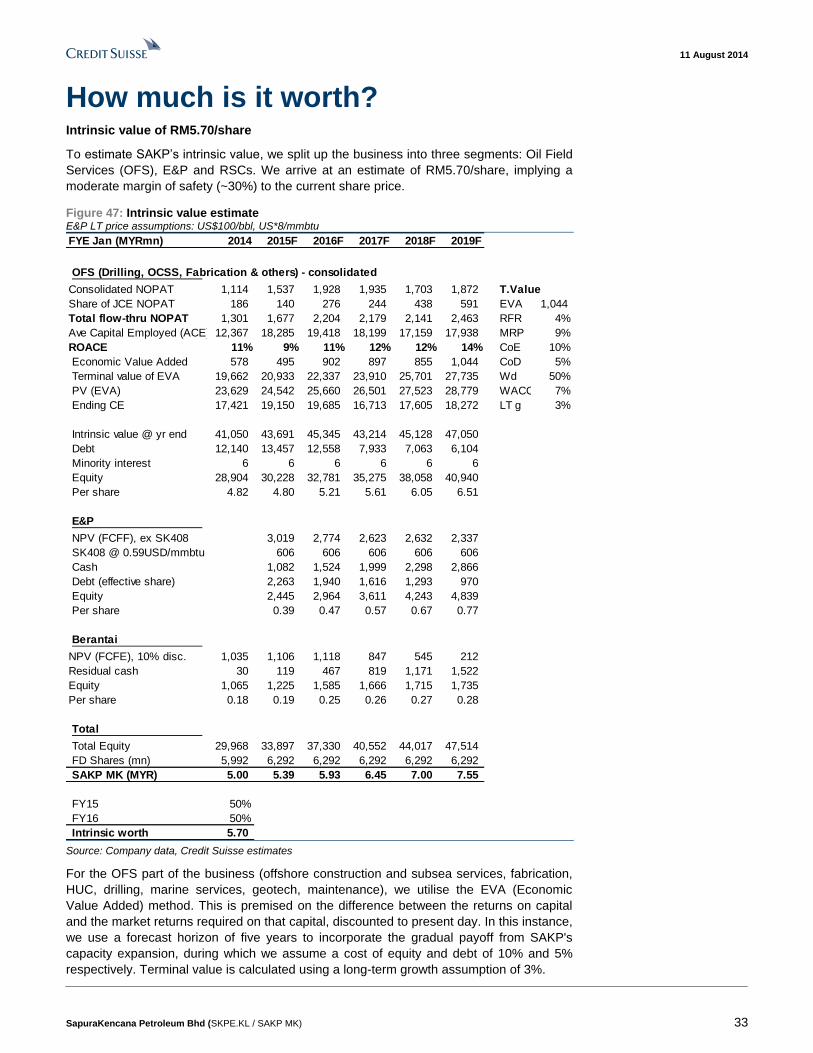
11 August 2014
SapuraKencana Petroleum Bhd (SKPE.KL / SAKP MK) 33
How much is it worth? Intrinsic value of RM5.70/share
To estimate SAKP’s intrinsic value, we split up the business into three segments: Oil Field
Services (OFS), E&P and RSCs. We arrive at an estimate of RM5.70/share, implying a
moderate margin of safety (~30%) to the current share price.
Figure 47: Intrinsic value estimate E&P LT price assumptions: US$100/bbl, US*8/mmbtu
FYE Jan (MYRmn) 2014 2015F 2016F 2017F 2018F 2019F
OFS (Drilling, OCSS, Fabrication & others) - consolidated
Consolidated NOPAT 1,114 1,537 1,928 1,935 1,703 1,872 T.Value
Share of JCE NOPAT 186 140 276 244 438 591 EVA 1,044
Total flow-thru NOPAT 1,301 1,677 2,204 2,179 2,141 2,463 RFR 4%
Ave Capital Employed (ACE) 12,367 18,285 19,418 18,199 17,159 17,938 MRP 9%
ROACE 11% 9% 11% 12% 12% 14% CoE 10%
Economic Value Added 578 495 902 897 855 1,044 CoD 5%
Terminal value of EVA 19,662 20,933 22,337 23,910 25,701 27,735 Wd 50%
PV (EVA) 23,629 24,542 25,660 26,501 27,523 28,779 WACC 7%
Ending CE 17,421 19,150 19,685 16,713 17,605 18,272 LT g 3%
Intrinsic value @ yr end 41,050 43,691 45,345 43,214 45,128 47,050
Debt 12,140 13,457 12,558 7,933 7,063 6,104
Minority interest 6 6 6 6 6 6
Equity 28,904 30,228 32,781 35,275 38,058 40,940
Per share 4.82 4.80 5.21 5.61 6.05 6.51
E&P
NPV (FCFF), ex SK408 3,019 2,774 2,623 2,632 2,337
SK408 @ 0.59USD/mmbtu 606 606 606 606 606
Cash 1,082 1,524 1,999 2,298 2,866
Debt (effective share) 2,263 1,940 1,616 1,293 970
Equity 2,445 2,964 3,611 4,243 4,839
Per share 0.39 0.47 0.57 0.67 0.77
Berantai
NPV (FCFE), 10% disc. 1,035 1,106 1,118 847 545 212
Residual cash 30 119 467 819 1,171 1,522
Equity 1,065 1,225 1,585 1,666 1,715 1,735
Per share 0.18 0.19 0.25 0.26 0.27 0.28
Total
Total Equity 29,968 33,897 37,330 40,552 44,017 47,514
FD Shares (mn) 5,992 6,292 6,292 6,292 6,292 6,292
SAKP MK (MYR) 5.00 5.39 5.93 6.45 7.00 7.55
FY15 50%
FY16 50%
Intrinsic worth 5.70 Source: Company data, Credit Suisse estimates
For the OFS part of the business (offshore construction and subsea services, fabrication,
HUC, drilling, marine services, geotech, maintenance), we utilise the EVA (Economic
Value Added) method. This is premised on the difference between the returns on capital
and the market returns required on that capital, discounted to present day. In this instance,
we use a forecast horizon of five years to incorporate the gradual payoff from SAKP's
capacity expansion, during which we assume a cost of equity and debt of 10% and 5%
respectively. Terminal value is calculated using a long-term growth assumption of 3%.
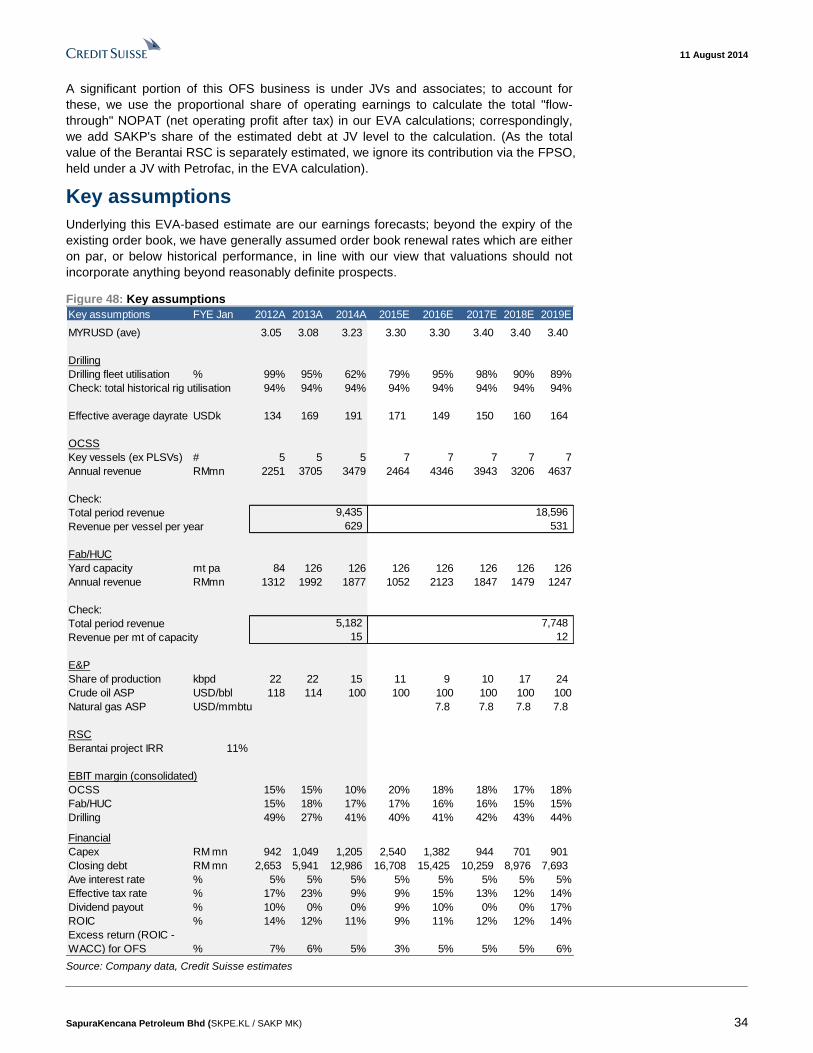
11 August 2014
SapuraKencana Petroleum Bhd (SKPE.KL / SAKP MK) 34
A significant portion of this OFS business is under JVs and associates; to account for
these, we use the proportional share of operating earnings to calculate the total "flow-
through" NOPAT (net operating profit after tax) in our EVA calculations; correspondingly,
we add SAKP's share of the estimated debt at JV level to the calculation. (As the total
value of the Berantai RSC is separately estimated, we ignore its contribution via the FPSO,
held under a JV with Petrofac, in the EVA calculation).
Key assumptions
Underlying this EVA-based estimate are our earnings forecasts; beyond the expiry of the
existing order book, we have generally assumed order book renewal rates which are either
on par, or below historical performance, in line with our view that valuations should not
incorporate anything beyond reasonably definite prospects.
Figure 48: Key assumptions
Key assumptions FYE Jan 2012A 2013A 2014A 2015E 2016E 2017E 2018E 2019E
MYRUSD (ave) 3.05 3.08 3.23 3.30 3.30 3.40 3.40 3.40
Drilling
Drilling fleet utilisation % 99% 95% 62% 79% 95% 98% 90% 89%
Check: total historical rig utilisation 94% 94% 94% 94% 94% 94% 94% 94%
Effective average dayrate USDk 134 169 191 171 149 150 160 164
OCSS
Key vessels (ex PLSVs) # 5 5 5 7 7 7 7 7
Annual revenue RMmn 2251 3705 3479 2464 4346 3943 3206 4637
Check:
Total period revenue
Revenue per vessel per year
Fab/HUC
Yard capacity mt pa 84 126 126 126 126 126 126 126
Annual revenue RMmn 1312 1992 1877 1052 2123 1847 1479 1247
Check:
Total period revenue
Revenue per mt of capacity
E&P
Share of production kbpd 22 22 15 11 9 10 17 24
Crude oil ASP USD/bbl 118 114 100 100 100 100 100 100
Natural gas ASP USD/mmbtu 7.8 7.8 7.8 7.8
RSC
Berantai project IRR 11%
EBIT margin (consolidated)
OCSS 15% 15% 10% 20% 18% 18% 17% 18%
Fab/HUC 15% 18% 17% 17% 16% 16% 15% 15%
Drilling 49% 27% 41% 40% 41% 42% 43% 44%
Financial
Capex RM mn 942 1,049 1,205 2,540 1,382 944 701 901
Closing debt RM mn 2,653 5,941 12,986 16,708 15,425 10,259 8,976 7,693
Ave interest rate % 5% 5% 5% 5% 5% 5% 5% 5%
Effective tax rate % 17% 23% 9% 9% 15% 13% 12% 14%
Dividend payout % 10% 0% 0% 9% 10% 0% 0% 17%
ROIC % 14% 12% 11% 9% 11% 12% 12% 14%
Excess return (ROIC -
WACC) for OFS % 7% 6% 5% 3% 5% 5% 5% 6%
9,435 18,596
629 531
15 12
5,182 7,748
Source: Company data, Credit Suisse estimates
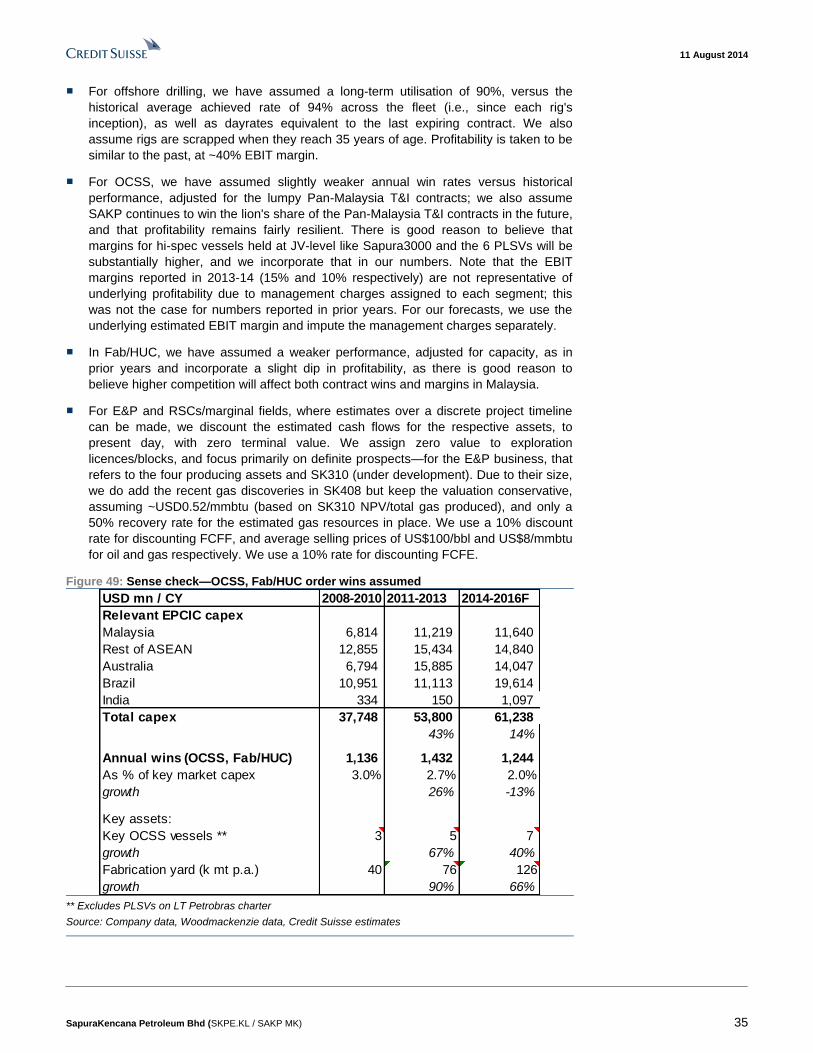
11 August 2014
SapuraKencana Petroleum Bhd (SKPE.KL / SAKP MK) 35
■ For offshore drilling, we have assumed a long-term utilisation of 90%, versus the
historical average achieved rate of 94% across the fleet (i.e., since each rig's
inception), as well as dayrates equivalent to the last expiring contract. We also
assume rigs are scrapped when they reach 35 years of age. Profitability is taken to be
similar to the past, at ~40% EBIT margin.
■ For OCSS, we have assumed slightly weaker annual win rates versus historical
performance, adjusted for the lumpy Pan-Malaysia T&I contracts; we also assume
SAKP continues to win the lion's share of the Pan-Malaysia T&I contracts in the future,
and that profitability remains fairly resilient. There is good reason to believe that
margins for hi-spec vessels held at JV-level like Sapura3000 and the 6 PLSVs will be
substantially higher, and we incorporate that in our numbers. Note that the EBIT
margins reported in 2013-14 (15% and 10% respectively) are not representative of
underlying profitability due to management charges assigned to each segment; this
was not the case for numbers reported in prior years. For our forecasts, we use the
underlying estimated EBIT margin and impute the management charges separately.
■ In Fab/HUC, we have assumed a weaker performance, adjusted for capacity, as in
prior years and incorporate a slight dip in profitability, as there is good reason to
believe higher competition will affect both contract wins and margins in Malaysia.
■ For E&P and RSCs/marginal fields, where estimates over a discrete project timeline
can be made, we discount the estimated cash flows for the respective assets, to
present day, with zero terminal value. We assign zero value to exploration
licences/blocks, and focus primarily on definite prospects—for the E&P business, that
refers to the four producing assets and SK310 (under development). Due to their size,
we do add the recent gas discoveries in SK408 but keep the valuation conservative,
assuming ~USD0.52/mmbtu (based on SK310 NPV/total gas produced), and only a
50% recovery rate for the estimated gas resources in place. We use a 10% discount
rate for discounting FCFF, and average selling prices of US$100/bbl and US$8/mmbtu
for oil and gas respectively. We use a 10% rate for discounting FCFE.
Figure 49: Sense check—OCSS, Fab/HUC order wins assumed
USD mn / CY 2008-2010 2011-2013 2014-2016F
Relevant EPCIC capex
Malaysia 6,814 11,219 11,640
Rest of ASEAN 12,855 15,434 14,840
Australia 6,794 15,885 14,047
Brazil 10,951 11,113 19,614
India 334 150 1,097
Total capex 37,748 53,800 61,238
43% 14%
Annual wins (OCSS, Fab/HUC) 1,136 1,432 1,244
As % of key market capex 3.0% 2.7% 2.0%
growth 26% -13%
Key assets:
Key OCSS vessels ** 3 5 7
growth 67% 40%
Fabrication yard (k mt p.a.) 40 76 126
growth 90% 66% ** Excludes PLSVs on LT Petrobras charter
Source: Company data, Woodmackenzie data, Credit Suisse estimates
11 August 2014
SapuraKencana Petroleum Bhd (SKPE.KL / SAKP MK) 36
Relative value
Price multiples on the lower end of range for larger O&G-related stocks
SAKP is trading at a CY15F P/E of ~13x and P/B of ~2x, as compared to domestic peer
ranges of 12-24x and 2-5x respectively.
There is a noticeable premium for the larger companies, but despite being the largest in
terms of profits and market cap, SAKP is trading at the lower end of the range seen for the
bigger companies.
Rather unsurprisingly, its CY15F P/E and P/B multiples exceed the means for global O&G
services (drillers: 11x, EPCIC: 13x). Though they look more interesting when adjusted for
growth (PEG: 0.3 vs 1.1, 0.9 and 1.4 for global peers across drilling, EPCIC and E&P), we
find relative valuation to be particularly misleading in this case: (1) The E&P business's
worth is primarily based on the unproduced reserves in the ground, which requires a DCF-
based approach. (2) The "Malaysian premium" (arising from substantial trapped domestic
liquidity) always renders such comparisons practically irrelevant.
Forget about relative "valuation", focus on intrinsic valuation
We prefer to stick to intrinsic valuation, and the margin of safety concept. The Malaysian
O&G sector is generally very popular with investors, both retail and institutional, due to the
perception of a secular upswing in contract awards. This is not completely wrong, by itself,
but as usual tends to be carried to the extreme—hence the propensity for disproportionate
exuberance is higher in this segment of the stock market than in others, leading to fairly
common repetition of phrases like, “It’s still cheap, it’s only 15x”. Sticking to intrinsic
valuation helps to avoid getting carried away by such emotions, and is the only way to
derive a useful margin of safety.
As a rough sense-check though, we note that our target price implies a CY15F P/E of 18x
(excluding the E&P business, it would be 21x), suggesting we are not "working against the
tide", being within the range of multiples being currently paid for by investors for the larger-
cap O&G services companies in Malaysia (13-24x).
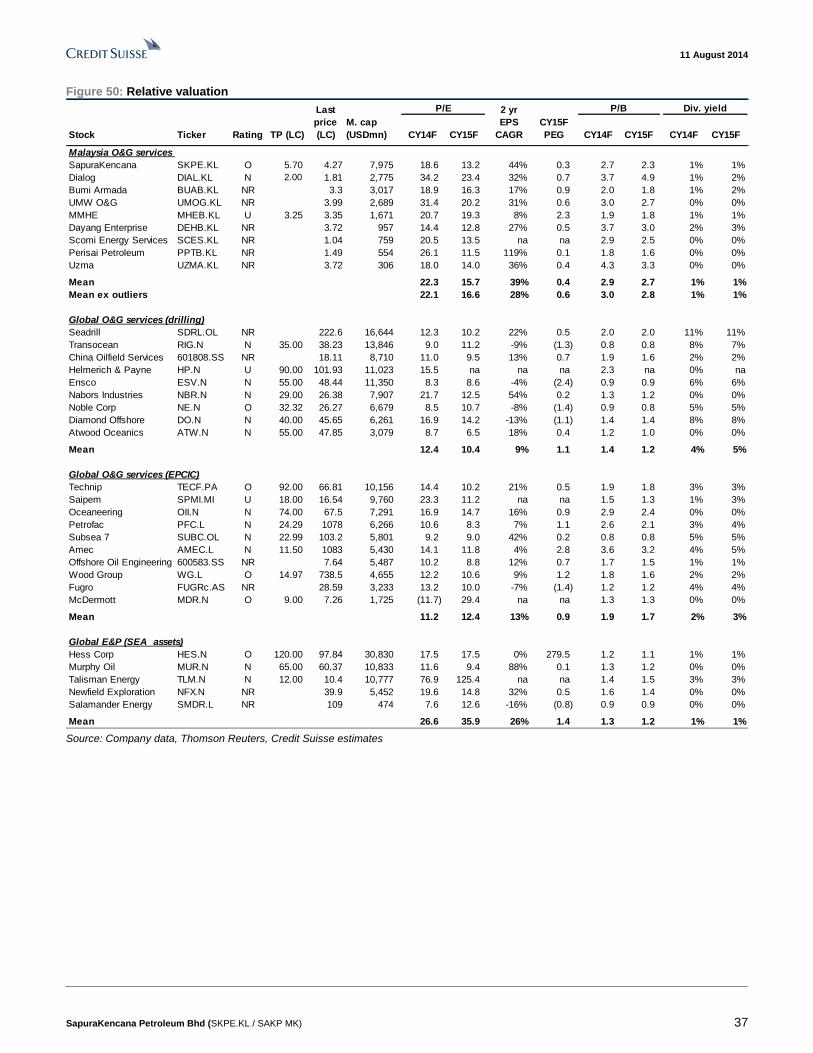
11 August 2014
SapuraKencana Petroleum Bhd (SKPE.KL / SAKP MK) 37
Figure 50: Relative valuation
Stock Ticker Rating TP (LC)
M. cap
(USDmn) CY14F CY15F
CY15F
PEG CY14F CY15F CY14F CY15F
Malaysia O&G services
SapuraKencana SKPE.KL O 5.70 4.27 7,975 18.6 13.2 44% 0.3 2.7 2.3 1% 1%
Dialog DIAL.KL N 2.10 1.81 2,775 34.2 23.4 32% 0.7 3.7 4.9 1% 2%
Bumi Armada BUAB.KL NR 3.3 3,017 18.9 16.3 17% 0.9 2.0 1.8 1% 2%
UMW O&G UMOG.KL NR 3.99 2,689 31.4 20.2 31% 0.6 3.0 2.7 0% 0%
MMHE MHEB.KL U 3.25 3.35 1,671 20.7 19.3 8% 2.3 1.9 1.8 1% 1%
Dayang Enterprise DEHB.KL NR 3.72 957 14.4 12.8 27% 0.5 3.7 3.0 2% 3%
Scomi Energy Services SCES.KL NR 1.04 759 20.5 13.5 na na 2.9 2.5 0% 0%
Perisai Petroleum PPTB.KL NR 1.49 554 26.1 11.5 119% 0.1 1.8 1.6 0% 0%
Uzma UZMA.KL NR 3.72 306 18.0 14.0 36% 0.4 4.3 3.3 0% 0%
Mean 22.3 15.7 39% 0.4 2.9 2.7 1% 1%
Mean ex outliers 22.1 16.6 28% 0.6 3.0 2.8 1% 1%
Global O&G services (drilling)
Seadrill SDRL.OL NR 222.6 16,644 12.3 10.2 22% 0.5 2.0 2.0 11% 11%
Transocean RIG.N N 35.00 38.23 13,846 9.0 11.2 -9% (1.3) 0.8 0.8 8% 7%
China Oilfield Services 601808.SS NR 18.11 8,710 11.0 9.5 13% 0.7 1.9 1.6 2% 2%
Helmerich & Payne HP.N U 90.00 101.93 11,023 15.5 na na na 2.3 na 0% na
Ensco ESV.N N 55.00 48.44 11,350 8.3 8.6 -4% (2.4) 0.9 0.9 6% 6%
Nabors Industries NBR.N N 29.00 26.38 7,907 21.7 12.5 54% 0.2 1.3 1.2 0% 0%
Noble Corp NE.N O 32.32 26.27 6,679 8.5 10.7 -8% (1.4) 0.9 0.8 5% 5%
Diamond Offshore DO.N N 40.00 45.65 6,261 16.9 14.2 -13% (1.1) 1.4 1.4 8% 8%
Atwood Oceanics ATW.N N 55.00 47.85 3,079 8.7 6.5 18% 0.4 1.2 1.0 0% 0%
Mean 12.4 10.4 9% 1.1 1.4 1.2 4% 5%
Global O&G services (EPCIC)
Technip TECF.PA O 92.00 66.81 10,156 14.4 10.2 21% 0.5 1.9 1.8 3% 3%
Saipem SPMI.MI U 18.00 16.54 9,760 23.3 11.2 na na 1.5 1.3 1% 3%
Oceaneering OII.N N 74.00 67.5 7,291 16.9 14.7 16% 0.9 2.9 2.4 0% 0%
Petrofac PFC.L N 24.29 1078 6,266 10.6 8.3 7% 1.1 2.6 2.1 3% 4%
Subsea 7 SUBC.OL N 22.99 103.2 5,801 9.2 9.0 42% 0.2 0.8 0.8 5% 5%
Amec AMEC.L N 11.50 1083 5,430 14.1 11.8 4% 2.8 3.6 3.2 4% 5%
Offshore Oil Engineering 600583.SS NR 7.64 5,487 10.2 8.8 12% 0.7 1.7 1.5 1% 1%
Wood Group WG.L O 14.97 738.5 4,655 12.2 10.6 9% 1.2 1.8 1.6 2% 2%
Fugro FUGRc.AS NR 28.59 3,233 13.2 10.0 -7% (1.4) 1.2 1.2 4% 4%
McDermott MDR.N O 9.00 7.26 1,725 (11.7) 29.4 na na 1.3 1.3 0% 0%
Mean 11.2 12.4 13% 0.9 1.9 1.7 2% 3%
Global E&P (SEA assets)
Hess Corp HES.N O 120.00 97.84 30,830 17.5 17.5 0% 279.5 1.2 1.1 1% 1%
Murphy Oil MUR.N N 65.00 60.37 10,833 11.6 9.4 88% 0.1 1.3 1.2 0% 0%
Talisman Energy TLM.N N 12.00 10.4 10,777 76.9 125.4 na na 1.4 1.5 3% 3%
Newfield Exploration NFX.N NR 39.9 5,452 19.6 14.8 32% 0.5 1.6 1.4 0% 0%
Salamander Energy SMDR.L NR 109 474 7.6 12.6 -16% (0.8) 0.9 0.9 0% 0%
Mean 26.6 35.9 26% 1.4 1.3 1.2 1% 1%
Last
price
(LC)
P/E P/B Div. yield2 yr
EPS
CAGR
2.00
Source: Company data, Thomson Reuters, Credit Suisse estimates
11 August 2014
SapuraKencana Petroleum Bhd (SKPE.KL / SAKP MK) 38
Investment risks
Our previous analysis indicates the following to be pertinent investment risks for investors
to note:
■ Concentrated management risk. We think SAKP without TSS would be a very
different animal. The large ED remuneration he received indicates the board of
directors probably think the same thing. The high concentration of decision-making in
his hands means investors should consider management incapacitation as a real risk.
■ Oil & gas prices. The E&P business contributes ~7-8% of our intrinsic worth
estimates, based on our discounted cash flow estimates from the four oil producing
blocks and SK310. This will increase in ~3-4 years as SK310 cash inflows become
more certain, and remaining capex drops. Clarity on SK408 development plans will
also raise the significance of this segment even further, potentially significantly. As
such, SAKP's exposure to oil & gas prices will increase with time. Our analysis
suggests that its total production costs are low enough to mitigate this to a large extent
fundamentally, but perception of stock market participants will likely be the overriding
factor, i.e., low oil & gas prices will likely result in a de-rating, even if SAKP continues
to make money on E&P.
■ Large debt maturity in FY17. The ~RM5 bn in principal due in FY17 will likely be
refinanced, under the base case. On our analysis, in a bearish scenario of zero order
wins and no capex deferral, it can also be comfortably met, but only if cash is
conserved in FY15 and FY16, i.e., minimal dividends. Hence, there is a very small risk
of a default situation panning out, but with clearly dire consequences (i.e. tail-end risk).
■ Potential short term selling pressure. Shariah funds still holding the stock will be
selling between now and November, when SAKP will be removed from the SC's
Shariah-compliant list. It is not possible to quantify the size of these holdings; even
with the complete shareholders' list, the company itself has difficulty calculating a
100% reliable number for the total holdings held by funds affected by this issue.
However, we think this is only a risk for those unable to hold beyond a few months.
■ SK310 and SK408. In SK310, where definite prospects lie for SAKP's E&P business,
the gas sales agreement with Petronas is still unsigned. Without this, the development
cannot proceed. Whilst we understand there is no abnormal delay, and the due
process is being followed, delays could push back cash flows and reduce the present
value of the project, whilst a drop in LNG prices could make it less profitable or
unviable. These are unlikely events, but would have a significant short-term effect on
the stock: we estimate SK310 to contribute ~RM0.20/share to SAKP's intrinsic worth.
In SK408, SAKP has had considerable success with its first four wells. With about five
wells to be drilled in 2015 and one well result unannounced, there is still scope for
SAKP to lose money, though this has dropped significantly to only ~US$40 mn
(SAKP's share of the capex for the remaining six wells). The direct impact from this
will be small though, considering SAKP's much bigger earnings base and the low
likelihood of consensus imputing any value in possible successful discoveries from the
undrilled wells.
11 August 2014
SapuraKencana Petroleum Bhd (SKPE.KL / SAKP MK) 39
Appendix Malaysia E&P
Summary
Malaysia's upstream sector has been built upon the oil and gas fields in the shallow waters
off Peninsular Malaysia and Sarawak, which have been the focus for development activity
since the 1960s. However, as production from the former region matured, the attention of
major operators switched to the deepwater potential off Borneo in the Sarawak and Sabah
basins. This attention has been richly rewarded, particularly with large oil discoveries such
as Kikeh and Gumusut offshore Sabah. Meanwhile, state oil company Petronas and other
operators have enjoyed considerable success in recent years discovering large gas
accumulations in carbonate pinnacle reef structures in Sarawak. Opportunities for smaller
players remain in mature areas, but for most larger companies, offshore eastern
Malaysia/Borneo has far greater allure. Further deepwater success will be required if
Malaysia is to arrest declining liquids and gas production post-2020 and satisfy future
domestic and export LNG demands.
Gas accounts for the majority of remaining reserves, and production is used to supply
domestic demand in Peninsular Malaysia or converted to LNG for export at the Bintulu
LNG plant in Sarawak. Increasing domestic demand has led to the construction of several
import pipelines from Indonesia and Thailand, and a new LNG regasification terminal in
Peninsular Malaysia is now operational. Domestic gas production is currently forecast to
peak in 2018, in line with the ramp-up of output from several new developments in Sabah,
including the Kebabangan Cluster and the Belud Complex. Two domestic floating LNG
projects (FLNG) are also planned, one each off Sabah and Sarawak. Recent large gas
discoveries offshore Sarawak have also allowed Petronas to proceed with the expansion
of the Bintulu MLNG facility, with the construction of a ninth train.
Liquids production peaked in 1995 and around 75% of Malaysia's commercial liquids
reserves have now been produced. With the majority of remaining liquids held within fields
smaller than 100 million barrels in size, Petronas, Malaysia's national oil company, has
announced its intention to focus on maximising domestic production and stimulate
investment in marginal fields by offering fiscal incentives. This will predominately be via a
new 100%-owned subsidiary, Vestigo Petroleum, which will exclusively focus on small,
marginal field developments, initially just in Malaysia. The impact of these measures
remains to be seen, but several smaller operators have already achieved material
positions in Malaysia by concentrating their efforts on overlooked acreage within mature
areas. Elsewhere, PETRONAS plans to cooperate with technologically experienced
partners to unlock the potential of Malaysia's stranded resources and deepwater acreage.
The above excerpt has been taken from Woodmackenzie’s Malaysia Country Overview
report, May 2014
Exploration and production
Under the Petroleum Development Act, Petronas is the custodian of hydrocarbon
resources in the country. E&P companies can participate in the exploitation of
hydrocarbons via PSCs (Production Sharing Contracts), which replaced the previous
concession structure in 1976. Under these contracts, oil companies commit to a minimum
exploration work programme at their own cost for the acreage awarded within a certain
time frame (5-7 years). During exploration, Petronas Carigali has a carried interest (i.e.
does not pay for costs but has a stake). Areas not defined as development areas under
plans submitted to Petronas at the end of the exploration period are relinquished to
Petronas. Production revenue is used to pay royalty to the government, cover capex and
operating costs, pay duties/cesses and settle income taxes, in that order, before the
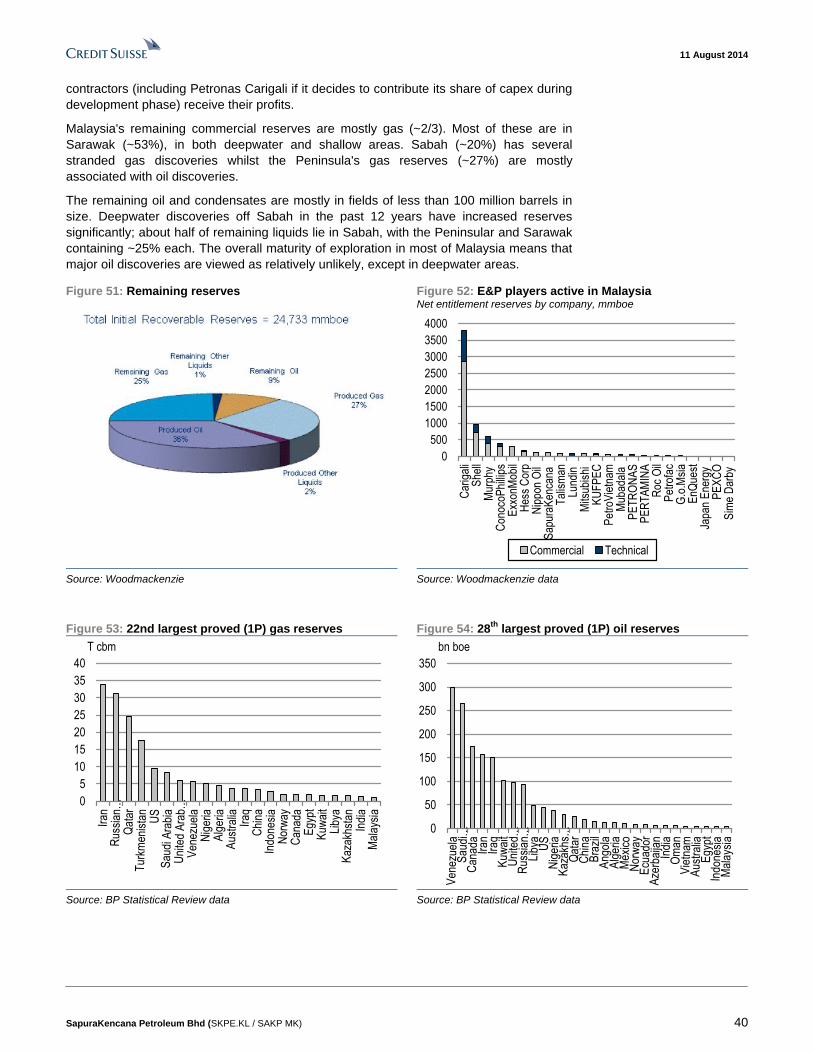
11 August 2014
SapuraKencana Petroleum Bhd (SKPE.KL / SAKP MK) 40
contractors (including Petronas Carigali if it decides to contribute its share of capex during
development phase) receive their profits.
Malaysia's remaining commercial reserves are mostly gas (~2/3). Most of these are in
Sarawak (~53%), in both deepwater and shallow areas. Sabah (~20%) has several
stranded gas discoveries whilst the Peninsula's gas reserves (~27%) are mostly
associated with oil discoveries.
The remaining oil and condensates are mostly in fields of less than 100 million barrels in
size. Deepwater discoveries off Sabah in the past 12 years have increased reserves
significantly; about half of remaining liquids lie in Sabah, with the Peninsular and Sarawak
containing ~25% each. The overall maturity of exploration in most of Malaysia means that
major oil discoveries are viewed as relatively unlikely, except in deepwater areas.
Figure 51: Remaining reserves
Figure 52: E&P players active in Malaysia Net entitlement reserves by company, mmboe
0
500
1000
1500
2000
2500
3000
3500
4000
Car
igal
iS
hell
Mur
phy
Con
ocoP
hilli
psE
xxon
Mob
ilH
ess
Cor
pN
ippo
n O
ilS
apur
aKen
cana
Tal
ism
anLu
ndin
Mits
ubis
hiK
UF
PE
CP
etro
Vie
tnam
Mub
adal
aP
ET
RO
NA
SP
ER
TA
MIN
AR
oc O
ilP
etro
fac
G.o
.Msi
aE
nQue
stJa
pan
Ene
rgy
PE
XC
OS
ime
Dar
by
Commercial Technical
Source: Woodmackenzie Source: Woodmackenzie data
Figure 53: 22nd largest proved (1P) gas reserves Figure 54: 28th
largest proved (1P) oil reserves
0
5
10
15
20
25
30
35
40
T cbm
0
50
100
150
200
250
300
350
bn boe
Source: BP Statistical Review data Source: BP Statistical Review data
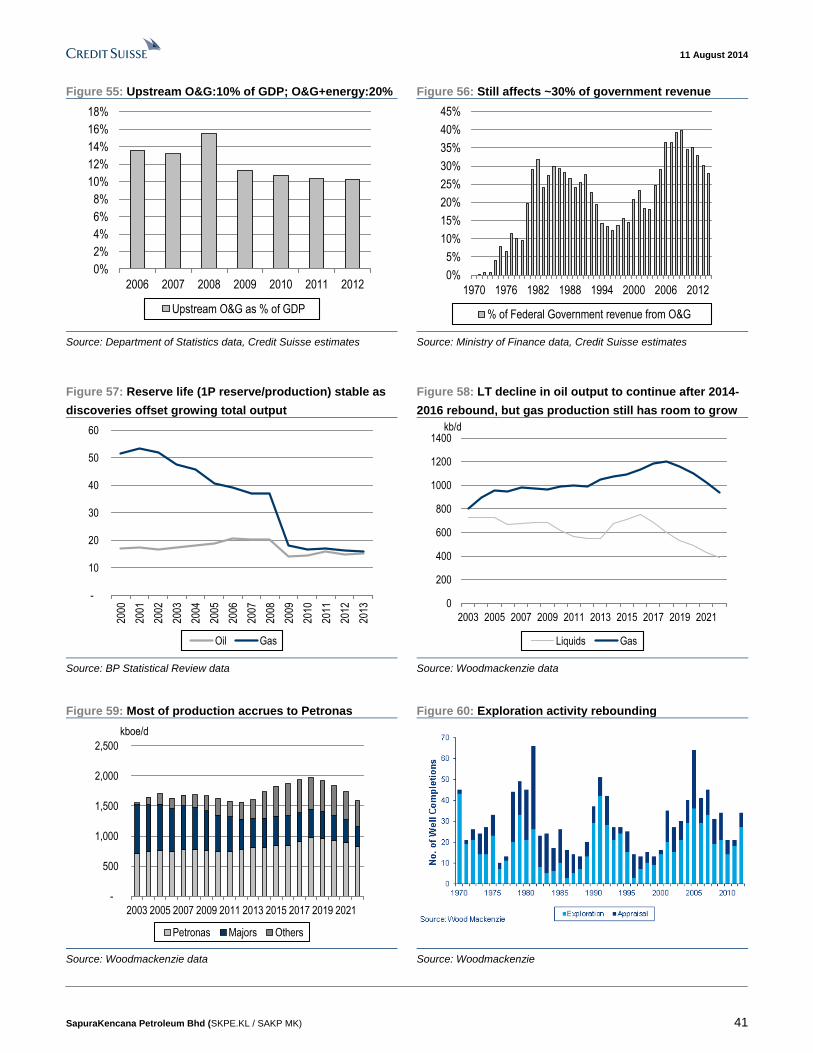
11 August 2014
SapuraKencana Petroleum Bhd (SKPE.KL / SAKP MK) 41
Figure 55: Upstream O&G:10% of GDP; O&G+energy:20% Figure 56: Still affects ~30% of government revenue
0%
2%
4%
6%
8%
10%
12%
14%
16%
18%
2006 2007 2008 2009 2010 2011 2012
Upstream O&G as % of GDP
0%
5%
10%
15%
20%
25%
30%
35%
40%
45%
1970 1976 1982 1988 1994 2000 2006 2012
% of Federal Government revenue from O&G
Source: Department of Statistics data, Credit Suisse estimates Source: Ministry of Finance data, Credit Suisse estimates
Figure 57: Reserve life (1P reserve/production) stable as
discoveries offset growing total output
Figure 58: LT decline in oil output to continue after 2014-
2016 rebound, but gas production still has room to grow
-
10
20
30
40
50
60
2000
2001
2002
2003
2004
2005
2006
2007
2008
2009
2010
2011
2012
2013
Oil Gas
0
200
400
600
800
1000
1200
1400
2003 2005 2007 2009 2011 2013 2015 2017 2019 2021
kb/d
Liquids Gas
Source: BP Statistical Review data Source: Woodmackenzie data
Figure 59: Most of production accrues to Petronas Figure 60: Exploration activity rebounding
-
500
1,000
1,500
2,000
2,500
2003 2005 2007 2009 2011 2013 2015 2017 2019 2021
kboe/d
Petronas Majors Others
Source: Woodmackenzie data Source: Woodmackenzie
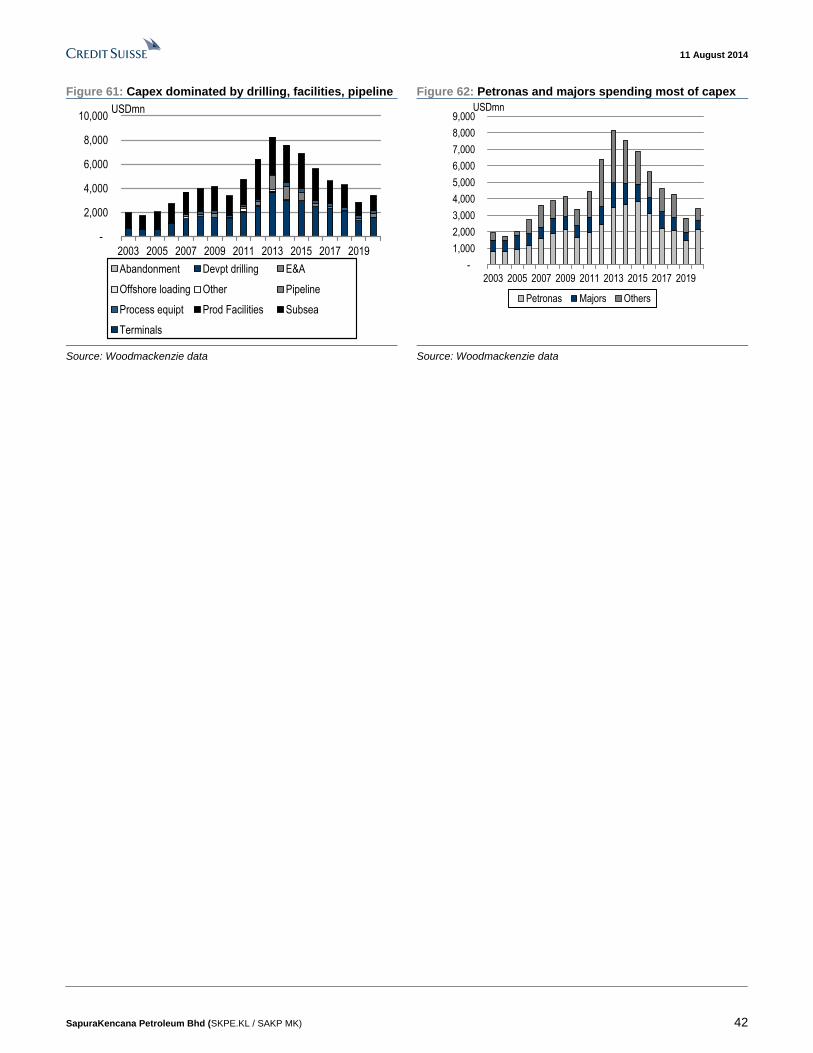
11 August 2014
SapuraKencana Petroleum Bhd (SKPE.KL / SAKP MK) 42
Figure 61: Capex dominated by drilling, facilities, pipeline Figure 62: Petronas and majors spending most of capex
-
2,000
4,000
6,000
8,000
10,000
2003 2005 2007 2009 2011 2013 2015 2017 2019
USDmn
Abandonment Devpt drilling E&A
Offshore loading Other Pipeline
Process equipt Prod Facilities Subsea
Terminals
-
1,000
2,000
3,000
4,000
5,000
6,000
7,000
8,000
9,000
2003 2005 2007 2009 2011 2013 2015 2017 2019
USDmn
Petronas Majors Others
Source: Woodmackenzie data Source: Woodmackenzie data
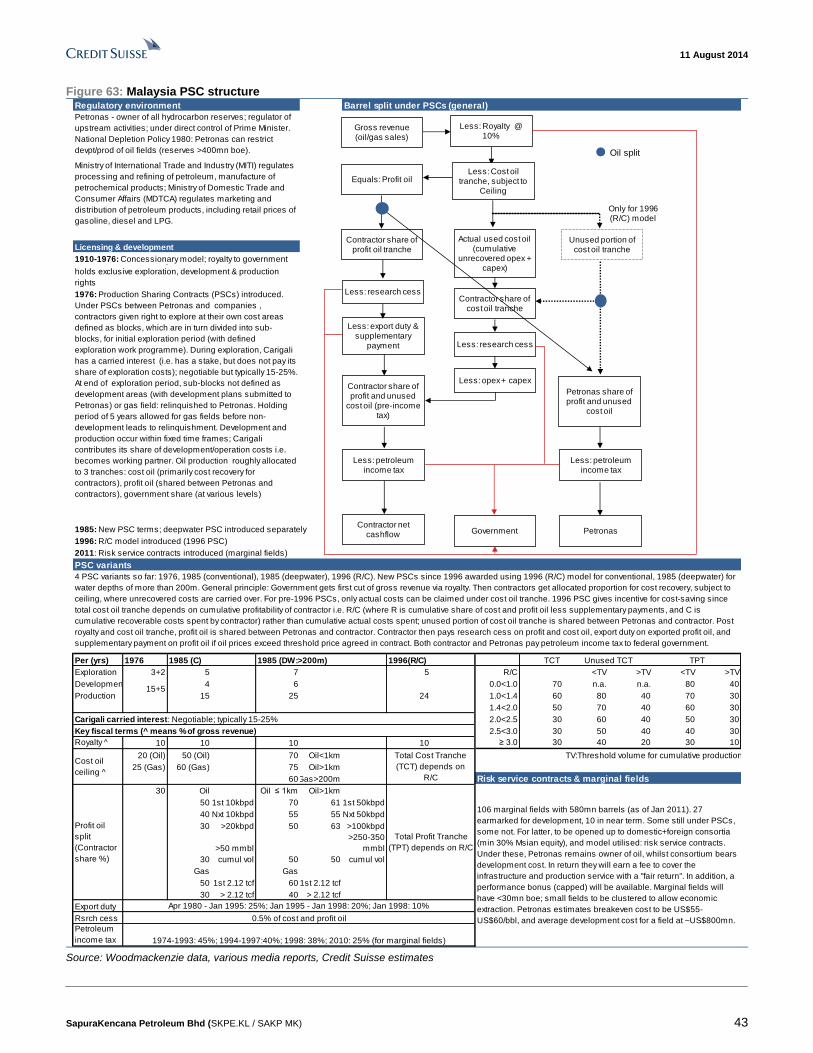
11 August 2014
SapuraKencana Petroleum Bhd (SKPE.KL / SAKP MK) 43
Figure 63: Malaysia PSC structure Regulatory environment Barrel split under PSCs (general)
Oil split
Licensing & development
1910-1976: Concessionary model; royalty to government
1985: New PSC terms; deepwater PSC introduced separately
1996: R/C model introduced (1996 PSC)
2011: Risk service contracts introduced (marginal fields)
PSC variants
Per (yrs) 1976 1985 (C) 1985 (DW:>200m) 1996(R/C) TCT
Exploration 3+2 5 7 5 R/C <TV >TV <TV >TV
Development 4 6 0.0<1.0 70 n.a. n.a. 80 40
Production 15 25 1.0<1.4 60 80 40 70 30
1.4<2.0 50 70 40 60 30
2.0<2.5 30 60 40 50 30
2.5<3.0 30 50 40 40 30
Royalty ^ 10 10 10 10 ≥ 3.0 30 40 20 30 10
20 (Oil) 50 (Oil) 70 Oil<1km TV:Threshold volume for cumulative production
25 (Gas) 60 (Gas) 75 Oil>1km
60Gas>200m Risk service contracts & marginal fields
30 Oil Oil ≤ 1km Oil>1km
50 1st 10kbpd 70 61 1st 50kbpd
40 Nxt 10kbpd 55 55 Nxt 50kbpd
30 >20kbpd 50 63 >100kbpd
30
>50 mmbl
cumul vol 50 50
>250-350
mmbl
cumul vol
Gas Gas
50 1st 2.12 tcf 60 1st 2.12 tcf
30 > 2.12 tcf 40 > 2.12 tcf
Export duty
Rsrch cess
Petroleum
income tax 1974-1993: 45%; 1994-1997:40%; 1998: 38%; 2010: 25% (for marginal fields)
Total Profit Tranche
(TPT) depends on R/C
Profit oil
split
(Contractor
share %)
Total Cost Tranche
(TCT) depends on
R/C
0.5% of cost and profit oil
Cost oil
ceiling ^
Apr 1980 - Jan 1995: 25%; Jan 1995 - Jan 1998: 20%; Jan 1998: 10%
106 marginal fields with 580mn barrels (as of Jan 2011). 27
earmarked for development, 10 in near term. Some still under PSCs,
some not. For latter, to be opened up to domestic+foreign consortia
(min 30% Msian equity), and model utilised: risk service contracts.
Under these, Petronas remains owner of oil, whilst consortium bears
development cost. In return they will earn a fee to cover the
infrastructure and production service with a "fair return". In addition, a
performance bonus (capped) will be available. Marginal fields will
have <30mn boe; small fields to be clustered to allow economic
extraction. Petronas estimates breakeven cost to be US$55-
US$60/bbl, and average development cost for a field at ~US$800mn.
Key fiscal terms (^ means % of gross revenue)
15+524
4 PSC variants so far: 1976, 1985 (conventional), 1985 (deepwater), 1996 (R/C). New PSCs since 1996 awarded using 1996 (R/C) model for conventional, 1985 (deepwater) for
water depths of more than 200m. General principle: Government gets first cut of gross revenue via royalty. Then contractors get allocated proportion for cost recovery, subject to
ceiling, where unrecovered costs are carried over. For pre-1996 PSCs, only actual costs can be claimed under cost oil tranche. 1996 PSC gives incentive for cost-saving since
total cost oil tranche depends on cumulative profitability of contractor i.e. R/C (where R is cumulative share of cost and profit oil less supplementary payments, and C is
cumulative recoverable costs spent by contractor) rather than cumulative actual costs spent; unused portion of cost oil tranche is shared between Petronas and contractor. Post
royalty and cost oil tranche, profit oil is shared between Petronas and contractor. Contractor then pays research cess on profit and cost oil, export duty on exported profit oil, and
supplementary payment on profit oil if oil prices exceed threshold price agreed in contract. Both contractor and Petronas pay petroleum income tax to federal government.
Unused TCT TPT
Carigali carried interest: Negotiable; typically 15-25%
Under PSCs between Petronas and companies ,
contractors given right to explore at their own cost areas
defined as blocks, which are in turn divided into sub-
blocks, for initial exploration period (with defined
exploration work programme). During exploration, Carigali
has a carried interest (i.e. has a stake, but does not pay its
share of exploration costs); negotiable but typically 15-25%.
At end of exploration period, sub-blocks not defined as
development areas (with development plans submitted to
Petronas) or gas field: relinquished to Petronas. Holding
period of 5 years allowed for gas fields before non-
development leads to relinquishment. Development and
production occur within fixed time frames; Carigali
contributes its share of development/operation costs i.e.
becomes working partner. Oil production roughly allocated
to 3 tranches: cost oil (primarily cost recovery for
contractors), profit oil (shared between Petronas and
contractors), government share (at various levels)
Ministry of International Trade and Industry (MITI) regulates
processing and refining of petroleum, manufacture of
petrochemical products; Ministry of Domestic Trade and
Consumer Affairs (MDTCA) regulates marketing and
distribution of petroleum products, including retail prices of
gasoline, diesel and LPG.
1976: Production Sharing Contracts (PSCs) introduced.
Petronas - owner of all hydrocarbon reserves; regulator of
upstream activities; under direct control of Prime Minister.
National Depletion Policy 1980: Petronas can restrict
devpt/prod of oil fields (reserves >400mn boe).
1974: Petroleum Development Act; Petronas created,
holds exclusive exploration, development & production
rights
Gross revenue (oil/gas sales)
Less: Royalty @ 10%
Government
Less: Cost oil tranche, subject to
Ceiling
Equals: Profit oil
Actual used cost oil (cumulative
unrecovered opex + capex)
Unused portion of cost oil tranche
Only for 1996 (R/C) model
PetronasContractor net
cashflow
Contractor share of cost oil tranche
Less: export duty & supplementary
payment
Less: research cess
Less: petroleum income tax
Less: opex + capex
Contractor share of profit oil tranche
Contractor share of profit and unused
cost oil (pre-income tax)
Less: petroleum income tax
Petronas share of profit and unused
cost oil
Less: research cess
Source: Woodmackenzie data, various media reports, Credit Suisse estimates
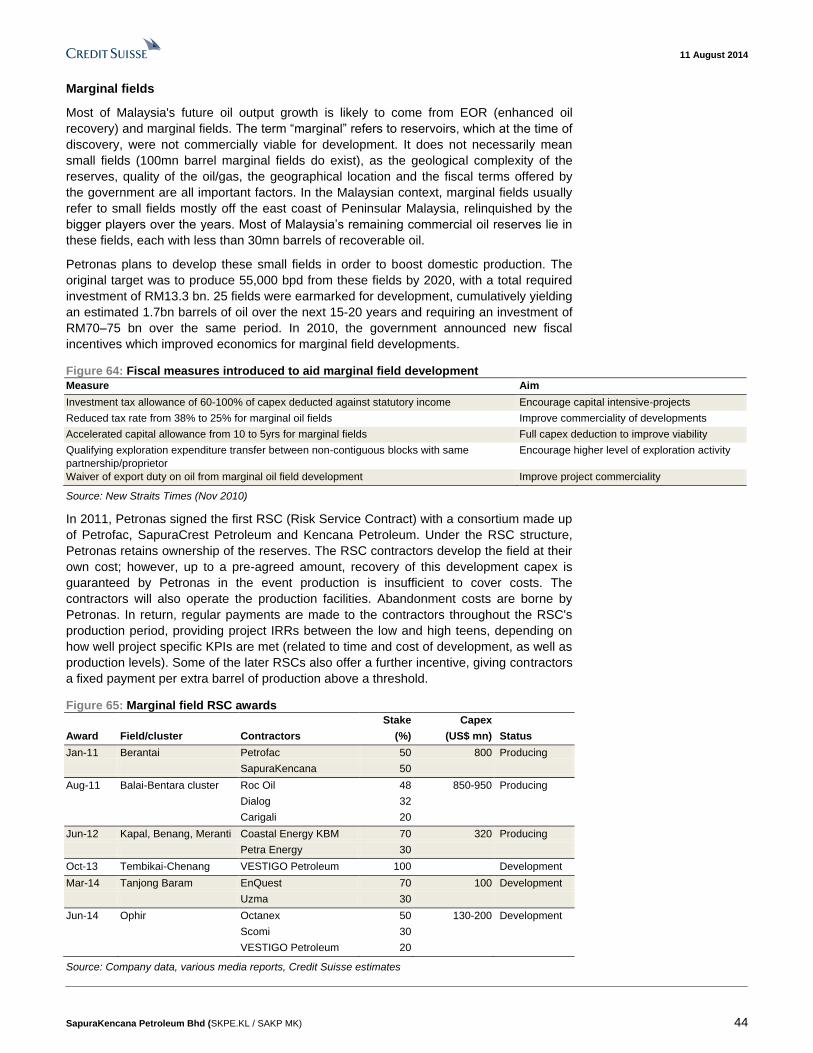
11 August 2014
SapuraKencana Petroleum Bhd (SKPE.KL / SAKP MK) 44
Marginal fields
Most of Malaysia's future oil output growth is likely to come from EOR (enhanced oil
recovery) and marginal fields. The term “marginal” refers to reservoirs, which at the time of
discovery, were not commercially viable for development. It does not necessarily mean
small fields (100mn barrel marginal fields do exist), as the geological complexity of the
reserves, quality of the oil/gas, the geographical location and the fiscal terms offered by
the government are all important factors. In the Malaysian context, marginal fields usually
refer to small fields mostly off the east coast of Peninsular Malaysia, relinquished by the
bigger players over the years. Most of Malaysia’s remaining commercial oil reserves lie in
these fields, each with less than 30mn barrels of recoverable oil.
Petronas plans to develop these small fields in order to boost domestic production. The
original target was to produce 55,000 bpd from these fields by 2020, with a total required
investment of RM13.3 bn. 25 fields were earmarked for development, cumulatively yielding
an estimated 1.7bn barrels of oil over the next 15-20 years and requiring an investment of
RM70–75 bn over the same period. In 2010, the government announced new fiscal
incentives which improved economics for marginal field developments.
Figure 64: Fiscal measures introduced to aid marginal field development
Measure Aim
Investment tax allowance of 60-100% of capex deducted against statutory income Encourage capital intensive-projects
Reduced tax rate from 38% to 25% for marginal oil fields Improve commerciality of developments
Accelerated capital allowance from 10 to 5yrs for marginal fields Full capex deduction to improve viability
Qualifying exploration expenditure transfer between non-contiguous blocks with same
partnership/proprietor
Encourage higher level of exploration activity
Waiver of export duty on oil from marginal oil field development Improve project commerciality
Source: New Straits Times (Nov 2010)
In 2011, Petronas signed the first RSC (Risk Service Contract) with a consortium made up
of Petrofac, SapuraCrest Petroleum and Kencana Petroleum. Under the RSC structure,
Petronas retains ownership of the reserves. The RSC contractors develop the field at their
own cost; however, up to a pre-agreed amount, recovery of this development capex is
guaranteed by Petronas in the event production is insufficient to cover costs. The
contractors will also operate the production facilities. Abandonment costs are borne by
Petronas. In return, regular payments are made to the contractors throughout the RSC's
production period, providing project IRRs between the low and high teens, depending on
how well project specific KPIs are met (related to time and cost of development, as well as
production levels). Some of the later RSCs also offer a further incentive, giving contractors
a fixed payment per extra barrel of production above a threshold.
Figure 65: Marginal field RSC awards
Stake Capex
Award Field/cluster Contractors (%) (US$ mn) Status
Jan-11 Berantai Petrofac 50 800 Producing
SapuraKencana 50
Aug-11 Balai-Bentara cluster Roc Oil 48 850-950 Producing
Dialog 32
Carigali 20
Jun-12 Kapal, Benang, Meranti Coastal Energy KBM 70 320 Producing
Petra Energy 30
Oct-13 Tembikai-Chenang VESTIGO Petroleum 100 Development
Mar-14 Tanjong Baram EnQuest 70 100 Development
Uzma 30
Jun-14 Ophir Octanex 50 130-200 Development
Scomi 30
VESTIGO Petroleum 20
Source: Company data, various media reports, Credit Suisse estimates
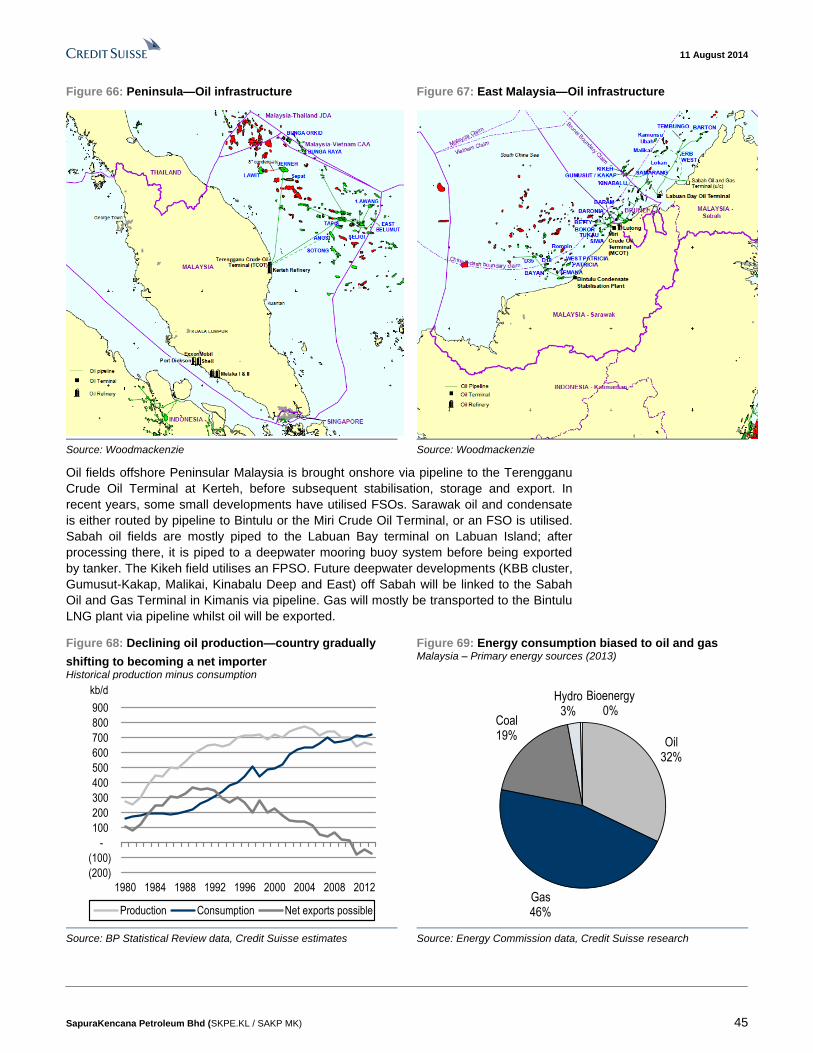
11 August 2014
SapuraKencana Petroleum Bhd (SKPE.KL / SAKP MK) 45
Figure 66: Peninsula—Oil infrastructure
Figure 67: East Malaysia—Oil infrastructure
Source: Woodmackenzie Source: Woodmackenzie
Oil fields offshore Peninsular Malaysia is brought onshore via pipeline to the Terengganu
Crude Oil Terminal at Kerteh, before subsequent stabilisation, storage and export. In
recent years, some small developments have utilised FSOs. Sarawak oil and condensate
is either routed by pipeline to Bintulu or the Miri Crude Oil Terminal, or an FSO is utilised.
Sabah oil fields are mostly piped to the Labuan Bay terminal on Labuan Island; after
processing there, it is piped to a deepwater mooring buoy system before being exported
by tanker. The Kikeh field utilises an FPSO. Future deepwater developments (KBB cluster,
Gumusut-Kakap, Malikai, Kinabalu Deep and East) off Sabah will be linked to the Sabah
Oil and Gas Terminal in Kimanis via pipeline. Gas will mostly be transported to the Bintulu
LNG plant via pipeline whilst oil will be exported.
Figure 68: Declining oil production—country gradually
shifting to becoming a net importer Historical production minus consumption
Figure 69: Energy consumption biased to oil and gas Malaysia – Primary energy sources (2013)
(200)
(100)
-
100
200
300
400
500
600
700
800
900
1980 1984 1988 1992 1996 2000 2004 2008 2012
kb/d
Production Consumption Net exports possible
Oil32%
Gas46%
Coal19%
Hydro3%
Bioenergy0%
Source: BP Statistical Review data, Credit Suisse estimates Source: Energy Commission data, Credit Suisse research
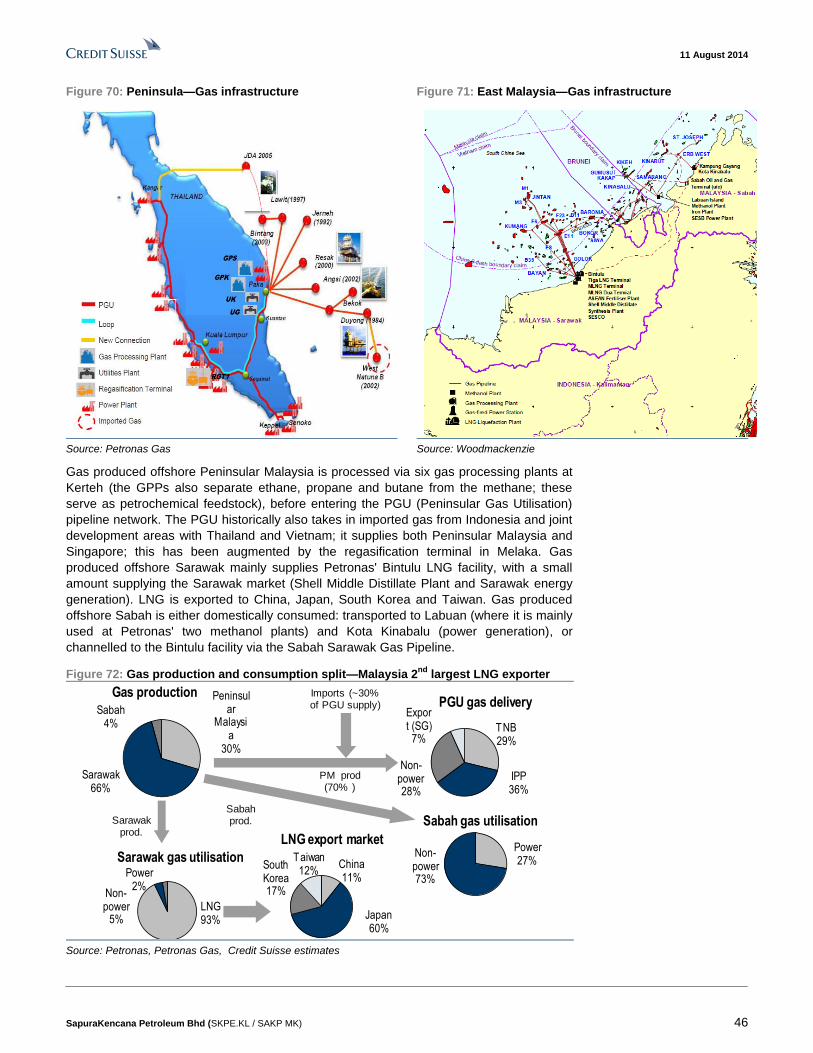
11 August 2014
SapuraKencana Petroleum Bhd (SKPE.KL / SAKP MK) 46
Figure 70: Peninsula—Gas infrastructure
Figure 71: East Malaysia—Gas infrastructure
Source: Petronas Gas Source: Woodmackenzie
Gas produced offshore Peninsular Malaysia is processed via six gas processing plants at
Kerteh (the GPPs also separate ethane, propane and butane from the methane; these
serve as petrochemical feedstock), before entering the PGU (Peninsular Gas Utilisation)
pipeline network. The PGU historically also takes in imported gas from Indonesia and joint
development areas with Thailand and Vietnam; it supplies both Peninsular Malaysia and
Singapore; this has been augmented by the regasification terminal in Melaka. Gas
produced offshore Sarawak mainly supplies Petronas' Bintulu LNG facility, with a small
amount supplying the Sarawak market (Shell Middle Distillate Plant and Sarawak energy
generation). LNG is exported to China, Japan, South Korea and Taiwan. Gas produced
offshore Sabah is either domestically consumed: transported to Labuan (where it is mainly
used at Petronas' two methanol plants) and Kota Kinabalu (power generation), or
channelled to the Bintulu facility via the Sabah Sarawak Gas Pipeline.
Figure 72: Gas production and consumption split—Malaysia 2nd
largest LNG exporter
China11%
Japan60%
South Korea17%
Taiwan12%
LNG export market
TNB29%
IPP36%
Non-power28%
Export (SG)
7%
PGU gas deliveryPeninsul
ar Malaysi
a30%
Sarawak66%
Sabah4%
Gas production
LNG93%
Non-power
5%
Power2%
Sarawak gas utilisation
PM prod (70% )
Imports (~30% of PGU supply)
Sabah prod.Sarawak
prod.
Power27%
Non-power73%
Sabah gas utilisation
Source: Petronas, Petronas Gas, Credit Suisse estimates
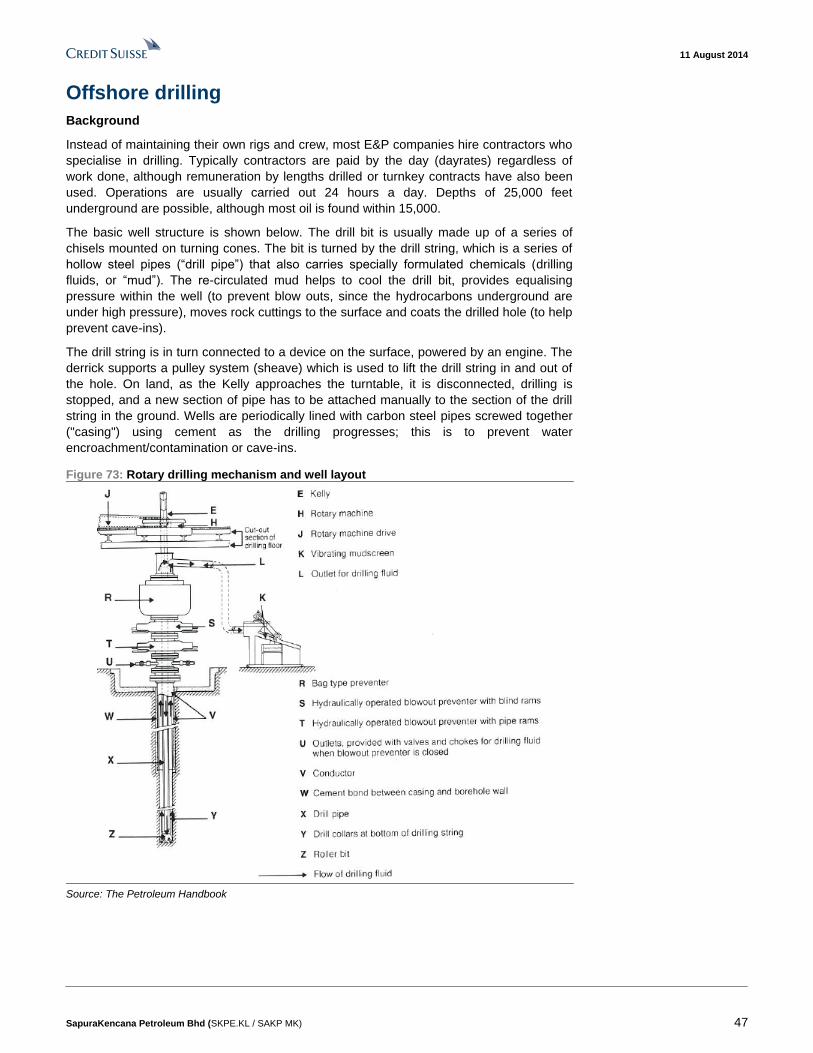
11 August 2014
SapuraKencana Petroleum Bhd (SKPE.KL / SAKP MK) 47
Offshore drilling
Background
Instead of maintaining their own rigs and crew, most E&P companies hire contractors who
specialise in drilling. Typically contractors are paid by the day (dayrates) regardless of
work done, although remuneration by lengths drilled or turnkey contracts have also been
used. Operations are usually carried out 24 hours a day. Depths of 25,000 feet
underground are possible, although most oil is found within 15,000.
The basic well structure is shown below. The drill bit is usually made up of a series of
chisels mounted on turning cones. The bit is turned by the drill string, which is a series of
hollow steel pipes (“drill pipe”) that also carries specially formulated chemicals (drilling
fluids, or “mud”). The re-circulated mud helps to cool the drill bit, provides equalising
pressure within the well (to prevent blow outs, since the hydrocarbons underground are
under high pressure), moves rock cuttings to the surface and coats the drilled hole (to help
prevent cave-ins).
The drill string is in turn connected to a device on the surface, powered by an engine. The
derrick supports a pulley system (sheave) which is used to lift the drill string in and out of
the hole. On land, as the Kelly approaches the turntable, it is disconnected, drilling is
stopped, and a new section of pipe has to be attached manually to the section of the drill
string in the ground. Wells are periodically lined with carbon steel pipes screwed together
("casing") using cement as the drilling progresses; this is to prevent water
encroachment/contamination or cave-ins.
Figure 73: Rotary drilling mechanism and well layout
Source: The Petroleum Handbook
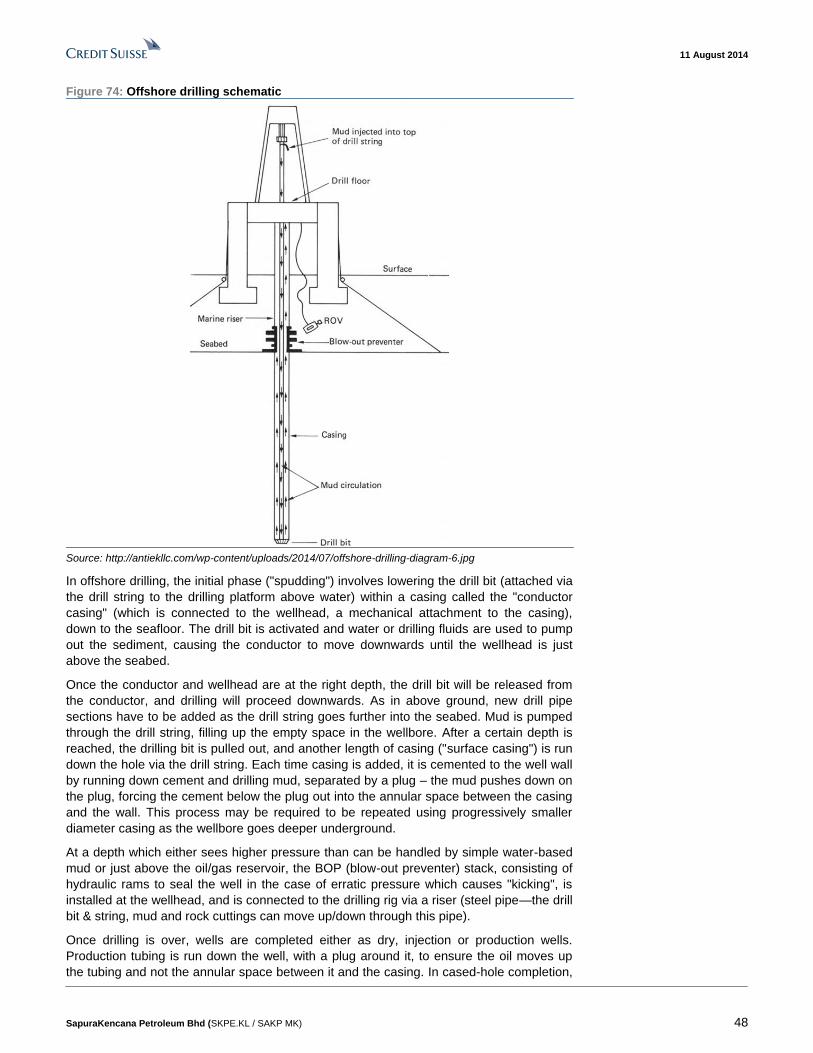
11 August 2014
SapuraKencana Petroleum Bhd (SKPE.KL / SAKP MK) 48
Figure 74: Offshore drilling schematic
Source: http://antiekllc.com/wp-content/uploads/2014/07/offshore-drilling-diagram-6.jpg
In offshore drilling, the initial phase ("spudding") involves lowering the drill bit (attached via
the drill string to the drilling platform above water) within a casing called the "conductor
casing" (which is connected to the wellhead, a mechanical attachment to the casing),
down to the seafloor. The drill bit is activated and water or drilling fluids are used to pump
out the sediment, causing the conductor to move downwards until the wellhead is just
above the seabed.
Once the conductor and wellhead are at the right depth, the drill bit will be released from
the conductor, and drilling will proceed downwards. As in above ground, new drill pipe
sections have to be added as the drill string goes further into the seabed. Mud is pumped
through the drill string, filling up the empty space in the wellbore. After a certain depth is
reached, the drilling bit is pulled out, and another length of casing ("surface casing") is run
down the hole via the drill string. Each time casing is added, it is cemented to the well wall
by running down cement and drilling mud, separated by a plug – the mud pushes down on
the plug, forcing the cement below the plug out into the annular space between the casing
and the wall. This process may be required to be repeated using progressively smaller
diameter casing as the wellbore goes deeper underground.
At a depth which either sees higher pressure than can be handled by simple water-based
mud or just above the oil/gas reservoir, the BOP (blow-out preventer) stack, consisting of
hydraulic rams to seal the well in the case of erratic pressure which causes "kicking", is
installed at the wellhead, and is connected to the drilling rig via a riser (steel pipe—the drill
bit & string, mud and rock cuttings can move up/down through this pipe).
Once drilling is over, wells are completed either as dry, injection or production wells.
Production tubing is run down the well, with a plug around it, to ensure the oil moves up
the tubing and not the annular space between it and the casing. In cased-hole completion,
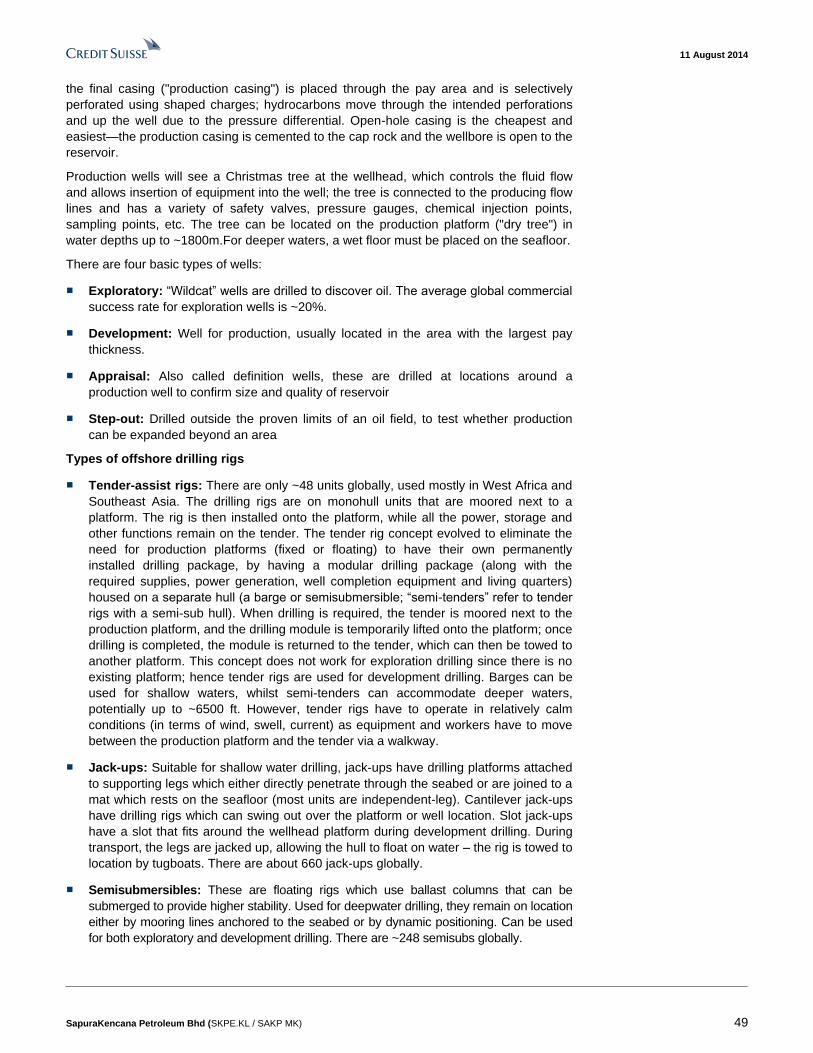
11 August 2014
SapuraKencana Petroleum Bhd (SKPE.KL / SAKP MK) 49
the final casing ("production casing") is placed through the pay area and is selectively
perforated using shaped charges; hydrocarbons move through the intended perforations
and up the well due to the pressure differential. Open-hole casing is the cheapest and
easiest—the production casing is cemented to the cap rock and the wellbore is open to the
reservoir.
Production wells will see a Christmas tree at the wellhead, which controls the fluid flow
and allows insertion of equipment into the well; the tree is connected to the producing flow
lines and has a variety of safety valves, pressure gauges, chemical injection points,
sampling points, etc. The tree can be located on the production platform ("dry tree") in
water depths up to ~1800m.For deeper waters, a wet floor must be placed on the seafloor.
There are four basic types of wells:
■ Exploratory: “Wildcat” wells are drilled to discover oil. The average global commercial
success rate for exploration wells is ~20%.
■ Development: Well for production, usually located in the area with the largest pay
thickness.
■ Appraisal: Also called definition wells, these are drilled at locations around a
production well to confirm size and quality of reservoir
■ Step-out: Drilled outside the proven limits of an oil field, to test whether production
can be expanded beyond an area
Types of offshore drilling rigs
■ Tender-assist rigs: There are only ~48 units globally, used mostly in West Africa and
Southeast Asia. The drilling rigs are on monohull units that are moored next to a
platform. The rig is then installed onto the platform, while all the power, storage and
other functions remain on the tender. The tender rig concept evolved to eliminate the
need for production platforms (fixed or floating) to have their own permanently
installed drilling package, by having a modular drilling package (along with the
required supplies, power generation, well completion equipment and living quarters)
housed on a separate hull (a barge or semisubmersible; “semi-tenders” refer to tender
rigs with a semi-sub hull). When drilling is required, the tender is moored next to the
production platform, and the drilling module is temporarily lifted onto the platform; once
drilling is completed, the module is returned to the tender, which can then be towed to
another platform. This concept does not work for exploration drilling since there is no
existing platform; hence tender rigs are used for development drilling. Barges can be
used for shallow waters, whilst semi-tenders can accommodate deeper waters,
potentially up to ~6500 ft. However, tender rigs have to operate in relatively calm
conditions (in terms of wind, swell, current) as equipment and workers have to move
between the production platform and the tender via a walkway.
■ Jack-ups: Suitable for shallow water drilling, jack-ups have drilling platforms attached
to supporting legs which either directly penetrate through the seabed or are joined to a
mat which rests on the seafloor (most units are independent-leg). Cantilever jack-ups
have drilling rigs which can swing out over the platform or well location. Slot jack-ups
have a slot that fits around the wellhead platform during development drilling. During
transport, the legs are jacked up, allowing the hull to float on water – the rig is towed to
location by tugboats. There are about 660 jack-ups globally.
■ Semisubmersibles: These are floating rigs which use ballast columns that can be
submerged to provide higher stability. Used for deepwater drilling, they remain on location
either by mooring lines anchored to the seabed or by dynamic positioning. Can be used
for both exploratory and development drilling. There are ~248 semisubs globally.
11 August 2014
SapuraKencana Petroleum Bhd (SKPE.KL / SAKP MK) 50
■ Drillships: Ship-shaped rigs which are self-propelled; drilling rigs operate through a
moonpool on deck. Suitable for deepwater and remote locations, requiring fewer
supply boat trips compared to semisubs. There are ~ 174 drillships globally.
■ Platform rigs: Self-contained rigs placed on platforms for development drilling. ~250
units globally.
■ Inland barges: Used for inland waters close to shore, e.g. in the Gulf of Mexico. ~70
inland barges globally.
Figure 75: Tender barge (right) and platform (left) Figure 76: Jack-up rig
Source: www.drillingcontractor.org Source: www.drillingcontractor.org
Figure 77: Semisub Figure 78: Drillship
Source: www.worldmaritimenews.com Source: www.offshoreenergytoday.com
11 August 2014
SapuraKencana Petroleum Bhd (SKPE.KL / SAKP MK) 51
Offshore Construction and Subsea Services
Figure 79: Typical field layout
Source: http://www.piping-engineering.com/offshore-pipelines-design-activities.html
Pipelaying & SURF (Subsea Umbilicals, Risers, Flowlines)
Subsea pipelines are an integral part of offshore O&G infrastructure, used to transport the
hydrocarbon streams to shore. They go up to ~60 inches in diameter, can be laid for
hundreds of kilometres, and have so far been installed in water depths of up to ~3000m.
There are two main types of pipes used in the industry: rigid and flexible.
■ Rigid: These are typically used for shallow to medium water depths (though flexible
pipe is encroaching on this). Rigid pipes are made of single steel sections; these are
welded together on the vessel. The advantages of rigid pipe include its cheaper
upfront cost and easy availability; however total lifetime costs for flexible pipe may be
lower due to easier installation (half the installation cost, mainly due to lack of offshore
welding labour requirement) and lower operating cost due to higher reliability.
■ Flexible: Suitable for deepwater and ultra deepwater markets, flexible pipes are made
up of several different layers (from 4 up to 19 layers depending on the application), the
main components of which are helically wound corrosion-resistant steel wires (which
provide the structure high-pressure resistance and excellent bending characteristics)
and leak-proof thermoplastic barriers. Flexible pipe comes in a continuous length and
can be spooled onto a reel or carousel, which allows for efficient and quick storage,
transportation and installation—common laying speeds are 500m per hour due to the
elimination of the welding process. The welding of the pipe onshore also reduces the
chances of problems with the pipe as well as the resulting time-consuming and
expensive underwater repair process.
Export or transmission pipelines are used to transport hydrocarbons from offshore facilities
to land. Flowlines are also made from pipe, but transport hydrocarbons from wellhead to
the processing equipment on the nearby platform. Risers are another type of pipeline that
move material between subsea and topside (hydrocarbon streams, mud, injection
chemicals, water). Umbilicals are cables which provide power and signal/control lines
between topside and subsea equipment. Either rigid or flexible pipe can be used for risers,
flowlines and export pipelines. Installation of SURF typically requires the use of remotely-
11 August 2014
SapuraKencana Petroleum Bhd (SKPE.KL / SAKP MK) 52
operated vehicles (ROVs), which are robots that can be controlled from the surface, and
can go down as deep as ~5000m. For shallower depths, human divers can do the work,
using a saturation diving system. SURF installation work and expenditure is one of the
fastest growing markets as more and more field development occurs in deeper waters.
About 70-80% of total offshore field expenditure is typically spent on the development
phase. Within this, a significant amount is spent on pipeline and subsea infrastructure;
according to Woodmackenzie data for example, pipeline and subsea-related capex
accounted for ~20% of total field development capex in Malaysia in 2013, despite its
mature infrastructure.
Pipelaying is typically done in four main ways:
■ S–lay: Suitable for shallow to medium water depths (up to 300m). In this configuration,
steel pipe sections are welded together onboard the pipe-lay vessel. The resulting
pipeline is gripped by a device called a tensioner which pays the pipeline out of the
vessel as it moves forward, guided by the stinger (a structure at the back of the ship),
onto the seabed.
The rationale for S-lay is as follows: When a segment of the pipeline reaches the
seabed, there is significant bending stress in this region of the pipe (“sag-bend”). This
can contribute to fatigue, and eventually pipeline leaks. At the same time, since the
pipeline exits the welding stations at a horizontal angle, the top of the pipeline
(“overbend”) also sees significant bending stresses. Furthermore, the pipe is heavy; as
a result, if it was just dumped out of the vessel after being welded, it is possible for it to
buckle under its own weight as it is being laid onto the seafloor.
The bending stresses at the top of the pipe (i.e., near surface) are reduced via the use
of the stinger, which supports/guides the pipeline and controls its bending radius by
adjusting the angle at which the pipeline enters the water. The tensioner provides a
force to counter the weight, which reduces buckling stress as well as bending stress at
the sag-bend area. Think of the pipe as a string—the tensioner provides tension in the
string by gripping it and paying it out at a measured pace as the vessel moves forward
i.e., it effectively allows the vessel to “pull” the string. The result of this configuration is
the S shape described by the name. A disadvantage of S-lay is that any particular
section will see bending twice—once at the top, and once at the bottom.
■ J-lay: Used for deepwater pipelaying. In deeper waters, S-lay faces a problem
because the suspended length of the pipe is significant—as a result, the weight pulling
down on the top section of the pipe (i.e., closer to surface) results in large bending
stress, due to stinger length limitations (the deeper the water, the longer the stinger
required, which becomes uneconomical at a certain point).To get around this, in J-lay,
the pipe is paid out through tall J-lay towers, which allows it to enter the water at an
angle that is closer to the vertical, eliminating bending stresses at the top of the pipe.
Additionally, the pipe is only bent once, near the seabed.
The disadvantage of J-lay is that the high lay towers mean that segments are loaded
in batches, rather than continuously one after another, as seen in S-lay, reducing the
speed of installation. Tensioners also have to be of higher capacity, because there is
no stinger to help support some of the pipe weight (on top of the fact that deeper
waters will result in longer suspended pipe lengths and hence weight to be supported).
Friction clamps can be used to increase capacity substantially. The pipe resembles a
J, in this configuration, hence the name. J-lay is not suitable for shallow water as the
almost-vertical entry into the water, combined with the short distance to the seabed
can result in significant bending stresses at the top.
■ Reel-lay: Rigid or flexible pipes are spooled in reels, and fed into a pipe straightener
before being overboarded as the vessel moves forward. A tensioner is still required to
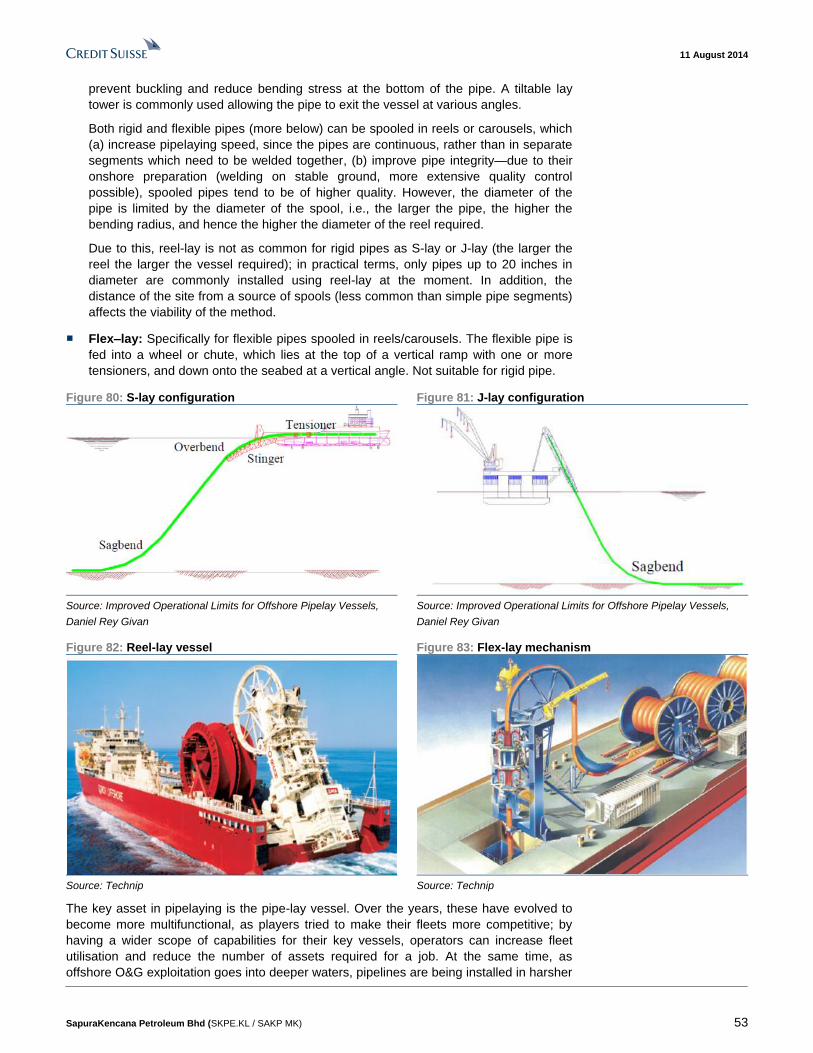
11 August 2014
SapuraKencana Petroleum Bhd (SKPE.KL / SAKP MK) 53
prevent buckling and reduce bending stress at the bottom of the pipe. A tiltable lay
tower is commonly used allowing the pipe to exit the vessel at various angles.
Both rigid and flexible pipes (more below) can be spooled in reels or carousels, which
(a) increase pipelaying speed, since the pipes are continuous, rather than in separate
segments which need to be welded together, (b) improve pipe integrity—due to their
onshore preparation (welding on stable ground, more extensive quality control
possible), spooled pipes tend to be of higher quality. However, the diameter of the
pipe is limited by the diameter of the spool, i.e., the larger the pipe, the higher the
bending radius, and hence the higher the diameter of the reel required.
Due to this, reel-lay is not as common for rigid pipes as S-lay or J-lay (the larger the
reel the larger the vessel required); in practical terms, only pipes up to 20 inches in
diameter are commonly installed using reel-lay at the moment. In addition, the
distance of the site from a source of spools (less common than simple pipe segments)
affects the viability of the method.
■ Flex–lay: Specifically for flexible pipes spooled in reels/carousels. The flexible pipe is
fed into a wheel or chute, which lies at the top of a vertical ramp with one or more
tensioners, and down onto the seabed at a vertical angle. Not suitable for rigid pipe.
Figure 80: S-lay configuration Figure 81: J-lay configuration
Source: Improved Operational Limits for Offshore Pipelay Vessels,
Daniel Rey Givan
Source: Improved Operational Limits for Offshore Pipelay Vessels,
Daniel Rey Givan
Figure 82: Reel-lay vessel Figure 83: Flex-lay mechanism
Source: Technip Source: Technip
The key asset in pipelaying is the pipe-lay vessel. Over the years, these have evolved to
become more multifunctional, as players tried to make their fleets more competitive; by
having a wider scope of capabilities for their key vessels, operators can increase fleet
utilisation and reduce the number of assets required for a job. At the same time, as
offshore O&G exploitation goes into deeper waters, pipelines are being installed in harsher
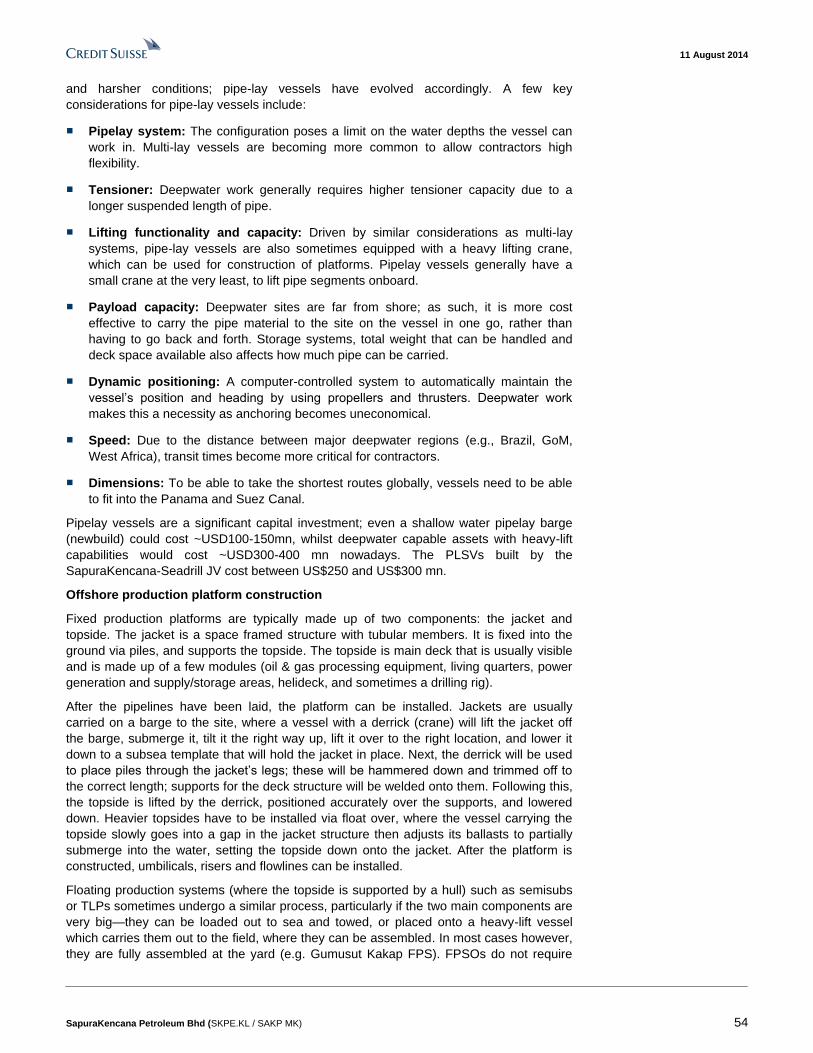
11 August 2014
SapuraKencana Petroleum Bhd (SKPE.KL / SAKP MK) 54
and harsher conditions; pipe-lay vessels have evolved accordingly. A few key
considerations for pipe-lay vessels include:
■ Pipelay system: The configuration poses a limit on the water depths the vessel can
work in. Multi-lay vessels are becoming more common to allow contractors high
flexibility.
■ Tensioner: Deepwater work generally requires higher tensioner capacity due to a
longer suspended length of pipe.
■ Lifting functionality and capacity: Driven by similar considerations as multi-lay
systems, pipe-lay vessels are also sometimes equipped with a heavy lifting crane,
which can be used for construction of platforms. Pipelay vessels generally have a
small crane at the very least, to lift pipe segments onboard.
■ Payload capacity: Deepwater sites are far from shore; as such, it is more cost
effective to carry the pipe material to the site on the vessel in one go, rather than
having to go back and forth. Storage systems, total weight that can be handled and
deck space available also affects how much pipe can be carried.
■ Dynamic positioning: A computer-controlled system to automatically maintain the
vessel’s position and heading by using propellers and thrusters. Deepwater work
makes this a necessity as anchoring becomes uneconomical.
■ Speed: Due to the distance between major deepwater regions (e.g., Brazil, GoM,
West Africa), transit times become more critical for contractors.
■ Dimensions: To be able to take the shortest routes globally, vessels need to be able
to fit into the Panama and Suez Canal.
Pipelay vessels are a significant capital investment; even a shallow water pipelay barge
(newbuild) could cost ~USD100-150mn, whilst deepwater capable assets with heavy-lift
capabilities would cost ~USD300-400 mn nowadays. The PLSVs built by the
SapuraKencana-Seadrill JV cost between US$250 and US$300 mn.
Offshore production platform construction
Fixed production platforms are typically made up of two components: the jacket and
topside. The jacket is a space framed structure with tubular members. It is fixed into the
ground via piles, and supports the topside. The topside is main deck that is usually visible
and is made up of a few modules (oil & gas processing equipment, living quarters, power
generation and supply/storage areas, helideck, and sometimes a drilling rig).
After the pipelines have been laid, the platform can be installed. Jackets are usually
carried on a barge to the site, where a vessel with a derrick (crane) will lift the jacket off
the barge, submerge it, tilt it the right way up, lift it over to the right location, and lower it
down to a subsea template that will hold the jacket in place. Next, the derrick will be used
to place piles through the jacket’s legs; these will be hammered down and trimmed off to
the correct length; supports for the deck structure will be welded onto them. Following this,
the topside is lifted by the derrick, positioned accurately over the supports, and lowered
down. Heavier topsides have to be installed via float over, where the vessel carrying the
topside slowly goes into a gap in the jacket structure then adjusts its ballasts to partially
submerge into the water, setting the topside down onto the jacket. After the platform is
constructed, umbilicals, risers and flowlines can be installed.
Floating production systems (where the topside is supported by a hull) such as semisubs
or TLPs sometimes undergo a similar process, particularly if the two main components are
very big—they can be loaded out to sea and towed, or placed onto a heavy-lift vessel
which carries them out to the field, where they can be assembled. In most cases however,
they are fully assembled at the yard (e.g. Gumusut Kakap FPS). FPSOs do not require
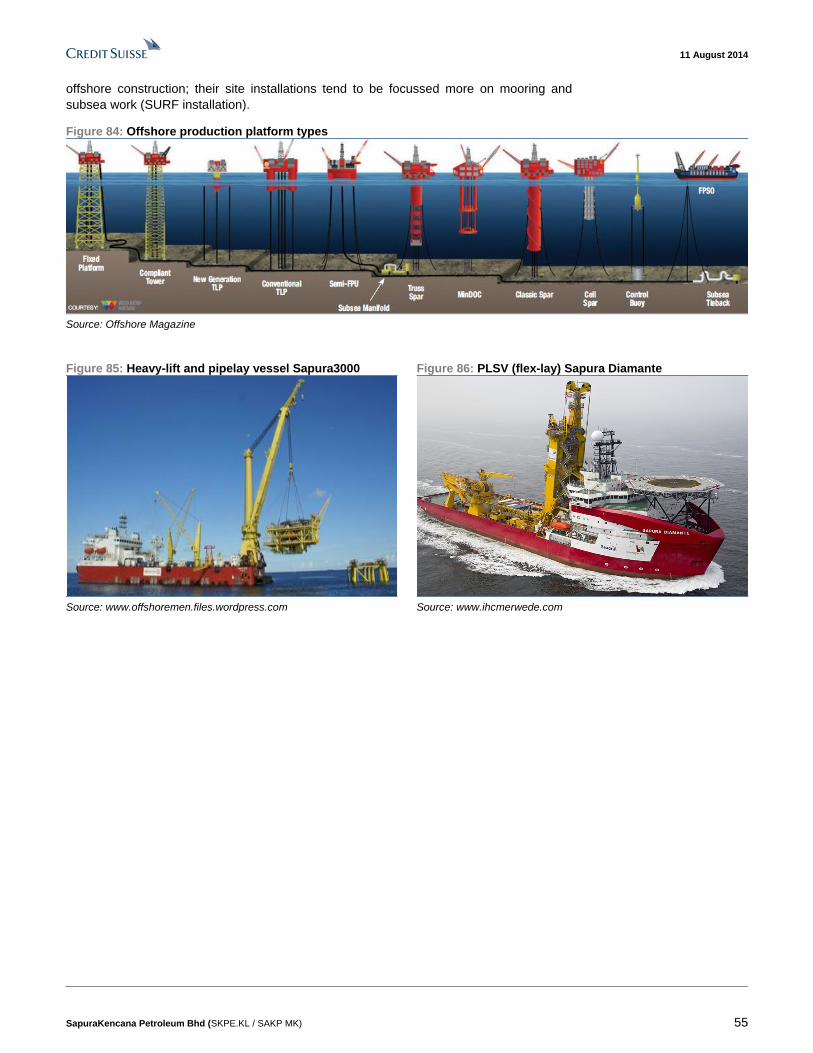
11 August 2014
SapuraKencana Petroleum Bhd (SKPE.KL / SAKP MK) 55
offshore construction; their site installations tend to be focussed more on mooring and
subsea work (SURF installation).
Figure 84: Offshore production platform types
Source: Offshore Magazine
Figure 85: Heavy-lift and pipelay vessel Sapura3000 Figure 86: PLSV (flex-lay) Sapura Diamante
Source: www.offshoremen.files.wordpress.com Source: www.ihcmerwede.com
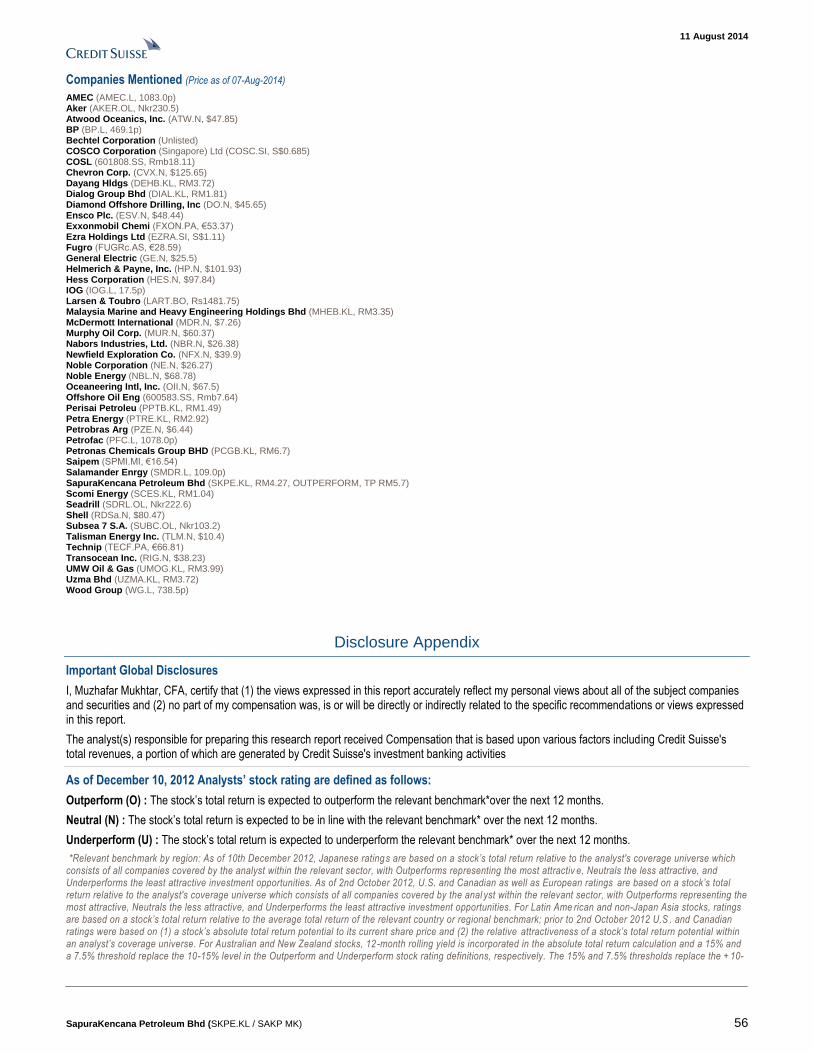
11 August 2014
SapuraKencana Petroleum Bhd (SKPE.KL / SAKP MK) 56
Companies Mentioned (Price as of 07-Aug-2014)
AMEC (AMEC.L, 1083.0p) Aker (AKER.OL, Nkr230.5) Atwood Oceanics, Inc. (ATW.N, $47.85) BP (BP.L, 469.1p) Bechtel Corporation (Unlisted) COSCO Corporation (Singapore) Ltd (COSC.SI, S$0.685) COSL (601808.SS, Rmb18.11) Chevron Corp. (CVX.N, $125.65) Dayang Hldgs (DEHB.KL, RM3.72) Dialog Group Bhd (DIAL.KL, RM1.81) Diamond Offshore Drilling, Inc (DO.N, $45.65) Ensco Plc. (ESV.N, $48.44) Exxonmobil Chemi (FXON.PA, €53.37) Ezra Holdings Ltd (EZRA.SI, S$1.11) Fugro (FUGRc.AS, €28.59) General Electric (GE.N, $25.5) Helmerich & Payne, Inc. (HP.N, $101.93) Hess Corporation (HES.N, $97.84) IOG (IOG.L, 17.5p) Larsen & Toubro (LART.BO, Rs1481.75) Malaysia Marine and Heavy Engineering Holdings Bhd (MHEB.KL, RM3.35) McDermott International (MDR.N, $7.26) Murphy Oil Corp. (MUR.N, $60.37) Nabors Industries, Ltd. (NBR.N, $26.38) Newfield Exploration Co. (NFX.N, $39.9) Noble Corporation (NE.N, $26.27) Noble Energy (NBL.N, $68.78) Oceaneering Intl, Inc. (OII.N, $67.5) Offshore Oil Eng (600583.SS, Rmb7.64) Perisai Petroleu (PPTB.KL, RM1.49) Petra Energy (PTRE.KL, RM2.92) Petrobras Arg (PZE.N, $6.44) Petrofac (PFC.L, 1078.0p) Petronas Chemicals Group BHD (PCGB.KL, RM6.7) Saipem (SPMI.MI, €16.54) Salamander Enrgy (SMDR.L, 109.0p) SapuraKencana Petroleum Bhd (SKPE.KL, RM4.27, OUTPERFORM, TP RM5.7) Scomi Energy (SCES.KL, RM1.04) Seadrill (SDRL.OL, Nkr222.6) Shell (RDSa.N, $80.47) Subsea 7 S.A. (SUBC.OL, Nkr103.2) Talisman Energy Inc. (TLM.N, $10.4) Technip (TECF.PA, €66.81) Transocean Inc. (RIG.N, $38.23) UMW Oil & Gas (UMOG.KL, RM3.99) Uzma Bhd (UZMA.KL, RM3.72) Wood Group (WG.L, 738.5p)
Disclosure Appendix
Important Global Disclosures
I, Muzhafar Mukhtar, CFA, certify that (1) the views expressed in this report accurately reflect my personal views about all of the subject companies and securities and (2) no part of my compensation was, is or will be directly or indirectly related to the specific recommendations or views expressed in this report.
The analyst(s) responsible for preparing this research report received Compensation that is based upon various factors including Credit Suisse's total revenues, a portion of which are generated by Credit Suisse's investment banking activities
As of December 10, 2012 Analysts’ stock rating are defined as follows:
Outperform (O) : The stock’s total return is expected to outperform the relevant benchmark*over the next 12 months.
Neutral (N) : The stock’s total return is expected to be in line with the relevant benchmark* over the next 12 months.
Underperform (U) : The stock’s total return is expected to underperform the relevant benchmark* over the next 12 months.
*Relevant benchmark by region: As of 10th December 2012, Japanese ratings are based on a stock’s total return relative to the analyst's coverage universe which consists of all companies covered by the analyst within the relevant sector, with Outperforms representing the most attractiv e, Neutrals the less attractive, and Underperforms the least attractive investment opportunities. As of 2nd October 2012, U.S. and Canadian as well as European ratings are based on a stock’s total return relative to the analyst's coverage universe which consists of all companies covered by the anal yst within the relevant sector, with Outperforms representing the most attractive, Neutrals the less attractive, and Underperforms the least attractive investment opportunities. For Latin Ame rican and non-Japan Asia stocks, ratings are based on a stock’s total return relative to the average total return of the relevant country or regional benchmark; prior to 2nd October 2012 U.S . and Canadian ratings were based on (1) a stock’s absolute total return potential to its current share price and (2) the relative attractiveness of a stock’s total return potential within an analyst’s coverage universe. For Australian and New Zealand stocks, 12 -month rolling yield is incorporated in the absolute total return calculation and a 15% and a 7.5% threshold replace the 10-15% level in the Outperform and Underperform stock rating definitions, respectively. The 15% and 7.5% thresholds replace the + 10-
11 August 2014
SapuraKencana Petroleum Bhd (SKPE.KL / SAKP MK) 57
15% and -10-15% levels in the Neutral stock rating definition, respectively. Prior to 10th December 2012, Japanese ratings were based on a stock’s total return relative to the average total return of the relevant country or regional benchmark.
Restricted (R) : In certain circumstances, Credit Suisse policy and/or applicable law and regulations preclude certain types of communications, including an investment recommendation, during the course of Credit Suisse's engagement in an investment banking transaction and in certain other circumstances.
Volatility Indicator [V] : A stock is defined as volatile if the stock price has moved up or down by 20% or more in a month in at least 8 of the past 24 months or the analyst expects significant volatility going forward.
Analysts’ sector weightings are distinct from analysts’ stock ratings and are based on the analyst’s expectations for the fundamentals and/or valuation of the sector* relative to the group’s historic fundamentals and/or valuation:
Overweight : The analyst’s expectation for the sector’s fundamentals and/or valuation is favorable over the next 12 months.
Market Weight : The analyst’s expectation for the sector’s fundamentals and/or valuation is neutral over the next 12 months.
Underweight : The analyst’s expectation for the sector’s fundamentals and/or valuation is cautious over the next 12 months.
*An analyst’s coverage sector consists of all companies covered by the analyst within the relevant sector. An analyst may cover multiple sectors.
Credit Suisse's distribution of stock ratings (and banking clients) is:
Global Ratings Distribution
Rating Versus universe (%) Of which banking clients (%)
Outperform/Buy* 44% (53% banking clients)
Neutral/Hold* 40% (51% banking clients)
Underperform/Sell* 13% (46% banking clients)
Restricted 3%
*For purposes of the NYSE and NASD ratings distribution disclosure requirements, our stock rati ngs of Outperform, Neutral, and Underperform most closely correspond to Buy, Hold, and Sell, respectively; however, the meanings are not the same, as our stock ratings are determined on a relative basis. (Please refer to definitions above.) An investor's decision to buy or sell a security should be based on investment objectives, current holdings, and other individual factors.
Credit Suisse’s policy is to update research reports as it deems appropriate, based on developments with the subject company, the sector or the market that may have a material impact on the research views or opinions stated herein.
Credit Suisse's policy is only to publish investment research that is impartial, independent, clear, fair and not misleading. For more detail please refer to Credit Suisse's Policies for Managing Conflicts of Interest in connection with Investment Research: http://www.csfb.com/research and analytics/disclaimer/managing_conflicts_disclaimer.html
Credit Suisse does not provide any tax advice. Any statement herein regarding any US federal tax is not intended or written to be used, and cannot be used, by any taxpayer for the purposes of avoiding any penalties.
Price Target: (12 months) for SapuraKencana Petroleum Bhd (SKPE.KL)
Method: Sapurakencana's target price of RM5.70 is based on (1) an EVA approach for the oilfield services segments (drilling, OCSS, fabrication), using a WACC of 6-8% and LT growth of 3%, (2) NPV (FCFE) for E&P, including a rough valuation for SK408 discoveries, using US$100/bbl, US$8/mmbtu and a 10% discount rate, and (3) NPV for Berantai FCFE, discounted at 10%.
Risk: Contract renewals/wins below expectations for oilfield services segments or significant margin compression. Unsuccessful exploration for remaining five wells in SK408. Failed development of SK310 including failure to secure gas sales agreement with Petronas.
Please refer to the firm's disclosure website at https://rave.credit-suisse.com/disclosures for the definitions of abbreviations typically used in the target price method and risk sections.
See the Companies Mentioned section for full company names
The subject company (SKPE.KL, RIG.N, NBR.N, NE.N, DO.N, ATW.N, SPMI.MI, OII.N, HES.N, TLM.N, NBL.N) currently is, or was during the 12-month period preceding the date of distribution of this report, a client of Credit Suisse.
Credit Suisse provided investment banking services to the subject company (SKPE.KL, RIG.N, DO.N, ATW.N, HES.N) within the past 12 months.
Credit Suisse provided non-investment banking services to the subject company (RIG.N, NBR.N, NE.N, TLM.N, NBL.N) within the past 12 months
Credit Suisse has managed or co-managed a public offering of securities for the subject company (RIG.N, HES.N) within the past 12 months.
Credit Suisse has received investment banking related compensation from the subject company (SKPE.KL, RIG.N, DO.N, ATW.N, HES.N) within the past 12 months
Credit Suisse expects to receive or intends to seek investment banking related compensation from the subject company (SKPE.KL, DIAL.KL, MHEB.KL, RIG.N, HP.N, NBR.N, DO.N, ATW.N, SPMI.MI, OII.N, AMEC.L, FUGRc.AS, MDR.N, HES.N, MUR.N, NBL.N) within the next 3 months.
11 August 2014
SapuraKencana Petroleum Bhd (SKPE.KL / SAKP MK) 58
Credit Suisse has received compensation for products and services other than investment banking services from the subject company (RIG.N, NBR.N, NE.N, TLM.N, NBL.N) within the past 12 months
As of the date of this report, Credit Suisse makes a market in the following subject companies (RIG.N, HP.N, ESV.N, NBR.N, NE.N, DO.N, ATW.N, OII.N, MDR.N, HES.N, MUR.N, TLM.N, NBL.N).
Credit Suisse may have interest in (SKPE.KL, DIAL.KL, MHEB.KL, UZMA.KL, PCGB.KL)
As of the end of the preceding month, Credit Suisse beneficially own 1% or more of a class of common equity securities of (RIG.N, NE.N, AMEC.L).
For other important disclosures concerning companies featured in this report, including price charts, please visit the website at https://rave.credit-suisse.com/disclosures or call +1 (877) 291-2683.
Important Regional Disclosures
Singapore recipients should contact Credit Suisse AG, Singapore Branch for any matters arising from this research report.
The analyst(s) involved in the preparation of this report have not visited the material operations of the subject company (SKPE.KL, DIAL.KL, MHEB.KL, UZMA.KL, RIG.N, HP.N, ESV.N, NBR.N, NE.N, DO.N, ATW.N, TECF.PA, SPMI.MI, OII.N, PFC.L, SUBC.OL, AMEC.L, WG.L, FUGRc.AS, MDR.N, HES.N, MUR.N, PCGB.KL, NBL.N) within the past 12 months
An analyst involved in the preparation of this report has visited certain material operations of the subject company (TLM.N) within the past 12 months
The travel expenses of the analyst in connection with such visits were not paid or reimbursed by the subject company, other than de minimus local travel expenses.
Restrictions on certain Canadian securities are indicated by the following abbreviations: NVS--Non-Voting shares; RVS--Restricted Voting Shares; SVS--Subordinate Voting Shares.
Individuals receiving this report from a Canadian investment dealer that is not affiliated with Credit Suisse should be advised that this report may not contain regulatory disclosures the non-affiliated Canadian investment dealer would be required to make if this were its own report.
For Credit Suisse Securities (Canada), Inc.'s policies and procedures regarding the dissemination of equity research, please visit http://www.csfb.com/legal_terms/canada_research_policy.shtml.
Credit Suisse Securities (Europe) Limited (Credit Suisse) acts as broker to (WG.L).
The following disclosed European company/ies have estimates that comply with IFRS: (TECF.PA, SPMI.MI, PFC.L, WG.L).
Credit Suisse has acted as lead manager or syndicate member in a public offering of securities for the subject company (RIG.N, DO.N, ATW.N, WG.L, HES.N, TLM.N) within the past 3 years.
As of the date of this report, Credit Suisse acts as a market maker or liquidity provider in the equities securities that are the subject of this report.
Principal is not guaranteed in the case of equities because equity prices are variable.
Commission is the commission rate or the amount agreed with a customer when setting up an account or at any time after that.
To the extent this is a report authored in whole or in part by a non-U.S. analyst and is made available in the U.S., the following are important disclosures regarding any non-U.S. analyst contributors: The non-U.S. research analysts listed below (if any) are not registered/qualified as research analysts with FINRA. The non-U.S. research analysts listed below may not be associated persons of CSSU and therefore may not be subject to the NASD Rule 2711 and NYSE Rule 472 restrictions on communications with a subject company, public appearances and trading securities held by a research analyst account.
Credit Suisse Securities (Malaysia) Sdn Bhd. .................................................................................................................... Muzhafar Mukhtar, CFA
For Credit Suisse disclosure information on other companies mentioned in this report, please visit the website at https://rave.credit-suisse.com/disclosures or call +1 (877) 291-2683.
11 August 2014
SapuraKencana Petroleum Bhd (SKPE.KL / SAKP MK) 59
References in this report to Credit Suisse include all of the subsidiaries and affiliates of Credit Suisse operating under its investment banking division. For more information on our structure, please use the following link: https://www.credit-suisse.com/who_we_are/en/This report may contain material that is not directed to, or intended for distribution to or use by, any person or entity who is a citizen or resident of or located in any locality, state, country or other jurisdiction where such distribution, publication, availability or use would be contrary to law or regulation or which would subject Credit Suisse AG or its affiliates ("CS") to any registration or licensing requirement within such jurisdiction. All material presented in this report, unless specifically indicated otherwise, is under copyright to CS. None of the material, nor its content, nor any copy of it, may be altered in any way, transmitted to, copied or distributed to any other party, without the prior express written permission of CS. All trademarks, service marks and logos used in this report are trademarks or service marks or registered trademarks or service marks of CS or its affiliates. The information, tools and material presented in this report are provided to you for information purposes only and are not to be used or considered as an offer or the solicitation of an offer to sell or to buy or subscribe for securities or other financial instruments. CS may not have taken any steps to ensure that the securities referred to in this report are suitable for any particular investor. CS will not treat recipients of this report as its customers by virtue of their receiving this report. The investments and services contained or referred to in this report may not be suitable for you and it is recommended that you consult an independent investment advisor if you are in doubt about such investments or investment services. Nothing in this report constitutes investment, legal, accounting or tax advice, or a representation that any investment or strategy is suitable or appropriate to your individual circumstances, or otherwise constitutes a personal recommendation to you. CS does not advise on the tax consequences of investments and you are advised to contact an independent tax adviser. Please note in particular that the bases and levels of taxation may change. Information and opinions presented in this report have been obtained or derived from sources believed by CS to be reliable, but CS makes no representation as to their accuracy or completeness. CS accepts no liability for loss arising from the use of the material presented in this report, except that this exclusion of liability does not apply to the extent that such liability arises under specific statutes or regulations applicable to CS. This report is not to be relied upon in substitution for the exercise of independent judgment. CS may have issued, and may in the future issue, other communications that are inconsistent with, and reach different conclusions from, the information presented in this report. Those communications reflect the different assumptions, views and analytical methods of the analysts who prepared them and CS is under no obligation to ensure that such other communications are brought to the attention of any recipient of this report. Some investments referred to in this report will be offered solely by a single entity and in the case of some investments solely by CS, or an associate of CS or CS may be the only market maker in such investments. Past performance should not be taken as an indication or guarantee of future performance, and no representation or warranty, express or implied, is made regarding future performance. Information, opinions and estimates contained in this report reflect a judgment at its original date of publication by CS and are subject to change without notice. The price, value of and income from any of the securities or financial instruments mentioned in this report can fall as well as rise. The value of securities and financial instruments is subject to exchange rate fluctuation that may have a positive or adverse effect on the price or income of such securities or financial instruments. Investors in securities such as ADR's, the values of which are influenced by currency volatility, effectively assume this risk. Structured securities are complex instruments, typically involve a high degree of risk and are intended for sale only to sophisticated investors who are capable of understanding and assuming the risks involved. The market value of any structured security may be affected by changes in economic, financial and political factors (including, but not limited to, spot and forward interest and exchange rates), time to maturity, market conditions and volatility, and the credit quality of any issuer or reference issuer. Any investor interested in purchasing a structured product should conduct their own investigation and analysis of the product and consult with their own professional advisers as to the risks involved in making such a purchase. Some investments discussed in this report may have a high level of volatility. High volatility investments may experience sudden and large falls in their value causing losses when that investment is realised. Those losses may equal your original investment. Indeed, in the case of some investments the potential losses may exceed the amount of initial investment and, in such circumstances, you may be required to pay more money to support those losses. Income yields from investments may fluctuate and, in consequence, initial capital paid to make the investment may be used as part of that income yield. Some investments may not be readily realisable and it may be difficult to sell or realise those investments, similarly it may prove difficult for you to obtain reliable information about the value, or risks, to which such an investment is exposed. This report may provide the addresses of, or contain hyperlinks to, websites. Except to the extent to which the report refers to website material of CS, CS has not reviewed any such site and takes no responsibility for the content contained therein. Such address or hyperlink (including addresses or hyperlinks to CS's own website material) is provided solely for your convenience and information and the content of any such website does not in any way form part of this document. Accessing such website or following such link through this report or CS's website shall be at your own risk. This report is issued and distributed in Europe (except Switzerland) by Credit Suisse Securities (Europe) Limited, One Cabot Square, London E14 4QJ, England, which is authorised by the Prudential Regulation Authority and regulated by the Financial Conduct Authority and the Prudential Regulation Authority. This report is being distributed in Germany by Credit Suisse Securities (Europe) Limited Niederlassung Frankfurt am Main regulated by the Bundesanstalt fuer Finanzdienstleistungsaufsicht ("BaFin"). This report is being distributed in the United States and Canada by Credit Suisse Securities (USA) LLC; in Switzerland by Credit Suisse AG; in Brazil by Banco de Investimentos Credit Suisse (Brasil) S.A or its affiliates; in Mexico by Banco Credit Suisse (México), S.A. (transactions related to the securities mentioned in this report will only be effected in compliance with applicable regulation); in Japan by Credit Suisse Securities (Japan) Limited, Financial Instruments Firm, Director-General of Kanto Local Finance Bureau (Kinsho) No. 66, a member of Japan Securities Dealers Association, The Financial Futures Association of Japan, Japan Investment Advisers Association, Type II Financial Instruments Firms Association; elsewhere in Asia/ Pacific by whichever of the following is the appropriately authorised entity in the relevant jurisdiction: Credit Suisse (Hong Kong) Limited, Credit Suisse Equities (Australia) Limited, Credit Suisse Securities (Thailand) Limited, regulated by the Office of the Securities and Exchange Commission, Thailand, having registered address at 990 Abdulrahim Place, 27th Floor, Unit 2701, Rama IV Road, Silom, Bangrak, Bangkok 10500, Thailand, Tel. +66 2614 6000, Credit Suisse Securities (Malaysia) Sdn Bhd, Credit Suisse AG, Singapore Branch, Credit Suisse Securities (India) Private Limited (CIN no. U67120MH1996PTC104392) regulated by the Securities and Exchange Board of India (registration Nos. INB230970637; INF230970637; INB010970631; INF010970631), having registered address at 9th Floor, Ceejay House, Dr.A.B. Road, Worli, Mumbai - 18, India, T- +91-22 6777 3777, Credit Suisse Securities (Europe) Limited, Seoul Branch, Credit Suisse AG, Taipei Securities Branch, PT Credit Suisse Securities Indonesia, Credit Suisse Securities (Philippines ) Inc., and elsewhere in the world by the relevant authorised affiliate of the above. Research on Taiwanese securities produced by Credit Suisse AG, Taipei Securities Branch has been prepared by a registered Senior Business Person. Research provided to residents of Malaysia is authorised by the Head of Research for Credit Suisse Securities (Malaysia) Sdn Bhd, to whom they should direct any queries on +603 2723 2020. This report has been prepared and issued for distribution in Singapore to institutional investors, accredited investors and expert investors (each as defined under the Financial Advisers Regulations) only, and is also distributed by Credit Suisse AG, Singapore branch to overseas investors (as defined under the Financial Advisers Regulations). By virtue of your status as an institutional investor, accredited investor, expert investor or overseas investor, Credit Suisse AG, Singapore branch is exempted from complying with certain compliance requirements under the Financial Advisers Act, Chapter 110 of Singapore (the "FAA"), the Financial Advisers Regulations and the relevant Notices and Guidelines issued thereunder, in respect of any financial advisory service which Credit Suisse AG, Singapore branch may provide to you. This research may not conform to Canadian disclosure requirements. In jurisdictions where CS is not already registered or licensed to trade in securities, transactions will only be effected in accordance with applicable securities legislation, which will vary from jurisdiction to jurisdiction and may require that the trade be made in accordance with applicable exemptions from registration or licensing requirements. Non-U.S. customers wishing to effect a transaction should contact a CS entity in their local jurisdiction unless governing law permits otherwise. U.S. customers wishing to effect a transaction should do so only by contacting a representative at Credit Suisse Securities (USA) LLC in the U.S. Please note that this research was originally prepared and issued by CS for distribution to their market professional and institutional investor customers. Recipients who are not market professional or institutional investor customers of CS should seek the advice of their independent financial advisor prior to taking any investment decision based on this report or for any necessary explanation of its contents. This research may relate to investments or services of a person outside of the UK or to other matters which are not authorised by the Prudential Regulation Authority and regulated by the Financial Conduct Authority and the Prudential Regulation Authority or in respect of which the protections of the Prudential Regulation Authority and Financial Conduct Authority for private customers and/or the UK compensation scheme may not be available, and further details as to where this may be the case are available upon request in respect of this report. CS may provide various services to US municipal entities or obligated persons ("municipalities"), including suggesting individual transactions or trades and entering into such transactions. Any services CS provides to municipalities are not viewed as "advice" within the meaning of Section 975 of the Dodd-Frank Wall Street Reform and Consumer Protection Act. CS is providing any such services and related information solely on an arm's length basis and not as an advisor or fiduciary to the municipality. In connection with the provision of the any such services, there is no agreement, direct or indirect, between any municipality (including the officials, management, employees or agents thereof) and CS for CS to provide advice to the municipality. Municipalities should consult with their financial, accounting and legal advisors regarding any such services provided by CS. In addition, CS is not acting for direct or indirect compensation to solicit the municipality on behalf of an unaffiliated broker, dealer, municipal securities dealer, municipal advisor, or investment adviser for the purpose of obtaining or retaining an engagement by the municipality for or in connection with Municipal Financial Products, the issuance of municipal securities, or of an investment adviser to provide investment advisory services to or on behalf of the municipality. If this report is being distributed by a financial institution other than Credit Suisse AG, or its affiliates, that financial institution is solely responsible for distribution. Clients of that institution should contact that institution to effect a transaction in the securities mentioned in this report or require further information. This report does not constitute investment advice by Credit Suisse to the clients of the distributing financial institution, and neither Credit Suisse AG, its affiliates, and their respective officers, directors and employees accept any liability whatsoever for any direct or consequential loss arising from their use of this report or its content. Principal is not guaranteed. Commission is the commission rate or the amount agreed with a customer when setting up an account or at any time after that.
Copyright © 2014 CREDIT SUISSE AG and/or its affiliates. All rights reserved.
Investment principal on bonds can be eroded depending on sale price or market price. In addition, there are bonds on which investment principal can be eroded due to changes in redemption amounts. Care is required when investing in such instruments. When you purchase non-listed Japanese fixed income securities (Japanese government bonds, Japanese municipal bonds, Japanese government guaranteed bonds, Japanese corporate bonds) from CS as a seller, you will be requested to pay the purchase price only.
OG0598.doc
Related Documents