Section No. Version No. 1.0 Date: 10/02/2015 Page 1 of 35 1. Title and Approval Page Salmonid Restoration Federation QUALITY ASSURANCE PROJECT PLAN (QAPP) FOR THE REDWOOD CREEK, SOUTH FORK EEL RIVER, WATER CONSERVATION, MONITORING, PLANNING AND ASSESSMENT, AND EDUCATION PROJECT COMPLETED PLAN PREPARED BY: Dana Stolzman, Salmonid Restoration Federation Sara Schremmer, Salmonid Restoration Federation Randy Klein, Consulting Hydrologist Bill Eastwood, Eel River Salmon Restoration Project FINAL – December 15, 2015 Refer correspondence to: Executive Director, Salmonid Restoration Federation P.O. Box 784, Redway, CA 95560 707-923-7501, [email protected] Approvals: Affiliation / Title: Subcontractor QA Officer Randy Klein Signature: __________________________________________________Date: ______________ Affiliation / Title: Salmonid Restoration Federation, Project Supervisor Dana Stolzman Signature: Date: 08/31/2015 Affiliation / Title: Salmonid Restoration Federation, Project Manager Sara Schremmer Signature: Date: 08/31/2015 Affiliation / Title: State Water Resources Control Board, QA Officer Renee Spears Signature: __________________________________________________Date: ______________ Affiliation / Title: North Coast Regional Quality Control Board, Grant Manager Michele Fortner Signature: __________________________________________________Date: ______________

Welcome message from author
This document is posted to help you gain knowledge. Please leave a comment to let me know what you think about it! Share it to your friends and learn new things together.
Transcript
Section No. Version No. 1.0
Date: 10/02/2015 Page 1 of 35
1. Title and Approval Page
Salmonid Restoration Federation
QUALITY ASSURANCE PROJECT PLAN (QAPP) FOR THE REDWOOD CREEK, SOUTH FORK EEL RIVER, WATER CONSERVATION, MONITORING,
PLANNING AND ASSESSMENT, AND EDUCATION PROJECT
COMPLETED PLAN PREPARED BY:
Dana Stolzman, Salmonid Restoration Federation
Sara Schremmer, Salmonid Restoration Federation Randy Klein, Consulting Hydrologist
Bill Eastwood, Eel River Salmon Restoration Project
FINAL – December 15, 2015
Refer correspondence to: Executive Director, Salmonid Restoration Federation
P.O. Box 784, Redway, CA 95560 707-923-7501, [email protected]
Approvals:
Affiliation / Title: Subcontractor QA Officer Randy Klein
Signature: __________________________________________________Date: ______________
Affiliation / Title: Salmonid Restoration Federation, Project Supervisor Dana Stolzman
Signature: Date: 08/31/2015
Affiliation / Title: Salmonid Restoration Federation, Project Manager Sara Schremmer
Signature: Date: 08/31/2015
Affiliation / Title: State Water Resources Control Board, QA Officer Renee Spears
Signature: __________________________________________________Date: ______________
Affiliation / Title: North Coast Regional Quality Control Board, Grant Manager Michele Fortner
Signature: __________________________________________________Date: ______________
Section No. Version No. 1.0
Date: 10/02/2015 Page 2 of 35
2. Table of Contents page
1. TITLE AND APPROVAL PAGE ............................................................................. 1
2. TABLE OF CONTENTS PAGE .............................................................................. 2
3. DISTRIBUTION LIST ............................................................................................. 4 Table 3.1. Primary Distribution List
4. PROJECT ORGANIZATION .................................................................................. 4
5. PROBLEM DEFINITION / BACKGROUND ........................................................... 7
6. PROJECT / TASK DESCRIPTION ........................................................................ 9 Table 6.1.1. Watershed and channel attributes for Redwood Creek monitoring sites Table 6.2.1. Tabular summary of project chronology
7. DATA QUALITY OBJECTIVES (DQOS) ............................................................. 13 Table 7.1. Data Quality Objectives for all parameters
8. SPECIAL TRAINING NEEDS / CERTIFICATION ................................................ 15
9. DOCUMENTATION AND RECORDS .................................................................. 16
10. SAMPLING PROCESS DESIGN ......................................................................... 16
11. SAMPLING METHODS ....................................................................................... 17
12. SAMPLE HANDLING AND CUSTODY PROCEDURES ..................................... 17
13. ANALYTICAL METHODS ................................................................................... 17 Table 13.1. Low-Flow Trend Monitoring parameters, methods and environmental relevancy
14. QUALITY CONTROL ........................................................................................... 18 Table 14.1. Quality Control actions for all parameters
15. INSTRUMENT / EQUIPMENT TESTING, INSPECTION AND MAINTENANCE . 19 Table 15.1. Testing, inspection and maintenance of monitoring instruments and equipment
16. INSTRUMENT / EQUIPMENT CALIBRATION AND FREQUENCY .................... 20
17. INSPECTION / ACCEPTANCE OF SUPPLIES AND CONSUMABLES ............. 20
Section No. Version No. 1.0
Date: 10/02/2015 Page 3 of 35
18. NON-DIRECT MEASUREMENTS (EXISTING DATA) ........................................ 20
19. DATA MANAGEMENT ........................................................................................ 21
20. ASSESSMENT AND RESPONSE ACTIONS ...................................................... 21
21. REPORTS TO MANAGEMENT ........................................................................... 22
22. DATA REVIEW, VERIFICATION, AND VALIDATION ........................................ 22
23. VERIFICATION AND VALIDATION METHODS .................................................. 23
24. RECONCILIATION WITH USER REQUIREMENTS ............................................ 23
APPENDICES
APPENDIX 1. DATA QUALITY FORMS Data Quality Form: Precision Data Quality Form: Completeness Data Quality Form: Training Documentation
APPENDIX 2. MAP OF MONITORING SITES
APPENDIX 3. STANDARD OPERATING PROCEDURES (SOPS) SOP #SRF-1: SOPs for Volumetric Flow Measurement
SOP #SRF-2: SOPs for 3-inch Parshall Flume Flow Measurement SOP #SRF-3: SOPs for Installation & Monitoring of Staff Gages and Pressure Transducers
APPENDIX 4. MAP OF SALMONID DISTRIBUTION APPENDIX 5. LIST OF ACRONYMS QAPP Revision History Log Previous Version Number
Revision Date (mm/dd/yy)
Author(s) Changes Made (with page numbers if applicable)
Reason for Changes New Version Number
Changes in this QAPP will be logged in the above table. For minor changes like spelling or format corrections, Version Numbers increase incrementally by hundredths (e.g., Version 1.01, Version 1.02, … etc.). Major revisions (e.g. changes that might impact data collection and analysis protocols) should be designated with the next whole number (e.g., Version 2.0, 3.0, etc.). Record the previous Version Number, date of revision, author of the revision, identify pages where changes were made, the reason for making the changes, and the new Version Number.
Section No. Version No. 1.0
Date: 10/02/2015 Page 4 of 35
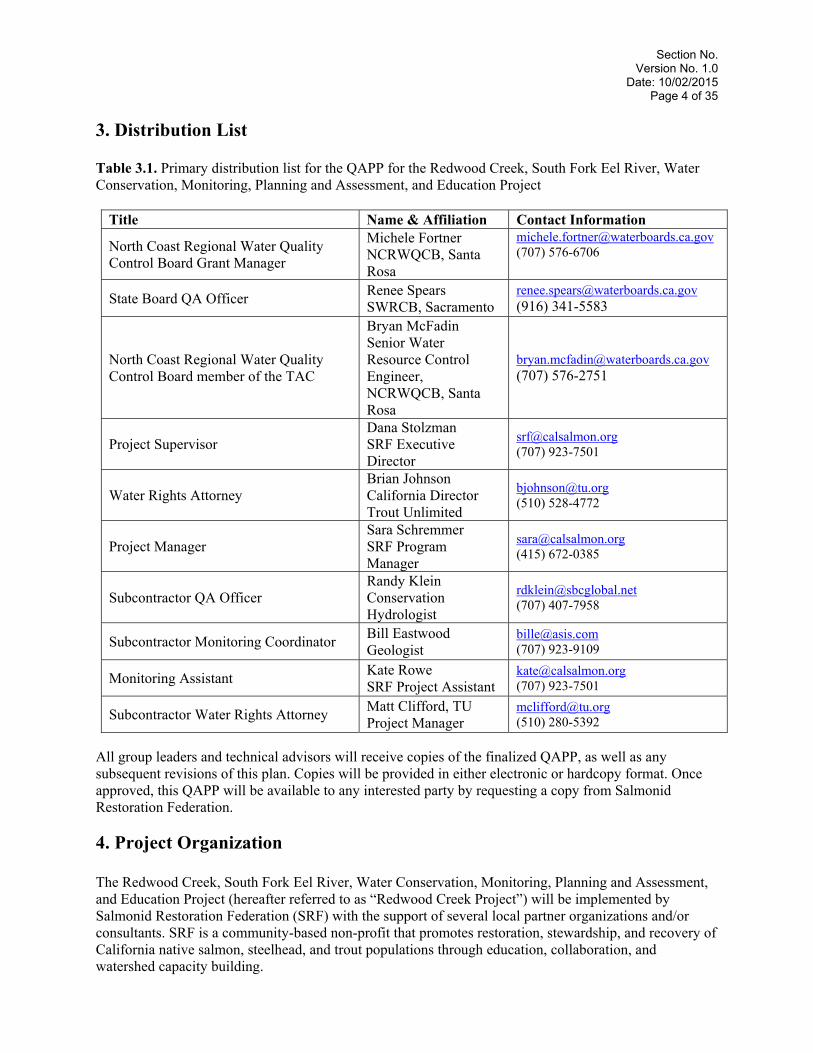
3. Distribution List Table 3.1. Primary distribution list for the QAPP for the Redwood Creek, South Fork Eel River, Water Conservation, Monitoring, Planning and Assessment, and Education Project
Title Name & Affiliation Contact Information
North Coast Regional Water Quality Control Board Grant Manager
Michele Fortner NCRWQCB, Santa Rosa
[email protected] (707) 576-6706
State Board QA Officer Renee Spears SWRCB, Sacramento
[email protected] (916) 341-5583
North Coast Regional Water Quality Control Board member of the TAC
Bryan McFadin Senior Water Resource Control Engineer, NCRWQCB, Santa Rosa
[email protected] (707) 576-2751
Project Supervisor Dana Stolzman SRF Executive Director
[email protected] (707) 923-7501
Water Rights Attorney Brian Johnson California Director Trout Unlimited
[email protected] (510) 528-4772
Project Manager Sara Schremmer SRF Program Manager
[email protected] (415) 672-0385
Subcontractor QA Officer Randy Klein Conservation Hydrologist
[email protected] (707) 407-7958
Subcontractor Monitoring Coordinator Bill Eastwood Geologist
[email protected] (707) 923-9109
Monitoring Assistant Kate Rowe SRF Project Assistant
[email protected] (707) 923-7501
Subcontractor Water Rights Attorney Matt Clifford, TU Project Manager
[email protected] (510) 280-5392
All group leaders and technical advisors will receive copies of the finalized QAPP, as well as any subsequent revisions of this plan. Copies will be provided in either electronic or hardcopy format. Once approved, this QAPP will be available to any interested party by requesting a copy from Salmonid Restoration Federation.
4. Project Organization The Redwood Creek, South Fork Eel River, Water Conservation, Monitoring, Planning and Assessment, and Education Project (hereafter referred to as “Redwood Creek Project”) will be implemented by Salmonid Restoration Federation (SRF) with the support of several local partner organizations and/or consultants. SRF is a community-based non-profit that promotes restoration, stewardship, and recovery of California native salmon, steelhead, and trout populations through education, collaboration, and watershed capacity building.
Section No. Version No. 1.0
Date: 10/02/2015 Page 5 of 35
4.1 Key Individuals The Project Team includes Monitoring Coordinator Bill Eastwood who is a geologist and has implemented over thirty years of restoration projects in the South Fork Eel River particularly in Redwood Creek, Hydrologist Randy Klein who was the supervising hydrologist on the Mattole forbearance effectiveness studies and has over 30 years of experience with Redwood National and State Parks, and Water Rights Attorney and Executive Director of Trout Unlimited, Brian Johnson. Our Project Team will be supervised by Dana Stolzman, Executive Director of Salmonid Restoration Federation, who has over 20 years of non-profit management experience and has extensive experience managing multiple government contracts, overseeing contractors, and doing community outreach. SRF’s Program Assistant, Kathryn Rowe, will act as the project’s Monitoring Assistant and SRF’s Program Manager, Sara Schremmer, will be the Project Manager. Trout Unlimited’s (TU) California Director Brian Johnson will oversee TU’s staff attorney for the California Water Project, Matt Clifford, JD, who is our liaison with Trout Unlimited for this project. 4.2 Project Team Responsibilities Randy Klein, project hydrologist, will be responsible for quality control oversight, designing the monitoring plan, computation of discharge rates, data analysis, identifying data gaps, and technical report writing. The Project Director (SRF’s Executive Director) will establish the Technical Advisory Committee, oversee sub-contractors (consulting hydrologist, monitoring coordinator, water rights attorney) and be responsible for grant oversight and public representation of the project. The Project Director will manage the budget and ensure that cost-share requirements are met. The Program Manager will oversee the timeline, deliverables including the Project Assessment and Evaluation Plan (PAEP) and QAPP and be responsible for interim reporting. The Program Manager will coordinate with the Monitoring Coordinator, the consulting hydrologist, California State Water Board (SWB) Division of Water Rights, and Trout Unlimited’s (TU’s) California staff attorney to ensure that SRF is adhering to the timeline outlined in the SWB contract and meeting our deliverables. The Monitoring Coordinator (MC) will identify suitable monitoring sites and install pressure/temperature data loggers at seven flow measurement sites and one at a barometric pressure control site. The locations of gauges will be precisely mapped using a global positioning system (GPS) device. The pressure transducers (water level data loggers) would accomplish the goals of both filling critical data gaps and allowing for better statistical analysis. The Monitoring Assistant will compare the continuous data logged with weekly data collected at streamflow sites. Pressure transducers will be at key sites and the MC will maintain twelve streamflow sites where he will manually collect data on a weekly basis. The Monitoring Assistant will help maintain hard copy and electronic data records, compute flow measurements to gallons per minute (GPM), program the data loggers, and download the data loggers. SRF will consult with Brian Johnson, California Director of Trout Unlimited, and Matt Clifford (Staff Attorney for TU’s California Water Program). SRF will consult as needed with these TU attorneys regarding water rights verification, assisting landowners who would like to do water conservation projects on their land with calculating their water budget as well as riparian and appropriative filings, and participating in water rights clinics and workshops to encourage compliance and improved water storage planning.
Section No. Version No. 1.0
Date: 10/02/2015 Page 6 of 35
4.3 Quality Assurance Officer’s roles Randy Klein is the Quality Assurance Officer (QAO) for the low-flow monitoring tasks undertaken by SRF. The QAO communicates to SRF’s project team (Dana Stolzman, Sara Schremmer, Kate Rowe, and Bill Eastwood). The QAO’s role is to establish the quality assurance and quality control procedures found in this QAPP as part of SRF’s field data collection and data processing. The QAO is also responsible for working with the Monitoring Coordinator to ensure that adequate training is conducted in all field methods to ensure that quality control is maintained for the duration of data collection. The QAO will also interact with any subcontractors hired by SRF by communicating all quality assurance and quality control issues contained in this QAPP to them. In addition, the QAO will review and assess all procedures during the life of the contract against QAPP requirements and determine conformance with QAPP requirements and report all findings to SRF’s project managers, including all requests for corrective action. The QAO may stop all actions if there are significant deviations from required practices or if there is evidence of a systematic failure. The State Water Recourses Control Board QAO will provide review, oversight and approval of the QAPP and is otherwise independent from generating project information.
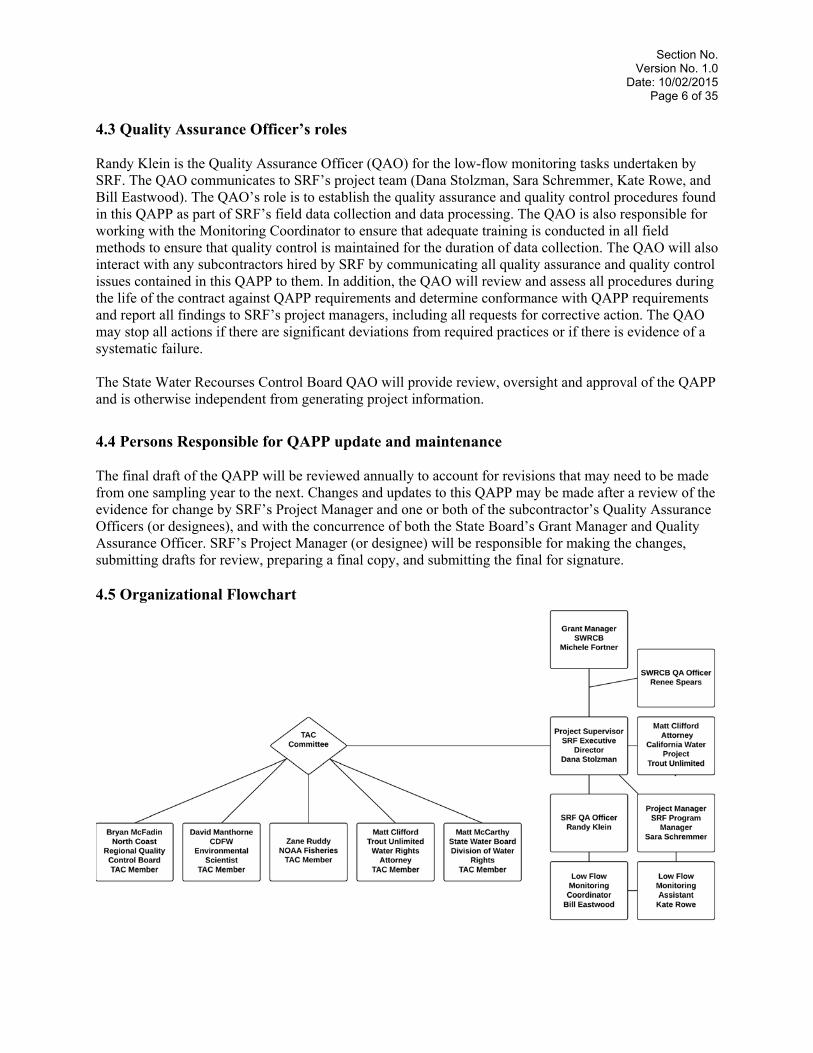
4.4 Persons Responsible for QAPP update and maintenance The final draft of the QAPP will be reviewed annually to account for revisions that may need to be made from one sampling year to the next. Changes and updates to this QAPP may be made after a review of the evidence for change by SRF’s Project Manager and one or both of the subcontractor’s Quality Assurance Officers (or designees), and with the concurrence of both the State Board’s Grant Manager and Quality Assurance Officer. SRF’s Project Manager (or designee) will be responsible for making the changes, submitting drafts for review, preparing a final copy, and submitting the final for signature. 4.5 Organizational Flowchart
Section No. Version No. 1.0
Date: 10/02/2015 Page 7 of 35
4.6 Project Team Advisors SRF has created a Technical Advisory Committee (TAC) comprised of members of the North Coast Regional Water Quality Control Board, the California Department of Fish and Wildlife (CDFW), the California SWB Division of Water Rights, National Oceanic and Atmospheric Administration (NOAA) Fisheries, and Randy Klein, the consulting hydrologist. The TAC will oversee our monitoring methodology, provide technical assistance, and offer their technical expertise with planning, assessment, and project development. SRF has confirmed participation and shared the monitoring plan and incorporated input from Bryan McFadin (North Coast Regional Water Quality Control Board (NCRWQCB), Zane Ruddy (NOAA Fisheries), Matt McCarthy (SWB, Division of Water Rights), and David Manthorne (CDFW Environmental Scientist).
5. Problem Definition / Background Human demands on water are increasing, and most rural landowners withdraw water for agricultural and personal use from flowing streams. A negative cumulative effect of water withdrawals occurs when the sum of all water withdrawals is of sufficient quantity to impact riparian and aquatic ecosystems. Effects include shrinking the wetted channel surface area, drying up of backwater habitat, hydraulically disconnecting pools and complete loss of surface flows. Aquatic organisms, including juvenile salmonids, can suffer from lack of dissolved oxygen, excessive water temperatures, increased predation, and desiccation.
5.1 Decisions or Outcomes The Redwood Creek Project addresses water quality, flows, and temperature issues associated with diminishing instream flows in the South Fork Eel River watershed. SRF will monitor summer flows and temperatures in Redwood Creek to identify impairments and solutions, and to build capacity for a water conservation program. SRF will engage the local community in monitoring efforts and work with county, state and federal agencies to identify critical reaches for water conservation projects that could increase instream flows. The education component addresses recommendations in the NCRWQCB Action Plan to Address Elevated Temperatures in the Navarro, Mattole, and Eel Rivers including educating users on water conservation practices, and developing flow improvement projects for beneficial uses. This is a complete planning and assessment project that SRF believes will yield enough valuable and defensible data in order to make flow and threshold recommendations that would benefit fish and be sustainable for the human community in this watershed. To address the low flow problem in Redwood Creek, the low flow monitoring component of the Redwood Creek Project has the following objectives:
1. Quantify summer/fall stream discharges at a suite of main channel and tributary sites; 2. Evaluate possible causes of unexpected flow variations (e.g., decreasing discharge with
increasing drainage area); 3. Identify and rank sub-watersheds that may be impacted by water diversions and therefore benefit
from forbearance agreements; 4. Recommend means to streamline future monitoring.
5.2 Project Context Anadromous fisheries have declined throughout California and coho salmon are listed as threatened species in the Southern Oregon Northern California Coast (SONCC) Coho Recovery Plan. The South Fork of the Eel River provides important coho and steelhead spawning and rearing habitat and is key to
Section No. Version No. 1.0
Date: 10/02/2015 Page 8 of 35
the recovery of coho salmon in this Evolutionary Significant Unit (ESU). Tributaries to the South Fork Eel still provide spawning and rearing habitat but suffer from the cumulative effects of unregulated water diversions and excessive low flows. The major factors impacting coho salmon in Redwood Creek and the South Fork Eel River are lack of cool water refugia, insufficient water quantity especially that which inhibits migratory success, poor water quality (in particular water temperatures), and excessive sediment. According to the South Fork Eel River Total Maximum Daily Load (TMDL), the major water quality problems are excessive sediment and increased water temperature, which are leading to the decline of cold water fish populations. Under the federal Clean Water Act (Section 303(d)) in 1998 the State listed the South Fork Eel as water quality limited due to sediment and temperature concerns. According to a California Department of Fish and Game (CDFG) 1997 report, “At the turn of the century, the Eel River supported runs of salmon and steelhead that were estimated to exceed one-half million fish. Populations of salmon and steelhead have declined significantly from this early period due to human activities and associated habitat destruction. These adverse impacts resulted principally from land development and associated resource uses that included poor road design and construction, poor logging and grazing practices, excessive water diversions, and over-fishing.” The forest landscape and hydrology of this area has been greatly impacted by logging and subsequent development. Human settlements increase the amount of consumptive water use and young Douglas fir stands now populate native meadows, utilizing more water than in the past. Due to changes in the forest landscape, climate change, drought, and unregulated water diversions, many creeks that once supported salmon are now intermittent in the summer and do not have continuous flow for fish. Rearing and spawning habitat for juvenile coho are essential for the recovery of the species. Today, remnant populations survive in populated tributaries like Redwood Creek but despite considerable expenditures in habitat restoration projects, the creeks become disconnected during the dry months and many pools of juvenile coho vanish each summer. Spawning surveys, spot checks and reports from landowners going back more than 30 years confirm that Chinook, coho and steelhead regularly spawn in consistent reaches of Redwood Creek and its tributaries. Juveniles of these species are routinely found throughout the watershed in spring and early summer, with coho and steelhead rearing in the watershed until migrating to the ocean the following spring. The best spawning reaches are found in Dinner, China, and Miller Creeks, as well as lower and upper Redwood Creek. Protecting quality rearing habitat used by juvenile salmonids in the Redwood Creek watershed is essential for the viability of this population. Stream reaches that are accessible, have cold water, instream cover, and deep pools are vital for juvenile survival. Tributaries in Redwood Creek could still provide excellent rearing habitat for coho salmon but they are threatened and greatly impacted by unregulated water diversions. 5.3 Water Quality or Regulatory Criteria The Redwood Creek Project addresses several recommendations in the South Fork Eel River Total Maximum Daily Loads for Sediment and Temperature, Region IX and the Action Plan to Implement the Water Quality Objectives for Temperature in the Mattole, Navarro and Eel River watersheds, including:
Implementation Projects Addressing Temperature: Off-stream storage, rooftop catchment systems, water use efficiency projects, and any other water conservation measures to reduce summer diversions/ increase summer flows;
Planning Projects Addressing Temperature: Coordinated diversion planning to ensure adequate flows and temperatures to sustain beneficial uses; and
Section No. Version No. 1.0
Date: 10/02/2015 Page 9 of 35
Planning Projects Addressing Sediment/Temperature: Planning, assessment, monitoring, and/or education/outreach efforts intended to reduce watershed impacts associated with agriculture activities.
The Redwood Creek Project also addresses several high priority actions described in the recently published “Action Plan to Implement Water Quality Objectives for Temperature in the Mattole, Navarro, and Eel River Watersheds,” (NCWQCB, August, 2013). The project will address that plan’s following water quality objectives for temperature:
5.3.5 Address Temperature Concerns Using Other Tools, o “Use other regulatory, executive, and enforcement tools, as appropriate, to address
elevated water temperatures and preserve existing cold water resources.” 5.3.6 Address Temperature Concerns Through Support of Restoration,
o “Support and encourage restoration projects that are designed to eliminate, reduce, or mitigate existing sources of temperature impairments. Administer, encourage, and support the use of grant funds to facilitate projects that 48 Staff Report Supporting the Policy for the Implementation of the Water Quality Objectives for Temperature and Action Plan to Address Temperature Impairment in the Mattole, Navarro, and Eel River Watersheds address elevated water temperature concerns. Pursue non-regulatory actions with organizations, landowners and individuals to encourage the control of elevated water temperatures, watershed restoration, and protection activities.”
5.3.7 Coordinate with the Division of Water Rights in the Water Rights Permitting Process, o “Continue to coordinate with the Division of Water Rights by participating in the water
right application and petition process, providing monitoring recommendations, joint inspections, submittal of data in support of 401 certifications related to water diversions and/or facilities regulated by the Federal Energy Regulatory Commission, and any other appropriate means to help ensure that the terms of water right permits and licenses are consistent with the water quality objectives for temperature.”
5.3.8 Coordinate with the Division of Water Rights in the Development of Instream Flow Studies and Flow Objectives,
o “Coordinate with the Division of Water Rights on the development of instream flow studies and flow objectives, as appropriate.”
5.3.9 Provide Other Agencies Guidance and Recommendations o “Coordinate with the Division of Water Rights on the development of instream flow
studies and flow objectives, as appropriate.” SRF will work with the NCRWQCB and the SWB Division of Water Rights on Action Plan 6.5.9: Water Use, “to support efforts to develop off stream water storage for diverters that currently divert surface water during the dry season.” This effort is intended to lead to increased cooler water flows instream during the time of highest water temperatures.
6. Project / Task Description
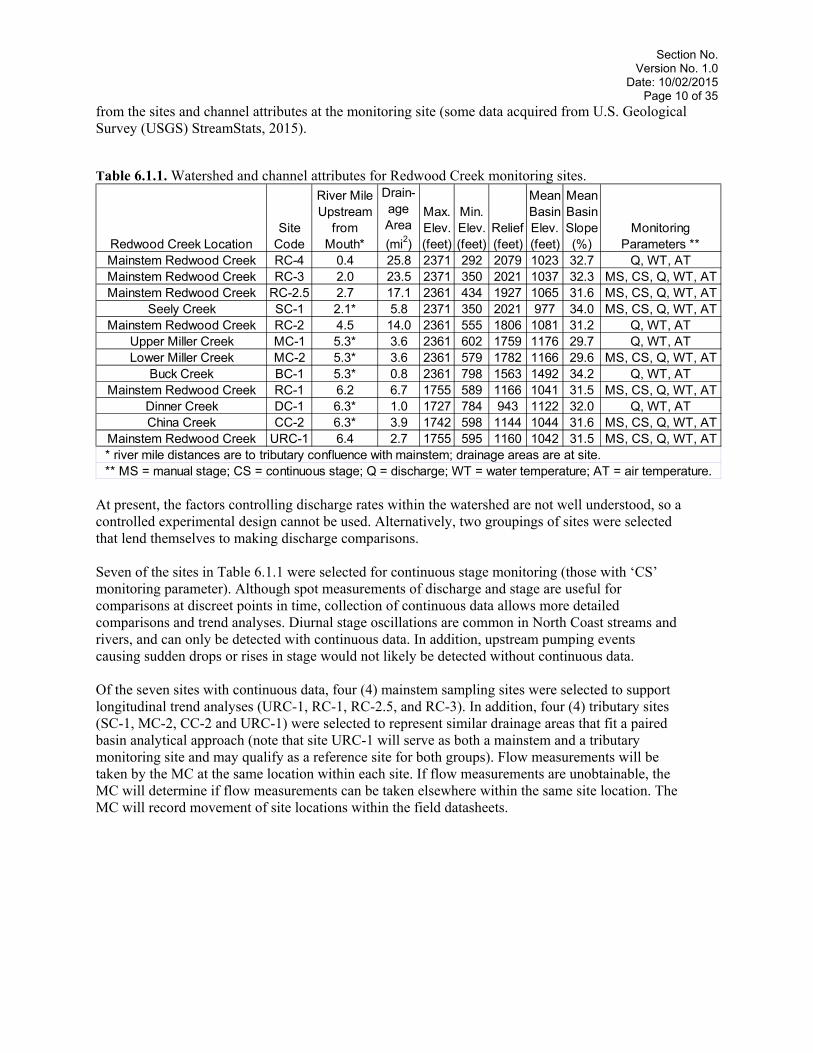
6.1 Work statement and produced products This project will involve the collection and analysis of hydrologic data collected during the low flow season within the Redwood Creek watershed. Hydrologic data to be collected are listed in Table 6.1.1, below. The Redwood Creek Project low flow monitoring utilizes most of the sites that were monitored in 2013-14, but with some modification. Table 6.1.1 provides watershed information for areas upstream
Section No. Version No. 1.0
Date: 10/02/2015 Page 10 of 35
from the sites and channel attributes at the monitoring site (some data acquired from U.S. Geological Survey (USGS) StreamStats, 2015). Table 6.1.1. Watershed and channel attributes for Redwood Creek monitoring sites.
At present, the factors controlling discharge rates within the watershed are not well understood, so a controlled experimental design cannot be used. Alternatively, two groupings of sites were selected that lend themselves to making discharge comparisons. Seven of the sites in Table 6.1.1 were selected for continuous stage monitoring (those with ‘CS’ monitoring parameter). Although spot measurements of discharge and stage are useful for comparisons at discreet points in time, collection of continuous data allows more detailed comparisons and trend analyses. Diurnal stage oscillations are common in North Coast streams and rivers, and can only be detected with continuous data. In addition, upstream pumping events causing sudden drops or rises in stage would not likely be detected without continuous data. Of the seven sites with continuous data, four (4) mainstem sampling sites were selected to support longitudinal trend analyses (URC-1, RC-1, RC-2.5, and RC-3). In addition, four (4) tributary sites (SC-1, MC-2, CC-2 and URC-1) were selected to represent similar drainage areas that fit a paired basin analytical approach (note that site URC-1 will serve as both a mainstem and a tributary monitoring site and may qualify as a reference site for both groups). Flow measurements will be taken by the MC at the same location within each site. If flow measurements are unobtainable, the MC will determine if flow measurements can be taken elsewhere within the same site location. The MC will record movement of site locations within the field datasheets.
Redwood Creek LocationSite
Code
River Mile Upstream
from Mouth*
Drain-age Area
(mi2)
Max. Elev. (feet)
Min. Elev. (feet)
Relief (feet)
Mean Basin Elev. (feet)
Mean Basin Slope (%)
Monitoring Parameters **
Mainstem Redwood Creek RC-4 0.4 25.8 2371 292 2079 1023 32.7 Q, WT, ATMainstem Redwood Creek RC-3 2.0 23.5 2371 350 2021 1037 32.3 MS, CS, Q, WT, ATMainstem Redwood Creek RC-2.5 2.7 17.1 2361 434 1927 1065 31.6 MS, CS, Q, WT, AT
Seely Creek SC-1 2.1* 5.8 2371 350 2021 977 34.0 MS, CS, Q, WT, ATMainstem Redwood Creek RC-2 4.5 14.0 2361 555 1806 1081 31.2 Q, WT, AT
Upper Miller Creek MC-1 5.3* 3.6 2361 602 1759 1176 29.7 Q, WT, ATLower Miller Creek MC-2 5.3* 3.6 2361 579 1782 1166 29.6 MS, CS, Q, WT, AT
Buck Creek BC-1 5.3* 0.8 2361 798 1563 1492 34.2 Q, WT, ATMainstem Redwood Creek RC-1 6.2 6.7 1755 589 1166 1041 31.5 MS, CS, Q, WT, AT
Dinner Creek DC-1 6.3* 1.0 1727 784 943 1122 32.0 Q, WT, ATChina Creek CC-2 6.3* 3.9 1742 598 1144 1044 31.6 MS, CS, Q, WT, AT
Mainstem Redwood Creek URC-1 6.4 2.7 1755 595 1160 1042 31.5 MS, CS, Q, WT, AT * river mile distances are to tributary confluence with mainstem; drainage areas are at site. ** MS = manual stage; CS = continuous stage; Q = discharge; WT = water temperature; AT = air temperature.
Section No. Version No. 1.0
Date: 10/02/2015 Page 11 of 35
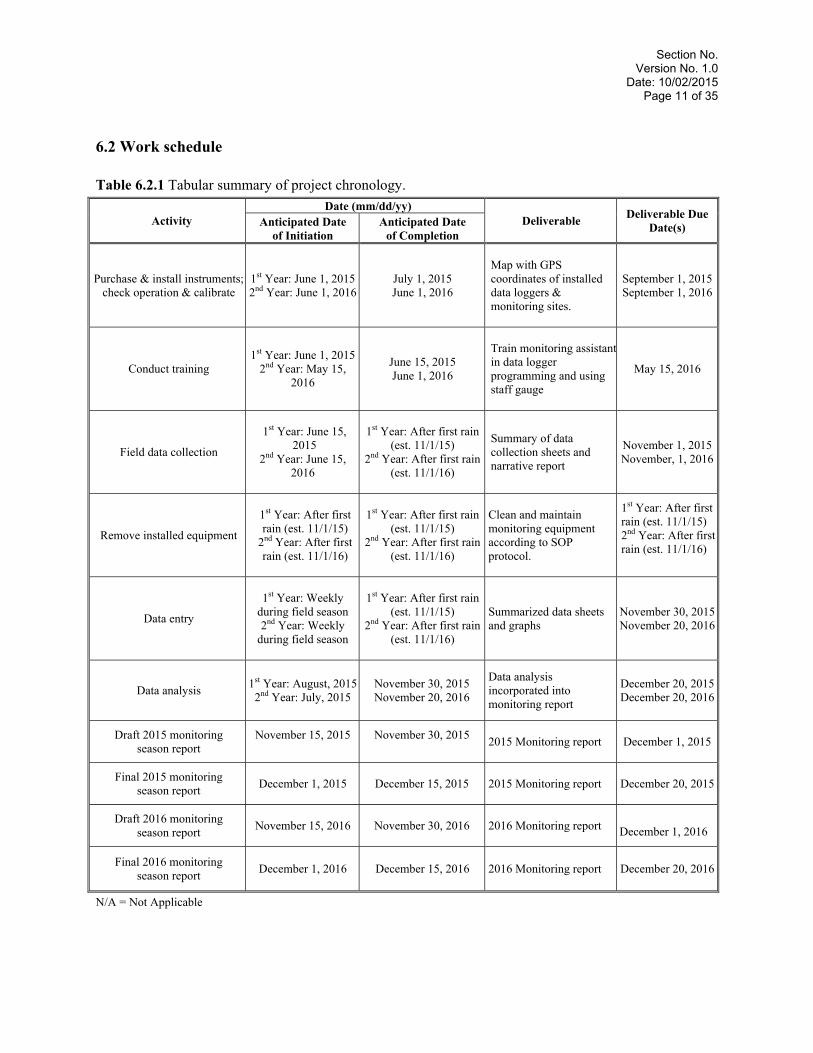
6.2 Work schedule Table 6.2.1 Tabular summary of project chronology.
Activity Date (mm/dd/yy)
Deliverable Deliverable Due
Date(s) Anticipated Date of Initiation
Anticipated Date of Completion
Purchase & install instruments; check operation & calibrate
1st Year: June 1, 20152nd Year: June 1, 2016
July 1, 2015 June 1, 2016
Map with GPS coordinates of installed data loggers & monitoring sites.
September 1, 2015September 1, 2016
Conduct training 1st Year: June 1, 2015
2nd Year: May 15, 2016
June 15, 2015 June 1, 2016
Train monitoring assistantin data logger programming and using staff gauge
May 15, 2016
Field data collection
1st Year: June 15, 2015
2nd Year: June 15, 2016
1st Year: After first rain
(est. 11/1/15) 2nd Year: After first rain
(est. 11/1/16)
Summary of data collection sheets and narrative report
November 1, 2015November, 1, 2016
Remove installed equipment
1st Year: After first rain (est. 11/1/15)
2nd Year: After first rain (est. 11/1/16)
1st Year: After first rain
(est. 11/1/15) 2nd Year: After first rain
(est. 11/1/16)
Clean and maintain monitoring equipment according to SOP protocol.
1st Year: After first rain (est. 11/1/15) 2nd Year: After first rain (est. 11/1/16)
Data entry
1st Year: Weekly during field season 2nd Year: Weekly
during field season
1st Year: After first rain
(est. 11/1/15) 2nd Year: After first rain
(est. 11/1/16)
Summarized data sheets and graphs
November 30, 2015November 20, 2016
Data analysis 1st Year: August, 20152nd Year: July, 2015
November 30, 2015 November 20, 2016
Data analysis incorporated into monitoring report
December 20, 2015December 20, 2016
Draft 2015 monitoring season report
November 15, 2015
November 30, 2015 2015 Monitoring report
December 1, 2015
Final 2015 monitoring season report
December 1, 2015 December 15, 2015 2015 Monitoring report
December 20, 2015
Draft 2016 monitoring season report
November 15, 2016
November 30, 2016
2016 Monitoring report
December 1, 2016
Final 2016 monitoring season report
December 1, 2016 December 15, 2016 2016 Monitoring report
December 20, 2016
N/A = Not Applicable
Section No. Version No. 1.0
Date: 10/02/2015 Page 12 of 35
6.3 Geographical setting Joining with the South Fork Eel River near Redway, CA, Redwood Creek drains a basin area of about 26 square miles of forested steep lands. Historic land uses were dominated by timber harvest, which continues to the present. Rural residential and small-scale agriculture compose other land and water uses. The town of Briceland is located near the centroid of the watershed and Redway is downstream near the watershed’s outlet. Coho salmon and steelhead have historically thrived in Redwood Creek, and there is extensive, high quality habitat distributed throughout the watershed. Field mapping of habitat and fish distribution has been provided by CDFW (Please see attached fish distribution map).
6.4 Constraints Measurement of low flows poses constraints that often eliminate the use of traditional spinning-cup or similar types of velocity meters (e.g., Price AA or Pygmy meters). In the prior two years of low flow monitoring (2013-2014) a current meter was used only a few times at the beginning of the season when flows were high enough (greater than about 0.5 cubic feet per second (cfs)). Under circumstances that prevent the use of velocity meters, two other methods will be used that are more suitable for shallow and slow discharges. The volumetric flow measurement method involves funneling the flow into a pipe and collecting the flow from the pipe into a bucket with a known volume over a measured amount of time. The method is fairly accurate for flows below 0.06 cfs, but only works where there is sufficient elevation drop to allow collection of flow into the bucket. A Parshall flume can also be used when flows are too low for using a velocity meter. For flows between 0.03 and 0.5 cfs, a three-inch sized Parshall Flume is appropriate and will be used. The flume is embedded into the channel gravel in a position to collect as much of the flow as possible, and then leveled and the surrounding gravel bed is sealed off with plastic sheeting to minimize leakage. Flow is determined by applying the flow depth within the flume, as measured in an attached stilling well, to a calibration equation specific to the flume being used. Although efforts are taken to capture all the flow into the flume or pipe, occasionally some leakage bypasses the flume or the pipe, causing the true flow rate to be slightly higher than that measured. The leakage rate is estimated as a percentage of measured flow, and typically is between 1% and 3%, but a few times has reached as high as 10%. Some sites included in this project go dry in most years. When flow is zero, obviously no further discharge measurements can take place and the dry sites cannot be included in analyses of those periods. Perhaps the most significant constraint is the paucity of suitable reference sites, i.e., sites which represent unimpaired conditions. Such sites would provide the best data for comparing with impaired sites to evaluate water use effects. One possible reference site in Redwood Creek may be URC-1, a site common to both groups (tributary and main channel). Discussions with CDFW indicated their similar desire to collect discharges from reference sites. Additional reference sites may exist in nearby watersheds, and we will work with the CDFW to establish monitoring there at the earliest possible time. Lacking those data, our analyses will focus on longitudinal and temporal trend analyses within the Redwood Creek watershed.
Section No. Version No. 1.0
Date: 10/02/2015 Page 13 of 35
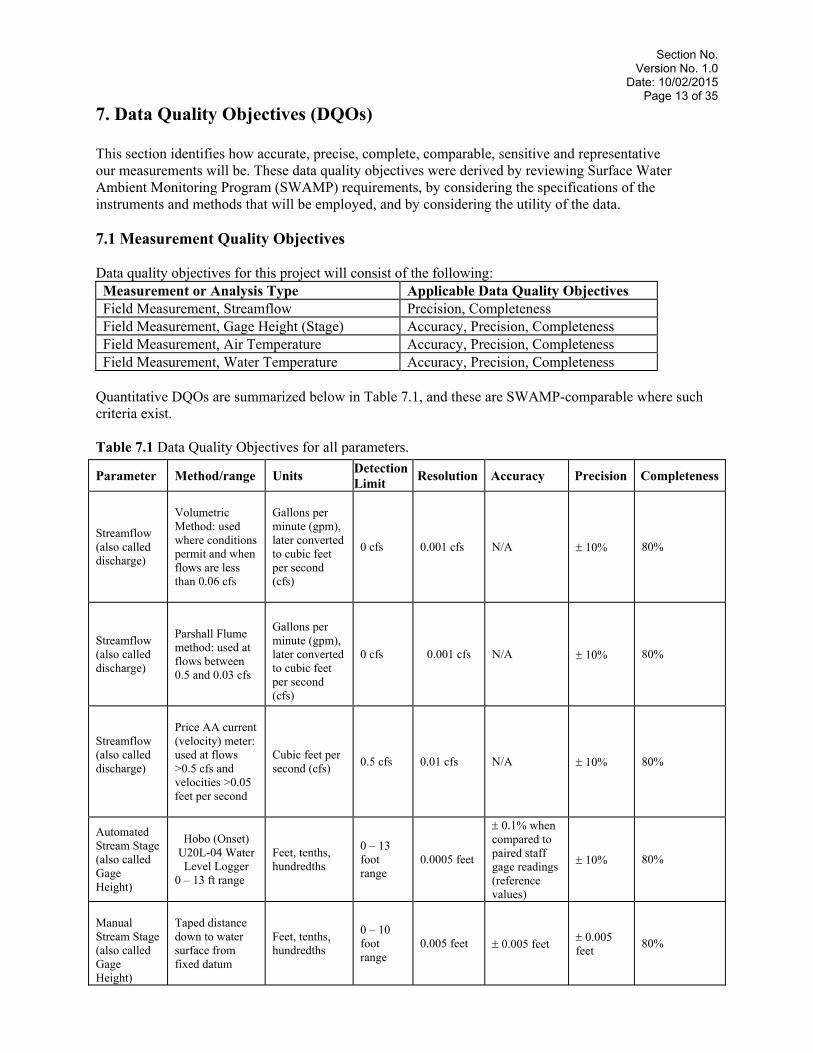
7. Data Quality Objectives (DQOs) This section identifies how accurate, precise, complete, comparable, sensitive and representative our measurements will be. These data quality objectives were derived by reviewing Surface Water Ambient Monitoring Program (SWAMP) requirements, by considering the specifications of the instruments and methods that will be employed, and by considering the utility of the data. 7.1 Measurement Quality Objectives Data quality objectives for this project will consist of the following: Measurement or Analysis Type Applicable Data Quality Objectives Field Measurement, Streamflow Precision, Completeness Field Measurement, Gage Height (Stage) Accuracy, Precision, Completeness Field Measurement, Air Temperature Accuracy, Precision, Completeness Field Measurement, Water Temperature Accuracy, Precision, Completeness
Quantitative DQOs are summarized below in Table 7.1, and these are SWAMP-comparable where such criteria exist. Table 7.1 Data Quality Objectives for all parameters.
Parameter Method/range Units Detection Limit
Resolution Accuracy Precision Completeness
Streamflow (also called discharge)
Volumetric Method: used where conditions permit and when flows are less than 0.06 cfs
Gallons per minute (gpm), later converted to cubic feet per second (cfs)
0 cfs 0.001 cfs N/A 10% 80%
Streamflow (also called discharge)
Parshall Flume method: used at flows between 0.5 and 0.03 cfs
Gallons per minute (gpm), later converted to cubic feet per second (cfs)
0 cfs
0.001 cfs
N/A 10% 80%
Streamflow (also called discharge)
Price AA current (velocity) meter: used at flows >0.5 cfs and velocities >0.05 feet per second
Cubic feet per second (cfs)
0.5 cfs 0.01 cfs N/A 10% 80%
Automated Stream Stage (also called Gage Height)
Hobo (Onset) U20L-04 Water Level Logger
0 – 13 ft range
Feet, tenths, hundredths
0 – 13 foot range
0.0005 feet
0.1% when compared to paired staff gage readings (reference values)
10% 80%
Manual Stream Stage (also called Gage Height)
Taped distance down to water surface from fixed datum
Feet, tenths, hundredths
0 – 10 foot range
0.005 feet 0.005 feet 0.005 feet
80%
Section No. Version No. 1.0
Date: 10/02/2015 Page 14 of 35
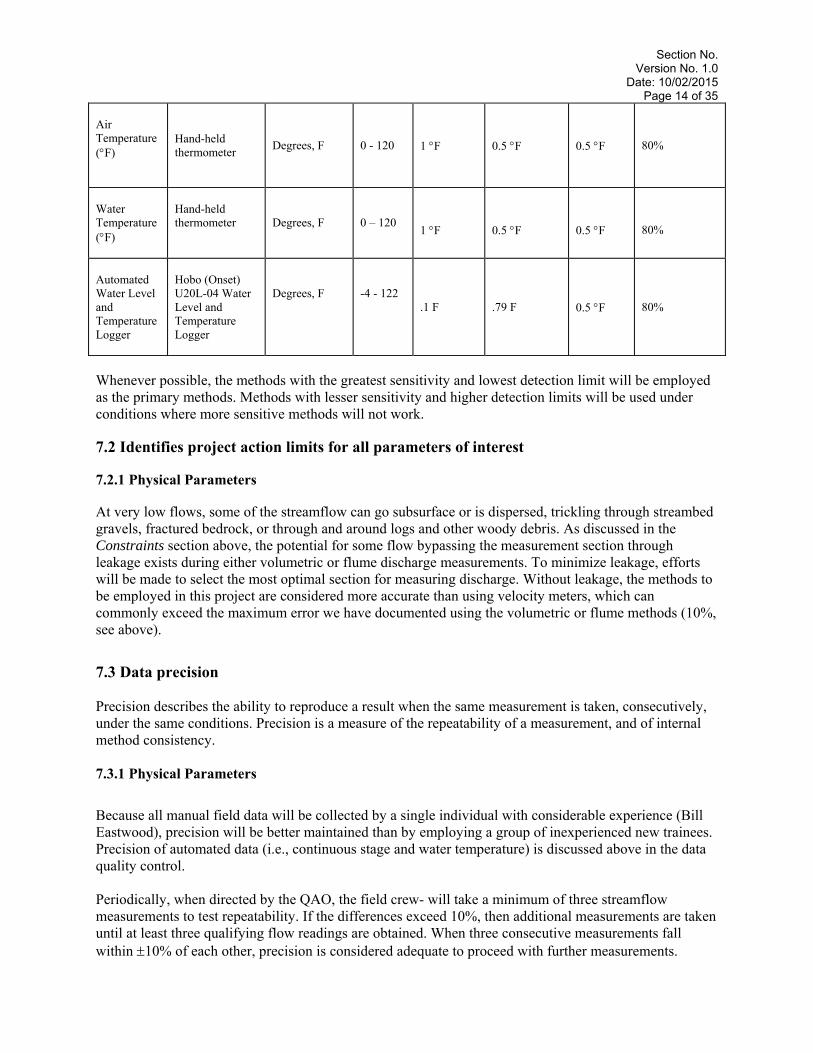
Air Temperature (F)
Hand-held thermometer
Degrees, F 0 - 120 1 F 0.5 F 0.5 F 80%
Water Temperature (F)
Hand-held thermometer
Degrees, F
0 – 120
1 F
0.5 F
0.5 F
80%
Automated Water Level and Temperature Logger
Hobo (Onset) U20L-04 Water Level and Temperature Logger
Degrees, F
-4 - 122
.1 F .79 F 0.5 F 80%
Whenever possible, the methods with the greatest sensitivity and lowest detection limit will be employed as the primary methods. Methods with lesser sensitivity and higher detection limits will be used under conditions where more sensitive methods will not work. 7.2 Identifies project action limits for all parameters of interest 7.2.1 Physical Parameters At very low flows, some of the streamflow can go subsurface or is dispersed, trickling through streambed gravels, fractured bedrock, or through and around logs and other woody debris. As discussed in the Constraints section above, the potential for some flow bypassing the measurement section through leakage exists during either volumetric or flume discharge measurements. To minimize leakage, efforts will be made to select the most optimal section for measuring discharge. Without leakage, the methods to be employed in this project are considered more accurate than using velocity meters, which can commonly exceed the maximum error we have documented using the volumetric or flume methods (10%, see above).
7.3 Data precision Precision describes the ability to reproduce a result when the same measurement is taken, consecutively, under the same conditions. Precision is a measure of the repeatability of a measurement, and of internal method consistency. 7.3.1 Physical Parameters
Because all manual field data will be collected by a single individual with considerable experience (Bill Eastwood), precision will be better maintained than by employing a group of inexperienced new trainees. Precision of automated data (i.e., continuous stage and water temperature) is discussed above in the data quality control. Periodically, when directed by the QAO, the field crew- will take a minimum of three streamflow measurements to test repeatability. If the differences exceed 10%, then additional measurements are taken until at least three qualifying flow readings are obtained. When three consecutive measurements fall within 10% of each other, precision is considered adequate to proceed with further measurements.
Section No. Version No. 1.0
Date: 10/02/2015 Page 15 of 35
SRF will coordinate with CDFW to obtain pool habitat assessment data that corresponds with current monitoring sites. CDFW personnel will adhere to protocol outlined in the CDFG Salmonid Stream Habitat Restoration Manual (4th edition, 2010, and subsequent updates). Part of this approach includes a crewmember (typically not the data recorder) taking successive measurements (e.g., pool dimensions [maximum depth, length, width], pool tail crest depth using the best-qualified personnel for all habitat assessments will yield the highest-quality and most consistent habitat data. If discrepancies occur in the field, they will be reconciled using best professional judgment among the crew present at the site and not by any single person. Duplicate data collections will be done on at least 10% of the total measurements or ratings for each habitat parameter over the course of the season. 7.3.2 Biological Parameters
SRF will coordinate with CDFW to obtain annual biological survey data that corresponds with current monitoring sites or significant pool habitat. Documenting precision for juvenile salmonid counts will be accomplished by repeating the census at 10% of the pool monitoring events each season. Snorkelers will allow a minimum of 20 minutes between successive fish counts. Precision will be calculated as Relative Percent Difference of duplicate fish counts. In the 2015 monitoring season, CDFW will conduct snorkel surveys at all of our monitoring sites where there is sufficient water. This is funded under the current emergency drought funding so this may not be something that CDFW can provide next year to complement our study. 7.4 Identifies the need for completeness Completeness is the fraction of planned data that must be collected in order to fulfill the statistical criteria of the project. There are no statistical criteria that require a certain percentage of data. However, it is expected that 80% of all measurements could be taken when anticipated. This allows for adverse weather conditions, safety concerns, and equipment problems. We will determine completeness by comparing the number of measurements we planned to collect compared to the number of measurements we actually collected that were also deemed valid. An invalid measurement would be one that does not meet the sampling methods requirements and the DQO’s (see Table 7.1). Completeness results will be checked quarterly. This will allow us to identify and correct problems.
8. Special Training Needs / Certification
8.1 Specialized Training or Certifications No special credentials or certifications (e.g., laboratory certification) are required for this project.
8.2 Training and Certification Documentation All field supervisors and crewmembers must participate in hands-on training sessions conducted or supervised by the QAO, as required by SWAMP. The QAO’s for SRF may be assisted by other recognized experts at these training sessions. The purpose of training is to ensure quality control, consistency in data collection, and to keep personnel updated if methods are updated or refined. Training fosters communication and information exchange among all levels of project organization.
Section No. Version No. 1.0
Date: 10/02/2015 Page 16 of 35
8.3 Training Personnel Training is conducted or supervised by the QAO for SRF. Training assistance may be provided by recognized experts on an as-needed basis (e.g., training in the use of stage data loggers has been provided by the QAO).
9. Documentation and Records Please note that management of project data is covered under Section 19, “Data Management.” All field results will be recorded in a fieldbook. Photocopies of fieldbook entries will be made to back-up the field data records. Within one week of data collection, the data will be entered into a spreadsheet maintained by SRF (described under ‘Data Management’). The data spreadsheet will contain separate worksheets for each monitoring site including all data collected in the field. Field data sheets will be archived for five years from the time they were collected. Stream stage data logger files downloaded from the field (‘raw’ data) will be downloaded to a laptop computer designated for this purpose. The raw files will reside on the field laptop and, within one week of downloading, the raw files will be copied to the SRF office computer for backup. The raw data files will be processed to adjust the raw stage data for atmospheric pressure (‘adjusted’ data) within one week after arriving at the SRF office. A backup of the adjusted files will be maintained on separate computer media (CD, flash drive, etc.). Raw and adjusted files will be archived for five years from the time they were collected. Hard copies of all data as well as electronic back-ups are maintained by Salmonid Restoration Federation at their headquarters and at the office of the Monitoring Coordinator. All data are available for inspection upon written request. The Project Manager will be responsible for distributing electronic or paper copies of this QAPP to all parties involved with the project, including field personnel and the individuals listed in Table 3.1. Any future amended QAPPs will be distributed in the same fashion. All originals of the first and subsequent amended QAPPs will be filed at the SRF office. Copies of versions other than the most current will be discarded so as not to create confusion.
10. Sampling Process Design The Redwood Creek Project’s low flow monitoring plan was designed by SRF in collaboration with consulting Hydrologist Randy Klein and Monitoring Coordinator Bill Eastwood. Monitoring site locations, and justifications for site selection, are described in Section 6 (above). Monitoring sites were consciously selected, as opposed to randomly sampled, in order to evaluate water conservation measures applied in specific areas, and also to have control over field conditions necessary to optimize accuracy and precision in low-flow measurements. Both spatial and temporal trends within the watershed will be evaluated for water use effects. Such trends may reveal discharge variations from the normal condition of increasing discharge with drainage area. Data from 2013 and 2014 show this occurs in Redwood Creek. Mainstem trends will be evaluated using URC-1, RC-1, RC-2.5, and RC-3 fitted with data loggers. For tributary analyses, URC-1, CC-2, MC-2, and SC-1 are similarly-sized tributary watersheds thus appropriate for comparing and contrasting. Because of its size and location, URC-1 will serve both the tributary and mainstem analyses and will likely serve as a reference site. The other monitoring sites (DC-1, BC-1, MC-1, RC-2, and RC-4
Section No. Version No. 1.0
Date: 10/02/2015 Page 17 of 35
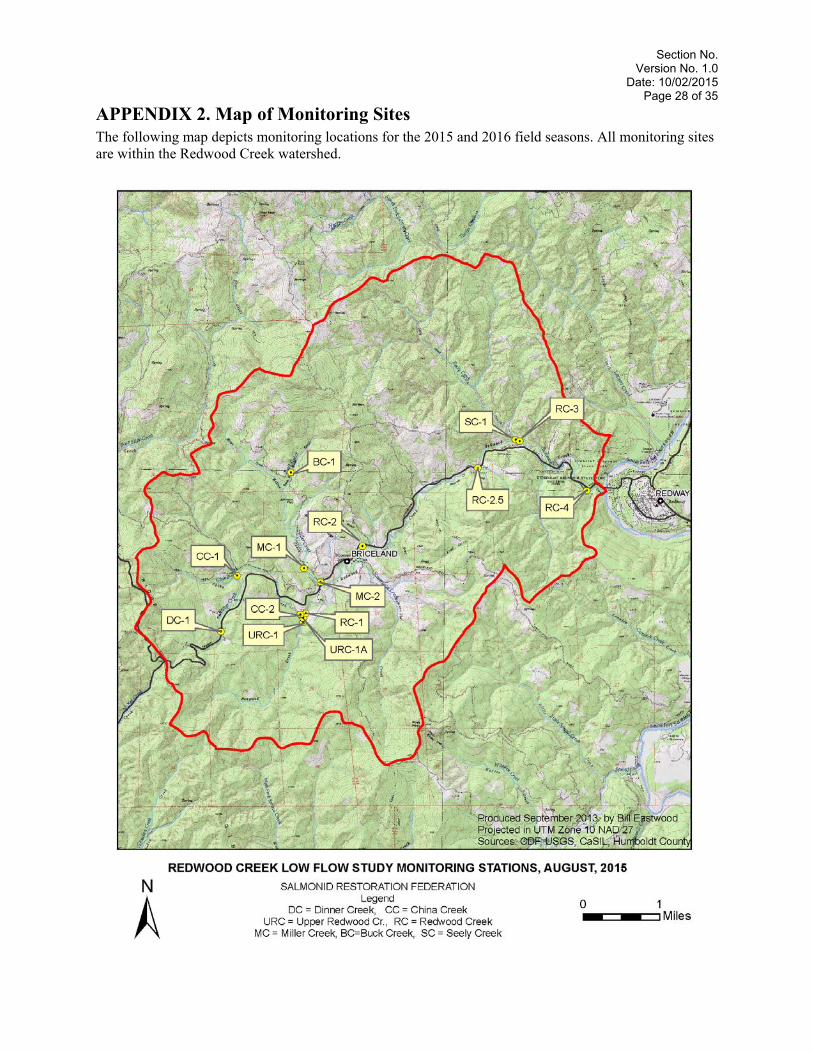
discharge will be measured periodically, but without continuous stage data collection) will be included in separate analyses of spot data. A map of the project area is attached (Appendix 2) showing the approximate locations of monitoring sites.
11. Sampling Methods Sampling methods are described in Appendix 3, Standard Operating Procedures (SOP). The SOPs are consistent with SWAMP protocols, and are presented in Appendix 5 as follows: SOP #SRF-1: SOPs for Volumetric Flow Measurement SOP #SRF-2: SOPs for 3-inch Parshall Flume Flow Measurement SOP #SRF-3: SOPs for Installation & Monitoring of Staff Gages and Pressure Transducers
12. Sample Handling and Custody Procedures No samples are collected as part of the Low-Flow Trend Monitoring Project.
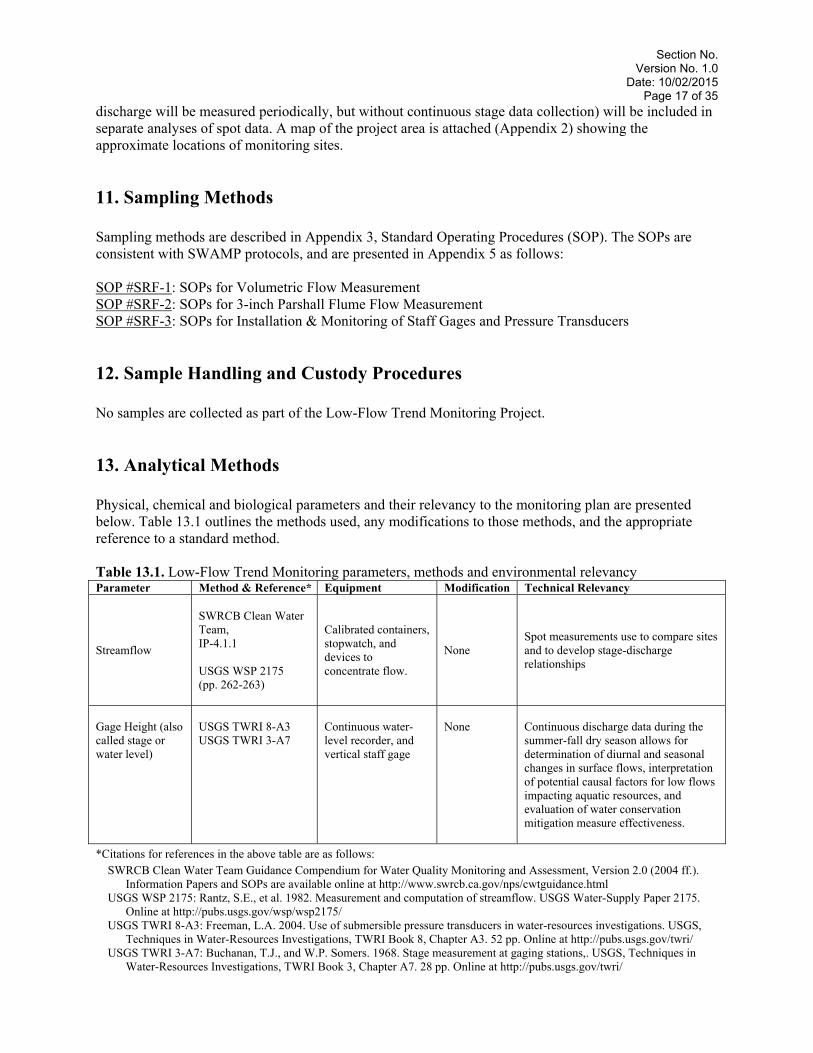
13. Analytical Methods Physical, chemical and biological parameters and their relevancy to the monitoring plan are presented below. Table 13.1 outlines the methods used, any modifications to those methods, and the appropriate reference to a standard method. Table 13.1. Low-Flow Trend Monitoring parameters, methods and environmental relevancy Parameter Method & Reference* Equipment Modification Technical Relevancy
Streamflow
SWRCB Clean Water Team, IP-4.1.1 USGS WSP 2175 (pp. 262-263)
Calibrated containers, stopwatch, and devices to concentrate flow.
None Spot measurements use to compare sites and to develop stage-discharge relationships
Gage Height (also called stage or water level)
USGS TWRI 8-A3 USGS TWRI 3-A7
Continuous water-level recorder, and vertical staff gage
None
Continuous discharge data during the summer-fall dry season allows for determination of diurnal and seasonal changes in surface flows, interpretation of potential causal factors for low flows impacting aquatic resources, and evaluation of water conservation mitigation measure effectiveness.
*Citations for references in the above table are as follows: SWRCB Clean Water Team Guidance Compendium for Water Quality Monitoring and Assessment, Version 2.0 (2004 ff.).
Information Papers and SOPs are available online at http://www.swrcb.ca.gov/nps/cwtguidance.html USGS WSP 2175: Rantz, S.E., et al. 1982. Measurement and computation of streamflow. USGS Water-Supply Paper 2175.
Online at http://pubs.usgs.gov/wsp/wsp2175/ USGS TWRI 8-A3: Freeman, L.A. 2004. Use of submersible pressure transducers in water-resources investigations. USGS,
Techniques in Water-Resources Investigations, TWRI Book 8, Chapter A3. 52 pp. Online at http://pubs.usgs.gov/twri/ USGS TWRI 3-A7: Buchanan, T.J., and W.P. Somers. 1968. Stage measurement at gaging stations,. USGS, Techniques in
Water-Resources Investigations, TWRI Book 3, Chapter A7. 28 pp. Online at http://pubs.usgs.gov/twri/
Section No. Version No. 1.0
Date: 10/02/2015 Page 18 of 35
Standard Methods for the Examination of Water and Wastewater, 21st edition, 2005, published by American Public Health Association, American Water Works Association, and Water Environment Federation. pp. 4-136 to 4-137. Online at http://www.standardmethods.org/
CDFG (California Department of Fish and Game), Salmonid Stream Habitat Restoration Manual, 3rd edition (1998) and subsequent updates. Online at http://www.dfg.ca.gov/nafwb/manual.html
14. Quality Control
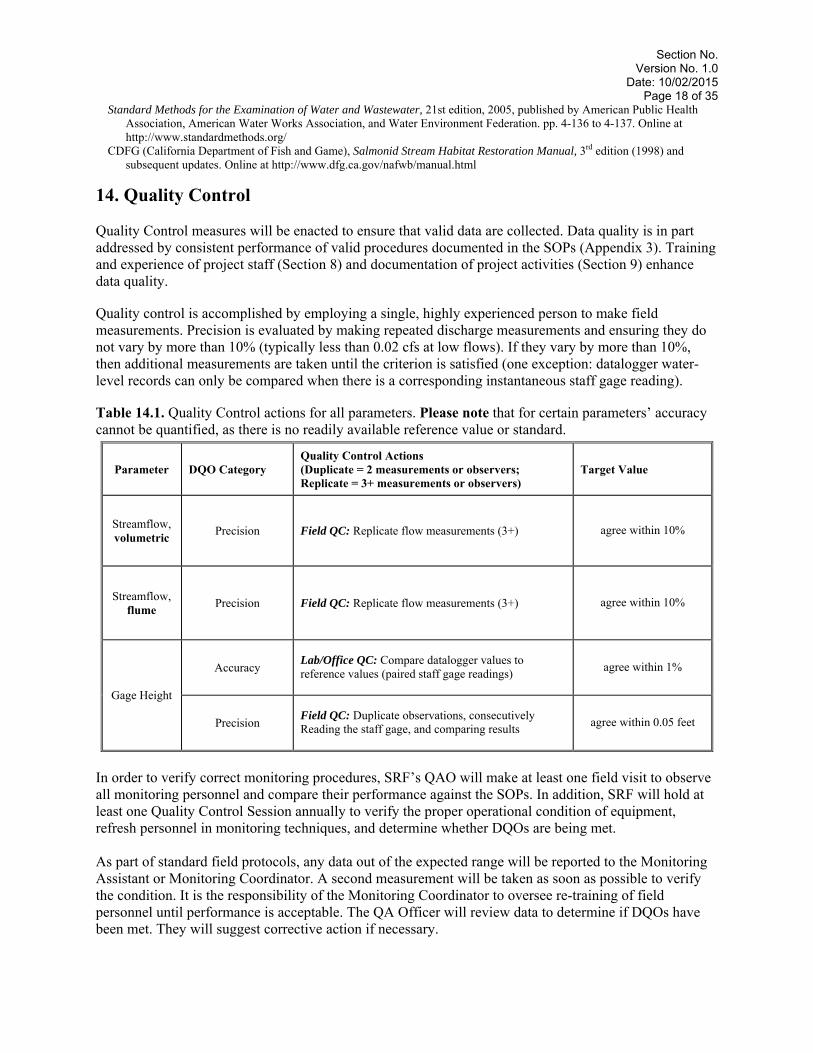
Quality Control measures will be enacted to ensure that valid data are collected. Data quality is in part addressed by consistent performance of valid procedures documented in the SOPs (Appendix 3). Training and experience of project staff (Section 8) and documentation of project activities (Section 9) enhance data quality. Quality control is accomplished by employing a single, highly experienced person to make field measurements. Precision is evaluated by making repeated discharge measurements and ensuring they do not vary by more than 10% (typically less than 0.02 cfs at low flows). If they vary by more than 10%, then additional measurements are taken until the criterion is satisfied (one exception: datalogger water-level records can only be compared when there is a corresponding instantaneous staff gage reading). Table 14.1. Quality Control actions for all parameters. Please note that for certain parameters’ accuracy cannot be quantified, as there is no readily available reference value or standard.
Parameter DQO Category Quality Control Actions (Duplicate = 2 measurements or observers; Replicate = 3+ measurements or observers)
Target Value
Streamflow, volumetric
Precision Field QC: Replicate flow measurements (3+) agree within 10%
Streamflow, flume
Precision Field QC: Replicate flow measurements (3+) agree within 10%
Gage Height
Accuracy Lab/Office QC: Compare datalogger values to reference values (paired staff gage readings)
agree within 1%
Precision Field QC: Duplicate observations, consecutively Reading the staff gage, and comparing results
agree within 0.05 feet
In order to verify correct monitoring procedures, SRF’s QAO will make at least one field visit to observe all monitoring personnel and compare their performance against the SOPs. In addition, SRF will hold at least one Quality Control Session annually to verify the proper operational condition of equipment, refresh personnel in monitoring techniques, and determine whether DQOs are being met. As part of standard field protocols, any data out of the expected range will be reported to the Monitoring Assistant or Monitoring Coordinator. A second measurement will be taken as soon as possible to verify the condition. It is the responsibility of the Monitoring Coordinator to oversee re-training of field personnel until performance is acceptable. The QA Officer will review data to determine if DQOs have been met. They will suggest corrective action if necessary.
Section No. Version No. 1.0
Date: 10/02/2015 Page 19 of 35
Field data will be double-checked before leaving a site. On returning from the field, field data will be copied and stored in a site-specific binder. The binder and the original data will be stored at the locations specified in Section 9, “Documentation and Records.” SRF’s Project Manager and hydrologist Randy Klein will review manual field data and electronic data files monthly to determine if the data meet the Quality Assurance Project Plan objectives. Any outliers, spurious results or omissions will be brought to the attention of the Monitoring Coordinator / Monitoring Assistant. QAOs will also evaluate compliance with the DQOs. They will suggest corrective action that will be implemented by the Project Coordinator or Team Leader. Problems with data quality and corrective action will be reported in final reports. If data do not meet the project’s specifications, the following actions will be taken. First, the QAO will review the errors and determine if the problem is equipment failure, calibration/maintenance techniques, or monitoring/sampling techniques. If the problem cannot be corrected by re-training, revision of techniques, or replacement of supplies/equipment, then the TAC will review the DQOs and determine if the DQOs are feasible. If the specific DQOs are not achievable, they will determine whether the specific DQO can be relaxed, or if the parameter should be eliminated from the monitoring program. Any revisions to DQOs will be appended to this QAPP with the revision date and the reason for modification. The appended QAPP will be sent to the SWB Contract Manager and QAO. When the amended QAPP is approved, the Project Coordinator or Team Leader will ensure that all data meeting the new DQOs are entered into the database. Archived data can also be entered.
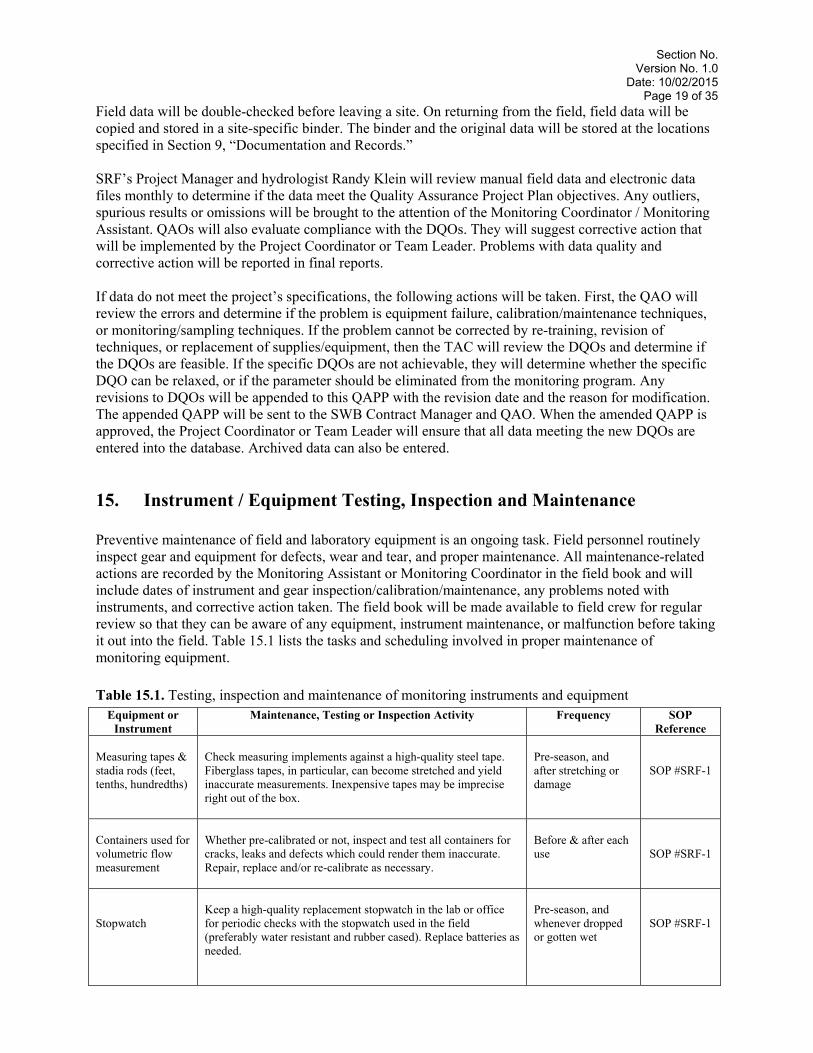
15. Instrument / Equipment Testing, Inspection and Maintenance Preventive maintenance of field and laboratory equipment is an ongoing task. Field personnel routinely inspect gear and equipment for defects, wear and tear, and proper maintenance. All maintenance-related actions are recorded by the Monitoring Assistant or Monitoring Coordinator in the field book and will include dates of instrument and gear inspection/calibration/maintenance, any problems noted with instruments, and corrective action taken. The field book will be made available to field crew for regular review so that they can be aware of any equipment, instrument maintenance, or malfunction before taking it out into the field. Table 15.1 lists the tasks and scheduling involved in proper maintenance of monitoring equipment.
Table 15.1. Testing, inspection and maintenance of monitoring instruments and equipment Equipment or
Instrument Maintenance, Testing or Inspection Activity Frequency SOP
Reference Measuring tapes & stadia rods (feet, tenths, hundredths)
Check measuring implements against a high-quality steel tape. Fiberglass tapes, in particular, can become stretched and yield inaccurate measurements. Inexpensive tapes may be imprecise right out of the box.
Pre-season, and after stretching or damage
SOP #SRF-1
Containers used for volumetric flow measurement
Whether pre-calibrated or not, inspect and test all containers for cracks, leaks and defects which could render them inaccurate. Repair, replace and/or re-calibrate as necessary.
Before & after each use
SOP #SRF-1
Stopwatch
Keep a high-quality replacement stopwatch in the lab or office for periodic checks with the stopwatch used in the field (preferably water resistant and rubber cased). Replace batteries as needed.
Pre-season, and whenever dropped or gotten wet
SOP #SRF-1
Section No. Version No. 1.0
Date: 10/02/2015 Page 20 of 35
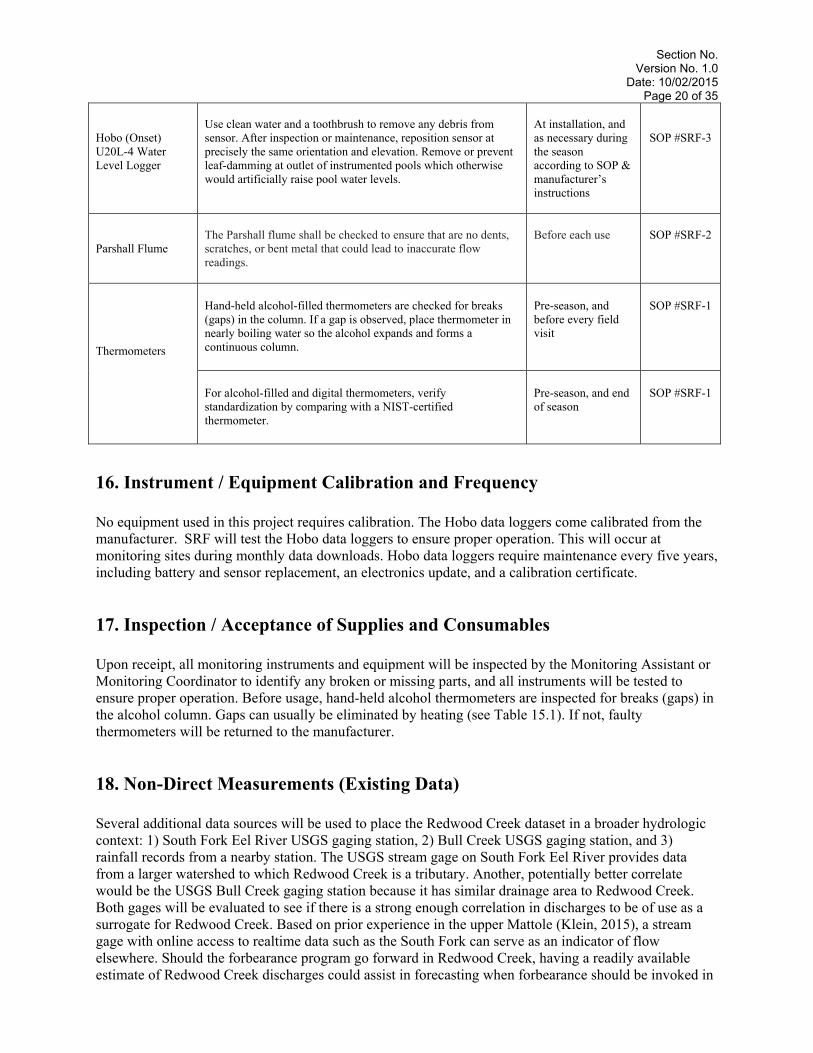
Hobo (Onset) U20L-4 Water Level Logger
Use clean water and a toothbrush to remove any debris from sensor. After inspection or maintenance, reposition sensor at precisely the same orientation and elevation. Remove or prevent leaf-damming at outlet of instrumented pools which otherwise would artificially raise pool water levels.
At installation, and as necessary during the season according to SOP & manufacturer’s instructions
SOP #SRF-3
Parshall Flume
The Parshall flume shall be checked to ensure that are no dents, scratches, or bent metal that could lead to inaccurate flow readings.
Before each use
SOP #SRF-2
Thermometers
Hand-held alcohol-filled thermometers are checked for breaks (gaps) in the column. If a gap is observed, place thermometer in nearly boiling water so the alcohol expands and forms a continuous column.
Pre-season, and before every field visit
SOP #SRF-1
For alcohol-filled and digital thermometers, verify standardization by comparing with a NIST-certified thermometer.
Pre-season, and end of season
SOP #SRF-1
16. Instrument / Equipment Calibration and Frequency No equipment used in this project requires calibration. The Hobo data loggers come calibrated from the manufacturer. SRF will test the Hobo data loggers to ensure proper operation. This will occur at monitoring sites during monthly data downloads. Hobo data loggers require maintenance every five years, including battery and sensor replacement, an electronics update, and a calibration certificate.
17. Inspection / Acceptance of Supplies and Consumables Upon receipt, all monitoring instruments and equipment will be inspected by the Monitoring Assistant or Monitoring Coordinator to identify any broken or missing parts, and all instruments will be tested to ensure proper operation. Before usage, hand-held alcohol thermometers are inspected for breaks (gaps) in the alcohol column. Gaps can usually be eliminated by heating (see Table 15.1). If not, faulty thermometers will be returned to the manufacturer.
18. Non-Direct Measurements (Existing Data) Several additional data sources will be used to place the Redwood Creek dataset in a broader hydrologic context: 1) South Fork Eel River USGS gaging station, 2) Bull Creek USGS gaging station, and 3) rainfall records from a nearby station. The USGS stream gage on South Fork Eel River provides data from a larger watershed to which Redwood Creek is a tributary. Another, potentially better correlate would be the USGS Bull Creek gaging station because it has similar drainage area to Redwood Creek. Both gages will be evaluated to see if there is a strong enough correlation in discharges to be of use as a surrogate for Redwood Creek. Based on prior experience in the upper Mattole (Klein, 2015), a stream gage with online access to realtime data such as the South Fork can serve as an indicator of flow elsewhere. Should the forbearance program go forward in Redwood Creek, having a readily available estimate of Redwood Creek discharges could assist in forecasting when forbearance should be invoked in
Section No. Version No. 1.0
Date: 10/02/2015 Page 21 of 35
the Redwood Creek watershed. It could also serve for estimating flows at monitoring sites where a strong enough correlation exists. A third data source proved to be useful in the upper Mattole River is antecedent precipitation index, or API, which uses a decay function applied to daily rainfall data to provide an index of the watershed’s wetness. It is often well-correlated with streamflow. Both South Fork Eel River flow and API will be tested to evaluate their utility for estimating and forecasting low flows in Redwood Creek. Although not presently monitored, several tributaries to Bull Creek have the potential to provide relatively unimpaired flows for comparison with Redwood Creek sites. Much of the Bull Creek watershed is located within Humboldt Redwoods State Park. Several tributaries in the lower watershed are forested with a mix of old growth redwood and maturing cutover lands incorporated into the park after harvesting decades ago. Assuming there is little water extraction in some of these tributaries, they could serve as control sites. They have several key features similar to Redwood Creek, including drainage areas, climate, aspect, geology, and basin geomorphology.
19. Data Management Data will be maintained as established in Section 9, “Documentation and Records.” The Monitoring Assistant, Monitoring Coordinator, and QAO will review their fieldbook entries and confirm that the data are deemed acceptable for electronic data entry. During data entry, routine consistency checks are performed to check for transcription errors from paper to electronic form. Field data will be entered by the Monitoring Assistant into an online database (Google Spreadsheet) in a format that is compatible with SWRCB guidelines for the Information Management System used by SWAMP. The Monitoring Assistant and Project Manager will coordinate database maintenance for information collected in this project. Electronic data files are backed up weekly, and computer back-ups (e.g., CDs, portable hard drives, or portable USB storage devices) are stored at SRF’s Garberville office. Hard copies of all data, as well as electronic back-ups, are maintained by all project partners at their headquarters and also at a separate secure location. All data are available for inspection upon written request. All records will be passed to the SWB Contract Manager at project completion. As indicated in Section 9 of this QAPP, copies of the records will be maintained by project partners for five years after project completion and then discarded, except for the database, which will be maintained without discarding.
20. Assessment and Response Actions Review of all field practices and data collection activities is the responsibility of the Monitoring Coordinator and Monitoring Assistant, with the assistance of the QAO. All field personnel will be accompanied by their QAO at least once during each low-flow monitoring season. Reviews of field and lab performance will be based on comparing observed practices to those in the SOPs. If possible, personnel in need of performance improvement will be retrained on-site. If a field audit discovers a discrepancy that cannot be resolved by on-site retraining, the QAO will discuss the problem with that person individually. The discussion will begin with whether the information collected has acceptable accuracy and precision, what were the cause(s) leading to the deviation, how the deviation might impact data quality, and what corrective actions might be considered. All personnel trainings, re-trainings, and corrective actions will be recorded using the Data Quality Form: Training Documentation (Appendix 1).
Section No. Version No. 1.0
Date: 10/02/2015 Page 22 of 35
The QAO has the power to halt all monitoring by an organization if the deviation(s) noted are considered detrimental to data quality. All field and laboratory activities and records may be reviewed by State or Regional Water Board QAO as requested.
21. Reports to Management SRF will produce interim reports at twice per year (by the 10th of the month following the quarter) so that deliverables can be provided to the SWB Grant Manager in a timely fashion. At a minimum, quarterly progress reports will consist of a narrative description of work completed for each task, and any significant problems that might cause project shortfalls or delays. At the end of each season’s data collection, project partners will also compile, analyze and interpret the data collected in an end-of-season report (draft due in December, and final due on the 10th of January; see Table 6.3.1 for specific deliverables and due dates). The results of data quality assessments from the QAO will be incorporated into year-end reports. The Monitoring Assistant and Project Manager will be responsible for interim and final report preparation. All monitoring data will be submitted to SWB in SWAMP-comparable formats. If the QA Officer, in consultation with the Monitoring Assistant and Monitoring Coordinator, determines that data quality has been compromised, they will submit a report to the Project Supervisor and/or the Technical Advisory Committee with suggestions on how to improve data quality or alter sample design for re-measurement.
22. Data Review, Verification, and Validation The information in this Section of the QAPP describes the final critical checks that will be done on the information obtained to decide whether they satisfy the quality criteria listed previously in Section 7 (Data Quality Objectives), and whether that information can be used. The level of detail and frequency for performing data review, verification, and validation activities will depend on the complexity of the project, and the importance of the decision to be made based on it. Data review is the in-house examination to ensure that the data have been recorded, transmitted, and processed correctly. That includes, for example, checking for data entry, transcription, calculation, reduction, and transformation errors. It may also mean ensuring that there is full documentation of sampling information available, such as duplicates and replicates, and ensuring that there are no programming errors. Data verification is the process for evaluating the completeness, correctness, and conformance/compliance of a specific data set against the method, procedural, or contractual specifications. Data validation is an analytic- and sample-specific process that extends the evaluation of data beyond method, procedure, or contractual compliance to determine the quality of a specific data set relative to the end use. Data review is the first step, done in-house soon after data collection. Data verification is generally done next, internally by those generating the data or by an organization external to that group. Data validation is generally performed on the verified data later in the process by the QAO or other entity independent of the data generator and the data user. The latter two processes may occur both during and at the end of the project.
Section No. Version No. 1.0
Date: 10/02/2015 Page 23 of 35
The following two paragraphs describe the criteria for deciding to accept, reject, or qualify project data in an objective and consistent manner. Procedures are discussed in Section 23, “Validation and Verification Methods.” Data generated by project activities will be reviewed against the DQOs cited in Section 7 and the quality assurance/quality control practices cited in Sections 14, 15, 16, and 17. Data will be separated into three categories: data meeting all DQOs, data failing to meet precision criteria, and data failing to meet accuracy criteria. Data meeting all data quality objectives, but with failures of quality assurance/quality control practices, will be set aside until the impact of the failure on data quality is determined. Once determined, the data will be moved into either the first category or the last category. Data falling in the first category is considered usable by the project. Data falling in the last category is considered not usable. Data falling in the second category will have all aspects assessed. If sufficient evidence is found supporting data quality for use in this project, the data will be moved to the first category, but will be flagged with a “J” as per Environmental Protection Agency (EPA) specifications.
23. Verification and Validation Methods All data records (field data sheets, Data Quality Forms, and related documentation) will be checked visually and recorded as checked by initials and dates. Before leaving each monitoring site, the crew supervisor will check field data for errors, completeness, and legibility. In the office, the Project Coordinator or Team Leader (or designee, usually someone other than the crew supervisor or field data recorder) will double-check all calculations on copies of all field forms. That person will also check the forms for errors, completeness, and legibility, and then initial and date each form. Any questionable data will be brought to the attention of the responsible crew supervisor and field data recorder. Decisions to accept, reject or qualify data will be made jointly by the QAO and Monitoring Coordinator. Issues will be noted in a brief narrative after considering such factors as equipment limitations, instrument malfunctioning, procedural problems, personnel performance, level of training or proficiency, etc. Reconciliation and correction will be done by a committee composed of the above personnel and other appropriate project staff or technical advisors. Any corrections require unanimous agreement that the correction is appropriate.
24. Reconciliation with User Requirements Salmonid Restoration Federation needs a sufficient number of instantaneous discharge measurements at all monitoring stations in the Redwood Creek watershed in order to perform low-flow trend analyses and evaluate the effectiveness of water conservation activities. At instrumented sites equipped with continuous water-level recorders, an adequate number of data points are needed, over a range of flows, to develop a useful rating curve or stage-discharge relationship. The more points, the more precise a rating curve is likely to be.
Section No. Version No. 1.0
Date: 10/02/2015 Page 24 of 35
APPENDIX 1. Data Quality Forms The following forms are records used by the QA Officer and project staff for quality assurance and quality control.
Section No. Version No. 1.0
Date: 10/02/2015 Page 25 of 35
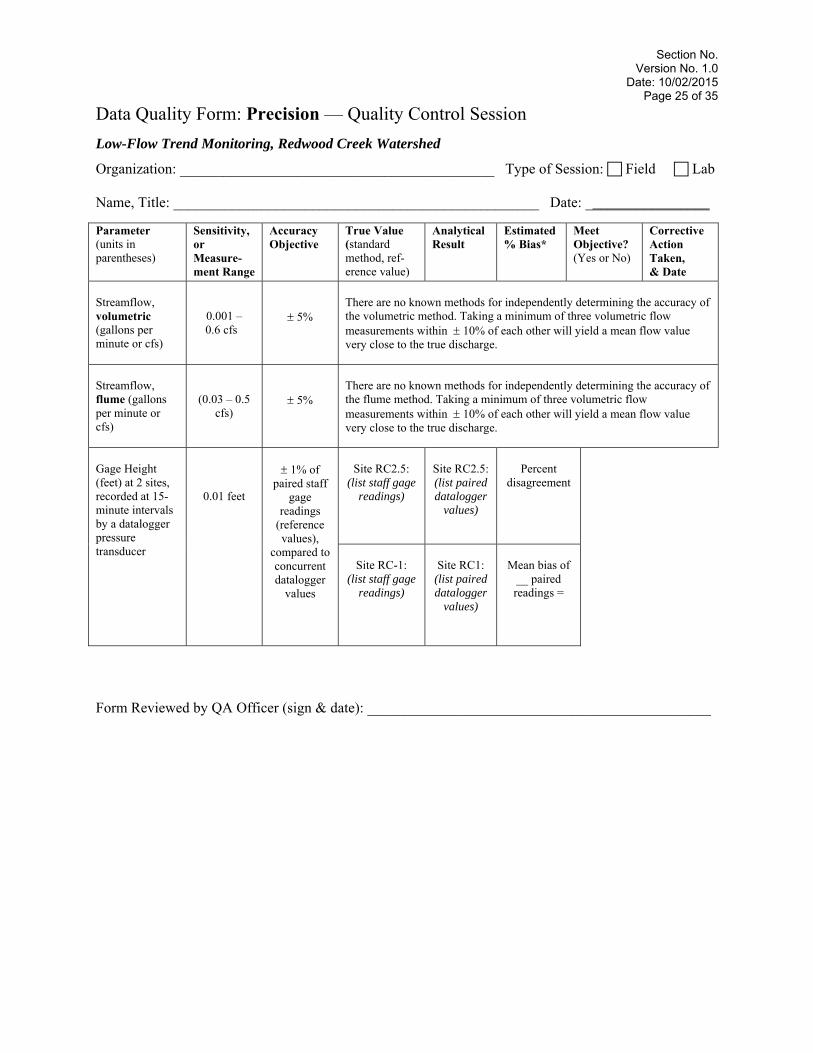
Data Quality Form: Precision — Quality Control Session
Low-Flow Trend Monitoring, Redwood Creek Watershed
Organization: ___________________________________________ Type of Session: Field Lab Name, Title: __________________________________________________ Date: _________________ Parameter (units in parentheses)
Sensitivity, or Measure-ment Range
Accuracy Objective
True Value (standard method, ref-erence value)
Analytical Result
Estimated % Bias*
Meet Objective? (Yes or No)
Corrective Action Taken, & Date
Streamflow, volumetric (gallons per minute or cfs)
0.001 – 0.6 cfs
5%
There are no known methods for independently determining the accuracy of the volumetric method. Taking a minimum of three volumetric flow measurements within 10% of each other will yield a mean flow value very close to the true discharge.
Streamflow, flume (gallons per minute or cfs)
(0.03 – 0.5 cfs)
5%
There are no known methods for independently determining the accuracy of the flume method. Taking a minimum of three volumetric flow measurements within 10% of each other will yield a mean flow value very close to the true discharge.
Gage Height (feet) at 2 sites, recorded at 15-minute intervals by a datalogger pressure transducer
0.01 feet
1% of
paired staff gage
readings (reference values),
compared to concurrent datalogger
values
Site RC2.5:
(list staff gage readings)
Site RC2.5: (list paired datalogger
values)
Percent
disagreement
Site RC-1:
(list staff gage readings)
Site RC1:
(list paired datalogger
values)
Mean bias of
__ paired readings =
Form Reviewed by QA Officer (sign & date): _______________________________________________
Section No. Version No. 1.0
Date: 10/02/2015 Page 26 of 35
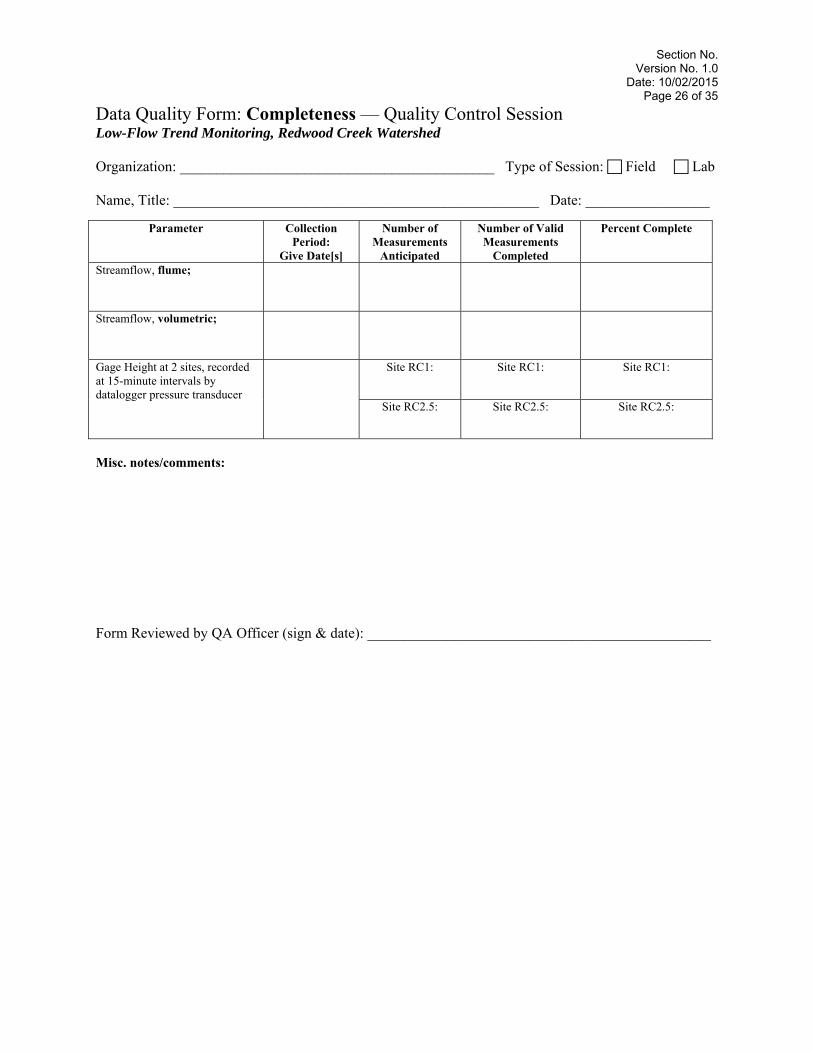
Data Quality Form: Completeness — Quality Control Session Low-Flow Trend Monitoring, Redwood Creek Watershed Organization: ___________________________________________ Type of Session: Field Lab Name, Title: __________________________________________________ Date: _________________
Parameter Collection Period:
Give Date[s]
Number of Measurements
Anticipated
Number of Valid Measurements
Completed
Percent Complete
Streamflow, flume;
Streamflow, volumetric;
Gage Height at 2 sites, recorded at 15-minute intervals by datalogger pressure transducer
Site RC1: Site RC1: Site RC1:
Site RC2.5: Site RC2.5: Site RC2.5:
Misc. notes/comments: Form Reviewed by QA Officer (sign & date): _______________________________________________
Section No. Version No. 1.0
Date: 10/02/2015 Page 27 of 35
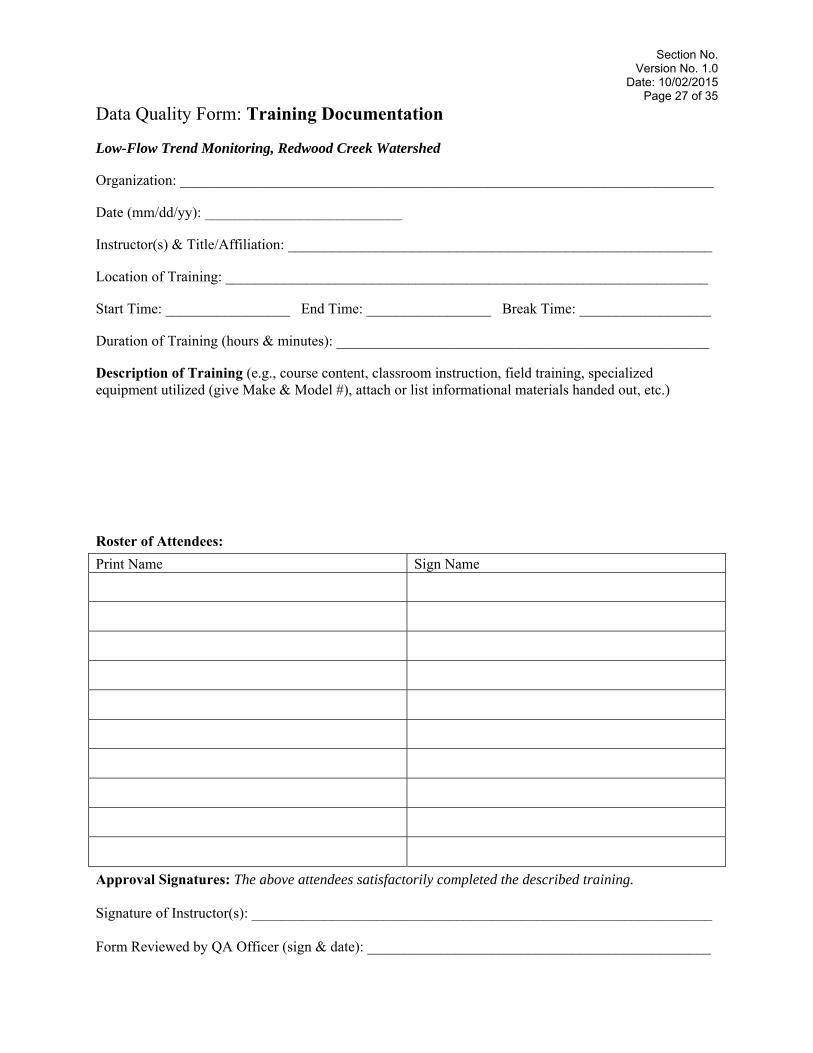
Data Quality Form: Training Documentation Low-Flow Trend Monitoring, Redwood Creek Watershed Organization: _________________________________________________________________________ Date (mm/dd/yy): ___________________________ Instructor(s) & Title/Affiliation: __________________________________________________________ Location of Training: __________________________________________________________________ Start Time: _________________ End Time: _________________ Break Time: __________________ Duration of Training (hours & minutes): ___________________________________________________ Description of Training (e.g., course content, classroom instruction, field training, specialized equipment utilized (give Make & Model #), attach or list informational materials handed out, etc.) Roster of Attendees:
Print Name Sign Name
Approval Signatures: The above attendees satisfactorily completed the described training. Signature of Instructor(s): _______________________________________________________________ Form Reviewed by QA Officer (sign & date): _______________________________________________
Section No. Version No. 1.0
Date: 10/02/2015 Page 28 of 35
APPENDIX 2. Map of Monitoring Sites The following map depicts monitoring locations for the 2015 and 2016 field seasons. All monitoring sites are within the Redwood Creek watershed.
Section No. Version No. 1.0
Date: 10/02/2015 Page 29 of 35
APPENDIX 3. Standard Operating Procedures (SOPs) SOP #SRF-1: SOPs for Volumetric Flow Measurement The simplest way to measure the flow in a stream channel is to collect all the flow for a given period of time in a container, and measure the volume of water that had accumulated in the container during that time. The measurement units normally used are gallons per minute, gallons per second, or quarts per second. When streamflow is in the order of magnitude of up to 224 gal/min (= 3.75 gal/sec, 15 quarts/sec, or 0.50 cubic feet per second), the water can be channeled into a flexible “apron” or spout that discharges into a bucket or tub, and the rate at which the container is filled can be measured. This concept is the basis for the volumetric method that uses a temporary weir (or an apron and sandbags assembly) combined with a container and a stopwatch. Volumetric flow measurement is also called the “bucket and stopwatch” method, or the “container and timepiece” method. The challenges of the apron procedure are to get all the water in the channel to flow into the apron or spout, and to have a sufficient “step” under the apron discharge that would accommodate a container. Finding natural or constructed chutes can help. If a bucket is too tall, another option is to use a flatter pan, tray or even a garbage bag and then transfer the water into a graduated cylinder for volume measurement. Hydrologists have sometimes used plumber’s putty (a water-insoluble, pliable matter used in plumbing) and plastic sheeting to fashion a temporary weir across the channel, with a spout or outflow pipe that can easily direct all the flow into a container. There are several advantages to using the volumetric approach, namely:
• The volumetric method — and the use of tracers, not described here — are the only techniques that allow for high-quality flow measurements in natural channels when flows are less than about 180 gallons per minute (3 gal/sec, 12 quarts/sec, or 0.40 cubic feet per second), whereas all methods based on water velocity measurements are generally much less effective in this range.
• It can generate reliable data of known quality in a fully documented, scientifically defensible manner. • It can provide consistent results with a very narrow range of error. • It does not require expensive equipment, and takes a reasonable amount of time to perform. • It does not require outstanding expertise, and can easily be taught to any field operator. Equipment List:
• buckets, pans, trays, plastic bags and other containers of suitable size and type for collecting flow • 2000-milliliter graduated cylinder • plastic sheeting, garbage bags, or other flexible material to construct a weir or apron • sandbags, plumber’s putty, or other materials helpful in constructing a weir or apron • PVC or poly pipe of appropriate lengths and diameters for conveying flow • good-quality stopwatch, preferably water resistant and rubber cased • field data sheets • clipboard • 2 mechanical pencils • pocket calculator • wristwatch or timepiece • (optional) GPS unit [not necessary if GPS coordinates are already recorded for an established
monitoring station] • (optional) digital camera
Section No. Version No. 1.0
Date: 10/02/2015 Page 30 of 35
Measurement Techniques:
Because of the site-specific nature of volumetric flow measurement, it is impractical to list step-by-step procedures that will be applicable to all flow monitoring stations. Methods for channeling all streamflow into a bucket or container, the size and shape of container used, and other details are by necessity tailored to site conditions. Ultimately, the success of the volumetric method depends upon close attention to detail, the ingenuity and patience of the crew, and on the unique configuration and conditions at each flow measurement site. The following standard procedures, however, will be followed in all cases. 1) After installing a weir or apron, allow the flow to stabilize before collecting volumetric data. Note:
Channel modifications shall not be done at stations where pressure transducer readings or staff gage readings will be affected.
2) Containers used for volumetric measurement will be pre-calibrated and marked to a known volume.
Alternatively, the volume of water collected in a container over a measured time interval are determined in the field using a 2000-milliliter (mL) graduated cylinder, and these volume measurements are recorded on the data sheet to the nearest 10 mL.
3) Stopwatch readings are recorded on the data sheet to the nearest hundredth of a second. 4) Since graduated cylinders are calibrated in milliliters and elapsed time is measured in seconds, we
must make a conversion to arrive at gallons per minute of flow. In the field, convert individual flow readings on the data sheet from mL/sec (or gal/sec) to gal/min using the conversion factors provided on the data sheet. Round these individual flow calculations to 2 decimal places (round 0 through 4 down, and 5 through 9 up).
5) At each monitoring station, volumetric flow measurements will be made at least three times to be
certain no errors have been made and to ensure the precision of results. If the Coefficient of Variation (CV) exceeds 10% for the first three volumetric flow determinations at a site, then additional measurements are taken until three qualifying flow readings are obtained (see QAPP Section 7.4.1 for description of calculations). A minimum of three qualifying measurements are averaged to yield a single value for mean flow, recorded in gallons per minute to 2 decimal places. All flow data, even outlier measurements that are ultimately rejected, shall be recorded on the field data sheet.
6) If someone other than the data recorder is taking and reporting stopwatch readings and volume
measurements, the data recorder should verbally repeat the values to ensure correct data recording. 7) Record on the field form the staff gage reading (if applicable) to the nearest hundredth of a foot, and
the time of the reading. For detailed instructions, see “Reading the Staff Gage” in the SOP describing staff gage installation and monitoring. Double-check the staff gage reading to be absolutely certain of the water level, as this value will later be compared to continuous stage data recorded by a datalogger pressure transducer. If the stage appears to change while the flow measurement is in progress, obtain one or more additional staff gage readings and also record the time of those readings.
8) Before leaving the flow measurement site, the crew supervisor will check the field form for errors,
completeness, and legibility, and then initial and date the form. 9) When converting volumetric flow values from gallons per minute to cubic feet per second, use the
following guidelines:
• Report values greater than 1 cfs to the nearest tenth (e.g., 1.35 would be reported as 1.4 cfs). • Report values less than 1 cfs but greater than or equal to 0.1 cfs to the nearest hundredth (e.g.,
0.6749 would be reported as 0.67 cfs).
Section No. Version No. 1.0
Date: 10/02/2015 Page 31 of 35
• Report flow values less than 0.1 cfs to the nearest thousandth (e.g., 0.0058 would be reported as 0.006 cfs).
10) In the office, the Project Coordinator (or designee, usually someone other than the crew supervisor or
field data recorder) will double-check all calculations on the data sheet. That person will also check the entire form for errors, completeness, and legibility, and then initial and date the form.
Section No. Version No. 1.0
Date: 10/02/2015 Page 32 of 35
SOP #SRF-2: SOPs for 3-inch Parshall Flume Flow Measurement The Parshall Flume is placed in the low flow channel where the flow has been concentrated in a manner similar to the description for the Volumetric Method described above. The upstream edge of the flume has a taped-on plastic sheet apron that extends upstream about 16 inches where it is buried in the stream bottom with fine sand. This makes a very effective seal. The flume is leveled during placement using the attached level bubble. Measurements of water depth within the flume are taken in the attached stilling well using 10-inch long, 3/8-inch wooden dowels that are submerged in the stilling well and the wetted length measured to the nearest tenth of a centimeter. To improve measuring accuracy, the scale used to measure the wetted length has a ¼ inch perpendicular protrusion at the zero mark to rest the end of the dowel against. Four measurements are taken to settle on the nearest tenth of a centimeter. The water depth is converted to flow (in gpm or cfs) using the Oregon State University Extension Parshall Flume Calculator that is online at: http://irrigation.wsu.edu/Content/Calculators/Water-Measurements/Parshall-Flume.php
SOP #SRF-3: SOPs for Installation & Monitoring of Staff Gages and Water Level Loggers (Pressure Transducers) Staff Gages
Stream stage is defined as the elevation of the water surface above an arbitrary datum. A staff gage is simply a means to measure the stream’s stage as it may vary through time. Staff gage measurements made coincident with discharge measurements allow development of a stage-discharge rating curve so that discharge may be computed for any stage falling within the range of measurements. The more points and the better distributed across the range of flows measured, the more precise the rating curve is likely to be. At sites fitted with electronic stage recorders, manual staff gage readings paired with coincident electronic stages allow adjustment of the electronic records to match those made manually. Traditional staff gages consist of a scale (usually enameled steel) graduated in feet and hundredths of feet placed in a stream. Such installations would be prone to vandalism in Redwood Creek, so an alternative method is employed. For this project, we are using a fixed datum (e.g., nail in a tree projecting out over the water) and measuring down to the water from the datum. Best located in a pool, the gage height, or stage, is recorded in increments of 0.01 feet. Staff gages and data loggers are co-located in the low flow channel so they measure the same water level. Site selection is a critical component in the collection of accurate data. The precise location of each stage monitoring station was chosen to take advantage of the best locally available conditions for stage and discharge measurements. The staff gage is generally mounted as close as practicable to the data logger, and usually with its face parallel to the current in an orientation where the gage can be read from the bank so it is unnecessary to wade and potentially disrupt or ripple the water surface. One of the most important criteria is that staff gages and associated instrumentation must be installed in a pool upstream from a stable hydraulic control (e.g., stable riffle) that is sensitive to changes in the low flow. Hydraulic controls govern the water level at the station and determine the stage-discharge relationship. Installation of a Pressure Transducer and Establishing a Stage-Discharge Rating Curve
Continuous monitoring of discharge requires the installation of a water level recorder — such as a submersible pressure transducer and electronic datalogger — in conjunction with the staff gage. The instrumentation currently being used is Hobo U20L-4 ventless water level logger made by Onset, Inc. The state range of the logger is 13 feet.
Section No. Version No. 1.0
Date: 10/02/2015 Page 33 of 35
Stage data recorders are ideally set at an elevation below the lowest expected water level. They are enclosed in plastic pipe to protect them from disturbance by animals, etc. The pipes, also called ‘stilling wells’, must be as vandal-proof as possible. Consequently, they are installed beneath the streambed surface into the gravel substrate so they cannot be seen from above. To prevent vertical shifting and resultant errors, the plastic stilling wells are anchored to metal post driven into the streambed. The data loggers are programmed to record water levels at 15 minute measurement intervals. The data are downloaded in the field every 4 weeks (i.e. monthly). Water-level data are retrieved on-site using a portable computer with the proper data downloading software, per instructions detailed in the manufacturer’s operating manual. As soon as possible after returning to the office with downloaded data, the data will be reviewed and compared to coincident staff-gage readings, and closely examined for potential errors. The data should be fully checked for quality and flagged for potentially erroneous values such as spikes, gaps, etc. Some anomalous data may be due to obvious causes (e.g., sensor being calibrated or maintained, leaf accumulation or other pool outlet changes, equipment limitations, instrument malfunctioning, procedural problems, personnel performance, training shortfalls, water diversions, recent weather patterns etc.), but other suspicious values may not have a clear origin or explanation. All suspect data should be investigated, and outliers should be clearly identified in the data file. Outlier data will be rejected if they can be explained by some physical phenomenon, but care must be taken not to delete anomalous data that may simply reveal actual dynamic changes. For data points with corresponding staff gage readings, accuracy and precision should be evaluated to verify that Data Quality Objectives have been met. If the continuous stage data “passes,” it is considered acceptable for the time period represented. If not, explanations will be sought with the goal of making corrections if possible. Failing this, clearly erroneous and un-correctable data will be rejected from further analysis. The next step is to establish a stage-discharge rating curve for each instrumented station by plotting a series of independent flow measurements and simultaneous stage readings at different water levels. The rating curve converts stage to discharge. Discharge rating curves are usually determined empirically by means of periodic measurements of discharge and stage (minimum of 10 measurements per year is recommended). For optimum accuracy, it is important that the rating curve include stage and flow measurements made over the entire range of interest, in this case from a maximum of several cfs down to near-zero flow. An anticipated problem alluded to earlier is the phenomenon of continuous stage data being adversely affected by accumulations of leaves at the outlet of instrumented pools. Past experience in the Mattole has shown that, beginning in September, floating and sinking leaves accumulate in thick layers at pool tails, thereby artificially raising pool water levels a slight amount. The effect is likely accentuated in pools where the outlet is constricted. The magnitude of elevated stage is unknown — probably no more than a few hundredths of a foot — but could result in substantial overestimation of flow when applying a stage-discharge relationship. Monitoring personnel will take appropriate measures to avoid leaf accumulation affecting the data, including installation of instream or overhead netting to minimize leaf-damming of affected pool outlets, and/or weekly visits to instrumented sites (or more frequently, if necessary) to manually clear accumulated debris. If the latter approach is employed, personnel must record the staff gage reading to the nearest hundredth of a foot, and the time of the reading, both before and after modifying the pool outlet. At the end of the low-flow monitoring season, before high water or flooding occurs, monitoring personnel will remove all materials and instrumentation installed in and adjacent to the stream channel to prevent damage or loss of valuable equipment. This includes data logger pressure transducers, all plastic pipe and posts, staff gages, sandbags and sheeting, etc. All materials and equipment will be properly stored so they will be ready for deployment the following low-flow season.
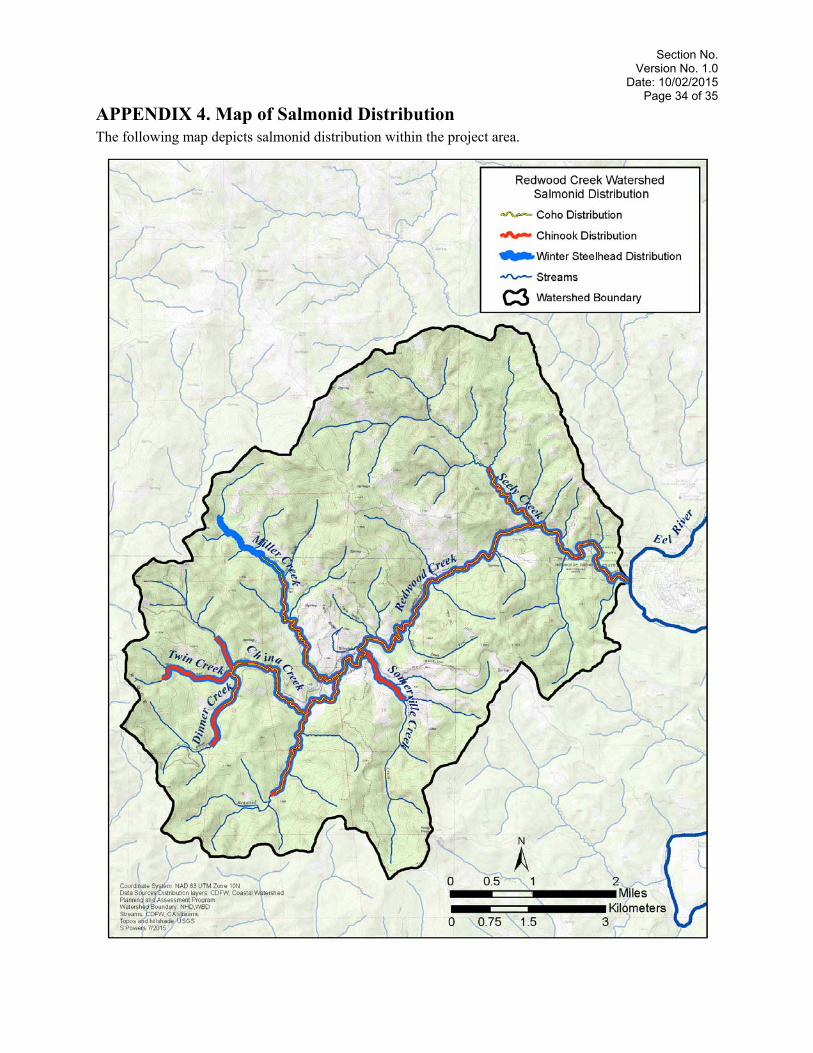
Section No. Version No. 1.0
Date: 10/02/2015 Page 34 of 35
APPENDIX 4. Map of Salmonid Distribution The following map depicts salmonid distribution within the project area.
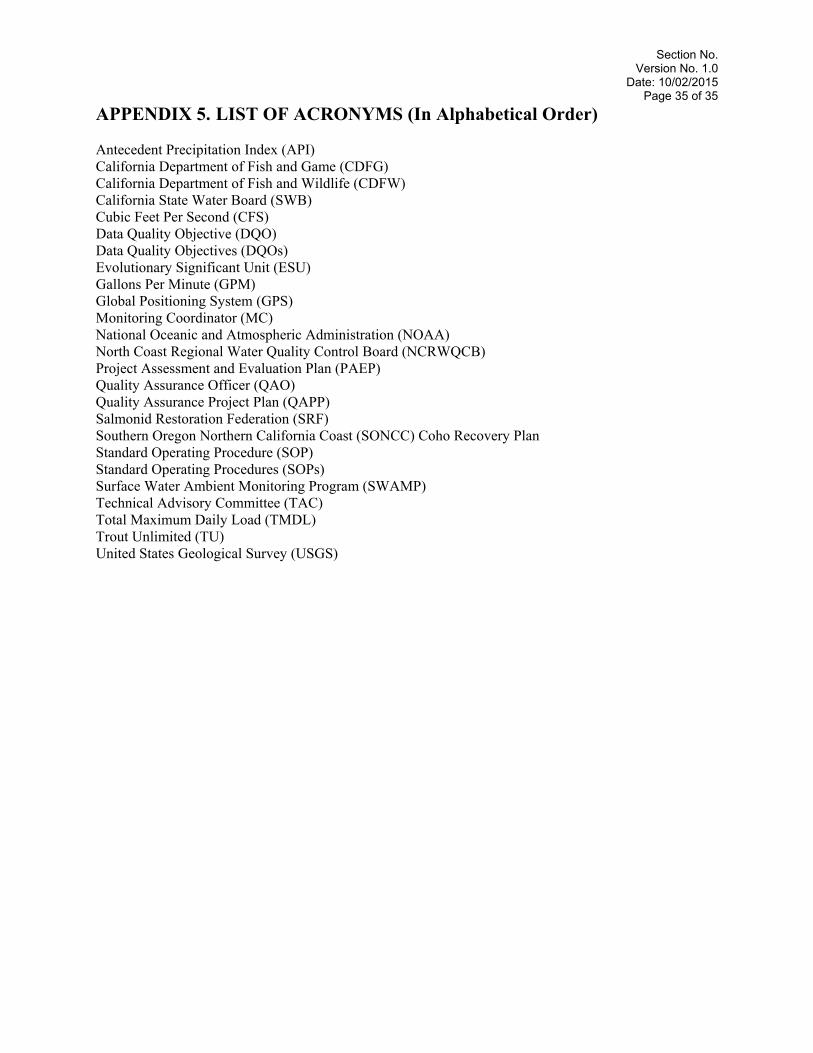
Section No. Version No. 1.0
Date: 10/02/2015 Page 35 of 35
APPENDIX 5. LIST OF ACRONYMS (In Alphabetical Order) Antecedent Precipitation Index (API) California Department of Fish and Game (CDFG) California Department of Fish and Wildlife (CDFW) California State Water Board (SWB) Cubic Feet Per Second (CFS) Data Quality Objective (DQO) Data Quality Objectives (DQOs) Evolutionary Significant Unit (ESU) Gallons Per Minute (GPM) Global Positioning System (GPS) Monitoring Coordinator (MC) National Oceanic and Atmospheric Administration (NOAA) North Coast Regional Water Quality Control Board (NCRWQCB) Project Assessment and Evaluation Plan (PAEP) Quality Assurance Officer (QAO) Quality Assurance Project Plan (QAPP) Salmonid Restoration Federation (SRF) Southern Oregon Northern California Coast (SONCC) Coho Recovery Plan Standard Operating Procedure (SOP) Standard Operating Procedures (SOPs) Surface Water Ambient Monitoring Program (SWAMP) Technical Advisory Committee (TAC) Total Maximum Daily Load (TMDL) Trout Unlimited (TU) United States Geological Survey (USGS)
Related Documents

![Restoring Salmonid Aquatic/Riparian Habitat...aquatic/riparian habitat restoration activities. [5] [6] VISION AND OBJECTIVES The overreaching goal of this initiative is to improve](https://static.cupdf.com/doc/110x72/6104737c127ac45d1972c9a7/restoring-salmonid-aquaticriparian-habitat-aquaticriparian-habitat-restoration.jpg)