Sage PFW ERP 6561 Irvine Center Drive Irvine, CA 92618 888-473-5135 Sage PFW Intelligence Getting Started Guide

Welcome message from author
This document is posted to help you gain knowledge. Please leave a comment to let me know what you think about it! Share it to your friends and learn new things together.
Transcript

Sage PFW ERP 6561 Irvine Center Drive Irvine, CA 92618 888-473-5135
Sage PFW Intelligence
Getting Started Guide
Page 2
Sage PFW ERP, 6561 Irvine Center Drive, Irvine, CA 92618 888-473-5135
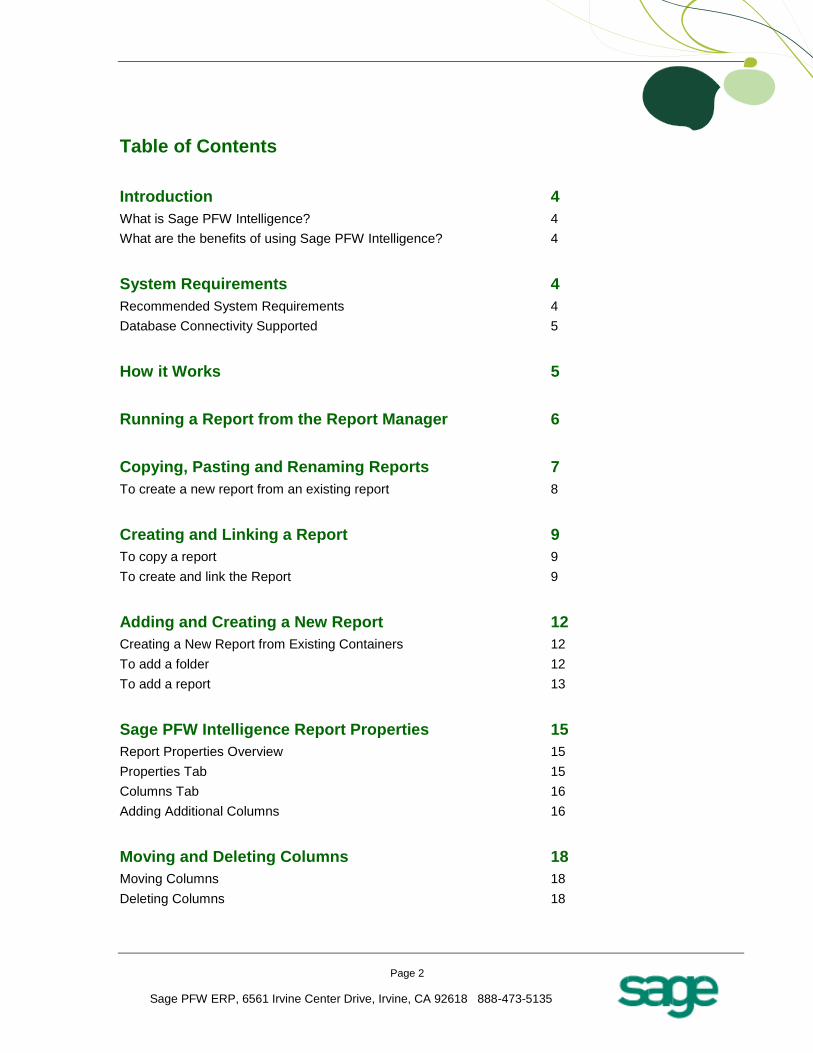
Table of Contents
Introduction 4
What is Sage PFW Intelligence? 4
What are the benefits of using Sage PFW Intelligence? 4
System Requirements 4
Recommended System Requirements 4
Database Connectivity Supported 5
How it Works 5
Running a Report from the Report Manager 6
Copying, Pasting and Renaming Reports 7
To create a new report from an existing report 8
Creating and Linking a Report 9
To copy a report 9
To create and link the Report 9
Adding and Creating a New Report 12
Creating a New Report from Existing Containers 12
To add a folder 12
To add a report 13
Sage PFW Intelligence Report Properties 15
Report Properties Overview 15
Properties Tab 15
Columns Tab 16
Adding Additional Columns 16
Moving and Deleting Columns 18
Moving Columns 18
Deleting Columns 18
Page 3
Sage PFW ERP, 6561 Irvine Center Drive, Irvine, CA 92618 888-473-5135
Exporting Reports 19
Importing Reports 20
Security Manager 22
Security Manager Access 22
Adding Roles 23
Adding Reports to Roles 25
Creating a Simple Pivot Table in Excel 26
Reasons for Organizing Data into a Pivot Table 26
Original Worksheet 26
Pivot Table 26
Pivot Chart 26
Pivot Table Concept and Layout 27
Microsoft Excel 2007 27
Create a Pivot Table Report 28
Pivot Table Field List 29
Turn the Field List On/Off 30
Remove, Add and Move Fields 30
Remove a Field 30
Add a Field 31
Move Fields within the Table 31
Pivot Table Concept and Layout 2003 32
Create a Pivot Table Report 33
Remove, Add and Move Fields 35
Remove a Field 35
Add a Field 26
Getting Support 36
Page 4
Sage PFW ERP, 6561 Irvine Center Drive, Irvine, CA 92618 888-473-5135
Introduction
What is Sage PFW Intelligence?
Organizations are increasingly suffering from information frustration, having to manage large volumes of
data, and needing to report from several databases, using inflexible reporting tools. Information delivery
and user empowerment is increasingly taking center stage in all enterprises with a resultant growth in the
end user query and reporting (EUQR) category of the business intelligence market. Sage PFW
Intelligence is an innovative software reporting solution that offers users in organizations of all sizes a
powerful and intuitive reporting tool to take control of their own reports. It introduces a revolutionary
approach to leveraging the reporting power of Microsoft Excel and protects and extends organizations
existing IT skills and investment.
What are the benefits of using Sage PFW Intelligence?
• Work with a standard Windows look and feel
• Reduces the need for IT department intervention
• Reduces the need for expensive consultants and specialist software training
• Consistent format (Microsoft Excel) for reporting across multiple data sources
• Business intelligence can become a standard desktop tool
• Avoids inefficiencies in the report development life cycle thereby improving productivity
• Empowers the user thereby improving overall productivity
• Optimizes your return on investment by leveraging your existing IT infrastructure
• Extends Microsoft Excel skills rather than requiring learning of a new set of software skills
Sage PFW Intelligence is a cost effective, high value reporting tool that allows people to spend more time
doing things that directly translate into business value. It offers flexible access to business intelligence
and empowers the user to create and customize operational and analytical reports on a real time basis.
Sage PFW Intelligence allows an organization to track information more effectively and delivers a rapid
return on investment at a moderate total cost of ownership.
System Requirements
Recommended System Requirements
• Operating System : Windows XP SP3, Windows Vista, Windows 7 (32 and 64 bit), Windows
Server 2003, Windows Server 2008, Windows Terminal Server
• Microsoft .Net Framework 3.5 SP1
• Microsoft Excel 2003 and higher. Note : to run Report Designer reports, you need to have
Microsoft Excel 2007 or higher. (32 bit only)
• Hardware: CPU > 1.3 GHz
• Memory: 1GB RAM
• Hard Drive Space: 350MB
Page 5
Sage PFW ERP, 6561 Irvine Center Drive, Irvine, CA 92618 888-473-5135
Database Connectivity Supported
Sage PFW Intelligence uses ODBC and OLEDB technology to gain access to Open
Database Systems. Sage PFW Intelligence includes direct support for most popular database systems
and Connection Types for these are included within the Connector. For systems where a Connection
Type does not exist but where the system has an ODBC driver these can be accessed via the System
DSN connection types within the Connector.
Some of the more common Database types supported are:
• Microsoft SQL Server
• Pervasive
• Oracle
• Sybase
• Microsoft Access
• Microsoft Visual FoxPro
• Dbase
• MySQL
• Sage50
• Paradox
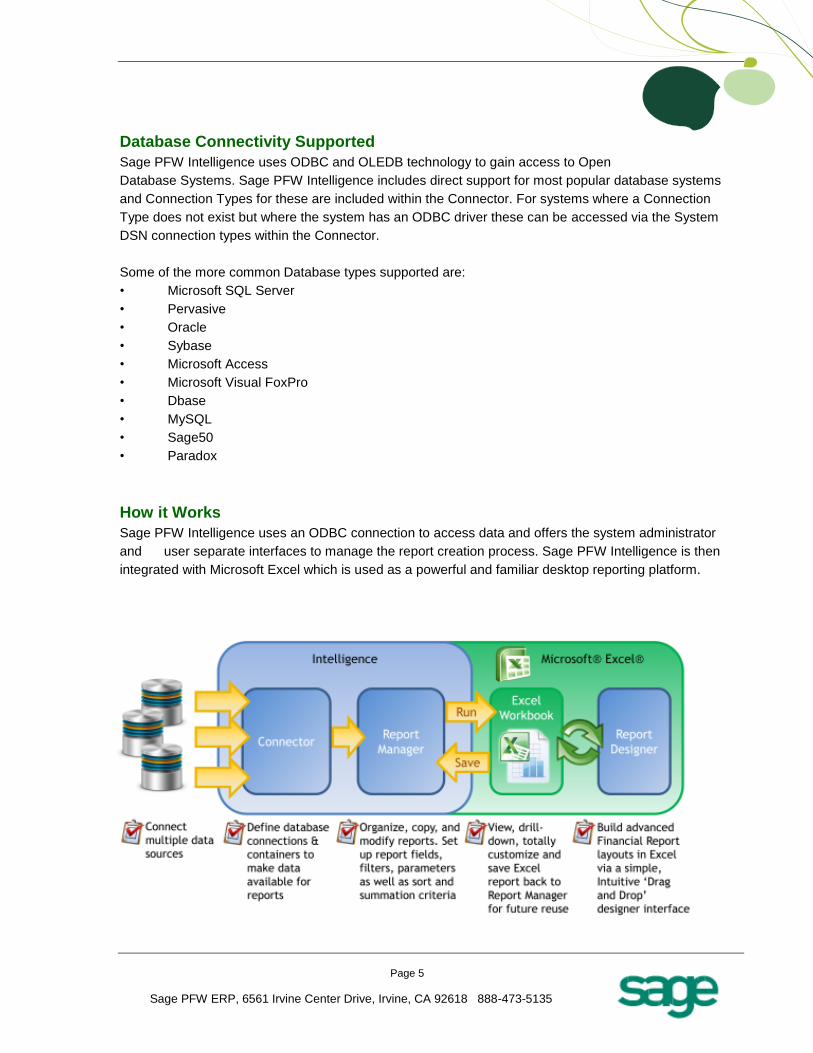
How it Works
Sage PFW Intelligence uses an ODBC connection to access data and offers the system administrator
and user separate interfaces to manage the report creation process. Sage PFW Intelligence is then
integrated with Microsoft Excel which is used as a powerful and familiar desktop reporting platform.
Page 6
Sage PFW ERP, 6561 Irvine Center Drive, Irvine, CA 92618 888-473-5135
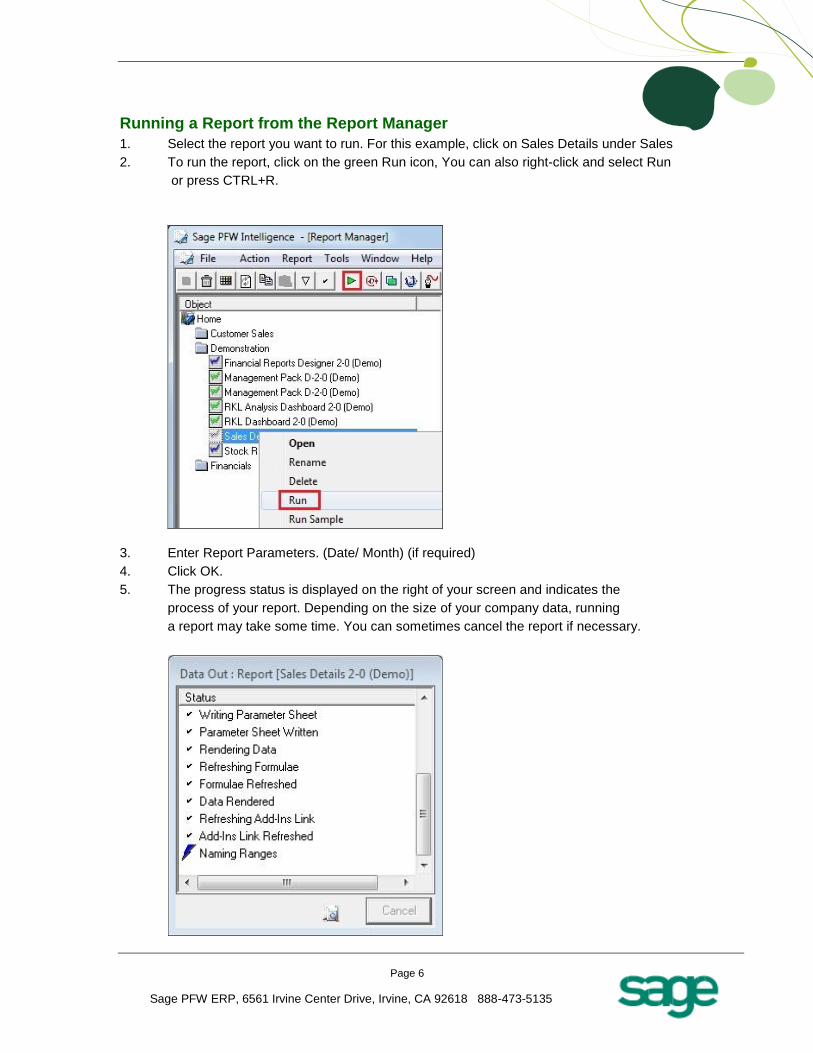
Running a Report from the Report Manager
1. Select the report you want to run. For this example, click on Sales Details under Sales
2. To run the report, click on the green Run icon, You can also right-click and select Run
or press CTRL+R.
3. Enter Report Parameters. (Date/ Month) (if required)
4. Click OK.
5. The progress status is displayed on the right of your screen and indicates the
process of your report. Depending on the size of your company data, running
a report may take some time. You can sometimes cancel the report if necessary.
Page 7
Sage PFW ERP, 6561 Irvine Center Drive, Irvine, CA 92618 888-473-5135
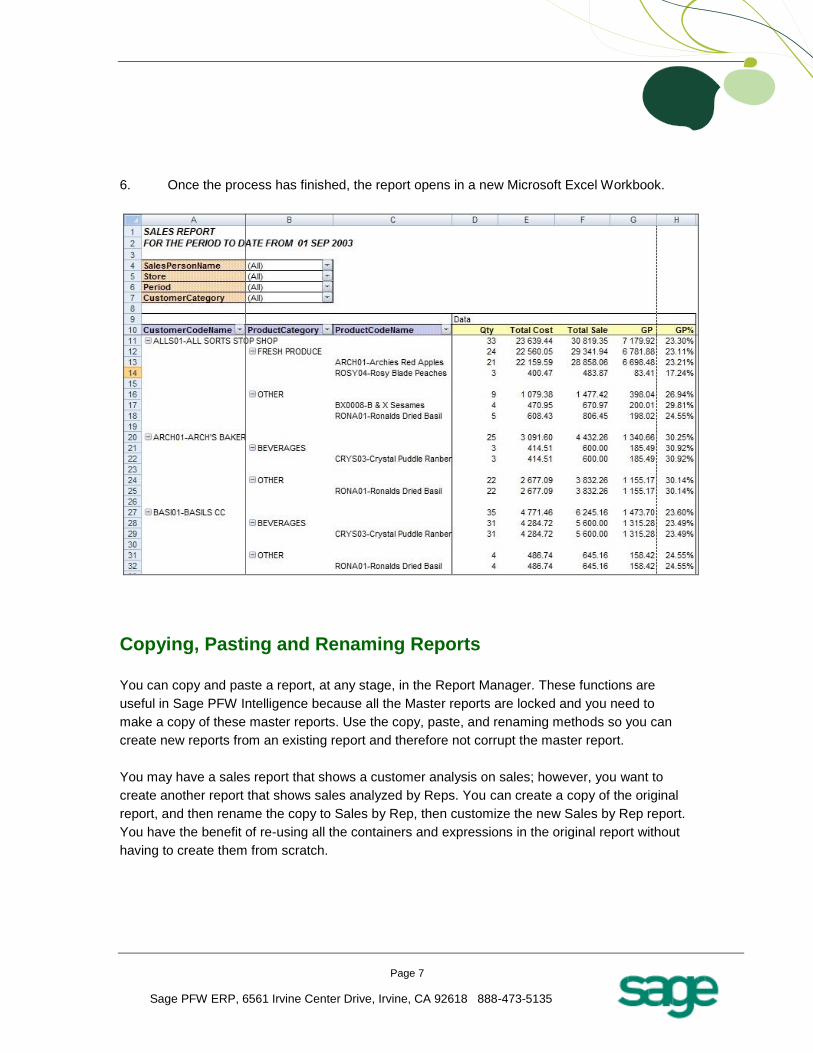
6. Once the process has finished, the report opens in a new Microsoft Excel Workbook.
Copying, Pasting and Renaming Reports
You can copy and paste a report, at any stage, in the Report Manager. These functions are
useful in Sage PFW Intelligence because all the Master reports are locked and you need to
make a copy of these master reports. Use the copy, paste, and renaming methods so you can
create new reports from an existing report and therefore not corrupt the master report.
You may have a sales report that shows a customer analysis on sales; however, you want to
create another report that shows sales analyzed by Reps. You can create a copy of the original
report, and then rename the copy to Sales by Rep, then customize the new Sales by Rep report.
You have the benefit of re-using all the containers and expressions in the original report without
having to create them from scratch.
Page 8
Sage PFW ERP, 6561 Irvine Center Drive, Irvine, CA 92618 888-473-5135
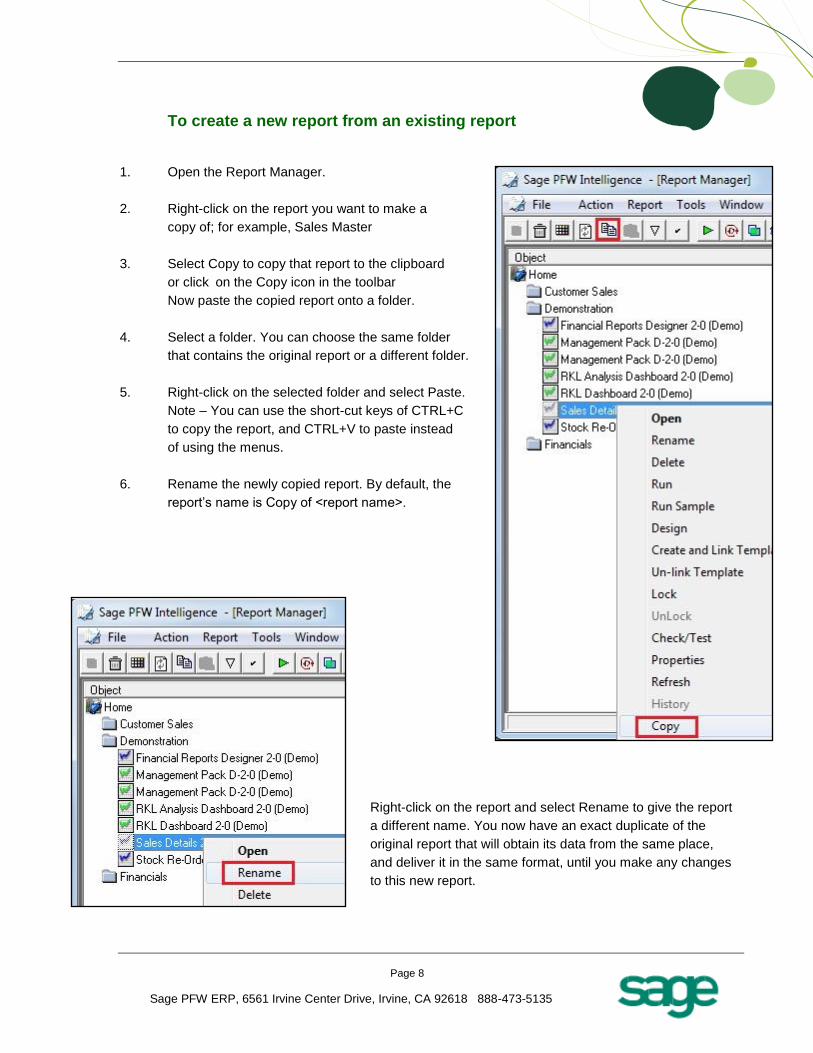
To create a new report from an existing report
1. Open the Report Manager.
2. Right-click on the report you want to make a
copy of; for example, Sales Master
3. Select Copy to copy that report to the clipboard
or click on the Copy icon in the toolbar
Now paste the copied report onto a folder.
4. Select a folder. You can choose the same folder
that contains the original report or a different folder.
5. Right-click on the selected folder and select Paste.
Note – You can use the short-cut keys of CTRL+C
to copy the report, and CTRL+V to paste instead
of using the menus.
6. Rename the newly copied report. By default, the
report’s name is Copy of <report name>.
Right-click on the report and select Rename to give the report
a different name. You now have an exact duplicate of the
original report that will obtain its data from the same place,
and deliver it in the same format, until you make any changes
to this new report.
Page 9
Sage PFW ERP, 6561 Irvine Center Drive, Irvine, CA 92618 888-473-5135
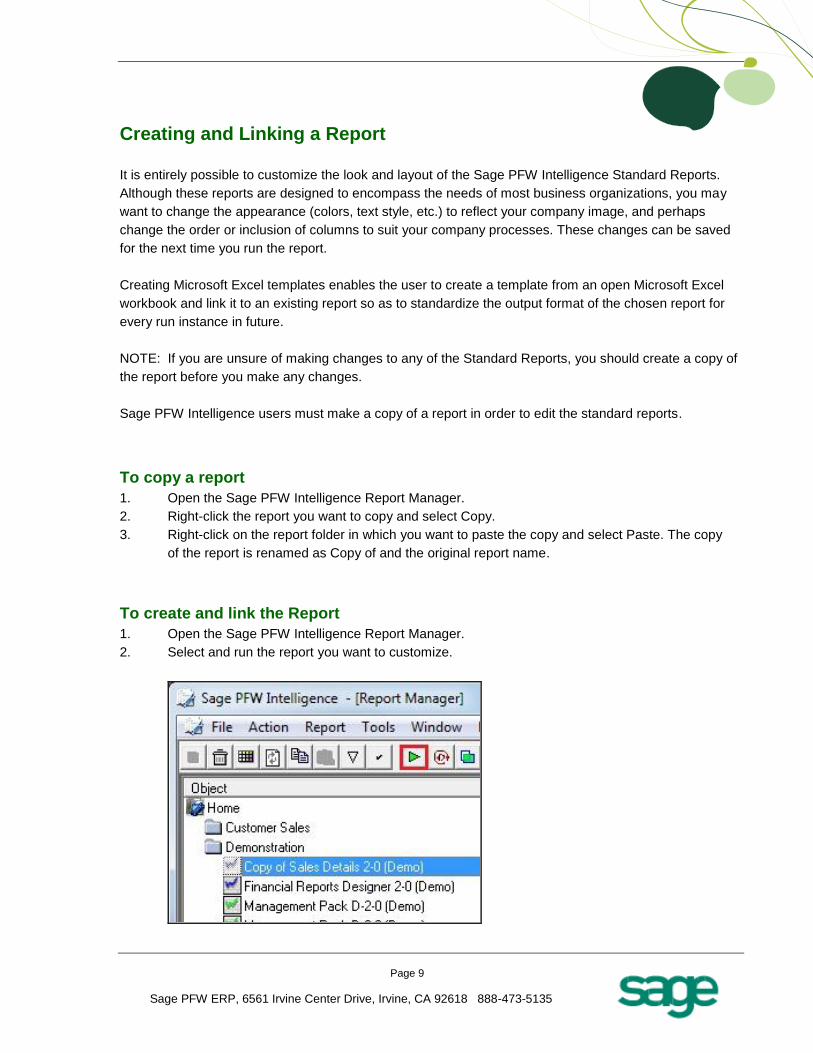
Creating and Linking a Report
It is entirely possible to customize the look and layout of the Sage PFW Intelligence Standard Reports.
Although these reports are designed to encompass the needs of most business organizations, you may
want to change the appearance (colors, text style, etc.) to reflect your company image, and perhaps
change the order or inclusion of columns to suit your company processes. These changes can be saved
for the next time you run the report.
Creating Microsoft Excel templates enables the user to create a template from an open Microsoft Excel
workbook and link it to an existing report so as to standardize the output format of the chosen report for
every run instance in future.
NOTE: If you are unsure of making changes to any of the Standard Reports, you should create a copy of
the report before you make any changes.
Sage PFW Intelligence users must make a copy of a report in order to edit the standard reports.
To copy a report
1. Open the Sage PFW Intelligence Report Manager.
2. Right-click the report you want to copy and select Copy.
3. Right-click on the report folder in which you want to paste the copy and select Paste. The copy
of the report is renamed as Copy of and the original report name.
To create and link the Report
1. Open the Sage PFW Intelligence Report Manager.
2. Select and run the report you want to customize.
Page 10
Sage PFW ERP, 6561 Irvine Center Drive, Irvine, CA 92618 888-473-5135
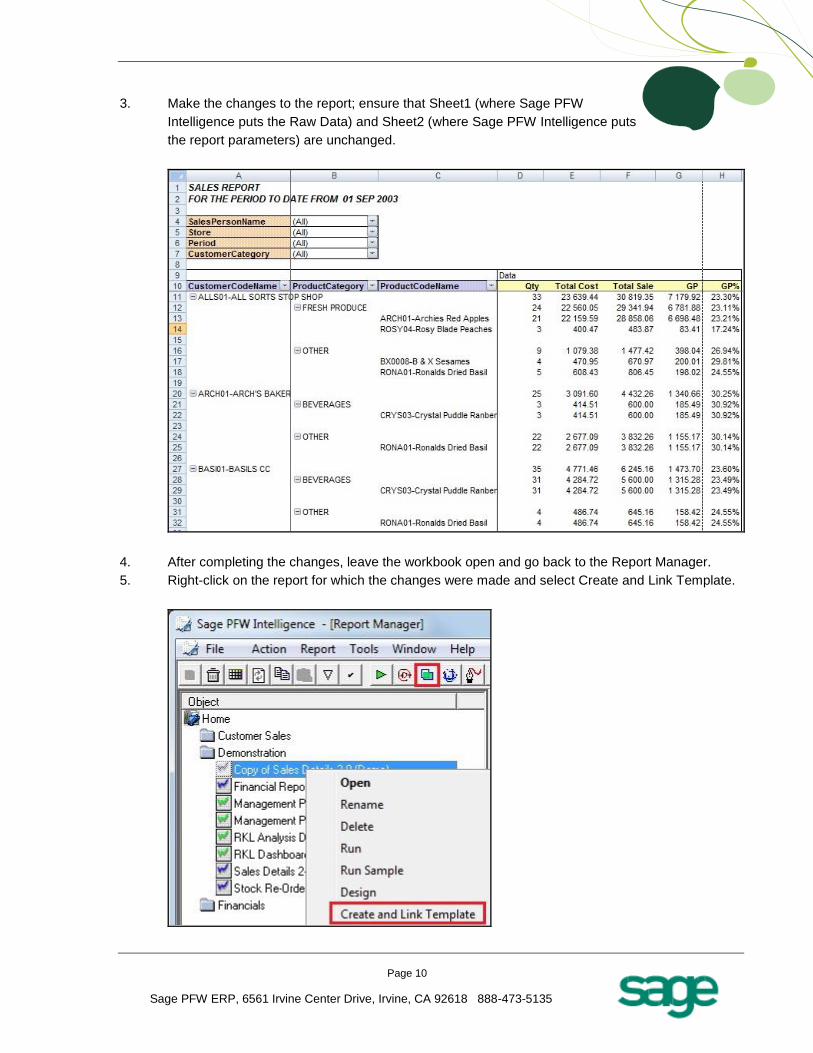
3. Make the changes to the report; ensure that Sheet1 (where Sage PFW
Intelligence puts the Raw Data) and Sheet2 (where Sage PFW Intelligence puts
the report parameters) are unchanged.
4. After completing the changes, leave the workbook open and go back to the Report Manager.
5. Right-click on the report for which the changes were made and select Create and Link Template.
Page 11
Sage PFW ERP, 6561 Irvine Center Drive, Irvine, CA 92618 888-473-5135
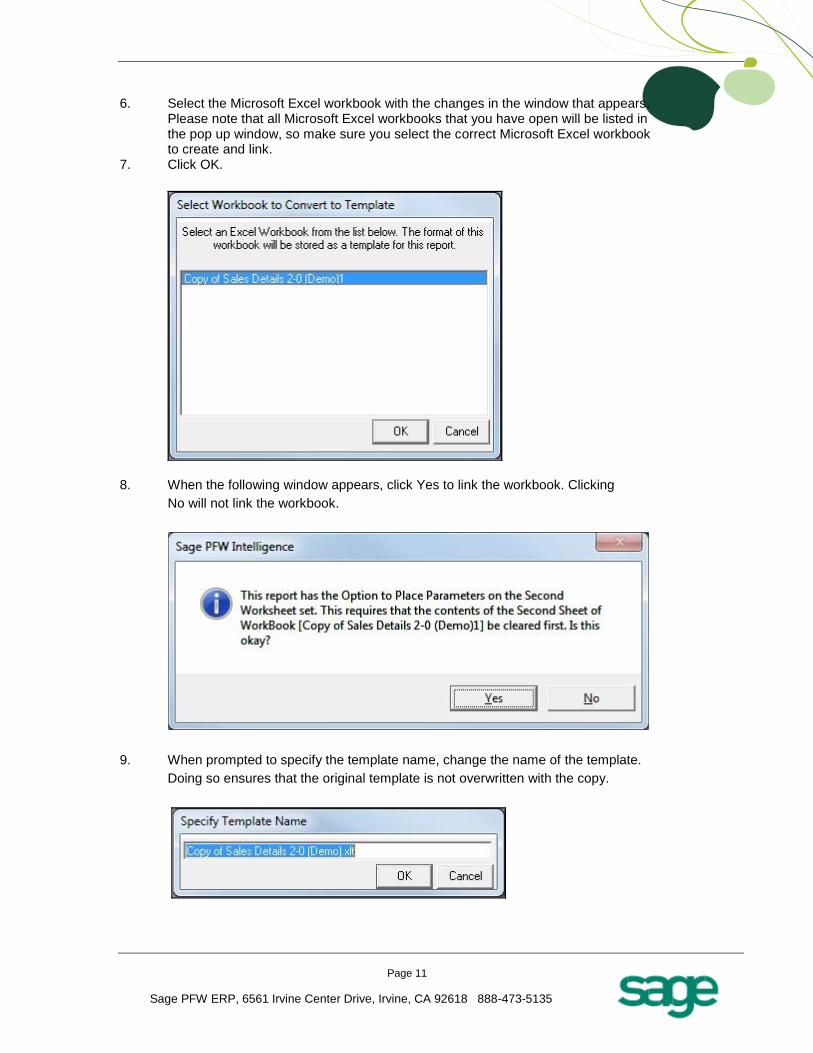
6. Select the Microsoft Excel workbook with the changes in the window that appears. Please note that all Microsoft Excel workbooks that you have open will be listed in the pop up window, so make sure you select the correct Microsoft Excel workbook to create and link. 7. Click OK.
8. When the following window appears, click Yes to link the workbook. Clicking
No will not link the workbook.
9. When prompted to specify the template name, change the name of the template.
Doing so ensures that the original template is not overwritten with the copy.
Page 12
Sage PFW ERP, 6561 Irvine Center Drive, Irvine, CA 92618 888-473-5135
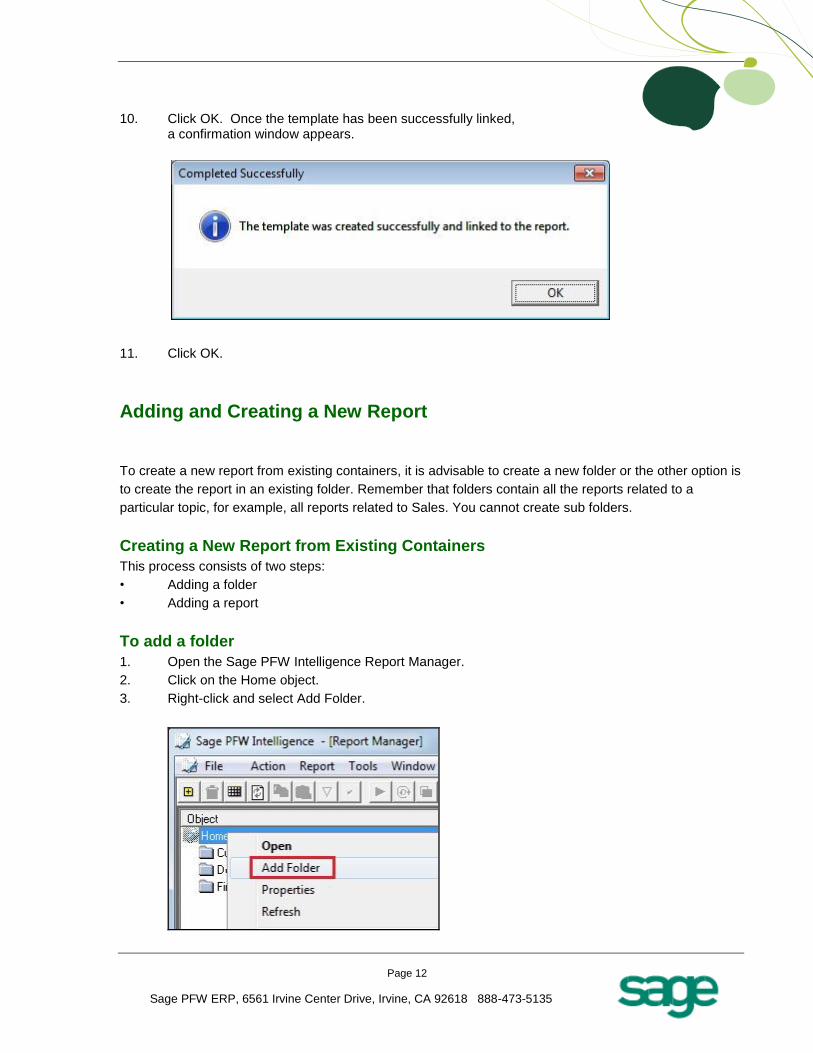
10. Click OK. Once the template has been successfully linked, a confirmation window appears.
11. Click OK.
Adding and Creating a New Report
To create a new report from existing containers, it is advisable to create a new folder or the other option is
to create the report in an existing folder. Remember that folders contain all the reports related to a
particular topic, for example, all reports related to Sales. You cannot create sub folders.
Creating a New Report from Existing Containers
This process consists of two steps:
• Adding a folder
• Adding a report
To add a folder
1. Open the Sage PFW Intelligence Report Manager.
2. Click on the Home object.
3. Right-click and select Add Folder.
Page 13
Sage PFW ERP, 6561 Irvine Center Drive, Irvine, CA 92618 888-473-5135
4. The Enter a Name for the Folder window appears. Enter a name for your
folder; for example, Sales Test. 5. Click OK.
To add a report
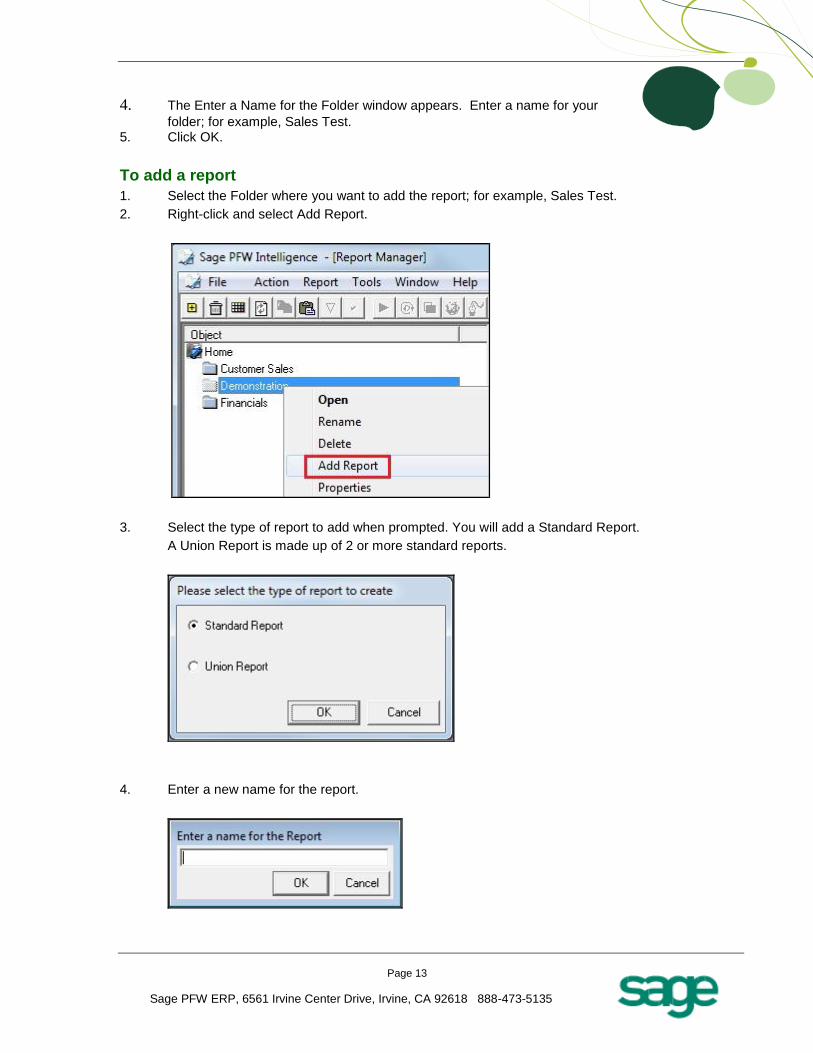
1. Select the Folder where you want to add the report; for example, Sales Test.
2. Right-click and select Add Report.
3. Select the type of report to add when prompted. You will add a Standard Report.
A Union Report is made up of 2 or more standard reports.
4. Enter a new name for the report.
Page 14
Sage PFW ERP, 6561 Irvine Center Drive, Irvine, CA 92618 888-473-5135
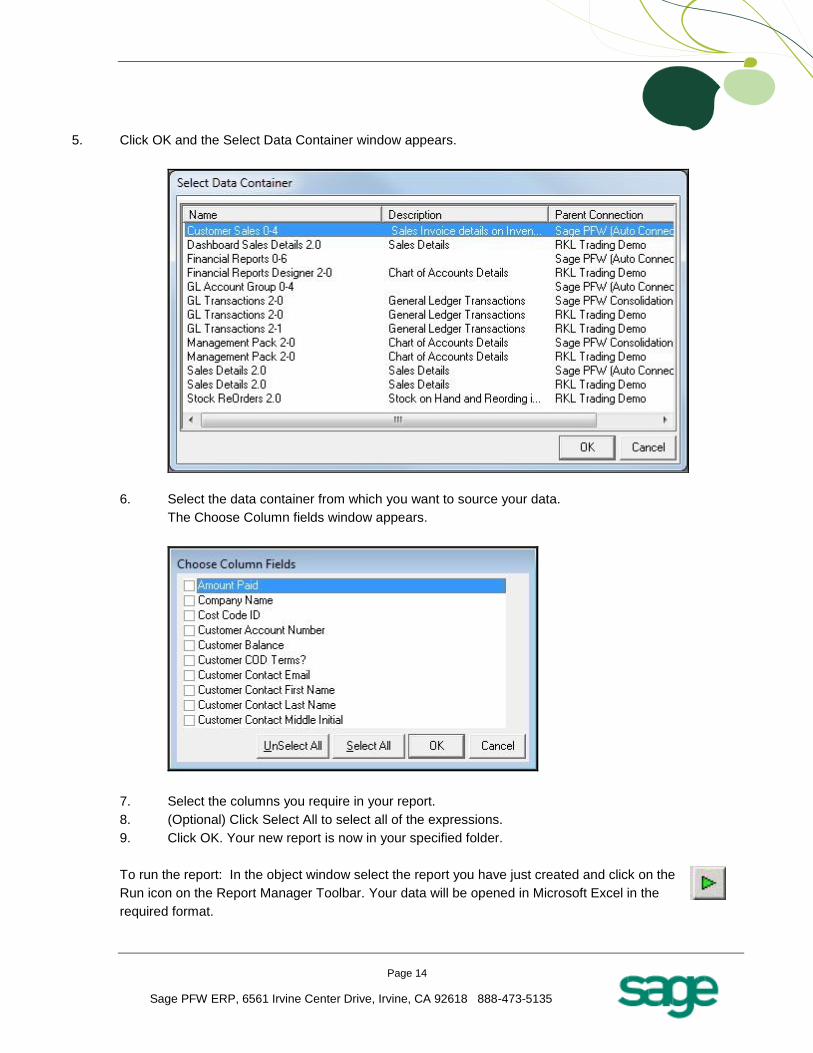
5. Click OK and the Select Data Container window appears.
6. Select the data container from which you want to source your data.
The Choose Column fields window appears.
7. Select the columns you require in your report.
8. (Optional) Click Select All to select all of the expressions.
9. Click OK. Your new report is now in your specified folder.
To run the report: In the object window select the report you have just created and click on the
Run icon on the Report Manager Toolbar. Your data will be opened in Microsoft Excel in the
required format.
Page 15
Sage PFW ERP, 6561 Irvine Center Drive, Irvine, CA 92618 888-473-5135
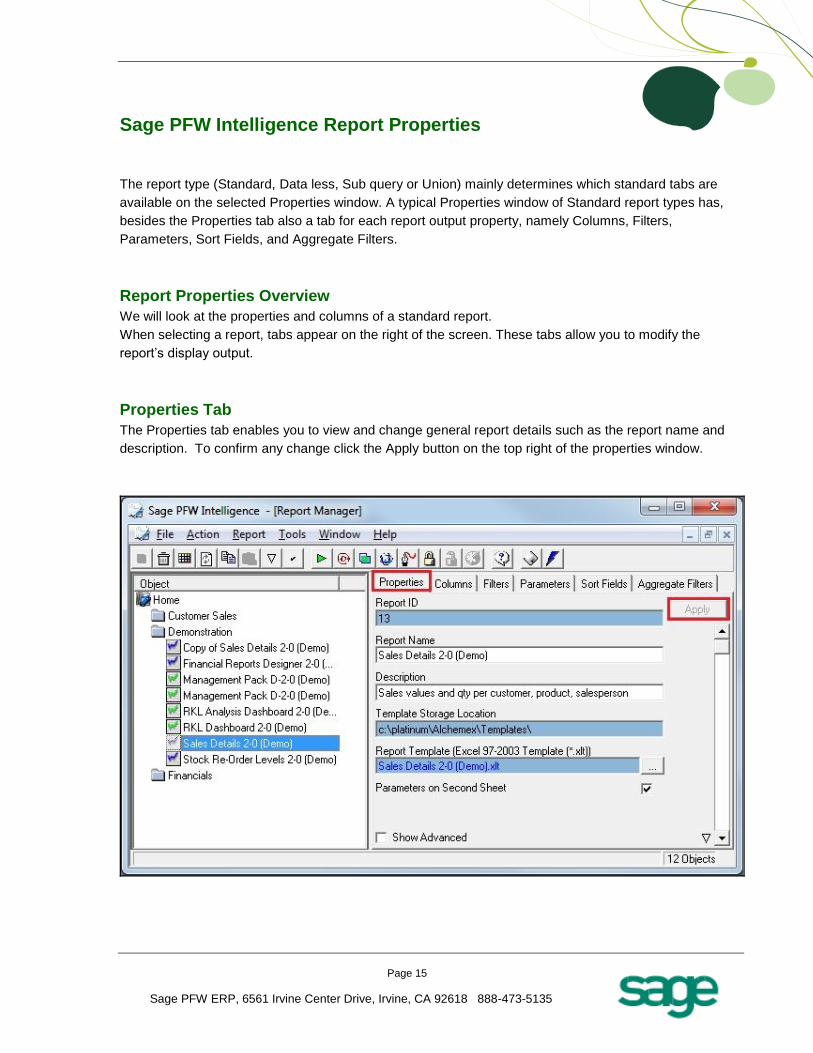
Sage PFW Intelligence Report Properties
The report type (Standard, Data less, Sub query or Union) mainly determines which standard tabs are
available on the selected Properties window. A typical Properties window of Standard report types has,
besides the Properties tab also a tab for each report output property, namely Columns, Filters,
Parameters, Sort Fields, and Aggregate Filters.
Report Properties Overview
We will look at the properties and columns of a standard report.
When selecting a report, tabs appear on the right of the screen. These tabs allow you to modify the
report’s display output.
Properties Tab
The Properties tab enables you to view and change general report details such as the report name and
description. To confirm any change click the Apply button on the top right of the properties window.
Page 16
Sage PFW ERP, 6561 Irvine Center Drive, Irvine, CA 92618 888-473-5135
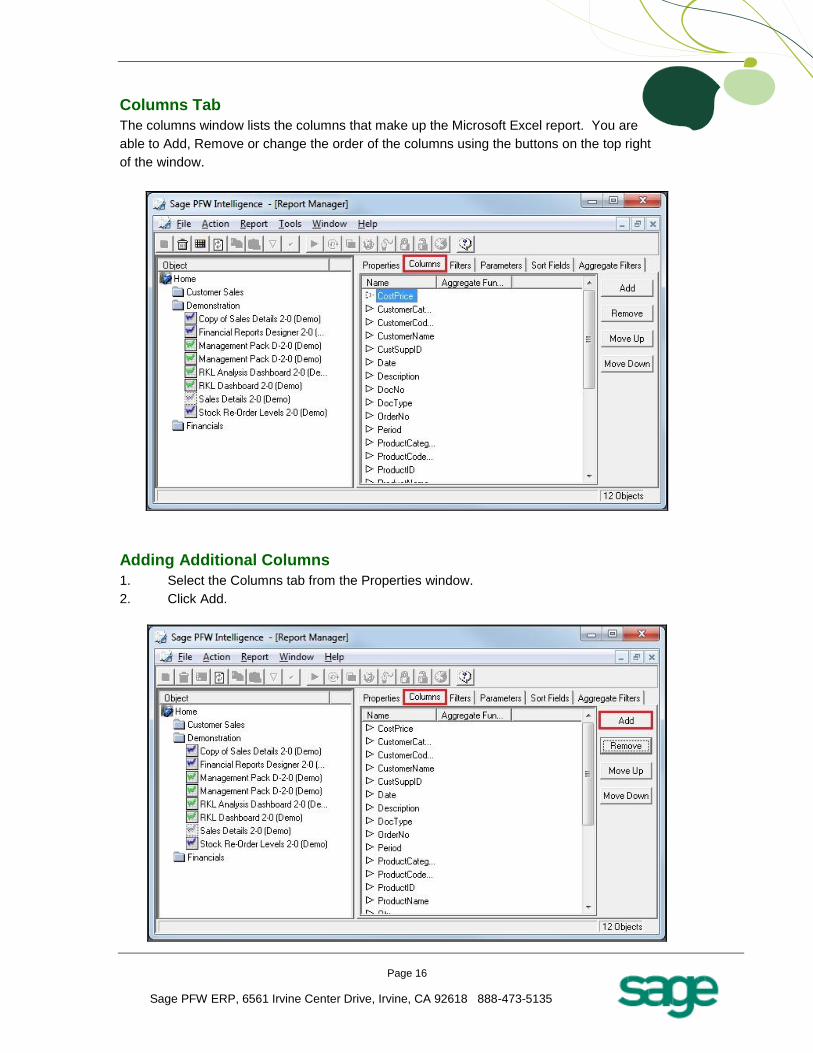
Columns Tab
The columns window lists the columns that make up the Microsoft Excel report. You are
able to Add, Remove or change the order of the columns using the buttons on the top right
of the window.
Adding Additional Columns
1. Select the Columns tab from the Properties window.
2. Click Add.
Page 17
Sage PFW ERP, 6561 Irvine Center Drive, Irvine, CA 92618 888-473-5135
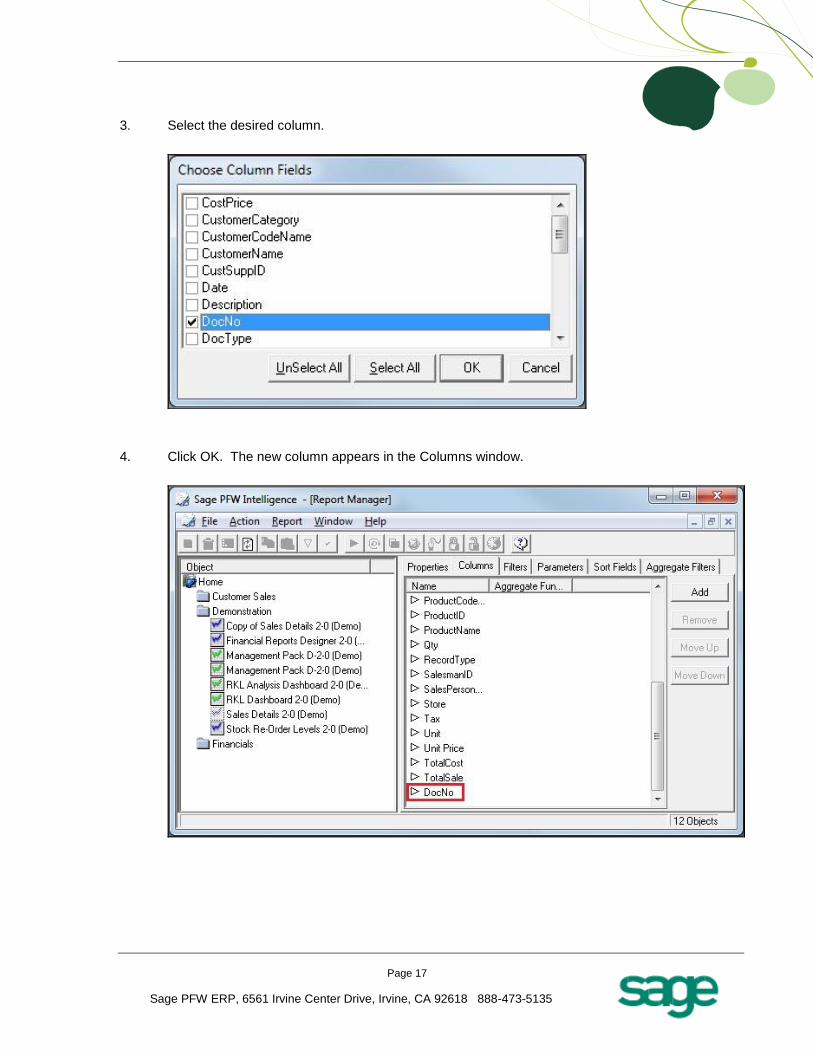
3. Select the desired column.
4. Click OK. The new column appears in the Columns window.
Page 18
Sage PFW ERP, 6561 Irvine Center Drive, Irvine, CA 92618 888-473-5135
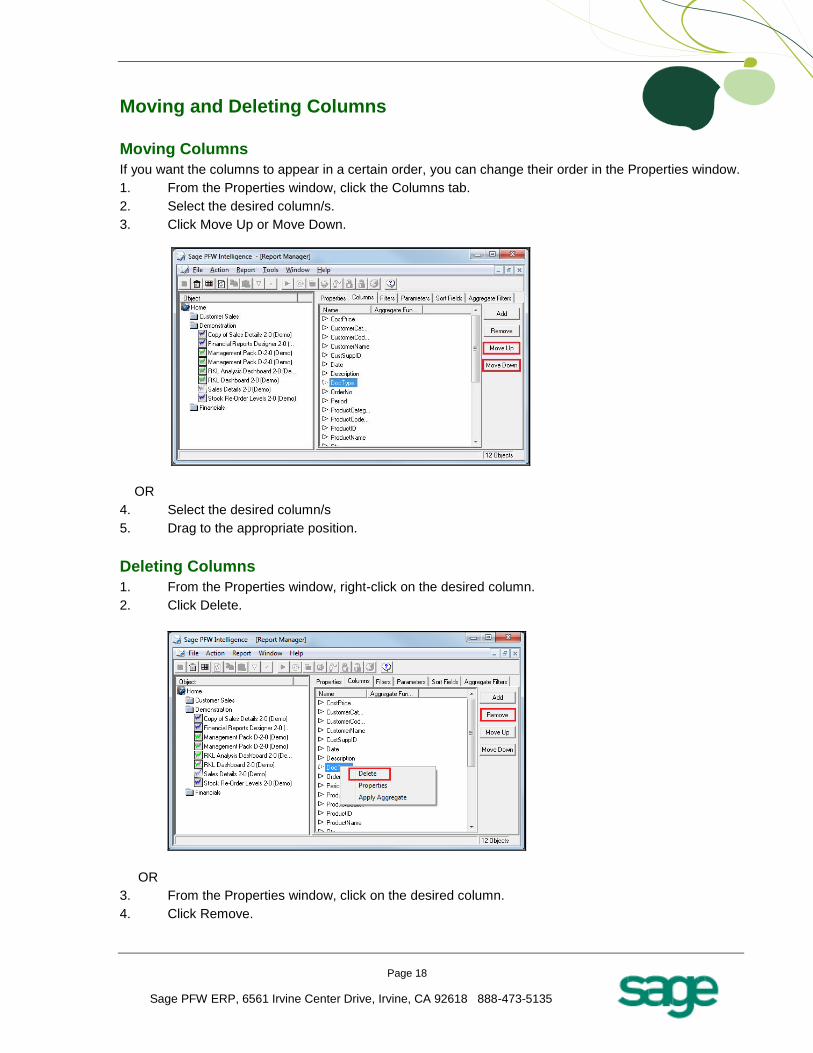
Moving and Deleting Columns
Moving Columns
If you want the columns to appear in a certain order, you can change their order in the Properties window.
1. From the Properties window, click the Columns tab.
2. Select the desired column/s.
3. Click Move Up or Move Down.
OR
4. Select the desired column/s
5. Drag to the appropriate position.
Deleting Columns
1. From the Properties window, right-click on the desired column.
2. Click Delete.
OR
3. From the Properties window, click on the desired column.
4. Click Remove.
Page 19
Sage PFW ERP, 6561 Irvine Center Drive, Irvine, CA 92618 888-473-5135
Exporting Reports
Reports can be exported from one system and imported into another. The export function creates a
compressed file with an .al_ extension which can be imported into other systems. The uncompressed
version of the file will create a file with the extension .alx
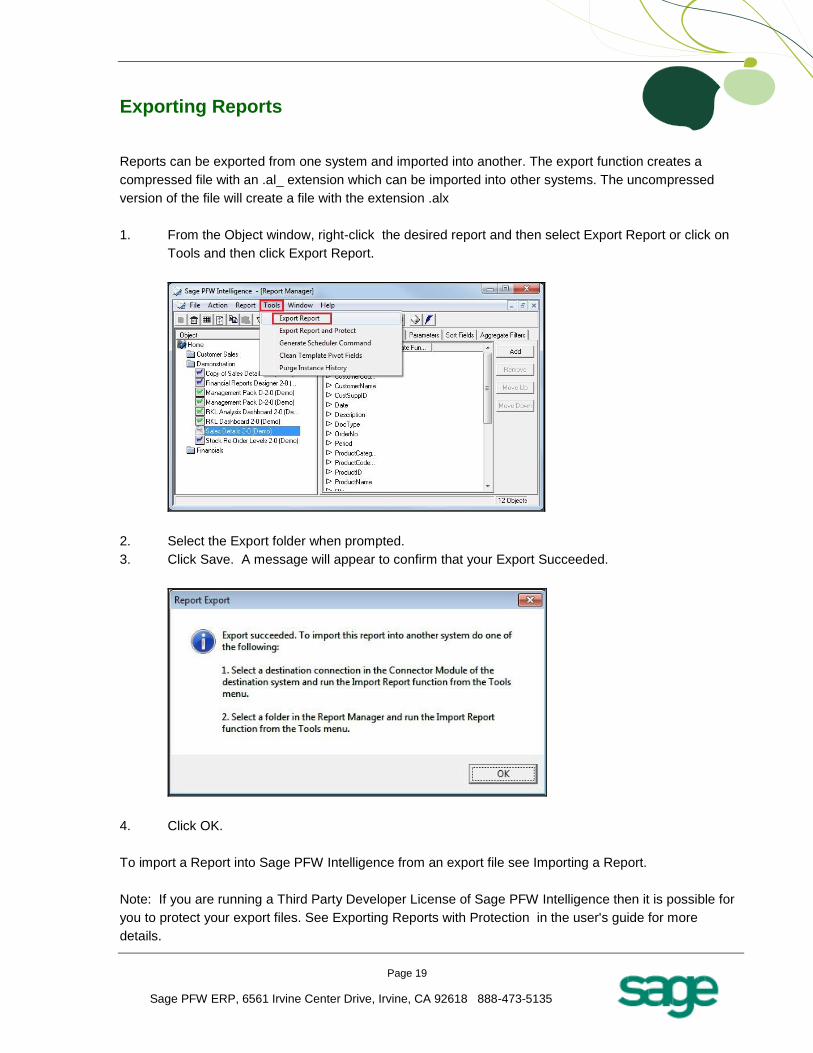
1. From the Object window, right-click the desired report and then select Export Report or click on
Tools and then click Export Report.
2. Select the Export folder when prompted.
3. Click Save. A message will appear to confirm that your Export Succeeded.
4. Click OK.
To import a Report into Sage PFW Intelligence from an export file see Importing a Report.
Note: If you are running a Third Party Developer License of Sage PFW Intelligence then it is possible for
you to protect your export files. See Exporting Reports with Protection in the user's guide for more
details.
Page 20
Sage PFW ERP, 6561 Irvine Center Drive, Irvine, CA 92618 888-473-5135
Importing Reports
Reports can be exported from one system and imported into another. The export function creates a
compressed file with an .al_ extension which can be imported into other systems. The uncompressed
version of the file will create a file with the extension .alx
Report export files (.alx files) and compressed export files (.al_ files - version 3.5 and later) created using
the Export Report facility can be imported into Sage PFW Intelligence. Using this facility, reports can be
created in one Sage PFW Intelligence system and distributed to other Sage PFW Intelligence systems.
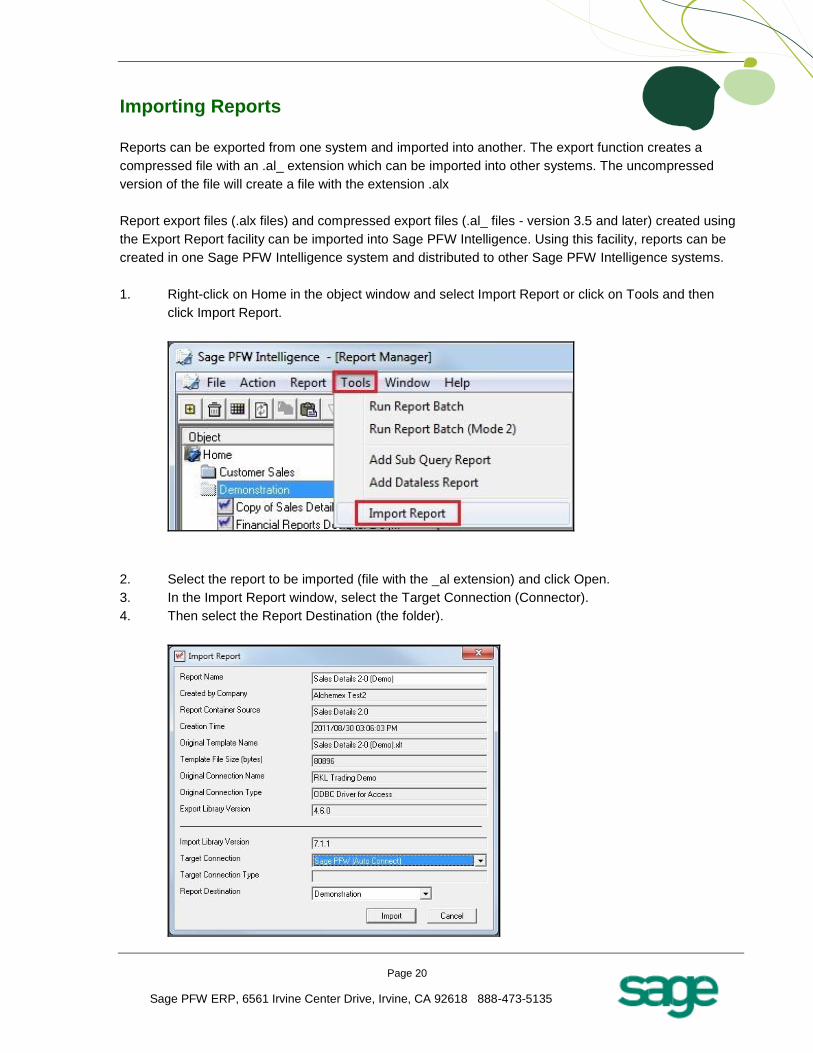
1. Right-click on Home in the object window and select Import Report or click on Tools and then
click Import Report.
2. Select the report to be imported (file with the _al extension) and click Open.
3. In the Import Report window, select the Target Connection (Connector).
4. Then select the Report Destination (the folder).
Page 21
Sage PFW ERP, 6561 Irvine Center Drive, Irvine, CA 92618 888-473-5135
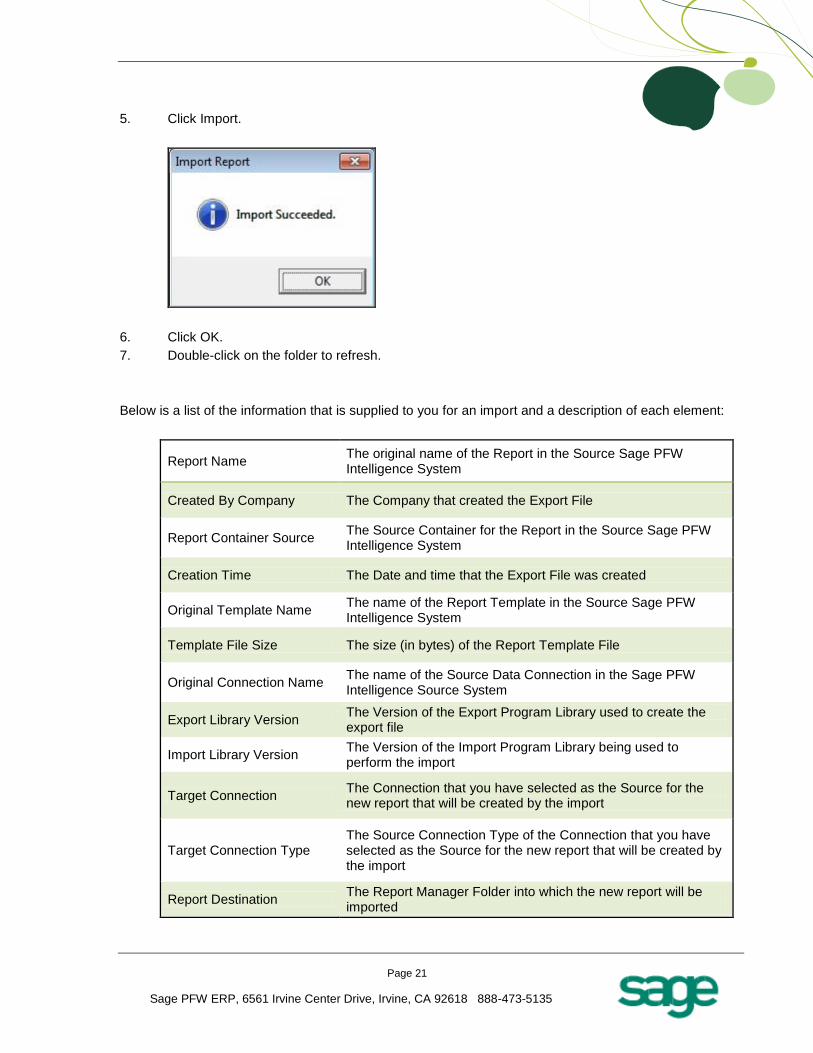
5. Click Import.
6. Click OK.
7. Double-click on the folder to refresh.
Below is a list of the information that is supplied to you for an import and a description of each element:
Report Name The original name of the Report in the Source Sage PFW Intelligence System
Created By Company The Company that created the Export File
Report Container Source The Source Container for the Report in the Source Sage PFW Intelligence System
Creation Time The Date and time that the Export File was created
Original Template Name The name of the Report Template in the Source Sage PFW Intelligence System
Template File Size The size (in bytes) of the Report Template File
Original Connection Name The name of the Source Data Connection in the Sage PFW Intelligence Source System
Export Library Version The Version of the Export Program Library used to create the export file
Import Library Version The Version of the Import Program Library being used to perform the import
Target Connection The Connection that you have selected as the Source for the new report that will be created by the import
Target Connection Type The Source Connection Type of the Connection that you have selected as the Source for the new report that will be created by the import
Report Destination The Report Manager Folder into which the new report will be imported
Page 22
Sage PFW ERP, 6561 Irvine Center Drive, Irvine, CA 92618 888-473-5135
Security Manager
Security Manager Access
Method
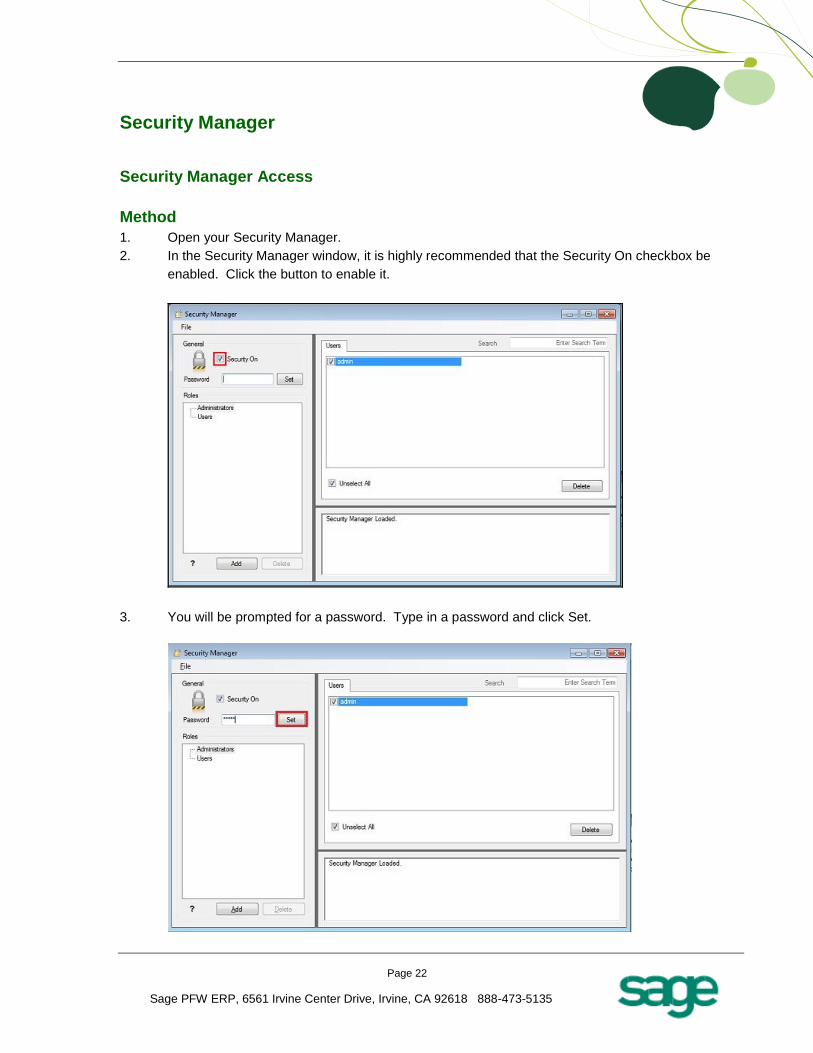
1. Open your Security Manager.
2. In the Security Manager window, it is highly recommended that the Security On checkbox be
enabled. Click the button to enable it.
3. You will be prompted for a password. Type in a password and click Set.
Page 23
Sage PFW ERP, 6561 Irvine Center Drive, Irvine, CA 92618 888-473-5135
4. Confirm your password. This password will be required in future to gain
access To the Security Manager.
5. Click OK. A confirmation dialog box will appear.
6. Click Ok.
7. Proceed to Add Roles
Adding Roles
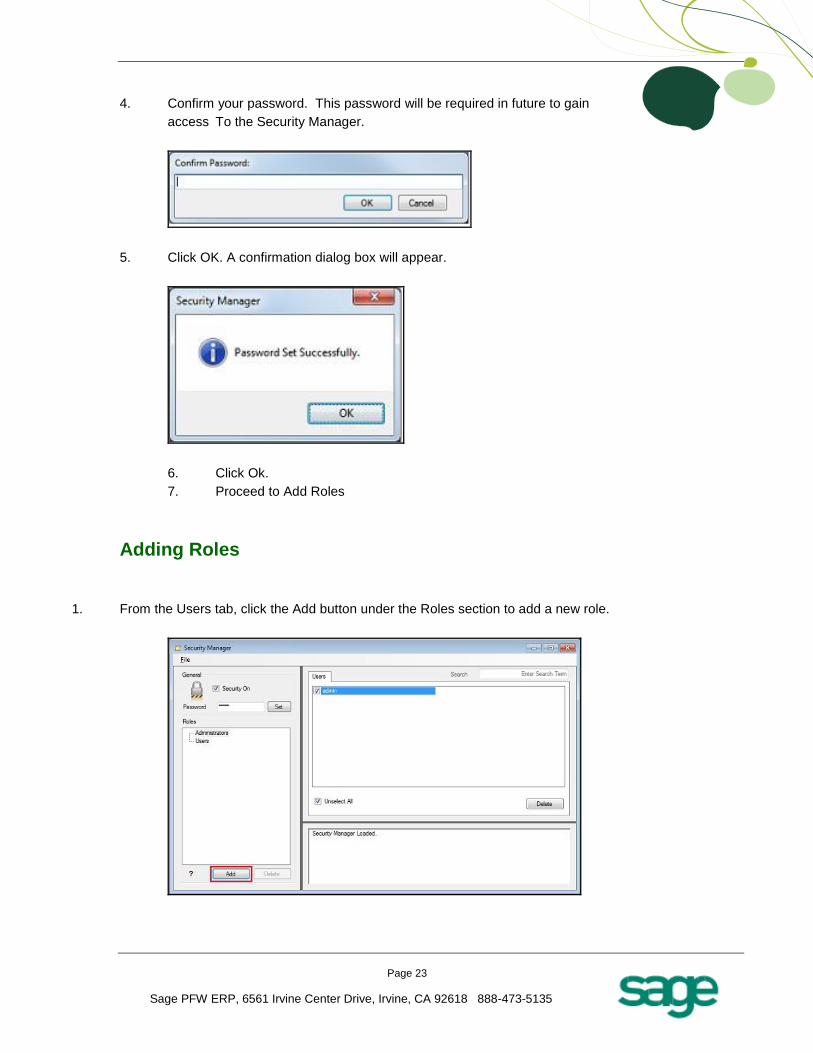
1. From the Users tab, click the Add button under the Roles section to add a new role.
Page 24
Sage PFW ERP, 6561 Irvine Center Drive, Irvine, CA 92618 888-473-5135
2. Enter a name for the Role.
3. Your role will now be added. Repeat steps 1-4 for each additional role you would like to add.
4. Select the users that should belong to each role. Note: If integrated security is used, those users
listed are those set up in your Sage PFW ERP security.
5. Passwords for users are by default, blank. It is suggested passwords are set for users so
they match their Sage PFW ERP passwords. For each user, click Change Password to set
the password.
6. Proceed to Add Reports to Roles.
Page 25
Sage PFW ERP, 6561 Irvine Center Drive, Irvine, CA 92618 888-473-5135
Adding Reports to Roles
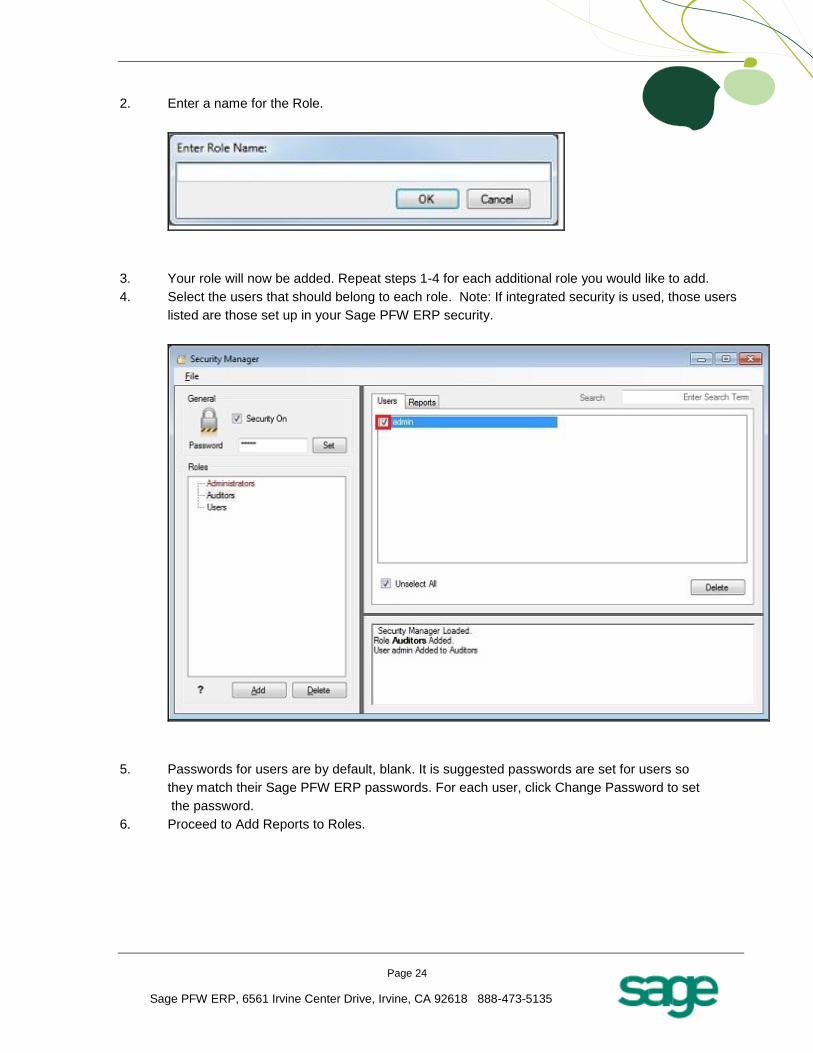
1. Click on the Reports tab to assign access to specific reports for each role.
2. For each role, select the role in the left pane, and select the reports in the right pane
which that role must have access to.
• Note : Union/sub reports are automatically added when the main report is added.
The users now assigned to that role, have access to the reports that the system
administrator has assigned to the role.
Page 26
Sage PFW ERP, 6561 Irvine Center Drive, Irvine, CA 92618 888-473-5135
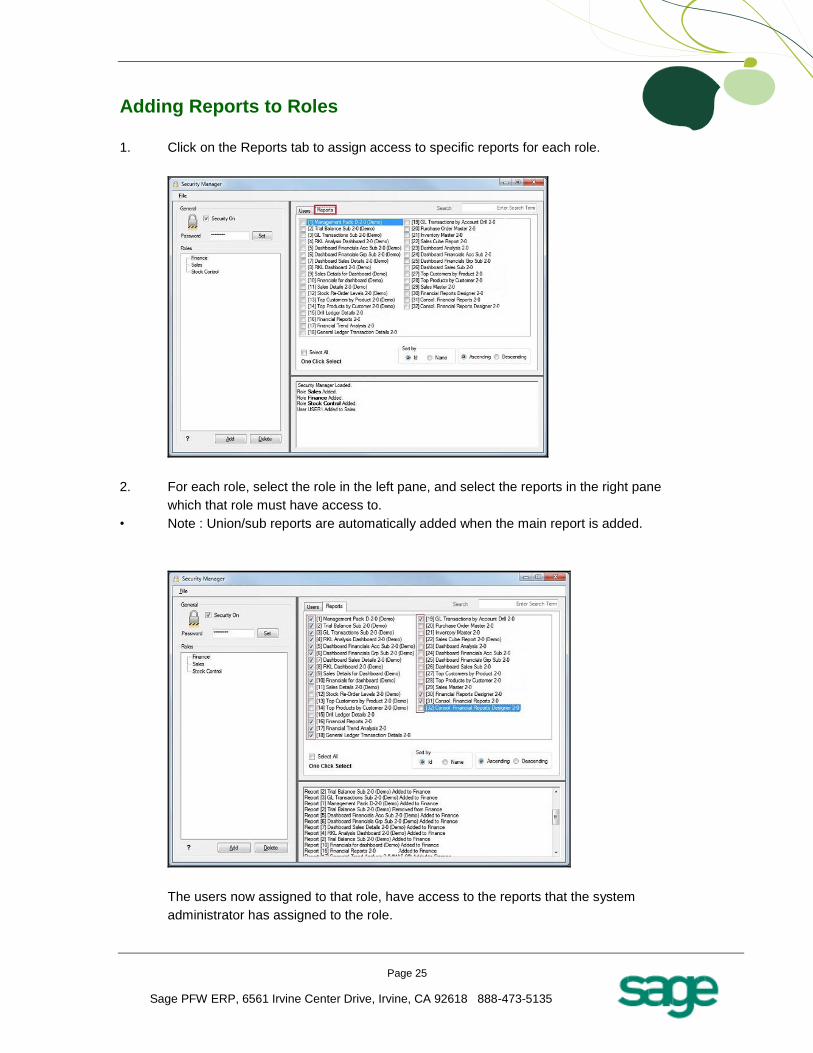
Creating a Simple Pivot Table in Excel
Reasons for Organizing Data into a Pivot Table
Four key reasons for organizing data into a Pivot Table are:
• To summarize the data contained in a lengthy list into a compact format
• To find relationships within the data that are otherwise hard to see because of the amount of detail
• To organize the data into a format that’s easy to chart
• View the same data in many different ways quickly and easily
Pivot Table reports use functions, allowing you to total, average and count data. These functions also
provide subtotals and grand totals automatically, where you choose to show them.
Original Worksheet
Pivot Table
Pivot Chart
Page 27
Sage PFW ERP, 6561 Irvine Center Drive, Irvine, CA 92618 888-473-5135
Pivot Table Concept and Layout
Microsoft Excel 2007
An important point to remember when working with Pivot Tables is that you are working within a layout
slightly different to a normal Microsoft Excel worksheet. A Pivot Table has its own Ribbon and that alone
provides functionality specific to the Pivot Table and not to a normal Microsoft Excel cell on the
worksheet.
Although one can format a cell using the Format Tools on the Home tab of the Ribbon, a Pivot Table
provides its own Format Cells option on its Ribbon as it is treated as a separate entity.
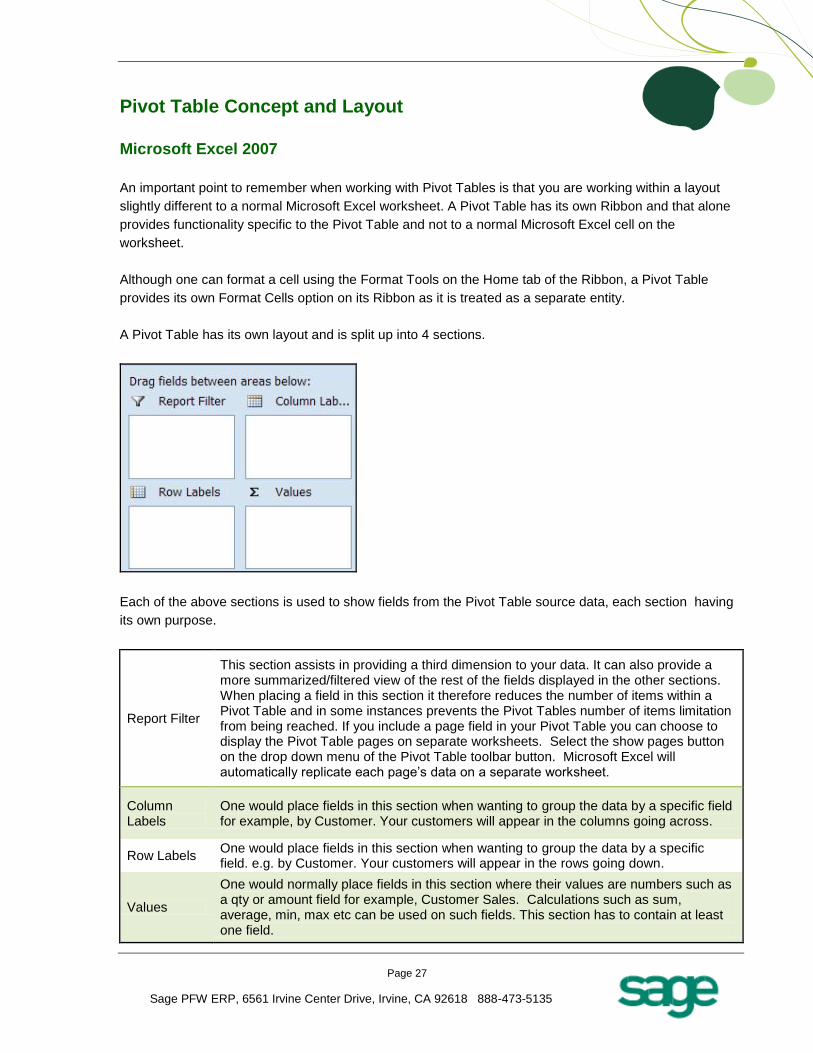
A Pivot Table has its own layout and is split up into 4 sections.
Each of the above sections is used to show fields from the Pivot Table source data, each section having
its own purpose.
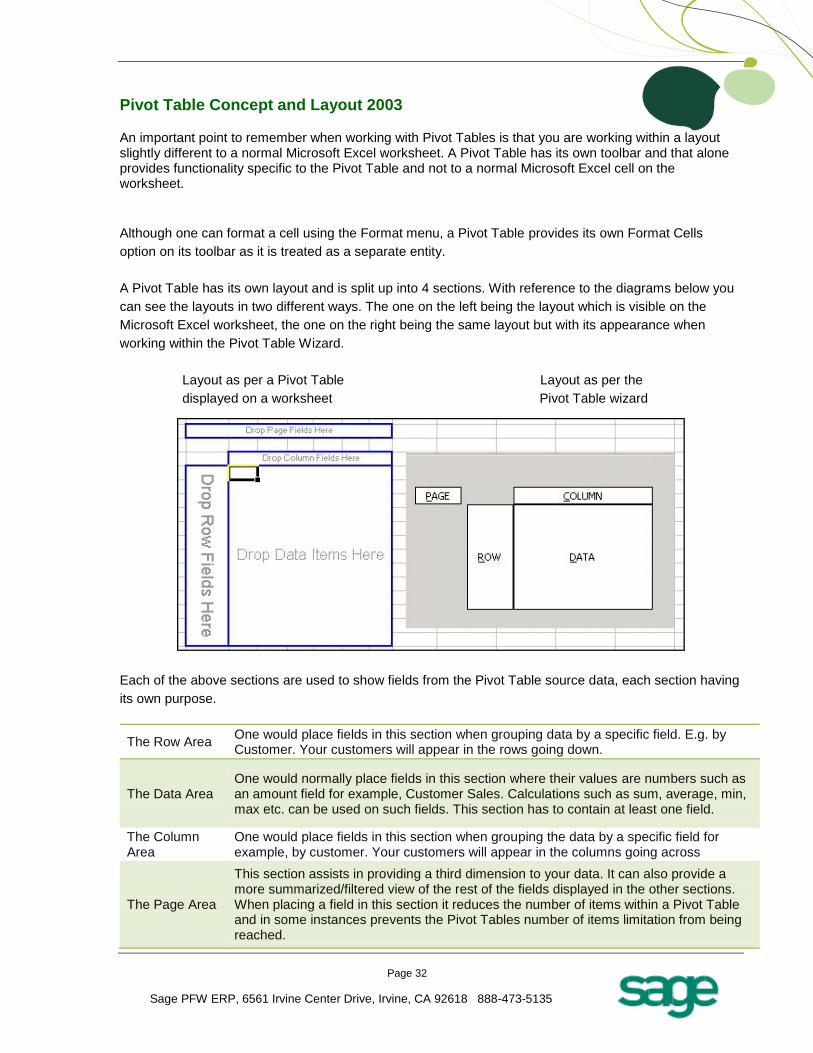
Report Filter
This section assists in providing a third dimension to your data. It can also provide a more summarized/filtered view of the rest of the fields displayed in the other sections. When placing a field in this section it therefore reduces the number of items within a Pivot Table and in some instances prevents the Pivot Tables number of items limitation from being reached. If you include a page field in your Pivot Table you can choose to display the Pivot Table pages on separate worksheets. Select the show pages button on the drop down menu of the Pivot Table toolbar button. Microsoft Excel will automatically replicate each page’s data on a separate worksheet.
Column Labels
One would place fields in this section when wanting to group the data by a specific field for example, by Customer. Your customers will appear in the columns going across.
Row Labels One would place fields in this section when wanting to group the data by a specific field. e.g. by Customer. Your customers will appear in the rows going down.
Values
One would normally place fields in this section where their values are numbers such as a qty or amount field for example, Customer Sales. Calculations such as sum, average, min, max etc can be used on such fields. This section has to contain at least one field.
Page 28
Sage PFW ERP, 6561 Irvine Center Drive, Irvine, CA 92618 888-473-5135
Create a Pivot Table Report
To create a Pivot Table you need to identify these two elements in your data:
• Have a list in Microsoft Excel with data fields (headings) and rows of related data
• Identify which fields are going to go where in your design
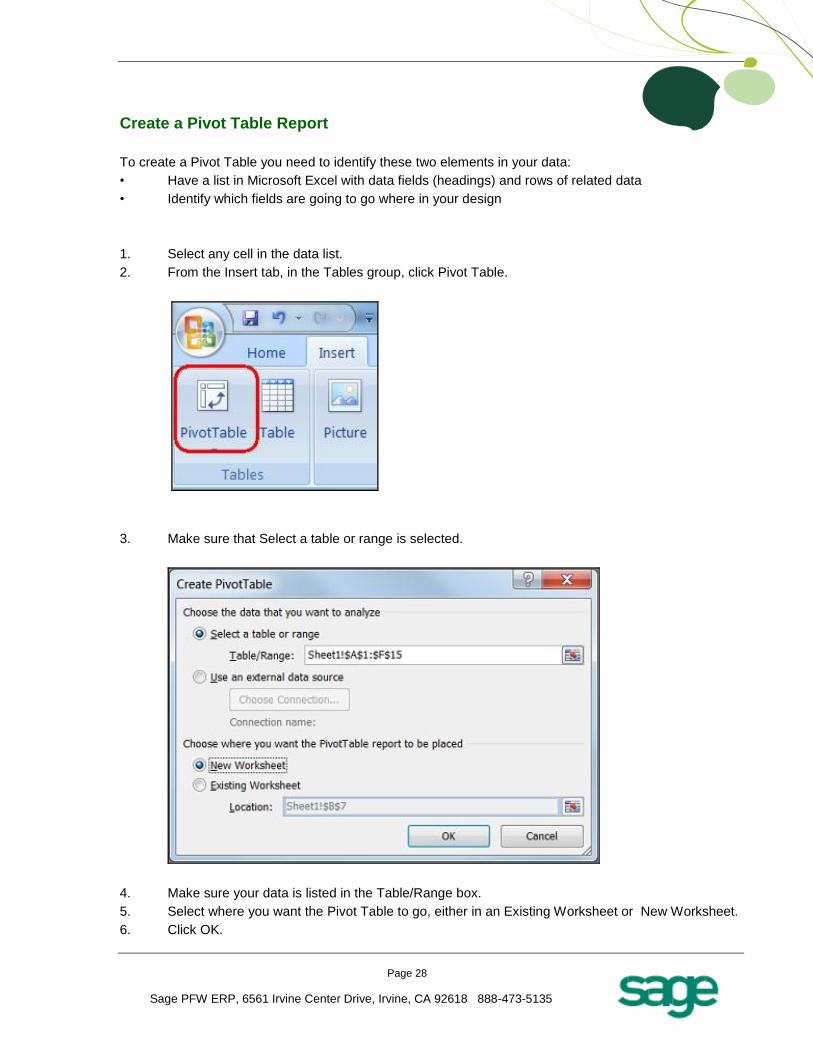
1. Select any cell in the data list.
2. From the Insert tab, in the Tables group, click Pivot Table.
3. Make sure that Select a table or range is selected.
4. Make sure your data is listed in the Table/Range box.
5. Select where you want the Pivot Table to go, either in an Existing Worksheet or New Worksheet.
6. Click OK.
Page 29
Sage PFW ERP, 6561 Irvine Center Drive, Irvine, CA 92618 888-473-5135
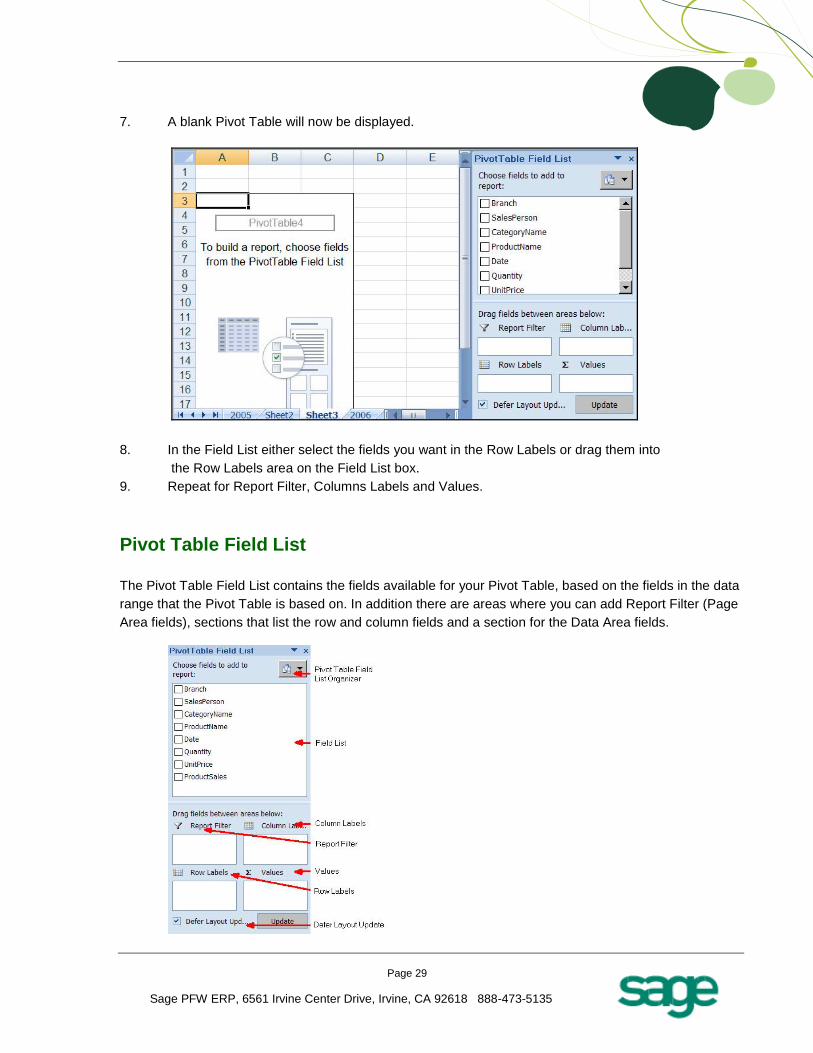
7. A blank Pivot Table will now be displayed.
8. In the Field List either select the fields you want in the Row Labels or drag them into
the Row Labels area on the Field List box.
9. Repeat for Report Filter, Columns Labels and Values.
Pivot Table Field List
The Pivot Table Field List contains the fields available for your Pivot Table, based on the fields in the data
range that the Pivot Table is based on. In addition there are areas where you can add Report Filter (Page
Area fields), sections that list the row and column fields and a section for the Data Area fields.
Page 30
Sage PFW ERP, 6561 Irvine Center Drive, Irvine, CA 92618 888-473-5135
Turn the Field List On/Off
The Pivot Table Field List is only visible while you are within the Pivot Table. If you
are within the Pivot Table and it is still not visible, right-click and select Show Field List.
You can also turn the field list on and off from the Ribbon.
1. Select any cell in the Pivot Table
2. From the Options tab, in the Show/Hide group, click Field List
OR
1. Select any cell in the Pivot Table
2. Right-click and select Show Field List
Remove, Add and Move Fields
When selecting a field from the data area to move or remove, you need to select the field by placing the
mouse pointer on the border of the field and clicking when the pointer changes to the normal arrow
pointer.
Fields that appear in the Pivot Table will have a tick in their check box on the Field List. De-selecting this
check box will remove the field from the Pivot Table.
Remove a Field
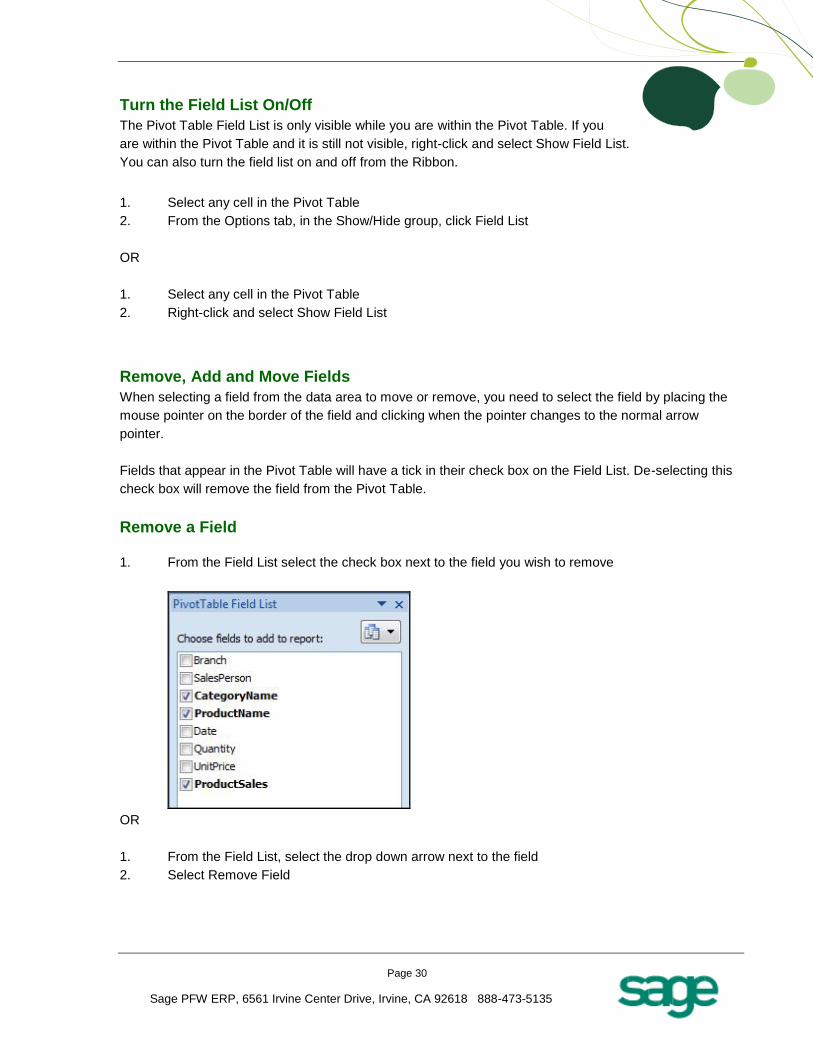
1. From the Field List select the check box next to the field you wish to remove
OR
1. From the Field List, select the drop down arrow next to the field
2. Select Remove Field
Page 31
Sage PFW ERP, 6561 Irvine Center Drive, Irvine, CA 92618 888-473-5135
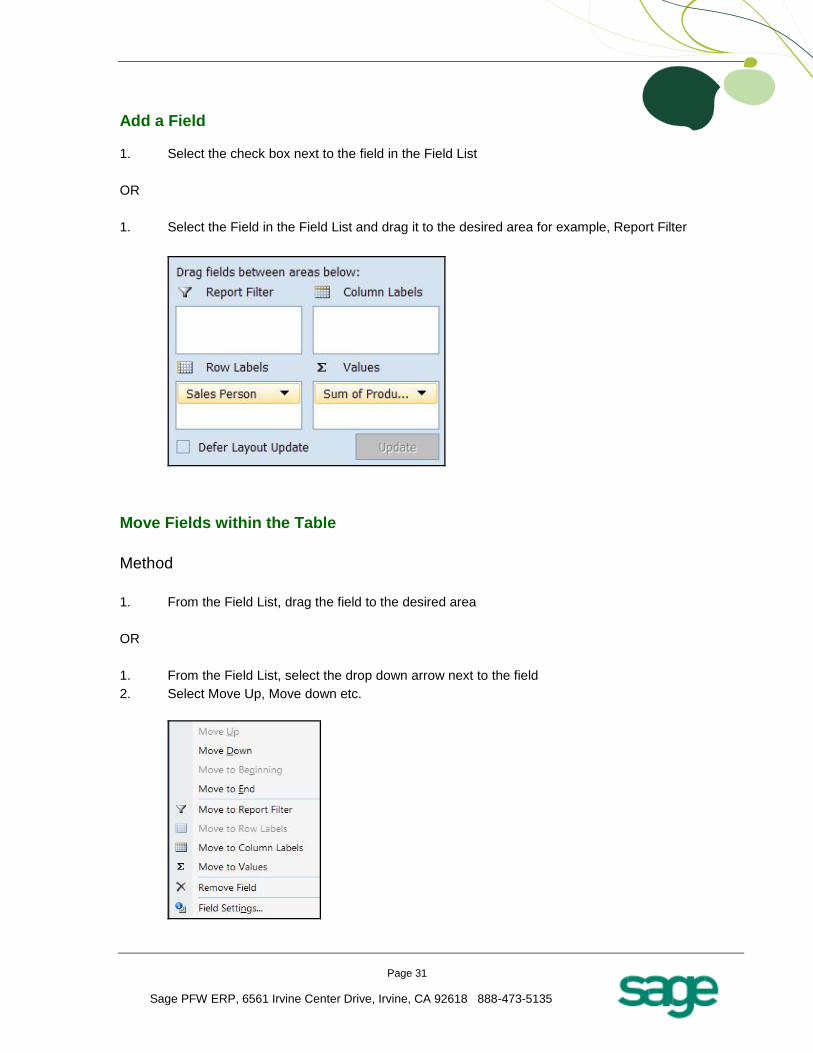
Add a Field
1. Select the check box next to the field in the Field List
OR
1. Select the Field in the Field List and drag it to the desired area for example, Report Filter
Move Fields within the Table
Method
1. From the Field List, drag the field to the desired area
OR
1. From the Field List, select the drop down arrow next to the field
2. Select Move Up, Move down etc.
Page 32
Sage PFW ERP, 6561 Irvine Center Drive, Irvine, CA 92618 888-473-5135
Pivot Table Concept and Layout 2003
An important point to remember when working with Pivot Tables is that you are working within a layout slightly different to a normal Microsoft Excel worksheet. A Pivot Table has its own toolbar and that alone provides functionality specific to the Pivot Table and not to a normal Microsoft Excel cell on the worksheet.
Although one can format a cell using the Format menu, a Pivot Table provides its own Format Cells
option on its toolbar as it is treated as a separate entity.
A Pivot Table has its own layout and is split up into 4 sections. With reference to the diagrams below you
can see the layouts in two different ways. The one on the left being the layout which is visible on the
Microsoft Excel worksheet, the one on the right being the same layout but with its appearance when
working within the Pivot Table Wizard.
Layout as per a Pivot Table Layout as per the
displayed on a worksheet Pivot Table wizard
Each of the above sections are used to show fields from the Pivot Table source data, each section having
its own purpose.
The Row Area One would place fields in this section when grouping data by a specific field. E.g. by Customer. Your customers will appear in the rows going down.
The Data Area One would normally place fields in this section where their values are numbers such as an amount field for example, Customer Sales. Calculations such as sum, average, min, max etc. can be used on such fields. This section has to contain at least one field.
The Column Area
One would place fields in this section when grouping the data by a specific field for example, by customer. Your customers will appear in the columns going across
The Page Area
This section assists in providing a third dimension to your data. It can also provide a more summarized/filtered view of the rest of the fields displayed in the other sections. When placing a field in this section it reduces the number of items within a Pivot Table and in some instances prevents the Pivot Tables number of items limitation from being reached.
Page 33
Sage PFW ERP, 6561 Irvine Center Drive, Irvine, CA 92618 888-473-5135
Create a Pivot Table Report
To create a Pivot Table you need to identify these two elements in your data:
• Have a list in Microsoft Excel with data fields (headings) and rows of related data
• Identify which fields are going to go where in your design
1. Select any cell in the data list.
2. On the Menu bar select Data.
3. Select Pivot Table and Pivot Chart Wizard.
4. Make sure that Microsoft Excel list or database is selected as the data to analyse.
5. Make sure the kind of report is selected as Pivot Table.
6. Select Next.
7. Select the collapse icon in the range box.
Page 34
Sage PFW ERP, 6561 Irvine Center Drive, Irvine, CA 92618 888-473-5135
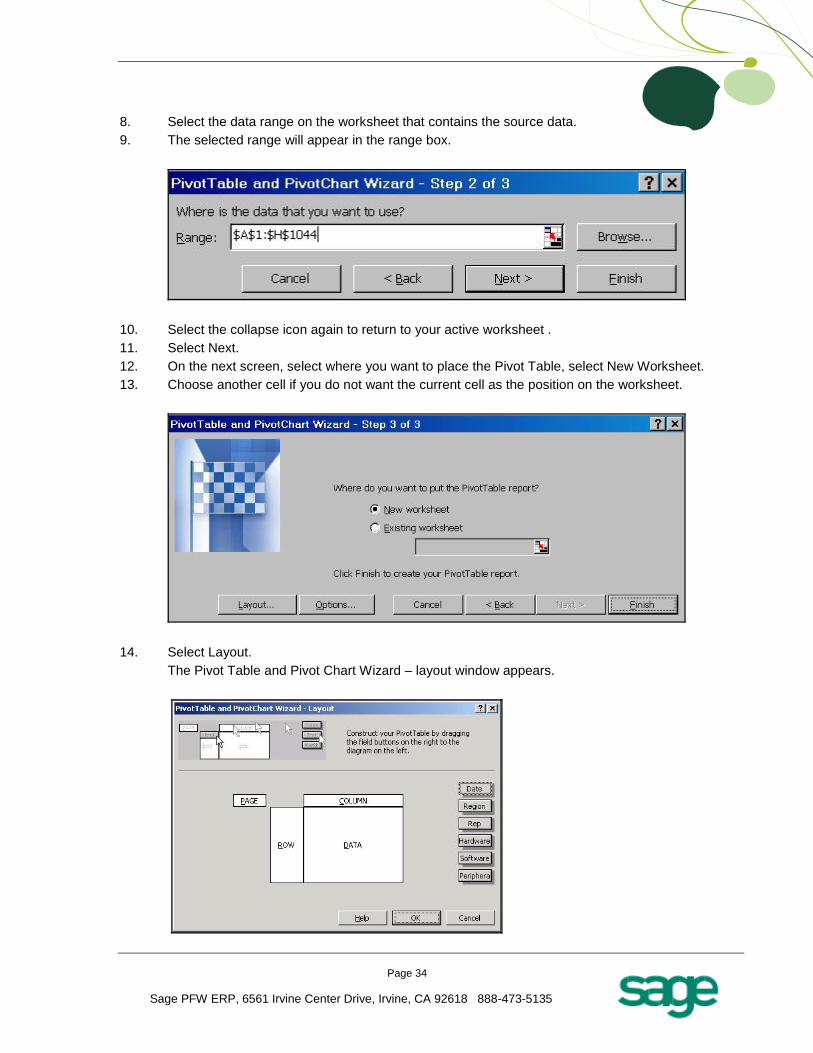
8. Select the data range on the worksheet that contains the source data.
9. The selected range will appear in the range box.
10. Select the collapse icon again to return to your active worksheet .
11. Select Next.
12. On the next screen, select where you want to place the Pivot Table, select New Worksheet.
13. Choose another cell if you do not want the current cell as the position on the worksheet.
14. Select Layout.
The Pivot Table and Pivot Chart Wizard – layout window appears.
Page 35
Sage PFW ERP, 6561 Irvine Center Drive, Irvine, CA 92618 888-473-5135
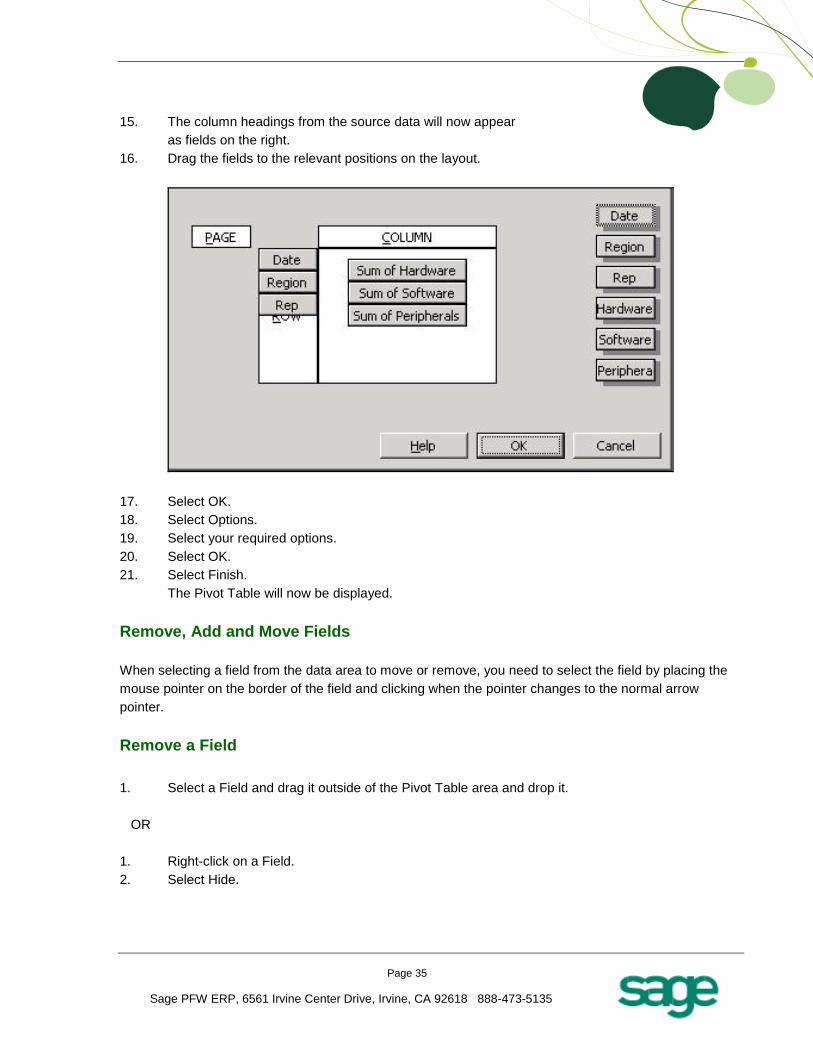
15. The column headings from the source data will now appear
as fields on the right.
16. Drag the fields to the relevant positions on the layout.
17. Select OK.
18. Select Options.
19. Select your required options.
20. Select OK.
21. Select Finish.
The Pivot Table will now be displayed.
Remove, Add and Move Fields
When selecting a field from the data area to move or remove, you need to select the field by placing the
mouse pointer on the border of the field and clicking when the pointer changes to the normal arrow
pointer.
Remove a Field
1. Select a Field and drag it outside of the Pivot Table area and drop it.
OR
1. Right-click on a Field.
2. Select Hide.
Page 36
Sage PFW ERP, 6561 Irvine Center Drive, Irvine, CA 92618 888-473-5135
Add a Field
1. Select a Field from the Field List.
2. Drag it into the Pivot Table area and drop it in the appropriate position.
OR
1. On the Pivot Table toolbar select Pivot Table.
2. Pivot Table Wizard, select the Layout button.
3. Drag the fields to the appropriate position.
OR
1. Select the Field in the Field List.
2. From the drop down, select the area you would like to add it to.
Getting Support The Sage PFW Intelligence Help Files have been written to provide maximum information and assistance
to all Sage PFW Intelligence users. Every effort has been made to make Sage PFW Intelligence easy to
understand and use. The comprehensive help files can be accessed by pressing the F1 button in your
Sage PFW Intelligence software. For further assistance, please contact:
Customer Service 888-473-5135
Customer Support Services 800-333-5242 (Sage PFW Clientcare Customers)
Sage PFW Product Website http://www.sagepfw.com
Sage PFW Intelligence Website http://www.sagepfw.com/intelligence/
Sage PFW Intelligence Community http://community.alchemex.com/group/sagepfwerpintelligence
Sage Online - Web based technical resource http://www.sagesoftwareonline.com
Real-time Learning Courses http://sageu.com/pfw/home.html
©2011 Sage Software, Inc. All rights reserved. Sage, the Sage logos, and the Sage product and service names mentioned herein are registered trademarks or trademarks of Sage Software, Inc., or its affiliated entities. All other trademarks are the property of their respective owners.
Related Documents