1 RVIB Nathaniel B. Palmer EM122 Multibeam Echosounder Sea Acceptance Trial for TX/RX Arrays NBP1505 June 10-15, 2015 Report prepared by: Paul Johnson and Kevin Jerram University of New Hampshire Center for Coastal and Ocean Mapping/Joint Hydrographic Center Durham, NH

Welcome message from author
This document is posted to help you gain knowledge. Please leave a comment to let me know what you think about it! Share it to your friends and learn new things together.
Transcript
1
RVIB Nathaniel B. Palmer EM122 Multibeam Echosounder Sea Acceptance Trial for TX/RX Arrays NBP1505 June 10-15, 2015
Report prepared by: Paul Johnson and Kevin Jerram University of New Hampshire Center for Coastal and Ocean Mapping/Joint Hydrographic Center Durham, NH
2
Table of Contents
Table of Contents .......................................................................................................... 2
Introduction .................................................................................................................. 3
Survey System Components .......................................................................................... 4
Overview of System Geometry ...................................................................................... 4
Primary Reference Frame ........................................................................................................... 5
Secondary Reference Frame ....................................................................................................... 5
2015 Talcahuano Survey ............................................................................................................. 5
TX and RX Arrays ......................................................................................................................... 7
MRU ............................................................................................................................................ 7
SIS and Seapath Attitude Configurations .................................................................................... 9
Calibration .................................................................................................................... 9
Calibration Results ...................................................................................................... 11
SIS and Seapath Parameters (15 June 2015) ................................................................. 13
Accuracy assessment ................................................................................................... 17
Coverage Assessment .................................................................................................. 20
Noise Level Assessment ............................................................................................... 22
TX Channel BIST .......................................................................................................... 26
Summary, Recommendations, and Observations ......................................................... 27
References .................................................................................................................. 28
Appendix .................................................................................................................... 29
SIS Installation Parameters as of NBP1505 ............................................................................... 29
EM122 RX Module Noise Levels vs. Ship Speed With Swell ..................................................... 34
EM122 RX Module Noise Levels vs. Ship Speed Into Swell ....................................................... 40
Procedure for Unifying SIS and Seapath Reference Frames ..................................................... 54
Any opinions, findings, conclusions, or recommendations expressed in this material are those of the author(s) and do not necessarily reflect the views of the University of New Hampshire Center for Coastal and Ocean Mapping (UNH-CCOM), National Science Foundation (NSF), or Antarctic Support Contract (ASC). Cover image: RVIB Nathaniel B. Palmer in Puerto Montt, Chile.
3
Introduction The research vessel icebreaker (RVIB) Nathaniel B. Palmer (NBP) undertook cruise NBP1505 in the
vicinity of the continental shelf break between Talcahuano and Puerto Montt, Chile, from June 10-
15, 2015 (Fig. 1) in order to assess performance of the vessel’s 12-kHz multibeam echosounder
(MBES). The MBES consists of a Kongsberg Maritime (KM) EM122 transceiver installed in June
2014 and transmit (TX) and receive (RX) arrays installed in June 2015, prior to NBP1505.
A Sea Acceptance Trial (SAT) for the EM122 transceiver performed in June 2014 (NBP1405)
revealed extensive degradation of the original EM120 TX array and motivated the upgrade of both
EM120 TX and RX arrays to the latest-generation EM122 models (see NBP1405 MAC SAT report
for more detail). A primary expected advantage of the EM122 array upgrade is wider swath
coverage through frequency-modulated (FM) transmission compared to traditional continuous
waveform (CW) operation. FM capabilities were available with the EM122 transceiver but not
fully supported by the original EM120 arrays.
Additionally, the damaged polycarbonate ice window on the EM120 TX array was replaced
completely prior to NBP1505; the titanium ice window on the EM120 RX array was observed to be
in good condition and reinstalled for the EM122 RX array. A survey of the installed arrays, GPS
antennas, and the two MRUs (Seapath 330 and Seapath 200) was conducted while the NBP was in
dry dock in Talcahuano. The survey results were provided in preliminary form to KM and MAC
personnel for implementation during NBP1505.
The primary MAC objectives during NBP1505, which are documented in this report, were to:
1. Assist KM representatives with the SAT of the EM122 TX and RX arrays
2. Review and update the system geometry per the 2015 Talcahuano survey
3. Determine residual angular offsets between the MBES and primary MRU
4. Evaluate the depth accuracy across the swath using a reference surface
5. Examine RX array noise conditions at various speeds and headings relative to the swell
6. Determine the achieved swath coverage over a wide range of depths
7. Outline steps for transformation of all MBES sensors to a common reference frame
4
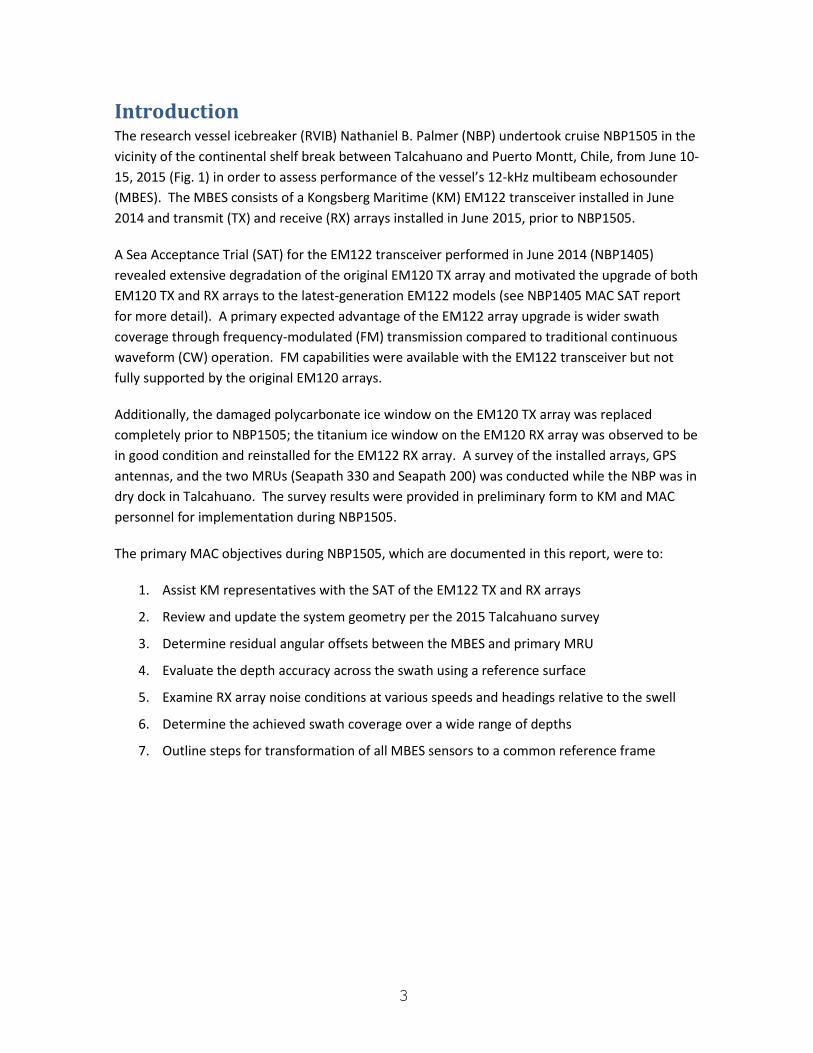
Figure 1. Calibration (patch test) and deepwater accuracy testing sites near the continental shelf break. Actual accuracy survey lines differed slightly due to wind and swell conditions.
Survey System Components The mapping system consists of the following primary components:
1. KM EM122 MBES arrays (12 kHz, 1° TX by 2° RX) installed in June 2015
2. KM EM122 MBES transceiver installed in June 2014
3. KM Seafloor Information System (SIS)
4. KM Seapath 330 vessel navigation system
a. Seapath 330 GNSS antennas
b. Seatex MRU-5, s/n 20934 (‘Seapath 2’ installed in 2013)
5. Surface sound speed sensor (thermosalinograph, or TSG)
6. Sippican expendable bathythermograph (XBT) profiling system
Overview of System Geometry In this report, we use the term ‘system geometry’ to discuss the reference frames of the vessel and the linear and angular offsets of the primary components of the multibeam mapping system, including the TX array, RX array, and primary ship motion sensor (‘Seapath 2’ MRU). These parameters are critical for data collection in an unbiased and repeatable manner. Table 1 provides a chronological outline of major documented changes to the system geometry. Due to time constraints, only the ‘Seapath 2’ MRU (the primary unit, installed in 2013) was
5
calibrated for angular offsets during NBP1505; angular offsets for the ‘Seapath 1’ MRU (the secondary unit, installed in 2002) remain undetermined. A separate patch test must be performed using the ‘Seapath 1’ MRU if this unit is used for navigation feed to the MBES.
Primary Reference Frame
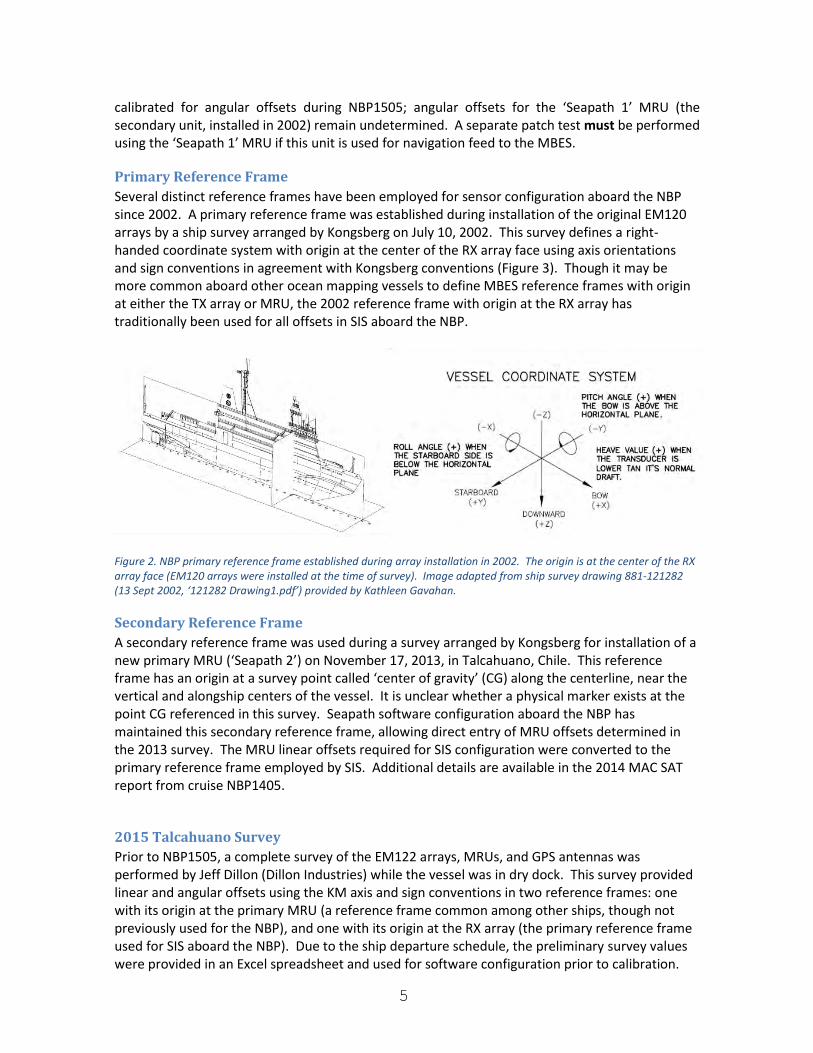
Several distinct reference frames have been employed for sensor configuration aboard the NBP since 2002. A primary reference frame was established during installation of the original EM120 arrays by a ship survey arranged by Kongsberg on July 10, 2002. This survey defines a right-handed coordinate system with origin at the center of the RX array face using axis orientations and sign conventions in agreement with Kongsberg conventions (Figure 3). Though it may be more common aboard other ocean mapping vessels to define MBES reference frames with origin at either the TX array or MRU, the 2002 reference frame with origin at the RX array has traditionally been used for all offsets in SIS aboard the NBP.
Figure 2. NBP primary reference frame established during array installation in 2002. The origin is at the center of the RX array face (EM120 arrays were installed at the time of survey). Image adapted from ship survey drawing 881-121282 (13 Sept 2002, ‘121282 Drawing1.pdf’) provided by Kathleen Gavahan.
Secondary Reference Frame
A secondary reference frame was used during a survey arranged by Kongsberg for installation of a new primary MRU (‘Seapath 2’) on November 17, 2013, in Talcahuano, Chile. This reference frame has an origin at a survey point called ‘center of gravity’ (CG) along the centerline, near the vertical and alongship centers of the vessel. It is unclear whether a physical marker exists at the point CG referenced in this survey. Seapath software configuration aboard the NBP has maintained this secondary reference frame, allowing direct entry of MRU offsets determined in the 2013 survey. The MRU linear offsets required for SIS configuration were converted to the primary reference frame employed by SIS. Additional details are available in the 2014 MAC SAT report from cruise NBP1405.
2015 Talcahuano Survey
Prior to NBP1505, a complete survey of the EM122 arrays, MRUs, and GPS antennas was performed by Jeff Dillon (Dillon Industries) while the vessel was in dry dock. This survey provided linear and angular offsets using the KM axis and sign conventions in two reference frames: one with its origin at the primary MRU (a reference frame common among other ships, though not previously used for the NBP), and one with its origin at the RX array (the primary reference frame used for SIS aboard the NBP). Due to the ship departure schedule, the preliminary survey values were provided in an Excel spreadsheet and used for software configuration prior to calibration.
6
Unfortunately, the initial report included misplaced descriptions of the transducer array pitch and roll offsets which were used to determine their interpretation and application. For example, the angular values corresponding to array roll were described as ‘BOW DOWN’ (TX) and ‘BOW UP’ (RX) in the initial report, leading MAC and KM personnel to apply these values as negative (TX) and positive (RX) pitch offsets, respectively, in the SIS reference frame prior to calibration. Likewise, both values corresponding to TX and RX array pitch were described as ‘STBD DOWN’ and treated as positive roll offsets during software configuration prior to calibration. This misplacement of array angular offset descriptions was realized only after receipt of the ‘final’ survey report, after conclusion of NBP1505. Table 2 presents the initial and final report values and the errors expected in array offsets applied during calibration (i.e., the difference of the applied value from the true value). While the patch test that was conducted during NBP1505 compensates for these errors, the only way to completely resolve the errors is to perform another patch test with the correct array roll and pitch offsets applied. Until then, it is recommended that the EM122 be operated as calibrated and no further corrections be attempted. As recommended in the NBP1405 report, the complete Talcahuano survey of EM122 arrays, primary MRU, and GPS antennas presents an opportunity to bring the entire MBES system into a single common reference frame. This reference frame could be centered at the RX array per the traditional primary reference frame, Talcahuano survey, and existing SIS configuration. Alternatively, the reference frame could have its origin at the center of the TX array, as is more conventional aboard other ocean mapping vessels with KM MBES systems. Either choice will address confusion regarding the multiple reference frames presently employed for MBES components aboard the NBP. Migration of all SIS and Seapath configurations to a common reference frame requires in-depth review of the final Talcahuano survey report. As discussed with shipboard personnel during NBP1505, an outline of the options and steps for implementing this conversion are available in the Appendix. Because of the limited time for system geometry review before patch testing, a decision was made by MAC, KM, and shipboard personnel at the beginning of NBP1505 to maintain the existing reference frames employed by the SIS and Seapath software packages during NBP1505. Accordingly, the 2015 dry dock survey results were applied in SIS using the primary reference frame and in the Seapath software using the secondary reference frame. The Seapath data output to SIS is corrected to the MRU location expected by SIS (see SIS and Seapath Configurations, below). All SIS configurations discussed herein are with respect to the primary reference frame with origin at the center of the RX array face, unless otherwise noted.
7
Table 1. Documented changes to system geometry
Date Location Event References
2002-07-10
Survey to establish primary reference frame and offsets of EM120 arrays, MRU, and GPS antennas
Excel spreadsheet and Autocad drawing provided by Kongsberg / Tony Dalheim as ‘NBP_EM120_install_survey_2002_July_10.xls’ and ‘121282 survey.pdf’
2013-11-17 Talcahuano, Chile
Install Seapath 330 and MRU-5 (‘Seapath 2’) as primary MRU; survey offsets in primary and secondary reference frames
Excel spreadsheet provided by Kongsberg / Tony Dalheim as ‘RVIB NATHANIEL B. PALMER SYSTEM COORDINATES.xls’
2014-06 Talcahuano to Puerto Montt, Chile
Install EM122 transceiver; perform SAT for transceiver (NBP1405); create Seapath 330 ‘Monitoring Point’ at MRU location for data input to SIS
MAC EM122 SAT report available as ‘20140619_EM122_SAT_NBP1405_Final_NSF.pdf’ at mac.unols.org
2015-06 Talcahuano, Chile
Install EM122 TX and RX arrays and TX ice window; survey linear and angular offsets for arrays, Seapath 330, and antennas in primary reference frame
Excel spreadsheet of preliminary survey results provided by Jeff Dillon (Dillon Industries) to Kongsberg / Chuck Hohing as ‘INITIAL_REPORT.xls’
2015-06-10 Talcahuano to Puerto Montt, Chile
SAT for EM122 arrays (NBP1505); update SIS and Seapath offsets with Talcahuano initial survey, maintaining existing reference frames and Seapath ‘Monitoring Point’ for input to SIS; patch test EM122
This document
2015-06-26 Puerto Montt, Chile
Receive ‘final’ report from Talcahuano dry dock survey with modified array pitch and roll offset descriptions; see note regarding impact on calibration results
‘NBP REPORT-FINAL 6-26-15.pdf’ provided by Jeff Dillon
TX and RX Arrays
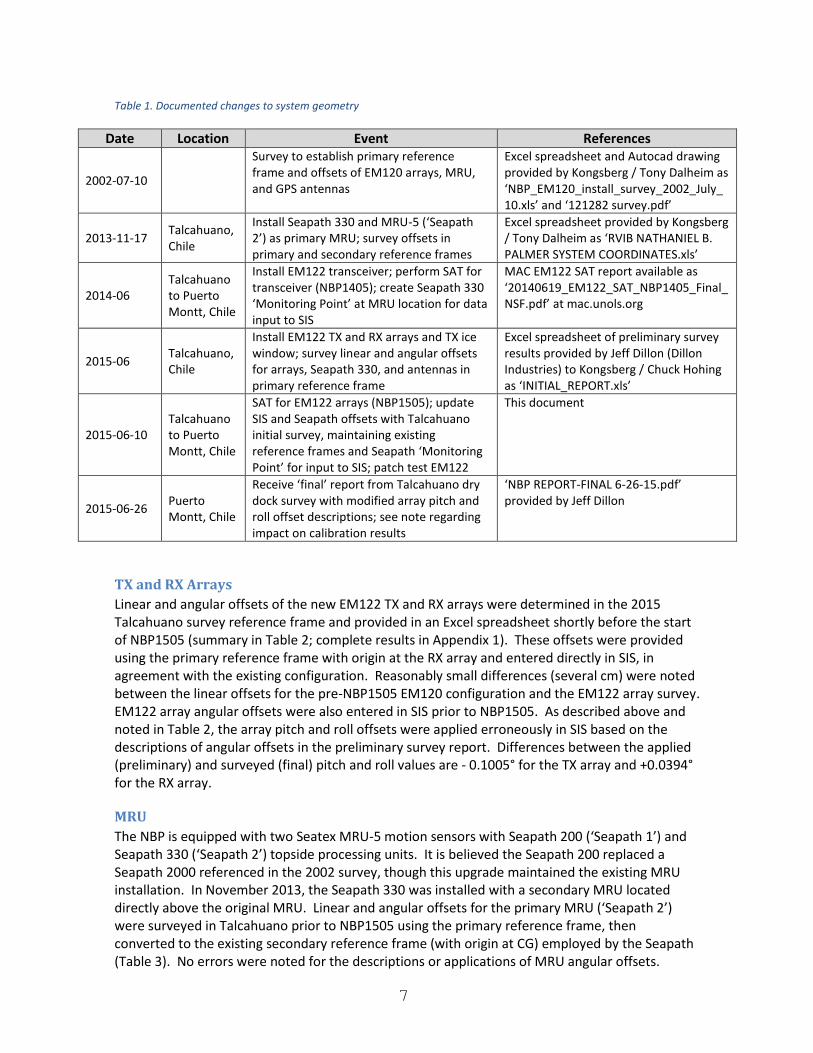
Linear and angular offsets of the new EM122 TX and RX arrays were determined in the 2015 Talcahuano survey reference frame and provided in an Excel spreadsheet shortly before the start of NBP1505 (summary in Table 2; complete results in Appendix 1). These offsets were provided using the primary reference frame with origin at the RX array and entered directly in SIS, in agreement with the existing configuration. Reasonably small differences (several cm) were noted between the linear offsets for the pre-NBP1505 EM120 configuration and the EM122 array survey. EM122 array angular offsets were also entered in SIS prior to NBP1505. As described above and noted in Table 2, the array pitch and roll offsets were applied erroneously in SIS based on the descriptions of angular offsets in the preliminary survey report. Differences between the applied (preliminary) and surveyed (final) pitch and roll values are - 0.1005° for the TX array and +0.0394° for the RX array.
MRU
The NBP is equipped with two Seatex MRU-5 motion sensors with Seapath 200 (‘Seapath 1’) and Seapath 330 (‘Seapath 2’) topside processing units. It is believed the Seapath 200 replaced a Seapath 2000 referenced in the 2002 survey, though this upgrade maintained the existing MRU installation. In November 2013, the Seapath 330 was installed with a secondary MRU located directly above the original MRU. Linear and angular offsets for the primary MRU (‘Seapath 2’) were surveyed in Talcahuano prior to NBP1505 using the primary reference frame, then converted to the existing secondary reference frame (with origin at CG) employed by the Seapath (Table 3). No errors were noted for the descriptions or applications of MRU angular offsets.
8
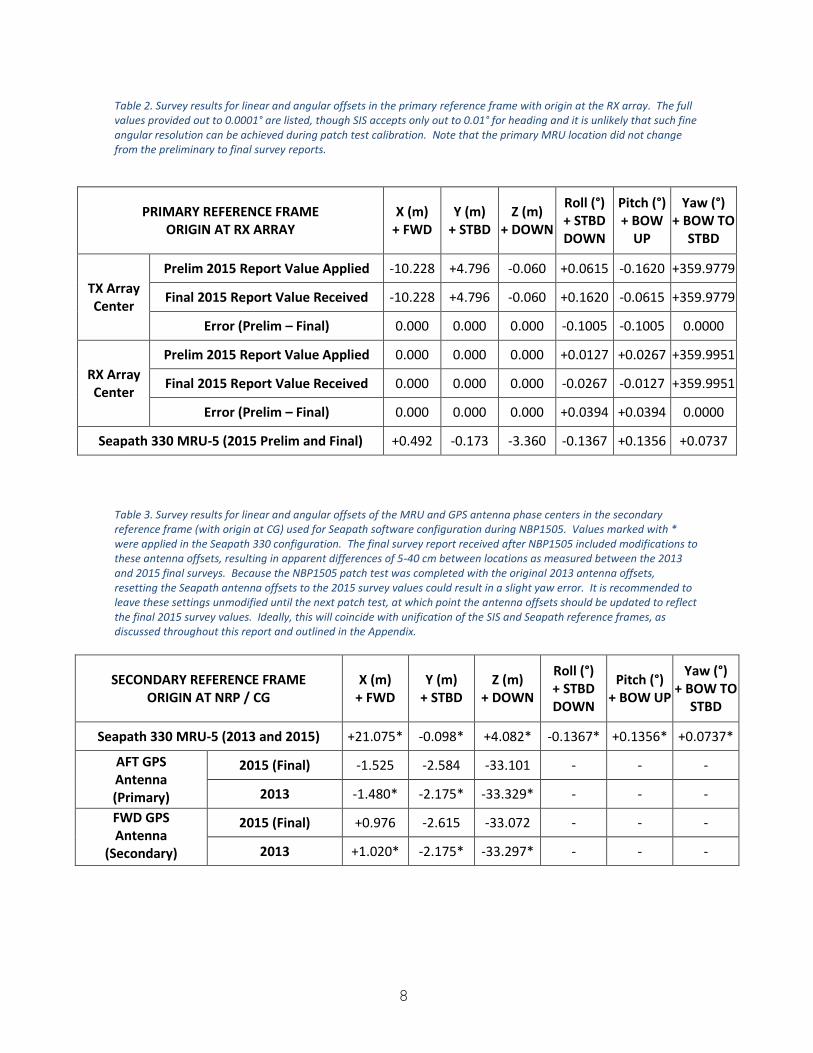
Table 2. Survey results for linear and angular offsets in the primary reference frame with origin at the RX array. The full values provided out to 0.0001° are listed, though SIS accepts only out to 0.01° for heading and it is unlikely that such fine angular resolution can be achieved during patch test calibration. Note that the primary MRU location did not change from the preliminary to final survey reports.
PRIMARY REFERENCE FRAME ORIGIN AT RX ARRAY
X (m) + FWD
Y (m) + STBD
Z (m) + DOWN
Roll (°) + STBD DOWN
Pitch (°) + BOW
UP
Yaw (°) + BOW TO
STBD
TX Array Center
Prelim 2015 Report Value Applied -10.228 +4.796 -0.060 +0.0615 -0.1620 +359.9779
Final 2015 Report Value Received -10.228 +4.796 -0.060 +0.1620 -0.0615 +359.9779
Error (Prelim – Final) 0.000 0.000 0.000 -0.1005 -0.1005 0.0000
RX Array Center
Prelim 2015 Report Value Applied 0.000 0.000 0.000 +0.0127 +0.0267 +359.9951
Final 2015 Report Value Received 0.000 0.000 0.000 -0.0267 -0.0127 +359.9951
Error (Prelim – Final) 0.000 0.000 0.000 +0.0394 +0.0394 0.0000
Seapath 330 MRU-5 (2015 Prelim and Final) +0.492 -0.173 -3.360 -0.1367 +0.1356 +0.0737
Table 3. Survey results for linear and angular offsets of the MRU and GPS antenna phase centers in the secondary reference frame (with origin at CG) used for Seapath software configuration during NBP1505. Values marked with * were applied in the Seapath 330 configuration. The final survey report received after NBP1505 included modifications to these antenna offsets, resulting in apparent differences of 5-40 cm between locations as measured between the 2013 and 2015 final surveys. Because the NBP1505 patch test was completed with the original 2013 antenna offsets, resetting the Seapath antenna offsets to the 2015 survey values could result in a slight yaw error. It is recommended to leave these settings unmodified until the next patch test, at which point the antenna offsets should be updated to reflect the final 2015 survey values. Ideally, this will coincide with unification of the SIS and Seapath reference frames, as discussed throughout this report and outlined in the Appendix.
SECONDARY REFERENCE FRAME ORIGIN AT NRP / CG
X (m) + FWD
Y (m) + STBD
Z (m) + DOWN
Roll (°) + STBD DOWN
Pitch (°) + BOW UP
Yaw (°) + BOW TO
STBD
Seapath 330 MRU-5 (2013 and 2015) +21.075* -0.098* +4.082* -0.1367* +0.1356* +0.0737*
AFT GPS Antenna (Primary)
2015 (Final) -1.525 -2.584 -33.101 - - -
2013 -1.480* -2.175* -33.329* - - -
FWD GPS Antenna
(Secondary)
2015 (Final) +0.976 -2.615 -33.072 - - -
2013 +1.020* -2.175* -33.297* - - -
9
SIS and Seapath Attitude Configurations
At the start of NBP1505, SIS was configured to utilize attitude and position data provided by the Seapath 330. All SIS angular offsets for the attitude sensor were set to zero to provide a ‘clean slate’ for patch testing. It is noted that any residual array angular offsets will be coupled into (and, in this process, inseparable from) the patch test results for residual MRU angular offsets. As noted in the NBP1405 report, a review of the Seapath 330 and SIS configurations prior to NBP1405 had revealed a possible mismatch between the shipboard locations at which the attitude and position data were referenced (or considered ‘valid’) in each system. The Seapath 330 had been configured using the secondary reference frame (origin at CG) to provide attitude and position data valid at the Navigation Reference Point (NRP) coincident with CG. SIS linear offsets were configured to accept attitude and position data valid at the Seapath 330 MRU location, not the NRP/CG location. It is expected that this mismatch would have led to alongship, athwartship, and vertical offsets in bathymetric data equal to the differences between the NRP/CG location and the Seapath 330 MRU location. These offsets may have also impacted previous patch test results, particularly for pitch, prior to NBP1405 (see NBP1405 report). To reconcile the Seapath and SIS configurations at the start of NBP1405, the Seapath output to SIS was set to a ‘Monitoring Point’ (MP1) which had been created previously to calculate attitude and position at the ‘Seapath 2’ MRU location. SIS linear offsets for attitude and position data (valid at the ‘Seapath 2’ MRU location) were left unchanged. As mentioned in the discussion of reference frames above, it was decided by MAC, KM, and NBP personnel to maintain this arrangement during NBP1505 and transition to a common reference frame at a later date (outlined in the Appendix and highly recommended when a suitable opportunity arises). Thus, the existing feed of Seapath data at MP1 has been maintained to provide SIS with position and attitude valid at the primary MRU location; all 2015 Talcahuano survey results have been applied with this arrangement in mind.
Calibration A patch test was performed near the continental shelf break west-northwest of Talcahuano (Figure 3) as the first survey activity of NBP1505 in order to estimate angular offset residuals, which are attributed in bulk to the Seapath 330 MRU alignment in the SIS reference frame. Descriptions of the rationale for calibration line planning are available in the Cookbook for CARIS HIPS 8.1 Patch Test with Kongsberg EM302 (though other details of this cookbook may not apply to NBP1505). MRU angular offsets in SIS were set to zero at the start of the calibration and determined in the order of pitch first, roll second, and yaw third. To minimize coupling of angular offsets in the calibration results, each angular offset was updated in SIS after completion of its respective calibration procedure and before the start of survey data collection for the next offset calibration. XBT profiles were acquired to 760 m depth and applied in SIS prior to the pitch and roll calibration lines. All XBTs throughout NBP1505 were processed with MBSystem by NBP personnel to remove spurious sound velocities, apply salinity data, and prepare the profile for SIS. To increase the alongtrack sounding density on the calibration lines and attempt to reduce bubble sweep beneath the bow, vessel speed was reduced from typical survey speed of ten knots to four knots over ground. To maximize ping rate and sounding density, the EM122 was configured as follows:
10
Depth mode: AUTO Dual-swath mode: enabled (dynamic) Transmit mode: FM disabled (FM was inadvertently enabled for the first pitch calibration) Yaw stabilization: enabled (rel. mean heading) Pitch stabilization: enabled Beam spacing: High density equidistant Swath width: Pitch: 15°/15° port/stbd Roll: 70°/70° port/stbd Yaw: 15°/60° and 60°/15° port/stbd Calibration tools in SIS, CARIS HIPS 9.0, and a pre-release version of QPS’ Qimera hydrographic software packages were used separately to evaluate each set of calibration lines. Results from independent examinations of each tests dataset by Johnson, Jerram, and Kongsberg representatives using all three tools typically fell to within 0.05° of each other; final values were agreed upon by all before modification in SIS. These values were later confirmed independently by Kathleen Gavahan. All calibration results were verified by repeating the pitch, roll, and yaw calibration procedure after application of the initial patch test results in SIS. No remaining residual offsets were detected during the verification and the initial patch test results were maintained in SIS. No apparent latency effects were visible during NBP1505, and no latency test was performed. Due to the depth at the calibration site and resolution of the EM122, it is unclear whether a latency of less than 1 s would be apparent in this calibration procedure; it would more likely manifest as a seafloor ‘wobble’ related to erroneous attitude timing, which was not observed during NBP1505.
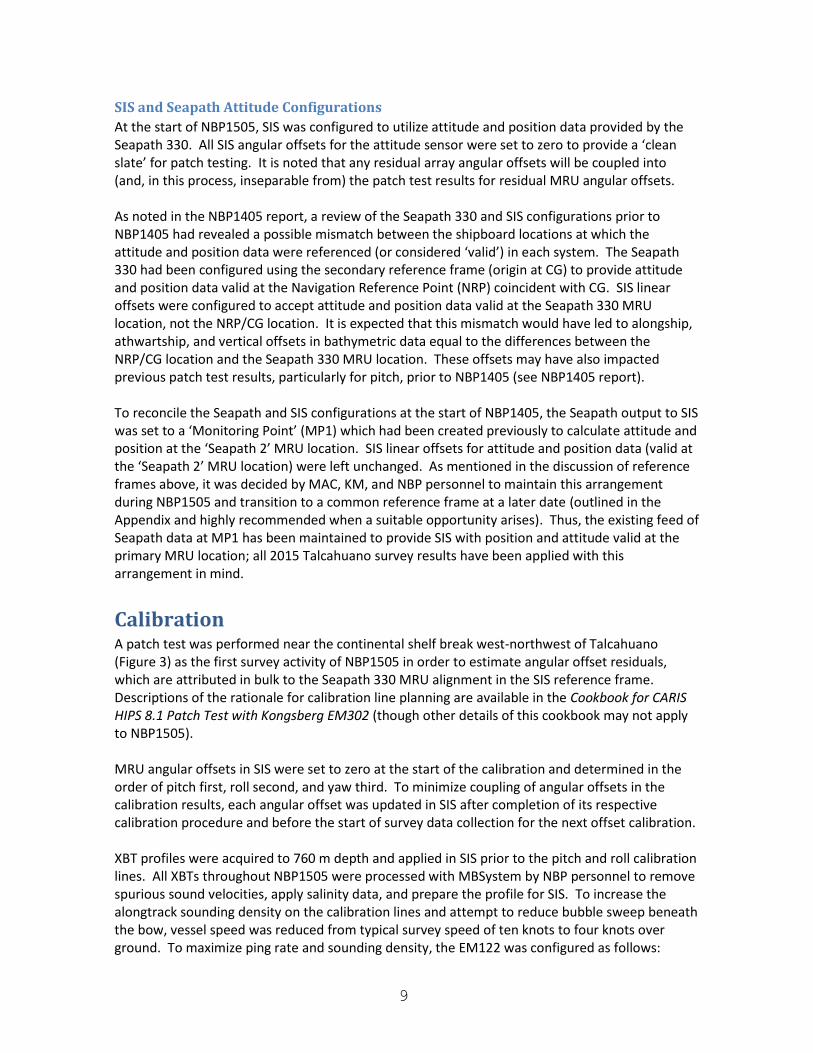
Figure 3. Left: Layout of calibration lines for NBP1505 (using historic multibeam echosounder data downloaded from the National Geophysical Data Center). Right: Slopes of calibration area, with green showing desirable slopes between 20-32°. Slopes below 20° are blue and above 32° are red. This range of desirable slopes provides relief for picking out seafloor features while maintaining sufficient acoustic return strengths.
11
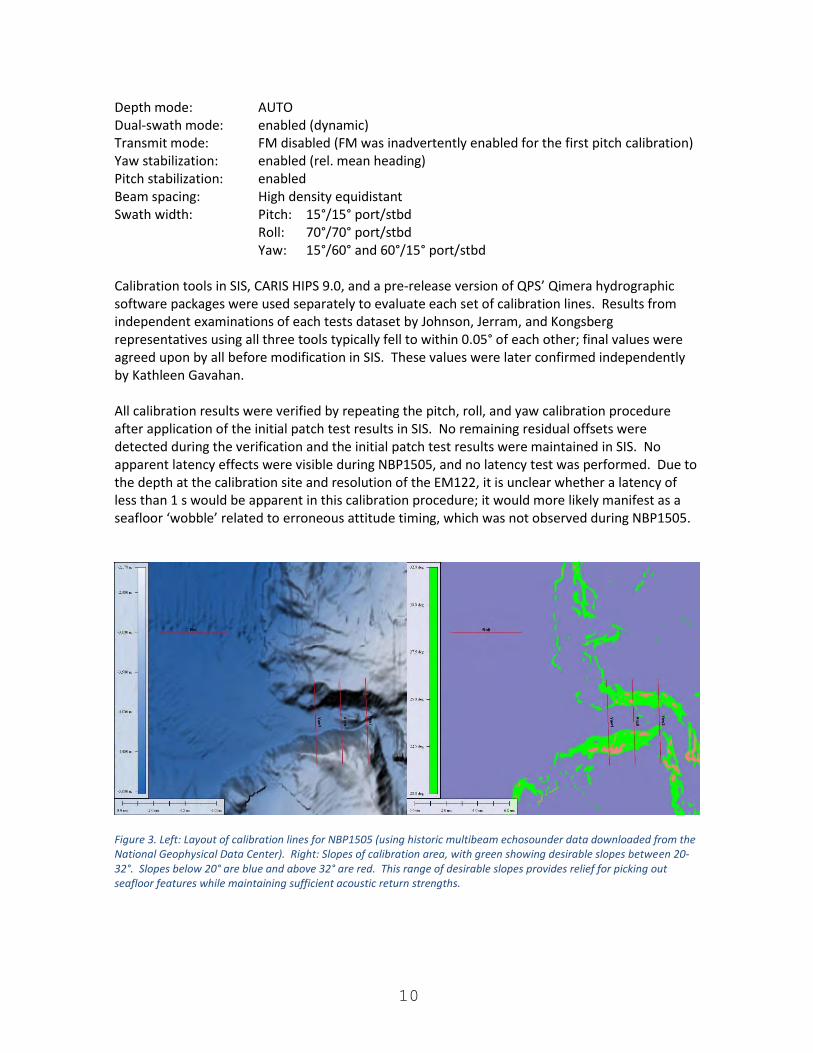
Calibration Results Figure 4-6 depict example transects of the roll, pitch, and yaw data sets in the CARIS HIPS Subset Editor calibration tool with the final value for each offset applied. Each result in Table 4 is based on independent analyses of multiple transects in the CARIS, Qimera, and SIS calibration tools. All three values were verified through a complete second patch test which yielded zero residuals; accordingly, MRU angular offsets entered in SIS reflect the verified NBP1505 calibration results.
Table 4. Summary of attitude sensor calibration results.
Calibration Result Roll (°) Pitch (°) Yaw (°)
Pre-NBP1505 +0.29 0.05 0.50
NBP1505 Calibration +0.35 +0.25 +0.65
NBP1505 Verification +0.35 +0.25 +0.65
Figure 4. Roll calibration in CARIS yielding a MRU roll offset of +0.35°. Differences in swath width on reciprocal headings (green versus red) are evident due to varying levels of bubble sweep along the hull in the prevailing seas. The roll offset was verified with repeat survey lines collected using this value. Vertical exaggeration is 20X in this image.
12
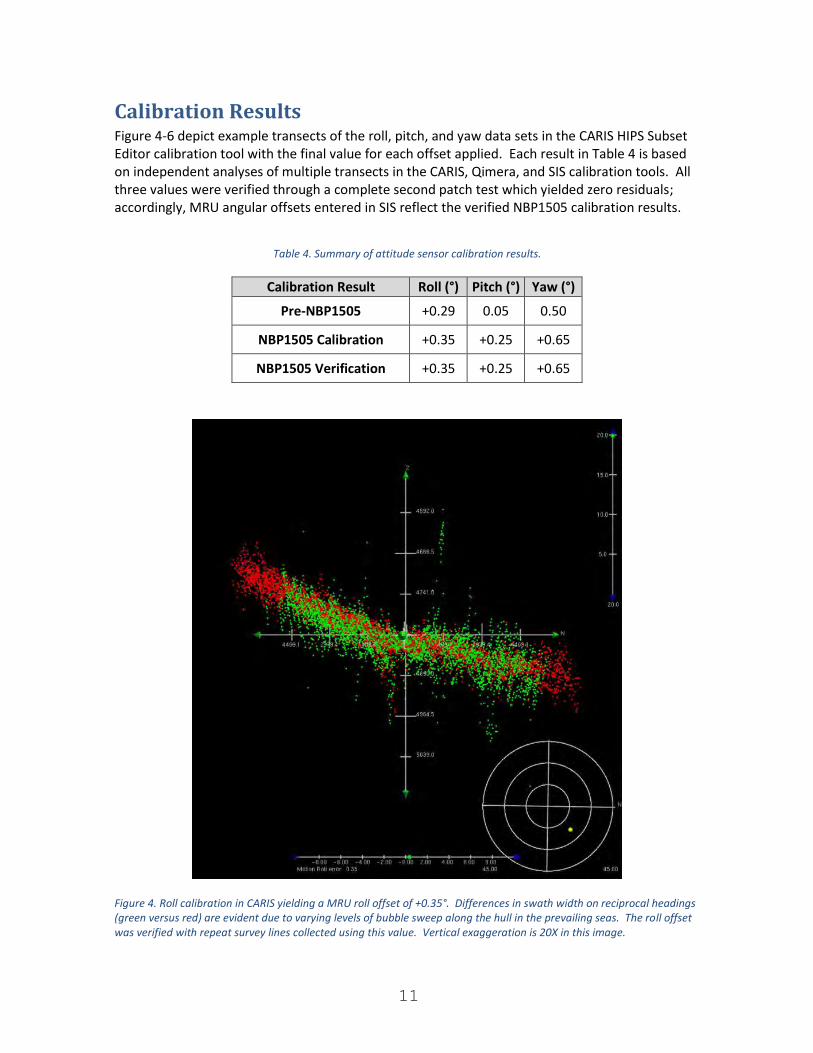
Figure 5. Pitch calibration in CARIS yielding a MRU pitch offset of +0.25°. The pitch offset was verified with repeat survey lines collected using this value. Vertical exaggeration is 20X in this image.
13
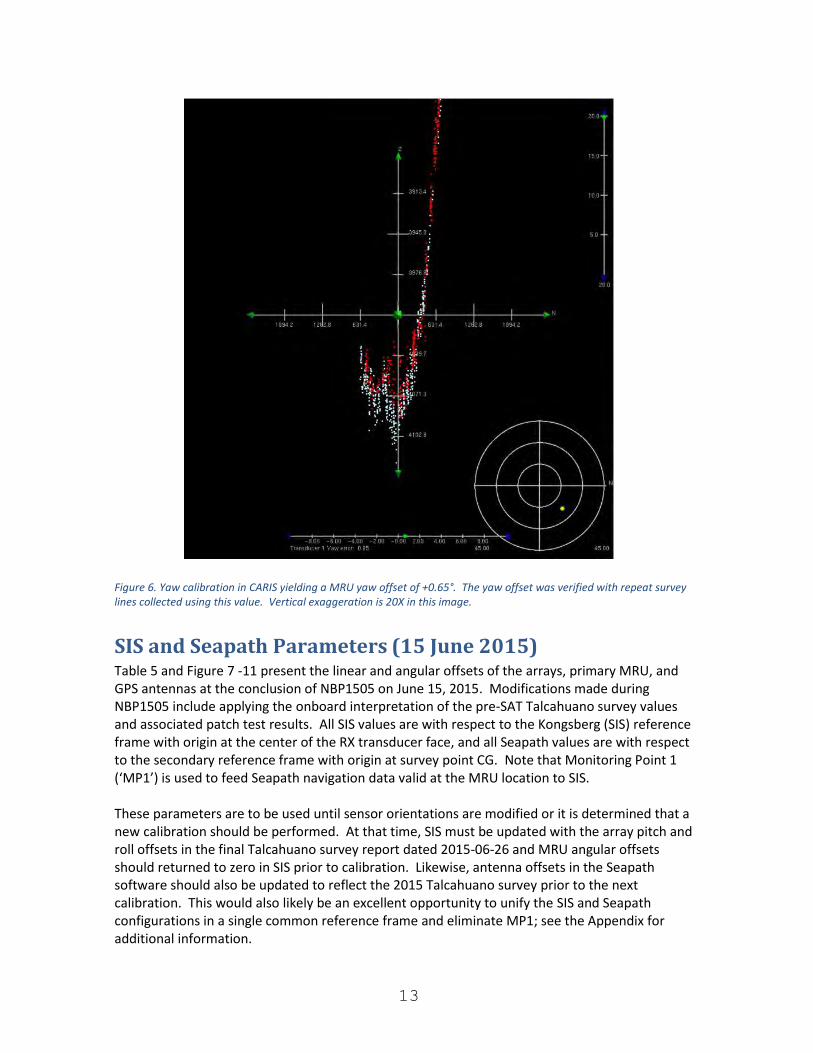
Figure 6. Yaw calibration in CARIS yielding a MRU yaw offset of +0.65°. The yaw offset was verified with repeat survey lines collected using this value. Vertical exaggeration is 20X in this image.
SIS and Seapath Parameters (15 June 2015) Table 5 and Figure 7 -11 present the linear and angular offsets of the arrays, primary MRU, and GPS antennas at the conclusion of NBP1505 on June 15, 2015. Modifications made during NBP1505 include applying the onboard interpretation of the pre-SAT Talcahuano survey values and associated patch test results. All SIS values are with respect to the Kongsberg (SIS) reference frame with origin at the center of the RX transducer face, and all Seapath values are with respect to the secondary reference frame with origin at survey point CG. Note that Monitoring Point 1 (‘MP1’) is used to feed Seapath navigation data valid at the MRU location to SIS. These parameters are to be used until sensor orientations are modified or it is determined that a new calibration should be performed. At that time, SIS must be updated with the array pitch and roll offsets in the final Talcahuano survey report dated 2015-06-26 and MRU angular offsets should returned to zero in SIS prior to calibration. Likewise, antenna offsets in the Seapath software should also be updated to reflect the 2015 Talcahuano survey prior to the next calibration. This would also likely be an excellent opportunity to unify the SIS and Seapath configurations in a single common reference frame and eliminate MP1; see the Appendix for additional information.
14
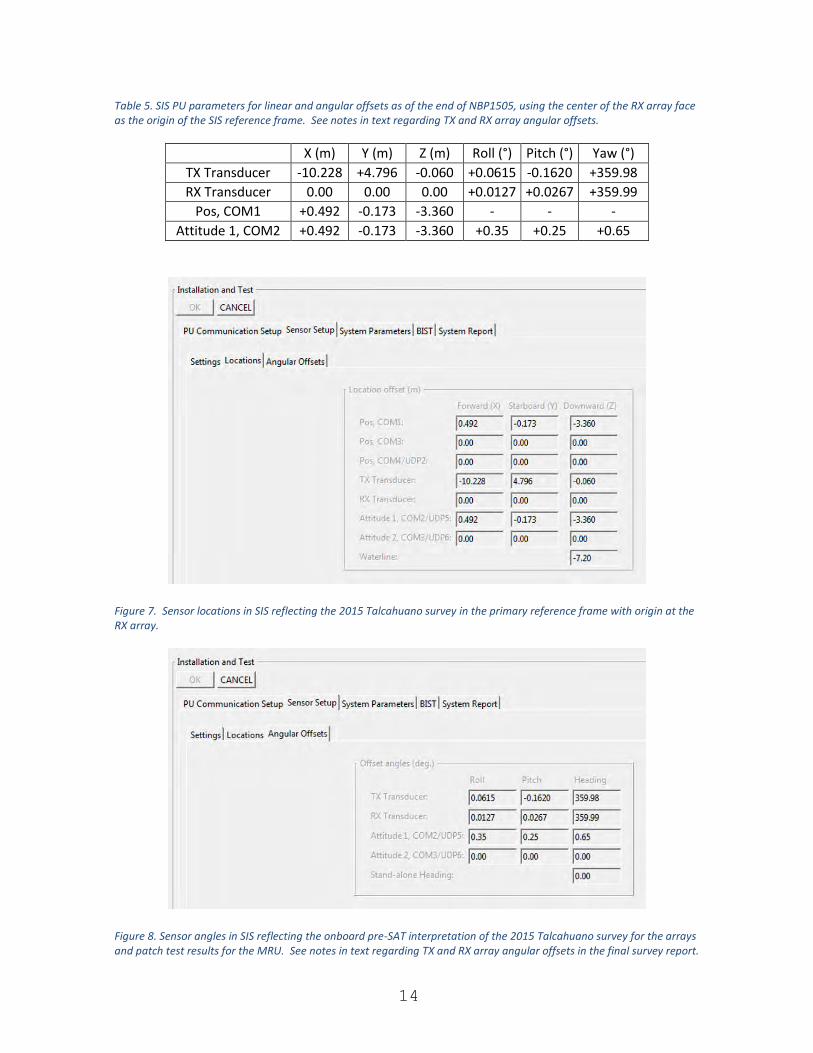
Table 5. SIS PU parameters for linear and angular offsets as of the end of NBP1505, using the center of the RX array face as the origin of the SIS reference frame. See notes in text regarding TX and RX array angular offsets.
X (m) Y (m) Z (m) Roll (°) Pitch (°) Yaw (°)
TX Transducer -10.228 +4.796 -0.060 +0.0615 -0.1620 +359.98
RX Transducer 0.00 0.00 0.00
+0.0127 +0.0267 +359.99
Pos, COM1 +0.492 -0.173 -3.360 - - -
Attitude 1, COM2 +0.492 -0.173 -3.360
+0.35 +0.25 +0.65
Figure 7. Sensor locations in SIS reflecting the 2015 Talcahuano survey in the primary reference frame with origin at the RX array.
Figure 8. Sensor angles in SIS reflecting the onboard pre-SAT interpretation of the 2015 Talcahuano survey for the arrays and patch test results for the MRU. See notes in text regarding TX and RX array angular offsets in the final survey report.
15
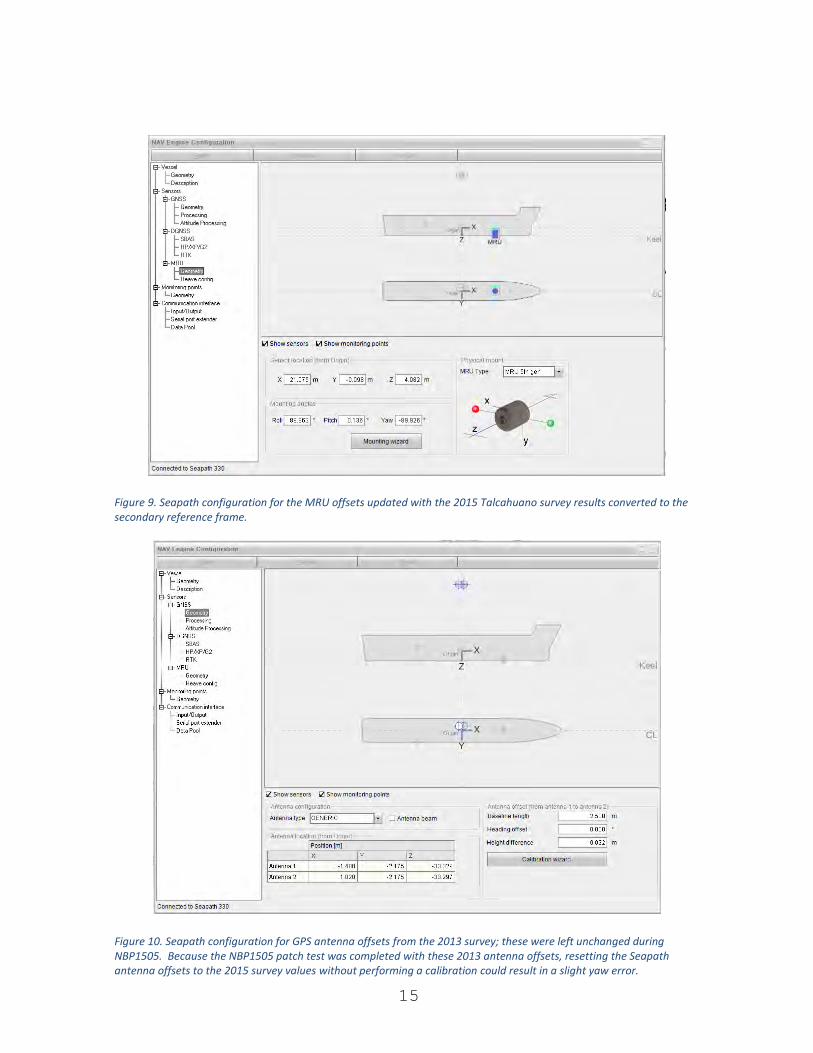
Figure 9. Seapath configuration for the MRU offsets updated with the 2015 Talcahuano survey results converted to the secondary reference frame.
Figure 10. Seapath configuration for GPS antenna offsets from the 2013 survey; these were left unchanged during NBP1505. Because the NBP1505 patch test was completed with these 2013 antenna offsets, resetting the Seapath antenna offsets to the 2015 survey values without performing a calibration could result in a slight yaw error.
16
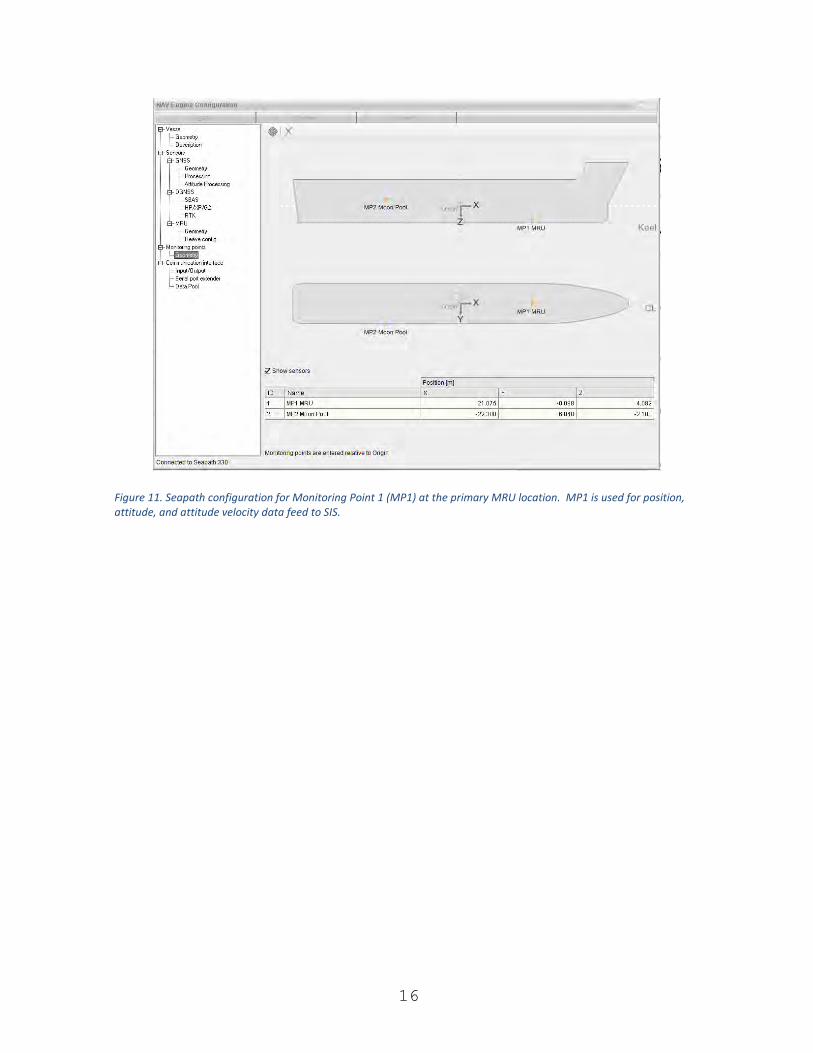
Figure 11. Seapath configuration for Monitoring Point 1 (MP1) at the primary MRU location. MP1 is used for position, attitude, and attitude velocity data feed to SIS.
17
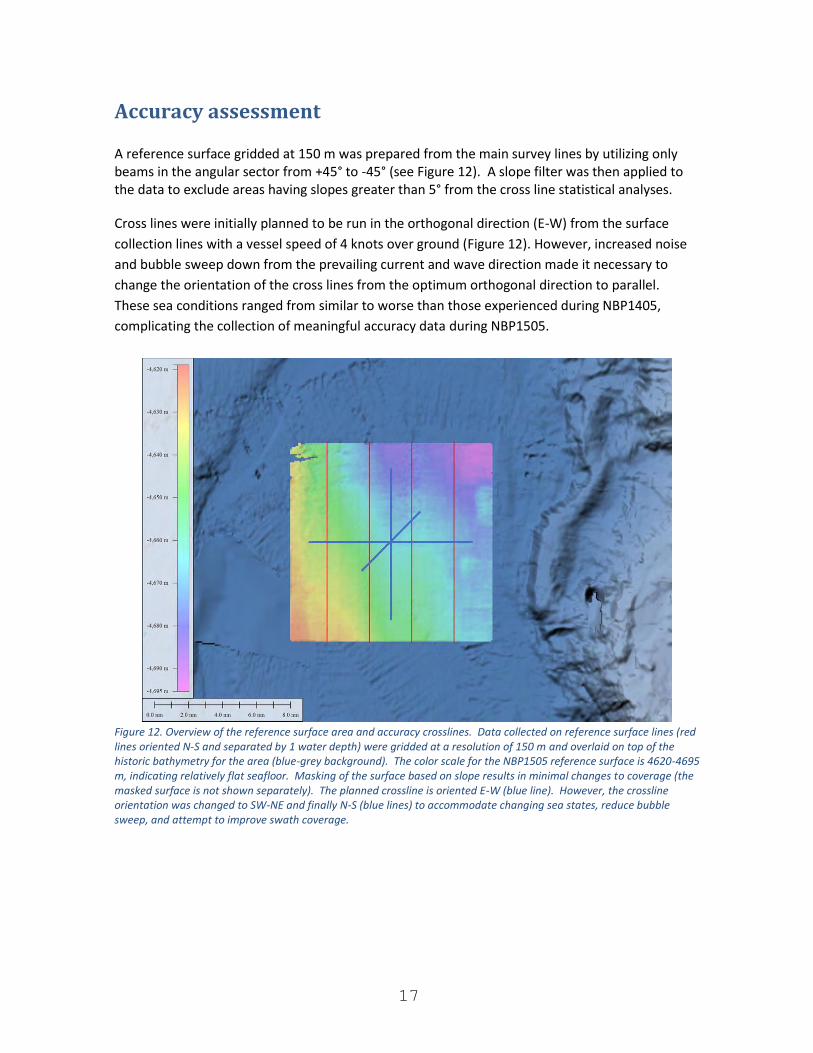
Accuracy assessment A reference surface gridded at 150 m was prepared from the main survey lines by utilizing only beams in the angular sector from +45° to -45° (see Figure 12). A slope filter was then applied to the data to exclude areas having slopes greater than 5° from the cross line statistical analyses.
Cross lines were initially planned to be run in the orthogonal direction (E-W) from the surface
collection lines with a vessel speed of 4 knots over ground (Figure 12). However, increased noise
and bubble sweep down from the prevailing current and wave direction made it necessary to
change the orientation of the cross lines from the optimum orthogonal direction to parallel.
These sea conditions ranged from similar to worse than those experienced during NBP1405,
complicating the collection of meaningful accuracy data during NBP1505.
Figure 12. Overview of the reference surface area and accuracy crosslines. Data collected on reference surface lines (red lines oriented N-S and separated by 1 water depth) were gridded at a resolution of 150 m and overlaid on top of the historic bathymetry for the area (blue-grey background). The color scale for the NBP1505 reference surface is 4620-4695 m, indicating relatively flat seafloor. Masking of the surface based on slope results in minimal changes to coverage (the masked surface is not shown separately). The planned crossline is oriented E-W (blue line). However, the crossline orientation was changed to SW-NE and finally N-S (blue lines) to accommodate changing sea states, reduce bubble sweep, and attempt to improve swath coverage.
18
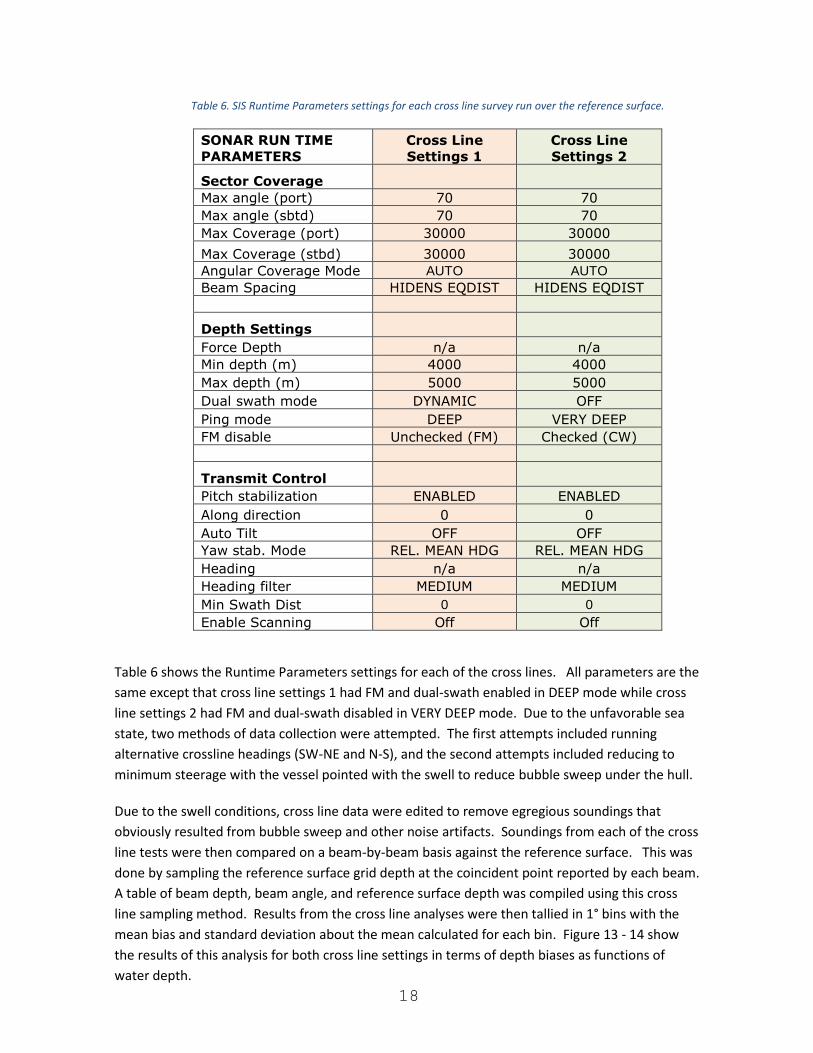
Table 6. SIS Runtime Parameters settings for each cross line survey run over the reference surface.
SONAR RUN TIME
PARAMETERS
Cross Line
Settings 1
Cross Line
Settings 2
Sector Coverage
Max angle (port) 70 70
Max angle (sbtd) 70 70
Max Coverage (port) 30000 30000
Max Coverage (stbd) 30000 30000
Angular Coverage Mode AUTO AUTO
Beam Spacing HIDENS EQDIST HIDENS EQDIST
Depth Settings
Force Depth n/a n/a
Min depth (m) 4000 4000
Max depth (m) 5000 5000
Dual swath mode DYNAMIC OFF
Ping mode DEEP VERY DEEP
FM disable Unchecked (FM) Checked (CW)
Transmit Control
Pitch stabilization ENABLED ENABLED
Along direction 0 0
Auto Tilt OFF OFF
Yaw stab. Mode REL. MEAN HDG REL. MEAN HDG
Heading n/a n/a
Heading filter MEDIUM MEDIUM
Min Swath Dist 0 0
Enable Scanning Off Off
Table 6 shows the Runtime Parameters settings for each of the cross lines. All parameters are the
same except that cross line settings 1 had FM and dual-swath enabled in DEEP mode while cross
line settings 2 had FM and dual-swath disabled in VERY DEEP mode. Due to the unfavorable sea
state, two methods of data collection were attempted. The first attempts included running
alternative crossline headings (SW-NE and N-S), and the second attempts included reducing to
minimum steerage with the vessel pointed with the swell to reduce bubble sweep under the hull.
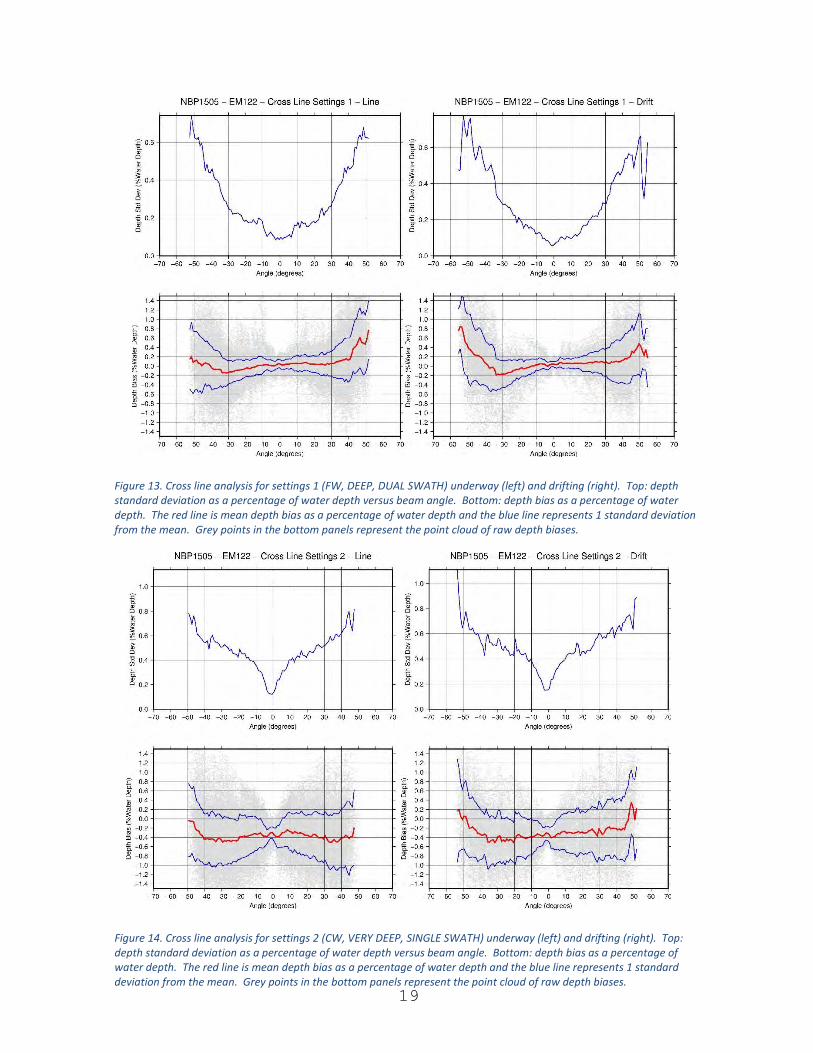
Due to the swell conditions, cross line data were edited to remove egregious soundings that
obviously resulted from bubble sweep and other noise artifacts. Soundings from each of the cross
line tests were then compared on a beam-by-beam basis against the reference surface. This was
done by sampling the reference surface grid depth at the coincident point reported by each beam.
A table of beam depth, beam angle, and reference surface depth was compiled using this cross
line sampling method. Results from the cross line analyses were then tallied in 1° bins with the
mean bias and standard deviation about the mean calculated for each bin. Figure 13 - 14 show
the results of this analysis for both cross line settings in terms of depth biases as functions of
water depth.
19
Figure 13. Cross line analysis for settings 1 (FW, DEEP, DUAL SWATH) underway (left) and drifting (right). Top: depth standard deviation as a percentage of water depth versus beam angle. Bottom: depth bias as a percentage of water depth. The red line is mean depth bias as a percentage of water depth and the blue line represents 1 standard deviation from the mean. Grey points in the bottom panels represent the point cloud of raw depth biases.
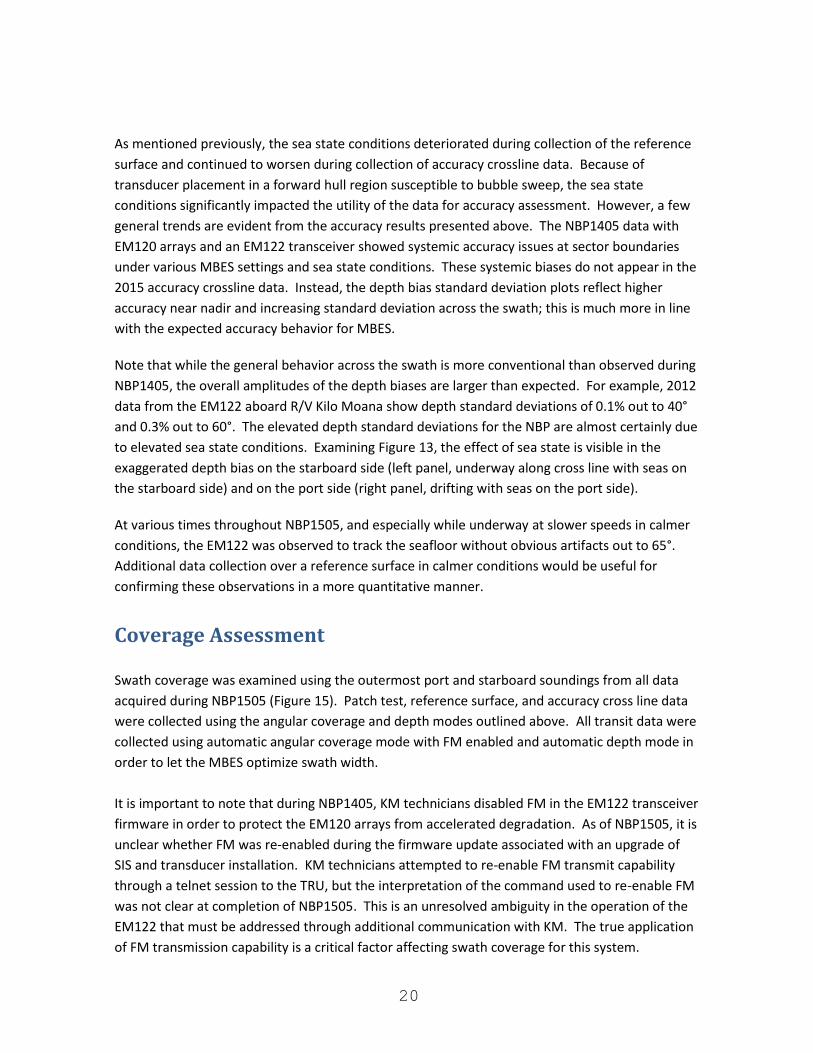
Figure 14. Cross line analysis for settings 2 (CW, VERY DEEP, SINGLE SWATH) underway (left) and drifting (right). Top: depth standard deviation as a percentage of water depth versus beam angle. Bottom: depth bias as a percentage of water depth. The red line is mean depth bias as a percentage of water depth and the blue line represents 1 standard deviation from the mean. Grey points in the bottom panels represent the point cloud of raw depth biases.
20
As mentioned previously, the sea state conditions deteriorated during collection of the reference
surface and continued to worsen during collection of accuracy crossline data. Because of
transducer placement in a forward hull region susceptible to bubble sweep, the sea state
conditions significantly impacted the utility of the data for accuracy assessment. However, a few
general trends are evident from the accuracy results presented above. The NBP1405 data with
EM120 arrays and an EM122 transceiver showed systemic accuracy issues at sector boundaries
under various MBES settings and sea state conditions. These systemic biases do not appear in the
2015 accuracy crossline data. Instead, the depth bias standard deviation plots reflect higher
accuracy near nadir and increasing standard deviation across the swath; this is much more in line
with the expected accuracy behavior for MBES.
Note that while the general behavior across the swath is more conventional than observed during
NBP1405, the overall amplitudes of the depth biases are larger than expected. For example, 2012
data from the EM122 aboard R/V Kilo Moana show depth standard deviations of 0.1% out to 40°
and 0.3% out to 60°. The elevated depth standard deviations for the NBP are almost certainly due
to elevated sea state conditions. Examining Figure 13, the effect of sea state is visible in the
exaggerated depth bias on the starboard side (left panel, underway along cross line with seas on
the starboard side) and on the port side (right panel, drifting with seas on the port side).
At various times throughout NBP1505, and especially while underway at slower speeds in calmer
conditions, the EM122 was observed to track the seafloor without obvious artifacts out to 65°.
Additional data collection over a reference surface in calmer conditions would be useful for
confirming these observations in a more quantitative manner.
Coverage Assessment
Swath coverage was examined using the outermost port and starboard soundings from all data
acquired during NBP1505 (Figure 15). Patch test, reference surface, and accuracy cross line data
were collected using the angular coverage and depth modes outlined above. All transit data were
collected using automatic angular coverage mode with FM enabled and automatic depth mode in
order to let the MBES optimize swath width.
It is important to note that during NBP1405, KM technicians disabled FM in the EM122 transceiver
firmware in order to protect the EM120 arrays from accelerated degradation. As of NBP1505, it is
unclear whether FM was re-enabled during the firmware update associated with an upgrade of
SIS and transducer installation. KM technicians attempted to re-enable FM transmit capability
through a telnet session to the TRU, but the interpretation of the command used to re-enable FM
was not clear at completion of NBP1505. This is an unresolved ambiguity in the operation of the
EM122 that must be addressed through additional communication with KM. The true application
of FM transmission capability is a critical factor affecting swath coverage for this system.
21
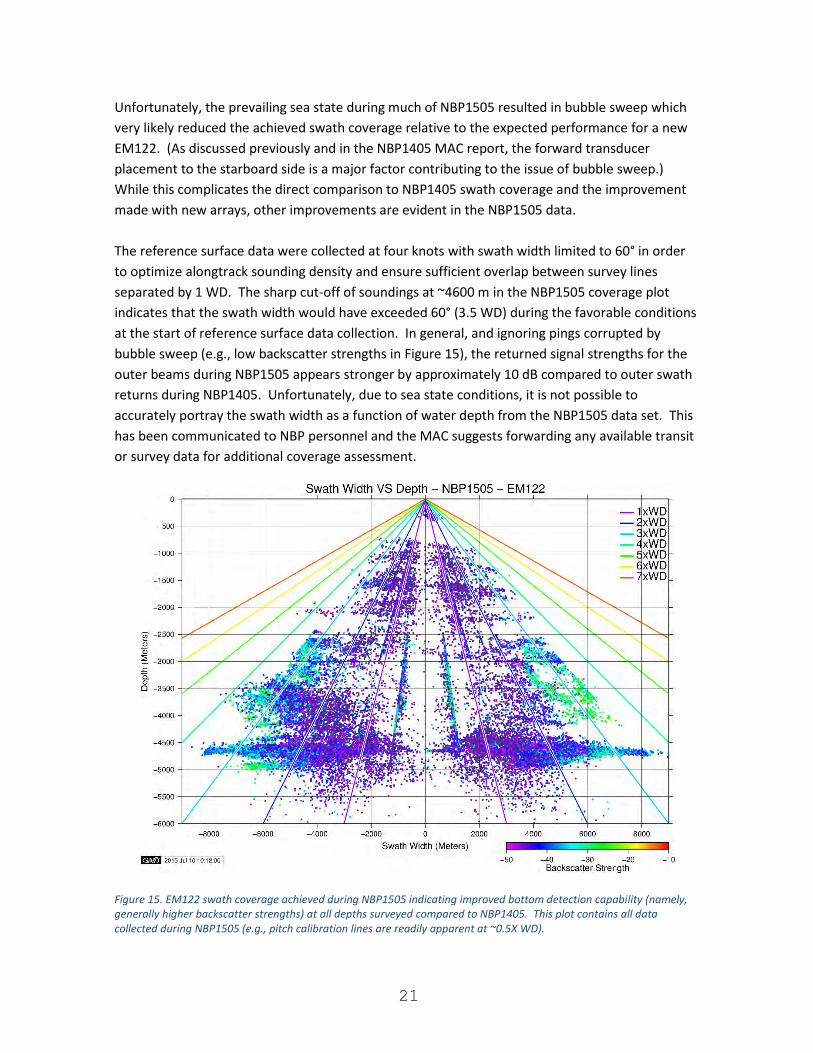
Unfortunately, the prevailing sea state during much of NBP1505 resulted in bubble sweep which
very likely reduced the achieved swath coverage relative to the expected performance for a new
EM122. (As discussed previously and in the NBP1405 MAC report, the forward transducer
placement to the starboard side is a major factor contributing to the issue of bubble sweep.)
While this complicates the direct comparison to NBP1405 swath coverage and the improvement
made with new arrays, other improvements are evident in the NBP1505 data.
The reference surface data were collected at four knots with swath width limited to 60° in order
to optimize alongtrack sounding density and ensure sufficient overlap between survey lines
separated by 1 WD. The sharp cut-off of soundings at ~4600 m in the NBP1505 coverage plot
indicates that the swath width would have exceeded 60° (3.5 WD) during the favorable conditions
at the start of reference surface data collection. In general, and ignoring pings corrupted by
bubble sweep (e.g., low backscatter strengths in Figure 15), the returned signal strengths for the
outer beams during NBP1505 appears stronger by approximately 10 dB compared to outer swath
returns during NBP1405. Unfortunately, due to sea state conditions, it is not possible to
accurately portray the swath width as a function of water depth from the NBP1505 data set. This
has been communicated to NBP personnel and the MAC suggests forwarding any available transit
or survey data for additional coverage assessment.
Figure 15. EM122 swath coverage achieved during NBP1505 indicating improved bottom detection capability (namely, generally higher backscatter strengths) at all depths surveyed compared to NBP1405. This plot contains all data collected during NBP1505 (e.g., pitch calibration lines are readily apparent at ~0.5X WD).
22
Noise Level Assessment
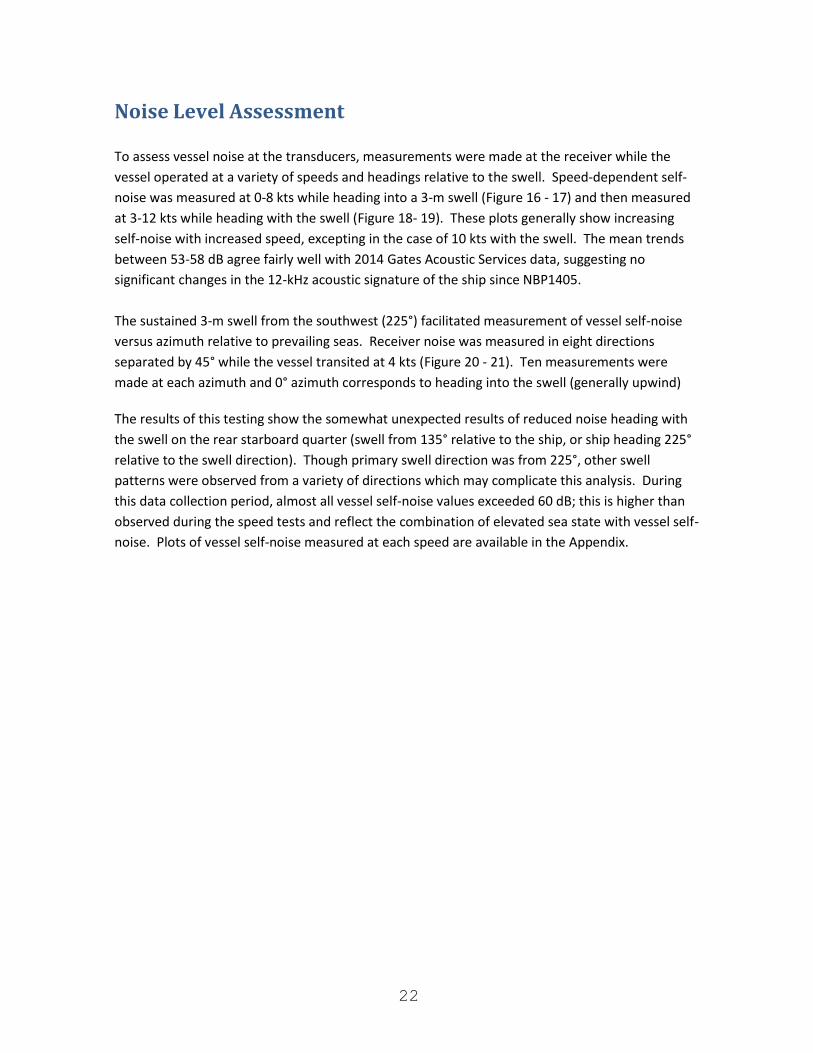
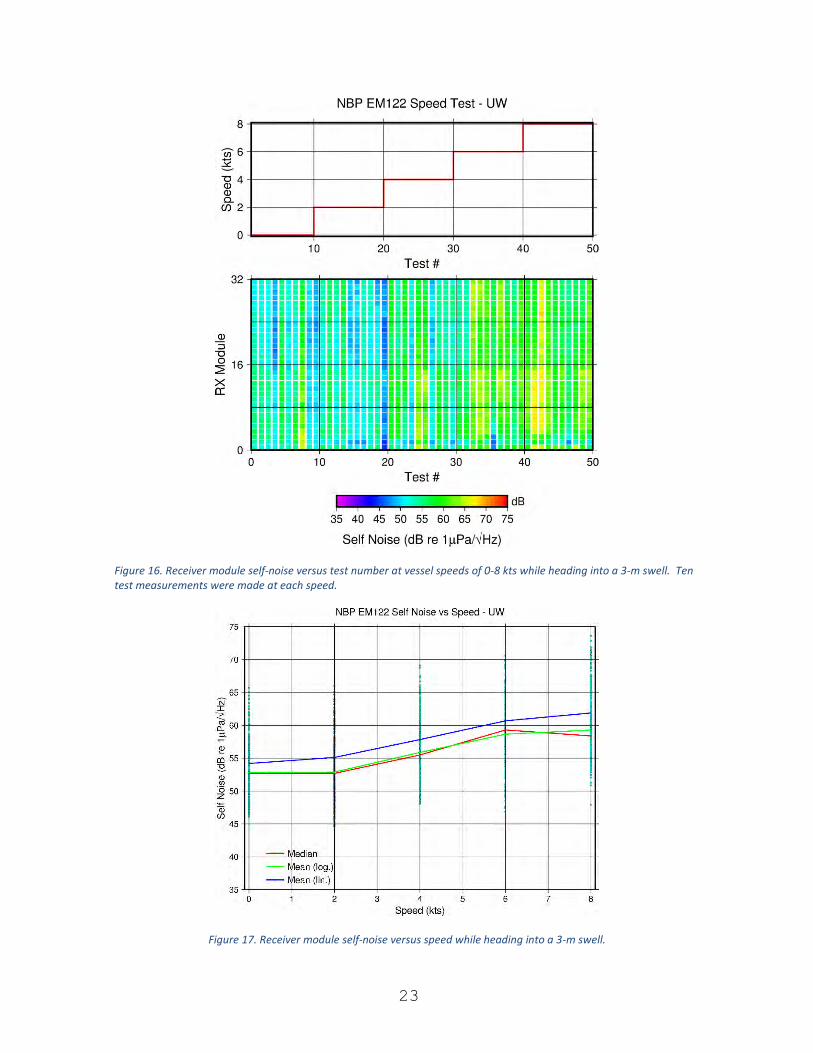
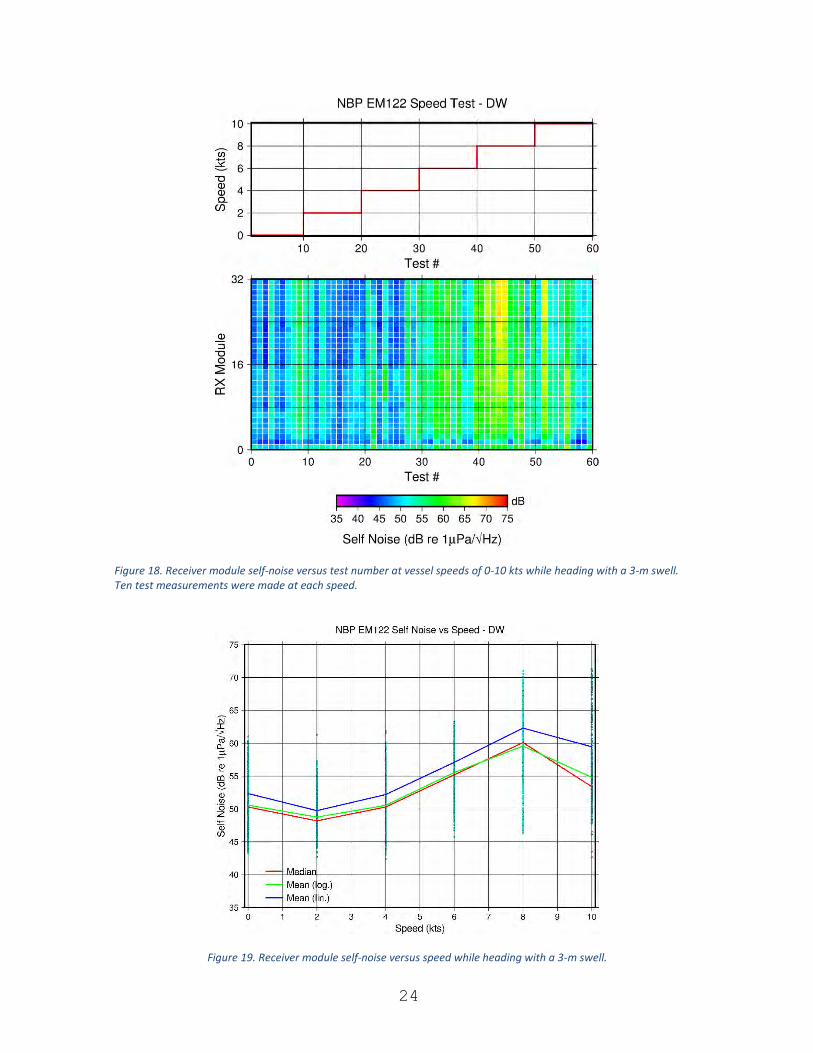
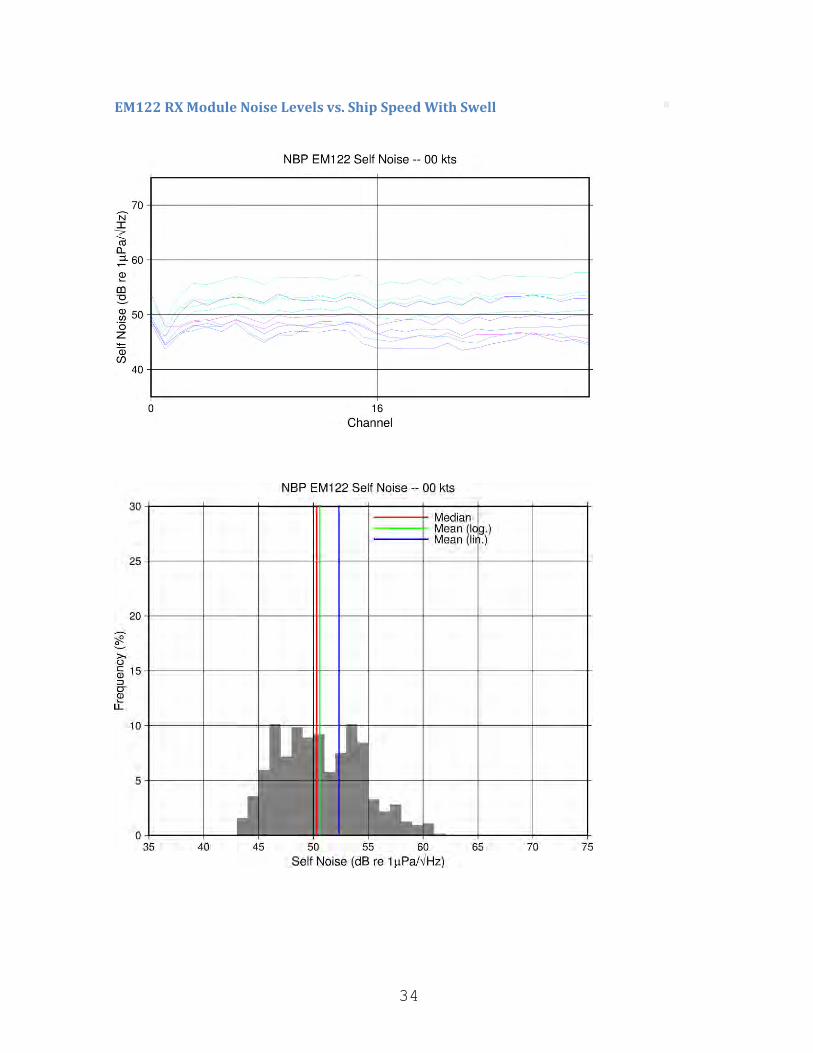
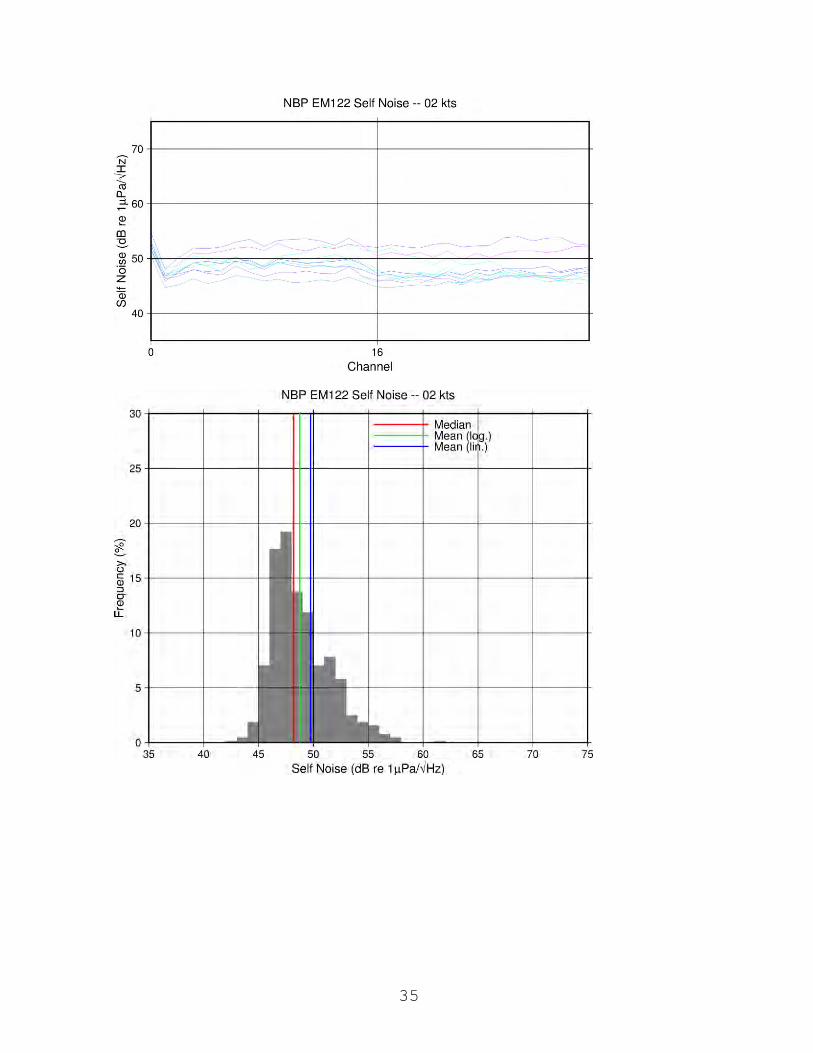
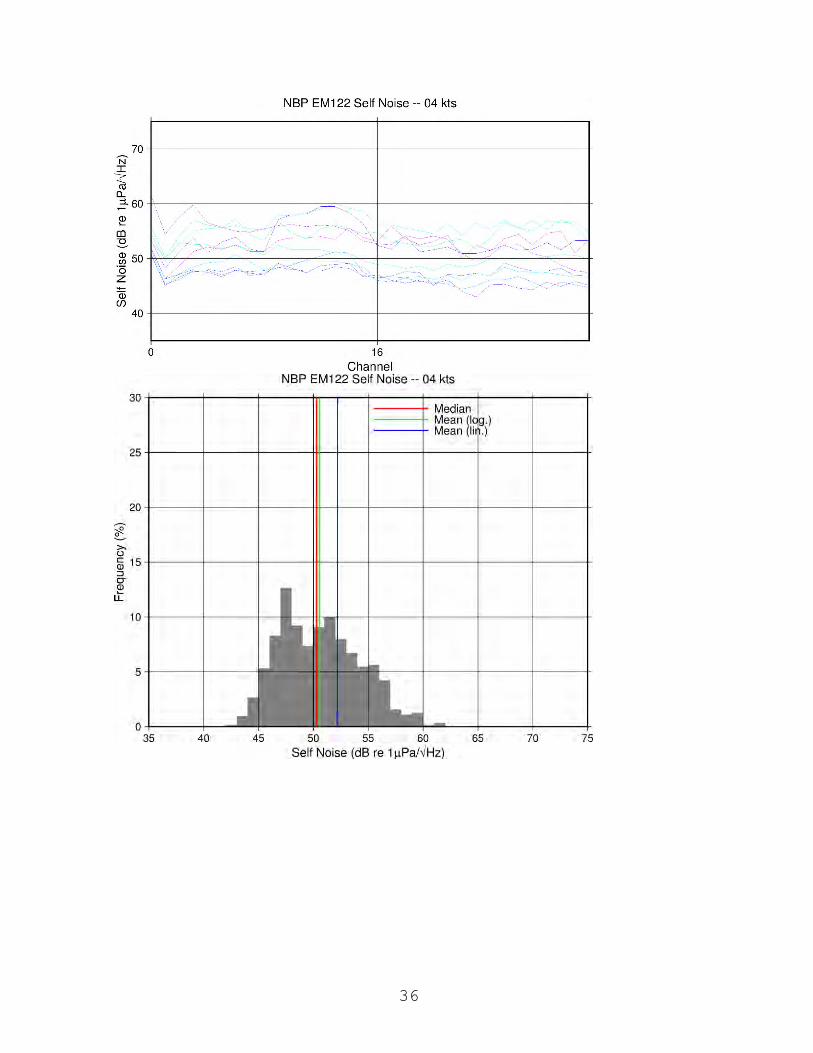
To assess vessel noise at the transducers, measurements were made at the receiver while the
vessel operated at a variety of speeds and headings relative to the swell. Speed-dependent self-
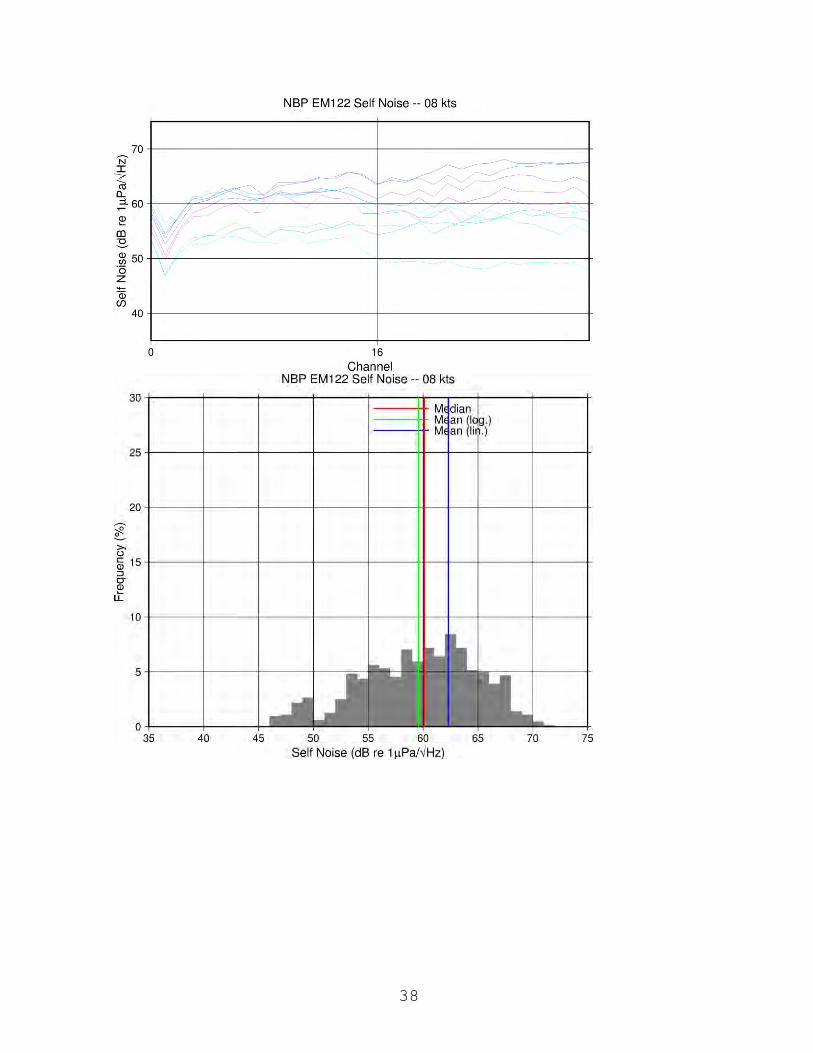
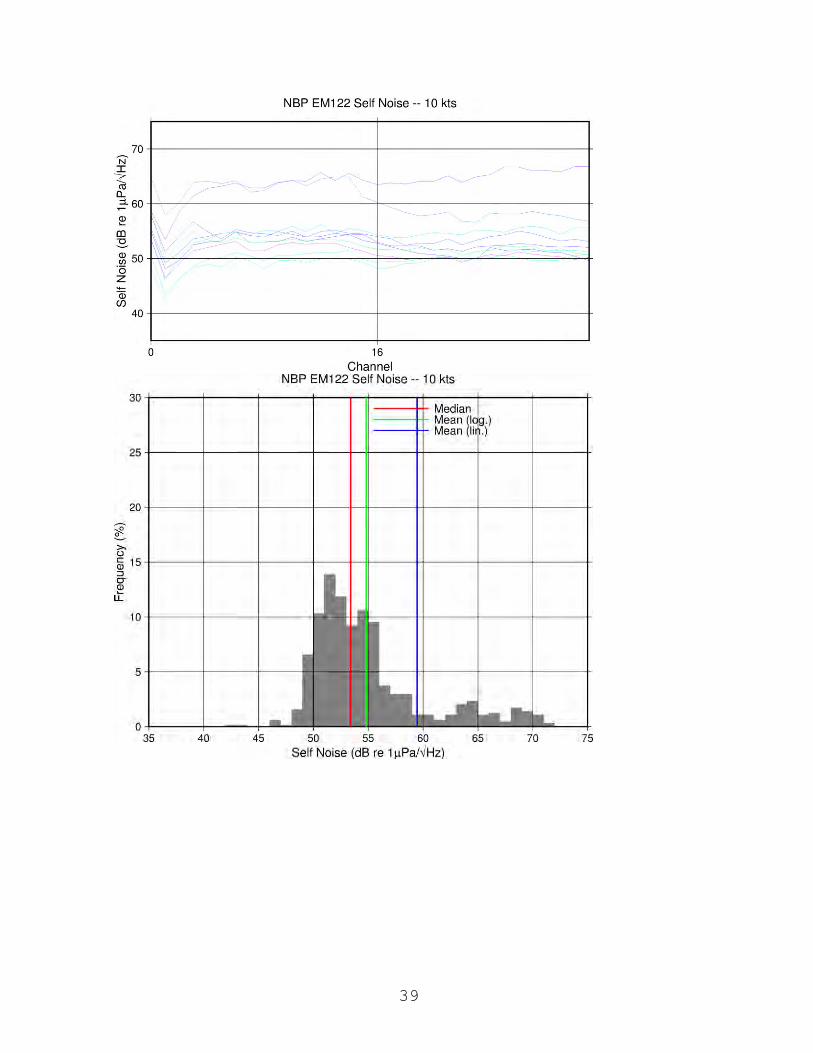
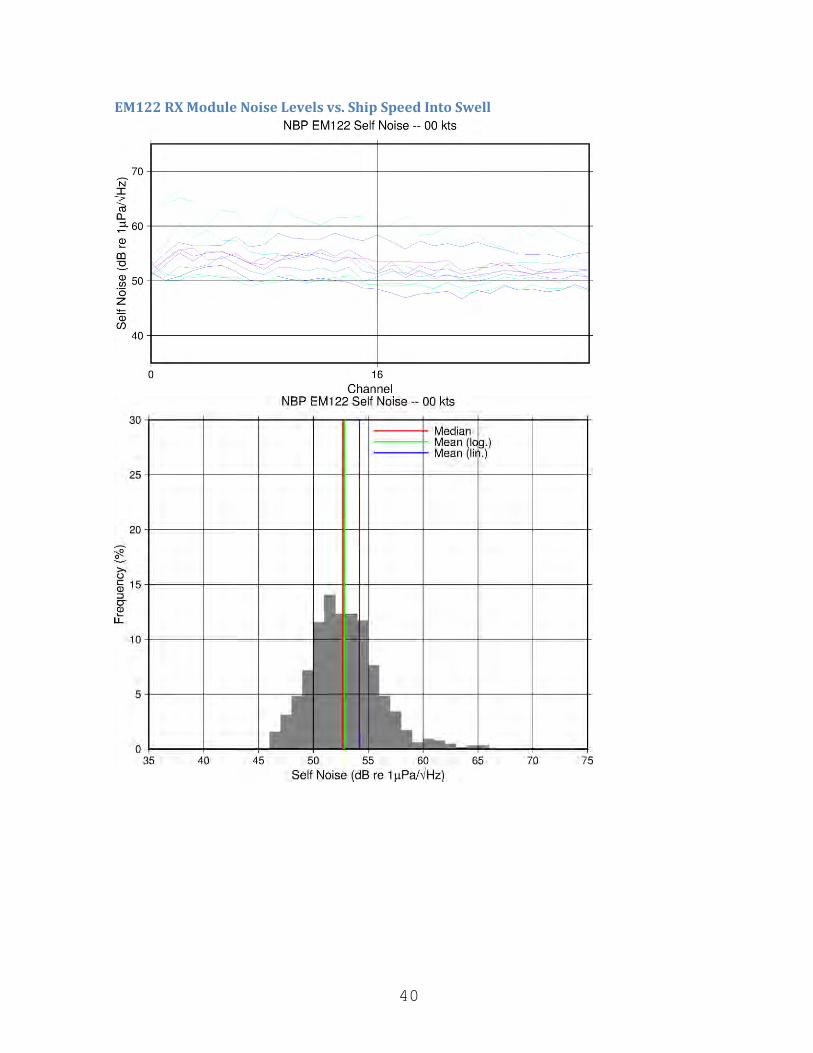
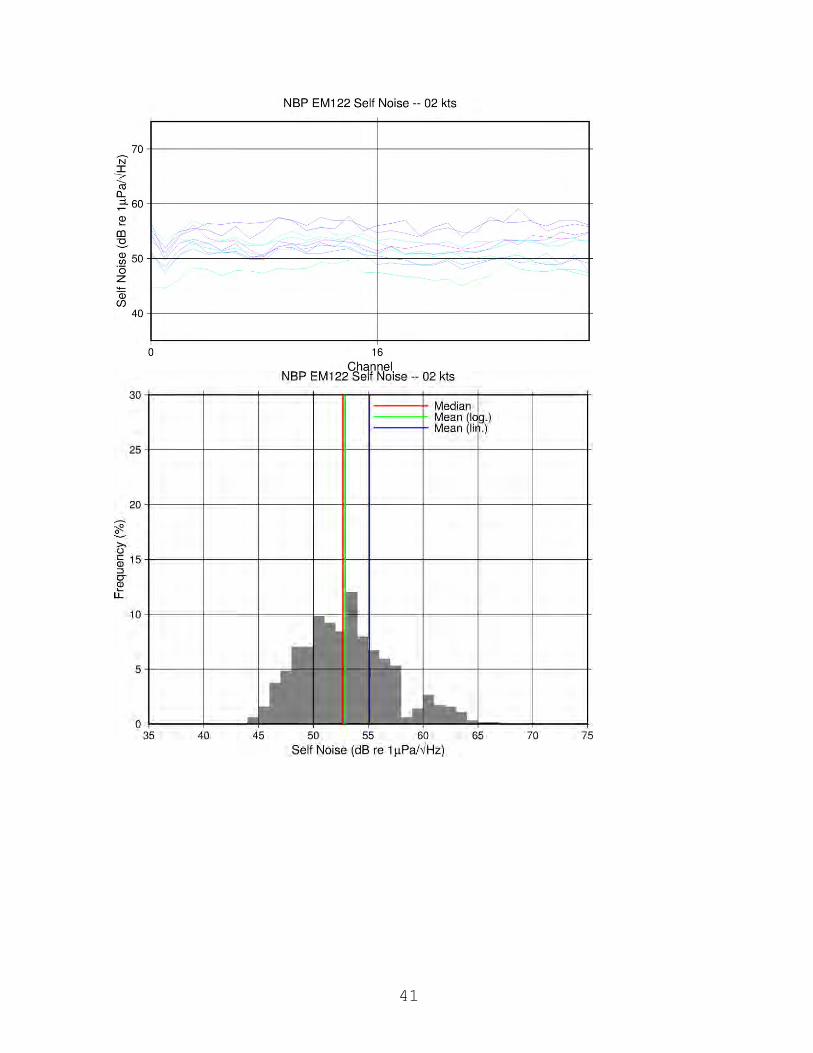
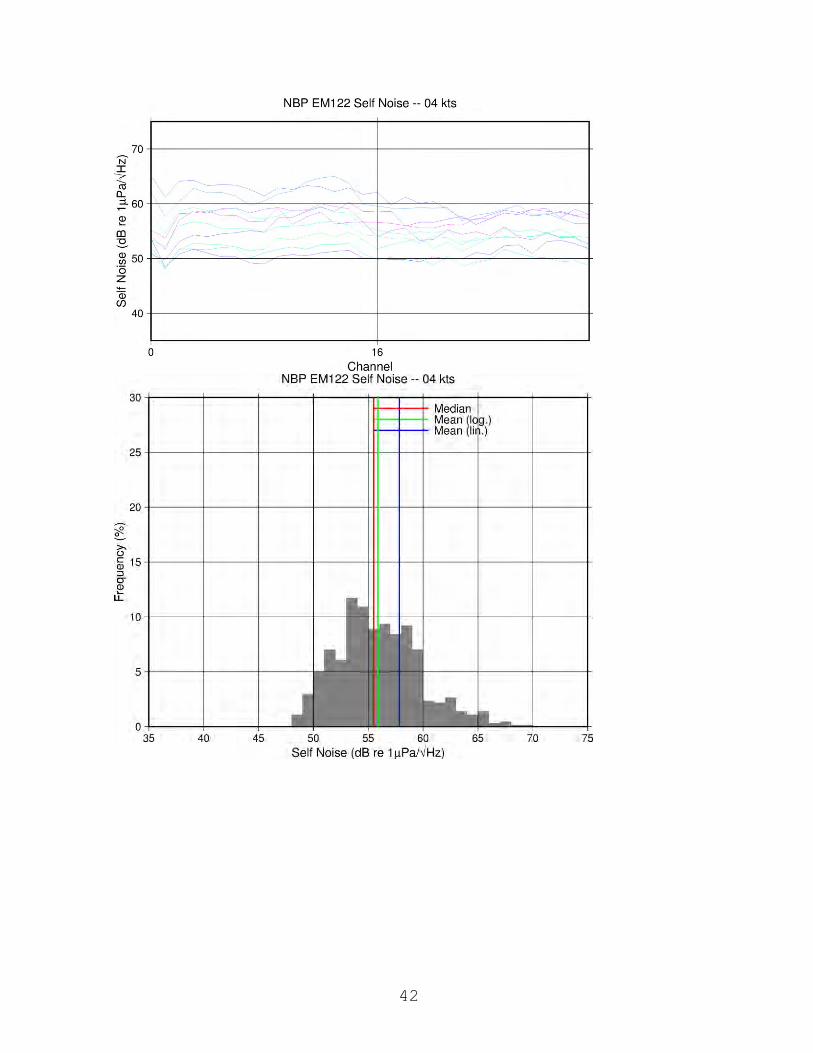
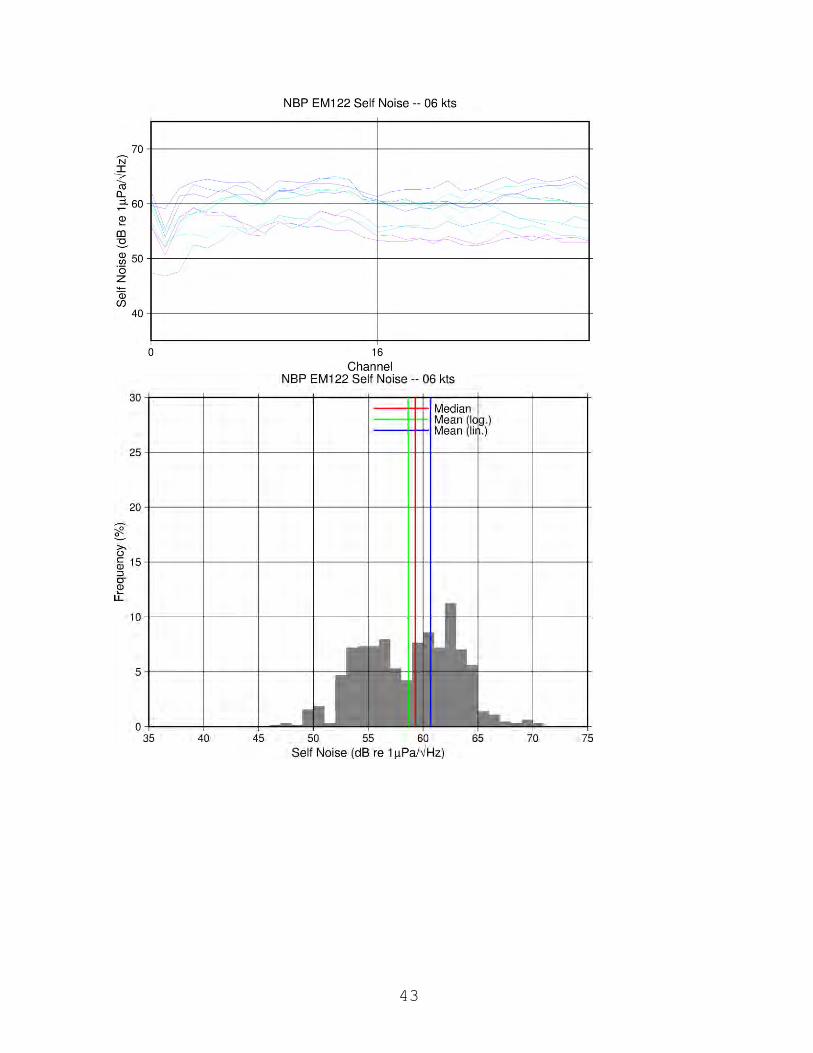
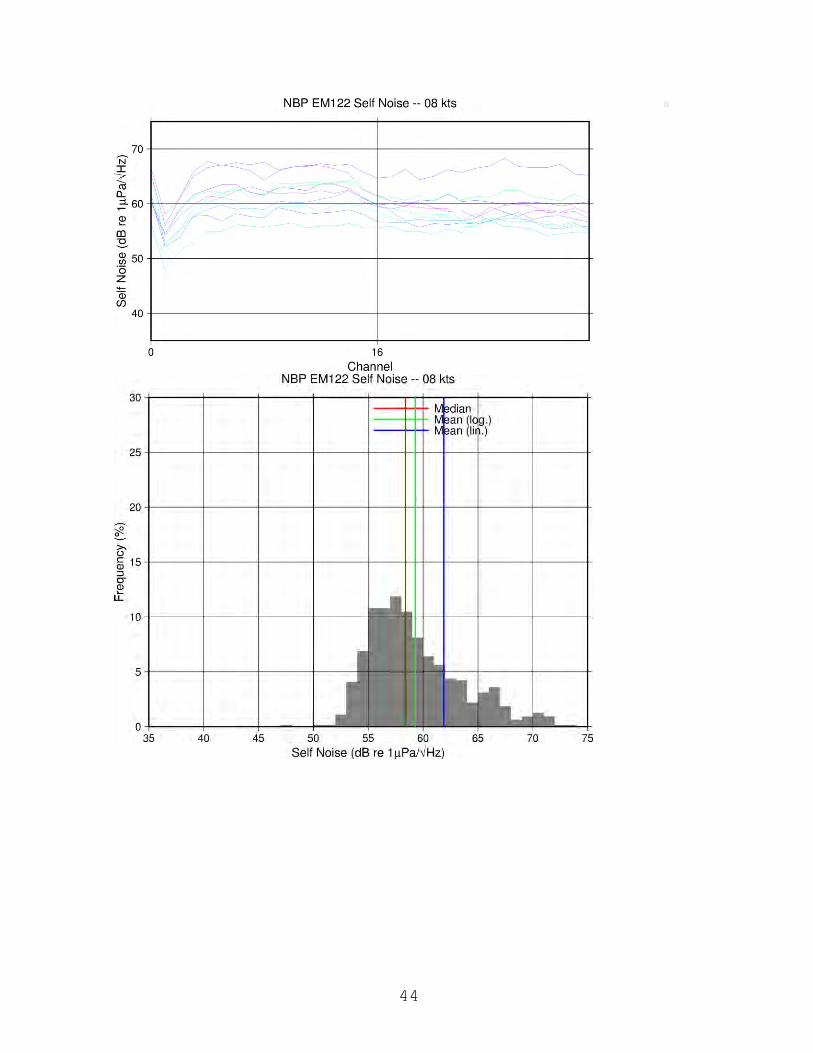
noise was measured at 0-8 kts while heading into a 3-m swell (Figure 16 - 17) and then measured
at 3-12 kts while heading with the swell (Figure 18- 19). These plots generally show increasing
self-noise with increased speed, excepting in the case of 10 kts with the swell. The mean trends
between 53-58 dB agree fairly well with 2014 Gates Acoustic Services data, suggesting no
significant changes in the 12-kHz acoustic signature of the ship since NBP1405.
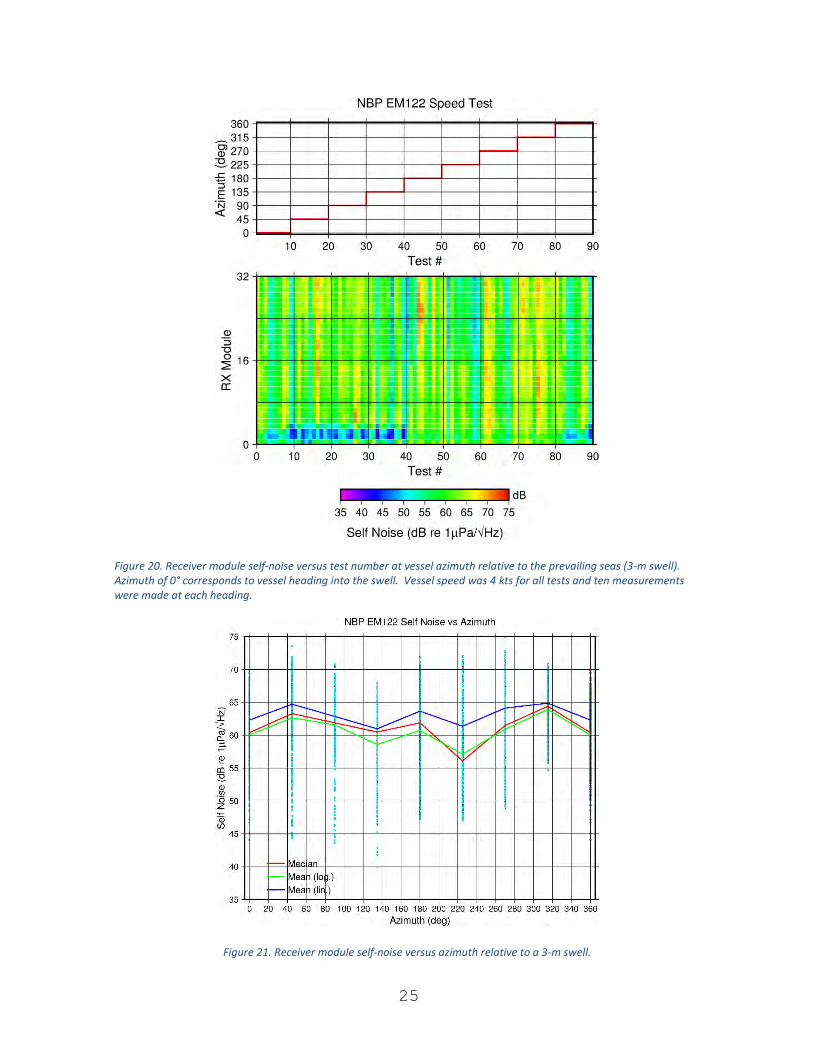
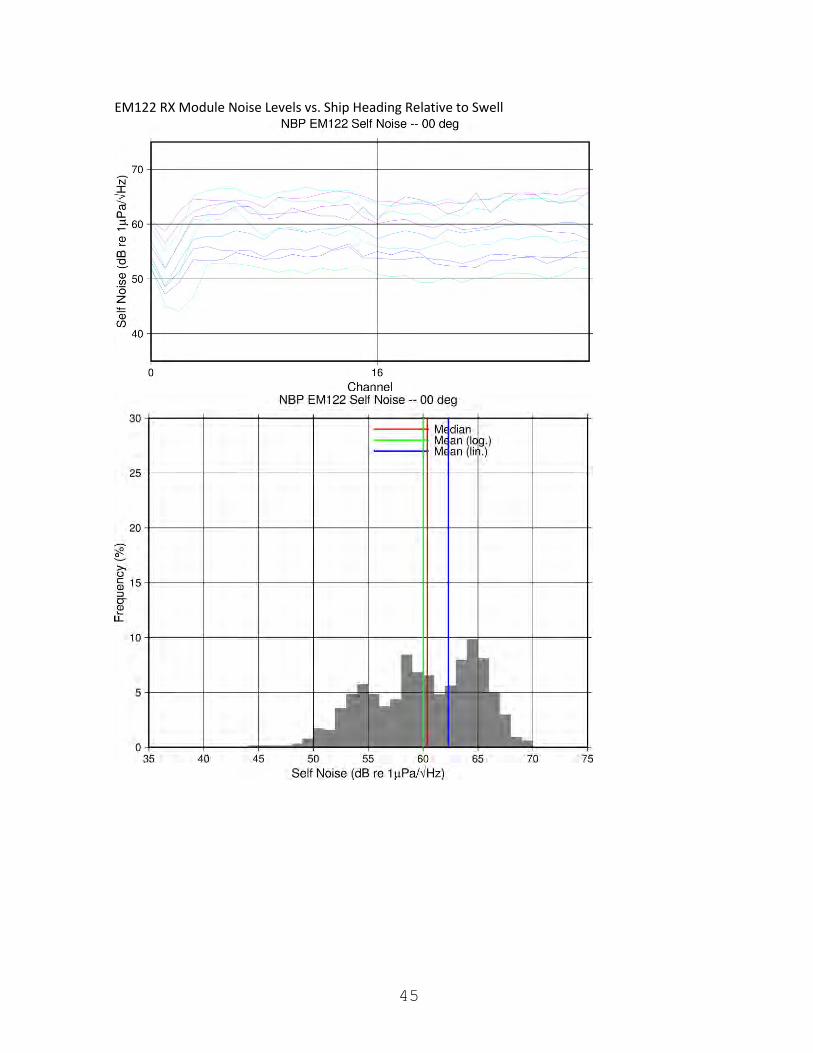
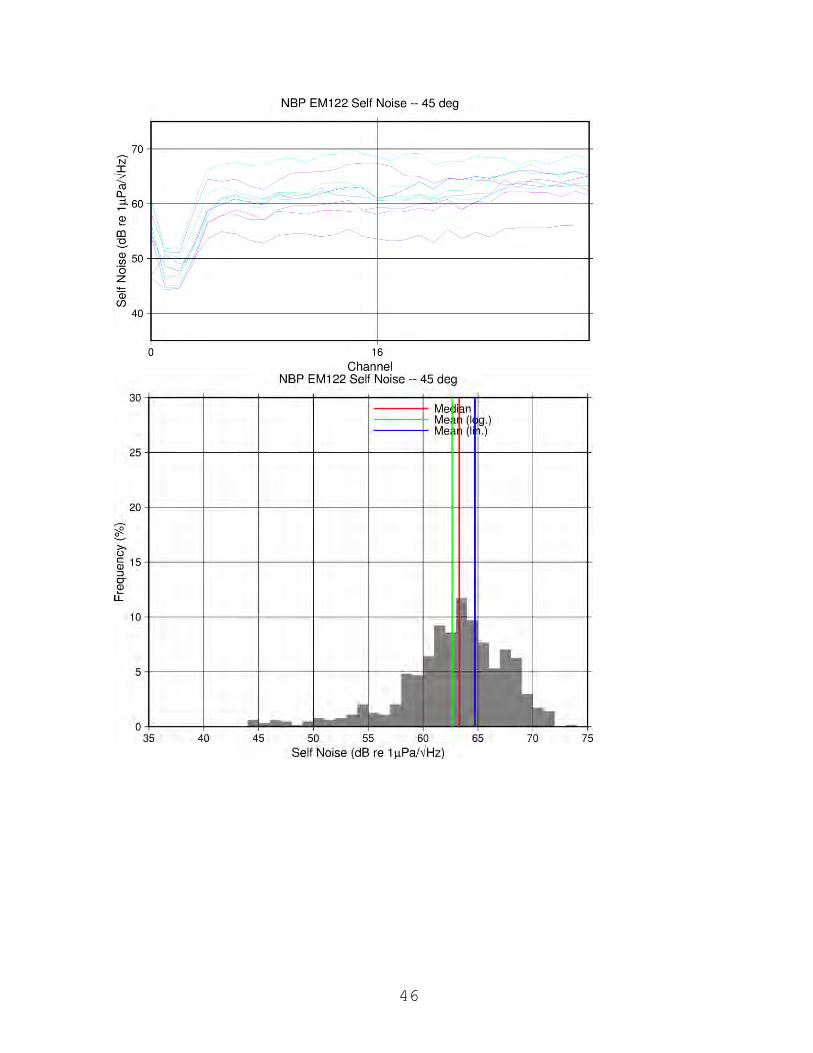
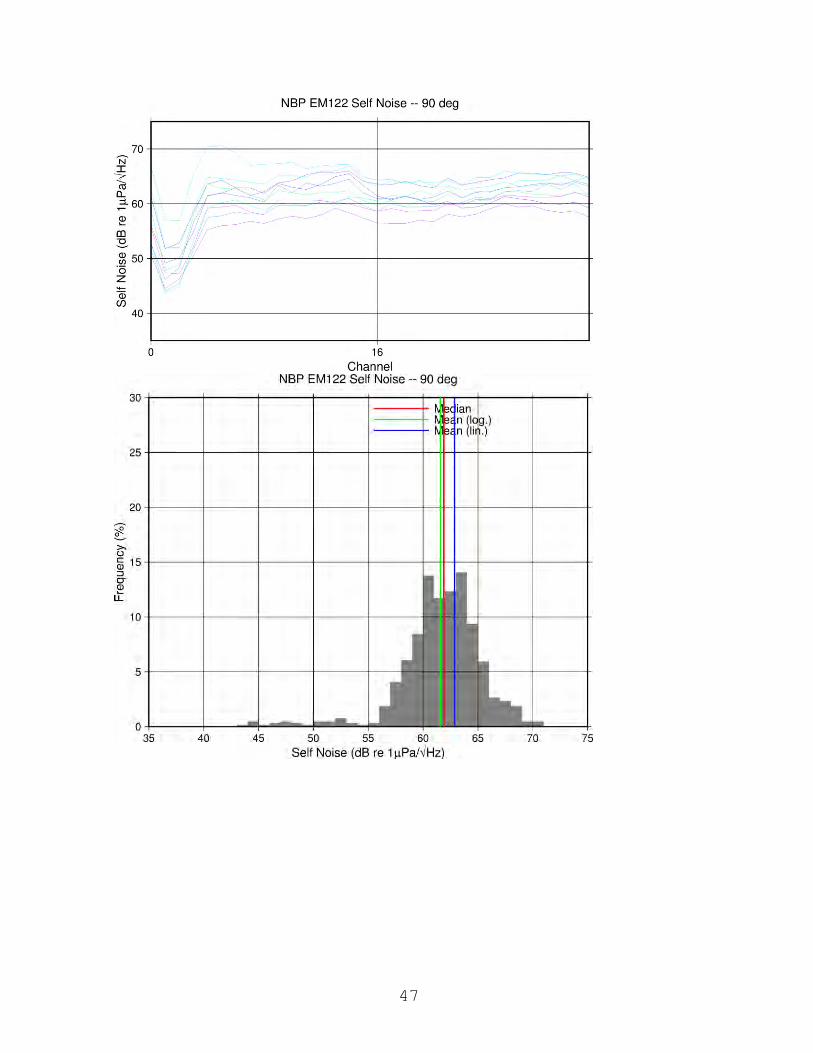
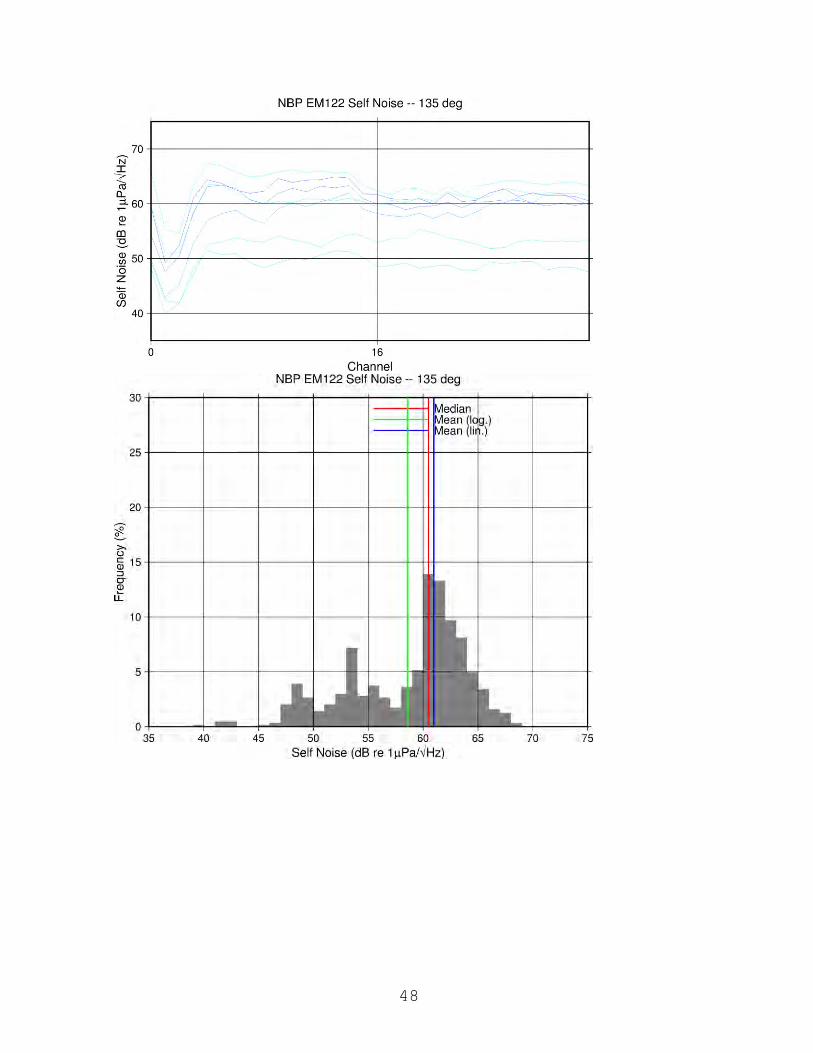
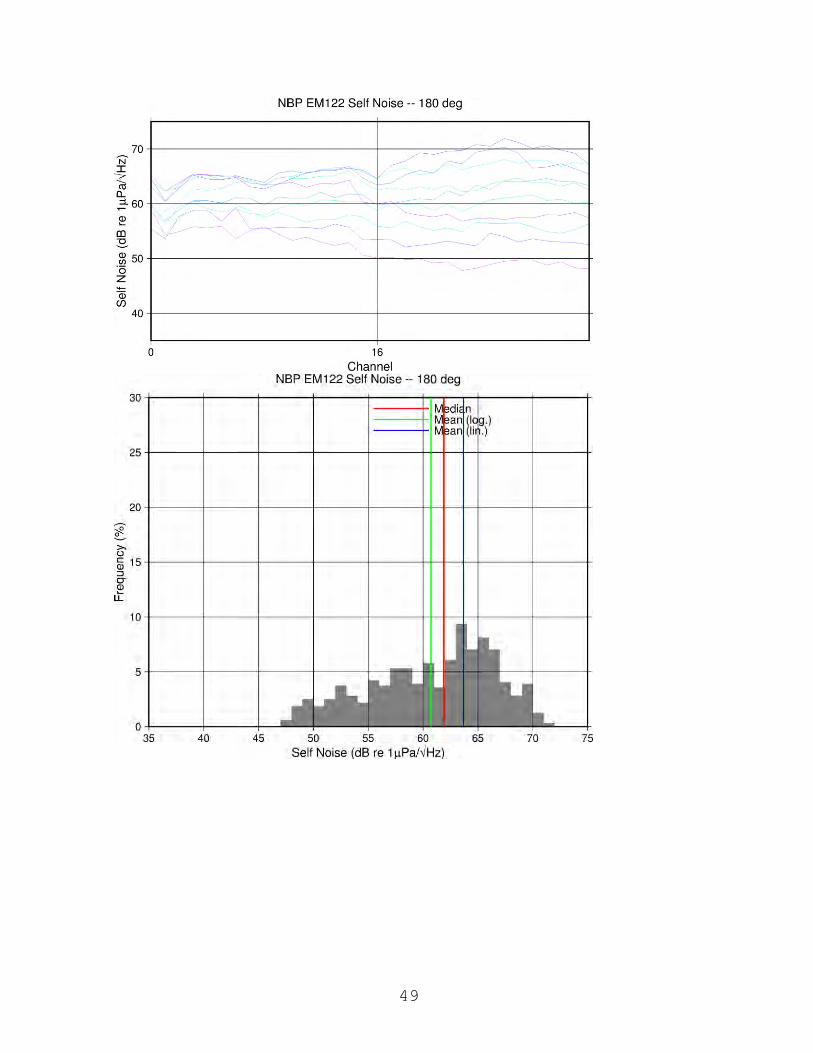
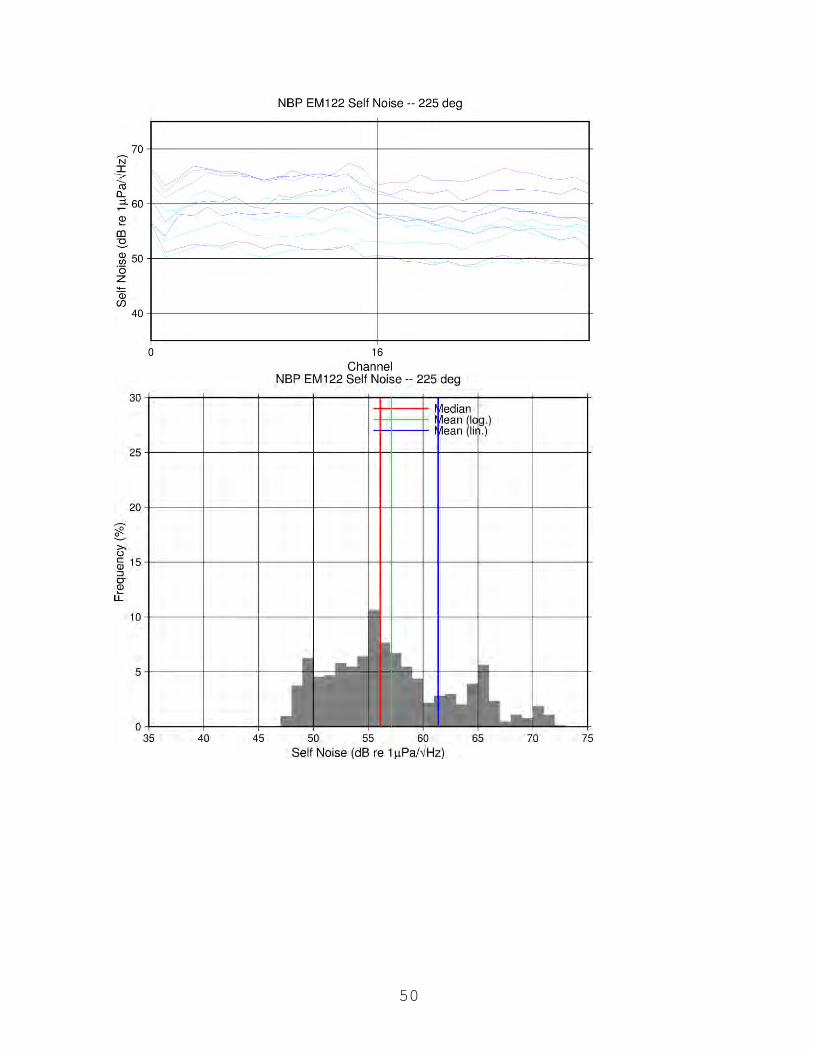
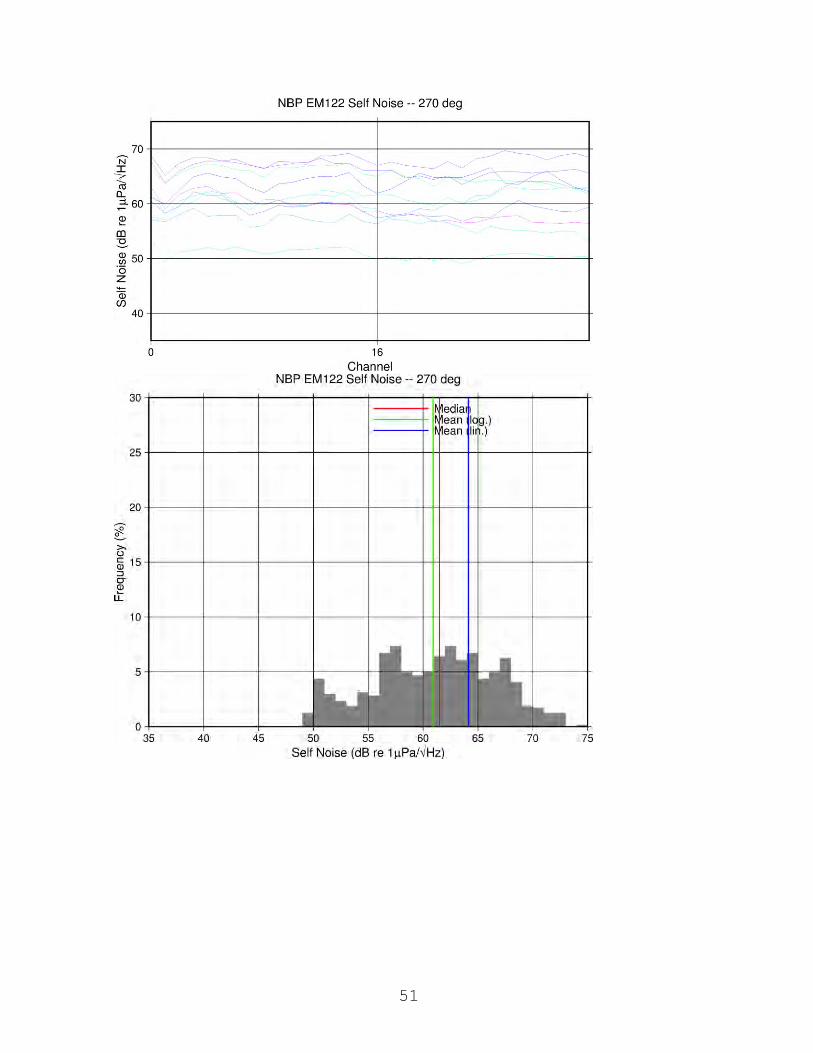
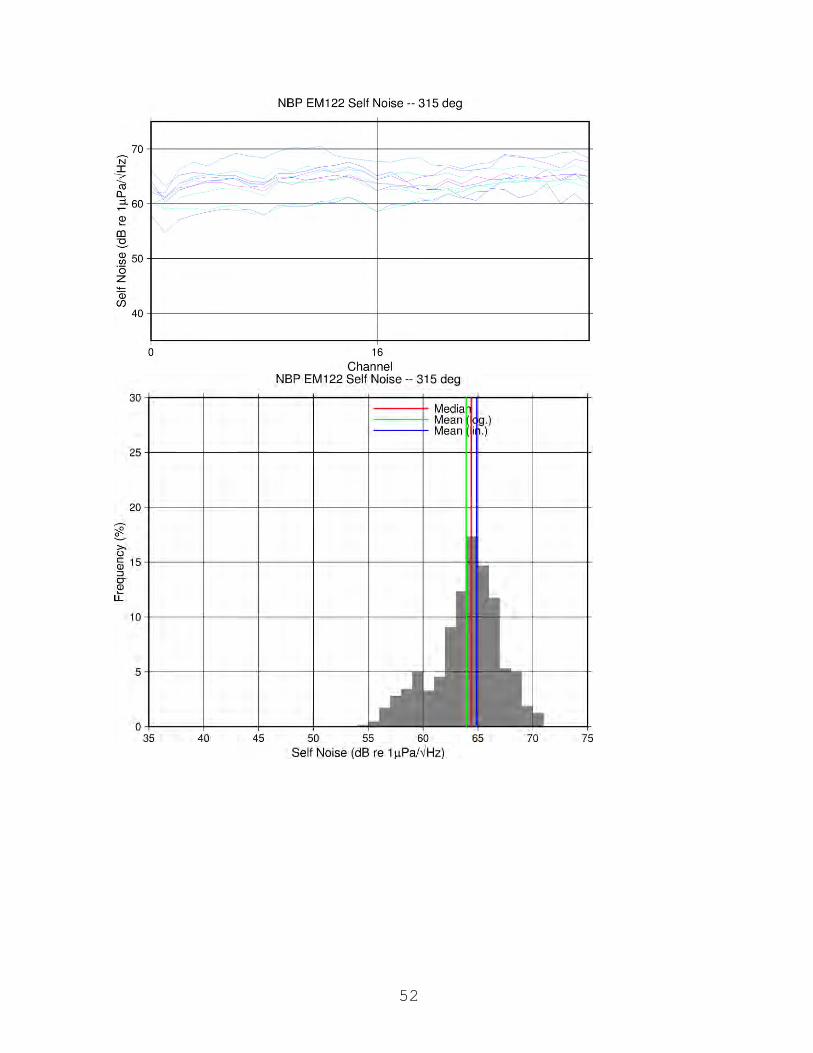
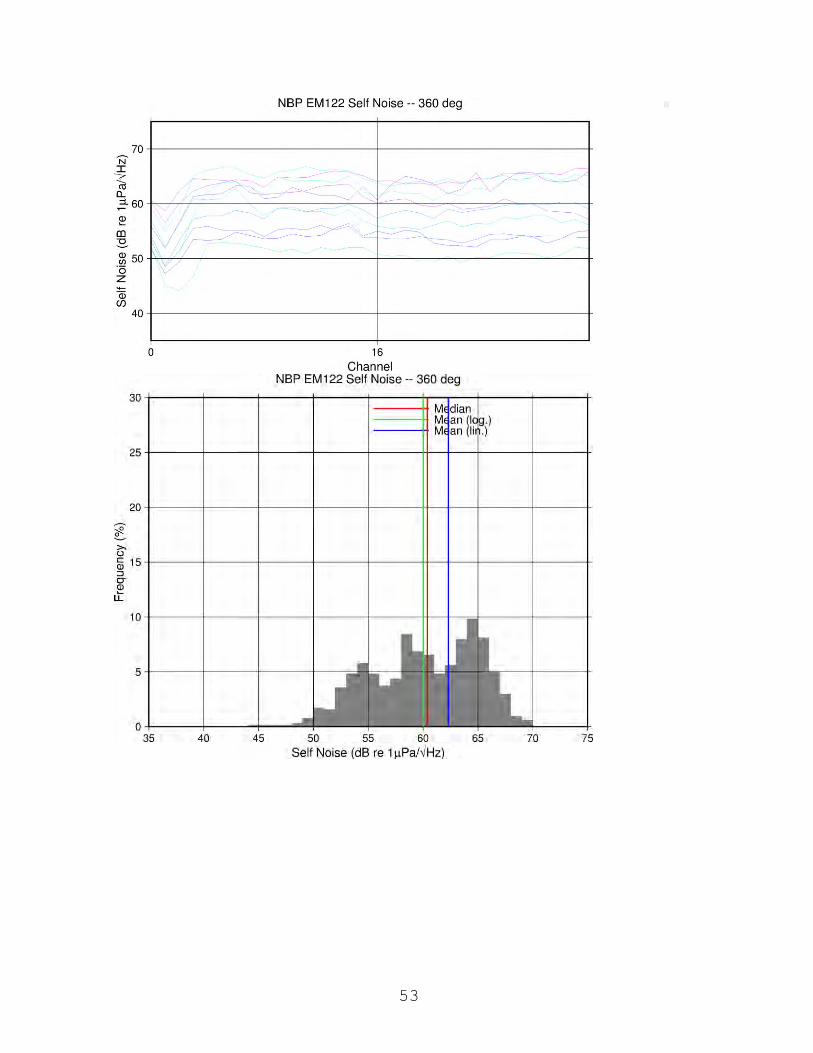
The sustained 3-m swell from the southwest (225°) facilitated measurement of vessel self-noise
versus azimuth relative to prevailing seas. Receiver noise was measured in eight directions
separated by 45° while the vessel transited at 4 kts (Figure 20 - 21). Ten measurements were
made at each azimuth and 0° azimuth corresponds to heading into the swell (generally upwind)
The results of this testing show the somewhat unexpected results of reduced noise heading with
the swell on the rear starboard quarter (swell from 135° relative to the ship, or ship heading 225°
relative to the swell direction). Though primary swell direction was from 225°, other swell
patterns were observed from a variety of directions which may complicate this analysis. During
this data collection period, almost all vessel self-noise values exceeded 60 dB; this is higher than
observed during the speed tests and reflect the combination of elevated sea state with vessel self-
noise. Plots of vessel self-noise measured at each speed are available in the Appendix.
23
Figure 16. Receiver module self-noise versus test number at vessel speeds of 0-8 kts while heading into a 3-m swell. Ten test measurements were made at each speed.
Figure 17. Receiver module self-noise versus speed while heading into a 3-m swell.
24
Figure 18. Receiver module self-noise versus test number at vessel speeds of 0-10 kts while heading with a 3-m swell. Ten test measurements were made at each speed.
Figure 19. Receiver module self-noise versus speed while heading with a 3-m swell.
25
Figure 20. Receiver module self-noise versus test number at vessel azimuth relative to the prevailing seas (3-m swell). Azimuth of 0° corresponds to vessel heading into the swell. Vessel speed was 4 kts for all tests and ten measurements were made at each heading.
Figure 21. Receiver module self-noise versus azimuth relative to a 3-m swell.
26
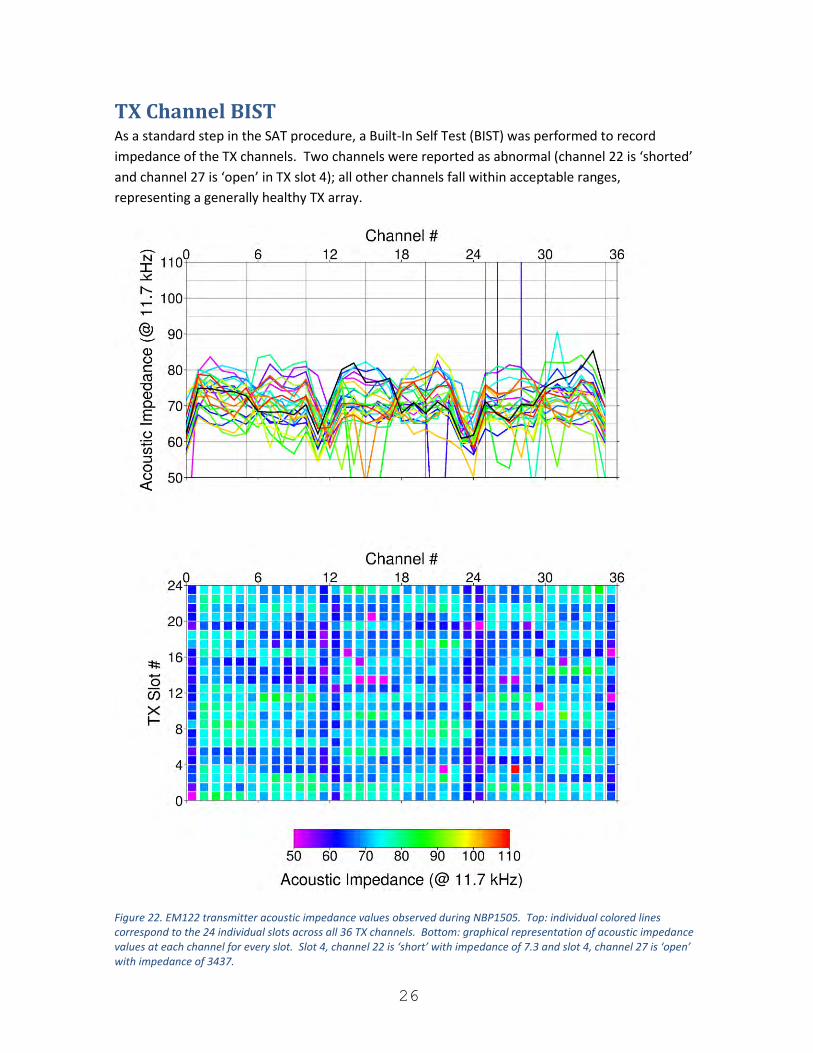
TX Channel BIST As a standard step in the SAT procedure, a Built-In Self Test (BIST) was performed to record
impedance of the TX channels. Two channels were reported as abnormal (channel 22 is ‘shorted’
and channel 27 is ‘open’ in TX slot 4); all other channels fall within acceptable ranges,
representing a generally healthy TX array.
Figure 22. EM122 transmitter acoustic impedance values observed during NBP1505. Top: individual colored lines correspond to the 24 individual slots across all 36 TX channels. Bottom: graphical representation of acoustic impedance values at each channel for every slot. Slot 4, channel 22 is ‘short’ with impedance of 7.3 and slot 4, channel 27 is ‘open’ with impedance of 3437.
27
Summary, Recommendations, and Observations 1. System Geometry and Patch Test
a. Both Kongsberg Maritime and the Multibeam Advisory Committee independently
determined offset and angle values through a full review of the vessel layout
documentation and patch test.
b. The static angular offsets (pitch, roll, and heading) for the MRU (Seapath2)
determined by the patch test are applicable for the current configuration based
on the preliminary survey results obtained at the start of NBP1505. Following
completion of NBP1505, a final report was received which clarified inconsistent
labeling of array angular offsets in the preliminary report. These final offsets
should not be applied in SIS until a new patch test is conducted.
c. It is highly recommended that the ship move to a single reference frame for all
sensors affecting the MBES. Based on the 2015 Talcahuano survey, the offsets
that should be applied for the arrays, MRUs, and antennas in each candidate
reference frame are available in the Appendix. This step should be taken when a
new patch test is conducted to verify successful migration of all offsets to a
common reference frame onboard the NBP.
d. The spare MRU (Seapath1) should have static angular offset values determined
for it by conducting a patch test when time is available. After patch testing, the
spare MRU would be available for immediate service to the EM122 in the event of
primary MRU failure; this step could prevent a significant and unpredictable
interruption to a future mapping cruise.
2. Accuracy
a. Sea state conditions precluded collection of a satisfactory dataset for accurately assessing system accuracy. However, the systemic artifacts observed during NBP1405 appear to have been eliminated with the new TX and RX arrays.
b. The depth standard deviation as a percentage of water depth is above 0.2% over a majority of the swath. This is higher than would be expected from a typical EM122 system, but likely a consequence of the sea state during NBP1505 and the system’s susceptibility to bubble sweep.
c. Data collected during the NBP1505 reference area readily achieved swath widths of +/-60° before sea state deteriorated. This represents a noticeable improvement compared to NBP1405 reference surface data collection in similar water depths.
28
3. Coverage Assessment a. Data collected early in NBP1505, during periods of low sea state and
advantageous swell direction relative to the ship, suggest reasonably satisfactory swath coverage. Additional data should be collected with no swath width limitation in SIS to further evaluate the swath coverage achieved with the new EM122 arrays. The MAC is more than willing to evaluate any data collected during transits or future survey missions.
b. During periods of calm seas, the returned signal strengths for outer beams were observed to exceed those during NBP1405, suggesting greatly increased transmitted power. This is also suggested by ‘punch-through’ at nadir, which was not readily observed during NBP1405.
4. Hardware a. Additional BISTS should be performed, ideally at least once per cruise, in order to
monitor transducer health over the lifetime of the arrays.
b. The ambiguity regarding FM transmission capability MUST be resolved by KM personnel. The MAC is deeply interested in this issue and more than willing to assist with this effort.
References 1. Beaudoin, J. (2012a). “SVP Editor Software Manual”, v1.0.3. Available online at:
http://mac.unols.org/sites/mac.unols.org/files/SVP_Editor_Manual_v1.0.3.pdf
2. Beaudoin, J. (2012b). R/V Kilo Moana Multibeam Echosounder System Review. Multibeam Advisory Committee, Sea Acceptance Team. Report, 27 pp. Available online at: http://mac.unols.org/sites/mac.unols.org/files/20120701_Kilo_Moana_SAT_ report-final_0.pdf
3. Caress, D. W., and Chayes, D. N. (2005). “Mapping the seafloor: Software for the processing and display of swath sonar data”. [5.0.6]. Columbia University. USA.
4. Johnson, P.D., and Jerram, K.W. (2014). RVIB Nathaniel B. Palmer EM122 Multibeam Echosounder Sea Acceptance Trials. Multibeam Advisory Committee, Sea Acceptance Team. Report, 23 pp. Available online at: http://mac.unols.org/sites/mac.unols.org/files/20140619_EM122_SAT_NBP1405_Final_NSF.pdf
29
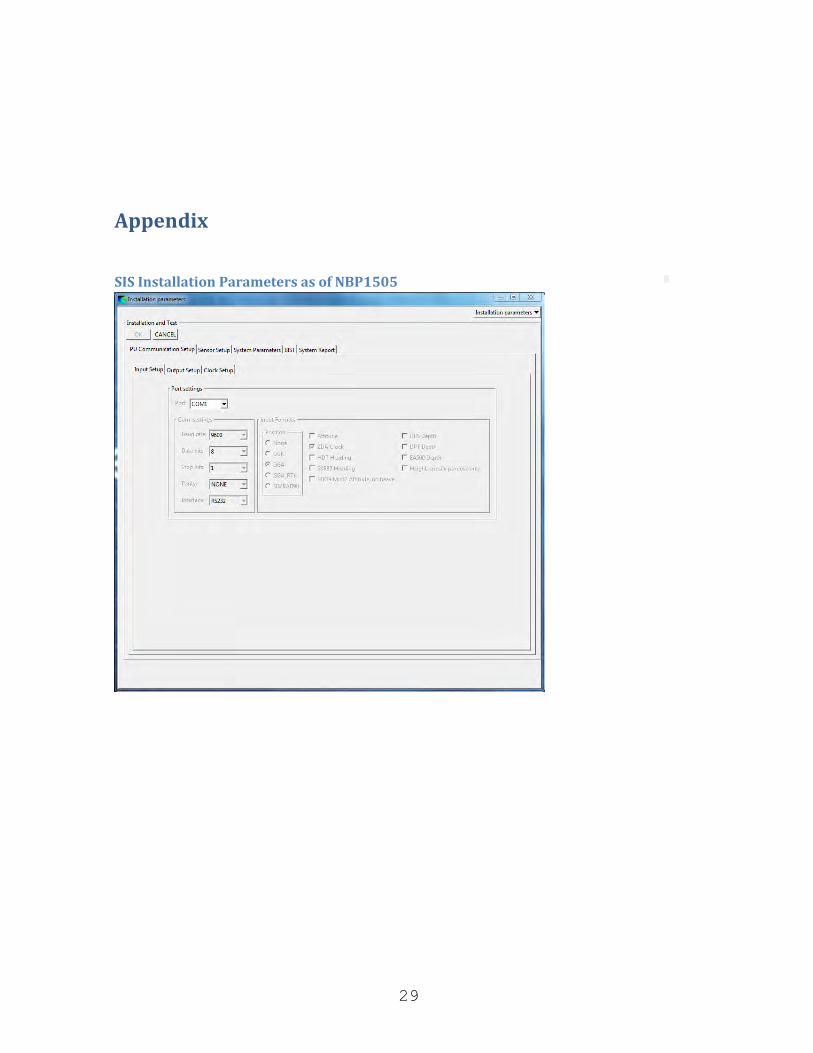
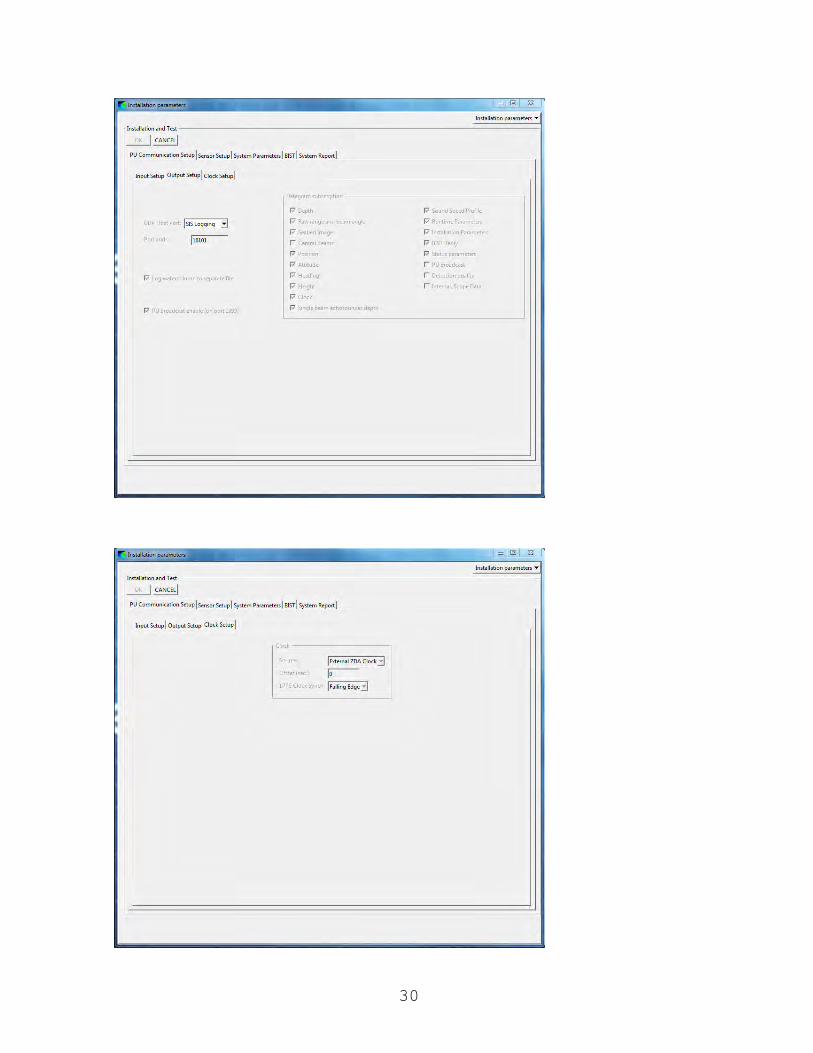
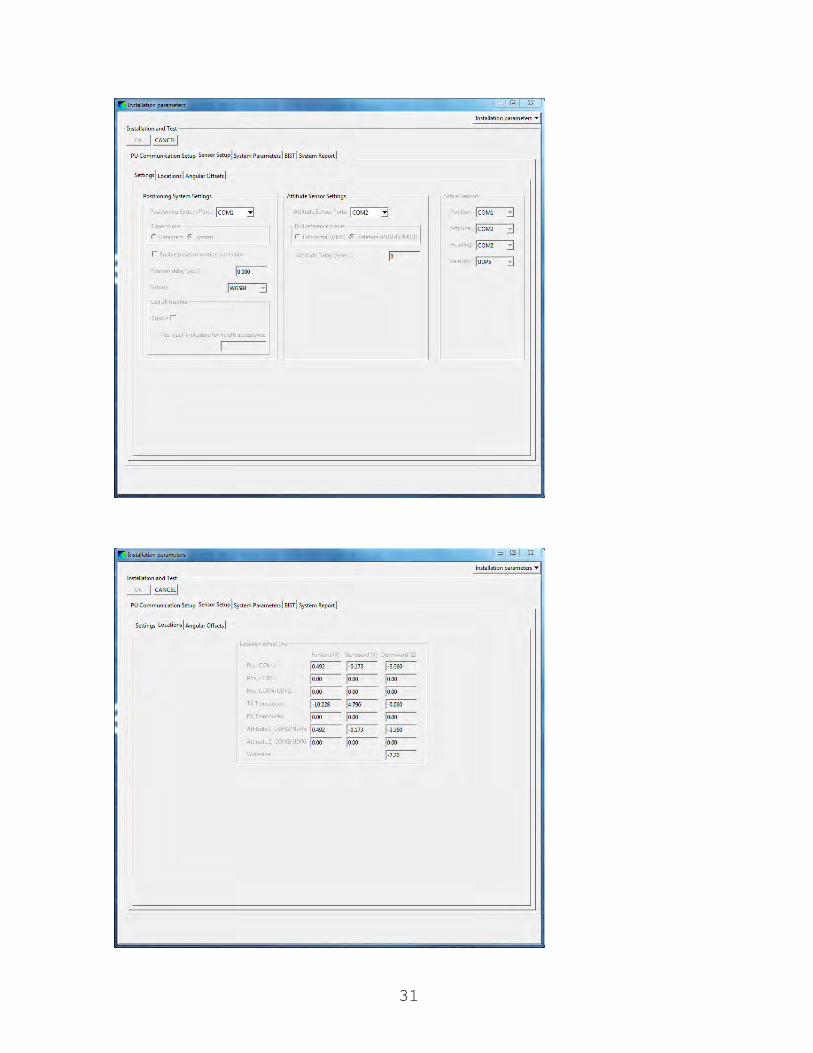
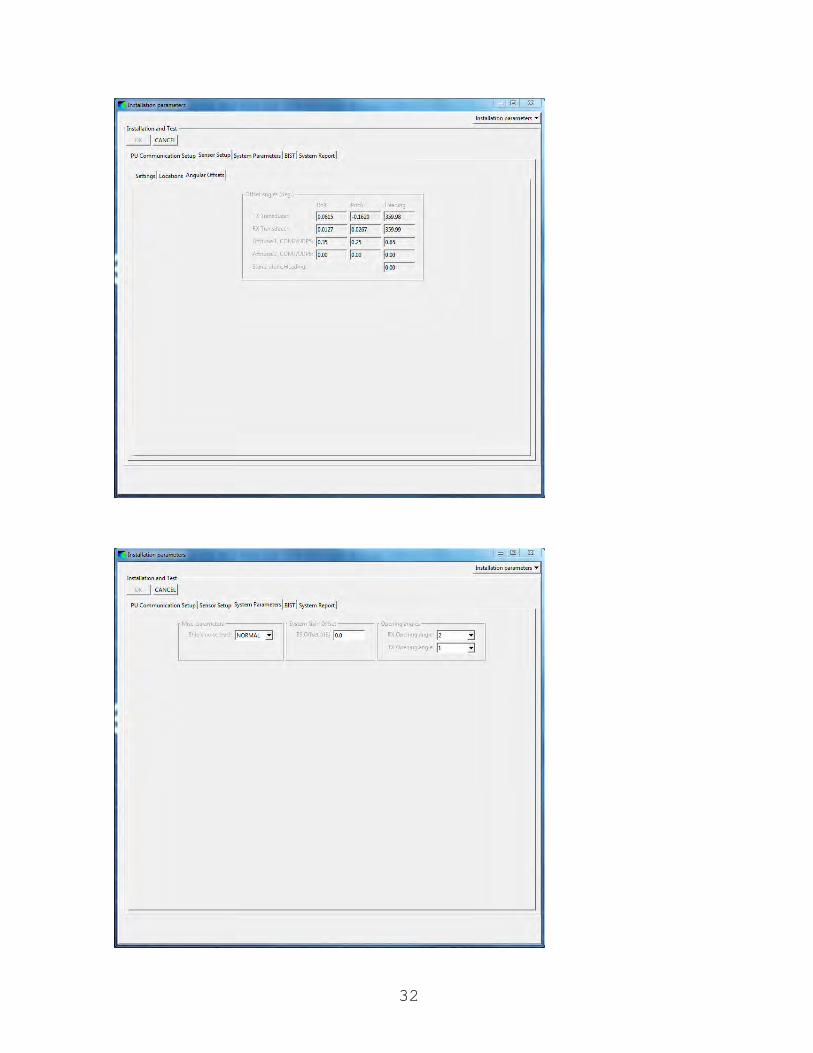
Appendix
SIS Installation Parameters as of NBP1505
30
31
32
33
34
EM122 RX Module Noise Levels vs. Ship Speed With Swell
35
36

37
38
39
40
EM122 RX Module Noise Levels vs. Ship Speed Into Swell
41
42
43
44
45
EM122 RX Module Noise Levels vs. Ship Heading Relative to Swell
46
47
48
49
50
51
52
53
54
Procedure for Unifying SIS and Seapath Reference Frames
The sensor offset survey performed after installation of the EM122 arrays (June 2015 in
Talcahuano) provides an opportunity to unify the reference frames used by SIS and Seapath
software. The present use of multiple reference frames can be challenging for system review and
leaves ample opportunity for introduction of errors during configuration. The unification process
is important for greatly simplifying and carefully documenting the configuration of all sensors
affecting the EM122 and can be completed with no material impact to existing data feeds from
the Seapath. See the 2015 MAC EM122 SAT report for additional discussion of the reference
frames in use through NBP1505. Unification of the SIS and Seapath configurations in a common
reference frame (CRF) involves several steps outlined below. In all cases, the axis and sign
conventions for linear and angular offsets adhere to the Kongsberg standards, meaning the values
included below may be entered directly into SIS and Seapath software.
NOTE: a geometric calibration (patch test) must be completed after CRF implementation.
1. Select the origin of the common reference frame (CRF).
a. Option 1: Center of RX Array Face (EXISTING SIS CONFIGURATION)
i. Historical surveys and the 2015 Talcahuano survey used the center of the
RX array face as the origin for the primary reference frame. This origin
was used for SIS configuration through NBP1505 and lends itself to direct
application of existing surveys. However, this arrangement is not typical
among other vessels with Kongsberg multibeam systems, partly due to
software challenges during refraction correction in post-processing.
b. Option 2: Center of TX Array Face (HIGHLY RECOMMENDED)
i. The conventional configuration aboard other vessels with Kongsberg
multibeam systems is to place the origin of the reference frame at the
center of the TX array face. This agrees with Kongsberg conventions and
enables proper refraction correction, if necessary, in post-processing.
c. Option 3: Navigation Ref. Point / ‘Center of Gravity’ (NOT RECOMMENDED)
i. A secondary reference frame was included in surveys performed in 2013
(during Seapath 330 installation) and 2015 (during EM122 array
installation). This secondary reference frame has its origin at the
Navigation Reference Point (NRP) used for Seapath configuration, which is
coincident with a ‘Center of Gravity’ (CG) reference point described in
previous surveys. This option is acknowledged here, but is not
recommended for the CRF and is not presented in the table below.
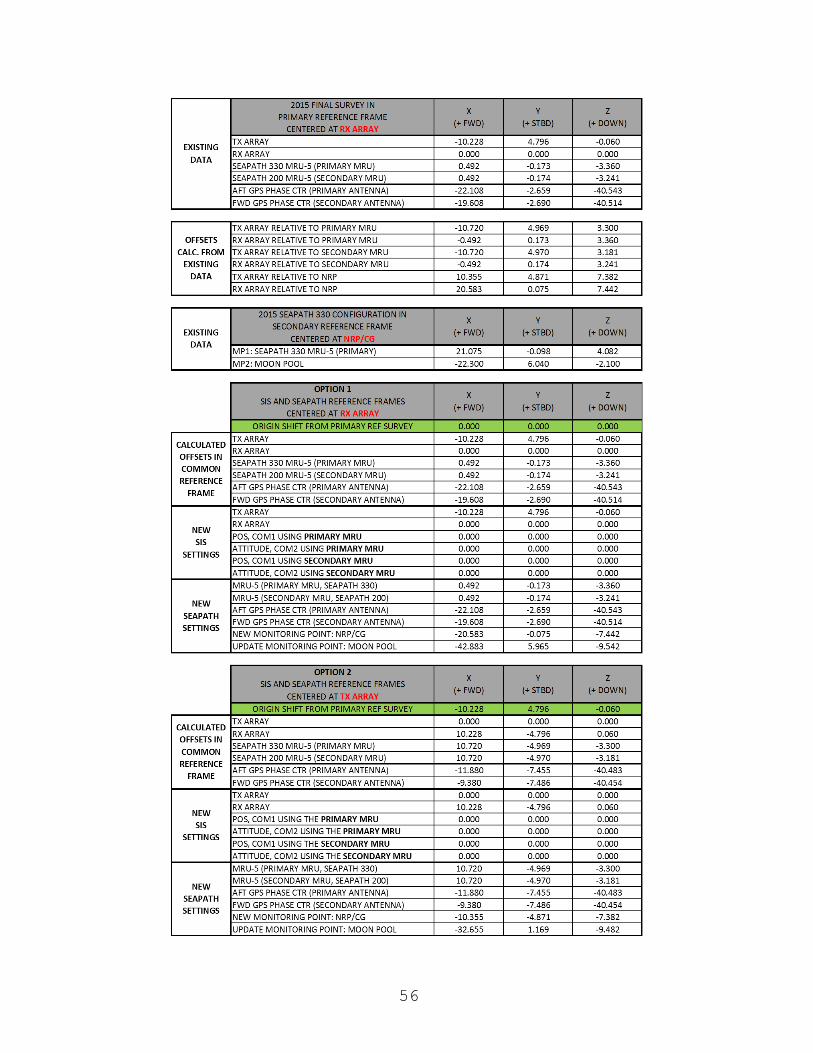
2. Confirm SIS and Seapath offsets in the CRF
a. Examine the table below for the selected CRF option. While these results have
been thoroughly checked by the MAC, it is recommended that sensor offsets in
the selected reference frame be independently verified (e.g., by sketching out the
sensor locations and spot-checking the results) to increase confidence in the
offsets among the users of the Seapath systems and EM122.
55
3. Document, modify, and document the SIS and Seapath configurations
a. Ensure that all pre- and post-modification settings are completely documented in
screenshots and backed up in case configurations must be reverted.
b. Update SIS Installation Parameters to reflect the table for the CRF selected
i. Note that MRU angular offsets may be set to zero in preparation for the
new patch test with the final TX and RX angular offsets applied; see patch
test step.
c. Update Seapath 200 and 330 configurations to reflect the table for the CRF
i. MRUs
ii. Antennas
iii. Update output telegrams sent to the EM122 to reflect the new origin
(deselect MP1)
1. TelegramOut3: attitude velocity to EM122
2. TelegramOut4: position output to EM122
3. TelegramOut5: attitude output to EM122
iv. Delete Monitoring Point MP1 (MRU location)
v. Update Monitoring Point MP2 (Moon Pool location) with offsets from
table above
vi. Create Monitoring Point for the NRP/CG using offsets from table above
and select this MP for all output telegrams requiring data at this location
1. TelegramOut6: SEAP 330 to BBox to AIS
2. TelegramOut7: SEAP 330 to RVDAS (CG)
3. TelegramOut10: SEAP 330 to Serial Panel
4. Perform a patch test with final array angular offsets and new CRF configurations
a. Update the TX and RX array angular offsets in SIS to reflect the table (based on
the FINAL 2015 Talcahuano survey report, ‘NBP REPORT-FINAL 6-26-15’). See
2015 EM122 SAT report for discussion of the array angular offsets during the
NBP1505 patch test and discrepancies from the table below.
b. Because the 2015 Talcahuano survey states the angular offsets of the MRU
bracket rather than the MRU sensors directly, it may be appropriate to set all
MRU angular offsets to zero in both SIS and Seapath software (for the MRU being
used during the patch test). The MRU angular offsets resulting from the patch
test will then better reflect the true angular offsets of the MRU in service and may
then be applied in the Seapath software to more directly correct all attitude data
provided by the Seapath. Under this scheme, the MRU angular offsets in SIS will
remain zero, as the MRU data will be corrected by the Seapath using these
calibration results.
5. Please contact the MAC if there are any questions regarding this conversion
56
Related Documents