African Development Review, Vol. 22, No. 1, 2010, 92–114 Rural Poverty Dynamics and Impact of Intervention Programs upon Chronic and Transitory Poverty in Northern Ethiopia ∗ Fredu Nega, Erik Mathijs, Jozef Deckers, Mitiku Haile, Jan Nyssen and Eric Tollens ∗∗ Abstract : Using a three-year panel data set of rural households in the Tigray region of northern Ethiopia, we examine the dynamics of poverty and the impact of two intervention measures—the food for work (FFW) and the food security package (FSP) programs—upon poverty by disaggregating total poverty into its transient and chronic components. Poverty in the region is predominantly chronic. Results of matching estimators indicate that the FSP program has a significant negative effect on total and chronic poverty, but not on transient poverty. Households involved in the program have on average lower levels of total and chronic poverty than households not involved in the program. The FFW on the other hand does not significantly influence any of the three forms of poverty. Tertile regressions, however, reveal that the FFW benefits households in the richest and the middle tertiles. 1. Introduction Conventional poverty profile and poverty status measures provide useful information on the level of poverty, characteristics of the poor and the poverty correlates thereof. This, however, is not sufficient to combat poverty, partly because the correlates of poverty profiles are different from the dynamic process that determines a household’s movements into and out of poverty. The lack of an inter-temporal dimension in the conventional measure is one of its criticisms and its presence provides a useful insight into what ∗ The authors are grateful for the comments by an anonymous reviewer and to the Flemish Interuniversity Council (VLIR) for funding the research that has been carried out in the framework of the VLIR Institutional Cooperation Program with Mekelle University. ∗∗ Fredu Nega and Mitiku Haile are at Mekelle University, Ethiopia; Erik Mathijs, Jozef Deckers and Eric Tollens are at the Catholic University of Leuven, Belgium; Jan Nyssen is at Ghent University, Belgium. Author to whom correspondence should be addressed: Fredu Nega, Mekelle University, College of Business and Economics, PO Box 451, Mekelle, Ethiopia; e-mail: [email protected] 92 C 2010 The Authors. Journal compilation C 2010 African Development Bank. Published by Blackwell Publishing Ltd, 9600 Garsington Road, Oxford OX4 2DQ, UK and 350 Main Street, Malden, MA 02148, USA.

Welcome message from author
This document is posted to help you gain knowledge. Please leave a comment to let me know what you think about it! Share it to your friends and learn new things together.
Transcript
African Development Review, Vol. 22, No. 1, 2010, 92–114
Rural Poverty Dynamics and Impactof Intervention Programs upon Chronicand Transitory Poverty in Northern Ethiopia∗
Fredu Nega, Erik Mathijs, Jozef Deckers, Mitiku Haile,Jan Nyssen and Eric Tollens∗∗
Abstract: Using a three-year panel data set of rural households in theTigray region of northern Ethiopia, we examine the dynamics of poverty andthe impact of two intervention measures—the food for work (FFW) and thefood security package (FSP) programs—upon poverty by disaggregating totalpoverty into its transient and chronic components. Poverty in the region ispredominantly chronic. Results of matching estimators indicate that the FSPprogram has a significant negative effect on total and chronic poverty, but noton transient poverty. Households involved in the program have on averagelower levels of total and chronic poverty than households not involved in theprogram. The FFW on the other hand does not significantly influence any ofthe three forms of poverty. Tertile regressions, however, reveal that the FFWbenefits households in the richest and the middle tertiles.
1. Introduction
Conventional poverty profile and poverty status measures provide usefulinformation on the level of poverty, characteristics of the poor and the povertycorrelates thereof. This, however, is not sufficient to combat poverty, partlybecause the correlates of poverty profiles are different from the dynamicprocess that determines a household’s movements into and out of poverty.The lack of an inter-temporal dimension in the conventional measure isone of its criticisms and its presence provides a useful insight into what
∗The authors are grateful for the comments by an anonymous reviewer and to the FlemishInteruniversity Council (VLIR) for funding the research that has been carried out in the framework ofthe VLIR Institutional Cooperation Program with Mekelle University.∗∗Fredu Nega and Mitiku Haile are at Mekelle University, Ethiopia; Erik Mathijs, Jozef Deckers andEric Tollens are at the Catholic University of Leuven, Belgium; Jan Nyssen is at Ghent University,Belgium. Author to whom correspondence should be addressed: Fredu Nega, Mekelle University,College of Business and Economics, PO Box 451, Mekelle, Ethiopia; e-mail: [email protected]
92C© 2010 The Authors. Journal compilation C© 2010 African Development Bank. Published by Blackwell Publishing Ltd,
9600 Garsington Road, Oxford OX4 2DQ, UK and 350 Main Street, Malden, MA 02148, USA.
Rural Poverty Dynamics 93
determines movements into and out of poverty and why some householdsremain poor.
The study of poverty dynamics requires panel data and the lack of it hasbeen the limiting factor to study poverty dynamics in developing countriesuntil recently. Over the last decade, a growing amount of panel data setsfor developing countries has enabled researchers to start addressing themovements in poverty and the factors explaining these movements. Baulchand Hoddinott (2000) bring together recent studies on poverty dynamicsin the developing world. In Ethiopia, several research papers (Dercon andKrishnan, 2000; Bigsten and Shimeles, 2004; Dercon, 2005; Swanepoel,2005) have analyzed the dynamics of poverty but none have looked at theimpact of intervention programs in place to fight poverty.
In the Tigray region of northern Ethiopia, two intervention programs—the food or cash for work (FFW) program and the household level foodsecurity package (FSP) program—are widely implemented to fight povertyand ensure food security. By engaging the rural poor in public works suchas the construction of rural roads, dams, and soil and water conservationactivities against payment either in cash or in kind, the FFW programhas a short-term objective of protecting the poor against shocks (consumptionsmoothing) as well as a long-term objective of poverty reduction, growthenhancement and natural resource conservation. The household level FSPprogram on the other hand intends to secure food at household level bydiversifying the income base of the poor through provision of resources(credit) for a range of activities in a package. Identifying the basic interestof the rural poor and providing the required resources, technical assistanceand training to engage in their choice of activities so as to secure food athousehold level and sustain income over time is the prime concern of theFSP program.
A number of empirical studies have been conducted about the FFWprogram. Most focused on the efficiency in targeting (Clay et al., 1999;Devereux, 1999; Ravallion, 1999; Gebremedhin and Swinton, 2000; Haddadand Adato, 2001; Jayne et al., 2002) and others on the mode of payment—cash versus food (Faminow, 1995; Dorosh and Haggblade, 1997; Arndtand Tarp, 2001). Despite the importance of FFW programs to householdwelfare, studies on the impact of the programs on welfare are limited. Thereis a small body of research that assesses the impact of food aid programs onhousehold food security and welfare and to a more limited extent, nutrition(Barrett, 2002). Important exceptions include Quisumbing (2003), Derconand Krishnan (2004), Yamano et al. (2005) and Holden et al. (2006). In arecent paper, Gilligan and Hoddinott (2007) examined the importance ofFFW on consumption, food security and assets in rural Ethiopia.
Given the objectives of the programs—smoothing consumption in theshort run and lifting income of participants in the long run—the evaluation of
C© 2010 The Authors. Journal compilation C© 2010 African Development Bank
94 F. Nega et al.
the impact of these programs upon chronic and transient poverty is pertinent,an aspect which has never been studied before. Using a panel data set of 385rural households in northern Ethiopia, we assess the level of chronic andtransitory poverty and the importance of the FFW and FSP programs for thechronically poor and transiently poor households. The paper is organized asfollows. In the section that follows, we briefly describe intervention programsin Tigray. Data and methodology are discussed in Section 3. Section 4discusses the dynamics of poverty by identifying the magnitude of povertyand the impact of FFW and FSP programs on chronic and transient povertyand Section 5 concludes.
2. Intervention Programs in Tigray
Tigray is the northernmost state of Ethiopia. It is one of the most droughtprone and food insecure regions. Tackling food security at householdlevel, which stretches from making food available to the rural poor tomitigate transitory economic shocks through emergency relief and safetynet mechanisms, to diversifying the income base of the poor, is arguablythe most effective and direct way of poverty reduction envisaged by thegovernment. Among the programs implemented for this purpose are theFood for Work (FFW)1 and an integrated household level extension programknown as the Food Security Package (FSP) programs.
The FFW program has a long history in Ethiopia. It was first used inpublic works programs in the early 1960s. During the 1980s, the governmentmanaged an extensive national FFW soil conservation and afforestationproject using labor brigades (Gebremedhin and Swinton, 2000). Today, FFWserves as a safety net for poor communities in food insecure areas. Poorhouseholds are made to work in public projects such as in the constructionof rural roads for food wage. It is a way of utilizing the food aid available todevelopment ends, while at the same time transferring food to the poor, thatis, a transition between emergency relief and the achievement of long-termdevelopment objectives.
FFW projects envisaged until 2004 were more focused on a relief-orientedemergency system. Food insecurity in Ethiopia is normally understood interms of recurrent food crises and famines, and responses to food insecurityhave conventionally been dominated by emergency food based interventions(Devereux et al., 2006). However, a significant portion of the aid recipientsor those engaged in the FFW projects are not simply poor but chronicallyfood insecure. Given their resource constraints and overall level of poverty,their food deficiencies are predictable which requires long-term predictablesupport. Recognizing this, in 2004 a Productive Safety Net Program(PSNP) was introduced in Ethiopia. It marked a shift from a relief-oriented
C© 2010 The Authors. Journal compilation C© 2010 African Development Bank
Rural Poverty Dynamics 95
emergency system to a productive and development-oriented safety net.The program’s objectives are to smooth household consumption by bridgingproduction deficits in chronically food insecure farming households, protecthousehold assets as a result of distress sales and create community assets(Devereux et al., 2006). The program increasingly provides cash ratherthan food support through labor intensive public works that address theunderlying causes of food insecurity and through grants to households whocannot undertake public works (MoARD, 2004). Here, we do not make adistinction between the FFW program before 2005 and the PSNP since 2005.We consider both as FFW.
Besides the FFW program, the household level food security package(FSP) program was introduced in Tigray with the objective of furnishing theasset base of the poor to ensure food security and to increase and diversifythe income base through the provision of adequate and efficient financialservices, training and technical assistance. The program was launched inNovember 2002 with the overall aim of improving the livelihood of therural households and raising the average annual income to ETB18,000 perhousehold in a period of three years (Mirutse et al., 2006).2
The household level FSP is a coordinated program that involves the mainactors in the rural development of the region, mainly the regional Bureau ofAgriculture and Rural Development (BoARD), the Food Security Office andthe Dedebit Credit and Saving Institute (DECSI), the locally operating microfinance institute. Individual households capable of using loans for productivepurposes are eligible for the program. A household can get financed for arange of activities (package) and loans are disbursed on an individual basis.Although the components of the package for which loans are granted differfrom area to area to suit agro-ecological and other factors, the basic onesinclude livestock (oxen and cows), small animals (sheep and goats), poultry,beehives, seed and fertilizer. Depending on the type of activity, loan periodsrange from 2 to 4 years.
As measures to reduce poverty, the FFW and the FSP programs need beevaluated in terms of their short-term and long-term objectives. The short-run question is the ability of the programs (especially the FFW program) toeffectively shield people who suffer transition income shocks. In this regard,when poor households face temporary shocks, they will have access to foodin an exchange for their labor service in public works. This helps the poor notonly to have the minimum essential quantity of food necessary to maintaingood nutrition, but also protects them from losing their meager assets. Thus,the short-run objectives of the programs need to be evaluated in their abilityto reduce transitory poverty.
Besides the transitorily poor, there are also the chronically poor householdswho are poor most of the time. The chronic poor are believed to have a lowlevel of asset base to generate income. Thus, the long-run objective of the
C© 2010 The Authors. Journal compilation C© 2010 African Development Bank
96 F. Nega et al.
FFW and the FSP programs to reduce poverty is evaluated in their abilityto foster income growth and wealth accumulation among the chronicallydestitute, that is, in their ability to reduce chronic poverty.
3. Data and Methodology
3.1 Data
The data considered here have been collected in three consecutive years—2004, 2005 and 2006—in four study tabias3 in northern Ethiopia usinga two-stage sampling design. The primary sampling units were tabias.Sample tabias were selected on the basis of secondary information collectedfrom all Woredas.4 In selecting the sample tabias, factors that affect socio-economic conditions such as distance to market, geographical location, theavailability of both rain-fed agriculture and irrigation and size of tabia basedon population were considered. A total of four tabias namely Ruba Feleg,Tsenkaniet, Arato and Siye were selected for the survey. The tabias selectedare representative of the three agro-ecological zones of the Tigray regionidentified on the basis of altitude. Areas with altitude ranging from 1500 to2300 meters above sea level are locally termed as woina dogua (i.e., midlandareas), areas above 2300 meters above sea level are locally known as dogua(i.e., highland areas) and areas with altitude less than 1500 meters above sealevel are termed as kola (i.e., lowland). Two of the tabias are in woina dogua,one is in dogua and the fourth in kola.
A multi-purpose questionnaire was used to gather information onhousehold income, expenditure, off-farm income, households’ participationin the FFW and the FSP programs, household assets and local institutionsalongside a host of other information related to production and sales. Thesurvey questionnaire was administered to 100 households randomly selectedfrom each tabia. A total of 400 households were selected for the survey. Animportant issue for panel data is the attrition rate across rounds. Only ninehouseholds were lost in the second round and six more households in thethird round. The attrition rate over the three years is nearly 4 percent.
Data of the three rounds are directly comparable both in terms of contentand timing. A standardized questionnaire was used in all rounds and thesurvey was conducted in a similar season.
3.2 Measuring and Decomposing Poverty
To analyze the impact of the FFW and the FSP programs on chronic andtransitory poverty, we first determine the level of poverty and disaggregate it
C© 2010 The Authors. Journal compilation C© 2010 African Development Bank
Rural Poverty Dynamics 97
into its transitory and chronic components. We use consumption to measurepoverty, for consumption is generally regarded as the best indicator of welfarein rural Ethiopia, because most people in the rural areas consume fromtheir produce and do not earn regular off-farm income. A poverty line isconstructed first by choosing a bundle of food items consumed by the poorest50 percent. The quantity of each of the food items in the bundle is rescaledso as to give a predetermined level of minimum calorie requirement—2200kcal per person per day; this is valued at area-specific prices. The foodcomponent of the poverty line is augmented with an allowance for non-foodgoods, consistent with the non-food spending of those households whosefood spending is no more than adequate to afford the food component of thepoverty line.5
Following Jalan and Ravallion (2000), we decomposed poverty into itschronic and transitory components. They define transient poverty as thecontribution of consumption variability over time to expected consumption.The non-transient component (chronic poverty) is the poverty that remainswhen inter-temporal variability in consumption has been smoothed out (Jalanand Ravallion, 2000). To formally state, assume consumption is used aswelfare indicator and let (yi1, yi2, . . . , yiT ) be household i’s consumptionstream over T dates and p is some well-defined poverty measure, suchas those in the Foster–Greer–Thorbecke class of poverty measures (Fosteret al., 1984), the inter-temporal aggregate measure of poverty of householdi is:
pi = p(yi1, yi2, . . . , yiT ) (1)
The household’s total poverty pi is the expectation overtime of the povertymeasure at each point in time pit :
pi = 1
T
T∑t=1
pit (2)
where pit is:
pit =⎧⎨⎩
(z − yit
z
)α
if yit < z
0 if yit ≥ z
(3)
where z is the poverty line. Chronic poverty is the poverty at time meanconsumption for all dates and is defined as:
ci = p(y∗i , y∗
i , . . . , y∗i ) (4)
where y∗i is the mean consumption expenditure of household i.
Equation (4) can be written as the expectation over time of the household’schronic poverty at each point in time cit , but since the household’s chronic
C© 2010 The Authors. Journal compilation C© 2010 African Development Bank
98 F. Nega et al.
poverty does not change over time, ci = cit where:
ci = cit =⎧⎨⎩
(z − y∗
i
z
)α
if y∗i < z
0 if y∗i ≥ z
(5)
The transient component (pti ) of p(.) is the portion that is attributable to
inter-temporal variability in consumption and is given by netting out thechronic component from the aggregate measure.
pti = pi − ci (6)
Jalan and Ravallion employed the squared poverty gap (i.e., α = 2 inEquations (3) and (5)) as a measure of poverty which satisfies both theadditive assumption—poverty measure should be additive across householdsand over time—and transfer axiom—the poverty function should be strictlydecreasing and convex to penalize inequality among the poor. We use thesame poverty measure—the squared poverty gap. Since the squared povertygap gives more weight to the poorest of the poor, it serves the purpose ofevaluating the impact of the FFW and the FSP programs as these programsare basically meant to serve the poorest of the poor.
3.3 The Impact of Intervention Programs upon Chronicand Transitory Poverty
After decomposing poverty into its chronic and transitory components, weanalyze the impact of the FFW and the FSP programs on these two formsof poverty. Assessing the impact of any intervention requires making aninference about the outcomes that would have been observed for programparticipants had they not participated.
Let Y 1 be the outcome conditional on participation and Y 0 the outcomeconditional on non-participation, so that the impact of participation in theprogram is � = Y1 − Y0. For each household, only Y 1 or Y 0 is observed,which leads to a missing-data problem. Let D be an indicator variable equalto 1 if the household works in FFW and 0 otherwise. Similarly D = 1 ifthe household is beneficiary of FSP and 0 otherwise. Let Z denote a vectorof observed individual characteristics used as conditioning variables. Themost common evaluation parameter of interest is the average impact of thetreatment on the treated (ATT) given as
ATT = E(� | Z , D = 1) = E(Y1 − Y0 | Z , D = 1)
= E(Y1 | Z , D = 1) − E(Y0 | Z , D = 1) (7)
This parameter estimates the average impact among participants. Dataon program participants identify the mean outcome in the treated stateE(Y1 | Z , D = 1). The mean outcome in the non-treated E(Y0 | Z , D = 1)
C© 2010 The Authors. Journal compilation C© 2010 African Development Bank
Rural Poverty Dynamics 99
is not observed. We estimate the impact of the FFW and the FSP programs ontotal, chronic and transitory poverty levels using propensity score matchingas a method of estimating the counterfactual outcome for participants(Rosenbaum and Rubin, 1983).
Let P = Pr(D = 1 | Z) denote the probability of participating in theprograms (FFW or FSP), i.e., the propensity score. Propensity score matchingconstructs a statistical comparison group by matching observations on FFWor FSP recipients to non-participants on similar values of P. Propensity scorematching estimators are based on two assumptions:
a) matching assumes that conditional on P, non-participants have the samemean outcomes as participants would have if they did not receive theprogram:
E(Y0 | P, D = 1) = E(Y0 | P, D = 0) = E(Y0 | P)
b) valid matches can be found for each program participants:
P < 1
If assumptions (a) and (b) are satisfied, then, after conditioning on P,the Y 0 distribution observed for the matched non-participant group can besubstituted for the missing Y 0 distribution for participants. Under theseassumptions, the mean impact of the program is given by
ATT = E(Y1 − Y0| D = 1)
= E(Y1 | D = 1) − EP|D=1{EY (Y0 | D = 1, P)}= E(Y1 | D = 1) − EP|D=1{EY (Y0 | D = 0, P)} (8)
where the first term on the right-hand side of the last expression can beestimated from the treatment group and the second term from the meanoutcomes of the matched (on P) comparison groups.
For each program (FFW and FSP), we estimate the propensity score forparticipation in the program by a probit model using observable variablesin the panel that include both determinants of participation in the programsand factors that affect the outcome. We match treatment and comparisonobservation using kernel matching. Following Heckman et al. (1997) andSmith and Todd (2005), the kernel matching estimator takes the form
ATT = 1
n1
∑i=I1
⎧⎪⎪⎪⎪⎨⎪⎪⎪⎪⎩
Y1i −
∑j∈I0
Y0 j K
(Pj − Pi
an
)
∑k∈I0
K
(Pk − Pi
an
)
⎫⎪⎪⎪⎪⎬⎪⎪⎪⎪⎭
(9)
where as stated above, I 1 is the treatment group of program participants, I 0
is the comparison group of non-participants, K(•) is a kernel function andan is a bandwidth parameter.C© 2010 The Authors. Journal compilation C© 2010 African Development Bank
100 F. Nega et al.
3.4 Conditioning Variables for Program Participation
The construction of the unobservable counterfactual is the basic dilemmaof impact evaluation. Measuring impact as the difference in mean outcomesbetween all households involved in either the FFW or the FSP and thosenot involved even controlling for program characteristics, may give abiased estimate of program impact. This bias arises if there are unobservedcharacteristics that affect the probability of participation in the outcomeof interest. Two important sources of this selection bias include targetingof the program to recipients based on characteristics unobservable to theresearcher and self-selection into the program by eligible recipients (Gilliganand Hoddinott, 2007).
The propensity score matching estimator used in this analysis helps tocontrol for these sources of selection bias and provides reliable, low-biasestimates of program impact provided sufficient control variables relevantto modeling the program participation decisions are used (Heckman et al.,1997). Our data set contains a rich set of conditioning variables to controlprogram participation decisions.
The FFW and the FSP programs are intended to serve the very poor.Although it is difficult to identify the poor, one way of judging the welfarelevel of households is on the basis of assets owned. Hence, we include thetwo basic assets in the rural economy—land and livestock owned. Lack ofthese assets is associated not only with program eligibility but also withthe outcome variable—total, chronic and transitory poverty measured by thesquared poverty gap. However, the direction of the association of povertywith assets that can be accumulated or depleted such as livestock is not clear.It could be that households are poor because they possess less livestockor households possess less livestock because they are poor. To avoid theendogeniety problem, we have used lagged values of livestock owned, thatis, livestock owned in 2003, a year before the survey period for which povertyis calculated.
Demographic variables (female headship, age of household head, numberof adult household members, number of children under five, dependencyratio and family size) associated with program eligibility and the outcomevariables are also included.
A household participates in these programs with the aim of securingadditional income and/or diversifying its income base by investing in newactivities. Thus, a household’s decision is partly influenced by the availablelabor time and the alternative income sources at its disposal. To capturethis effect, we include control variables of whether a household participatesin non-farm wage employment and/or non-farm self-employment incomegenerating activities. We also include social capital defined by membershipin local institutions to indicate the breadth and depth of household social
C© 2010 The Authors. Journal compilation C© 2010 African Development Bank
Rural Poverty Dynamics 101
connectedness to identify the role of these connections and access toinformation in program participation. Detailed retrospective questions aboutshocks in the 2006 round of the socio-economic survey also allows us toconstruct control variables for crop loss due to drought, disease and pests;livestock loss due to animal disease or theft, and other losses such as deathof a household member, serious illness of a member, separation of partners,judiciary and other problems.
Conceived as willing to improve themselves, local administrators favorhouseholds who prepare their own water wells or garden ponds in theselection of participants for the FFW and the FSP programs. To capturethis effect, we include control variables on whether a household possessesits own water well or garden pond.
Besides the above common control variables that influence eligibility toFFW and FSP, program-specific variables are also included. In the rural areasof Tigray, households are required to work 20 days for free on communalactivities such as soil and water conservation. Since participation in collectiveaction is regarded as one of the essential conditions to participate in theFFW program, we include a control variable to capture whether a householdparticipated in communal activities in 2004 and 2005. We also include thegap between the local market wage rate and the FFW wage rate interactedwith male adult household members to identify household specific selfselection.
For the FSP program, we include a control variable for households’access and indebtedness to other formal sources of credit such as loansfrom Dedebit Credit and Saving Institute (DECSI), Bureau of Agriculture,Women’s Association and Cooperatives is considered. To be eligible to theFSP program, a household must not be indebted to any of the aforementionedformal institutions.
With this rich set of control variables one can capture many ofthe determinants of participation that are typically unobservable to theresearcher, which helps to reduce a potentially significant source of biasin propensity score matching estimators. We find that the estimates of theFFW and the FSP programs are sensitive to the choice of variables used forconditioning participation, so we try various alternative specifications andpresent the results that appear most robust.
4. Results
We present our results by first showing the dynamics of poverty and thenwe explore the impact of the FFW and the FSP programs upon chronic andtransitory poverty.
C© 2010 The Authors. Journal compilation C© 2010 African Development Bank
102 F. Nega et al.
4.1 Dynamics of Poverty
Short-term Mobility of Households between 2004 and 2006
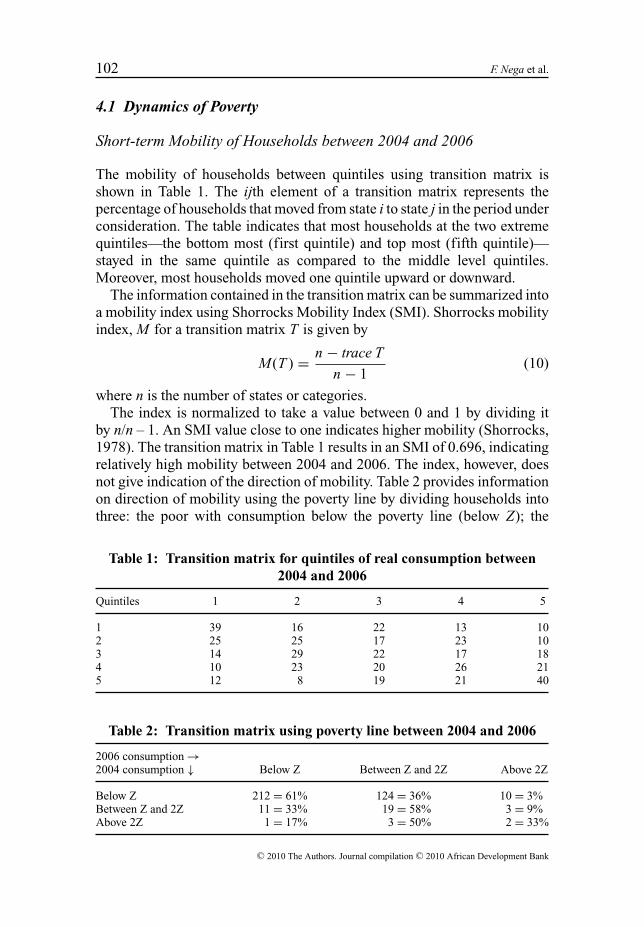
The mobility of households between quintiles using transition matrix isshown in Table 1. The ijth element of a transition matrix represents thepercentage of households that moved from state i to state j in the period underconsideration. The table indicates that most households at the two extremequintiles—the bottom most (first quintile) and top most (fifth quintile)—stayed in the same quintile as compared to the middle level quintiles.Moreover, most households moved one quintile upward or downward.
The information contained in the transition matrix can be summarized intoa mobility index using Shorrocks Mobility Index (SMI). Shorrocks mobilityindex, M for a transition matrix T is given by
M(T ) = n − trace T
n − 1(10)
where n is the number of states or categories.The index is normalized to take a value between 0 and 1 by dividing it
by n/n – 1. An SMI value close to one indicates higher mobility (Shorrocks,1978). The transition matrix in Table 1 results in an SMI of 0.696, indicatingrelatively high mobility between 2004 and 2006. The index, however, doesnot give indication of the direction of mobility. Table 2 provides informationon direction of mobility using the poverty line by dividing households intothree: the poor with consumption below the poverty line (below Z); the
Table 1: Transition matrix for quintiles of real consumption between2004 and 2006
Quintiles 1 2 3 4 5
1 39 16 22 13 102 25 25 17 23 103 14 29 22 17 184 10 23 20 26 215 12 8 19 21 40
Table 2: Transition matrix using poverty line between 2004 and 2006
2006 consumption →2004 consumption ↓ Below Z Between Z and 2Z Above 2Z
Below Z 212 = 61% 124 = 36% 10 = 3%Between Z and 2Z 11 = 33% 19 = 58% 3 = 9%Above 2Z 1 = 17% 3 = 50% 2 = 33%
C© 2010 The Authors. Journal compilation C© 2010 African Development Bank
Rural Poverty Dynamics 103
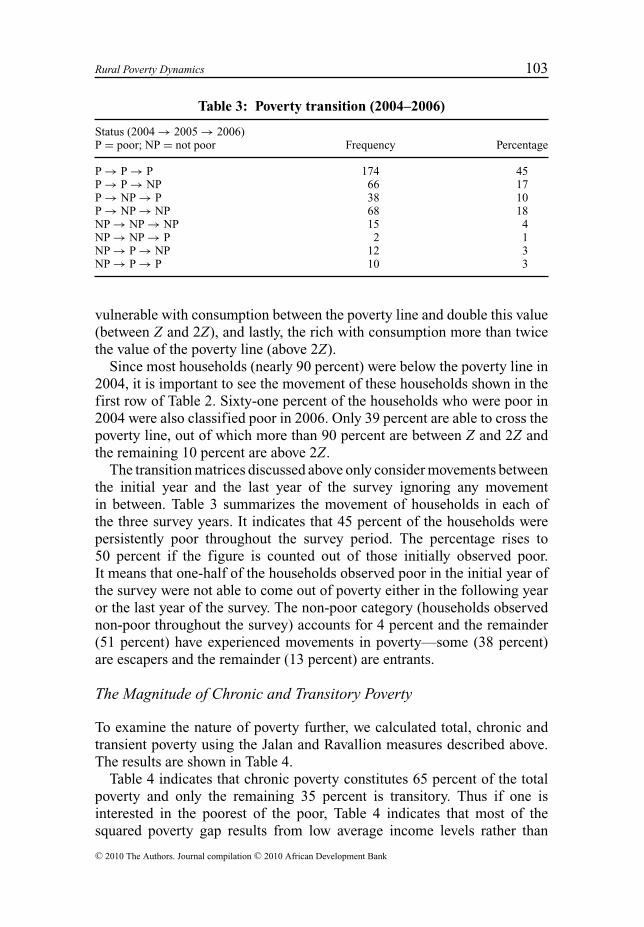
Table 3: Poverty transition (2004–2006)
Status (2004 → 2005 → 2006)P = poor; NP = not poor Frequency Percentage
P → P → P 174 45P → P → NP 66 17P → NP → P 38 10P → NP → NP 68 18NP → NP → NP 15 4NP → NP → P 2 1NP → P → NP 12 3NP → P → P 10 3
vulnerable with consumption between the poverty line and double this value(between Z and 2Z), and lastly, the rich with consumption more than twicethe value of the poverty line (above 2Z).
Since most households (nearly 90 percent) were below the poverty line in2004, it is important to see the movement of these households shown in thefirst row of Table 2. Sixty-one percent of the households who were poor in2004 were also classified poor in 2006. Only 39 percent are able to cross thepoverty line, out of which more than 90 percent are between Z and 2Z andthe remaining 10 percent are above 2Z.
The transition matrices discussed above only consider movements betweenthe initial year and the last year of the survey ignoring any movementin between. Table 3 summarizes the movement of households in each ofthe three survey years. It indicates that 45 percent of the households werepersistently poor throughout the survey period. The percentage rises to50 percent if the figure is counted out of those initially observed poor.It means that one-half of the households observed poor in the initial year ofthe survey were not able to come out of poverty either in the following yearor the last year of the survey. The non-poor category (households observednon-poor throughout the survey) accounts for 4 percent and the remainder(51 percent) have experienced movements in poverty—some (38 percent)are escapers and the remainder (13 percent) are entrants.
The Magnitude of Chronic and Transitory Poverty
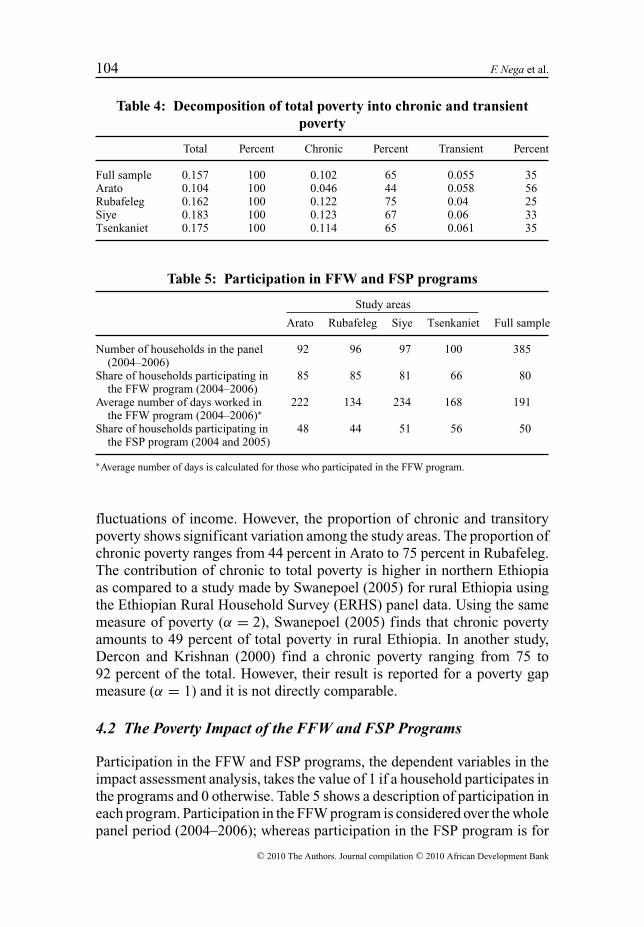
To examine the nature of poverty further, we calculated total, chronic andtransient poverty using the Jalan and Ravallion measures described above.The results are shown in Table 4.
Table 4 indicates that chronic poverty constitutes 65 percent of the totalpoverty and only the remaining 35 percent is transitory. Thus if one isinterested in the poorest of the poor, Table 4 indicates that most of thesquared poverty gap results from low average income levels rather than
C© 2010 The Authors. Journal compilation C© 2010 African Development Bank
104 F. Nega et al.
Table 4: Decomposition of total poverty into chronic and transientpoverty
Total Percent Chronic Percent Transient Percent
Full sample 0.157 100 0.102 65 0.055 35Arato 0.104 100 0.046 44 0.058 56Rubafeleg 0.162 100 0.122 75 0.04 25Siye 0.183 100 0.123 67 0.06 33Tsenkaniet 0.175 100 0.114 65 0.061 35
Table 5: Participation in FFW and FSP programs
Study areas
Arato Rubafeleg Siye Tsenkaniet Full sample
Number of households in the panel(2004–2006)
92 96 97 100 385
Share of households participating inthe FFW program (2004–2006)
85 85 81 66 80
Average number of days worked inthe FFW program (2004–2006)∗
222 134 234 168 191
Share of households participating inthe FSP program (2004 and 2005)
48 44 51 56 50
∗Average number of days is calculated for those who participated in the FFW program.
fluctuations of income. However, the proportion of chronic and transitorypoverty shows significant variation among the study areas. The proportion ofchronic poverty ranges from 44 percent in Arato to 75 percent in Rubafeleg.The contribution of chronic to total poverty is higher in northern Ethiopiaas compared to a study made by Swanepoel (2005) for rural Ethiopia usingthe Ethiopian Rural Household Survey (ERHS) panel data. Using the samemeasure of poverty (α = 2), Swanepoel (2005) finds that chronic povertyamounts to 49 percent of total poverty in rural Ethiopia. In another study,Dercon and Krishnan (2000) find a chronic poverty ranging from 75 to92 percent of the total. However, their result is reported for a poverty gapmeasure (α = 1) and it is not directly comparable.
4.2 The Poverty Impact of the FFW and FSP Programs
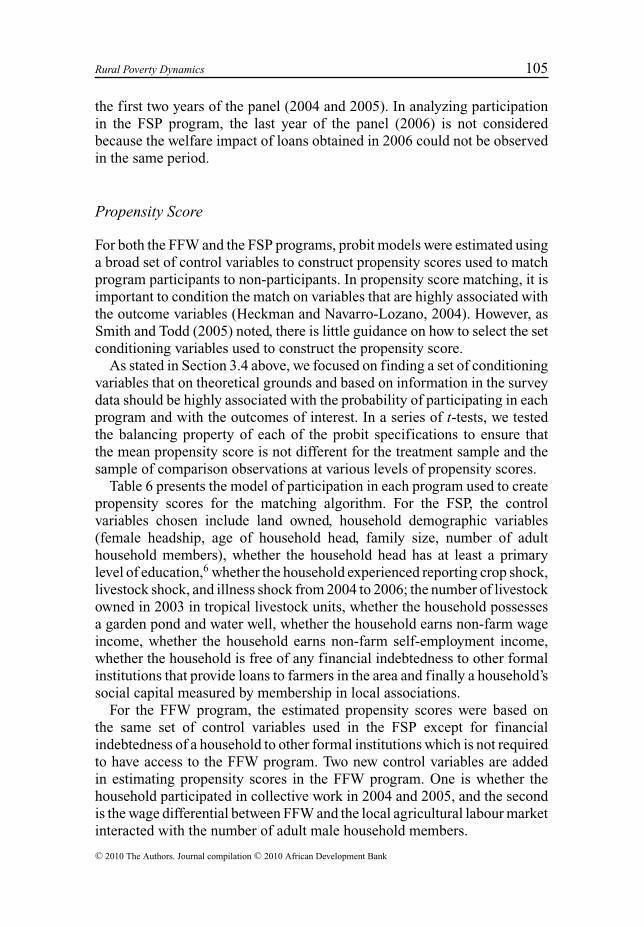
Participation in the FFW and FSP programs, the dependent variables in theimpact assessment analysis, takes the value of 1 if a household participates inthe programs and 0 otherwise. Table 5 shows a description of participation ineach program. Participation in the FFW program is considered over the wholepanel period (2004–2006); whereas participation in the FSP program is for
C© 2010 The Authors. Journal compilation C© 2010 African Development Bank
Rural Poverty Dynamics 105
the first two years of the panel (2004 and 2005). In analyzing participationin the FSP program, the last year of the panel (2006) is not consideredbecause the welfare impact of loans obtained in 2006 could not be observedin the same period.
Propensity Score
For both the FFW and the FSP programs, probit models were estimated usinga broad set of control variables to construct propensity scores used to matchprogram participants to non-participants. In propensity score matching, it isimportant to condition the match on variables that are highly associated withthe outcome variables (Heckman and Navarro-Lozano, 2004). However, asSmith and Todd (2005) noted, there is little guidance on how to select the setconditioning variables used to construct the propensity score.
As stated in Section 3.4 above, we focused on finding a set of conditioningvariables that on theoretical grounds and based on information in the surveydata should be highly associated with the probability of participating in eachprogram and with the outcomes of interest. In a series of t-tests, we testedthe balancing property of each of the probit specifications to ensure thatthe mean propensity score is not different for the treatment sample and thesample of comparison observations at various levels of propensity scores.
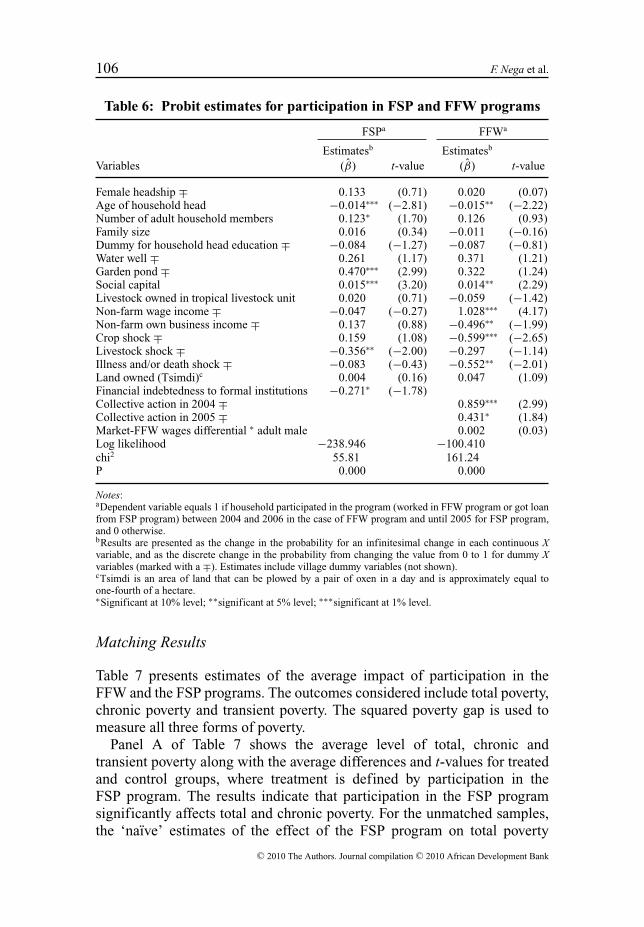
Table 6 presents the model of participation in each program used to createpropensity scores for the matching algorithm. For the FSP, the controlvariables chosen include land owned, household demographic variables(female headship, age of household head, family size, number of adulthousehold members), whether the household head has at least a primarylevel of education,6 whether the household experienced reporting crop shock,livestock shock, and illness shock from 2004 to 2006; the number of livestockowned in 2003 in tropical livestock units, whether the household possessesa garden pond and water well, whether the household earns non-farm wageincome, whether the household earns non-farm self-employment income,whether the household is free of any financial indebtedness to other formalinstitutions that provide loans to farmers in the area and finally a household’ssocial capital measured by membership in local associations.
For the FFW program, the estimated propensity scores were based onthe same set of control variables used in the FSP except for financialindebtedness of a household to other formal institutions which is not requiredto have access to the FFW program. Two new control variables are addedin estimating propensity scores in the FFW program. One is whether thehousehold participated in collective work in 2004 and 2005, and the secondis the wage differential between FFW and the local agricultural labour marketinteracted with the number of adult male household members.
C© 2010 The Authors. Journal compilation C© 2010 African Development Bank
106 F. Nega et al.
Table 6: Probit estimates for participation in FSP and FFW programs
FSPa FFWa
Estimatesb Estimatesb
Variables (β̂) t-value (β̂) t-value
Female headship ∓ 0.133 (0.71) 0.020 (0.07)Age of household head −0.014∗∗∗ (−2.81) −0.015∗∗ (−2.22)Number of adult household members 0.123∗ (1.70) 0.126 (0.93)Family size 0.016 (0.34) −0.011 (−0.16)Dummy for household head education ∓ −0.084 (−1.27) −0.087 (−0.81)Water well ∓ 0.261 (1.17) 0.371 (1.21)Garden pond ∓ 0.470∗∗∗ (2.99) 0.322 (1.24)Social capital 0.015∗∗∗ (3.20) 0.014∗∗ (2.29)Livestock owned in tropical livestock unit 0.020 (0.71) −0.059 (−1.42)Non-farm wage income ∓ −0.047 (−0.27) 1.028∗∗∗ (4.17)Non-farm own business income ∓ 0.137 (0.88) −0.496∗∗ (−1.99)Crop shock ∓ 0.159 (1.08) −0.599∗∗∗ (−2.65)Livestock shock ∓ −0.356∗∗ (−2.00) −0.297 (−1.14)Illness and/or death shock ∓ −0.083 (−0.43) −0.552∗∗ (−2.01)Land owned (Tsimdi)c 0.004 (0.16) 0.047 (1.09)Financial indebtedness to formal institutions −0.271∗ (−1.78)Collective action in 2004 ∓ 0.859∗∗∗ (2.99)Collective action in 2005 ∓ 0.431∗ (1.84)Market-FFW wages differential ∗ adult male 0.002 (0.03)Log likelihood −238.946 −100.410chi2 55.81 161.24P 0.000 0.000
Notes:aDependent variable equals 1 if household participated in the program (worked in FFW program or got loanfrom FSP program) between 2004 and 2006 in the case of FFW program and until 2005 for FSP program,and 0 otherwise.bResults are presented as the change in the probability for an infinitesimal change in each continuous Xvariable, and as the discrete change in the probability from changing the value from 0 to 1 for dummy Xvariables (marked with a ∓). Estimates include village dummy variables (not shown).cTsimdi is an area of land that can be plowed by a pair of oxen in a day and is approximately equal toone-fourth of a hectare.∗Significant at 10% level; ∗∗significant at 5% level; ∗∗∗significant at 1% level.
Matching Results
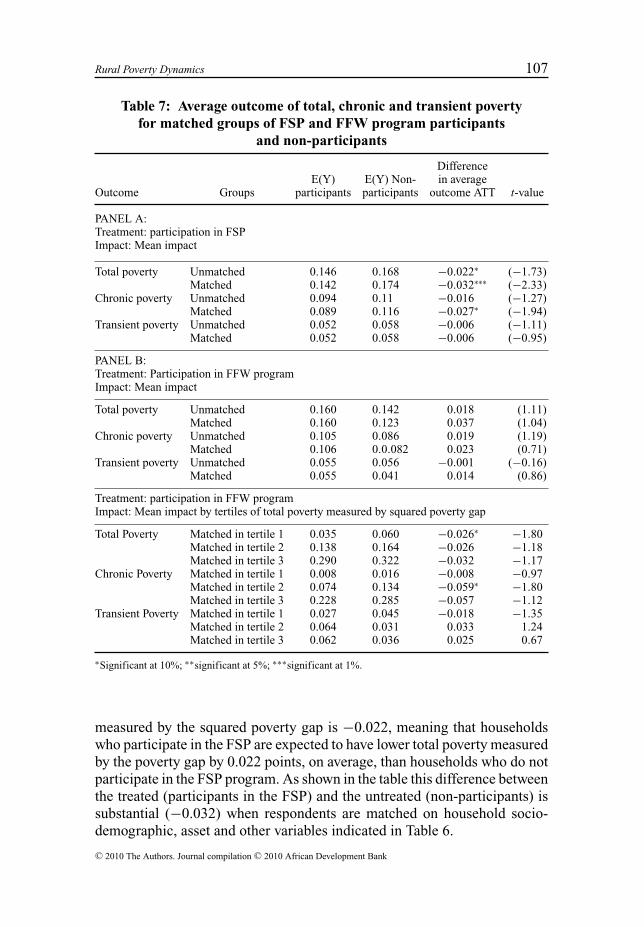
Table 7 presents estimates of the average impact of participation in theFFW and the FSP programs. The outcomes considered include total poverty,chronic poverty and transient poverty. The squared poverty gap is used tomeasure all three forms of poverty.
Panel A of Table 7 shows the average level of total, chronic andtransient poverty along with the average differences and t-values for treatedand control groups, where treatment is defined by participation in theFSP program. The results indicate that participation in the FSP programsignificantly affects total and chronic poverty. For the unmatched samples,the ‘naı̈ve’ estimates of the effect of the FSP program on total poverty
C© 2010 The Authors. Journal compilation C© 2010 African Development Bank
Rural Poverty Dynamics 107
Table 7: Average outcome of total, chronic and transient povertyfor matched groups of FSP and FFW program participants
and non-participants
DifferenceE(Y) E(Y) Non- in average
Outcome Groups participants participants outcome ATT t-value
PANEL A:Treatment: participation in FSPImpact: Mean impact
Total poverty Unmatched 0.146 0.168 −0.022∗ (−1.73)Matched 0.142 0.174 −0.032∗∗∗ (−2.33)
Chronic poverty Unmatched 0.094 0.11 −0.016 (−1.27)Matched 0.089 0.116 −0.027∗ (−1.94)
Transient poverty Unmatched 0.052 0.058 −0.006 (−1.11)Matched 0.052 0.058 −0.006 (−0.95)
PANEL B:Treatment: Participation in FFW programImpact: Mean impact
Total poverty Unmatched 0.160 0.142 0.018 (1.11)Matched 0.160 0.123 0.037 (1.04)
Chronic poverty Unmatched 0.105 0.086 0.019 (1.19)Matched 0.106 0.0.082 0.023 (0.71)
Transient poverty Unmatched 0.055 0.056 −0.001 (−0.16)Matched 0.055 0.041 0.014 (0.86)
Treatment: participation in FFW programImpact: Mean impact by tertiles of total poverty measured by squared poverty gap
Total Poverty Matched in tertile 1 0.035 0.060 −0.026∗ −1.80Matched in tertile 2 0.138 0.164 −0.026 −1.18Matched in tertile 3 0.290 0.322 −0.032 −1.17
Chronic Poverty Matched in tertile 1 0.008 0.016 −0.008 −0.97Matched in tertile 2 0.074 0.134 −0.059∗ −1.80Matched in tertile 3 0.228 0.285 −0.057 −1.12
Transient Poverty Matched in tertile 1 0.027 0.045 −0.018 −1.35Matched in tertile 2 0.064 0.031 0.033 1.24Matched in tertile 3 0.062 0.036 0.025 0.67
∗Significant at 10%; ∗∗significant at 5%; ∗∗∗significant at 1%.
measured by the squared poverty gap is −0.022, meaning that householdswho participate in the FSP are expected to have lower total poverty measuredby the poverty gap by 0.022 points, on average, than households who do notparticipate in the FSP program. As shown in the table this difference betweenthe treated (participants in the FSP) and the untreated (non-participants) issubstantial (−0.032) when respondents are matched on household socio-demographic, asset and other variables indicated in Table 6.
C© 2010 The Authors. Journal compilation C© 2010 African Development Bank
108 F. Nega et al.
Participants in the matched sample have poverty levels, measured by thesquared poverty gap, that are on average nearly 18 percent lower than non-participants in the same sample. This suggests that the FSP program hasa causal influence on total poverty when individuals are matched on therelevant socio-demographic, assets and other covariates. Hence, if we hadtwo hypothetical households matched on those socio-demographic, asset andother variables in Table 6 but were to make one of them participate in theFSP (i.e., get access to a food security loan for a package of activities andtraining) she would have a poverty level on average 18 percent lower thanthe other individual not involved in the program.
For chronic poverty, a similar trend is reflected. Treated households in thematched sample have lower levels of chronic poverty than non-participantsin the same sample. Program participants have a chronic poverty level that ison average 0.027 points (i.e., 23 percent) lower than non-participants and thedifference is statistically significant at the 10 percent level of significance.On the other hand, for the unmatched sample, the difference in chronicpoverty between participants and non-participants vanishes (p > 0.10).
The third outcome estimated for program participants and non-participantsis transitory poverty. The FSP program has no significant influence ontransient poverty. Although the difference in transitory poverty betweenparticipants and non-participants is negative, it is not statistically significantand hence not different from zero (p > 0.10).
In panel B, the same analysis of the outcome variables is done, but thistime the treatment variable being whether the household participates inthe FFW program. The results indicate that there is no difference on thethree measures of poverty (total, chronic and transient) for both programparticipants and non-participants, suggesting that the FFW program has nosignificant influence on chronic and transient poverty as measured by thesquared poverty gap.
In the bottom portion of Table 7, we estimate the impact of FFW on total,chronic and transient poverty by tertiles of total poverty to see if the averageimpact masks significant impacts of the FFW program for some participants.Lower tertile means households with a low level of total poverty and hencehigher welfare, and higher tertile means lower welfare. The estimates showvariation in the impact of participation in the FFW program across the threeforms of poverty. Participants and non-participants are not different in termsof transient poverty but there are significant differences in total and chronicpoverty for tertiles one and two respectively. Participants in tertile 1 (thetertile with the lowest level of poverty or equally, the tertile with the highestlevel of welfare) have a lower level of total poverty than non-participantsin the same tertile. This means that the FFW program reduces severity ofpoverty for participants in the upper welfare group. The same effect, however,is not observed for the second and the third tertiles. The difference in total
C© 2010 The Authors. Journal compilation C© 2010 African Development Bank
Rural Poverty Dynamics 109
poverty among participants and non-participants in these two tertiles is notdifferent from zero (p > 0.10). On the other hand, participants in the secondtertile have lower levels of chronic poverty than non-participants in the sametertile. The difference in chronic poverty for the other tertiles, althoughnegative, is not statistically significant (p > 0.10).
To sum up, the FFW program has a significant and negative effect on totaland chronic poverty for the richest and the middle tertiles respectively, but isnot significant for the poorest tertile. This echoes the finding by Gilligan andHoddinott (2007) in their analysis of the impact of Employment GenerationSchemes (EGS) on household welfare in Ethiopia. They find that the EGSprogram has no effect on the growth of household consumption or foodconsumption for households in the poorest tertile, but it has large, positiveand significant effects on both outcomes of households in tertiles 2 and3 (Gilligan and Hoddinott, 2007). One explanation given by Gilligan andHoddinott (2007) is the difference in the number of days worked. EGSparticipants in the poorest tertile worked fewer days on average than theircounterparts in the second and third tertiles.
A similar explanation holds true in this analysis too. The FFW participantsin the richest tertile (tertile 1) worked on average more days than theircounterparts in the second and third tertiles. Program participants in tertileone worked on average 194.3 days over the period 2004–2006, while thosein the second and third tertiles worked 189.6 and 189.5 days respectivelyover the same period. The difference is even larger if we consider theaverage number of days worked per adult household member or averageper capita number of days worked (i.e., total number of days worked by ahousehold divided by household size). The FFW participants in the richesttertile worked on average 93 days per adult household member, whereasthe figure for program participants in the middle and the poorest tertiles is75.9 and 73.5 days respectively. Similarly in terms of per capita number ofdays worked, program participants in the richest, middle and poorest tertilesworked 45.6, 31.4 and 31 days respectively. In all indicators, participants inthe richest tertile participate more in the program followed by participantsin the middle tertile. One reason for this observed difference in participationmay be the tighter labor constraint in poor households (Barrett and Clay,2003; Gilligan and Hoddinott, 2007). Another reason could be poor targetingin the implementation of the program. Although it is believed that the FFWprogram is self-targeted, that is, the relatively wealthier households are lesslikely to participate due to the low wage, there is evidence that this is notthe case. Solomon (2006) finds that households with higher farm incomeand oxen holding were more likely to take part in food-for-work programsin northern Ethiopia pointing to a leakage in targeting.
Besides differences in number of days worked, another explanation fordifferences in impact of the FFW on poverty for the three tertiles could be
C© 2010 The Authors. Journal compilation C© 2010 African Development Bank
110 F. Nega et al.
that due to factors not explained by the substantial set of control variablesused for matching participants to non-participants, the rich can complementincome from the FFW by other sources and turn it to a more productive useand hence more lasting effects on poverty.
5. Conclusions
Using panel data of 385 rural households from the Tigray region of northernEthiopia, we examined the dynamics of poverty and the impact of the FFWand the FSP programs on total, chronic and transitory poverty.
Poverty in Tigray is predominantly chronic. Matching results indicatethat the FSP program significantly reduces total and chronic poverty. Aftermatching participants in the FSP program with non-participants on the basisof some socio-demographic, asset and other variables, we find that the levelof total and chronic poverty of the FSP program participants is respectively18 and 23 percent lower than that of non-participants. The two groups,however, do not differ in terms of transitory poverty.
Participation in the FFW program, on the other hand, does not havea strong and significant effect on chronic and transitory poverty. Resultsdisaggregated by tertiles of total poverty measured by the squared povertygap show that benefits from the FFW program are skewed towardshouseholds in the richest and the middle tertiles.
These findings have important implications for anti-poverty measures.The predominantly chronic nature of poverty in our sample implies twothings: (a) anti-poverty measures should place emphasis on building theasset base of the poor to shift average income. The recent shift in the FFWprogram from a relief-oriented emergency system to the Productive SafetyNet Program (PSNP) that targets to provide long-term predictable support tochronic food insecure households is commendable, and (b) the fact that mostpoverty is chronic makes targeting possible. Despite this, targeting seems aproblem in the anti-poverty measures especially in the FFW. The relativelyrich households benefit more than the severely poor.
Notes
1. FFW includes all public work programs made against payment eitherin kind or in cash and the recently introduced Production Safety NetProgram (PSNP).
2. ETB is Ethiopian Birr, the local currency. The exchange rate in August2008 was US$1 = ETB9.6571.
3. A tabia is the smallest unit of local government in rural communities ofthe present day Tigray and each tabia consists of four villages. Hence,the study is conducted in 16 villages.
C© 2010 The Authors. Journal compilation C© 2010 African Development Bank
Rural Poverty Dynamics 111
4. A Woreda is the second administrative unit above the tabia.
5. From the survey data a poverty line of ETB1008 per person per yearis constructed. The poverty line is constructed by first identifying thepoorest 50 percent as a reference household deemed to be typical ofthe poor. Next, we identified the food items commonly consumed bythe reference household to constitute the food bundle. In this case, atotal of 21 food items are chosen and their quantity is determined insuch a way that the bundle supplies a predetermined level of minimumcalorie requirement—2200 kcal. Having selected the bundle of goods,we then valued it using a median price for each food item in thebasket based on internal price data. The same basket of food items isvalued by the corresponding price in each year and each study site todetermine the cost of consuming the reference basket of food items. Weexpressed consumption expenditure in terms of 2006 prices. We followedthe approach described in Ravallion and Bidani (1994) to estimate therequired non-food share by examining the consumption behavior of thereference household who can just afford the reference food bundle.The non-food share is estimated by regressing the share of totalexpenditure devoted to food of each household i on a constant and the logof the ratio of consumption expenditures to the food poverty line
si = α + β log(yi/z f ) + εi
where the value of the intercept α estimates the average food share of thosehouseholds that can just afford the food bundle, i.e., those householdswhose expenditure equals the food poverty line (yi = z f ). The povertyline is given by: z = z f (2 − α).
6. One can consider the primary level, secondary level and tertiary leveleducation complete separately as control variables in each program usedto create propensity scores for the matching algorithm. However, pasteducational investment of the present adult force in the sample is verysmall. There are no households with tertiary education and householdswith secondary education are few in number. Hence we considered onlyone variable for education (at least primary level complete).
References
Arndt, C. and F.Tarp (2001), ‘Who Gets the Goods? A General EquilibriumPerspective on Food Aid in Mozambique’, Food Policy, Vol. 26, No. 2,pp. 107–19.
Barrett, C.B. (2002), ‘Food Security and Food Assistance Programs’, inB. Gardner and G. Rausser (eds.), Handbook of Agricultural Economics,Volume 2, Elsevier, Amsterdam.
C© 2010 The Authors. Journal compilation C© 2010 African Development Bank
112 F. Nega et al.
Barrett, C.B. and D.C. Clay (2003), ‘How Accurate Is Food-for-Work Self-Targeting in the Presence of Imperfect Factor Markets? Evidence fromEthiopia’, Journal of Development Studies, Vol. 39, No. 5, pp. 152–80.
Baulch, R. and J. Hoddinott (2000), ‘Economic Mobility and PovertyDynamics in Developing Countries’, Journal of Development Studies,Vol. 36, No. 6, pp. 1–24.
Bigsten, A. and A. Shimeles (2004), ‘The Dynamics of Poverty in Ethiopia’,WIDER Research Paper No. 39.
Clay, D.C., D. Molla and H. Debebe (1999), ‘Food Aid Targeting inEthiopia: A Study of Who Needs It and Who Gets It’, Food Policy, Vol. 24,No. 3, pp. 391–409.
Dercon, S. (2005), ‘Economic Reform, Growth and the Poor: Evidence fromRural Ethiopia’, Journal of Development Economics, Vol. 81, pp. 1–24.
Dercon, S. and P. Krishnan (2000), ‘Vulnerability, Seasonality and Povertyin Ethiopia’, Journal of Development Studies, Vol. 36, No. 6, pp. 25–53.
Dercon, S. and P. Krishnan (2004), ‘Food Aid and Informal Insurance’, inS. Dercon (ed.), Insurance against Poverty, Oxford University Press, NewYork.
Devereux, S. (1999), ‘Targeting Transfers: Innovative Solutions to FamiliarProblems’, Institute of Development Studies Bulletin, Vol. 30, No. 2,pp. 61–74.
Devereux, S., R. Sabates-Wheeler, T. Mulugeta and T. Hailemichael (2006),‘Ethiopia’s Productive Safety Net Program (PSNP): Trends in PSNPTransfer within Targeted Households’, Institute of Development Studies,Sussex, UK and Indak International Pvt. L. C., Addis Ababa, Ethiopia.
Dorosh, P.A. and S. Haggblade (1997), ‘Shifting Sands: The ChangingCase for Monetizing Project Food Aid in Bangladesh’, World Development,Vol. 25, No. 12, pp. 2093–104.
Faminow, M. (1995), ‘Issues in Valuing Food Aid: The Cash or In-KindControversy’, Food Policy, Vol. 20, No. 1, pp. 3–10.
Foster, J.E., J. Greer and E. Thorbecke (1984), ‘Class of DecomposablePoverty Measures’, Econometrica, Vol. 52, No. 3, pp. 761–76.
Gebremedhin, B. and S.M. Swinton (2000), ‘Reconciling Food-for-WorkProject Feasibility with Food Aid Targeting in Tigray, Ethiopia’, FoodPolicy, Vol. 26, No. 1, pp. 85–95.
Gilligan, D. O. and J. Hoddinott (2007), ‘Is There Persistence in the Impactof Emergency Food Aid? Evidence on Consumption, Food Security, and
C© 2010 The Authors. Journal compilation C© 2010 African Development Bank
Rural Poverty Dynamics 113
Assets in Rural Ethiopia’, American Journal of Agricultural Economics,Vol. 89, No. 2, pp. 225–42.
Haddad, L. and M. Adato (2001), ‘How Effective Do Public WorksPrograms Transfer Benefits to the Poor? Evidence from South Africa’,Food Consumption and Nutrition Division Discussion Paper No. 108,International Food Policy Research Institute, Washington, DC.
Heckman, J.J., H. Ichimura and P.E. Todd (1997), ‘Matching as an EconomicEvaluation Estimator: Evidence from Evaluating a Job Training Program’,Review of Economic Studies, Vol. 64, pp. 605–54.
Heckman, J.J. and S. Navarro-Lozano (2004), ‘Using Matching, Instrumen-tal Variables, and Control Functions to Estimate Economic Choice Models’,Review of Economics and Statistics, Vol. 86, pp. 30–57.
Holden, S., B.C. Barret and F. Hagos (2006), ‘Food-for-Work for PovertyReduction and the Promotion of Sustainable Land Use: Can it Work?’,Environment and Development Economics, Vol. 11, No. 1, pp. 15–38.
Jalan, J. and M. Ravallion (2000), ‘Is Transient Poverty Different? Evidencefrom Rural China’, Journal of Development Studies, Vol. 36, No. 6, pp. 82–100.
Jayne, T., J. Strauss, T. Yamano and D. Molla (2002), ‘Targeting of FoodAid in Rural Ethiopia: Chronic Need or Inertia?’, Journal of DevelopmentEconomics, Vol. 68, No. 2, pp. 247–88.
Mirutse, D., H. Gebregiorgis and A. Selam (2006), ‘Female-HeadedHouseholds and Livelihood Intervention in Four Selected Weredas in Tigray,Ethiopia’, Drylands Coordination Group (DCG) Report No. 44.
MoARD (2004), ‘Productive Safety Net Program: Program of Implementa-tion Manual’, Ministry of Agriculture and Rural Development, Governmentof Ethiopia, Addis Ababa, Ethiopia.
Quisumbing, A.R. (2003), ‘Food Aid and Child Nutrition in Rural Ethiopia’,World Development, Vol. 31, No. 7, pp. 1309–24.
Ravallion, M. (1999), ‘Appraising Workfare’, World Bank ResearchObserver, Vol. 14, No. 1, pp. 31–48.
Ravallion, M. and B. Bidani (1994), ‘How Robust Is Poverty Profile?’, TheWorld Bank Economic Review, Vol. 8, No. 1, pp. 75–102.
Rosenbaum, P. and D.B. Rubin (1983), ‘The Central Role of the PropensityScore in Observational Studies for Causal Effects’, Biometrika, Vol. 70,pp. 41–55.
C© 2010 The Authors. Journal compilation C© 2010 African Development Bank
114 F. Nega et al.
Shorrocks, A.E. (1978), ‘The Measurement of Mobility’, Econometrica,Vol. 46, No. 5, pp. 1013–23.
Smith, J.A. and P.E. Todd (2005), ‘Does Matching Overcome LaLonde’sCritique of Nonexperimental Estimators?’, Journal of Econometrics,Vol. 125, pp. 305–53.
Solomon, A. (2006), ‘Does Food Aid Reach the Poor? New Evidencefrom Northern Ethiopia’, paper presented at a Conference on InternationalAgricultural Research for Development, 11–13 October, University ofBonn, Germany.
Swanepoel, C. (2005), ‘Poverty and Poverty Dynamics in Rural Ethiopia’,Stellenbosch Economic Working Papers 3.
Yamano, T., H. Alderman and L. Christiaensen (2005), ‘Child Growth,Shocks and Food Aid in Rural Ethiopia’, American Journal of AgriculturalEconomics, Vol. 87, No. 2, pp. 273–88.
C© 2010 The Authors. Journal compilation C© 2010 African Development Bank
Related Documents