Rules and Feature Extraction for Microcalcifications Detection in Digital Mammograms Using Neuro-Symbolic Hybrid Systems and Undecimated Filter Banks OSSLAN OSIRIS VERGARA VILLEGAS 1 , HUMBERTO DE JESÚS OCHOA DOMÍNGUEZ 2 , VIANEY GUADALUPE CRUZ SÁNCHEZ 3 , EFRÉN DAVID GUTIÉRREZ CASAS 2 AND GERARDO REYES SALGADO 3 1 Industrial and Manufacturing Engineering Department 2 Electrical and Computer Engineering Department Universidad Autónoma de Ciudad Juárez Avenida del Charro No. 450 Norte, Zona Pronaf, P. C. 32310, Ciudad Juárez, Chihuahua MEXICO {osslan, hochoa}@ieee.org, [email protected], http://www.uacj.mx 3 Computer Science Department Centro Nacional de Investigación y Desarrollo Tecnológico (cenidet) Interior Internado Palmira s/n, Col. Palmira, P. C. 62490, Cuernavaca, Morelos MEXICO {vianey, greyes}@cenidet.edu.mx, http://www.cenidet.edu.mx Abstract: - In this paper, we present a Neuro-Symbolic Hybrid System methodology to improve the recognition stage of benignant or malignant microcalcifications in mammography. At the first stage, we use five different undecimated filter banks in order to detect the microcalcifications. The microcalcifications appear as a small number of high intensity pixels compared with their neighbors. Once the microcalcifications were detected, we extract rules in order to obtain the image features. At the end, we can classify the microcalcification in one of three sets: benign, malign, and normal. The results obtained show that there is no a substantial difference in the number of detected microcalcification among the several filter banks used and the NSHS methodology proposed can improve, in the future, the results of microcalcification recognition. Key-Words: - Breast cancer, Microcalcifications detection, Undecimated filter bank, NSHS. 1 Introduction Breast cancer is a disease where abnormal cells grow in an uncontrolled fashion and is the most common cause of death in middle age-women [1], [2]. Early detection plays a very important role in cancer treatment and allows a faster recovery for most of the patients. Screen films are considered the most reliable method for breast cancer detection. However, mammograms provided by the X-ray equipment, are very difficult to interpret. The early detection, through this method, is still a challenge for the radiologists. Automatic systems help the radiologist to give a more accurate diagnostic [3], [4]. Breast abnormalities are divided into exhibiting microcalcification, circumscribed lesions and speculated lesions. One of the earliest signs of breast cancer is the formation of clusters of microcalcifications [5], [6], [7]. Microcalcifications are tinny specs of calcium in the breast and only can be detected on a mammogram. These deposits of calcium are very small spots of high contrast, inside the mammogram. Microcalcifications are related to breast cancer because 30% to 50% of malignant breast tumors are surrounded by microcalcifications [8]. Approximately from 10% to 30% of breast cancer is missed by the radiologists because, microcalcifications are difficult to detect in a simple sight [9]. Wavelets have been widely used in the medical imaging field, since any area or areas of an image can be enhanced easily by amplifying them or by modifying the wavelet coefficients. In other words, wavelets use basis functions that can dilate in scale and translate in position according to the signal characteristics [9], [10], [11]. Wavelet transforms are implemented by using filter banks. Two stages are used; one to decompose the signal (analysis) and one to recover the signal (synthesis). Synthesis bank must invert the analysis bank in order to have perfect reconstruction of the signal at the output of the filter bank. The simple filter bank has the analysis filters preceded by WSEAS TRANSACTIONS on SIGNAL PROCESSING Osslan Osiris Vergara Villegas, Humberto De Jesus Ochoa Dominguez, Vianey Guadalupe Cruz Sanchez, Efren David Gutierrez Casas, Gerardo Reyes Salgado ISSN: 1790-5052 484 Issue 8, Volume 4, August 2008

Welcome message from author
This document is posted to help you gain knowledge. Please leave a comment to let me know what you think about it! Share it to your friends and learn new things together.
Transcript
Rules and Feature Extraction for Microcalcifications Detection in Digital Mammograms Using Neuro-Symbolic Hybrid Systems and
Undecimated Filter Banks
OSSLAN OSIRIS VERGARA VILLEGAS1, HUMBERTO DE JESÚS OCHOA DOMÍNGUEZ2, VIANEY GUADALUPE CRUZ SÁNCHEZ3, EFRÉN DAVID GUTIÉRREZ CASAS2 AND
GERARDO REYES SALGADO3
1Industrial and Manufacturing Engineering Department 2Electrical and Computer Engineering Department
Universidad Autónoma de Ciudad Juárez Avenida del Charro No. 450 Norte, Zona Pronaf, P. C. 32310, Ciudad Juárez, Chihuahua
MEXICO {osslan, hochoa}@ieee.org, [email protected], http://www.uacj.mx
3Computer Science Department Centro Nacional de Investigación y Desarrollo Tecnológico (cenidet)
Interior Internado Palmira s/n, Col. Palmira, P. C. 62490, Cuernavaca, Morelos MEXICO
{vianey, greyes}@cenidet.edu.mx, http://www.cenidet.edu.mx
Abstract: - In this paper, we present a Neuro-Symbolic Hybrid System methodology to improve the recognition stage of benignant or malignant microcalcifications in mammography. At the first stage, we use five different undecimated filter banks in order to detect the microcalcifications. The microcalcifications appear as a small number of high intensity pixels compared with their neighbors. Once the microcalcifications were detected, we extract rules in order to obtain the image features. At the end, we can classify the microcalcification in one of three sets: benign, malign, and normal. The results obtained show that there is no a substantial difference in the number of detected microcalcification among the several filter banks used and the NSHS methodology proposed can improve, in the future, the results of microcalcification recognition. Key-Words: - Breast cancer, Microcalcifications detection, Undecimated filter bank, NSHS. 1 Introduction Breast cancer is a disease where abnormal cells grow in an uncontrolled fashion and is the most common cause of death in middle age-women [1], [2]. Early detection plays a very important role in cancer treatment and allows a faster recovery for most of the patients.
Screen films are considered the most reliable method for breast cancer detection. However, mammograms provided by the X-ray equipment, are very difficult to interpret. The early detection, through this method, is still a challenge for the radiologists. Automatic systems help the radiologist to give a more accurate diagnostic [3], [4].
Breast abnormalities are divided into exhibiting microcalcification, circumscribed lesions and speculated lesions. One of the earliest signs of breast cancer is the formation of clusters of microcalcifications [5], [6], [7]. Microcalcifications are tinny specs of calcium in the breast and only can be detected on a mammogram. These deposits of calcium are very
small spots of high contrast, inside the mammogram. Microcalcifications are related to breast cancer because 30% to 50% of malignant breast tumors are surrounded by microcalcifications [8].
Approximately from 10% to 30% of breast cancer is missed by the radiologists because, microcalcifications are difficult to detect in a simple sight [9].
Wavelets have been widely used in the medical imaging field, since any area or areas of an image can be enhanced easily by amplifying them or by modifying the wavelet coefficients. In other words, wavelets use basis functions that can dilate in scale and translate in position according to the signal characteristics [9], [10], [11].
Wavelet transforms are implemented by using filter banks. Two stages are used; one to decompose the signal (analysis) and one to recover the signal (synthesis). Synthesis bank must invert the analysis bank in order to have perfect reconstruction of the signal at the output of the filter bank. The simple filter bank has the analysis filters preceded by
WSEAS TRANSACTIONS on SIGNAL PROCESSING
Osslan Osiris Vergara Villegas, Humberto De Jesus Ochoa Dominguez, Vianey Guadalupe Cruz Sanchez, Efren David Gutierrez Casas, Gerardo Reyes Salgado
ISSN: 1790-5052 484 Issue 8, Volume 4, August 2008
downsamplers and the synthesis filters followed by upsamplers.
Downsampling operation introduces aliasing and is not removed completely by the analysis filters as the filters are not ideal. Downsampling-upsampling operations are used to avoid the oversampling problem in signal compression applications.
However, these operations can be removed and still have perfect reconstruction of the signal without aliasing introducing aliasing in the analysis stage. On the other hand, the number of samples per dimension of signal is doubled at the output of the analysis bank. This type of scheme is known as undecimated filter bank and is described in Fig. 1.
This paper is organized as follows: Section 2 presents the methodology used to detect the microcalcificaions. Section 3 presents the NSHS methodology to classify the microcalcifications, the results and conclusions are presented in Section 4 and 5 respectively.
2 Microcalcification Detection Methodology This section reviews the process to detect microcalcifications, in digital mammograms, using five undecimated filter banks. 2.1 Image segmentation A Sobel filter was applied on the image to detect the edges of the region of interest (ROI). The ROI is the breast of the digital mammogram and the goal is to isolate this area from the film. A dilation operation was performed after filtering to connect edges. Dilation was followed by filling the remaining holes of the ROI. This process produced a mask of ones in those pixels engulfed by the ROI.
A multiplication of the mask with the digital mammogram was carried out to segment the breast area (X) which is the input to the filter bank. 2.2 Decomposition and reconstruction of the
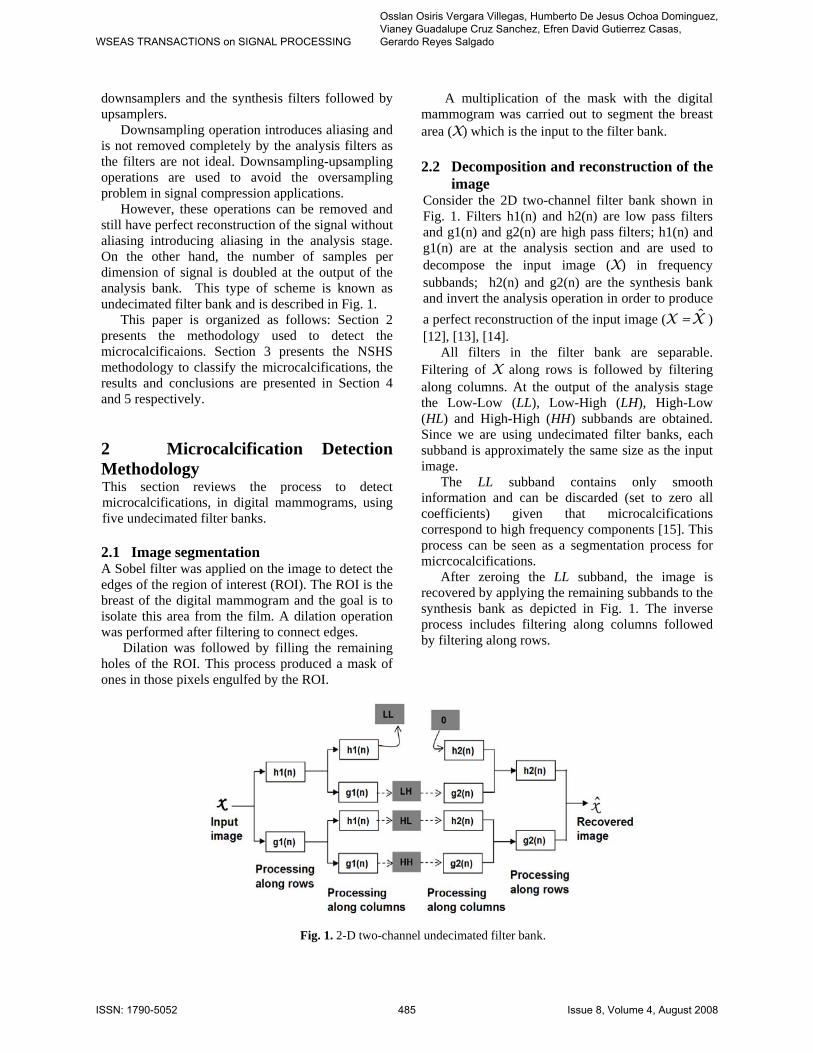
image Consider the 2D two-channel filter bank shown in Fig. 1. Filters h1(n) and h2(n) are low pass filters and g1(n) and g2(n) are high pass filters; h1(n) and g1(n) are at the analysis section and are used to decompose the input image (X) in frequency subbands; h2(n) and g2(n) are the synthesis bank and invert the analysis operation in order to produce a perfect reconstruction of the input image (X = X̂ ) [12], [13], [14].
All filters in the filter bank are separable. Filtering of X along rows is followed by filtering along columns. At the output of the analysis stage the Low-Low (LL), Low-High (LH), High-Low (HL) and High-High (HH) subbands are obtained. Since we are using undecimated filter banks, each subband is approximately the same size as the input image.
The LL subband contains only smooth information and can be discarded (set to zero all coefficients) given that microcalcifications correspond to high frequency components [15]. This process can be seen as a segmentation process for micrcocalcifications.
After zeroing the LL subband, the image is recovered by applying the remaining subbands to the synthesis bank as depicted in Fig. 1. The inverse process includes filtering along columns followed by filtering along rows.
Fig. 1. 2-D two-channel undecimated filter bank.
WSEAS TRANSACTIONS on SIGNAL PROCESSING
Osslan Osiris Vergara Villegas, Humberto De Jesus Ochoa Dominguez, Vianey Guadalupe Cruz Sanchez, Efren David Gutierrez Casas, Gerardo Reyes Salgado
ISSN: 1790-5052 485 Issue 8, Volume 4, August 2008
2.3 Image thresholding and microcalcifica-tion area enhancement
At the output of the synthesis bank a noisy image ( X̂ ) is recovered. However, most of the microcalcifications are of greater magnitude than the noise. Therefore, thresholding was applied to the recovered image, in order to remove noise. After exhaustive tests, on test images, a threshold of ±17 was found. The recovered images were analyzed in sets of 2x2 neighbor samples. If one of the samples, in the set, is greater than the threshold, the set contains a microcalcification. Therefore, all the neighbor samples are set to a maximum value of 255. The images were inverted, in order to show the detected microcalcifications.
After the microcalcification detection we implement a neuro-symbolic methodology in order to obtain a feature set. The features extracted allow us the recognition of abnormalities such as microcalcification formation. The features were obtained by means of a rule extraction process and were used to discriminate between three subsets: benign, malign, and normal. We considered the features extracted as apriori knowledge to the stage of abnormality recognition on digital mammograms. In the following section we explain the methodology implemented.
3 Neuro-Symbolic Hybrid Systems Methodology
In order to improve the recognition of benignant or malignant microcalcification, we propose an analysis of the knowledge contained in the numeric mammography database obtained from [16].
The numeric knowledge allows us to obtain the most important characteristics to inform when a microcalcification is benignant or malignant. The methodology used for the feature extraction is neuro-symbolic.
This methodology use techniques such as the artificial neural networks in order to train the numeric database and production rules to represent the knowledge extracted. The results were validated by an expert at the field of microcalcifications detection (radiologist).
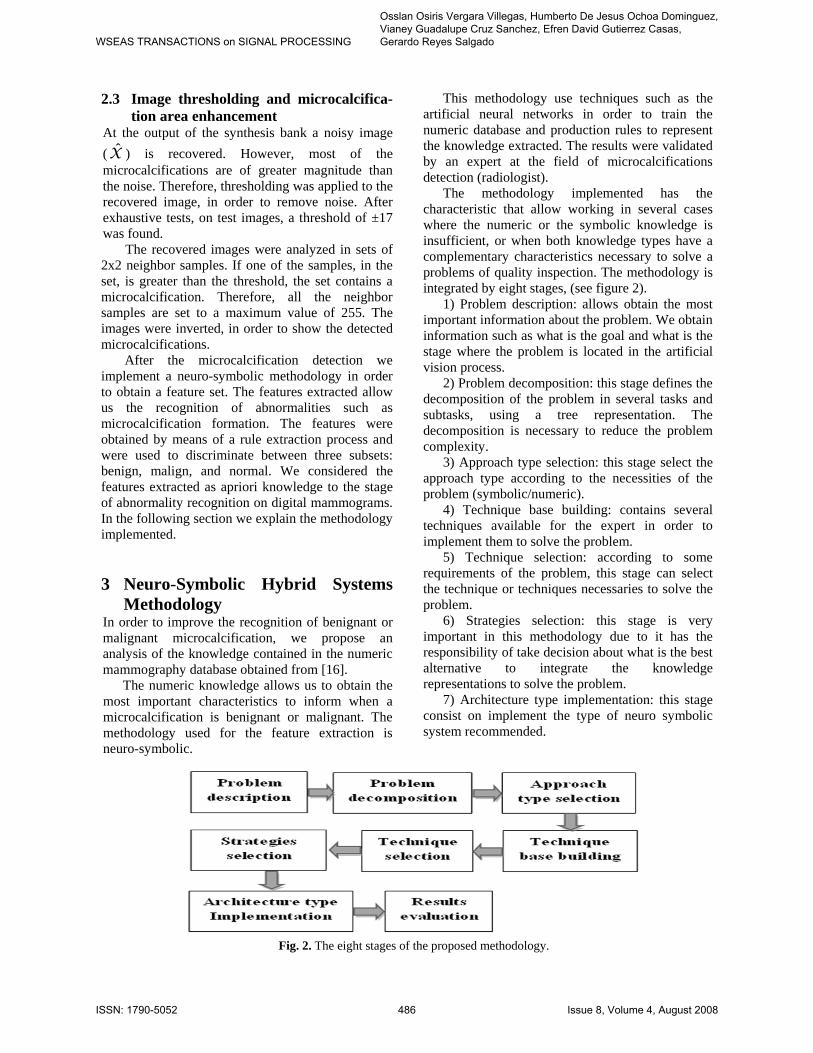
The methodology implemented has the characteristic that allow working in several cases where the numeric or the symbolic knowledge is insufficient, or when both knowledge types have a complementary characteristics necessary to solve a problems of quality inspection. The methodology is integrated by eight stages, (see figure 2).
1) Problem description: allows obtain the most important information about the problem. We obtain information such as what is the goal and what is the stage where the problem is located in the artificial vision process.
2) Problem decomposition: this stage defines the decomposition of the problem in several tasks and subtasks, using a tree representation. The decomposition is necessary to reduce the problem complexity.
3) Approach type selection: this stage select the approach type according to the necessities of the problem (symbolic/numeric).
4) Technique base building: contains several techniques available for the expert in order to implement them to solve the problem.
5) Technique selection: according to some requirements of the problem, this stage can select the technique or techniques necessaries to solve the problem.
6) Strategies selection: this stage is very important in this methodology due to it has the responsibility of take decision about what is the best alternative to integrate the knowledge representations to solve the problem.
7) Architecture type implementation: this stage consist on implement the type of neuro symbolic system recommended. Fig. 2. The eight stages of the proposed methodology.
WSEAS TRANSACTIONS on SIGNAL PROCESSING
Osslan Osiris Vergara Villegas, Humberto De Jesus Ochoa Dominguez, Vianey Guadalupe Cruz Sanchez, Efren David Gutierrez Casas, Gerardo Reyes Salgado
ISSN: 1790-5052 486 Issue 8, Volume 4, August 2008
8) Results evaluation, this stage is designed to analyze and verify the results obtained by the methodology implemented. 3.1 Knowledge extraction with NSHS 1) Problem description, the artificial vision expert
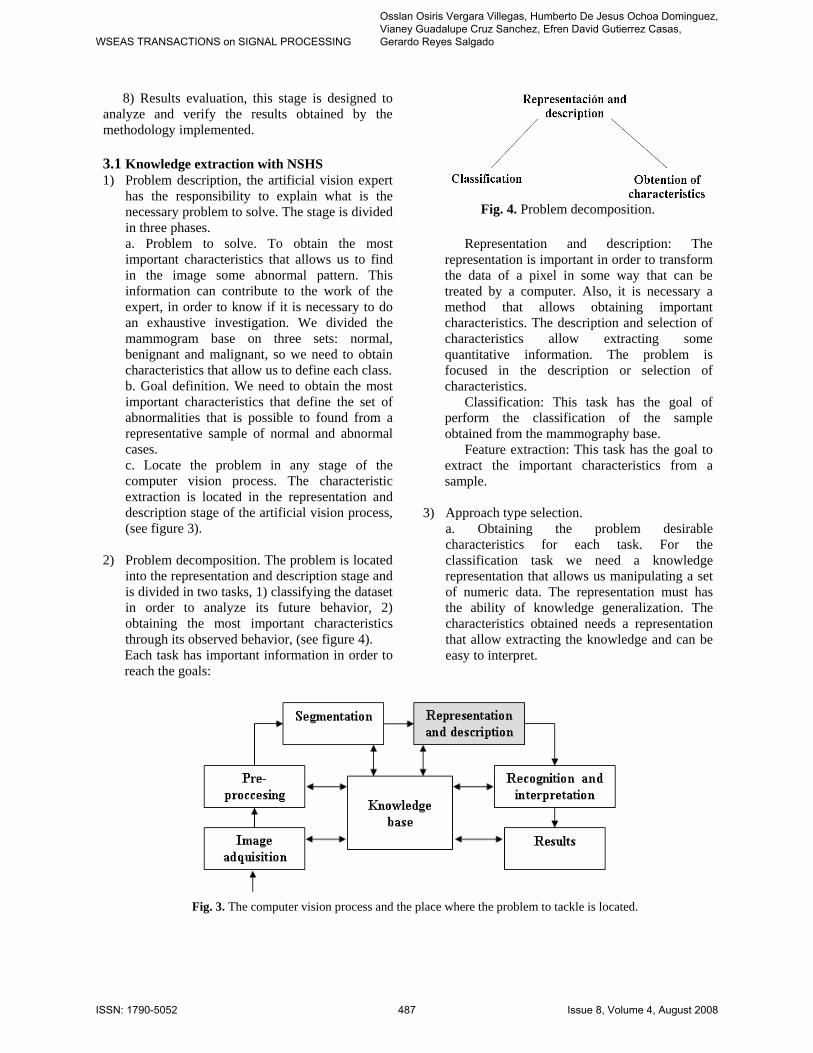
has the responsibility to explain what is the necessary problem to solve. The stage is divided in three phases. a. Problem to solve. To obtain the most important characteristics that allows us to find in the image some abnormal pattern. This information can contribute to the work of the expert, in order to know if it is necessary to do an exhaustive investigation. We divided the mammogram base on three sets: normal, benignant and malignant, so we need to obtain characteristics that allow us to define each class. b. Goal definition. We need to obtain the most important characteristics that define the set of abnormalities that is possible to found from a representative sample of normal and abnormal cases. c. Locate the problem in any stage of the computer vision process. The characteristic extraction is located in the representation and description stage of the artificial vision process, (see figure 3).
2) Problem decomposition. The problem is located
into the representation and description stage and is divided in two tasks, 1) classifying the dataset in order to analyze its future behavior, 2) obtaining the most important characteristics through its observed behavior, (see figure 4). Each task has important information in order to reach the goals:
Fig. 4. Problem decomposition.
Representation and description: The
representation is important in order to transform the data of a pixel in some way that can be treated by a computer. Also, it is necessary a method that allows obtaining important characteristics. The description and selection of characteristics allow extracting some quantitative information. The problem is focused in the description or selection of characteristics.
Classification: This task has the goal of perform the classification of the sample obtained from the mammography base.
Feature extraction: This task has the goal to extract the important characteristics from a sample.
3) Approach type selection.
a. Obtaining the problem desirable characteristics for each task. For the classification task we need a knowledge representation that allows us manipulating a set of numeric data. The representation must has the ability of knowledge generalization. The characteristics obtained needs a representation that allow extracting the knowledge and can be easy to interpret.
Fig. 3. The computer vision process and the place where the problem to tackle is located.
WSEAS TRANSACTIONS on SIGNAL PROCESSING
Osslan Osiris Vergara Villegas, Humberto De Jesus Ochoa Dominguez, Vianey Guadalupe Cruz Sanchez, Efren David Gutierrez Casas, Gerardo Reyes Salgado
ISSN: 1790-5052 487 Issue 8, Volume 4, August 2008
b. Selecting the starting approach type of the characteristics selected. The different approach types recognized are numeric and symbolic, and then the necessary system to solve the problem is neuro-symbolic.
4) Technique base building. a. Obtaining a set of techniques. The techniques available to this study case are: artificial neural networks and production rules. The tools available are Neusim [17] that allow obtain an artificial neural network from a set of examples using a learning method called CasCor (Cascade Correlation) and the tool Extract-us that use a knowledge extraction algorithm called subset which built a symbolic rules set. b. Classifying the techniques according to the problem type. The production rules and the artificial neural network are considerate to solve classification problems. c. Describing the abilities of each technique. The artificial neural network has the ability of knowledge generalization and the production rules have the ability to express the knowledge. d. Assigning the approach type to each technique. The artificial neural network is of numeric type while the production rules are a symbolic approach.
5) Technique selection a. Obtaining as input the approach type. According to representation and description task the system is neuro-symbolic. b. Obtaining the alternatives available according to the approach. The alternatives available are the artificial neural networks in the case of the numeric approach and the production rules in the case of symbolic approach. c. Analyzing and selecting the technique according to some criteria. The techniques available allow us to solve the classification and the knowledge extraction tasks, artificial neural network and production rules respectively.
6) Strategies selection are based on the four criteria of neuro-symbolic hybrid systems: • Integration type, the steps of this criteria
are: Knowing the problem module. The problem has a symbolic and numeric module. Identify the hierarchy among modules. If the n+1 task depends on the output n then do the task n. Therefore, to do the extraction
of characteristics is necessary to execute the classification of the sample. Identify the functions. The numeric or connectionist module executes the knowledge insertion. The symbolic module executes the knowledge extraction. Deduce the integration type. In this problem is necessary to execute two functions insertion and extraction of knowledge, therefore, this integration type is hybrid integration.
• Integration Mode Knowing the problem modules. Due to the neuro-symbolic approach, the problem contains a symbolic and numeric module. Locate the system type. The system type is sequential, due to operations are executed in a sequential form, follow some order. Assigning the role. The symbolic module takes the principal module role. While the connectionist module take the subordinate role. Locate the modules in some integration mode. According to the methodology the integration mode has the chain architecture.
• Coupling grade Knowing the modules of the problems. The system is integrated by a neural and symbolic module. Detect the communication lines between the modules. The communication line is unidirectional where the output of the connectionist module is the input of the symbolic module. Identify the problem necessities. According with the system requirements we need that the processing time can be good. Identify the dependence type among the modules. The coupling type is the data according to the methodology, because the set of rules are extracted from the artificial neural network without modifications. Deciding the type and coupling grade. Due to the characteristics of the problem, we deduce that the coupling grade is weak.
• Knowledge transference. Knowing the system approach type. The problem contain a numeric and symbolic module. Knowing the modules of the problem. There are two modules: one symbolic module and one numeric module.
WSEAS TRANSACTIONS on SIGNAL PROCESSING
Osslan Osiris Vergara Villegas, Humberto De Jesus Ochoa Dominguez, Vianey Guadalupe Cruz Sanchez, Efren David Gutierrez Casas, Gerardo Reyes Salgado
ISSN: 1790-5052 488 Issue 8, Volume 4, August 2008
Identify the knowledge transference lines. The knowledge transference is unidirectional.
7) Implementation. The system implemented was a neuro-symbolic hybrid system with a weak coupling, a chain integration mode and with unidirectional knowledge transference.
8) Results evaluation. In order to perform the test,
we used a data base of mini mammography of the Mammographic Image Analysis Society. Each image has 10 characteristics and its category according to the severity. The characteristics obtained are:
Characteristics: F - Fatty G - Fatty-glandular D - Dense-glandular Abnormality type: CALC – Calcification CIRC - Well-defined/circumscribed masses SPIC - Speculated masses MISC - Other, ill-defined masses ARCH - Architectural distortion ASYM – Asymmetry NORM – Normal Severity of the abnormality: B – Benign M – Malignant N – Normal (proposed by this work).
4 Tests and Results The results presented in this paper correspond to digital mammograms different from those used to determine the threshold.
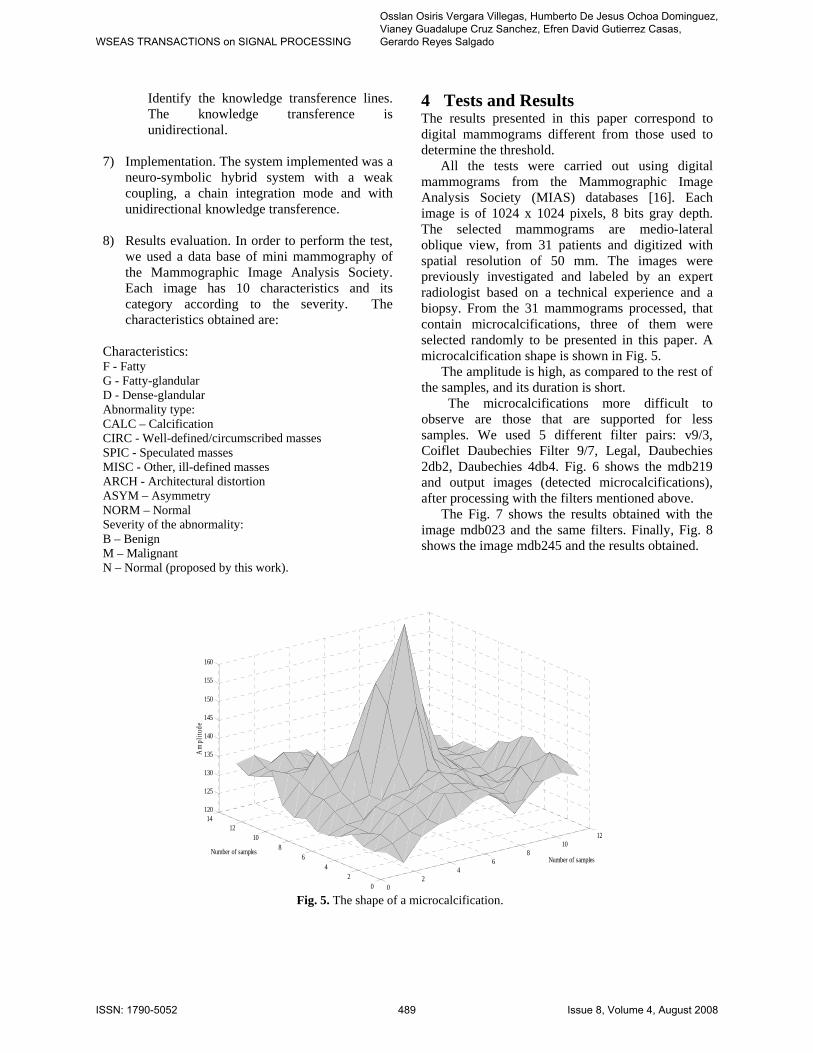
All the tests were carried out using digital mammograms from the Mammographic Image Analysis Society (MIAS) databases [16]. Each image is of 1024 x 1024 pixels, 8 bits gray depth. The selected mammograms are medio-lateral oblique view, from 31 patients and digitized with spatial resolution of 50 mm. The images were previously investigated and labeled by an expert radiologist based on a technical experience and a biopsy. From the 31 mammograms processed, that contain microcalcifications, three of them were selected randomly to be presented in this paper. A microcalcification shape is shown in Fig. 5.
The amplitude is high, as compared to the rest of the samples, and its duration is short.
The microcalcifications more difficult to observe are those that are supported for less samples. We used 5 different filter pairs: v9/3, Coiflet Daubechies Filter 9/7, Legal, Daubechies 2db2, Daubechies 4db4. Fig. 6 shows the mdb219 and output images (detected microcalcifications), after processing with the filters mentioned above.
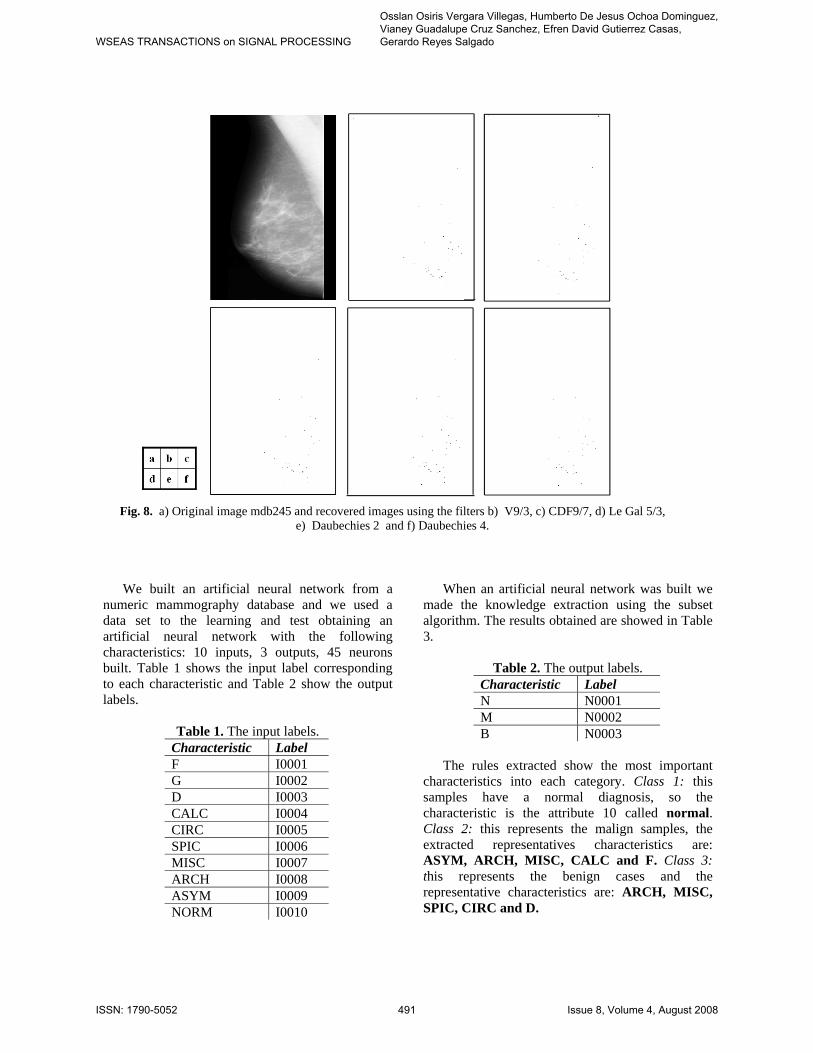
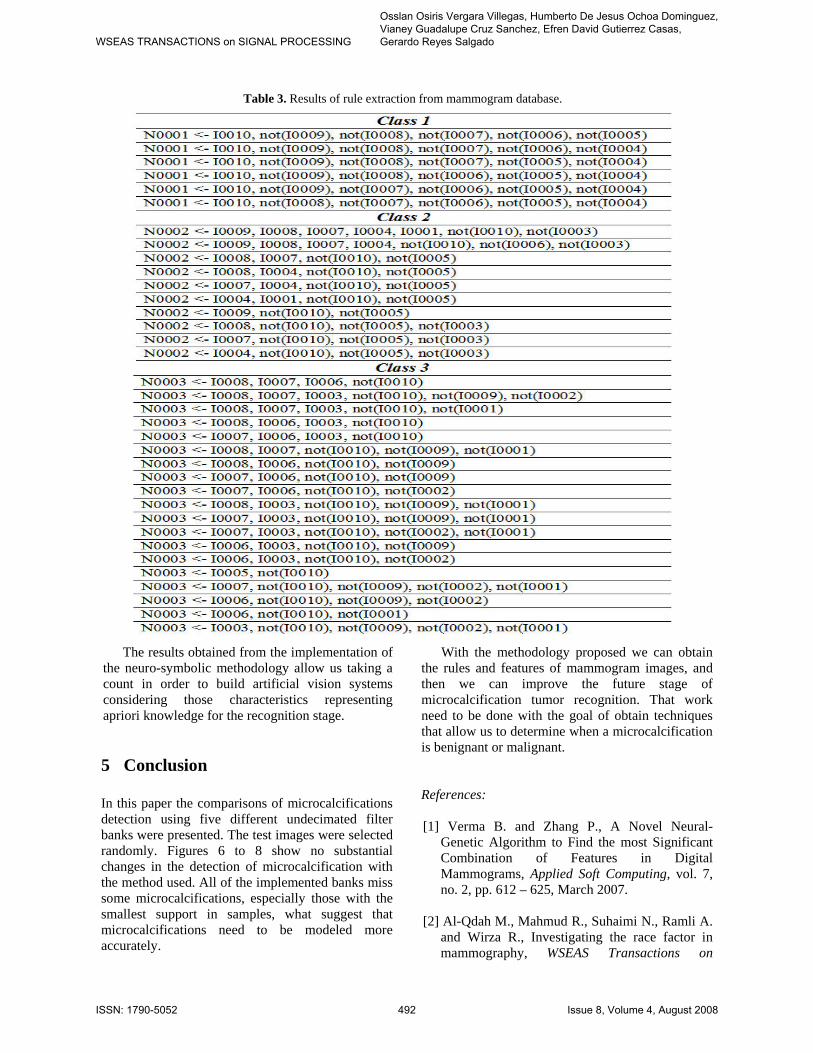
The Fig. 7 shows the results obtained with the image mdb023 and the same filters. Finally, Fig. 8 shows the image mdb245 and the results obtained.
Fig. 5. The shape of a microcalcification. 0
24
68
1012
02
46
810
1214
120
125
130
135
140
145
150
155
160
Number of samplesNumber of samples
Am
plitu
de
WSEAS TRANSACTIONS on SIGNAL PROCESSING
Osslan Osiris Vergara Villegas, Humberto De Jesus Ochoa Dominguez, Vianey Guadalupe Cruz Sanchez, Efren David Gutierrez Casas, Gerardo Reyes Salgado
ISSN: 1790-5052 489 Issue 8, Volume 4, August 2008
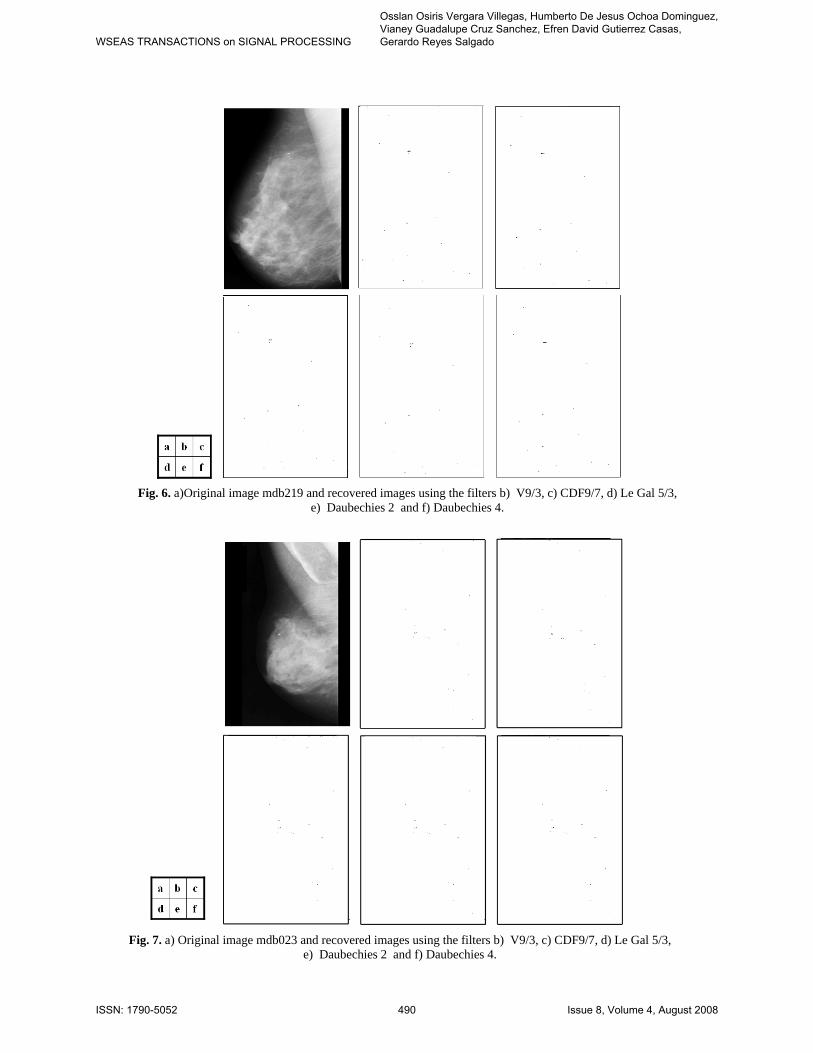
Fig. 7. a) Original image mdb023 and recovered images using the filters b) V9/3, c) CDF9/7, d) Le Gal 5/3, e) Daubechies 2 and f) Daubechies 4.
Fig. 6. a)Original image mdb219 and recovered images using the filters b) V9/3, c) CDF9/7, d) Le Gal 5/3, e) Daubechies 2 and f) Daubechies 4.
WSEAS TRANSACTIONS on SIGNAL PROCESSING
Osslan Osiris Vergara Villegas, Humberto De Jesus Ochoa Dominguez, Vianey Guadalupe Cruz Sanchez, Efren David Gutierrez Casas, Gerardo Reyes Salgado
ISSN: 1790-5052 490 Issue 8, Volume 4, August 2008
We built an artificial neural network from a
numeric mammography database and we used a data set to the learning and test obtaining an artificial neural network with the following characteristics: 10 inputs, 3 outputs, 45 neurons built. Table 1 shows the input label corresponding to each characteristic and Table 2 show the output labels.
Table 1. The input labels. Characteristic Label F I0001 G I0002 D I0003 CALC I0004 CIRC I0005 SPIC I0006 MISC I0007 ARCH I0008 ASYM I0009 NORM I0010
When an artificial neural network was built we made the knowledge extraction using the subset algorithm. The results obtained are showed in Table 3.
Table 2. The output labels.
Characteristic Label N N0001 M N0002 B N0003
The rules extracted show the most important
characteristics into each category. Class 1: this samples have a normal diagnosis, so the characteristic is the attribute 10 called normal. Class 2: this represents the malign samples, the extracted representatives characteristics are: ASYM, ARCH, MISC, CALC and F. Class 3: this represents the benign cases and the representative characteristics are: ARCH, MISC, SPIC, CIRC and D.
Fig. 8. a) Original image mdb245 and recovered images using the filters b) V9/3, c) CDF9/7, d) Le Gal 5/3, e) Daubechies 2 and f) Daubechies 4.
WSEAS TRANSACTIONS on SIGNAL PROCESSING
Osslan Osiris Vergara Villegas, Humberto De Jesus Ochoa Dominguez, Vianey Guadalupe Cruz Sanchez, Efren David Gutierrez Casas, Gerardo Reyes Salgado
ISSN: 1790-5052 491 Issue 8, Volume 4, August 2008
The results obtained from the implementation of
the neuro-symbolic methodology allow us taking a count in order to build artificial vision systems considering those characteristics representing apriori knowledge for the recognition stage.
5 Conclusion In this paper the comparisons of microcalcifications detection using five different undecimated filter banks were presented. The test images were selected randomly. Figures 6 to 8 show no substantial changes in the detection of microcalcification with the method used. All of the implemented banks miss some microcalcifications, especially those with the smallest support in samples, what suggest that microcalcifications need to be modeled more accurately.
With the methodology proposed we can obtain the rules and features of mammogram images, and then we can improve the future stage of microcalcification tumor recognition. That work need to be done with the goal of obtain techniques that allow us to determine when a microcalcification is benignant or malignant. References: [1] Verma B. and Zhang P., A Novel Neural-
Genetic Algorithm to Find the most Significant Combination of Features in Digital Mammograms, Applied Soft Computing, vol. 7, no. 2, pp. 612 – 625, March 2007.
[2] Al-Qdah M., Mahmud R., Suhaimi N., Ramli A.
and Wirza R., Investigating the race factor in mammography, WSEAS Transactions on
Table 3. Results of rule extraction from mammogram database.
WSEAS TRANSACTIONS on SIGNAL PROCESSING
Osslan Osiris Vergara Villegas, Humberto De Jesus Ochoa Dominguez, Vianey Guadalupe Cruz Sanchez, Efren David Gutierrez Casas, Gerardo Reyes Salgado
ISSN: 1790-5052 492 Issue 8, Volume 4, August 2008
Systems, vol. 3, no.10, pp. 2952-2957, December 2004.
[3] Essam A., Rashed E. A., Ismail A., Ismail B.
and Sherif I., Multiresolution Mammogram Analysis in Multilevel Decomposition, Pattern Recognition Letters, vol. 28, no. 2, pp. 286 – 292, January 2007.
[4] Lascu M., Lascu D., Tanase M. and Lie I.,
Image Processing Techniques in Digital Mammography using LabVIEW, WSEAS Transactions on Circuits and Systems, vol. 5, no.7, pp. 887-894, July 2006.
[5] Engan K. and Gulsrad T., Varmet – A method
for Detection of Image Singularities with Application to Mammography, WSEAS Transactions on Signal Processing, vol. 2, no. 9, pp. 1222-1229, September 2006.
[6] Khamlichi Y. I., Machkour M., Afdel K. and
Moudden A., Multiple Watermark for Tamper Detection in Mammography Image, WSEAS Transactions on Computers, vol. 5, no. 6, pp. 1222-1226, June 2006.
[7] Khuwaja G. Computer-Aided Breast Cancer
Detection with Neural Networks using Digital Mammography, WSEAS Transactions on Signal Processing, vol. 2, no. 5, pp. 811-818, May 2006.
[8] Sickles A. E., Mammographic Features of Early
Breast Cancer, American Journal of Roentgenology, vol. 143, no. 3, pp. 461 – 464, May 1984.
[9] Bird R. E., Wallace T. W. and Yankaskas B. C.,
Analysis of Cancers Missed at Screening Mammography, Radiology, vol. 184, pp. 613 – 617, 1992.
[10] Al-Qdaha M., Rahman Ramlib A. and
Mahmudc R., A System of Microcalcifications Detection and Evaluation of the Radiologist: Comparative Study of the Three Main Races in Malaysia, Computers in Biology and Medicine, vol. 35, no.10, pp. 905 – 914, December 2005.
[11] Wang T. C. and Karayiannis N. B., Detection of Microcalcifications in Digital Mammograms Using Wavelets, IEEE Transactions on Medical Imaging, vol. 17, no. 4, pp. 498 - 509, August 1998.
[12] Strang G. and Nguyen T., Wavelets and Filter
Banks, Wesley Cambridge Press, 1997. [13] Bopardikar A., Raghuveer M. and Adiga B.,
Perfect Reconstruction Circular Convolution Filter Banks and their Application to the Implementaion of Bandlimited Discrete Wavelet Transforms, IEEE International Conference on Acoustics, Speech and Signal Processing (ICASSP), vol. 5, pp.3665, April 1997.
[14] Vetterli M., Filter Banks Allowing Perfect
Reconstruction, Signal Processing, vol. 10, no. 3, pp. 219 - 244, April 1986.
[15] Yu S. N., Li K. Y. and Huang Y. K., Detection
of Microcalcifications in Digital mammograms Using Wavelet Filter and Markov Random Field Model, Computerized Medical Imaging and Graphics, vol. 30, no. 3, pp. 163-173, April 2006.
[16] Suckling J., Parker J., Dance D. Astley S., Hutt
I., Boggis C., Ricketts I., Stamatakis E., Cerneaz N., Kok S., Taylor P., Betal D. and Svage J., The Mammographic Image Analysis Society Digital Mammogram Database, Exerpta Medica, International Congress Series 1069, pp. 375 – 378, 1994.
[17] Osorio F. S., An Hybrid System for
Constructive Machine Learning, Ph. D. dissertation, LEIBNIZ - IMAG –INPG Laboratory, France, 1998.
WSEAS TRANSACTIONS on SIGNAL PROCESSING
Osslan Osiris Vergara Villegas, Humberto De Jesus Ochoa Dominguez, Vianey Guadalupe Cruz Sanchez, Efren David Gutierrez Casas, Gerardo Reyes Salgado
ISSN: 1790-5052 493 Issue 8, Volume 4, August 2008
Related Documents