Room Service: Patient Expectations and Experiences Kirsten Ivana Dayrit Garcia A thesis submitted in partial fulfillment of the requirements for the degree of Master of Dietetics At the University of Otago, Dunedin, New Zealand November 2018

Welcome message from author
This document is posted to help you gain knowledge. Please leave a comment to let me know what you think about it! Share it to your friends and learn new things together.
Transcript
Room Service: Patient Expectations and Experiences
Kirsten Ivana Dayrit Garcia
A thesis submitted in partial fulfillment of the requirements for the degree of
Master of Dietetics
At the University of Otago, Dunedin, New Zealand
November 2018
ii
Abstract
Background: Patient expectations and the foodservice are largely overlooked in patient
experience research. Hospital foodservices face added challenges being subject to a
negative stereotype. Hotel-style room service is a current innovation in hospital
foodservices seeking to improve patient experiences and reverse long-held images.
Objective: To assess and determine the impact of the first hospital room service system
in New Zealand on patient foodservice expectations and experiences, in a private
hospital setting.
Methods: To determine the impact of room service on patient experience, this study
replicates the design of a mixed-method study undertaken at the study hospital in 2016
when a traditional hospital ordering and delivery foodservice system was in place.
Patients booked for at least a one-night stay during the three-week data collection period
were recruited (n=38). The foodservice was assessed using four foodservice quality
constructs; food quality; meal service quality; staff and service issues; and hunger and
satiety. Patient expectations and experiences were quantitatively collected using an
adapted version of the 2016 questionnaire. A sub-sample (n=16) of participants
participated in semi-structured interviews prior to admission to determine explanatory
factors for their expectations scores. Findings were compared to the results of the 2016
study.
Results: Questionnaire results showed patients’ high expectations were generally met or
exceeded by their room service experiences. A statistically significant difference was
seen between mean expectation and experience scores for the food quality and hunger
and satiety constructs. Participants with previous foodservice experience at the study
hospital, and those over 65 years of age had higher expectations for these constructs. No
iii
differences between age or gender groups were apparent in experience scores.
Experience scores for the temperature of meals and drinks were lower than expectation
scores, suggesting an area of improvement for the foodservice. Sixty percent of
participants experienced a clinical condition that affected their ability to consume and
enjoy the hospital meals. Tolerance of institutional systems emerged as the strongest
explanatory factor for patient expectations followed by past experiences and post-
operative clinical condition. The largest difference in patient expectations and
experiences between room service and a traditional hospital foodservice system
captured in this study was higher experience scores for the hunger and satiety construct.
Conclusion: Patients have realistic expectations of hospital foodservices which is based
on their past experiences and understanding of institutional systems. Institutional
systems tolerance moderates patients’ expectations however, expectations are still high
for room service as a personalized service and for a private institution. Hospital room
service generated high patient experience scores, notably for hunger and satiety with
increased access to food compared to the traditional hospital foodservice system. A
patient’s clinical condition has an influence on their foodservice experience and
warrants further investigation as a moderator of quality perceptions. Assessing patient
expectations and experiences is a reliable form of feedback for foodservices,
successfully identifying areas for improvement.
iv
Preface
The candidate undertook this research as part of the requirements for the Masters of
Dietetics degree. The research was originally proposed by Dr Penny Field, primary
supervisor and Kirsten Webster, secondary supervisor; alongside Ashley Calkin,
Dietetic advisor. The project was funded by the Department of Human Nutrition,
University of Otago. The research was conducted in a period of 28 weeks between
September 2017 and November 2018. The candidate was responsible for the following
under supervision from her supervisors, Mercy Hospital Dietitian Victoria Wood and
the Study Statistician Dr Jill Haszard:
• Refinement of study protocol
• Critical review of the literature on room service and patient foodservice
expectations and experiences.
• Contributing to ethics applications to the University of Otago and Mercy
Hospital.
• Contributing to application for Maori Consultation, University of Otago.
• Questionnaire and interview development and pretesting
• Development of study information and consent forms for participants.
• Recruitment of participants
• Administering data collection; distribution and collection of questionnaires and
interviewing of patients.
• Selective transcribing of interviews
• Qualitative data analysis
• Statistical analysis
• Synthesizing data
• Drafting and final write up of thesis.

v
Subscale analyses and linear regression analysis was undertaken by Dr Jill Haszard
(Biostatistician, Department of Human Nutrition, University of Otago).
vi
Acknowledgements
I am humbled to think of all the individual people that have had a part to play and
supported me through this thesis. To my kind participants, dear friends, the supportive
staff in the nutrition department and Mercy Hospital, and fellow dietetics classmates for
the solidarity. Thank you.
A very special thank you to:
Firstly, my supervisors, Penny and Kirsten. For both of your dedication, guidance, and
thorough proof-reading that has massively shaped this thesis. Your mentoring through
this research process has been invaluable.
Ash and Vikki for inspiring me and helping me grow as a Dietitian. As well as
providing me with the ultimate room service experience.
Charlotte, for counselling me through to my woes and our beneficial procrastinating.
Nick, for pushing me when I needed it and all the little things that helped get me
through each day. You help me believe I can do hard things.
Lastly, my family, especially Mum and Dad. For getting me to this point and instilling
the values for me to achieve my goals. Iskul-bukol no more!
vii
Table of Contents
Abstract ............................................................................................................................. ii
Preface ............................................................................................................................. iv
Acknowledgements ......................................................................................................... vi
Table of Contents ........................................................................................................... vii
List of Tables ................................................................................................................... ix
List of Figures .................................................................................................................... x
List of Abbreviations ....................................................................................................... xi
1 Introduction ............................................................................................................... 1
2 Literature Review ...................................................................................................... 3
2.1 Foodservice systems in hospitals ....................................................................... 3
2.2 Room service ..................................................................................................... 7
2.3 Patient expectations and experience ................................................................ 12
2.4 Conclusion ....................................................................................................... 17
3 Objective Statement ................................................................................................. 18
4 Subjects and Methods .............................................................................................. 20
4.1 Study design .................................................................................................... 20
4.2 Development of data collection tools .............................................................. 23
4.3 Data collection ................................................................................................. 26
4.4 Analysis ........................................................................................................... 31
4.5 Quality considerations ..................................................................................... 35
5 Results ..................................................................................................................... 37
5.1 Response rate ................................................................................................... 37
viii
5.2 Study participant characteristics ...................................................................... 38
5.3 Questionnaire results ....................................................................................... 40
5.4 Qualitative results ............................................................................................ 48
6 Discussion ................................................................................................................ 58
6.1 Patient expectations and experiences of room service .................................... 58
6.2 Room service vs traditional hospital foodservice system ................................ 61
6.3 Strengths and limitations ................................................................................. 63
6.4 Implications for future research ....................................................................... 63
6.5 Conclusion ....................................................................................................... 64
7 Application to Practice ............................................................................................ 65
7.1 Reflection ........................................................................................................ 66
8 References ............................................................................................................... 67
9 Appendices .............................................................................................................. 74
ix
List of Tables
Table 1. Participant characteristics .................................................................................. 39
Table 2. Subscale analysis by foodservice construct ....................................................... 42
Table 3. Key statistics analysis by construct and question .............................................. 43
Table 4. Influence of prior experience on expectations and experience ......................... 44
Table 5. Length of stay and experience scores by construct ........................................... 45
Table 6. Mean expectations and experience score differences by gender and age group.
......................................................................................................................................... 46
Table 7. Experienced clinical conditions reported by participants .................................. 47
Table 8. Mean expectations and experience scores between traditional and room service
foodservice systems ......................................................................................................... 48
Table 9. Explanatory factors for patient expectations by foodservice system ................ 57
x
List of Figures
Figure 1. Three phases of data collection ........................................................................ 21
Figure 2. Study participants by stage............................................................................... 37
Figure 3. Mean expectations vs mean experiences scores............................................... 41
Figure 4. Explanatory factors for patient’s hospital foodservice and room service
expectations ..................................................................................................................... 49
xi
List of Abbreviations
ACHFPSQ Acute Care Hospital Foodservice Patient Satisfaction Questionnaire
CI Confidence Interval
Cronbach’s α Cronbach’s alpha
FEQ Foodservice Expectations Questionnaire
FEEQ Foodservice Expectations and Experiences Questionnaire
n= Number
POS Point of Service
Q Question
SD Standard Deviation
1
1 Introduction
For most patients, the hospital foodservice makes a major contribution to their overall
hospital experience (1–5). The foodservice has an important role as the sole provider of
nutrition for patients (3,6–8). In spite of ongoing quality improvement initiatives,
malnutrition rates in hospitals remain high (8–10). Poor food intake in hospitals not only
has implications for patient recovery but also results in high plate waste, which has
environmental and financial costs (7,10,11). A further complication is the negative
stereotype of hospital food, often reflected in media criticism (12–15). These issues can
be the result of patient dissatisfaction with the foodservice, and suggest that the
foodservice is not providing a high quality service (2,7,10).
Previously, the most commonly used patient-centered measure of hospital service
quality was patient satisfaction (2,16). In recent times, this measure has moved to
patient experience, which is considered to be a broader measure than patient satisfaction
(16–18). Experience as a measure focuses on patients’ overall perception of a service
based on actual events (16–18). Patient experience is now an important form of
feedback for hospital services and is being widely used as a quality performance
indicator for patient-centered services, including foodservices (17,19–21). Hospital
foodservice experience is an emerging field, however it is hampered by often not being
included in general inpatient experience research (3,19,22).
According to expectation disconfirmation theory from the field of marketing,
expectations are strong determinants of experiences (23–27). For quality assessments,
expectations add context to experience scores and when compared, can be used to
highlight gaps in the quality of a service and direct decisions for improvements (24–28).
In the realm of the hospital foodservice, hospital food providers who understand what
patients expect, will be able to enhance their experience and ensure they receive optimal
2
nutrition while under the foodservice’s care (13,23,24,29). To date, expectations have
been rarely or only superficially investigated in patient experience and foodservice
research (18,24,28,30).
In order to improve patient experience, hospital foodservices are seeking new methods
of providing food to patients (31–33). Hotel-style room service is an innovation in
hospital foodservices that is challenging the current norms of hospital food (3,5,33–35).
This foodservice system counters some of the inconveniences patients’ face with a
traditional hospital foodservice by giving patients the autonomy to order their food on
demand, and receive it within a set timeframe (5,34,36). Room service is known to
enhance aspects of the patient foodservice experience and increase patient ratings for
the quality of the food and service (5,10,11,31,36–39). Room service has had rising
popularity in hospitals overseas but only recently has been implemented in a New
Zealand hospital (3,33,40,41).
A private hospital located in Dunedin, New Zealand, transitioned to a hotel-style room
service in February 2018 (41–43). With the room service foodservice system, patients
can order food anytime between 7am and 7pm from an a-la-carte menu, and the meal
will be delivered within 45 minutes (41,42).
The impact of a hospital room service system is unknown in New Zealand, let alone
what patients expect from room service and how this compares to a traditional hospital
foodservice. This study will investigate New Zealand patients’ expectations and
experiences of hospital room service.
3
2 Literature Review
Hotel-style room service systems are emerging as a new approach to enhancing hospital
foodservice (3,5,29,33,44). A hospital foodservice is a complex system comprising of
unified functional sub-systems related to the production, distribution and serving of
food to patients (32,45–48). Differences between hospital foodservice systems have
been shown to influence how much patients eat and their level of satisfaction with the
foodservice (2,3,5,35,49). Room service is becoming increasingly popular as patients
and foodservice managers perceive it to deliver higher quality food and service
compared to alternative, traditional hospital foodservice systems (10,11,33,37,44,50). A
concurrent trend is the use of patient experience as a quality measure for health services,
including hospital foodservices (3,17–21,48,51,52).
The aim of this literature review is to explore the influence of room service as a hospital
foodservice system on patient foodservice experience. The relationship between patient
foodservice expectations and experiences will also be examined, followed by a brief
review of their measurement tools.
Literature was obtained from multiple searches of the following databases; ProQuest,
Ovid, University of Otago and PubMed. The key search words used singly and in
combination were; Patient, Expectation/s, Experience/s, Satisfaction, Room Service,
Hospital, Foodservice, Food and Meal.
2.1 Foodservice systems in hospitals
Decisions to change hospital foodservice systems are driven by many factors, including
an increasing number of patients expressing their dissatisfaction with hospital food
(3,5,7). Advances in technology have also enabled foodservices to streamline their
processes to cater for large groups of people (53,54). In some countries and commercial
4
enterprises such as private hospitals, change has been driven by competitive health
markets that push health providers to meet or exceed patient expectations, while finding
cost-efficient ways to do so (5,29,55). To understand how hospital foodservice systems
including room service systems operate, it is important to first consider the parts or
subsystems that make up a foodservice system, in particular ordering and delivery
systems.
2.1.1 Meal ordering systems
The timing and method of meal ordering has an important influence on a patient’s
experience of the foodservice (31,35,53,54). In a traditional hospital foodservice system
with set meal times, patients order their food choices up to a day in advance (46). This
enables the foodservice to accurately forecast and prepare appropriate quantities of
food, minimizing food waste in production (46). A key disadvantage of this system is
the cost to the patient, who is required to order in advance. This is challenging as
patients have to assume what they will feel like eating in the future and will not be able
to make changes if their appetite, clinical condition or prescribed diet changes
(31,35,54). Often, this results in plate waste and ordered meals being discarded (10,48).
An alternative system is Point of Service (POS), which addresses some of the shortfalls
of traditional hospital meal ordering. POS systems enable patients to order their food
choices closer to the time of consumption (34,35,49). POS ordering is most commonly
associated with bulk trolley and room service (35,49). A bulk trolley meal delivery
system delivers food to the wards that is then plated to order during set meal times.
Patients are able to select and portion their meals according to their appetite and
preferences at the time (35,49). Whereas room service enables patients to order within a
wider, more flexible timeframe rather than during set meal times (31,37,38). This
flexibility in ordering has been shown to be beneficial in increasing food intake for
5
those who are very ill, have nausea or a decreased appetite as it increases food access
for when patients are hungry outside standard meal times (5,31,36,37).
POS facilitates patient choice by enabling patients to choose what and how much food
they would like to receive close to the time they consume it (35,48). This has been
shown to result in increased food intake and decreased plate waste (10,35,48). Ensuring
adequate food intake in hospitals is crucial in preventing malnutrition (11,51,56).
Reducing food waste is beneficial for mitigating environmental impacts but can also
save costs for hospital foodservices which can act as a powerful motivator to change
systems (35).
Promoting patient choice through POS may also be more acceptable for modern day
patients because of the increase in self-service options in other parts of their lives. Self-
service amenities like ATMs, online ordering and self-checkouts in retail stores are now
common place. For some patients, food is a source of comfort and familiarity in an
anxiety provoking hospital setting (3,35,57). The increased choice with food in hospital
additionally offers a sense of autonomy, which the patients do not often have over their
hospital medical care (3,35,57). Increasing patient autonomy around food also helps
hospitals achieve an overarching quality goal of promoting patient-centered care
(10,17,58,59).
2.1.2 Meal delivery systems
Meal delivery systems are how hospital food is delivered to patients (distribution) and
how it is served to them (service) (45,47). Many traditional hospital foodservices
distribute meals using a tray service system. This typically entails the assembling of pre-
ordered meals on individualized trays on a tray line in the hospital kitchen, which are
then delivered to wards in trolleys and served to patients on the tray (45). Tray service
systems use a range of methods for managing food temperature; from heated plate
6
bases, insulated covers, or by delivering in thermalized carts (45). The tray line delivery
method is seen an effective approach to streamline the process of assembling and
delivering large quantities of patient meals (45). However, common patient complaints
of the tray delivery system are eating to the hospitals timeframe instead of their own
appetite, and receiving hot food cold and cold food hot (5,54). Room service in
particular counters these limitations, as patients are able to order on demand and have
their food delivered as soon as it is made (3,5,10,35).
2.1.3 Rationale for changing systems
Many studies have shown patients rate both bulk trolley and room service POS meal
ordering and delivery systems more positively than traditional hospital systems
(3,10,35–37,49). It is difficult to separate these outcomes to determine whether they are
a result of the ordering or delivery aspect of the system as the two subsystems are
interlinked. Therefore, their benefits are considered together below.
Changing ordering and delivery to a POS system has been shown to increase patients’
perception of the quality of hospital food in relation to flavour, texture and temperature
(35–37,49). Hartwell et al. compared patient ratings of a traditional tray line meal
delivery system, with ratings of a newly introduced bulk trolley system (49). With the
menu remaining unchanged, patient scores for temperature, flavour and texture of the
food with the bulk trolley system were higher (49). The temperature result may be based
only on patient perception, as the actual temperature was not measured in the study.
Nevertheless, the new method for ordering and delivery increased the perceived quality
of food when there was no change to the food itself (17). This increase in food quality
ratings is commonly seen when a POS system replaces a traditional foodservice system
(2,35).
7
Higher satisfaction ratings from POS systems are attributed to the enhanced interaction
between patients and service staff compared to traditional tray delivery (3,35). POS
demands greater communication and interaction with foodservice staff when patients
order and receive their meals. This interpersonal factor may also be why ordering with a
menu spoken by a staff member has higher satisfaction ratings compared to ordering on
written menus (21). One foodservice reported an increase in foodservice satisfaction
scores with no change to the food or menu, but through enhancing customer service (3).
Interpersonal elements may also increase patient satisfaction as interaction with service
staff can be a form of emotional support for patients, and part of the hospital experience
involves reducing the stress or anxiety from being unwell in hospital. This is a prime
example of how the foodservice plays an important role in offering comfort to its
patients (3). The main disadvantage to changing a hospital meal delivery system to POS
is the added staff expense involved in taking patients meal orders before each meal,
three or more times a day (5). This can be justified as a worthwhile investment for
hospital foodservices if it lifts patients’ perception of the food, improves their overall
experience and increases their food intake while in hospital (32).
2.2 Room service
Over the past two decades, hotel-style room service has become increasingly popular as
a form of hospital foodservice (3,5,44). Room service is defined as the “meal
distribution process where food service employees deliver cooked-to-order foods after a
patient has placed an order from a restaurant-style selective menu” (34). It has gained
popularity especially in America due to a competitive health market but is also seen in
Europe and Australia (10,11,29,44). Room service has been shown to increase both
patient food intake and satisfaction, enhance patient experience and reduce hospital
meal plate waste (3,10,31,47). The section below examines the influence of room
service on patient satisfaction and experience using four well-established constructs of
8
foodservice satisfaction; food quality, meal service quality, staff and service issues, and
hunger and satiety (1,8,24).
2.2.1 Food quality
The food quality construct assesses the physical sensory attributes, or the tangible
characteristics of the food itself, including the taste, flavour and presentation of the
meal, as well the intangible factor of menu variety (1).
Five studies assessing patient satisfaction with room service all report an increase in
food quality ratings compared to their previous traditional hospital foodservice system
(10,31,36–38). Interestingly, Doordujin et al. found no change in food quality ratings
(11). However, as all these studies used different measurement tools and most were not
validated, so comparison of results is difficult.
A reason why foodservice managers believe food quality is enhanced with room service
is due to the variety of made fresh to order menu choices that would be less possible
with other foodservice systems (5,36,37). Room service is usually associated with an
upscale, a la carte, static menu that includes “comfort foods”, so patients can choose
options from grilled salmon to macaroni and cheese (34,36,50). A room service menu
itself influences patient satisfaction, as Wadden et al. found, with an increase in overall
patient and food quality satisfaction with a room service menu compared to a traditional
cyclic menu (50). Acute stay patients also have more items to choose from compared to
the standard 2-3 main options that are typically offered with a traditional hospital cyclic
menu (5,29,36). However, a static menu can be a concern for long term patients who
can become weary of the same menu choices every day. Some hospitals with room
service have countered this by offering a separate menu for these patients (60).
9
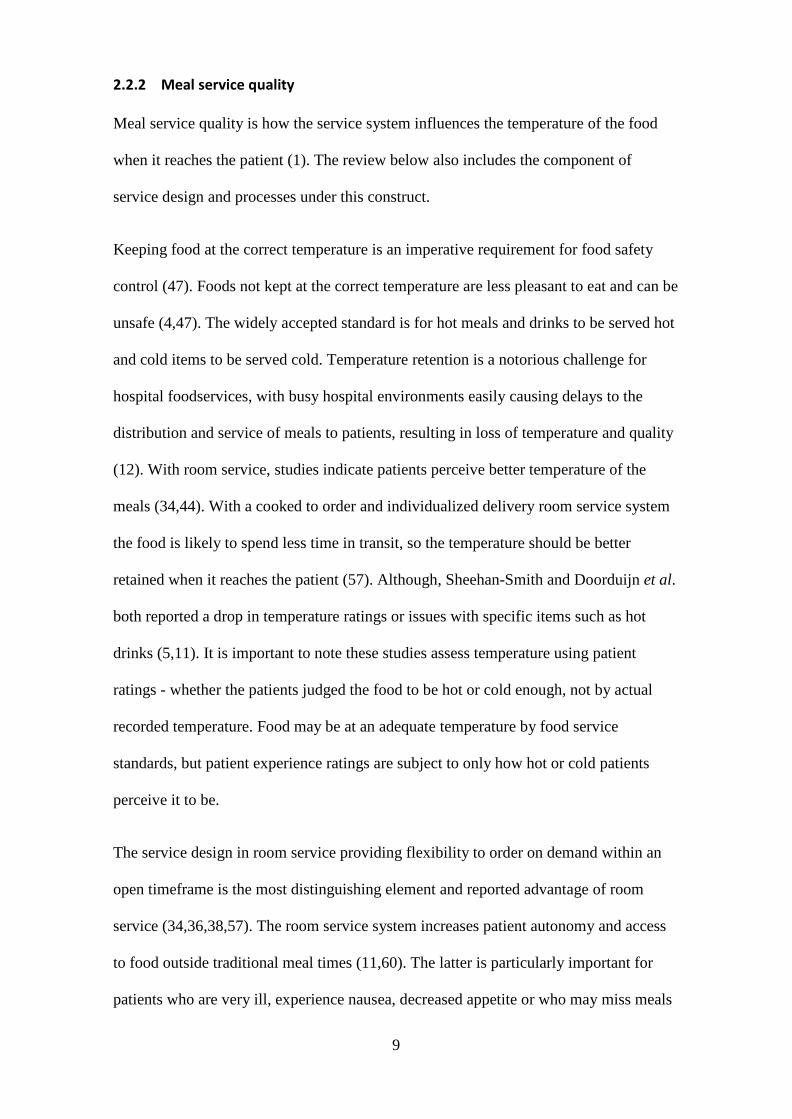
2.2.2 Meal service quality
Meal service quality is how the service system influences the temperature of the food
when it reaches the patient (1). The review below also includes the component of
service design and processes under this construct.
Keeping food at the correct temperature is an imperative requirement for food safety
control (47). Foods not kept at the correct temperature are less pleasant to eat and can be
unsafe (4,47). The widely accepted standard is for hot meals and drinks to be served hot
and cold items to be served cold. Temperature retention is a notorious challenge for
hospital foodservices, with busy hospital environments easily causing delays to the
distribution and service of meals to patients, resulting in loss of temperature and quality
(12). With room service, studies indicate patients perceive better temperature of the
meals (34,44). With a cooked to order and individualized delivery room service system
the food is likely to spend less time in transit, so the temperature should be better
retained when it reaches the patient (57). Although, Sheehan-Smith and Doorduijn et al.
both reported a drop in temperature ratings or issues with specific items such as hot
drinks (5,11). It is important to note these studies assess temperature using patient
ratings - whether the patients judged the food to be hot or cold enough, not by actual
recorded temperature. Food may be at an adequate temperature by food service
standards, but patient experience ratings are subject to only how hot or cold patients
perceive it to be.
The service design in room service providing flexibility to order on demand within an
open timeframe is the most distinguishing element and reported advantage of room
service (34,36,38,57). The room service system increases patient autonomy and access
to food outside traditional meal times (11,60). The latter is particularly important for
patients who are very ill, experience nausea, decreased appetite or who may miss meals
10
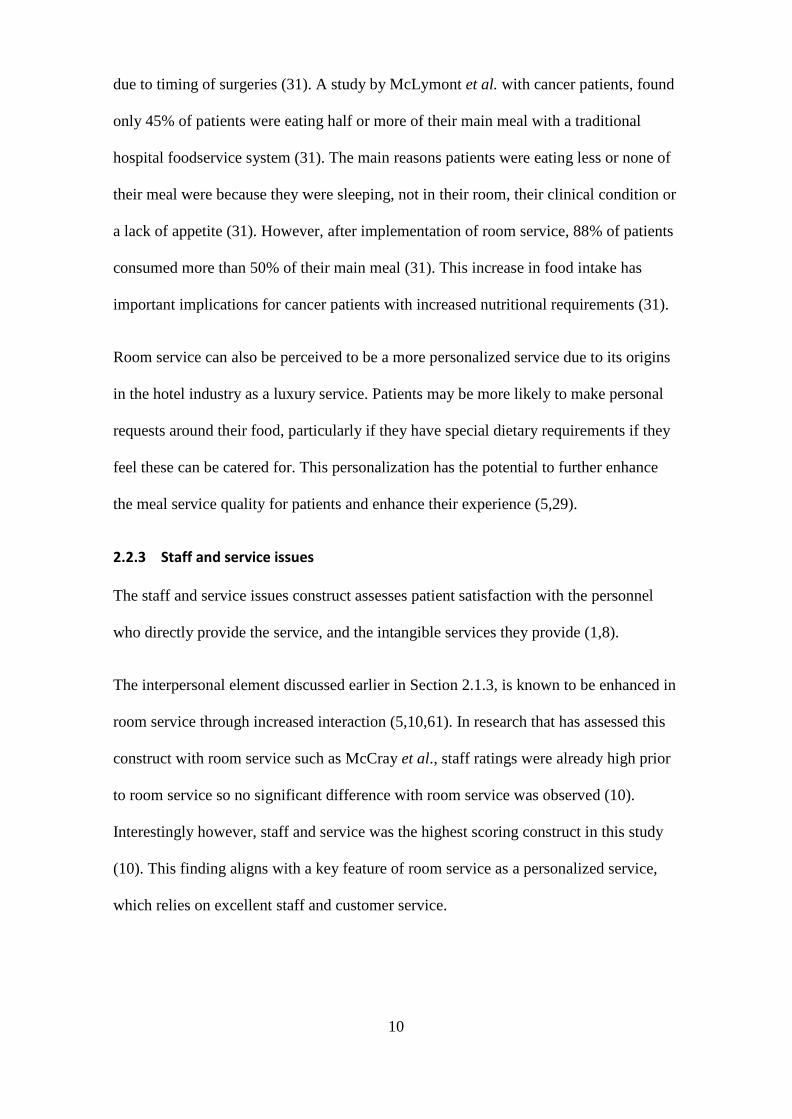
due to timing of surgeries (31). A study by McLymont et al. with cancer patients, found
only 45% of patients were eating half or more of their main meal with a traditional
hospital foodservice system (31). The main reasons patients were eating less or none of
their meal were because they were sleeping, not in their room, their clinical condition or
a lack of appetite (31). However, after implementation of room service, 88% of patients
consumed more than 50% of their main meal (31). This increase in food intake has
important implications for cancer patients with increased nutritional requirements (31).
Room service can also be perceived to be a more personalized service due to its origins
in the hotel industry as a luxury service. Patients may be more likely to make personal
requests around their food, particularly if they have special dietary requirements if they
feel these can be catered for. This personalization has the potential to further enhance
the meal service quality for patients and enhance their experience (5,29).
2.2.3 Staff and service issues
The staff and service issues construct assesses patient satisfaction with the personnel
who directly provide the service, and the intangible services they provide (1,8).
The interpersonal element discussed earlier in Section 2.1.3, is known to be enhanced in
room service through increased interaction (5,10,61). In research that has assessed this
construct with room service such as McCray et al., staff ratings were already high prior
to room service so no significant difference with room service was observed (10).
Interestingly however, staff and service was the highest scoring construct in this study
(10). This finding aligns with a key feature of room service as a personalized service,
which relies on excellent staff and customer service.
11
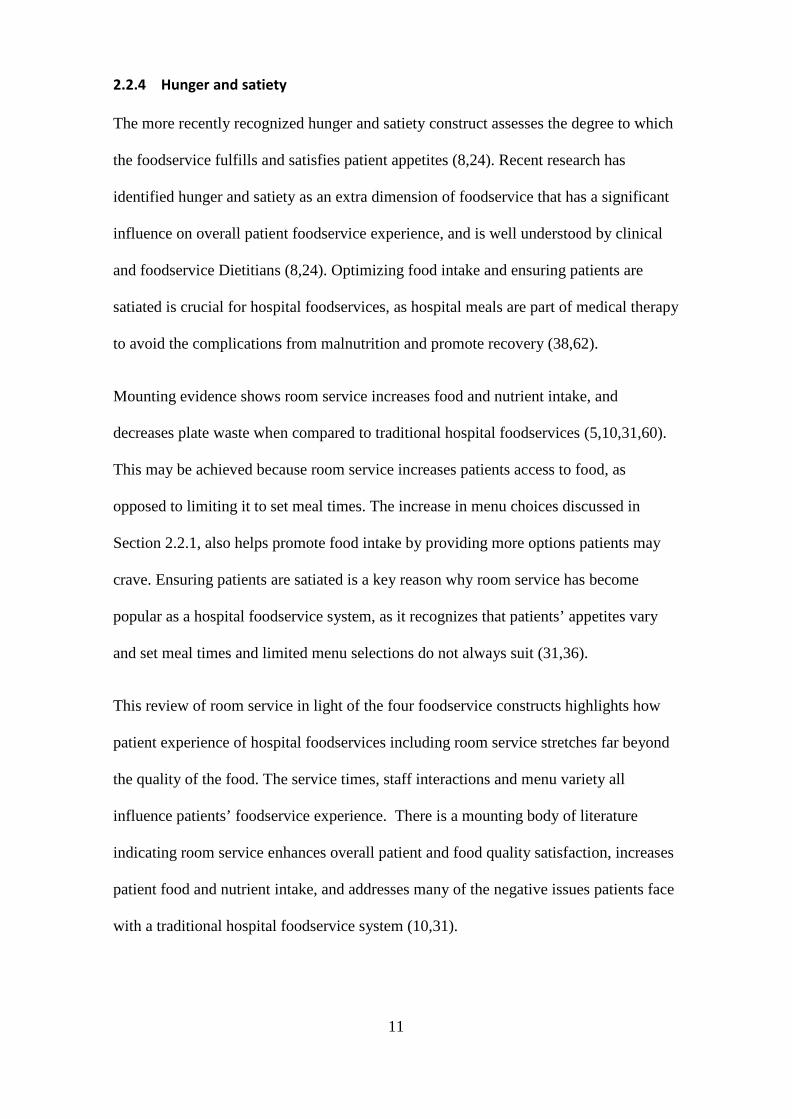
2.2.4 Hunger and satiety
The more recently recognized hunger and satiety construct assesses the degree to which
the foodservice fulfills and satisfies patient appetites (8,24). Recent research has
identified hunger and satiety as an extra dimension of foodservice that has a significant
influence on overall patient foodservice experience, and is well understood by clinical
and foodservice Dietitians (8,24). Optimizing food intake and ensuring patients are
satiated is crucial for hospital foodservices, as hospital meals are part of medical therapy
to avoid the complications from malnutrition and promote recovery (38,62).
Mounting evidence shows room service increases food and nutrient intake, and
decreases plate waste when compared to traditional hospital foodservices (5,10,31,60).
This may be achieved because room service increases patients access to food, as
opposed to limiting it to set meal times. The increase in menu choices discussed in
Section 2.2.1, also helps promote food intake by providing more options patients may
crave. Ensuring patients are satiated is a key reason why room service has become
popular as a hospital foodservice system, as it recognizes that patients’ appetites vary
and set meal times and limited menu selections do not always suit (31,36).
This review of room service in light of the four foodservice constructs highlights how
patient experience of hospital foodservices including room service stretches far beyond
the quality of the food. The service times, staff interactions and menu variety all
influence patients’ foodservice experience. There is a mounting body of literature
indicating room service enhances overall patient and food quality satisfaction, increases
patient food and nutrient intake, and addresses many of the negative issues patients face
with a traditional hospital foodservice system (10,31).
12
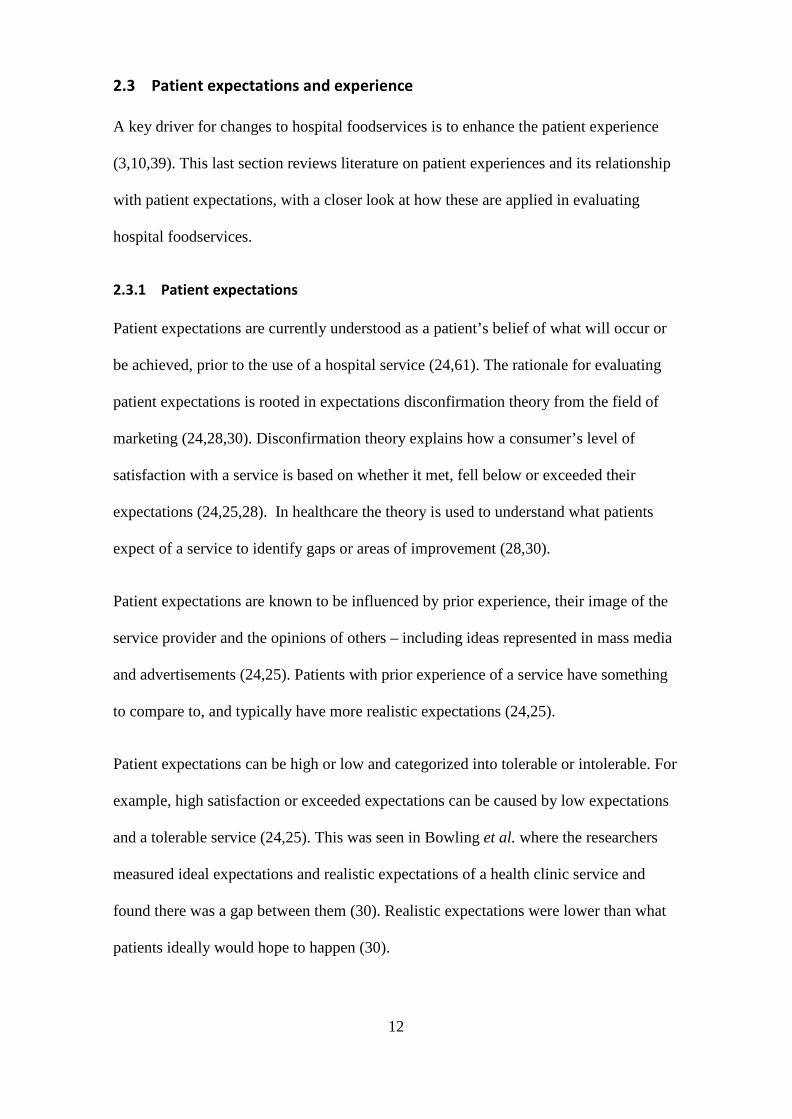
2.3 Patient expectations and experience
A key driver for changes to hospital foodservices is to enhance the patient experience
(3,10,39). This last section reviews literature on patient experiences and its relationship
with patient expectations, with a closer look at how these are applied in evaluating
hospital foodservices.
2.3.1 Patient expectations
Patient expectations are currently understood as a patient’s belief of what will occur or
be achieved, prior to the use of a hospital service (24,61). The rationale for evaluating
patient expectations is rooted in expectations disconfirmation theory from the field of
marketing (24,28,30). Disconfirmation theory explains how a consumer’s level of
satisfaction with a service is based on whether it met, fell below or exceeded their
expectations (24,25,28). In healthcare the theory is used to understand what patients
expect of a service to identify gaps or areas of improvement (28,30).
Patient expectations are known to be influenced by prior experience, their image of the
service provider and the opinions of others – including ideas represented in mass media
and advertisements (24,25). Patients with prior experience of a service have something
to compare to, and typically have more realistic expectations (24,25).
Patient expectations can be high or low and categorized into tolerable or intolerable. For
example, high satisfaction or exceeded expectations can be caused by low expectations
and a tolerable service (24,25). This was seen in Bowling et al. where the researchers
measured ideal expectations and realistic expectations of a health clinic service and
found there was a gap between them (30). Realistic expectations were lower than what
patients ideally would hope to happen (30).
13
2.3.2 Patient experience
Patient satisfaction was previously the standard quality measure used in monitoring the
quality of hospital care and services (17,18). In recent times patient satisfaction is being
replaced by patient experience (16–18). Patient satisfaction asks patients opinion in
rating the quality of a service (16–18). Whereas patient experience encompasses patient
satisfaction and more, as experience is a broader concept which assesses actual events
that did and did not occur (16–18). There is a consensus emerging on the use of patient
experience as a measure for health services because it captures quality dimensions that
are difficult to evaluate objectively (16–18).
Following disconfirmation theory, experience is strongly determined by expectations
prior to receiving the service . An individual’s expectations are what they compare their
experience to, which determines their rating of quality of the service (24,25,28).
Considering patient expectations adds context to patient experience scores but there is a
limited amount of research that has done this.
2.3.3 Patient foodservice expectations and experience
Appendix A i. summarizes studies which have examined patients views on aspects of
their foodservice experience, collected either prior to receiving the service (to assess
expectations) and/or after experiencing the service. Although most studies do not
measure experiences explicitly since patient foodservice experience is still a relatively
new concept, they do assess aspects of what was experienced. Three related food or
patient expectations and experience studies are included in Appendix A ii. for
comparison. In studies using disconfirmation theory to explore expectations,
expectations are compared to the actual received service and the “gap” between them is
deemed to be an indicator of quality. The literature review tables in Appendix A reveal
that expectations are not commonly researched alongside experience or satisfaction,
14
even though expectations are considered to be a strong determining factor. The time
when the tool was administered is also noted as some literature suggests this has an
influence on experience scores, with inpatient surveys scoring higher than those
completed post-discharge (2,17).
2.3.4 Measurement tools
At present, there are no known tools developed solely to measure patient foodservice
expectations apart from Lowerson’s 2016 Foodservice Expectations Questionnaire
(FEQ) (24). Although Lowerson created the first explicit and validated tool measuring
foodservice expectations, foodservice expectations have been explored using similar
methods in previous literature (24). A PhD thesis by a leading hospital foodservice
researcher reports a study design similar to the FEQ study and collected information
from patients prior to their experience of a meal service, with one question asking how
satisfied did the patient expect to be with their meal (48). The widely used Acute Care
Hospital Foodservice Patient Satisfaction Questionnaire (ACHFPSQ) also has one
question that asks patients whether the food met their expectations (1,7,8,23,32,62).
Studies using the ACHFPSQ have found that expectations are a strong predictor of
patient satisfaction with the foodservice (23,62). Simply asking if meals met
expectations however, provides no context for what their expectations were, nor any
detail on where improvements could be made.
There is demand for a standardized universal tool to assess patient expectations. Patients
today are more educated about their food than they have been in the past, and this is
continuing to intensify as public interest in nutrition and cuisine grows (45,50).
Foodservices have to keep up with this trend (32,48). New Zealand Health Partnerships
recognize that patient expectations are evolving, and hospital foodservices should reflect
15
this change (63). There is no public documentation however, of how they will
investigate patient expectations.
A number of authors have found that patient foodservice expectations are affected by
institutional stereotyping (12,13,48,54). Institutional stereotyping is the negative stigma
consumers often place on hospital food before they have experienced it, due to how
hospital food is represented in mass media (13). Commonly, this results in low
expectations for hospital foodservices compared to other commercial foodservices
(2,13,20). The carryover effect on patient foodservice experience has not yet been
explored.
As noted in Section 2.2 above, patient experience of the foodservice is not solely based
on the quality of the food received (1,24,54,62,64). Multiple tangible and intangible
factors collectively determine the overall experience. This is why tools used to assess
experience are often separated into constructs such as; food quality, meal service
quality, staff and service issues and hunger and satiety (1,8,65). Food quality is often the
strongest predictor of patient satisfaction, usually followed by staff and service issues
(1,8,32,64). However the constructs are interdependent (35). For example food quality
is influenced by the other constructs, in room service; quick delivery time (meal service)
retains the quality of food, and interpersonal interaction with staff can increase patients’
perception of the food quality (35). One limitation of assessing the foodservice
holistically is that issues with specific meal items can be overlooked (56). Hannan-Jones
and Capra have addressed this by developing an assessment tool for single meal items,
to be used in conjunction with experience surveys (56).
Although patient experience is becoming a widely used measure, no gold standard
measurement tool for patient experiences exists (2,18). In hospital foodservice, patient
16
experience is an emerging field, so quality assessment tools are typically self-
administered written questionnaires still measuring patient satisfaction (2,51). As
illustrated in Appendix A i., some foodservice studies utilize qualitative methods such
as interviewing to collect descriptive information (2). Alternative methods in
foodservice experience research also include; meal time observations, focus groups with
patients and free text survey comments (2).
Lack of a universal tool is also true for assessing general hospital experience (18). A
comprehensive 2015 review found 13 different published patient experience tools of
which; nine used quantitative methods such as a survey (of which six were validated)
and four used a mix of a qualitative method alongside a quantitative method (18).
However, all the tools reviewed only collected information at the “generalizable, less
descriptive” level. This is a limitation of quantitative data in experience research,
insufficient detailed information is collected to use as the basis for organizational
changes, and explains why patient interviews are becoming more popular (17,18). This
review also noted that no validated qualitative method exists.
For both patient experience and patient foodservice experience tools, very few are
validated as they are often created for single use in research to assess the effect of a
change in a service (2,12,18). This lack of consistency in measurement tools makes it
hard to compare findings and to assess whether quality improvements have sustained
results.
In New Zealand, inpatient experiences are monitored by the Health Quality Safety
Commission using a small subset of Picker Institute questions (66). The ratings from
this survey are used to identify gaps in service delivery and benchmark District Health
Boards (58). However, none of the survey questions are related to hospital foodservice
17
or patients meal experience (66). Like other countries, inpatient experience surveys
often exclude or only include a single item on hospital food (3,22,64). In the United
Kingdom, the National Health Service inpatient experience survey only ask for an
overall rating of the food and whether there was a choice of food (22). As hospital food
is a distinguishing element in the hospital experience and an element of the hospital care
provided (as nutrition therapy), the foodservice needs to be more thoroughly assessed in
national patient experiences surveys for benchmarking and quality assurance purposes
(24,64,67).
2.4 Conclusion
This review has demonstrated how differences in hospital foodservice systems have
been shown to influence not only the quality of the food but patients overall foodservice
experience. The innovation of hospital room service ordering and delivery system
especially enhances patient experience and addresses many of the unhelpful issues
patients face with a traditional hospital foodservice. Assessing patient experiences is
now a well-established form of feedback for quality improvement. Foodservices are an
important element of the patient experience but are not sufficiently investigated in
general patient experience surveys. The majority of studies examining foodservice
experience available to date only address some aspects of foodservice experience as it is
still an emerging area of inquiry. In addition, there is a good rationale to consider
expectations to add context to experience scores, but this is rarely done in patient or
foodservice research. Consequently, patient expectations of room service remain largely
unknown, and how this affects patient foodservice experience is yet to be explored.
18
3 Objective Statement
Hospital foodservices play an important role providing food-based nutrition support to
patients. To achieve this requires a complex system comprising of many different linked
components, with foodservice systems varying between hospitals. Room service meal
ordering and delivery is the latest trend in hospital foodservices, supported by literature
indicating a more timely, bespoke system enhances many aspects of the foodservice for
patients. Concurrently, another patient-centered innovation is gaining traction; previous
tools assessing patient satisfaction with hospital services are being updated to patient
experiences. Patient expectations and experience are important measures for quality
assurance that can reliably indicate service gaps requiring improvement. Foodservice
experience as part of overall hospital experience is an emerging field, further
disadvantaged by the foodservice element often not being considered or under examined
in general patient experience research. Few studies have assessed any aspect of patient
expectations of a foodservice, so what patients expect of room service foodservice is
unknown. This research investigates the first known hospital room service in New
Zealand, to discover the impact of room service on New Zealand patients’ expectations
and experiences.
The aim of this study is to answer the research question: how do New Zealand hospital
patient expectations and experiences of food service change with the introduction of a
room service meal system? The specific objectives of the study are:
1. To assess patient expectations of a ‘room service’ meal system in a private hospital
setting.
2. To assess patient experiences of a ‘room service’ meal system in a private hospital
setting.
19
3. To explore factors influencing the relationship between patients’ food service
expectations and experiences in a private hospital setting using a ‘room service’ meal
system.
4. To determine the impact on patient foodservice expectations and experiences of a
room service system of food service.
The impact of the room service will be determined by comparing results to the findings
of a pilot study undertaken at the study hospital in 2016, when a traditional foodservice
system was in place.
Patient expectations and experiences of room service will be assessed using the four
widely accepted foodservice constructs of food quality, meal service quality, staff and
service issues and hunger and satiety; to encompass a holistic view of the foodservice.
In addition, other known contributing factors of patient foodservice experience will be
explored such as; physical environment, prior hospital experience and clinical
conditions. The same methodology carried out in the 2016 study has been followed to
allow for comparison of results, using both quantitative and qualitative methods.
20
4 Subjects and Methods
This section presents the study design, methods, data collection tools and quality
assurance processes used in the study.
4.1 Study design
The study is a follow up of a pilot study undertaken at the study hospital in 2016. The
2016 pilot study used a three-phase study design to assess patient expectations and
satisfaction with the study hospital’s traditional hospital foodservice system prior to the
commissioning of room service. The study design for the current research replicates the
design of the pilot study to meet the aim of assessing the impact of room service on
patient expectations and experiences. Satisfaction has been updated to experience,
which is now accepted to be a broader measure of patient quality perceptions as
discussed in Section 2.3.2.
The study hospital is a 41-bed, private hospital located in Dunedin, New Zealand. The
hospital mainly provides elective surgery to around seven thousand patients a year, most
only requiring an overnight stay and the majority of whom are New Zealand Europeans
with an average age of 70 years (43). The foodservice transitioned to a hotel-style room
service in February 2018 and became the first hospital room service in New Zealand
(41,42). Patients can order their food anytime between 7am and 7pm from an a-la-carte
menu, and the meal will be delivered within 45 minutes (41,42).
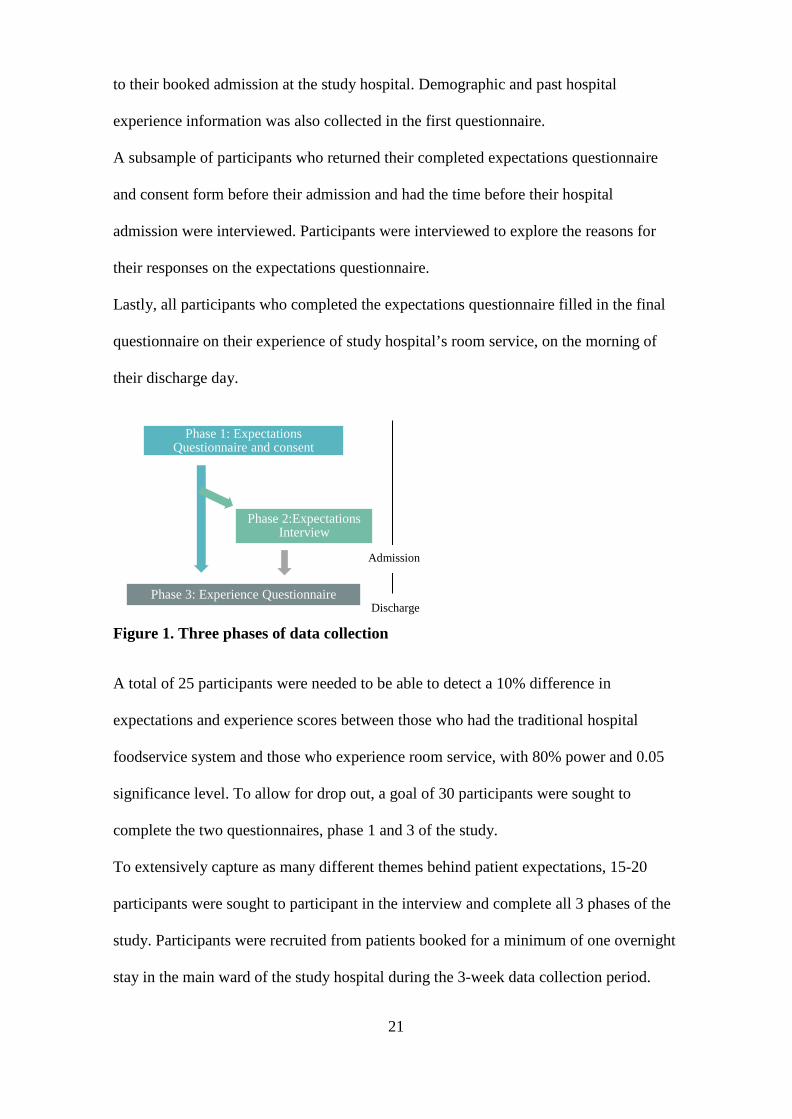
4.1.1 Data collection phases
As illustrated in Figure 1 below, data was collected in three phases:
Once patients gave consent to participate in the study, participants completed the first
questionnaire assessing their expectations of the foodservice. This was completed prior
21
to their booked admission at the study hospital. Demographic and past hospital
experience information was also collected in the first questionnaire.
A subsample of participants who returned their completed expectations questionnaire
and consent form before their admission and had the time before their hospital
admission were interviewed. Participants were interviewed to explore the reasons for
their responses on the expectations questionnaire.
Lastly, all participants who completed the expectations questionnaire filled in the final
questionnaire on their experience of study hospital’s room service, on the morning of
their discharge day.
Figure 1. Three phases of data collection
A total of 25 participants were needed to be able to detect a 10% difference in
expectations and experience scores between those who had the traditional hospital
foodservice system and those who experience room service, with 80% power and 0.05
significance level. To allow for drop out, a goal of 30 participants were sought to
complete the two questionnaires, phase 1 and 3 of the study.
To extensively capture as many different themes behind patient expectations, 15-20
participants were sought to participant in the interview and complete all 3 phases of the
study. Participants were recruited from patients booked for a minimum of one overnight
stay in the main ward of the study hospital during the 3-week data collection period.
Phase 1: Expectations Questionnaire and consent
Phase 2:Expectations Interview
Phase 3: Experience Questionnaire Discharge
Admission
22
Data was collected six months after the implementation of room service when the
system was stable. No major changes were made to the room service during data
collection to influence participant experience scores.
4.1.2 Rationale for study design
The 2016 pilot study proved the methods undertaken were able to capture patient
expectations and satisfaction with the foodservice. The current research has similar aims
to the pilot, the only difference being to assess the impact of a room service system.
Following the same design as the pilot study, using the FEQ and expectations interview
allows the results to be compared and the impact of room service on patient
expectations and experiences to be determined.
The strengths of mixed-methodology are relevant to this research. The quantitative
element accords with majority of foodservice and patient experience research which
utilizes self-administered questionnaires, as outlined in Section 2.3.4 of the literature
review. The FEQ was also validated in the pilot study with high Cronbach’s alphas for
the four foodservice constructs which gives confidence in its ability to measure the
desired constructs (24). The qualitative interviews supplement the quantitative methods
by gathering information unable to be obtained by the questionnaire, as done in other
patient experience research (17,18,21).
By utilizing quantitative and qualitative methods, this research not only explicitly
measures and quantifies patient expectations and experiences, but also gives the
researcher the flexibility to explore underlying themes that may explain trends in the
data. Together these methods address the aims of the research.
23
4.2 Development of data collection tools
4.2.1 Foodservice Expectations and Experiences Questionnaire
The questionnaire used in the 2016 pilot study underwent minor adaptations to capture
experiences whilst enabling comparison of results between the current and 2016 study
(24). With the adaptations, the 21-item Foodservice Expectations and Experiences
Questionnaire (FEEQ) was produced. Following the 2016 FEQ, the FEEQ is two
versions of the same questionnaire, with corresponding word changes to assess patient
expectations prior to admission, then their pre-discharge foodservice experience. For
example, Question one in the expectations questionnaire “At Mercy Hospital I expect
the meals I receive to be high quality” corresponds with Question one in the experience
questionnaire “At Mercy Hospital the meals I received were high quality”. Both
questionnaires are included in Appendix B. The two matched versions of the
questionnaire allow expectations and experiences to be compared and their relationship
explored. Responses to questions were obtained using a 5-point Likert-type scale, with
the option of free text for additional comments for questions requiring specified answers
such as desired menu items or clinical conditions experienced. The use of a Likert-scale
is common practice with this type of quality assessment questionnaire as it forces a
single response from the participant on the category that best aligns with their view, and
collects responses in a categorized manner (1,48,68). Whereas free text responses
provide insight into the more contextual factors the tool does not explicitly measure
(8,71).
For holistic assessment of patient foodservice experience, the questionnaire questions
are based on four established foodservice constructs; food quality, meal service quality,
staff and service issues and hunger and satiety (1,8). Physical environment, another
recognized influencing factor of foodservice experience was also included (1). A table
24
detailing the questions exploring each foodservice construct is included in Appendix B.
Four questions were added when developing the FEEQ. A question on presentation of
meals was included as with institutional food the presentation influences people’s
perception of food quality, hence this question was included under the food quality
construct (2,35). The ACHFPSQ the FEQ was based on had one question on
presentation of the crockery and cutlery and the overall meal tray as part of the meal
service construct (1). However, these items do not specifically assess the presentation of
the actual food, so this has been specified in the FEEQ.
A question on timing was included to specifically explore the timing of meals, as this is
one of the main distinguishing elements of the room service delivery model. Timing is
included as a measure of meal service quality, as the design of the service determines
when the meals are served to the patient.
Following Neighbours and Mclachlan’s studies in 2017, a question to assess the
influence of patient’s clinical symptoms on their foodservice experience was added
(52,70). This 2017 work suggests clinical condition may be an important and to date
overlooked explanatory variable for hospital foodservice experience.
Lowerson’s FEQ question on previous hospital stays underwent minor modifications to
capture previous foodservice experience specifically at the study hospital prior to room
service being implemented. This question aimed to evaluate whether prior experience of
the study hospital foodservice influenced expectations and experiences of the new room
service system.
In addition to gathering data on specific issues, these four questions sought to enhance
the discriminatory power of the FEEQ by canvassing more potentially explanatory
factors. As the results from the 2016 pilot study showed very high expectations and
satisfaction levels with the previous foodservice system, it was anticipated it may be
25
difficult to distinguish a significant difference in expectation or experiences with room
service.
Other adaptations to the FEQ included redesigning the questionnaire formatting to make
it more visually appealing. A fillable electronic copy of the expectations questionnaire
was created for participants to complete electronically (Appendix B).
The additional and revised questions underwent expert review from study supervisors
and qualitative pretesting for content and face validity (71,72). A condensed version of
the expectations and experience questionnaire including all added and revised questions
was created. A sample of n=16 people known through connections of the researcher
completed both questionnaires and were asked to make comments on clarity and
readability. Pretesting participants met the study participant inclusion criteria, and
individuals who fit the typical participant profile (New Zealand European, over 50 years
old) from the prior study were included to represent likely participants (24). A
subsample of the pretesting participants (n=7) were cognitively interviewed by the
researcher for face and content validity (72). The cognitive interviews involved the
researcher asking the participants to individually complete the questionnaire and express
their thinking and understanding of the questions out loud. These interviews assessed
the questionnaire’s face value and if respondents understood the objective measures
(72). This process informed minor improvements to the questionnaire for clarity and
specificity. Appendix B v. outlines the changes made as a result of the pretesting.
4.2.2 Interview schedule
A set of fourteen questions to guide the expectations interview was compiled. The
interviews were conducted to explore the reasons for participant responses to selected
questions on the expectation’s questionnaire. Nine questions from the pilot study
interview schedule were carried over and new questions were introduced to specifically
26
explore the influence of room service on expectations and responses to the new
questionnaire questions. The interview questions explored expectations related to a
combination of tangible and intangible foodservice factors for each of the foodservice
constructs. New and revised interview questions were also tested for content and face
validity through expert review by study supervisors and cognitive interviewing
alongside the pretesting of the questionnaire. Changes following pre-testing are included
in Appendix B.
The complete interview schedule is included in Appendix B iv. along with justifications
for the inclusion of each question.
4.3 Data collection
4.3.1 Ethical consideration
According to Ministry of Health criteria, the study is classified as minimal risk health
research (73). Ethical approval was obtained from the University of Otago Human
Ethics Committee (Health) and the study hospital Ethics Committee prior to recruitment
commencing (74). Maori consultation was also undertaken with the University of Otago
Ngāi Tahu Research Consultation Committee. Eligible patients were informed of the
purpose of the study, their rights, what information was required for the research and the
need to sign a consent form to participate in the study. Participant Study Information is
available in Appendix C. As data was being collected from hospital patients, it was
made clear that there was no disadvantage or impact on care at the study hospital for
those who decided not to participate. See Appendix C for University of Otago and
Mercy Hospital ethics applications and approvals and Ngāi Tahu consultation.
Only the researcher was aware of patient identities and participants were assigned a
unique identifier code upon commencing the study. To protect patient confidentiality,
only unique identifiers were used on data collection records and all subsequent analyses.
27
Only basic demographic information was sought i.e. self-reported age range, gender,
ethnicity, length of current and last hospital stay and used solely for the research.
4.3.2 Recruitment
The participant inclusion criteria were; adults, 18 years of age and above, English
speaking, with a booked admission to the study hospital for a minimum of one
overnight stay during the three-week data collection period August 6th to August 24th ,
2018.
Initially, 20 patients each week who fulfilled the inclusion criteria were randomly
selected for invitation to participate in the study. A study hospital preadmission
administrator randomly selected patients across each week from the patient management
software TrakCare. The randomization process for choosing participants was the first
five eligible patients lodged for admission in TrakCare each day for four days a week,
over the three weeks. The researcher was given contact information five to seven days
before each patient’s admission and contacted patients by phone to provide information
about the study. A $20 supermarket voucher was offered for completion of the study. If
an individual agreed to participate, the first questionnaire was sent to them
electronically via email or a paper copy via post, together with the consent form and
study information (Appendix C). Those who declined to participate were not contacted
again.
To compare the expectations and experience results with the results of the 2016 study,
the study statistician advised matching study participant demographics as closely as
possible. This did not hinder initial random selection of patients as the 2016 study
participant demographics represented the typical patient profile of the study hospital
(24,43). A matching goal of similar age and sex demographics was decided. Ethnicity
and previous hospital experience were not included in the matching goal due to ethical
28
consideration and previous hospital experience information unable to be obtained prior
to recruitment. Throughout data collection, the demographics of the study participants
recruited to date were reviewed and compared to the pilot study participant
demographics. During the last week of data collection, males and patients over the age
of 75 who met the inclusion criteria were specifically selected to be invited into the
study, to reach the matching goal.
Many of the randomly selected patients were unable to be contacted to be recruited, and
there were low returns of questionnaires. To counter this, over the last two weeks of
data collection an additional 32 patients who fit the inclusion criteria were randomly
selected to be invited to participate in the study.
4.3.3 Data Collection by Phase
4.3.3.1 Expectations Questionnaire
A fillable electronic copy of the first questionnaire was emailed immediately to patients
who agreed to participate during the phone call inviting them into the study. Emailed
with the questionnaire was the study information and an electronic consent form for
participants to sign and return. A secure study hospital email address assigned to the
researcher was used solely for email correspondence with participants. For participants
who were unable to receive the questionnaire via email, paper copies of the
questionnaire were sent by post. A small number of participants chose to pick up a hard
copy of the questionnaire from reception during their next pre-admission appointment at
the study hospital. A majority of participants returned their completed expectations
questionnaire and consent form via email, while the remainder returned them via post or
at the study hospital’s reception prior to their admission. Participants were informed the
questionnaire should take no longer than 15 minutes to complete. Due to the timing of
when booked admission details became available, the researcher had a short timeframe
29
(5-7days) to recruit the participants before their admission. Participants were
encouraged to return the completed questionnaire at their earliest convenience and given
at least three full working days to return it prior to their admission.
4.3.3.2 Expectations Interview
Due to the short timeframe, all participants who returned their expectations
questionnaire at least one day before their booked admission were invited to take part in
the voluntary expectations interview. When possible, a time was organized between the
researcher and the interviewee for the 15-20-minute interview. The researcher assessed
the participant’s expectations questionnaire responses to determine which questions
from the interview schedule to ask and included reference to their questionnaire
responses in the interview. The researcher telephoned participants from a landline phone
at the study hospital.
Verbal consent to participate and record the interview was obtained at the start of each
interview and participants were reminded they did not have to answer any question they
wished not to. Interviews were audio recorded using the ‘myPortal’ application,
desktop version 6.2.260X (Unify Software and Solutions GmbH & Co. KG), a program
connected to the study hospital phone system. Recordings were made for selective
transcribing and subsequent analysis. One interview recording was lost due to a
technical issue.
To adequately explore expectations of the foodservice while keeping interviews to
fifteen to twenty minutes to prevent respondent fatigue, five to six questions from the
full interview schedule were chosen prior to each interview. Interview questions were
chosen intentionally from the schedule, based on the participant’s questionnaire
responses, if they had a polarized response to the corresponding question or an unusual
response to the rest of the participants. The aim was to choose one question from each
of the four foodservice constructs. Although, in seven of the sixteen interviews, more
30
than one food quality construct questions was asked. A majority of the interview
questions favored the food quality construct as it encompasses menu variety – a key
area of interest as an enhanced element of the room service, as discussed in Section
2.2.1. An extra question was included in each interview to explore other related factors
that do not fit into the existing foodservice constructs such as; the expected effect of
participants clinical condition on their foodservice experience and their past hospital
foodservice experiences. The last question was an open question to uncover any other
issues that may not have been explored. To ensure all interview questions were asked
and, in an attempt to cover the foodservice constructs as evenly as possible, a Microsoft
Excel table was used to tally the question asked by construct across the interviews
(Appendix D).
All interviews followed a semi-informal, open-ended questions approach that asked
follow on questions during the interview to clarify and further explore participants
interview responses (75). The researcher followed established strategies to maintain
interviewer control as done in the 2016 pilot, which included directing the interview
focus to the research aims and using micro counselling techniques from dietetic training
to prevent introduction of biases (24,75).
4.3.3.3 Experience questionnaire
Each morning throughout the data collection period, the researcher checked the ward
communication board for study participants’ discharge date and time. The study hospital
generally discharged patients by 11am if being discharged that day. Participants who
were being discharged were given a paper copy of the experience questionnaire to
complete during the morning of their discharge. The researcher allowed twenty minutes
for participants to complete the questionnaire. The researcher left participants to
complete questionnaires on their own. Some participants were unable to complete their
31
questionnaire due to their hand dexterity being affected by surgery and were assisted to
complete their questionnaire by family members or the researcher. The researcher
remained neutral to participant’s responses when assisting them. After collection of the
questionnaire by the researcher, participants were given a $20 supermarket voucher
provided by the University of Otago to thank them for their participation in the study.
Due to the researcher being unable to collect questionnaires on weekend days,
participants who had a scheduled weekend discharge were given their expectations
questionnaire to complete at the latest time possible, on the Friday evening prior to their
Saturday morning discharge and collected by the researcher or the study hospital
Dietitian the same evening.
4.3.4 Revisions
One question was added to the experience questionnaire during the first week of data
collection period. Question 23 on duration of the participants stay (based on number of
nights) was included to assess whether the length of stay influenced foodservice
experience. Length of stays were calculated from date of admission and when the
experience questionnaire was completed for participants who filled out the FEEQ prior
to the revision.
4.4 Analysis
4.4.1 Scoring of the Questionnaires
Questionnaire responses were entered in to a Microsoft Excel 2016 sheet for analysis.
Likert Scale responses, including reverse and alternate Likert Scales were coded in a
consecutive manner i.e. Never = 1, Always = 5. Missing responses were noted as 0.
32
4.4.2 Quantitative analysis
Descriptive statistics (mean, standard deviations, percentages) for each question on each
questionnaire and demographic profiles were calculated by the researcher within the
Microsoft Excel spreadsheet. All other statistical analysis was undertaken using Stata
15.1 (StataCorp, College Station, Texas).
4.4.2.1 Subscale investigation
Quantitative foodservice expectations and experiences were represented in subscales of
the four foodservice constructs. Cronbach's alpha correlation coefficient was calculated
for each subscale to derive a score for internal reliability of measuring the relevant
construct (a value of >0.7 indicates internal reliability). Question 20 related to ‘bringing
food from home’ responses was on a reverse Likert scale and was consequently reverse
scored. Question 13 responses on ‘meal time routine’ uses an alternate Likert-scale and
therefore was not included in the subscale analysis. Mean differences between
expectation and experience were estimated by paired t-tests and 95% confidence
intervals reported. Spearman correlations were also calculated.
Three inconsistencies identified in the 2016 study subscale analysis have been corrected
in the present study. Firstly, the question regarding “healthy menu items” was included
in the meal service construct in the preceding study, when according to Capra et al it
belongs in the food quality construct, as it relates to menu variety (1,24). Secondly, the
question regarding meal distractions was included in staff and service issues, where
following Capra et al it is a separate question regarding the physical environment that
should have been analyzed separately (1,24). Third, it was not stated whether the
question “bring food from home” was reverse scored as it is on a reverse Likert-scale
(24). While compromising on the comparability of results of the two studies, it was
33
decided it was more important to correct these in this study’s subscale analysis for
accurate measurement of the affected foodservice aspects.
To assess whether sex or age was related to expectation or experience, linear regression
models were used with both predictors in the same model. Differences in experience by
length of stay (one night compared to more than one night) were estimated using
unpaired t-tests. Differences in expectations and experience by whether the participant
had past experience at the study hospital before were also estimated using unpaired t-
tests.
To assess the impact of room service from the traditional hospital foodservice, mean
construct expectations and experience scores for the two systems were compared and
the differences calculated.
4.4.3 Qualitative interview analysis
The qualitative analysis of interview transcripts employed thematic analysis based on
grounded theory, following Thomas’s general inductive approach (76). Thematic
analysis is a qualitative analytic method that identifies, analyses and reports patterns and
themes within data (77). Analysis based on grounded theory aims to produce credible
and functional theory that links and represents the ideas present in the data. To identify
changes in expectations following the introduction of room service the same analytical
approach as Lowerson’s 2016 study was used (24). Following Thomas’s general
inductive approach discoveries stem directly from the data. However, Thomas’
approach also has deductive elements as it assumes the coding of the data is driven by
research objectives (76). The deductive component is important for the current research
to narrow the focus of analysis to explanatory factors for expectations of the study
34
hospital foodservice. The use of the key steps of Thomas’s general inductive approach
is outlined below:
Raw data files
All interviews were selectively transcribed using Express Transcribe Software version
7.03 to Microsoft OneNote 2016 documents to create raw data files for analysis. The
researcher transcribed all recorded speech only excluding redundant affirmative answers
(e.g. repetitive yeses) and information blatantly not relevant to the study i.e. not relating
to reasons for a participant’s response. This detailed approach to transcribing allowed
for identification of all possible themes.
Identification of themes
All interview transcripts underwent extensive and iterative examination to identify
explanatory themes for foodservice expectations. The researcher initially identified
potential themes from six interviews chosen from different time points across the data
collection period. The study supervisors then examined the same transcripts to
independently identify review and refine these initial themes. After the parallel analysis
of these six transcripts, overlapping themes emerged which formed the initial categories.
Draft category definitions were discussed at length with the study supervisors. A clear
definition, inclusion and exclusion criteria was created for each category to direct
assigning of themes to categories. Analysis of remaining transcripts resulted in
assigning themes to an existing category or a developing a new category. The category
definitions were linked to the research objectives to ensure the findings were relevant to
the research aims.
Coding and Strength of themes
Identified text from interview transcripts was coded to one or more categories. A
35
frequency table was generated to quantify the number of times a theme was identified
across interview transcripts (Appendix D iii.). This allowed identification of relative
strength of categories to be determined based on tallies for contributing themes.
Overlapping coding and uncoded text
Text irrelevant to the study aims was excluded from analysis and left un-coded in raw
data files. Ideas in the text that applied to more than one category were coded into each
applicable category.
Ongoing revision and refinement of categories
Once all interview data was identified and coded, the identified categories were further
refined by ranking them super ordinately and comprehensively analyzing again for new
insights, subtopics and identifying any opposing views. Quotes that strongly conveyed
the essence of a category were chosen to represent it. Categories were aggregated where
there was similarity or overarching themes.
Final categories were formed when no further reduction to the categories for
conciseness was possible. These remaining categories emerged as the major explanatory
themes for patient’s foodservice expectations at the study hospital. A mind map to
illustrate emerging themes and connected categories was created.
4.5 Quality considerations
The researcher is trained in interviewing techniques from their dietetic training and
made a conscious effort to remain unbiased during the interviews. Effort was taken not
to influence participant’s expectations by refraining from providing additional
information about the room service above the information participants were given in
their preadmission and study information packs. Participants were directed to the study
hospital’s website for more information on the room service when they requested it.
36
To ensure consistency of themes and categories produced from qualitative analysis, the
research supervisors independently coded one third of the transcripts. This ensured
robust identification of themes and identified possible new insights. Thomas’s approach
assumes different researchers will have different interpretations to the same data due to
the deductive component, as the findings are shaped by the researcher’s ideas (76). This
quality assurance process by the supervisors sought to minimize any researcher bias in
data identification and coding. An expert review was also undertaken by the research
supervisors on the final categories to ensure comprehensiveness of the explanatory
factors.
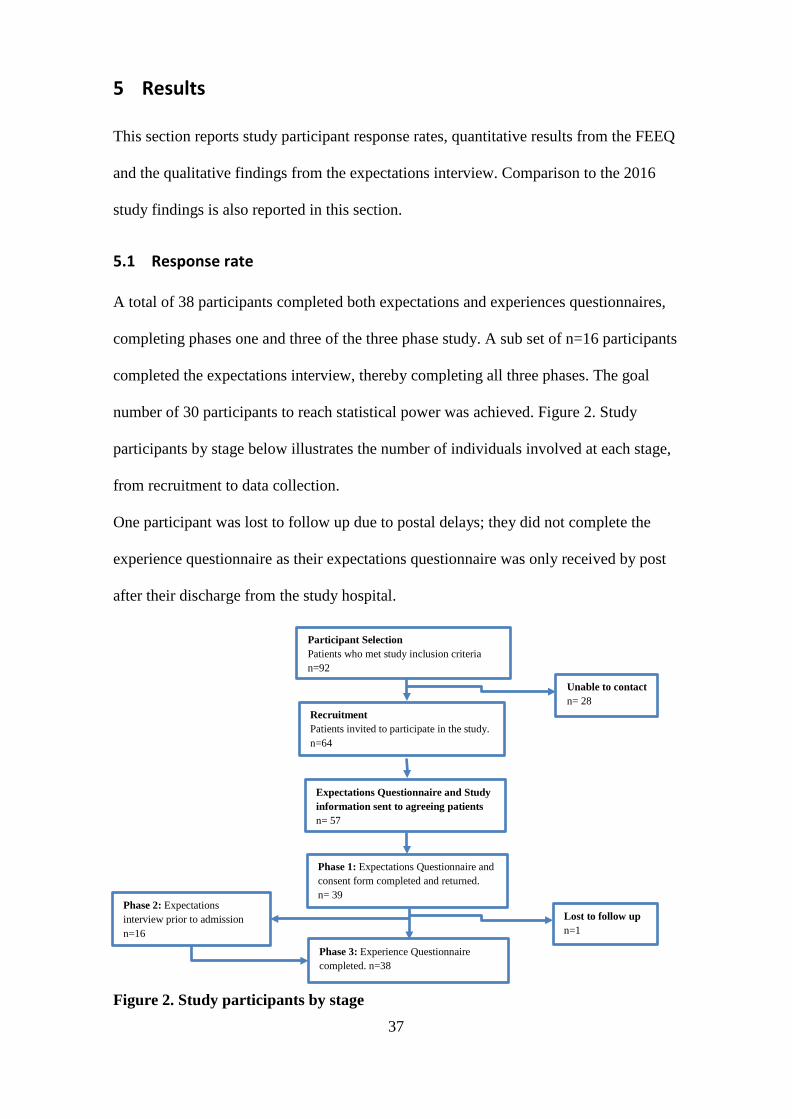
37
5 Results
This section reports study participant response rates, quantitative results from the FEEQ
and the qualitative findings from the expectations interview. Comparison to the 2016
study findings is also reported in this section.
5.1 Response rate
A total of 38 participants completed both expectations and experiences questionnaires,
completing phases one and three of the three phase study. A sub set of n=16 participants
completed the expectations interview, thereby completing all three phases. The goal
number of 30 participants to reach statistical power was achieved. Figure 2. Study
participants by stage below illustrates the number of individuals involved at each stage,
from recruitment to data collection.
One participant was lost to follow up due to postal delays; they did not complete the
experience questionnaire as their expectations questionnaire was only received by post
after their discharge from the study hospital.
Figure 2. Study participants by stage
Participant Selection Patients who met study inclusion criteria n=92
Unable to contact n= 28 Recruitment
Patients invited to participate in the study. n=64
Expectations Questionnaire and Study information sent to agreeing patients n= 57
Phase 1: Expectations Questionnaire and consent form completed and returned. n= 39
Lost to follow up n=1 Phase 3: Experience Questionnaire
completed. n=38
Phase 2: Expectations interview prior to admission n=16
38
5.2 Study participant characteristics
The characteristics of study participants are shown in Table 1 below. Study participant
characteristics largely reflect the typical patient profile for the study hospital (43). All
but one participant had prior hospital experience before their upcoming admission.
However, for 62% of participants their last hospital admission was five or more years
ago. Thirty-nine percent of participants had experienced the foodservice at the study
hospital prior to room service being implemented. No participant had experienced the
room service at the study hospital before nor had participated in the 2016 study.
5.2.1 Matching goal
As justified in Section 4.3.2, recruitment aimed to match the age and sex profile of
participants in the current study with the profile of those who participated in the
traditional hospital foodservice system study. While not matched exactly, the current
study population broadly matches that of the 2016 study. Notably, the proportion of
participants by age group is very similar. During recruitment the number of males
selected to be invited to be part of the study was increased to reach the matching goal,
however not all completed and returned their questionnaire. This resulted in slightly
more female participants in the current study than in the 2016 study.
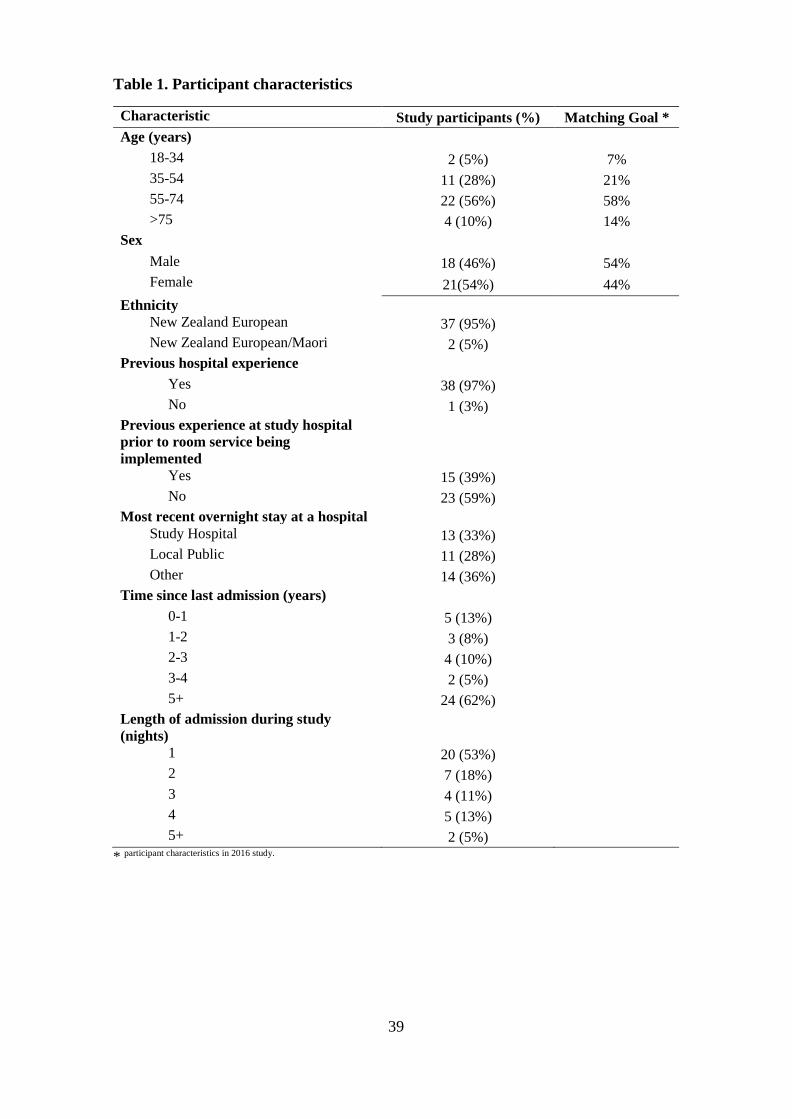
39
Table 1. Participant characteristics
Characteristic Study participants (%) Matching Goal * Age (years)
18-34 2 (5%) 7% 35-54 11 (28%) 21% 55-74 22 (56%) 58% >75 4 (10%) 14%
Sex Male 18 (46%) 54% Female 21(54%) 44%
Ethnicity New Zealand European 37 (95%) New Zealand European/Maori 2 (5%)
Previous hospital experience Yes 38 (97%) No 1 (3%)
Previous experience at study hospital prior to room service being implemented
Yes 15 (39%) No 23 (59%)
Most recent overnight stay at a hospital Study Hospital 13 (33%) Local Public 11 (28%) Other 14 (36%)
Time since last admission (years) 0-1 5 (13%) 1-2 3 (8%) 2-3 4 (10%) 3-4 2 (5%) 5+ 24 (62%)
Length of admission during study (nights)
1 20 (53%) 2 7 (18%) 3 4 (11%) 4 5 (13%) 5+ 2 (5%)
* participant characteristics in 2016 study.
40
5.3 Questionnaire results
The following section presents the results of the expectations and experience
questionnaires.
5.3.1 Descriptive statistics
Figure 3 shows mean scores for expectations and experiences by question, which were
overall high for both questionnaires. Some of the variations seen in the graph may be
explained by the use of reverse and alternate order Likert scale responses for Questions
12, 13, 17, 20 and 21.
Patient expectation scores for room service were high, with 91% of responses being
‘mostly’ or ‘always’ across all construct-related questions in both the expectations and
experience questionnaire. Percentages of responses to construct questions are given in
Appendix D ii.. The median values and interquartile ranges shown in Table 3 reinforce
participants’ high expectations of and experiences with room service. In each of these
reports, comparing experience scores with expectation scores indicates where
experiences did or did not exceed expectations. These comparisons suggest the strengths
of the foodservice as well as where there may be gaps in the service. For example, for
questions six to eight assessing temperature of meals and drinks, experience scores were
below expectations scores. This result was affirmed by four participants commenting on
the food and drinks not being hot/cold enough in the free text section of the experience
questionnaire. For example, Participant 909’s wrote: “Coffee was served with warm
water (cooled from kitchen to ward). Yoghurt was not cold.”.
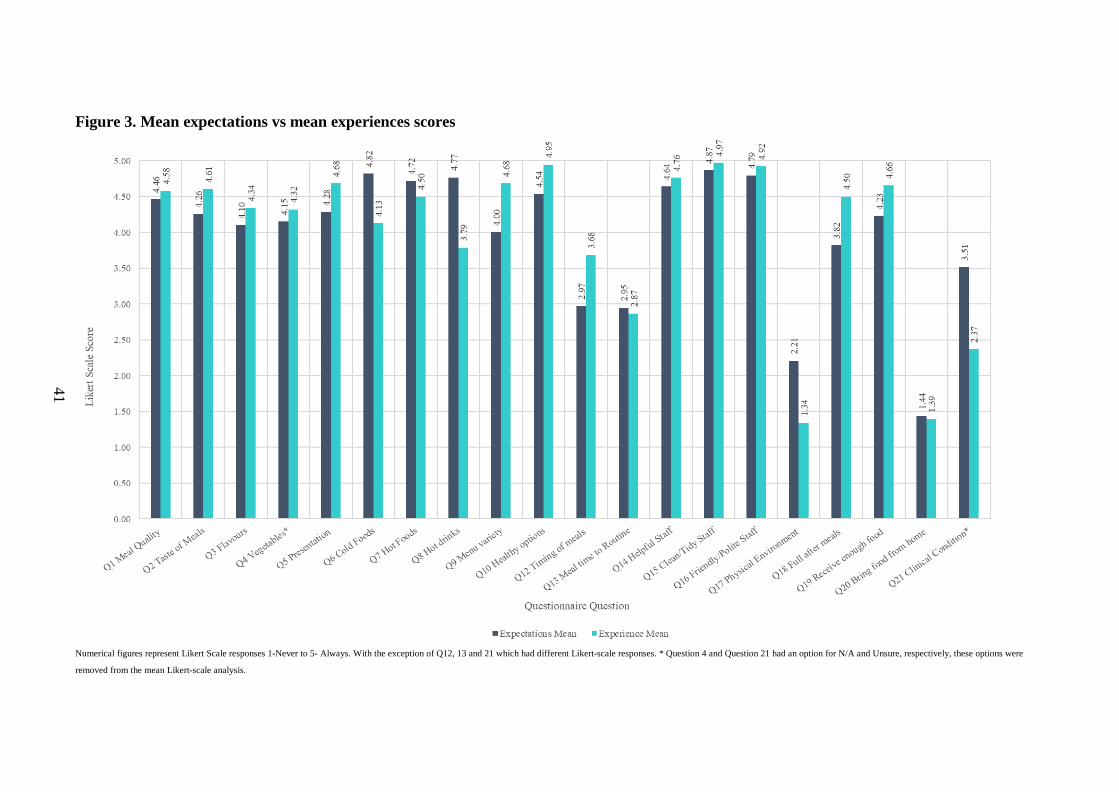
41
Numerical figures represent Likert Scale responses 1-Never to 5- Always. With the exception of Q12, 13 and 21 which had different Likert-scale responses. * Question 4 and Question 21 had an option for N/A and Unsure, respectively, these options were
removed from the mean Likert-scale analysis.
Figure 3. Mean expectations vs mean experiences scores
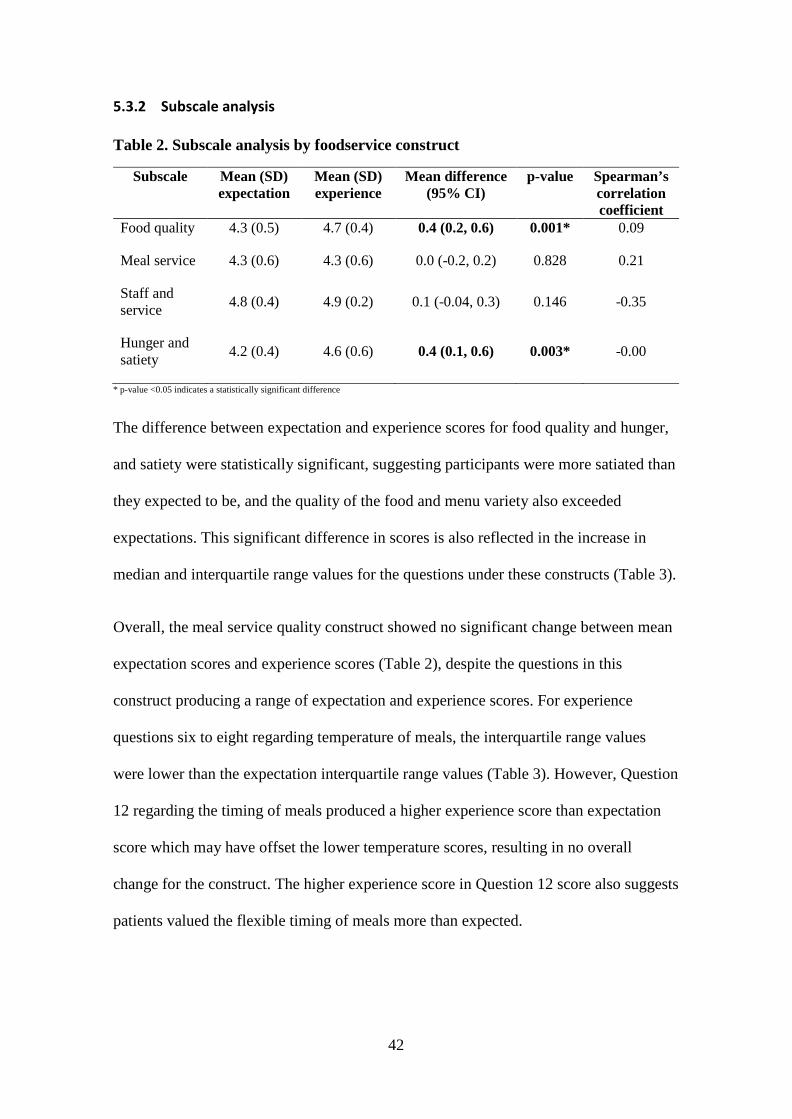
42
5.3.2 Subscale analysis
Table 2. Subscale analysis by foodservice construct
Subscale Mean (SD) expectation
Mean (SD) experience
Mean difference (95% CI)
p-value Spearman’s correlation coefficient
Food quality 4.3 (0.5) 4.7 (0.4) 0.4 (0.2, 0.6) 0.001* 0.09
Meal service 4.3 (0.6) 4.3 (0.6) 0.0 (-0.2, 0.2) 0.828 0.21
Staff and service 4.8 (0.4) 4.9 (0.2) 0.1 (-0.04, 0.3) 0.146 -0.35
Hunger and satiety 4.2 (0.4) 4.6 (0.6) 0.4 (0.1, 0.6) 0.003* -0.00
* p-value <0.05 indicates a statistically significant difference
The difference between expectation and experience scores for food quality and hunger,
and satiety were statistically significant, suggesting participants were more satiated than
they expected to be, and the quality of the food and menu variety also exceeded
expectations. This significant difference in scores is also reflected in the increase in
median and interquartile range values for the questions under these constructs (Table 3).
Overall, the meal service quality construct showed no significant change between mean
expectation scores and experience scores (Table 2), despite the questions in this
construct producing a range of expectation and experience scores. For experience
questions six to eight regarding temperature of meals, the interquartile range values
were lower than the expectation interquartile range values (Table 3). However, Question
12 regarding the timing of meals produced a higher experience score than expectation
score which may have offset the lower temperature scores, resulting in no overall
change for the construct. The higher experience score in Question 12 score also suggests
patients valued the flexible timing of meals more than expected.
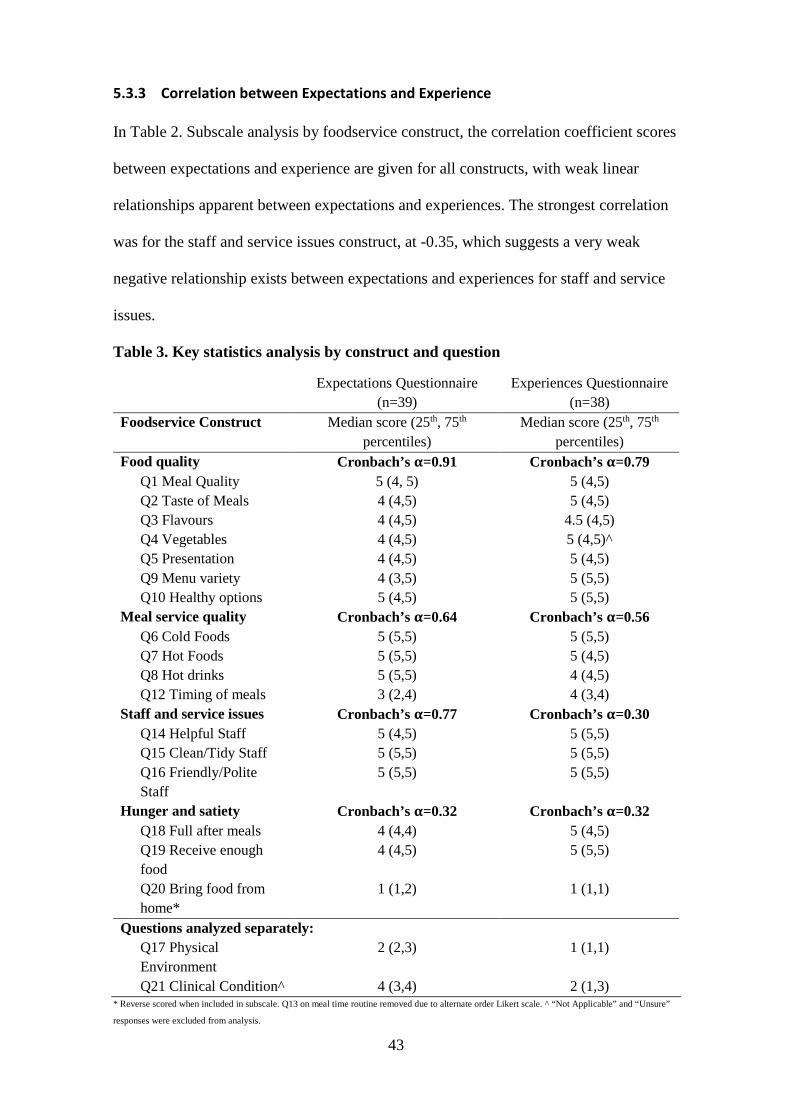
43
5.3.3 Correlation between Expectations and Experience
In Table 2. Subscale analysis by foodservice construct, the correlation coefficient scores
between expectations and experience are given for all constructs, with weak linear
relationships apparent between expectations and experiences. The strongest correlation
was for the staff and service issues construct, at -0.35, which suggests a very weak
negative relationship exists between expectations and experiences for staff and service
issues.
Table 3. Key statistics analysis by construct and question
Expectations Questionnaire (n=39)
Experiences Questionnaire (n=38)
Foodservice Construct Median score (25th, 75th percentiles)
Median score (25th, 75th percentiles)
Food quality Cronbach’s α=0.91 Cronbach’s α=0.79 Q1 Meal Quality 5 (4, 5) 5 (4,5) Q2 Taste of Meals 4 (4,5) 5 (4,5) Q3 Flavours 4 (4,5) 4.5 (4,5) Q4 Vegetables 4 (4,5) 5 (4,5)^ Q5 Presentation 4 (4,5) 5 (4,5) Q9 Menu variety 4 (3,5) 5 (5,5) Q10 Healthy options 5 (4,5) 5 (5,5)
Meal service quality Cronbach’s α=0.64 Cronbach’s α=0.56 Q6 Cold Foods 5 (5,5) 5 (5,5) Q7 Hot Foods 5 (5,5) 5 (4,5) Q8 Hot drinks 5 (5,5) 4 (4,5) Q12 Timing of meals 3 (2,4) 4 (3,4)
Staff and service issues Cronbach’s α=0.77 Cronbach’s α=0.30 Q14 Helpful Staff 5 (4,5) 5 (5,5) Q15 Clean/Tidy Staff 5 (5,5) 5 (5,5) Q16 Friendly/Polite Staff
5 (5,5) 5 (5,5)
Hunger and satiety Cronbach’s α=0.32 Cronbach’s α=0.32 Q18 Full after meals 4 (4,4) 5 (4,5) Q19 Receive enough food
4 (4,5) 5 (5,5)
Q20 Bring food from home*
1 (1,2) 1 (1,1)
Questions analyzed separately: Q17 Physical Environment
2 (2,3) 1 (1,1)
Q21 Clinical Condition^ 4 (3,4) 2 (1,3) * Reverse scored when included in subscale. Q13 on meal time routine removed due to alternate order Likert scale. ^ “Not Applicable” and “Unsure”
responses were excluded from analysis.
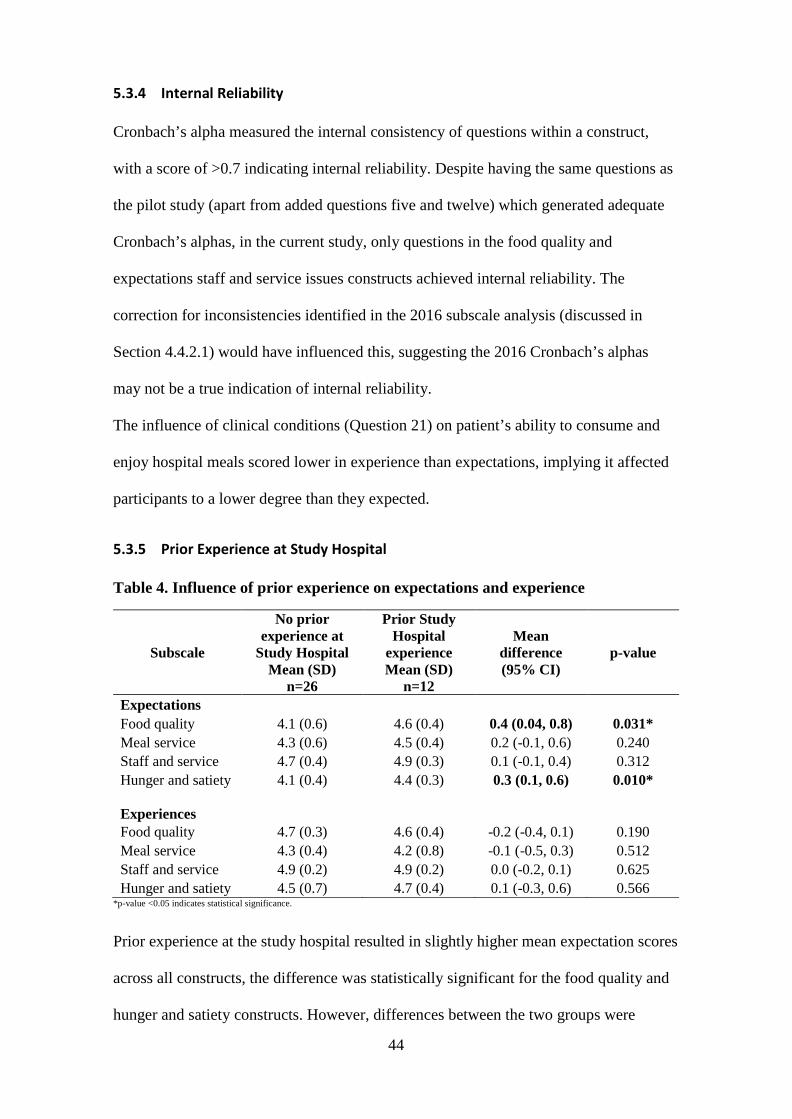
44
5.3.4 Internal Reliability
Cronbach’s alpha measured the internal consistency of questions within a construct,
with a score of >0.7 indicating internal reliability. Despite having the same questions as
the pilot study (apart from added questions five and twelve) which generated adequate
Cronbach’s alphas, in the current study, only questions in the food quality and
expectations staff and service issues constructs achieved internal reliability. The
correction for inconsistencies identified in the 2016 subscale analysis (discussed in
Section 4.4.2.1) would have influenced this, suggesting the 2016 Cronbach’s alphas
may not be a true indication of internal reliability.
The influence of clinical conditions (Question 21) on patient’s ability to consume and
enjoy hospital meals scored lower in experience than expectations, implying it affected
participants to a lower degree than they expected.
5.3.5 Prior Experience at Study Hospital
Table 4. Influence of prior experience on expectations and experience
Subscale
No prior experience at
Study Hospital Mean (SD)
n=26
Prior Study Hospital
experience Mean (SD)
n=12
Mean difference (95% CI)
p-value
Expectations Food quality 4.1 (0.6) 4.6 (0.4) 0.4 (0.04, 0.8) 0.031* Meal service 4.3 (0.6) 4.5 (0.4) 0.2 (-0.1, 0.6) 0.240 Staff and service 4.7 (0.4) 4.9 (0.3) 0.1 (-0.1, 0.4) 0.312 Hunger and satiety 4.1 (0.4) 4.4 (0.3) 0.3 (0.1, 0.6) 0.010*
Experiences
Food quality 4.7 (0.3) 4.6 (0.4) -0.2 (-0.4, 0.1) 0.190 Meal service 4.3 (0.4) 4.2 (0.8) -0.1 (-0.5, 0.3) 0.512 Staff and service 4.9 (0.2) 4.9 (0.2) 0.0 (-0.2, 0.1) 0.625 Hunger and satiety 4.5 (0.7) 4.7 (0.4) 0.1 (-0.3, 0.6) 0.566
*p-value <0.05 indicates statistical significance.
Prior experience at the study hospital resulted in slightly higher mean expectation scores
across all constructs, the difference was statistically significant for the food quality and
hunger and satiety constructs. However, differences between the two groups were
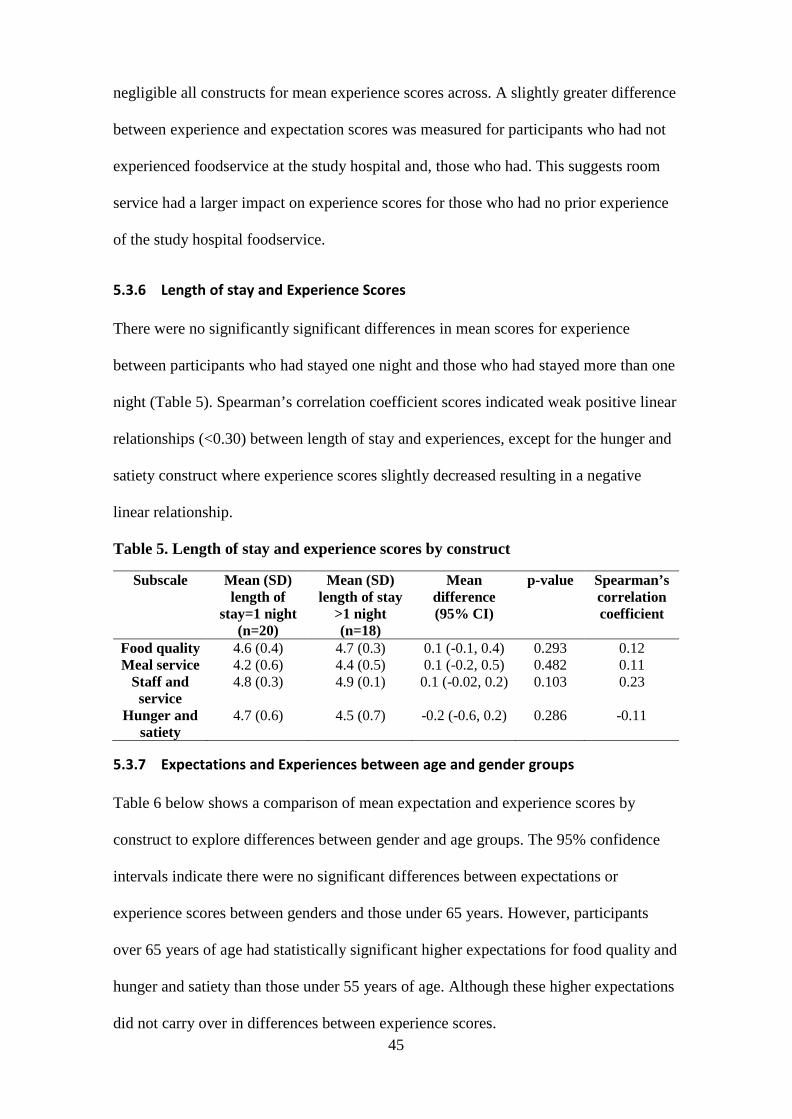
45
negligible all constructs for mean experience scores across. A slightly greater difference
between experience and expectation scores was measured for participants who had not
experienced foodservice at the study hospital and, those who had. This suggests room
service had a larger impact on experience scores for those who had no prior experience
of the study hospital foodservice.
5.3.6 Length of stay and Experience Scores
There were no significantly significant differences in mean scores for experience
between participants who had stayed one night and those who had stayed more than one
night (Table 5). Spearman’s correlation coefficient scores indicated weak positive linear
relationships (<0.30) between length of stay and experiences, except for the hunger and
satiety construct where experience scores slightly decreased resulting in a negative
linear relationship.
Table 5. Length of stay and experience scores by construct
Subscale Mean (SD) length of
stay=1 night (n=20)
Mean (SD) length of stay
>1 night (n=18)
Mean difference (95% CI)
p-value Spearman’s correlation coefficient
Food quality 4.6 (0.4) 4.7 (0.3) 0.1 (-0.1, 0.4) 0.293 0.12 Meal service 4.2 (0.6) 4.4 (0.5) 0.1 (-0.2, 0.5) 0.482 0.11
Staff and service
4.8 (0.3) 4.9 (0.1) 0.1 (-0.02, 0.2) 0.103 0.23
Hunger and satiety
4.7 (0.6) 4.5 (0.7) -0.2 (-0.6, 0.2) 0.286 -0.11
5.3.7 Expectations and Experiences between age and gender groups
Table 6 below shows a comparison of mean expectation and experience scores by
construct to explore differences between gender and age groups. The 95% confidence
intervals indicate there were no significant differences between expectations or
experience scores between genders and those under 65 years. However, participants
over 65 years of age had statistically significant higher expectations for food quality and
hunger and satiety than those under 55 years of age. Although these higher expectations
did not carry over in differences between experience scores.
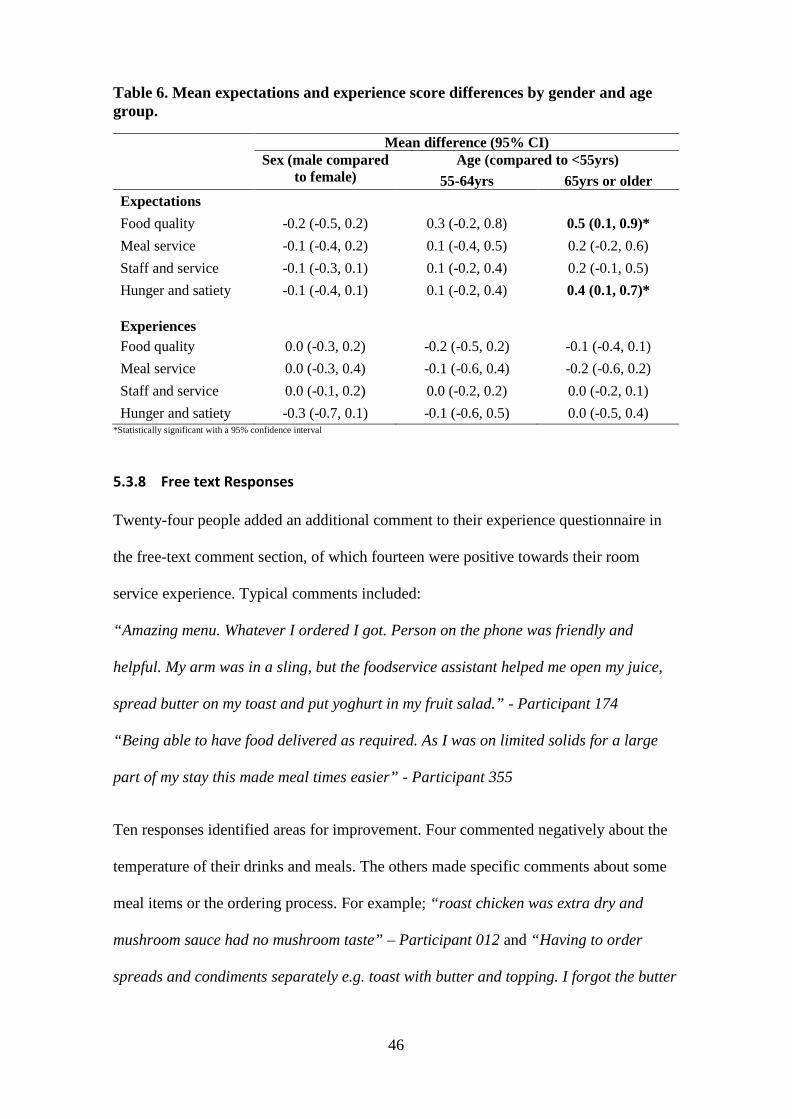
46
Table 6. Mean expectations and experience score differences by gender and age group.
Mean difference (95% CI)
Sex (male compared
to female) Age (compared to <55yrs)
55-64yrs 65yrs or older Expectations Food quality -0.2 (-0.5, 0.2) 0.3 (-0.2, 0.8) 0.5 (0.1, 0.9)* Meal service -0.1 (-0.4, 0.2) 0.1 (-0.4, 0.5) 0.2 (-0.2, 0.6) Staff and service -0.1 (-0.3, 0.1) 0.1 (-0.2, 0.4) 0.2 (-0.1, 0.5) Hunger and satiety -0.1 (-0.4, 0.1) 0.1 (-0.2, 0.4) 0.4 (0.1, 0.7)*
Experiences
Food quality 0.0 (-0.3, 0.2) -0.2 (-0.5, 0.2) -0.1 (-0.4, 0.1) Meal service 0.0 (-0.3, 0.4) -0.1 (-0.6, 0.4) -0.2 (-0.6, 0.2) Staff and service 0.0 (-0.1, 0.2) 0.0 (-0.2, 0.2) 0.0 (-0.2, 0.1) Hunger and satiety -0.3 (-0.7, 0.1) -0.1 (-0.6, 0.5) 0.0 (-0.5, 0.4)
*Statistically significant with a 95% confidence interval
5.3.8 Free text Responses
Twenty-four people added an additional comment to their experience questionnaire in
the free-text comment section, of which fourteen were positive towards their room
service experience. Typical comments included:
“Amazing menu. Whatever I ordered I got. Person on the phone was friendly and
helpful. My arm was in a sling, but the foodservice assistant helped me open my juice,
spread butter on my toast and put yoghurt in my fruit salad.” - Participant 174
“Being able to have food delivered as required. As I was on limited solids for a large
part of my stay this made meal times easier” - Participant 355
Ten responses identified areas for improvement. Four commented negatively about the
temperature of their drinks and meals. The others made specific comments about some
meal items or the ordering process. For example; “roast chicken was extra dry and
mushroom sauce had no mushroom taste” – Participant 012 and “Having to order
spreads and condiments separately e.g. toast with butter and topping. I forgot the butter
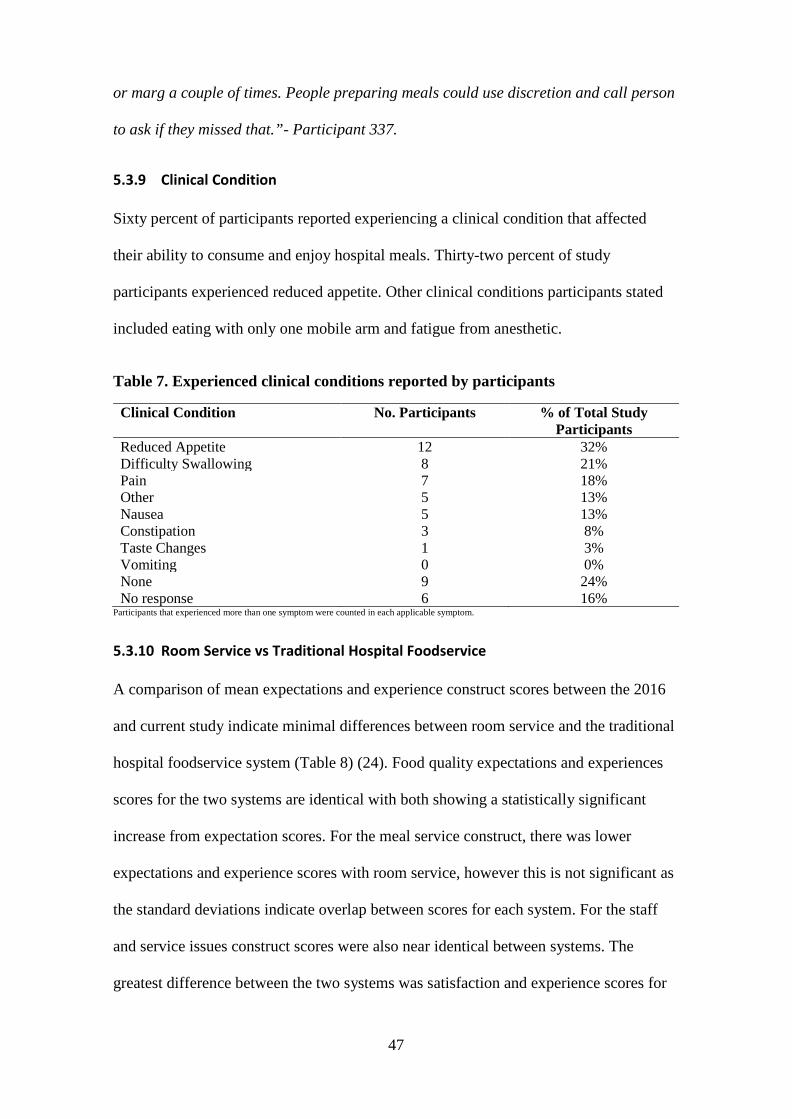
47
or marg a couple of times. People preparing meals could use discretion and call person
to ask if they missed that.”- Participant 337.
5.3.9 Clinical Condition
Sixty percent of participants reported experiencing a clinical condition that affected
their ability to consume and enjoy hospital meals. Thirty-two percent of study
participants experienced reduced appetite. Other clinical conditions participants stated
included eating with only one mobile arm and fatigue from anesthetic.
Table 7. Experienced clinical conditions reported by participants
Clinical Condition No. Participants % of Total Study Participants
Reduced Appetite 12 32% Difficulty Swallowing 8 21% Pain 7 18% Other 5 13% Nausea 5 13% Constipation 3 8% Taste Changes 1 3% Vomiting 0 0% None 9 24% No response 6 16%
Participants that experienced more than one symptom were counted in each applicable symptom.
5.3.10 Room Service vs Traditional Hospital Foodservice
A comparison of mean expectations and experience construct scores between the 2016
and current study indicate minimal differences between room service and the traditional
hospital foodservice system (Table 8) (24). Food quality expectations and experiences
scores for the two systems are identical with both showing a statistically significant
increase from expectation scores. For the meal service construct, there was lower
expectations and experience scores with room service, however this is not significant as
the standard deviations indicate overlap between scores for each system. For the staff
and service issues construct scores were also near identical between systems. The
greatest difference between the two systems was satisfaction and experience scores for
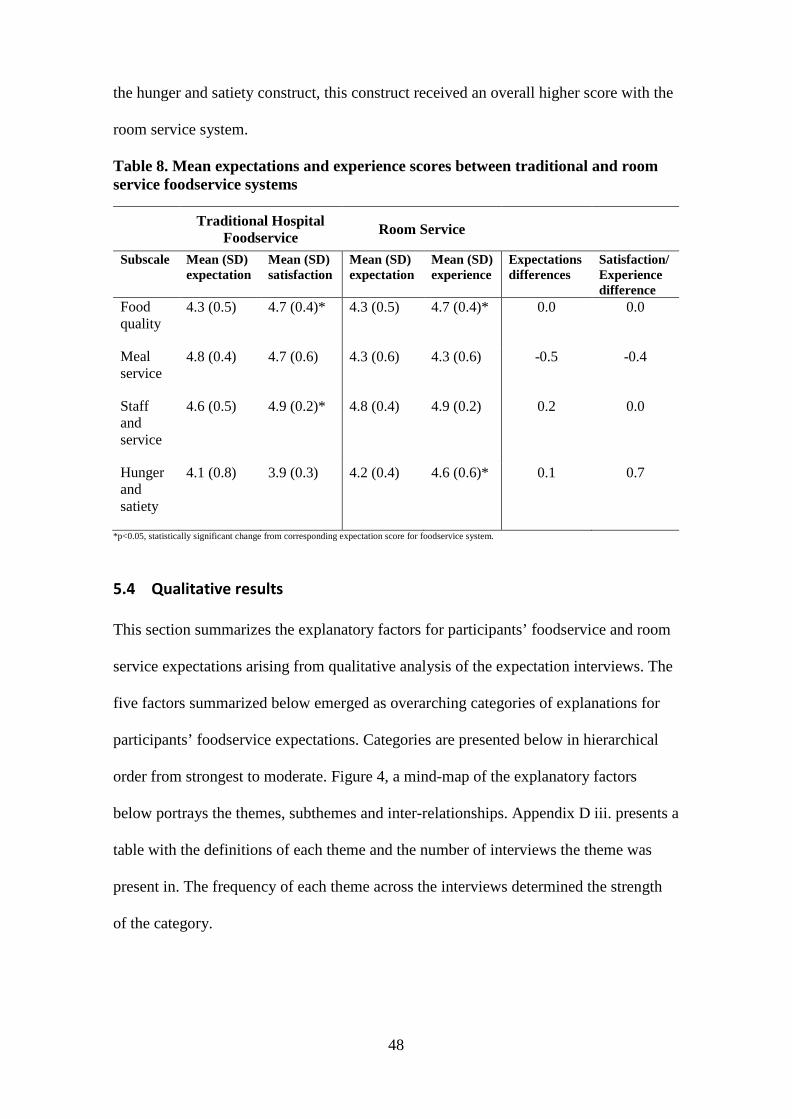
48
the hunger and satiety construct, this construct received an overall higher score with the
room service system.
Table 8. Mean expectations and experience scores between traditional and room service foodservice systems
Traditional Hospital Foodservice Room Service
Subscale Mean (SD) expectation
Mean (SD) satisfaction
Mean (SD) expectation
Mean (SD) experience
Expectations differences
Satisfaction/ Experience difference
Food quality
4.3 (0.5) 4.7 (0.4)* 4.3 (0.5) 4.7 (0.4)* 0.0 0.0
Meal service
4.8 (0.4) 4.7 (0.6) 4.3 (0.6) 4.3 (0.6) -0.5 -0.4
Staff and service
4.6 (0.5) 4.9 (0.2)* 4.8 (0.4) 4.9 (0.2) 0.2 0.0
Hunger and satiety
4.1 (0.8) 3.9 (0.3) 4.2 (0.4) 4.6 (0.6)* 0.1 0.7
*p<0.05, statistically significant change from corresponding expectation score for foodservice system.
5.4 Qualitative results
This section summarizes the explanatory factors for participants’ foodservice and room
service expectations arising from qualitative analysis of the expectation interviews. The
five factors summarized below emerged as overarching categories of explanations for
participants’ foodservice expectations. Categories are presented below in hierarchical
order from strongest to moderate. Figure 4, a mind-map of the explanatory factors
below portrays the themes, subthemes and inter-relationships. Appendix D iii. presents a
table with the definitions of each theme and the number of interviews the theme was
present in. The frequency of each theme across the interviews determined the strength
of the category.
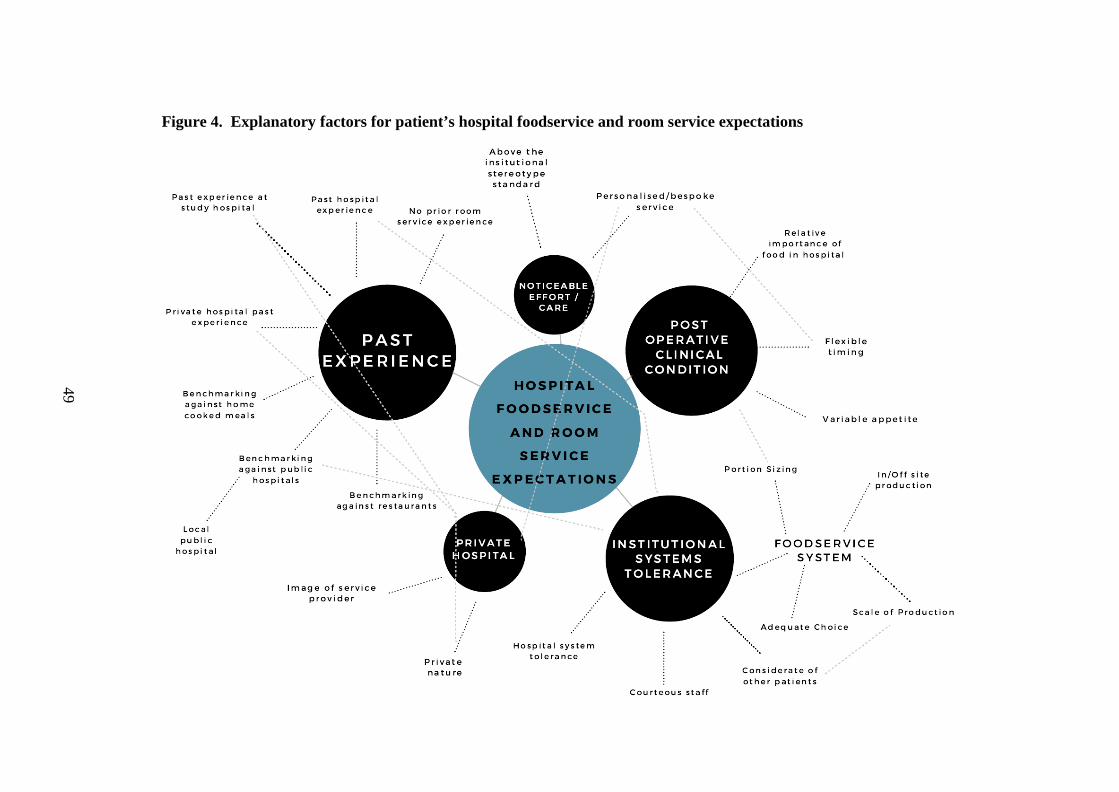
49
Figure 4. Explanatory factors for patient’s hospital foodservice and room service expectations
50
5.4.1 Institutional Systems Tolerance
The strongest theme to emerge was institutional systems tolerance. Interviewees
reflected a forbearing attitude to the hospital foodservice as an institution based on their
understanding of hospital systems. They expressed realistic expectations to how the
foodservice would perform, considering the constraints they thought the hospital and
foodservice faced. This involved expecting inconveniences as inpatients, compromises
on the quality of the food and preparing to be tolerant of these potentially undesirable
aspects of their future experience. This theme is connected to past experience as
participants drew on previous hospital experiences.
Eleven out of sixteen interviewees discussed unwelcome aspects of being in hospital
that are to be expected and tolerated as a patient. It was a common impression that
hospital environments are busy places, with staff having duties to fulfill. When asked if
sounds, smells and staff would distract them from their meal, interviewees expressed:
“I mean you're going to hospital, you know it’s going to be a busy
place, and its possibly going to be noisy, and there's staff coming in
and out all the time, you know, you're not really going there for the
food. I don’t think it would distract me from the food at all” –
Participant 816
There was also an expectation by twelve interviewees of courteous staff, as they are
seen as paid employees hired to provide good service and carry out duties within the
hospital system. Good service was necessary and represented the image of the whole
institution. This sub theme is included within institutional systems tolerance as
interviewees were compassionate towards staff members, with some expressing
understanding to the possibility of lower standards of service.
51
“If it's their job to deliver meals to their clients which I would be.
Then I would expect them to do it as, to the best of their ability. If
their ability is perhaps at a lower standard to what I would expect. As
long as they were doing it to the best of their ability. Then that's fine
by me” -Participant.449
5.4.1.1 Foodservice systems tolerance
Within institutional systems category, distinct from tolerance of the general hospital
environment, was interviewees’ understanding of institutional foodservice systems and
how they expected this would affect the meal and service they received. Interviewees
had a general understanding of traditional hospital foodservice systems from past
experiences. They could reflect how the foodservice system influenced the meal they
received, specifically the scale of production and whether the food was produced on-site
or outsourced. Interviewees’ knowledge of foodservice systems was heavily influenced
by media representation and criticism of public hospital foodservices.
“… in the public hospital system I'm referring to now is that the meals
have got an absolute reputation for being produced in a mass-
produced way…the meals aren’t even prepared in Dunedin...the
attention to the fine detail of preparing, cooking and preparing and
presenting vegetables just wouldn't be possible… I have homemade
low fat, low sugar muesli [at home]...I can’t imagine that would be
possible in a, large institution. Where they're trying to cater for a
whole lot of different…appetites.” – Participant 909
Tolerance towards system-related factors appeared to be because as patients, they
perceive changing the foodservice is not within their control, and they depend on the
foodservice for their nutritional needs.
52
“..a hospital, doesn’t matter how big or how small, has got to run
umm to their schedules that they've set out… because I'm there as a
patient, I could understand that they gotta ask me early enough to see
what I wanted and they got all these other patients in all these other
rooms. I appreciate what they've got to do, and I appreciate whatever
I'm going to get I'm going to get roughly about the same time they put
out the meals” – Participant 263
Some interviewees expressed tolerance due to the short duration of their admission.
Three interviewees also thought the short duration of their stay would prevent an
accurate evaluation of their foodservice experience.
“.. at the end of the day no matter what it is, I'm only going to be
there for one night, so I'm just going to be happy with whatever I
get...I just put down always because whatever I get given is, will be
fine.” - Participant 206
Other sub-themes contributing to the institutional and foodservice systems tolerance
category include; being considerate of other patients, understanding the foodservice is
catering to a group; adequate choice, not all usual food items will be available; and
portion sizing, that appropriate portion sizes will be served to cater for different
appetites, with adequate amounts to sustain people between meals.
5.4.2 Past Experience
The next strongest factor influencing patient’s expectations was past experiences. The
category of past experiences is defined as patients comparing or benchmarking their
expectations of the foodservice in their upcoming admission against actual past
experiences to other types of foodservices. Stereotypical ideas of foodservices were not
included in this category to exclude generalized bias from common beliefs.
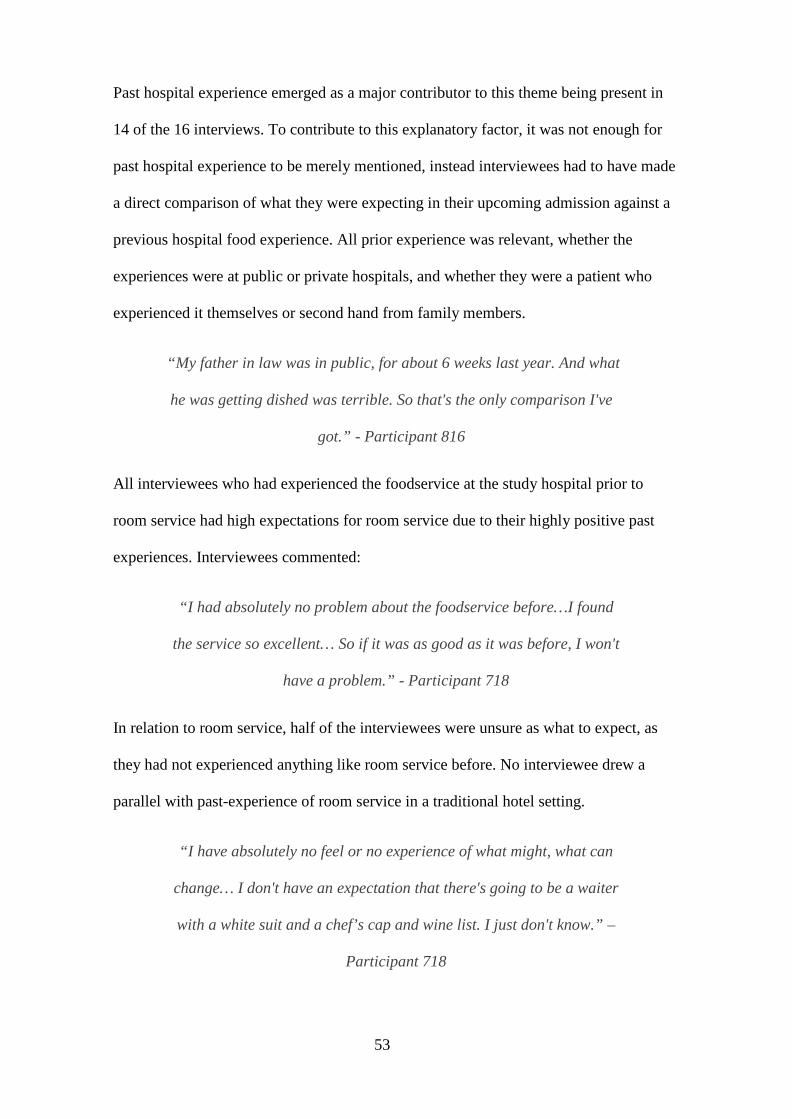
53
Past hospital experience emerged as a major contributor to this theme being present in
14 of the 16 interviews. To contribute to this explanatory factor, it was not enough for
past hospital experience to be merely mentioned, instead interviewees had to have made
a direct comparison of what they were expecting in their upcoming admission against a
previous hospital food experience. All prior experience was relevant, whether the
experiences were at public or private hospitals, and whether they were a patient who
experienced it themselves or second hand from family members.
“My father in law was in public, for about 6 weeks last year. And what
he was getting dished was terrible. So that's the only comparison I've
got.” - Participant 816
All interviewees who had experienced the foodservice at the study hospital prior to
room service had high expectations for room service due to their highly positive past
experiences. Interviewees commented:
“I had absolutely no problem about the foodservice before…I found
the service so excellent… So if it was as good as it was before, I won't
have a problem.” - Participant 718
In relation to room service, half of the interviewees were unsure as what to expect, as
they had not experienced anything like room service before. No interviewee drew a
parallel with past-experience of room service in a traditional hotel setting.
“I have absolutely no feel or no experience of what might, what can
change… I don't have an expectation that there's going to be a waiter
with a white suit and a chef’s cap and wine list. I just don't know.” –
Participant 718
54
Some interviewees saw room service as an attempt at service improvement. Participants
expected room service to be better than their previous hospital foodservice experiences.
“I think just the quality, of the whole, like the food and the delivery and the service will
be a lot better now, with a room service type thing.” – Participant 212.
Past experiences with foodservices in the public hospital system, particularly the local
public hospital was used as a benchmark for expectations. Interviewees expected the
study hospital foodservice would be of higher quality than what they had experienced in
a public hospital - “I'm just expecting it to be a bit more than what I'd get at public
hospital.” – Participant 263. This theme is linked to the themes of private nature, and
noticeable care/effort.
Interviewees also drew from their usual meal experiences at home when explaining their
expectations - “Yes, like I do it at home. So you know it would be nice to have it when
you're not feeling that well.” – Participant 524.
Benchmarking against restaurants was also apparent, with a few participants stating they
do not expect a restaurant-like service:
“It’s not like a restaurant and you put an order in and you'd expect it
to be absolutely perfect within 20 minutes sort of thing…you don't
expect it to be absolutely restaurant quality when they've got a lot of
people to feed.” – Participant 206
5.4.3 Post-surgery clinical condition
Another major explanatory factor for foodservice expectations was participants’ idea of
how their physical state, mood and appetite post-surgery would influence when and
what they eat. Twelve out of the sixteen interviewees predicted their clinical condition,
post-surgery, would influence their foodservice experience. Commonly they expected
55
not to want to consume food and utilize the foodservice due to nausea or fatigue until
they felt more well. “…like for myself I suppose I don’t think I'm going to be eating
much after my surgery” – Participant 798
The relative importance of food post-surgery was also raised, three participants thought
food was of low importance in hospital, since activity levels decrease, and recovery was
more important; whereas two participants believed food was an important part of
recovery post-surgery. “… it's not really your main focus, when you've had an
operation…You're hungry but you're not always hungry straight away you know.” –
Participant 811
“…you need your strength to recover you know, and food is a big part of that.”
– Participant 167
Four interviewees welcomed the flexible timing of meals with room service, as they
expected they and other patients would not be certain when they would feel like eating
due to their post-surgery clinical condition. They also thought it would increase patient
autonomy over their food and deliver a more personalized service. “…in hospital,
everyone seems more or less do most of it for you, so I guess it [room service] gives you
a bit of control over something” – Participant 708
5.4.4 Noticeable care and effort
Close to half of the interviewees expected service to exceed the institutional stereotype
standard of hospital foodservice, which would be evident in noticeable care and effort
by staff and in the quality of the food. Interviewees expected to see attempts of going
beyond the institutional stereotype in tangible aspects of the food such as the
presentation of the food, and in the service from staff, expecting a more personalized
service where personal requests would be fulfilled. The strength of this explanatory
56
factor was moderate compared to the above categories but links to private nature and
scale of production. Interviewees believed a personalized, attention-to-detail service
would be more possible in a private hospital setting and with a room service system. “I
think, the connotation is that, that because its room service, it might be someone has
taken a bit more care on it” – Participant 811
“Well I think a) people are paying…people go to private hospitals
because they expect a higher standard than what you would otherwise
get at the in the public system.” – Participant 909
5.4.5 Private Hospital Nature
Another moderately strong theme to emerge as an explanatory factor for foodservice
expectations was the study hospital being a private hospital and commercial healthcare
provider. Six interviewees had higher expectations for private hospital foodservices, due
it being a paid service, regardless who was funding their admission. This expectation
was often benchmarked to public hospital foodservices.
”…being private, I would it expect it to be a little bit better than that,
a public one, because its private I suppose, and it's not such a big
place and I guess the fact that you're paying the money, even though
your insurance is paying the money. You would it expect it to be of
better quality… the expectations are higher, in a private hospital,
than a public one” – Participant 206
The reputation of the study hospital also influenced expectations in a similar way.
One comment that was typical from the three interviewees who had this expectation
was: “…because of the reputation of Mercy hospital and um yeah I think that’s why the
meals I get there will be better than I would at public” - Participant 263
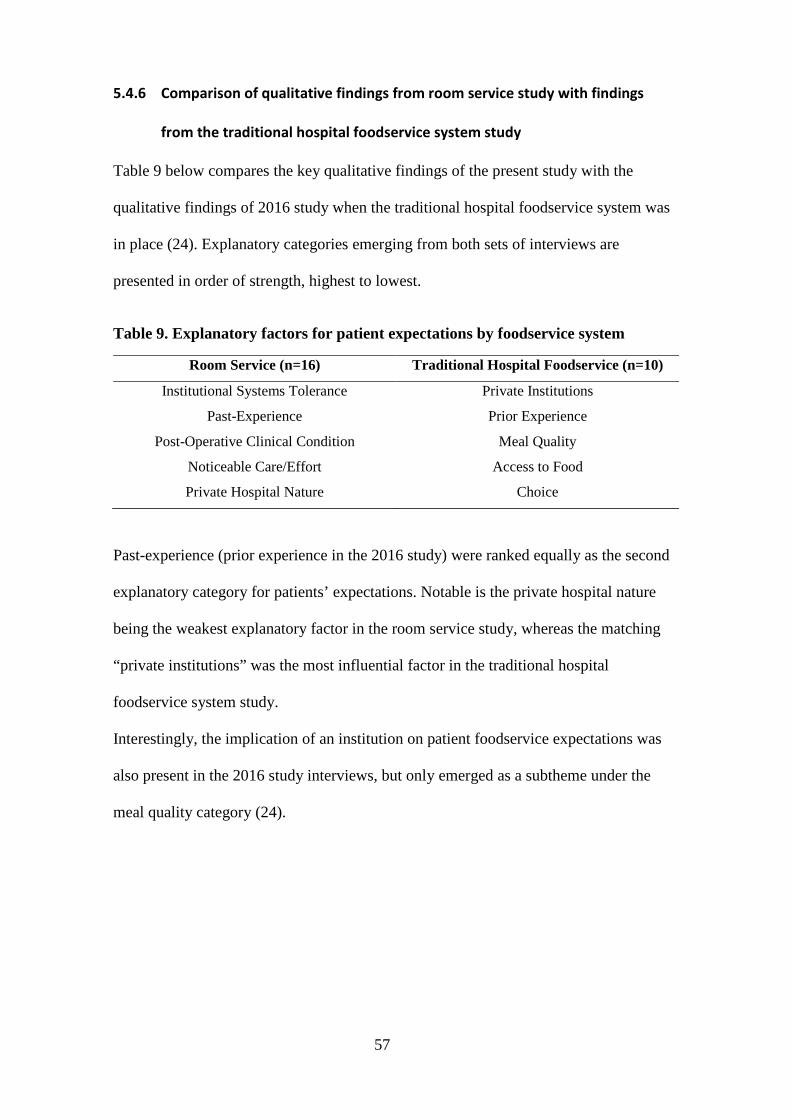
57
5.4.6 Comparison of qualitative findings from room service study with findings
from the traditional hospital foodservice system study
Table 9 below compares the key qualitative findings of the present study with the
qualitative findings of 2016 study when the traditional hospital foodservice system was
in place (24). Explanatory categories emerging from both sets of interviews are
presented in order of strength, highest to lowest.
Table 9. Explanatory factors for patient expectations by foodservice system
Room Service (n=16) Traditional Hospital Foodservice (n=10)
Institutional Systems Tolerance Private Institutions
Past-Experience Prior Experience
Post-Operative Clinical Condition Meal Quality
Noticeable Care/Effort Access to Food
Private Hospital Nature Choice
Past-experience (prior experience in the 2016 study) were ranked equally as the second
explanatory category for patients’ expectations. Notable is the private hospital nature
being the weakest explanatory factor in the room service study, whereas the matching
“private institutions” was the most influential factor in the traditional hospital
foodservice system study.
Interestingly, the implication of an institution on patient foodservice expectations was
also present in the 2016 study interviews, but only emerged as a subtheme under the
meal quality category (24).
58
6 Discussion
The impact of a room service on patient foodservice expectations and experiences is
unknown. This study explores patients’ expectations and experiences of the first
hospital room service in New Zealand, addressing this gap in the literature. Comparison
of questionnaire results from this study and a 2016 study when a traditional hospital
foodservice system was in place reveal marginal differences. With high patient
expectations in both studies being met or exceeded with high experience scores. These
somewhat surprising findings can be explained by the qualitative results for patient
expectations with some interesting differences arising between the two studies.
6.1 Patient expectations and experiences of room service
Patients expectations of and experiences with room service were positively high with
91% of responses in the upper limits. This may in part be explained by the major theme
emerging from the interviews, institutional systems tolerance.
6.1.1 Institutional Systems Tolerance
Institutional systems tolerance was a major explanatory factor which moderated patient
expectations. Interviewee’s accommodating attitude to ideal expectations not being met
was based on their ideas and understanding of the hospital foodservice system. This
pragmatism coincides with findings from a study on patient clinic expectations, where
patient’s realistic expectations were lower than their ideal expectations (30). The
implication of an institution on foodservice expectations also emerged in the 2016 study
results however as a lesser explanatory factor (24). It is well known that the reputation
of hospital food is not very positive amongst the general public (12,13,20,48). The study
region population is likely to hold even more polarized negative views of hospital
foodservices due to relatively recent media coverage of problems with the public
hospital foodservice from a change of contractor (14,78).
59
Institutional systems tolerance sets patient’s expectations and perceptions of their meal
experience in the context of the hospital setting, not a restaurant. Even with a
personalized hotel-style room service, the hospital setting had implications on patients’
expectations particularly around scale of production and consideration of other patients.
This perspective expands from institutional stereotyping of the hospital foodservice to
include a sense of empathy towards the constraints the foodservice operates with. The
moderating effect from institutional ideas of hospital foodservices on patient
expectations is an important novel finding.
6.1.2 Prior hospital experience and private nature
The influence of past experience seen in this study fits well with the disconfirmation
theory (Section 2.3.1) which postulates past experiences directly influence expectations
(24,25,79). Even though participants had no prior-experience of room service to inform
expectations, their high expectations were based on what they knew and understood
about hospital foodservice systems from past experiences. Patients who had
experienced the study hospital food service before had higher expectations for food
quality and hunger and satiety. This also links to the private nature of the hospital, with
patients stating they already had access to food in between meals with the traditional
hospital foodservice system.
Participants’ high expectations related to the private nature of the hospital are similar to
Shabbir et al. and Lowerson’s findings, with extra effort from staff and in the quality of
the food expected, as the hospital operated as a paid, private sector service (24,28). It is
surprising that the influence of private nature was not as strong an explanatory theme in
the current research as it was in the 2016 study. This may come down to the differences
in participants, as systems tolerance dominated the present study participants’
expectations.
60
6.1.3 Foodservice experience
Experience scores did not differ between age or gender groups, which is consistent with
other foodservice research from Hartwell, Tranter et al. and Fallon et al. (48,62,69).
Statistically significant differences between expectations and experience scores for food
quality and hunger and satiety constructs indicate the foodservice exceeded expectations
in both these areas. The higher experience score for food quality accords with findings
from previous studies which have demonstrated room service enhances patient
perception of the quality of food (10,31,37). Although the higher experience than
expectation score is identical to the results for food quality in the 2016 study, so it
cannot be completely credited to the change of system.
The lower experience than expectation scores for temperature of foods is an excellent
example of the value in measuring expectations, to indicate shortfalls in the quality of
the service (24,25,28). The free text comments also confirmed this issue which
highlights the usefulness of comment boxes in surveys, as found in previous research
(8,69). As noted in Section 2.2.2, temperature is particularly subject to patient criticism
as it is based on individual perceptions, rather than the actual temperature of the food
which may have been within an acceptable range. Nevertheless, it is a quality aspect
worth further investigating to improve.
A distinguishing element of room service, being able to order on demand, was clearly
valued by participants with greater mean experience scores than expectation scores.
This finding further supports the literature, emphasizing a key benefit of room service as
a hospital foodservice system for patients (10,31,36,38).
The influence of patients’ clinical condition on their foodservice experience emerged as
an important finding. Most useful is the finding that 32% of participants experienced
reduced appetite. This could be limiting the amount and types of foods and drinks they
consume from the foodservice and influence experience scores. This seemingly obvious
61
variable has been considered in one other study which found the severity of a patient’s
illness affected their satisfaction with hospital services, including the foodservice (80).
Otherwise, the impact of clinical condition has only been reported in foodservice studies
as incidental findings. For example, in Tranter et al., in a miscellaneous category for
patient satisfaction survey comments, the most frequent comment was “no appetite”
(69). In Naithani et al., patients also reported being affected by loss of appetite and
trouble swallowing (20). Neighbours in 2017 produced a similar finding and suggested
it is a largely unconsidered explanatory factor for patient foodservice experiences (52).
These examples highlight how patient’s clinical condition is rarely considered, yet for
patients it has a significant impact on their foodservice experience. Participants in this
study expected their clinical condition to exert an influence. Recognizing the effect of
clinical conditions along with the foodservice quality constructs helps build a broader
picture of the patient foodservice experience and provide some context to experience
scores.
6.2 Room service vs traditional hospital foodservice system
Where other room service research has reported significant increases in patient
satisfaction when room service replaces a traditional hospital foodservice system, in this
study, there were only marginal differences across all mean foodservice construct scores
(10,11,31,36–38). This result may represent a ceiling effect (81). This possibility was
suspected as the traditional hospital foodservice system at the study hospital already had
high expectation and satisfaction scores (24). In the present study, institutional systems
tolerance and patients not knowing what to expect with room service may have
suppressed the effect of any higher expectations associated with room service as a
personalized service. High scores could also be due to the ‘halo’ effect of a private
institution. As seen in other research, people could not add more to their expectations
62
and experiences as they were already very high for a private hospital (24,28,62).
High expectations scores despite institutional systems tolerance may indicate the FEEQ
failed to discriminate between truly high expectations and experiences and high
expectations and experiences from easy-to-please patients. Alternatively, it could simply
be hard to quantify even higher experiences from already high expectations on the
Likert-scale as the maximum of the scale has been reached, resulting in the ceiling
effect. Experience interviews could have been undertaken in both the current and 2016
study to qualitatively measure experiences, which may have better discerned differences
between room service and traditional hospital foodservice, as it did for expectations.
Surprisingly, room service meal service scores were lower in expectations and
experience compared to traditional foodservice system scores. The lower temperature
rating with room service is contrary to what most researchers have found with room
service (31,35,36). Although Doorduijn et al. also reported a decrease in food
temperature ratings with room service (11). For the study hospital, the decreased
temperature rating with room service may be because the traditional system used
insulated trolleys to deliver the meals. Whereas at the time of this study room service
was not using insulated trolleys, as the food was being delivered straight after it was
made. On occasion if there were multiple orders to be delivered at the same time, some
meal items may have not retained their ideal temperature in transit.
The largest difference between system scores was with the hunger and satiety construct.
This construct generated higher experience than expectations scores as well as when
compared to the traditional system. This is likely due to the increased access to food.
This finding suggests participants were less likely to go hungry with room service,
which aligns with research that room service increases food intake (10,31,35,36,38).
This has important implications for the prevention of malnutrition in hospitals and
improving post-surgery recovery. However, the weak Cronbach’s alpha for the hunger
63
and satiety construct limit the magnitude of this finding.
6.3 Strengths and limitations
The present study followed the same research design as the 2016 study and recruited a
matched study population to enable a fair comparison with the traditional hospital
foodservice system. The timing of data collection when the room service system was
stable and administration of the experience questionnaire to participants as inpatients
also ensured unbiased assessment of experiences.
The food quality construct achieved strong internal reliability for both questionnaires
proving the set of questions is a true measure of the food quality of the foodservice. All
other constructs however, had weaker Cronbach alphas than the 2016 pilot study,
reducing the usefulness of these results. This is likely to be due to the inconsistencies
identified in the 2016 study subscale analysis, which were corrected to be a strength of
this research. High expectations and experience scores in both studies due to the ‘halo
effect’ of a private institution also limited the ability to detect a difference between
room service and the traditional system. This suggests the FEEQ does not sufficiently
discriminate higher experiences from high expectations. Additionally, the small sample
size of predominantly New Zealand Europeans limit the generalizability of the findings.
Despite these limitations, the mixed methodology proved useful in highlighting
differences in expectations between the two systems. A gap in the assessment of
foodservice quality was also identified, demonstrating the applicability of this research
in practice.
6.4 Implications for future research
Introduction of a room service system requires large capital expenditure (34). Further
research is urgently needed to expand on the findings from this study for a deeper
understanding of the impact of room service on patient expectations and experiences.
Specifically:
64
• Exploring how room service affects patient expectations and experiences in other
settings and populations, such as public hospitals, children and other ethnicities.
• Further developing the FEEQ by addressing its limitation to discriminate higher
experiences from high expectations.
Foodservice experience should also be more broadly analyzed by qualitative measures,
which may better detect differences between hospital foodservice systems unable to be
quantified by questionnaires alone. Findings from this research also suggest patient
expectations prior to the use of a service and clinical conditions should be considered in
patient experience studies.
6.5 Conclusion
This groundbreaking study set out to assess the impact of the first hospital room service
system in New Zealand on patient foodservice expectations and experiences.
Surprisingly, marginal differences were found in foodservice construct scores between
room service and the previous traditional hospital foodservice system at the study
hospital. Qualitative analysis showed institutional systems tolerance and lack of prior
experience moderated patients’ expectations for room service. Additionally, the ‘halo’
effect of a private institution limited the ability to distinguish the impact of the new
room service. However, strengths of a room service system were identified, as well as
area of improvement regarding the temperature of the meals and drinks. This clearly
illustrates the value in assessing patient expectations and experiences as a form of
feedback for hospital foodservices. Findings from this research should help inform
improvements to hospital foodservices and patient feedback instruments. Further
exploration into room service in different settings is needed to determine its influence
on patient expectations and experiences.
65
7 Application to Practice
The findings of this research provide insight into what New Zealand patients expect and
experience with a hospital room service foodservice system. It adds to the growing body
of literature on hospital room service and patient foodservice expectations and
experiences. The results can be applied in practice to inform quality improvements for
the study hospital foodservice, and other hospital foodservices nationwide. In particular,
the results will help other hospitals determine if a room service system is the logical
next step for their foodservice to enhance patient foodservice experiences.
The increased access to food and improved hunger and satiety scores also suggest a
room service meal ordering and delivery system could be a used as a strategy in
preventing malnutrition in hospitals.
Dietitians in hospital foodservices and other settings should ensure they apply robust
patient-centered quality measures as part of their quality management program. This
research provides an exemplary model for how this can be done by:
1. Moving away from patient satisfaction and using the more inclusive measure of
patient experiences
2. Assessing what patients expect prior to the use of a service, to benchmark their
actual experiences to for identifying areas of improvement.
3. Considering patient experiences as multi-dimensional. For example, clinical
conditions should be considered as part of the whole patient foodservice
experience to provide context to experience scores.
4. Collecting both quantitative and qualitative data to provide context for patient
expectations and experiences.
The study is also the first known to assess a change in foodservice systems in New
Zealand. Given the recent contracting out of many New Zealand District Health Board
66
foodservices and the budget constraints the public health sector faces, the tools
developed in this research could be applied to monitor the impact of changes to hospital
foodservices on patients’ foodservice experiences, to inform future decisions (63,78).
The research also highlights the institutional stereotype of hospital food is alive in New
Zealand patient’s expectations to the point they have developed a tolerance and realistic
expectations for hospital foodservices, even for private hospitals. This provides
foodservice dietitians with evidence that they need to address the disappointment
patients anticipate with hospital food before they have even tried it. This could be
tainting their meal experience and effecting their meal intake prejudicially. Quality
improvements should be directed to exceed these expectations and encourage positive
experiences to ensure patient’s meet their nutritional requirements in hospital.
7.1 Reflection
Originally when I took up this research project, my focus was around the questionnaire.
The interviews seemed superfluous to measuring expectations. However, I found them
to be the most fun and enlightening aspect of data collection. I felt humbled to talk to
strangers who shared their opinions so freely, though it did not seem like much to them,
it gave me much more information than what I could see from their questionnaires.
Although transcribing 4 hours’ worth of interviews was a challenge for me, I can see the
information I collated from them has enriched my findings and has truly identified
something novel. This has made me appreciate the value in qualitative research to
explore different perspectives. It has also taught me the value in listening to patients and
putting their experience in the center of what you are trying to do. As a Dietitian this is
important for ensuring practical nutrition interventions. From this experience, I now
know not to just rely on ratings but to take the time to listen to clients and seek what an
ideal experience looks like for them, to find out how can I achieve this with them.
67
8 References
1. Capra S, Wright O, Sardie M, Bauer J, Askew D. The acute hospital foodservice patient satisfaction questionnaire: the development of a valid and reliable tool to measure patient satisfaction with acute care hospital foodservices. Foodservice Research International. 2005 Mar;16:1–14.
2. Dall’Oglio I, Nicolò R, Di Ciommo V, Bianchi N, Ciliento G, Gawronski O, et al. A Systematic Review of Hospital Foodservice Patient Satisfaction Studies. Journal of the Academy of Nutrition and Dietetics [Internet]. 2015 Apr [cited 2017 Sep 8];115(4):567–84. Available from: http://linkinghub.elsevier.com/retrieve/pii/S2212267214017602
3. Aase S. Hospital Foodservice and Patient Experience: What’s New? Journal of the American Dietetic Association. 2011;111:1118, 1120–3.
4. Hartwell HJ, Edwards JSA, Symonds C. Foodservice in hospital: development of a theoretical model for patient experience and satisfaction using one hospital in the UK National Health Service as a case study. Journal of Foodservice [Internet]. 2006 Dec;17(5–6):226–38. Available from: http://10.0.4.87/j.1745-4506.2006.00040.x
5. Sheehan-Smith L. Hotel-style room service in hospitals: the new paradigm of meal delivery for achieving patient satisfaction of food service. Peabody College of Vanderbilt University; 2004.
6. Ottrey E, Porter J. Hospital menu interventions: a systematic review of research. International Journal of Health Care Quality Assurance. 2016;29(1):62–74.
7. Farhana Aminuddin N, Kumari Vijayakumaran R, Razak SA, Malaysia S, Kelantan M, Vijayakumaran RK. Patient Satisfaction With Hospital Foodservice and its Impact on Plate Waste in Public Hospitals in East Malaysia. Hospital Practices and Research [Internet]. 2018 [cited 2018 Sep 3];3(3):90–7. Available from: http://www.jhpr.ir
8. Messina G, Fenucci R, Vencia F, Niccolini F, Quercioli C, Nante N. Patients’ evaluation of hospital foodservice quality in Italy: what do patients really value? Public Health Nutrition. 2012;16(4):730–7.
9. Barker LA, Gout BS, Crowe TC. Hospital malnutrition: prevalence, identification and impact on patients and the healthcare system. International Journal of Environmental Research and Public Health [Internet]. 2011 [cited 2018 Nov 10];8(2):514–27. Available from: http://www.ncbi.nlm.nih.gov/pubmed/21556200
10. McCray S, Maunder K, Krikowa R, MacKenzie-Shalders K. Room Service Improves Nutritional Intake and Increases Patient Satisfaction While Decreasing Food Waste and Cost. Journal of the Academy of Nutrition and Dietetics [Internet]. 2017;1–10. Available from: http://dx.doi.org/10.1016/j.jand.2017.05.014
11. Doorduijn AS, Van Gameren Y, Vasse E, De Roos NM. At Your Request® room
68
service dining improves patient satisfaction, maintains nutritional status, and offers opportunities to improve intake. Clinical Nutrition. 2016;35:1174–80.
12. Johns N, Edwards JSA, Hartwell HJ. Hungry in hospital, well-fed in prison? A comparative analysis of food service systems. Vol. 68, Appetite. 2013.
13. Cardello A V., Bell R, Kramer FM. Attitudes of consumers toward military and other institutional foods. Food Quality and Preference. 1996;7(1):7–20.
14. “The meals are disgusting” - campaign against Dunedin hospital meals grows [Internet]. One News. New Zealand: TVNZ; 2016 [cited 2017 Nov 2]. Available from: https://www.tvnz.co.nz/one-news/new-zealand/meals-disgusting-campaign-against-dunedin-hospital-grows
15. Goodwin E. Group formed to protest hospital meals. Otago Daily Times [Internet]. 2016 [cited 2017 Nov 2]; Available from: https://www.odt.co.nz/news/dunedin/group-formed-protest-hospital-meals
16. Manary M, Boulding W, Staelin R, Glickman SW. The Patient Experience and Health Outcomes. New England Journal of Medicine [Internet]. 2013;368(3):199–201. Available from: http://www.nejm.org/doi/10.1056/NEJMp1213134
17. Russell S. Patients’ experiences: Top heavy with research [Internet]. Research Matters. Melbourne; 2013 [cited 2017 Sep 20]. Available from: http://www.research-matters.com.au/publications/PatientsExperiencesReview.pdf
18. Edwards KJ, Walker K, Duff J. Patient Experience Journal Instruments to measure the inpatient hospital experience: A literature review. Patient Experience Journal [Internet]. 2015 [cited 2017 Sep 20];2(2). Available from: http://pxjournal.org/journal
19. Health Quality & Safety Commission. Patient Experience Survey – Adult Inpatients Methodology and Procedures [Internet]. Wellington; 2014 [cited 2017 Sep 15]. Available from: http://www.hqsc.govt.nz
20. Naithani S, Whelan K, Thomas J, Gulliford MC, Morgan M. Hospital inpatients’ experiences of access to food: a qualitative interview and observational study. Health Expectations [Internet]. 2008 Sep 1 [cited 2018 Oct 15];11(3):294–303. Available from: http://doi.wiley.com/10.1111/j.1369-7625.2008.00495.x
21. Ottrey E, Porter J. Exploring patients’ experience of hospital meal-ordering systems. Nursing Standard. 2017 Aug 9;31(50):41–51.
22. Survey Coordination Centre. NHS Adult Inpatient Questionnaire [Internet]. Care Quality Commission; 2018 [cited 2018 Oct 18]. Available from: http://www.nhssurveys.org/Filestore/Inpatients_2018/IP18_Questionnaire_V1.pdf
23. Porter J, Cant R. Exploring hospital patients’ satisfaction with cook-chill foodservice systems: a preliminary study using a validated questionnaire. Journal of Foodservice [Internet]. 2009 Apr;20(2):81–9. Available from: http://10.0.4.87/j.1748-0159.2009.00128.x
69
24. Lowerson S. Patient Foodservice Expectations and Satisfaction Study [Internet]. University of Otago; 2016. Available from: https://ourarchive.otago.ac.nz/handle/10523/7253
25. Elkhani N, Bakri A. Review on “Expectancy Disconfirmation Theory” (EDT) Model in B2C E-Commerce. Journal of Information Systems Research and Innovation [Internet]. 2012 [cited 2018 Nov 8];95–102. Available from: http://seminar.utmspace.edu.my/jisri/
26. Batailler P, François P, Mô Dang V, Sellier E, Vittoz J-P, Seigneurin A, et al. Trends in patient perception of hospital care quality. International Journal of Health Care Quality Assurance [Internet]. 2014;27(5):414–26. Available from: http://www.emeraldinsight.com/doi/10.1108/IJHCQA-02-2013-0014
27. Ofir C, Simonson I. The Effect of Stating Expectations on Customer Satisfaction and Shopping Experience. Journal of Marketing Research [Internet]. 2007 Feb [cited 2018 Nov 1];44(1):164–74. Available from: http://journals.ama.org/doi/abs/10.1509/jmkr.44.1.164
28. Shabbir A, Malik SA, Janjua SY. Equating the expected and perceived service quality. International Journal of Quality & Reliability Management [Internet]. 2017;34(8):1295–317. Available from: http://www.emeraldinsight.com/doi/10.1108/IJQRM-04-2016-0051
29. Wu Z, Robson S, Hollis B. The Application of Hospitality Elements in Hospitals. Journal of Healthcare Management [Internet]. 2013;58(1):47–62. Available from: http://search.ebscohost.com/login.aspx?direct=true&db=buh&AN=85209414&site=ehost-live
30. Bowling A, Rowe G, Lambert N, Waddington M, Mahtani KR, Kenten C, et al. The measurement of patients’ expectations for health care: a review and psychometric testing of a measure of patients’ expectations [Internet]. Vol. 16, Health Technology Assessment. 2012 [cited 2018 Oct 15]. Available from: www.hta.ac.uk
31. McLymont V, Cox S, Stell F. Improving patient meal satisfaction with room service meal delivery. Journal of Nursing Care Quality [Internet]. 2003;18(1):27–37. Available from: http://www.ncbi.nlm.nih.gov/pubmed/12518836
32. Theurer VA. Improving Patient Satisfaction in a Hospital Foodservice System Using Low-Cost Interventions : Determining Whether a Room Service System is the Next Step [Internet]. All Graduate Plan B and other reports. Utah State University; 2011. Available from: http://digitalcommons.usu.edu/gradreports/32
33. Zabel CM. Room Service: An Innovation in Food Service Delivery in the Acute Care Setting Enhances the Patient/Family Food Experience. Journal of the American Dietetic Association [Internet]. 2010 Sep 1 [cited 2017 Sep 20];110(9):A71. Available from: http://www.sciencedirect.com.ezproxy.otago.ac.nz/science/article/pii/S0002822310009685
34. Sheehan-Smith L. Key facilitators and best practices of hotel-style room service in hospitals. Journal of the American Dietetic Association. 2006;106(4):581–6.
70
35. Mahoney S, Zulli A, Walton K. Patient satisfaction and energy intakes are enhanced by point of service meal provision. Nutrition and Dietetics. 2009;66(4):212–20.
36. Kuperberg K, Caruso A, Dello S, Mager D. How will a room service delivery system affect dietary intake, food costs, food waste and patient satisfaction in a paediatric hospital? A pilot study. Journal of Foodservice [Internet]. 2008;19(5):255–61. Available from: http://doi.wiley.com/10.1111/j.1748-0159.2008.00103.x
37. Wadden K, Wolf B, Mayhew A. Traditional Versus Room Service Menu Styles For Pediatric Patients. Canadian Journal of Dietetic Practice and Research [Internet]. 2006;67(2):92–4. Available from: http://www.ncbi.nlm.nih.gov/pubmed/16759436%0Ahttp://dcjournal.ca/doi/abs/10.3148/67.2.2006.92
38. Williams R, Virtue K, Adkins A. Clinical Issues Room Service Improves Patient Food Intake and Satisfaction With Hospital Food. Jounal of Pediatric Oncology Nursing [Internet]. 1998 Jul [cited 2017 Sep 15];15(3):183–9. Available from: http://journals.sagepub.com.ezproxy.otago.ac.nz/doi/pdf/10.1177/104345429801500307
39. Lee H, Wood K, Griffith S, Franco R, Villareal P. Room Service: Food Systems Application Model to Improve Patient Food Satisfaction Scores in a Large Multi-Hospital Chain. Journal of the American Dietetic Association [Internet]. 2011 Sep 1 [cited 2017 Sep 15];111(9):A61. Available from: http://www.sciencedirect.com/science/article/pii/S0002822311009345?via%3Dihub
40. Two awards won by Mercy Hospital [Internet]. Otago Daily Times. 2018 [cited 2018 Nov 15]. Available from: https://www.odt.co.nz/news/dunedin/two-awards-won-mercy-hospital
41. Restaurant style food at hospital. Otago Daily Times [Internet]. 2018 Feb 15 [cited 2018 Nov 15]; Available from: https://www.odt.co.nz/news/dunedin/restaurant-style-food-hospital
42. Mercy Hospital Dunedin. Overview : Mercy Hospital [Internet]. 2018 [cited 2018 Nov 5]. Available from: https://www.mercyhospital.org.nz/about-us/mercy-hospital/overview
43. Mercy Hospital Dunedin Limited. Mercy Hospital and Room Service overview. Dunedin; 2018.
44. Fitzpatrick T. Room Service Refined. Food Management; Cleveland. 2010 Aug;45(8):52–4.
45. Payne-Palacio J, Theis M. Foodservice management: Principles and practices. 13th ed. Pearson Education, Inc; 2016.
46. Olney E. Design and analysis of meal assembly and delivery methods in hospital foodservice systems [Internet]. Rochester Insitute of Technology; 2003 [cited 2017 Oct 4]. Available from: http://scholarworks.rit.edu/theses
71
47. Gregoire MB, Spears MC. Distribution and Service. In: Foodservice organisations: a managerial and systems approach. 6th ed. Upper Saddle River: Pearson Prentice Hall; 2007. p. 200–13.
48. Hartwell HJ. Patient Experience, Nutritional Intake And Satisfaction With Hospital Food Service [Internet]. Bournemouth University; 2004 [cited 2018 Sep 3]. Available from: https://core.ac.uk/download/pdf/77035.pdf
49. Hartwell HJ, Edwards JSA, Beavis J. Plate versus bulk trolley food service in a hospital: comparison of patients’ satisfaction. Nutrition. 2007;23:211–8.
50. Goad M. Hospital food goes upscale. Portland Press Herald [Internet]. 2016 Jun 12; Available from: https://search.proquest.com/docview/1795742453?accountid=14700
51. Hartwell HJ, Shepherd PA, Edwards JSA, Johns N. What do patients value in the hospital meal experience? 2015 [cited 2017 Sep 15]; Available from: http://ac.els-cdn.com.ezproxy.otago.ac.nz/S0195666315300349/1-s2.0-S0195666315300349-main.pdf?_tid=f1a78bf0-9994-11e7-9d5d-00000aab0f26&acdnat=1505425244_2c6d39c2ba1bced2b987223aa932327a
52. Neighbours KB. Exploring Patient Foodservice Experiences with a New Zealand Public Hospital Population. University of Otago; 2017.
53. Engelund EH, Lassen A, Mikkelsen BE. The modernization of hospital food service – findings from a longitudinal study of technology trends in Danish hospitals. Nutrition & Food Science [Internet]. 2007;37(2):90–9. Available from: http://dx.doi.org/10.1111/j.1748-0159.2008.00103.x
54. Johns N, Hartwell H, Morgan M. Improving the provision of meals in hospital. The patients’ viewpoint. Appetite. 2010;54:181–5.
55. Sarah Barnett. Hospital food: it’s complicated [Internet]. New Zealand Listener. 2011 [cited 2017 Oct 12]. Available from: http://www.noted.co.nz/health/health/hospital-food-its-complicated/
56. Hannan-Jones M, Capra S. Developing a valid meal assessment tool for hospital patients. Appetite [Internet]. 2017 Jan [cited 2018 Nov 6];108:68–73. Available from: https://linkinghub.elsevier.com/retrieve/pii/S0195666316304743
57. Nor ZM. Hospital foodservice directors identify the important aspects when implementing room service in hospital foodservice. Iowa State University [Internet]. 2010; Available from: http://lib.dr.iastate.edu/etd
58. Health Quality and Safett Commission 2017. A Window on the Quality of NZ Health Care [Internet]. [cited 2017 Sep 15]. Available from: https://www.hqsc.govt.nz/assets/Health-Quality-Evaluation/PR/A_Window_on_the_Quality_of_NZ_Health_Care_2017.pdf
59. Bombard Y, Baker GR, Orlando E, Fancott C, Bhatia P, Casalino S, et al. Engaging patients to improve quality of care: a systematic review. Implementation Science [Internet]. 2018;13(1):98. Available from: https://implementationscience.biomedcentral.com/articles/10.1186/s13012-018-
72
0784-z
60. Polta A. Rice Memorial Hospital introduces room service. McClatchy - Tribune Business News [Internet]. 2008 Nov 19 [cited 2017 Oct 10];1–3. Available from: https://search.proquest.com/docview/456746493?accountid=14700
61. Mahoney D. Understanding the Needs of the Health Care Consumer. Industry Edge. 2016;(May):1–3.
62. Fallon A, Gurr S, Hannan-Jones M, Bauer JD. Use of the acute care hospital foodservice patient satisfaction questionnaire to monitor trends in patient satisfaction with foodservice at an acute care private hospital. Nutrition and Dietetics. 2008;65(1):41–6.
63. Board of New Zealand Health Partnerships. Statement of Intent Statement of Performance Expectations. 2016 [cited 2017 Sep 19]; Available from: http://www.nzhealthpartnerships.co.nz/wp-content/uploads/2016/08/07.-Combined-SOI-and-SPE-300616-FINAL.pdf
64. Wright ORL, Connelly LB, Capra S. Consumer evaluation of hospital foodservice quality: an empirical investigation. International Journal of Health Care Quality Assurance [Internet]. 2006;19(2):181–94. Available from: http://www.emeraldinsight.com/doi/10.1108/09526860610651708
65. Dube L, Trudeau E, Belanger M-C. Determining the complexity of patient satisfaction with foodservices. Journal of the American Dietetic Association [Internet]. 1994 Apr 1 [cited 2017 Sep 15];94(4):394–9. Available from: http://go.galegroup.com.ezproxy.otago.ac.nz/ps/i.do?&id=GALE%7CA15380469&v=2.1&u=otago&it=r&p=AONE&sw=w&authCount=1
66. Health Quality Intelligence. National patient experience survey: Results for patients treated in May 2017 [Internet]. Health Quality and Safety Commission New Zealand. 2017 [cited 2017 Sep 15]. Available from: https://www.hqsc.govt.nz/our-programmes/health-quality-evaluation/publications-and-resources/publication/3016/
67. Hospital takes innovative approach to food services. [Internet]. Vol. 7, Healthcare benchmarks. 2000 [cited 2017 Sep 20]. p. 140–2. Available from: http://www.ncbi.nlm.nih.gov/pubmed/11185817
68. Wright O, Capra S, Aliakbari J. A comparison of two measures of hospital foodservice satisfaction The importance of patient foodservice satisfaction. Australian Health Review [Internet]. 2003 [cited 2017 Sep 19];26(1). Available from: http://www.publish.csiro.au.ezproxy.otago.ac.nz/ah/pdf/AH030070
69. Tranter MA, Gregoire MB, Fullam FA, Lafferty LJ. Can Patient-Written Comments Help Explain Patient Satisfaction with Food Quality? Journal of the American Dietetic Association [Internet]. 2009 Dec 1 [cited 2017 Sep 15];109(12):2068–72. Available from: http://www.sciencedirect.com.ezproxy.otago.ac.nz/science/article/pii/S0002822309015491
70. McLachlan PL. Exploring Patients’ Expectations of a New Zealand Public
73
Hospital Foodservice. University of Otago; 2017.
71. Bolarinwa OA. Principles and methods of validity and reliability testing of questionnaires used in social and health science researches. The Nigerian postgraduate medical journal [Internet]. 2015 [cited 2018 Nov 16];22(4):195–201. Available from: http://www.ncbi.nlm.nih.gov/pubmed/26776330
72. European Commission. Qualitative methodologies for questionnaire assessment [Internet]. Luxembourg; 2017 [cited 2018 Nov 16]. Available from: https://circabc.europa.eu/sd/a/7f617c55-1b01-41a5-96a4-966394f28b32/Methodological document - qualitative methods for pretesting.pdf
73. Ministry of Health. Standard Operating Procedures for Health and Disability Ethics Committees. Wellington; 2014.
74. University of Otago. Human Ethics Committees [Internet]. University of Otago; [cited 2018 Nov 26]. Available from: https://www.otago.ac.nz/council/committees/committees/HumanEthicsCommittees.html
75. Patton MQ. Qualitative Interviewing. In: Qualitative Research and Evaluation Methods. 3rd ed. Thousand Oakes, California: Sage Publications; 2002.
76. Thomas DR. A general inductive approach for analyzing qualitative evaluation data. University of Auckland; 2003.
77. Braun V, Clarke V, Clark V, Clarke V. Using thematic analysis in Psychology. Qualitative Research in Psychology [Internet]. 2006;3(2):77–101. Available from: http://eprints.uwe.ac.uk/11735
78. 300 people protest Dunedin Hospital food [Internet]. New Zealand Herald. 2016 [cited 2017 Nov 2]. Available from: http://www.nzherald.co.nz/nz/news/article.cfm?c_id=1&objectid=11630958
79. John J. Patient satisfaction: the impact of past experience. Journal of Health Care Marketing [Internet]. 1992 Sep [cited 2018 Nov 14];12(3):56–64. Available from: http://www.ncbi.nlm.nih.gov/pubmed/10120535
80. Otani K, Waterman B, Dunagan WC, Ehinger S. Patient Satisfaction: How Patient Health Conditions Influence Their Satisfaction. Journal of Healthcare Management. 2012 Jul;57(4).
81. Salkind N. Ceiling Effect. In: Encyclopedia of Research Design [Internet]. Thousand Oaks, California : SAGE Publications, Inc.; 2010 [cited 2018 Nov 27]. Available from: http://methods.sagepub.com/reference/encyc-of-research-design
82. Belanger M-C, Dubé L. The Emotional Experience of Hospitalization: Its Moderators and Its Role in Patient Satisfaction With Foodservices. Journal of the American Dietetic Association. 1996;96(4).
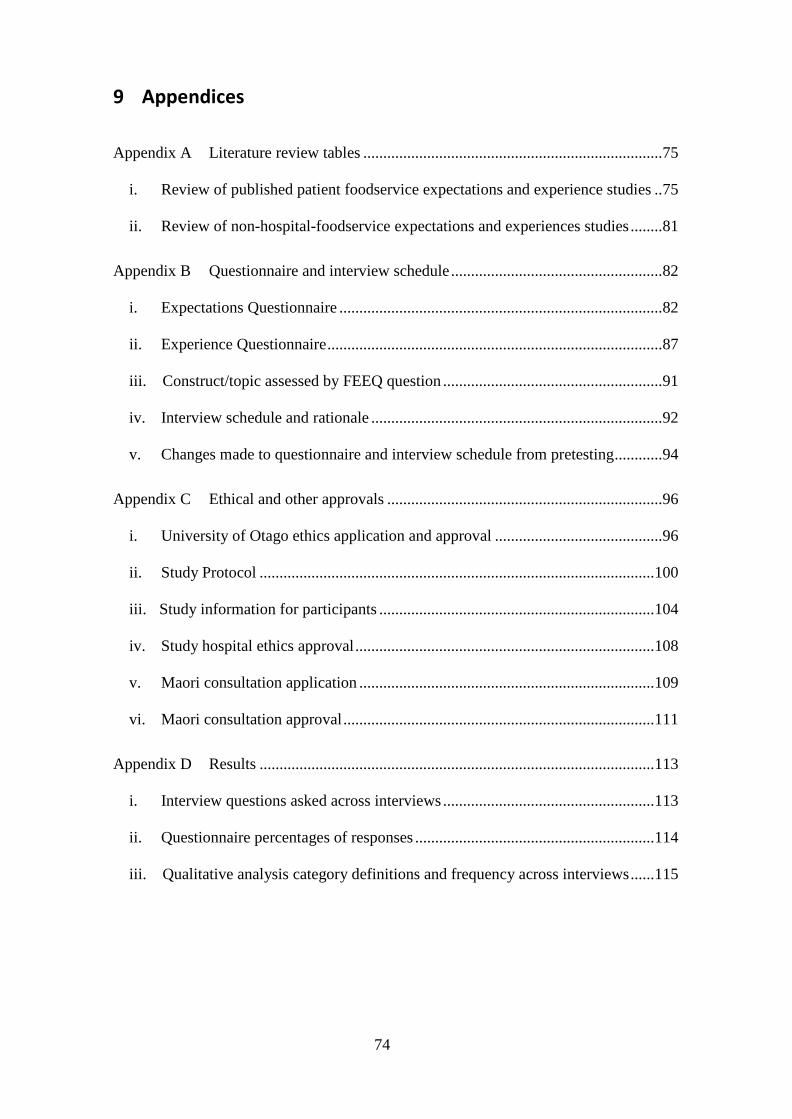
74
9 Appendices
Appendix A Literature review tables ........................................................................... 75
i. Review of published patient foodservice expectations and experience studies .. 75
ii. Review of non-hospital-foodservice expectations and experiences studies ........ 81
Appendix B Questionnaire and interview schedule ..................................................... 82
i. Expectations Questionnaire ................................................................................. 82
ii. Experience Questionnaire .................................................................................... 87
iii. Construct/topic assessed by FEEQ question ....................................................... 91
iv. Interview schedule and rationale ......................................................................... 92
v. Changes made to questionnaire and interview schedule from pretesting ............ 94
Appendix C Ethical and other approvals ..................................................................... 96
i. University of Otago ethics application and approval .......................................... 96
ii. Study Protocol ................................................................................................... 100
iii. Study information for participants ..................................................................... 104
iv. Study hospital ethics approval ........................................................................... 108
v. Maori consultation application .......................................................................... 109
vi. Maori consultation approval .............................................................................. 111
Appendix D Results ................................................................................................... 113
i. Interview questions asked across interviews ..................................................... 113
ii. Questionnaire percentages of responses ............................................................ 114
iii. Qualitative analysis category definitions and frequency across interviews ...... 115
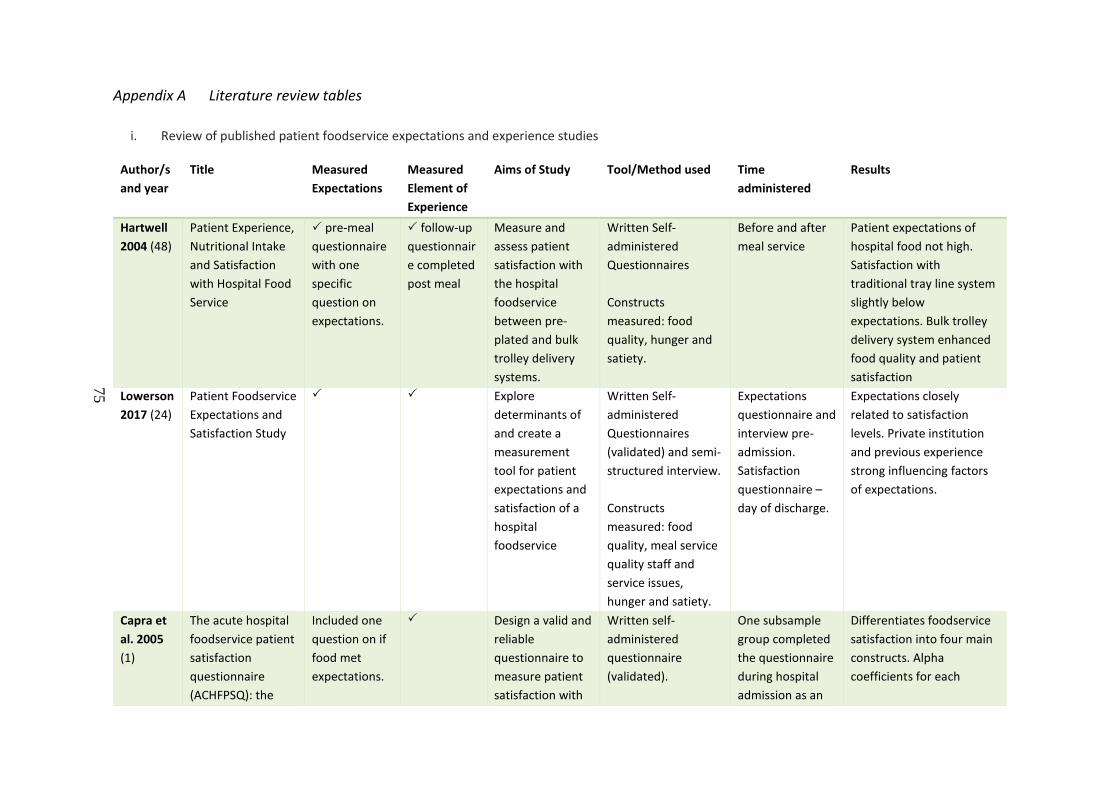
75
Appendix A Literature review tables
i. Review of published patient foodservice expectations and experience studies
Author/s and year
Title Measured Expectations
Measured Element of Experience
Aims of Study Tool/Method used Time administered
Results
Hartwell 2004 (48)
Patient Experience, Nutritional Intake and Satisfaction with Hospital Food Service
pre-meal questionnaire with one specific question on expectations.
follow-up questionnaire completed post meal
Measure and assess patient satisfaction with the hospital foodservice between pre-plated and bulk trolley delivery systems.
Written Self-administered Questionnaires Constructs measured: food quality, hunger and satiety.
Before and after meal service
Patient expectations of hospital food not high. Satisfaction with traditional tray line system slightly below expectations. Bulk trolley delivery system enhanced food quality and patient satisfaction
Lowerson 2017 (24)
Patient Foodservice Expectations and Satisfaction Study
Explore determinants of and create a measurement tool for patient expectations and satisfaction of a hospital foodservice
Written Self-administered Questionnaires (validated) and semi-structured interview. Constructs measured: food quality, meal service quality staff and service issues, hunger and satiety.
Expectations questionnaire and interview pre-admission. Satisfaction questionnaire – day of discharge.
Expectations closely related to satisfaction levels. Private institution and previous experience strong influencing factors of expectations.
Capra et al. 2005 (1)
The acute hospital foodservice patient satisfaction questionnaire (ACHFPSQ): the
Included one question on if food met expectations.
Design a valid and reliable questionnaire to measure patient satisfaction with
Written self-administered questionnaire (validated).
One subsample group completed the questionnaire during hospital admission as an
Differentiates foodservice satisfaction into four main constructs. Alpha coefficients for each
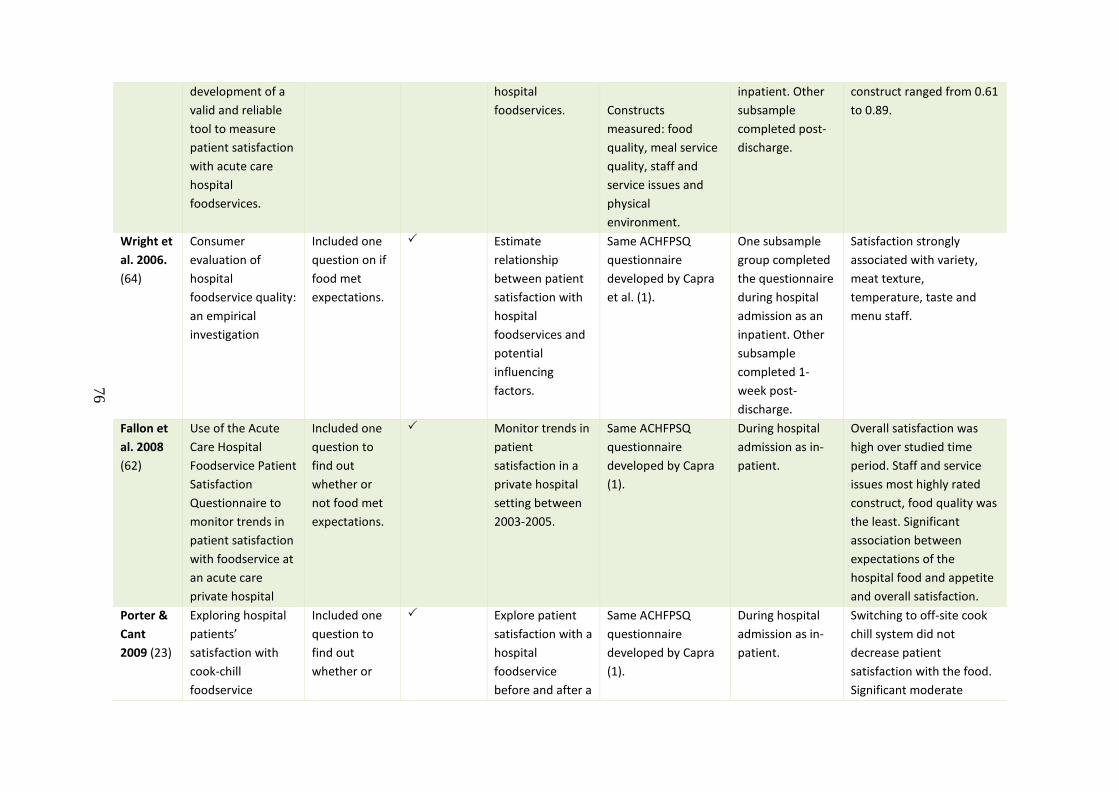
76
development of a valid and reliable tool to measure patient satisfaction with acute care hospital foodservices.
hospital foodservices.
Constructs measured: food quality, meal service quality, staff and service issues and physical environment.
inpatient. Other subsample completed post-discharge.
construct ranged from 0.61 to 0.89.
Wright et al. 2006. (64)
Consumer evaluation of hospital foodservice quality: an empirical investigation
Included one question on if food met expectations.
Estimate relationship between patient satisfaction with hospital foodservices and potential influencing factors.
Same ACHFPSQ questionnaire developed by Capra et al. (1).
One subsample group completed the questionnaire during hospital admission as an inpatient. Other subsample completed 1-week post-discharge.
Satisfaction strongly associated with variety, meat texture, temperature, taste and menu staff.
Fallon et al. 2008 (62)
Use of the Acute Care Hospital Foodservice Patient Satisfaction Questionnaire to monitor trends in patient satisfaction with foodservice at an acute care private hospital
Included one question to find out whether or not food met expectations.
Monitor trends in patient satisfaction in a private hospital setting between 2003-2005.
Same ACHFPSQ questionnaire developed by Capra (1).
During hospital admission as in-patient.
Overall satisfaction was high over studied time period. Staff and service issues most highly rated construct, food quality was the least. Significant association between expectations of the hospital food and appetite and overall satisfaction.
Porter & Cant 2009 (23)
Exploring hospital patients’ satisfaction with cook-chill foodservice
Included one question to find out whether or
Explore patient satisfaction with a hospital foodservice before and after a
Same ACHFPSQ questionnaire developed by Capra (1).
During hospital admission as in-patient.
Switching to off-site cook chill system did not decrease patient satisfaction with the food. Significant moderate
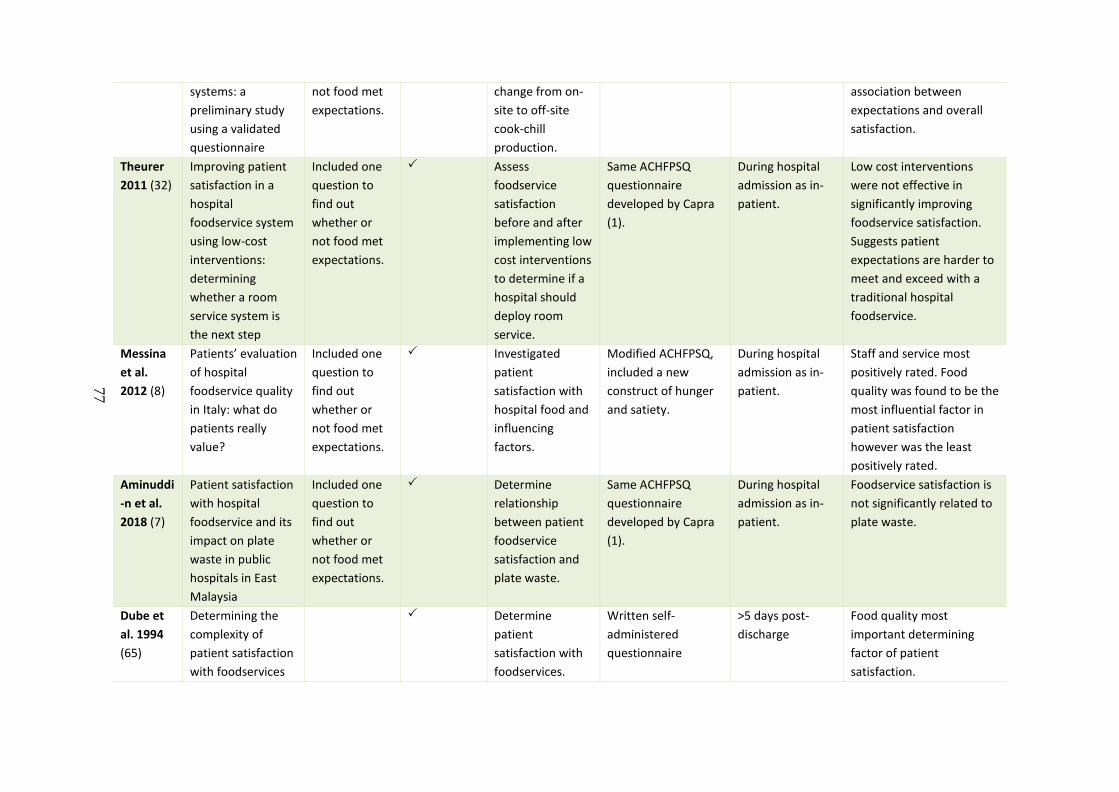
77
systems: a preliminary study using a validated questionnaire
not food met expectations.
change from on-site to off-site cook-chill production.
association between expectations and overall satisfaction.
Theurer 2011 (32)
Improving patient satisfaction in a hospital foodservice system using low-cost interventions: determining whether a room service system is the next step
Included one question to find out whether or not food met expectations.
Assess foodservice satisfaction before and after implementing low cost interventions to determine if a hospital should deploy room service.
Same ACHFPSQ questionnaire developed by Capra (1).
During hospital admission as in-patient.
Low cost interventions were not effective in significantly improving foodservice satisfaction. Suggests patient expectations are harder to meet and exceed with a traditional hospital foodservice.
Messina et al. 2012 (8)
Patients’ evaluation of hospital foodservice quality in Italy: what do patients really value?
Included one question to find out whether or not food met expectations.
Investigated patient satisfaction with hospital food and influencing factors.
Modified ACHFPSQ, included a new construct of hunger and satiety.
During hospital admission as in-patient.
Staff and service most positively rated. Food quality was found to be the most influential factor in patient satisfaction however was the least positively rated.
Aminuddi-n et al. 2018 (7)
Patient satisfaction with hospital foodservice and its impact on plate waste in public hospitals in East Malaysia
Included one question to find out whether or not food met expectations.
Determine relationship between patient foodservice satisfaction and plate waste.
Same ACHFPSQ questionnaire developed by Capra (1).
During hospital admission as in-patient.
Foodservice satisfaction is not significantly related to plate waste.
Dube et al. 1994 (65)
Determining the complexity of patient satisfaction with foodservices
Determine patient satisfaction with foodservices.
Written self-administered questionnaire
>5 days post-discharge
Food quality most important determining factor of patient satisfaction.
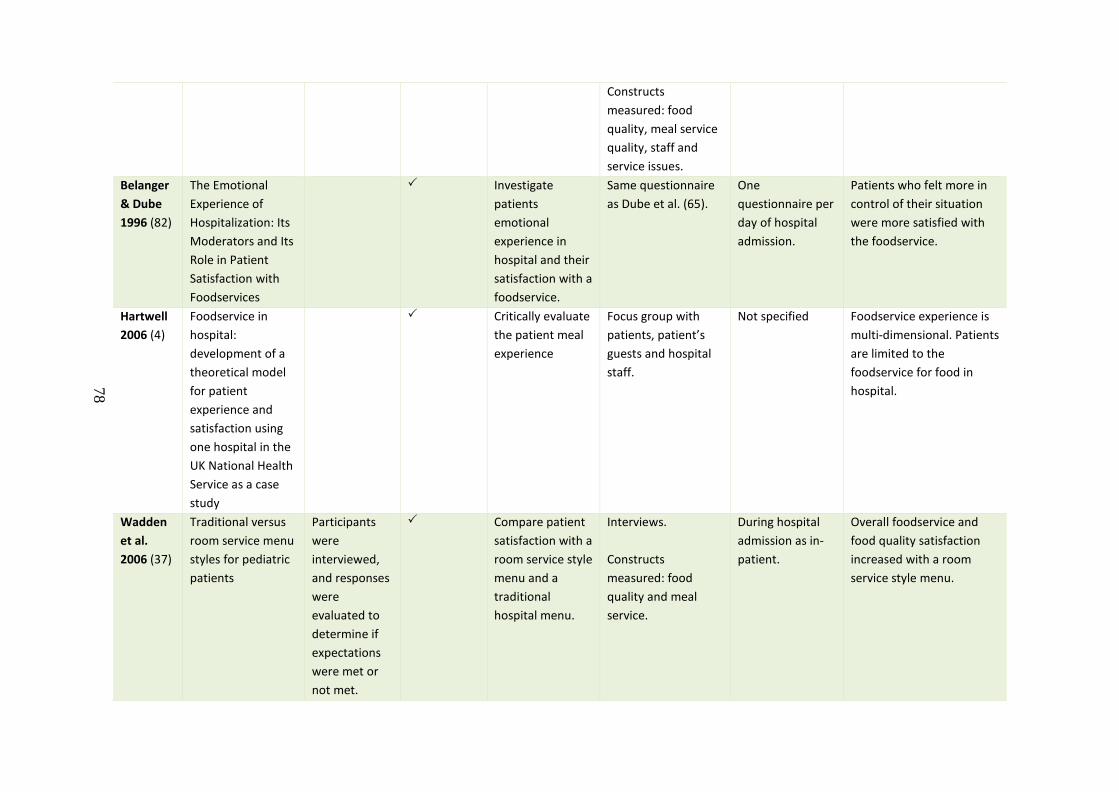
78
Constructs measured: food quality, meal service quality, staff and service issues.
Belanger & Dube 1996 (82)
The Emotional Experience of Hospitalization: Its Moderators and Its Role in Patient Satisfaction with Foodservices
Investigate patients emotional experience in hospital and their satisfaction with a foodservice.
Same questionnaire as Dube et al. (65).
One questionnaire per day of hospital admission.
Patients who felt more in control of their situation were more satisfied with the foodservice.
Hartwell 2006 (4)
Foodservice in hospital: development of a theoretical model for patient experience and satisfaction using one hospital in the UK National Health Service as a case study
Critically evaluate the patient meal experience
Focus group with patients, patient’s guests and hospital staff.
Not specified Foodservice experience is multi-dimensional. Patients are limited to the foodservice for food in hospital.
Wadden et al. 2006 (37)
Traditional versus room service menu styles for pediatric patients
Participants were interviewed, and responses were evaluated to determine if expectations were met or not met.
Compare patient satisfaction with a room service style menu and a traditional hospital menu.
Interviews. Constructs measured: food quality and meal service.
During hospital admission as in-patient.
Overall foodservice and food quality satisfaction increased with a room service style menu.
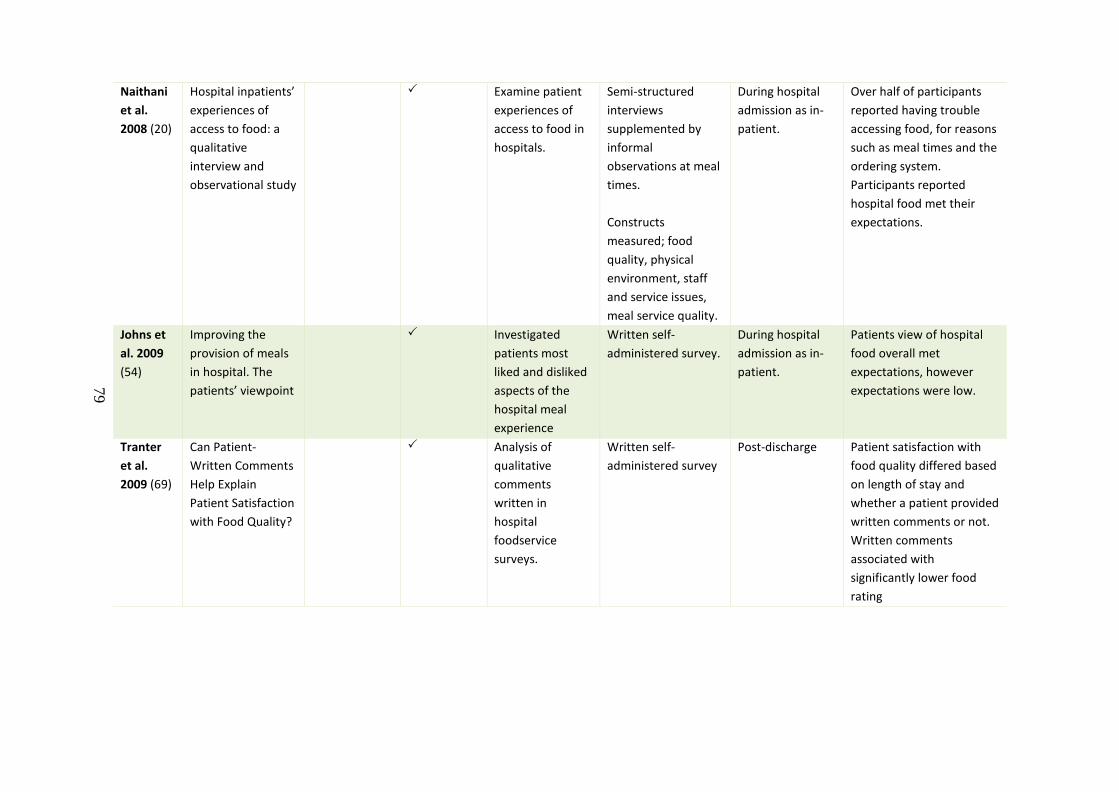
79
Naithani et al. 2008 (20)
Hospital inpatients’ experiences of access to food: a qualitative interview and observational study
Examine patient experiences of access to food in hospitals.
Semi-structured interviews supplemented by informal observations at meal times. Constructs measured; food quality, physical environment, staff and service issues, meal service quality.
During hospital admission as in-patient.
Over half of participants reported having trouble accessing food, for reasons such as meal times and the ordering system. Participants reported hospital food met their expectations.
Johns et al. 2009 (54)
Improving the provision of meals in hospital. The patients’ viewpoint
Investigated patients most liked and disliked aspects of the hospital meal experience
Written self-administered survey.
During hospital admission as in-patient.
Patients view of hospital food overall met expectations, however expectations were low.
Tranter et al. 2009 (69)
Can Patient-Written Comments Help Explain Patient Satisfaction with Food Quality?
Analysis of qualitative comments written in hospital foodservice surveys.
Written self-administered survey
Post-discharge Patient satisfaction with food quality differed based on length of stay and whether a patient provided written comments or not. Written comments associated with significantly lower food rating
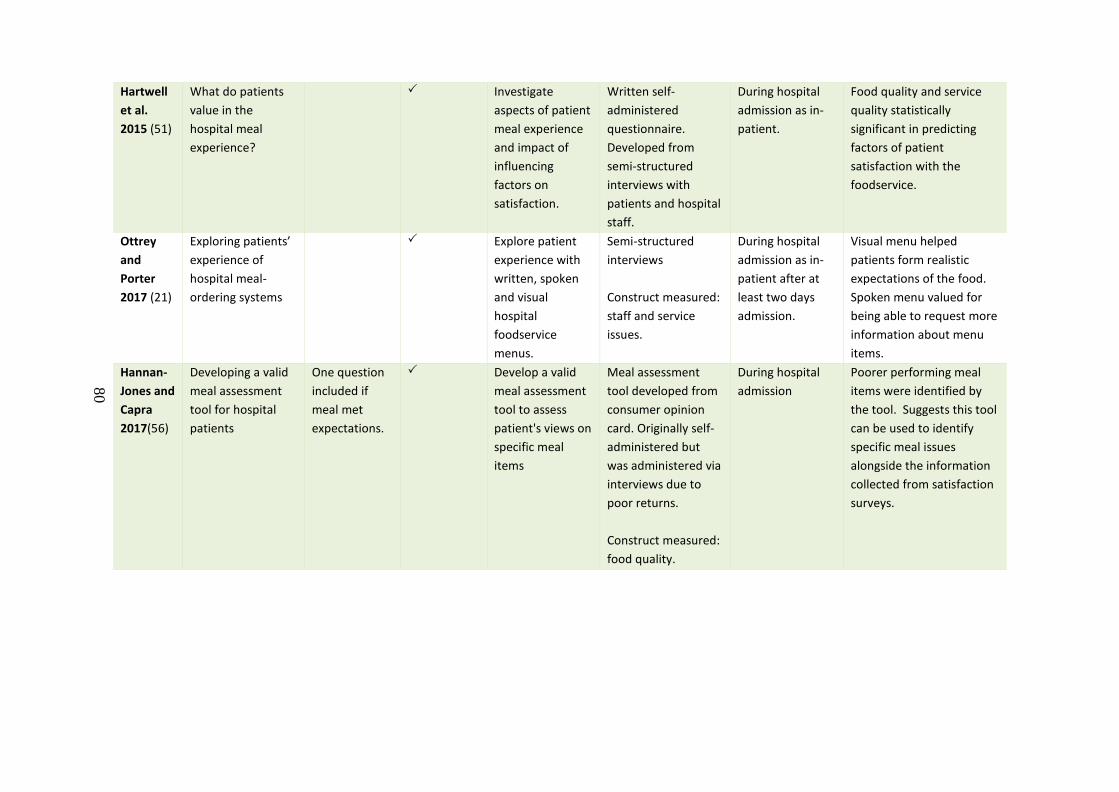
80
Hartwell et al. 2015 (51)
What do patients value in the hospital meal experience?
Investigate aspects of patient meal experience and impact of influencing factors on satisfaction.
Written self-administered questionnaire. Developed from semi-structured interviews with patients and hospital staff.
During hospital admission as in-patient.
Food quality and service quality statistically significant in predicting factors of patient satisfaction with the foodservice.
Ottrey and Porter 2017 (21)
Exploring patients’ experience of hospital meal-ordering systems
Explore patient experience with written, spoken and visual hospital foodservice menus.
Semi-structured interviews Construct measured: staff and service issues.
During hospital admission as in-patient after at least two days admission.
Visual menu helped patients form realistic expectations of the food. Spoken menu valued for being able to request more information about menu items.
Hannan-Jones and Capra 2017(56)
Developing a valid meal assessment tool for hospital patients
One question included if meal met expectations.
Develop a valid meal assessment tool to assess patient's views on specific meal items
Meal assessment tool developed from consumer opinion card. Originally self-administered but was administered via interviews due to poor returns. Construct measured: food quality.
During hospital admission
Poorer performing meal items were identified by the tool. Suggests this tool can be used to identify specific meal issues alongside the information collected from satisfaction surveys.
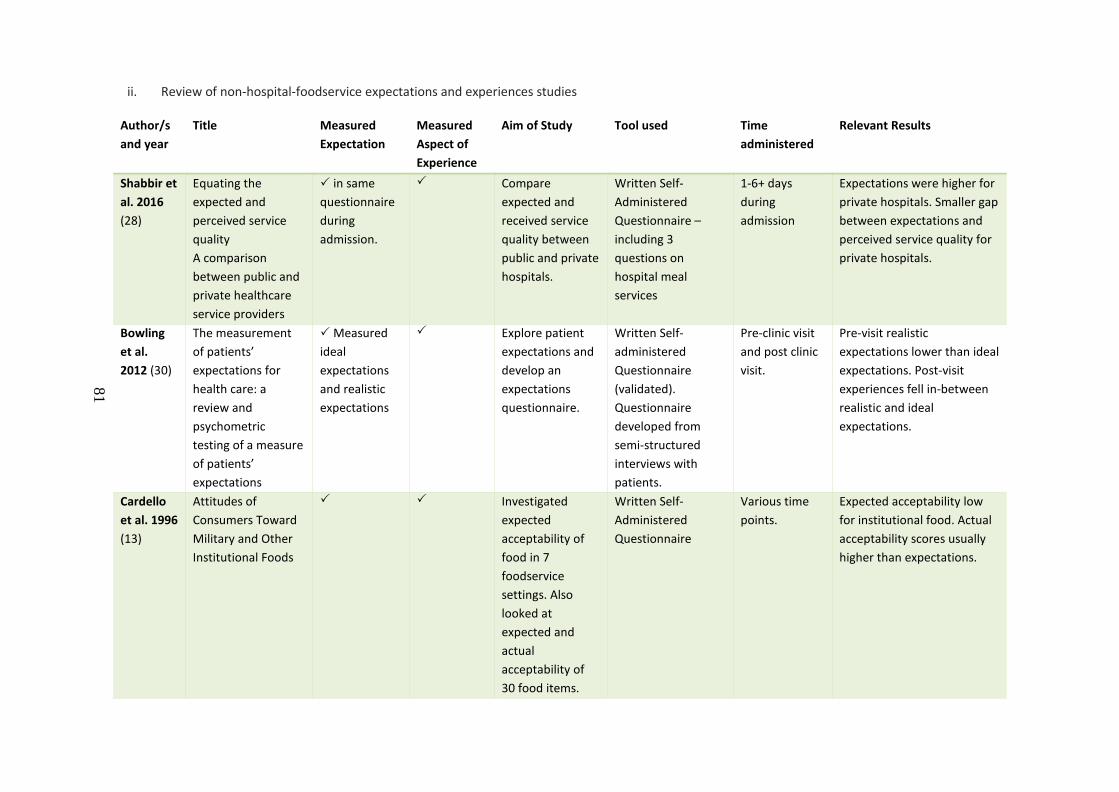
81
ii. Review of non-hospital-foodservice expectations and experiences studies
Author/s and year
Title Measured Expectation
Measured Aspect of Experience
Aim of Study Tool used Time administered
Relevant Results
Shabbir et al. 2016 (28)
Equating the expected and perceived service quality A comparison between public and private healthcare service providers
in same questionnaire during admission.
Compare expected and received service quality between public and private hospitals.
Written Self-Administered Questionnaire – including 3 questions on hospital meal services
1-6+ days during admission
Expectations were higher for private hospitals. Smaller gap between expectations and perceived service quality for private hospitals.
Bowling et al. 2012 (30)
The measurement of patients’ expectations for health care: a review and psychometric testing of a measure of patients’ expectations
Measured ideal expectations and realistic expectations
Explore patient expectations and develop an expectations questionnaire.
Written Self-administered Questionnaire (validated). Questionnaire developed from semi-structured interviews with patients.
Pre-clinic visit and post clinic visit.
Pre-visit realistic expectations lower than ideal expectations. Post-visit experiences fell in-between realistic and ideal expectations.
Cardello et al. 1996 (13)
Attitudes of Consumers Toward Military and Other Institutional Foods
Investigated expected acceptability of food in 7 foodservice settings. Also looked at expected and actual acceptability of 30 food items.
Written Self-Administered Questionnaire
Various time points.
Expected acceptability low for institutional food. Actual acceptability scores usually higher than expectations.
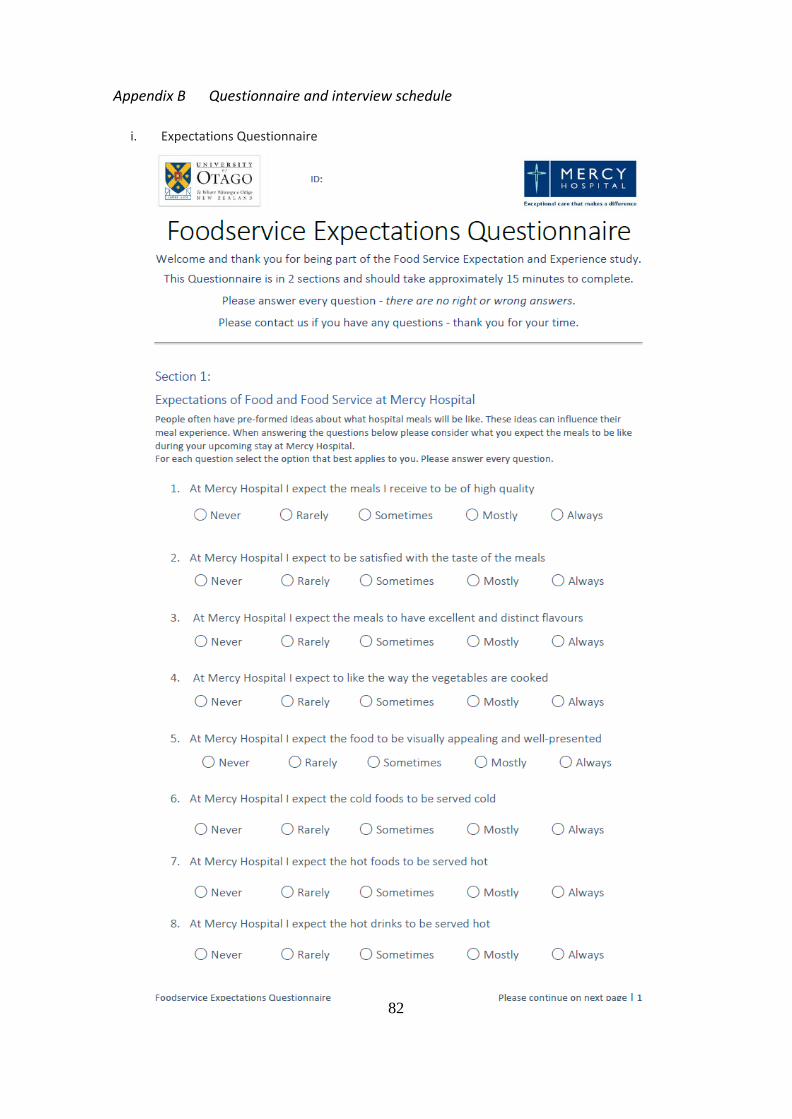
82
Appendix B Questionnaire and interview schedule
i. Expectations Questionnaire
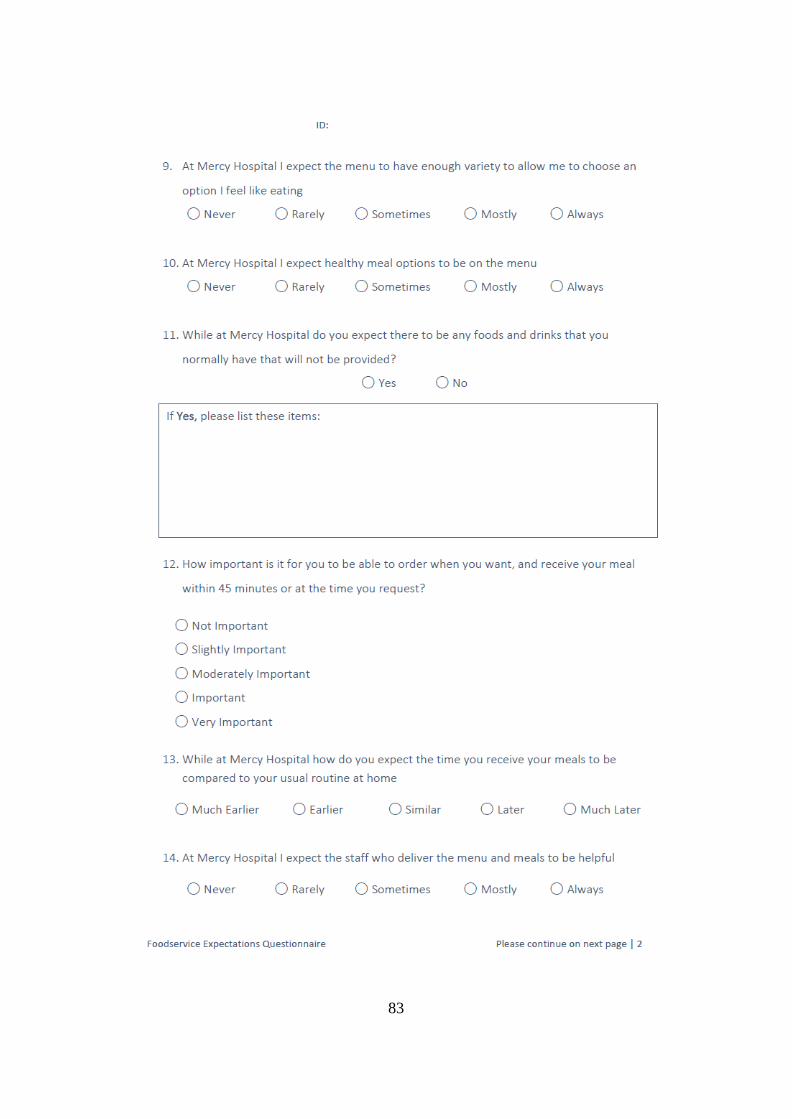
83
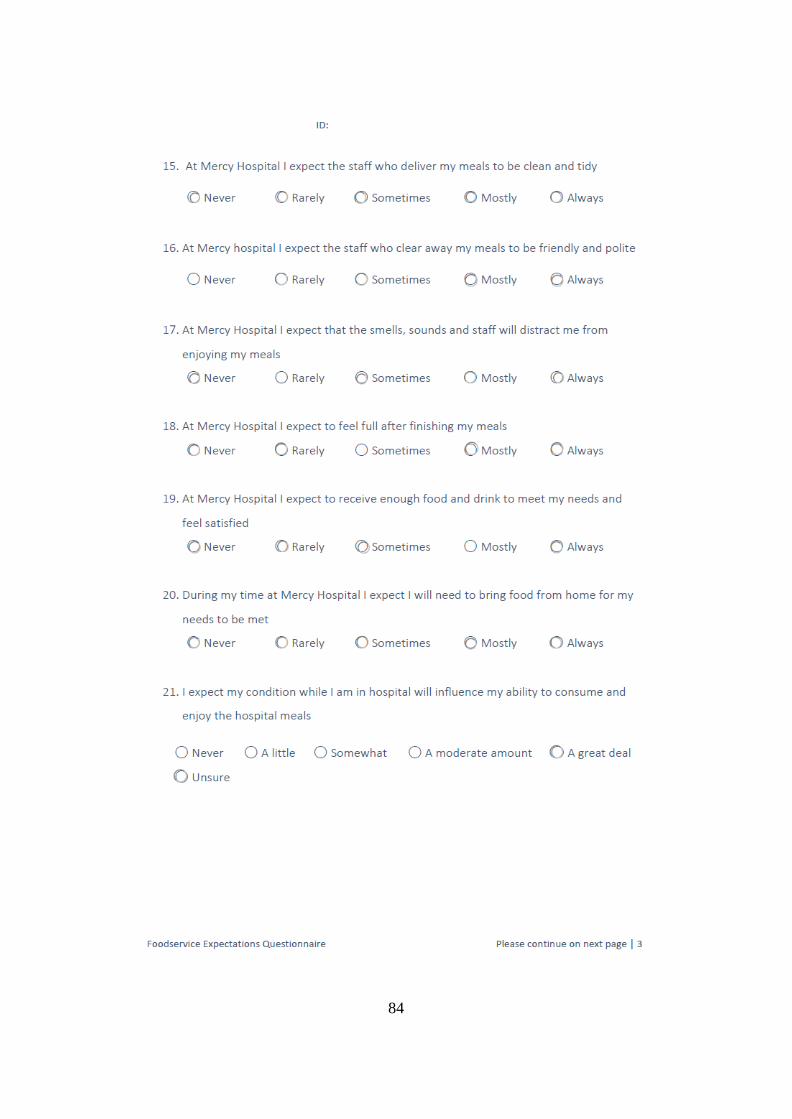
84
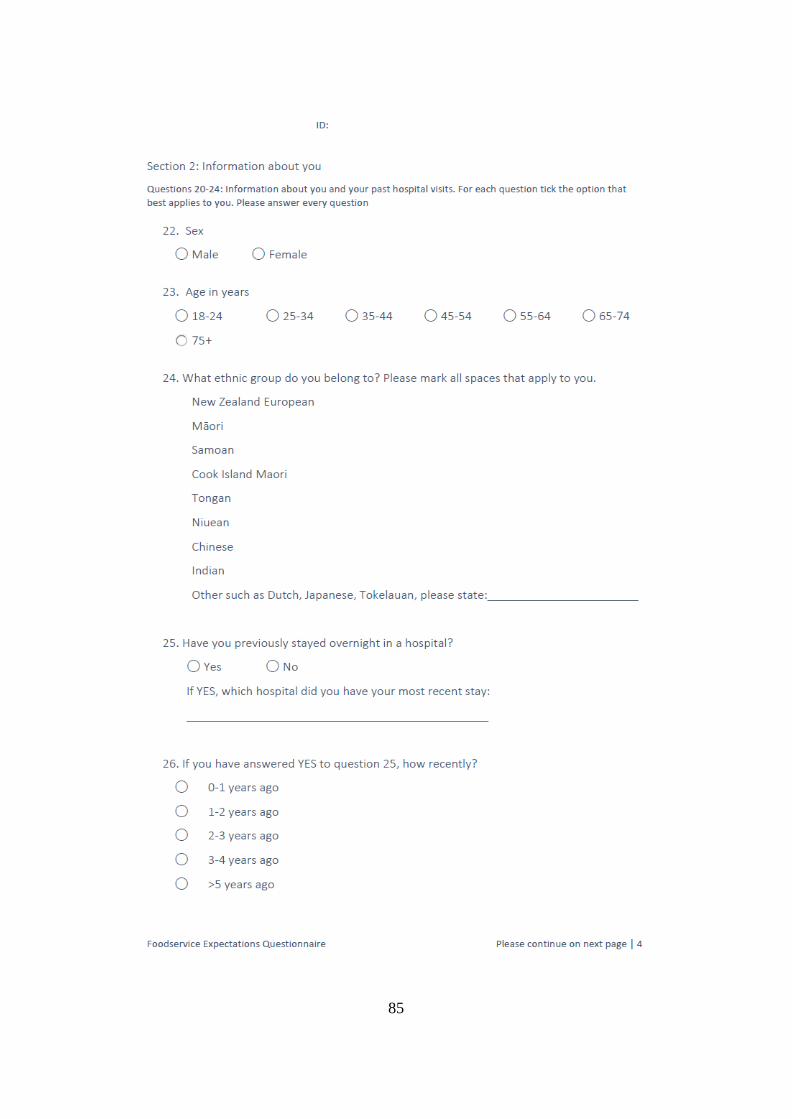
85
86
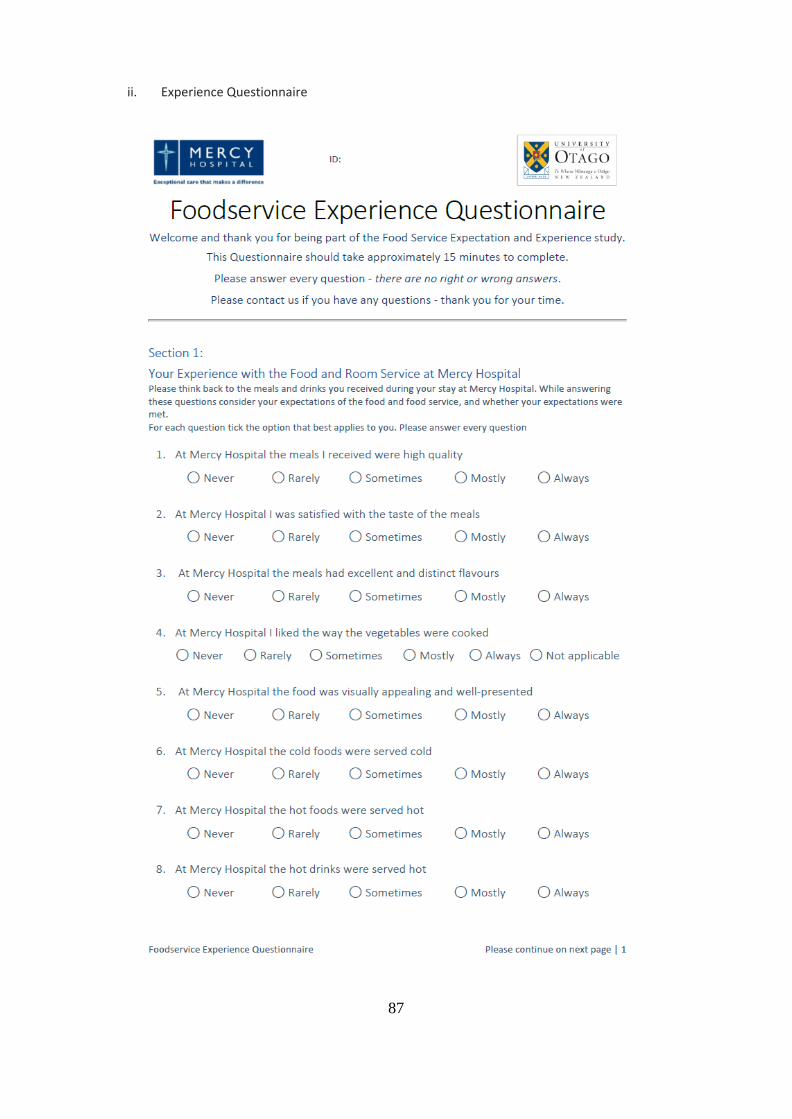
87
ii. Experience Questionnaire
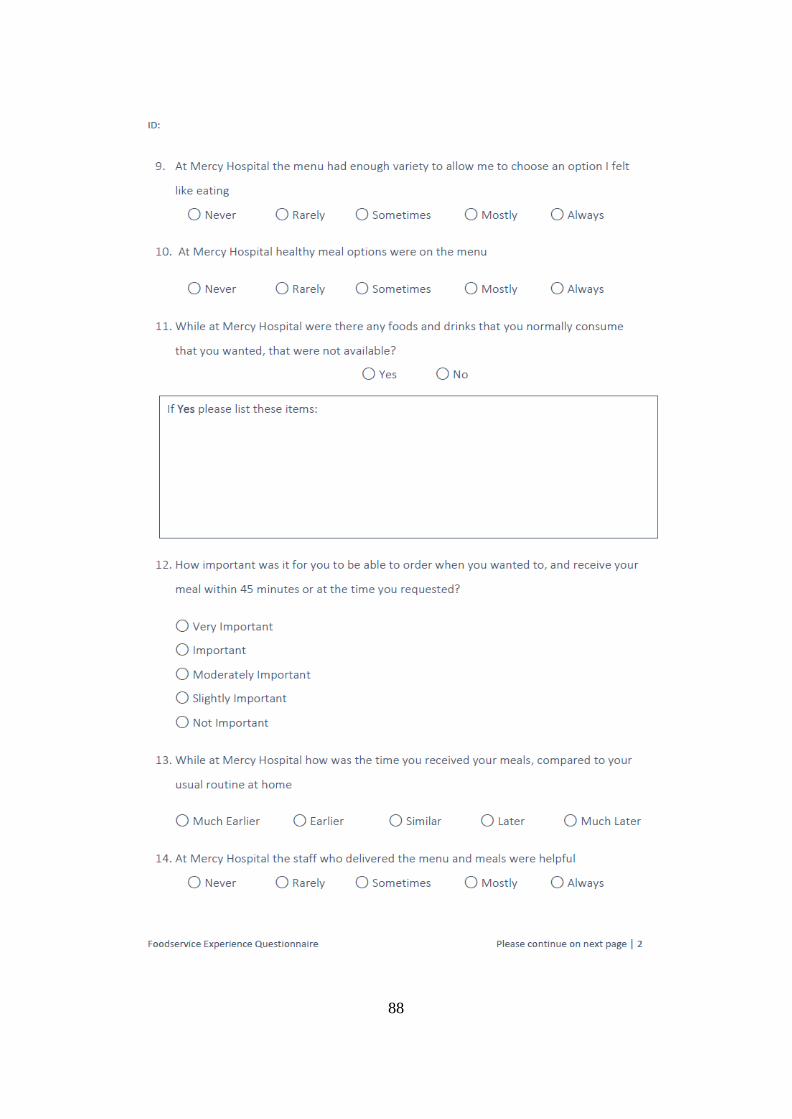
88
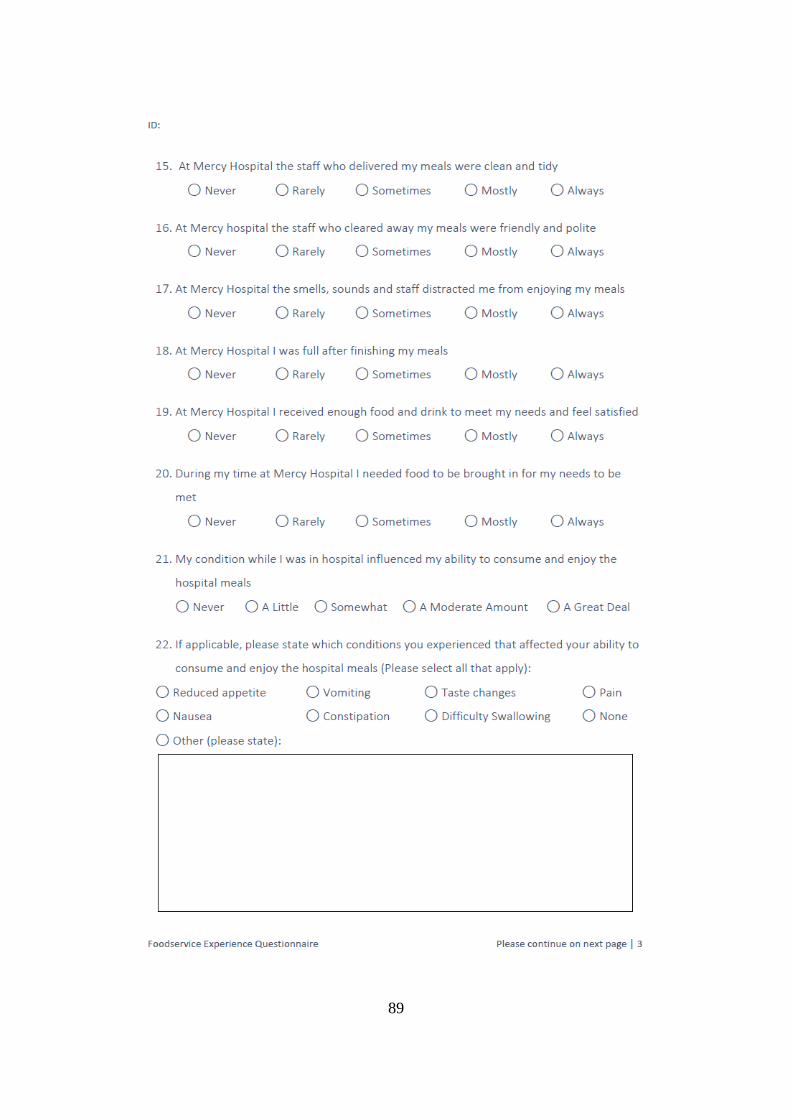
89
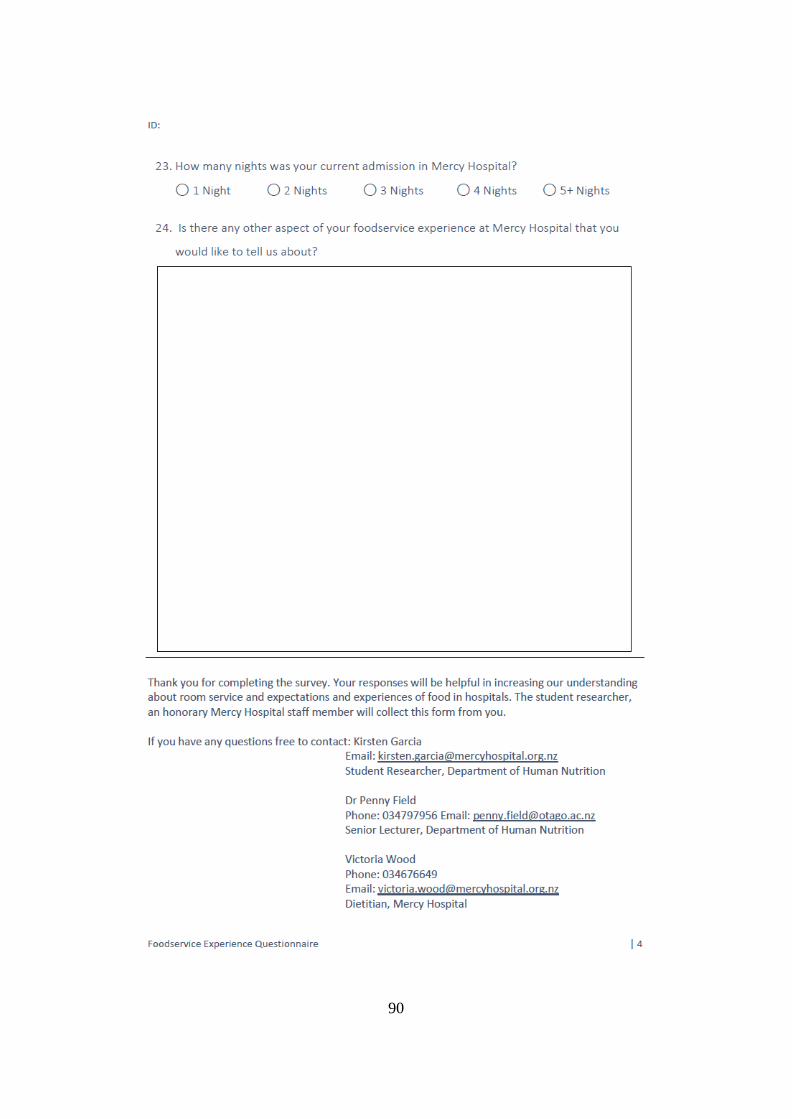
90
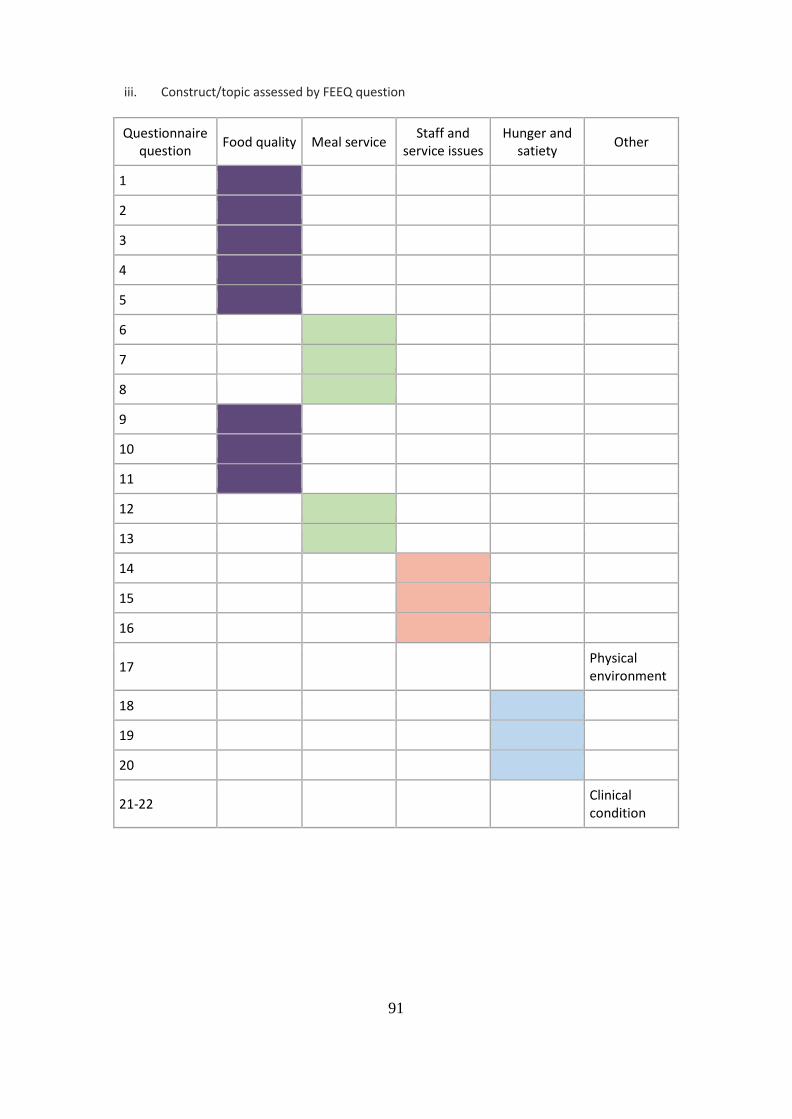
91
iii. Construct/topic assessed by FEEQ question
Questionnaire question Food quality Meal service Staff and
service issues Hunger and
satiety Other
1
2
3
4
5
6
7
8
9
10
11
12
13
14
15
16
17 Physical environment
18
19
20
21-22 Clinical condition
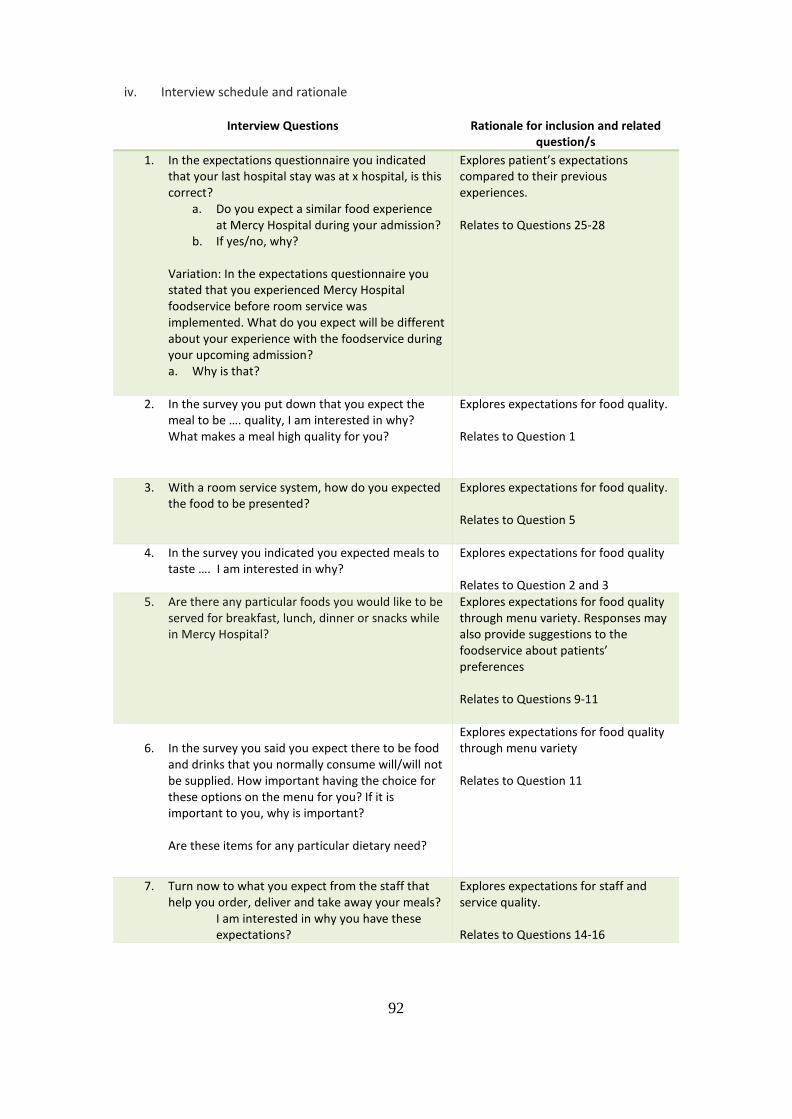
92
iv. Interview schedule and rationale
Interview Questions Rationale for inclusion and related question/s
1. In the expectations questionnaire you indicated that your last hospital stay was at x hospital, is this correct?
a. Do you expect a similar food experience at Mercy Hospital during your admission?
b. If yes/no, why?
Variation: In the expectations questionnaire you stated that you experienced Mercy Hospital foodservice before room service was implemented. What do you expect will be different about your experience with the foodservice during your upcoming admission? a. Why is that?
Explores patient’s expectations compared to their previous experiences. Relates to Questions 25-28
2. In the survey you put down that you expect the meal to be …. quality, I am interested in why? What makes a meal high quality for you?
Explores expectations for food quality. Relates to Question 1
3. With a room service system, how do you expected the food to be presented?
Explores expectations for food quality. Relates to Question 5
4. In the survey you indicated you expected meals to taste …. I am interested in why?
Explores expectations for food quality Relates to Question 2 and 3
5. Are there any particular foods you would like to be served for breakfast, lunch, dinner or snacks while in Mercy Hospital?
Explores expectations for food quality through menu variety. Responses may also provide suggestions to the foodservice about patients’ preferences Relates to Questions 9-11
6. In the survey you said you expect there to be food
and drinks that you normally consume will/will not be supplied. How important having the choice for these options on the menu for you? If it is important to you, why is important? Are these items for any particular dietary need?
Explores expectations for food quality through menu variety Relates to Question 11
7. Turn now to what you expect from the staff that help you order, deliver and take away your meals?
I am interested in why you have these expectations?
Explores expectations for staff and service quality. Relates to Questions 14-16
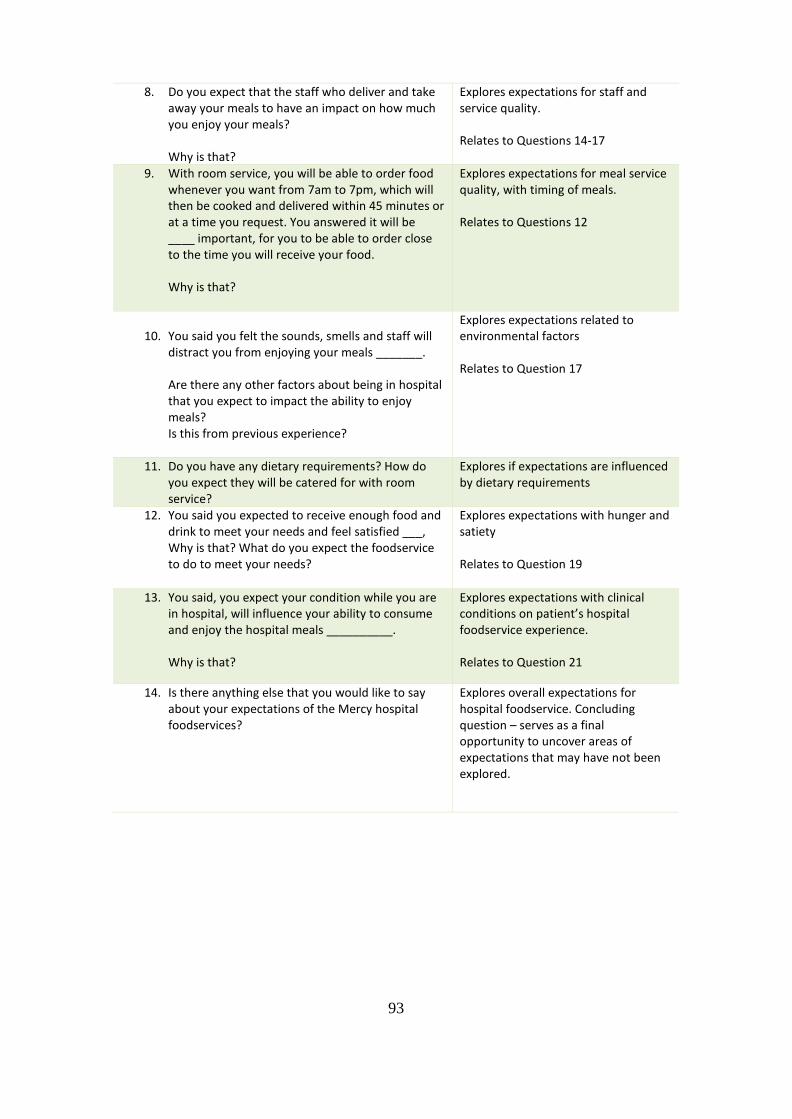
93
8. Do you expect that the staff who deliver and take away your meals to have an impact on how much you enjoy your meals? Why is that?
Explores expectations for staff and service quality. Relates to Questions 14-17
9. With room service, you will be able to order food whenever you want from 7am to 7pm, which will then be cooked and delivered within 45 minutes or at a time you request. You answered it will be ____ important, for you to be able to order close to the time you will receive your food. Why is that?
Explores expectations for meal service quality, with timing of meals. Relates to Questions 12
10. You said you felt the sounds, smells and staff will
distract you from enjoying your meals _______. Are there any other factors about being in hospital that you expect to impact the ability to enjoy meals? Is this from previous experience?
Explores expectations related to environmental factors Relates to Question 17
11. Do you have any dietary requirements? How do you expect they will be catered for with room service?
Explores if expectations are influenced by dietary requirements
12. You said you expected to receive enough food and drink to meet your needs and feel satisfied ___, Why is that? What do you expect the foodservice to do to meet your needs?
Explores expectations with hunger and satiety Relates to Question 19
13. You said, you expect your condition while you are in hospital, will influence your ability to consume and enjoy the hospital meals __________. Why is that?
Explores expectations with clinical conditions on patient’s hospital foodservice experience. Relates to Question 21
14. Is there anything else that you would like to say about your expectations of the Mercy hospital foodservices?
Explores overall expectations for hospital foodservice. Concluding question – serves as a final opportunity to uncover areas of expectations that may have not been explored.
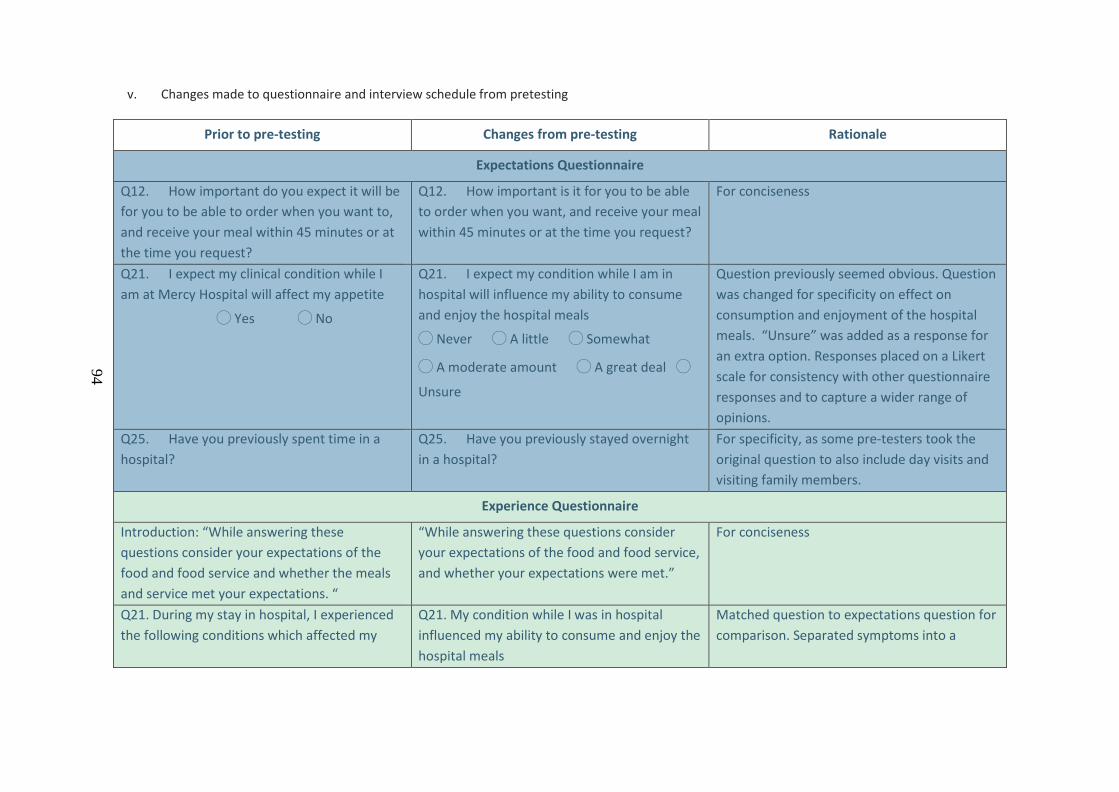
94
v. Changes made to questionnaire and interview schedule from pretesting
Prior to pre-testing Changes from pre-testing Rationale
Expectations Questionnaire
Q12. How important do you expect it will be for you to be able to order when you want to, and receive your meal within 45 minutes or at the time you request?
Q12. How important is it for you to be able to order when you want, and receive your meal within 45 minutes or at the time you request?
For conciseness
Q21. I expect my clinical condition while I am at Mercy Hospital will affect my appetite
◯ Yes ◯ No
Q21. I expect my condition while I am in hospital will influence my ability to consume and enjoy the hospital meals
◯ Never ◯ A little ◯ Somewhat
◯ A moderate amount ◯ A great deal ◯
Unsure
Question previously seemed obvious. Question was changed for specificity on effect on consumption and enjoyment of the hospital meals. “Unsure” was added as a response for an extra option. Responses placed on a Likert scale for consistency with other questionnaire responses and to capture a wider range of opinions.
Q25. Have you previously spent time in a hospital?
Q25. Have you previously stayed overnight in a hospital?
For specificity, as some pre-testers took the original question to also include day visits and visiting family members.
Experience Questionnaire
Introduction: “While answering these questions consider your expectations of the food and food service and whether the meals and service met your expectations. “
“While answering these questions consider your expectations of the food and food service, and whether your expectations were met.”
For conciseness
Q21. During my stay in hospital, I experienced the following conditions which affected my
Q21. My condition while I was in hospital influenced my ability to consume and enjoy the hospital meals
Matched question to expectations question for comparison. Separated symptoms into a
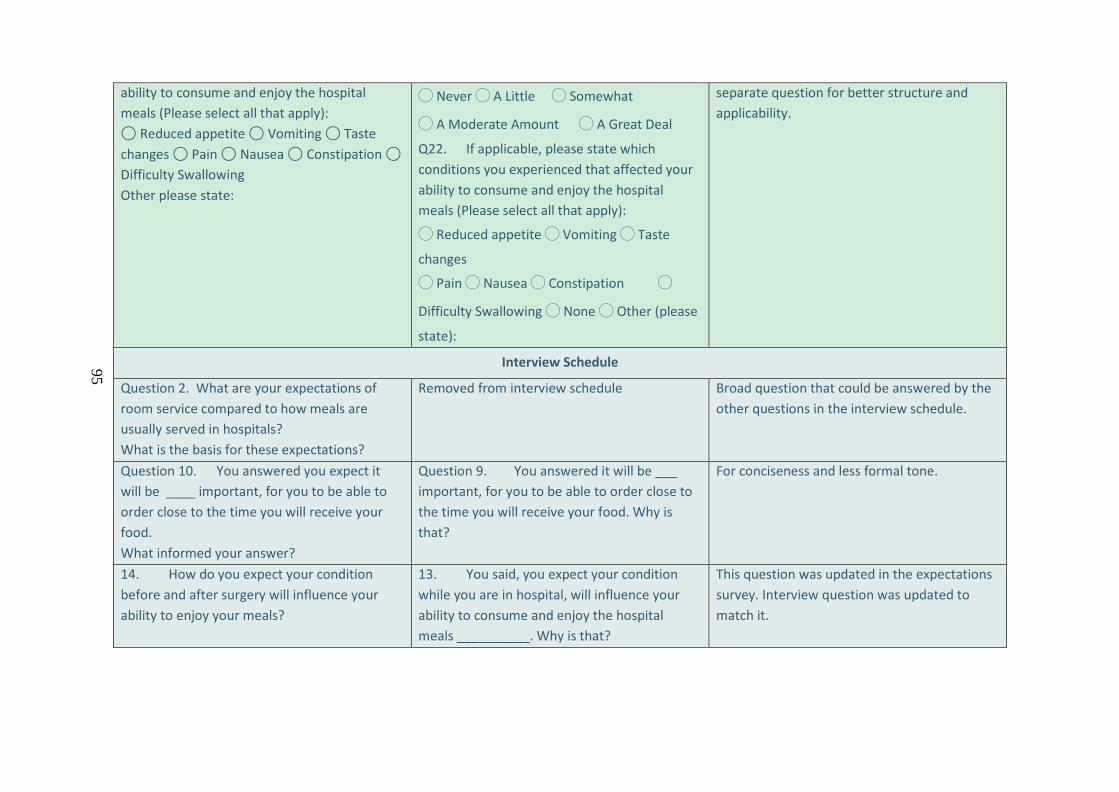
95
ability to consume and enjoy the hospital meals (Please select all that apply): ◯ Reduced appetite ◯ Vomiting ◯ Taste changes ◯ Pain ◯ Nausea ◯ Constipation ◯ Difficulty Swallowing Other please state:
◯ Never ◯ A Little ◯ Somewhat
◯ A Moderate Amount ◯ A Great Deal
Q22. If applicable, please state which conditions you experienced that affected your ability to consume and enjoy the hospital meals (Please select all that apply):
◯ Reduced appetite ◯ Vomiting ◯ Taste
changes
◯ Pain ◯ Nausea ◯ Constipation ◯
Difficulty Swallowing ◯ None ◯ Other (please
state):
separate question for better structure and applicability.
Interview Schedule
Question 2. What are your expectations of room service compared to how meals are usually served in hospitals? What is the basis for these expectations?
Removed from interview schedule Broad question that could be answered by the other questions in the interview schedule.
Question 10. You answered you expect it will be ____ important, for you to be able to order close to the time you will receive your food. What informed your answer?
Question 9. You answered it will be ___ important, for you to be able to order close to the time you will receive your food. Why is that?
For conciseness and less formal tone.
14. How do you expect your condition before and after surgery will influence your ability to enjoy your meals?
13. You said, you expect your condition while you are in hospital, will influence your ability to consume and enjoy the hospital meals __________. Why is that?
This question was updated in the expectations survey. Interview question was updated to match it.
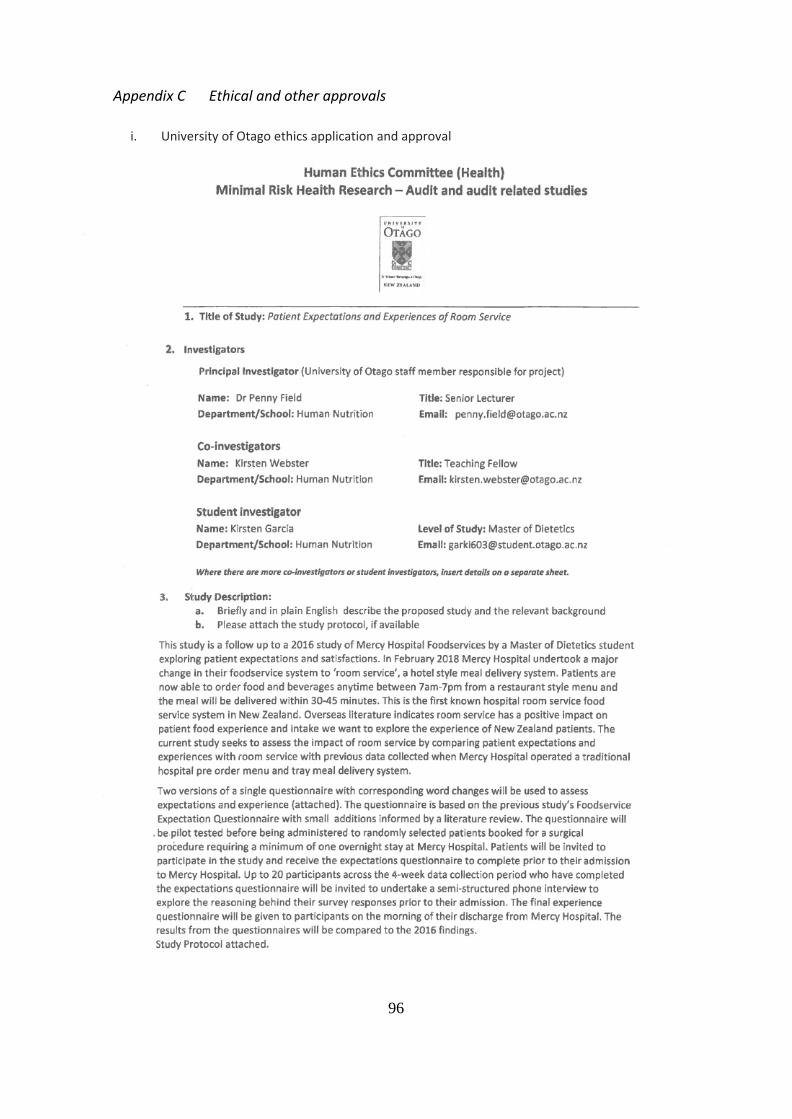
96
Appendix C Ethical and other approvals
i. University of Otago ethics application and approval
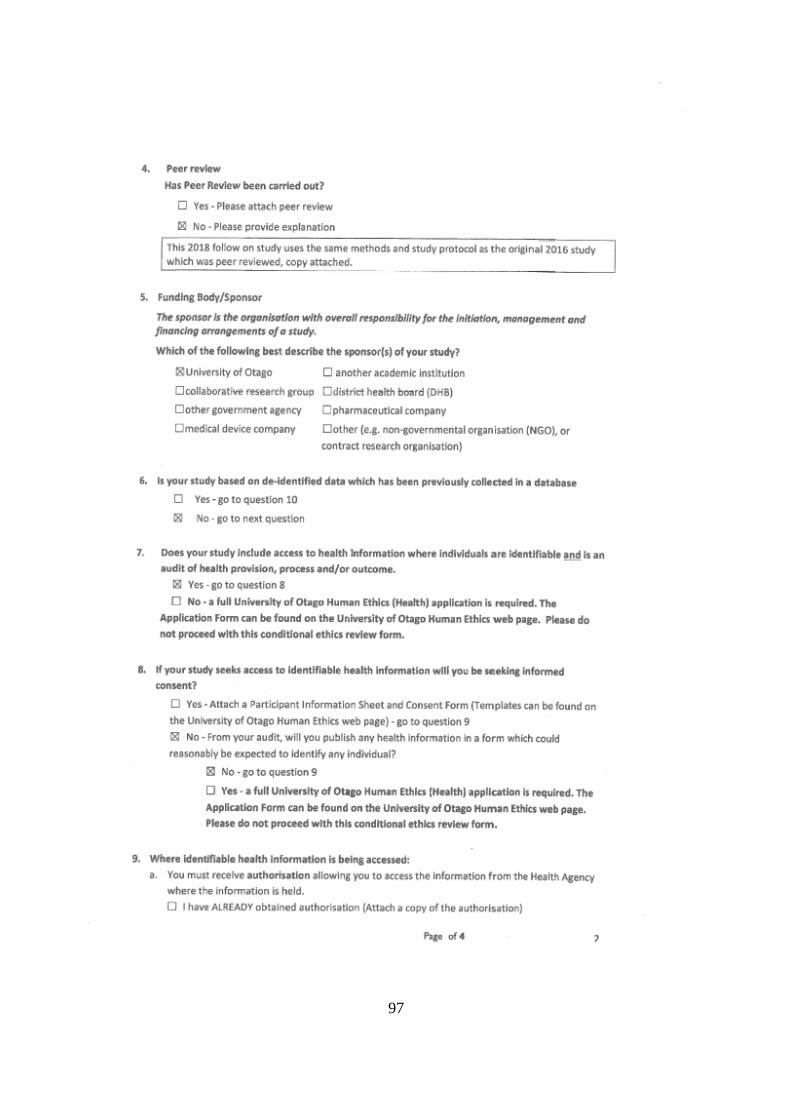
97
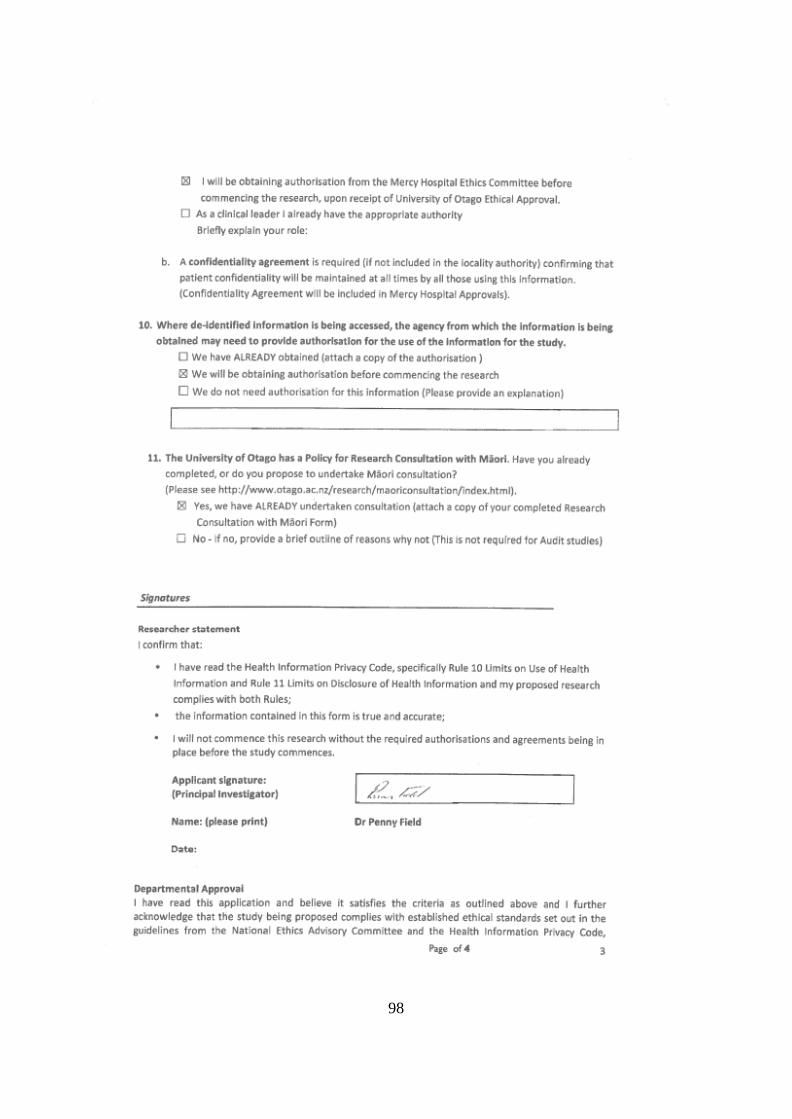
98
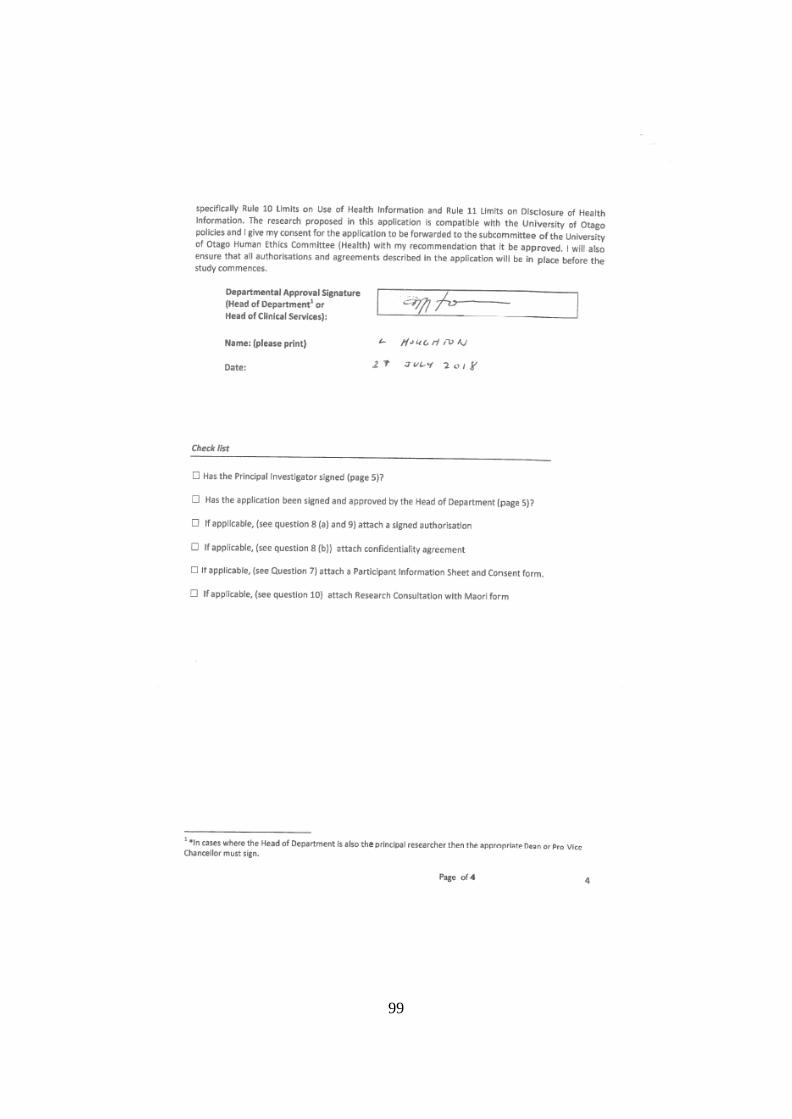
99
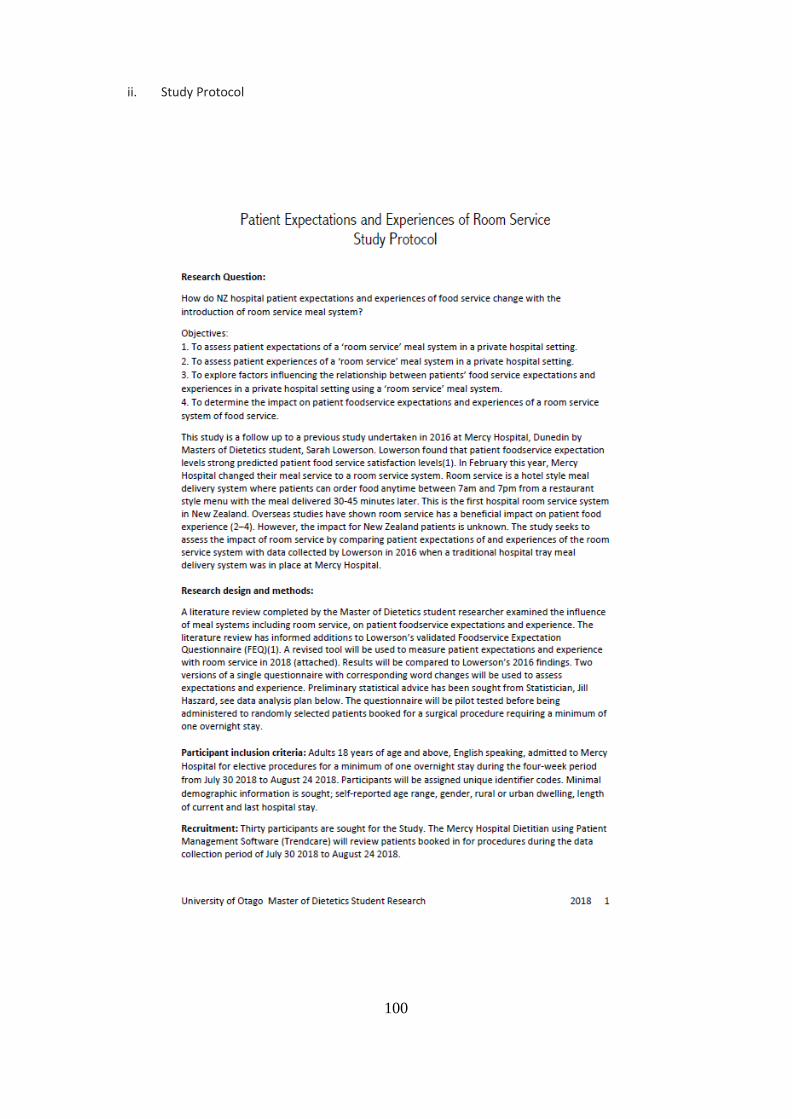
100
ii. Study Protocol
101
102

103
104
iii. Study information for participants
105
106
107
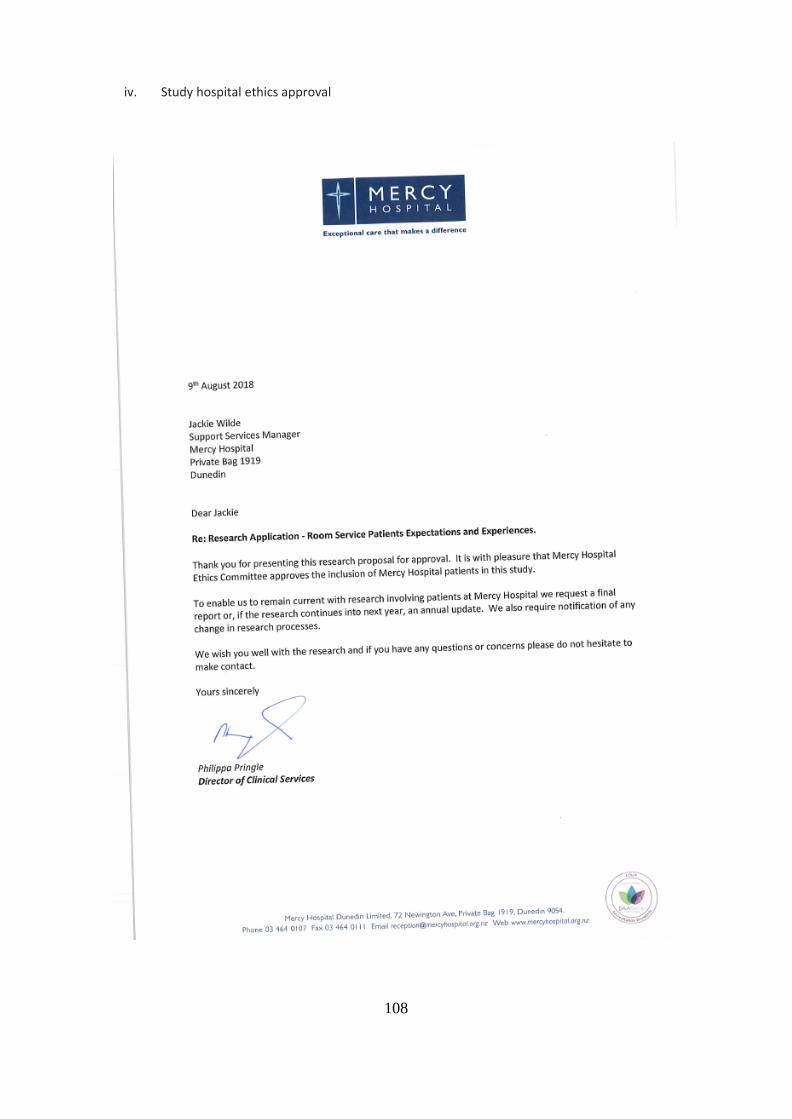
108
iv. Study hospital ethics approval
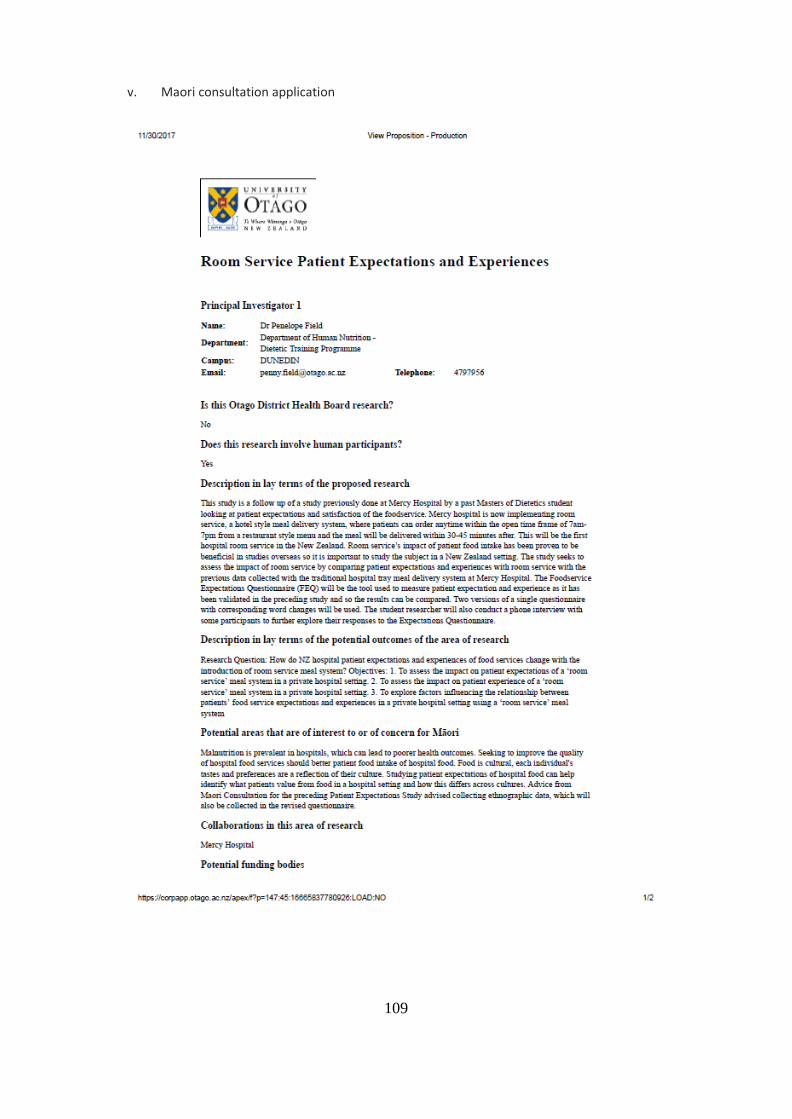
109
v. Maori consultation application

110
111
vi. Maori consultation approval

112
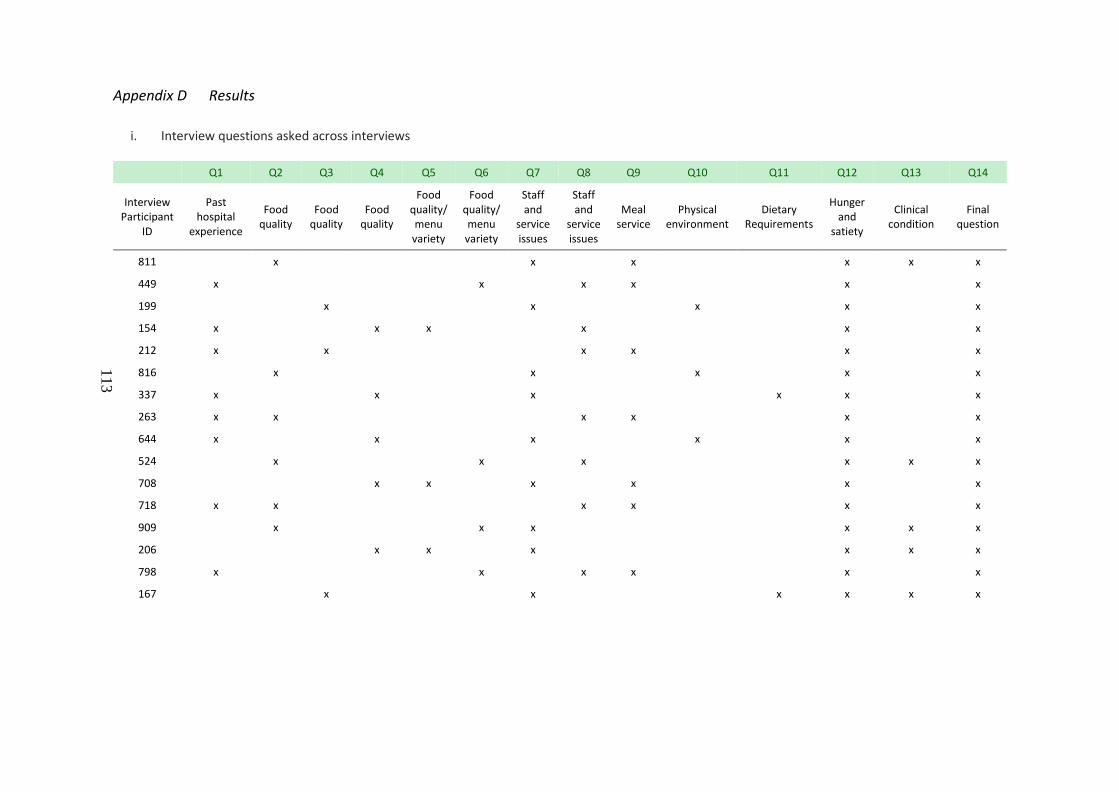
113
Appendix D Results
i. Interview questions asked across interviews
Q1 Q2 Q3 Q4 Q5 Q6 Q7 Q8 Q9 Q10 Q11 Q12 Q13 Q14
Interview Participant
ID
Past hospital
experience
Food quality
Food quality
Food quality
Food quality/ menu
variety
Food quality/ menu
variety
Staff and
service issues
Staff and
service issues
Meal service
Physical environment
Dietary Requirements
Hunger and
satiety
Clinical condition
Final question
811 x x x x x x
449 x x x x x x
199 x x x x x
154 x x x x x x
212 x x x x x x
816 x x x x x
337 x x x x x x
263 x x x x x x
644 x x x x x x
524 x x x x x x
708 x x x x x x
718 x x x x x x
909 x x x x x x
206 x x x x x x
798 x x x x x x
167 x x x x x x
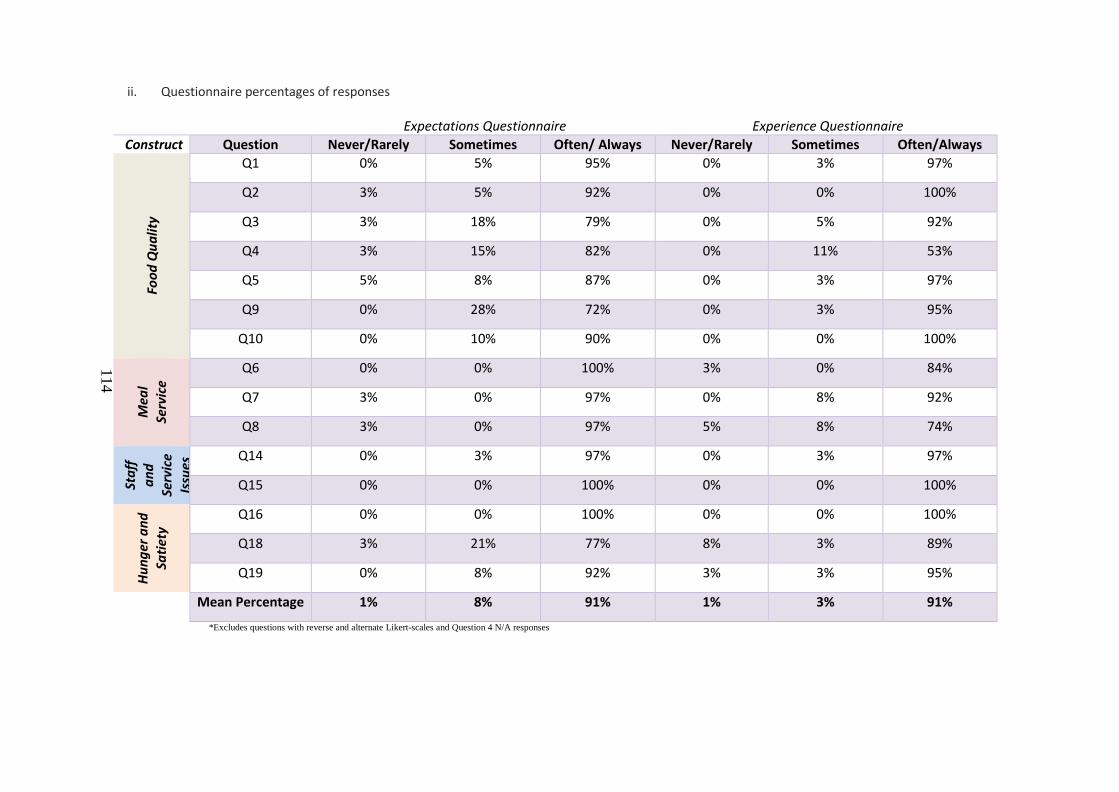
114
ii. Questionnaire percentages of responses
Expectations Questionnaire Experience Questionnaire Construct Question Never/Rarely Sometimes Often/ Always Never/Rarely Sometimes Often/Always
Food
Qua
lity
Q1 0% 5% 95% 0% 3% 97%
Q2 3% 5% 92% 0% 0% 100%
Q3 3% 18% 79% 0% 5% 92%
Q4 3% 15% 82% 0% 11% 53%
Q5 5% 8% 87% 0% 3% 97%
Q9 0% 28% 72% 0% 3% 95%
Q10 0% 10% 90% 0% 0% 100%
Mea
l Se
rvic
e
Q6 0% 0% 100% 3% 0% 84%
Q7 3% 0% 97% 0% 8% 92%
Q8 3% 0% 97% 5% 8% 74%
Staf
f an
d Se
rvic
e Is
sues
Q14 0% 3% 97% 0% 3% 97%
Q15 0% 0% 100% 0% 0% 100%
Hung
er a
nd
Satie
ty Q16 0% 0% 100% 0% 0% 100%
Q18 3% 21% 77% 8% 3% 89%
Q19 0% 8% 92% 3% 3% 95%
Mean Percentage 1% 8% 91% 1% 3% 91%
*Excludes questions with reverse and alternate Likert-scales and Question 4 N/A responses
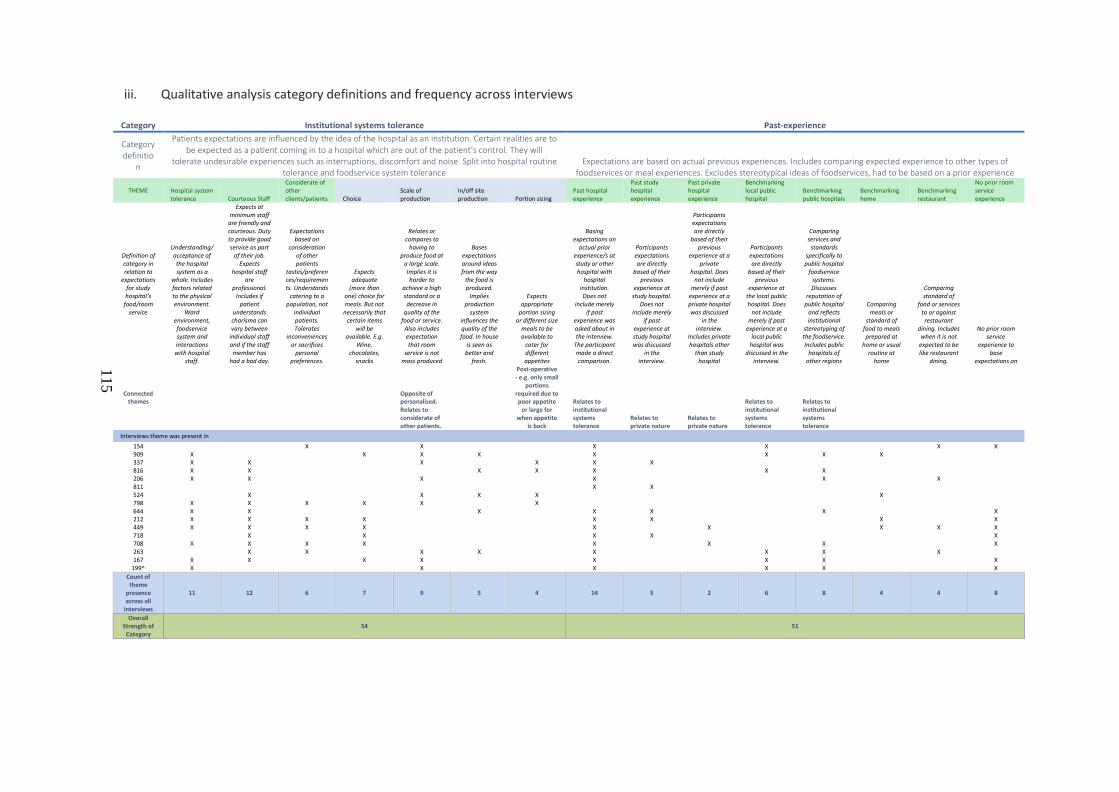
115
iii. Qualitative analysis category definitions and frequency across interviews
Category Institutional systems tolerance Past-experience
Category definitio
n
Patients expectations are influenced by the idea of the hospital as an institution. Certain realities are to be expected as a patient coming in to a hospital which are out of the patient's control. They will
tolerate undesirable experiences such as interruptions, discomfort and noise. Split into hospital routine tolerance and foodservice system tolerance
Expectations are based on actual previous experiences. Includes comparing expected experience to other types of foodservices or meal experiences. Excludes stereotypical ideas of foodservices, had to be based on a prior experience
THEME Hospital system tolerance Courteous Staff
Considerate of other clients/patients Choice
Scale of production
In/off site production Portion sizing
Past hospital experience
Past study hospital experience
Past private hospital experience
Benchmarking local public hospital
Benchmarking public hospitals
Benchmarking home
Benchmarking restaurant
No prior room service experience
Definition of category in relation to
expectations for study hospital’s
food/room service
Understanding/acceptance of the hospital system as a
whole. Includes factors related to the physical environment.
Ward environment, foodservice system and interactions with hospital
staff.
Expects at minimum staff
are friendly and courteous. Duty to provide good service as part
of their job. Expects
hospital staff are
professional. Includes if
patient understands charisma can vary between
individual staff and if the staff
member has had a bad day.
Expectations based on
consideration of other patients
tastes/preferences/requirements. Understands
catering to a population, not
individual patients. Tolerates
inconveniences or sacrifices
personal preferences.
Expects adequate
(more than one) choice for meals. But not
necessarily that certain items
will be available. E.g.
Wine, chocolates,
snacks
Relates or compares to
having to produce food at
a large scale. Implies it is harder to
achieve a high standard or a decrease in
quality of the food or service.
Also includes expectation that room
service is not mass produced
Bases expectations around ideas from the way
the food is produced.
Implies production
system influences the quality of the food. In house
is seen as better and
fresh.
Expects appropriate
portion sizing or different size
meals to be available to
cater for different appetites
Basing expectations on
actual prior experience/s at study or other hospital with
hospital institution. Does not
include merely if past
experience was asked about in the interview.
The participant made a direct comparison.
Participants expectations are directly
based of their previous
experience at study hospital.
Does not include merely
if past experience at study hospital was discussed
in the interview.
Participants expectations are directly
based of their previous
experience at a private
hospital. Does not include
merely if past experience at a private hospital was discussed
in the interview.
Includes private hospitals other
than study hospital
Participants expectations are directly
based of their previous
experience at the local public hospital. Does
not include merely if past
experience at a local public
hospital was discussed in the
interview.
Comparing services and
standards specifically to public hospital
foodservice systems. Discusses
reputation of public hospital
and reflects institutional
stereotyping of the foodservice. Includes public
hospitals of other regions
Comparing meals or
standard of food to meals prepared at
home or usual routine at
home
Comparing standard of
food or services to or against restaurant
dining. Includes when it is not
expected to be like restaurant
dining.
No prior room service
experience to base
expectations on
Connected themes
Opposite of personalised. Relates to considerate of other patients.
Post-operative - e.g. only small
portions required due to poor appetite
or large for when appetite
is back
Relates to institutional systems tolerance
Relates to private nature
Relates to private nature
Relates to institutional systems tolerance
Relates to institutional systems tolerance
Interviews theme was present in 154 X X X X X X 909 X X X X X X X X 337 X X X X X X 816 X X X X X X X 206 X X X X X X 811 X X 524 X X X X X 798 X X X X X X 644 X X X X X X X 212 X X X X X X X X 449 X X X X X X X X X 718 X X X X X 708 X X X X X X X X 263 X X X X X X X X 167 X X X X X X X X
199^ X X X X X X Count of theme
presence across all
interviews
11 12 6 7 9 5 4 14 5 2 6 8 4 4 8
Overall Strength of
Category 54 51
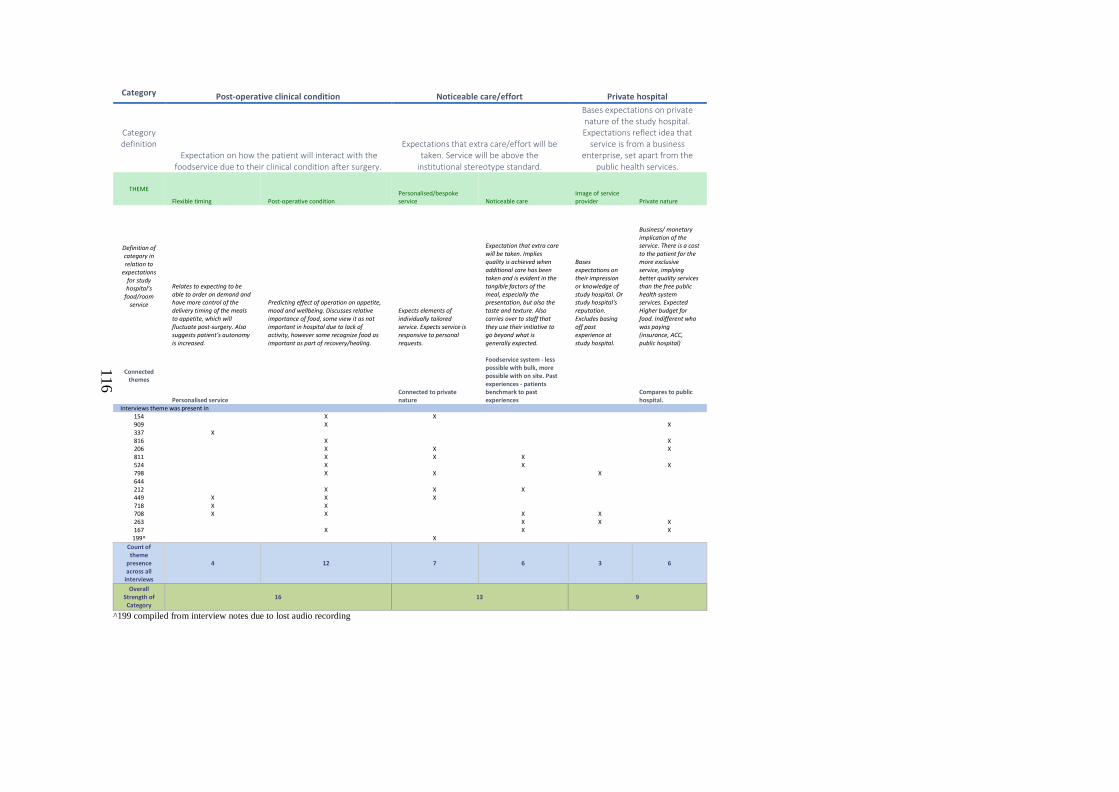
116
Category Post-operative clinical condition Noticeable care/effort Private hospital
Category definition
Expectation on how the patient will interact with the foodservice due to their clinical condition after surgery.
Expectations that extra care/effort will be taken. Service will be above the
institutional stereotype standard.
Bases expectations on private nature of the study hospital. Expectations reflect idea that
service is from a business enterprise, set apart from the
public health services.
THEME
Flexible timing Post-operative condition Personalised/bespoke service Noticeable care
Image of service provider Private nature
Definition of category in relation to
expectations for study hospital’s
food/room service
Relates to expecting to be able to order on demand and have more control of the delivery timing of the meals to appetite, which will fluctuate post-surgery. Also suggests patient’s autonomy is increased.
Predicting effect of operation on appetite, mood and wellbeing. Discusses relative importance of food, some view it as not important in hospital due to lack of activity, however some recognize food as important as part of recovery/healing.
Expects elements of individually tailored service. Expects service is responsive to personal requests.
Expectation that extra care will be taken. Implies quality is achieved when additional care has been taken and is evident in the tangible factors of the meal, especially the presentation, but also the taste and texture. Also carries over to staff that they use their initiative to go beyond what is generally expected.
Bases expectations on their impression or knowledge of study hospital. Or study hospital's reputation. Excludes basing off past experience at study hospital.
Business/ monetary implication of the service. There is a cost to the patient for the more exclusive service, implying better quality services than the free public health system services. Expected Higher budget for food. Indifferent who was paying (insurance, ACC, public hospital)
Connected themes
Personalised service Connected to private nature
Foodservice system - less possible with bulk, more possible with on site. Past experiences - patients benchmark to past experiences
Compares to public hospital.
Interviews theme was present in 154 X X 909 X X 337 X 816 X X 206 X X X 811 X X X 524 X X X 798 X X X 644 212 X X X 449 X X X 718 X X 708 X X X X 263 X X X 167 X X X
199^ X Count of theme
presence across all
interviews
4 12 7 6 3 6
Overall Strength of
Category 16 13 9
^199 compiled from interview notes due to lost audio recording
Related Documents