Rock Creek Watershed Implementation Plan January 15, 2010 Rock Creek Watershed Implementation Plan (WIP) August 2010 Completed by the District Department of the Environment Watershed Protection Division

Welcome message from author
This document is posted to help you gain knowledge. Please leave a comment to let me know what you think about it! Share it to your friends and learn new things together.
Transcript
Rock Creek Watershed Implementation Plan January 15, 2010
Rock Creek Watershed Implementation Plan
(WIP)
August 2010
Completed by the District Department of the Environment
Watershed Protection Division

Rock Creek Watershed Implementation Plan August 15, 2010 2
Rock Creek Watershed Implementation Plan August 15, 2010 3
Table of Contents
Table of Contents _____________________________________________________________ 3
Index of Tables _______________________________________________________________ 6
Index of Figures ______________________________________________________________ 6
Background _________________________________________________________________ 7
Overview & Purpose _______________________________________________________________ 7
Plan Outline & Objectives __________________________________________________________ 8
Geographic and Historical Background _______________________________________________ 8 Description of Rock Creek __________________________________________________________________ 8 Land Use _______________________________________________________________________________ 9 Sub-watersheds _________________________________________________________________________ 11 Geology _______________________________________________________________________________ 16 Soils __________________________________________________________________________________ 16 Flow Characteristics _____________________________________________________________________ 19 Rosgen Stream-Channel Classification _______________________________________________________ 20 Sewer Systems __________________________________________________________________________ 21
Sewer System - Late 1800s to 1950s _______________________________________________________ 21 1960 Separate System Policy ____________________________________________________________ 22 The Combined Sewer Overflow Long Term Control Plan ______________________________________ 22 Municipal Separate Storm Sewer System Permit _____________________________________________ 23
Causes and Sources of Rock Creek’s Water Quality Impairments _____________________ 24
Rock Creek TMDLs ______________________________________________________________ 24
Causes of Impairments ____________________________________________________________ 25
Specific Pollutants of Concern ______________________________________________________ 25 Description of the Pollutants of Concern ______________________________________________________ 28
Fecal Coliform Bacteria ________________________________________________________________ 29 Zinc ________________________________________________________________________________ 30 Lead ________________________________________________________________________________ 31 Copper ______________________________________________________________________________ 31 Arsenic______________________________________________________________________________ 32 Mercury _____________________________________________________________________________ 32 Polynuclear Aromatic Hydrocarbons (PAHs) ________________________________________________ 33 Chlordane ___________________________________________________________________________ 33 Heptachlor Epoxide ____________________________________________________________________ 34 Dieldrin _____________________________________________________________________________ 35 DDT, DDE, and DDD __________________________________________________________________ 35 Total PCBs __________________________________________________________________________ 36
Current Loads and Required Load Reductions for Specific Pollutants ____________________ 36 Long Term Control Plan __________________________________________________________________ 43
Rock Creek Watershed Implementation Plan August 15, 2010 4
Chesapeake Bay Agreement Requirements ____________________________________________________ 44
Current and Proposed Management Measures ____________________________________ 44
General Management Measures ____________________________________________________ 44 Pollution Prevention Plans _________________________________________________________________ 45 Catch Basin Cleaning _____________________________________________________________________ 45 Street Sweeping _________________________________________________________________________ 46 Erosion and Sediment Control ______________________________________________________________ 47 Illicit Discharge and Industrial Facility Inspection and Enforcement ________________________________ 48 Public Roads and Alleyways _______________________________________________________________ 49 Catch Basin Inserts and Screens and Water Quality Catch Basins __________________________________ 50 Leaf Collection _________________________________________________________________________ 50 RiverSmart Homes Program _______________________________________________________________ 51 Rain Leader Disconnect Program ___________________________________________________________ 51 Green Roof Retrofit Program _______________________________________________________________ 52 Permeable Pavement _____________________________________________________________________ 52 Education of Public on Pet Wastes/Enforcement of Pet Waste Regulations ___________________________ 52 Household Hazardous Waste Collection and Disposal ___________________________________________ 53 Integrated Pest Management and Nutrient Management __________________________________________ 53 Tree Planting ___________________________________________________________________________ 54 Public Outreach and Education _____________________________________________________________ 55 Coal Tar Ban ___________________________________________________________________________ 56 District of Columbia Bag Bill ______________________________________________________________ 57
Specific Projects _________________________________________________________________ 57 Low Impact Development _________________________________________________________________ 58 Stream Restoration _______________________________________________________________________ 59 Reforestation and Riparian Buffers __________________________________________________________ 60 Wetland Creation and Rehabilitation _________________________________________________________ 61 Removal of Barriers to Fish Passage _________________________________________________________ 61 Trash Removal __________________________________________________________________________ 62
Expected Load Reductions _____________________________________________________ 62
Methodology for Calculating Load Reductions ________________________________________ 62
Expected Load Reductions _________________________________________________________ 63 Upper and Lower Rock Creek ______________________________________________________________ 63 Tributaries to Rock Creek _________________________________________________________________ 66
Implementation Schedule and Milestones ________________________________________ 79
Implementation Schedule __________________________________________________________ 79
Milestones ______________________________________________________________________ 82
Financial and Technical Resources Needed for Management Measures ________________ 83
Financial Assistance Needs _________________________________________________________ 83
Technical Assistance Needs ________________________________________________________ 85

Rock Creek Watershed Implementation Plan August 15, 2010 5
Outreach, Education and Public Participation ____________________________________ 85
Strategy for Stakeholder Outreach __________________________________________________ 85
Stakeholders ____________________________________________________________________ 86 EPA Chesapeake Bay Program _____________________________________________________________ 86 District Department of the Environment ______________________________________________________ 87 DC Department of Parks and Recreation (DPR) ________________________________________________ 88 US Department of Agriculture (USDA), Natural Resources Conservation Service (NRCS) ______________ 89 DC Public Schools (DCPS) and Office of Public Education Facilities Modernization (OPEFM) __________ 89 DC Department of Transportation (DDOT) ____________________________________________________ 89 District Department of Public Works (DPW) __________________________________________________ 90 DC Water and Sewer Authority (WASA) _____________________________________________________ 90 National Park Service (NPS) _______________________________________________________________ 90 Friends of Rock Creek Environment (FORCE) _________________________________________________ 91 Casey Trees ____________________________________________________________________________ 91 Rock Creek Advisory Neighborhood Commissions _____________________________________________ 91 Rock Creek Civic and Community Associations ________________________________________________ 92 Montgomery County Department of Environmental Protection ____________________________________ 92 Washington Suburban Sanitary Commission ___________________________________________________ 92
Monitoring _________________________________________________________________ 93
Criteria for Determining Load Reductions ___________________________________________ 93
Current Monitoring ______________________________________________________________ 93 Integrated Water Quality Assessment Monitoring _______________________________________________ 93 MS4 Permit Monitoring ___________________________________________________________________ 94
Enhanced Monitoring Strategy _____________________________________________________ 94 Analyze Existing Data ____________________________________________________________________ 95 Expand In-Stream Water Quality Monitoring __________________________________________________ 95 Integrating Existing Monitoring Efforts_______________________________________________________ 96 Adding Monitoring for Organic Pollutants ____________________________________________________ 96 Monitor Both Upstream and at the Mouth of Tributaries _________________________________________ 97
Establishment of Benchmarks ______________________________________________________ 98
References ______________________________________________________________________ 99 Appendices
Appendix A: Maps Appendix B: Educational Materials & Outreach Materials Appendix C: Low Impact Development Restoration Sites Appendix D: Stream Restoration Sites Appendix E: Reforestation Sites Appendix F: Wetland Restoration Sites Appendix G: Fish Passage Restoration Sites Appendix H: Trash Cleanup Sites Appendix I: Load Reduction Charts Appendix J: Summary of 2006-2008 Ambient Monitoring for Rock Creek Appendix K: 2007 MS4 Discharge Monitoring Report
Rock Creek Watershed Implementation Plan August 15, 2010 6
Index of Tables Table 1: Land Use in Rock Creek Watershed (acres) ________________________________________________ 11 Table 2: Summary of DC Rock Creek Sub-watershed Information ______________________________________ 12 Table 3: Rosgen stream classification ____________________________________________________________ 20 Table 4: District of Columbia Rock Creek TMDL Documents Approved by EPA ___________________________ 26 Table 5: Categories of Uses that Determine Water Quality Standards ___________________________________ 28 Table 6: Approved TMDLs and Percent Reductions for the Main Stem of Rock Creek ______________________ 37 Table 7: Approved TMDLs and Percent Reductions for the Tributaries of Rock Creek ______________________ 38 Table 8: Load Reductions Achieved by Suggested Management Practices in Upper Rock Creek ______________ 64 Table 9: Load Reductions Achieved by Suggested Management Practices in Lower Rock Creek ______________ 65 Table 10: Load Reductions Achieved by Suggested Management Practices in Broad Branch _________________ 67 Table 11: Load Reductions Achieved by Suggested Management Practices in Dumbarton Oaks ______________ 68 Table 12: Load Reductions Achieved by Suggested Management Practices in Fenwick Branch _______________ 69 Table 13: Load Reductions Achieved by Suggested Management Practices in Klingle Run ___________________ 70 Table 14: Load Reductions Achieved by Suggested Management Practices in Luzon Creek __________________ 71 Table 15: Load Reductions Achieved by Suggested Management Practices in Melvin Hazen Branch ___________ 72 Table 16: Load Reductions Achieved by Suggested Management Practices in Normanstone Creek _____________ 73 Table 17: Load Reductions Achieved by Suggested Management Practices in Pinehurst Branch ______________ 74 Table 18: Load Reductions Achieved by Suggested Management Practices in Portal Branch _________________ 75 Table 19: Load Reductions Achieved by Suggested Management Practices in Soapstone Creek _______________ 76 Table 20: Load Reductions Achieved by Suggested Management Practices for Organic Pollutants in Piney Branch __________________________________________________________________________________________ 77 Table 21: Load Reductions Achieved by Suggested Management Practices for Metals in Piney Branch _________ 78 Table 22: Short Term Implementation Schedule for Rock Creek Restoration Projects _______________________ 80 Table 23: Milestones for Achieving Water Quality Standards _________________________________________ 82 Table 24: Cost of Implementing Specific Restoration Projects _________________________________________ 84 Table 25: Stakeholder Outreach Task List and Timeline ______________________________________________ 86 Table 26: Rock Creek Water Quality Monitoring Parameters __________________________________________ 93 Table 27: Rock Creek Monitoring Stations ________________________________________________________ 94 Table 28: Enhanced Monitoring Task List and Timeline ______________________________________________ 97
Index of Figures Figure 1: Rock Creek Land Use & Land Cover _____________________________________________________ 10 Figure 2: Generalized Soil Map of Washington, DC _________________________________________________ 18 Figure 3: Sub-watersheds of the District of Columbia ________________________________________________ 21 Figure 4: Rock Creek Impervious Cover __________________________________________________________ 25 Figure 5: WASA Long-Term Control Plan _________________________________________________________ 43
Rock Creek Watershed Implementation Plan August 15, 2010 7
Background
Overview & Purpose In February 2004 the Government of the District of Columbia (DC) submitted and the Environmental Protection Agency (EPA) accepted final Total Maximum Daily Load (TMDL) reports for fecal coliform bacteria and metals for the main stem of Rock Creek and organics and metals for the tributaries of Rock Creek. In 2005 the District Department of the Environment (then called District Department of Health, Environmental Health Administration) researched and wrote a Watershed Implementation Plan (WIP) for the Rock Creek basin in an effort to develop a plan to begin to address the pollutants impairing the water body and ultimately delist Rock Creek for these impairments.
Concurrently in 2005 the DC Government submitted a “Rock Creek Watershed Total Maximum Daily Load Waste Load Allocation Implementation Plan” to be in compliance with its National Pollutant Discharge Elimination System (NPDES) Municipal Separate Storm Sewer System (MS4) Permit issued in 2004 which stated that the:
“Permittee shall further submit implementation plans to reduce discharges consistent with any applicable EPA-approved waste load allocation (WLA) component of any established Total Maximum Daily Loadings (TMDL).” Furthermore, Part III.A. states that ”the permittee shall also submit Implementation Plan(s) for the…Rock Creek watershed Total Maximum Daily Loads (TMDLs) twelve months after the effective issuance date of the Permit”
In 2006 the EPA reviewed the submitted draft WIP and provided comments to Environmental Health Administration Watershed Protection Division (WPD) for corrections. Upon reviewing the comments provided by the EPA and the original draft WIP, the District Department of the Environment (DDOE) WPD felt that a more detailed examination of the pollutants impairing Rock Creek and methods to address these pollutants was required. In the summer and fall of 2009 the DDOE WPD completed field work, desktop research, and data analysis. The document was written at the end of the calendar year 2009 and at the beginning of the calendar year 2010 the document was provided to stakeholders for review and comment and submitted to the EPA for approval.
The document that follows is an effort to create a watershed-based non-point source pollution control plan that meets the EPA’s requirements for acceptance while providing a realistic and adaptable guide for agencies responsible for the restoration of Rock Creek at the local level.

Rock Creek Watershed Implementation Plan August 15, 2010 8
Plan Outline & Objectives This Implementation Plan is divided into eight sections:
The Background section discusses the purpose of the Rock Creek Watershed Implementation Plan and provides an overview of important aspects of the watershed.
The Causes and Sources of Impairments details what pollutants are impairing Rock Creek, their current loads, where the pollutants originated, and finally their required load reductions.
The Current and Proposed Management Measures section provides details on what is being done and what will be done to control pollutants in the Rock Creek Watershed.
The Expected Load Reductions section shows how pollutant loads to Rock Creek will be reduced through the implementation of the management measures.
The Implementation Schedule and Milestones Section lays out the timeline to restoring the watershed and how it will be tracked.
The Financial and Technical Resources section depicts the price tag to achieve the proposed management measures and does a gap analysis on the monetary and technical needs of the District to implement the Rock Creek Implementation Plan.
The Outreach Strategy provides insight into the stakeholders in the Rock Creek Watershed and how the District plans to work with them to restore the watershed.
The Monitoring Strategy section is the final section of the document which lays out the District’s current monitoring protocol and puts forward enhanced monitoring measures to better gage progress toward the proposed milestones.
As with any multi-year implementation plan, this is a living document which will be continually evaluated and updated as needed based on “lessons learned” during the implementation phase. The implementation of this plan will be monitored and evaluated, and the Watershed Implementation Plan will be updated every five years to reflect the results of the monitoring program, the efficacy of the pollutant reducing activities, advances in technology, and availability of financial and technical resources.
Geographic and Historical Background
Description of Rock Creek Rock Creek is a tributary of the Potomac River and one of the District’s most beloved environmental treasures. From its source in Laytonsville, MD, Rock Creek meanders a 33-mile course before meeting the Potomac River’s north bank, near Theodore Roosevelt Island, in the District of Columbia (CH2M Hill, 1979). Rock Creek watershed encompasses a total area of 76.5 square miles. Close to 21% (15.9 square miles) of Rock the watershed lies within the boundaries of Washington, DC and approximately one-

Rock Creek Watershed Implementation Plan August 15, 2010 9
third (9.52 miles) of Rock Creek’s 33-mile stream length runs through the District (Dynamic Corporation, 1993). The balance of the watershed (60.6 square miles and 23.48 stream miles) is located in Montgomery County, MD (Anderson et al., 2002). Land-use directly surrounding Rock Creek is primarily publicly-owned parkland, except in Rock Creek’s uppermost portions (US Army Corps of Engineers, 1989). Rock Creek enters the District of Columbia less than a mile from its most northern limits, at a point marked by Western Avenue and Rock Creek Park’s Boundary Bridge. Of the 15.9 square miles of Rock Creek watershed located within the District, the National Park Service’s main section of Rock Creek Park comprises about 17% of this (1,754 acres or 2.74 square miles). However, the system of green space collectively managed as Rock Creek Park includes a number of peripheral park facilities that are also within the watershed. Examples include Montrose Park, Dumbarton Oaks Park, Fort Circle Parks, North Portal Park, Pinehurst Park, Melvin C. Hazen Park, and Soapstone Valley Park. Several of these parks serve as forest buffers for some of Rock Creek’s 15 tributaries that are located within the District. Collectively, the Rock Creek Park system accounts for over 2,000 District acres, or 3.13 square miles or 19.7 percent of the District’s portion of the Rock Creek watershed (National Park Service, 2005a).
Land Use Land use in the District’s portion of the Rock Creek Watershed is expected to remain unchanged for the foreseeable future. This part of the watershed is heavily urbanized and has already been developed for low and high density residential uses as can be witnessed by the land use map (Figure 1). Table 1 provides numerical information from the land-use analysis conducted by United States Geological Survey (USGS) for the entire Rock Creek watershed in 2002.

Rock Creek Watershed Implementation Plan August 15, 2010 10
Figure 1: Rock Creek Land Use & Land Cover
Rock Creek Watershed Implementation Plan August 15, 2010 11
Table 1: Land Use in Rock Creek Watershed (acres)
Water/Wetland Low Intensity Residential
High Intensity Residential
Forest/ Grassland
Agriculture/ Recreational Areas
Total
DC 1 9,980 1,402 201 384 11,968 Maryland 895 7,620 3,270 15,287 10,304 37,376 Total 896 17,600 4,672 15,488 11,237 49,344 As this analysis shows, roughly 95% of the District’s 11,000-plus acres found within the Rock Creek watershed have been developed. In the upper watershed of Montgomery County, approximately 45% of the watershed has been developed. The primary development is low-intensity residential.
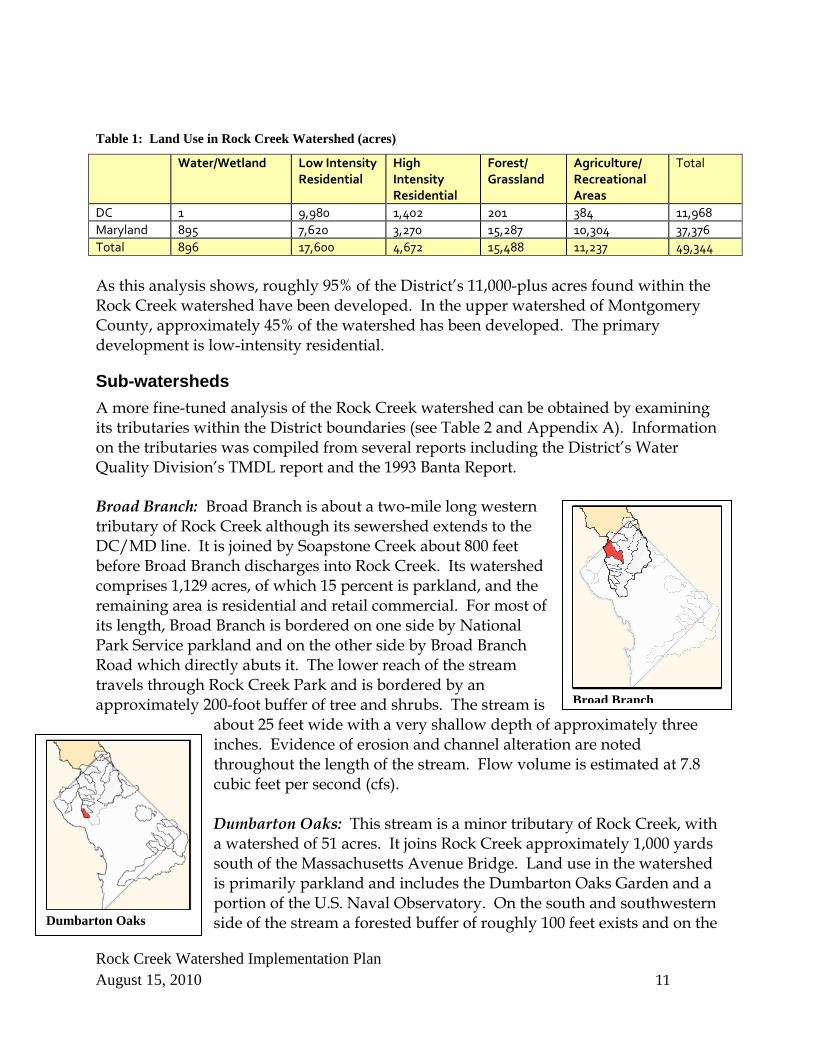
Sub-watersheds A more fine-tuned analysis of the Rock Creek watershed can be obtained by examining its tributaries within the District boundaries (see Table 2 and Appendix A). Information on the tributaries was compiled from several reports including the District’s Water Quality Division’s TMDL report and the 1993 Banta Report. Broad Branch: Broad Branch is about a two-mile long western tributary of Rock Creek although its sewershed extends to the DC/MD line. It is joined by Soapstone Creek about 800 feet before Broad Branch discharges into Rock Creek. Its watershed comprises 1,129 acres, of which 15 percent is parkland, and the remaining area is residential and retail commercial. For most of its length, Broad Branch is bordered on one side by National Park Service parkland and on the other side by Broad Branch Road which directly abuts it. The lower reach of the stream travels through Rock Creek Park and is bordered by an approximately 200-foot buffer of tree and shrubs. The stream is
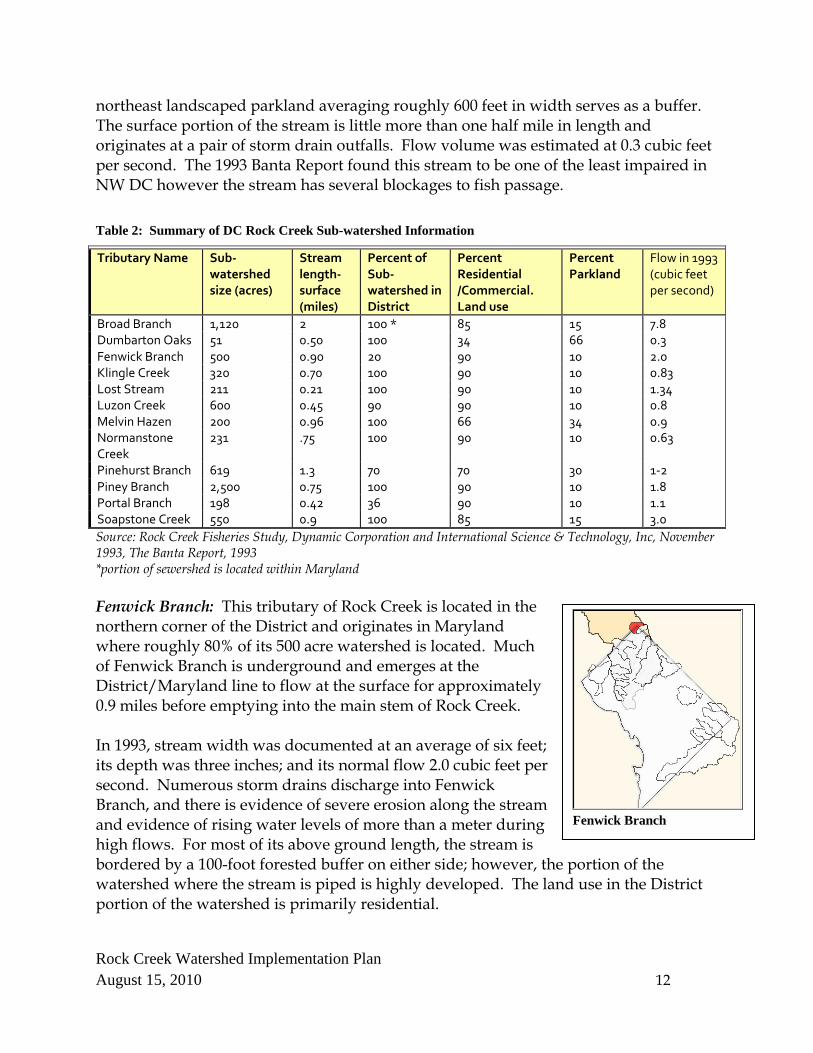
about 25 feet wide with a very shallow depth of approximately three inches. Evidence of erosion and channel alteration are noted throughout the length of the stream. Flow volume is estimated at 7.8 cubic feet per second (cfs). Dumbarton Oaks: This stream is a minor tributary of Rock Creek, with a watershed of 51 acres. It joins Rock Creek approximately 1,000 yards south of the Massachusetts Avenue Bridge. Land use in the watershed is primarily parkland and includes the Dumbarton Oaks Garden and a portion of the U.S. Naval Observatory. On the south and southwestern side of the stream a forested buffer of roughly 100 feet exists and on the
Broad Branch
Dumbarton Oaks
Rock Creek Watershed Implementation Plan August 15, 2010 12
northeast landscaped parkland averaging roughly 600 feet in width serves as a buffer. The surface portion of the stream is little more than one half mile in length and originates at a pair of storm drain outfalls. Flow volume was estimated at 0.3 cubic feet per second. The 1993 Banta Report found this stream to be one of the least impaired in NW DC however the stream has several blockages to fish passage. Table 2: Summary of DC Rock Creek Sub-watershed Information
Tributary Name Sub‐watershed size (acres)
Stream length‐surface (miles)
Percent of Sub‐watershed in District
Percent Residential /Commercial. Land use
Percent Parkland
Flow in 1993 (cubic feet per second)
Broad Branch 1,120 2 100 * 85 15 7.8 Dumbarton Oaks 51 0.50 100 34 66 0.3 Fenwick Branch 500 0.90 20 90 10 2.0 Klingle Creek 320 0.70 100 90 10 0.83 Lost Stream 211 0.21 100 90 10 1.34 Luzon Creek 600 0.45 90 90 10 0.8 Melvin Hazen 200 0.96 100 66 34 0.9 Normanstone Creek
231 .75 100 90 10 0.63
Pinehurst Branch 619 1.3 70 70 30 1‐2 Piney Branch 2,500 0.75 100 90 10 1.8 Portal Branch 198 0.42 36 90 10 1.1 Soapstone Creek 550 0.9 100 85 15 3.0 Source: Rock Creek Fisheries Study, Dynamic Corporation and International Science & Technology, Inc, November 1993, The Banta Report, 1993 *portion of sewershed is located within Maryland Fenwick Branch: This tributary of Rock Creek is located in the northern corner of the District and originates in Maryland where roughly 80% of its 500 acre watershed is located. Much of Fenwick Branch is underground and emerges at the District/Maryland line to flow at the surface for approximately 0.9 miles before emptying into the main stem of Rock Creek. In 1993, stream width was documented at an average of six feet; its depth was three inches; and its normal flow 2.0 cubic feet per second. Numerous storm drains discharge into Fenwick Branch, and there is evidence of severe erosion along the stream and evidence of rising water levels of more than a meter during high flows. For most of its above ground length, the stream is bordered by a 100-foot forested buffer on either side; however, the portion of the watershed where the stream is piped is highly developed. The land use in the District portion of the watershed is primarily residential.
Fenwick Branch

Rock Creek Watershed Implementation Plan August 15, 2010 13
Klingle Run: This creek is about 0.7 miles long and discharges into Rock Creek near Porter Street Bridge. It parallels the south side of Klingle Road with one major branch that parallels the south side of Macomb Street. The watershed is approximately 320 acres; however, most of the runoff from the watershed empties into Rock Creek via a combined drain system north of the mouth of Klingle Creek. The surrounding land use is primarily residential but there is a wooded buffer of a few hundred feet on one side of the creek. In 1993, a 30 foot-wide channel was measured, with only 6 feet being occupied by water. The average stream depth was 3.5 inches although pools of two feet in depth were recorded. Estimated normal flow was 0.83 cubic feet per second. There is strong evidence of erosion along the tributary including steep banks, exposed tree roots, and other hazards which have lead to the closing of Klingle Road along the length of the stream.
Lost Stream: This is an unnamed tributary of Broad Branch. The stream is roughly 1,100 feet (0.2 miles) long and originates from a five foot by six inch storm water drain just south of Military Road, NW. The tributary runs through Little Forest Park for most of its length and then enters a stormwater discharge pipe that connects with Broad Branch. The streams watershed is 211 acres of which approximately 10% is forested parkland with the remaining 90% being upscale residential development. In a 1993 study, average channel width was 16 feet, depth was four inches, and two foot deep pools were noted. Average flow was 1.34 cubic feet per second. Minimal erosion and channel alteration was noted at this stream.
Luzon Branch: Luzon Branch is an eastern tributary of Rock Creek. It travels roughly half a mile southwest and empties into Rock Creek at Joyce Road. The stream’s watershed measures about 600 acres of which all but 10% is located within the District. Almost 90% of the watershed is residential and light commercial and the rest being parkland. The watershed is predominantly piped below ground with a surface portion of the stream that is less than 0.5 miles long. The above ground portion of the stream is buffered by 100-1,000 feet of parkland. In 1993, Luzon Branch’s channel was measured at 26-feet wide. The width of the stream was measured at eight feet wide and had a depth of about seven inches with almost no deep pools. Normal flow volume was calculated at 0.8 cubic feet per
Klingle Run
Lost Stream
Luzon Branch
Rock Creek Watershed Implementation Plan August 15, 2010 14
second. Significant erosion was noted in the creek and evidence of high water marks 1.5 meters above the bottom was observed.
Melvin Hazen: This stream is less than a mile long (4,500 feet) and originates near 34th Street and Tilden St., NW. Its watershed encompasses roughly 200 acres. The upper two-thirds of the watershed is primarily residential and commercial development and the remainder is parkland that buffers the stream for approximately 200 feet on both sides. In 1993, streambed width was averaged at 11 feet, with water filling six feet. The stream depth was measured at six inches and normal flow was calculated at 0.9 cubic feet per second. High flows were estimated to be a foot above the channel bed. Moderate impairment was noted – primarily channel alteration, low flow volume, and bottom scouring.
Normanstone Creek: This stream is a western tributary of Rock Creek that joins the main stem about 1,000 feet northeast of the Massachusetts Avenue Bridge. The surface portion of the stream is roughly 4,000 feet (.75 miles) long and travels parallel to Normanstone Parkway for most of its length. The watershed is approximately 250 acres and includes a significant portion of the Washington Cathedral grounds, the U.S. Naval Observatory and parts of Cleveland and Woodley Park. Land use in the watershed is 90% residential/commercial and 10% parkland which includes a forested buffer strip on the southwestern side of the stream that varies in width from 100-1,000 feet. During
the 1993 Banta study, channel width was averaged at 12 feet, with the stream measuring three feet in width and seven inches in depth—pools of two feet in depth were observed. Normal water flow was calculated at 0.63 cubic feet per second and evidence of erosion and extreme high water flows were noted. Pinehurst Branch: Pinehurst Branch originates at the DC/Maryland state line in Chevy Chase Manor, Maryland and travels about 1.3 miles east-southeast to its confluence with Rock Creek. The 619-acre Pinehurst watershed is composed of about 70 percent residential and commercial development and 30 percent parkland. Approximately 70 percent of the watershed lies in the
District, with the remaining in Montgomery County, Maryland. The average gradient of the stream is approximately two percent over its entire length. Pinehurst Branch is shallow with a depth of about five inches, although pools over two feet deep were
Melvin Hazen Run
Normanstone Creek
Pinehurst Branch
Rock Creek Watershed Implementation Plan August 15, 2010 15
observed. Normal flow was calculated at one to two cubic feet per second. Evidence of the stream topping its banks suggests high flows are common and easily top their relatively low banks. The stream itself was rated high in terms of habitat quality. Piney Branch: Piney Branch runs approximately three-quarters of a mile through a strip of forested parkland about 1,000 yards wide on the eastern side of Rock Creek. The watershed comprises 2,500 acres and is completely within the District of Columbia, making it the largest of all of the District’s tributaries. The large size of the watershed compared to the short surface stream length (0.75 miles) results from the extensive combined sewer and storm sewer systems that discharge to Piney Branch. The surface stream portion of the watershed is surrounded by predominantly forested parkland and comprises about five percent of the entire watershed. The rest of the watershed is primarily urban residential and some light commercial. Piney Branch is approximately 12 feet wide and has a depth of about four inches. In 1993, normal water flow was estimated at 1.8 cubic feet per second. Erosion was noted in the form of channel alteration, bottom scouring, and lack of vegetative cover.
Portal Branch: Portal Branch is a tributary of Fenwick Branch, which it joins at 120 feet before Fenwick empties into Rock Creek. The surface portion of the stream is roughly 2,200 feet (0.42 miles), and its watershed measures roughly 200 acres, of which 36% falls within the District. The District portion of the watershed is low density residential while the Maryland portion is generally high density residential and light commercial. The stream is buffered on either side by 100 feet or less of forested parkland. During the 1993 Banta study the stream channel was averaged at 10 feet wide, with water occupying approximately six feet. Water depth was about three inches with several two foot pools observed. Flow volume was calculated at 1.1 cubic feet per second. Signs of severe erosion, including imbedded
cobbles, channel alteration, and sediment deposition were observed. Soapstone Creek: Soapstone Creek, a tributary of Broad Branch, joins the stream just before its confluence with Rock Creek. The watershed covers 550 acres and is mostly urban, with approximately 15 percent parkland and forest in the lower reaches of the creek. The northern quarter of the urban watershed is densely populated residential property. The southwestern quarter of the watershed is much less densely populated residential and commercial property. The lower reach of this watershed is the only portion that drains naturally—the upper areas drain into storm sewer systems.
Piney Branch
Portal Branch
Rock Creek Watershed Implementation Plan August 15, 2010 16
Soapstone Creek runs about 0.9 miles through a steep-sided heavily wooded valley about 500 yards wide. The average channel width is approximately 15 feet and water flow was estimated at three cubic feet per second. Signs of moderate erosion were observed.
Geology The majority of the Rock Creek basin lies just west of the fall line separating the Piedmont and Coastal Plain Physiographic Provinces. Therefore, the geology of the basin is quietly characteristic of the Piedmont, and the broad, low-sloped uplands of the Outer Piedmont Sub-province. Underlying rocks are primarily metamorphosed sedimentary and igneous rocks of Cambrian to Ordovician age (543 to 444 million years ago) that have little inter-granular porosity (USGS 2002 Duigon et al. 2000). Bedrock is primarily schists, tonalites, and grandiorites (USGS 2002 Darton 1950). The pre-Cambrian and metamorphic rocks of the Appalachians form a continuous ledge or zone paralleling the east coast of the US. Where they cross this ledge, streams and rivers have denuded the softer deposits of the coastal plain more efficiently, creating falls and rapids. This line of transition between the two underlying geologies is referred to as the “fall line”. In the DC area, the fall line is most readily observed between Great Falls on the Potomac River and Theodore Roosevelt Island. Many east coast cities, including Richmond, Baltimore, Philadelphia, and Trenton, grew along this “fall line” because the line marks the most inland navigable point along each city’s respective river. Past the fall line, boat shipments historically had to be unloaded for further travel by land. However, canal construction would later circumvent the falls in many cities, as the C&O Canal did in the District. In addition to their impact on transportation, the falls also created an early waterpower source for many grist and textile mills. Rock Creek Park’s Pierce Mill is an example of an early gristmill.
Soils The soils the Rock Creek watershed consist of a multitude of deposits. As individual soil descriptions would prove overwhelming for such a large area, general soil association descriptions, and an accompanying soils map of the watershed are presented on the following pages. The following soil information is excerpted from the USDA-NRCS 1974 Washington, DC Soils Survey. Most associations below contain a significant urban land component. Urban land consists of areas that are occupied by structures and works. These soils usually occupy gentler slopes and that have been cut or graded. Most soil materials around building foundations and most fill materials used to support structures generally consist of
Soapstone Creek

Rock Creek Watershed Implementation Plan August 15, 2010 17
parent soil material from the surrounding area that is mixed with construction and demolition debris. Most of the remaining undisturbed soils in Washington, DC (about 19% of the District’s land area) are found in parks. Figure 3 shows a generalized soil map of the Rock Creek watershed. Descriptions of the soil associations below provide more in-depth detail. Iuka-Lindside-Codorus association - The majority of Rock Creek’s channel and flood plain consist of the Iuka-Lindside-Codorus association. These are deep, nearly level; moderately well drained soils that are underlain by stratified alluvial sediment, or man-deposited dredged material; on flood plains. Manor-Glenelg association - The Manor-Glenelg association follows the north-south course of Rock Creek and surrounds the Iuka-Lindside-Codorus association. This association accounts for much of Rock Creek Park’s land. These soils are deep, steep to nearly level, well drained and somewhat excessively drained soils that are underlain by acid crystalline rocks; on uplands that have broad ridge tops. Neshaminy-Urban Land association - This association, common to the Georgetown area, is located in two patches within the Rock Creek watershed. One patch sits just southeast of the US Naval Observatory, mainly within Dumbarton Oaks Park. The other patch lies just south of the Chevy Chase neighborhood. In general, the association exhibits deep, steep to moderately sloping, well drained soils, which are underlain by semi basic or mixed basic and acidic rocks, and urban land; on uplands. Udorthents association - Found primarily around the Mall, the Udorthents association extends north from the Lincoln Memorial, into the Rock Creek watershed, surrounding the streams southernmost reach, below Q Street. Overall, Udorthents are deep to moderately deep, nearly level to steep, well drained soils that consist of cuts, fills, or otherwise disturbed lands. Urban Land association - Throughout the District, the Urban Land association is primarily found near the downtown business district, and in corridors along main roads and streets. In the Rock Creek watershed four patches are found. In the west these soils follow Wisconsin Avenue from Glover Park, north. In the south, they are found around Dupont Circle. In the east two patches are found, one along 13th and 16th Streets, the other in the vicinity of Fort Slocum Park. Urban Land soils are nearly level to moderately sloped, with asphalt, concrete, buildings, and other impervious surfaces covering more than 80% of their area.

Rock Creek Watershed Implementation Plan August 15, 2010 18
Figure 2: Generalized Soil Map of Washington, DC Urban Land – Brandywine association - Found in a narrow band (approximately 2,500 feet in width) along the western border of Rock Creek Park and on the eastern edge of the stream channel near Crestwood and Mount Pleasant neighborhoods, this association is characterized by urban land and deep, steep to moderately sloping excessively-drained soils underlain by acid crystalline rocks, on uplands. Urban land-Christiana-Sunnyside association - This association occurs in only one relatively small patch of the District’s portion of the Rock Creek watershed, in the Brightwood neighborhood, just south of Walter Reed Army Medical Center. These soils are deep, nearly level to steep, well-drained soils that are underlain by unstable clayey sediment; on uplands.
Rock Creek Watershed Implementation Plan August 15, 2010 19
Urban land-Manor-Glenelg Association - This association is found at the northern border of Rock Creek Park, crossing over the District border into Maryland, also on the western border of the boundary of Rock Creek Park watershed in the District near the neighborhoods of Chevy Chase and Maryland. Soils are characterized by urban land and deep, steep to gently sloping somewhat excessively-drained and well-drained soils that are underlain by acid crystalline rocks, on uplands. Urban land-Sassafras-Chillum Association - This is a dominant soil type within the District’s portion of the Rock Creek watershed. It is found primarily on the eastern edge of the city, between the park and the watershed’s boundary line. It also occurs on the western edge of the park near the Naval Observatory and Cleveland Park. It is characterized by urban land, deep, nearly level to steep, well-drained soils underlain by sandy and gravelly soils on uplands.
Flow Characteristics Rock Creek is a perennial, low gradient, warm water stream. Channel width varies from approximately 20 feet (widest), to five feet (where the stream enters the District). The average channel slope for Rock Creek is 0.3%, as read from a topographic map. Valley slopes are prominent about the watershed. A USGS stream flow-gauging station (USGS site # 01648000) is located on the left bank of Rock Creek, in upper NW Washington, DC at latitude 38˚58’21” and longitude 77˚02’25”. This location is approximately 125 yards downstream from Sherrill Drive Bridge, or 7.5 miles upstream from the mouth of Rock Creek. Gauge datum is 148.87 feet above sea level. Installed in October 1929, the gauge provided continuous stream flow data until September 30, 2003 for the corresponding hydrologic unit code (HUC) #02070010. Data produced by this Rock Creek gauging station, and other USGS sites, can be accessed at http://waterdata.usgs.gov. Analysis of stream flow data from the Sherrill Drive station can be used to summarize Rock Creek flows in many ways. One practical figure is the average of the mean annual discharge, which is 63.2 cubic feet per second (cubic feet per second) for the years 1930-2002. It should be noted that Rock Creek flows increase dramatically during storm events due to the imperviousness of the watershed, and the efficiency of the storm water conveyance system. For example, flows exceeding 1,000-2,000 cubic feet per second can usually be expected in a given year. The highest peak flow of 12,500 cubic feet per second was recorded on June 22, 1972. It is important to note that two man-made lakes (Lake Needwood and Frank) are located in the upper, Maryland portion of the Rock Creek watershed. These lakes were constructed in the 1960’s for flood control and recreation and have played a role in water quantity control as well as sediment reduction.

Rock Creek Watershed Implementation Plan August 15, 2010 20
Rosgen Stream-Channel Classification In addition to its gauge data, the USGS completed a Rosgen stream-channel classification in May 1999 (Anderson et al., 2002), which provides important information on Rock Creek’s depth, sediment, and water flow. Data for the classification was obtained from a field survey of the channel reach downstream of the Sherrill Drive station (USGS site # 01648000). Cross-sectional and longitudinal data, as well as modified-Wolman pebble counts, were collected along this approximate 900-foot long reach. Results from the analysis and interpretation of this data are found below, in Table 3. At the time of the survey, the USGS also extended their elevation measurements to the staff gauge at the Sherrill Drive station and determined bank full stage to be 6.75 feet, gage datum. Historically, this bank full stage corresponds to a discharge of about 1,530 cubic feet per second, and a flood event of approximately 1.4 years. According to the Rosgen stream-channel classification system, the reach is a C5 - a sand-bedded, slightly entrenched, single thread channel, with a moderate width/depth ratio, and high sinuosity. Sediment supply is often high to very-high in these stream types and point bars and other depositional features are often present (Rosgen, 1996).
Table 3: Rosgen stream classification
Variables Value Water surface slope 0.0019 Feet per foot Sinuosity 1.48 Feet per foot Mean channel material size <2.0 Millimeters Bank full width 72 Feet Food‐prone width >200 Feet Entrenchment ratio >2.2 Feet per foot Mean bank full depth 6.39 Feet Maximum bank full depth 8.58 Feet Width/depth ratio 11.3 Feet per foot Percentage of riffles in reach 10.5 Percent Percentage of pools in reach 65.4 Percent Percentage of runs in reach 25.0 Percent
In their final report, the USGS also noted an earlier, 1989, Rosgen stream-channel classification that was conducted in the same reach by a consultant to NPS (Dynamic Corporation). At the time, the reach was classified primarily as a C3 channel exhibiting a cobbled bed, with two smaller portions of Rock Creek within the District being classified as an F4 (near the Maryland border and near the P Street Bridge) and another section being identified as a B2 stream type. The results of this classification led the USGS to believe that additional sand deposits had accumulated over the previous decade, and now overlay the older cobble materials.
Rock Creek Watershed Implementation Plan August 15, 2010 21
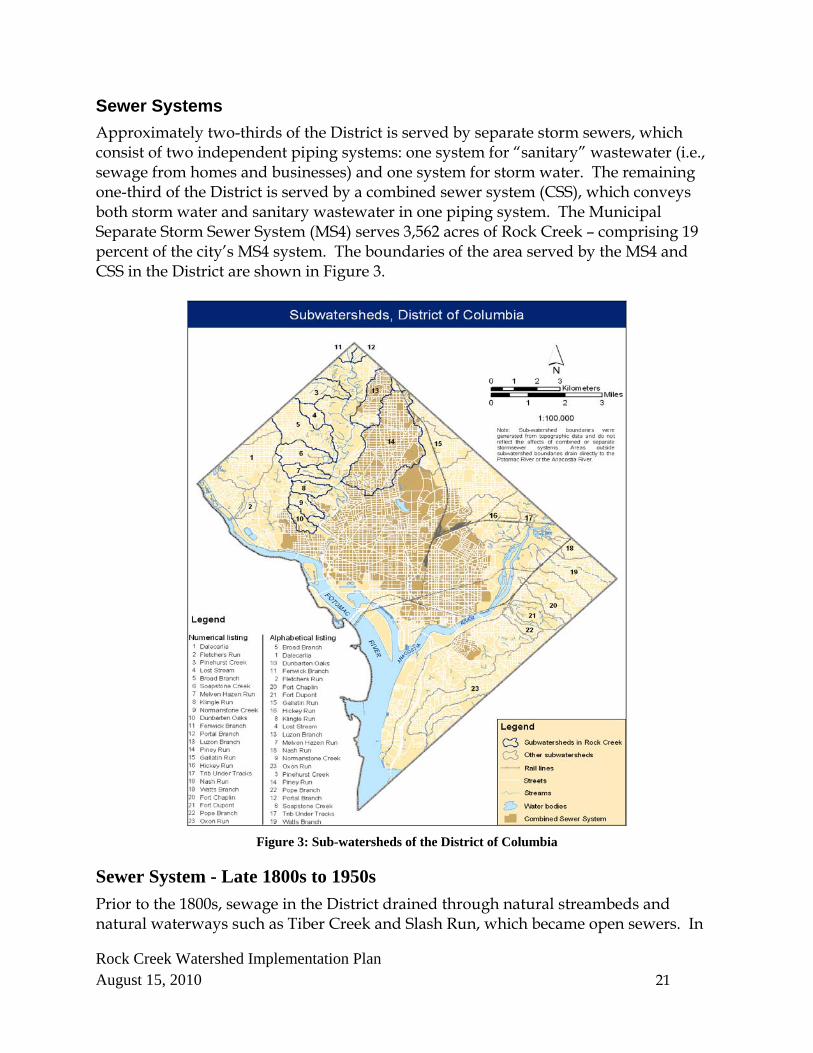
Sewer Systems Approximately two-thirds of the District is served by separate storm sewers, which consist of two independent piping systems: one system for “sanitary” wastewater (i.e., sewage from homes and businesses) and one system for storm water. The remaining one-third of the District is served by a combined sewer system (CSS), which conveys both storm water and sanitary wastewater in one piping system. The Municipal Separate Storm Sewer System (MS4) serves 3,562 acres of Rock Creek – comprising 19 percent of the city’s MS4 system. The boundaries of the area served by the MS4 and CSS in the District are shown in Figure 3.
Figure 3: Sub-watersheds of the District of Columbia
Sewer System - Late 1800s to 1950s Prior to the 1800s, sewage in the District drained through natural streambeds and natural waterways such as Tiber Creek and Slash Run, which became open sewers. In
Rock Creek Watershed Implementation Plan August 15, 2010 22
1871, the Board of Public Works initiated underground sewer pipe construction. Combined sewers discharged untreated sewage and storm water runoff into rivers and canals, with some interceptors built piecemeal to enclose parts of the old canals and move discharge points away from developed downtown areas. In 1890, President Harrison sent Congress an overall engineering plan for new interceptors to carry sanitary and storm water runoff considerably farther from the then-populated areas for discharge into the Potomac River downstream from the developed City. In 1916, Congress authorized the State of Maryland to connect to the District’s sewer system. Agreements were subsequently developed to accept wastewater from Montgomery County and Prince George’s County. In 1938, the Blue Plains Waste Water Treatment Plant was placed in operation. The rapid population expansion of the city during and after World War II greatly taxed the sewer system. Major studies of the city’s combined sewer system were conducted in the mid-1950s, resulting in the preparation of two reports documenting the then-current conditions of the system and recommending a major capital program for system development.
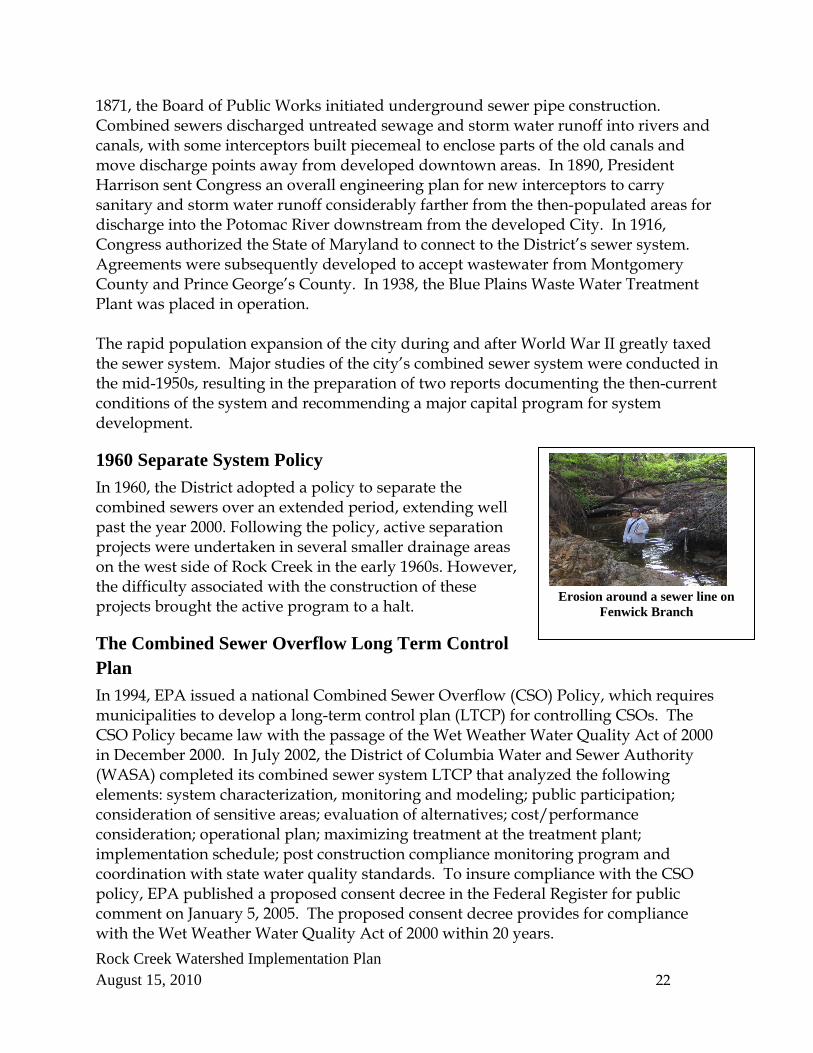
1960 Separate System Policy In 1960, the District adopted a policy to separate the combined sewers over an extended period, extending well past the year 2000. Following the policy, active separation projects were undertaken in several smaller drainage areas on the west side of Rock Creek in the early 1960s. However, the difficulty associated with the construction of these projects brought the active program to a halt.
The Combined Sewer Overflow Long Term Control Plan In 1994, EPA issued a national Combined Sewer Overflow (CSO) Policy, which requires municipalities to develop a long-term control plan (LTCP) for controlling CSOs. The CSO Policy became law with the passage of the Wet Weather Water Quality Act of 2000 in December 2000. In July 2002, the District of Columbia Water and Sewer Authority (WASA) completed its combined sewer system LTCP that analyzed the following elements: system characterization, monitoring and modeling; public participation; consideration of sensitive areas; evaluation of alternatives; cost/performance consideration; operational plan; maximizing treatment at the treatment plant; implementation schedule; post construction compliance monitoring program and coordination with state water quality standards. To insure compliance with the CSO policy, EPA published a proposed consent decree in the Federal Register for public comment on January 5, 2005. The proposed consent decree provides for compliance with the Wet Weather Water Quality Act of 2000 within 20 years.
Erosion around a sewer line on
Fenwick Branch
Rock Creek Watershed Implementation Plan August 15, 2010 23
Municipal Separate Storm Sewer System Permit The EPA issued a MS4 NPDES permit to the District on April 19, 2000. The Permit allows discharges from the MS4 to the Potomac and Anacostia Rivers and tributaries (including Rock Creek), in accordance with the conditions of the Permit. On June 12, 2001, the “Storm Water Permit Compliance Amendment Act of 2000” was made final by the District of Columbia to amend the powers of WASA to engage in certain MS4 permit compliance activities. The Act created a Storm Water Administration within WASA and established WASA as its lead agency to coordinate actions among other District agencies in connection with permit compliance activities. The act also created the Storm Water Permit Compliance Enterprise Fund to fund administration and compliance activities related to the MS4 permit. On October 19, 2002, the District applied for a new NPDES permit and submitted an upgraded Storm Water Management (SWM) Plan for approval. This SWM plan describes the District’s SWM Program to control pollutant discharge from the MS4 to the Potomac and Anacostia Rivers and their tributaries, including Rock Creek. On August 19, 2004, EPA reissued the District’s MS4 NPDES permit for a five-year term.
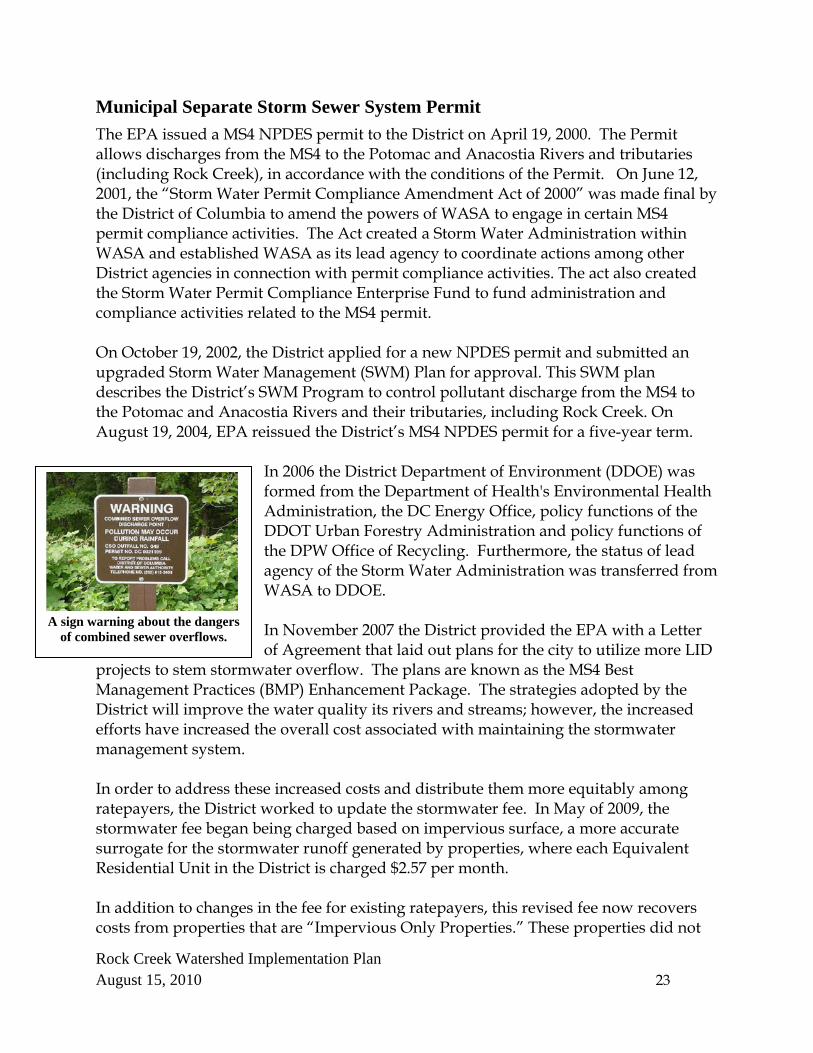
In 2006 the District Department of Environment (DDOE) was formed from the Department of Health's Environmental Health Administration, the DC Energy Office, policy functions of the DDOT Urban Forestry Administration and policy functions of the DPW Office of Recycling. Furthermore, the status of lead agency of the Storm Water Administration was transferred from WASA to DDOE. In November 2007 the District provided the EPA with a Letter of Agreement that laid out plans for the city to utilize more LID
projects to stem stormwater overflow. The plans are known as the MS4 Best Management Practices (BMP) Enhancement Package. The strategies adopted by the District will improve the water quality its rivers and streams; however, the increased efforts have increased the overall cost associated with maintaining the stormwater management system. In order to address these increased costs and distribute them more equitably among ratepayers, the District worked to update the stormwater fee. In May of 2009, the stormwater fee began being charged based on impervious surface, a more accurate surrogate for the stormwater runoff generated by properties, where each Equivalent Residential Unit in the District is charged $2.57 per month. In addition to changes in the fee for existing ratepayers, this revised fee now recovers costs from properties that are “Impervious Only Properties.” These properties did not
A sign warning about the dangers
of combined sewer overflows.

Rock Creek Watershed Implementation Plan August 15, 2010 24
have an existing WASA account since they do not receive water and sanitary sewer service from WASA. The changes in the rates are expected to increase the funding to meet with the EPA requirements for the 2009 permit.
Causes and Sources of Rock Creek’s Water Quality Impairments
Rock Creek TMDLs The water quality of Rock Creek has been monitored for over twenty years. Over that time, monitoring has shown that pollutants in Rock Creek regularly exceed the District’s water quality standards for all of its designated uses. Rock Creek’s designated uses include Classes A through D:
Class A - Primary contact – activities such as swimming and wading; Class B - Secondary contact – pursuits such as boating; Class C - Aquatic life – the ability for the stream to sustain fish and other aquatic
life; and Class D - Fish consumption – being able to safely eat fish caught in the stream.
Because the pollutants in Rock Creek exceed the city’s standards, the District of Columbia was required to develop Total Maximum Daily Loads (TMDL) for each of the pollutants that impair the waterway. A TMDL is a calculation of the maximum amount of a pollutant that a water body can receive from point and nonpoint sources (including a margin of safety) and still meet applicable water quality standards. It also provides an allocation of that maximum amount among the water body's pollutant sources. The Clean Water Act (Act), section 303, establishes the water quality standards and TMDL programs. States, territories, and tribes set water
quality standards. These entities identify specific designated uses (e.g., drinking water, contact recreation, and aquatic life support) for each water body in their jurisdiction and identify the scientific water quality standards to support those uses. TMDLs are established for water bodies that, following implementation of technology-based effluent limits, fail to meet existing water quality standards for pollutants of concern. Section 303(d) of the Act requires the District to identify water bodies (or segments of water bodies) for which the existing effluent limitations are not rigorous enough to support water quality standards. The District is also required to rank these water bodies by priority of severity of pollution and their associated uses. The District assesses its water bodies every two years as required by section 305(b) of the Act. In doing so, approximately 30 total water bodies in the District were identified as impaired for various pollutants (e.g. metals, organics, coliform bacteria, oil and
Stormwater flowing
down an alley

Rock Creek Watershed Implementation Plan August 15, 2010 25
grease, etc.) and included on the TMDL 303(d) list in 2002. Within the Rock Creek Watershed, Rock Creek and a number of its tributaries are listed as impaired water bodies.
Causes of Impairments The major proximal causes of impairment to Rock Creek are pathogens, metals and persistent chemical pollutants also called organics. The ultimate source of these pollutants is large quantities of uncontrolled and untreated stormwater carrying with it these pollutants and delivering them to Rock Creek. The large amount of impervious area in the watershed impedes stormwater from infiltrating naturally as it would in a forested environment (see Figure 4: Rock Creek Impervious Cover). Instead it flows off rooftops and roadways into storm drains where it is delivered – hot, fast, and dirty to the stream and its tributaries. In addition to the pollutants carried to the stream, the volume, velocity, and temperature of the water impacts aquatic life by eroding stream banks, raising stream temperatures, and scouring stream beds. The high percent of impervious surface in the watershed has a second impact on aquatic habitat. Because rain water cannot infiltrate and recharge the ground water, some streams go dry during dry periods because the water table drops below the stream level.
Figure 4: Rock Creek Impervious Cover
Specific Pollutants of Concern EPA Region III has currently approved three TMDL documents issued by the District of Columbia (Table 4), establishing TMDLs for 16 pollutants in the Rock Creek watershed

Rock Creek Watershed Implementation Plan August 15, 2010 26
(DC DOH 2004a; DC DOH 2004b; DC DOH 2004c). TMDLs were established for the 12 segments of water bodies within the Rock Creek watershed listed below (total number of pollutants for each segment is included in parentheses):
Upper Rock Creek (5) Lower Rock Creek (5) Broad Branch (10) Dumbarton Oaks (10) Fenwick Branch (10) Klingle Valley (10) Luzon Branch (10) Melvin –Hazen Valley Branch (10) Normanstone Creek (10) Pinehurst Branch (10) Soapstone Creek (10) Piney Branch (14)
The upper and lower Rock Creek segments had the lowest number of TMDLs identified at 5 pollutants, and the Piney Branch tributary had the highest number of TMDLs identified at 14 pollutants. The complete TMDL documents and backup materials are available online at: www.epa.gov/reg3wapd/tmdl/dc_tmdl/index.htm.
Table 4: District of Columbia Rock Creek TMDL Documents Approved by EPA
TMDL Document Date Approved Final Total Maximum Daily Loads for Fecal Coliform Bacteria in Rock Creek February 27, 2004 Final Total Maximum Daily Loads for Metals in Rock Creek February 27, 2004 Final Total Maximum Daily Loads for Organics and Metals in Broad Branch, Dumbarton Oaks, Fenwick Branch, Klingle Valley, Luzon Branch, Melvin Hazen Valley Branch, Normanstone Creek, Pinehurst Branch, Piney Branch, Portal Branch, and Soapstone Creek
February 27, 2004
The three documents listed above report the results of water quality modeling using the Storm Water Management Model (SWMM) model and the DC Small Tributaries TMDL model to calculate the load reductions for their respective pollutants. The Rock Creek watershed was subdivided into the 12 segments as listed above for modeling purposes.
The SWMM model was selected for the simulation of total suspended solids (TSS) and metals (copper, zinc, lead, and mercury) in Rock Creek. SWMM has process and transport simulation capabilities that are consistent with the needs of a model to support development of TMDLs for metals in Rock Creek. In addition, the SWMM model has been successfully applied recently in Rock Creek for other studies, including a bacterial TMDL and the development of a LTCP for CSOs in the District of Columbia. The model predicts hourly concentrations of total metals, which were converted to dissolved concentrations using partition coefficients. These results were then compared

Rock Creek Watershed Implementation Plan August 15, 2010 27
to the applicable water quality standards to determine an appropriate TMDL. Mercury concentrations were calculated based upon available monitoring data and atmospheric deposition modeling.
The DC Small Tributaries TMDL model, developed by the Interstate Commission on the Potomac River Basin (ICPRB), was used for estimating metals and organics using a simple mass balance model that predicted daily water column concentrations of constituents of concern in the tributaries. The tributary model includes sub-models, one of which is for organic pollutants and one for inorganic pollutants (metals). These two sub-models predict daily water column concentrations of each pollutant in each of the tributaries under current conditions and allow evaluation of load reduction scenarios by simple percent reductions of base and storm loads.
Based on the analysis of the model results for each specific pollutant, the TMDL documents estimate historic pollutant loads and the maximum loads allowable to comply with the water quality standards. Each TMDL document contains an Implementation Plan that allocates the reduction required among identified sources. These plans are generic and allocate the same percentage reduction to each identified source. Specific pollutants of concern identified in the three TMDL documents for the Rock Creek watershed for reductions in discharges from the MS4 include:
Fecal coliform bacteria Zinc Lead Copper Arsenic Mercury Polynuclear aromatic hydrocarbons (PAHs), including:
o PAH-1 - naphthalene, 2-methyl naphthalene, acenaphthylene, acenaphthene, fluorene, and phenanthrene;
o PAH-2 - fluoranthene, pyrene, benzo[a]anthracene, and chrysene; o PAH-3 - benzo[k]fluoranthene, benzo[a]pyrene, perylene, indeno[1,2,3-
c,d]pyrene, benzo[g,h,i]perylene, and dibenzo[a,h+ac]anthracene. Chlordane Heptachlor epoxide Dieldrin DDT (dichloro-diphenyl-trichloroethane) DDE (dichloro-diphenyl-dichloroethylene)
Crumbling Roadway Infrastructure
on Klingle Run from Stormwater Volumes

Rock Creek Watershed Implementation Plan August 15, 2010 28
DDD (dichloro-diphenyl-dichloroethane) Total polychlorinated biphenyls (PCBs)
Description of the Pollutants of Concern The 16 pollutants of concern that have TMDL waste load allocations for Rock Creek and its tributaries can be categorized into three typical groups that include: pathogens, metals, and organic chemicals. The Rock Creek TMDLs are established because pollutants are found to exceed water quality standards established by the District of Columbia to protect human heath and the health of fish and wildlife (Table 5). Table 5: Categories of Uses that Determine Water Quality Standards
Class Use A Primary Contact Recreation (Recreation “in” the water) B Secondary Contact Recreation (Recreation “on” the water) C Protection and propagation of fish, shellfish, and wildlife D Protection of human health related to fish and shellfish consumption E Navigation
Pathogens are disease-causing microorganisms, such as bacteria and viruses, which can be found in fecal waste of humans and animals. The group of bacteria known as fecal coliforms is the only pathogen that is a TMDL pollutant in the Rock Creek watershed. Pathogens generally wash off the land from wild animal, farm animal, and pet waste, and can enter waterways from improperly functioning septic tanks, leaky sewer lines, CSOs, and boat sanitary disposal systems. Exposure to pathogens that reach water bodies can cause a number of health problems. The primary reduction strategy for pathogens is source control to eliminate pathogens from entering the watershed.
Metals are common inorganic chemical pollutants that are very resistant to breakdown, tend to be passed through the food chain, and therefore concentrate in top animal and fish predators. Metals listed as TMDL pollutants for the Rock Creek watershed include mercury, lead, zinc, and copper. Arsenic is a metalloid and is also listed as a TMDL pollutant for the Rock Creek watershed. In addition to industrial point source discharges, metals can enter water bodies through the disposal and combustion of fuels. Metals have the tendency to accumulate in sediments and can be found in point bars and depositional areas. The toxicity of
metals varies greatly with pH, water hardness, dissolved oxygen concentrations, salinity, temperature, and other parameters; physiological impacts (e.g. mortality, lack of reproduction) can be elicited in aquatic systems from relatively low concentrations of metals. The primary reduction strategies for metals include source control and source
Pet waste is a source of pathogens in
Rock Creek

Rock Creek Watershed Implementation Plan August 15, 2010 29
reduction. In addition, most metals are positively charged and tend to bond with negatively charged soil particles such as clay and silt. Therefore, removal practices that manage TSS have also been identified as strategies to remove metals from the watershed. Organic Chemicals include persistent, organic substances that have similar chemical characteristics, are generally hydrophobic, and have the affinity to bind to carbon, TSS, and other particles. Organic chemicals persist in the environment, bioaccumulate through the food web, and pose a risk of causing adverse effects to human health and the environment. Categories of organic chemicals that are listed as TMDL pollutants for the Rock Creek watershed include manufactured pesticides and chemicals. Pesticides that are listed as TMDL pollutants for the Rock Creek watershed include chlordane, dieldrin, heptachlor epoxide, DDT, DDE, and DDD. All manufacturing of the pesticides mentioned above, with the exception of heptachlor epoxide for limited uses has been banned in the U.S. Manufactured chemicals that are listed as TMDL pollutants for the Rock Creek watershed include total PCBs and PAHs. Total PCBs are manufactured industrial chemicals that have been banned in the U.S. PAHs are a byproduct of combustion from the burning of wood, garbage, coal, and organic substances. Some PAHs are still used to make dyes and plastics. Most organic chemicals that are listed as TMDL pollutants in the Rock Creek watershed, as mentioned above, have been banned from use. However, these organic chemicals continue to persist in the environment in low concentrations and are extremely hard to target for removal. Direct removal techniques for organic chemicals from storm water are not known at present, and since most of the organic chemicals have an affinity to bind with soil particles, removal practices that manage TSS have been identified as strategies to remove organic chemicals from the watershed. For each pollutant, a brief definition is provided below, followed by common sources of the pollutant and finally, general strategies for reduction of the pollutant in the MS4. Pollutant reduction strategies for these pollutants of concern are discussed in detail in Section 3 of this Watershed Implementation Plan.
Fecal Coliform Bacteria Definition - Fecal coliform bacteria are not all pathogenic or harmful. As a group, they have been used historically as an “indicator” organism that signifies the presence of pathogenic bacteria, viruses, and protozoa that live in human and animal digestive systems. Pathogen-specific analyses can be difficult, time consuming, and expensive; therefore, tests for fecal coliform are used to indicate the potential for pathogens to be present in water. EPA now recommends specific testing for the Escherichia coli (E. coli) as the indicator organism, since it is the most common organism associated only with the fecal material of humans and other animals. The presence of fecal coliform bacteria

Rock Creek Watershed Implementation Plan August 15, 2010 30
in aquatic environments indicates that the water has been contaminated with the fecal material of humans or other animals. Common Sources - Common sources of fecal coliform in storm water include birds, such as geese or pigeons, and pets, especially dogs. Other sources in an urban environment are illegal sanitary sewer connections to the storm drain, failed septic tanks linked to the storm drain, cross connections between a sanitary sewer and the storm drain, and sanitary sewer exfiltration (either directly or indirectly via groundwater seepage to the storm drain). There are four CSOs on Piney Branch, and the remaining Rock Creek CSO outfalls are along the main banks of the Creek. Although this plan will address actions in the CSS, required actions for the reduction of CSOs are covered in the LTCP. The only tributary impacted by CSOs in the Rock Creek watershed is Piney Branch. All the remaining CSOs are on the main stem of Rock Creek. WASA has proposed a storage system in Rock Creek and other parts of the combined sewer system in the Final CSO LTCP (DC WASA, 2002a). The CSO LTCP has been approved by DDOE, and as it is implemented, the plan will significantly reduce CSOs to Piney Branch (DOH, 2004c). In addition, the wildlife that currently inhabits Rock Creek Park and other natural areas of the watershed are not considered primary polluting sources in the Rock Creek watershed. Reduction Strategies- For fecal coliform bacteria, the primary reduction strategy is public outreach, such as educating pet owners on the importance of collecting and disposing of waste. The primary strategy for reducing sanitary discharges to the storm sewers is to identify and eliminate pathways such as illicit connections and leakage from sanitary systems to the MS4. CSOs are a contributor of fecal coliform bacteria to Rock Creek. The management of CSOs is the responsibility of WASA. Under a separate program for a reduction strategy, WASA has developed an LTCP for the District’s CSOs, dated July 2002, and submitted to EPA for review.
Zinc Definition - Zinc is a naturally occurring metal and one of the most common elements in the earth’s crust. Zinc is found in air, soil, and water and readily combines with other elements to form compounds. The TMDLWLA for the MS4 requires a reduction of zero percent for zinc. Therefore, zinc is not addressed further in this plan. Common Sources - The most common source of zinc is heavy industrial manufacturing processes such as steel production and coal burning. Zinc can be found in atmospheric particulate matter, which can be made soluble by acid rain in runoff. Zinc has a variety of industrial uses including coatings to prevent rust and galvanizing steel. It is also a constituent in paint, rubber, dyes, and batteries. Zinc is frequently used to make alloys such as bronze and brass.

Rock Creek Watershed Implementation Plan August 15, 2010 31
Reduction Strategies - Source reduction and source control are the best strategies for zinc. This may include emission controls, proper vehicle operation and maintenance, proper disposal of batteries, and monitoring waste streams from industrial dischargers. Zinc commonly bonds with soil particles, and therefore treatment techniques that manage TSS are also potential reduction strategies for zinc. These reduction strategies include street sweeping, catch basin cleaning, and use of structural Best Management Practices (BMPs).
Lead Definition - Lead is also a naturally occurring metal. Lead and its compounds tend to bind to soil and sediment particles, and are not easily dissolved in water. Lead’s primary uses are for automobile batteries and ammunition manufacturing, but lead is also used in medical equipment and computer components. Common Sources - Lead sources include industrial processes and atmospheric and airborne particulate matter from burning fuel and solid waste. Acid rain can release this matter to soluble form in runoff to drains and streams. Lead was commonly used in plumbing pipes and paints and as gasoline additives, but the use of lead in these applications has been phased out or greatly reduced. Sources of lead in urban environments include contaminated soil from automobile exhaust and paint chips from old houses and buildings prior to when lead based paint use was prohibited. Reduction Strategies - Source reduction and source control are the best strategies for lead. This may include proper vehicle operation and maintenance, proper disposal of batteries, and monitoring waste streams from industrial dischargers. Because lead bonds with soil particles and has a low solubility in water, treatment techniques that manage TSS are a potential reduction strategy.
Copper Definition - Copper is a naturally occurring metal and an essential element for all living organisms. Copper readily forms inorganic and organic compounds, and is used in the manufacture of alloys such as brass and bronze. Copper is found in atmospheric particulate matter, which can be made soluble by acid rain in runoff. Copper compounds are used in agricultural applications to treat plant diseases and as preservatives for wood and fabrics. Copper compounds tend to bind to soil and sediment, and are not easily water-soluble.
Roadway pollutants being captured in
a bioretention cell
Rock Creek Watershed Implementation Plan August 15, 2010 32
Common Sources - Common industrial sources of copper and its alloys include electrical wiring, sheet metal, pipes, and metal plating including automobiles. Copper is also an important component of pesticides, fungicides, and insecticides, including the preservative used to weatherproof wood products. Reduction Strategies - For copper, source reduction and source control are the best strategies. This may include using alternatives to copper-containing fungicides and insecticides or proper management of fungicides and insecticides, and monitoring waste streams from industrial dischargers. Because copper bonds with soil particles and has a low solubility in water, treatment techniques that manage TSS are a potential reduction strategy.
Arsenic Definition - Arsenic is a naturally occurring metalloid that readily forms inorganic and organic compounds in the environment. Common Sources - Arsenic is naturally released into the atmosphere during volcanic emissions. Arsenic is also released into the atmosphere from industrial sources such as power plants, ore processing, and smelters. Arsenic can be naturally occurring in soils or added as pesticides into soils. Arsenic may also get into water as a result of soil erosion and resuspension. Arsenic is primarily used to make the preservative chromated copper arsenate (CCA), which is used to weatherproof wood used in construction. As a wood preservative, it can be found in plywood, wood decking and patios, wood utility poles, wood pilings, and piers. Arsenic-containing particulates can be released to the air from the burning of wood containing this preservative. Arsenic and arsenic alloys are also used in automobile batteries, semiconductors, and metal finishing. Organic arsenic compounds are used in insecticides and pesticides. Reduction Strategies - Naturally occurring and particulate arsenic sources in an urban environment are best controlled through erosion and sediment regulations and source control.
Mercury Definition - Mercury is a naturally occurring element that is found in air, water, soil, and rocks. It exists in several forms: elemental mercury, inorganic mercury compounds, and organic mercury compounds. Once deposited, certain microorganisms can convert mercury into methyl mercury, a highly toxic form that builds up in fish, shellfish, and animals that consume fish. Common Sources - Mercury is found naturally in many rocks including coal ore. When coal is burned, mercury is released to the environment. Coal-burning power plants are the largest human-caused source of mercury emissions to the air in the United States,
Rock Creek Watershed Implementation Plan August 15, 2010 33
accounting for about 40 percent of all domestic mercury-containing emissions. Burning hazardous wastes, producing chlorine, breaking mercury products, and spilling mercury, as well as the improper treatment and disposal of products or wastes containing mercury, can also release it into the environment. A study by the Maryland Department of the Environment (MDE, 2001) found that, soil concentrations ranged from 0.14 ug/g (microgram per gram) to 0.51 ug/g in Maryland soils. Non-point sources are potential contributors of mercury in the D.C. portion of the watershed. Rain and snowmelt create runoff that collect mercury from a diffuse group of sources and transport mercury to Rock Creek. Reduction Strategies - Controlling emissions at power plants and incinerators is a potential strategy for reducing mercury in the air and airborne deposition. Proper disposal and recycle of mercury waste and spills is another means of reducing mercury in the environment. In addition, because mercury is found in soils, soil erosion control and treatment techniques that manage TSS are strategies for reduction of mercury in MS4 discharges.
Polynuclear Aromatic Hydrocarbons (PAHs) Definition - PAHs are hydrogen compounds with multiple benzene rings and result from the combustion of petroleum, coal, oil, and wood. The TMDL pollutants for Rock Creek include PAH-1, PAH-2, and PAH-3, which are groups of specific compounds. In general, PAHs do not easily dissolve in water, but instead bind tightly to soil and sediment particles. Common Sources - Sources of PAHs include vehicles, heating and power plants, industrial processes, and open burning of wastes. PAHs are typical components of fuels, oils, greases, vehicle (diesel and gasoline) emissions, asphalt roads, and tobacco smoke. PAHs typically enter surface water through runoff. Reduction Strategies - Source control is a potential strategy for PAH reduction. However, many sources are dispersed and/or cross-jurisdictional boundaries. Because PAHs bond with soil particles, treatment techniques that manage TSS are the best reduction strategy for removal of PAHs in MS4 discharges.
Chlordane Definition - Chlordane is a synthetic chemical made up of several components, including transchlordane, cis-chlordane, beta-chlordane, heptachlor, and trans-nonachlor. Chlordane has been banned for use in the U.S. since 1988 because of concerns about cancer risk, persistence in the environment, and danger to wildlife. Chlordane was used as a pesticide on agricultural crops,
A bottle of chlordane collected at a hazardous waste collection day.

Rock Creek Watershed Implementation Plan August 15, 2010 34
lawns, and gardens and as a fumigating agent. It has also been used to control termites in homes by applying underground around the foundations of homes. Chlordane has a very low solubility in water. Common Sources - Chlordane is persistent in the environment and remains as a residue in soils; therefore, chlordane can still exist today in agricultural, lawn and garden soils, and soils along the foundations of homes. Reduction Strategies - Source control is not a potential reduction strategy for chlordane in MS4 discharges. Although no longer in use, the historic widespread use of chlordane in agriculture and termite control has resulted in dispersed small sources today that are difficult to identify and control. Because chlordane bonds with soil particles and has a low solubility in water, treatment techniques that manage TSS are the best reduction strategies for removal of chlordane.
Heptachlor Epoxide Definition - Heptachlor epoxide is a breakdown product of the insecticide heptachlor; it was never manufactured and used as an insecticide itself. Heptachlor is a manufactured pesticide that was used to kill insects in homes and buildings and on food crops. Heptachlor is also a component of the pesticide chlordane. There are no known natural sources of heptachlor or heptachlor epoxide. Use of heptachlor as an insecticide was banned in 1988, with the exception of killing fire ants in power transformer boxes, underground cable television, and telephone cable boxes. Heptachlor epoxide strongly binds to soils and is persistent in the soil. Common Sources - Heptachlor epoxide may exist as a residue in soils (upper soil layers) that have been treated with heptachlor or chlordane. Heptachlor epoxide can also be found in plants and crops grown in soil treated with heptachlor. Reduction Strategies - Source control is not a potential reduction strategy for heptachlor epoxide in MS4 discharges. Although heptachlor is no longer used, its historic widespread use in agricultural and residential applications has resulted in dispersed small sources that are difficult to identify and control. EPA has approved granular activated carbon for removal of heptachlor epoxide in drinking water treatment. However, the use of activated carbon for the treatment of storm water is not feasible. Because heptachlor epoxide binds with soil particles and has a low solubility in water, treatment techniques that manage TSS are the best reduction strategies for removal of heptachlor epoxide. This will include street sweeping, inlet cleaning, and use of structural BMPs.

Rock Creek Watershed Implementation Plan August 15, 2010 35
Dieldrin Definition - Dieldrin is a synthetic pesticide with no known natural source. Dieldrin is also formed from the breakdown of aldrin, another pesticide. Dieldrin was used in agriculture on cotton, corn, and citrus crops; for public health control of diseases carried by insects, such as mosquitoes and tsetse flies; for termite control; and as a wood preservative. Use of dieldrin and aldrin was banned in the U.S. in 1985 and 1987, respectively. However, dieldrin is persistent and is found in areas where it or aldrin was previously used. Dieldrin does not easily dissolve in water. Common Sources - Dieldrin (and aldrin) may exist as a residual in soils (upper soil layers) that have been treated with dieldrin and aldrin. Dieldrin (and aldrin) may be found in soils near homes where the compounds were used to kill termites. It can also be found in plants grown in soils treated with dieldrin and aldrin, as well as in animals that feed on these plants. Reduction Strategies - Source control is not a strategy for dieldrin reduction in storm water discharges. Although banned in the U.S. today, the historic widespread use of dieldrin in numerous applications has resulted in dispersed small sources that are difficult to identify and control. Because dieldrin bonds with soil particles and has a low solubility in water, treatment techniques that manage TSS are the best reduction strategies for removal of dieldrin. This will include street sweeping, inlet cleaning, and use of structural BMPs.
DDT, DDE, and DDD Definition - DDT is a manufactured pesticide with no known natural sources, and DDE and DDD are breakdown products of DDT. DDT was one of the first man-made chemicals used to control insects that carry diseases, such as malaria and typhus. DDT is not soluble in water and tends to bind tightly to particles of soil or sediment. DDT was banned in the U.S. in 1972 because of its deleterious effects on the reproductive capabilities of birds, and persistence in the environment. Common Sources - DDT and its breakdown products initially entered soils during their manufacture and use as insecticides. They are persistent chemicals that remain in the soil for a long time; therefore, the majority of the DDT and DDD found in the environment today is a residue from past use. DDE is only found in the environment as a breakdown product of DDT, and some DDD is also a breakdown product of DDT. DDT can be transferred to crops grown in DDT-contaminated soils. Reduction Strategies - Source control is not a reduction strategy for DDT, DDD, and DDE. Although DDT is banned in the U.S. today, DDT, DDD, and DDE can exist dispersed as residual in areas used for farming and landscaping. At known contaminated sites, a strategy is to maintain ground cover, provide dust control, and

Rock Creek Watershed Implementation Plan August 15, 2010 36
minimize soil disturbance. Because of their bonds with soil, sediment and erosion control and subsequent removal of TSS is an optional reduction strategy for control and removal of DDT, DDD, and DDE. This will include providing sediment and erosion control at construction sites, soil stockpile sites, and rubble and sanitary landfills. In addition, reduction control strategies include street sweeping, inlet cleaning, and use of structural BMPs.
Total PCBs Definition - PCBs are manufactured compounds with no known natural sources. PCBs do not burn easily and are good insulating materials that were used widely as coolants and lubricants in transformers, capacitors, and other electrical equipment. Other uses included heat transfer fluid, hydraulic fluid, dye carriers in carbonless copy paper, and plasticizers in paints, adhesives, and caulking compounds. PCBs were banned in 1977 because of their wide range of harmful health effects. Many electrical transformers and capacitors filled with PCBs are still in service today. In older buildings, PCB-containing fluorescent lights (i.e., in the ballast), electrical devices, and appliances still exist. PCBs are persistent in the environment and tend to bind to particulates such as dust, soil, or sediment during transport. Common Sources - Point sources of PCBs in most urban environments such as the District are not delineated. PCBs manufactured prior to the 1977 ban can still be a residue in soils, and PCB wastes were placed in landfills. Despite the controls and restriction that are in place, demolition and removal of PCB-containing facilities (such as transformers, capacitors, fluorescent lights), accidental leaks and spills from landfills or during transport, and burning of PCB containing wastes in municipal and industrial incinerators are all potential PCB sources. Reduction Strategies - There is no effective reduction strategy for control of PCBs in MS4 discharges. However, proper demolition and disposal of PCB-containing facilities and related spill remediation is an ongoing and standard procedure to follow.
Current Loads and Required Load Reductions for Specific Pollutants EPA regulations define a TMDL as the sum of the waste load allocations assigned to point sources, the load allocations to nonpoint sources and natural background, and a margin of safety (MOS). The TMDL is commonly expressed as:
TMDL = WLAs + LAs + MOS
Load allocations and existing loads are modeled annual averages based on average concentrations measured in stormwater and stream base flow monitoring data. Loads are allocated to both Maryland and the District based on the proportion of the watershed area found in each jurisdiction; Maryland loads are listed as upstream loads.

Rock Creek Watershed Implementation Plan August 15, 2010 37
Given that the Rock Creek watershed is split between Maryland and the District, for the District to achieve its TMDLs, Maryland’s own load allocations must also be met. Upper and Lower Rock Creek have identical TMDLs and WLAs. These two stream segments are listed for Fecal Coliform Bacteria, Copper, Lead, Zinc, and Mercury. For two of these pollutants, Copper and Zinc, no reduction is required and they will not be discussed further in this document. The Approved Rock Creek TMDLs and their associated reductions for the two main stem segments of Rock Creek are detailed in Table 6. Table 6: Approved TMDLs and Percent Reductions for the Main Stem of Rock Creek
Upper Rock Creek Pollutant Existing Load
(MS4) Waste Load Allocation (MS4)
Units Required Reduction to Achieve TMDL
CSO Waste Load Allocation
Units
Fecal Coliform Bacteria
1.27E+15 6.27E+13 MPN/100ml 95% NA
Copper 155.6 147.82 lbs/yr 0% NA
Lead 71.82 9.55 lbs/yr 86% NA
Zinc 365.04 346.79 lbs/yr 0% NA
Mercury 0.38 0.055 lbs/yr 85% NA
Lower Rock Creek
Pollutant Existing Load (MS4)
Waste Load Allocation (MS4)
Units Required Reduction to Achieve TMDL
CSO Waste Load Allocation
Units
Fecal Coliform Bacteria
4.46E+14 2.21E+13 MPN/100ml 95% 1.37E+14 MPN/100ml
Copper 149.67 142.19 lbs/yr 0% 2.5 lbs/yr
Lead 69.08 9.19 lbs/yr 86% 0.66 lbs/yr
Zinc 351.14 333.58 lbs/yr 0% 10.59 lbs/yr
Mercury 0.36 0.053 lbs/yr 85% 0.008 lbs/yr
Of the 11 tributaries to Rock Creek with TMDL requirements, all but Piney Branch have identical percentage reduction requirements for the following constituents:
PAH1 PAH2 PAH3 Chlordane Heptachlor Epoxide Dieldrin DDD DDE DDT
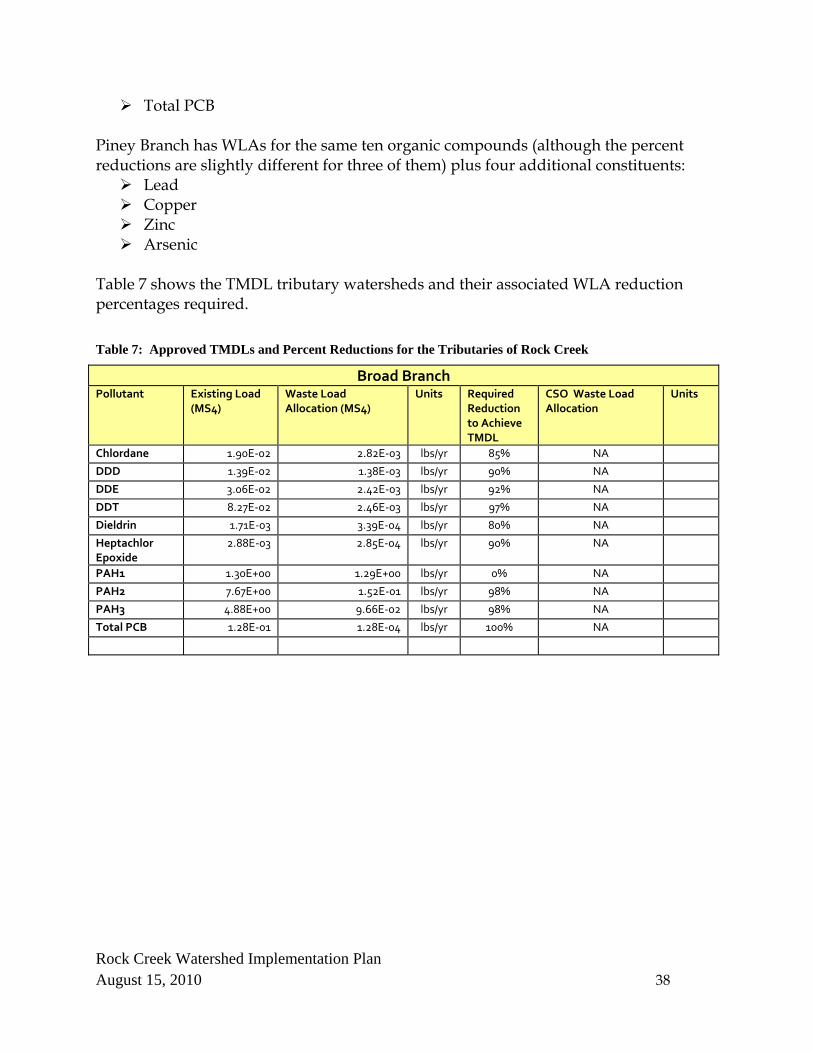
Rock Creek Watershed Implementation Plan August 15, 2010 38
Total PCB Piney Branch has WLAs for the same ten organic compounds (although the percent reductions are slightly different for three of them) plus four additional constituents:
Lead Copper Zinc Arsenic
Table 7 shows the TMDL tributary watersheds and their associated WLA reduction percentages required. Table 7: Approved TMDLs and Percent Reductions for the Tributaries of Rock Creek
Broad Branch Pollutant Existing Load
(MS4) Waste Load Allocation (MS4)
Units Required Reduction to Achieve TMDL
CSO Waste Load Allocation
Units
Chlordane 1.90E‐02 2.82E‐03 lbs/yr 85% NA
DDD 1.39E‐02 1.38E‐03 lbs/yr 90% NA
DDE 3.06E‐02 2.42E‐03 lbs/yr 92% NA
DDT 8.27E‐02 2.46E‐03 lbs/yr 97% NA
Dieldrin 1.71E‐03 3.39E‐04 lbs/yr 80% NA
Heptachlor Epoxide
2.88E‐03 2.85E‐04 lbs/yr 90% NA
PAH1 1.30E+00 1.29E+00 lbs/yr 0% NA
PAH2 7.67E+00 1.52E‐01 lbs/yr 98% NA
PAH3 4.88E+00 9.66E‐02 lbs/yr 98% NA
Total PCB 1.28E‐01 1.28E‐04 lbs/yr 100% NA

Rock Creek Watershed Implementation Plan August 15, 2010 39
Dumbarton Oaks Pollutant Existing Load
(MS4) Waste Load Allocation (MS4)
Units Required Reduction to Achieve TMDL
CSO Waste Load Allocation
Units
Chlordane 4.19E‐04 6.23E‐05 lbs/yr 85% NA
DDD 2.43E‐04 2.40E‐05 lbs/yr 90% NA
DDE 6.37E‐04 5.04E‐05 lbs/yr 92% NA
DDT 1.70E‐03 5.03E‐05 lbs/yr 97% NA
Dieldrin 2.86E‐05 5.66E‐06 lbs/yr 80% NA
Heptachlor Epoxide
5.53E‐05 5.48E‐06 lbs/yr 90% NA
PAH1 2.86E‐02 2.83E‐02 lbs/yr 0% NA
PAH2 1.72E‐01 3.41E‐03 lbs/yr 98% NA
PAH3 1.10E‐01 2.18E‐03 lbs/yr 98% NA
Total PCB 2.74E‐03 2.74E‐06 lbs/yr 100% NA
Fenwick Branch Pollutant Existing Load
(MS4) Waste Load Allocation (MS4)
Units Required Reduction to Achieve TMDL
CSO Waste Load Allocation
Units
Chlordane 3.12E‐03 4.93E‐04 lbs/yr 85% NA
DDD 2.75E‐03 2.72E‐04 lbs/yr 90% NA
DDE 5.54E‐03 4.39E‐04 lbs/yr 92% NA
DDT 1.51E‐02 4.49E‐04 lbs/yr 97% NA
Dieldrin 3.44E‐04 6.80E‐05 lbs/yr 80% NA
Heptachlor Epoxide
5.42E‐04 5.37E‐05 lbs/yr 90% NA
PAH1 2.29E‐01 2.27E‐01 lbs/yr 0% NA
PAH2 1.33E+00 2.63E‐02 lbs/yr 98% NA
PAH3 8.43E‐01 1.67E‐02 lbs/yr 98% NA
Total PCB 2.28E‐02 2.28E‐05 lbs/yr 100% NA

Rock Creek Watershed Implementation Plan August 15, 2010 40
Klingle Run Pollutant Existing Load
(MS4) Waste Load Allocation (MS4)
Units Required Reduction to Achieve TMDL
CSO Waste Load Allocation
Units
Chlordane 9.24E‐03 1.37E‐03 lbs/yr 85% NA
DDD 5.53E‐03 5.47E‐04 lbs/yr 90% NA
DDE 1.42E‐02 1.12E‐03 lbs/yr 92% NA
DDT 3.77E‐02 1.12E‐03 lbs/yr 97% NA
Dieldrin 6.56E‐04 1.30E‐04 lbs/yr 80% NA
Heptachlor Epoxide
1.24E‐03 1.23E‐04 lbs/yr 90% NA
PAH1 6.31E‐01 6.24E‐01 lbs/yr 0% NA
PAH2 3.79E+00 7.51E‐02 lbs/yr 98% NA
PAH3 2.42E+00 4.80E‐02 lbs/yr 98% NA
Total PCB 6.05E‐02 6.05E‐05 lbs/yr 100% NA
Luzon Branch Pollutant Existing Load
(MS4) Waste Load Allocation (MS4)
Units Required Reduction to Achieve TMDL
CSO Waste Load Allocation
Units
Chlordane 3.23E‐03 4.79E‐04 lbs/yr 85% NA
DDD 1.97E‐03 1.95E‐04 lbs/yr 90% NA
DDE 4.97E‐03 3.93E‐04 lbs/yr 92% NA
DDT 1.33E‐02 3.94E‐03 lbs/yr 97% NA
Dieldrin 2.35E‐04 4.66E‐05 lbs/yr 80% NA
Heptachlor Epoxide
4.39E‐04 4.35E‐05 lbs/yr 90% NA
PAH1 2.20E‐01 2.18E‐01 lbs/yr 0% NA
PAH2 1.32E+00 2.62E‐02 lbs/yr 98% NA
PAH3 8.44E‐01 1.67E‐02 lbs/yr 98% NA
Total PCB 2.12E‐02 2.12E‐05 lbs/yr 100% NA
Melvin Hazen Pollutant Existing Load
(MS4) Waste Load Allocation (MS4)
Units Required Reduction to Achieve TMDL
CSO Waste Load Allocation
Units
Chlordane 3.58E‐03 5.32E‐04 lbs/yr 85% NA
DDD 2.20E‐03 2.18E‐04 lbs/yr 90% NA
DDE 5.52E‐03 4.37E‐04 lbs/yr 92% NA
DDT 1.47E‐02 4.38E‐04 lbs/yr 97% NA
Dieldrin 2.62E‐04 5.19E‐05 lbs/yr 80% NA
Heptachlor Epoxide
4.89E‐04 4.84E‐05 lbs/yr 90% NA
PAH1 2.45E‐01 2.42E‐01 lbs/yr 0% NA
PAH2 1.47E+00 2.91E‐02 lbs/yr 98% NA
PAH3 9.38E‐01 1.86E‐02 lbs/yr 98% NA
Total PCB 2.36E‐02 2.36E‐05 lbs/yr 100% NA
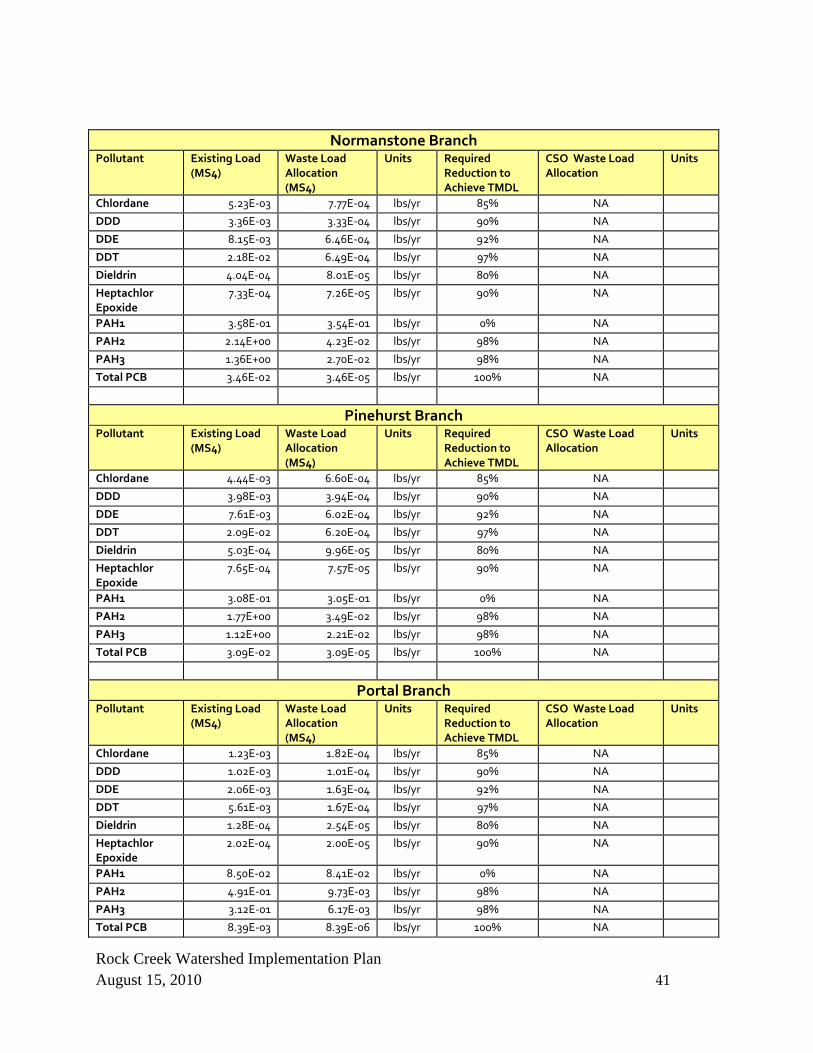
Rock Creek Watershed Implementation Plan August 15, 2010 41
Normanstone Branch Pollutant Existing Load
(MS4) Waste Load Allocation (MS4)
Units Required Reduction to Achieve TMDL
CSO Waste Load Allocation
Units
Chlordane 5.23E‐03 7.77E‐04 lbs/yr 85% NA
DDD 3.36E‐03 3.33E‐04 lbs/yr 90% NA
DDE 8.15E‐03 6.46E‐04 lbs/yr 92% NA
DDT 2.18E‐02 6.49E‐04 lbs/yr 97% NA
Dieldrin 4.04E‐04 8.01E‐05 lbs/yr 80% NA
Heptachlor Epoxide
7.33E‐04 7.26E‐05 lbs/yr 90% NA
PAH1 3.58E‐01 3.54E‐01 lbs/yr 0% NA
PAH2 2.14E+00 4.23E‐02 lbs/yr 98% NA
PAH3 1.36E+00 2.70E‐02 lbs/yr 98% NA
Total PCB 3.46E‐02 3.46E‐05 lbs/yr 100% NA
Pinehurst Branch Pollutant Existing Load
(MS4) Waste Load Allocation (MS4)
Units Required Reduction to Achieve TMDL
CSO Waste Load Allocation
Units
Chlordane 4.44E‐03 6.60E‐04 lbs/yr 85% NA
DDD 3.98E‐03 3.94E‐04 lbs/yr 90% NA
DDE 7.61E‐03 6.02E‐04 lbs/yr 92% NA
DDT 2.09E‐02 6.20E‐04 lbs/yr 97% NA
Dieldrin 5.03E‐04 9.96E‐05 lbs/yr 80% NA
Heptachlor Epoxide
7.65E‐04 7.57E‐05 lbs/yr 90% NA
PAH1 3.08E‐01 3.05E‐01 lbs/yr 0% NA
PAH2 1.77E+00 3.49E‐02 lbs/yr 98% NA
PAH3 1.12E+00 2.21E‐02 lbs/yr 98% NA
Total PCB 3.09E‐02 3.09E‐05 lbs/yr 100% NA
Portal Branch Pollutant Existing Load
(MS4) Waste Load Allocation (MS4)
Units Required Reduction to Achieve TMDL
CSO Waste Load Allocation
Units
Chlordane 1.23E‐03 1.82E‐04 lbs/yr 85% NA
DDD 1.02E‐03 1.01E‐04 lbs/yr 90% NA
DDE 2.06E‐03 1.63E‐04 lbs/yr 92% NA
DDT 5.61E‐03 1.67E‐04 lbs/yr 97% NA
Dieldrin 1.28E‐04 2.54E‐05 lbs/yr 80% NA
Heptachlor Epoxide
2.02E‐04 2.00E‐05 lbs/yr 90% NA
PAH1 8.50E‐02 8.41E‐02 lbs/yr 0% NA
PAH2 4.91E‐01 9.73E‐03 lbs/yr 98% NA
PAH3 3.12E‐01 6.17E‐03 lbs/yr 98% NA
Total PCB 8.39E‐03 8.39E‐06 lbs/yr 100% NA
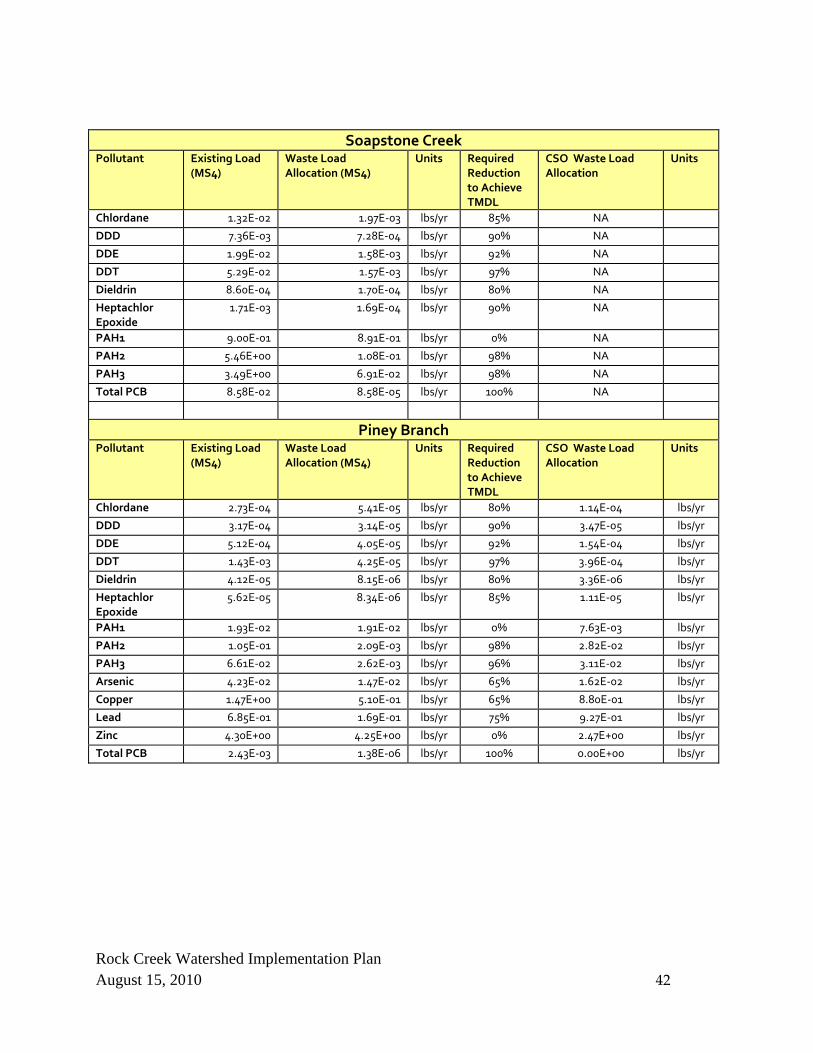
Rock Creek Watershed Implementation Plan August 15, 2010 42
Soapstone Creek Pollutant Existing Load
(MS4) Waste Load Allocation (MS4)
Units Required Reduction to Achieve TMDL
CSO Waste Load Allocation
Units
Chlordane 1.32E‐02 1.97E‐03 lbs/yr 85% NA
DDD 7.36E‐03 7.28E‐04 lbs/yr 90% NA
DDE 1.99E‐02 1.58E‐03 lbs/yr 92% NA
DDT 5.29E‐02 1.57E‐03 lbs/yr 97% NA
Dieldrin 8.60E‐04 1.70E‐04 lbs/yr 80% NA
Heptachlor Epoxide
1.71E‐03 1.69E‐04 lbs/yr 90% NA
PAH1 9.00E‐01 8.91E‐01 lbs/yr 0% NA
PAH2 5.46E+00 1.08E‐01 lbs/yr 98% NA
PAH3 3.49E+00 6.91E‐02 lbs/yr 98% NA
Total PCB 8.58E‐02 8.58E‐05 lbs/yr 100% NA
Piney Branch Pollutant Existing Load
(MS4) Waste Load Allocation (MS4)
Units Required Reduction to Achieve TMDL
CSO Waste Load Allocation
Units
Chlordane 2.73E‐04 5.41E‐05 lbs/yr 80% 1.14E‐04 lbs/yr
DDD 3.17E‐04 3.14E‐05 lbs/yr 90% 3.47E‐05 lbs/yr
DDE 5.12E‐04 4.05E‐05 lbs/yr 92% 1.54E‐04 lbs/yr
DDT 1.43E‐03 4.25E‐05 lbs/yr 97% 3.96E‐04 lbs/yr
Dieldrin 4.12E‐05 8.15E‐06 lbs/yr 80% 3.36E‐06 lbs/yr
Heptachlor Epoxide
5.62E‐05 8.34E‐06 lbs/yr 85% 1.11E‐05 lbs/yr
PAH1 1.93E‐02 1.91E‐02 lbs/yr 0% 7.63E‐03 lbs/yr
PAH2 1.05E‐01 2.09E‐03 lbs/yr 98% 2.82E‐02 lbs/yr
PAH3 6.61E‐02 2.62E‐03 lbs/yr 96% 3.11E‐02 lbs/yr
Arsenic 4.23E‐02 1.47E‐02 lbs/yr 65% 1.62E‐02 lbs/yr
Copper 1.47E+00 5.10E‐01 lbs/yr 65% 8.80E‐01 lbs/yr
Lead 6.85E‐01 1.69E‐01 lbs/yr 75% 9.27E‐01 lbs/yr
Zinc 4.30E+00 4.25E+00 lbs/yr 0% 2.47E+00 lbs/yr
Total PCB 2.43E‐03 1.38E‐06 lbs/yr 100% 0.00E+00 lbs/yr

Rock Creek Watershed Implementation Plan August 15, 2010 43
Long Term Control Plan It is important to note that many of the TMDLs, particularly those for fecal coliform bacteria, were developed in coordination with the $2.2 billion DC Combined Sewer Overflow (CSO) Long Term Control Plan (LTCP) (WASA, 2002), as CSOs have been determined to be a primary source of degradation of the District’s water quality. The LTCP is designed to minimize the amount of polluted water discharged to the receiving waters, allowing these waters to meet the designated uses stipulated in the water quality standards. Approximately $50 million will be spent on Rock Creek watershed projects/upgrades, which under the LTCP include:
Figure 5: WASA Long-Term Control Plan
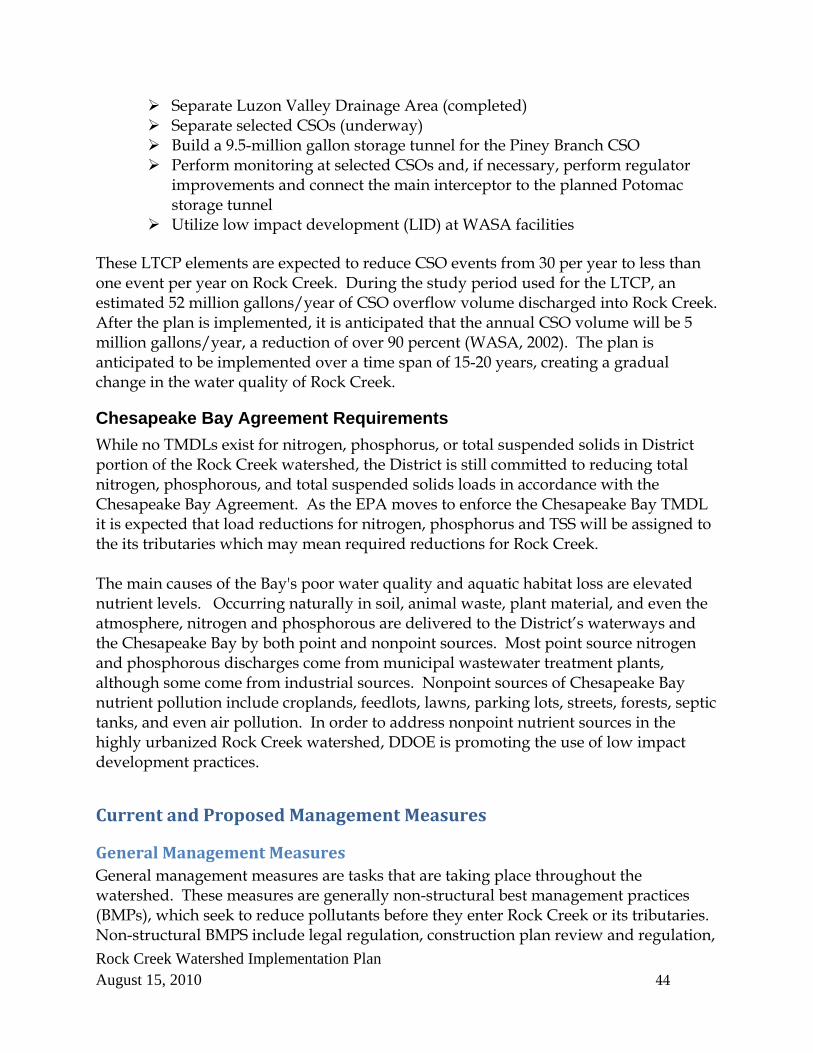
Rock Creek Watershed Implementation Plan August 15, 2010 44
Separate Luzon Valley Drainage Area (completed) Separate selected CSOs (underway) Build a 9.5-million gallon storage tunnel for the Piney Branch CSO Perform monitoring at selected CSOs and, if necessary, perform regulator
improvements and connect the main interceptor to the planned Potomac storage tunnel
Utilize low impact development (LID) at WASA facilities
These LTCP elements are expected to reduce CSO events from 30 per year to less than one event per year on Rock Creek. During the study period used for the LTCP, an estimated 52 million gallons/year of CSO overflow volume discharged into Rock Creek. After the plan is implemented, it is anticipated that the annual CSO volume will be 5 million gallons/year, a reduction of over 90 percent (WASA, 2002). The plan is anticipated to be implemented over a time span of 15-20 years, creating a gradual change in the water quality of Rock Creek.
Chesapeake Bay Agreement Requirements While no TMDLs exist for nitrogen, phosphorus, or total suspended solids in District portion of the Rock Creek watershed, the District is still committed to reducing total nitrogen, phosphorous, and total suspended solids loads in accordance with the Chesapeake Bay Agreement. As the EPA moves to enforce the Chesapeake Bay TMDL it is expected that load reductions for nitrogen, phosphorus and TSS will be assigned to the its tributaries which may mean required reductions for Rock Creek. The main causes of the Bay's poor water quality and aquatic habitat loss are elevated nutrient levels. Occurring naturally in soil, animal waste, plant material, and even the atmosphere, nitrogen and phosphorous are delivered to the District’s waterways and the Chesapeake Bay by both point and nonpoint sources. Most point source nitrogen and phosphorous discharges come from municipal wastewater treatment plants, although some come from industrial sources. Nonpoint sources of Chesapeake Bay nutrient pollution include croplands, feedlots, lawns, parking lots, streets, forests, septic tanks, and even air pollution. In order to address nonpoint nutrient sources in the highly urbanized Rock Creek watershed, DDOE is promoting the use of low impact development practices.
Current and Proposed Management Measures
General Management Measures General management measures are tasks that are taking place throughout the watershed. These measures are generally non-structural best management practices (BMPs), which seek to reduce pollutants before they enter Rock Creek or its tributaries. Non-structural BMPS include legal regulation, construction plan review and regulation,

Rock Creek Watershed Implementation Plan August 15, 2010 45
public education, illicit discharge detection and enforcement, and the management of the District’s solid waste through street sweeping, trash collection, catch basin cleaning, and floatable reduction as primary means to control pollutants. General management measures also include programs to encourage the installation of structural BMPs through voluntary measures on private lands. Tables 8 through 21 provide details on DDOE’s proposed general management measures, the area that they are assumed to treat, and their associated load reductions.
Pollution Prevention Plans Pollution Prevention Plans (P3) are low-cost, effective tools for reducing organics and metals in Rock Creek. As a part of the District’s MS4 permit, the permit stakeholder agencies are developing pollution prevention plans for each facility under their control. These plans detail procedures to avoid the accidental spill of hazardous materials and provide guidance on how to properly clean up a spill should one occur. The Department of Public Works has completed their P3 plans and several other agencies are currently in the process of inventorying their current practices so that the can update and/or create P3s. DDOE offers technical assistance and quality assurance review for agencies in the process of creating P3s. In an effort to delist Rock Creek and other District tributaries, DDOE inspectors will coordinate with Federal and District agencies to ensure that pollution prevention plans are created and followed.
Catch Basin Cleaning Catch basin cleaning is a significant BMP to remove pollutants from the MS4 before they are flushed into receiving waters. Catch basin cleaning has proven to be one of the most cost effective methods to capture and remove gross pollutants in urban areas. Catch basin sumps such as those used in the District trap substantial quantities of debris, sediment, and particulate pollutants. Catch basins with a baffle or siphon attached to the outlet can also trap significant amounts of floatable debris and oil and grease. Either mechanical equipment or a vacuum truck is used to remove sediment and pollutants on a regular schedule. WASA seeks to clean each of the District’s 25,000 catch basins once every six to twelve months through annual clean outs and in response to public comments. More efficient and frequent cleaning of the catch basins will remove solids and pollutants, and prevent overfilling of the sumps and subsequent washout to receiving waters. Improved catch basin containment and removal of pollutants near the source will be a major benefit toward TMDL compliance. Primary pollutants of concern removed during catch basin cleaning are nutrients, BOD, TSS, metals and other
A vacuum truck cleaning a catch basin

Rock Creek Watershed Implementation Plan August 15, 2010 46
pollutants sorbed to particulate matter, and oil and grease in catch basins with a baffle or siphon device. Between 2007 and 2009 WASA performed a pilot project to document the gross amount of pollutants removed during catch basin cleaning and to optimize the frequency of catch basin cleaning to maximize the removal of pollutants of concern. Based on the evaluation of the pilot program, including a cost-benefit analysis, the recommended cleaning methods and frequency will be expanded into the Rock Creek MS4 area. For purposes of our load reduction model we assume 100% catch basin cleaning in the Rock Creek watershed over the long-term (30 years).
Street Sweeping Street sweeping has also been identified as one of the most cost-effective methods of removing particulate debris from streets and roadways. Street sweeping with high efficiency sweepers that are able to collect particulate and fine material is especially effective for removal of TSS and other pollutants, such as metals that are commonly attached or collocated with organic and particulate material. Street sweeping removes particulate pollutants from District roadways before they are introduced to the MS4 by runoff events. It has been documented that the removal of fine particulate will also remove many pollutants including metals that are associated with particulates (Schueler and Holland, 2000). Traditionally, street sweeping has focused on removal of litter, leaves, and other large, visible trash. The benefit of street sweeping for removal of pollutants of concern in the MS4 system is the collection and disposal of fine particulate matter that is hardly noticeable by visual inspection. Improved collection of the fine particulates in street sweeping activities is the focus of this component of the implementation plan. Compared with traditional mechanical street sweepers, modern regenerative air and high efficiency vacuum assisted sweepers can remove up to 60 percent and 35 percent more TSS and nitrogen, respectively (Sutherland, 2004). Heavy metals (copper, lead, and zinc) are also removed more effectively. The use of vacuum assisted and/or regenerative air sweepers greatly increases the removal efficiency of the fine particulate matter and the particulate pollutants and pollutants that may bind to particulate matter. The District Department of Public works currently cleans all streets several times a year. The mechanical street sweeping program currently operates from March to November.
A regenerative air street sweeper

Rock Creek Watershed Implementation Plan August 15, 2010 47
The District, through funding made available from the Stormwater Enterprise Fund, has already initiated a program to accelerate the purchase of high-efficiency street sweepers. This program will result in improved pollutant removal from street sweeping throughout the District and in the Rock Run watershed. In addition, DPW has recently completed a study of all regularly scheduled and signed street sweeping routes. The results of this study suggest that through improved route efficiency, on existing signed routes, DPW can expand mechanical sweeping, so called environmental sweeping, to other parts of the District. For the Rock Creek WIP load reduction model, we use a street sweeping scenario that assumes 20% of the streets in the MS4 areas of Rock Creek will be swept.
Erosion and Sediment Control Erosion and Sediment Control comes in two forms – strict regulations and inspection and enforcement. The District already has strong erosion and sediment control regulations in place – requiring that and land disturbance over 50 square feet apply for an erosion and sediment control permit. In comparison, other jurisdictions require these permits be filed when more than 5,000 square feet of soil are disturbed. Furthermore, the DDOE has published the District of Columbia Soil Erosion and Sediment Control Standards and Specifications and the DC Storm Water Management Guidebook. These documents are used by DDOE in the plan review process for new construction.
Federal facilities within the District are required to comply with District regulations under the Soil Erosion and Sediment Control Act. The US General Services Administration (GSA) and DDOE signed a consent agreement in fiscal year (FY) 2000 that requires work under contracts through GSA to comply with the same sediment and erosion control requirements as commercial, residential, and industrial operations in the District. In the same year, DDOT and WASA signed agreements, in an MOU between District agencies, requiring their contractors to comply with the same
sediment and erosion control requirements as commercial, residential, and industrial operations in the District. The District also has a strong inspection and enforcement branch that inspects construction sites throughout the District to make sure they are incompliance with District regulations. The need for expanded inspection and enforcement will be continually evaluated. DDOE also regularly inspects existing stormwater management facilities to ensure that they are in proper working order. For purposes of our load
Failing silt fencing at a construction site

Rock Creek Watershed Implementation Plan August 15, 2010 48
reduction model we assume that we will continue to have strong erosion and sediment control enforcement that will cover 90 percent of construction sites.
Illicit Discharge and Industrial Facility Inspection and Enforcement The District has already evaluated and expanded inspection and enforcement activities industrial facilities. The District will continue to evaluate and expand other inspection and enforcement activities to ensure compliance with District regulations and to minimize pollutant discharges to the Rock Creek watershed from these sources. The District has mapped MS4 and CSO outfalls and is inspecting each outfall for dry weather flow and conducting field evaluation of any flows observed. The expanded inspection program will result in the identification of a number of sites or facilities that are sources of pollution to the MS4 program. Owners of the sites or facilities will be required voluntarily or through enforcement actions to correct these sources of pollution. After a source of pollution is corrected, there is no further cost, and with the pollutant source removed, the benefit is continuous and cumulative each year. Removing polluting sources can collectively represent significant progress toward TMDL compliance.
Inspectors routinely visit auto service shops, dry cleaners, and car washes in the District to ensure compliance with Water Pollution Control Act regulations. Witnessing Water Pollution Control Act violations during an inspection, however, is rare. For this reason, education and outreach is an important component of this program. Inspectors work closely with these businesses to develop better housekeeping practices and ensure compliance with existing regulations (See Appendix B for examples of educational materials).
The District’s illicit discharge elimination program will be evaluated to identify potential improvements using the Center for Watershed Protection Guidance Manual for Illicit Discharge Detection and Elimination. This manual considers eight major components for developing an effective illicit discharge detection and elimination program. The eight major components are:
1. Audit existing city resources and programs 2. Establish responsibility, authority, and tracking 3. Complete a desktop assessment of illicit discharge 4. Develop program goals and implement strategies 5. Search for illicit discharge problems in the field 6. Isolate and correct discharges 7. Prevent illicit discharges
An outfall discharging during dry
weather

Rock Creek Watershed Implementation Plan August 15, 2010 49
8. Evaluate the program. After completing the evaluation of the illicit discharge elimination program, resources will be directed toward increased inspection and enforcement activities as necessary to reduce pollutant loading and towards compliance with the WLA in the TMDL documents. For purposes of our load reduction model we assume that acres inspected for illicit discharges will remain constant in the Rock Creek watershed over the long-term (30 years).
Public Roads and Alleyways The District Department of Transportation (DDOT) is responsible for maintaining streets, roads, alleyways and sidewalks in the city. DDOT has begun to adopt the use of Low Impact Development (LID) strategies to control stormwater and stormwater pollution. The city is currently demonstrating many types of LID including:
Infiltration tree box planters – tree boxes that accept runoff from sidewalks and roadways to treat the stormwater and provide water for the trees.
Silva Cells, structural soils, and other tree root expansion techniques – These tools help expand the space available for the growth of tree roots which allows for a larger and healthier tree and the greater potential for the uptake of stormwater and stormwater pollutants.
Bioretention – This can take the form of standard bioretention cells or bump outs into the street that are generally placed near intersections. These bump outs provide a safer crossing area for pedestrians by reducing the street area that they have to cross; they slow traffic by narrowing the road; and they accept runoff and treat stormwater pollution.
Permeable pavements – Permeable pavements take many forms including paving stones, porous concrete, and porous asphalt. The District is testing different permeable pavements in different applications such as alleyways, sidewalks, and roadways to determine which are appropriate and cost effective.
DDOT is also working to reduce pollutants to the city’s waterways by encouraging commuters to use alternative forms of transportation. DDOT is expanding the number of bike lanes in the city, installing bike-share racks, creating trolley and high speed bus lanes, and operating lower polluting hybrid and natural gas powered busses for its “Circulator” routes. For purposes of our load reduction model we propose that the public right of way will be retrofitted with LID at a rate consistent with the “aggressive” assumptions of Green Build-Out Model (GBOM) – a model of the
A Silva Cell being installed
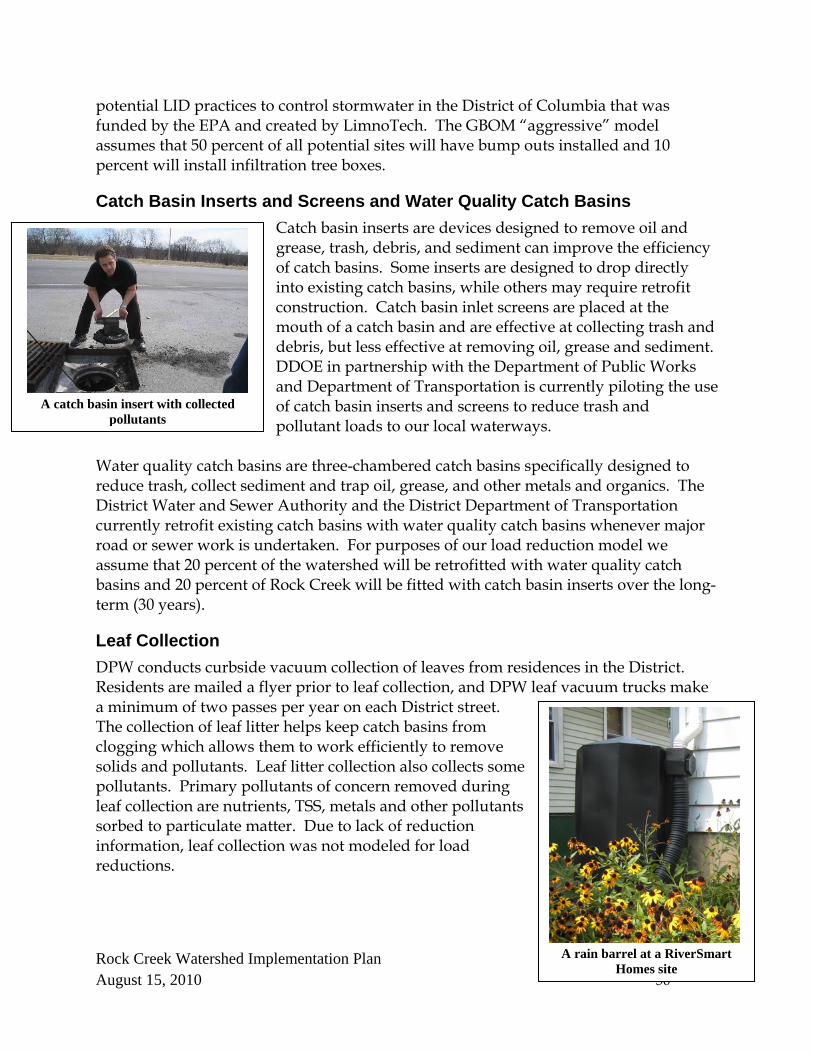
Rock Creek Watershed Implementation Plan August 15, 2010 50
potential LID practices to control stormwater in the District of Columbia that was funded by the EPA and created by LimnoTech. The GBOM “aggressive” model assumes that 50 percent of all potential sites will have bump outs installed and 10 percent will install infiltration tree boxes.
Catch Basin Inserts and Screens and Water Quality Catch Basins Catch basin inserts are devices designed to remove oil and grease, trash, debris, and sediment can improve the efficiency of catch basins. Some inserts are designed to drop directly into existing catch basins, while others may require retrofit construction. Catch basin inlet screens are placed at the mouth of a catch basin and are effective at collecting trash and debris, but less effective at removing oil, grease and sediment. DDOE in partnership with the Department of Public Works and Department of Transportation is currently piloting the use of catch basin inserts and screens to reduce trash and pollutant loads to our local waterways.
Water quality catch basins are three-chambered catch basins specifically designed to reduce trash, collect sediment and trap oil, grease, and other metals and organics. The District Water and Sewer Authority and the District Department of Transportation currently retrofit existing catch basins with water quality catch basins whenever major road or sewer work is undertaken. For purposes of our load reduction model we assume that 20 percent of the watershed will be retrofitted with water quality catch basins and 20 percent of Rock Creek will be fitted with catch basin inserts over the long-term (30 years).
Leaf Collection DPW conducts curbside vacuum collection of leaves from residences in the District. Residents are mailed a flyer prior to leaf collection, and DPW leaf vacuum trucks make a minimum of two passes per year on each District street. The collection of leaf litter helps keep catch basins from clogging which allows them to work efficiently to remove solids and pollutants. Leaf litter collection also collects some pollutants. Primary pollutants of concern removed during leaf collection are nutrients, TSS, metals and other pollutants sorbed to particulate matter. Due to lack of reduction information, leaf collection was not modeled for load reductions.
A rain barrel at a RiverSmart
Homes site
A catch basin insert with collected
pollutants
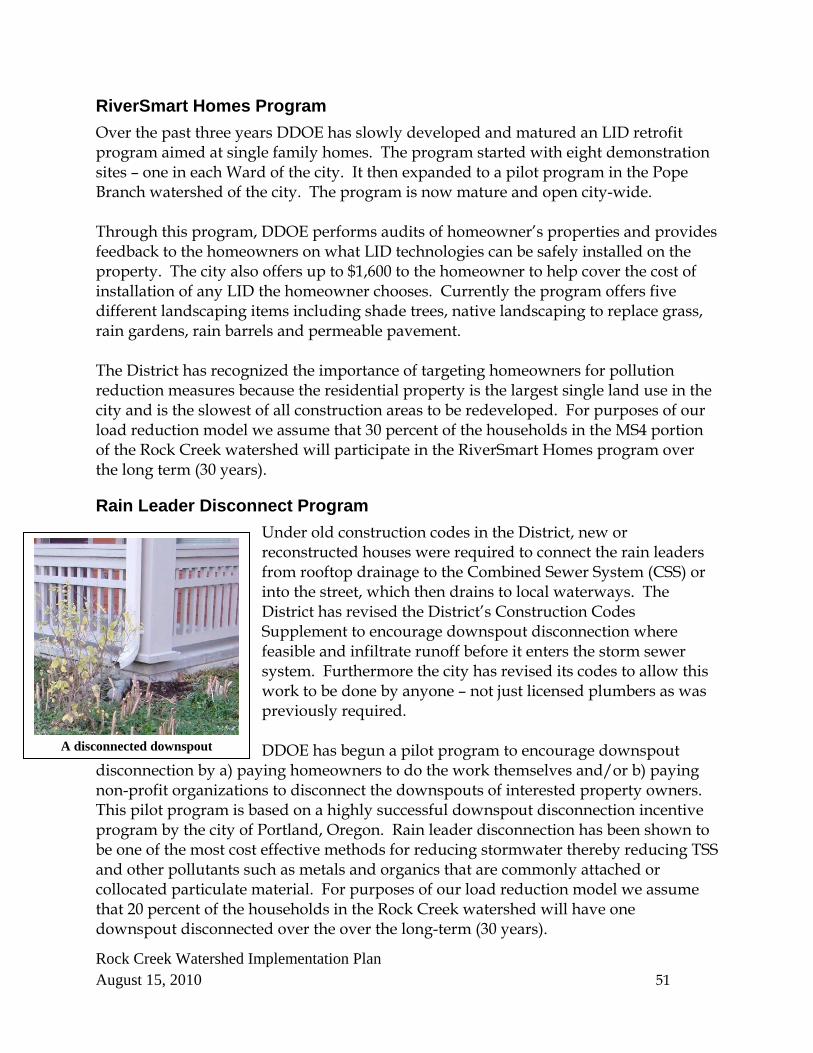
Rock Creek Watershed Implementation Plan August 15, 2010 51
RiverSmart Homes Program Over the past three years DDOE has slowly developed and matured an LID retrofit program aimed at single family homes. The program started with eight demonstration sites – one in each Ward of the city. It then expanded to a pilot program in the Pope Branch watershed of the city. The program is now mature and open city-wide. Through this program, DDOE performs audits of homeowner’s properties and provides feedback to the homeowners on what LID technologies can be safely installed on the property. The city also offers up to $1,600 to the homeowner to help cover the cost of installation of any LID the homeowner chooses. Currently the program offers five different landscaping items including shade trees, native landscaping to replace grass, rain gardens, rain barrels and permeable pavement. The District has recognized the importance of targeting homeowners for pollution reduction measures because the residential property is the largest single land use in the city and is the slowest of all construction areas to be redeveloped. For purposes of our load reduction model we assume that 30 percent of the households in the MS4 portion of the Rock Creek watershed will participate in the RiverSmart Homes program over the long term (30 years).
Rain Leader Disconnect Program Under old construction codes in the District, new or reconstructed houses were required to connect the rain leaders from rooftop drainage to the Combined Sewer System (CSS) or into the street, which then drains to local waterways. The District has revised the District’s Construction Codes Supplement to encourage downspout disconnection where feasible and infiltrate runoff before it enters the storm sewer system. Furthermore the city has revised its codes to allow this work to be done by anyone – not just licensed plumbers as was previously required. DDOE has begun a pilot program to encourage downspout
disconnection by a) paying homeowners to do the work themselves and/or b) paying non-profit organizations to disconnect the downspouts of interested property owners. This pilot program is based on a highly successful downspout disconnection incentive program by the city of Portland, Oregon. Rain leader disconnection has been shown to be one of the most cost effective methods for reducing stormwater thereby reducing TSS and other pollutants such as metals and organics that are commonly attached or collocated particulate material. For purposes of our load reduction model we assume that 20 percent of the households in the Rock Creek watershed will have one downspout disconnected over the over the long-term (30 years).
A disconnected downspout

Rock Creek Watershed Implementation Plan August 15, 2010 52
Green Roof Retrofit Program For the last two years the District has offered a rebate for installation of a new green roof or the retrofit of an existing roof. This program, offered through DDOE, provides $5 a square foot for the installation of a green roof on a new structure or existing roof less that 2,000 square feet in size (up to $20,000) and $7 a square foot for the retrofit of a green roof on older roofs over 2,000 square feet in size (no maximum dollar limit). Additionally the city has been aggressively retrofitting their existing rooftops with green roofs and installing vegetated roofs on new city-owned buildings. As a result of this push, Washington, DC is second only to Chicago in the square footage of green roofs installed. We envision that the city will continue this trend and we have adopted the assumptions of the “aggressive” GBOM model for our long term pollutant load reduction. GBOM calls for green roofs on 50 percent of rooftops with over 2,000 square feet to have green roofs.
Permeable Pavement As noted earlier, the District is testing different permeable pavements in to determine which are appropriate and cost effective for the public right of way. In addition to the use of permeable pavement in roads, alleys, and sidewalks, this technology has promise in commercial parking lot applications. Our model adopts the “aggressive” assumptions proposed in the Green Build Out Model of a 90% adoption rate for this technology in parking lots. We predict a high rate of acceptance for this land use partly because of the new storm water fee that has gone into effect in the last year. Previously parking lots did not pay a stormwater fee because the fee was assessed as a part of water use. Now the stormwater fee has been tied to impervious cover – something that greatly impacts parking lots. In the coming year property owners that undertake retrofits to reduce impervious surfaces will be able to reduce their stormwater fee by up to 50 percent.
Education of Public on Pet Wastes/Enforcement of Pet Waste Regulations DDOE has developed educational materials such as fliers and videos that inform citizens of their legal obligations to manage pet waste, proper application and disposal of fertilizers, and the use of landscaping to control storm water runoff. These materials are regularly distributed at public events such as community meetings, Earth Day celebrations, and community cleanup days. Furthermore this information is distributed door to door in communities where storm drain marking is taking place. Finally this information is available on the DDOE website.
A pervious paver patio

Rock Creek Watershed Implementation Plan August 15, 2010 53
The District has also begun installing dog parks in communities throughout the city. These dog parks are placed and designed to reduce the impact of pets on the environment while allowing dogs to play and exercise. Dog parks reduce TSS, nitrogen, phosphorous, and fecal coliform flowing to Rock Creek through their design and by the concentrating the impact of dogs in one area. Finally dog parks increase the compliance with pet waste regulations through peer pressure from other dog owners. Although education is important, enforcement of existing laws can be a stronger tool for reducing pet borne fecal coliform. Currently enforcement of pet waste and leash laws has been lax. Through this Watershed Implementation Plan enforcement efforts will be stepped up. For purposes of our load reduction model we assume that 80 percent of Rock Creek Park users and 20 percent of residential areas in the Rock Creek watershed will adopt pet waste collection over the long-term (30 years).
Household Hazardous Waste Collection and Disposal In the past, the District promoted the collection and disposal of household hazardous waste through twice annual collection days when residents may bring hazardous wastes for proper disposal. In the past year, DPW stepped up the household hazardous waste program and now residents can drop their hazardous wastes off at the Fort Totten waste transfer station any Saturday. The frequent and convenient collection of household hazardous waste is a low-cost and effective way to reduce organics and metals into Rock Creek. The collection of household hazardous waste was not modeled for pollutant load reductions.
Integrated Pest Management and Nutrient Management DDOE has developed an education and outreach program on Integrated Pest Management (IPM) and Nutrient Management. The purpose of the program is to better inform the public on the proper use and disposal of pesticides and on the use of safer alternatives. The program provides education and outreach activities designed to property owners and managers about environmentally sound practices with regard to the use of pesticides in the yard or garden and the introduction of “good” pests into the landscape. Through DDOE’s Nutrient Management Program, the property owners receive education regarding the proper amount of fertilizer to use on a lawn. In addition to fertilizer use, this program addresses the proper way to mow, use of mulch, and the effects of applying too much mulch. This management area focuses on the control of storm water pollutants originating from the use of pesticides, herbicides, and fertilizers within the District. Emphasis is placed on educational and training programs provided for both District property managers and private residents.

Rock Creek Watershed Implementation Plan August 15, 2010 54
Furthermore the DDOE Pesticide Management Program trains commercial applicators in the legal and safe appliance of pesticides and herbicides. Commercial applicators must receive a certification through the program to legally apply pesticides and herbicides in the District. A part of this program involves the use of IPM. The District Department of Real Estate Services has committed to utilize IPM and nutrient management on their properties and other District and Federal agencies are exploring similar efforts. For purposes of our load reduction model we assume that 100 percent of all industrial and commercial properties and 100 of all local and federal properties in the Rock Creek watershed will adopt IPM and nutrient management over the long-term (30 years).
Tree Planting The District of Columbia has been called “The City of Trees.” It has a tree canopy cover of 35 percent, which is high for a dense urban environment. The Urban Forestry Administration (UFA) maintains the city’s street trees pruning and planting to manage trees in a harsh environment of power and sewer lines, impervious surfaces, road salt, and punishing summer heat. UFA plants an average of 4150 trees annually, maintains the thousands of existing city trees, and works to improve growing conditions for street trees by removing unneeded impervious areas, experimenting with new tree box technology such as structural soils and Silva cells, and watering trees and pruning trees.
In addition, DDOE with help from non-profit partners such as Casey Trees and Washington Parks and People help plant trees on private, federal, and other District lands. Casey Trees, a non-profit dedicated solely to expanding and caring for the District’s tree canopy is an especially important partner. Casey runs community tree planting programs, a tree rebate program, and plants trees for RiverSmart Homes. Additionally Casey leads classes in the identification and care of trees and performs monitoring and modeling of canopy cover.
In 2009 the District committed to expand its canopy cover over the next 30 years. For the purposes of this WIP, we have adopted the assumptions of the “aggressive” GBOM model for our long term pollutant load reduction. GBOM calls for a 50 percent canopy cover in 30 years which will mean an approximate 10 percent increase in the Rock Creek Watershed. We assume that most of this tree planting will occur in areas outside of Rock Creek Park.
A river birch being planted
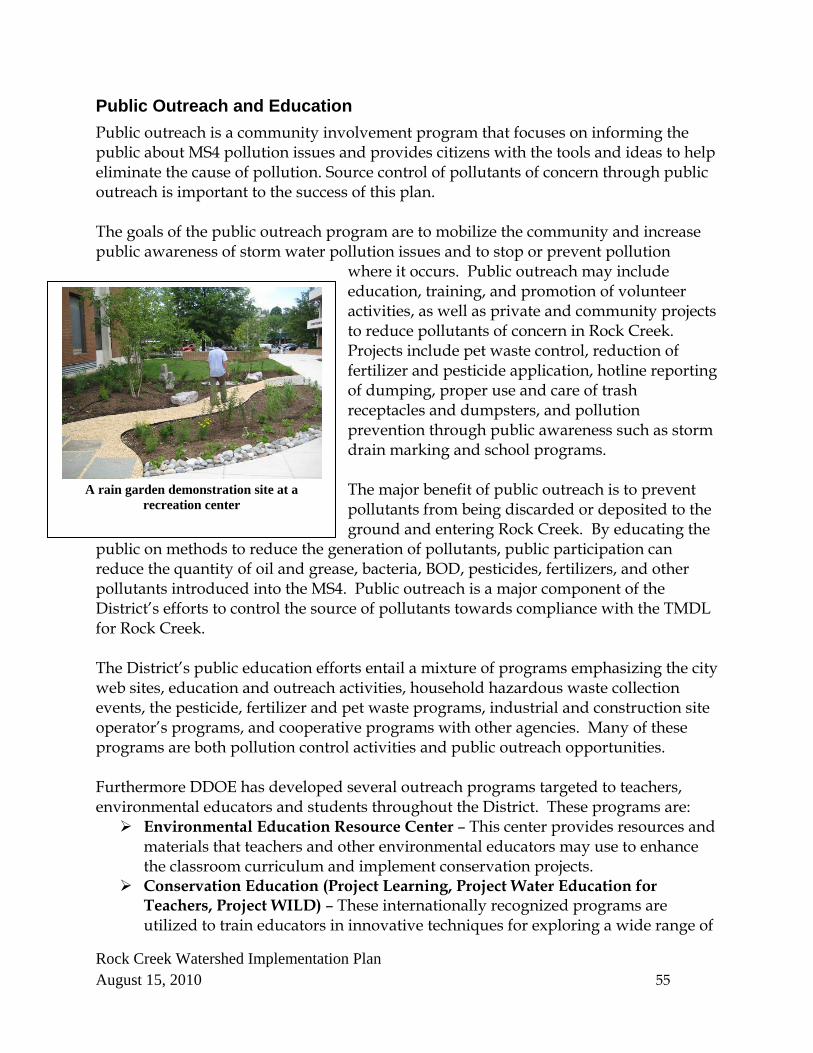
Rock Creek Watershed Implementation Plan August 15, 2010 55
Public Outreach and Education Public outreach is a community involvement program that focuses on informing the public about MS4 pollution issues and provides citizens with the tools and ideas to help eliminate the cause of pollution. Source control of pollutants of concern through public outreach is important to the success of this plan. The goals of the public outreach program are to mobilize the community and increase public awareness of storm water pollution issues and to stop or prevent pollution
where it occurs. Public outreach may include education, training, and promotion of volunteer activities, as well as private and community projects to reduce pollutants of concern in Rock Creek. Projects include pet waste control, reduction of fertilizer and pesticide application, hotline reporting of dumping, proper use and care of trash receptacles and dumpsters, and pollution prevention through public awareness such as storm drain marking and school programs. The major benefit of public outreach is to prevent pollutants from being discarded or deposited to the ground and entering Rock Creek. By educating the
public on methods to reduce the generation of pollutants, public participation can reduce the quantity of oil and grease, bacteria, BOD, pesticides, fertilizers, and other pollutants introduced into the MS4. Public outreach is a major component of the District’s efforts to control the source of pollutants towards compliance with the TMDL for Rock Creek. The District’s public education efforts entail a mixture of programs emphasizing the city web sites, education and outreach activities, household hazardous waste collection events, the pesticide, fertilizer and pet waste programs, industrial and construction site operator’s programs, and cooperative programs with other agencies. Many of these programs are both pollution control activities and public outreach opportunities. Furthermore DDOE has developed several outreach programs targeted to teachers, environmental educators and students throughout the District. These programs are:
Environmental Education Resource Center – This center provides resources and materials that teachers and other environmental educators may use to enhance the classroom curriculum and implement conservation projects.
Conservation Education (Project Learning, Project Water Education for Teachers, Project WILD) – These internationally recognized programs are utilized to train educators in innovative techniques for exploring a wide range of
A rain garden demonstration site at a
recreation center
Rock Creek Watershed Implementation Plan August 15, 2010 56
environmental concepts with students and teaching critical thinking skills that lead to environmental stewardship (grades K-12).
Teacher Training Workshops – These workshops assist teachers in meeting their teaching and learning standards while helping students develop environmental ethics and responsible stewardship.
RiverSmart Schools – RiverSmart schools works with applicant schools to install Low Impact Development (LID) practices to control stormwater. These practices are specially designed to be functional as well as educational in order to fit with the school environment. Additionally schools that take part in the RiverSmart Schools program receive teacher and site manager training on how to use the sites to teach to curriculum standards and how to properly maintain the site.
The District of Columbia Environmental Education Consortium – DDOE helps to organize a network of environmental educators throughout the city so that ideas and resources can be shared among them. DCEEC provides opportunities for networking, event coordination and program partnering among its members. They also facilitate professional development and educational opportunities that support required learning standards. The members provide environmental expertise, professional development opportunities, curricula and resources, and hands-on classroom and field studies to District schools.
Aquatic Resources Education Center (AREC) - Located in Anacostia Park, AREC has a variety of live exhibits of fish and other aquatic species from local rivers and surrounding environment. This unique partnership between the National Park Service, the Fish and Wildlife Service and DDOE affords school groups, teachers, and District residents to learn about the Aquatic Resources in the District. Stewardship of natural resources is a key component of the AREC curriculum.
DDOE also performs outreach to industrial and construction facilities through workshops, brochures, and site inspections. DDOE personnel use inspections to promote awareness of the proper methods of facility maintenance for stormwater regulation compliance. To aid facilities in ensuring proper maintenance of storm water management facilities, DDOE has established and published guidelines for their proper maintenance.
Coal Tar Ban Rock Creek has TMDLs for several types of organic chemicals including three classes of polycyclic aromatic hydrocarbons (PAHs) with a total reduction of 98% required for all three classes. One major source of PAHs throughout the watershed is coal-tar based pavement sealants. Coal-tar based pavement sealants have PAH concentrations that are 1,000 times greater than alternative asphalt-based sealants. Coal-tar sealants are applied to asphalt and pavement surfaces ostensibly to extend the life of that surface. The sealant, however, flakes off with ware and is washed away by stormwater or

Rock Creek Watershed Implementation Plan August 15, 2010 57
otherwise mobilized by winds. To address this issue the DC Council passed Comprehensive Stormwater Enhancement Amendment Act of 2008 that bans the sale and use of coal-tar based sealants within the District of Columbia. DDOE has mailed informational fliers about the ban to all District business that may sell these products and local and regional contractors who may use it. DDOE is in the process of hiring a full time inspector to augment the enforcement staff and focus on the coal tar ban.
District of Columbia Bag Bill Although Rock Creek does not have a TMDL for trash, trash is an issue in the watershed. One major component of trash in the stream is plastic bags. In an attempt to abate the amount of plastic bags reaching the District’s waterways the District Council passed the “Anacostia River Clean Up and Protection Act of 2009” which levies a 5 cent fee on each disposable paper and plastic bag sold at any business that sells food. The retailer retains 1 cent for administration and transfers the remaining 4 cents a restoration fund which is administered by DDOE. These funds are meant to pay for restoration activities in impaired watersheds in the District. Although the law has only been in effect since January 1, 2010, some businesses have reported over a 50% decline in the sale of disposable bags.
Specific Projects In the development of this Watershed Implementation Plan, DDOE staff spent the equivalent of several work weeks in the field searching for appropriate locations for the installation of Low Impact Development practices to reduce stormwater pollution to Rock Creek. Due to the large size of the Rock Creek watershed and the time available for this effort, DDOE’s effort concentrated on LID in the public space and in highly visible private property locations. Some additional projects on private property were added when the size of the property or its proximity to Rock Creek elevated its importance. Inventories of the identified projects are found in Appendices C through H of this document. The majority of these projects focus on three major pollution reducing practices: low impact development installation, stream restoration, and reforestation. In addition, other projects that benefit fish and wildlife were identified. These projects include removal of barriers to fish passage, trash reduction projects, and the installation or rehabilitation of wetlands. Many of the projects identified in this inventory will be among the first projects installed through the WIP effort, however not all the project identified will be installed in the coming years. Some projects will be found to be infeasible due to costs or unseen barriers to installation such as buried infrastructure or unwilling land owners. We do not utilize the load reductions from the specific projects identified in the course of our field work in calculating load reductions for the specific watersheds. Instead we calculate the load reductions solely on the
Bag bill educational
material
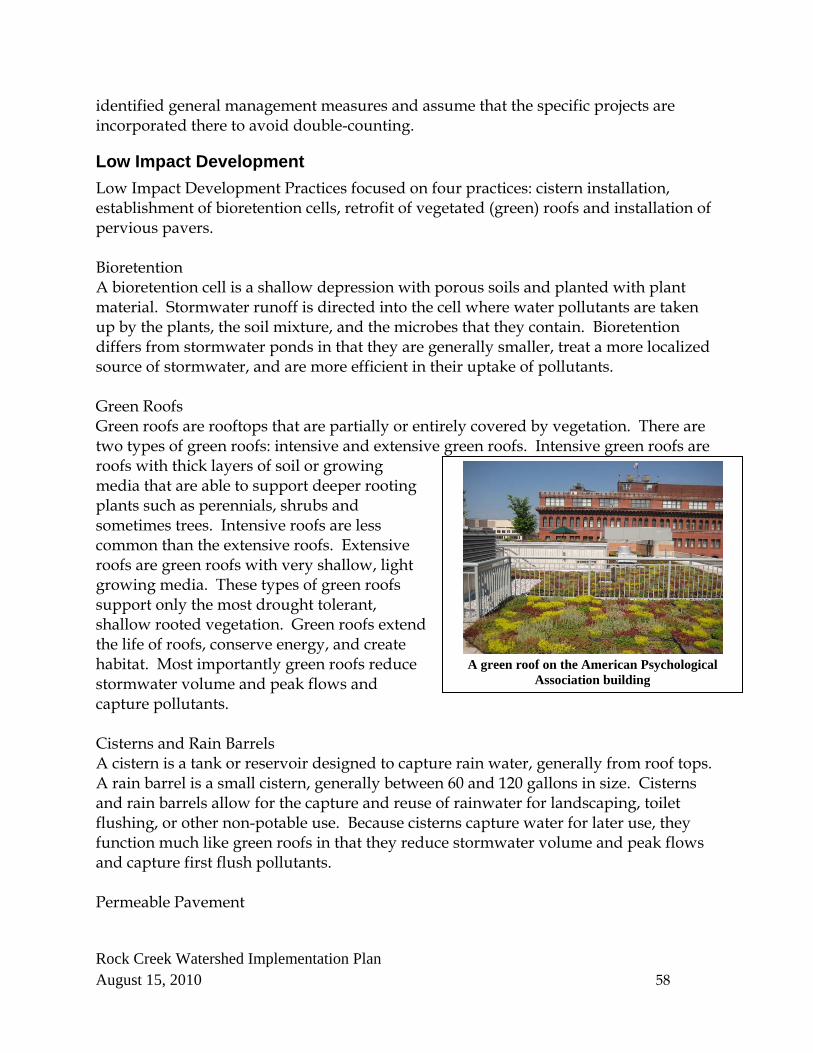
Rock Creek Watershed Implementation Plan August 15, 2010 58
identified general management measures and assume that the specific projects are incorporated there to avoid double-counting.
Low Impact Development Low Impact Development Practices focused on four practices: cistern installation, establishment of bioretention cells, retrofit of vegetated (green) roofs and installation of pervious pavers. Bioretention A bioretention cell is a shallow depression with porous soils and planted with plant material. Stormwater runoff is directed into the cell where water pollutants are taken up by the plants, the soil mixture, and the microbes that they contain. Bioretention differs from stormwater ponds in that they are generally smaller, treat a more localized source of stormwater, and are more efficient in their uptake of pollutants. Green Roofs Green roofs are rooftops that are partially or entirely covered by vegetation. There are two types of green roofs: intensive and extensive green roofs. Intensive green roofs are roofs with thick layers of soil or growing media that are able to support deeper rooting plants such as perennials, shrubs and sometimes trees. Intensive roofs are less common than the extensive roofs. Extensive roofs are green roofs with very shallow, light growing media. These types of green roofs support only the most drought tolerant, shallow rooted vegetation. Green roofs extend the life of roofs, conserve energy, and create habitat. Most importantly green roofs reduce stormwater volume and peak flows and capture pollutants. Cisterns and Rain Barrels A cistern is a tank or reservoir designed to capture rain water, generally from roof tops. A rain barrel is a small cistern, generally between 60 and 120 gallons in size. Cisterns and rain barrels allow for the capture and reuse of rainwater for landscaping, toilet flushing, or other non-potable use. Because cisterns capture water for later use, they function much like green roofs in that they reduce stormwater volume and peak flows and capture first flush pollutants. Permeable Pavement
A green roof on the American Psychological
Association building

Rock Creek Watershed Implementation Plan August 15, 2010 59
Permeable pavements take many forms including paving stones, porous concrete, and porous asphalt. These pavements are underlain by varying depths of compacted crushed stone. The crushed stone provides void space for rain water to filter down and eventually infiltrate into the soil while also creating a stable base for the paving stones. The depth of the crushed stone base will vary depending on the amount of stormwater the permeable pavement system will receive as well as the weight of the vehicles it must support and the frequency of the pavement’s use. We identified 366 individual LID projects in the Rock Creek watershed. All told, these projects could treat 1,325 acres of the watershed where there are currently no stormwater controls; this amount to about 10% of the District’s portion of the Rock Creek watershed. The cost of implementing these projects is estimated at approximately $70,000,000. Appendix A includes a map of the LID projects that we identified in our survey and Appendix C provides details about each individual project.
Stream Restoration Stream restoration is the act of modifying the current channel of a stream in an attempt to improve the environmental health and habitat of the waterway. Urban streams face immense pressure from high stormwater flows due to runoff from impervious surfaces. The erosion we see in urban streams is the stream’s way of adjusting to accommodate the new (geologically) flow regime it is experiencing. Stream restoration attempts to create a new channel that is in stasis with the flows it experiences. The District prefers the use of natural channel design techniques that protect stream banks, reduce erosion, and provide habitat for fish and wildlife. These techniques preferred over bank hardening such as the use of rip-rap, gabion baskets, and cement culverts. There are, however cases where high flows, human infrastructure, and threats to safety sometimes limit the use of natural stream channel design. Fortunately, Rock Creek and the majority of its tributaries are surrounded by large buffers of parkland (by urban standards) that provide space for the regarding of stream banks that is often required. A mixed blessing is the human infrastructure that is present in Rock Creek. The roads, paths, and sewer lines that are present create challenges for stream restoration, but their presence ensures that there is generally easy access to the stream by restoration equipment.
A regenerative stormwater conveyance just after
installation

Rock Creek Watershed Implementation Plan August 15, 2010 60
In our plan we identify 35 stream restoration projects at a potential cost of approximately $96,000,000. These projects are comprehensive in nature, given that every stream in Rock Creek is impacted by the affects of high stormwater flows from the impervious surfaces of our densely developed city. Over 21 miles of stream restoration are documented in this WIP and the LID projects proposed will also help stabilize stream valleys by reducing stormwater flows. A map of the stream restoration projects and details about each project can be found in Appendix D.
Reforestation and Riparian Buffers Urban trees have many known and quantified benefits. They have recently been touted as valuable tool for carbon sequestration. They are known to improve air quality, to cool their surroundings, to reduce energy consumption, and to provide valuable food and habitat for wildlife. Trees have documented human health benefits as well – from reducing asthma rates to improving mental health.
From the standpoint of this plan however, we focus on trees’ ability to reduce pollution. Trees reduce topsoil erosion, prevent harmful land pollutants contained in the soil from getting into our waterways, slow down water run-off, and help ensure that our groundwater supplies are continually being replenished. For every 5% of tree cover added to a community, stormwater runoff is reduced by approximately 2% (Coder, 1996). Along with breaking the fall of rainwater, tree roots remove nutrients harmful to water ecology and quality. Trees act as natural pollution filters - keeping particulate matter out of the flow toward the storm
sewers and reducing the flow of stormwater. Trees that make up a healthy riparian buffer also stabilize stream banks – reducing erosion caused by stormwater flows. They also cool streams – reducing the thermal shock streams can experience with stormwater flows. Finally riparian buffers provide valuable habitat to wildlife – especially in urban environments. In our survey, we found 151 sites for tree planting in the Rock Creek watershed. Conservatively, we estimate that these sites make up 106 acres of additional tree planting. The cost of planting these areas is estimated at $1,070,000 dollars. This estimate is likely low as it is based in large scale reforestation with saplings. Tree planting in urban environments often requires planting most costly older trees that can resist mowers, weed-eaters and other human impacts. With these costs, and the additional costs of watering and care for the larger trees, this cost estimate could easily
A riparian buffer planting at the National Zoo
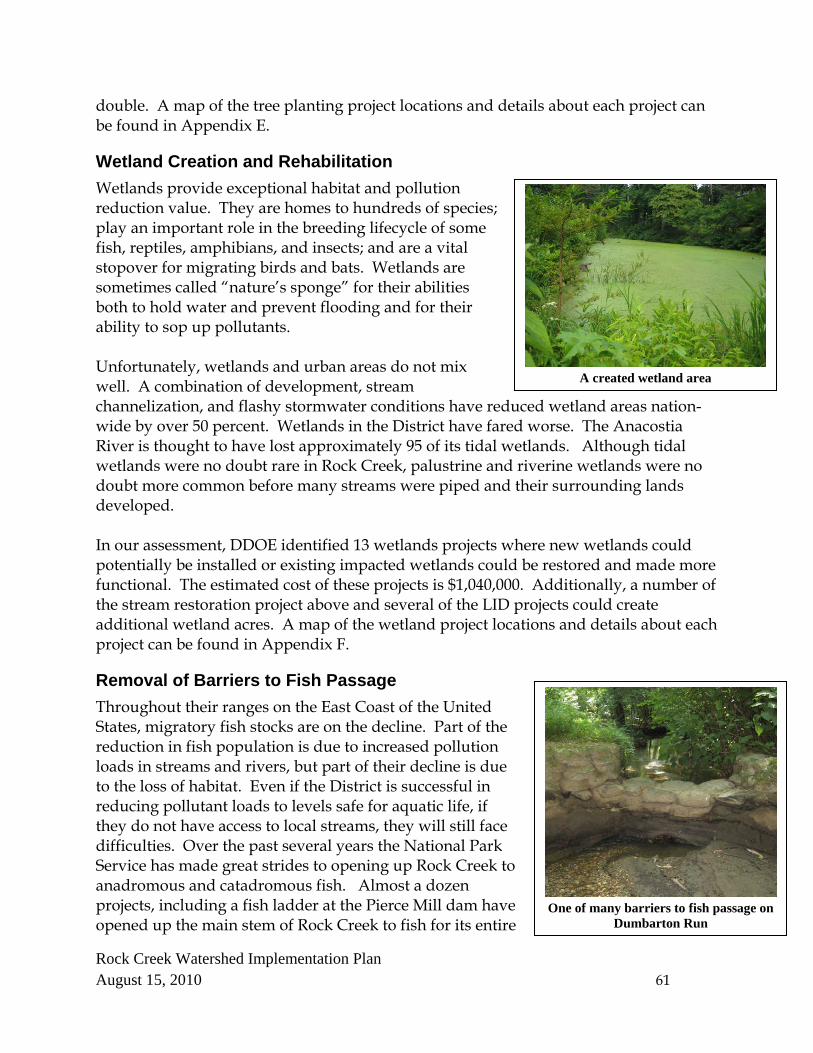
Rock Creek Watershed Implementation Plan August 15, 2010 61
double. A map of the tree planting project locations and details about each project can be found in Appendix E.
Wetland Creation and Rehabilitation Wetlands provide exceptional habitat and pollution reduction value. They are homes to hundreds of species; play an important role in the breeding lifecycle of some fish, reptiles, amphibians, and insects; and are a vital stopover for migrating birds and bats. Wetlands are sometimes called “nature’s sponge” for their abilities both to hold water and prevent flooding and for their ability to sop up pollutants. Unfortunately, wetlands and urban areas do not mix well. A combination of development, stream channelization, and flashy stormwater conditions have reduced wetland areas nation-wide by over 50 percent. Wetlands in the District have fared worse. The Anacostia River is thought to have lost approximately 95 of its tidal wetlands. Although tidal wetlands were no doubt rare in Rock Creek, palustrine and riverine wetlands were no doubt more common before many streams were piped and their surrounding lands developed. In our assessment, DDOE identified 13 wetlands projects where new wetlands could potentially be installed or existing impacted wetlands could be restored and made more functional. The estimated cost of these projects is $1,040,000. Additionally, a number of the stream restoration project above and several of the LID projects could create additional wetland acres. A map of the wetland project locations and details about each project can be found in Appendix F.
Removal of Barriers to Fish Passage Throughout their ranges on the East Coast of the United States, migratory fish stocks are on the decline. Part of the reduction in fish population is due to increased pollution loads in streams and rivers, but part of their decline is due to the loss of habitat. Even if the District is successful in reducing pollutant loads to levels safe for aquatic life, if they do not have access to local streams, they will still face difficulties. Over the past several years the National Park Service has made great strides to opening up Rock Creek to anadromous and catadromous fish. Almost a dozen projects, including a fish ladder at the Pierce Mill dam have opened up the main stem of Rock Creek to fish for its entire
A created wetland area
One of many barriers to fish passage on
Dumbarton Run

Rock Creek Watershed Implementation Plan August 15, 2010 62
length in the District. There are still many opportunities to provide additional habitat to fish, however. In our inventory, DDOE identified sixteen fish passage projects (some removing multiple barriers) that could open up more than forty thousand linear feet (7.6 miles of habitat) to fish. We estimate that the sum total cost of these projects at $3,630,000, however many of these projects could be relatively inexpensive and open up large areas to fish. A map of the fish passage project locations and details about each project can be found in Appendix G.
Trash Removal Trash removal, although having a minimal impact on pollutant loads, is an excellent activity for involving the public in restoration work and in generating watershed stewards. Through the inventory effort, WPD found that Rock Creek was surprisingly clean – with very little illegal dumping and only a few debris dams with loads of
floatable trash. DDOE did identify 29 locations for cleanup projects at a potential cost of $69,000 dollars if performed through contract or staff time. Many of these projects are small and could be easily and safely accomplished by teams of volunteers in one or two days. Some of the projects however, are more extensive involving unstable piles of dumped debris on steep slopes. These projects would require dedicated volunteers working over several weeks or months or trained individuals using machinery. A map of the trash removal project locations and details about project can be found in Appendix H.
Expected Load Reductions
Methodology for Calculating Load Reductions Reductions were calculated for metals, organics, and bacteria using reduction efficiencies as reported in the Rock Creek Watershed Total Maximum Daily Load Allocation Implementation Plan written in August 2005 by the District of Columbia Stormwater Administration. The TMDL loads in the District portion of Rock Creek watershed are assigned to the MS4 portion of the watershed (DOH, TMDL 2004). To calculate load reductions the reduction efficiency for the specific practice is multiplied by the area treated by the specific practice. For example, the reduction efficiency of porous pavement for lead has been estimated at 0.13 pounds per acre treated. In Piney Branch, we assume that over time 90% of all large parking lots will adopt the use of porous pavement, which amounts to a land area of five percent of the
Trash collected behind a downed tree on
Fenwick Branch

Rock Creek Watershed Implementation Plan August 15, 2010 63
watershed, or about 2.8 acres. So the load reduction calculation for lead from porous paving looks like this:
0.13 pounds/acre X 2.8 acres treated = 0.364 pound reduction of lead We then combined the calculated load reductions of all the management practices to determine the overall load reduction for each watershed. By comparing this number with the required load reduction from the 2004 TMDL, we were able to determine if we were able to meet our load reduction goals. As stated above, DDOE investigators identified 366 sites for LID, 35 potential stream restoration projects, 151 areas where tree planting could take place, and 13 possible wetlands restoration efforts. The total treatment area of these projects is over 2,000 acres, or almost twenty percent of the Rock Creek watershed. To avoid double counting, the specific projects that we identified are assumed to be a part of the efforts that will be installed though the general management measures. To determine load reductions for Rock Creek and its tributaries we utilized the assumptions outlined in the general management measures section of this document. The management practices were chosen for their cost benefit, ease of implementation, and environmental benefit.
Expected Load Reductions Using the general management measures described above and applying them to their assumed treatment areas, we were able to achieve the required load reductions for most pollutants for most tributaries. There were some pollutants where the load reductions were not achieved or were not calculated. Most notably, we are uncertain of the load reductions our proposed management measures will have on mercury because there are no reliable load reduction estimates for this metal. Furthermore, in every subwatershed except Dumbarton Oaks, the load reductions for Dieldrin were not achieved. We were unable to achieve the required load reductions for this chemical without setting the areas treated by the general management measures at unreasonably high levels.
Upper and Lower Rock Creek We used different strategies for load reductions in the main stem of Rock Creek than in its tributaries. This was necessary because, unlike its tributaries, the main stem has a TMDL for bacteria. To achieve the reductions needed to reach the waste load allocation for bacteria, a greater emphasis was put on adopting pet waste pickup. Furthermore, we assumed that a greater percentage of the main stem would be treated with bioretention. We believe that this mixture of behavior change and naturalistic stormwater treatment is appropriate because these segments of Rock Creek lie predominantly in Rock Creek Park where there is a greater concentration of dog walkers and a greater need for management measures that fit with the natural environment of the Park. Tables 8 and 9 detail the suggested scenarios for load reductions in Upper and Lower Rock Creek.

Rock Creek Watershed Implementation Plan August 15, 2010 64
Table 8: Load Reductions Achieved by Suggested Management Practices in Upper Rock Creek
*Note: Bacteria Reductions are in MPN/100 ml ^Note: Non‐attaining pollutants are highlighted in blue.
Management Practice
Bioretention Vacuum Sweeping
Porous Pavement
Tree Boxes
Catch Basin
Cleaning
Pollution Prevention
Plans
Erosion & Sediment Control
Illicit Discharge
Inspection & Enforcement
Water Quality Catch
Basins & Catch Basin Inserts
Integrated Pest
Management
Green Roofs
Pet Waste Pickup
Downspout Disconnection
Current Load
(lbs/year)
Reduction Needed
to Achieve TMDL
(lbs/year)
Reduction Achieved (lbs/year)
% Area Treated 60% of Watershed
20% of Watershed
90% of parking
lots (5% of Watershed)
15% Increase in
areas outside
NPS (50% canopy cover)
25% of Watershed
100% of District and
Federal Lands
90% of Lands Under Construction
90% of Total Land Area
40% of Watershed
100% of District and Federal Lands
50% of Roofs Over
2000 Square
Feet (6% of Watershed)
90% of Total Land
Area
20% of Total Land Area
Pollutant Reductions Expected (lbs/year)
Copper 3.426E+02 1.058E+02 2.750E+01 5.594E+01 1.005E+02 1.206E+02 3.617E+02 3.617E+02 1.607E+02 1.206E+02 2.411E+01 8.037E+01 8.037E+01 1.556E+02 0.000E+00 1.942E+03
Zinc 8.883E+02 2.623E+02 7.085E+01 1.459E+02 1.639E+02 1.967E+02 5.901E+02 5.901E+02 2.623E+02 1.967E+02 3.934E+01 1.311E+02 1.311E+02 3.468E+02 0.000E+00 3.669E+03
Mercury^ No Data No Data No Data No Data No Data No Data No Data No Data No Data No Data No Data No Data No Data 3.800E‐01 3.230E‐01 0.000E+00
Lead 1.523E+02 4.230E+01 1.375E+01 2.675E+01 5.288E+01 6.345E+01 1.904E+02 1.904E+02 8.460E+01 6.345E+01 1.269E+01 4.230E+01 4.230E+01 7.182E+01 6.177E+01 9.774E+02
Bacteria* 5.9516E+14 4.1877E+13 1.0469E+13 2.8108E+13 3.3047E+13 1.3198E+12 4.9681E+12 9.9172E+13 7.9355E+13 1.3198E+12 3.3121E+12 3.1788E+14 8.7984E+11 1.265E+15 1.202E+15 1.217E+15
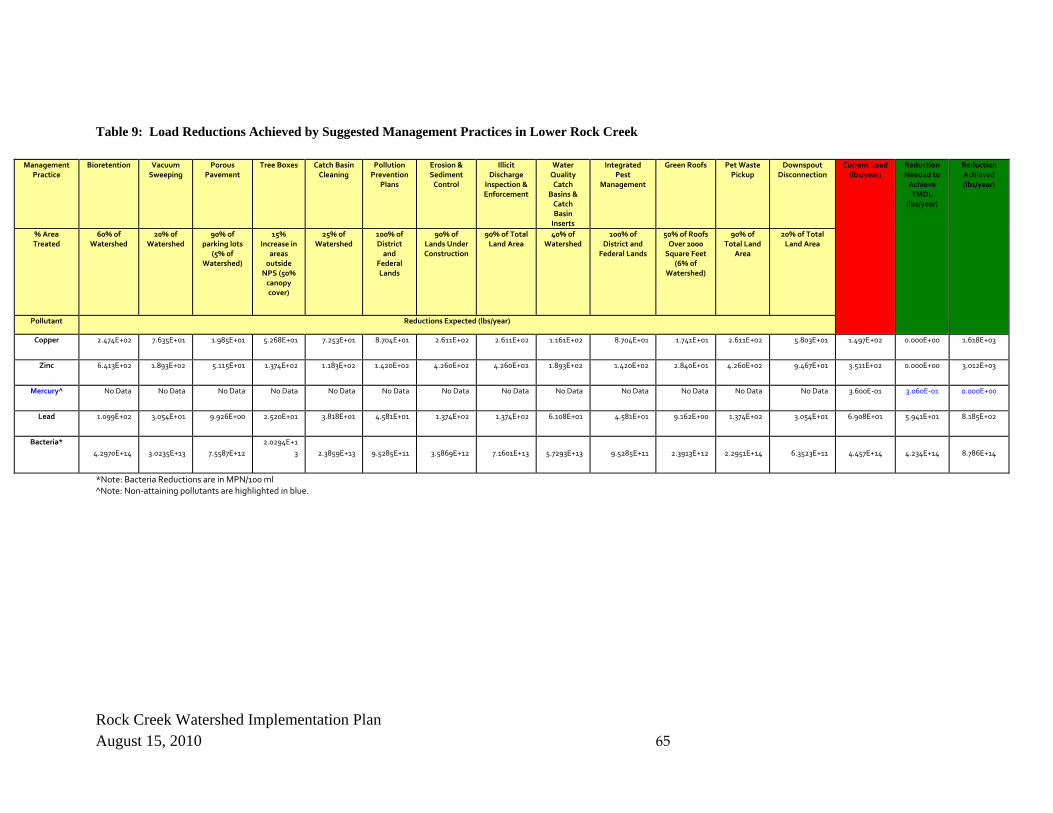
Rock Creek Watershed Implementation Plan August 15, 2010 65
Table 9: Load Reductions Achieved by Suggested Management Practices in Lower Rock Creek
*Note: Bacteria Reductions are in MPN/100 ml ^Note: Non‐attaining pollutants are highlighted in blue.
Management Practice
Bioretention Vacuum Sweeping
Porous Pavement
Tree Boxes Catch Basin Cleaning
Pollution Prevention
Plans
Erosion & Sediment Control
Illicit Discharge
Inspection & Enforcement
Water Quality Catch
Basins & Catch Basin Inserts
Integrated Pest
Management
Green Roofs Pet Waste Pickup
Downspout Disconnection
Current Load (lbs/year)
Reduction Needed to Achieve TMDL
(lbs/year)
Reduction Achieved (lbs/year)
% Area Treated
60% of Watershed
20% of Watershed
90% of parking lots
(5% of Watershed)
15% Increase in
areas outside
NPS (50% canopy cover)
25% of Watershed
100% of District and
Federal Lands
90% of Lands Under Construction
90% of Total Land Area
40% of Watershed
100% of District and
Federal Lands
50% of Roofs Over 2000 Square Feet
(6% of Watershed)
90% of Total Land
Area
20% of Total Land Area
Pollutant Reductions Expected (lbs/year)
Copper 2.474E+02 7.635E+01 1.985E+01 5.268E+01 7.253E+01 8.704E+01 2.611E+02 2.611E+02 1.161E+02 8.704E+01 1.741E+01 2.611E+02 5.803E+01 1.497E+02 0.000E+00 1.618E+03
Zinc 6.413E+02 1.893E+02 5.115E+01 1.374E+02 1.183E+02 1.420E+02 4.260E+02 4.260E+02 1.893E+02 1.420E+02 2.840E+01 4.260E+02 9.467E+01 3.511E+02 0.000E+00 3.012E+03
Mercury^ No Data No Data No Data No Data No Data No Data No Data No Data No Data No Data No Data No Data No Data 3.600E‐01 3.060E‐01 0.000E+00
Lead 1.099E+02 3.054E+01 9.926E+00 2.520E+01 3.818E+01 4.581E+01 1.374E+02 1.374E+02 6.108E+01 4.581E+01 9.162E+00 1.374E+02 3.054E+01 6.908E+01 5.941E+01 8.185E+02
Bacteria* 4.2970E+14 3.0235E+13 7.5587E+12
2.0294E+13 2.3859E+13 9.5285E+11 3.5869E+12 7.1601E+13 5.7293E+13 9.5285E+11 2.3913E+12 2.2951E+14 6.3523E+11 4.457E+14 4.234E+14 8.786E+14

Rock Creek Watershed Implementation Plan August 15, 2010 66
Tributaries to Rock Creek With the exception of the Piney Branch watershed, all of Rock Creek’s tributaries have the same water quality impairments – ten different persistent organic chemicals. In the case of Piney Branch, it is listed as impaired for these ten chemicals and four metals: lead, copper, zinc, and arsenic. In the suggested load reduction scenarios for the tributaries to Rock Creek, we balance structural load reduction methods such as bioretention, porous pavement, and green roofs, non-structural techniques such as catch basin cleaning, vacuum sweeping, integrated pest management, and pet waste pickup. In all, we utilize thirteen different methods to optimize load reductions to the tributaries. Tables 10 through 21 demonstrate the suggested scenarios for load reductions in the tributaries to Rock Creek. Load reductions charts for each general management practice and each watershed can be found in Appendix I.
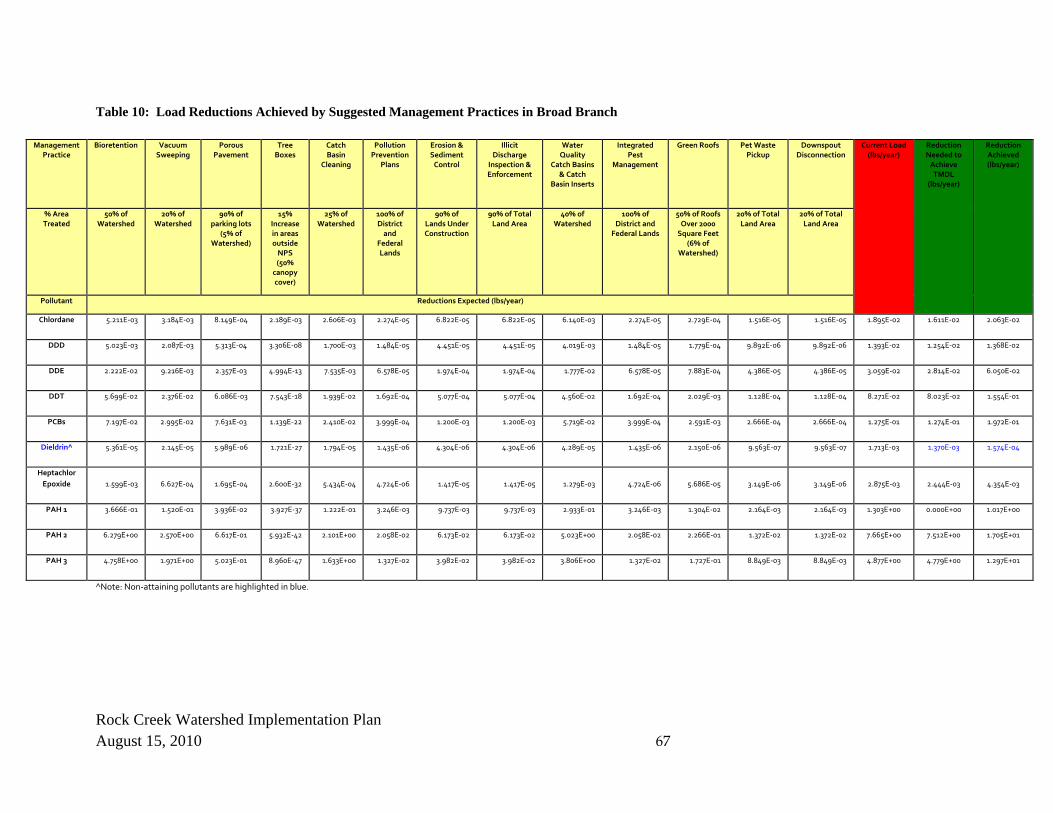
Rock Creek Watershed Implementation Plan August 15, 2010 67
Table 10: Load Reductions Achieved by Suggested Management Practices in Broad Branch
^Note: Non‐attaining pollutants are highlighted in blue.
Management Practice
Bioretention Vacuum Sweeping
Porous Pavement
Tree Boxes
Catch Basin
Cleaning
Pollution Prevention
Plans
Erosion & Sediment Control
Illicit Discharge
Inspection & Enforcement
Water Quality
Catch Basins & Catch
Basin Inserts
Integrated Pest
Management
Green Roofs Pet Waste Pickup
Downspout Disconnection
Current Load (lbs/year)
Reduction Needed to Achieve TMDL
(lbs/year)
Reduction Achieved (lbs/year)
% Area Treated
50% of Watershed
20% of Watershed
90% of parking lots
(5% of Watershed)
15% Increase in areas outside NPS (50%
canopy cover)
25% of Watershed
100% of District and
Federal Lands
90% of Lands Under Construction
90% of Total Land Area
40% of Watershed
100% of District and
Federal Lands
50% of Roofs Over 2000 Square Feet
(6% of Watershed)
20% of Total Land Area
20% of Total Land Area
Pollutant Reductions Expected (lbs/year)
Chlordane 5.211E‐03 3.184E‐03 8.149E‐04 2.189E‐03 2.606E‐03 2.274E‐05 6.822E‐05 6.822E‐05 6.140E‐03 2.274E‐05 2.729E‐04 1.516E‐05 1.516E‐05 1.895E‐02 1.611E‐02 2.063E‐02
DDD 5.023E‐03 2.087E‐03 5.313E‐04 3.306E‐08 1.700E‐03 1.484E‐05 4.451E‐05 4.451E‐05 4.019E‐03 1.484E‐05 1.779E‐04 9.892E‐06 9.892E‐06 1.393E‐02 1.254E‐02 1.368E‐02
DDE 2.222E‐02 9.216E‐03 2.357E‐03 4.994E‐13 7.535E‐03 6.578E‐05 1.974E‐04 1.974E‐04 1.777E‐02 6.578E‐05 7.883E‐04 4.386E‐05 4.386E‐05 3.059E‐02 2.814E‐02 6.050E‐02
DDT 5.699E‐02 2.376E‐02 6.086E‐03 7.543E‐18 1.939E‐02 1.692E‐04 5.077E‐04 5.077E‐04 4.560E‐02 1.692E‐04 2.029E‐03 1.128E‐04 1.128E‐04 8.271E‐02 8.023E‐02 1.554E‐01
PCBs 7.197E‐02 2.995E‐02 7.631E‐03 1.139E‐22 2.410E‐02 3.999E‐04 1.200E‐03 1.200E‐03 5.719E‐02 3.999E‐04 2.591E‐03 2.666E‐04 2.666E‐04 1.275E‐01 1.274E‐01 1.972E‐01
Dieldrin^ 5.361E‐05 2.145E‐05 5.989E‐06 1.721E‐27 1.794E‐05 1.435E‐06 4.304E‐06 4.304E‐06 4.289E‐05 1.435E‐06 2.150E‐06 9.563E‐07 9.563E‐07 1.713E‐03 1.370E‐03 1.574E‐04
Heptachlor Epoxide 1.599E‐03 6.627E‐04 1.695E‐04 2.600E‐32 5.434E‐04 4.724E‐06 1.417E‐05 1.417E‐05 1.279E‐03 4.724E‐06 5.686E‐05 3.149E‐06 3.149E‐06 2.875E‐03 2.444E‐03 4.354E‐03
PAH 1 3.666E‐01 1.520E‐01 3.936E‐02 3.927E‐37 1.222E‐01 3.246E‐03 9.737E‐03 9.737E‐03 2.933E‐01 3.246E‐03 1.304E‐02 2.164E‐03 2.164E‐03 1.303E+00 0.000E+00 1.017E+00
PAH 2 6.279E+00 2.570E+00 6.617E‐01 5.932E‐42 2.101E+00 2.058E‐02 6.173E‐02 6.173E‐02 5.023E+00 2.058E‐02 2.266E‐01 1.372E‐02 1.372E‐02 7.665E+00 7.512E+00 1.705E+01
PAH 3 4.758E+00 1.971E+00 5.023E‐01 8.960E‐47 1.633E+00 1.327E‐02 3.982E‐02 3.982E‐02 3.806E+00 1.327E‐02 1.727E‐01 8.849E‐03 8.849E‐03 4.877E+00 4.779E+00 1.297E+01

Rock Creek Watershed Implementation Plan August 15, 2010 68
Table 11: Load Reductions Achieved by Suggested Management Practices in Dumbarton Oaks
Management Practice
Bioretention Vacuum Sweeping
Porous Pavement
Tree Boxes
Catch Basin
Cleaning
Pollution Prevention
Plans
Erosion & Sediment Control
Illicit Discharge
Inspection & Enforcement
Water Quality Catch
Basins & Catch Basin Inserts
Integrated Pest
Management
Green Roofs
Pet Waste Pickup
Downspout Disconnection
Current Load (lbs/year)
Reduction Needed to Achieve TMDL
(lbs/year)
Reduction Achieved (lbs/year)
% Area Treated
50% of Watershed
20% of Watershed
90% of parking
lots (5% of Watershed)
15% Increase in areas outside NPS (50%
canopy cover)
25% of Watershed
100% of District and
Federal Lands
90% of Lands Under Construction
90% of Total Land Area
40% of Watershed
100% of District and Federal Lands
50% of Roofs Over
2000 Square
Feet (6% of Watershed)
20% of Total Land Area
20% of Total Land Area
Pollutant Reductions Expected (lbs/year)
Chlordane 1.153E‐04 7.044E‐05 1.803E‐05 4.843E‐05 5.765E‐05 5.032E‐07 1.509E‐06 1.509E‐06 1.359E‐04 5.032E‐07 6.038E‐06 3.354E‐07 3.354E‐07 4.193E‐04 3.564E‐04 4.564E‐04
DDD 1.071E‐03 4.450E‐04 1.133E‐04 3.047E‐04 3.626E‐04 3.164E‐06 9.492E‐06 9.492E‐06 8.570E‐04 3.164E‐06 3.795E‐05 2.109E‐06 2.109E‐06 2.426E‐04 2.183E‐04 3.221E‐03
DDE 4.738E‐03 1.965E‐03 5.026E‐04 1.350E‐03 1.607E‐03 1.403E‐05 4.209E‐05 4.209E‐05 3.790E‐03 1.403E‐05 1.681E‐04 9.352E‐06 9.352E‐06 6.369E‐04 5.859E‐04 1.425E‐02
DDT 1.215E‐02 5.068E‐03 1.298E‐03 3.461E‐03 4.135E‐03 3.609E‐05 1.083E‐04 1.083E‐04 9.723E‐03 3.609E‐05 4.326E‐04 2.406E‐05 2.406E‐05 1.432E‐03 1.389E‐03 3.661E‐02
PCBs 1.535E‐02 6.386E‐03 1.277E‐06 4.357E‐03 5.140E‐03 8.528E‐05 2.559E‐04 2.559E‐04 1.220E‐02 8.528E‐05 5.525E‐04 5.686E‐05 5.686E‐05 2.736E‐03 2.733E‐03 4.477E‐02
Dieldrin 1.143E‐05 4.573E‐06 3.615E‐05 3.430E‐06 3.826E‐06 3.059E‐07 9.177E‐07 9.177E‐07 9.146E‐06 3.059E‐07 4.586E‐07 2.039E‐07 2.039E‐07 2.860E‐05 2.288E‐05 7.188E‐05
Heptachlor Epoxide 3.409E‐04 1.413E‐04 8.395E‐03 9.734E‐05 1.159E‐04 1.007E‐06 3.022E‐06 3.022E‐06 2.727E‐04 1.007E‐06 1.213E‐05 6.716E‐07 6.716E‐07 5.532E‐05 4.979E‐05 9.384E‐03
PAH 1 7.818E‐02 3.242E‐02 1.411E‐01 2.259E‐02 2.606E‐02 6.922E‐04 2.076E‐03 2.076E‐03 6.254E‐02 6.922E‐04 2.781E‐03 4.614E‐04 4.614E‐04 2.856E‐02 0.000E+00 3.721E‐01
PAH 2 1.339E+00 5.480E‐01 1.071E‐01 3.801E‐01 4.481E‐01 4.388E‐03 1.316E‐02 1.316E‐02 1.071E+00 4.388E‐03 4.833E‐02 2.925E‐03 2.925E‐03 1.724E‐01 1.690E‐01 3.983E+00
PAH 3 1.015E+00 4.202E‐01 1.627E‐03 2.902E‐01 3.481E‐01 2.830E‐03 8.491E‐03 8.491E‐03 8.116E‐01 2.830E‐03 3.683E‐02 1.887E‐03 1.887E‐03 1.103E‐01 1.081E‐01 2.950E+00
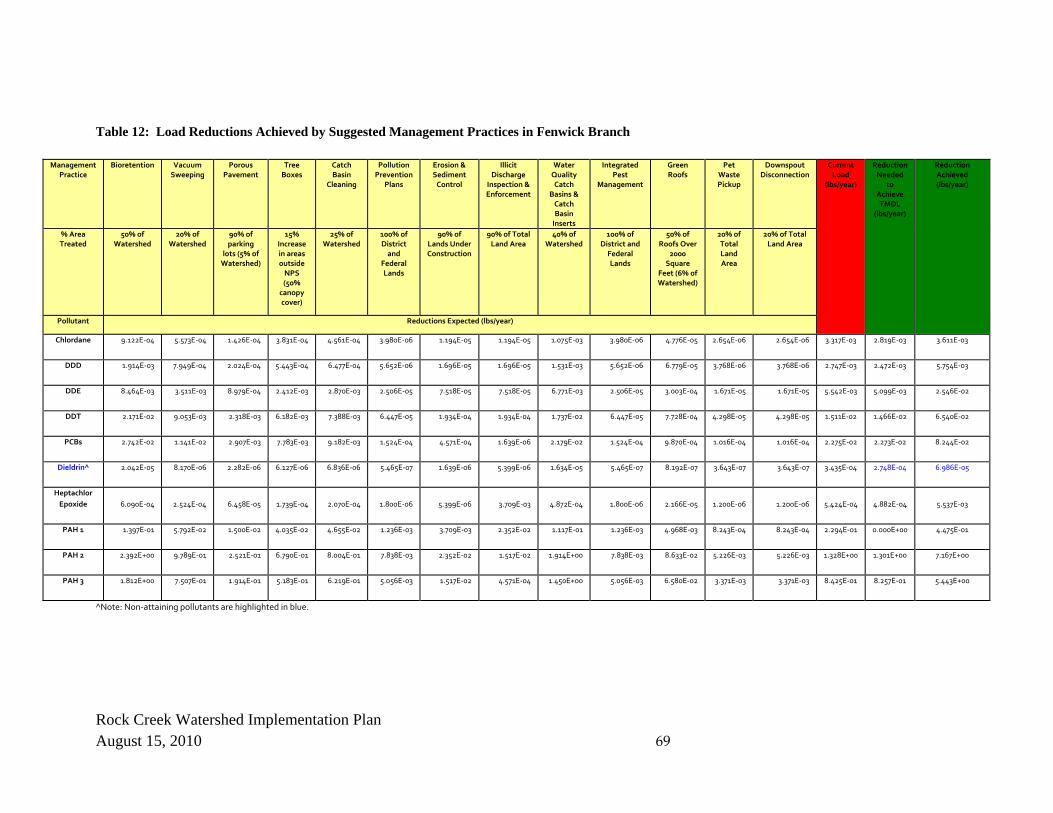
Rock Creek Watershed Implementation Plan August 15, 2010 69
Table 12: Load Reductions Achieved by Suggested Management Practices in Fenwick Branch
^Note: Non‐attaining pollutants are highlighted in blue.
Management Practice
Bioretention Vacuum Sweeping
Porous Pavement
Tree Boxes
Catch Basin
Cleaning
Pollution Prevention
Plans
Erosion & Sediment Control
Illicit Discharge
Inspection & Enforcement
Water Quality Catch
Basins & Catch Basin Inserts
Integrated Pest
Management
Green Roofs
Pet Waste Pickup
Downspout Disconnection
Current Load
(lbs/year)
Reduction Needed
to Achieve TMDL
(lbs/year)
Reduction Achieved (lbs/year)
% Area Treated
50% of Watershed
20% of Watershed
90% of parking
lots (5% of Watershed)
15% Increase in areas outside NPS (50%
canopy cover)
25% of Watershed
100% of District and
Federal Lands
90% of Lands Under Construction
90% of Total Land Area
40% of Watershed
100% of District and Federal Lands
50% of Roofs Over
2000 Square
Feet (6% of Watershed)
20% of Total Land Area
20% of Total Land Area
Pollutant Reductions Expected (lbs/year)
Chlordane 9.122E‐04 5.573E‐04 1.426E‐04 3.831E‐04 4.561E‐04 3.980E‐06 1.194E‐05 1.194E‐05 1.075E‐03 3.980E‐06 4.776E‐05 2.654E‐06 2.654E‐06 3.317E‐03 2.819E‐03 3.611E‐03
DDD 1.914E‐03 7.949E‐04 2.024E‐04 5.443E‐04 6.477E‐04 5.652E‐06 1.696E‐05 1.696E‐05 1.531E‐03 5.652E‐06 6.779E‐05 3.768E‐06 3.768E‐06 2.747E‐03 2.472E‐03 5.754E‐03
DDE 8.464E‐03 3.511E‐03 8.979E‐04 2.412E‐03 2.870E‐03 2.506E‐05 7.518E‐05 7.518E‐05 6.771E‐03 2.506E‐05 3.003E‐04 1.671E‐05 1.671E‐05 5.542E‐03 5.099E‐03 2.546E‐02
DDT 2.171E‐02 9.053E‐03 2.318E‐03 6.182E‐03 7.388E‐03 6.447E‐05 1.934E‐04 1.934E‐04 1.737E‐02 6.447E‐05 7.728E‐04 4.298E‐05 4.298E‐05 1.511E‐02 1.466E‐02 6.540E‐02
PCBs 2.742E‐02 1.141E‐02 2.907E‐03 7.783E‐03 9.182E‐03 1.524E‐04 4.571E‐04 1.639E‐06 2.179E‐02 1.524E‐04 9.870E‐04 1.016E‐04 1.016E‐04 2.275E‐02 2.273E‐02 8.244E‐02
Dieldrin^ 2.042E‐05 8.170E‐06 2.282E‐06 6.127E‐06 6.836E‐06 5.465E‐07 1.639E‐06 5.399E‐06 1.634E‐05 5.465E‐07 8.192E‐07 3.643E‐07 3.643E‐07 3.435E‐04 2.748E‐04 6.986E‐05
Heptachlor Epoxide 6.090E‐04 2.524E‐04 6.458E‐05 1.739E‐04 2.070E‐04 1.800E‐06 5.399E‐06 3.709E‐03 4.872E‐04 1.800E‐06 2.166E‐05 1.200E‐06 1.200E‐06 5.424E‐04 4.882E‐04 5.537E‐03
PAH 1 1.397E‐01 5.792E‐02 1.500E‐02 4.035E‐02 4.655E‐02 1.236E‐03 3.709E‐03 2.352E‐02 1.117E‐01 1.236E‐03 4.968E‐03 8.243E‐04 8.243E‐04 2.294E‐01 0.000E+00 4.475E‐01
PAH 2 2.392E+00 9.789E‐01 2.521E‐01 6.790E‐01 8.004E‐01 7.838E‐03 2.352E‐02 1.517E‐02 1.914E+00 7.838E‐03 8.633E‐02 5.226E‐03 5.226E‐03 1.328E+00 1.301E+00 7.167E+00
PAH 3 1.812E+00 7.507E‐01 1.914E‐01 5.183E‐01 6.219E‐01 5.056E‐03 1.517E‐02 4.571E‐04 1.450E+00 5.056E‐03 6.580E‐02 3.371E‐03 3.371E‐03 8.425E‐01 8.257E‐01 5.443E+00
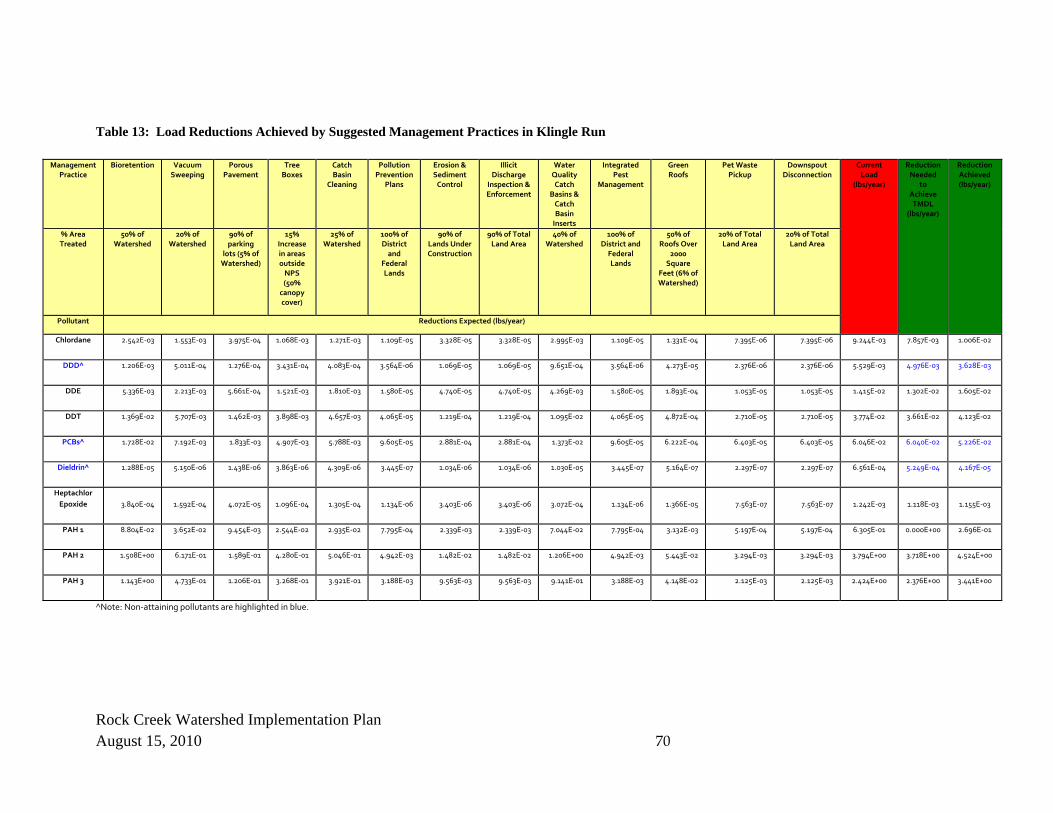
Rock Creek Watershed Implementation Plan August 15, 2010 70
Table 13: Load Reductions Achieved by Suggested Management Practices in Klingle Run
^Note: Non‐attaining pollutants are highlighted in blue.
Management Practice
Bioretention Vacuum Sweeping
Porous Pavement
Tree Boxes
Catch Basin
Cleaning
Pollution Prevention
Plans
Erosion & Sediment Control
Illicit Discharge
Inspection & Enforcement
Water Quality Catch
Basins & Catch Basin Inserts
Integrated Pest
Management
Green Roofs
Pet Waste Pickup
Downspout Disconnection
Current Load
(lbs/year)
Reduction Needed
to Achieve TMDL
(lbs/year)
Reduction Achieved (lbs/year)
% Area Treated
50% of Watershed
20% of Watershed
90% of parking
lots (5% of Watershed)
15% Increase in areas outside NPS (50%
canopy cover)
25% of Watershed
100% of District and
Federal Lands
90% of Lands Under Construction
90% of Total Land Area
40% of Watershed
100% of District and Federal Lands
50% of Roofs Over
2000 Square
Feet (6% of Watershed)
20% of Total Land Area
20% of Total Land Area
Pollutant Reductions Expected (lbs/year)
Chlordane 2.542E‐03 1.553E‐03 3.975E‐04 1.068E‐03 1.271E‐03 1.109E‐05 3.328E‐05 3.328E‐05 2.995E‐03 1.109E‐05 1.331E‐04 7.395E‐06 7.395E‐06 9.244E‐03 7.857E‐03 1.006E‐02
DDD^ 1.206E‐03 5.011E‐04 1.276E‐04 3.431E‐04 4.083E‐04 3.564E‐06 1.069E‐05 1.069E‐05 9.651E‐04 3.564E‐06 4.273E‐05 2.376E‐06 2.376E‐06 5.529E‐03 4.976E‐03 3.628E‐03
DDE 5.336E‐03 2.213E‐03 5.661E‐04 1.521E‐03 1.810E‐03 1.580E‐05 4.740E‐05 4.740E‐05 4.269E‐03 1.580E‐05 1.893E‐04 1.053E‐05 1.053E‐05 1.415E‐02 1.302E‐02 1.605E‐02
DDT 1.369E‐02 5.707E‐03 1.462E‐03 3.898E‐03 4.657E‐03 4.065E‐05 1.219E‐04 1.219E‐04 1.095E‐02 4.065E‐05 4.872E‐04 2.710E‐05 2.710E‐05 3.774E‐02 3.661E‐02 4.123E‐02
PCBs^ 1.728E‐02 7.192E‐03 1.833E‐03 4.907E‐03 5.788E‐03 9.605E‐05 2.881E‐04 2.881E‐04 1.373E‐02 9.605E‐05 6.222E‐04 6.403E‐05 6.403E‐05 6.046E‐02 6.040E‐02 5.226E‐02
Dieldrin^ 1.288E‐05 5.150E‐06 1.438E‐06 3.863E‐06 4.309E‐06 3.445E‐07 1.034E‐06 1.034E‐06 1.030E‐05 3.445E‐07 5.164E‐07 2.297E‐07 2.297E‐07 6.561E‐04 5.249E‐04 4.167E‐05
Heptachlor Epoxide 3.840E‐04 1.592E‐04 4.072E‐05 1.096E‐04 1.305E‐04 1.134E‐06 3.403E‐06 3.403E‐06 3.072E‐04 1.134E‐06 1.366E‐05 7.563E‐07 7.563E‐07 1.242E‐03 1.118E‐03 1.155E‐03
PAH 1 8.804E‐02 3.652E‐02 9.454E‐03 2.544E‐02 2.935E‐02 7.795E‐04 2.339E‐03 2.339E‐03 7.044E‐02 7.795E‐04 3.132E‐03 5.197E‐04 5.197E‐04 6.305E‐01 0.000E+00 2.696E‐01
PAH 2 1.508E+00 6.171E‐01 1.589E‐01 4.280E‐01 5.046E‐01 4.942E‐03 1.482E‐02 1.482E‐02 1.206E+00 4.942E‐03 5.443E‐02 3.294E‐03 3.294E‐03 3.794E+00 3.718E+00 4.524E+00
PAH 3 1.143E+00 4.733E‐01 1.206E‐01 3.268E‐01 3.921E‐01 3.188E‐03 9.563E‐03 9.563E‐03 9.141E‐01 3.188E‐03 4.148E‐02 2.125E‐03 2.125E‐03 2.424E+00 2.376E+00 3.441E+00

Rock Creek Watershed Implementation Plan August 15, 2010 71
Table 14: Load Reductions Achieved by Suggested Management Practices in Luzon Creek
^Note: Non‐attaining pollutants are highlighted in blue.
Management Practice
Bioretention Vacuum Sweeping
Porous Pavement
Tree Boxes
Catch Basin
Cleaning
Pollution Prevention
Plans
Erosion & Sediment Control
Illicit Discharge
Inspection & Enforcement
Water Quality Catch
Basins & Catch Basin Inserts
Integrated Pest
Management
Green Roofs
Pet Waste Pickup
Downspout Disconnection
Current Load
(lbs/year)
Reduction Needed
to Achieve TMDL
(lbs/year)
Reduction Achieved (lbs/year)
% Area Treated
50% of Watershed
20% of Watershed
90% of parking
lots (5% of Watershed)
15% Increase in areas outside
NPS (50% canopy cover)
25% of Watershed
100% of District and
Federal Lands
90% of Lands Under Construction
90% of Total Land Area
40% of Watershed
100% of District and Federal Lands
50% of Roofs Over
2000 Square
Feet (6% of Watershed)
20% of Total Land Area
20% of Total Land Area
Pollutant Reductions Expected (lbs/year)
Chlordane 8.872E‐04 5.420E‐04 1.387E‐04 3.726E‐04 4.436E‐04 3.871E‐06 1.161E‐05 1.161E‐05 1.045E‐03 3.871E‐06 4.645E‐05 2.581E‐06 2.581E‐06 3.226E‐03 2.742E‐03 3.512E‐03
DDD 3.385E‐03 1.406E‐03 3.581E‐04 9.628E‐04 1.146E‐03 9.999E‐06 3.000E‐05 3.000E‐05 2.708E‐03 9.999E‐06 1.199E‐04 6.666E‐06 6.666E‐06 1.974E‐03 1.777E‐03 1.018E‐02
DDE 1.497E‐02 6.211E‐03 1.588E‐03 4.267E‐03 5.078E‐03 4.433E‐05 1.330E‐04 1.330E‐04 1.198E‐02 4.433E‐05 5.312E‐04 2.956E‐05 2.956E‐05 4.965E‐03 4.568E‐03 4.504E‐02
DDT 3.841E‐02 1.601E‐02 4.101E‐03 1.094E‐02 1.307E‐02 1.141E‐04 3.422E‐04 3.422E‐04 3.073E‐02 1.141E‐04 1.367E‐03 7.604E‐05 7.604E‐05 1.326E‐02 1.286E‐02 1.157E‐01
PCBs 4.850E‐02 2.018E‐02 5.143E‐03 1.377E‐02 1.624E‐02 2.695E‐04 8.085E‐04 8.085E‐04 3.854E‐02 2.695E‐04 1.746E‐03 1.797E‐04 1.797E‐04 2.117E‐02 2.115E‐02 1.466E‐01
Dieldrin^ 3.613E‐05 1.445E‐05 4.036E‐06 1.084E‐05 1.209E‐05 9.667E‐07 2.900E‐06 2.900E‐06 2.890E‐05 9.667E‐07 1.449E‐06 6.445E‐07 6.445E‐07 2.352E‐04 1.882E‐04 1.169E‐04
Heptachlor Epoxide 1.077E‐03 4.466E‐04 1.143E‐04 3.076E‐04 3.662E‐04 3.183E‐06 9.550E‐06 9.550E‐06 8.619E‐04 3.183E‐06 3.832E‐05 2.122E‐06 2.122E‐06 4.392E‐04 3.953E‐04 3.242E‐03
PAH 1 2.471E‐01 1.025E‐01 2.653E‐02 7.138E‐02 8.235E‐02 2.187E‐03 6.562E‐03 6.562E‐03 1.976E‐01 2.187E‐03 8.789E‐03 1.458E‐03 1.458E‐03 2.202E‐01 0.000E+00 7.566E‐01
PAH 2 4.232E+00 1.732E+00 4.459E‐01 1.201E+00 1.416E+00 1.387E‐02 4.160E‐02 4.160E‐02 3.385E+00 1.387E‐02 1.527E‐01 9.244E‐03 9.244E‐03 1.322E+00 1.296E+00 1.269E+01
PAH 3 3.206E+00 1.328E+00 3.385E‐01 9.169E‐01 1.100E+00 8.945E‐03 2.683E‐02 2.683E‐02 2.565E+00 8.945E‐03 1.164E‐01 5.963E‐03 5.963E‐03 8.444E‐01 8.275E‐01 9.655E+00
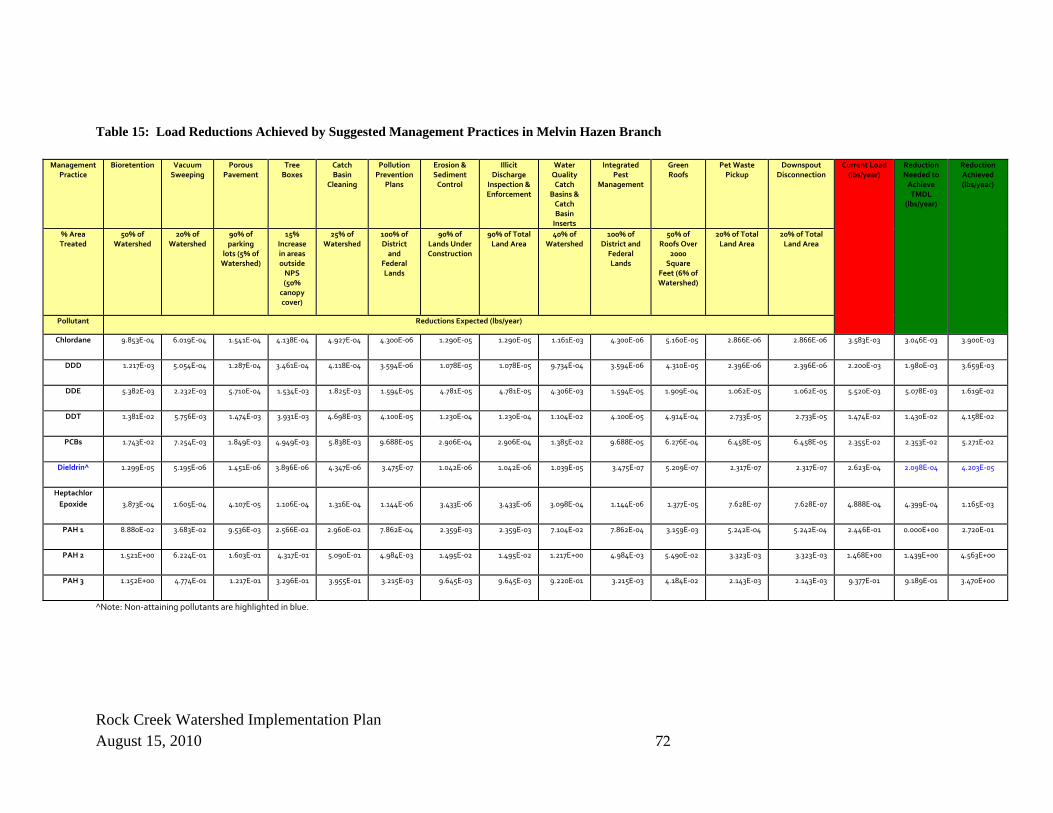
Rock Creek Watershed Implementation Plan August 15, 2010 72
Table 15: Load Reductions Achieved by Suggested Management Practices in Melvin Hazen Branch
^Note: Non‐attaining pollutants are highlighted in blue.
Management Practice
Bioretention Vacuum Sweeping
Porous Pavement
Tree Boxes
Catch Basin
Cleaning
Pollution Prevention
Plans
Erosion & Sediment Control
Illicit Discharge
Inspection & Enforcement
Water Quality Catch
Basins & Catch Basin Inserts
Integrated Pest
Management
Green Roofs
Pet Waste Pickup
Downspout Disconnection
Current Load (lbs/year)
Reduction Needed to Achieve TMDL
(lbs/year)
Reduction Achieved (lbs/year)
% Area Treated
50% of Watershed
20% of Watershed
90% of parking
lots (5% of Watershed)
15% Increase in areas outside NPS (50%
canopy cover)
25% of Watershed
100% of District and
Federal Lands
90% of Lands Under Construction
90% of Total Land Area
40% of Watershed
100% of District and Federal Lands
50% of Roofs Over
2000 Square
Feet (6% of Watershed)
20% of Total Land Area
20% of Total Land Area
Pollutant Reductions Expected (lbs/year)
Chlordane 9.853E‐04 6.019E‐04 1.541E‐04 4.138E‐04 4.927E‐04 4.300E‐06 1.290E‐05 1.290E‐05 1.161E‐03 4.300E‐06 5.160E‐05 2.866E‐06 2.866E‐06 3.583E‐03 3.046E‐03 3.900E‐03
DDD 1.217E‐03 5.054E‐04 1.287E‐04 3.461E‐04 4.118E‐04 3.594E‐06 1.078E‐05 1.078E‐05 9.734E‐04 3.594E‐06 4.310E‐05 2.396E‐06 2.396E‐06 2.200E‐03 1.980E‐03 3.659E‐03
DDE 5.382E‐03 2.232E‐03 5.710E‐04 1.534E‐03 1.825E‐03 1.594E‐05 4.781E‐05 4.781E‐05 4.306E‐03 1.594E‐05 1.909E‐04 1.062E‐05 1.062E‐05 5.520E‐03 5.078E‐03 1.619E‐02
DDT 1.381E‐02 5.756E‐03 1.474E‐03 3.931E‐03 4.698E‐03 4.100E‐05 1.230E‐04 1.230E‐04 1.104E‐02 4.100E‐05 4.914E‐04 2.733E‐05 2.733E‐05 1.474E‐02 1.430E‐02 4.158E‐02
PCBs 1.743E‐02 7.254E‐03 1.849E‐03 4.949E‐03 5.838E‐03 9.688E‐05 2.906E‐04 2.906E‐04 1.385E‐02 9.688E‐05 6.276E‐04 6.458E‐05 6.458E‐05 2.355E‐02 2.353E‐02 5.271E‐02
Dieldrin^ 1.299E‐05 5.195E‐06 1.451E‐06 3.896E‐06 4.347E‐06 3.475E‐07 1.042E‐06 1.042E‐06 1.039E‐05 3.475E‐07 5.209E‐07 2.317E‐07 2.317E‐07 2.623E‐04 2.098E‐04 4.203E‐05
Heptachlor Epoxide 3.873E‐04 1.605E‐04 4.107E‐05 1.106E‐04 1.316E‐04 1.144E‐06 3.433E‐06 3.433E‐06 3.098E‐04 1.144E‐06 1.377E‐05 7.628E‐07 7.628E‐07 4.888E‐04 4.399E‐04 1.165E‐03
PAH 1 8.880E‐02 3.683E‐02 9.536E‐03 2.566E‐02 2.960E‐02 7.862E‐04 2.359E‐03 2.359E‐03 7.104E‐02 7.862E‐04 3.159E‐03 5.242E‐04 5.242E‐04 2.446E‐01 0.000E+00 2.720E‐01
PAH 2 1.521E+00 6.224E‐01 1.603E‐01 4.317E‐01 5.090E‐01 4.984E‐03 1.495E‐02 1.495E‐02 1.217E+00 4.984E‐03 5.490E‐02 3.323E‐03 3.323E‐03 1.468E+00 1.439E+00 4.563E+00
PAH 3 1.152E+00 4.774E‐01 1.217E‐01 3.296E‐01 3.955E‐01 3.215E‐03 9.645E‐03 9.645E‐03 9.220E‐01 3.215E‐03 4.184E‐02 2.143E‐03 2.143E‐03 9.377E‐01 9.189E‐01 3.470E+00
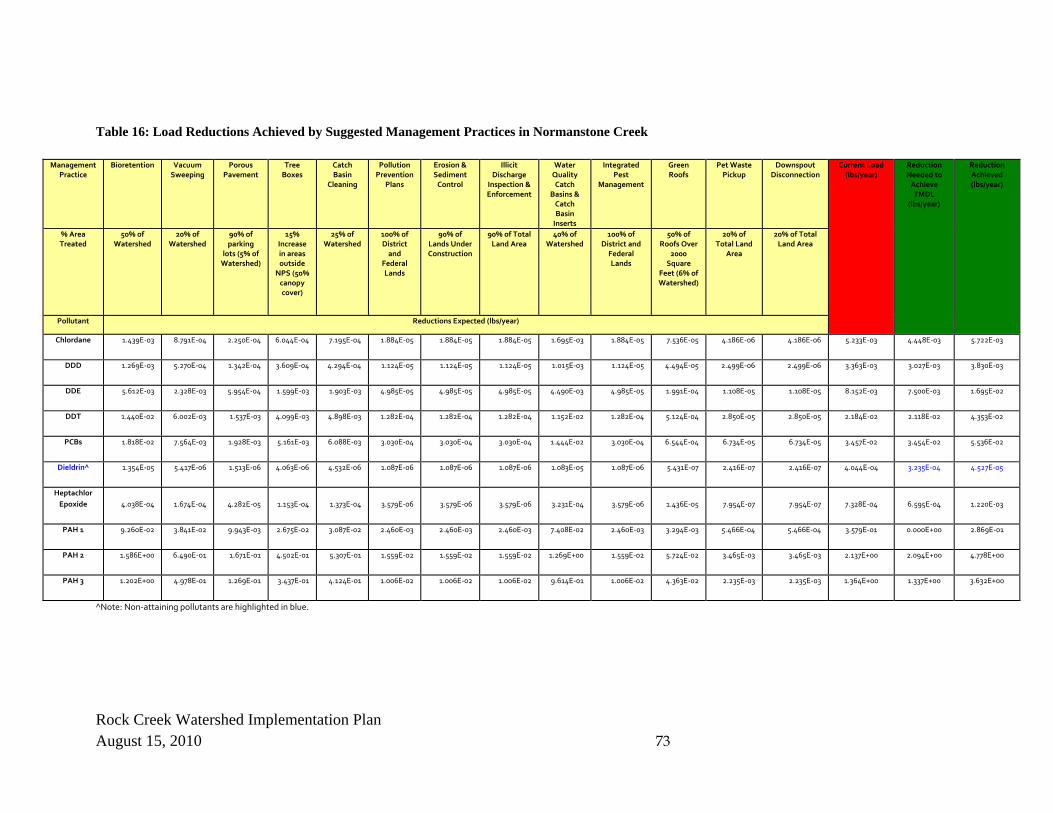
Rock Creek Watershed Implementation Plan August 15, 2010 73
Table 16: Load Reductions Achieved by Suggested Management Practices in Normanstone Creek
^Note: Non‐attaining pollutants are highlighted in blue.
Management Practice
Bioretention Vacuum Sweeping
Porous Pavement
Tree Boxes
Catch Basin
Cleaning
Pollution Prevention
Plans
Erosion & Sediment Control
Illicit Discharge
Inspection & Enforcement
Water Quality Catch
Basins & Catch Basin Inserts
Integrated Pest
Management
Green Roofs
Pet Waste Pickup
Downspout Disconnection
Current Load (lbs/year)
Reduction Needed to Achieve TMDL
(lbs/year)
Reduction Achieved (lbs/year)
% Area Treated
50% of Watershed
20% of Watershed
90% of parking
lots (5% of Watershed)
15% Increase in areas outside
NPS (50% canopy cover)
25% of Watershed
100% of District and
Federal Lands
90% of Lands Under Construction
90% of Total Land Area
40% of Watershed
100% of District and Federal Lands
50% of Roofs Over
2000 Square
Feet (6% of Watershed)
20% of Total Land
Area
20% of Total Land Area
Pollutant Reductions Expected (lbs/year)
Chlordane 1.439E‐03 8.791E‐04 2.250E‐04 6.044E‐04 7.195E‐04 1.884E‐05 1.884E‐05 1.884E‐05 1.695E‐03 1.884E‐05 7.536E‐05 4.186E‐06 4.186E‐06 5.233E‐03 4.448E‐03 5.722E‐03
DDD 1.269E‐03 5.270E‐04 1.342E‐04 3.609E‐04 4.294E‐04 1.124E‐05 1.124E‐05 1.124E‐05 1.015E‐03 1.124E‐05 4.494E‐05 2.499E‐06 2.499E‐06 3.363E‐03 3.027E‐03 3.830E‐03
DDE 5.612E‐03 2.328E‐03 5.954E‐04 1.599E‐03 1.903E‐03 4.985E‐05 4.985E‐05 4.985E‐05 4.490E‐03 4.985E‐05 1.991E‐04 1.108E‐05 1.108E‐05 8.152E‐03 7.500E‐03 1.695E‐02
DDT 1.440E‐02 6.002E‐03 1.537E‐03 4.099E‐03 4.898E‐03 1.282E‐04 1.282E‐04 1.282E‐04 1.152E‐02 1.282E‐04 5.124E‐04 2.850E‐05 2.850E‐05 2.184E‐02 2.118E‐02 4.353E‐02
PCBs 1.818E‐02 7.564E‐03 1.928E‐03 5.161E‐03 6.088E‐03 3.030E‐04 3.030E‐04 3.030E‐04 1.444E‐02 3.030E‐04 6.544E‐04 6.734E‐05 6.734E‐05 3.457E‐02 3.454E‐02 5.536E‐02
Dieldrin^ 1.354E‐05 5.417E‐06 1.513E‐06 4.063E‐06 4.532E‐06 1.087E‐06 1.087E‐06 1.087E‐06 1.083E‐05 1.087E‐06 5.431E‐07 2.416E‐07 2.416E‐07 4.044E‐04 3.235E‐04 4.527E‐05
Heptachlor Epoxide 4.038E‐04 1.674E‐04 4.282E‐05 1.153E‐04 1.373E‐04 3.579E‐06 3.579E‐06 3.579E‐06 3.231E‐04 3.579E‐06 1.436E‐05 7.954E‐07 7.954E‐07 7.328E‐04 6.595E‐04 1.220E‐03
PAH 1 9.260E‐02 3.841E‐02 9.943E‐03 2.675E‐02 3.087E‐02 2.460E‐03 2.460E‐03 2.460E‐03 7.408E‐02 2.460E‐03 3.294E‐03 5.466E‐04 5.466E‐04 3.579E‐01 0.000E+00 2.869E‐01
PAH 2 1.586E+00 6.490E‐01 1.671E‐01 4.502E‐01 5.307E‐01 1.559E‐02 1.559E‐02 1.559E‐02 1.269E+00 1.559E‐02 5.724E‐02 3.465E‐03 3.465E‐03 2.137E+00 2.094E+00 4.778E+00
PAH 3 1.202E+00 4.978E‐01 1.269E‐01 3.437E‐01 4.124E‐01 1.006E‐02 1.006E‐02 1.006E‐02 9.614E‐01 1.006E‐02 4.363E‐02 2.235E‐03 2.235E‐03 1.364E+00 1.337E+00 3.632E+00

Rock Creek Watershed Implementation Plan August 15, 2010 74
Table 17: Load Reductions Achieved by Suggested Management Practices in Pinehurst Branch
^Note: Non‐attaining pollutants are highlighted in blue.
Management Practice
Bioretention Vacuum Sweeping
Porous Pavement
Tree Boxes
Catch Basin
Cleaning
Pollution Prevention
Plans
Erosion & Sediment Control
Illicit Discharge
Inspection & Enforcement
Water Quality Catch
Basins & Catch Basin Inserts
Integrated Pest
Management
Green Roofs
Pet Waste Pickup
Downspout Disconnection
Current Load (lbs/year)
Reduction Needed to Achieve TMDL
(lbs/year)
Reduction Achieved (lbs/year)
% Area Treated
50% of Watershed
20% of Watershed
90% of parking
lots (5% of Watershed)
15% Increase in areas outside
NPS (50% canopy cover)
25% of Watershed
100% of District and
Federal Lands
90% of Lands Under Construction
90% of Total Land Area
40% of Watershed
100% of District and Federal Lands
50% of Roofs Over
2000 Square
Feet (6% of Watershed)
20% of Total Land Area
20% of Total Land Area
Pollutant Reductions Expected (lbs/year)
Chlordane 1.221E‐04 7.461E‐05 1.910E‐05 5.129E‐05 6.106E‐05 5.329E‐07 1.599E‐06 1.599E‐06 1.439E‐04 5.329E‐07 6.395E‐06 3.553E‐07 3.553E‐07 4.441E‐03 3.775E‐03 4.834E‐04
DDD 3.406E‐03 1.415E‐03 3.603E‐04 9.687E‐04 1.153E‐03 1.006E‐05 3.018E‐05 3.018E‐05 2.725E‐03 1.006E‐05 1.207E‐04 6.707E‐06 6.707E‐06 3.984E‐03 3.586E‐03 1.024E‐02
DDE 1.507E‐02 6.249E‐03 1.598E‐03 4.294E‐03 5.109E‐03 4.461E‐05 1.338E‐04 1.338E‐04 1.205E‐02 4.461E‐05 5.345E‐04 2.974E‐05 2.974E‐05 7.605E‐03 6.997E‐03 4.532E‐02
DDT 3.865E‐02 1.611E‐02 4.127E‐03 1.100E‐02 1.315E‐02 1.148E‐04 3.443E‐04 3.443E‐04 3.092E‐02 1.148E‐04 1.376E‐03 7.650E‐05 7.650E‐05 2.086E‐02 2.023E‐02 1.164E‐01
PCBs 4.880E‐02 2.031E‐02 5.175E‐03 1.385E‐02 1.634E‐02 9.727E‐07 8.135E‐04 8.135E‐04 3.878E‐02 9.727E‐07 1.757E‐03 1.808E‐04 1.808E‐04 3.085E‐02 3.082E‐02 1.470E‐01
Dieldrin^ 3.635E‐05 1.454E‐05 4.061E‐06 1.091E‐05 1.217E‐05 3.203E‐06 2.918E‐06 2.918E‐06 2.908E‐05 3.203E‐06 1.458E‐06 6.485E‐07 6.485E‐07 5.032E‐04 4.026E‐04 1.221E‐04
Heptachlor Epoxide 1.084E‐03 4.493E‐04 1.150E‐04 3.095E‐04 3.684E‐04 2.201E‐03 9.609E‐06 9.609E‐06 8.672E‐04 2.201E‐03 3.855E‐05 2.135E‐06 2.135E‐06 7.649E‐04 6.884E‐04 7.657E‐03
PAH 1 2.486E‐01 1.031E‐01 2.669E‐02 7.182E‐02 8.286E‐02 1.395E‐02 6.602E‐03 6.602E‐03 1.989E‐01 1.395E‐02 8.843E‐03 1.467E‐03 1.467E‐03 3.084E‐01 0.000E+00 7.848E‐01
PAH 2 4.258E+00 1.742E+00 4.487E‐01 1.208E+00 1.425E+00 9.000E‐03 4.185E‐02 4.185E‐02 3.406E+00 9.000E‐03 1.537E‐01 9.301E‐03 9.301E‐03 1.765E+00 1.730E+00 1.276E+01
PAH 3 3.226E+00 1.336E+00 3.406E‐01 9.226E‐01 1.107E+00 2.712E‐04 2.700E‐02 2.700E‐02 2.581E+00 2.712E‐04 1.171E‐01 6.000E‐03 6.000E‐03 1.117E+00 1.095E+00 9.697E+00

Rock Creek Watershed Implementation Plan August 15, 2010 75
Table 18: Load Reductions Achieved by Suggested Management Practices in Portal Branch
^Note: Non‐attaining pollutants are highlighted in blue.
Management Practice
Bioretention Vacuum Sweeping
Porous Pavement
Tree Boxes
Catch Basin
Cleaning
Pollution Prevention Plans
Erosion & Sediment Control
Illicit Discharge
Inspection & Enforcement
Water Quality Catch
Basins & Catch Basin Inserts
Integrated Pest
Management
Green Roofs Pet Waste Pickup
Downspout Disconnection
Current Load
(lbs/year)
Reduction Needed to Achieve TMDL
(lbs/year)
Reduction Achieved (lbs/year)
% Area Treated
50% of Watershed
20% of Watershed
90% of parking
lots (5% of Watershed)
15% Increase in areas outside
NPS (50% canopy cover)
25% of Watershed
100% of District and
Federal Lands
90% of Lands Under Construction
90% of Total Land Area
40% of Watershed
100% of District and
Federal Lands
50% of Roofs Over 2000 Square Feet
(6% of Watershed)
20% of Total Land Area
20% of Total Land Area
Pollutant Reductions Expected (lbs/year)
Chlordane 3.377E‐04 2.063E‐04 5.280E‐05 1.418E‐04 1.689E‐04 1.474E‐06 4.421E‐06 4.421E‐06 3.979E‐04 1.474E‐06 1.768E‐05 9.824E‐07 9.824E‐07 1.228E‐03 1.044E‐03 1.337E‐03
DDD 1.050E‐03 4.363E‐04 1.111E‐04 2.988E‐04 3.555E‐04 3.103E‐06 9.308E‐06 9.308E‐06 8.403E‐04 3.103E‐06 3.721E‐05 2.068E‐
06 2.068E‐06 1.024E‐03 9.216E‐04 3.159E‐03
DDE 4.646E‐03 1.927E‐03 4.929E‐04 1.324E‐03 1.576E‐03 1.376E‐05 4.127E‐05 4.127E‐05 3.717E‐03 1.376E‐05 1.648E‐04 9.171E‐06 9.171E‐06 2.056E‐03 1.892E‐03 1.398E‐02
DDT 1.192E‐02 4.969E‐03 1.273E‐03 3.394E‐03 4.055E‐03 3.539E‐05 1.062E‐04 1.062E‐04 9.534E‐03 3.539E‐05 4.242E‐04 2.359E‐05 2.359E‐05 5.610E‐03 5.442E‐03 3.590E‐02
PCBs 1.505E‐02 6.262E‐03 1.596E‐03 4.272E‐03 5.040E‐03 8.363E‐05 2.509E‐04 2.509E‐04 1.196E‐02 8.363E‐05 5.418E‐04 5.575E‐05 5.575E‐05 8.394E‐03 8.386E‐03 4.550E‐02
Dieldrin^ 1.121E‐05 4.484E‐06 1.252E‐06 3.363E‐06 3.752E‐06 3.000E‐07 8.999E‐07 8.999E‐07 8.969E‐06 3.000E‐07 4.497E‐07 2.000E‐07 2.000E‐07 1.282E‐04 1.026E‐04 3.628E‐05
Heptachlor Epoxide 3.343E‐04 1.386E‐04 3.545E‐05 9.545E‐05 1.136E‐04 9.878E‐07 2.963E‐06 2.963E‐06 2.674E‐04 9.878E‐07 1.189E‐05 6.585E‐07 6.585E‐07 2.017E‐04 1.815E‐04 1.006E‐03
PAH 1 7.666E‐02 3.179E‐02 8.232E‐03 2.215E‐02 2.555E‐02 6.787E‐04 2.036E‐03 2.036E‐03 6.133E‐02 6.787E‐04 2.727E‐03 4.525E‐04 4.525E‐04 8.496E‐02 0.000E+00 2.348E‐01
PAH 2 1.313E+00 5.373E‐01 1.384E‐01 3.727E‐01 4.394E‐01 4.303E‐03 1.291E‐02 1.291E‐02 1.050E+00 4.303E‐03 4.739E‐02 2.868E‐03 2.868E‐03 4.913E‐01 4.815E‐01 3.939E+00
PAH 3 9.949E‐01 4.121E‐01 1.050E‐01 2.845E‐01 3.414E‐01 2.775E‐03 8.326E‐03 8.326E‐03 7.959E‐01 2.775E‐03 3.612E‐02 1.850E‐03 1.850E‐03 3.116E‐01 3.054E‐01 2.996E+00
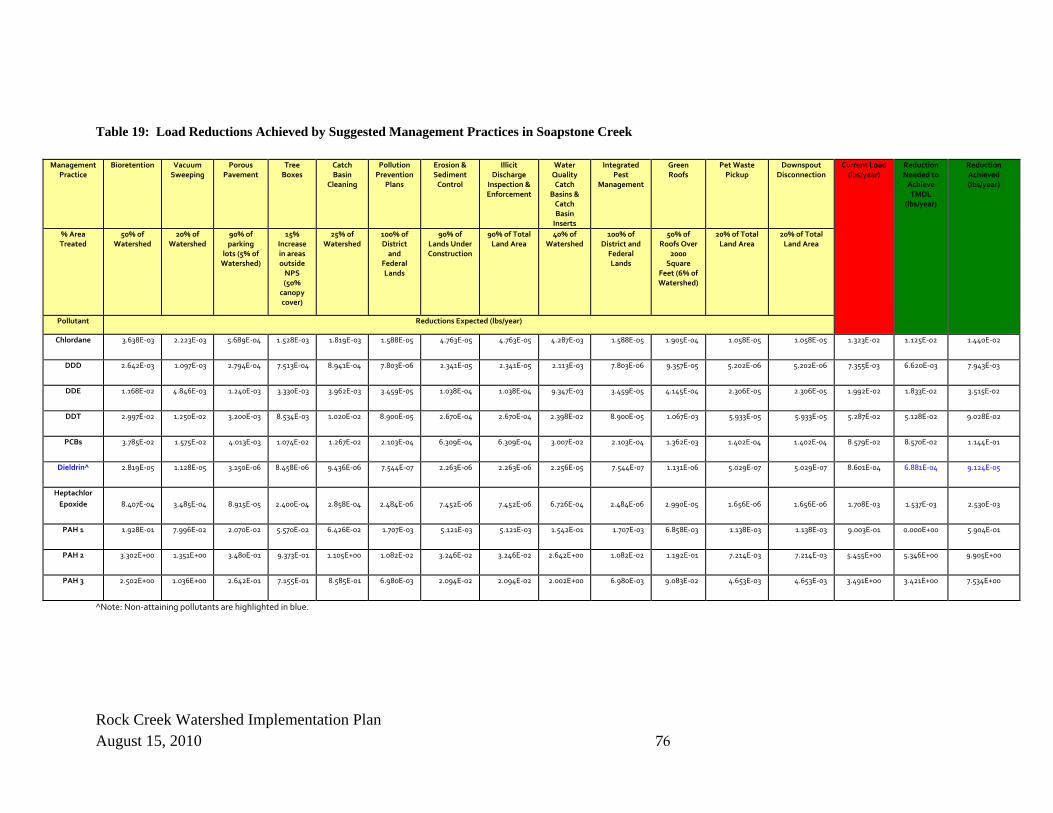
Rock Creek Watershed Implementation Plan August 15, 2010 76
Table 19: Load Reductions Achieved by Suggested Management Practices in Soapstone Creek
^Note: Non‐attaining pollutants are highlighted in blue.
Management Practice
Bioretention Vacuum Sweeping
Porous Pavement
Tree Boxes
Catch Basin
Cleaning
Pollution Prevention
Plans
Erosion & Sediment Control
Illicit Discharge
Inspection & Enforcement
Water Quality Catch
Basins & Catch Basin Inserts
Integrated Pest
Management
Green Roofs
Pet Waste Pickup
Downspout Disconnection
Current Load (lbs/year)
Reduction Needed to Achieve TMDL
(lbs/year)
Reduction Achieved (lbs/year)
% Area Treated
50% of Watershed
20% of Watershed
90% of parking
lots (5% of Watershed)
15% Increase in areas outside NPS (50%
canopy cover)
25% of Watershed
100% of District and
Federal Lands
90% of Lands Under Construction
90% of Total Land Area
40% of Watershed
100% of District and Federal Lands
50% of Roofs Over
2000 Square
Feet (6% of Watershed)
20% of Total Land Area
20% of Total Land Area
Pollutant Reductions Expected (lbs/year)
Chlordane 3.638E‐03 2.223E‐03 5.689E‐04 1.528E‐03 1.819E‐03 1.588E‐05 4.763E‐05 4.763E‐05 4.287E‐03 1.588E‐05 1.905E‐04 1.058E‐05 1.058E‐05 1.323E‐02 1.125E‐02 1.440E‐02
DDD 2.642E‐03 1.097E‐03 2.794E‐04 7.513E‐04 8.941E‐04 7.803E‐06 2.341E‐05 2.341E‐05 2.113E‐03 7.803E‐06 9.357E‐05 5.202E‐06 5.202E‐06 7.355E‐03 6.620E‐03 7.943E‐03
DDE 1.168E‐02 4.846E‐03 1.240E‐03 3.330E‐03 3.962E‐03 3.459E‐05 1.038E‐04 1.038E‐04 9.347E‐03 3.459E‐05 4.145E‐04 2.306E‐05 2.306E‐05 1.992E‐02 1.833E‐02 3.515E‐02
DDT 2.997E‐02 1.250E‐02 3.200E‐03 8.534E‐03 1.020E‐02 8.900E‐05 2.670E‐04 2.670E‐04 2.398E‐02 8.900E‐05 1.067E‐03 5.933E‐05 5.933E‐05 5.287E‐02 5.128E‐02 9.028E‐02
PCBs 3.785E‐02 1.575E‐02 4.013E‐03 1.074E‐02 1.267E‐02 2.103E‐04 6.309E‐04 6.309E‐04 3.007E‐02 2.103E‐04 1.362E‐03 1.402E‐04 1.402E‐04 8.579E‐02 8.570E‐02 1.144E‐01
Dieldrin^ 2.819E‐05 1.128E‐05 3.150E‐06 8.458E‐06 9.436E‐06 7.544E‐07 2.263E‐06 2.263E‐06 2.256E‐05 7.544E‐07 1.131E‐06 5.029E‐07 5.029E‐07 8.601E‐04 6.881E‐04 9.124E‐05
Heptachlor Epoxide 8.407E‐04 3.485E‐04 8.915E‐05 2.400E‐04 2.858E‐04 2.484E‐06 7.452E‐06 7.452E‐06 6.726E‐04 2.484E‐06 2.990E‐05 1.656E‐06 1.656E‐06 1.708E‐03 1.537E‐03 2.530E‐03
PAH 1 1.928E‐01 7.996E‐02 2.070E‐02 5.570E‐02 6.426E‐02 1.707E‐03 5.121E‐03 5.121E‐03 1.542E‐01 1.707E‐03 6.858E‐03 1.138E‐03 1.138E‐03 9.003E‐01 0.000E+00 5.904E‐01
PAH 2 3.302E+00 1.351E+00 3.480E‐01 9.373E‐01 1.105E+00 1.082E‐02 3.246E‐02 3.246E‐02 2.642E+00 1.082E‐02 1.192E‐01 7.214E‐03 7.214E‐03 5.455E+00 5.346E+00 9.905E+00
PAH 3 2.502E+00 1.036E+00 2.642E‐01 7.155E‐01 8.585E‐01 6.980E‐03 2.094E‐02 2.094E‐02 2.002E+00 6.980E‐03 9.083E‐02 4.653E‐03 4.653E‐03 3.491E+00 3.421E+00 7.534E+00

Rock Creek Watershed Implementation Plan August 15, 2010 77
Table 20: Load Reductions Achieved by Suggested Management Practices for Organic Pollutants in Piney Branch
^Note: Non‐attaining pollutants are highlighted in blue.
Management Practice
Bioretention Vacuum Sweeping
Porous Pavement
Tree Boxes
Catch Basin
Cleaning
Pollution Prevention
Plans
Erosion & Sediment Control
Illicit Discharge
Inspection & Enforcement
Water Quality Catch
Basins & Catch Basin Inserts
Integrated Pest
Management
Green Roofs Pet Waste Pickup
Downspout Disconnection
Current Load
(lbs/year)
Reduction Needed to Achieve TMDL
(lbs/year)
Reduction Achieved (lbs/year)
% Area Treated
50% of Watershed
20% of Watershed
90% of parking
lots (5% of Watershed)
15% Increase in areas outside
NPS (50% canopy cover)
25% of Watershed
100% of District and
Federal Lands
90% of Lands Under Construction
90% of Total Land Area
40% of Watershed
100% of District and Federal Lands
50% of Roofs Over 2000 Square Feet
(6% of Watershed)
20% of Total Land Area
20% of Total Land Area
Pollutant Reductions Expected (lbs/year)
Chlordane 7.510E‐05 4.588E‐05 1.174E‐05 3.154E‐05 3.755E‐05 3.277E‐07 9.832E‐07 9.832E‐07 8.848E‐05 3.277E‐07 3.933E‐06 2.185E‐07 2.185E‐07 2.731E‐04 2.185E‐04 2.973E‐04
DDD 2.912E‐04 1.210E‐04 3.080E‐05 8.282E‐05 9.856E‐05 8.602E‐07 2.580E‐06 2.580E‐06 2.330E‐04 8.602E‐07 1.032E‐05 5.734E‐07 5.734E‐07 3.173E‐04 2.856E‐04 8.756E‐04
DDE 1.288E‐03 5.342E‐04 1.366E‐04 3.671E‐04 4.368E‐04 3.814E‐06 1.144E‐05 1.144E‐05 1.030E‐03 3.814E‐06 4.570E‐05 2.542E‐06 2.542E‐06 5.115E‐04 4.706E‐04 3.874E‐03
DDT 3.304E‐03 1.378E‐03 3.528E‐04 9.408E‐04 1.124E‐03 9.811E‐06 2.943E‐05 2.943E‐05 2.643E‐03 9.811E‐06 1.176E‐04 6.541E‐06 6.541E‐06 1.432E‐03 1.389E‐03 9.952E‐03
PCBs 4.172E‐03 1.736E‐03 4.424E‐04 1.184E‐03 1.397E‐03 2.318E‐05 6.955E‐05 6.955E‐05 3.315E‐03 2.318E‐05 1.502E‐04 1.546E‐05 1.546E‐05 2.434E‐03 2.432E‐03 1.261E‐02
Dieldrin^ 3.108E‐06 1.243E‐06 3.472E‐07 9.324E‐07 1.040E‐06 8.316E‐08 2.495E‐07 2.495E‐07 2.486E‐06 8.316E‐08 1.247E‐07 5.544E‐08 5.544E‐08 4.118E‐05 3.294E‐05 1.006E‐05
Heptachlor Epoxide 9.268E‐05 3.842E‐05 9.828E‐06 2.646E‐05 3.150E‐05 2.738E‐07 8.215E‐07 8.215E‐07 7.414E‐05 2.738E‐07 3.296E‐06 1.826E‐07 1.826E‐07 5.618E‐05 4.775E‐05 2.789E‐04
PAH 1 2.125E‐02 8.814E‐03 2.282E‐03 6.140E‐03 7.084E‐03 1.882E‐04 5.645E‐04 5.645E‐04 1.700E‐02 1.882E‐04 7.560E‐04 1.254E‐04 1.254E‐04 1.927E‐02 0.000E+00 6.509E‐02
PAH 2 3.640E‐01 1.490E‐01 3.836E‐02 1.033E‐01 1.218E‐01 1.193E‐03 3.578E‐03 3.578E‐03 2.912E‐01 1.193E‐03 1.314E‐02 7.952E‐04 7.952E‐04 1.054E‐01 1.033E‐01 1.092E+00
PAH 3 2.758E‐01 1.142E‐01 2.912E‐02 7.888E‐02 9.464E‐02 7.694E‐04 2.308E‐03 2.308E‐03 2.206E‐01 7.694E‐04 1.001E‐02 5.130E‐04 5.130E‐04 6.606E‐02 6.342E‐02 8.305E‐01

Rock Creek Watershed Implementation Plan August 15, 2010 78
Table 21: Load Reductions Achieved by Suggested Management Practices for Metals in Piney Branch
Management Practice
Bioretention Vacuum Sweeping
Porous Pavement
Tree Boxes
Catch Basin
Cleaning
Pollution Prevention
Plans
Erosion & Sediment Control
Illicit Discharge
Inspection & Enforcement
Water Quality Catch
Basins & Catch Basin Inserts
Integrated Pest
Management
Green Roofs Pet Waste Pickup
Downspout Disconnection
Current Load
(lbs/year)
Reduction Needed to Achieve TMDL
(lbs/year)
Reduction Achieved (lbs/year)
% Area Treated
50% of Watershed
20% of Watershed
90% of parking
lots (5% of Watershed)
15% Increase in areas outside NPS (50%
canopy cover)
25% of Watershed
100% of District and
Federal Lands
90% of Lands Under Construction
90% of Total Land Area
40% of Watershed
100% of District and Federal Lands
50% of Roofs Over 2000
Square Feet (6% of Watershed)
20% of Total Land
Area
20% of Total Land Area
Pollutant Reductions Expected (lbs/year)
Copper 7.56E+00 2.80E+00 7.28E‐01 1.93E+00 2.38E+00 0.00E+00 0.00E+00 0.00E+00 6.05E+00 0.00E+00 2.35E‐01 0.00E+00 0.00E+00 1.471E+00 9.562E‐01 2.168E+01
Zinc 1.96E+01 6.94E+00 1.88E+00 5.04E+00 6.02E+00 0.00E+00 0.00E+00 0.00E+00 1.64E+01 0.00E+00 4.03E‐01 0.00E+00 0.00E+00 4.295E+00 0.000E+00 5.624E+01
Arsenic 1.31E‐01 5.43E‐02 1.39E‐02 3.73E‐02 4.42E‐02 3.93E‐04 1.18E‐03 1.18E‐03 1.05E‐01 3.93E‐04 4.70E‐03 2.62E‐04 2.62E‐04 4.229E‐02 2.749E‐02 3.940E‐01
Lead 3.36E+00 1.12E+00 3.64E‐01 9.24E‐01 1.12E+00 0.00E+00 0.00E+00 0.00E+00 2.69E+00 0.00E+00 0.00E+00 0.00E+00 0.00E+00 6.845E‐01 5.134E‐01 9.576E+00

Rock Creek Watershed Implementation Plan August 15, 2010 79
Implementation Schedule and Milestones
Implementation Schedule By analyzing where groupings of potential projects found while performing reconnaissance for the Rock Creek implementation plan and adding this data to a list of projects currently underway or about to begin (see Table 22), we were able to prioritize watersheds for restoration. Based on this analysis, we broke up Rock Creek restoration work into five-year increments, with an average of two watersheds the focus of each five year interval. By prioritizing restoration work by watershed we should be able to better see the results of our work. Furthermore, targeting watersheds will also help us target our monitoring efforts which will allow more money to go towards restoration work. However because the District Department of the Environment is not a landholder in the City, our implementation schedule relies on the willingness of those that do own or manage land in the city to provide access to install pollution management measures. Moreover, approximately 1/3 of the land in the District is federally controlled, which adds a further burden of coordinating with a second level of bureaucracy. Because of this, and because of the limited financial resources available on an annual basis, it is difficult to lay out an exact implementation schedule. In order to coordinate with, and get buy-in from District landholders and stakeholders, DDOE has laid out a process for performing outreach on this Watershed Implementation Plan (see the section entitled “Strategy for Stakeholder Outreach” for further details). The District will use the Rock Creek WIP, and its WIPs for other watersheds as living documents, constantly being updated as we become aware of new projects from partner agencies and organizations and as timelines for implementation of specific projects becomes clear. Based on the feedback from stakeholders and landholders, we will update the WIP and begin lining up agreements with landholders so that we can commence restoration work as soon as funding becomes available. The five year increments in this implementation schedule mesh closely with the EPA Chesapeake Bay Program and District MS4 permit timelines. Using the WIP schedule we have created load reduction targets that will allow us to review our progress towards meeting our targets and adjust our implementation plan accordingly.

Rock Creek Watershed Implementation Plan August 15, 2010 80
Table 22: Short Term Implementation Schedule for Rock Creek Restoration Projects
Project code Project description
Implementing entity
Estimated cost
Funding needed?
Watershed 2009 2010 2011 2012 2013
RC_Stream_20 Broad Branch Daylighting
DDOE 3 M No Broad Branch
Fieldwork completed for construction plans
Construction plans complete
Restoration work begun
Restoration work completed
RC_LID_330 Bingham Run Regenerative Stormwater Conveyance
DDOE, NPS 300K No Upper Rock Creek
Design Regenerative Stormwater Conveyance
Install Regenerative Stormwater Conveyance
RC_LID_156 Oregon Avenue Regenerative Stormwater Conveyance
DDOE, NPS 500K No Upper Rock Creek
Design Regenerative Stormwater Conveyance
Install Regenerative Stormwater Conveyance
RC_LID_128 Crestwood Bioretention
DDOE, NRCS 200K No Piney Branch
Design Bioretention Cell
Install Bioretention Cell
RC_LID_219 Retrofit of UDC Rooftops
DDOE, UDC, DRES
1.2 M No Soapstone Run
Design Green Roofs
Install Green Roofs
RC_LID_219 Retrofit UDC Plaza
1.45 M No Soapstone Run
Design Plaza LID
Install Plaza LID
RC_LID_239 Klingle Road Retrofits
DDOT, NPS 2.0 M Klingle Run Perform EA/EIS for work
Design Road/Path
Install Road/Path
Install Road/Path
RC_LID_137‐145
East Beach Drive Retrofits
DDOT, NPS 1.0 M No Fenwick Branch
Construction Plans Complete
Install several roadway retrofits

Rock Creek Watershed Implementation Plan August 15, 2010 81
Project code Project description
Implementing entity
Estimated cost
Funding needed?
Watershed 2009 2010 2011 2012 2013
RC_LID_024 Walter Pierce Park
DDOE, DPR, NRCS
$200,000 No Lower Rock Creek
Design and install LID
RC_Stream_07 and RC_Stream_08
Klingle Run Restoration
DDOE, NPS, WASA, DDOT
$3,00,000 Yes Klingle Run Design Stream Restoration
Begin Stream Restoration
Complete Stream Restoration
Community Based LID Grant – Broad Branch
DDOE, WASA, DDOT, DPR
$1.5 M No Broad Branch
Pre‐monitoring of Sewershed, Design of LID
Installation of LID
Post‐monitoring of Sewershed
Community Based LID Grant ‐ Kansas Avenue
DDOE, WASA, DDOT, OPEFM
$1.5 M No Piney Branch
Pre‐monitoring of Sewershed, Design of LID
Installation of LID
Post‐monitoring of Sewershed
RC_LID_275 Community Based LID Grant ‐ PA Avenue
DDOE, WASA, DDOT
$150 K No Lower Rock Creek
Pre‐monitoring of Sewershed, Design of LID
Installation of LID
Post‐monitoring of Sewershed
RiverSmart Homes
DDOE $1 M No – MS4
Throughout Watershed
Retrofit 20 homes in Rock Creek
Retrofit 46 homes in Rock Creek
Retrofit 46 homes in Rock Creek
Retrofit 100 homes in Rock Creek
Retrofit 100 homes in Rock Creek
RC_LID_173 Lafayette Recreation Center Cistern
DDOE, DPR $70,000 No Broad Branch
Design Cistern Installation
Install Cistern

Rock Creek Watershed Implementation Plan August 15, 2010 82
Milestones The District will use the number of watersheds attaining water quality standards and the percent of Rock Creek attaining water quality standards as milestones for marking its progress towards delisting the Rock Creek watershed (see Table 23). The total restoration effort is estimated to take 30 years with the highest percent of work taking place ten to twenty years from the writing of this plan. In order to ensure that these milestones are being reached, the District will use its current monitoring efforts combined with enhanced monitoring to show load reductions (see the Monitoring section for more information). Focusing restoration efforts at a sub-watershed scale will allow DDOE to efficiently show load reductions in a cost-effective fashion. Table 23: Milestones for Achieving Water Quality Standards Timeframe (years)
Sub‐Watersheds Attaining Water Quality Standards
Locations of Load Reduction Data
Percent of Rock Creek Attaining Water Quality Standards (Cumulative Percent in Parentheses)
Notes:
0‐5 Years Fenwick Branch Klingle Run
Tables 12 and 13. 4.9 Percent Fenwick Branch ‐ DDOT retrofits planned for next year on East Beach Drive. Klingle Run ‐ Restoration designs at 30%.
5‐10 Years Broad Branch Melvin Hazen Run
Tables 10 and 15. 12.6 Percent (17.5 Percent) Broad Branch – Stream Daylighting and Targeted Watershed Grant work underway. Melvin Hazen – Innovative LID work already underway at Sidwell Friends.
10‐15 Years Luzon Creek Normanstone Run Soapstone Run
Tables 14, 16, and 19. 13.6 Percent (31.2 Percent) Luzon – Water Reed base closing will present restoration opportunity. Normanstone – Stream work should be combined with roadway work. Soapstone – UDC retrofits to be completed in 2012.
15‐20 Years
Dumbarton Oaks Pinehurst Branch Piney Branch Portal Branch
Tables 11, 17, 18 and 20. 33.3 Percent (64.5 Percent) Dumbarton – High percent of NPS land with historic structures creates difficult restoration. Piney Branch – much of reductions will take place through Long Term Control Plan. Portal Branch – small area that is predominantly residential.
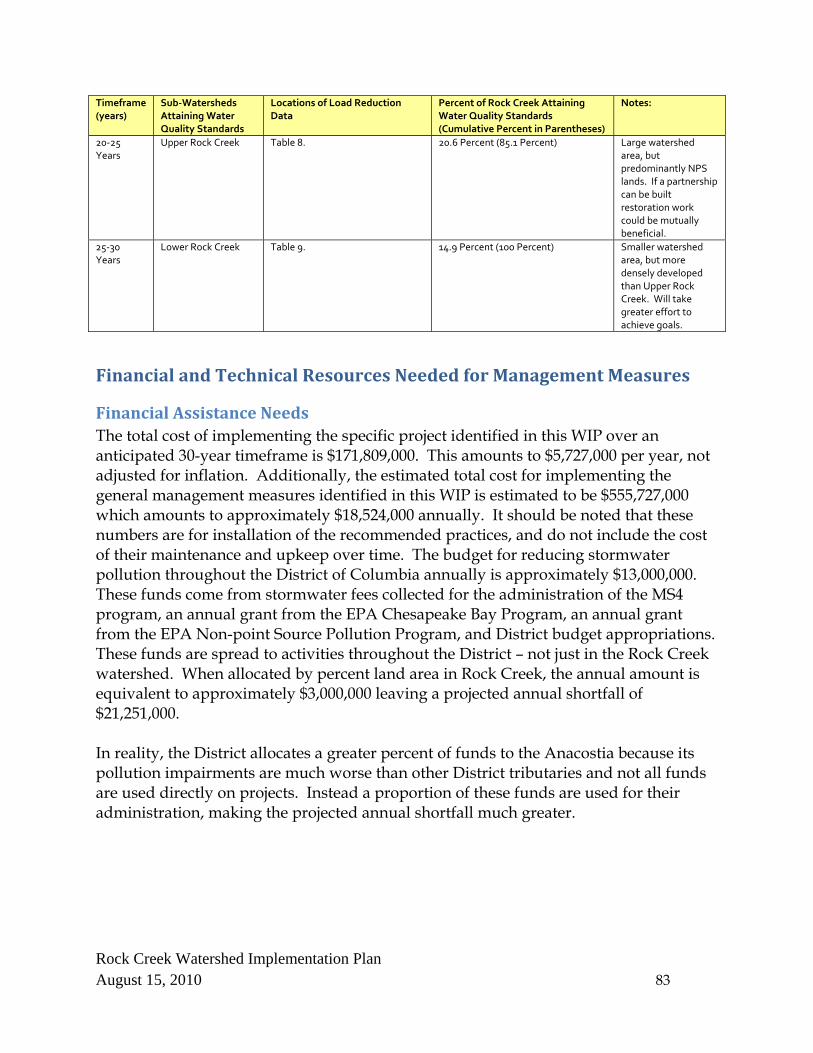
Rock Creek Watershed Implementation Plan August 15, 2010 83
Timeframe (years)
Sub‐Watersheds Attaining Water Quality Standards
Locations of Load Reduction Data
Percent of Rock Creek Attaining Water Quality Standards (Cumulative Percent in Parentheses)
Notes:
20‐25 Years
Upper Rock Creek Table 8. 20.6 Percent (85.1 Percent) Large watershed area, but predominantly NPS lands. If a partnership can be built restoration work could be mutually beneficial.
25‐30 Years
Lower Rock Creek Table 9. 14.9 Percent (100 Percent) Smaller watershed area, but more densely developed than Upper Rock Creek. Will take greater effort to achieve goals.
Financial and Technical Resources Needed for Management Measures
Financial Assistance Needs The total cost of implementing the specific project identified in this WIP over an anticipated 30-year timeframe is $171,809,000. This amounts to $5,727,000 per year, not adjusted for inflation. Additionally, the estimated total cost for implementing the general management measures identified in this WIP is estimated to be $555,727,000 which amounts to approximately $18,524,000 annually. It should be noted that these numbers are for installation of the recommended practices, and do not include the cost of their maintenance and upkeep over time. The budget for reducing stormwater pollution throughout the District of Columbia annually is approximately $13,000,000. These funds come from stormwater fees collected for the administration of the MS4 program, an annual grant from the EPA Chesapeake Bay Program, an annual grant from the EPA Non-point Source Pollution Program, and District budget appropriations. These funds are spread to activities throughout the District – not just in the Rock Creek watershed. When allocated by percent land area in Rock Creek, the annual amount is equivalent to approximately $3,000,000 leaving a projected annual shortfall of $21,251,000. In reality, the District allocates a greater percent of funds to the Anacostia because its pollution impairments are much worse than other District tributaries and not all funds are used directly on projects. Instead a proportion of these funds are used for their administration, making the projected annual shortfall much greater.
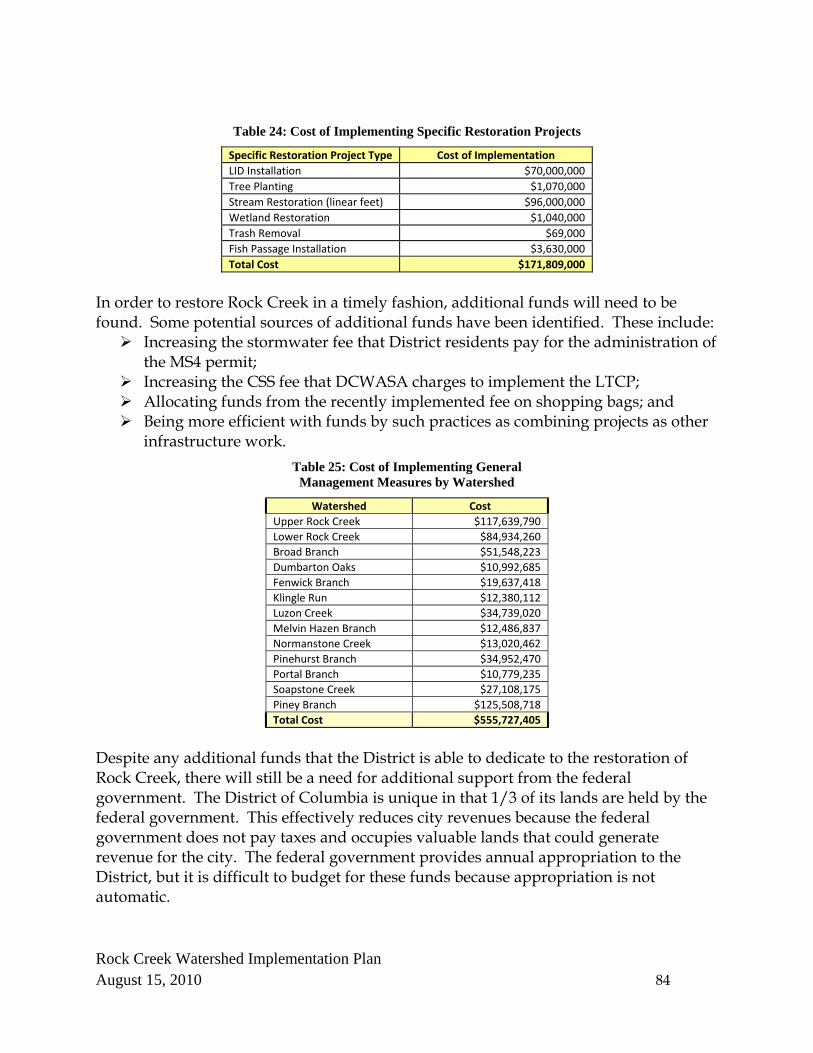
Rock Creek Watershed Implementation Plan August 15, 2010 84
Table 24: Cost of Implementing Specific Restoration Projects
Specific Restoration Project Type Cost of Implementation LID Installation $70,000,000 Tree Planting $1,070,000 Stream Restoration (linear feet) $96,000,000 Wetland Restoration $1,040,000 Trash Removal $69,000 Fish Passage Installation $3,630,000 Total Cost $171,809,000
In order to restore Rock Creek in a timely fashion, additional funds will need to be found. Some potential sources of additional funds have been identified. These include:
Increasing the stormwater fee that District residents pay for the administration of the MS4 permit;
Increasing the CSS fee that DCWASA charges to implement the LTCP; Allocating funds from the recently implemented fee on shopping bags; and Being more efficient with funds by such practices as combining projects as other
infrastructure work. Table 25: Cost of Implementing General
Management Measures by Watershed
Watershed Cost Upper Rock Creek $117,639,790 Lower Rock Creek $84,934,260 Broad Branch $51,548,223 Dumbarton Oaks $10,992,685 Fenwick Branch $19,637,418 Klingle Run $12,380,112 Luzon Creek $34,739,020 Melvin Hazen Branch $12,486,837 Normanstone Creek $13,020,462 Pinehurst Branch $34,952,470 Portal Branch $10,779,235 Soapstone Creek $27,108,175 Piney Branch $125,508,718 Total Cost $555,727,405
Despite any additional funds that the District is able to dedicate to the restoration of Rock Creek, there will still be a need for additional support from the federal government. The District of Columbia is unique in that 1/3 of its lands are held by the federal government. This effectively reduces city revenues because the federal government does not pay taxes and occupies valuable lands that could generate revenue for the city. The federal government provides annual appropriation to the District, but it is difficult to budget for these funds because appropriation is not automatic.

Rock Creek Watershed Implementation Plan August 15, 2010 85
Technical Assistance Needs In addition to further funding, as a local government, we are in need of additional technical resources. Although we have a strong and knowledgeable staff, we are still a small staff that is required to fulfill the obligations of both a state and local agency. One particular area where we are in need of resources is in monitoring our local waterways. The District could use additional resources to perform TMDL compliance monitoring – from securing monitoring equipment, to taking samples, to performing the analysis and reporting on the samples collected. A second area where the District requires technical assistance is working with federal landholders. A number of the proposed projects are located on federal lands. To date most of these landholders have been reticent to allow the District access to their lands to treat stormwater pollution. The District could use the weight of a federal agency supporting our efforts and negotiating on our behalf with the major federal landholders – the National Park Service, the military services, the Government Services Administration, and the Architect of the Capitol.
Outreach, Education and Public Participation
Strategy for Stakeholder Outreach The District Department of the Environment is not a landholder in the city. It relies on the willingness of those that do own or manage land in the city to provide access to install pollution management measures. Moreover, approximately 1/3 of the land in the District is federally controlled, which requires an additional burden of coordinating with a second level of bureaucracy. In order to achieve the load reductions presented in this document, DDOE will need the interest and support of District landowners and other stakeholders. DDOE recognizes the importance of performing outreach to Rock Creek stakeholders to educated them about water pollution issues and to engage them in the adopting pollution reduction activities on their land. DDOE WPD has already developed a number of outreach and education activities and incentive programs aimed District landowners (see the General Management Measures Section of this document), however, in coordination with its Stormwater Management Division, the WPD will be revising its outreach strategy and developing new outreach programs in the coming months. The DDOE is undertaking the development of a new outreach strategy as a condition for its MS4 permit and to meet Watershed Implementation Plan requirements. The District Department of the Environment has already identified many key stakeholder organizations that are currently involved in activities to help restore Rock Creek. In order to better identify and prioritize restoration efforts, DDOE will distribute this draft WIP to the following stakeholders for review and comments (see

Rock Creek Watershed Implementation Plan August 15, 2010 86
Stakeholder Outreach Task List Timeline Table 25). It is hoped that these stakeholders will identify additional specific and general projects to achieve further pollutant load reductions in Rock Creek. Once comments have been received they will be evaluated and incorporated into this document, as appropriate. Table 26: Stakeholder Outreach Task List and Timeline
Task Completion Date Notes Create Master Project List August 30, 2010 Master project list will include prioritized projects
from Rock Creek and other watersheds. Divide Master Project List by landowner and stakeholder
September 30, 2010
Meet with MS4 permit partners and provide them with their customized Master Project List
October 2010 MS4 permit partners have an interest in identifying and working to install pollution reducing projects.
Meet with the National Park Service and provide them with their customized Master Project List
November 2010 The NPS is a vital partner because much of their land is impacted by Rock Creek’s uncontrolled stormwater.
Meet with non‐profits to seek buy‐in and feedback
February 2011
Meet with ANCs and Civic/Community Associations to seek buy‐in and feedback
June 30, 2011 This will be a large undertaking because of the large number of ANCs and the need to divide projects identified geographically
Collect new projects, project priorities, and other feedback from landowners and stakeholders
Ongoing starting in October 2010
Update Master Project List based on the feedback from landowners and stakeholders
Ongoing starting in October 2010
The Master Project List will be continuously updated as new projects come up and old projects are completed.
Stakeholders
EPA Chesapeake Bay Program The District Department of the Environment’s goals for Rock Creek are closely aligned with those of the Chesapeake Bay Program. Rock Creek restoration efforts will support the agreement’s goals of: “Living Resource Protection and Restoration” for fish passage; “Water Quality Protection and Restoration” through reduction of nutrient and sediment loads and for the protection of priority urban waters; and “Sound Land Use” by helping to promote stewardship of natural resources through public education and community engagement. The Chesapeake Bay is listed as impaired for nitrogen, phosphorous, sediment. As noted earlier, while no TMDLs exist for nitrogen, phosphorus, or total suspended solids in District portion of the Rock Creek watershed, the District is still committed to reducing total nitrogen, phosphorous, and total suspended solids loads in accordance with the Chesapeake Bay Agreement. As the EPA moves to enforce the Chesapeake Bay TMDL it is expected that load reductions for nitrogen, phosphorus and TSS will be assigned to the its tributaries which may mean required reductions for Rock Creek.
Rock Creek Watershed Implementation Plan August 15, 2010 87
The Chesapeake Bay Program has moved to utilizing specific two-year restoration actions with five and ten year load reduction targets. It is expected that the activities laid out in this WIP will inform the specific restoration actions and the more long-term load reduction targets.
District Department of the Environment The Department of Environment Watershed Protection Division is responsible for watershed management planning within the District of Columbia. The division manages DC watersheds according to three types of actions that occur within their boundaries:
1. Scheduled, mandated actions 2. Scheduled, “voluntary” actions 3. Unscheduled and unanticipated events
The DDOE’s Watershed Protection Division manages these actions in accordance with its mission to conserve the soil and water resources of the District of Columbia and to protect its watersheds from nonpoint source pollution. The Branches within the Watershed Protection Division are responsible for the following activities: Planning and Restoration Branch – In addition to being responsible for all watershed planning within the District, this branch also fulfills a number of other mandated responsibilities. The first of these responsibilities is to encourage pollution prevention by carrying out information and education campaigns, and increasing involvement in cleanup efforts in the District of Columbia watersheds and the Chesapeake Bay. Second, the Nonpoint Source Management Branch sponsors activities that protect and restore river, stream, and wetland habitats in DC, increase the DC and Chesapeake Bay watershed's ecological diversity, and protect the health, welfare, and safety of our residents. Lastly, the branch’s education segment sponsors teacher-training workshops in environmental education using nationally accredited environmental curriculums. These curriculums provide teachers with continuing education credits, and provide students with meaningful environmental experiences via outdoor activities, and events. The Watershed Protection Division’s developed its RiverSmart Homes and RiverSmart Schools programs to combine all three missions of the Branch. RiverSmart Schools provides teachers with the necessary training and financial resources to install conservation sites on their school grounds and utilize them for educational purposes. These innovative schoolyard greening projects focus on incorporating landscape design principles that retain and filter stormwater runoff. Selected schools participate in the program over the course of two school years. RiverSmart Homes is a District-wide program that offers incentives to homeowners interested in reducing stormwater runoff from their properties. Homeowners receive up
Rock Creek Watershed Implementation Plan August 15, 2010 88
to $1,200 to adopt one or more practices on their property including shade trees, rain gardens, cisterns, permeable paving, and landscaping with native plants. Sediment and Stormwater Technical Services Branch – This branch has developed and enacted storm water management and sediment and erosion control regulations for construction sites. The branch reviews construction and grading plans for stormwater management, erosion and sediment control, and flood plain management considerations. As required by EPA regulations regarding new construction permits, all new construction in the District must have Storm Water Pollution Prevention Plans (SWPPPS) that "identify all potential sources of pollution which may reasonably be expected to affect the quality of storm water discharges from the construction site." Through the work of this branch, many BMPs are installed every year through the plan review process. All construction that disturbs over 5,000 square feet requires a stormwater certification from WPD review engineers. This regulatory process is one that is under a mandate to ensure that post-development flows mimic pre-development stormwater runoff. WPD is currently establishing new regulations that will encourage the development community to focus on the installation of LID. Efficiency percentages for LID practices are higher and will remove a greater percentage of nutrients and sediments. The current focus of WPD is to install LID where appropriate and strongly encourage developers to incorporate this stormwater management technique Inspection and Enforcement Branch – Following up on these plan reviews, the Inspection and Enforcement Branch makes construction site visits to enforce compliance with the District of Columbia’s sediment control and storm water management laws and regulations. In the process, they also inspect Best Management Practices (BMPs) to ensure they are adequately maintained. Lastly, the Branch is also responsible for investigating citizen complaints relating to soil erosion and drainage problems, and recommending appropriate solutions. In addition to the DDOE’s mandated activities, the administration also has the freedom to participate in non-mandated activities that further support watershed protection. Examples of these activities include the majority of the watershed studies and restoration projects that are implemented throughout the District. The DDOE frequently seeks the expertise of private contractors and federal agencies when carrying out these voluntary actions. This gives the administration the flexibility needed to accomplish objectives vital to the overall goal of protecting DC watersheds, in situations that might not otherwise receive attention.
DC Department of Parks and Recreation (DPR) DPR supervises and maintains area parks, community facilities, swimming pools and spray parks, and neighborhood recreation centers, as well as coordinates a wide variety

Rock Creek Watershed Implementation Plan August 15, 2010 89
of recreation programs. DPR is a crucial partner in the implementation of this WIP in that it manages large blocks of city land with the potential to manage stormwater. Even before this WIP was circulated DPR has been working to retrofit Rock Creek’s parks with LID practices to infiltrate stormwater and reduce pollutants to Rock Creek.
US Department of Agriculture (USDA), Natural Resources Conservation Service (NRCS) The NRCS of Maryland provides technical assistance to the DDOE in locating and installing stormwater retrofits. In the past NRCS has performed a parkland and recreation center soil assessment for 87 sites within the DPR system that prioritizes recreation centers and parks that suffer from erosion for restoration. NRCS also provides technical services in performing large and local scale soil characterizations that are useful in sighting and sizing LID practices.
DC Public Schools (DCPS) and Office of Public Education Facilities Modernization (OPEFM) Similar to the recreational facilities, the DCPS and OPEFM oversee, maintain, and modernize the City’s public schools. There are dozens of schools in the Rock Creek watershed, many of which are slated for renovation or are currently under renovation. These renovations offer an opportunity to incorporate LID and providing outdoor learning areas for environmental education.
DC Department of Transportation (DDOT) The District Department of Transportation (DDOT) is responsible for maintaining streets, roads, alleyways and sidewalks in the city. DDOT has begun to adopt the use of Low Impact Development (LID) strategies to control stormwater and stormwater pollution. The city is currently demonstrating many types of LID including:
Infiltration tree box planters – tree boxes that accept runoff from sidewalks and roadways to treat the stormwater and provide water for the trees.
Silva Cells, structural soils, and other tree root expansion techniques – These tools help expand the space available for the growth of tree roots which allows for a larger and healthier tree and the greater potential for the uptake of stormwater and stormwater pollutants.
Bioretention – This can take the form of standard bioretention cells or bump outs into the street that are generally placed near intersections. These bump outs provide a safer crossing area for pedestrians by reducing the street area that they have to cross; they slow traffic by narrowing the road; and they accept runoff and treat stormwater pollution.
Permeable pavements – Permeable pavements take many forms including paving stones, porous concrete, and porous asphalt. The District is testing different permeable pavements in different applications such as alleyways, sidewalks, and roadways to determine which are appropriate and cost effective.

Rock Creek Watershed Implementation Plan August 15, 2010 90
DDOT is also working to reduce pollutants to the city’s waterways by encouraging commuters to use alternative forms of transportation. DDOT is expanding the number of bike lanes in the city, installing bike-share racks, creating trolley and high speed bus lanes, and operating lower polluting hybrid and natural gas powered busses for its “Circulator” routes. The District Department of Transportation also houses the City’s Urban Forestry Administration (UFA). The Urban Forestry Administration (UFA) maintains the city’s street trees pruning and planting to manage trees in a harsh environment of power and sewer lines, impervious surfaces, road salt, and punishing summer heat. UFA plants an average of 4150 trees annually, maintains the thousands of existing city trees, and works to improve growing conditions for street trees by removing unneeded impervious areas, experimenting with new tree box technology such as structural soils and Silva cells, and watering trees and pruning trees.
District Department of Public Works (DPW) The Department of Public Works provides a number of public services that affect the Rock Creek watershed. DPW oversees solid waste collection, the collection of hazardous wastes, recycling, leaf collection, and street and alley cleaning programs. These programs together help trash, hazardous waste, and pollutants and sediment from roadways do not end up in Rock Creek. In addition DPW leads the Solid Waste Education and Enforcement Program (SWEEP) which provides the tools for District residents to combat illegal dumping, clean up vacant lots, and support neighborhood clean-ups.
DC Water and Sewer Authority (WASA) WASA is responsible for collecting and treating wastewater in the District – including stormwater in the portion of the city served by the Combined Sewer System (CSS). As a part of these duties, WASA maintains the network of pipes and catch basins that collect and convey stormwater throughout the city. WASA has developed and is implementing a long-term control plan for the CSS found in a portion of the Rock Creek watershed. As a part of this effort WASA is making upgrades to the CSS, separating combined sewers in some areas, and exploring the potential for using LID to reduce combined sewer overflows – particularly in the Piney Branch sewershed.
National Park Service (NPS) The National Park Service manages a great deal of the federally-controlled lands in the Rock Creek watershed. Rock Creek Park is the largest of these landholdings, but the NPS also oversees a large portion of the Fort Circle Parks and many smaller squares and triangle parks. In recent years the NPS has overseen the removal of several blockages to fish passage and the installation of a fish ladder at Pierce Mill. These

Rock Creek Watershed Implementation Plan August 15, 2010 91
projects have given fish access to all portions of the main stem of Rock Creek in the District. Recently the NPS and DDOE have begun to work together to design and install regenerative stormwater conveyances – a type of LID that treats and infiltrates stormwater while maintaining the natural appearance of protected parkland. Furthermore DDOE and NPS are partnering to daylight (restore to the surface) a stream that had been piped in the 1950’s.
Friends of Rock Creek Environment (FORCE) Formed in the spring of 2005, the Friends of Rock Creek Environment (FORCE) is a citizen-based, non-profit organization that works throughout the watershed on education and restoration projects. The group’s activities to date include coordinating stream cleanups, removing invasive species, marking storm drains, performing water quality monitoring, and installing and maintaining LID. FORCE has a large community of members and volunteers and is highly effective at communicating to the public and mobilizing citizens.
Casey Trees Casey Trees is a non-profit organization dedicated to expanding and caring for the District’s tree canopy. As a part of this effort, Casey runs community tree planting programs, a tree rebate program, and plants trees for DDOE’s RiverSmart Homes program. Additionally Casey leads classes in the identification and care of trees and performs monitoring and modeling of canopy cover. Casey has an active and knowledgeable cadre of volunteer “citizen foresters” that aid its paid staff in their mission.
Rock Creek Advisory Neighborhood Commissions The Advisory Neighborhood Commissions are elected bodies that weigh in on issues that affect their neighborhoods. ANCs consider a wide range of policies and programs affecting their neighborhoods, including traffic, parking, recreation, street improvements, liquor licenses, zoning, economic development, police protection, sanitation and trash collection, and the District's annual budget. In each of these areas, the purpose of the ANCs is to ensure input from an advisory board that is made up of the residents of the neighborhoods that are directly affected by government action. The ANCs are the body of government with the closest official ties to the people in a neighborhood. The ANCs present their positions and recommendations on issues to various District government agencies, the Mayor, and the City Council. They also present testimony to independent agencies, boards, and commissions. There are fifteen ANCs in the Rock Creek watershed (ANCs 1A-D, 2B, 2D, 2E, 3C, 3E-G, and 4A-D). As a part of outreach efforts for this plan DDOE will bring the projects and findings from this report to the various ANC commissions. ANC partners will be critical partners in helping to galvanize community support for restoration activity.

Rock Creek Watershed Implementation Plan August 15, 2010 92
Rock Creek Civic and Community Associations Civic and community associations are neighborhood groups dedicated to informing, representing, and supporting their communities. These groups disseminate information to help citizens keep abreast of developments and activities that affect their welfare. These groups also represent their residents through testimony and letters on important issues. Unlike ANCs, civic and community associations are not an official part of the District government. District residents, however often better identify with their local civic or community association than their ANC because they are based on a neighborhood identity. There are fifteen known community and civic associations in the Rock Creek watershed. As a part of outreach efforts for this plan DDOE will bring the projects and findings from this report to the various associations. Like ANCs, the community and civic associations are an important resource in educating the community and garnering the support of District residents for restoration activities.
Montgomery County Department of Environmental Protection The restoration and protection of the Rock Creek watershed, the second largest in Montgomery County, is a priority for the Montgomery County Department of Environmental Protection (DEP). The County recently undertook a Countywide Stream Protection Strategy initiative to preserve, protect, or restore watersheds by evaluating existing conditions. Based upon the stream analysis as well as several other factors, has undertaken dozens of management and stream restoration projects designed to reduce pollution in Rock Creek and restore stream habitat.
Washington Suburban Sanitary Commission The Washington Suburban Sanitary Commission (WSSC) provides sanitary services to approximately 1.6 million residents in Prince George’s and Montgomery counties. Similar to efforts by WASA and other District agencies, the WSCC works to minimize the chances of sewage overflows and to maintain stormwater and sewer infrastructure in the upstream portions of the Rock Creek watershed. In 2005 WSSC entered into a consent decree with the EPA where WSSC is required to implement over 14 years numerous reporting, monitoring, inspection, maintenance, repair and replacement remedial measures for its sewer collection system in order to eliminate sewer overflows.

Rock Creek Watershed Implementation Plan August 15, 2010 93
Monitoring
Criteria for Determining Load Reductions
Current Monitoring The District currently performs a great deal of monitoring in the Rock Creek watershed. DDOE performs in-stream monitoring of water quality parameters, takes samples of fish tissue, and surveys aquatic life for the Integrated Report to the EPA as required by the Clean Water Act. Additionally DDOE oversees stormwater monitoring from outfalls as required under the District’s MS4 permit.
Integrated Water Quality Assessment Monitoring The DDOE Water Quality Division monitors two sites on the main stem of Rock Creek and one site on each of the twelve tributaries of Rock Creek for physical, chemical and bacterial parameters. These sites are monitored based on an annual schedule of monitoring activities that are outlined in Table 26 below. Dates for water quality are set in advance and in-stream water quality monitoring takes place in all weather conditions. Moreover, quarterly water quality monitoring ensures that samples are representative of the various seasons. DDOE also monitors biological activity in Rock Creek using benthic macroinvertebrate studies. The District uses the Maryland Biological Stream Survey (MBSS) (Maryland DNR, 2001) protocol for its benthic macroinvertebrate sampling. Table 27: Rock Creek Water Quality Monitoring Parameters
Parameters Monitored Frequency Type of Sample
Bacteria (E. Coli) Quarterly Grab Sample
Temperature, Salinity, Dissolved Oxygen %, Dissolved Oxygen Concentration, pH, Turbidity, Chlorophyll, and Hardness
Quarterly In Situ
Dissolved Metals (Zinc, Lead, Copper, Arsenic) Quarterly Grab Sample
Benthic Macroinvertebrates Annually District of Columbia Stream Survey (adapted from Maryland Biological Stream Survey)
Habitat Assessment Annually District of Columbia Stream Survey (evaluate in‐stream habitat, channel morphology, and structural features of bank and riparian vegetation)
Fish Assessment Annually Index of Biotic Integrity

Rock Creek Watershed Implementation Plan August 15, 2010 94
Using the data collected, DDOE’s Water Quality Division prepares the biannual Integrated Report to the Environmental Protection Agency. This report, which was last prepared in 2008, satisfies the listing requirements of §303(d) and the reporting requirements of §305(b) of the federal Clean Water Act (P.L. 97-117). A summary of the monitoring in Rock Creek can be found in Appendix J. Based on the monitoring over the 2006-2008 time period, Rock Creek did not meet its designated uses.
MS4 Permit Monitoring The other source of water quality data for Rock Creek is stormwater outfall monitoring done to meet the requirements of the city’s stormwater permit. Under the most recent permit, the District monitored ten stations in Rock Creek – six required stations and four additional stations (see Table 27 for a list of monitoring stations). The Rock Creek stations are monitored once annually and every three years they are monitored more intensely. In the most recent available Discharge Monitoring Report for Rock Creek (DDOE, 2007), each of the ten stations average these stations was sampled on average three times during storm events. Four of these stations were also sampled twice a year over the same time period during dry weather. The samples collected at these stations are analyzed for over 150 parameters. A summary of the most recent storm water outfall findings for Rock Creek can be found in Appendix K. Table 28: Rock Creek Monitoring Stations
Site Number Sampling Location Estimated Drainage Area (acres)
1 Walter Reed – Ft. Stevens Drive 25 2 Military Rd and Beach Drive 37 3 Soapstone Creek – Connecticut Avenue and Ablemarle Street 330 4 Melvin Hazen Valley Branch – Klingle Road and Porter Street 88 5 Klingle Valley Creek – Devonshire Place and 30th Street 52 6 Normanstone Creek – Normanstone Drive and Normanstone Parkway 10 7 Portal Street and 16th Street 6 8 Broad Branch ‐ Broad Branch Road and 30th Street near the Ivory Coast Embassy 540 9 Oregon Avenue and Pinehurst Road 84 10 Archibald Parkway – Intersection of New Mexico Avenue. and Garfield Street 49
Enhanced Monitoring Strategy To ensure that the monitoring program helps to inform the Rock Creek restoration effort and to make certain that the restoration effort has a measurable impact on improved water quality, DDOE will carry out a comprehensive monitoring regiment for Rock Creek and its tributaries. Monitoring data will form an information feedback loop that allows planners to adjust the implementation strategy as new information becomes available. Most importantly appropriate monitoring will demonstrate that the outcome of a clean and healthy water body, which can be enjoyed by the Districts residents, is met.
Rock Creek Watershed Implementation Plan August 15, 2010 95
As is evident from the current monitoring in Rock Creek detailed above, DDOE is committed to gathering comprehensive and relevant water quality data for Rock Creek. A fairly comprehensive monitoring strategy has already been implemented, however there are gaps in the available data for Rock Creek that will need be addressed. Building on the existing monitoring strategy, the enhanced monitoring strategy will have the following additional components:
An analysis of monitoring data taken to date to determine if Rock Creek can be delisted for some pollutants;
An expansion of water quality monitoring to include targeted in-stream sampling of loads during storm events;
An integration of existing monitoring efforts; Adding monitoring for organic pollutants; and Monitoring at both upstream/end of pipe and at the mouth of targeted
tributaries to better determine loads and load reductions. Each of these four proposals is discussed in more detail below. These additions to current monitoring activities will give a more comprehensive picture of existing conditions and establish a baseline from which progress toward TMDL endpoints can be measured. Using the enhanced monitoring data will then provide an information feedback loop that will allow planners to adjust the implementation strategy as new information becomes available. Most importantly, monitoring data will help ensure that the outcome of a clean and healthy water body, which can be enjoyed by the Districts residents, is met.
Analyze Existing Data There is some monitoring evidence to suggest that at least a few of the pollutants listed for Rock Creek and its tributaries are no longer present in quantities that impair the waterways. In order to delist these pollutants DDOE should first examine its historical monitoring records to determine if there is sufficient evidence to warrant delisting. If there is some evidence, but not enough to justify delisting, additional focused monitoring should be undertaken.
Expand In-Stream Water Quality Monitoring As noted above, currently DDOE’s Water Quality Division performs only ambient water quality sampling. It is understandable that DDOE has to date focused on ambient sampling; it is predictable, cost-effective, straight forward and can be done during regular working hours. That being said, most pollutant loads are delivered during storm events. For this reason, expanded monitoring will include targeted, in-stream sampling during storm events. Depending on the outcome of the current review of the District monitoring protocols, stormwater sampling could entail:
Stormwater monitoring in watersheds where focused restoration work is taking place; or
Rock Creek Watershed Implementation Plan August 15, 2010 96
Stormwater monitoring in watersheds on a rotating basis (as is done for the MS4 permit); or
A combination of the two.
Integrating Existing Monitoring Efforts As was already noted, currently monitoring in Rock Creek is performed by both the Water Quality Division and the Stormwater Division. The reasons that the two divisions monitor are different, hence the parameters that they monitor are different as are the monitoring locations and the frequency of monitoring. That being said, under the enhanced monitoring effort, a more integrated approach to monitoring Rock Creek will be used to get better data and to save money. The first step in taking this approach will be to examine the monitoring sites to make sure that they are representative of the watershed. If sites are physically clumped together, could they be better spread apart to represent the entire watershed? If they are temporally close, could they be spread out better across the year? Next, creating a unified monitoring effort will examine the use of District resources. Would it make more sense to have one contract for in-stream and stormwater sampling to create an economy of scale and reduce duplicative efforts? If the Water Quality Division is out taking ambient samples, could they collect dry weather outfall samples as well? Could DDOE’s Fisheries and Wildlife Division perform the rapid bio-assessment instead of the contractor for the Stormwater Division? Finally in addition to integrating the field component, the enhanced monitoring effort will combine monitoring efforts for reporting purposes. Including the results from both stormwater and stream outfalls in reports would give a more complete picture of the health of the waters of Rock Creek.
Adding Monitoring for Organic Pollutants The District does not currently effectively monitor for organic pollutants. This gap is understandable in that these pollutants are notoriously difficult to monitor. They require complicated monitoring protocols and they require sensitive laboratory equipment. Consequently monitoring for them can be very costly and is not always a good use of resources. To close this gap DDOE proposes a dual strategy of biological monitoring and continuous in situ water quality monitoring. Biological monitoring will examine fish tissue samples to ascertain the presence of organic pollutants that are harmful to human health. The in situ monitoring will be done using a Continuous Low-Level Monitoring device, or CLAM. The CLAM is a submersible extraction sampler, using EPA approved SPE (Solid Phase Extraction) media to sequester Pesticides, Herbicides, PAH’s, TPH, and other trace organics from water.

Rock Creek Watershed Implementation Plan August 15, 2010 97
Using this type of sampling device will allow DDOE to both determine the presence or absence of these chemicals, but also help localize their sources. Sampling using this system would begin at the lowest reaches of Rock Creek and move upstream. By moving upstream with subsequent samples DDOE can pinpoint the source(s) of organic pollution, if any. Similarly, fish tissue analysis will show if there are high levels of organic and metals pollutants which may be harmful to human health if consumed.
Monitor Both Upstream and at the Mouth of Tributaries As noted in the discussion on integrating monitoring efforts, the enhanced monitoring protocol will examine the monitoring sites to make sure that they are representative of the watershed. It is clear that the District does not have unlimited resources for monitoring. So that expanding our monitoring effort does not reduce DDOE’s ability to undertake restoration efforts due to it additional costs, the upstream/downstream monitoring will only take place in targeted watersheds. Like adding in-stream stormwater monitoring, how this expansion takes place will depend on the results of the current review of the District monitoring protocols. Upstream/downstream sampling could entail:
Performing this monitoring in watersheds where focused restoration work is taking place; or
Performing this monitoring in watersheds on a rotating basis (as is done for the MS4 permit).
Table 29: Enhanced Monitoring Task List and Timeline
Task Completion Date Notes Study ambient monitoring program and report on potential ways of improving it
Complete Internal report is currently being reviewed.
Develop taskforce of Water Quality, Stormwater, and Watershed Protection Divisions to develop enhanced monitoring strategy
Complete Currently ongoing
Examine new techniques and technologies for monitoring organics
June 2011 This work is currently ongoing.
Examine existing MS4 and ambient monitoring locations for overlaps and gaps
December 2010
Deploy and test new techniques and technologies for monitoring organics
March 2011 This is dependent on funding availability.
Examine potential targeted stormwater monitoring sites
May 2011 This analysis will feed into the next task.
Determine new monitoring locations based on overlap and gap analysis
June 2011
Begin monitoring at new monitoring locations October 2011 Perform analysis of existing monitoring data December 2011 This is dependent on funding availability. Decide upon methodology for monitoring organics and commence use in targeted areas
December 2011
Commence targeted stormwater monitoring March 2012 Complete overarching enhanced monitoring strategy
18 months from issue of new MS4 permit
This will depend on when the new permit is issued.
Rock Creek Watershed Implementation Plan August 15, 2010 98
Establishment of Benchmarks The District has laid out the methodology to be used in identifying specific technologies that can be installed at proposed locations and how to estimate the pollutant reduction achieved by that technology. Benchmarks for this Plan will vary depending on the project or activity being measured. For instance, constructed LIDs are more easily evaluated based on the number of units installed, the area treated, the efficiency of the unit, and the storm water pollutant load measured at the selected location. The annual measure of success for these projects will be the completion of scheduled projects. On the other hand, the success of public outreach activities cannot be measured by chemical sample analysis of a sewershed or sub-sewershed. The annual success for these types of activities will be measured by indirect benchmarks (e.g., number of citizens reached with a message or number of pamphlets distributed in the case of public outreach). As noted earlier in this section, the Water Quality Division is currently reevaluating their monitoring program. We have suggested some guidelines for how to more effectively monitor Rock Creek. Regardless of the outcome of DDOE’s monitoring program, demonstration of load reductions in Rock Creek will still follow the same method. Load reductions will be calculated using the Simple Method and will be reported by comparing the monitoring data for that pollutant to the required load reductions for each pollutant and each impaired water body. The aim of this WIP is to utilize the most efficient, cost-effective projects and activities to achieve maximum pollutant load reductions with the resources available to the District, and measure progress based a comprehensive and cost effective monitoring program. The District will continue to seek out additional resources for the control of storm water pollutants entering Rock Creek to quickly and effectively meet its TMDLs.
Rock Creek Watershed Implementation Plan August 15, 2010 99
References Aalto, J.A., Jaworski, W.A., and Schremp, W.H. A Water Study of the Rock Creek Watershed. FWPCA, Middle Atlantic Region, 1969. Banta, W.C. 1993. Biological water quality of the surface streams of the District of Columbia. Occasional Publications, Department of Biology, American University, Washington, DC 20016. Volume 2, no. 1. Center for Watershed Protection Division. 2001. Rock Creek Watershed Restoration Action Plan. Prepared for Montgomery County Department of Environmental Protection in cooperation with URS Corporation. Center for Watershed Protection Division. 2003. New York State Stormwater Management Guide—The Simple Method to Calculate Urban Stormwater Loads (Appendix A). Prepared for the New York State Department of Environmental Conservation. CH2M Hill, 1979. Rock Creek Watershed Conservation Study, prepared for the National Park Service. CH2M Hill. W12124.A0. District of Columbia Department of Health. 2004. Nutrient and Sediment Tributary Strategy. District of Columbia Stormwater Administration. 2005. Rock Creek Watershed Total Maximum Daily Load Waste Load Allocation Implementation Plan. District of Columbia Water and Sewer Authority (WASA). 2002. Combined Sewer System Long Term Control Plan. District of Columbia Department of Health. 2002 Water Quality Report to US EPA and Congress. District of Columbia Department of Health. 2004a. District of Columbia Final Total Maximum Daily Loads for Metals in Rock Creek. Environmental Health Division, Bureau of Environmental Quality, Water Quality Division. District of Columbia Department of Health. 2004b. District of Columbia Final Total Maximum Daily Loads for Fecal Coliform in Rock Creek. Environmental Health Administration, Bureau of Environmental Quality, Water Quality Division.
Rock Creek Watershed Implementation Plan August 15, 2010 100
District of Columbia Department of Health. 2004c. District of Columbia Final Total Maximum Daily Loads for Organics and Metals in Broad Branch, Dumbarton Oaks, Fenwick Branch, Klingle Valley Creek, Luzon Branch, Melvin Hazen Valley Branch, Normanstone Creek, Pinehurst Branch, Piney Branch, Portal Branch, and Soapstone Creek. Environmental Health Administration, Bureau of Environmental Quality, Water Quality Division. District of Columbia Storm Water Administration. 2005. Draft: Rock Creek Watershed Total Maximum Daily Load Waste Load Allocation Implementation Plan. Prepared with assistance by EA Engineering, Science, and Technology for Municipal Separate Storm Sewer System NPDES Permit No. DC0000221. United States Department of Agriculture. Draft Soil Erosion Assessment of District of Columbia Parks & Recreation Properties. Prepared for District of Columbia Department of Parks and Recreation in cooperation with District of Columbia Department of Health. United States Environmental Protection Agency. 2002. National Water Quality Inventory: 2000 Report. Office of Water, Publication EPA-841-R-02-001. USDA, Soil Conservation Service. 1976. Soil Survey of the District of Columbia. USGS, 2002, Water Quality, Sediment Quality, and Stream-Channel Classification of Rock Creek, Washington D.C., 1999-2000, Baltimore, Maryland.
Related Documents