RiverPark Short Term High Yield Fund & RiverPark Strategic Income Fund First Quarter 2015 Commentary Thirty‐eight years ago, the Delaware Bay froze over and stayed frozen for 45 days, a record that stands today 1 . With boyhood enthusiasm, I told my parents I was going to walk over the bay from New Jersey to Delaware. As I sprinted out, I heard subtle cracking sounds as the ice shifted from my weight and briefly stopped to reconsider my actions. It was just enough time for my father to catch up and warn me that, while the ice may be miles wide, it was probably not thick enough to support me on my quest. This was an early lesson in weighing risk versus reward. The 2008 financial crisis highlighted systematic risks which prompted the U.S. Government to pursue regulation and policies to protect citizens from future hazards and jump‐start a recovery from the “Great Recession”. 2 The reforms aimed at “Too Big to Fail” 3 institutions and implementation of “Quantitative Easing” 4 , have definitely restored a sense of stability, but not without unintended consequences. In March 2015, the Bank of International Settlements and Moody’s Investor Services highlighted the adverse impact on bond market liquidity and the consequences of low interest rates which encourage companies to lever up. The plethora of new financial regulations has increased corporate bond market transparency 5 and breadth at the expense of market depth. The financial crisis forced Wall Street to deleverage and unwind proprietary trading positions. The “Volker Rule” 6 sealed the fate of the business model, permanently curtailing market making activities in favor of agency transactions. In other words, Wall Street would no longer serve as a provider of liquidity, but would be more than happy to continue to take an order and match buyers and sellers on a best efforts, riskless, basis. 1

Welcome message from author
This document is posted to help you gain knowledge. Please leave a comment to let me know what you think about it! Share it to your friends and learn new things together.
Transcript

RiverPark Short Term High Yield Fund &
RiverPark Strategic Income Fund
First Quarter 2015 Commentary
Thirty‐eight years ago, the Delaware Bay froze over and stayed frozen for 45 days, a record that stands today1. With boyhood enthusiasm, I told my parents I was going to walk over the bay from New Jersey to Delaware. As I sprinted out, I heard subtle cracking sounds as the ice shifted from my weight and briefly stopped to reconsider my actions. It was just enough time for my father to catch up and warn me that, while the ice may be miles wide, it was probably not thick enough to support me on my quest. This was an early lesson in weighing risk versus reward.
The 2008 financial crisis highlighted systematic risks which prompted the U.S. Government to pursue regulation and policies to protect citizens from future hazards and jump‐start a recovery from the “Great Recession”.2 The reforms aimed at “Too Big to Fail”3 institutions and implementation of “Quantitative Easing”4, have definitely restored a sense of stability, but not without unintended consequences. In March 2015, the Bank of International Settlements and Moody’s Investor Services highlighted the adverse impact on bond market liquidity and the consequences of low interest rates which encourage companies to lever up.
The plethora of new financial regulations has increased corporate bond market transparency5 and breadth at the expense of market depth. The financial crisis forced Wall Street to deleverage and unwind proprietary trading positions. The “Volker Rule”6 sealed the fate of the business model, permanently curtailing market making activities in favor of agency transactions. In other words, Wall Street would no longer serve as a provider of liquidity, but would be more than happy to continue to take an order and match buyers and sellers on a best efforts, riskless, basis.
1

Addressing the concern head on, the Bank of International Settlements discussed in their recent quarterly review the “Shifting tides – market liquidity and market‐making in fixed income instruments”7:
… in most corporate bond markets, trading appears to be highlyconcentrated in just a few liquid issues, and concentration appears to be increasing in some market segments…In many jurisdictions, market‐making has thus shifted from a principal trading model towards a client‐driven brokerage model. As a result, many market‐makers have become reluctant to absorb large positions and consequently need more time to execute large trades.
Despite the best of intentions, every new regulation and intervention has unintended consequences. The First Law of Thermodynamics states: Energy can neither be created nor destroyed; it may only be controlled, stored or transferred. Similarly, the Volker Rule did not eliminate systemic risk. Instead, the risk was transferred from Wall Street to its institutional clients, the “Buy Side”. Prior to the 2008 financial crisis, Wall Street trading desks actively engaged in market‐making activities and their inventory represented a significant portion of the corporate bond market. A recent Greenwich Associates survey highlights the liquidity void; 38% of buy‐side fixed income participants surveyed felt that trading $15MM or more (par value) bonds was extremely difficult8.
2
This begs the question: Are investors being adequately compensated for this risk? With interest rates at historic lows, finding yield without taking on significant risk can be difficult. It has long been our belief that smaller issues of “money good”9, high yield bonds offer investors a high risk‐adjusted rate of return.
Splitting the high yield market in half by issue size illustrates the significant yield pick‐up10. The bottom 50% of issues has an option‐adjusted‐spread (“OAS”) over US Treasuries of 582 basis points (“bp”) which is 140 bp more yield per year than the top 50% of issues. Coincidently, excluding the energy sector because of recent turmoil and potential future credit losses, the bottom half of issues still maintain an advantage of 140 bp OAS:
High Yield Index Option‐Adjusted‐Spread (ex‐Energy) Top 50% Bottom 50% OAS (JLRG) (JLIT) Difference
31‐Mar‐14 349 bp 433 bp 84 bp 31‐Dec‐14 419 bp 545 bp 126 bp 31‐Mar‐15 398 bp 538 bp 140 bp
Over the past 15 years, investing in an index of the bottom half of issuers would have outperformed the top half of issuers by a cumulative 50.1% in return.
We know there is no free lunch… general consensus is that smaller issues are less liquid than bigger issues. This is not always the case. For instance, in periods of great market stress, we have observed that the larger issues quickly become as illiquid as the smaller issues. Below is a
0% 5% 10% 15% 20% 25% 30% 35% 40%
Less than $5mm
$5mm‐$15mm
Over $15mm
% of Study Participants Who Responsed "Extremely Difficult"
Par Value of Bonds
Buy Side Survey: Ability to Trade Corporate Bonds
3

chart illustrating the difference in OAS between the top 50% and bottom 50% of high yield issues over time:
During the selloff from the internet/telecom bubble and the recent financial crisis, the OAS of the top 50% of issues exceeded that of the bottom 50% of issues. In other words, the price decline was significantly greater in the top 50% issues. A multitude of explanations may be provided, but the key factor is that when elephants stampede, you want to get out of the way. With Wall Street diminished and passive ETFs, as well as other buy‐side parties, increasing their demand for large bond issues, the trade may be a little crowded. Unfortunately, large sell‐offs have a way of converting temporary mark‐to‐market losses into permanent losses as redemptions need to be met.
Like the iced‐over Bay, there would appear to be safety in the on‐the‐run, large bond issues, but that margin of safety is precariously thin and cannot bear the full weight of the market.
We often find value in overlooked and ignored “money good” high yield bonds. During the first quarter of 2015, RiverPark Strategic Income purchased two “off‐the‐beaten‐path” 11bonds that met that criterion: Consolidated‐Tomoka12 4.5% Senior Unsecured Convertible Bonds due 2020 and Nathan’s Famous13 10% Senior Secured Notes due 2020.
Consolidated‐Tomoka Land Company (“CTO”), founded over 100 years ago, is a Florida‐based publicly‐traded real estate company with a portfolio of income‐earning investments and land assets. We have known the CEO for years and even predating his arrival, we were familiar with this sleepy, long standing, value investment. Historically, the company has been considered asset rich and cash flow poor. The current CEO arrived in 2011 and has been successful in
(200) bp
(100) bp
0 bp
100 bp
200 bp
2000 2001 2002 2003 2004 2005 2006 2007 2008 2009 2010 2011 2012 2013 2014 2015
OAS DIFFEREN
CE
Historical OAS Difference
JLIT ‐ JLRG median
Financial Crisis
4
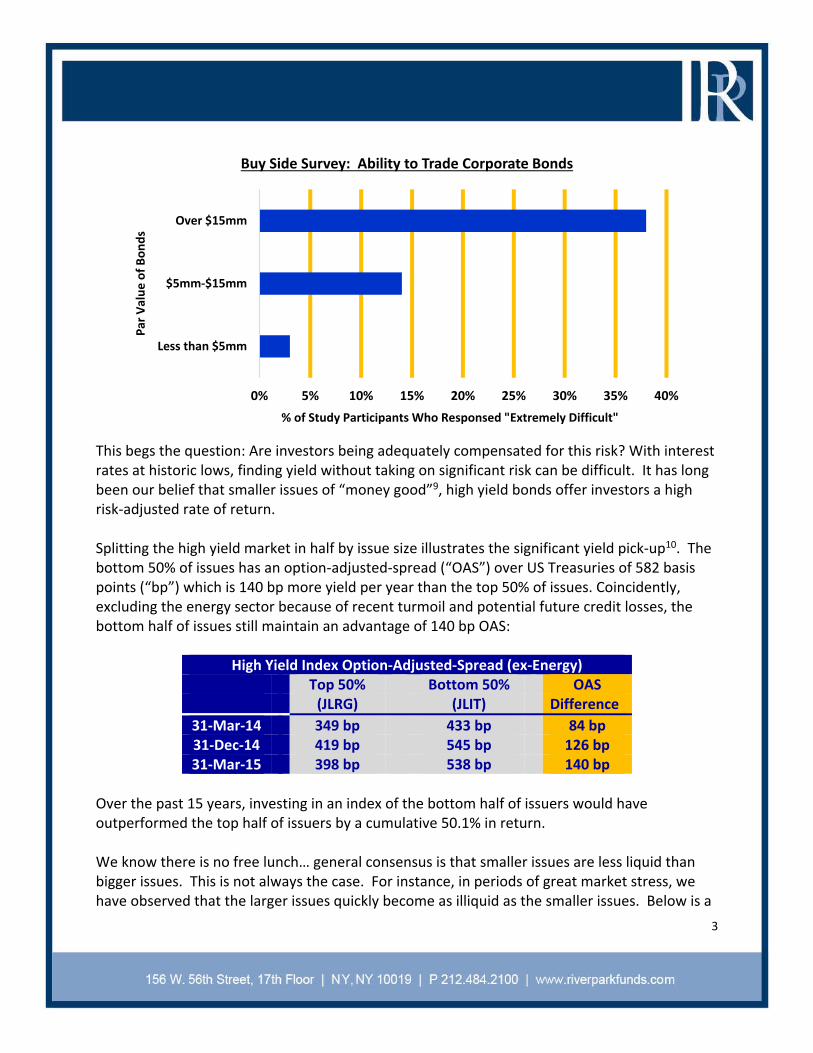
unlocking some of CTO’s value, as reflected by the stock more than doubling to a market cap of over $330 million. In March, CTO issued a $75 million convertible bond with proceeds to be used to repay its credit facility and for general corporate purposes. Purchasing this bond, we were getting the best of both worlds: yield with equity upside. Since the debt is not callable, we assure ourselves a reasonable yield for five years with strong asset coverage and the opportunity to participate in equity upside tied to continued value realization. Following issuance of the bond, it has traded to a significant premium, as expected, yet we see potential for further gains and continue to hold the position. Nathan’s Famous (“NATH”) is a well‐known brand name for hot dogs sold at company‐owned and franchised restaurants, through food service programs and via licensing activities. In March, the company, new to the bond market, issued $135 million senior secured notes to pay a special dividend to its shareholders. Our research showed a recent licensing agreement more than covered the debt and the remaining businesses were extra cushion. In March 2014, NATH signed an 18‐year licensing agreement with a subsidiary of Smithfield Foods requiring minimum licensing fees that would generate enough cash flow to cover the bonds before any additional revenue sharing. Assuming management doesn’t run amok, NATH bonds have an implied Smithfield Foods credit risk further enhanced by cash flows from NATH’s restaurant businesses. Smithfield Foods, which is rated BB‐, has 5.875% unsecured note due 2021 that the market was pricing at a 4.5% YTM. Hence, the new NATH bond compares very favorably with its 10% coupon and secured interests. Moreover, bondholders are protected by effective financial covenants, preventing management from taking additional shareholder‐friendly actions that might degrade the credit in the future, in contrast to typical covenants in investment grade bonds. In a March 2015, Moody’s Investors Service published a report14 entitled Macroeconomics and Corporate Polices Eroding Credit Quality in 2015, addressing the negative impact of low interest rates on corporate behavior:
Investment‐grade US companies are increasingly returning cash to shareholders, and have less free cash flow (FCF) to repay debt today than they did before the recession… Meanwhile, prolonged very low interest rates are making dividends more important to investors, leaving companies increasingly fixated on dividend growth—a risk for credit quality, especially with leverage rising.
As shown below, investment grade corporate bond yields are significantly below the earnings yields (inverse of the P/E ratio) of S&P 500 stocks. This has created an environment in which corporations have incentive to issue debt to effectuate shareholder‐friendly stock buy backs and dividends.
5

While the Moody’s report has created some commotion, we took note of this phenomenon in the fall of 2012. In fact, in the November 29, 2013 edition of Grant’s Interest Rate Observer15, we were quoted to this effect:
What investment‐grade companies are doing is, they’re levering up either to try to grow through expansion, mergers or even build product line(s). Or they’re financial engineering. But, truthfully, with revenues not being so robust, they’re not really growing the business as quickly as they’re growing the debt.”
In the article we discussed our observation of this behavior with respect to Coca‐Cola which, since that time, has increased its debt by approximately 19% and increased its dividend rate by nearly 8%. While many companies are compelled to pursue immediate gratification via financial engineering, a few companies are using cheap money to pursue long term shareholder value, sometimes via strategic acquisitions. Although debt‐financed acquisitions may add leverage, when prudently employed with an alignment of interests among bondholders and stockholders, growth can be re‐ignited that ultimately benefits all financial constituents. Three investments purchased by the Fund(s) in 1Q15 that illustrate this approach are Coach16, Southwestern Energy17 and International Game Technologies18.
6

In 2014, Coach, the designer and retailer of luxury leather goods saw a dramatic decline in revenues and its stock was one of the worst performers in the S&P 500; down over 30% for the year. At the time, Coach had no debt. Rather than appease shareholders with an aggressive stock buyback or dividend policy, they focused long term. Seeking a new source of growth while simultaneously refreshing its core brands, Coach agreed to purchase luxury footwear and accessories producer Stuart Weitzman for $530 million. To finance the transaction, in February 2015, Coach issued $600 million in 4.25% senior unsecured bonds due 2025. We viewed the financing as an attractive investment grade addition to RiverPark Strategic Income Fund. We thought that the 225 bp issuance spread unduly penalized Coach for recent financial performance. With Debt/EBITDA < 1.0x, we encourage Coach to pursue similar transactions and we would be happy to participate in financing them. Suffering from sharply depressed natural gas prices since 2008 that led to treacherously high leverage, Chesapeake Energy was a stressed seller of assets. Taking advantage of the situation, in October 2014, Southwestern Energy agreed to purchase Chesapeake’s oil and gas assets in West Virginia and southwest Pennsylvania for approximately $5.4 billion. Southwestern took a balanced approach to funding the acquisition, utilizing a combination of debt, convertible preferred stock and common equity. Although net leverage is anticipated to increase from approximately 2.0x at year end 2014 to 3.3x at year‐end 2015, we are comforted by the significant equity cushion beneath the convertible preferred. RiverPark Strategic Income participated in the original issuance of the 6.25% convertible preferred shares. Although we thought the new issue was attractive from the perspective of a fixed income investor, equity and convertible investors were more optimistic, driving the shares nearly 20% above their issue price within weeks after the initial offering. With the shares exhibiting equity‐like behavior, the Fund advantageously exited the position. We expect to repurchase the convertible preferred should the price decline. In July 2014, GTech, an international provider of computerized online lottery services agreed to purchase International Game Technologies (IGT), a leader in gaming equipment. Facilitated by the low interest rate environment, GTech saw the opportunity to expand its presence in the worldwide gaming market as part of its growth strategy. Prior to the transaction, IGT was investment grade, while GTech was a high yield issuer. However, with the purchase to be funded with a combination of cash and equity, pro forma leverage was expected to be reasonable. The indentures of IGT’s three outstanding bonds contained language that required that the company offer to repurchase its bonds at a price of 101 upon a “change of control”. In February 2015, after seeing regulatory approval for the deal in a number of jurisdictions and receiving indications from IGT management that it would offer to purchase two of the bond issues at 101 (bondholders of the third issue accepted a consent payment to forego the offer to purchase), both RiverPark Strategic Income and RiverPark Short Term High Yield began to purchase bonds in anticipation of achieving an annualized return of approximately 4%. The
7

combination of the companies was completed in early April, leading to an offer to purchase the IGT bonds that is expected to be completed by mid‐May.
It is useful to note that both Southwestern Energy and Coach have been holdings of RiverPark equity funds19 and collaboration with their investment teams has been rewarding. We have been actively engaged in the corporate bond market for over 25 years and are sensitive to the changing landscape. Consequently, we actively manage the portfolio strategy accordingly.
40‐60% of the holdings of RiverPark Short Term High Yield Fund (RPHYX and RPHIX)
enjoy the organic liquidity of short term maturities that roll into cash approximately
every 60 days. RiverPark Strategic Income Fund (RSIIX and RSIVX) similarly enjoys this
unaided liquidity mechanism through a 15‐35% overlap with Short Term Fund holdings.
The portfolio may experience mark‐to‐market risk as result of this new liquidity
paradigm; however, we rely on our ability to select “money‐good” bonds to enable us to
hold bonds to maturity to achieve targeted returns.
Our commitment to limit capacity and close our funds, mitigates the risk of reliance on
third‐party liquidity and avoids the need to invest in larger blocks of bonds that have
become increasingly difficult to trade and for which investors are not being adequately
compensated.
Cash is an asset class that provides investors with liquidity and affords us the ability to add to positions when others may be buffeted by market illiquidity.
We focus on finding fixed income opportunities outside of the mainstream that provide
our investors with above market returns without taking on additional credit risk.
In today’s low interest rate environment, central banks are encouraging investors to fill up their SUVs with cheap gas and drive on out onto the frozen bay, ignoring potential risks. Having heard the ice cracking in my youth, I will keep us closer to shore.
Sincerely,
David Sherman and The Cohanzick Team
8

1 James E. Salmon, Public Information Officer for Delaware River and Bay Authority: “The longest freeze up occurred in 1977, 45 consecutive days beginning January 11 of that year.” 2 Although the “Great Recession” is widely attributed as occurring in the late 2000’s as the largest economic decline since the Great Depression, the etymology is unclear, see Catherine Rampell of the New York Times blog on March 11, 2009: http://economix.blogs.nytimes.com/2009/03/11/great‐recession‐a‐brief‐etymology/ 3 “Too Big to Fail” is generally applied to the wave of financial regulation adopted to reduce and prevent economic damage caused by the financial system. For an interesting insight, see Jesse Eisinger of New York Times article dated December 11, 2013 entitled “Soothing Words on ‘Too Big to Fail’, but With Little Meaning”: http://dealbook.nytimes.com/2013/12/11/soothing‐words‐on‐too‐big‐to‐fail‐but‐with‐little‐meaning/ 4 “Quantitative Easing” is associated with unconventional policies pursued by Central Bankers to fight deflation. Ben Bernanke highlighted the array of secret weapons to flood the economy with money at Central Bankers’ disposal in his November 2002 speech “Deflation: Making Sure ‘It’ Doesn’t Happen Here” in which he highlighted Milton Friedman’s “helicopter drop” solution. For a more detailed explanation, see CNBC’s “Quantitative Easing”: http://www.cnbc.com/id/43268061 5 Specifically, the full implementation of TRACE completed in 2014 requires timely electronic price reporting of virtually all corporate bonds. For more specific information or to access this useful service, refer to FINRA’s website: http://www.finra.org/industry/trace/corporate‐bond‐data 6 For a deeper understanding of the Volker Rule, please see the SEC’s press release dated December 10, 2013 providing “Fact Sheet ‐ Final Rules to Implement the ‘Volker Rule’”: http://www.sec.gov/News/PressRelease/Detail/PressRelease/1370540476526 In addition, The Dodd‐Frank Wall Street Reform Act and Consumer Protection Act can be reviewed at the website: http://www.gpo.gov/fdsys/pkg/PLAW‐111publ203/html/PLAW‐111publ203.htm 7 Authored by Ingo Fender and Ulf Lewrick in BIS Quarterly Review dated March 2015, pages 97‐103. The entire report can be found https://www.bis.org/publ/qtrpdf/r_qt1503.pdf 8 Greenwich Associates 2014 Trading Desk Optimization Study
9 A “money good” asset is considered by market participants to be “as good as money” The term “money good” implies a lender will be repaid principal. In other words, one will get a hundred cents on the dollar back. 10 BofA Merrill Lynch Lynch US Cash Pay High Yield Index (J0A0) is a most comprehensive index of all cash coupon paying high yield bonds in the United States with an issue size of $100MM par value or more. As of March 31, 2015, the table below represents dividing J0A0 in equal half by the number issues in which the 50% largest issues in par value comprised of the JLRG index and the 50% smallest issues in par value are comprised of the JLIT index:
9

Overlap of issuers between the JLRG and JLIT is 211. For example, US Steel has two issues in the large index and four issues in the little index. 11 The RiverPark Strategic Income Fund defines “off the beaten path” bonds as: Small issues, not widely‐followed, or less liquid that can offer better yields with what we believe to be comparable or less credit risk than “on‐the‐run” issues 12 As of 3/31/2015, our position in Consolidated‐Tomoka Land bonds, represented 1.11% of the Strategic Income portfolio. 13 As of 3/31/2015, our position in Nathan’s Famous Inc., bonds, represented 1.29% of the Strategic Income portfolio. 14 Authored by Bill Wolfe, Tom Marshella, Paloma San Valentin and Mark Gray, Moody’s Investors Service US Non‐Financial Corporates: Macroeconomics and Corporate Polices Eroding Credit Quality in 2015 dated 3/27/2015. 15 Authored by Jim Grant, Grant’s Interest Rate Observer dated 11/29/2013. Full report available upon request. 16As of 3/31/2015, our position in Coach bonds represented 1.91 % of the Strategic Income portfolio. 17As of 3/31/2015, our position in Southwestern Energy represented less than 1% of the Strategic Income portfolio. 18 As of 3/31/2015, our position in International Gaming Technology bonds, represented 1.39% of the Short Term portfolio and 2.14% of the Strategic Income portfolio. 19 As of 3/31/2015 the RiverPark Large Growth Fund had a 3.41% position in Southwestern Energy common stock, and the RiverPark Long/Short Opportunity Fund had a 4.30% position in the same issue. RiverPark/Wedgewood Fund held a 5.69% position in Coach common stock as of 3/31/2015.
J0A0 JLRG JLIT
Issues 2,280 1,140 1,140
Issuers 1,078 524 765
Par Value $1,341 B $1,000 B $341 B
Market Value $1,343 B $1,008 B $335 B
YTW 6.16% 5.83% 7.15%
YTW Duration 4.08 4.15 3.87
YTM 6.57% 6.23% 7.58%
YTM Duration 4.95 5.05 4.68
OAS 477 bp 442 bp 582 bp
Max Issue Size $4,249 MM $4,249 MM $450 MM
Min Issue Size $100 MM $450 MM $100 MM
10

RiverPark Short Term High Yield Fund &
RiverPark Strategic Income Fund
First Quarter 2015
RIVERPARK SHORT TERM HIGH YIELD FUND MARCH 31, 2015
RiverPark BofA Merrill BofA Merrill BofA Merrill
Short Term High Yield Lynch 1‐Year Lynch 1‐3 Yr Lynch 0‐3 Yr
Fund Performance U.S. Treasury U.S. Corp U.S. HY Index
RPHIX RPHYX Index1 Index1 Ex‐Financials1
1Q15 0.70% 0.64% 0.11% 0.83% 1.77%
YTD 2015 0.70% 0.64% 0.11% 0.83% 1.77%
One Year 2.83% 2.38% 0.21% 1.49% 1.61%
Since Inception*
3.74% 3.44% 0.32% 2.28% 5.40%
* Total Returns presented for periods less than 1 year are cumulative, returns for periods one yearand greater are annualized. Fund Inception Date: September 30, 2010.The performance quoted herein represents past performance. Past performance does not guarantee future results. The investment return and principal value of an investment will fluctuate so that an investor's shares, when redeemed, may be worth more or less than their original cost, and current performance may be higher or lower than the performance. As of the most recent prospectus, dated 1/28/2015, gross expense ratio was 0.90%. Gross Expense Ratio does not reflect the ability of the adviser to recover all or a portion of prior waivers, which would result in higher expenses for the investor. Please reference the prospectus for additional information. 1 The BofA Merrill Lynch 1‐3 Year U.S. Corporate Index is a subset of the BofA Merrill Lynch U.S. Corporate Master Index tracking the performance of U.S. dollar denominated investment grade rated corporate debt publicly issued in the U.S. domestic market. This subset includes all securities with a remaining term to maturity of less than 3 years. The BofA Merrill Lynch 1‐Year U.S. Treasuries Index is an unmanaged index that tracks the performance of the direct sovereign debt of the U.S. Government having a maturity of at least one year and less than three years. The BofA
11
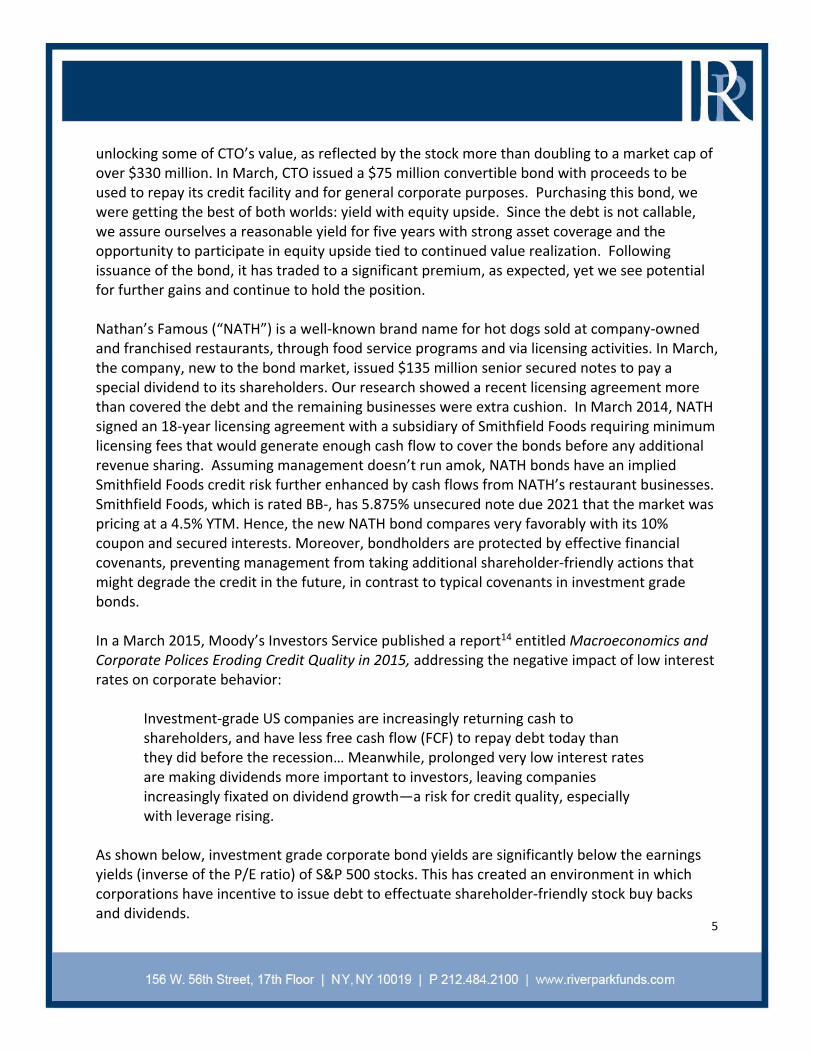
Merrill Lynch 0‐3 Year U.S. High Yield Index Excluding Financials considers all securities from the BofA Merrill Lynch US High Yield Master II Index and the BofA Merrill Lynch U.S. High Yield 0‐1 Year Index, and then applies the following filters: securities greater than or equal to one month but less than 3 years to final maturity, and exclude all securities with Level 2 sector classification = Financial (FNCL).
As of March 31, 2015 the portfolio was comprised of securities with an average maturity of 4.8 months. The average maturity is based on the Weighted Average Expected Effective Maturity, which may differ from the stated maturity because of a corporate action or event.
Source: Bloomberg Professional Analytics
12

At quarter‐end, 52% of the invested portfolio was comprised of securities with an Expected Effective Maturity of 30 days or less. Below is a more specific breakdown of the portfolio’s holdings by credit strategy:
% Of Invested Portfolio As of 3/31/15
Expected Effective Redeemed Event‐ Strategic Cushion Short Term Maturity Debt Driven Recap Bonds Maturities
0‐30 days 45.6% 1.1% 3.3% 1.6% 51.6%
31‐60 days 0.2% 10.2% 0.4% 10.9%
61‐90 days 0.0%
91‐180 days 3.9% 4.5% 8.3%
181‐270 days 3.0% 7.4% 2.2% 12.6%
271 ‐365 days 2.3% 2.3%
1‐2 years 3.6% 7.4% 11.0%
2‐3 years 1.6% 1.8% 3.3%
45.8% 15.2% 6.8% 19.3% 13.0% 08/21/15
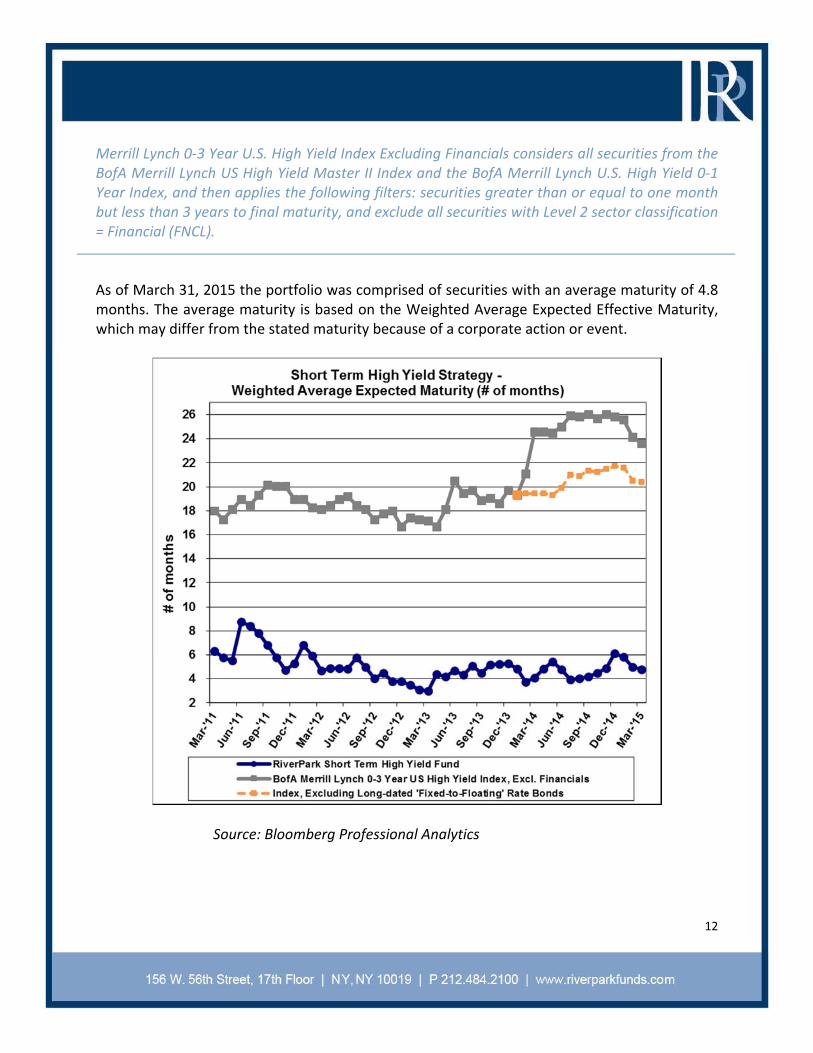
As of March 31, 2015 the Weighted Average Market Yield to Effective Maturity was 5.77% for Effective Maturities of 31 days or more. That comprised 48% of the invested Portfolio.
0.00%
1.00%
2.00%
3.00%
4.00%
5.00%
6.00%
7.00%
0%
10%
20%
30%
40%
50%
60%
70%
80%
Weighted Average M
arket
Yield to Effective M
aturity
% of Invested
Portfolio
Effective Maturites ‐ 31 Days or More
% of Invested Portfolio Wgtd Avg Mkt Yld to Effective Maturity
13

New purchases made by the Fund during the quarter consisted of 52.6% Called/Tendered, 17.7% Event‐Driven, 23.0% Strategic Recap, 1.8% Cushion Bonds, and 4.9% Short Term Maturities. Called and Tendered securities continue to be the most significant component of our purchases. The supply of these bonds remained ample during most of the period.
When combining Called/Tendered purchases with Strategic Recap (which represent securities that are in the process of being refinanced but have not yet been officially redeemed), the figure reached nearly 76% of our purchases during the quarter. We will continue to try focusing a large portion of the Fund in redeemed or soon‐to‐be redeemed securities, especially in times of market weakness, both to keep the Fund’s duration short, and also to ensure that adequate pools of near‐term cash are available to take advantage of attractive new purchases.
14

RiverPark Short Term High Yield Fund &
RiverPark Strategic Income Fund
First Quarter 2015
RIVERPARK STRATEGIC INCOME FUND MARCH 31, 2015
RiverPark Barclay's Morningstar
Strategic Income Aggregate Multisector
Fund Performance Bond Bond
RSIIX RSIVX Index1 Category2
1Q15 1.44% 1.38% 1.61% 1.43%
YTD 2015 1.44% 1.38% 1.61% 1.43%
One Year 3.00% 2.66% 5.72% 2.50%
Since Inception*
5.46% 5.23% 4.95% 4.59%
*Total Returns presented for periods less than 1 year are cumulative, returns for periods one year
and greater are annualized. Inception Date: September 30, 2013The performance quoted herein represents past performance. Past performance does not guarantee future results. The investment return and principal value of an investment will fluctuate so that an investor's shares, when redeemed, may be worth more or less than their original cost, and current performance may be higher or lower than the performance. As of the most recent prospectus, dated 1/28/2015, gross expense ratio was 0.91%. Gross Expense Ratio does not reflect the ability of the adviser to recover all or a portion of prior waivers, which would result in higher expenses for the investor. This option is available contractually to the advisor until January 31, 2016. Please reference the prospectus for additional information. 1 The Barclays U.S. Aggregate Bond Index is a broad‐based unmanaged index of investment grade, U.S. dollar‐denominated, fixed‐rate taxable bond market, including Treasuries, government‐related and corporate securities, MBS (agency fixed‐rate and hybrid ARM passthroughs), ABS, and CMBS. 2 Source: Morningstar Principia. The Morningstar Multisector Bond Category is used for funds that seek income by diversifying their assets among several fixed‐income sectors, usually U.S. government obligations, foreign bonds, and high‐yield domestic debt securities.
15
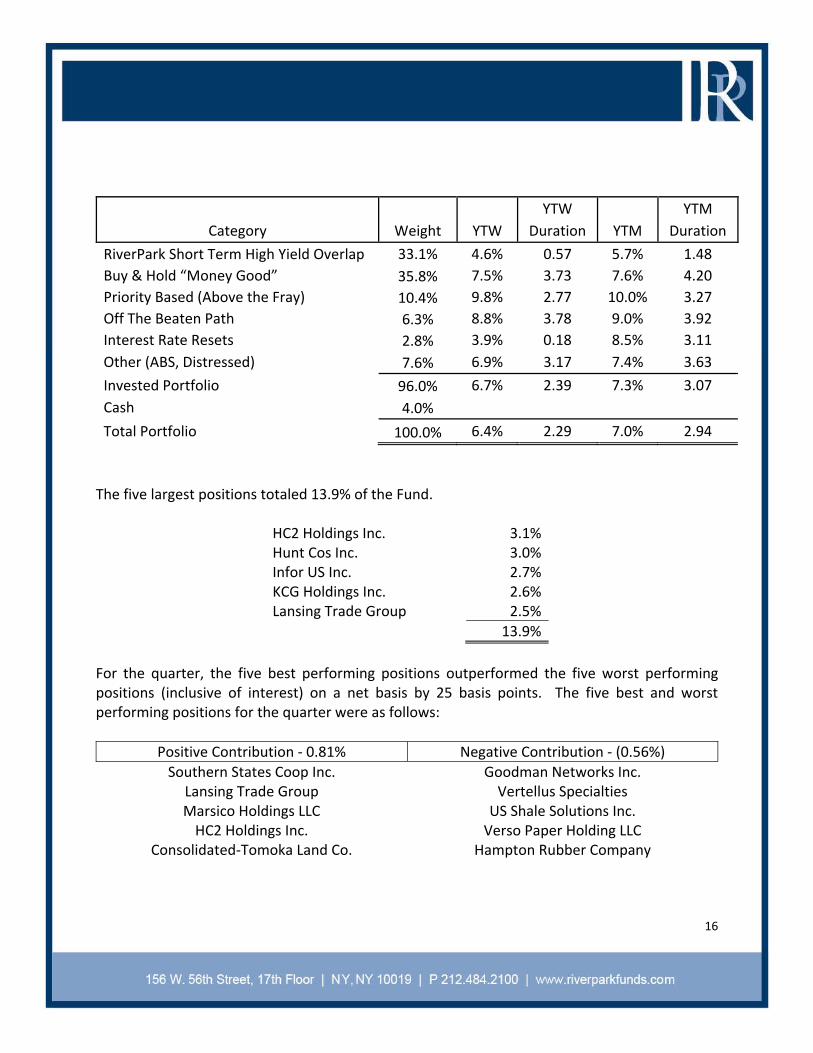
The five largest positions totaled 13.9% of the Fund.
HC2 Holdings Inc. 3.1%Hunt Cos Inc. 3.0%Infor US Inc. 2.7%KCG Holdings Inc. 2.6%Lansing Trade Group 2.5%
13.9%
For the quarter, the five best performing positions outperformed the five worst performing positions (inclusive of interest) on a net basis by 25 basis points. The five best and worst performing positions for the quarter were as follows:
Positive Contribution ‐ 0.81% Negative Contribution ‐ (0.56%)
Southern States Coop Inc. Goodman Networks Inc. Lansing Trade Group Vertellus Specialties Marsico Holdings LLC US Shale Solutions Inc. HC2 Holdings Inc. Verso Paper Holding LLC
Consolidated‐Tomoka Land Co. Hampton Rubber Company
YTW YTM
Category Weight YTW Duration YTM Duration
RiverPark Short Term High Yield Overlap 33.1% 4.6% 0.57 5.7% 1.48
Buy & Hold “Money Good” 35.8% 7.5% 3.73 7.6% 4.20
Priority Based (Above the Fray) 10.4% 9.8% 2.77 10.0% 3.27
Off The Beaten Path 6.3% 8.8% 3.78 9.0% 3.92
Interest Rate Resets 2.8% 3.9% 0.18 8.5% 3.11
Other (ABS, Distressed) 7.6% 6.9% 3.17 7.4% 3.63
Invested Portfolio 96.0% 6.7% 2.39 7.3% 3.07
Cash 4.0%
Total Portfolio 100.0% 6.4% 2.29 7.0% 2.94
16

In 1Q15, Southern States Coop and Marsico both recovered from technical selling pressure. As discussed earlier in the letter, Consolidated‐Tomoka Land Co issued paper that we found attractive. The bonds moved up after issuance. Lansing Trade Group advanced as they reported a better than expected fourth quarter. Price appreciation in HC2 Holdings reflected enthusiasm for and better understanding of recent acquisitions.
Goodman Networks suffered as their largest client, AT&T, announced a significant decline in their capex budget. Vertellus bonds moved lower as they reported worse than expected earnings. US Shale is a service provider to the oil and gas market and we realized the loss as we exited the position. Concern arose that part of Hampton Rubber Company’s distribution business may see greater than expected weakness from servicing the energy sector, including refiners and mid‐stream segments. The loss was realized as we chose to swap out of the 2nd lien paper into the 1st lien debt, allowing us, ultimately, to recapture the decline in market price. Verso declined on concerns regarding the likelihood of achieving much‐needed synergies projected to be derived from its recent merger with NewPage.
RiverPark Barclays Markit iBoxx Strategic U.S. Aggregate USD Liquid
Income Fund Bond Index* High Yield Index* (RSIIX, RSIVX)1
YTW 6.39% 1.53% 5.56%
Effective Maturity 1/24/2018 6/19/2022 11/23/2019
YTM 7.01% 1.53% 5.99%
Stated Maturity 4/07/2019 7/11/2022 08/23/2021
SEC 30 Day Yield 6.95% 1.87% 5.24%
1. Numbers represent a weighted average for RSIIX and RSIVX
This material must be preceded or accompanied by a current prospectus. Investors should read it carefully before investing. *These index characteristics are calculated by Bloomberg Professional Analytics and are based on the iShares ETFswhich are passive ETFs comprised of the underlying securities of these indices.
RiverPark Strategic Income has a much higher Yield‐to‐Worst and Yield‐to‐Maturity than the indices even though its effective maturity is much shorter. We believe the portfolio is well positioned and defensive relative to the indices.
17

This material must be preceded or accompanied by a current prospectus. Investors should read it carefully before investing.
Mutual fund investing involves risk including possible loss of principal. In addition to the normal risks associated with investing, international investments may involve risk of capital loss from unfavorable fluctuation in currency values, from differences in generally accepted accounting principles or from social, economic or political instability in other nations. Bonds and bond funds are subject to interest rate risk and will decline in value as interest rates rise. High yield bonds and non‐investment grade securities involve greater risks of default or downgrade and are more volatile than investment grade securities, due to the speculative nature of their investments. The RiverPark Strategic Income Fund may invest in securities of companies that are experiencing significant financial or business difficulties, including companies involved in bankruptcy or other reorganization and liquidation proceedings. Although such investments may result in significant returns to the Fund, they involve a substantial degree of risk. There can be no assurance that the Fund will achieve its stated objectives.
The RiverPark Strategic Income Fund and RiverPark Short Term High Yield Fund are distributed by SEI Investments Distribution Co., One Freedom Valley Drive, Oaks, PA 19456 which is not affiliated with RiverPark Advisors, LLC, Cohanzick Management, LLC, or their affiliates.
18
Related Documents