Risk-based (planning of) official controls & the MANCP outcome of the pilot-WG (November 2011) 1

Risk-based (planning of) official controls & the MANCP outcome of the pilot-WG (November 2011) 1.
Dec 28, 2015
Welcome message from author
This document is posted to help you gain knowledge. Please leave a comment to let me know what you think about it! Share it to your friends and learn new things together.
Transcript

Risk-based (planning of) official controls & the MANCP
outcome of the pilot-WG
(November 2011)
1

Quickly ‘share & compare’ main features MANCP?
2

Quickly ‘share & compare’ main features MANCP?
proposal for reference tool: MANCP Quick Scan Form
3

Inspiration
• International Chemical Safety Cards
• Guidance/requirements MANCP (Commission Decision 2007/363/EC)
4

MANCP Quick Scan Form (proposed template)
5

MANCP Quick Scan Form• Summary of main principles & characteristics
(‘appetizer’ for other MS)• Lot of contact data (further bilateral discussions)• 8 boxes
– box 1 & 2: ID & contact data– box 3: main features– box 4: overall objectives– box 5: CA & delegation to control bodies; indication degree
of centralization of competecence– box 6: laboratory network– box 7: official controls & risk factors (box may be repeated)– box 8: any additional information
• 2 pages (?)
6

Risk-based controls as a guarantee for safe feed &
food?
7

Risk-based controls as a guarantee for safe feed &
food?
Food Safety Barometer
8
• Tool for measuring safety in the food chain
• Pressure – State – Response concept
• developed in 1980’s by OECD to classify environmental indicators
Barometer of the Food Chain Safety(Scientific Committee of BE FASFC)
9
Food safety Animal Plant
FASFC ‘scope isSafety of the Food Chain
3 aspects=
3 barometers1 operational, 2 in
development
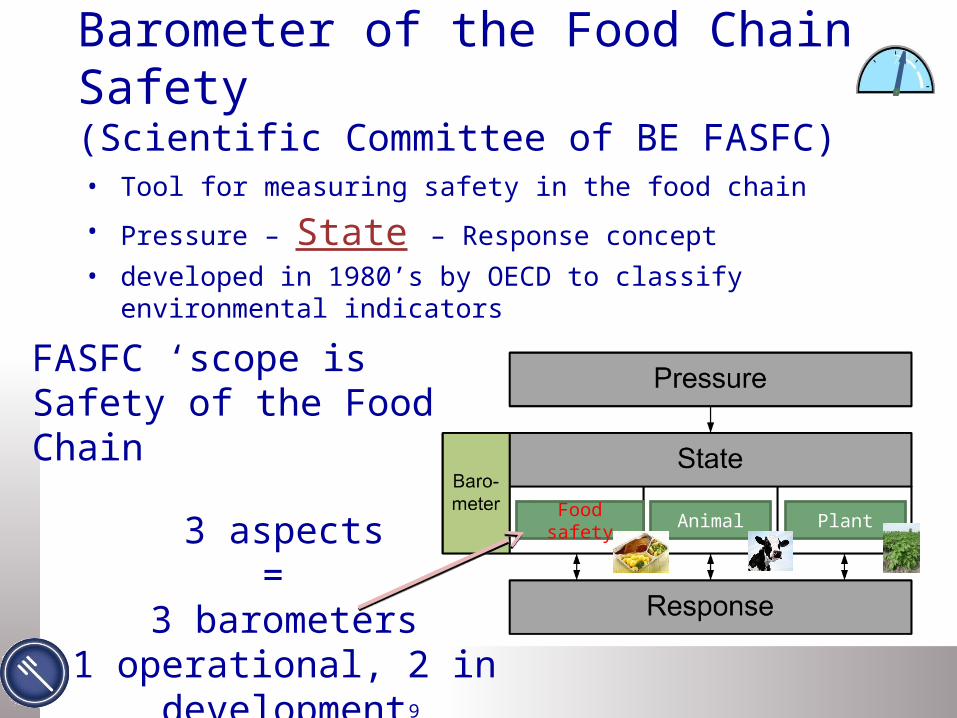
Selection of Food Safety Indicators
• Biological, chemical, physical hazards• Quantitative measurements • Available in reports, documents & databases • Direct or indirect relation with food safety• NO complete picture of all hazards in the food chain &
NO risk assessment
Set of indicators to provide information on the overall situation of food safety
10

Set of 30 Food Safety Indicators (FSI’s) - Throughout the food chain (‘farm to fork’)- Belgian production chain, intracommunity trade
& import of third countries - Animal and plant production / products- Product controls (biological & chemical
hazards)- Process controls (inspections)- The preventive approach (self-checking
systems, notification, traceability)- Public health issues (restricted to biological
hazards)
Selection of Food Safety Indicators
11
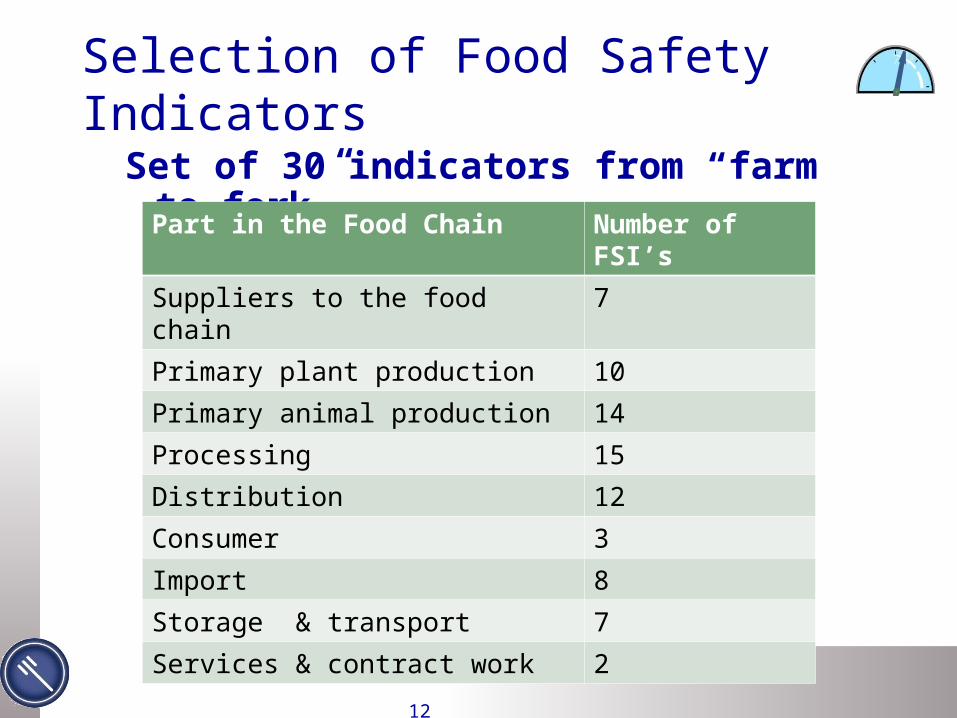
Set of 30 indicators from “farm to fork”
Selection of Food Safety Indicators
Part in the Food Chain Number of FSI’s
Suppliers to the food chain 7
Primary plant production 10
Primary animal production 14
Processing 15
Distribution 12
Consumer 3
Import 8
Storage & transport 7
Services & contract work 2
12

0%
20%
40%
60%
80%
100%
Inspections self checking Inspections hygiene Inspections traceability
% O
K or
OK
with
rem
arks
2007
2008
2009
2010
Inspections
Measurement of food safety 2007-2010
13

Product analysis : biological hazards
Measurement of food safety 2007-2010
0%
20%
40%
60%
80%
100%
% co
nfor
m
2007
2008
2009
2010
14

0,00
10,00
20,00
30,00
40,00
50,00
Salmonellosis Foodborne outbreak Listeriosis
Case
s per
100
000
inha
bita
nts
2007
2008
2009
2010
Foodborne outbreaks and reported cases
Measurement of food safety 2007-2010
15

Impact each FSI perceived by various stakeholders
Assigning a weight to each indicator by expert opinion:SciCom & Advisory Com & Dir Com FASFC
Using Las Vegas method : - assigning 20 chips to 30 indicators - multiple chips/indicator – total 20 chips
Prioritization of the 30 indicators in their impact to measure food safety
16

10 indicators with highest (perceived) relevance• FSI6: Inspections self checking in the food chain 2,06• FSI7: Inspections infrastructure, hygiene in the sectors of distribution, hotels and catering and
community kitchens 1,88• FSI19: Chemical and microbiological hazards in imported animal products intended for human
consumption 1,73• FSI8: Inspections traceability within the food chain 1,65• FSI13: Substances with an anabolic action, unauthorized substances and veterinary drugs for cows
and pigs 1,50• FSI28: Foodborne outbreaks 1,46• FSI17: Residues from pesticides in vegetables and fruit from other EU- countries and third countries
1,39• FSI29: Salmonellosis in humans 1,28• FSI1: Compulsory notification in food safety 1,16• FSI4: Self checking systems in the transformation sector 1,16
Prioritization of Food Safety Indicators
17

State : 2010 versus 2009Status of Food Safety
+ 3.73%
.
18

Food Safety Barometer
19

Food Safety Barometer
20
description tool in MANCP (+ Quick Scan) trends in (Ex. Summ.) AR MANCP

21
More information:
The Barometer of the Safety of the Food Chain: http://www.afsca.be/scientificcommittee/barometer/

22
Thank you for your attention
Related Documents