REVIEWS, CASE HISTORIES Illnesses Related to Shank Application of Metam-Sodium, Arvin, California, July 2002 Michael O’Malley, MD, MPH Terrell Barry, PhD Mario Ibarra, BS Marylou Verder-Carlos, DVM, MPVM Louise Mehler, MD, PhD ABSTRACT. Objectives: To evaluate the health effects of methyl isothiocyanate (MITC) and other byproducts resulting from the soil-incorporated (shank) application of 25,000 pounds of metam-sodium on July 8, 2002, near the community of Arvin, California. Methods: Residents in a four-block area were interviewed regarding eye and upper respiratory irritation, non-specific systemic symptoms, and lower respiratory complaints. The distribution of cases was compared to results of Industrial Source Complex (ISC3) air dispersion modeling for the metam-sodium byproduct, methyl isothiocyanate (MITC). The 1-hour 200 ppb no-observed-ef- fect-level (NOEL) and 800 ppb lowest-observed-effect level (LOEL) from a previous human eye irritation study were used to interpret the results of the air modeling estimates. Peak concentrations were compared to the 4-minute NOEL of 600 ppb and the LOEL of 1.9 ppm. Results: Two-hundred-fifty-two cases of irritant, non-specific systemic, and respiratory symptoms were associated with the metam-sodium application. These included 178 community residents or visitors and 74 employees of a carrot packing operation located in the affected neigh- borhood of Arvin. The most severe reported illness occurred in a community visitor with a history of pre-existing pulmonary disease, who was hospitalized for a week with respiratory distress. ISC3 Michael O’Malley is affiliated with the University of California Davis, Employee Health Services and Worker Health and Safety Branch, California Department of Pesticide Regulation. Terrell Barry is affiliated with the Environmental Monitoring Branch, California Department of Pesticide Regulation. Mario Ibarra is affiliated with the Pesticide Use Enforcement Branch, California Department of Pesticide Regulation. Marylou Verder-Carlos and Louise Mehler are affiliated with the Worker Health and Safety Branch, California Department of Pesticide Regulation. Address correspondence to: Michael O’Malley, MD, MPH, University of California Davis, Employee Health Services, 501 Oak Avenue, Davis, CA 95616 (E-mail: [email protected]). The authors gratefully recognize the assistance and expertise of Dave Kim in preparing the map graphics for this article. This work funded in part under a consulting contract between the California Department of Pesticide Regulation and the University of California, Davis. Journal of Agromedicine, Vol. 10(4) 2005 Available online at http://www.haworthpress.com/web/JA © 2005 by The Haworth Press, Inc. All rights reserved. doi:10.1300/J096v10n04_06 27

Welcome message from author
This document is posted to help you gain knowledge. Please leave a comment to let me know what you think about it! Share it to your friends and learn new things together.
Transcript
REVIEWS, CASE HISTORIES
Illnesses Related to Shank Application of Metam-Sodium,Arvin, California, July 2002
Michael O’Malley, MD, MPHTerrell Barry, PhDMario Ibarra, BS
Marylou Verder-Carlos, DVM, MPVMLouise Mehler, MD, PhD
ABSTRACT. Objectives: To evaluate the health effects of methyl isothiocyanate (MITC) andother byproducts resulting from the soil-incorporated (shank) application of 25,000 pounds ofmetam-sodium on July 8, 2002, near the community of Arvin, California.
Methods: Residents in a four-block area were interviewed regarding eye and upper respiratoryirritation, non-specific systemic symptoms, and lower respiratory complaints. The distribution ofcases was compared to results of Industrial Source Complex (ISC3) air dispersion modeling for themetam-sodium byproduct, methyl isothiocyanate (MITC). The 1-hour 200 ppb no-observed-ef-fect-level (NOEL) and 800 ppb lowest-observed-effect level (LOEL) from a previous human eyeirritation study were used to interpret the results of the air modeling estimates. Peak concentrationswere compared to the 4-minute NOEL of 600 ppb and the LOEL of 1.9 ppm.
Results: Two-hundred-fifty-two cases of irritant, non-specific systemic, and respiratorysymptoms were associated with the metam-sodium application. These included 178 communityresidents or visitors and 74 employees of a carrot packing operation located in the affected neigh-borhood of Arvin. The most severe reported illness occurred in a community visitor with a historyof pre-existing pulmonary disease, who was hospitalized for a week with respiratory distress. ISC3
Michael O’Malley is affiliated with the University of California Davis, Employee Health Services and WorkerHealth and Safety Branch, California Department of Pesticide Regulation.
Terrell Barry is affiliated with the Environmental Monitoring Branch, California Department of Pesticide Regulation.Mario Ibarra is affiliated with the Pesticide Use Enforcement Branch, California Department of Pesticide Regulation.Marylou Verder-Carlos and Louise Mehler are affiliated with the Worker Health and Safety Branch, California
Department of Pesticide Regulation.Address correspondence to: Michael O’Malley, MD, MPH, University of California Davis, Employee Health
Services, 501 Oak Avenue, Davis, CA 95616 (E-mail: [email protected]).The authors gratefully recognize the assistance and expertise of Dave Kim in preparing the map graphics for this
article.This work funded in part under a consulting contract between the California Department of Pesticide Regulation
and the University of California, Davis.
Journal of Agromedicine, Vol. 10(4) 2005Available online at http://www.haworthpress.com/web/JA
© 2005 by The Haworth Press, Inc. All rights reserved.doi:10.1300/J096v10n04_06 27
Modeling indicated 1-hour MITC concentrations in the affected community ranged from 0.8-1.0ppm, in the range of the LOEL, with peak concentrations between 2.4 and 3.2 ppm.
Conclusion: Estimated MITC concentrations during the episode exceeded both the 4-minute NOELand 1-hour NOEL by approximately four fold. The high concentrations of MITC present in the affectedneighborhood may have been partially attributable to failure to immediately complete a requiredpost-application water-treatment on 15 of the 100 treated acres. However, because of the limited areainvolved, the violation was unlikely to have accounted for the entire incident. Similar episodes may oc-cur when metam-sodium fumigants are used adjacent to other rural communities. [Article copies avail-able for a fee from The Haworth Document Delivery Service: 1-800-HAWORTH. E-mail address: <[email protected]> Website: <http://www.HaworthPress.com> © 2005 by The Haworth Press, Inc. All rightsreserved.]
KEYWORDS. MITC, fumigant, metam-sodium, eye irritation, respiratory illness
INTRODUCTION
Degradation products of metam-sodiumhave been demonstrated to cause repeated ill-ness episodes following applications near ruralcommunities. Between 1987 and 2000, theCalifornia pesticide illness registry identifiedeight episodes following sprinkler applicationsof metam-sodium and six episodes involvingsoil incorporated (shank) applications.1 Asprinkler application of metam-potassium wasalso associated with a cluster of 17 probablecases of eye, and respiratory irritation in 2003in the inland Southern California agriculturalcommunity of Coachella.2 A cluster of off-siteoccupational exposures also occurred in June2002 involving 138 Kern County field workersscheduled to girdle vines, pull leaves, and tipbunches in a vineyard adjacent to a sprinklerapplication of metam-sodium.3
For theprincipaldegradationproduct,methylisothiocyanate (MITC), experimental humandata demonstrate eye irritation with an 800 ppb1-hour lowest-observed-effect-level (LOEL)anda200ppbno-observed-effect-level (NOEL).The geometric mean odor threshold is 1700ppb and the 4-minute LOEL for eye irritationis 1900 ppb. Because the experimental studyexcluded breathing zone exposure, no data onMITC respiratory irritation thresholds areavailable.4 A similar study evaluated irritationthresholds for the fumigant chloropicrin, butincludedboth respiratoryand ocular endpoints.Ocular irritation occurred at chloropicrin con-centrations that did not cause nasal irritation orchanges in pulmonary function measured byforced expiratory volume in 1 second (FEV1).5
Both studies specifically excluded individualswith possible sensitivity to environmental irri-tants, including subjects with asthma or upperrespiratory allergies.
In illness episodes associated with metam-sodium, ocular and respiratory effects havetypically occurred simultaneously.1 Althoughthe ocular irritation typically has a short dura-tion, respiratory irritation may cause persistentreactive airways.6
This report describes a cluster of commu-nity ocular and respiratory illness followinga soil incorporated (shank) application ofmetam-sodium that occurred in July 2002near the Kern County community of Arvin,California. Relevant background on thecommunity, initial information on the outbreakand emergency response are discussed alongwith case classification and modeling methods.The relationship between ocular irritation andrespiratory effects in subjects with pre-existingpulmonary problems is also discussed basedupon case information from this episode.
METHODS
Community Background
Arvin is located in the southeastern corner ofthe San Joaquin Valley. With an elevation of445 feet, it is adjacent to the Tehachapi foot-hills, but part of the valley floor. Bakersfield isapproximately 21 miles north and west.
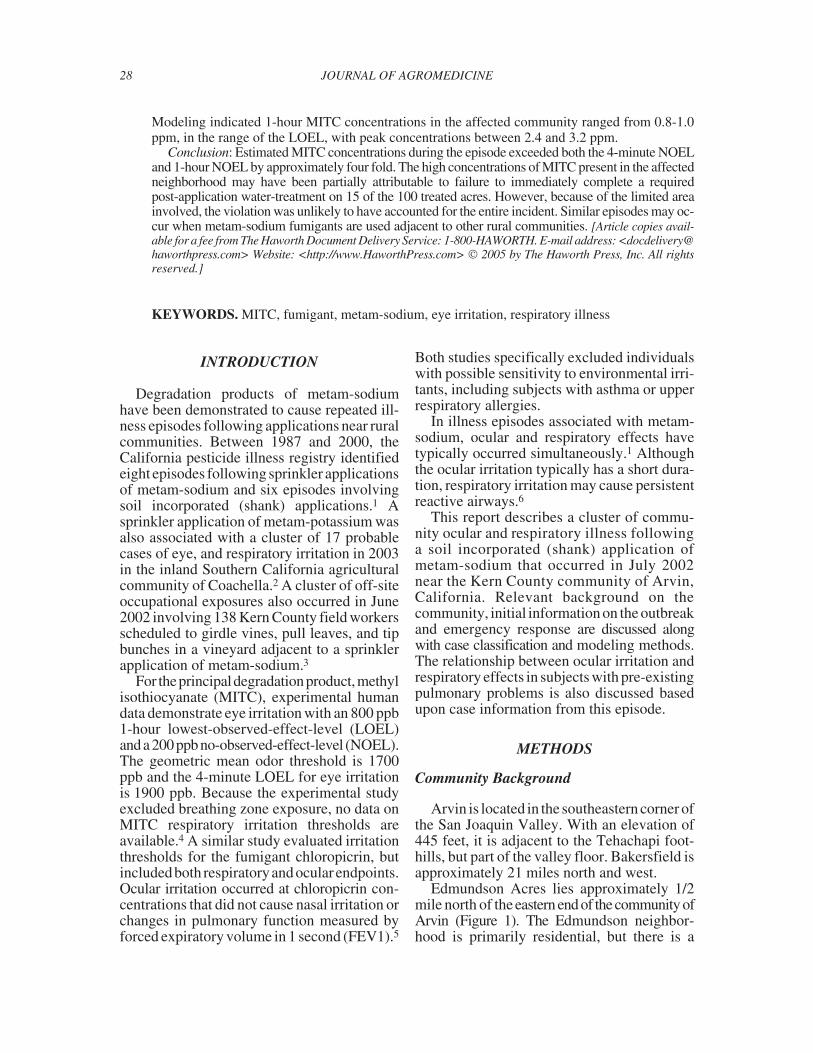
Edmundson Acres lies approximately 1/2mile north of the eastern end of the community ofArvin (Figure 1). The Edmundson neighbor-hood is primarily residential, but there is a
28 JOURNAL OF AGROMEDICINE
packing shed in the neighborhood, located onBarbara Street, operated by a farming companythat grows carrots in a field just to the east of theJudith, the other main street in the neighbor-hood.
The Edmundson population is not specifiedin the 2000 census information, but the neigh-borhood represents approximately 5% of thepopulated area of Arvin, proportionately repre-senting an estimated 650 residents. No data are
available on the neighborhood ethnic composi-tion, but the Arvin community as a whole is87.5% Hispanic. Approximately 47% are em-ployed inagriculture.7 Employment is seasonaland annual unemployment runs as high as27%.8 The median household income is$23,674, compared to$47,493 forCaliforniaasa whole and $41,994 for the entire U.S.9
No specific information was located regard-ing health insurance coverage for the commu-
Reviews, Case Histories 29
FIGURE 1. Edmundson acres neighborhood shown in relationship to other areas of Arvin.
nity. Statewide and regional data indicate thatbetween 12%and25%ofCaliforniafarmworkershave employer provided health insurance, withsome additional coverage provided to familymembers by publicly funded insurance.10
There is a community clinic in Arvin, withthree family doctors, open 8 a.m. to 7 p.m., abranch of a larger community clinic located inLamont, eight miles north and west of Arvin,open six days a week. According to clinic staff,the average wait time for a scheduled appoint-ment at the clinics is approximately two weeks.For the uninsured, a sliding fee scale is used,based on family size and family income. Thenearest 24-hour emergency services are inBakersfield, approximately 23 miles from thecenter of Arvin.
Incident Background and EmergencyResponse
A timeline detailing the sequence of eventsduring the incident and the subsequent investi-gation is shown in Table 1.
During the afternoon and early evening ofJuly 8, 2002, a few residents of Edmundsonbegan experiencing eye and throat irritation(noted at subsequent interview). At 9:16 p.m., aresident on Judith Street called 911, reportingthat her four children were vomiting, cryingand experiencingeye irritation.She was unableto identify a reason for their symptoms. A towtruck driver called at 9:23 p.m. regarding a pos-sible chemical spill at the packing shed and anadditional resident of Judith called at 9:31 p.m.
to report a chemical odor that was causing hiseyes to water. Statements from packing shedcrew supervisors indicated that evening shiftworkers began experiencing eye irritationshortly after 9 p.m. Some went into theneighborhood to look for the source of theproblem.
Emergency response records indicate thatfire department paramedics arrived in theneighborhood at 9:21 p.m., finding 30-40 resi-dents in the streets complaining of odor, andirritation of the eyes and throat. Because of thenumber of people affected, the paramedicsrequested assistance from a local ambulancecompany.Twopersons wereexaminedandonetransported to Mercy Hospital in Bakersfieldbecause of difficulty breathing.
Investigation of the neighborhood environ-mentdidnot identifya roadwayspillor a leakofhazardous material that could have caused theresidents complaints. Fire Department emer-gency crews and maintenance staff from thecarrot shed reported that there was no leakingof the chlorine used on the site. Contact wasmade with the Kern Department of Environ-ment Health and the Kern Department Agricul-ture. Agricultural sites evaluated included analmond orchard northwest of the neighborhood(treated with Omite and Lorsban on July 6,2002) and a vineyard located west of the neigh-borhood (treated with Omite and Sulfur on July5, 2002).
Metam-Sodium Application
The possible cause of the symptoms in thecommunity residents was identified in review-ing the application history of the field imme-diately east of Edmundson Acres. On July 8,between7:45 a.m.and 3:20 p.m., 60 gallonsperacre of Vapam HL (4.26 pounds of metam-sodium/gallon) were applied to one hundredfallow acres located directly east of JudithStreet (30 acres of potatoes in the north and 70acres of carrots in the south). The total amountof active ingredient applied was 25,560 pounds.The applicator reported that 20 acres along thewestern edge of the field were not treated in or-der to comply with the 500-foot buffer zone re-quired between the edge of the treated area andthe nearest homes on Judith. Additional safetymeasures included an irrigator certified in the
30 JOURNAL OF AGROMEDICINE
TABLE 1. Investigation timeline
July 8, 2002–metam-sodium application, index casehospitalized, initial Kern County investigation
August-September, 2002–additional complaints received
September 10, 2002–community meeting and interviews
Sept 10-12, 2002–community interviews
September 2002-February 2004-collection and review ofincident medical records, community complaints; modelingof MITC exposure from incident using ISC3 model,correlation of MITC iso-concentration map with caseincident data and preparation of graphics.
performance of post-application water treat-ments and a crew member certified to dopost-application odor monitoring. Near resi-dential areas, permit conditions specified atleast 12 hours of post-application monitoring.
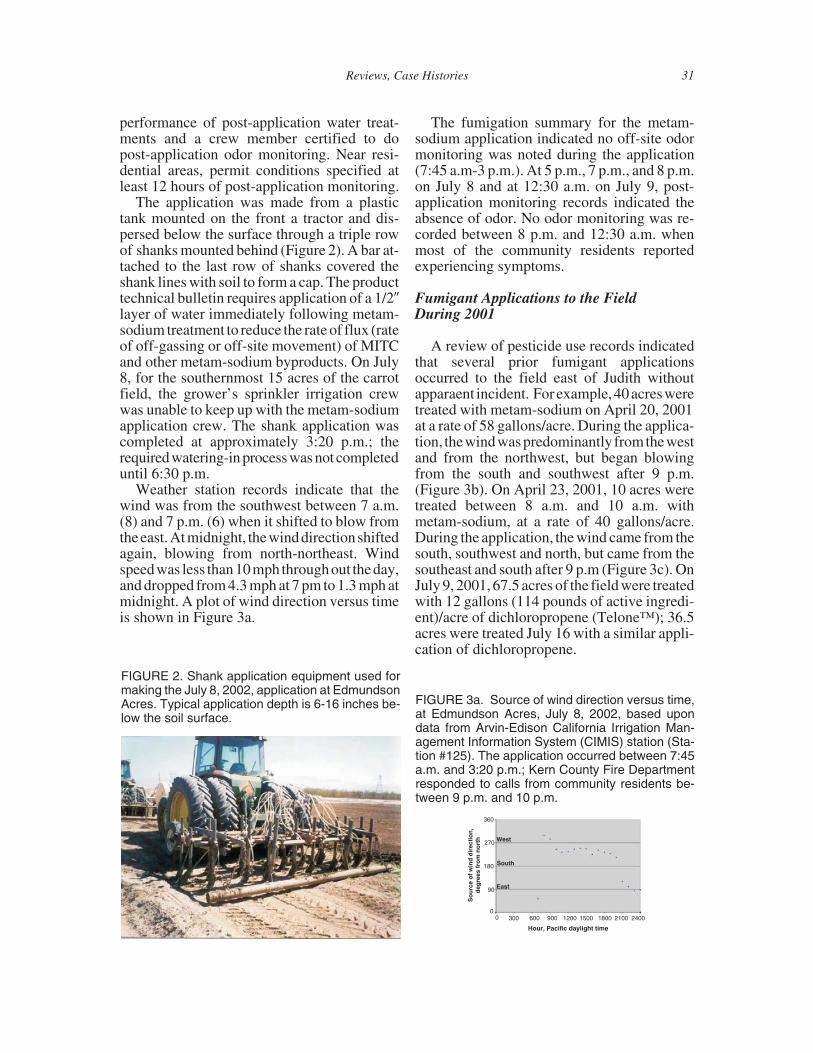
The application was made from a plastictank mounted on the front a tractor and dis-persed below the surface through a triple rowof shanks mounted behind (Figure 2). A bar at-tached to the last row of shanks covered theshank lines with soil to form a cap. The producttechnical bulletin requires application of a 1/2�layer of water immediately following metam-sodium treatment to reduce the rate of flux (rateof off-gassing or off-site movement) of MITCand other metam-sodium byproducts. On July8, for the southernmost 15 acres of the carrotfield, the grower’s sprinkler irrigation crewwas unable to keep up with the metam-sodiumapplication crew. The shank application wascompleted at approximately 3:20 p.m.; therequired watering-in process was not completeduntil 6:30 p.m.
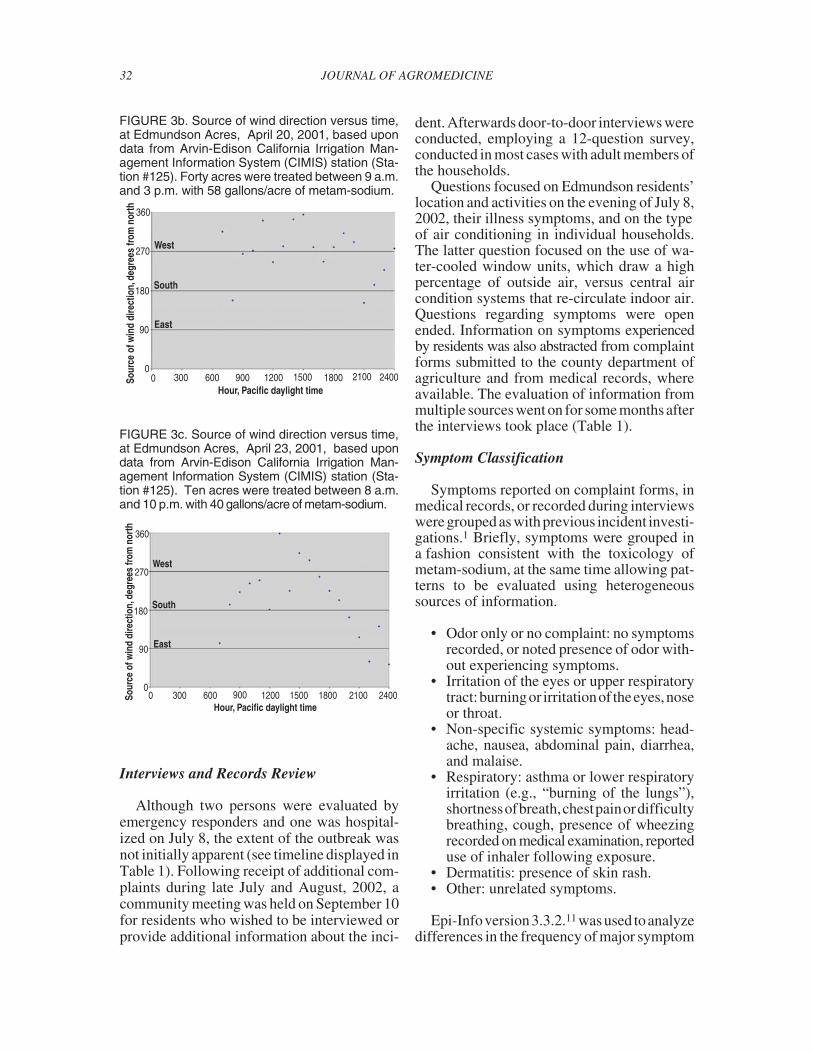
Weather station records indicate that thewind was from the southwest between 7 a.m.(8) and 7 p.m. (6) when it shifted to blow fromtheeast.At midnight, thewind directionshiftedagain, blowing from north-northeast. Windspeedwas less than10 mph throughout theday,and dropped from 4.3 mph at 7 pm to 1.3 mph atmidnight. A plot of wind direction versus timeis shown in Figure 3a.
The fumigation summary for the metam-sodium application indicated no off-site odormonitoring was noted during the application(7:45 a.m-3 p.m.). At 5 p.m., 7 p.m., and 8 p.m.on July 8 and at 12:30 a.m. on July 9, post-application monitoring records indicated theabsence of odor. No odor monitoring was re-corded between 8 p.m. and 12:30 a.m. whenmost of the community residents reportedexperiencing symptoms.
Fumigant Applications to the FieldDuring 2001
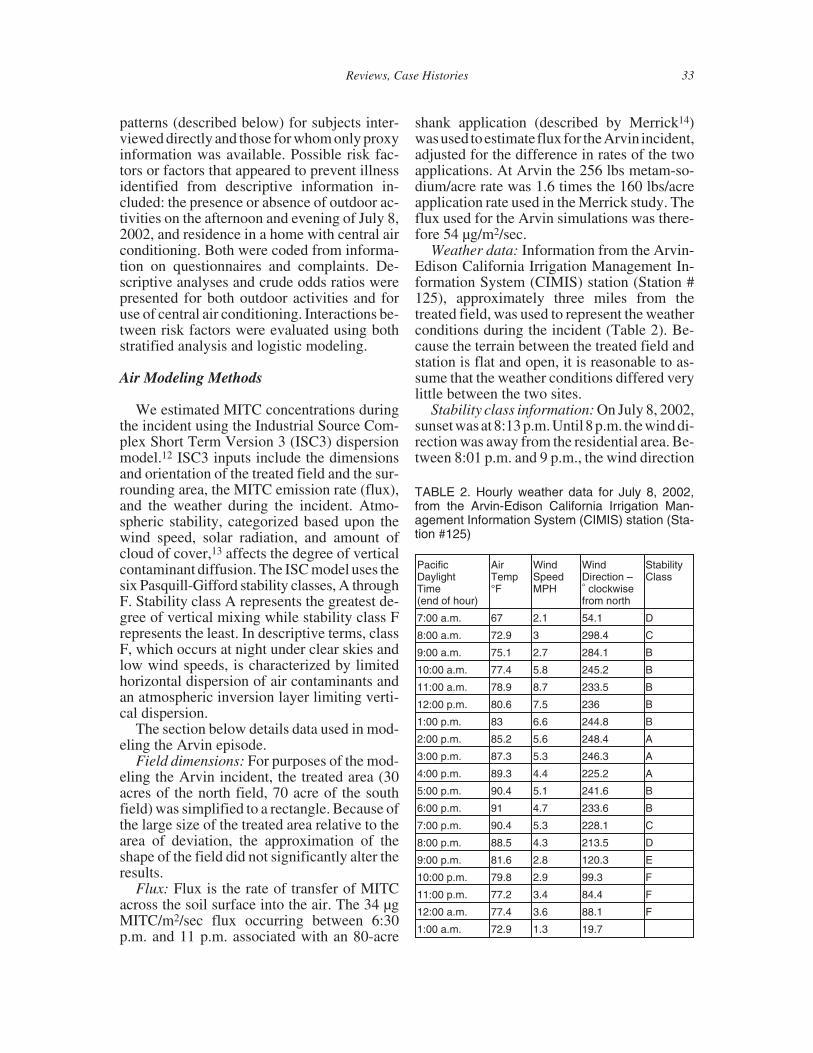
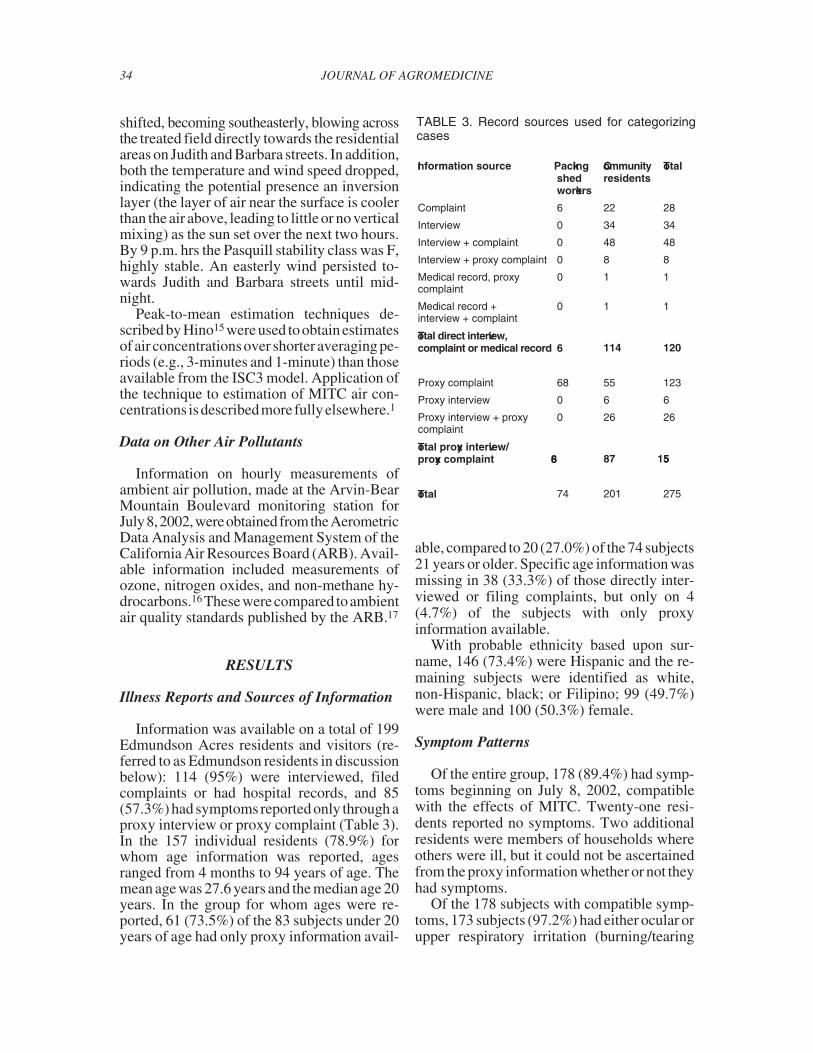
A review of pesticide use records indicatedthat several prior fumigant applicationsoccurred to the field east of Judith withoutapparaent incident. For example,40 acres weretreated with metam-sodium on April 20, 2001at a rate of 58 gallons/acre. During the applica-tion, thewindwas predominantly fromthewestand from the northwest, but began blowingfrom the south and southwest after 9 p.m.(Figure 3b). On April 23, 2001, 10 acres weretreated between 8 a.m. and 10 a.m. withmetam-sodium, at a rate of 40 gallons/acre.During the application, the wind came from thesouth, southwest and north, but came from thesoutheast and south after 9 p.m (Figure 3c). OnJuly 9, 2001, 67.5 acres of the field were treatedwith 12 gallons (114 pounds of active ingredi-ent)/acre of dichloropropene (Telone™); 36.5acres were treated July 16 with a similar appli-cation of dichloropropene.
Reviews, Case Histories 31
FIGURE 2. Shank application equipment used formaking the July 8, 2002, application at EdmundsonAcres. Typical application depth is 6-16 inches be-low the soil surface.
So
urc
e o
f w
ind
dir
ecti
on
,d
egre
es f
rom
no
rth
360
270
180
90
00 300 600 900 1200 1500 1800 2100 2400
Hour, Pacific dayight time
West
South
East
FIGURE 3a. Source of wind direction versus time,at Edmundson Acres, July 8, 2002, based upondata from Arvin-Edison California Irrigation Man-agement Information System (CIMIS) station (Sta-tion #125). The application occurred between 7:45a.m. and 3:20 p.m.; Kern County Fire Departmentresponded to calls from community residents be-tween 9 p.m. and 10 p.m.
Hour, Pacific daylight time
Interviews and Records Review
Although two persons were evaluated byemergency responders and one was hospital-ized on July 8, the extent of the outbreak wasnot initially apparent (see timeline displayed inTable 1). Following receipt of additional com-plaints during late July and August, 2002, acommunity meeting was held on September 10for residents who wished to be interviewed orprovide additional information about the inci-
dent. Afterwards door-to-door interviews wereconducted, employing a 12-question survey,conducted in most cases with adult members ofthe households.
Questions focused on Edmundson residents’location and activities on the evening of July 8,2002, their illness symptoms, and on the typeof air conditioning in individual households.The latter question focused on the use of wa-ter-cooled window units, which draw a highpercentage of outside air, versus central aircondition systems that re-circulate indoor air.Questions regarding symptoms were openended. Information on symptoms experiencedby residents was also abstracted from complaintforms submitted to the county department ofagriculture and from medical records, whereavailable. The evaluation of information frommultiple sources went on for some months afterthe interviews took place (Table 1).
Symptom Classification
Symptoms reported on complaint forms, inmedical records, or recorded during interviewswere grouped as with previous incident investi-gations.1 Briefly, symptoms were grouped ina fashion consistent with the toxicology ofmetam-sodium, at the same time allowing pat-terns to be evaluated using heterogeneoussources of information.
• Odor only or no complaint: no symptomsrecorded, or noted presence of odor with-out experiencing symptoms.
• Irritation of the eyes or upper respiratorytract:burningor irritationof theeyes,noseor throat.
• Non-specific systemic symptoms: head-ache, nausea, abdominal pain, diarrhea,and malaise.
• Respiratory: asthma or lower respiratoryirritation (e.g., “burning of the lungs”),shortnessofbreath,chestpainordifficultybreathing, cough, presence of wheezingrecorded on medical examination, reporteduse of inhaler following exposure.
• Dermatitis: presence of skin rash.• Other: unrelated symptoms.
Epi-Infoversion3.3.2.11 wasused toanalyzedifferences in the frequency of major symptom
32 JOURNAL OF AGROMEDICINE
Sour
ceof
win
ddi
rect
ion,
degr
ees
from
nort
h
360
270
180
90
00 300 600 900 1200 1500 1800 2100 2400
Hour, Pacific daylight time
West
South
East
FIGURE 3b. Source of wind direction versus time,at Edmundson Acres, April 20, 2001, based upondata from Arvin-Edison California Irrigation Man-agement Information System (CIMIS) station (Sta-tion #125). Forty acres were treated between 9 a.m.and 3 p.m. with 58 gallons/acre of metam-sodium.
Sour
ceof
win
ddi
rect
ion,
degr
ees
from
nort
h
360
270
180
90
00 300 600 900 1200 1500 1800 2100 2400
Hour, Pacific daylight time
West
South
East
FIGURE 3c. Source of wind direction versus time,at Edmundson Acres, April 23, 2001, based upondata from Arvin-Edison California Irrigation Man-agement Information System (CIMIS) station (Sta-tion #125). Ten acres were treated between 8 a.m.and 10 p.m. with 40 gallons/acre of metam-sodium.
patterns (described below) for subjects inter-viewed directly and those for whom only proxyinformation was available. Possible risk fac-tors or factors that appeared to prevent illnessidentified from descriptive information in-cluded: the presence or absence of outdoor ac-tivities on the afternoon and evening of July 8,2002, and residence in a home with central airconditioning. Both were coded from informa-tion on questionnaires and complaints. De-scriptive analyses and crude odds ratios werepresented for both outdoor activities and foruse of central air conditioning. Interactions be-tween risk factors were evaluated using bothstratified analysis and logistic modeling.
Air Modeling Methods
We estimated MITC concentrations duringthe incident using the Industrial Source Com-plex Short Term Version 3 (ISC3) dispersionmodel.12 ISC3 inputs include the dimensionsand orientation of the treated field and the sur-rounding area, the MITC emission rate (flux),and the weather during the incident. Atmo-spheric stability, categorized based upon thewind speed, solar radiation, and amount ofcloud of cover,13 affects the degree of verticalcontaminant diffusion. The ISC model uses thesix Pasquill-Gifford stability classes, A throughF. Stability class A represents the greatest de-gree of vertical mixing while stability class Frepresents the least. In descriptive terms, classF, which occurs at night under clear skies andlow wind speeds, is characterized by limitedhorizontal dispersion of air contaminants andan atmospheric inversion layer limiting verti-cal dispersion.
The section below details data used in mod-eling the Arvin episode.
Field dimensions: For purposes of the mod-eling the Arvin incident, the treated area (30acres of the north field, 70 acre of the southfield) was simplified to a rectangle. Because ofthe large size of the treated area relative to thearea of deviation, the approximation of theshape of the field did not significantly alter theresults.
Flux: Flux is the rate of transfer of MITCacross the soil surface into the air. The 34 µgMITC/m2/sec flux occurring between 6:30p.m. and 11 p.m. associated with an 80-acre
shank application (described by Merrick14)wasused toestimateflux for theArvin incident,adjusted for the difference in rates of the twoapplications. At Arvin the 256 lbs metam-so-dium/acre rate was 1.6 times the 160 lbs/acreapplication rate used in the Merrick study. Theflux used for the Arvin simulations was there-fore 54 µg/m2/sec.
Weather data: Information from the Arvin-Edison California Irrigation Management In-formation System (CIMIS) station (Station #125), approximately three miles from thetreated field, was used to represent the weatherconditions during the incident (Table 2). Be-cause the terrain between the treated field andstation is flat and open, it is reasonable to as-sume that the weather conditions differed verylittle between the two sites.
Stability class information: On July 8, 2002,sunset was at8:13 p.m. Until 8 p.m. thewind di-rection was away from the residential area. Be-tween 8:01 p.m. and 9 p.m., the wind direction
Reviews, Case Histories 33
TABLE 2. Hourly weather data for July 8, 2002,from the Arvin-Edison California Irrigation Man-agement Information System (CIMIS) station (Sta-tion #125)
PacificDaylightTime(end of hour)
AirTemp°F
WindSpeedMPH
WindDirection –° clockwisefrom north
StabilityClass
7:00 a.m. 67 2.1 54.1 D
8:00 a.m. 72.9 3 298.4 C
9:00 a.m. 75.1 2.7 284.1 B
10:00 a.m. 77.4 5.8 245.2 B
11:00 a.m. 78.9 8.7 233.5 B
12:00 p.m. 80.6 7.5 236 B
1:00 p.m. 83 6.6 244.8 B
2:00 p.m. 85.2 5.6 248.4 A
3:00 p.m. 87.3 5.3 246.3 A
4:00 p.m. 89.3 4.4 225.2 A
5:00 p.m. 90.4 5.1 241.6 B
6:00 p.m. 91 4.7 233.6 B
7:00 p.m. 90.4 5.3 228.1 C
8:00 p.m. 88.5 4.3 213.5 D
9:00 p.m. 81.6 2.8 120.3 E
10:00 p.m. 79.8 2.9 99.3 F
11:00 p.m. 77.2 3.4 84.4 F
12:00 a.m. 77.4 3.6 88.1 F
1:00 a.m. 72.9 1.3 19.7
shifted, becoming southeasterly, blowing acrossthe treated field directly towards the residentialareas on Judith and Barbara streets. In addition,both the temperature and wind speed dropped,indicating the potential presence an inversionlayer (the layer of air near the surface is coolerthan the air above, leading to little or no verticalmixing) as the sun set over the next two hours.By 9 p.m. hrs the Pasquill stability class was F,highly stable. An easterly wind persisted to-wards Judith and Barbara streets until mid-night.
Peak-to-mean estimation techniques de-scribed by Hino15 were used to obtain estimatesof air concentrationsover shorter averaging pe-riods (e.g., 3-minutes and 1-minute) than thoseavailable from the ISC3 model. Application ofthe technique to estimation of MITC air con-centrations isdescribedmore fullyelsewhere.1
Data on Other Air Pollutants
Information on hourly measurements ofambient air pollution, made at the Arvin-BearMountain Boulevard monitoring station forJuly8,2002,wereobtainedfromtheAerometricData Analysis and Management System of theCalifornia Air Resources Board (ARB). Avail-able information included measurements ofozone, nitrogen oxides, and non-methane hy-drocarbons.16 Thesewerecompared toambientair quality standards published by the ARB.17
RESULTS
Illness Reports and Sources of Information
Information was available on a total of 199Edmundson Acres residents and visitors (re-ferred to as Edmundson residents in discussionbelow): 114 (95%) were interviewed, filedcomplaints or had hospital records, and 85(57.3%) had symptoms reported only through aproxy interview or proxy complaint (Table 3).In the 157 individual residents (78.9%) forwhom age information was reported, agesranged from 4 months to 94 years of age. Themean age was 27.6 years and the median age 20years. In the group for whom ages were re-ported, 61 (73.5%) of the 83 subjects under 20years of age had only proxy information avail-
able, compared to 20 (27.0%) of the 74 subjects21 years or older. Specific age information wasmissing in 38 (33.3%) of those directly inter-viewed or filing complaints, but only on 4(4.7%) of the subjects with only proxyinformation available.
With probable ethnicity based upon sur-name, 146 (73.4%) were Hispanic and the re-maining subjects were identified as white,non-Hispanic, black; or Filipino; 99 (49.7%)were male and 100 (50.3%) female.
Symptom Patterns
Of the entire group, 178 (89.4%) had symp-toms beginning on July 8, 2002, compatiblewith the effects of MITC. Twenty-one resi-dents reported no symptoms. Two additionalresidents were members of households whereothers were ill, but it could not be ascertainedfrom the proxy information whether or not theyhad symptoms.
Of the 178 subjects with compatible symp-toms, 173 subjects (97.2%) had either ocular orupper respiratory irritation (burning/tearing
34 JOURNAL OF AGROMEDICINE
TABLE 3. Record sources used for categorizingcases
Information source Packingshedworkers
Communityresidents
Total
Complaint 6 22 28
Interview 0 34 34
Interview + complaint 0 48 48
Interview + proxy complaint 0 8 8
Medical record, proxycomplaint
0 1 1
Medical record +interview + complaint
0 1 1
Total direct interview,complaint or medical record 6 114 120
Proxy complaint 68 55 123
Proxy interview 0 6 6
Proxy interview + proxycomplaint
0 26 26
Total proxy interview/proxy complaint 68 87 155
Total 74 201 275
eyes, sore throats). There was no significantdifference in the prevalence of these symptomsin the 73 subjects (100%) interviewed directlyand the 105 subjects (95.2%) whose symptomswere recorded by proxy interview or proxycomplaint.
Non-specific systemic complaints (e.g.,headaches, vomiting, and nausea) were re-corded in 73 (40.2%) of all 179 subjects withcompatible symptoms. These symptoms werereported in 43 (43.9%) of the 98 subjects whofiled complaints or were directly interviewed,compared with 30 (37.5%) of the 80 subjectswith symptoms recorded only from proxy in-terviews or proxy complaints, a difference thatwas not significant statistically.
Symptoms potentially representing asthmaor lower respiratory irritation (e.g., cough,shortness of breath, wheezing or chest pain)were reported by 33 subjects (18.5% of allsymptomatic subjects). These included 17(21.9%) of the 98 subjects interviewed directlyand 16 (20.0%) of the 80 subjects with onlyproxy information. Specific symptoms in thesubjects with respiratory complaints includeddyspnea (coded as positive for patients report-ing difficulty breathing, chest pain, or noting“burning” in the lungs or chest distinct fromburning in the nose or throat) in 28 subjects(84.8%), cough in 7 subjects (21.2%), and ex-acerbations of asthma or smoking-related sub-jects (chronicobstructivepulmonarydiseaseorCOPD) in 5 subjects (15.1%).
The available details on the asthma/COPDcases are given below. Limited information isavailable on three cases:
• A 9-year-oldchild,withpre-existingasthma,developed a cough at the time of the inci-dent, but did not receive any formal medi-cal evaluation.
• A 41-year-old asthmatic reported that sherequired additional doses of her inhalerandsought treatmentatacommunitycliniclocated in a nearby town several days afterthe incident.
• A 94-year-old woman with emphysemaexperienced eye irritation along with someshortness of breath that required morethan her usual amount of supplementaloxygen.
The two cases for which medical recordswere available for review, the most seriousdocumented illnesses associated with the out-break, both involved significant exacerbationof pre-existing lung disease:
A 63-year-old woman with a history ofasthmaanddiabetes, also sought treatment fourdays after the incident for a persistent aggrava-tion of her respiratory problems, requiring useof supplemental oxygen. She had a respiratoryrate of 20 (normal < 16) but did not require useofheraccessoryrespiratorymuscles.Auscultationof the lungs demonstrated poor air entry andshe had wheezing in all lung fields. Her pulmo-nary function tests demonstrated reduction inair flow FEV1 (34% of predicted) and vital ca-pacity (54% of predicted). She was improvedat a follow-up visit 2 weeks later, although shestill required treatments with a fluticasone/salmeterol inhaler twice daily.
A 68-year-old woman with a history of em-physema that requirednosupplementaloxygenand only intermittent use of inhaled albuterolattended an evening family gathering outdoorson Judith Street on July 8. About 9 p.m., sheand others at the gathering began to suffer eyeirritation. She also developed nausea andmarked trouble breathing. At the time para-medics arrived a little after 9 p.m., she was insufficient distress to be transported to a Bakers-field hospital. On arrival in the hospital emer-gency department on 2 L of supplemental oxy-gen, her O2 saturation was 92%, she hadtachycardia, a respiratory rate of 22breaths/minute, and she had diffuse wheezing.The wheezing responded initially to nebulizedalbuterolandadose of intravenoussolumedrol.However, because she was unable to ambulatewithout marked respiratory distress, she wasadmitted to the hospital for additional treat-ment. She remained in the hospital for a weekreceiving bronchodilators and steroids. Shestill required treatment with supplemental oxy-gen at the time of her discharge on July 16,2002. This respiratory illness was the “indexcase” of the outbreak that prompted the initiallimited investigationby the local departmentofagriculture.
Ten additional persons reporting illnessesfrom the same address had less severe symp-toms. These included eye and upper respiratoryirritation,as well as headache,nausea and vom-
Reviews, Case Histories 35
iting. Four of the 10 reported either chest painor “raspy breathing” the day of the incident, butdid not have any reported medical treatment.
Treatment
Although details were available only forthe two subjects described above with themost serious respiratory symptoms, 11 of the illEdmundson residents or visitors reported re-ceiving medical treatment. These included 6(18.2%) of the 33 subjects with respiratorysymptoms and 7 (9.6%) of the 73 subjects withsystemic symptoms. No subjects reportedseeking treatment among the 87 communityresidents or visitors with isolated irritant symp-toms. A multivariate analysis confirmed thattreatmentappearedverysignificantly related torespiratory symptoms (odds ratio for seekingtreatment = 6.1, p = 0.005) but not systemicsymptoms (odds ratio for seeking treatment =2.6, p = 0.15).
Air Conditioning and Outdoor Activities
Suggestive anecdotal information regardingpossible risk factors was found in several cases.These includedfor example, a 48-year-old resi-dent of Judith Street, who experienced burningand tearing of her eyes while she was inside herhome. The symptoms became worse after turn-ing on the window air conditioner unit and stillworse after going outside. Other residents as-cribed a possible protective effect to central airconditioning.
Among the199Edmundsonresidentswhoseillness status was known, there were 71(35.7%) who reported at least brief outdoor ac-tivities on July 8 and 38 (19.1%) residing inhomes reported to have central air conditioningrather than window air condition units.
Of the subjects with air conditioning, 28(73.7%) had symptoms compatible with expo-sure to metam-sodiumbyproducts compared to150 (93.2%) of the subjects without central airconditioning (Risk ratio 0.79, risk difference�19.5%, odds ratio 0.21, p = 0.0015 byFisher’s exact test).For those with at least somereported outdoor activity on July 8, 66 (93%)had compatible symptoms, compared with 112(87.5%) of those who did not (risk ratio, 1.06,
odds ratio 1.9, risk difference 5.5%, p = 0.17 byFishers’ exact test).
When both factors were evaluated in a strati-fied analysis, the air conditioning effect wasnot significant for the 71 residents who re-ported outdoor activity (risk ratio = 0.89, riskdifference = �10.3%, odds ratio 0.25, p = 0.15,by Fisher’s exact test). However, central airconditioning appeared significantly protectiveamong the 128 who did not report outdoor ac-tivities (risk ratio = 0.64, risk difference =�33.1%,odds ratio 0.13, p = 0.0012 by Fisher’sexact test). When both factors were evaluatedtogether in a logistic regression model, the ad-justed odds ratio for central air conditioningwas 0.15 (p = 0.0003). The adjusted odds ratiofor outdoor activity was 3.07, but was still ofonly borderline significance (p = 0.0552).
Symptom Patterns by Distance from TreatedField
The frequency of irritant symptoms did notdiffer significantly between the 108 residentsof Judith (n = 97, 89.5%) and the 91 residents ofBarbara (n = 76, 83.5%). There was a greater,although non-significant, difference in the fre-quency of systemic symptoms: n = 44, 40.7%for Judith residents and n = 29, 31.9% forBarbara residents (odds ratio= 1.47, risk ratio=1.3, risk difference = 8.9%, p = 0.13, byFisher’s exact test). Respiratory symptomsshowed a significant difference between thetwo streets: n = 25, 23.1% for residents of Ju-dith, and n = 8, 8.8% for residents of Barbara(odds ratio = 3.1, risk ratio = 2.6, risk difference= 14.4%, p = 0.005 by Fisher’s exact test).
Illnesses in Packing Shed Workers
In addition to the illnesses in community res-idents on July 8, there were reports of 74 casesof MITC-compatible illness in employees of acarrot packing shed located on Barbara Street.These included six direct complaints filed byplant supervisors and 68 reported by proxy. Al-though theworkers wereadults, no informationon individual ages was available. The groupresembled community residents in probableethnicity based on surname: 77.7% were His-panic. One packing shed worker resided inEdmundson Acres, on Judith Street. The re-
36 JOURNAL OF AGROMEDICINE
maining workers lived in other sections ofArvin, the neighboring community of Lamont,or in Bakersfield.
In 72 cases the workers were described aslimited to eye irritation, and two cases had botheye irritation and sore throat. None of the pack-ing shed workers described any respiratory orsystemic symptoms (a deficit when comparedto the 36.7% frequency of systemic symptomsand 16.6% frequency of respiratory symptomsamong the 199 Edmundson residents (p < 1 �10�3 by Yates’ corrected chi-square for bothoutcomes).
Results of ISC3 Modeling
Modeling results indicated that the plume ofMITC from the application area spread acrossthe Edmundson between 8 p.m. and 9 p.m. Thestability class was E (slightly stable) for thathour; the 1-hour MITC air concentration esti-mates ranged from 0.6-0.8 ppm (along Judith)and0.4-0.6ppm(alongBarbara).Short-term(3minute TWA) concentrations, estimated usingpeak-to-mean methods, ranged between 1.6and 2.4 ppm (Table 4).
Between 9 p.m. and 10 p.m., the estimated1-hour MITC concentrations in the Edmundsonneighborhood ranged from 1.0 ppm (alongJudith) to0.8 ppm(alongBarbara).Between10p.m. and 11 p.m. the corresponding estimatedMITC concentrations were 0.8 ppm (along Ju-dith) and 0.6 ppm (along Barbara). The wind atthat point was 3 mph, coming nearly directlyfrom the east. Similar wind and atmosphericconditions also prevailed between 11 p.m. andmidnight. The atmospheric stability class wasF (highly stable) causing the concentrationswithin the plume generally to increase and esti-mated 3-minute TWA concentrations rangedbetween 2.4 and 3.2 ppm. The MITC plume
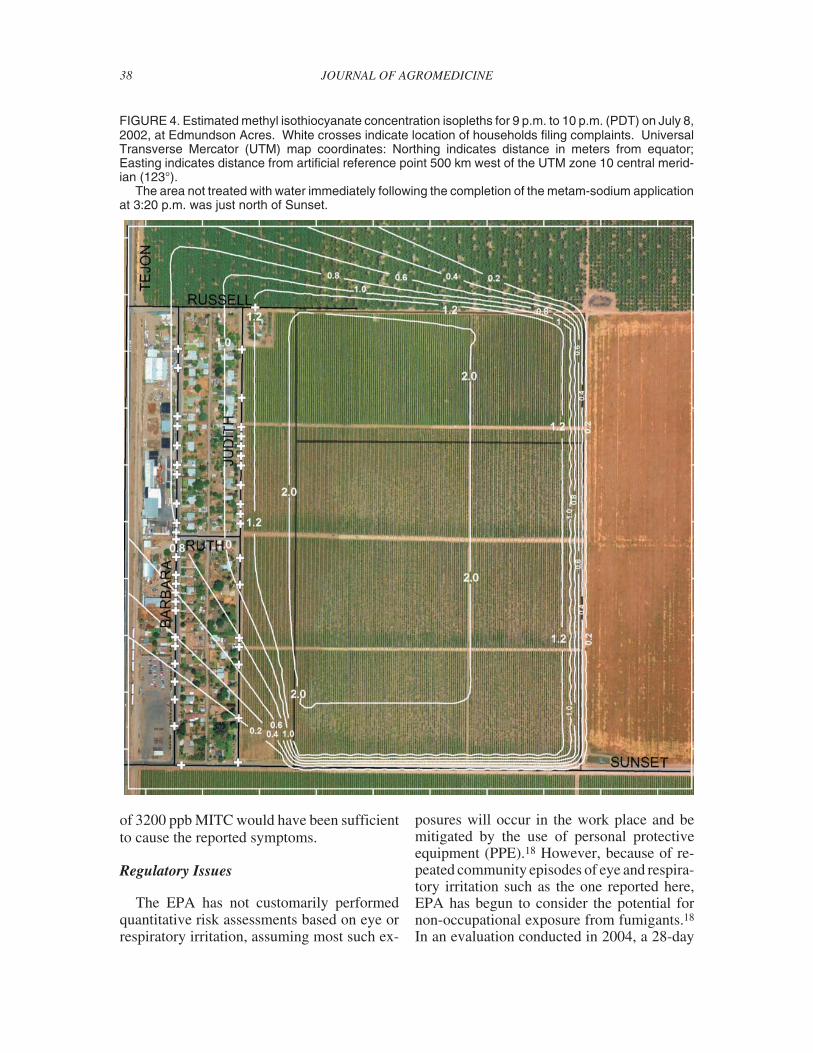
during this period corresponded closely withthe distribution of reported cases (Figure 4).
Between midnight and 1 a.m., the windspeed dropped to 1.3 mph and shifted to thenortheast. At this point, the majority of theplume of MITC was essentially not contactingthe north portion of the residential areas on Ju-dith and Barbara streets. However, the plumewas still in contact with the southern end ofJudith and Barbara streets.
Ambient Air Pollution
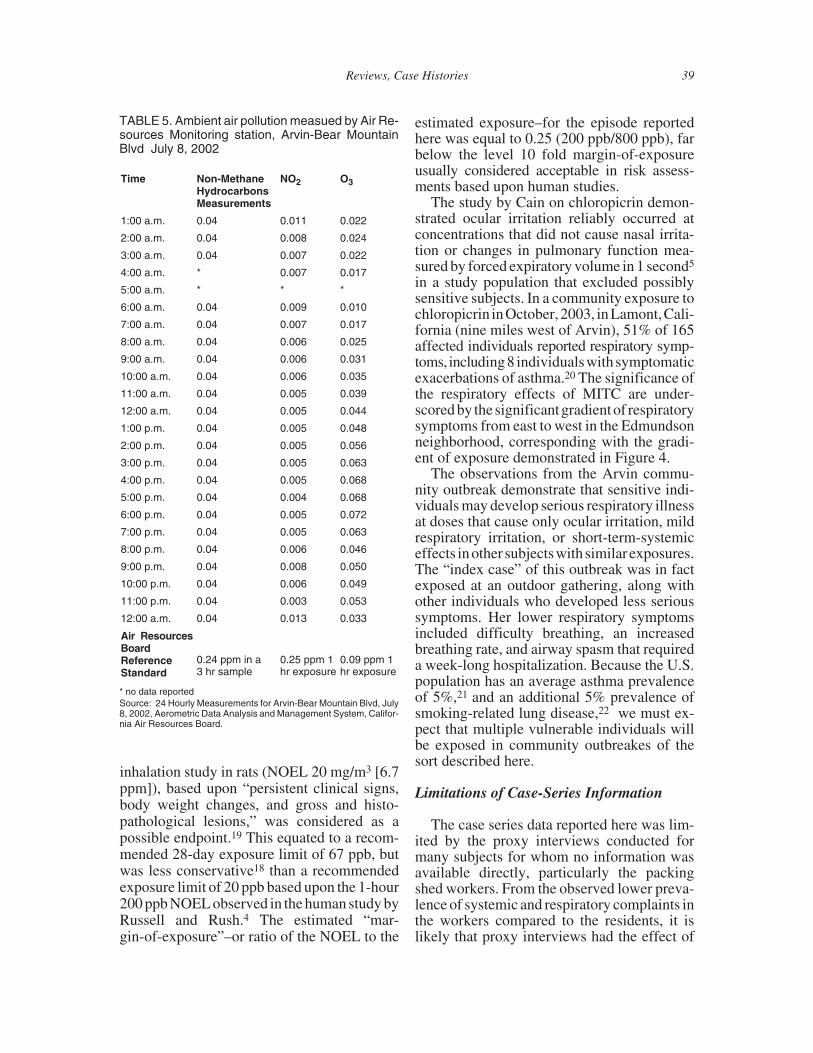
Data for ambient ozone, nitrogen oxides,and non-methane hydrocarbons measured atthe Arvin-Bear Mountain air pollution stationon July 8, 2002 are shown in Table 5. None ofthese air contaminants exceeded ambient airquality standards set by the California Air Re-sources Board on the day of the communityincident.
DISCUSSION
The symptoms occurring in communityresidents on the evening of July 8 in theEdmundson neighborhood of Arvin includedeye and upper respiratory irritation, non-spe-cific systemic complaints, and lower airwayssymptoms compatible with the effects ofMITC and other metam-sodium degradationproducts. On the day of the incident ambient airpollution was below reference standards set bythe California ARB. Investigation by emer-gency responders did not identify a roadwayspill or leak of hazardous materials from thepackingoperation located in theneighborhood.
ISC3 estimates suggest that MITC levels atthe 800 ppb 1-hour MITC eye irritation thresh-old occurred in portions of the EdmundsonAcres neighborhood for at least two hours be-tween 8 p.m. and 10 p.m. on the evening of July8, 2002. Peak-to-mean estimates suggestedthat short-term fluctuations as high as 3.2 ppm(3200 ppb) also occurred. It is plausible to as-sume that the reported symptoms, althoughnon-specific, were related to the application of25,000 pounds of metam-sodium adjacent totheir neighborhood earlier in the day. Exposureto either 1-hour of 800 ppb MITC or 4 minutes
Reviews, Case Histories 37
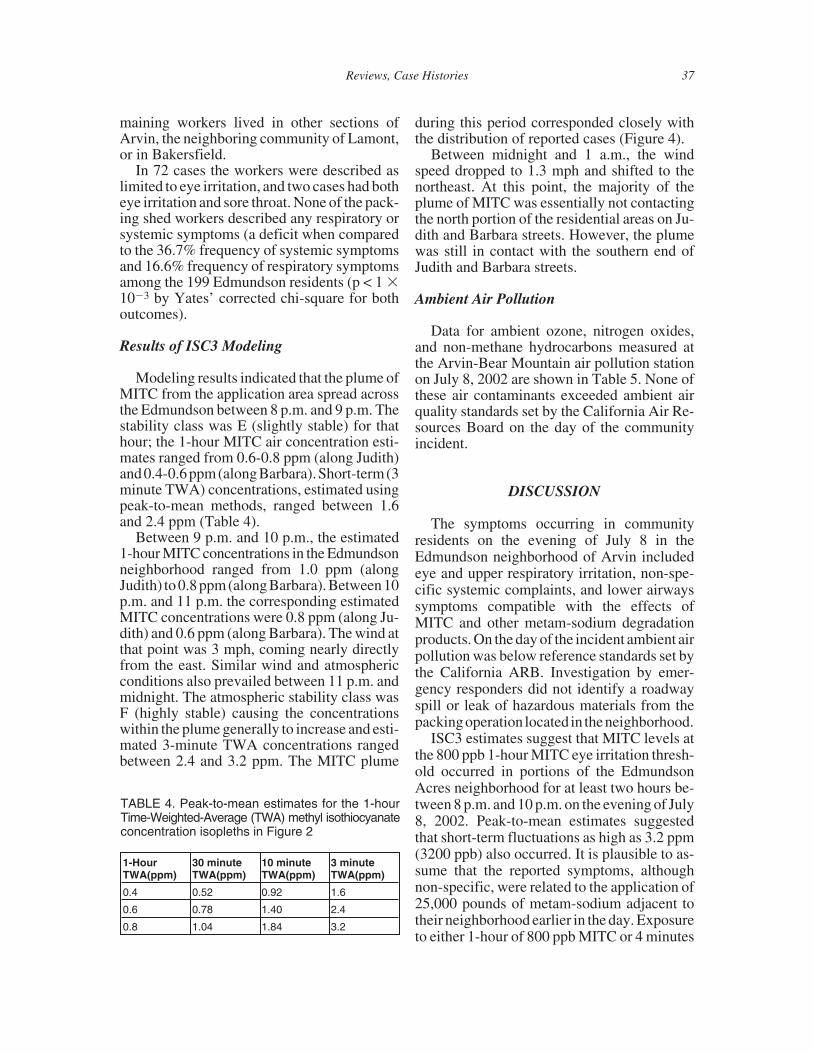
TABLE 4. Peak-to-mean estimates for the 1-hourTime-Weighted-Average (TWA) methyl isothiocyanateconcentration isopleths in Figure 2
1-HourTWA(ppm)
30 minuteTWA(ppm)
10 minuteTWA(ppm)
3 minuteTWA(ppm)
0.4 0.52 0.92 1.6
0.6 0.78 1.40 2.4
0.8 1.04 1.84 3.2
of 3200 ppb MITC would have been sufficientto cause the reported symptoms.
Regulatory Issues
The EPA has not customarily performedquantitative risk assessments based on eye orrespiratory irritation, assuming most such ex-
posures will occur in the work place and bemitigated by the use of personal protectiveequipment (PPE).18 However, because of re-peated community episodes of eye and respira-tory irritation such as the one reported here,EPA has begun to consider the potential fornon-occupational exposure from fumigants.18
In an evaluation conducted in 2004, a 28-day
38 JOURNAL OF AGROMEDICINE
FIGURE 4. Estimated methyl isothiocyanate concentration isopleths for 9 p.m. to 10 p.m. (PDT) on July 8,2002, at Edmundson Acres. White crosses indicate location of households filing complaints. UniversalTransverse Mercator (UTM) map coordinates: Northing indicates distance in meters from equator;Easting indicates distance from artificial reference point 500 km west of the UTM zone 10 central merid-ian (123°).
The area not treated with water immediately following the completion of the metam-sodium applicationat 3:20 p.m. was just north of Sunset.
inhalation study in rats (NOEL 20 mg/m3 [6.7ppm]), based upon “persistent clinical signs,body weight changes, and gross and histo-pathological lesions,” was considered as apossible endpoint.19 This equated to a recom-mended 28-day exposure limit of 67 ppb, butwas less conservative18 than a recommendedexposure limit of 20 ppb based upon the 1-hour200 ppb NOEL observed in the human study byRussell and Rush.4 The estimated “mar-gin-of-exposure”–or ratio of the NOEL to the
estimated exposure–for the episode reportedhere was equal to 0.25 (200 ppb/800 ppb), farbelow the level 10 fold margin-of-exposureusually considered acceptable in risk assess-ments based upon human studies.
The study by Cain on chloropicrin demon-strated ocular irritation reliably occurred atconcentrations that did not cause nasal irrita-tion or changes in pulmonary function mea-sured by forced expiratory volume in 1 second5
in a study population that excluded possiblysensitive subjects. In a community exposure tochloropicrin inOctober, 2003, inLamont,Cali-fornia (nine miles west of Arvin), 51% of 165affected individuals reported respiratory symp-toms, including8 individualswith symptomaticexacerbations of asthma.20 The significance ofthe respiratory effects of MITC are under-scored by the significantgradientof respiratorysymptoms from east to west in the Edmundsonneighborhood, corresponding with the gradi-ent of exposure demonstrated in Figure 4.
The observations from the Arvin commu-nity outbreak demonstrate that sensitive indi-viduals may develop serious respiratory illnessat doses that cause only ocular irritation, mildrespiratory irritation, or short-term-systemiceffects inother subjectswith similarexposures.The “index case” of this outbreak was in factexposed at an outdoor gathering, along withother individuals who developed less serioussymptoms. Her lower respiratory symptomsincluded difficulty breathing, an increasedbreathing rate, and airway spasm that requireda week-long hospitalization. Because the U.S.population has an average asthma prevalenceof 5%,21 and an additional 5% prevalence ofsmoking-related lung disease,22 we must ex-pect that multiple vulnerable individuals willbe exposed in community outbreakes of thesort described here.
Limitations of Case-Series Information
The case series data reported here was lim-ited by the proxy interviews conducted formany subjects for whom no information wasavailable directly, particularly the packingshed workers. From the observed lower preva-lence of systemic and respiratory complaints inthe workers compared to the residents, it islikely that proxy interviews had the effect of
Reviews, Case Histories 39
TABLE 5. Ambient air pollution measued by Air Re-sources Monitoring station, Arvin-Bear MountainBlvd July 8, 2002
Time Non-MethaneHydrocarbonsMeasurements
NO2 O3
1:00 a.m. 0.04 0.011 0.022
2:00 a.m. 0.04 0.008 0.024
3:00 a.m. 0.04 0.007 0.022
4:00 a.m. * 0.007 0.017
5:00 a.m. * * *
6:00 a.m. 0.04 0.009 0.010
7:00 a.m. 0.04 0.007 0.017
8:00 a.m. 0.04 0.006 0.025
9:00 a.m. 0.04 0.006 0.031
10:00 a.m. 0.04 0.006 0.035
11:00 a.m. 0.04 0.005 0.039
12:00 a.m. 0.04 0.005 0.044
1:00 p.m. 0.04 0.005 0.048
2:00 p.m. 0.04 0.005 0.056
3:00 p.m. 0.04 0.005 0.063
4:00 p.m. 0.04 0.005 0.068
5:00 p.m. 0.04 0.004 0.068
6:00 p.m. 0.04 0.005 0.072
7:00 p.m. 0.04 0.005 0.063
8:00 p.m. 0.04 0.006 0.046
9:00 p.m. 0.04 0.008 0.050
10:00 p.m. 0.04 0.006 0.049
11:00 p.m. 0.04 0.003 0.053
12:00 a.m. 0.04 0.013 0.033
Air ResourcesBoardReferenceStandard
0.24 ppm in a3 hr sample
0.25 ppm 1hr exposure
0.09 ppm 1hr exposure
* no data reportedSource: 24 Hourly Measurements for Arvin-Bear Mountain Blvd, July8, 2002, Aerometric Data Analysis and Management System, Califor-nia Air Resources Board.
under-estimating the occurrence of the moreserious adverse effects of MITC and othermetam-sodium degradation products. It is alsouncertain whether all affected residents andvisitors were identified. If the actual neighbor-hood population approached the admittedlycrude estimate of 650 residents, it is likely thatsome illnesses went unreported.
Medical evaluations were performed in only11 of the 178 community residents with re-portedsymptoms.Had this incidentoccurred ina community with greater medical resources,it seems probable that the majority of those af-fected (especially those with respiratory andsystemic symptoms) would have receivedmedical attention. This deficiency may be less-ened in any future similar episodes by a newCalifornia law requiring application compa-nies to pay the initial medical expenses of thoseaffected by pesticide drift.23
Risk factors identified in the analysis ofquestionnaire data were based upon limiteddata. Nevertheless, it does not appear from theavailable information that the standard recom-mendation to turn off air conditioningunitswaseffectively communicated to all Edmundsonresidents. Those who had central air condition-ing appeared relatively protected compared tothose with evaporative cooling units as long asthey did not venture outdoors.
The emergency responders’ decision to“shelter-in-place” instead of evacuating to anunaffected area was therefore only partiallyprotective.
Limitations of Modeling Data
The location of the plume in Figure 4 repre-sents a 1-hour time-weighted-average and assuch should not be interpretedas the exact loca-tion of the plumes at any particular momentduring the incident. It is probable that the cen-terline shifted back and forth over the affectedarea over time periods ranging from a few aminutes to one hour. The 2400-3200 ppb peakconcentrations exceeded the 1-hour TWALOEL concentration of 800 ppb for a time-weight-average by 3-4 fold and exceeded the4-minute TWA LOEL concentration of 1900ppb by 26-68%.
Crucial assumptions upon which the modelingwas based appear reasonably justified, includ-ing:
1. The weather data employed were repre-sentative of the weather conditions dur-ing the incident because of the proximityof the weather station (CIMIS # 125, 0.3miles southeast) and the intervening open,flat terrain;
2. The flux estimate obtained from analysisof the Merricks (1999) field study rea-sonably approximates the flux associ-ated with the Arvin incident. Whilethere is some question about the effecton the flux of the delay of watering-inon the last 15 acres of the application,the remainder of the Arvin applicationis similar to the Merricks (1999) studyapplication. The watering-in was com-pleted before the majority of neighbor-hood complaints occurred.
The wind direction is another important con-sideration. During the period of the highestnumber of complaints, 9 p.m. to 10 p.m., theplume of MITC from the field was moving al-most due west (Figure 3a and Table 3). There-fore, during those hours a plume emanatingonly from the 15 acres with the delayedpost-application water treatment is not likely tohave been sufficient to cause the observedsymptoms in the entire Edmundson neighbor-hood.
Prevention of Future Episodes
To prevent future respiratory and irritant ill-nesses due to MITC, it is necessary to evaluateto what extent exposure can be minimized bybetter enforcement of existing regulatory con-trols on metam-sodium and to what extent ad-ditional regulatory controls are necessary. Thepost incidentenforcement investigation24 dem-onstrated administrative violations includingfailing to complete the fumigationsummary re-quired under county permit conditions, andfailing to post signs at access points to thetreated field. Other violations included failureto monitor the application and failure to applywater immediately after treatment. Commonusage in the fumigation industry describes this
40 JOURNAL OF AGROMEDICINE
post-application treatment as a “water-seal”but limited data are available to document itsquantitative effect on MITC flux rates.
Factors related to theflux thatdidnot representviolations of the label or permit conditions in-cluded the application rate (60 gallons/acre ver-sus maximum label rate–75 gallons/acre) or theamountapplied (inexcessof25,000 lbs).There isno evidence that the 500-foot buffer zone was vi-olated,butsomequestionwhether thebufferzonewas sufficient. Given the quantity applied soclose to a populated area, it is unsurprising thatsmall changes in wind direction and in atmo-spheric stability, or sub-standard applicationtechnique might generate levels of MITC ex-ceeding the average 800 ppb irritation low-effect-level. Metam-sodium applications to thefield east of Judith during 2001 differed from theapplicationresponsible for theJuly,2002episodein two important respects. Both 2001 applica-tions involved a fraction of the active ingredientapplied in 2002 and both benefited from favor-able pattern of wind, blowing away from theEdmunson neighborhood (see Figure 3a, com-pared to Figure 3b, and Figure 3c).
New application requirements currently un-der consideration include limitation of treatedacreage, reduction of maximum allowable ap-plication rates, prohibition of night-time appli-cations, increased post-application water treat-ments, and extending buffer zones based onmodeling and exposure data. Newer applica-tion techniques, such as subsurface (30 cm be-low the soil) drip irrigation, also show promisein reducing flux from MITC, dichloropropeneand other fumigants.25 However, given currentapplication volumes, implementation of ade-quate measures to prevent illnesses related tooffsite movement of MITC, chloropicrin andother fumigants remains a formidable chal-lenge. Additional challenges may also arise asinvestigational products such as methyl io-dide26 and propargyl bromide25 become regis-teredforactiveuse inagriculturalproduction.
As demonstrated by the lengthy delay inresponding to the episode in Arvin, adequatepost-incident response also remains a chal-lenge given the resources available in typicallyaffected communities. In the Arvin episode, asin related incidents,20,27 the fire departmenthaz-mat team was largely unprepared to evalu-ate the degree of hazard presented by an
unknown air contaminant. Unsurprisingly, acrew trained to respond to roadway spills ofhazardous materials did not recognize a hazardemanating from an apparently vacant plot ofagricultural ground. The nature of the principalmetam-sodium byproduct, MITC, with an av-erage odor threshold twice the average irrita-tion threshold,4 further complicated the pro-cess of hazard identification by emergencyresponders. The responding hazardous materi-als crews decided, based upon the perceptionthat no odor was present, that no evacuationwas necessary.
Whether off-site fumigant episodes will be-come a common issue in jurisdictions outsideof California remains uncertain. According toU.S. Environmental Protection Agency esti-mates, California accounted for approximately36% of the 51-55 million pounds of metam-so-dium used in U.S. agriculture in 2002. Thenorthwestern states of Idaho, Oregon, andWashington accounted for 50%, the states ofMichiganand Wisconsin accounted for most ofthe 9% used in the midwestern U.S.; just over1% was used in Florida.28 The agricultural ar-eas of California have large populations rela-tive to the other states that use large volumes ofmetam-sodium. The four Oregon counties ac-counting for most of that state’s potato produc-tion,29 for example, had a reported 2003 popu-lation of 164,779 residents in a 14,262 squaremile area (11.5 residents/square mile).9 In2003, Kern County, the site of the outbreak re-ported here, had a population of 680,804 resi-dents in an area of 8,141 square miles (83.6 res-idents/square mile).9 Other jurisdictions withthe mix of rural housing and agricultural pro-duction illustrated in this outbreak (Figure 1)(and the similar episodes in Earlimart1 andLamont20) may be at risk for problems relatedto off-site movement of air contaminantsfollowing soil fumigations.
REFERENCES
1. O’Malley M, Barry T, Verder-Carlos M, Rubin A.Modeling of methyl isothiocyanate air concentrations as-sociated with community illnesses following a metam-sodium sprinkler application. Am J Ind Med. 2004 Jul;46(1):p.1-15.
Reviews, Case Histories 41
2.CaliforniaDepartmentofPesticideRegulation.Sum-maryofresultsfromtheCaliforniaPesticideIllnessSurveil-lance program, 2003-2005 [cited 2005 Feb 27]. Availablefrom: http://www.cdpr.ca.gov/docs/whs/2002 pisp.htm.
3. California Department of Pesticide Regulation.Summary of results from the California Pesticide IllnessSurveillance program, 2002-2004 [cited 2005 Feb 27].Available from: http://www.cdpr.ca.gov/docs/whs/2002pisp.htm.
4. Russell MJ and Rush TI. Methyl isothiocyanate:determination of human olfactory detection thresholdand human no observable effect level for eye irritation.1996, Metam Sodium Task Force: Sacramento, Calif.
5. Cain WS. Human sensory irritation testing forchloropicrin. San Diego (CA):University of California;2004. p. 378.
6. Cone JE, Wugofski L, Balmes JR, Das R, BowlerR, Alexeeff G, Shusterman D. Persistent respiratoryhealth effects after a metam sodiumpesticidespill.Chest.1994 Aug;106(2):p.500-8.
7. Migration dialogue. California Rural Communi-ties (CARUCOM); 2004 [cited 2005 Sep 16]. Availablefrom:http://migration.ucdavis.edu/rmn/rural_data/carucom/cal_ counties/kern/arvin.html.
8. Venturi Staffing. Arvin city, California Unem-ployment Rate: 2005 [cited 2005 October 13] Availablefrom: http://www.venturi-staffing.com/ui/arvin_city.shtml.
9. U.S. Census Bureau, F.F. State & County QuickFacts; 2000 [cited 2003 Aug 11]. Available from: http://factfinder.census.gov.
10. California Institute for Rural Studies. In their ownwords: farmworker access to health care in four Califor-nia regions; 2005 [cited 2005 Sep 16]. Available from:http://www.cirsinc.org/CPAC.pdf.
11. Division of Public Health Surveillance and Infor-matics, E.P.O., Epi-Info, version 3.3.2. 2005. Atlanta(GA):Centers for Disease Control [cited 2005 Oct 14].Available from: http://www.cdc.gov/epiinfo/epiinfo.htm.
12. U.S. Environmental Protection Agency. User’sguide for the Industrial source complex (isc3) dispersionmodels Volume II–description of model algorithms; 1995[cited 2005 Sep 16]. Available from: http://www.epa.gov/scram001/tt22.htm#isc.
13. Turner, DB. Workbook of atmospheric dispersionestimates: an introduction to dispersion modeling. 2nded. Boca Raton (FL): Lewis Publishers; 1994.
14. Merrick, DL. Determination of methyl isothio-cyanate offsite air movement from the application ofmetam-sodium through injection and sprinkler irriga-tion. Frederick (MD):Agrisearch Incorporated; 1999.
15. Hino M. Maximum ground level concentrationand sampling time. Atmos. Environ. 1968. 2: p.149-65.
16. Aerometric Data Analysis and Management Sys-tem, California Air Resources Board Hourly Listing: 24Hourly Measurements for Arvin-Bear Mountain Blvd,July 8, 2002; [cited 2005 Sep 16]. Available from:
http://www.arb.ca.gov/adam/cgi-bin/db2www/adamhourly.d2w/start.
17. California Air Resources Board. Ambient AirQuality Standards; 2005 [cited 2005 May 5]. Availablefrom: http://www.arb.ca.gov/aqs/aaqs2.pdf.
18. Lowit A. Human eye and nasal irritation resultingfrom air exposure to MITC, in Office of Pesticide Pro-grams Docket OPP-2004-0159. U.S. Environmental Pro-tection Agency; 2004.
19. Christensen. METAM SODIUM/METAM PO-TASSIUM: The HED Chapter of the ReregistrationEligibility Decision Document (RED), in Office of Pest-icide Programs Docket OPP-2004-0159. U.S. Environ-mental Protection Agency; 2004.
20. O’Malley M, Edmiston S, Richmond D, Ibarra M,Barry T, Smith M. Illness associated with drift of chloro-picrin soil fumigant into a residential area–Kern County,California,2003.MMWR.2004Aug20;53(32):740-43.
21.MiddletonE Jr,EllisEF,Yunginger JW,ReedCE,Adkinson NF Jr, Busse WW, editors. Allergy: Principlesand Practice, 5th ed. St. Louis(MO): Mosby; 1998.
22. Halbert RJ, Isonaka S, George D, Iqbal A. Inter-preting COPD prevalence estimates: what is the true bur-den of disease? Chest., 2003 May. 123(5):1684-92.
23. Florez D. Pesticide Drift Exposure Response Act.2004.
24. Ibarra M. Priority investigation 45-KER-02 sup-plemental report. Sacramento (CA):California Depart-ment of Pesticide Regulation; 2002.
25. Papiernik SK, Dungan RS, Zheng W, Guo M,Lesch SM, Yates SR. Effect of application variables onemissions and distribution of fumigants applied via sub-surface drip irrigation. Environ Sci Technol. 2004 Nov1;38(21):5489-96.
26. Becker J, Ohr H, Grech N, McGiffen M Jr, Sims J.Evaluation of methyl iodide as a soil fumigant in con-tainer and small field plot studies. Pestic Sci. 1998;52(1):58-62.
27. O’Malley M, Verder-Carlos M. Illness Related toExposure to Metam-Sodium Byproducts in Earlimart,California in November 1999. Sacramento (CA): Cali-fornia Environmental Protection Agency; 2001 [cited2005 Sep 16]. Available from: http://www.cdpr.ca.gov/docs/ whs/pdf/hs1808.pdf.
28. U.S. Environmental Protection Agency. Over-view of the Metam Sodium Risk Assessments, in Officeof Pesticide Programs, Docket #OPP-2004-0159-0003.Arlington (VA): U.S. Environmental Protection Agency;2004. p. 57.
29. Oregon State University. Potato Information Ex-change,OregonProduction.2005[cited2005Sep16].Avail-able from: http://oregonstate.edu/potatoes/orprod.htm.
RECEIVED: 10/19/2004REVISED: 05/06/2005
ACCEPTED: 07/19/2005
42 JOURNAL OF AGROMEDICINE
Related Documents