REVIEW ARTICLE Energy metabolism in tumor cells Rafael Moreno-Sa ´nchez, Sara Rodrı´guez-Enrı´quez, Alvaro Marı´n-Herna ´ ndez and Emma Saavedra Instituto Nacional de Cardiologı ´a, Departamento de Bioquı ´mica, Tlalpan, Me ´ xico, Mexico In biochemical and physiological studies, tumor cells are usually classified according to their rate of growth: low; intermediate; or fast [1]. For tumors in experimental ani- mals, the growth rate is determined by size and volume, mitotic count, degree of differentiation and thymidine incorporation [2]. Examples of fast-growth tumors in mice include several experimental cancers, such as Ehrl- ich ascites tumor, fibrosarcoma 1929 and lymphocytic leukemia L1210; and in rats, fast-growth tumors include the hepatomas of Morris (3924A, 7793, 7795, 7800, 7288C, 7316B, 3683), Reuber H-35, Novikoff, AH130 and AS-30D, breast carcinosarcoma Walker 256, hepatocellular carcinoma HC-252, hepatoma induced by dimethylazobenzene and DS-carcinosarcoma [1]. In human tumors, classification is based on their histological characteristics and stage of clinical pro- gression. By their advanced developmental stage and metastatic properties, some human tumors considered to be of fast growth are breast carcinoma, ovarian car- cinoma, melanoma, thyroid carcinoma, uterine carci- noma and lung carcinoma [1,3]. Human primary brain tumors, such as gliomas, glioblastomas and medulo- blastomas, are also considered as fast-growth tumors because of their high rate of proliferation (average transfer in days or weeks) and their conversion to a poorly differentiated status [4,5]. Tumor cells exhibit profound genetic, biochemical and histological differences with respect to the original, Keywords casiopeinas; chemotherapy; glycolysis; metabolic control analysis; mitochondrial metabolism; PET; rhodamines Correspondence R. Moreno-Sa ´ nchez, Instituto Nacional de Cardiologı ´a, Departamento de Bioquı ´mica, Juan Badiano no. 1, Tlalpan, Me ´ xico DF 14080, Mexico Fax: +5255 55730926 Tel: +5255 55732911, ext. 1422, 1298 E-mail: [email protected] or [email protected] (Received 31 October 2006, revised 2 Janu- ary 2007, accepted 10 January 2007) doi:10.1111/j.1742-4658.2007.05686.x In early studies on energy metabolism of tumor cells, it was proposed that the enhanced glycolysis was induced by a decreased oxidative phosphoryla- tion. Since then it has been indiscriminately applied to all types of tumor cells that the ATP supply is mainly or only provided by glycolysis, without an appropriate experimental evaluation. In this review, the different genetic and biochemical mechanisms by which tumor cells achieve an enhanced glycolytic flux are analyzed. Furthermore, the proposed mechanisms that arguably lead to a decreased oxidative phosphorylation in tumor cells are discussed. As the O 2 concentration in hypoxic regions of tumors seems not to be limiting for the functioning of oxidative phosphorylation, this path- way is re-evaluated regarding oxidizable substrate utilization and its contri- bution to ATP supply versus glycolysis. In the tumor cell lines where the oxidative metabolism prevails over the glycolytic metabolism for ATP sup- ply, the flux control distribution of both pathways is described. The effect of glycolytic and mitochondrial drugs on tumor energy metabolism and cel- lular proliferation is described and discussed. Similarly, the energy meta- bolic changes associated with inherent and acquired resistance to radiotherapy and chemotherapy of tumor cells, and those determined by positron emission tomography, are revised. It is proposed that energy metabolism may be an alternative therapeutic target for both hypoxic (glycolytic) and oxidative tumors. Abbreviations ALD, aldolase; ANT, adenine nucleotide translocase; COX, cyclooxygenase; CT, computed tomography; F2,6BP, fructose-2,6-bisphosphate; FDG, 18 fluoro-deoxyglucose; GAPDH, glyceraldehyde-3-phosphate dehydrogenase; GLUT, glucose transporter; G6P, glucose-6-phosphate; HIF, hypoxia inducible factor; HK, hexokinase; LDH, lactate dehydrogenase; NSAID, nonsteroidal anti-inflammatory drug; PDH, pyruvate dehydrogenase complex; PET, positron emission tomography; PFK-1, phosphofructokinase type 1; PFK-2, phosphofructokinase type 2; Pyr, pyruvate. FEBS Journal 274 (2007) 1393–1418 ª 2007 The Authors Journal compilation ª 2007 FEBS 1393

Welcome message from author
This document is posted to help you gain knowledge. Please leave a comment to let me know what you think about it! Share it to your friends and learn new things together.
Transcript

REVIEW ARTICLE
Energy metabolism in tumor cellsRafael Moreno-Sanchez, Sara Rodrıguez-Enrıquez, Alvaro Marın-Hernandez and Emma Saavedra
Instituto Nacional de Cardiologıa, Departamento de Bioquımica, Tlalpan, Mexico, Mexico
In biochemical and physiological studies, tumor cells are
usually classified according to their rate of growth: low;
intermediate; or fast [1]. For tumors in experimental ani-
mals, the growth rate is determined by size and volume,
mitotic count, degree of differentiation and thymidine
incorporation [2]. Examples of fast-growth tumors in
mice include several experimental cancers, such as Ehrl-
ich ascites tumor, fibrosarcoma 1929 and lymphocytic
leukemia L1210; and in rats, fast-growth tumors include
the hepatomas of Morris (3924A, 7793, 7795, 7800,
7288C, 7316B, 3683), Reuber H-35, Novikoff, AH130
and AS-30D, breast carcinosarcoma Walker 256,
hepatocellular carcinoma HC-252, hepatoma induced
by dimethylazobenzene and DS-carcinosarcoma [1].
In human tumors, classification is based on their
histological characteristics and stage of clinical pro-
gression. By their advanced developmental stage and
metastatic properties, some human tumors considered
to be of fast growth are breast carcinoma, ovarian car-
cinoma, melanoma, thyroid carcinoma, uterine carci-
noma and lung carcinoma [1,3]. Human primary brain
tumors, such as gliomas, glioblastomas and medulo-
blastomas, are also considered as fast-growth tumors
because of their high rate of proliferation (average
transfer in days or weeks) and their conversion to a
poorly differentiated status [4,5].
Tumor cells exhibit profound genetic, biochemical
and histological differences with respect to the original,
Keywords
casiopeinas; chemotherapy; glycolysis;
metabolic control analysis; mitochondrial
metabolism; PET; rhodamines
Correspondence
R. Moreno-Sanchez, Instituto Nacional de
Cardiologıa, Departamento de Bioquımica,
Juan Badiano no. 1, Tlalpan, Mexico DF
14080, Mexico
Fax: +5255 55730926
Tel: +5255 55732911, ext. 1422, 1298
E-mail: [email protected] or
(Received 31 October 2006, revised 2 Janu-
ary 2007, accepted 10 January 2007)
doi:10.1111/j.1742-4658.2007.05686.x
In early studies on energy metabolism of tumor cells, it was proposed that
the enhanced glycolysis was induced by a decreased oxidative phosphoryla-
tion. Since then it has been indiscriminately applied to all types of tumor
cells that the ATP supply is mainly or only provided by glycolysis, without
an appropriate experimental evaluation. In this review, the different genetic
and biochemical mechanisms by which tumor cells achieve an enhanced
glycolytic flux are analyzed. Furthermore, the proposed mechanisms that
arguably lead to a decreased oxidative phosphorylation in tumor cells are
discussed. As the O2 concentration in hypoxic regions of tumors seems not
to be limiting for the functioning of oxidative phosphorylation, this path-
way is re-evaluated regarding oxidizable substrate utilization and its contri-
bution to ATP supply versus glycolysis. In the tumor cell lines where the
oxidative metabolism prevails over the glycolytic metabolism for ATP sup-
ply, the flux control distribution of both pathways is described. The effect
of glycolytic and mitochondrial drugs on tumor energy metabolism and cel-
lular proliferation is described and discussed. Similarly, the energy meta-
bolic changes associated with inherent and acquired resistance to
radiotherapy and chemotherapy of tumor cells, and those determined by
positron emission tomography, are revised. It is proposed that energy
metabolism may be an alternative therapeutic target for both hypoxic
(glycolytic) and oxidative tumors.
Abbreviations
ALD, aldolase; ANT, adenine nucleotide translocase; COX, cyclooxygenase; CT, computed tomography; F2,6BP, fructose-2,6-bisphosphate;
FDG, 18fluoro-deoxyglucose; GAPDH, glyceraldehyde-3-phosphate dehydrogenase; GLUT, glucose transporter; G6P, glucose-6-phosphate;
HIF, hypoxia inducible factor; HK, hexokinase; LDH, lactate dehydrogenase; NSAID, nonsteroidal anti-inflammatory drug; PDH, pyruvate
dehydrogenase complex; PET, positron emission tomography; PFK-1, phosphofructokinase type 1; PFK-2, phosphofructokinase type 2;
Pyr, pyruvate.
FEBS Journal 274 (2007) 1393–1418 ª 2007 The Authors Journal compilation ª 2007 FEBS 1393

nontransformed cellular types. The vast majority of
fast-growth tumor cell types display a markedly modi-
fied energy metabolism in comparison to the tissue of
origin (Figs 1 and 2), which has been widely documen-
ted for human cervix (HeLa), pharynx and mammary
gland (MCF-7, MDA-MB-453) tumors, as well as for
astroblastomas, gliomas (U-251MG, D-54MG, U-87
and U118MG) and oligodendrogliomas. The same
applies for tumors experimentally developed in rodents
(hepatomas of Ehrlich, Ehrlich-Lettre, Morris and
AS-30D; Walker 256 carcinoma; C6 glioma) [1,5–9].
The most notorious and well-known energy metabo-
lism alteration in tumor cells is an increased glycolytic
capacity, even in the presence of a high O2 concentra-
tion [1,6–11]. For instance, the glycolytic flux is 2–17
times higher in rat hepatomas than in normal hepato-
cytes [3,11]. It has been proposed that this increase in
the glycolytic flux is a metabolic strategy of tumor cells
to ensure survival and growth in environments with
low O2 concentrations [10]. Several mechanisms for the
enhanced glycolysis in tumor cells have been advanced
and documented (Table 1). It has to be emphasized
in
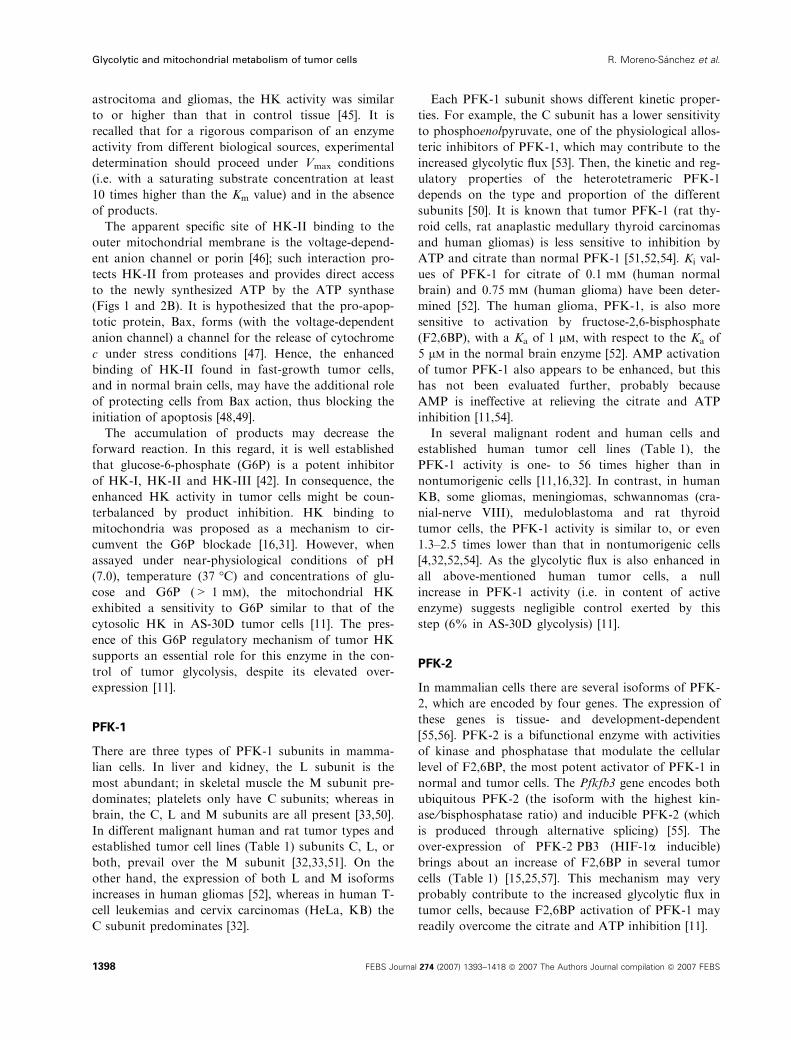
Fig. 1. The glycolytic pathway in normal
cells (left) and tumor cells (right). In tumor
cells, there is an increase of all enzymes
and glucose transporters with respect to
normal cells. In tumor cells hexokinase II
(HK-II) is over-expressed, increasing both
the activity and the binding to the outer
mitochondrial membrane, which in turn
increases the HK-II access to newly syn-
thesized ATP by oxidative phosphorylation.
An increased flux towards ribose-5-phos-
phate (and nucleotide) synthesis is docu-
mented for several tumor cells. Tumor
phosphofructokinase type 1 (PFK-1) (C and
L subunits) and the PFK-2FB3 isoform are
also over-expressed. In some tumors, the
amount of a-glycerol-3-phosphate dehydro-
genase (aGPDH) decreases. In addition to
be transformed in L-lactate, pyruvate may
be oxidized by mitochondria (MIT), generate
alanine (Ala) and, in tumor cells, synthesize
malate in a reaction catalyzed by an over-
expressed cytosolic malic enzyme. Other
relevant branches of the glycolytic pathway
are also indicated. The over-expressed HK is
strongly inhibited by its product, glucose-6-
phosphate (G6P), whereas PFK-1 activation
by fructose-2,6-bisphosphate (F2,6BP) over-
comes the citrate and ATP inhibition.
Glycolytic and mitochondrial metabolism of tumor cells R. Moreno-Sanchez et al.
1394 FEBS Journal 274 (2007) 1393–1418 ª 2007 The Authors Journal compilation ª 2007 FEBS

that there is no reason to apply the mechanisms, des-
cribed below, to all cancer cells automatically; each
particular tumor cell line has its own combination of
mechanisms and degree of expression for increasing
glycolysis.
Glycolytic enzymes and transportersin tumor cells
Transcriptional regulation of the glycolytic genes
A great body of evidence suggests that the main mech-
anism by which glycolysis is substantially higher in
tumor cells than in nontumorigenic cells is the
enhanced transcription of genes of several or all path-
way enzymes and transporters, which is accompanied
by an enhanced protein synthesis [12–15]; activity has,
however, rarely been determined.
For instance, in comparison to normal rat hepato-
cytes (Fig. 1), all glycolytic enzymes are over-expressed
by two- to fourfold in rat AS-30D hepatoma [hexose-
6-phosphate isomerase, aldolase (ALD), triose-
phosphate isomerase, glyceraldehyde-3-phosphate
dehydrogenase (GAPDH), phosphoglycerate kinase,
phosphoglycerate mutase, enolase and lactate dehy-
drogenase (LDH)], pyruvate kinase is over-expressed
by eight- to 10-fold, and hexokinase (HK) and phos-
phofructokinase type 1 (PFK-1) are over-expressed by
up to 17- to 300-fold (Fig. 1) [11,16]. For human cer-
vix HeLa cells, all enzymes, including HK and PFK-1,
are over-expressed by two- to sevenfold, with the
exception of phosphoglycerate mutase and LDH,
which are expressed at a level two- to seven-fold lower
than in rat hepatocytes [11]. However, for this last case
a more rigorous comparison should be made with nor-
mal uterine cervix epithelial cells (i.e. the original
source) when data become available. In Morris hepato-
mas, the activity of HK, PFK and pyruvate kinase is
5- to 500-fold higher than in liver [17], whereas the
activity of HK, ALD, pyruvate kinase and LDH is
3.7- to 7-times higher in human breast cancer than in
normal tissue [18].
Perhaps the prime driving mechanism for the
enhanced glycolysis is activation, via the hypoxia indu-
cible factor 1 (HIF-1), of the transcription and transla-
tion of glycolytic genes in tumor cells. HIF-1 is a
transcription factor constituted by two subunits, HIF-
1a and HIF-1b. Factor stability mostly depends on
HIF-1a. Under aerobiosis, an active process of HIF-1adegradation is promoted, whereas in anaerobiosis,
HIF-1a becomes highly stable [19,20]. In addition to
hypoxia, HIF-1a may be induced, under aerobiosis, by
cytokines, growth factors, reactive oxygen species and
A
B
Fig. 2. (A) Metabolic pathways in normal mitochondria. (1) The
Krebs cycle generates high NADH levels; (2) the concerted action
of the pyruvate (Pyr) transporter and pyruvate dehydrogenase com-
plex (PDH) generate adequate levels of acetyl-CoA; (3) NADH from
the Krebs cycle is a substrate for the respiratory chain, which gen-
erates a high H+ electrochemical gradient that drives ATP synthesis
by ATP synthase; and (4) ATP is exported by adenine nucleotide
translocase (ANT) to the cytosol to be used for cellular work.
(B) Principal metabolic perturbations, described or proposed for
some tumor mitochondria, which lead to a damaged oxidative
phosphorylation. (1) Cytosolic pyruvate is transported into mito-
chondria through a deficient Pyr transporter; (2) mitochondrial Pyr is
decarboxylated to acetoin, which inhibits the tumor PDH; (3) trun-
cated Krebs cycle with low aconitase and isocitrate dehydrogenase
activities; (4) a high citrate efflux for cholesterol and fatty acids syn-
thesis is developed; (5) low activity and expression of several res-
piratory chain complexes promotes a low H+ electrochemical
gradient; (6) an increase in the inhibitory protein (IP; red circles)
decreases the ATP synthase hydrolytic activity; (7) the close vicinity
of hexokinase-II (HK-II) and ANT favors the direct transfer of mito-
chondrial ATP to HK-II for glucose phosphorylation; and (8) tumor
cells have a lower number of mitochondria which, in turn, have a
lower number of respiratory chain copies. IM, inner mitochondrial
membrane; OM, outer mitochondrial membrane.
R. Moreno-Sanchez et al. Glycolytic and mitochondrial metabolism of tumor cells
FEBS Journal 274 (2007) 1393–1418 ª 2007 The Authors Journal compilation ª 2007 FEBS 1395

nitric oxide; or by the energy-metabolism intermediates
pyruvate (Pyr), lactate and oxaloacetate [20–22]. The
von Hippel)Lindau protein, a tumor suppressor, binds
to HIF-1a and induces its degradation by the proteo-
some; in some aggressive tumors, the von Hippel-Lin-
dau protein is mutated, thus becoming ineffective in
promoting HIF-1a degradation. This might be the rea-
son why HIF-1a is only detected in malignant tumors,
but not in normal, healthy tissues or benign tumors
[20,23]. In turn, HIF-1 enhancement promotes the
expression of HK, PFK-1, phosphofructokinase type 2
(PFK-2), ALD, GAPDH, phosphoglycerate kinase,
enolase, pyruvate kinase and LDH [24,25], which leads
to a stimulation of the glycolytic flux. Notwithstanding
the O2 level, metastatic tumor cell lines (breast MDA,
U87 glioblastoma, DU145 prostate, renal RCC4 and
CaSKi) show high levels of HIF-1a, over-expression of
glycolytic enzymes and high glycolysis, whereas non-
metastatic tumor cells (breast MCF-7, HT-29 colon,
MiaPaCa pancreatic, A549 lung, BX-PC3 prostate)
increase HIF-1a, enzyme over-expression and glycoly-
sis only under hypoxia [23].
HIF-1a also favors the glycolytic flux by increasing
the expression of pyruvate dehydrogenase complex
(PDH) kinase 1, which inhibits, by phosphorylation,
the PDH complex activity, thus decreasing Pyr oxida-
tion in the Krebs cycle and increasing the generation
of lactate from Pyr [26]. Further association of HIF-1awith the expression of other mitochondrial proteins
has yet to be found.
Table 1. Mechanisms explaining the accelerated glycolytic rate in fast-growing tumor cells. GLUT, glucose transporter; HK, hexokinase; PFK-
1, phosphofructokinase type 1; PFK-2, phosphofructokinase type 2.
Tumor cell type
Rodent Human
1. Increase in the isoform expression of the glycolytic enzymes and glucose transporters
GLUT AS-30D, Novikoff, Ehrlich, and Morris 3924A
hepatomas; ependymoblastoma; thyroid and
Lewis lung carcinomas [34]
HepG2 carcinomas; brain tumors (A-172, H4) [34]; breast
cancer (MCF-7 and T47D); leukemias (Jurkat, HL60,
U937,U1); pancreatic, lung, renal (HEK-293), cutaneous,
gastric and esophageal tumors [35]
HK AS-30D hepatoma [11,16]; Morris 7800,5123-D,
7288-C, 3924-A; H19 cells [31]; 3683 and Novikoff
hepatomas [44]
HeLa carcinoma [11], ependymoma, astrocytoma, glioma [45]
PFK-1 AS-30D hepatoma [11,16]; mouse ascites
carcinoma [33]; thyroid carcinoma [51]; Morris
(7800,5123-D,7288-C, 3924-A, 3683);
Ehrlich Lettre [53]
HL-60, KG-1, K-562 myeloid leukemia,MOLT-4 leukemia,
lymphoma [32], HeLa and KB carcinoma [32], glioma [45]
PFK-2 Ehrlich hepatoma [25] HeLa, HepG2 [55,57], Hek-293, Lewis lung carcinoma,
K562 leukemia, MCF-7 breast carcinoma, TD47 cells [15]
All enzymes AS-30D hepatoma [11] HeLa [11] and CaSKi carcinoma, U87 glioblastoma,
DU145 prostate tumor, renal RCC4 tumor [24]
2. Decreased expression of mitochondrial oxidative enzymes and transporters
Ehrlich [59,60], Morris (16, 44, 777, 3924A, 7794A,
7800) [1,61,66,72], Novikoff, Yoshida, Reuber H-35,
and BW7756 hepatomas [1,69,75]; L1210 leukemia;
leukemic B82T tumor; SV40-transformed fibroblast [1]
HeLa carcinoma; mammary tumors (Cf7, C3H) [1];
meningioma; ependymoma; pituitary adenoma [74];
human kidney carcinoma [77]
3. Lowering in the amount of mitochondria per cell
C-57, HC-252 carcinomas [1],
mammary adenocarcinoma [73]
4. Inhibition of oxidative phosphorylation by glycolysis activation (Crabtree effect)
Ehrlich-Lettre [80], AS-30D [64] hepatomas; HeLa [84], HT29 [85]
EL-4 thymoma [83]; sarcoma 180 [81]; tumor
pancreatic islet cells; insulinoma RINm5F [82]
5. Increased amount in the natural inhibitor protein (IF1) of the mitochondrial ATP synthase
Zadjela and Yoshida sarcomas [90],
AS-30D hepatoma [91]
6. Higher sensitivity of mitochondrial DNA to oxidative stress
Breast, colon, stomach, liver, kidney, bladder, head ⁄ neck
and lung tumors; leukemia; lymphoma [93]
Glycolytic and mitochondrial metabolism of tumor cells R. Moreno-Sanchez et al.
1396 FEBS Journal 274 (2007) 1393–1418 ª 2007 The Authors Journal compilation ª 2007 FEBS

The oncogene, c-myc, encodes the transcription
factor, c-Myc, which in transformed cells may also
activate glycolytic genes, such as those for glucose
transporter 1 (GLUT1), hexose-6-phosphate isomerase,
PFK-1, GAPDH, phosphoglycerate kinase, enolase
and LDH, thus increasing glycolysis under aerobiosis
[13,14].
Isoform expression and activity
HK and PFK-1 are among the main controlling steps
of the glycolytic flux in erythrocytes, hepatocytes, and
cardiac and skeletal muscle cells [27–30]. Changes in
the isoform pattern of HK and PFK-1 expression
occur in several tumor cells in comparison to normal
cells (Fig. 1) [1,2,31–33]. As described below, it seems
that such modifications in these and other glycolytic
steps are also part of the mechanisms involved in the
increased glycolytic flux of tumor cells.
Glucose transporter
It is well documented that GLUT levels of mRNA and
protein are higher in tumor cells than in normal,
healthy tissues [34–36]. This increase in the protein lev-
els of GLUT might be part of the mechanisms promo-
ting the increased glycolysis in tumor cells as long as
the GLUT activity also increases and significant con-
trol of the pathway resides in this step (discussed in
more detail in the section entitled ‘Metabolic control
analysis of glycolysis and oxidative phosphorylation in
intact tumor cells’).
There are several isoforms of GLUT expressed in
mammalian cells. The GLUT1 isoform is present in all
tissues; GLUT2 is abundant in liver, pancreas, intes-
tine and kidney; GLUT3 prevails in brain; GLUT4 is
present in skeletal muscle, heart, brain and adipose tis-
sue; GLUT5 is present in small intestine, testis, skeletal
muscle, adipose tissue and kidney; GLUT6 is present
in spleen, leukocytes and brain; GLUT7 is the less-well
known member of the family and the sites of expres-
sion are unknown; GLUT8 is present in testis and
brain; GLUT9 is present in liver and kidney; GLUT10
is present in liver and pancreas; GLUT11 is present in
heart and skeletal muscle; and GLUT12 is present in
heart, small intestine and prostate [34].
In several tumor cells, the predominant over-
expressed isoform is GLUT1 (Table 1) [34,35]. How-
ever, other isoforms, which are not usually found in
the tissue of origin, may also be over-expressed. For
instance, in some human leukemias (U937, HL60 y
U1), GLUT5, which is an isoform not found in nor-
mal leukocytes, is over-expressed [34]. GLUT3 is
detected in lung, ovarian and gastric cancers, but not
in the corresponding normal tissues [35].
In most studies on GLUT expression in tumor cells,
an enhanced mRNA or protein content has certainly
been detected, but unfortunately these results have not
been accompanied by an effort to determine whether
indeed an increased GLUT activity is also achieved,
perhaps because it is not an easy assay. Nevertheless,
some kinetic parameters of GLUT in tumor cells have
been reported [37,38]. However, these last experiments
were not carried out with glucose, but with glucose
analogues (some of which are indeed nonmetabolizable,
although 2-deoxyglucose can be phosphorylated by HK
and dehydrogenated by glucose-6-phosphate dehydrog-
enase) and under noninitial rate conditions (incubation
at 37 �C for long time periods). By taking into account
the last criticisms, our group has improved the assay of
the glucose transport in AS-30D hepatoma and HeLa
cells. Our data indicate that the tumor GLUT activity
is 10–12-fold higher than that found in nontumori-
genic cells [39,40], and that it is also highly sensitive to
cytochalasin B and phloretin, two common GLUT inhi-
bitors (S. Rodrıguez-Enrıquez, F. Flores-Rodrıguez,
A. Marın-Hernandez, L. Ruiz-Azuara & R Moreno-
Sanchez, unpublished results).
Hexokinase
In mammalian cells there are four different isoforms of
HK (HK-I, -II, -III, and -IV, or glucokinase), which
differ in their kinetic properties as well as in their tis-
sue-specific expression and subcellular localization
[41,42]. The predominant isoform in brain, mammary
gland, kidney and retina is HK-I [42]. HK-II predom-
inates in skeletal muscle and adipose cells, although its
activity is relatively low [43]. Because they contain a
specific hydrophobic N-terminal segment, HK-I and
HK-II may be either bound to the outer mitochondrial
membrane or free in the cytosol [43].
In fast-growth tumor cells, HK-II seems to be the
predominant isoform, except for brain tumors in which
HK-I is the over-expressed isoform [16,42,43]. In
hepatomas of Novikoff, H19 and AS-30D, the HK-II
activity is 20–306 times higher than the HK activity in
liver cells [11,16,31,44]; however, in Hela cells the HK
activity was only seven times higher than in hepato-
cytes [11] (Table 1). There is some discrepancy in the
reported HK activity in human brain tumors. Lowry
et al. [4] described that the HK activity in gliomas,
meduloblastomas and schwannomas, obtained from
terminal patients, was 78% lower than the HK activity
in nontumorigenic brain tissue. In contrast, others
have reported that in rat ependymoma, and in human
R. Moreno-Sanchez et al. Glycolytic and mitochondrial metabolism of tumor cells
FEBS Journal 274 (2007) 1393–1418 ª 2007 The Authors Journal compilation ª 2007 FEBS 1397
astrocitoma and gliomas, the HK activity was similar
to or higher than that in control tissue [45]. It is
recalled that for a rigorous comparison of an enzyme
activity from different biological sources, experimental
determination should proceed under Vmax conditions
(i.e. with a saturating substrate concentration at least
10 times higher than the Km value) and in the absence
of products.
The apparent specific site of HK-II binding to the
outer mitochondrial membrane is the voltage-depend-
ent anion channel or porin [46]; such interaction pro-
tects HK-II from proteases and provides direct access
to the newly synthesized ATP by the ATP synthase
(Figs 1 and 2B). It is hypothesized that the pro-apop-
totic protein, Bax, forms (with the voltage-dependent
anion channel) a channel for the release of cytochrome
c under stress conditions [47]. Hence, the enhanced
binding of HK-II found in fast-growth tumor cells,
and in normal brain cells, may have the additional role
of protecting cells from Bax action, thus blocking the
initiation of apoptosis [48,49].
The accumulation of products may decrease the
forward reaction. In this regard, it is well established
that glucose-6-phosphate (G6P) is a potent inhibitor
of HK-I, HK-II and HK-III [42]. In consequence, the
enhanced HK activity in tumor cells might be coun-
terbalanced by product inhibition. HK binding to
mitochondria was proposed as a mechanism to cir-
cumvent the G6P blockade [16,31]. However, when
assayed under near-physiological conditions of pH
(7.0), temperature (37 �C) and concentrations of glu-
cose and G6P (> 1 mm), the mitochondrial HK
exhibited a sensitivity to G6P similar to that of the
cytosolic HK in AS-30D tumor cells [11]. The pres-
ence of this G6P regulatory mechanism of tumor HK
supports an essential role for this enzyme in the con-
trol of tumor glycolysis, despite its elevated over-
expression [11].
PFK-1
There are three types of PFK-1 subunits in mamma-
lian cells. In liver and kidney, the L subunit is the
most abundant; in skeletal muscle the M subunit pre-
dominates; platelets only have C subunits; whereas in
brain, the C, L and M subunits are all present [33,50].
In different malignant human and rat tumor types and
established tumor cell lines (Table 1) subunits C, L, or
both, prevail over the M subunit [32,33,51]. On the
other hand, the expression of both L and M isoforms
increases in human gliomas [52], whereas in human T-
cell leukemias and cervix carcinomas (HeLa, KB) the
C subunit predominates [32].
Each PFK-1 subunit shows different kinetic proper-
ties. For example, the C subunit has a lower sensitivity
to phosphoenolpyruvate, one of the physiological allos-
teric inhibitors of PFK-1, which may contribute to the
increased glycolytic flux [53]. Then, the kinetic and reg-
ulatory properties of the heterotetrameric PFK-1
depends on the type and proportion of the different
subunits [50]. It is known that tumor PFK-1 (rat thy-
roid cells, rat anaplastic medullary thyroid carcinomas
and human gliomas) is less sensitive to inhibition by
ATP and citrate than normal PFK-1 [51,52,54]. Ki val-
ues of PFK-1 for citrate of 0.1 mm (human normal
brain) and 0.75 mm (human glioma) have been deter-
mined [52]. The human glioma, PFK-1, is also more
sensitive to activation by fructose-2,6-bisphosphate
(F2,6BP), with a Ka of 1 lm, with respect to the Ka of
5 lm in the normal brain enzyme [52]. AMP activation
of tumor PFK-1 also appears to be enhanced, but this
has not been evaluated further, probably because
AMP is ineffective at relieving the citrate and ATP
inhibition [11,54].
In several malignant rodent and human cells and
established human tumor cell lines (Table 1), the
PFK-1 activity is one- to 56 times higher than in
nontumorigenic cells [11,16,32]. In contrast, in human
KB, some gliomas, meningiomas, schwannomas (cra-
nial-nerve VIII), meduloblastoma and rat thyroid
tumor cells, the PFK-1 activity is similar to, or even
1.3–2.5 times lower than that in nontumorigenic cells
[4,32,52,54]. As the glycolytic flux is also enhanced in
all above-mentioned human tumor cells, a null
increase in PFK-1 activity (i.e. in content of active
enzyme) suggests negligible control exerted by this
step (6% in AS-30D glycolysis) [11].
PFK-2
In mammalian cells there are several isoforms of PFK-
2, which are encoded by four genes. The expression of
these genes is tissue- and development-dependent
[55,56]. PFK-2 is a bifunctional enzyme with activities
of kinase and phosphatase that modulate the cellular
level of F2,6BP, the most potent activator of PFK-1 in
normal and tumor cells. The Pfkfb3 gene encodes both
ubiquitous PFK-2 (the isoform with the highest kin-
ase ⁄bisphosphatase ratio) and inducible PFK-2 (which
is produced through alternative splicing) [55]. The
over-expression of PFK-2 PB3 (HIF-1a inducible)
brings about an increase of F2,6BP in several tumor
cells (Table 1) [15,25,57]. This mechanism may very
probably contribute to the increased glycolytic flux in
tumor cells, because F2,6BP activation of PFK-1 may
readily overcome the citrate and ATP inhibition [11].
Glycolytic and mitochondrial metabolism of tumor cells R. Moreno-Sanchez et al.
1398 FEBS Journal 274 (2007) 1393–1418 ª 2007 The Authors Journal compilation ª 2007 FEBS

Mitochondrial oxidative metabolism
in tumor cells
Warburg [58] originally proposed that the driving force
of the enhanced glycolysis in tumor cells was the
energy deficiency caused by an irreversible damage of
the mitochondrial function. There indeed seems to be
a diminished oxidative metabolism in many tumor cell
types [1]. Several explanations have been advocated
(Fig. 2), although, in some, not-so-solid arguments or
plainly flawed assumptions have been considered.
These are discussed below.
A lower Pyr oxidation, owing to inhibition of
the PDH complex by acetoin [59,60] and a diminished
Pyr transporter activity [60,61]
It has been described, for AS-30D and Ehrlich hepato-
mas, that a significant fraction of mitochondrial Pyr is
decarboxylated to an active acetaldehyde through a
‘nonoxidative’ reaction (assuming that tumor mito-
chondria operate in a low-oxygen environment)
catalyzed by the E1-PDH, via bound b-hydroxyethyl-thiamine pyrophosphate [59]. The active acetaldehyde
formed is condensed with a second acetaldehyde to
generate acetoin, which competitively inhibits PDH
(Ki ¼ 41 lm) [59]. Tumor cells may maintain high lev-
els of acetaldehyde as a result of the presence of an
atypical aldehyde dehydrogenase isoform (IV) with
low affinity for this substrate [62]. Tumor PDH is acti-
vated by 0.5–1 mm AMP, which does not occur in nor-
mal PDH [63]. The intracellular AMP concentration is
0.6–3.3 mm in AS-30D cells [11,64], but no data on the
intramitochondrial AMP level are available. However,
an enhanced Pyr decarboxylation by an AMP-activa-
ted PDH may lead to an increased acetoin formation,
which would affect the enzyme in a product-inhibition
manner and would establish a fine regulatory mechan-
ism of tumor PDH (Fig. 2B).
Indeed, acetoin inhibits the CO2 generation in Pyr-
stimulated mitochondria [59]. However, it remains to
be demonstrated whether PDH inhibition, by acetoin,
affects oxidative phosphorylation in tumor cells, as
glutamine oxidation, which is highly active in tumor
cells, may not be sensitive to acetoin inhibition [59].
On the other hand, in mitochondria isolated from
Morris 44 and 3924A hepatomas, the Pyr transporter
is slightly slower (Vmax ¼ 5–12 nmolÆmin)1Æmg of pro-
tein)1) and has a lower Pyr affinity (Km ¼ 0.74–
1.1 mm) than that of liver mitochondria (Vmax ¼20 nmolÆmin)1Æmg of protein)1 and Km ¼ 0.64 mm)
[61]. In Ehrlich hepatoma, the Pyr uptake is similar to
that found in liver slices and isolated mitochondria
[65]. Such a small difference in transporter activity
casts doubt on the role of this site in decreasing oxida-
tive phosphorylation in tumor cells (Fig. 2B).
Truncated Krebs cycle and lower reducing
equivalents transfer
Parlo & Coleman [66] proposed that the high glycolyt-
ic activity in some tumor cells is caused by mitochond-
rial dysfunction at the level of the Krebs cycle, which
leads to a lower availability of reducing equivalents for
the respiratory chain and hence a lower oxidative
phosphorylation. The same authors detected that in
Morris 3924A hepatoma, Pyr-derived citrate was pref-
erentially expelled from tumor mitochondria (four
times faster than in liver mitochondria) owing to a
defect in the transformation of citrate into 2-oxogluta-
rate (i.e. failure in both aconitase and isocitrate
dehydrogenase activities), which induces citrate accu-
mulation in the mitochondrial matrix and hence citrate
efflux (Fig. 2B). In the cytosol, citrate stimulates
the synthesis of cholesterol, triacylglycerides and
phospholipids (Fig. 2B), but does not inhibit glycolysis
because tumor cells over-express the citrate-insensitive
PFK-1 isoform (Fig. 1) [6,51,52,54] (see the section
entitled ‘Glycolytic enzymes and transporters in tumor
cells’).
However, other authors [67,68] challenged the trun-
cated Krebs cycle hypothesis. These authors deter-
mined the rates of Pyr, malate, citrate, acetoacetate
and acetate decarboxylation in AS-30D cells and mito-
chondria, and found that they were similar to those of
nontumorigenic cells and mitochondria, thus indicating
that the citrate flux through the Krebs cycle is not
truncated, at least in AS-30D hepatoma (Fig. 3). In
fact, the activities of all Krebs cycle enzymes are 1–30
times higher in AS-30D mitochondria than in normal
liver mitochondria [67] (Fig. 3).
Likewise, the activities of the aspartate ⁄malate and
a-glycerophosphate shuttles seem to be diminished in
some tumor cell types (Table 1), which would impede
the efficient transfer of reducing equivalents to mito-
chondria from the cytosol [1,69]; in consequence, the
higher availability of cytosolic NADH may accelerate
the LDH activity. However, the rate of reducing equiv-
alent transfer from the cytosol to the mitochondrial
matrix in Ehrlich hepatoma was similar to that
observed in hepatocytes (rate of transfer ¼ 2.78 and
2.61 lmolÆmin)1Æg of wet weight)1, respectively) [70].
Therefore, the results regarding a deficiency in trans-
fer equivalents from cytosol to mitochondria, as well
as those on acetoin inhibition and the truncated Krebs
cycle, are not sufficiently strong to establish a lower
R. Moreno-Sanchez et al. Glycolytic and mitochondrial metabolism of tumor cells
FEBS Journal 274 (2007) 1393–1418 ª 2007 The Authors Journal compilation ª 2007 FEBS 1399

mitochondrial function in tumor cells. Furthermore,
significant and rather high differences should be found
in the mechanism proposed for decreasing oxidative
phosphorylation in several tumor cell lines, not only in
a selected one or two tumor cell lines. Again, owing to
the genetic heterogeneity among the different tumor
cell types, it should not be expected to find a similar
degree of modification in the mechanism proposed, but
at least it should be observed to be occurring in several
tumor cell lines.
Lower content of mitochondria per cell and
defective respiratory chain
In 1978, Pedersen [1] proposed that the respiratory
activity of isolated tumor mitochondria was as efficient
as that of normal mitochondria, but that the dimin-
ished oxidative phosphorylation observed in tumor
cells was the result of a lower content of mitochondria
(20–50% lower mitochondrial content) (Fig. 2;
Table 1). This conclusion extended the original 1956
argument by Warburg [58], that the high glycolytic
rate in tumor cells was the result of a damaged
respiratory chain (Fig. 2B). A lower number of
mitochondria per cell implies that in tumor cells there
are more active degradation mechanisms of mitochon-
dria (i.e. mitophagy [71]) and ⁄or a diminished rate of
organelle proliferation, which has yet to be explored.
However, the mitochondrial content of Morris 16 and
7800 hepatomas was similar to that of liver cells
(reviewed in [1]).
Marked deficiencies have been identified in some res-
piratory chain components (iron sulfur centers, NADH
cytochrome c reductase, succinate dehydrogenase and
cytochrome c oxidase) of mitochondria from several
tumors (Table 1) [72–74]. However, an increase (two-
to five-fold) in the activity of NADH cytochrome c
reductase has also been determined in the same brain
tumors [74]. In mitochondria isolated from some
hepatomas (Table 1), the adenine nucleotide translo-
case (ANT) activity was lower (5.4-fold) than in nor-
mal liver mitochondria [75]. In contrast, an increment
in the ANT1 and ANT2 mRNA levels (eight-fold) in
SV40-transformed cells has been detected [76]; how-
ever, the ANT kinetic parameters in the transformed
fibroblasts were not elucidated. In mitochondria (syn-
thetic activity) and submitochondrial particles (hydro-
lytic activity) from human hepatocellular carcinoma
B
4
31
2 5
A
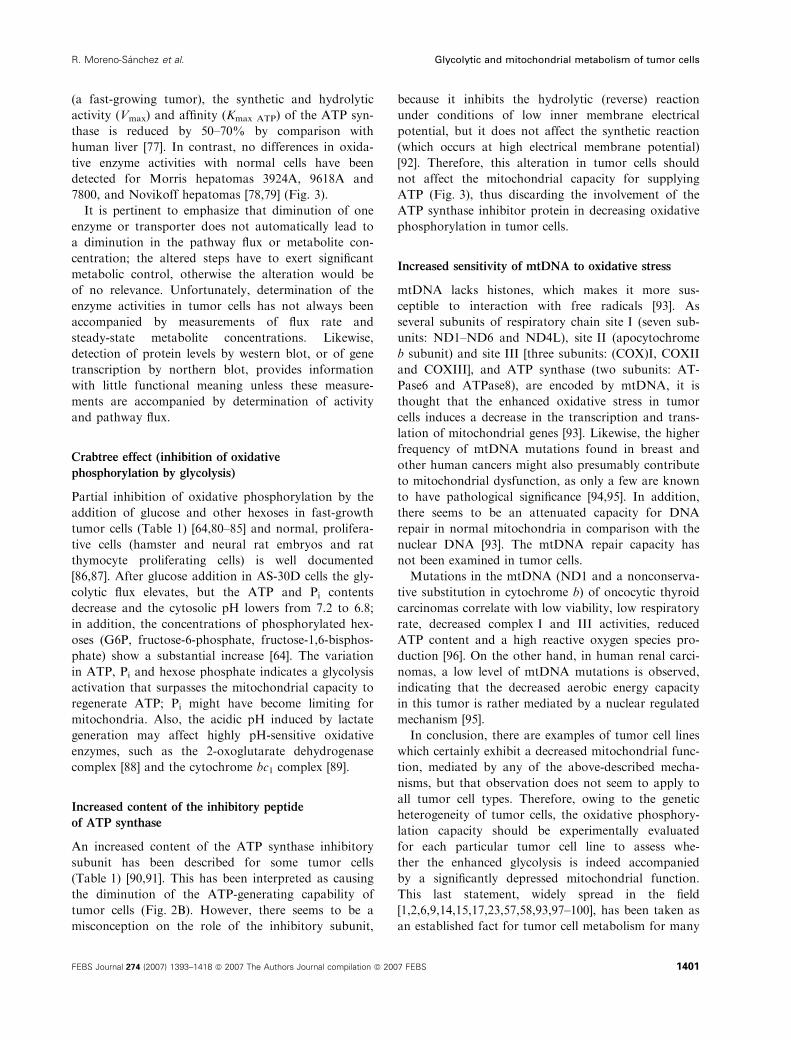
Fig. 3. Tumor mitochondria may have a normal or even an over-expressed enzyme set and have a highly active oxidative phosphorylation.
(A) Changes in the lipid composition of the inner mitochondrial membrane brings about a lower passive H+ permeability and a higher H+ gra-
dient across the inner mitochondrial membrane; (B) (1) a complete and fully functional Krebs cycle; (2) malate is transformed to pyruvate
(Pyr) by an increased NADP+-dependent intramitochondrial malic enzyme; (3) glutamine is actively taken up by a specific and over-expressed
glutamine transporter (an enhanced phosphate-dependent glutaminase transforms glutamine into glutamate, which enters the Krebs cycle
as 2-oxoglutarate); (4) acetoacetate and b-hydroxibutyrate are actively oxidized to acetyl CoA by means of an increased succinyl-CoA aceto-
acetyl transferase; and (5) a fraction of mitochondrial ATP is exported to the cytosol to be used for cellular work. Tumor cells may have a
normal number of mitochondria which, in turn, may have a normal number of respiratory chain copies.
Glycolytic and mitochondrial metabolism of tumor cells R. Moreno-Sanchez et al.
1400 FEBS Journal 274 (2007) 1393–1418 ª 2007 The Authors Journal compilation ª 2007 FEBS
(a fast-growing tumor), the synthetic and hydrolytic
activity (Vmax) and affinity (Kmax ATP) of the ATP syn-
thase is reduced by 50–70% by comparison with
human liver [77]. In contrast, no differences in oxida-
tive enzyme activities with normal cells have been
detected for Morris hepatomas 3924A, 9618A and
7800, and Novikoff hepatomas [78,79] (Fig. 3).
It is pertinent to emphasize that diminution of one
enzyme or transporter does not automatically lead to
a diminution in the pathway flux or metabolite con-
centration; the altered steps have to exert significant
metabolic control, otherwise the alteration would be
of no relevance. Unfortunately, determination of the
enzyme activities in tumor cells has not always been
accompanied by measurements of flux rate and
steady-state metabolite concentrations. Likewise,
detection of protein levels by western blot, or of gene
transcription by northern blot, provides information
with little functional meaning unless these measure-
ments are accompanied by determination of activity
and pathway flux.
Crabtree effect (inhibition of oxidative
phosphorylation by glycolysis)
Partial inhibition of oxidative phosphorylation by the
addition of glucose and other hexoses in fast-growth
tumor cells (Table 1) [64,80–85] and normal, prolifera-
tive cells (hamster and neural rat embryos and rat
thymocyte proliferating cells) is well documented
[86,87]. After glucose addition in AS-30D cells the gly-
colytic flux elevates, but the ATP and Pi contents
decrease and the cytosolic pH lowers from 7.2 to 6.8;
in addition, the concentrations of phosphorylated hex-
oses (G6P, fructose-6-phosphate, fructose-1,6-bisphos-
phate) show a substantial increase [64]. The variation
in ATP, Pi and hexose phosphate indicates a glycolysis
activation that surpasses the mitochondrial capacity to
regenerate ATP; Pi might have become limiting for
mitochondria. Also, the acidic pH induced by lactate
generation may affect highly pH-sensitive oxidative
enzymes, such as the 2-oxoglutarate dehydrogenase
complex [88] and the cytochrome bc1 complex [89].
Increased content of the inhibitory peptide
of ATP synthase
An increased content of the ATP synthase inhibitory
subunit has been described for some tumor cells
(Table 1) [90,91]. This has been interpreted as causing
the diminution of the ATP-generating capability of
tumor cells (Fig. 2B). However, there seems to be a
misconception on the role of the inhibitory subunit,
because it inhibits the hydrolytic (reverse) reaction
under conditions of low inner membrane electrical
potential, but it does not affect the synthetic reaction
(which occurs at high electrical membrane potential)
[92]. Therefore, this alteration in tumor cells should
not affect the mitochondrial capacity for supplying
ATP (Fig. 3), thus discarding the involvement of the
ATP synthase inhibitor protein in decreasing oxidative
phosphorylation in tumor cells.
Increased sensitivity of mtDNA to oxidative stress
mtDNA lacks histones, which makes it more sus-
ceptible to interaction with free radicals [93]. As
several subunits of respiratory chain site I (seven sub-
units: ND1–ND6 and ND4L), site II (apocytochrome
b subunit) and site III [three subunits: (COX)I, COXII
and COXIII], and ATP synthase (two subunits: AT-
Pase6 and ATPase8), are encoded by mtDNA, it is
thought that the enhanced oxidative stress in tumor
cells induces a decrease in the transcription and trans-
lation of mitochondrial genes [93]. Likewise, the higher
frequency of mtDNA mutations found in breast and
other human cancers might also presumably contribute
to mitochondrial dysfunction, as only a few are known
to have pathological significance [94,95]. In addition,
there seems to be an attenuated capacity for DNA
repair in normal mitochondria in comparison with the
nuclear DNA [93]. The mtDNA repair capacity has
not been examined in tumor cells.
Mutations in the mtDNA (ND1 and a nonconserva-
tive substitution in cytochrome b) of oncocytic thyroid
carcinomas correlate with low viability, low respiratory
rate, decreased complex I and III activities, reduced
ATP content and a high reactive oxygen species pro-
duction [96]. On the other hand, in human renal carci-
nomas, a low level of mtDNA mutations is observed,
indicating that the decreased aerobic energy capacity
in this tumor is rather mediated by a nuclear regulated
mechanism [95].
In conclusion, there are examples of tumor cell lines
which certainly exhibit a decreased mitochondrial func-
tion, mediated by any of the above-described mecha-
nisms, but that observation does not seem to apply to
all tumor cell types. Therefore, owing to the genetic
heterogeneity of tumor cells, the oxidative phosphory-
lation capacity should be experimentally evaluated
for each particular tumor cell line to assess whe-
ther the enhanced glycolysis is indeed accompanied
by a significantly depressed mitochondrial function.
This last statement, widely spread in the field
[1,2,6,9,14,15,17,23,57,58,93,97–100], has been taken as
an established fact for tumor cell metabolism for many
R. Moreno-Sanchez et al. Glycolytic and mitochondrial metabolism of tumor cells
FEBS Journal 274 (2007) 1393–1418 ª 2007 The Authors Journal compilation ª 2007 FEBS 1401
years, but because of the absence of hard experimental
data, it has rather become the metabolic central dogma
of tumor cells.
Re-evaluation of oxidativephosphorylation in tumor cells
Oxygen concentration
The increased glycolysis and the diminished mitochond-
rial activity found in the pioneering studies with solid and
ascites tumor cells led Warburg in 1956 [58], and other
authors subsequently [1,2,6,9,14,15,17,23,57,60,97–100],
to propose, as a universal mechanism, that all tumor
cell types were energetically dependent mainly or only
on glycolysis. In particular, glycolysis seems to be the
main energy pathway in slow-growing solid tumors
(human melanomas, mammary adenocarcinoma [101],
rat rhabdomyosarcomas [102]) as oxidative phosphory-
lation is apparently limited by the low O2 availability
inside the tumor [103]. In many human solid, hypoxic,
tumors, the concentration of O2 is lower than 20 lm
[104].
It is worth noting that the glycolytic rate is usually
determined by measuring the lactate production in
cells incubated with added glucose, but other nongly-
colytic reactions, catalyzed by alanine transaminase
and malic enzyme, may also contribute to the forma-
tion of l-lactate. To correct for any overestimation of
the glycolytic rate, lactate formation should also be
determined in the absence of added glucose and in the
presence of a glycolytic (GAPDH) inhibitor (i.e. arse-
nite, iodoacetate).
It should also be considered that, in addition to
lower O2 availability in solid tumors, especially in the
initial and avascular developmental stages under which
a poor vascularization occurs, glucose supply can be
similarly affected [105], thus inducing a severe decrease
in the generation of glycolytic ATP. Moreover, in the
center of glioma and carcinoma multicellular spheroids
(a model that simulates the avascular stages of solid
tumors) and in the hypoxic regions of human tumors,
the O2 concentration was determined to be 8–57 lm
[103,106–108], which resembles the range of values
usually found in several normal tissues with normal
blood irrigation (femoral muscle, mammary gland tis-
sue) [109]. The ascites fluid may have a high (50 lm)
[7], or a low (< 7 lm) [110], O2 concentration.
Oxidative phosphorylation may be compromised at
O2 concentration values lower than 1 lm because the
Km O2 of cytochrome c oxidase is 0.1–0.15 lm in sub-
mitochondrial particles and pure enzyme [111], 0.4–
0.8 lm in human umbilical vein endothelial cells [112]
and 0.39 lm in intact skin fibroblasts [113]. In turn, a
saturating O2 concentration for cytochrome c oxidase
and for oxidative phosphorylation would be > 4–8 lm
(i.e. a substrate concentration of 10 times its Km
value). Therefore, tumor mitochondrial metabolism
would not be affected by the hypoxia level found in
tumors, unless prolonged exposure (weeks or months)
to the hypoxic microenvironment somehow alters the
expression of mitochondrial enzymes, perhaps through
a p53-mediated mechanism [98]. Furthermore, the
O2 concentration in the tumor microenvironment could
not always reach such low values, unless an O2 gra-
dient develops so that the O2 concentration surround-
ing mitochondria falls below the critical level of 1 lm.
By assuming, but not experimentally determined,
that oxidative phosphorylation is negligible under hyp-
oxic conditions, the enhanced glycolysis of tumor cells
is usually considered as a sufficiently good reason for
proposing that the ATP supply only or mainly depends
on glycolysis [1,2,6,9,14,15,17,23,57,93,98,99]; in turn,
tumor glycolysis may be either marginally affected
(0–5%) or be further increased by 50–60% under hyp-
oxia [101,114]. However, the quantitive contribution of
each energy pathway to ATP supply has rarely been
determined.
It also remains to be analyzed whether the acceler-
ated glycolysis under hypoxia indeed serves only for
ATP supply or, alternatively, whether its role is the
supply of intermediates for biosynthesis of polysaccha-
rides, and precursors for nucleic acids, lipids and
amino acids. Moreover, the active angiogenesis in solid
tumors suggests a dependence on oxidative metabo-
lism, at least in the regions close to the blood vessels
[103].
Substrate utilization
It is postulated that both glucose and glutamine
(an exclusive mitochondrial-oxidizable substrate) are
the substrates preferentially consumed by fast-growth
tumor cells [1,7,115,116]. However, it is not clearly
established which of these two (or other) oxidizable
substrates supports the accelerated cell proliferation; in
glycolytic tumors an increased oxidation of glutamine
is also observed [6]. Some tumors, such as HeLa cells,
may adapt their metabolism towards the available
external carbon source: in the absence of external glu-
cose, HeLa cells activate the de novo synthesis of
mtDNA, which prompts the synthesis of the respirat-
ory complexes and citrate synthase [99]. For HeLa
cells, the ATP demand is supported by the aerobic oxi-
dation of both glucose and glutamine [116,117], which
indicates that glycolysis and oxidative phosphorylation
Glycolytic and mitochondrial metabolism of tumor cells R. Moreno-Sanchez et al.
1402 FEBS Journal 274 (2007) 1393–1418 ª 2007 The Authors Journal compilation ª 2007 FEBS

are both essential for ATP supply in this human tumor
cell line.
The ascitic medium developed in rodents during AS-
30D hepatoma growth contains high glutamine
(> 4 mm), whereas glucose is scarce (0.026 mm) [7]; a
low glucose concentration (< 0.11 mm) was also des-
cribed for the ascites fluid produced by MM1 hepa-
toma cells in rats [110]. Other oxidizable substrates,
also present in the ascites fluid, are ketone bodies
(0.9 mm acetoacetate, 0.04 mm b-hydroxybutyrate),glutamate (0.15 mm), Pyr (0.16 mm) and lactate
(3.3 mm) [7]. In contrast, the blood plasma, and most
of the commercial culture media for mammalian tumor
and normal cells, contain high glucose (5–25 mm) and
glutamine (4–5 mm) [118]; thus, culture media are used
without having determined the prevalent type of
energy metabolism (glycolytic versus oxidative) in each
tumor cell type (Table 2).
Contribution of glycolysis and oxidative
phosphorylation to ATP supply
It is intriguing that despite the accelerated glycolysis in
many fast-growth tumor cells (Table 2), its total con-
tribution to the cellular ATP supply only reaches 10%
(reviewed in ref. 3). In marked contrast, in other
tumor cell lines also considered of fast growth
(Table 2), glycolysis indeed supports 50–70% of the
ATP demand, a contribution value also estimated by
Warburg [58]. Moreover, the contribution to the ATP
demand from glycolysis and oxidative phosphorylation
for protein and nucleic acids synthesis, and for ion
transport (Na+ ⁄K+, Ca2+), during the proliferative
phase was similar in tumor cells with a deficient oxida-
tive system (Table 2) [119]. The ATP content in Ehrl-
ich hepatoma cells during the cell cycle transition from
G0 to S phase diminishes by 50%, which correlates
with a similar diminution in oxidative phosphoryla-
tion, whereas glycolysis remains constant [120]. This
suggests that when Ehrlich tumor cells undergo a
transition from resting to an active, highly proliferative
state, only mitochondrial ATP supports the enhanced
energy demand.
Some human and rodent gliomas exhibit high or
moderate susceptibility to respiratory inhibitors, indi-
cating the presence of fully functional mitochondria
and dependency on oxidative phosphorylation; further-
more, gliomas with a glycolytic phenotype actively
oxidize Pyr and glutamine under conditions of low
glucose [9].
An active Pyr oxidation, and a complete and func-
tional Krebs cycle, able to supply NADH for oxidative
phosphorylation, operate in AS-30D hepatoma [67]
(Fig. 3). Moreover, other oxidative pathways, such as
those for glutamate and ketone bodies, are also highly
active in these fast-growth tumor cells [7,68]; the succi-
nyl-CoA acetoacetyl transferase enzyme, which initi-
ates oxidation of ketone bodies, is 40-fold more active
in AS-30D cells than in hepatocytes [68] (Fig. 3). On
the contrary, many brain tumors have lower succinyl-
CoA acetoacetyl transferase activity than normal neu-
rons and glia and are unable to metabolize ketone
Table 2. Predominant energy metabolism (glycolysis or oxidative phosphorylation) in different types of tumor cells. Gly, glycolysis; OxPhos,
oxidative phosphorylation.
Tissue
of origin Tumor cell type
Predominant
energy metabolism References
Brain Glioma C6, oligodendroglioma, meningioma,
medulloblastoma
Gly [4,5,190]
Glioblastoma multiforme, astrocytoma C6 Gly and OxPhos [4]
Transformed hamster brain OxPhos [191]
Bone Sarcoma OxPhos [3]
Colon CT-26, LoVo colon adenocarcinoma Gly [192]
Novikoff Gly [3,193]
Liver Ehrlich Lettre, Ehrlich, Walker-256, Morris 3683 and
Dunings LC18 hepatomas; ascites mouse cancer;
sarcoma 27; MCF-7 carcinoma
Gly and OxPhos [3,193]
Reuber H-35, Morris (7793, 7795, 7800, 5123)
and AS-30D hepatomas
OxPhos [3,7,193]
Lung Lung carcinoma OxPhos [123,191]
Mammary gland Breast cancer OxPhos [123]
MCF7 Gly and OxPhos [141]
Skin Melanoma OxPhos [3]
Uterine cervix HeLa, ovarian and uterus carcinomas OxPhos [3,117,123]
R. Moreno-Sanchez et al. Glycolytic and mitochondrial metabolism of tumor cells
FEBS Journal 274 (2007) 1393–1418 ª 2007 The Authors Journal compilation ª 2007 FEBS 1403

bodies. Then, as fatty acids do not pass the blood–
brain barrier, brain tumors seem to depend only on
glucose and glycolysis for ATP supply [100].
As originally claimed by Weinhouse [121], a signifi-
cant number of tumor cell lines exhibit elevated rates
of respiration (recently reviewed in ref. 3); whether this
activity is fully associated with oxidative phosphoryla-
tion remains to be determined. For instance, in
AS-30D and HeLa cells, the rate of respiration was
85–90% sensitive to oligomycin, a specific ATP syn-
thase inhibitor, indicating that the remaining 10–15%
of the cellular O2 consumption was not associated with
oxidative phosphorylation. Tumor cell lines with high
rates of respiration are Ehrlich Letree hyperdipliod
chain [80], human colon cancer HT29 [85], Lewis lung
carcinoma [122], human breast MCF-7 carcinoma,
HeLa cells [117], in vivo human tumor xenographs
[123], mouse fibrosarcoma 1929 [124] and Neu mam-
mary epithelial mice tumor and LDH-A-deficient
clones [125], although unfortunately, in these studies,
oligomycin sensitivity was not evaluated.
Other observations supporting the existence of
highly active mitochondria in some tumors are the
presence of mitochondrial proteins (NADP+-malic
enzyme, glutaminase and glutamine transporter) with
high activities and affinities toward their substrates.
Mitochondrial tumor malic enzyme is 10–20 times
more active in tumor cells than in its original tissue
counterpart [126] (Fig. 3). The role of malic enzyme in
tumor cells has not yet been defined, although the
enzyme might remove excess malate to generate Pyr
for oxidative phosphorylation [127]. Glutamine oxida-
tion is another pathway that functions at high rates
during the logarithmic and stationary growth phases
of AS-30D hepatoma and HeLa cells [117]. Cytosolic
glutamine is transported faster (4–10 times) into tumor
mitochondria and further oxidized to glutamate by a
Pi-dependent glutaminase with also higher activity (10–
20 times versus liver mitochondria) [128,129] (Fig. 3).
The glycolytic pathway has other functions, in addi-
tion to providing cytosolic ATP and NADH. In
human and other mammalian normal cells, glycolysis
also contributes to the generation of metabolites for
anabolic pathways (G6P for glycogen and ribose-5-
phosphate synthesis; dihydroxyacetone phosphate
(DHAP) for triacylglyceride and phospholipid synthe-
sis; 3 phosphoglycerate for serine, cysteine, and glycine
synthesis; and Pyr for oxidative phosphorylation, and
for alanine and malate synthesis) and the maintenance
of the pyridine nucleotide redox state in the cytosol
(Fig. 1). These other functions in normal cells may
change in tumor cells, but unfortunately they have not
been studied in detail.
The contribution of oxidative phosphorylation has
been mostly determined in the presence of glucose,
which favors the Crabtree effect. High glucose may or
may not be present in the tumor microenvironment.
The availability of glucose versus glutamine (and other
mitochondrial substrates such as ketone bodies, glu-
tamate and proline, and the Krebs cycle intermediaries
2-oxoglutarate and malate) for different tumor cells
has not been examined, and neither has the magnitude
of the Crabtree effect.
Therefore, the generalized statement that glycolysis
predominates over oxidative phosphorylation for ATP
supply in tumor cells should be re-evaluated and
experimentally determined for each particular type of
tumor cells. An energy deficiency caused by a deterior-
ated oxidative phosphorylation might indeed be the
driving force behind the enhanced glycolysis in hypoxic
tumors, in a process mediated by HIF-1a. However, in
nonhypoxic oxidative tumors, oxidative phosphoryla-
tion-independent mechanisms do clearly operate to
enhance glycolysis, under which HIF-1a may also be
involved. Thus, the main thermodynamic reason for
increasing glycolysis in tumor cells (associated with
either a damaged or an unaltered oxidative phosphory-
lation) might rather be an energy deficiency induced by
highly ATP-demanding processes, such as an acceler-
ated cellular proliferation and ⁄or a stimulated nucleic
acid, protein and cholesterol synthesis.
Metabolic control analysis of glycolysis and
oxidative phosphorylation in intact tumor cells
The main controlling steps of the glycolytic flux in
mammalian, normal cells (erythrocytes, skeletal and
cardiac muscle, hepatocytes) are GLUT, HK and
PFK-1, with the other steps having a minor contribu-
tion [27–30]. As previously discussed, in fast-growth
tumor cells these three proteins are several-fold over-
expressed and therefore their activities are enhanced
(see the section entitled ‘Glycolytic enzymes and trans-
porters in tumor cells’); the rest of the glycolytic
enzymes are also over-expressed in tumor cells,
although to a lesser extent (Fig. 1). Thus, it seems dif-
ficult to extrapolate the elucidated control mechanisms
of glycolysis in normal cells towards tumor cells. To
solve this problem, the flux control distribution, and
the regulatory mechanisms involved, should be expli-
citly determined in tumor cells.
Metabolic control analysis establishes how to deter-
mine, quantitatively, the degree of control that each
pathway enzyme (Ei) exerts on flux (J) and metabolite
(M) concentration (termed flux control coefficient CJEi
and metabolite concentration control coefficient CMEi)
Glycolytic and mitochondrial metabolism of tumor cells R. Moreno-Sanchez et al.
1404 FEBS Journal 274 (2007) 1393–1418 ª 2007 The Authors Journal compilation ª 2007 FEBS
[130]. For oxidative phosphorylation, CJEi values can be
determined by titrating flux with specific, classical
inhibitors (rotenone, antimycin, cyanide, carboxyatrac-
tyloside, oligomycin) [131,132]. However, there are no
specific, permeable inhibitors for each glycolytic step.
An alternative approach, called elasticity analysis [130],
consists of the experimental determination of the sensi-
tivity [or elasticity coefficient (eEiM)] of enzyme blocks
towards a common intermediate, M. Variations in the
steady-state activity of enzyme blocks can be attained
by adding different concentrations of the initial sub-
strate or inhibitors of either block, which do not have
to be specific for one step but they do have to inhibit
only one block. The block of enzymes that generates
the common intermediate M is named the producer
block (E1), whereas the block consuming that
intermediate is named the consumer block (E2). By
applying the summation (SCEi ¼ 1) and connectivity
(CJE1 ⁄CJ
E2 ¼ –eE2M ⁄ eE1M ) theorems of metabolic control
analysis, the CJEi values can then be calculated [130].
There are few reports where metabolic control ana-
lysis of the tumor energy metabolism has been carried
out. The elasticity analysis of glycolysis in AS-30D
tumor cells revealed that the main flux control (71%)
resided in the upstream part of the pathway (i.e.
GLUT and HK) [11]. The rest of the control (29%)
was localized in the ALD-LDH segment, with a negli-
gible contribution by PFK-1 (< 6%). It was shown
that, despite the extensive over-expression, tumor HK
was strongly inhibited by its product G6P. On the
other hand, PFK-1 was moderately over-expressed,
but the tumor isoform was highly activated by
F2,6BP, which surpassed the citrate and ATP inhibi-
tion. These findings provided a mechanistic explana-
tion for the respective high and low flux control
exerted by HK and PFK-1 (see Fig. 1). This study also
showed that a massive over-expression of glycolytic
enzymes does not lead to uncontrolled flux, but rather
strict regulatory mechanisms are preserved by tumor
cells.
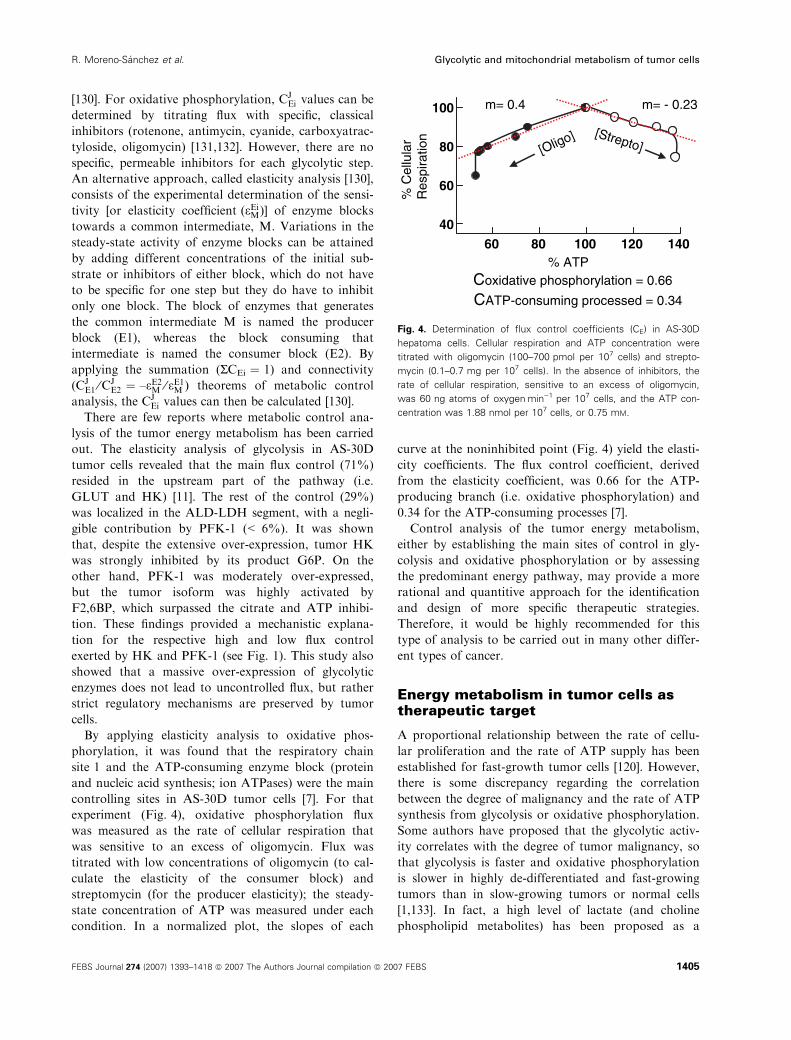
By applying elasticity analysis to oxidative phos-
phorylation, it was found that the respiratory chain
site 1 and the ATP-consuming enzyme block (protein
and nucleic acid synthesis; ion ATPases) were the main
controlling sites in AS-30D tumor cells [7]. For that
experiment (Fig. 4), oxidative phosphorylation flux
was measured as the rate of cellular respiration that
was sensitive to an excess of oligomycin. Flux was
titrated with low concentrations of oligomycin (to cal-
culate the elasticity of the consumer block) and
streptomycin (for the producer elasticity); the steady-
state concentration of ATP was measured under each
condition. In a normalized plot, the slopes of each
curve at the noninhibited point (Fig. 4) yield the elasti-
city coefficients. The flux control coefficient, derived
from the elasticity coefficient, was 0.66 for the ATP-
producing branch (i.e. oxidative phosphorylation) and
0.34 for the ATP-consuming processes [7].
Control analysis of the tumor energy metabolism,
either by establishing the main sites of control in gly-
colysis and oxidative phosphorylation or by assessing
the predominant energy pathway, may provide a more
rational and quantitive approach for the identification
and design of more specific therapeutic strategies.
Therefore, it would be highly recommended for this
type of analysis to be carried out in many other differ-
ent types of cancer.
Energy metabolism in tumor cells astherapeutic target
A proportional relationship between the rate of cellu-
lar proliferation and the rate of ATP supply has been
established for fast-growth tumor cells [120]. However,
there is some discrepancy regarding the correlation
between the degree of malignancy and the rate of ATP
synthesis from glycolysis or oxidative phosphorylation.
Some authors have proposed that the glycolytic activ-
ity correlates with the degree of tumor malignancy, so
that glycolysis is faster and oxidative phosphorylation
is slower in highly de-differentiated and fast-growing
tumors than in slow-growing tumors or normal cells
[1,133]. In fact, a high level of lactate (and choline
phospholipid metabolites) has been proposed as a
60 80 100 120 14040
60
80
100
% C
ellu
lar
Res
pira
tion
% ATP
m= 0.4 m= - 0.23
[Oligo] [Strepto]
Coxidative phosphorylation = 0.66
CATP-consuming processed = 0.34
Fig. 4. Determination of flux control coefficients (CE) in AS-30D
hepatoma cells. Cellular respiration and ATP concentration were
titrated with oligomycin (100–700 pmol per 107 cells) and strepto-
mycin (0.1–0.7 mg per 107 cells). In the absence of inhibitors, the
rate of cellular respiration, sensitive to an excess of oligomycin,
was 60 ng atoms of oxygenÆmin)1 per 107 cells, and the ATP con-
centration was 1.88 nmol per 107 cells, or 0.75 mM.
R. Moreno-Sanchez et al. Glycolytic and mitochondrial metabolism of tumor cells
FEBS Journal 274 (2007) 1393–1418 ª 2007 The Authors Journal compilation ª 2007 FEBS 1405

predictor of malignancy [134]. There is a direct correla-
tion between tumor progression and the HK [11,43]
and PFK-1 [11,53,54] activities, which are increased
several-fold in fast-growth tumor cells (see above in
the section entitled ‘Glycolytic enzymes and transport-
ers in tumor cells’). Accordingly, it has been postulated
that tumor cells which exhibit deficiencies in their oxi-
dative capacity are more malignant than those that
have an active oxidative phosphorylation [135].
Muller et al. [119] originally proposed that a bio-
chemical strategy to suppress the accelerated tumor
proliferation efficiently was the simultaneous blockade
of both ATP-generating pathways. It appears difficult
to target the energy metabolism of tumors as the host
cells also depend on the same essential pathways for
ATP supply. However, by identifying the most signifi-
cant differences in the energy metabolism between
tumor cells and healthy host cells, it might be possible
to achieve some suitable potential antineoplastic
targets.
Such an unorthodox approach has already been
applied to some tumor cells (Table 3). For example, in
Table 3. Compounds assayed as antineoplastic drugs targeting energy metabolism in fast-growing tumor cells. 2-DOG, 2-deoxyglucose;
3-MPA, 3-mercaptopicolinic acid; ANT, adenine nucleotide translocase; GAPDH, glyceraldehyde-3-phosphate dehydrogenase; HK, hexo-
kinase; HPI, hexose-6-phosphate isomerase; LDH, lactate dehydrogenase; OxPhos, oxidative phosphorylation; PEPCK, phosphoenolpyruvate
carboxykinase; 2-OGDH, 2-oxoglutrate dehydrogenase.
Metabolic drug Tumor cell type
Drug
concentration
Effects
Growth (% of
growth diminution
or size reduction Energy pathway
Casiopeina II-gly AS-30D hepatoma 10 lM > 95% 2-OGDH inhibitor Succinate
HeLa cells [117] 1 lM DH inhibitor
3-bromopyruvate Rabbit VX2 tumor [147,148] 500 lM 80% HK-II inhibitor
Krebs cycle enzymes inhibitor
3-bromopyruvate Human HL-60 leukemia; human
lymphoma Raji,
C6F leukemia; Raji ⁄ C8,
HL-60 ⁄ AR [97]
50–100 lM 90% HK-II inhibitor
Krebs cycle enzymes inhibitor
2-DOG Breast MCF-7 [140] 3.5 mMa 50% HK-II inhibitor
HPI inhibitor
Clofazimine Chemoresistant bronchial carcinoma
WIL [144]
10 lM 40–50% Mitochondrial uncoupler
F16 Mammary tumor and human
breast cancer [145]
3 lM > 90% H+-ATPase inhibitor ANT inhibitorb
Lonidamide Glioblastoma multiforme [152] 200 lM 50% OxPhos uncoupler
Mitochondria-bound HK
MKT-077 Breast MCF-7 carcinoma CRL1420 0.5–2.3 lM > 90% Mitochondrial uncoupler
Carcinoma CX-1
Melanoma LOX [146]
Damage to mitochondrial DNA
Rhodamine 6G + Rat implanted Walker-256
carcinosarcoma [137]
0.8–4 mg kg)1 50% OxPhos uncoupler and ATP ⁄ ADP
translocase inhibitor
3-MPA 40 mg kg)1 Host hypoglycemia PEPCK inhibitor
Rhodamine 123 + Human MCF-7 breast, human
cervical carcinoma KB-3–1 [140]
3.4–3.8 lM 50–60% OxPhos uncoupler
Gossypol 0.8–4.3 lM GAPDH and LDH inhibitor
Rhodamine 123 + Human MCF-7 breast [142] 1.3 lM OxPhos uncoupler
100%
2-DOG 300 lM HK-II inhibitor
HPI inhibitor
Rhodamine 123 + Human osteosarcoma [141] 5 lM
65–80%
2-DOG 500 lM
Rhodamine 123 + Mice-implanted Ehrlich hepatoma 15 mg kg)1
MB49 carcinoma [143] 80% (mice survival)
2-DOG 0.5 g kg)1
a In the presence of 4 mM glucose. b Assayed only in liver mitochondria.
Glycolytic and mitochondrial metabolism of tumor cells R. Moreno-Sanchez et al.
1406 FEBS Journal 274 (2007) 1393–1418 ª 2007 The Authors Journal compilation ª 2007 FEBS

Walker-256 tumor-bearing rats, 3-mercaptopicolinate
(a phosphoenolpyruvate carboxykinase inhibitor) was
added to block gluconeogenesis in the host by inducing
severe hypoglycemia and hence a diminution in tumor
glycolysis, together with the hydrophobic cation, rhod-
amine 6G (Table 3), which acts as an uncoupler (H+
ionophore) and an ANT inhibitor [136,137], to block
oxidative phosphorylation. When added simultaneously,
tumor growth decreased by 50%, whereas separately,
the drugs did not affect growth [137].
Gossypol is another drug used to block glycolysis in
diverse fast-growth tumor cells (Table 3). This drug
inhibits NAD+-dependent enzymes (GAPDH, LDH)
[138,139]. The simultaneous inhibition of glycolysis
with gossypol and oxidative phosphorylation with
rhodamine 123 (Table 3) decreased tumor cell prolifer-
ation by 60% [140].
Similarly, treatment of several human and rodent
tumors with 2-deoxyglucose and rhodamine 123 induced
almost full blockade of growth (> 90%) [141–143].
Clofazimine (Table 3), an antileprotic agent, induced a
40% size reduction in WIL, a human bronchial carcino-
sarcoma that is resistant to regular chemotherapy, by
acting as a mitochondrial uncoupler [144]; clofazimine,
in combination with a glycolytic drug, was, however,
not assayed. Other lipophilic cationic drugs, such as
MKT-077 and F16 [145,146] (Table 3), have proved to
be effective against several human and mouse tumors
(> 90% growth inhibition by 0.5 lm MKT-077 after
24 h or 3 lm F16 after 7 days). F16 was ineffective
against mouse breast c-myc-initiated and fibrosarcoma
ras-initiated tumor cells [145]. Also, F16 inhibited the
respiratory rate (IC50 ¼ 25 lm) and H+-ATPase activ-
ity (IC50 ¼ 6 lm) of rat liver mitochondria [145].
Geschwind et al. [147,148] carried out an exhaustive
screening of a multitude of drugs, searching for more
specific and potent inhibitors of both glycolysis and
oxidative phosphorylation. It was found that 3-bromo-
pyruvate (Table 3), an alkylating agent, was a potent
inhibitor of both energy pathways and able to elimin-
ate, almost completely, tumors implanted in rabbits.
The specific sites of action were not elucidated,
although the authors have claimed that 3-bromopyru-
vate inhibits bound HK-II and the Krebs cycle [148].
These authors histologically analyzed the host tissues,
finding no apparent damage; however, the occurrence
of subcellular morphological damage cannot be discar-
ded. Tumor cell lines with high respiratory activity
(human HL-60 leukemia; human lymphoma Raji),
that are mitochondria-deficient (q–) (C6F leukemia;
Raji ⁄C8) or that express a multidrug-resistant pheno-
type (HL-60 ⁄AR), were killed effectively with 3-bromo-
pyruvate under normoxia or anoxia, although at
somewhat disappointingly high doses (50–100 lm for
24 h) [97] (Table 3).
In the search for drugs that are more specific for
tumor cells than for normal cells, some authors have
used the typical mitochondrial inhibitors, such as rote-
none and oligomycin, for blocking tumor cell prolifer-
ation. For instance, oligomycin at low doses (0.06–
0.7 lm), which do not affect normal cells, stopped the
cell cycle progression from G1 to S phase in human
promyelocytic leukemia cells (HL-60) and in Jurkat T
cells owing to a severe diminution of mitochondrial
ATP production [149]. At 3–6 lm oligomycin, over
50% of HL-60 cells arrested in the G2-M phase; how-
ever, this drug concentration may also affect normal
cells. The respiratory chain site 1 inhibitor, rotenone
(0.1–1 lm), arrests the cell cycle at G2 ⁄M, promoting
a strong inhibition (50–90%) of cell proliferation in
human lymphoma WP and 134 B osteosarcoma [150].
Such an effect is related to a severe diminution of the
H+ electrochemical gradient across the inner mitoch-
ondrial membrane and hence to inhibition of oxidative
phosphorylation, but also to an increase in the mem-
brane fluidity and to the activation of apoptosis [151].
Certainly, rotenone does inhibit the respiratory chain
site 1 in normal cells, but this drug might still be
advantageously used whether site 1 exerts a signifi-
cantly higher flux control of oxidative phosphorylation
in tumor cells (see the section entitled ‘Metabolic con-
trol analysis of glycolysis and oxidative phosphoryla-
tion in intact tumor cells’).
Other glycolytic drugs, such as lonidamide, also
diminish the growth of human breast cancer cells
[152], but severe side-effects are observed in the host
[153]. Tyrosine kinase inhibitors, such as imatinib and
genistein, are used in the therapy against hematological
malignancies as a result of their effect on tumor energy
metabolism [154,155]. In BCR leukemia cells, imatinib
decreases glucose uptake and glycolysis by 65–77%
and increases the activity of several mitochondrial
Krebs cycle enzymes by 40–70% (i.e. imatinib induces
a switch in the energy metabolism of leukemia cells).
Thus, despite a drastic inhibition of glycolysis by
imatinib, the cellular ATP content increases because of
oxidative phosphorylation activation [154]; therefore,
imatinib seems not to be adequate for targeting tumor
energy metabolism.
It is known that several human tumors (colon and
esophagus squamous cell carcinomas; skin cancer)
over-express cyclooxygenase (COX-2), which seems
essential for inhibiting apoptosis and stimulating angi-
ogenesis and invasiveness [156]. COX-2 synthesizes (a)
prostaglandin E2, which stimulates bcl-2 and inhibits
apoptosis, and (b) interleukin-6, which enhances
R. Moreno-Sanchez et al. Glycolytic and mitochondrial metabolism of tumor cells
FEBS Journal 274 (2007) 1393–1418 ª 2007 The Authors Journal compilation ª 2007 FEBS 1407

haptoglobin synthesis. Prostaglandin E2 is associated
with tumor metastases, interleukin-6 is associated with
cancer cell invasion, and haptoglobin is associated with
implantation and angiogenesis [156].
Aspirin, a nonsteroidal anti-inflammatory drug
(NSAID) that inhibits COX activity, may either reduce
or delay the appearance of colorectal adenoma, or
decrease the progression of colorectal cancer, because
a lower incidence of colorectal cancer among regular
aspirin users was originally reported by Kune et al.
[157]. Other NSAIDs, such as indomethacin, may also
reduce cancer progression and prolong the survival of
patients with established metastatic solid tumors [158].
However, the ability of NSAIDs to attenuate tumor
growth does not correlate with the tumor content of
COX-2, the NSAIDs target protein, or even of COX-1
[159]. Interestingly, several NSAIDs, such as nimesu-
lide, meloxicam, nabumetone, diclofenac and naprox-
en, potently inhibit oxidative phosphorylation in intact
cells and isolated mitochondria from AS-30D hepa-
toma [160]. Therefore, tumor mitochondrial function
might be directly targeted by some NSAIDs.
Once established that the energy metabolism in rodent
AS-30D hepatoma and human HeLa cells was mainly of
the oxidative type, drugs that presumably are specific
for mitochondria, such as rhodamines and casiopeinas,
were utilized to test the hypothesis that oxidative phos-
phorylation is the principal ATP supplier in these tumor
cells [117]. Interestingly, the lipophilic cationic drugs,
rhodamines 6G and 123, and casiopeina-IIgly, at low
micromolar concentrations drastically abolished oxi-
dative phosphorylation and cell proliferation, whereas
glycolytic drugs, such as gossypol, arsenite and iodoace-
tate, were ineffective in these tumor cells [117].
We have recently determined that the growth of HeLa
cells in multicellular spheroids involves changes in their
energy metabolism in comparison to their counterpart
in monolayer (bidimensional) culture. In the initial for-
mation of spheroid, mitochondria support over 80% of
the cellular ATP supply. However, at later spheroid
stages, mitochondrial metabolism fails and glycolysis
becomes predominant (S. Rodrıguez-Enrıquez, J.C.
Gallardo-Perez, A. Aviles-Salas, V. Maldonado-Lagu-
nas & R. Moreno-Sanchez, unpublished results). Casi-
opeina II-gly blocks the initial cell cluster formation and
growth of Hela multicellular spheroids by directly inhib-
iting oxidative phosphorylation (S. Rodrıguez-Enrıquez,
J.C. Gallardo-Perez, A. Aviles-Salas, V. Maldonado-
Lagunas & R. Moreno-Sanchez, unpublished results).
Certainly, drug efficacy, delivery and side-effects are
problems that need to be solved in developing new
chemotherapies. In solid tumors, delivery to a hypoxic
region may be difficult whether the drug does not easily
permeate through the different cellular layers.
To eliminate these uncertainties, it seems relevant to
continue searching and designing new specific drugs (i.e.
molecules with inhibition constants in, at least, the
submicromolar range and with superior membrane
permeability). However, the ‘error and trial’ strategy,
followed to date, by assuming that the application of a
given drug for a ‘key’ or ‘rate-limiting’ step may yield
full inhibition, is a misleading concept. It has now been
widely shown that control of glycolysis and oxidative
phosphorylation is shared by several steps (see the sec-
tion entitled ‘Metabolic control analysis of glycolysis
and oxidative phosphorylation in intact tumor cells’).
It appears more rational for drug design to gather infor-
mation by applying the metabolic control analysis,
which allows the quantitative identification of the main
controlling steps in a pathway, along with providing
understanding of the underlying regulatory mechanisms
and faciliting the prediction of the system behavior.
The encouraging results obtained with energy-meta-
bolism drugs indicate that to block the growth of oxida-
tive or partially oxidative tumors successfully (Table 2),
specific drugs for glycolysis and oxidative phosphoryla-
tion, which may cross the cellular permeability barriers,
need to be used simultaneously (Table 3). It may be
argued that cancer cells are genetic and phenotypically
heterogeneous from line to line. However, all tumor cell
lines depend on glycolysis and oxidative phosphoryla-
tion for ATP supply. The so-called ‘metabolic therapy’
searches for physico- and biochemical differences
between tumor and normal cells to facilitate the design
of strategies that preferentially affect tumor metabolism
and growth, without altering drastically the host tissue
and organ functionality. This approach may comple-
ment the existent chemotherapeutic treatments, so that
in combination they may successfully stop tumor
growth, invasiveness and drug resistance. Traditional
chemotherapy currently offers little long-term benefit
for most malignant gliomas and is often associated with
adverse side-effects that diminish the length or quality
of life. Hence, new approaches are required that can
provide long-term management of malignant brain tum-
ors while permitting a decent quality of life [161].
Lipophilic cationic drugs, such as the rhodamines,
MKT-077, F16, and perhaps the casiopeinas, are accu-
mulated in the cytosol and mitochondria of tumor and
normal cells because of the elevated electrical potential
gradient (Dw, negative inside) generated across both
the plasma membrane and the inner mitochondrial
membrane. However, the causes underlying the
observed higher selectivity of tumor mitochondria
towards rhodamines have not been elucidated [162].
In this regard, it is documented that mitochondria
Glycolytic and mitochondrial metabolism of tumor cells R. Moreno-Sanchez et al.
1408 FEBS Journal 274 (2007) 1393–1418 ª 2007 The Authors Journal compilation ª 2007 FEBS

from human colon CX-1 tumor [143], cells and
mitochondria from MCF-7 breast adenocarcinoma
[163], and neu-, v-Va-ras-, b-catenin and c-myc-initiated
mouse tumor cell lines [145] develop a Dw of a higher
magnitude than that of normal cells (epithelial cells
from spleen, breast, kidney) (Fig. 3). The reasons for
the higher Dw might be related to the higher content
of cardiolipin (increasing the density of membrane neg-
ative charges) and cholesterol (which may decrease the
passive diffusion of H+ and other ions) in the tumor
plasma and inner mitochondrial membranes [1,164]
(Fig. 3). In osteosarcoma cells lacking mtDNA (q�)and hence lacking a respiratory chain and the ability
to generate an electrical gradient, 50 times more rhod-
amine 123 is required to inhibit proliferation [165].
The fluorometric techniques used in detecting a higher
Dw do not permit a quantitative estimation of the
absolute values or of the difference in Dw between nor-
mal and tumor cells and mitochondria. However, by
taking into account the quantitative determinations of
Dw in cells and mitochondria [92,166–168], it is expec-
ted that the absolute values are in the range of 120–
150 mV and the difference to be not higher than 20–
40 mV, as that is the magnitude of the increase in Dwwhen an oxidative phosphorylation inhibitor (oligomy-
cin or carboxyatractyloside) is added to respiring cells
and mitochondria [167].
Metabolic changes associated with the tumor
resistance to radio- and chemotherapy
It is documented that the lack of effectiveness of clin-
ical treatments, such as radiation or antineoplastic
drugs, to diminish tumor progression is related to the
development of a hypoxic and acidic microenviron-
ment surrounding the tumor cells [104–108]. In partic-
ular, the growth of solid tumors may surpass the O2
diffusion from the blood vessels, thus developing hyp-
oxic areas. Such an O2 gradient has been detected in
human cervix carcinomas, breast cancers, head and
neck cancers, soft tissue sarcomas and glioblastoma
multiforme [106,107,169]. Apparently, both radio- and
chemotherapy require the presence of O2 (and hence
blood microcirculation) to become effective treatments
against tumor cells. Moreover, apoptosis mediated by
antineoplastic drugs also requires a highly oxygenated
environment and intracellular oxidant agents, which
are not always available in solid, glycolytic tumors
[170]. In fact, it seems that a functional oxidative phos-
phorylation is required for apoptosis, as qo tumor cells
develop an apoptotic-resistant phenotype [171]. Most
solid tumors cannot grow without a blood supply
(oxidizable substrates, O2), and metastasis depends on
neovascularization of the primary tumor. In multisphe-
roids of human U118MG colon cancer, changing the
prevalent glycolytic metabolism to oxidative, by adding
oxamate, an LDH inhibitor, provokes an increase in
the tumor sensitivity to radiation [107]. These observa-
tions suggest that the hypoxic microenvironment in
tumors facilltates survival.
Traditional chemotherapy targets dividing, prolifer-
ating cells. Unfortunately, all the clinically accepted che-
motherapeutic treatments use large drug doses that also
induce profound damage to normal, proliferative host
cells [172]. Therefore, more selective targeting is
required for the treatment of cancer. Another problem
associated with chemotherapy is that in many tumor
types there is either inherent or acquired resistance to
antineoplastic drugs. A significant advance has been elu-
cidation of the metabolic changes developed by the
tumor cells for drug resistance. The drug-resistant cells
decrease the mitochondrial H+ electrochemical gradient
by over-expressing uncoupler protein 2, which acts as
a mitochondrial H+ channel, thus collapsing the H+
gradient generated by the respiratory chain; a potent
uncoupler protein 2 inhibitor is guanosine 5¢-dipho-sphate (GDP). These drug-resistant cells also increase
the utilization of alternative oxidizable substrates (fatty
acids) [173]. Furthermore, drug-resistant tumor cells
may also over-express the P-glycoprotein, an organic
anion ATPase that efficiently expels xenobiotics, after
exposure to drugs such as doxorubicin, paclitaxel, vin-
blastine and epirubicin [174].
Tumor cell metabolism and positron emission
tomography (PET)
In recent years, PET, sometimes combined with com-
puted tomography (CT) has been applied for the diag-
nosis, monitoring and treatment of cancer [175,176].
PET has mainly used glucose derivatives [18fluoro-de-
oxyglucose (FDG)] as tracers under the assumption
that tumors have a higher glycolytic capacity than nor-
mal cells [177]. Unfortunately, the FDG ⁄PET results
have been contradictory in some cases [178,179].
On the one hand, FDG ⁄PET has established that
the vast majority of metastatic tumors (> 90%) are
highly glycolytic and allowed the accurate detection
(> 90%) of solitary pulmonary nodules, mediastinal
and axillary lymph nodes; colorectal cancers; lympho-
mas; melanomas; breast cancers; and head and neck
cancers [175]. On the other hand, false positives of
FDG ⁄PET in benign diseases have been reported.
Infectious diseases (mycobacterial, fungal, bacterial),
inflammatory cells (neutrophils, activated macro-
phages), fibrotic lesions, sarcoidosis, radiation pneu-
R. Moreno-Sanchez et al. Glycolytic and mitochondrial metabolism of tumor cells
FEBS Journal 274 (2007) 1393–1418 ª 2007 The Authors Journal compilation ª 2007 FEBS 1409
monitis and postoperative surgical conditions have
shown an intense FDG signal in PET. Moreover, it
is frequently encountered that tumors with low glyco-
lytic activity, such as adenomas and bronchioloal-
veolar carcinomas, and a low cellular density of
metastatic tumors caused by the presence of mucin,
carcinoid tumors, low-grade lymphomas and small-
size tumors, have revealed false-negative results on
FDG ⁄PET [180].
In thyroid carcinoma (an advanced state and highly
differentiated human tumor), FDG was not concentra-
ted, despite administration of high and repetitive
doses; instead, such treatment induced a secondary
effect, consisting of hematic toxicity [181], suggesting
that the relevant energy pathway in thyroid carcinoma
was not glycolysis. Accumulation of FDG in malig-
nant tumors is related to regional hypoxia, but because
other factors affecting FDG uptake may be more pre-
dominant in chronic hypoxia, there may be a poor cor-
relation between hypoxia and FDG uptake. Therefore,
FDG ⁄PET cannot reliably differentiate hypoxic (i.e.
glycolytic) from normoxic tumors in frequently
hypoxic (head and neck cancer and glioblastoma
multiforme), and in less frequently hypoxic (breast
cancers), tumors [182].
Certainly, glycolysis may be activated under hypoxia
in tumor cells, but glucose catabolism and O2 levels
may not follow a simple relationship. Glycolysis can
be affected by processes not related to hypoxia, such
as cell proliferation and maintenance of ion gradients
[169]. Moreover, the glycolytic pathway has other
functions, in addition to providing cytosolic ATP.
These additional, secondary functions in normal cells
may change in tumor cells.
Knowing that not all tumors are glycolytic, but that
some have a predominant oxidative type of energy
metabolism (see Table 2 and the section entitled
‘Re-evaluation of oxidative phosphorylation in tumor
cells’), it may be justifiable to apply PET-CT with trac-
ers directed to mitochondria. There are already some
examples: pyruvate-1-[11]C was used in the analysis
of mitochondrial encephalomyopathy and Leigh’s dis-
ease [183]; copper (II)-pyruvaldehyde-bis (N4-methyl-
thiosemicarbazone) was used for monitoring electron
transport chain in normal brain mitochondria and
Ehrlich ascites [184]; TC-99M-tetrofosmin was found
to accumulate more in tumor mitochondria (breast
adenocarcinoma MCF-7 and SK-BR-3 cells, synovial
sarcoma SW 982 cells and chondrosarcoma SW 1353
cells) than in normal mitochondria [185]; and in
prostate and hepatocellular carcinoma, the use of11C-acetate ⁄PET has been successfully validated by
both clinical and experimental studies [186], probably
because the predominant energy pathway in these can-
cers is not glycolysis, but fatty acid oxidation [187].
A family of novel copper II -mixed chelate com-
pounds, termed casiopeinas�, have been tested with
success against several human (HeLa, SiHa, CaSKi,
CaLo) and murine (B16 melanoma, AS-30D) tumor
cell lines [117,168,188]. Because of their hydrophobic
and cationic nature (Table 3), these antineoplastic
drugs (11C-casiopeinas) might be useful in PET diag-
nosis of nonglycolytic tumors. Of course, the use of
mitochondrial tracers in PET analysis may also
encounter the same difficulties described for FDG, in
regard to revealing false negatives in low oxidative
tumors, and false positives in normal tissues with
high oxidative activity. The question of whether
mitochondrial PET tracers may be more specific for
tumors than for normal, healthy cells will be
answered when more data become available, but it is
worth noting that mitochondria of oxidative tumors
develop a higher electrical membrane potential than
mitochondria of normal tissue (see the section entitled
‘Mitochondrial metabolism as therapeutic target’),
thus favoring the accumulation of lipophilic, cationic
drugs and facilitating the detection of oxidative
tumors.
Therefore, it now seems a more rational strategy to
first elucidate the energy metabolic properties of each
tumor type, to help establish the most appropriate
therapeutic strategies.
Conclusions
All tumor cell types show an enhanced glycolytic flux;
however, not all have a diminished mitochondrial
metabolic capacity. Therefore, the take-home message
is that not all tumor cell types depend exclusively on
glycolysis for ATP supply; some may equally or pre-
dominantly rely on oxidative phosphorylation. In
consequence, the driving force for the enhanced gly-
colysis in tumor cells cannot be an energy deficiency
induced only by a damaged oxidative phosphoryla-
tion. The accelerated cellular proliferation may also
impose an energy deficiency (as well as a higher
demand for glycolytic and Krebs cycle biosynthetic
intermediaries), which can only be covered by an
increased glycolysis together with an unperturbed oxi-
dative phosphorylation.
Certainly there is genetic, biochemical and morpholo-
gical heterogeneity in cancer cells, but all depend only
on glycolysis and oxidative phosphorylation for ATP
supply. The enhanced tumor glycolysis results from a
generalized over-expression of most or all the enzymes
and transporters of the pathway, with HK and PFK-1
Glycolytic and mitochondrial metabolism of tumor cells R. Moreno-Sanchez et al.
1410 FEBS Journal 274 (2007) 1393–1418 ª 2007 The Authors Journal compilation ª 2007 FEBS

being markedly over-expressed in a different isoform
(with different kinetic properties from that of the tissue
of origin). At the genetic level, the enhanced glycolysis
seems to be activated by the transcription factor,
HIF-1a, although other factors, such as p53, may also
be involved. These two transcription factors might also
affect the mitochondrial function.
The metabolic control analysis of glycolysis and
oxidative phosphorylation, under conditions close to
their natural environment, and the elucidation of their
regulatory mechanisms, may allow us to predict the
pathway behavior and identify the relevant alterations
in tumor cells. This type of analysis has shown that
despite the enhanced glycolysis in all tumor cell types,
the same pathway regulatory mechanisms observed in
normal cells seem to be in place, with the notable
exception of those for PFK-1. In other words, GLUT
and HK do control glycolytic flux in some fast-growth
tumor cells (rodent AS-30D; human HeLa) as well as
in normal cells, despite the drastic over-expression of
these two proteins and the shift in the over-expressed
isoform: for HK, the regulatory mechanism is a
strong product inhibition. It would be interesting to
establish whether the two controlling steps (GLUT,
HK) might also be suitable therapeutic targets for gly-
colytic, hypoxic tumors. However, it first has to be
determined whether these proteins also mainly control
glycolytic flux in these other tumors. In turn, the
better understanding of the energy metabolism of
tumor cells may lead to design strategies for an
efficient modulation of the ATP supply and cellular
processes that are highly ATP-dependent, such as cel-
lular proliferation.
The relevant role of HIF-1a in mediating angiogene-
sis, proliferation and invasion, and in regulating the
expression of glycolytic enzymes in tumor cells, has led
to the proposal of the blockade of the HIF-1a signal
as a novel, promising therapeutic target in hypoxic
tumors [189]. However, the several unsuccessful efforts
in this direction indicate that the multiple functions of
this transcription factor have to be fully elucidated
before embarking on clinical trials.
In tumor types (such as oxidative tumors) in which
glycolysis is not the predominant energy pathway, the
application of mitochondria-directed drugs (such as
cationic lipophilic molecules), as well as the use of
mitochondria-directed tracers (such as 11C-acetate or
glutamine or 11C-rhodamines or casiopeinas) in PET-
CT analysis may be considered as alternative detection
and therapeutic strategies. These observations empha-
size the necessity in advancing the understanding of
tumor energy metabolism for improvement in diagno-
sis, drug design and chemotherapy of cancer.
Acknowledgements
The present work was partially supported by grants
from CONACYT-Mexico Salud-2002-C01-7677, SEP-
2003-C02-43811-Q and SEP-4671-Q.
References
1 Pedersen PL (1978) Tumor mitochondria and the bio-
energetics of cancer cells. Prog Exp Tumor Res 22,
190–274.
2 Weber G (2001) Ordered biochemical program of gene
expression in cancer cells. Biochemistry (Moscow) 66,
1164–1173.
3 Zu XL & Guppy M (2004) Cancer metabolism: facts,
fantasy, and fiction. Biochem Biophys Res Commun
313, 459–465.
4 Lowry OH, Berger SJ, Carter JG, Chi MM, Manches-
ter JK, Knor J & Pusateri ME (1983) Diversity of
metabolic patterns in human brain tumors: enzymes
of energy metabolism and related metabolites and
cofactors. J Neurochem 41, 994–1010.
5 Dastidar SG & Sharma SK (1989) Activities of glyco-
lytic enzymes in rapidly proliferating and differentiated
C6 glioma cells. Exp Cell Biol 57, 159–164.
6 Mazurek S, Michel A & Eigenbrodt E (1997) Effect of
extracellular AMP on cell proliferation and metabolism
of breast cancer cell lines with high and low glycolytic
rates. J Biol Chem 272, 4941–4952.
7 Rodrıguez-Enrıquez S, Torres-Marquez ME &
Moreno-Sanchez R (2000) Substrate oxidation and
ATP supply in AS-30D hepatoma cells. Arch Biochem
Biophys 375, 21–30.
8 Ziegler A, Von Kienlin M, Decorps M & Remy C
(2001) High glycolytic activity in rat glioma demon-
strated in vivo by correlation peak 1H magnetic reso-
nance imaging. Cancer Res 61, 5595–5600.
9 Griguer CE, Oliva CR & Gillespie GY (2005)
Glucose metabolism heterogeneity in human and
mouse malignant glioma cell lines. J Neurooncol 74,
123–133.
10 Gatenby RA & Gillies RJ (2004) Why do cancers have
high aerobic glycolysis? Nat Rev Cancer 4, 891–899.
11 Marin-Hernandez A, Rodriguez-Enriquez S, Vital-
Gonzalez PA, Flores-Rodriguez FL, Macias-Silva M,
Sosa-Garrocho M & Moreno-Sanchez R (2006) Deter-
mining and understanding the control of glycolysis in
fast-growth tumor cells. Flux control by an over-
expressed but strongly product-inhibited hexokinase.
FEBS J 273, 1975–1988.
12 Meienhofer MC, De Medicis E, Cognet M & Kahn A
(1978) Regulation of genes for glycolytic enzimes in
cultured rat hepatoma cell lines. Eur J Biochem 169,
237–243.
R. Moreno-Sanchez et al. Glycolytic and mitochondrial metabolism of tumor cells
FEBS Journal 274 (2007) 1393–1418 ª 2007 The Authors Journal compilation ª 2007 FEBS 1411

13 Dang CV, Lewis BC, Dolde C, Dang G & Shim H
(1997) Oncogenes in tumor metabolism, tumorigenesis,
and apoptosis. J Bioenerg Biomembr 29, 345–354.
14 Osthus RC, Shim H, Kim S, Li Q, Reddy R, Mu-
kherjee M, Xu Y, Wonsey D, Lee LA & Dang CV
(2000) Deregulation of glucose transporter 1 and
glycolytic gene expression by c-Myc. J Biol Chem 275,
21797–21800.
15 Atsumi T, Chesney J, Metz C, Leng L, Donnelly S,
Makita Z, Mitchell T & Bucala R (2002) High expres-
sion of inducible 6-phosphofructo-2-kinase ⁄ fructose2,6-bisphosphatase (iPFK-2: PFKFB3) in human
cancers. Cancer Res 62, 5881–5887.
16 Nakashima RA, Paggi MG, Scott LJ & Pedersen PL
(1988) Purification and characterization of bindable
form of mitochondrial bound hexokinase from the
highly glycolytic AS-30D rat hepatoma cell line.
Cancer Res 48, 913–919.
17 Stubbs M, Bashford CL & Griffiths JR (2003) Under-
standing the tumor-metabolic phenotype in the geno-
mic era. Curr Mol Med 3, 49–59.
18 Balinsky D, Platz CE & Lewis JW (1984) Enzyme
activities in normal, dysplastic, and cancerous human
breast tissues. J Natl Cancer Inst 72, 217–224.
19 Semenza GL (2000) HIF-1: mediator of physiological
and pathophysiological responses to hypoxia. J Appl
Physiol 88, 1474–1480.
20 Guppy M, Leedman P, Zu XL & Russell V (2002)
Contribution by different fuels and metabolic pathways
to the total ATP turnover of proliferating MCF-7
breast cancer cells. Biochem J 364, 309–315.
21 Dalgard CL, Lu H, Mohyeldin A & Verma A (2004)
Endogenous 2-oxoacids regulate expression of oxygen
sensors. Biochem J 380, 419–424.
22 Thomas DD, Espey MG, Ridnour LA, Hofseth LJ,
Mancardi D, Harris CC & Wink DA (2004) Hypoxic
inducible factor 1 alpha, extracellular signal-regulated
kinase, and p53 are regulated by distinct threshold
concentrations of nitric oxide. Proc Natl Acad Sci
USA 101, 8894–8899.
23 Robey IF, Lien AD, Welsh SJ, Baggett BK & Gillies
RJ (2005) Hypoxia-inducible factor-1a and the glyco-
lytic phenotype in tumors. Neoplasia 7, 324–330.
24 Dang CV & Semenza GL (1999) Oncogenic alterations
of metabolism. Trends Biochem Sci 24, 68–72.
25 Minchenko O, Opentanova I & Caro J (2003) Hypoxic
regulation of the 6-phosphofructo-2-kinase ⁄ fructose-2–6-bisphosphatase gene family (PFKFB-1–4) expression
in vivo. FEBS Lett 554, 264–270.
26 Simon MC (2006) Coming up for air: HIF-1 and
mitochondrial oxygen consumption. Cell Metab 3,
150–151.
27 Rapoport TA, Heinrich R & Rapoport SM (1976) The
regulatory principles of glycolysis in erythrocytes
in vivo and in vitro. A minimal comprehensive model
describing steady states, quasi-steady states and time-
dependent processes. Biochem J 154, 449–469.
28 Torres NV, Mateo F, Melendez-Hevia E & Kacser H
(1986) Kinetics of metabolic pathways. Biochem J 234,
169–174.
29 Torres NV, Souto R & Melendez-Hevia E (1989)
Study of flux and transition time control coefficient
profiles in a metabolic system in vitro and the effect of
an external stimulator. Biochem J 260, 763–769.
30 Kashiwaya YK, Sato K, Tsuchiya N, Thomas S, Fell
DA, Veech RL & Passonneau JV (1994) Control of
glucose utilization in working perfused rat heart. J Biol
Chem 269, 25502–25514.
31 Bustamante E & Pedersen PL (1977) High aerobic gly-
colysis of rat hepatoma cells in culture: role of mito-
chondrial hexokinase. Proc Natl Acad Sci USA 74,
3735–3739.
32 Vora S, Halper JP & Knowles DM (1985) Alterations
in the activity and isozymic profile of human phospho-
fructokinase during malignant transformation in vivo
and in vitro: transformation-and progression-linked dis-
criminants of malignancy. Cancer Res 45, 2993–3001.
33 Sanchez-Martınez C & Aragon JJ (1997) Analysis of
phosphofructokinase subunits and isozymes in ascites
tumor cells and its original tissue, murine mammary
gland. FEBS Lett 409, 86–90.
34 Medina RA & Owen GI (2002) Glucose transporters:
expression, regulation and cancer. Biol Res 35, 9–26.
35 Wood IS & Trayhurn P (2003) Glucose transporters
(GLUT and SGLT): expanded families of sugar trans-
port proteins. Br J Nutr 89, 3–9.
36 Macheda ML, Rogers S & Best JD (2005) Molecular
and cellular regulation of glucose transporter (GLUT)
proteins in cancer. J Cell Physiol 202, 654–662.
37 Fung KP, Choy YM, Chan TW, Lam WP & Lee CY
(1986) Glucose regulates its own transport in Ehrlich
ascites tumour cells. Biochem Biophys Res Commun
134, 1231–1237.
38 Medina RA, Meneses AM, Vera JC, Guzman C, Nual-
art F, Rodriguez F, de los Angeles Garcia M, Kato S,
Espinoza N, Monso C et al. (2004) Differential regula-
tion of glucose transporter expression by estrogen and
progesterone in Ishikawa endometrial cancer cells.
J Endocrinol 182, 467–478.
39 Christopher CW, Kohlbacher MS & Amos H (1976)
Transport of sugars in chick-embryo fibroblasts.
Evidence for a low-affinity system and a high-affinity
system for glucose transport. Biochem J 158, 439–450.
40 Lane RH, Crawford SE, Flozak AS & Simmons RA
(1999) Localization and quantification of glucose trans-
porters in liver of growth-retarded fetal and neonatal
rats. Am J Physiol 276, E135–E142.
41 Cornish-Bowden A & Cardenas ML (1991) Hexo-
kinase and glucokinase in liver metabolism. Trends
Biochem Sci 16, 281–282.
Glycolytic and mitochondrial metabolism of tumor cells R. Moreno-Sanchez et al.
1412 FEBS Journal 274 (2007) 1393–1418 ª 2007 The Authors Journal compilation ª 2007 FEBS
42 Wilson JE (2003) Isozymes of mammalian hexokinase:
structure, subcellular localization and metabolic func-
tion. J Exp Biol 206, 2049–2057.
43 Pedersen PL, Mathupala S, Rempel A, Geschwind JF
& Ko YH (2002) Mitochondrial bound type II hexo-
kinase. Biochim Biophys Acta 1555, 14–20.
44 Parry DM & Pedersen PL (1983) Intracellular localiza-
tion and properties of particulate hexokinase in the
Novikoff ascites tumor. J Biol Chem 258, 10904–10912.
45 Bennett MJ, Timperley WR, Taylor CB & Hill AS
(1978) Isoenzymes of hexokinase in the developing,
normal and neoplastic human brain. Eur J Cancer 14,
189–193.
46 Beutner G, Ruck A, Riede B, Welte W & Brdiczka D
(1996) Complex between kinases, mitochondrial porin
and adenylate translocator in rat brain resemble the
permeability transition pore. FEBS Lett 396, 189–195.
47 Shimizu S, Ide T, Yanagida T & Tsujimoto Y (2000)
Electrophysiological study of a novel large pore
formed by Bax and the voltage-dependent anion chan-
nel that is permeable to cytochrome c. J Biol Chem
275, 12321–12325.
48 Pastorino JG, Shulga N & Hoek JB (2002) Mitochon-
drial binding of hexokinase II inhibits Bax induced
cytochrome c release and apoptosis. J Biol Chem 277,
7610–7618.
49 Seixas da-Silva W, Gomez-Puyou A, Tuena M,
Moreno-Sanchez R, de Felice FG, de Meis L, Oliveira
MF & Galina A (2004) Mitochondrial bound hexoki-
nase activity as a preventive antioxidant defense. J Biol
Chem 279, 39846–39855.
50 Dunaway GA, Kasten TP, Sebo T & Trapp R (1988)
Analysis of the phosphofructokinase subunits and iso-
enzymes in human tissues. Biochem J 251, 677–683.
51 Oskam R, Rijksen G, Staal GEJ & Vora S (1985) Iso-
zymic composition and regulatory properties of phos-
phofructokinase from well-differentiated and anaplastic
medullary thyroid carcinomas of the rat. Cancer Res
45, 135–142.
52 Staal GEJ, Kalff A, Heesbeen EC, van Veelen CWM
& Rijksen G (1987) Subunit composition, regulatory
properties, and phosphorylation of phosphofructoki-
nase from human gliomas. Cancer Res 47, 5047–5051.
53 Sanchez-Martınez C, Estevez AM & Aragon JJ (2000)
Phosphofructokinase C isozyme from ascites tumor
cells: cloning, expression, and properties. Biochem Bio-
phys Res Commun 271, 635–640.
54 Meldolesi MF, Macchia V & Laccetti P (1976) Differ-
ences in phosphofructokinase regulation in normal and
tumor rat thyroid cells. J Biol Chem 251, 6244–6251.
55 Rider MH, Bertrand L, Vertommen D, Michels PA,
Rousseau GG & Hue L (2004) 6-Phosphofructo-2-
kinase ⁄ fructose-2,6-bisphosphatase: head-to-head with
a bifunctional enzyme that controls glycolysis. Biochem
J 381, 561–579.
56 Hirata T, Kato M, Okamura N, Fukasawa M & Saka-
kibara R (1998) Expression of human placental-type
6-phosphofructo-2-kinase ⁄ fructose 2,6-bisphosphatase
in various cells and cells lines. Biochem Biophys Res
Commun 242, 680–684.
57 Calvo MN, Bartrons R, Castano E, Perales JC, Navar-
ro-Sabate A & Manzano A (2006) PFKFB3 gene silen-
cing decreases glycolysis, induces cell-cycle delay and
inhibits anchorage-independent growth in HeLa cells.
FEBS Lett 580, 3308–3314.
58 Warburg O (1956) On the origin of cancer cells.
Science 123, 309–314.
59 Baggetto LG & Lehninger AL (1987) Formation and
utilization of acetoin, an unusual product of pyruvate
metabolism by Ehrlich and AS30-D tumor mitochon-
dria. J Biol Chem 262, 9535–9541.
60 Baggetto LG (1992) Deviant energetic metabolism of
glycolytic cancer cells. Biochimie 74, 959–974.
61 Paradies G, Capuano F, Palombini G, Galeotti T &
Papa S (1983) Transport of pyruvate in mitochondria
from different tumor cells. Cancer Res 43, 5068–
5071.
62 Lindahl R (1979) Subcellular distribution and
properties of aldehyde dehydrogenase from 2-acetyl-
aminofluorene-induced rat hepatomas. Biochem J 183,
55–64.
63 Lazo PA & Sols A (1980) Pyruvate dehydrogenase
complex of ascites tumour. Activation by AMP and
other properties of potential significance in metabolic
regulation. Biochem J 190, 705–710.
64 Rodrıguez-Enrıquez S, Juarez O, Rodrıguez-Zavala JS
& Moreno-Sanchez R (2001) Multisite control of the
Crabtree effect in ascites hepatoma cells. Eur J
Biochem 268, 2512–2519.
65 Eboli ML, Paradies G, Galeotti T & Papa S (1977)
Pyruvate transport in tumour-cell mitochondria.
Biochim Biophys Acta 460, 183–187.
66 Parlo RA & Coleman PS (1984) Enhanced rate of
citrate export from cholesterol-rich hepatoma mito-
chondria. The truncated Krebs cycle and other meta-
bolic ramifications of mitochondrial membrane
cholesterol. J Biol Chem 259, 9997–10003.
67 Dietzen DJ & Davis EJ (1993) Oxidation of pyruvate,
malate, citrate, and cytosolic reducing equivalents by
AS-30D hepatoma mitochondria. Arch Biochem Bio-
phys 305, 91–102.
68 Briscoe DA, Fiskum G, Holleran AL & Kelleher JK
(1994) Acetoacetate metabolism in AS-30D hepatoma
cells. Mol Cell Biochem 136, 131–137.
69 Boxer GE & Devlin TM (1961) Pathways of intracellu-
lar hydrogen transport. Science 134, 1495–1501.
70 Grivell AR, Korpelainen EI, Williams CJ & Berry MN
(1995) Substrate-dependent utilization of the glycerol
3-phosphate or malate ⁄ aspartate redox shuttles by
Ehrlich ascites cells. Biochem J 310, 665–671.
R. Moreno-Sanchez et al. Glycolytic and mitochondrial metabolism of tumor cells
FEBS Journal 274 (2007) 1393–1418 ª 2007 The Authors Journal compilation ª 2007 FEBS 1413
71 Rodriguez-Enriquez S, Kim I, Currin RT & Lemasters
JJ (2006) Tracker dyes to probe mitochondrial
autophagy (mitophagy) in rat hepatocytes. Autophagy
2, 39–46.
72 LaNoue KF, Hemington JG, Ohnishi T, Morris HP &
Williamson JR (1974) Defects in anion and electron
transport in Morris hepatoma mitochondria. In Hor-
mones and Cancer (McKerns KW, ed.), pp. 131–167.
Academic Press, New York.
73 White MT & Nandi S (1976) Biochemical studies on
mitochondria isolated from normal and neoplasic tis-
sues of the mouse mammary gland. J Natl Cancer Inst
56, 65–73.
74 Lichtor T & Dohrmann GJ (1987) Oxidative metabo-
lism and glycolysis in benign brain tumors. J Neuro-
surg 67, 336–340.
75 Barbour RL & Chan SH (1983) Adenine nucleotide
transport in hepatoma mitochondria and its correlation
with hepatoma growth rates and tumor size. Cancer
Res 43, 1511–1517.
76 Torroni A, Stepien G, Hodge JA & Wallace DC
(1990) Neoplastic transformation is associated with
coordinate induction of nuclear and cytoplasmic oxida-
tive phosphorylation genes. J Biol Chem 265, 20589–
20593.
77 Capuano F, Varone D, D’Eri N, Russo E, Tommasi S,
Montemurro S, Prete F & Papa S (1996) Oxidative
phosphorylation and F0F1 ATP synthase activity of
human hepatocellular carcinoma. Biochem Mol Biol Int
38, 1013–1022.
78 Pedersen PL, Greenawalt JW, Chan TL & Morris HP
(1970) A comparison of some ultrastructural and
biochemical properties of mitochondria from Morris
hepatomas 9618A, 7800, and 3924A. Cancer Res 30,
2620–2626.
79 White MT & Tewari KK (1973) Structural and func-
tional changes in Novikoff hepatoma mitochondria.
Cancer Res 33, 1645–1653.
80 Sauer LA (1977) On the mechanism of the Crabtree
effect in mouse ascites tumor cells. J Cell Physiol 93,
313–316.
81 Sussman I, Erecinska M & Wilson DF (1980) Regula-
tion of cellular energy metabolism: the Crabtree effect.
Biochim Biophys Acta 591, 209–223.
82 Sener A, Blachier F & Malaisse WJ (1988) Crabtree
effect in tumoral pancreatic islet cells. J Biol Cell 263,
1904–1909.
83 Gabai VL (1992) Glucose decreases respiratory control
ratio in EL-4 tumor cells. FEBS Lett 313, 126–128.
84 Melo RF, Stevan FR, Campello AP, Carnieri EG &
de Oliveira MB (1998) Occurrence of the Crabtree
effect in HeLa cells. Cell Biochem Funct 16, 99–105.
85 Gauthier T, Denis-Pouxviel C & Murat JC (1990)
Respiration of mitochondria isolated from differen-
tiated and undifferentiated HT29 colon cancer cells in
the presence of various substrates and ADP generating
systems. Int J Biochem 22, 411–417.
86 Seshagiri PB & Bavister BD (1991) Glucose and phos-
phate inhibit respiration and oxidative metabolism in
cultured hamster eight-cell embryos: evidence for the
‘crabtree effect’. Mol Reprod Dev 30, 105–111.
87 Yang X, Borg LA & Eriksson UJ (1997) Altered meta-
bolism and superoxide generation in neural tissue of
rat embryos exposed to high glucose. Am J Physiol
272, E173–E180.
88 Rodriguez-Zavala JS & Moreno-Sanchez R (1998)
Modulation of oxidative phosphorylation by Mg2+ in
rat heart mitochondria. J Biol Chem 273, 7850–7855.
89 Covian R & Moreno-Sanchez R (2001) Role of proto-
natable groups of bovine heart bc(1) complex in ubi-
quinol binding and oxidation. Eur J Biochem 268,
5783–5790.
90 Luciakova K & Kuzela S (1984) Increased content of
natural ATPase inhibitor in tumor mitochondria.
FEBS Lett 177, 85–88.
91 Bravo C, Minauro-Sanmiguel F, Morales-Rios E,
Rodriguez-Zavala JS & Garcia JJ (2004) Overexpres-
sion of the inhibitor protein IF(1) in AS-30D hepa-
toma produces a higher association with mitochondrial
F(1)F(0) ATP synthase compared to normal rat
liver: functional and cross-linking studies. J Bioenerg
Biomembr 36, 257–264.
92 Solaini G & Harris DA (2005) Biochemical dysfunc-
tion in heart mitochondria exposed to ischaemia and
respiration. Biochem J 390, 377–394.
93 Penta JS, Johnson FM, Wachsman JT & Copeland
WC (2001) Mitochondrial DNA in human malignancy.
Mutat Res 488, 119–133.
94 Carew JS & Huang P (2002) Mitochondrial defects in
cancer. Mol Cancer 1, 1–9.
95 Meierhofer D, Mayr JA, Fink K, Schmeller N, Kofler
B & Sperl W (2006) Mitochondrial DNA mutations in
renal cell carcinomas revealed no general impact on
energy metabolism. Br J Cancer 94, 268–274.
96 Bonora E, Porcelli AM, Gasparre G, Biondi A, Ghelli
A, Carelli V, Baracca A, Tallini G, Martinuzzi A,
Lenaz G et al. (2006) Defective oxidative phosphoryla-
tion in thyroid oncocytic carcinoma is associated with
pathogenic mitochondrial DNA mutations affecting
complexes I and III. Cancer Res 66, 6087–6096.
97 Xu R, Pelicano H, Zhou Y, Carew JS, Feng L,
Bhalla KN, Keating MJ & Huang P (2005) Inhibi-
tion of glycolysis in cancer cells: a novel strategy to
overcome drug resistance associated with mitochon-
drial respiratory defect and hypoxia. Cancer Res 65,
613–621.
98 Matoba S, Kang JG, Patino WD, Wragg A, Boehm
M, Gavrilova O, Hurley PJ, Bunz F & Hwang PM
(2006) p53 regulates mitochondrial respiration. Science
312, 1650–1653.
Glycolytic and mitochondrial metabolism of tumor cells R. Moreno-Sanchez et al.
1414 FEBS Journal 274 (2007) 1393–1418 ª 2007 The Authors Journal compilation ª 2007 FEBS
99 Rossignol R, Gilkerson R, Aggeler R, Yamagata K,
Remington SJ & Capaldi RA (2004) Energy substrate
modulates mitochondrial structure and oxidative capa-
city in cancer cells. Cancer Res 64, 985–993.
100 Seyfried TN & Mukherjee P (2005) Targeting energy
metabolism in brain cancer: review and hypothesis.
Nutr Metabol 2, 30–38.
101 Eskey CJ, Koretsky AP, Domach MM & Jain RK
(1993) Role of oxygen versus glucose in energy meta-
bolism in a mammary carcinoma perfused ex vivo:
direct measurement by 31P NMR. Proc Natl Acad Sci
USA 90, 2646–2650.
102 Thews O, Kelleher DK, Lecher B & Vaupel P (1998)
Blood flow, oxygenation, metabolic and energetic sta-
tus in different clonal subpopulations of a rat rhabdo-
myosarcoma. Int J Oncol 13, 205–211.
103 Rofstad EK & Halsor EF (2000) Vascular endothelial
growth factor, interleukin 8, platelet-derived endothe-
lial cell growth factor, and basic fibroblast growth fac-
tor promote angiogenesis and metastasis in human
melanoma xenografts. Cancer Res 60, 4932–4938.
104 Sutherland RM (1988) Cell and environment interac-
tions in tumor microregions: the multicell spheroid
model. Science 240, 177–184.
105 Schroeder T, Yuan H, Viglianti BL, Peltz C, Asopa S,
Vujaskovic Z & Dewhirst MW (2005) Spatial heteroge-
neity and oxygen dependence of glucose consumption
in R3230Ac and fibrosarcomas of the Fischer 344 rat.
Cancer Res 65, 5163–5171.
106 Vaupel P, Kallinowski F & Okunieff P (1989) Blood
flow, oxygen and nutrient supply, and metabolic
microenvironment of human tumors: a review. Cancer
Res 49, 6449–6465.
107 Gorlach A & Acker H (1994) pO2- and pH-gradients
in multicellular spheroids and their relationship to cel-
lular metabolism and radiation sensitivity of malignant
human tumor cells. Biochim Biophys Acta 1227, 105–
112.
108 Sutherland RM (1998) Tumor hypoxia and gene
expression. Acta Oncol 37, 567–574.
109 Matsumoto A, Matsumoto S, Sowers AL, Koscielniak
JW, Trigg NJ, Kuppusamy P, Mitchell JB, Subramanian
S, Krishna MC & Matsumoto K (2005) Absolute oxy-
gen tension (pO(2)) in murine fatty and muscle tissue as
determined by EPR. Magn Reson Med 54, 1530–1535.
110 Inoue M, Mukai M, Hamanaka Y, Tatsuta M,
Hiraoka M & Kizaka-Kondoh S (2004) Targeting
hypoxic cancer cells with a protein prodrug is effective
in experimental malignant ascites. Int J Oncol 25, 713–
720.
111 Mason MG, Nicholls P, Wilson MT & Cooper CE
(2006) Nitric oxide inhibition of respiration involves
both competitive (heme) and noncompetitive (copper)
binding to cytochrome c oxidase. Proc Natl Acad Sci
USA 103, 708–713.
112 Gnaiger E, Lassnig B, Kuznetsov A, Rieger G & Mar-
greiter R (1998) Mitochondrial oxygen affinity, respira-
tory flux control and excess capacity of cytochrome c
oxidase. J Exp Biol 201, 1129–1139.
113 Pecina P, Gnaiger E, Zeman J, Pronicka E & Houstek
T (2004) Decreased affinity for oxygen of cytochrome-
c oxidase in Leigh syndrome caused by SURF1 muta-
tions. Am J Physiol Cell Physiol 287, C1384–C1388.
114 Nielsen FU, Daugaard P, Bentzen L, Stodkilde-Jorgen-
sen H, Overgaard J, Horsman MR & Maxwell RJ
(2001) Effect of changing tumor oxygenation on glyco-
lytic metabolism in a murine C3H mammary carci-
noma assessed by in vivo nuclear magnetic resonance
spectroscopy. Cancer Res 61, 5318–5325.
115 Board M, Humm S & Newsholme EA (1990) Maxi-
mum activities of key enzymes of glycolysis, glutamino-
lysis, pentose phosphate pathway and tricarboxylic
acid cycle in normal, neoplastic and suppressed cells.
Biochem J 265, 503–509.
116 Reitzer LJ, Wice BM & Kennell D (1979) Evidence
that glutamine, not sugar, is the major energy source
for cultured HeLa cells. J Biol Chem 254, 2669–2676.
117 Rodriguez-Enriquez S, Vital-Gonzalez PA, Flores-
Rodriguez FL, Marin-Hernandez A, Ruiz-Azuara L &
Moreno-Sanchez R (2006) Control of cellular prolifera-
tion by modulation of oxidative phosphorylation in
human and rodent fast-growing tumor cells. Toxicol
Appl Pharmacol 215, 208–217.
118 Medina MA (2001) Glutamine and cancer. J Nutr 131,
2539 S–2542 S.
119 Muller M, Siems W, Buttgereit F, Dumdey R & Rapo-
port SM (1986) Quantification of ATP-producing and
consuming processes of Ehrlich ascites tumour cells.
Eur J Biochem 161, 701–705.
120 Schmidt H, Siems W, Muller M, Dumdey R & Rapo-
port S (1991) ATP-producing and consuming processes
of Ehrlich mouse ascites tumor cells in proliferating
and resting phases. Exp Cell Res 194, 122–127.
121 Weinhouse S (1956) On respiratory impairment in can-
cer cells. Science 124, 267–269.
122 Miralpeix M, Azcon-Breto J, Bartrons R & Argiles JM
(1990) The impairment of respiration by glycolysis in
the Lewis lung carcinoma. Cancer Lett 50, 173–178.
123 Kallinowski F, Schlenger KH, Kloes M, Stohrer M &
Vaupel P (1989) Tumor blood flow: the principal mod-
ulator of oxidative and glycolytic metabolism, and of
the metabolic micromilieu of human tumor xenografts
in vivo. Int J Cancer 44, 266–272.
124 Lanks KW & Li PW (1988) End products of glucose
and glutamine metabolism by cultured cell lines. J Cell
Physiol 135, 151–155.
125 Fantin VR, St-Pierre J & Leder P (2006) Attenuation
of LDH-A expression uncovers a link between glyco-
lysis, mitochondrial physiology, and tumor mainte-
nance. Cancer Cell 9, 425–434.
R. Moreno-Sanchez et al. Glycolytic and mitochondrial metabolism of tumor cells
FEBS Journal 274 (2007) 1393–1418 ª 2007 The Authors Journal compilation ª 2007 FEBS 1415
126 Moreadith RW & Lehninger AL (1984) Purification,
kinetic behavior, and regulation of NAD(P)+ malic
enzyme of tumor mitochondria. J Biol Chem 259,
6222–6227.
127 Mandella RD & Sauer LA (1975) The mitochondrial
malic enzymes. I. Submitochondrial localization and
purification and properties of the NAD(P)+-depend-
ent enzyme from adrenal cortex. J Biol Chem 250,
5877–5884.
128 Molina M, Segura JA, Aledo JC, Medina MA, Nunez
de Castro I & Marquez J (1995) Glutamine transport
by vesicles isolated from tumour-cell mitochondrial
inner membrane. Biochem J 308, 629–633.
129 Matsuno T & Goto I (1992) Glutaminase and gluta-
mine synthetase activities in human cirrhotic liver
and hepatocellular carcinoma. Cancer Res 52, 1192–
1194.
130 Fell D (1997) Understanding the Control of Metabolism.
Portland Press, London.
131 Groen AK, Wanders RJ, Westerhoff HV, Van der
Meer R & Tager JM (1982) Quantification of the con-
tribution of various steps to the control of mitochon-
drial respiration. J Biol Chem 257, 2754–2757.
132 Moreno-Sanchez R & Torres-Marquez ME (1991)
Control of oxidative phosphorylation in mitochondria,
cells and tissues. Int J Biochem 23, 1163–1174.
133 Krieg RC, Knuechel R, Schiffmann E, Liotta LA, Pet-
ricoin EF III & Herrmann PC (2004) Mitochondrial
proteome: cancer-altered metabolism associated with
cytochrome c oxidase subunit level variation. Proteo-
mics 4, 2789–2795.
134 Walenta S, Wetterling M, Lehrke M, Schwickert G,
Sundfor K, Rofstad EK & Mueller-Klieser W (2000)
High lactate levels predict likelihood of metastases,
tumor recurrence, and restricted patient survival in
human cervical cancers. Cancer Res 60, 916–921.
135 Soderberg K, Nissinen E, Bakay B & Scheffler IE
(1980) The energy charge in wild-type and respiration-
deficient Chinese hamster cell mutants. J Cell Physiol
103, 169–172.
136 Gear AR (1974) Rhodamine 6G. A potent inhibitor of
mitochondrial oxidative phosphorylation. J Biol Chem
249, 3628–3637.
137 Fearon KC, Plumb JA, Burns HJ & Calman KC
(1987) Reduction of the growth rate of the Walker 256
tumor in rats by rhodamine 6G together with hypogly-
cemia. Cancer Res 47, 3684–3687.
138 Lambeir AM, Loiseau AM, Kuntz DA, Vellieux FM,
Michels PA & Opperdoes FR (1991) The cytosolic and
glycosomal glyceraldehyde-3-phosphate dehydrogenase
from Trypanosoma brucei. Kinetic properties and com-
parison with homologous enzymes. Eur J Biochem 198,
429–435.
139 Coyle T, Levante S, Shetler M & Wintield J (1994) In
vitro and in vivo cytotoxicity of gossypol against
central nervous system tumor cell lines. J Neurooncol
19, 25–35.
140 Jaroszewski JW, Kaplan O & Cohen JS (1990) Action
of gossypol and rhodamine 123 on wild-type and mul-
tidrug-resistant MCF-7 human breast cancer cells: 31P
nuclear magnetic resonance and toxicity studies. Can-
cer Res 50, 6936–6943.
141 Liu H, Hu YP, Savaraj N, Priebe W & Lampidis TJ
(2001) Hypersensitization of tumor cells to glycolytic
inhibitors. Biochemistry 40, 5542–5547.
142 Lampidis TJ, Bernal SD, Summerhayes IC & Chen LB
(1983) Selective toxicity of rhodamine 123 in carci-
noma cells in vivo. Cancer Res 43, 716–720.
143 Bernal SD, Lampidis TJ, McIsaac RM & Chen LB
(1983) Antisarcoma activity in vivo of rhodamine 123,
a mitochondrial-specific dye. Science 222, 169–172.
144 Sri-Pathmanathan RM, Plumb JA & Fearon KC
(1994) Clofazimine alters the energy metabolism and
inhibits the growth rate of a human lung-cancer cell
line in vitro and in vivo. Int J Cancer 56, 900–905.
145 Fantin VR, Berardi MJ, Scorrano L, Korsmeyer SJ &
Leder P (2002) A novel mitochondriotoxic small mole-
cule that selectively inhibits tumor cell growth. Cancer
Cell 2, 29–42.
146 Koya K, Li Y, Wang H, Ukai T, Tatsuta N, Kawaka-
mi M & Shishido & Chen LB (1996) MKT-077, a
novel rhodacyanine dye in clinical trials, exhibits antic-
arcinoma activity in preclinical studies based on selec-
tive mitochondrial accumulation. Cancer Res 56, 538–
543.
147 Ko YH, Pedersen PL & Geschwind JF (2001) Glucose
catabolism in the rabbit VX2 tumor model for liver
cancer: characterization and targeting hexokinase.
Cancer Lett 173, 83–91.
148 Geschwind JF, Ko YH, Torbenson MS, Magee C &
Pedersen PL (2002) Novel therapy for liver cancer:
direct intraarterial injection of a potent inhibitor of
ATP production. Cancer Res 62, 3909–3913.
149 Sweet S & Singh G (1995) Accumulation of human
promyelocytic leukemic (HL-60) cells at two energetic
cell cycle checkpoints. Cancer Res 55, 5164–5167.
150 Armstrong JS, Hornung B, Lecane P, Jones DP &
Knox SJ (2001) Rotenone-induced G2 ⁄M cell cycle
arrest and apoptosis in a human B lymphoma cell line
PW. Biochem Biophys Res Commun 289, 973–978.
151 Barrientos A & Moraes CT (1999) Titrating the effects
of mitochondrial complex I impairment in the cell phy-
siology. J Biol Chem 274, 16188–16197.
152 Fanciulli M, Valentini A, Bruno T, Citro G & Zupi &
Floridi A (1996) Effect of the antitumor drug lonida-
mine on glucose metabolism of adriamycin-sensitive
and -resistant human breast cancer cells. Oncol Res 8,
111–1120.
153 De Martino C, Malorni W, Accinni L, Rosati F, Nista
A, Formisano G, Silvestrini B & Arancia G (1987) Cell
Glycolytic and mitochondrial metabolism of tumor cells R. Moreno-Sanchez et al.
1416 FEBS Journal 274 (2007) 1393–1418 ª 2007 The Authors Journal compilation ª 2007 FEBS
membrane changes induced by lonidamine in human
erythrocytes and T lymphocytes, and Ehrlich ascites
tumor cells. Exp Mol Pathol 46, 15–30.
154 Gottschalk S, Anderson N, Hainz C, Eckhardt SG &
Serkova NJ (2004) Imatinib (STI571)-mediated
changes in glucose metabolism in human leukemia
BCR-ABL-positive cells. Clin Cancer Res 10, 6661–
6668.
155 Fiorentini D, Hakim G, Bonsi L, Bagnara GP, Mar-
aldi T & Landi L (2001) Acute regulation of glucose
transport in a human megakaryocytic cell line: differ-
ence between growth factors and H(2)O(2). Free Rad
Biol Med 31, 923–931.
156 Fosslien E (2000) Biochemistry of cyclooxygenase
(COX)-2 inhibitors and molecular pathology of COX-2
in neoplasia. Crit Rev Clin Lab Sci 37, 431–502.
157 Kune GA, Kune S & Watson LF (1988) Colorectal
cancer risk, chronic illness, operations and medica-
tions: case control results from the Melbourne Colorec-
tal Cancer Study. Cancer Res 48, 4399–4404.
158 Lundholm K, Gelin J, Hyltander A, Lonnroth C,
Sandstrom R, Svaninger G, Korner U, Gulich M, Kar-
refors I, Norli B et al. (1994) Anti-inflammatory treat-
ment may prolong survival in undernourished patients
with metastatic solid tumors. Cancer Res 54, 5602–
5606.
159 Cahlin C, Gelin J, Andersson M, Lonnroth C &
Lundholm K (2005) The effects of non-selective, prefer-
ential-selective and selective COX-inhibitors on the
growth of experimental and human tumors in mice
related to protanoid receptors. Int J Oncol 27, 913–923.
160 Moreno-Sanchez R, Bravo C, Vasquez C, Ayala G,
Silveira L & Martınez-Lavın M (1999) Inhibition and
uncoupling of oxidative phosphorylation by nonsteroi-
dal anti-inflammatory drugs: study in mitochondria,
submitochondrial particles, cells, and whole heart.
Biochem Pharmacol 57, 743–752.
161 Fisher PG & Buffler PA (2005) Malignant gliomas in
2005: where to GO from here? JAMA 293, 615–617.
162 Dairkee SH & Hackett AJ (1991) Differential retention
of rhodamine 123 by breast carcinoma and normal
human mammary tissue. Breast Cancer Res Treat 18,
57–61.
163 Davis S, Weiss MJ, Wong JR, Lampidis TJ & Chen
LB (1985) Mitochondrial and plasma membrane poten-
tials cause unusual accumulation and retention of rho-
damine 123 by human breast adenocarcinoma-derived
MCF-7 cells. J Biol Chem 260, 13844–13850.
164 Dietzen DJ & Davis EJ (1994) Excess membrane cho-
lesterol is not responsible for metabolic and bioener-
getic changes in AS-30D hepatoma mitochondria. Arch
Biochem Biophys 309, 341–347.
165 Hu Y, Moraes CT, Savaraj N, Priebe W & Lampidis
TJ (2000) Rho(0) tumor cells: a model for studying
whether mitochondria are targets for rhodamine 123,
doxorubicin and other drugs. Biochem Pharmacol 60,
1897–1905.
166 Moreno-Sanchez R, Rodriguez-Enriquez S, Cuellar A
& Corona N (1995) Modulation of 2-oxoglutarate
dehydrogenase and oxidative phosphorylation by Ca2+
in pancreas and adrenal cortex mitochondria. Arch
Biochem Biophys 319, 432–444.
167 Brown GC, Lakin-Thomas PL & Brand MD (1990)
Control of respiration and oxidative phosphorylation
in isolated rat liver cells. Eur J Biochem 192, 355–
362.
168 Marın-Hernandez A, Gracia-Mora I, Ruiz-Ramırez L
& Moreno-Sanchez R (2003) Toxic effects of copper-
based antineoplastic drugs (Casiopeinas) on mitochon-
drial functions. Biochem Pharmacol 65, 1979–1989.
169 Rajendran JG, Mankoff DA, O’Sullivan F, Peterson
LM, Schwartz DL, Conrad EU, Spence AM, Muzi M,
Farwell DG & Krohn KA (2004) Hypoxia and glucose
metabolism in malignant tumors: evaluation by [18F]
fluoromisonidazole and [18F] fluorodeoxyglucose posit-
ron emission tomography imaging. Clin Cancer Res 10,
2245–2252.
170 Murphy BJ, Laderoute KR, Chin RJ & Sutherland RJ
(1994) Metallothionein IIA is up-regulated by hypoxia
in human A431 squamous carcinoma cells. Cancer Res
54, 5808–5810.
171 Dey R & Moraes CT (2000) Lack of oxidative phos-
phorylation and low mitochondrial membrane poten-
tial decrease susceptibility to apoptosis and do not
modulate the protective effect of Bcl-x (L) in osteosar-
coma cells. J Biol Chem 275, 7087–7094.
172 Navolanic PM & McCubrey JA (2005) Pharmacologi-
cal breast cancer therapy (review). Int J Oncol 27,
1341–1334.
173 Harper ME, Antoniou A, Villalobos-Manuey E, Russo
A, Trauger R, Vendemelio M, George A, Bartholomew
R, Carlo D, Shaikh A et al. (2002) Characterization of
a novel metabolic strategy used by drug-resistant
tumor cells. FASEB J 16, 1550–1557.
174 Marks DC, Su GM, Davey RA & Davey MW (1996)
Extended multidrug resistance in haemopoietic cells.
Br J Haematol 95, 587–595.
175 Czernin J & Phelps ME (2002) Positron emission
tomography scanning: current and future applications.
Annu Rev Med 53, 89–112.
176 Seemann MD (2004) PET ⁄CT: Fundamental Princi-
ples. Eur J Med Res 28, 241–246.
177 Pauwels EK, Sturm EJ, Bombardieri E, Cleton FJ &
Stokkel MP (2000) Positron-emission tomography with
[18F]fluorodeoxyglucose. Part I. Biochemical uptake
mechanism and its implication for clinical studies.
J Cancer Res Clin Oncol 126, 549–559.
178 Schiepers C & Hoh CK (1998) Positron emission
tomography as a diagnostic tool in oncology. Eur
Radiol 8, 1481–1494.
R. Moreno-Sanchez et al. Glycolytic and mitochondrial metabolism of tumor cells
FEBS Journal 274 (2007) 1393–1418 ª 2007 The Authors Journal compilation ª 2007 FEBS 1417

179 Lassen U, Daugaard G, Eigtved A, Damgaard K &
Friberg L (1999) 18F-FDG whole body positron emis-
sion tomography (PET) in patients with unknown pri-
mary tumours (UPT). Eur J Cancer 35, 1076–1082.
180 Chang JM, Lee HJ, Goo JM, Lee HY, Lee JJ, Chung
JK & Im JG (2006) False positive and false negative
FDG-PET scans in various thoracic diseases. Korean J
Radiol 7, 57–69.
181 Haq MS, McCready RM & Harmer CL (2004) Treat-
ment of advanced differentiated thyroid carcinoma
with high activity radioiodine therapy. Nucl Med Com-
mun 25, 799–805.
182 Zimny M, Gagel B, Dimartino E, Hamacker K, Coe-
nen HH, Westhofen M, Eble M, Buell U & Reinartz P
(2006) FDG – a marker of tumour hypoxia? A com-
parison with [18F] fluoromisonidazole and pO2-pola-
rography in metastatic head and neck cancer. Eur J
Nucl Med Mol Imaging 33, 1426–1431.
183 Toyoda M, Sakuragawa N, Arai Y, Yoshikawa H,
Sugai K, Arima M, Hara T, Lio M & Satoyoshi E
(1989) Positron emission tomography using pyruvate-
1–11C in two cases of mitochondrial encephalomyo-
pathy. Ann Nucl Med 3, 103–109.
184 Fujibayashi Y, Taniuchi H, Wada K, Yonekura Y,
Konishi J & Yokoyama A (1995) Differential
mechanism of retention of Cu-pyruvaldehyde-bis
(N4-methylthiosemicarbazone) (Cu-PTSM) by
brain and tumor: a novel radiopharmaceutical for
positron emission tomography imaging. Ann Nucl Med
9, 1–5.
185 Rodrigues M, Kalinowska W, Aghajanian AA, Zielin-
ski C & Sinzinger H (2002) Accumulation of TC-99M-
MIBI and TC-99M-Tetrofosmin in tumor cells. Uptake
and washout studies. AloSbimn J 17, 410.
186 Jana S & Blaufox MD (2006) Nuclear medicine studies
of the prostate, testes, and bladder. Semin Nucl Med
36, 51–72.
187 Liu Y (2006) Fatty acid oxidation is a dominant bioen-
ergetic pathway in prostate cancer. Prostate Cancer
Prostatic Dis 9, 230–234.
188 Gracia-Mora I, Ruiz-Ramirez L, Gomez-Ruiz C,
Tinoco-Mendez M, Marquez-Quinones A, Romero-De
Lira L, Marin-Hernandez A, Macias-Rosales L &
Bravo-Gomez ME (2001) Knigth’s move in the peri-
odic table, from copper to platinum, novel antitumor
mixed chelate copper compounds, casiopeinas, evalu-
ated by an in vitro human and murine cancer cell line
panel. Metal Based Drugs 8, 19–28.
189 Kong D, Park EJ, Stephen AG, Calvani M, Cardellina
JH, Monks A, Fisher RJ, Shoemaker RH & Melillo G
(2005) Echinomycin, a small molecule inhibitor of
hypoxia-inducible factor-1 DNA-binding activity.
Cancer Res 65, 9047–9055.
190 Ziegler A, Von Kienlin M, Decorps M & Remy C
(2001) High glycolytic activity in rat glioma demon-
strated in vivo by correlation peak 1H magnetic reso-
nance imaging. Cancer Res 61, 5595–5600.
191 Balaban RS & Bader JP (1984) Studies on the relation-
ship between glycolysis and (Na++ K+)-ATPase in
cultured cells. Biochim Biophys Acta 804, 419–426.
192 Fanciulli M, Bruno T, Castiglione S, Del Carlo C,
Paggi MG & Floridi A (1993) Glucose metabolism in
adriamycin-sensitive and -resistant LoVo human colon
carcinoma cells. Oncol Res 5, 357–362.
193 Elwood JC, Lin YC, Cristofalo VJ, Wienhouse S &
Morris HP (1963) Glucose utilization in homogenates
of the Morris hepatoma 5123 and related tumors.
Cancer Res 23, 906–913.
Glycolytic and mitochondrial metabolism of tumor cells R. Moreno-Sanchez et al.
1418 FEBS Journal 274 (2007) 1393–1418 ª 2007 The Authors Journal compilation ª 2007 FEBS

Related Documents


![Cancer Metabolism - MDPI · 2019. 2. 13. · Cancer Metabolism Charlotte Domblides 1,2, ... lipids, proteins and nucleic acids [5]. 2. Metabolism of Tumor Cells Tumor cells modify](https://static.cupdf.com/doc/110x72/60fa278848cf54668f113ed7/cancer-metabolism-mdpi-2019-2-13-cancer-metabolism-charlotte-domblides-12.jpg)