Retinal neurodegeneration may precede microvascular changes characteristic of diabetic retinopathy in diabetes mellitus Elliott H. Sohn a,1 , Hille W. van Dijk b,1 , Chunhua Jiao a , Pauline H. B. Kok b , Woojin Jeong a , Nazli Demirkaya b , Allison Garmager a , Ferdinand Wit c , Murat Kucukevcilioglu a , Mirjam E. J. van Velthoven d , J. Hans DeVries e , Robert F. Mullins a , Markus H. Kuehn a , Reinier Otto Schlingemann b , Milan Sonka f,g , Frank D. Verbraak b,h , and Michael David Abràmoff a,f,g,i,j,2 a Stephen A. Wynn Institute for Vision Research, Department of Ophthalmology, University of Iowa, Iowa City, IA 52242; b Department of Ophthalmology, Academic Medical Center, University of Amsterdam, 1105 AZ Amsterdam, The Netherlands; c Department of Global Health, Academic Medical Center, University of Amsterdam, 1105 AZ Amsterdam, The Netherlands; d Oogziekenhuis Rotterdam, 3011 BH Rotterdam, The Netherlands; e Department of Endocrinology, Academic Medical Center, University of Amsterdam, 1105 AZ Amsterdam, The Netherlands; f Iowa Institute for Biomedical Imaging, University of Iowa, Iowa City, IA 52242; g Department of Electrical and Computer Engineering, University of Iowa, Iowa City, IA 52242; h Department of Biomedical Engineering and Physics, Academic Medical Center, University of Amsterdam, 1105 AZ Amsterdam, The Netherlands; i Iowa City VA Health Care System, Iowa City, IA 52246; and j Department of Biomedical Engineering, University of Iowa, Iowa City, IA 52242 Edited by Artur V. Cideciyan, University of Pennsylvania, Philadelphia, PA, and accepted by the Editorial Board March 23, 2016 (received for review December 17, 2015) Diabetic retinopathy (DR) has long been recognized as a micro- vasculopathy, but retinal diabetic neuropathy (RDN), characterized by inner retinal neurodegeneration, also occurs in people with diabetes mellitus (DM). We report that in 45 people with DM and no to minimal DR there was significant, progressive loss of the nerve fiber layer (NFL) (0.25 μm/y) and the ganglion cell (GC)/inner plexiform layer (0.29 μm/y) on optical coherence tomography anal- ysis (OCT) over a 4-y period, independent of glycated hemoglobin, age, and sex. The NFL was significantly thinner (17.3 μm) in the eyes of six donors with DM than in the eyes of six similarly aged control donors (30.4 μm), although retinal capillary density did not differ in the two groups. We confirmed significant, progressive inner retinal thinning in streptozotocin-induced “type 1” and B6.BKS(D)-Lepr db /J “type 2” diabetic mouse models on OCT; immu- nohistochemistry in type 1 mice showed GC loss but no difference in pericyte density or acellular capillaries. The results suggest that RDN may precede the established clinical and morphometric vas- cular changes caused by DM and represent a paradigm shift in our understanding of ocular diabetic complications. diabetes | retina | neurodegeneration | diabetic retinopathy | optical coherence tomography D iabetic retinopathy (DR), the most common cause of irre- versible blindness in working-age adults, results in central vision loss caused by microvascular damage to the inner lining of the back of the eye known as the retina (1). Diabetes mellitus (DM) is accompanied by retinal diabetic neuropathy (RDN), i.e., inner neuroretinal degeneration; this neuropathy is observed structurally, as neural apoptosis, ganglion cell (GC) loss, reactive gliosis, and thinning of the inner retina; and functionally, as def- icits in the electroretinogram (ERG), dark adaptation, contrast sensitivity, color vision, and microperimetric and perimetric psy- chophysical testing (2–5). Because the neuroretina forms an ex- tension of the brain embryologically, functional retinal changes may correlate with the cognitive decline in people with DM (6). Studies have shown that local functional loss on pattern ERG, which measures GC function, predicts local microvasculopathy and macular edema 1 y later (7). Pericyte loss is defined as the earliest detectable microvascular marker of DR in the retina (8), whereas microaneurysms on funduscopy or fundus photographs are defined as the first marker of clinically manifest DR (9). So- called “preclinical diabetic retinopathy” comprises additional vascular abnormalities such as acellular capillaries (10–14). Although ample evidence suggests that retinal damage, in- cluding clinically detectable DR and macular edema, results from microvascular abnormalities, the relationship between RDN and microvascular damage is unclear. Most assume that RDN is a secondary effect of microvascular damage, but mounting evidence shows that neuroretinal alterations are present even in the absence of clinically detectable retinal vasculopathy, i.e., DR, both in do- nor eyes of people with DM and on retinal optical coherence tomography (OCT) image analysis (4, 14– 18). However, these studies were unable to show the temporal relationship between Significance Diabetic retinopathy (DR), a primary cause of blindness, is characterized by microvascular abnormalities. Recent evidence suggests that retinal diabetic neuropathy (RDN) also occurs in people with diabetes, but little is known about the temporal relationship between DR and RDN. This longitudinal study in people with diabetes with no or minimal DR shows that RDN precedes signs of microvasculopathy and that RDN is pro- gressive and independent of glycated hemoglobin, age, and sex. This finding was further confirmed in human donor eyes and in two experimental mouse models of diabetes. The results suggest that RDN is not ischemic in origin and represent a shift in our understanding of the pathophysiology of this compli- cation of diabetes that potentially affects vision in all people with diabetes mellitus. Author contributions: E.H.S., H.W.v.D., C.J., J.H.D., R.O.S., F.D.V., and M.D.A. designed research; E.H.S., H.W.v.D., C.J., P.H.B.K., W.J., N.D., A.G., F.W., M.K., M.E.J.v.V., J.H.D., R.F.M., M.H.K., R.O.S., F.D.V., and M.D.A. performed research; M.S. and M.D.A. contrib- uted new reagents/analytic tools; E.H.S., C.J., F.W., F.D.V., and M.D.A. analyzed data; E.H.S., H.W.v.D., F.D.V., and M.D.A. wrote the paper; H.W.v.D., C.J., P.H.B.K., W.J., N.D., A.G., M.K., M.E.J.v.V., R.F.M., M.H.K., F.D.V., and M.D.A. managed data acquisition; and E.H.S., C.J., F.W., R.F.M., M.H.K., R.O.S., M.S., F.D.V., and M.D.A. provided administrative, technical, or material support. Conflict of interest statement: M.D.A. has direct equity ownership of and receives income from IDx LLC, a company that has licensed inventions from the University of Iowa, on which the Iowa Reference Algorithms used in this study are based. M.D.A. and M.S. are inventors on patents assigned to the University of Iowa and licensed by IDx LLC. This article is a PNAS Direct Submission. A.V.C. is a guest editor invited by the Editorial Board. The Iowa Reference Algorithms used for automated analysis of the human and mouse OCT data are freely available to all researchers in the public domain at www.iibi.uiowa.edu/ content/shared-software-download/. Underlying data are available from M.D.A. (michael- [email protected]) on request. 1 E.H.S. and H.W.v.D. contributed equally to this work. 2 To whom correspondence should be addressed. Email: [email protected]. This article contains supporting information online at www.pnas.org/lookup/suppl/doi:10. 1073/pnas.1522014113/-/DCSupplemental. www.pnas.org/cgi/doi/10.1073/pnas.1522014113 PNAS Early Edition | 1 of 10 MEDICAL SCIENCES PNAS PLUS

Welcome message from author
This document is posted to help you gain knowledge. Please leave a comment to let me know what you think about it! Share it to your friends and learn new things together.
Transcript
Retinal neurodegeneration may precede microvascularchanges characteristic of diabetic retinopathy indiabetes mellitusElliott H. Sohna,1, Hille W. van Dijkb,1, Chunhua Jiaoa, Pauline H. B. Kokb, Woojin Jeonga, Nazli Demirkayab,Allison Garmagera, Ferdinand Witc, Murat Kucukevcilioglua, Mirjam E. J. van Velthovend, J. Hans DeVriese,Robert F. Mullinsa, Markus H. Kuehna, Reinier Otto Schlingemannb, Milan Sonkaf,g, Frank D. Verbraakb,h,and Michael David Abràmoffa,f,g,i,j,2
aStephen A. Wynn Institute for Vision Research, Department of Ophthalmology, University of Iowa, Iowa City, IA 52242; bDepartment of Ophthalmology,Academic Medical Center, University of Amsterdam, 1105 AZ Amsterdam, The Netherlands; cDepartment of Global Health, Academic Medical Center,University of Amsterdam, 1105 AZ Amsterdam, The Netherlands; dOogziekenhuis Rotterdam, 3011 BH Rotterdam, The Netherlands; eDepartment ofEndocrinology, Academic Medical Center, University of Amsterdam, 1105 AZ Amsterdam, The Netherlands; fIowa Institute for Biomedical Imaging,University of Iowa, Iowa City, IA 52242; gDepartment of Electrical and Computer Engineering, University of Iowa, Iowa City, IA 52242; hDepartment ofBiomedical Engineering and Physics, Academic Medical Center, University of Amsterdam, 1105 AZ Amsterdam, The Netherlands; iIowa City VA Health CareSystem, Iowa City, IA 52246; and jDepartment of Biomedical Engineering, University of Iowa, Iowa City, IA 52242
Edited by Artur V. Cideciyan, University of Pennsylvania, Philadelphia, PA, and accepted by the Editorial Board March 23, 2016 (received for review December17, 2015)
Diabetic retinopathy (DR) has long been recognized as a micro-vasculopathy, but retinal diabetic neuropathy (RDN), characterizedby inner retinal neurodegeneration, also occurs in people withdiabetes mellitus (DM). We report that in 45 people with DM andno to minimal DR there was significant, progressive loss of thenerve fiber layer (NFL) (0.25 μm/y) and the ganglion cell (GC)/innerplexiform layer (0.29 μm/y) on optical coherence tomography anal-ysis (OCT) over a 4-y period, independent of glycated hemoglobin,age, and sex. The NFL was significantly thinner (17.3 μm) in theeyes of six donors with DM than in the eyes of six similarly agedcontrol donors (30.4 μm), although retinal capillary density did notdiffer in the two groups. We confirmed significant, progressiveinner retinal thinning in streptozotocin-induced “type 1” andB6.BKS(D)-Leprdb/J “type 2” diabetic mouse models on OCT; immu-nohistochemistry in type 1 mice showed GC loss but no differencein pericyte density or acellular capillaries. The results suggest thatRDN may precede the established clinical and morphometric vas-cular changes caused by DM and represent a paradigm shift in ourunderstanding of ocular diabetic complications.
diabetes | retina | neurodegeneration | diabetic retinopathy |optical coherence tomography
Diabetic retinopathy (DR), the most common cause of irre-versible blindness in working-age adults, results in central
vision loss caused by microvascular damage to the inner lining ofthe back of the eye known as the retina (1). Diabetes mellitus(DM) is accompanied by retinal diabetic neuropathy (RDN), i.e.,inner neuroretinal degeneration; this neuropathy is observedstructurally, as neural apoptosis, ganglion cell (GC) loss, reactivegliosis, and thinning of the inner retina; and functionally, as def-icits in the electroretinogram (ERG), dark adaptation, contrastsensitivity, color vision, and microperimetric and perimetric psy-chophysical testing (2–5). Because the neuroretina forms an ex-tension of the brain embryologically, functional retinal changesmay correlate with the cognitive decline in people with DM (6).Studies have shown that local functional loss on pattern ERG,which measures GC function, predicts local microvasculopathyand macular edema 1 y later (7). Pericyte loss is defined as theearliest detectable microvascular marker of DR in the retina (8),whereas microaneurysms on funduscopy or fundus photographsare defined as the first marker of clinically manifest DR (9). So-called “preclinical diabetic retinopathy” comprises additionalvascular abnormalities such as acellular capillaries (10–14).Although ample evidence suggests that retinal damage, in-
cluding clinically detectable DR and macular edema, results from
microvascular abnormalities, the relationship between RDN andmicrovascular damage is unclear. Most assume that RDN is asecondary effect of microvascular damage, but mounting evidenceshows that neuroretinal alterations are present even in the absenceof clinically detectable retinal vasculopathy, i.e., DR, both in do-nor eyes of people with DM and on retinal optical coherencetomography (OCT) image analysis (4, 14–18). However, thesestudies were unable to show the temporal relationship between
Significance
Diabetic retinopathy (DR), a primary cause of blindness, ischaracterized by microvascular abnormalities. Recent evidencesuggests that retinal diabetic neuropathy (RDN) also occurs inpeople with diabetes, but little is known about the temporalrelationship between DR and RDN. This longitudinal study inpeople with diabetes with no or minimal DR shows that RDNprecedes signs of microvasculopathy and that RDN is pro-gressive and independent of glycated hemoglobin, age, andsex. This finding was further confirmed in human donor eyesand in two experimental mouse models of diabetes. The resultssuggest that RDN is not ischemic in origin and represent a shiftin our understanding of the pathophysiology of this compli-cation of diabetes that potentially affects vision in all peoplewith diabetes mellitus.
Author contributions: E.H.S., H.W.v.D., C.J., J.H.D., R.O.S., F.D.V., and M.D.A. designedresearch; E.H.S., H.W.v.D., C.J., P.H.B.K., W.J., N.D., A.G., F.W., M.K., M.E.J.v.V., J.H.D.,R.F.M., M.H.K., R.O.S., F.D.V., and M.D.A. performed research; M.S. and M.D.A. contrib-uted new reagents/analytic tools; E.H.S., C.J., F.W., F.D.V., and M.D.A. analyzed data; E.H.S.,H.W.v.D., F.D.V., and M.D.A. wrote the paper; H.W.v.D., C.J., P.H.B.K., W.J., N.D., A.G., M.K.,M.E.J.v.V., R.F.M., M.H.K., F.D.V., and M.D.A. managed data acquisition; and E.H.S., C.J.,F.W., R.F.M., M.H.K., R.O.S., M.S., F.D.V., and M.D.A. provided administrative, technical, ormaterial support.
Conflict of interest statement: M.D.A. has direct equity ownership of and receives incomefrom IDx LLC, a company that has licensed inventions from the University of Iowa, onwhich the Iowa Reference Algorithms used in this study are based. M.D.A. and M.S. areinventors on patents assigned to the University of Iowa and licensed by IDx LLC.
This article is a PNAS Direct Submission. A.V.C. is a guest editor invited by the EditorialBoard.
The Iowa Reference Algorithms used for automated analysis of the human and mouse OCTdata are freely available to all researchers in the public domain at www.iibi.uiowa.edu/content/shared-software-download/. Underlying data are available from M.D.A. ([email protected]) on request.1E.H.S. and H.W.v.D. contributed equally to this work.2To whom correspondence should be addressed. Email: [email protected].
This article contains supporting information online at www.pnas.org/lookup/suppl/doi:10.1073/pnas.1522014113/-/DCSupplemental.
www.pnas.org/cgi/doi/10.1073/pnas.1522014113 PNAS Early Edition | 1 of 10
MED
ICALSC
IENCE
SPN
ASPL
US
RDN and vasculopathy (19, 20). The purpose of this study was todetermine the time course of inner retinal neurodegeneration inrelation to microvasculopathy in people with DM with no orminimal clinically detectable microvascular DR and to de-termine whether these findings are further supported by exper-imental murine models of DM.
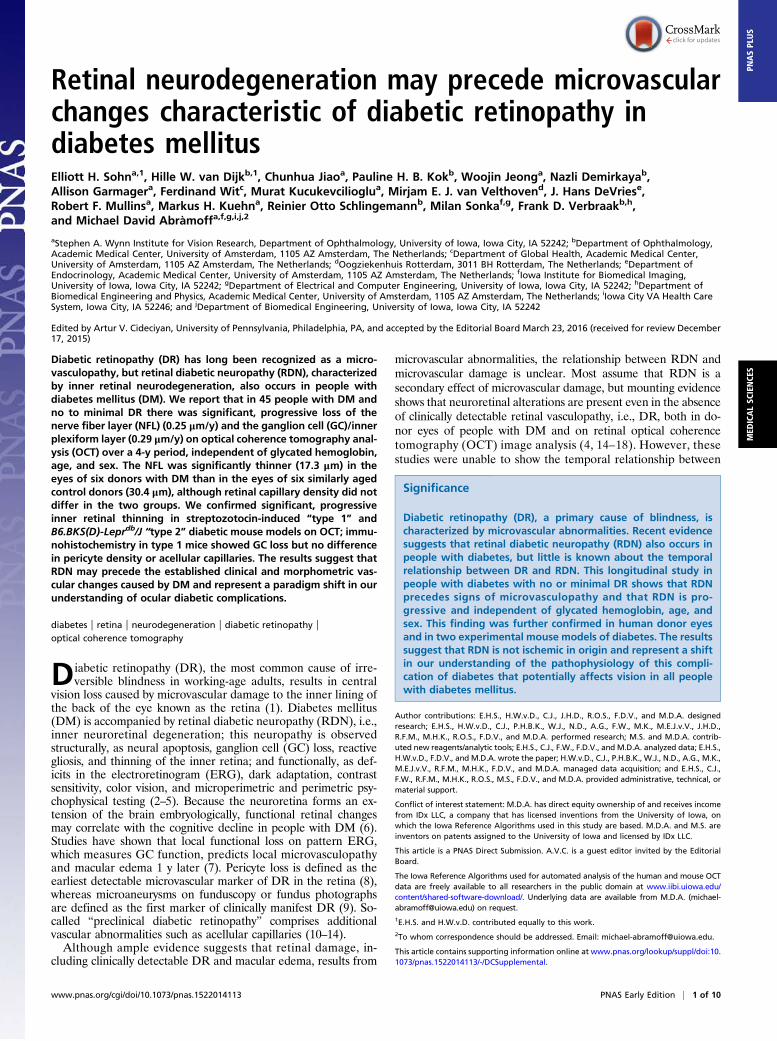
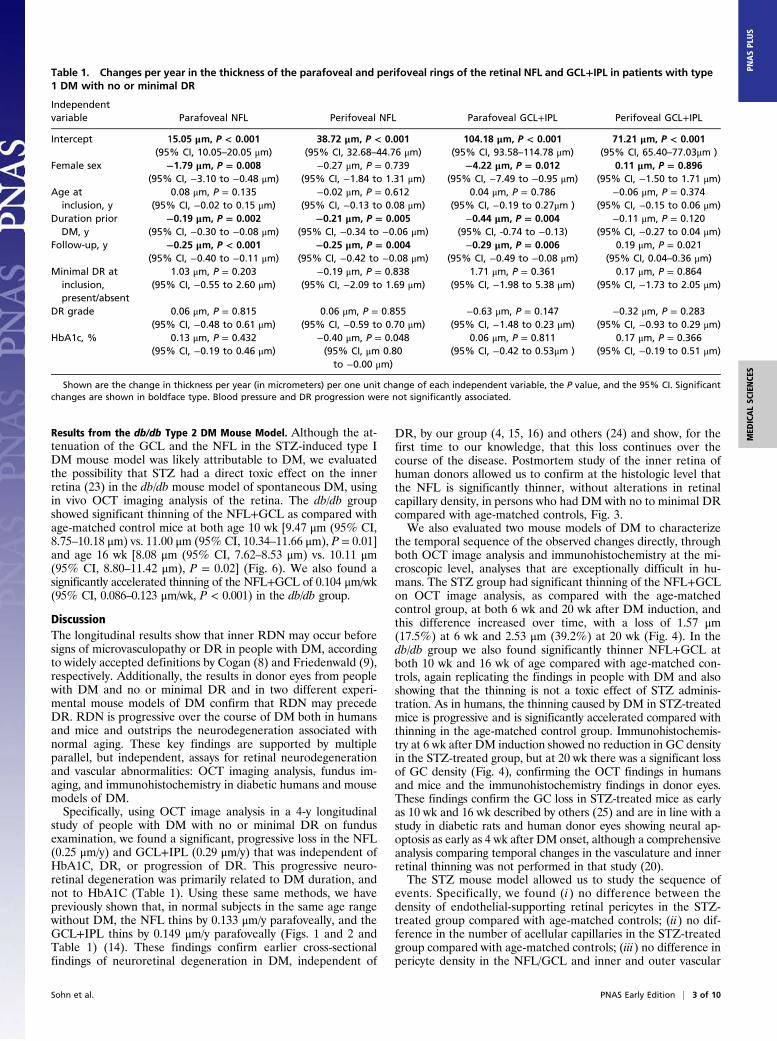
ResultsLongitudinal Human Study. Forty-five patients with type 1 DM(mean age 31 ± 10 y) were enrolled in this prospective, longi-tudinal study. At baseline, 21 patients had no DR, and 24 pa-tients showed minimal DR. None of the patients had a centralsubfield retinal thickness over 250 μm, which is the cutoff fordiabetic macular edema in the Diabetic Retinopathy ClinicalResearch Network studies for time-domain OCT (21). Duringfollow-up, 18 patients demonstrated progression of DR. Themean glycated hemoglobin (HbA1c) at baseline was 8.2% (SD1.2%). There were no statistically significant changes in meanHbA1c, blood pressure, or best corrected visual acuity (BCVA)during the four study visits. The median follow-up time was 73.0 mo(range, 37–79 mo; interquartile range, 57.5–80 mo). Six patientsskipped intermediary visits, and 10 were lost to follow-up because ofmigration (Table S1).The thickness of the inner retinal layers of the macula —the
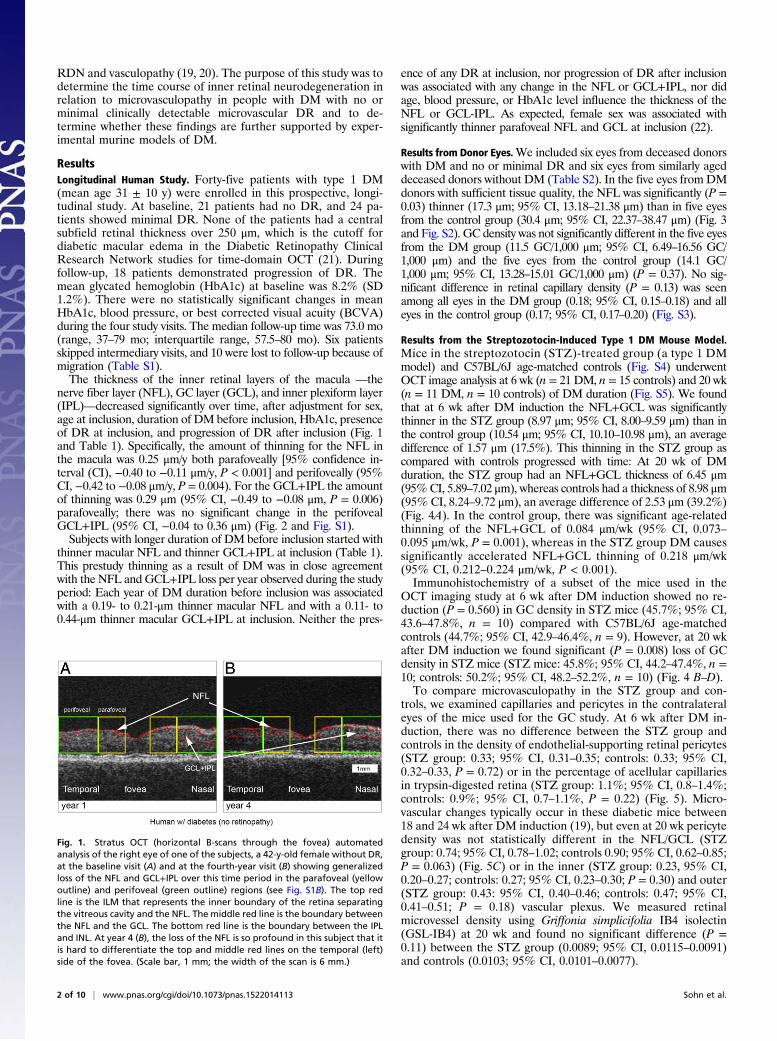
nerve fiber layer (NFL), GC layer (GCL), and inner plexiform layer(IPL)—decreased significantly over time, after adjustment for sex,age at inclusion, duration of DM before inclusion, HbA1c, presenceof DR at inclusion, and progression of DR after inclusion (Fig. 1and Table 1). Specifically, the amount of thinning for the NFL inthe macula was 0.25 μm/y both parafoveally [95% confidence in-terval (CI), −0.40 to −0.11 μm/y, P < 0.001] and perifoveally (95%CI, −0.42 to −0.08 μm/y, P = 0.004). For the GCL+IPL the amountof thinning was 0.29 μm (95% CI, −0.49 to −0.08 μm, P = 0.006)parafoveally; there was no significant change in the perifovealGCL+IPL (95% CI, −0.04 to 0.36 μm) (Fig. 2 and Fig. S1).Subjects with longer duration of DM before inclusion started with
thinner macular NFL and thinner GCL+IPL at inclusion (Table 1).This prestudy thinning as a result of DM was in close agreementwith the NFL and GCL+IPL loss per year observed during the studyperiod: Each year of DM duration before inclusion was associatedwith a 0.19- to 0.21-μm thinner macular NFL and with a 0.11- to0.44-μm thinner macular GCL+IPL at inclusion. Neither the pres-
ence of any DR at inclusion, nor progression of DR after inclusionwas associated with any change in the NFL or GCL+IPL, nor didage, blood pressure, or HbA1c level influence the thickness of theNFL or GCL-IPL. As expected, female sex was associated withsignificantly thinner parafoveal NFL and GCL at inclusion (22).
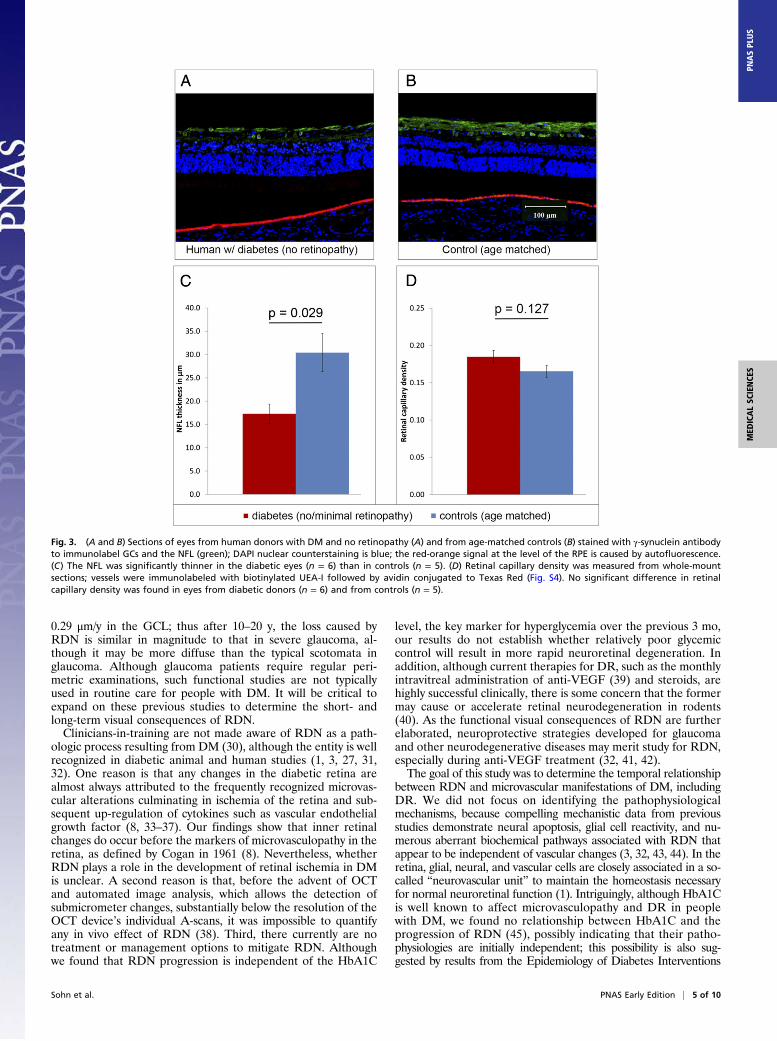
Results from Donor Eyes.We included six eyes from deceased donorswith DM and no or minimal DR and six eyes from similarly ageddeceased donors without DM (Table S2). In the five eyes from DMdonors with sufficient tissue quality, the NFL was significantly (P =0.03) thinner (17.3 μm; 95% CI, 13.18–21.38 μm) than in five eyesfrom the control group (30.4 μm; 95% CI, 22.37–38.47 μm) (Fig. 3and Fig. S2). GC density was not significantly different in the five eyesfrom the DM group (11.5 GC/1,000 μm; 95% CI, 6.49–16.56 GC/1,000 μm) and the five eyes from the control group (14.1 GC/1,000 μm; 95% CI, 13.28–15.01 GC/1,000 μm) (P = 0.37). No sig-nificant difference in retinal capillary density (P = 0.13) was seenamong all eyes in the DM group (0.18; 95% CI, 0.15–0.18) and alleyes in the control group (0.17; 95% CI, 0.17–0.20) (Fig. S3).
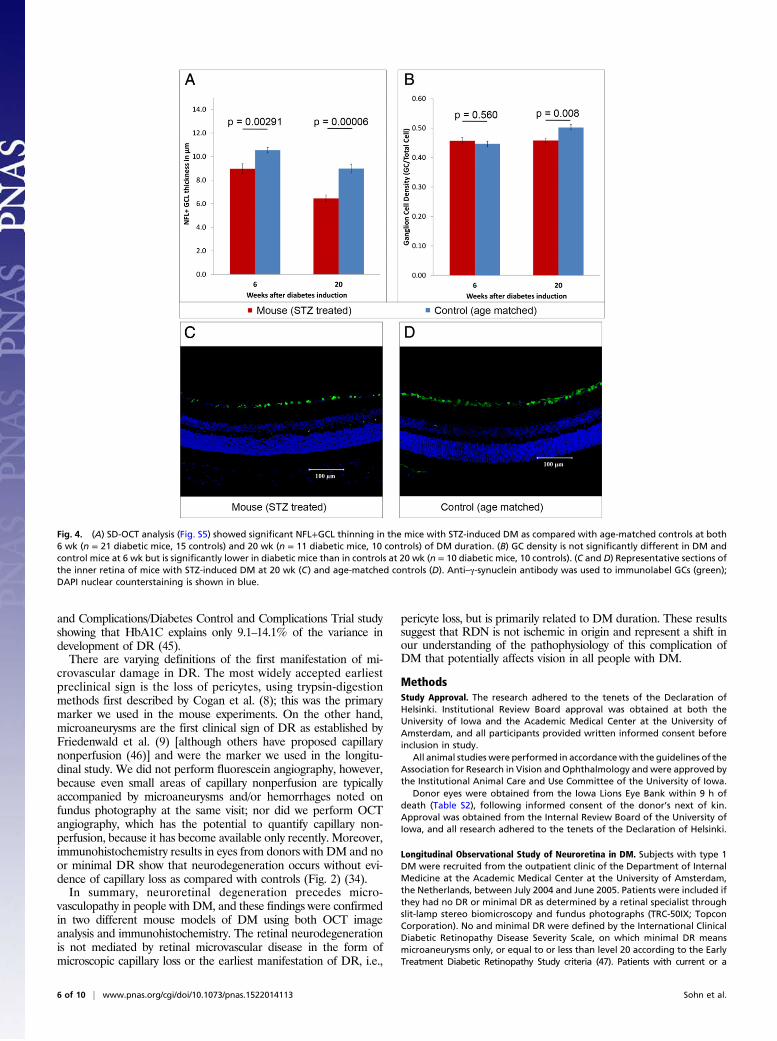
Results from the Streptozotocin-Induced Type 1 DM Mouse Model.Mice in the streptozotocin (STZ)-treated group (a type 1 DMmodel) and C57BL/6J age-matched controls (Fig. S4) underwentOCT image analysis at 6 wk (n = 21 DM, n = 15 controls) and 20 wk(n = 11 DM, n = 10 controls) of DM duration (Fig. S5). We foundthat at 6 wk after DM induction the NFL+GCL was significantlythinner in the STZ group (8.97 μm; 95% CI, 8.00–9.59 μm) than inthe control group (10.54 μm; 95% CI, 10.10–10.98 μm), an averagedifference of 1.57 μm (17.5%). This thinning in the STZ group ascompared with controls progressed with time: At 20 wk of DMduration, the STZ group had an NFL+GCL thickness of 6.45 μm(95%CI, 5.89–7.02 μm), whereas controls had a thickness of 8.98 μm(95% CI, 8.24–9.72 μm), an average difference of 2.53 μm (39.2%)(Fig. 4A). In the control group, there was significant age-relatedthinning of the NFL+GCL of 0.084 μm/wk (95% CI, 0.073–0.095 μm/wk, P = 0.001), whereas in the STZ group DM causessignificantly accelerated NFL+GCL thinning of 0.218 μm/wk(95% CI, 0.212–0.224 μm/wk, P < 0.001).Immunohistochemistry of a subset of the mice used in the
OCT imaging study at 6 wk after DM induction showed no re-duction (P = 0.560) in GC density in STZ mice (45.7%; 95% CI,43.6–47.8%, n = 10) compared with C57BL/6J age-matchedcontrols (44.7%; 95% CI, 42.9–46.4%, n = 9). However, at 20 wkafter DM induction we found significant (P = 0.008) loss of GCdensity in STZ mice (STZ mice: 45.8%; 95% CI, 44.2–47.4%, n =10; controls: 50.2%; 95% CI, 48.2–52.2%, n = 10) (Fig. 4 B–D).To compare microvasculopathy in the STZ group and con-
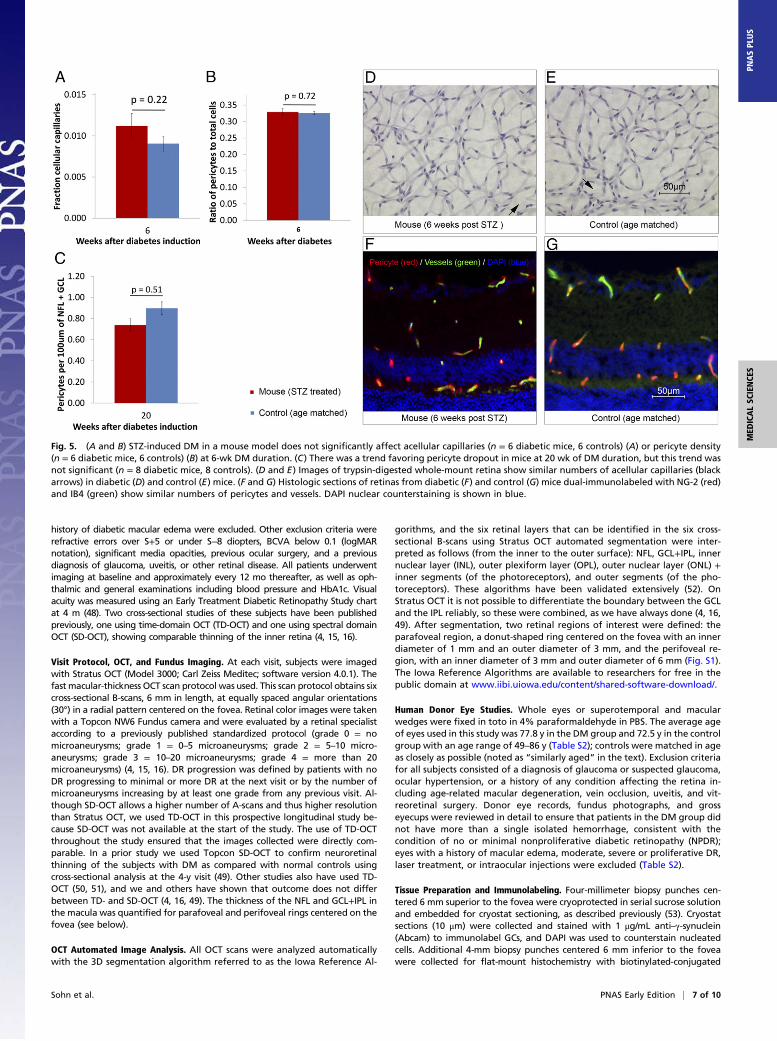
trols, we examined capillaries and pericytes in the contralateraleyes of the mice used for the GC study. At 6 wk after DM in-duction, there was no difference between the STZ group andcontrols in the density of endothelial-supporting retinal pericytes(STZ group: 0.33; 95% CI, 0.31–0.35; controls: 0.33; 95% CI,0.32–0.33, P = 0.72) or in the percentage of acellular capillariesin trypsin-digested retina (STZ group: 1.1%; 95% CI, 0.8–1.4%;controls: 0.9%; 95% CI, 0.7–1.1%, P = 0.22) (Fig. 5). Micro-vascular changes typically occur in these diabetic mice between18 and 24 wk after DM induction (19), but even at 20 wk pericytedensity was not statistically different in the NFL/GCL (STZgroup: 0.74; 95% CI, 0.78–1.02; controls 0.90; 95% CI, 0.62–0.85;P = 0.063) (Fig. 5C) or in the inner (STZ group: 0.23, 95% CI,0.20–0.27; controls: 0.27; 95% CI, 0.23–0.30; P = 0.30) and outer(STZ group: 0.43: 95% CI, 0.40–0.46; controls: 0.47; 95% CI,0.41–0.51; P = 0.18) vascular plexus. We measured retinalmicrovessel density using Griffonia simplicifolia IB4 isolectin(GSL-IB4) at 20 wk and found no significant difference (P =0.11) between the STZ group (0.0089; 95% CI, 0.0115–0.0091)and controls (0.0103; 95% CI, 0.0101–0.0077).
Fig. 1. Stratus OCT (horizontal B-scans through the fovea) automatedanalysis of the right eye of one of the subjects, a 42-y-old female without DR,at the baseline visit (A) and at the fourth-year visit (B) showing generalizedloss of the NFL and GCL+IPL over this time period in the parafoveal (yellowoutline) and perifoveal (green outline) regions (see Fig. S1B). The top redline is the ILM that represents the inner boundary of the retina separatingthe vitreous cavity and the NFL. The middle red line is the boundary betweenthe NFL and the GCL. The bottom red line is the boundary between the IPLand INL. At year 4 (B), the loss of the NFL is so profound in this subject that itis hard to differentiate the top and middle red lines on the temporal (left)side of the fovea. (Scale bar, 1 mm; the width of the scan is 6 mm.)
2 of 10 | www.pnas.org/cgi/doi/10.1073/pnas.1522014113 Sohn et al.
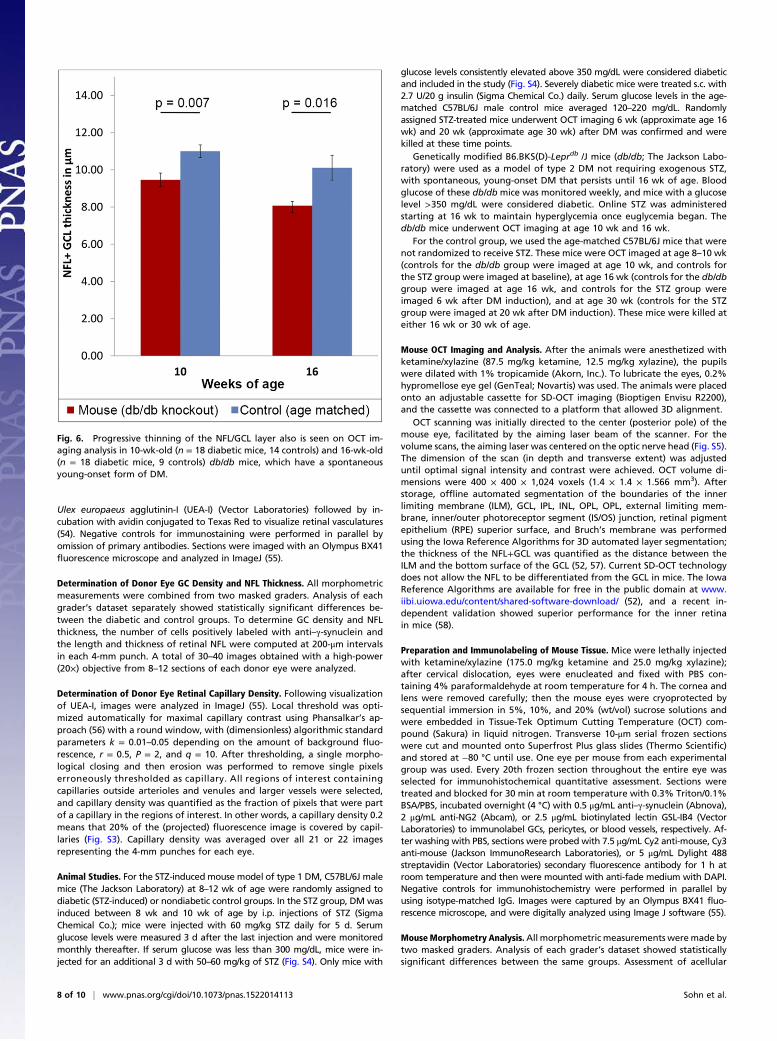
Results from the db/db Type 2 DM Mouse Model. Although the at-tenuation of the GCL and the NFL in the STZ-induced type IDM mouse model was likely attributable to DM, we evaluatedthe possibility that STZ had a direct toxic effect on the innerretina (23) in the db/db mouse model of spontaneous DM, usingin vivo OCT imaging analysis of the retina. The db/db groupshowed significant thinning of the NFL+GCL as compared withage-matched control mice at both age 10 wk [9.47 μm (95% CI,8.75–10.18 μm) vs. 11.00 μm (95% CI, 10.34–11.66 μm), P = 0.01]and age 16 wk [8.08 μm (95% CI, 7.62–8.53 μm) vs. 10.11 μm(95% CI, 8.80–11.42 μm), P = 0.02] (Fig. 6). We also found asignificantly accelerated thinning of the NFL+GCL of 0.104 μm/wk(95% CI, 0.086–0.123 μm/wk, P < 0.001) in the db/db group.
DiscussionThe longitudinal results show that inner RDN may occur beforesigns of microvasculopathy or DR in people with DM, accordingto widely accepted definitions by Cogan (8) and Friedenwald (9),respectively. Additionally, the results in donor eyes from peoplewith DM and no or minimal DR and in two different experi-mental mouse models of DM confirm that RDN may precedeDR. RDN is progressive over the course of DM both in humansand mice and outstrips the neurodegeneration associated withnormal aging. These key findings are supported by multipleparallel, but independent, assays for retinal neurodegenerationand vascular abnormalities: OCT imaging analysis, fundus im-aging, and immunohistochemistry in diabetic humans and mousemodels of DM.Specifically, using OCT image analysis in a 4-y longitudinal
study of people with DM with no or minimal DR on fundusexamination, we found a significant, progressive loss in the NFL(0.25 μm/y) and GCL+IPL (0.29 μm/y) that was independent ofHbA1C, DR, or progression of DR. This progressive neuro-retinal degeneration was primarily related to DM duration, andnot to HbA1C (Table 1). Using these same methods, we havepreviously shown that, in normal subjects in the same age rangewithout DM, the NFL thins by 0.133 μm/y parafoveally, and theGCL+IPL thins by 0.149 μm/y parafoveally (Figs. 1 and 2 andTable 1) (14). These findings confirm earlier cross-sectionalfindings of neuroretinal degeneration in DM, independent of
DR, by our group (4, 15, 16) and others (24) and show, for thefirst time to our knowledge, that this loss continues over thecourse of the disease. Postmortem study of the inner retina ofhuman donors allowed us to confirm at the histologic level thatthe NFL is significantly thinner, without alterations in retinalcapillary density, in persons who had DM with no to minimal DRcompared with age-matched controls, Fig. 3.We also evaluated two mouse models of DM to characterize
the temporal sequence of the observed changes directly, throughboth OCT image analysis and immunohistochemistry at the mi-croscopic level, analyses that are exceptionally difficult in hu-mans. The STZ group had significant thinning of the NFL+GCLon OCT image analysis, as compared with the age-matchedcontrol group, at both 6 wk and 20 wk after DM induction, andthis difference increased over time, with a loss of 1.57 μm(17.5%) at 6 wk and 2.53 μm (39.2%) at 20 wk (Fig. 4). In thedb/db group we also found significantly thinner NFL+GCL atboth 10 wk and 16 wk of age compared with age-matched con-trols, again replicating the findings in people with DM and alsoshowing that the thinning is not a toxic effect of STZ adminis-tration. As in humans, the thinning caused by DM in STZ-treatedmice is progressive and is significantly accelerated compared withthinning in the age-matched control group. Immunohistochemis-try at 6 wk after DM induction showed no reduction in GC densityin the STZ-treated group, but at 20 wk there was a significant lossof GC density (Fig. 4), confirming the OCT findings in humansand mice and the immunohistochemistry findings in donor eyes.These findings confirm the GC loss in STZ-treated mice as earlyas 10 wk and 16 wk described by others (25) and are in line with astudy in diabetic rats and human donor eyes showing neural ap-optosis as early as 4 wk after DM onset, although a comprehensiveanalysis comparing temporal changes in the vasculature and innerretinal thinning was not performed in that study (20).The STZ mouse model allowed us to study the sequence of
events. Specifically, we found (i) no difference between thedensity of endothelial-supporting retinal pericytes in the STZ-treated group compared with age-matched controls; (ii) no dif-ference in the number of acellular capillaries in the STZ-treatedgroup compared with age-matched controls; (iii) no difference inpericyte density in the NFL/GCL and inner and outer vascular
Table 1. Changes per year in the thickness of the parafoveal and perifoveal rings of the retinal NFL and GCL+IPL in patients with type1 DM with no or minimal DR
Independentvariable Parafoveal NFL Perifoveal NFL Parafoveal GCL+IPL Perifoveal GCL+IPL
Intercept 15.05 μm, P < 0.001(95% CI, 10.05–20.05 μm)
38.72 μm, P < 0.001(95% CI, 32.68–44.76 μm)
104.18 μm, P < 0.001(95% CI, 93.58–114.78 μm)
71.21 μm, P < 0.001(95% CI, 65.40–77.03μm )
Female sex −1.79 μm, P = 0.008(95% CI, −3.10 to −0.48 μm)
−0.27 μm, P = 0.739(95% CI, −1.84 to 1.31 μm)
−4.22 μm, P = 0.012(95% CI, −7.49 to −0.95 μm)
0.11 μm, P = 0.896(95% CI, −1.50 to 1.71 μm)
Age atinclusion, y
0.08 μm, P = 0.135(95% CI, −0.02 to 0.15 μm)
−0.02 μm, P = 0.612(95% CI, −0.13 to 0.08 μm)
0.04 μm, P = 0.786(95% CI, −0.19 to 0.27μm )
−0.06 μm, P = 0.374(95% CI, −0.15 to 0.06 μm)
Duration priorDM, y
−0.19 μm, P = 0.002(95% CI, −0.30 to −0.08 μm)
−0.21 μm, P = 0.005(95% CI, −0.34 to −0.06 μm)
−0.44 μm, P = 0.004(95% CI, -0.74 to −0.13)
−0.11 μm, P = 0.120(95% CI, −0.27 to 0.04 μm)
Follow-up, y −0.25 μm, P < 0.001(95% CI, −0.40 to −0.11 μm)
−0.25 μm, P = 0.004(95% CI, −0.42 to −0.08 μm)
−0.29 μm, P = 0.006(95% CI, −0.49 to −0.08 μm)
0.19 μm, P = 0.021(95% CI, 0.04–0.36 μm)
Minimal DR atinclusion,present/absent
1.03 μm, P = 0.203(95% CI, −0.55 to 2.60 μm)
−0.19 μm, P = 0.838(95% CI, −2.09 to 1.69 μm)
1.71 μm, P = 0.361(95% CI, −1.98 to 5.38 μm)
0.17 μm, P = 0.864(95% CI, −1.73 to 2.05 μm)
DR grade 0.06 μm, P = 0.815(95% CI, −0.48 to 0.61 μm)
0.06 μm, P = 0.855(95% CI, −0.59 to 0.70 μm)
−0.63 μm, P = 0.147(95% CI, −1.48 to 0.23 μm)
−0.32 μm, P = 0.283(95% CI, −0.93 to 0.29 μm)
HbA1c, % 0.13 μm, P = 0.432(95% CI, −0.19 to 0.46 μm)
−0.40 μm, P = 0.048(95% CI, μm 0.80to −0.00 μm)
0.06 μm, P = 0.811(95% CI, −0.42 to 0.53μm )
0.17 μm, P = 0.366(95% CI, −0.19 to 0.51 μm)
Shown are the change in thickness per year (in micrometers) per one unit change of each independent variable, the P value, and the 95% CI. Significantchanges are shown in boldface type. Blood pressure and DR progression were not significantly associated.
Sohn et al. PNAS Early Edition | 3 of 10
MED
ICALSC
IENCE
SPN
ASPL
US
plexus (Fig. 4); and (iv) no difference using the vessel stain IB4 at20 wk; all confirming that there were no differences in the vas-culature of the STZ-treated mice and controls. Although inhuman donor eyes we were able to determine that RDN occursin the absence of DR or capillary loss, these results in mice showthat RDN occurs before any evidence of microvascular damageas defined by Cogan (8).RDN is clinically relevant, for example affecting the visual
outcome after successful treatment of diabetic macular edema(26). Retinal neurodegeneration at the cellular and functional(ERG) level has been described previously (27) in another
mouse model of spontaneous DM. The functional consequencesof progressive RDN are not yet clear, although they have beengaining recognition (4, 5, 28). In a previous study, using the sameOCT image analysis methods, we reported a high correlation(0.68) between perimetric functional loss and RDN in peoplewith DM and no or minimal DR (4). In another recent study wefound that the difference in average thickness between patientswith early glaucoma (<6 dB perimetric loss) and those with se-vere glaucoma (>12 dB loss) is 5–8 μm for the NFL and 1–8 μmfor the GCL (29). The present results show that, on average, DMcauses a progressive loss of 0.25 μm/y in the NFL and a loss of
Fig. 2. Subjects with DM and no or minimal DR (n = 45) show significant neuroretinal thinning over time. (A–C) Observed changes in retinal layer thicknessper year, with subjects ranked (from left to right) by observed change in layer thickness over time, showing significant thinning of the parafoveal NFL (A),perifoveal NFL (B), and perifoveal GCL+IPL (C). (D) Nonsignificant changes in parafoveal GCL+IPL. All layer thicknesses were measured by Stratus OCT imaginganalysis over a 4-y study period and are demonstrated by the linear mixed regression models shown in Table 1. Each vertical bar represents the change inthickness per year in the parafoveal and perifoveal NFL and GCL+IPL regions for each subject. Dark-gray bars represent subjects without DR progression; light-gray bars represent subjects with DR progression. The solid and dotted red lines show the mean and 95% CI change in subjects in this study, respectively(model derived as in Table 1). Solid and dotted blue lines show the previously published mean and 95% CI loss, respectively, in normal control subjects (14).
4 of 10 | www.pnas.org/cgi/doi/10.1073/pnas.1522014113 Sohn et al.
0.29 μm/y in the GCL; thus after 10–20 y, the loss caused byRDN is similar in magnitude to that in severe glaucoma, al-though it may be more diffuse than the typical scotomata inglaucoma. Although glaucoma patients require regular peri-metric examinations, such functional studies are not typicallyused in routine care for people with DM. It will be critical toexpand on these previous studies to determine the short- andlong-term visual consequences of RDN.Clinicians-in-training are not made aware of RDN as a path-
ologic process resulting from DM (30), although the entity is wellrecognized in diabetic animal and human studies (1, 3, 27, 31,32). One reason is that any changes in the diabetic retina arealmost always attributed to the frequently recognized microvas-cular alterations culminating in ischemia of the retina and sub-sequent up-regulation of cytokines such as vascular endothelialgrowth factor (8, 33–37). Our findings show that inner retinalchanges do occur before the markers of microvasculopathy in theretina, as defined by Cogan in 1961 (8). Nevertheless, whetherRDN plays a role in the development of retinal ischemia in DMis unclear. A second reason is that, before the advent of OCTand automated image analysis, which allows the detection ofsubmicrometer changes, substantially below the resolution of theOCT device’s individual A-scans, it was impossible to quantifyany in vivo effect of RDN (38). Third, there currently are notreatment or management options to mitigate RDN. Althoughwe found that RDN progression is independent of the HbA1C
level, the key marker for hyperglycemia over the previous 3 mo,our results do not establish whether relatively poor glycemiccontrol will result in more rapid neuroretinal degeneration. Inaddition, although current therapies for DR, such as the monthlyintravitreal administration of anti-VEGF (39) and steroids, arehighly successful clinically, there is some concern that the formermay cause or accelerate retinal neurodegeneration in rodents(40). As the functional visual consequences of RDN are furtherelaborated, neuroprotective strategies developed for glaucomaand other neurodegenerative diseases may merit study for RDN,especially during anti-VEGF treatment (32, 41, 42).The goal of this study was to determine the temporal relationship
between RDN and microvascular manifestations of DM, includingDR. We did not focus on identifying the pathophysiologicalmechanisms, because compelling mechanistic data from previousstudies demonstrate neural apoptosis, glial cell reactivity, and nu-merous aberrant biochemical pathways associated with RDN thatappear to be independent of vascular changes (3, 32, 43, 44). In theretina, glial, neural, and vascular cells are closely associated in a so-called “neurovascular unit” to maintain the homeostasis necessaryfor normal neuroretinal function (1). Intriguingly, although HbA1Cis well known to affect microvasculopathy and DR in peoplewith DM, we found no relationship between HbA1C and theprogression of RDN (45), possibly indicating that their patho-physiologies are initially independent; this possibility is also sug-gested by results from the Epidemiology of Diabetes Interventions
Fig. 3. (A and B) Sections of eyes from human donors with DM and no retinopathy (A) and from age-matched controls (B) stained with γ-synuclein antibodyto immunolabel GCs and the NFL (green); DAPI nuclear counterstaining is blue; the red-orange signal at the level of the RPE is caused by autofluorescence.(C) The NFL was significantly thinner in the diabetic eyes (n = 6) than in controls (n = 5). (D) Retinal capillary density was measured from whole-mountsections; vessels were immunolabeled with biotinylated UEA-I followed by avidin conjugated to Texas Red (Fig. S4). No significant difference in retinalcapillary density was found in eyes from diabetic donors (n = 6) and from controls (n = 5).
Sohn et al. PNAS Early Edition | 5 of 10
MED
ICALSC
IENCE
SPN
ASPL
US
and Complications/Diabetes Control and Complications Trial studyshowing that HbA1C explains only 9.1–14.1% of the variance indevelopment of DR (45).There are varying definitions of the first manifestation of mi-
crovascular damage in DR. The most widely accepted earliestpreclinical sign is the loss of pericytes, using trypsin-digestionmethods first described by Cogan et al. (8); this was the primarymarker we used in the mouse experiments. On the other hand,microaneurysms are the first clinical sign of DR as established byFriedenwald et al. (9) [although others have proposed capillarynonperfusion (46)] and were the marker we used in the longitu-dinal study. We did not perform fluorescein angiography, however,because even small areas of capillary nonperfusion are typicallyaccompanied by microaneurysms and/or hemorrhages noted onfundus photography at the same visit; nor did we perform OCTangiography, which has the potential to quantify capillary non-perfusion, because it has become available only recently. Moreover,immunohistochemistry results in eyes from donors with DM and noor minimal DR show that neurodegeneration occurs without evi-dence of capillary loss as compared with controls (Fig. 2) (34).In summary, neuroretinal degeneration precedes micro-
vasculopathy in people with DM, and these findings were confirmedin two different mouse models of DM using both OCT imageanalysis and immunohistochemistry. The retinal neurodegenerationis not mediated by retinal microvascular disease in the form ofmicroscopic capillary loss or the earliest manifestation of DR, i.e.,
pericyte loss, but is primarily related to DM duration. These resultssuggest that RDN is not ischemic in origin and represent a shift inour understanding of the pathophysiology of this complication ofDM that potentially affects vision in all people with DM.
MethodsStudy Approval. The research adhered to the tenets of the Declaration ofHelsinki. Institutional Review Board approval was obtained at both theUniversity of Iowa and the Academic Medical Center at the University ofAmsterdam, and all participants provided written informed consent beforeinclusion in study.
All animal studies were performed in accordancewith the guidelines of theAssociation for Research in Vision and Ophthalmology and were approved bythe Institutional Animal Care and Use Committee of the University of Iowa.
Donor eyes were obtained from the Iowa Lions Eye Bank within 9 h ofdeath (Table S2), following informed consent of the donor’s next of kin.Approval was obtained from the Internal Review Board of the University ofIowa, and all research adhered to the tenets of the Declaration of Helsinki.
Longitudinal Observational Study of Neuroretina in DM. Subjects with type 1DM were recruited from the outpatient clinic of the Department of InternalMedicine at the Academic Medical Center at the University of Amsterdam,the Netherlands, between July 2004 and June 2005. Patients were included ifthey had no DR or minimal DR as determined by a retinal specialist throughslit-lamp stereo biomicroscopy and fundus photographs (TRC-50IX; TopconCorporation). No and minimal DR were defined by the International ClinicalDiabetic Retinopathy Disease Severity Scale, on which minimal DR meansmicroaneurysms only, or equal to or less than level 20 according to the EarlyTreatment Diabetic Retinopathy Study criteria (47). Patients with current or a
Fig. 4. (A) SD-OCT analysis (Fig. S5) showed significant NFL+GCL thinning in the mice with STZ-induced DM as compared with age-matched controls at both6 wk (n = 21 diabetic mice, 15 controls) and 20 wk (n = 11 diabetic mice, 10 controls) of DM duration. (B) GC density is not significantly different in DM andcontrol mice at 6 wk but is significantly lower in diabetic mice than in controls at 20 wk (n = 10 diabetic mice, 10 controls). (C and D) Representative sections ofthe inner retina of mice with STZ-induced DM at 20 wk (C) and age-matched controls (D). Anti–γ-synuclein antibody was used to immunolabel GCs (green);DAPI nuclear counterstaining is shown in blue.
6 of 10 | www.pnas.org/cgi/doi/10.1073/pnas.1522014113 Sohn et al.
history of diabetic macular edema were excluded. Other exclusion criteria wererefractive errors over S+5 or under S−8 diopters, BCVA below 0.1 (logMARnotation), significant media opacities, previous ocular surgery, and a previousdiagnosis of glaucoma, uveitis, or other retinal disease. All patients underwentimaging at baseline and approximately every 12 mo thereafter, as well as oph-thalmic and general examinations including blood pressure and HbA1c. Visualacuity was measured using an Early Treatment Diabetic Retinopathy Study chartat 4 m (48). Two cross-sectional studies of these subjects have been publishedpreviously, one using time-domain OCT (TD-OCT) and one using spectral domainOCT (SD-OCT), showing comparable thinning of the inner retina (4, 15, 16).
Visit Protocol, OCT, and Fundus Imaging. At each visit, subjects were imagedwith Stratus OCT (Model 3000; Carl Zeiss Meditec; software version 4.0.1). Thefast macular-thickness OCT scan protocol was used. This scan protocol obtains sixcross-sectional B-scans, 6 mm in length, at equally spaced angular orientations(30°) in a radial pattern centered on the fovea. Retinal color images were takenwith a Topcon NW6 Fundus camera and were evaluated by a retinal specialistaccording to a previously published standardized protocol (grade 0 = nomicroaneurysms; grade 1 = 0–5 microaneurysms; grade 2 = 5–10 micro-aneurysms; grade 3 = 10–20 microaneurysms; grade 4 = more than 20microaneurysms) (4, 15, 16). DR progression was defined by patients with noDR progressing to minimal or more DR at the next visit or by the number ofmicroaneurysms increasing by at least one grade from any previous visit. Al-though SD-OCT allows a higher number of A-scans and thus higher resolutionthan Stratus OCT, we used TD-OCT in this prospective longitudinal study be-cause SD-OCT was not available at the start of the study. The use of TD-OCTthroughout the study ensured that the images collected were directly com-parable. In a prior study we used Topcon SD-OCT to confirm neuroretinalthinning of the subjects with DM as compared with normal controls usingcross-sectional analysis at the 4-y visit (49). Other studies also have used TD-OCT (50, 51), and we and others have shown that outcome does not differbetween TD- and SD-OCT (4, 16, 49). The thickness of the NFL and GCL+IPL inthe macula was quantified for parafoveal and perifoveal rings centered on thefovea (see below).
OCT Automated Image Analysis. All OCT scans were analyzed automaticallywith the 3D segmentation algorithm referred to as the Iowa Reference Al-
gorithms, and the six retinal layers that can be identified in the six cross-sectional B-scans using Stratus OCT automated segmentation were inter-preted as follows (from the inner to the outer surface): NFL, GCL+IPL, innernuclear layer (INL), outer plexiform layer (OPL), outer nuclear layer (ONL) +inner segments (of the photoreceptors), and outer segments (of the pho-toreceptors). These algorithms have been validated extensively (52). OnStratus OCT it is not possible to differentiate the boundary between the GCLand the IPL reliably, so these were combined, as we have always done (4, 16,49). After segmentation, two retinal regions of interest were defined: theparafoveal region, a donut-shaped ring centered on the fovea with an innerdiameter of 1 mm and an outer diameter of 3 mm, and the perifoveal re-gion, with an inner diameter of 3 mm and outer diameter of 6 mm (Fig. S1).The Iowa Reference Algorithms are available to researchers for free in thepublic domain at www.iibi.uiowa.edu/content/shared-software-download/.
Human Donor Eye Studies. Whole eyes or superotemporal and macularwedges were fixed in toto in 4% paraformaldehyde in PBS. The average ageof eyes used in this study was 77.8 y in the DM group and 72.5 y in the controlgroup with an age range of 49–86 y (Table S2); controls were matched in ageas closely as possible (noted as “similarly aged” in the text). Exclusion criteriafor all subjects consisted of a diagnosis of glaucoma or suspected glaucoma,ocular hypertension, or a history of any condition affecting the retina in-cluding age-related macular degeneration, vein occlusion, uveitis, and vit-reoretinal surgery. Donor eye records, fundus photographs, and grosseyecups were reviewed in detail to ensure that patients in the DM group didnot have more than a single isolated hemorrhage, consistent with thecondition of no or minimal nonproliferative diabetic retinopathy (NPDR);eyes with a history of macular edema, moderate, severe or proliferative DR,laser treatment, or intraocular injections were excluded (Table S2).
Tissue Preparation and Immunolabeling. Four-millimeter biopsy punches cen-tered 6 mm superior to the fovea were cryoprotected in serial sucrose solutionand embedded for cryostat sectioning, as described previously (53). Cryostatsections (10 μm) were collected and stained with 1 μg/mL anti–γ-synuclein(Abcam) to immunolabel GCs, and DAPI was used to counterstain nucleatedcells. Additional 4-mm biopsy punches centered 6 mm inferior to the foveawere collected for flat-mount histochemistry with biotinylated-conjugated
Fig. 5. (A and B) STZ-induced DM in a mouse model does not significantly affect acellular capillaries (n = 6 diabetic mice, 6 controls) (A) or pericyte density(n = 6 diabetic mice, 6 controls) (B) at 6-wk DM duration. (C) There was a trend favoring pericyte dropout in mice at 20 wk of DM duration, but this trend wasnot significant (n = 8 diabetic mice, 8 controls). (D and E) Images of trypsin-digested whole-mount retina show similar numbers of acellular capillaries (blackarrows) in diabetic (D) and control (E) mice. (F and G) Histologic sections of retinas from diabetic (F) and control (G) mice dual-immunolabeled with NG-2 (red)and IB4 (green) show similar numbers of pericytes and vessels. DAPI nuclear counterstaining is shown in blue.
Sohn et al. PNAS Early Edition | 7 of 10
MED
ICALSC
IENCE
SPN
ASPL
US
Ulex europaeus agglutinin-I (UEA-I) (Vector Laboratories) followed by in-cubation with avidin conjugated to Texas Red to visualize retinal vasculatures(54). Negative controls for immunostaining were performed in parallel byomission of primary antibodies. Sections were imaged with an Olympus BX41fluorescence microscope and analyzed in ImageJ (55).
Determination of Donor Eye GC Density and NFL Thickness. All morphometricmeasurements were combined from two masked graders. Analysis of eachgrader’s dataset separately showed statistically significant differences be-tween the diabetic and control groups. To determine GC density and NFLthickness, the number of cells positively labeled with anti–γ-synuclein andthe length and thickness of retinal NFL were computed at 200-μm intervalsin each 4-mm punch. A total of 30–40 images obtained with a high-power(20×) objective from 8–12 sections of each donor eye were analyzed.
Determination of Donor Eye Retinal Capillary Density. Following visualizationof UEA-I, images were analyzed in ImageJ (55). Local threshold was opti-mized automatically for maximal capillary contrast using Phansalkar’s ap-proach (56) with a round window, with (dimensionless) algorithmic standardparameters k = 0.01–0.05 depending on the amount of background fluo-rescence, r = 0.5, P = 2, and q = 10. After thresholding, a single morpho-logical closing and then erosion was performed to remove single pixelserroneously thresholded as capillary. All regions of interest containingcapillaries outside arterioles and venules and larger vessels were selected,and capillary density was quantified as the fraction of pixels that were partof a capillary in the regions of interest. In other words, a capillary density 0.2means that 20% of the (projected) fluorescence image is covered by capil-laries (Fig. S3). Capillary density was averaged over all 21 or 22 imagesrepresenting the 4-mm punches for each eye.
Animal Studies. For the STZ-induced mouse model of type 1 DM, C57BL/6J malemice (The Jackson Laboratory) at 8–12 wk of age were randomly assigned todiabetic (STZ-induced) or nondiabetic control groups. In the STZ group, DM wasinduced between 8 wk and 10 wk of age by i.p. injections of STZ (SigmaChemical Co.); mice were injected with 60 mg/kg STZ daily for 5 d. Serumglucose levels were measured 3 d after the last injection and were monitoredmonthly thereafter. If serum glucose was less than 300 mg/dL, mice were in-jected for an additional 3 d with 50–60 mg/kg of STZ (Fig. S4). Only mice with
glucose levels consistently elevated above 350 mg/dL were considered diabeticand included in the study (Fig. S4). Severely diabetic mice were treated s.c. with2.7 U/20 g insulin (Sigma Chemical Co.) daily. Serum glucose levels in the age-matched C57BL/6J male control mice averaged 120–220 mg/dL. Randomlyassigned STZ-treated mice underwent OCT imaging 6 wk (approximate age 16wk) and 20 wk (approximate age 30 wk) after DM was confirmed and werekilled at these time points.
Genetically modified B6.BKS(D)-Leprdb /J mice (db/db; The Jackson Labo-ratory) were used as a model of type 2 DM not requiring exogenous STZ,with spontaneous, young-onset DM that persists until 16 wk of age. Bloodglucose of these db/db mice was monitored weekly, and mice with a glucoselevel >350 mg/dL were considered diabetic. Online STZ was administeredstarting at 16 wk to maintain hyperglycemia once euglycemia began. Thedb/db mice underwent OCT imaging at age 10 wk and 16 wk.
For the control group, we used the age-matched C57BL/6J mice that werenot randomized to receive STZ. These mice were OCT imaged at age 8–10 wk(controls for the db/db group were imaged at age 10 wk, and controls forthe STZ group were imaged at baseline), at age 16 wk (controls for the db/dbgroup were imaged at age 16 wk, and controls for the STZ group wereimaged 6 wk after DM induction), and at age 30 wk (controls for the STZgroup were imaged at 20 wk after DM induction). These mice were killed ateither 16 wk or 30 wk of age.
Mouse OCT Imaging and Analysis. After the animals were anesthetized withketamine/xylazine (87.5 mg/kg ketamine, 12.5 mg/kg xylazine), the pupilswere dilated with 1% tropicamide (Akorn, Inc.). To lubricate the eyes, 0.2%hypromellose eye gel (GenTeal; Novartis) was used. The animals were placedonto an adjustable cassette for SD-OCT imaging (Bioptigen Envisu R2200),and the cassette was connected to a platform that allowed 3D alignment.
OCT scanning was initially directed to the center (posterior pole) of themouse eye, facilitated by the aiming laser beam of the scanner. For thevolume scans, the aiming laser was centered on the optic nerve head (Fig. S5).The dimension of the scan (in depth and transverse extent) was adjusteduntil optimal signal intensity and contrast were achieved. OCT volume di-mensions were 400 × 400 × 1,024 voxels (1.4 × 1.4 × 1.566 mm3). Afterstorage, offline automated segmentation of the boundaries of the innerlimiting membrane (ILM), GCL, IPL, INL, OPL, OPL, external limiting mem-brane, inner/outer photoreceptor segment (IS/OS) junction, retinal pigmentepithelium (RPE) superior surface, and Bruch’s membrane was performedusing the Iowa Reference Algorithms for 3D automated layer segmentation;the thickness of the NFL+GCL was quantified as the distance between theILM and the bottom surface of the GCL (52, 57). Current SD-OCT technologydoes not allow the NFL to be differentiated from the GCL in mice. The IowaReference Algorithms are available for free in the public domain at www.iibi.uiowa.edu/content/shared-software-download/ (52), and a recent in-dependent validation showed superior performance for the inner retinain mice (58).
Preparation and Immunolabeling of Mouse Tissue. Mice were lethally injectedwith ketamine/xylazine (175.0 mg/kg ketamine and 25.0 mg/kg xylazine);after cervical dislocation, eyes were enucleated and fixed with PBS con-taining 4% paraformaldehyde at room temperature for 4 h. The cornea andlens were removed carefully; then the mouse eyes were cryoprotected bysequential immersion in 5%, 10%, and 20% (wt/vol) sucrose solutions andwere embedded in Tissue-Tek Optimum Cutting Temperature (OCT) com-pound (Sakura) in liquid nitrogen. Transverse 10-μm serial frozen sectionswere cut and mounted onto Superfrost Plus glass slides (Thermo Scientific)and stored at −80 °C until use. One eye per mouse from each experimentalgroup was used. Every 20th frozen section throughout the entire eye wasselected for immunohistochemical quantitative assessment. Sections weretreated and blocked for 30 min at room temperature with 0.3% Triton/0.1%BSA/PBS, incubated overnight (4 °C) with 0.5 μg/mL anti–γ-synuclein (Abnova),2 μg/mL anti-NG2 (Abcam), or 2.5 μg/mL biotinylated lectin GSL-IB4 (VectorLaboratories) to immunolabel GCs, pericytes, or blood vessels, respectively. Af-ter washing with PBS, sections were probed with 7.5 μg/mL Cy2 anti-mouse, Cy3anti-mouse (Jackson ImmunoResearch Laboratories), or 5 μg/mL Dylight 488streptavidin (Vector Laboratories) secondary fluorescence antibody for 1 h atroom temperature and then were mounted with anti-fade medium with DAPI.Negative controls for immunohistochemistry were performed in parallel byusing isotype-matched IgG. Images were captured by an Olympus BX41 fluo-rescence microscope, and were digitally analyzed using Image J software (55).
MouseMorphometry Analysis.All morphometric measurements weremade bytwo masked graders. Analysis of each grader’s dataset showed statisticallysignificant differences between the same groups. Assessment of acellular
Fig. 6. Progressive thinning of the NFL/GCL layer also is seen on OCT im-aging analysis in 10-wk-old (n = 18 diabetic mice, 14 controls) and 16-wk-old(n = 18 diabetic mice, 9 controls) db/db mice, which have a spontaneousyoung-onset form of DM.
8 of 10 | www.pnas.org/cgi/doi/10.1073/pnas.1522014113 Sohn et al.
capillaries was performed on trypsin-digested retina as described previously(59). To determine GC density (GC/total cells), the number of anti–γ-synu-clein–immunolabeled cells and the total number of nucleated cells in thesuperficial layer were measured in every 20th section (i.e., every 200 μm). Atotal of 40–50 images taken with a high-power (20×) objective from 8–12sections of each eye per animal were quantified. The number of pericytesper area of vascular plexus was traced and computed by total number ofanti-NG2–stained cells over the vascular plexus area in every 20th section(number of pericytes/1,000 μm2 of the total vascular plexus area).
Statistical Analysis.Longitudinal data. Statistical analysis was performed using SPSS softwareversion 20.0 (SPSS Inc.) and SAS software version 9.2 (SAS Institute Inc.).ANOVA was used to assess differences in mean HbA1c, mean blood pressure,and mean BCVA in the four follow-up visits. In a previous study it wasdemonstrated that there was no statistical difference in the measurements ina subject’s two eyes, and one eye was at random chosen for the presentanalysis (60). Changes over time in the thickness of the inner retinal layerswere assessed using linear mixed regression models with a first-order auto-regressive covariance structure to take into account that repeated measure-ments on the same subject over time are highly correlated and thatobservations on the same subject that are closer in time are more highlycorrelated than measurements at times further apart. The correlation betweentwo measurements within the same subject decreases exponentially as thelength of time between the measurements increases. The mixed-effects modelis also robust to missing data and can handle uneven intervals between therepeat measurements. The model was adjusted for age, sex, DM duration,HbA1c, DR at inclusion, and progression of DR, which were included as fixedeffects in the model. Age, HbA1c, and progression of DR were included in themodel as time-updated covariates. Four models were used, for parafoveal andperifoveal NFL and parafoveal and perifoveal GCL+IPL, respectively. The pri-mary research objective was to test if there was progressive thinning of theparafoveal and perifoveal NFL and/or GCL+IPL. We considered 95% CIs that
did not straddle zero to be statistically significant. All reported P valuesare two-sided.Human donor eye data. Morphometric data were averaged on a per-eye basis.Data were analyzed by two-tailed Student t test to compare two groups ofvariables. One-way ANOVA followed by Bonferroni post hoc analysis wasused to compare the differences in multiple groups using SPSS software 11.0(SPSS Inc.). Results are expressed as mean ± 95% CI. P < 0 0.05 was consid-ered statistically significant. The intraclass correlation coefficient (ICC) wasused in each study to measure the reliability of the rating between twograders with a 95% CI. The reliability of each measurement from twograders was 0.86 for human donor eye NFL thickness, 0.94 for mouse GCdensity, 0.97 for mouse acellular capillary assessment, and 0.90 for mousepericyte density. There was no significant difference between the two ob-servers in all assessments.Mouse data.Morphometric data were averaged on a per-eye basis. Data wereanalyzed by two-tailed Student t test to compare two groups of variables.One-way ANOVA followed by Bonferroni post hoc analysis was used tocompare the differences in multiple groups using SPSS software 11.0 (SPSSInc.). Results are reported as mean ± 95% CI and as mean ± SEM in graphs.P < 0 0.05 was considered statistically significant. The ICC was used in eachstudy to measure the reliability of the rating between two graders with a95% CI. The reliability of each measurement from two graders was 0.86 forhuman donor eye NFL thickness, 0.94 for mouse GC density, 0.97 for mouseacellular capillary assessment, and 0.90 for mouse pericyte density. Therewas no significant difference between the two observers in all assessments.
ACKNOWLEDGMENTS. Funding for this work was provided by National Insti-tutes of Health Grants R01EY018853, R01EY019112, R01EB004640, R01EY016379,and R01EY017066; Research to Prevent Blindness; Wynn Institute for Vision Re-search; Arnold and Mabel Beckman Initiative for Macular Research; and TheNetherlands Organization for Research (ZonMW). This work was supported inpart by Merit Review Award I01 CX000119 from the US Department ofVeterans Affairs Rehab Service; contents do not represent the views of the USDepartment of Veterans Affairs or the United States Government.
1. Antonetti DA, Klein R, Gardner TW (2012) Diabetic retinopathy. N Engl J Med 366(13):1227–1239.
2. Antonetti DA, et al.; JDRF Diabetic Retinopathy Center Group (2006) Diabetic reti-nopathy: Seeing beyond glucose-induced microvascular disease. Diabetes 55(9):2401–2411.
3. Stem MS, Gardner TW (2013) Neurodegeneration in the pathogenesis of diabeticretinopathy: Molecular mechanisms and therapeutic implications. Curr Med Chem20(26):3241–3250.
4. van Dijk HW, et al. (2011) Association of visual function and ganglion cell layerthickness in patients with diabetes mellitus type 1 and no or minimal diabetic reti-nopathy. Vision Res 51(2):224–228.
5. Realini T, Lai MQ, Barber L (2004) Impact of diabetes on glaucoma screening usingfrequency-doubling perimetry. Ophthalmology 111(11):2133–2136.
6. van Elderen SG, et al. (2010) Progression of brain atrophy and cognitive decline indiabetes mellitus: A 3-year follow-up. Neurology 75(11):997–1002.
7. Adams AJ, Bearse MA, Jr (2012) Retinal neuropathy precedes vasculopathy in di-abetes: A function-based opportunity for early treatment intervention? Clin ExpOptom 95(3):256–265.
8. Cogan DG, Toussaint D, Kuwabara T (1961) Retinal vascular patterns. IV. Diabeticretinopathy. Arch Ophthalmol 66:366–378.
9. Friedenwald JS (1950) Diabetic retinopathy. Am J Ophthalmol 33(8):1187–1199.10. Papachristodoulou D, Heath H, Kang SS (1976) The development of retinopathy in
sucrose-fed and streptozotocin-diabetic rats. Diabetologia 12(4):367–374.11. Mizutani M, Kern TS, Lorenzi M (1996) Accelerated death of retinal microvascular cells
in human and experimental diabetic retinopathy. J Clin Invest 97(12):2883–2890.12. Midena E, et al. (1989) Studies on the retina of the diabetic db/db mouse. I. Endo-
thelial cell-pericyte ratio. Ophthalmic Res 21(2):106–111.13. Kern TS, Engerman RL (1996) A mouse model of diabetic retinopathy. Arch
Ophthalmol 114(8):986–990.14. Demirkaya N, et al. (2013) Effect of age on individual retinal layer thickness in normal eyes
as measured with spectral-domain optical coherence tomography. Invest Ophthalmol VisSci 54(7):4934–4940.
15. van Dijk HW, et al. (2009) Selective loss of inner retinal layer thickness in type 1 di-abetic patients with minimal diabetic retinopathy. Invest Ophthalmol Vis Sci 50(7):3404–3409.
16. van Dijk HW, et al. (2012) Early neurodegeneration in the retina of type 2 diabeticpatients. Invest Ophthalmol Vis Sci 53(6):2715–2719.
17. Eisma JH, Dulle JE, Fort PE (2015) Current knowledge on diabetic retinopathy fromhuman donor tissues. World J Diabetes 6(2):312–320.
18. Verma A, et al. (2012) Does neuronal damage precede vascular damage in subjectswith type 2 diabetes mellitus and having no clinical diabetic retinopathy? OphthalmicRes 47(4):202–207.
19. Feit-Leichman RA, et al. (2005) Vascular damage in a mouse model of diabetic reti-nopathy: Relation to neuronal and glial changes. Invest Ophthalmol Vis Sci 46(11):4281–4287.
20. Barber AJ, et al. (1998) Neural apoptosis in the retina during experimental and humandiabetes. Early onset and effect of insulin. J Clin Invest 102(4):783–791.
21. Beck RW, et al.; Diabetic Retinopathy Clinical Research Network (DRCR.net) (2009)Three-year follow-up of a randomized trial comparing focal/grid photocoagulationand intravitreal triamcinolone for diabetic macular edema. Arch Ophthalmol 127(3):245–251.
22. Ooto S, et al. (2011) Effects of age, sex, and axial length on the three-dimensional profileof normal macular layer structures. Invest Ophthalmol Vis Sci 52(12):8769–8779.
23. Phipps JA, Fletcher EL, Vingrys AJ (2004) Paired-flash identification of rod and conedysfunction in the diabetic rat. Invest Ophthalmol Vis Sci 45(12):4592–4600.
24. Sim DA, et al. (2014) Quantitative analysis of diabetic macular ischemia using opticalcoherence tomography. Invest Ophthalmol Vis Sci 55(1):417–423.
25. Martin PM, Roon P, Van Ells TK, Ganapathy V, Smith SB (2004) Death of retinalneurons in streptozotocin-induced diabetic mice. Invest Ophthalmol Vis Sci 45(9):3330–3336.
26. Bonnin S, Tadayoni R, Erginay A, Massin P, Dupas B (2015) Correlation betweenganglion cell layer thinning and poor visual function after resolution of diabeticmacular edema. Invest Ophthalmol Vis Sci 56(2):978–982.
27. Bogdanov P, et al. (2014) The db/db mouse: A useful model for the study of diabeticretinal neurodegeneration. PLoS One 9(5):e97302.
28. Parisi V, Uccioli L (2001) Visual electrophysiological responses in persons with type 1diabetes. Diabetes Metab Res Rev 17(1):12–18.
29. Bogunovi�c H, et al. (2014) Relationships of retinal structure and humphrey 24-2 visualfield thresholds in patients with glaucoma. Invest Ophthalmol Vis Sci 56(1):259–271.
30. American Academy of Ophthalmology (2015–2016) Retina and Vitreous Basic andClinical Science Courses Series (BCSC) (American Academy of Ophthalmology, SanFrancisco), Vol 12.
31. Hombrebueno JR, Chen M, Penalva RG, Xu H (2014) Loss of synaptic connectivity,particularly in second order neurons is a key feature of diabetic retinal neuropathy inthe Ins2Akita mouse. PLoS One 9(5):e97970.
32. Simo R, Hernandez C, and the European Consortium for the Early Treatment of Di-abetic Retinopathy (2014) Neurodegeneration in the diabetic eye: New insights andtherapeutic perspectives. Trends Endocrinol Metab 25(1):23–33.
33. Lorenzi M, Gerhardinger C (2001) Early cellular and molecular changes induced bydiabetes in the retina. Diabetologia 44(7):791–804.
34. Bek T (1994) Transretinal histopathological changes in capillary-free areas of diabeticretinopathy. Acta Ophthalmol (Copenh) 72(4):409–415.
35. Bloodworth JM, Jr (1962) Diabetic retinopathy. Diabetes 11:1–22.36. Wolter JR (1961) Diabetic capillary microaneurysms of the retina. Arch Ophthalmol
65:847–854.37. Aiello LP, et al. (1994) Vascular endothelial growth factor in ocular fluid of patients with
diabetic retinopathy and other retinal disorders. N Engl J Med 331(22):1480–1487.38. Abràmoff MD, et al. (2013) Human photoreceptor outer segments shorten during
light adaptation. Invest Ophthalmol Vis Sci 54(5):3721–3728.
Sohn et al. PNAS Early Edition | 9 of 10
MED
ICALSC
IENCE
SPN
ASPL
US
39. Martin DF, Maguire MG (2015) Treatment choice for diabetic macular edema. N Engl JMed 372(13):1260–1261.
40. Park HY, Kim JH, Park CK (2014) Neuronal cell death in the inner retina and the in-fluence of vascular endothelial growth factor inhibition in a diabetic rat model. Am JPathol 184(6):1752–1762.
41. Imai H, Singh RS, Fort PE, Gardner TW (2009) Neuroprotection for diabetic retinop-athy. Dev Ophthalmol 44:56–68.
42. Kuehn MH, Fingert JH, Kwon YH (2005) Retinal ganglion cell death in glaucoma:Mechanisms and neuroprotective strategies.Ophthalmol Clin North Am 18(3):383–395, vi.
43. Obrosova IG, et al. (2006) Early diabetes-induced biochemical changes in the retina:Comparison of rat and mouse models. Diabetologia 49(10):2525–2533.
44. Fletcher EL, Phipps JA, Ward MM, Puthussery T, Wilkinson-Berka JL (2007) Neuronaland glial cell abnormality as predictors of progression of diabetic retinopathy. CurrPharm Des 13(26):2699–2712.
45. Anonymous (1995) The relationship of glycemic exposure (HbA1c) to the risk of de-velopment and progression of retinopathy in the diabetes control and complicationstrial. Diabetes 44(8):968–983.
46. Klemen UM, Freyler H (1980) Courses of diabetic retinopathy. Albrecht Von GraefesArch Klin Exp Ophthalmol 213(2):135–142.
47. Wilkinson CP, et al.; Global Diabetic Retinopathy Project Group (2003) Proposed in-ternational clinical diabetic retinopathy and diabetic macular edema disease severityscales. Ophthalmology 110(9):1677–1682.
48. Early Treatment Diabetic Retinopathy Study Research Group (1987) Treatment tech-niques and clinical guidelines for photocoagulation of diabetic macular edema. EarlyTreatment Diabetic Retinopathy Study Report Number 2.Ophthalmology 94(7):761–774.
49. Van Dijk HW, et al. (2009) Selective loss of inner retinal layer thickness in type 1 di-abetic patients with minimal diabetic retinopathy. ARVO Meeting Abstracts 50(5):3244.
50. Bressler SB, et al.; Diabetic Retinopathy Clinical Research Network Writing Committee(2014) Reproducibility of spectral-domain optical coherence tomography retinalthickness measurements and conversion to equivalent time-domain metrics in di-abetic macular edema. JAMA Ophthalmol 132(9):1113–1122.
51. Martin DF, et al.; Comparison of Age-related Macular Degeneration Treatments Trials(CATT) Research Group (2012) Ranibizumab and bevacizumab for treatment ofneovascular age-related macular degeneration: Two-year results. Ophthalmology119(7):1388–1398.
52. Abramoff MD, Garvin M, Sonka M (2010) Retinal imaging and image analysis. IEEERev Biomed Engin 3:169–208.
53. Barthel LK, Raymond PA (1990) Improved method for obtaining 3-micronscryosections for immunocytochemistry. J Histochem Cytochem 38(9):1383–1388.
54. Mullins RF, Grassi MA, Skeie JM (2005) Glycoconjugates of choroidal neovascularmembranes in age-related macular degeneration. Mol Vis 11:509–517.
55. Abramoff MD, Magalhaes PJ, Ram S (2004) Image Processing with ImageJ. BiophotonicsInternational 11(7):36–42.
56. Phansalkar N, More S, Sabale A, Joshi M (2011) Adaptive local thresholding for de-tection of nuclei in diversity stained cytology images. 2011 International Conferenceon Communications and Signal Processing (ICCSP), pp 218–220.
57. Antony BJ, et al. (2014) Automated 3D segmentation of intraretinal surfaces in SD-OCT volumes in normal and diabetic mice. Transl Vis Sci Technol 3(5):8.
58. Dysli C, Enzmann V, Sznitman R, Zinkernagel MS (2015) Quantitative analysis ofmouse retinal layers using automated segmentation of spectral domain optical co-herence tomography images. Transl Vis Sci Technol 4(4):9.
59. Yang Y, et al. (2012) Decrease in retinal neuronal cells in streptozotocin-induced di-abetic mice. Mol Vis 18:1411–1420.
60. Biallosterski C, et al. (2007) Decreased optical coherence tomography-measuredpericentral retinal thickness in patients with diabetes mellitus type 1 with minimaldiabetic retinopathy. Br J Ophthalmol 91(9):1135–1138.
10 of 10 | www.pnas.org/cgi/doi/10.1073/pnas.1522014113 Sohn et al.
Related Documents