Retinal nerve fibre layer thickness measurement reproducibility improved with spectral domain optical coherence tomography J S Kim 1,2 , H Ishikawa 1,2 , K R Sung 1 , J Xu 1 , G Wollstein 1 , R A Bilonick 1 , M L Gabriele 1 , L Kagemann 1,2 , J S Duker 3 , J G Fujimoto 4 , and J S Schuman 1,2 1 UPMC Eye Center, Eye and Ear Institute, Ophthalmology and Visual Science Research Center, Department of Ophthalmology, University of Pittsburgh School of Medicine, Pittsburgh, Pennsylvania, USA 2 Department of Bioengineering, Swanson School of Engineering, University of Pittsburgh, Pittsburgh, Pennsylvania, USA 3 New England Eye Center, Tufts Medical Center, Boston, Massachusetts, USA 4 Department of Electrical Engineering and Computer Science and Research Laboratory of Electronics, Massachusetts Institute of Technology, Cambridge, Massachusetts, USA Abstract Background/aims—To investigate retinal nerve fibre layer (RNFL) thickness measurement reproducibility using conventional time-domain optical coherence tomography (TD-OCT) and spectral-domain OCT (SD-OCT), and to evaluate two methods defining the optic nerve head (ONH) centring: Centred Each Time (CET) vs Centred Once (CO), in terms of RNFL thickness measurement variability on SD-OCT. Methods—Twenty-seven eyes (14 healthy subjects) had three circumpapillary scans with TD- OCT and three raster scans (three-dimensional or 3D image data) around ONH with SD-OCT. SD- OCT images were analysed in two ways: (1) CET: ONH centre was defined on each image separately and (2) CO: ONH centre was defined on one image and exported to other images after scan registration. After defining the ONH centre, a 3.4 mm diameter virtual circular OCT was resampled on SD-OCT images to mimic the conventional circumpapillary RNFL thickness measurements taken with TD-OCT. Results—CET and CO showed statistically significantly better reproducibility than TD-OCT except for 11:00 with CET. CET and CO methods showed similar reproducibility. Conclusions—SD-OCT 3D cube data generally showed better RNFL measurement reproducibility than TD-OCT. The choice of ONH centring methods did not affect RNFL measurement reproducibility. Correspondence to: Dr G Wollstein, UPMC Eye Center, Department of Ophthalmology, University of Pittsburgh School of Medicine, 203 Lothrop Street, Eye and Ear Institute, Suite 834, Pittsburgh, PA 15213, USA; [email protected]. JSK and HI contributed equally. Competing interests: JGF and JSS receive royalties for intellectual property licensed by Massachusetts Institute of Technology to Carl Zeiss Meditec. JGF is a scientific advisor and has stock options with Optovue. GW received research funding from Carl Zeiss Meditec and Optovue. HI, GW and JSS receive royalties for intellectual property, licensed by University of Pittsburgh to Bioptigen, Inc. Ethics approval: Ethics approval was provided by the institutional review board at the University of Pittsburgh. Patient consent: Obtained. Presented in part at the annual meeting of the Association for Research in Vision and Ophthalmology, Fort Lauderdale, Florida, April 2008. NIH Public Access Author Manuscript Br J Ophthalmol. Author manuscript; available in PMC 2010 April 29. Published in final edited form as: Br J Ophthalmol. 2009 August ; 93(8): 1057–1063. doi:10.1136/bjo.2009.157875. NIH-PA Author Manuscript NIH-PA Author Manuscript NIH-PA Author Manuscript

Welcome message from author
This document is posted to help you gain knowledge. Please leave a comment to let me know what you think about it! Share it to your friends and learn new things together.
Transcript
Retinal nerve fibre layer thickness measurement reproducibilityimproved with spectral domain optical coherence tomography
J S Kim1,2, H Ishikawa1,2, K R Sung1, J Xu1, G Wollstein1, R A Bilonick1, M L Gabriele1, LKagemann1,2, J S Duker3, J G Fujimoto4, and J S Schuman1,21UPMC Eye Center, Eye and Ear Institute, Ophthalmology and Visual Science Research Center,Department of Ophthalmology, University of Pittsburgh School of Medicine, Pittsburgh,Pennsylvania, USA2Department of Bioengineering, Swanson School of Engineering, University of Pittsburgh,Pittsburgh, Pennsylvania, USA3New England Eye Center, Tufts Medical Center, Boston, Massachusetts, USA4Department of Electrical Engineering and Computer Science and Research Laboratory ofElectronics, Massachusetts Institute of Technology, Cambridge, Massachusetts, USA
AbstractBackground/aims—To investigate retinal nerve fibre layer (RNFL) thickness measurementreproducibility using conventional time-domain optical coherence tomography (TD-OCT) andspectral-domain OCT (SD-OCT), and to evaluate two methods defining the optic nerve head(ONH) centring: Centred Each Time (CET) vs Centred Once (CO), in terms of RNFL thicknessmeasurement variability on SD-OCT.
Methods—Twenty-seven eyes (14 healthy subjects) had three circumpapillary scans with TD-OCT and three raster scans (three-dimensional or 3D image data) around ONH with SD-OCT. SD-OCT images were analysed in two ways: (1) CET: ONH centre was defined on each imageseparately and (2) CO: ONH centre was defined on one image and exported to other images afterscan registration. After defining the ONH centre, a 3.4 mm diameter virtual circular OCT wasresampled on SD-OCT images to mimic the conventional circumpapillary RNFL thicknessmeasurements taken with TD-OCT.
Results—CET and CO showed statistically significantly better reproducibility than TD-OCTexcept for 11:00 with CET. CET and CO methods showed similar reproducibility.
Conclusions—SD-OCT 3D cube data generally showed better RNFL measurementreproducibility than TD-OCT. The choice of ONH centring methods did not affect RNFLmeasurement reproducibility.
Correspondence to: Dr G Wollstein, UPMC Eye Center, Department of Ophthalmology, University of Pittsburgh School of Medicine,203 Lothrop Street, Eye and Ear Institute, Suite 834, Pittsburgh, PA 15213, USA; [email protected] and HI contributed equally.Competing interests: JGF and JSS receive royalties for intellectual property licensed by Massachusetts Institute of Technology toCarl Zeiss Meditec. JGF is a scientific advisor and has stock options with Optovue. GW received research funding from Carl ZeissMeditec and Optovue. HI, GW and JSS receive royalties for intellectual property, licensed by University of Pittsburgh to Bioptigen,Inc.Ethics approval: Ethics approval was provided by the institutional review board at the University of Pittsburgh.Patient consent: Obtained.Presented in part at the annual meeting of the Association for Research in Vision and Ophthalmology, Fort Lauderdale, Florida, April2008.
NIH Public AccessAuthor ManuscriptBr J Ophthalmol. Author manuscript; available in PMC 2010 April 29.
Published in final edited form as:Br J Ophthalmol. 2009 August ; 93(8): 1057–1063. doi:10.1136/bjo.2009.157875.
NIH
-PA Author Manuscript
NIH
-PA Author Manuscript
NIH
-PA Author Manuscript
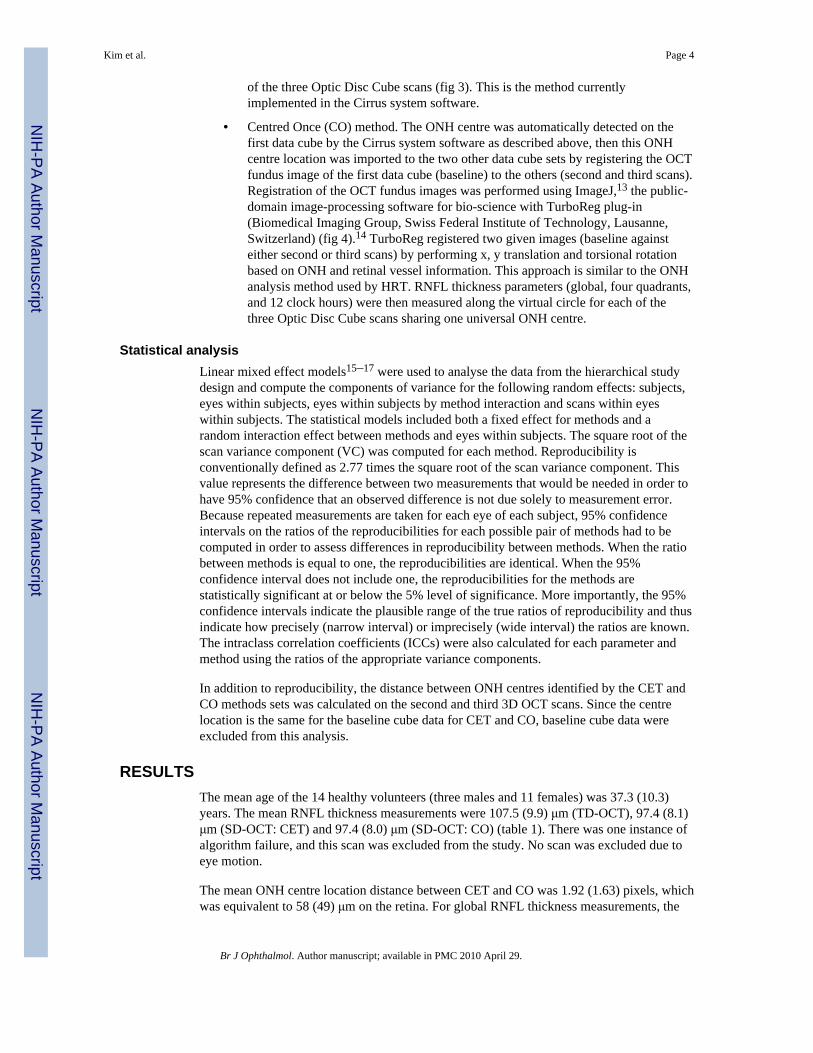
Retinal nerve fibre layer (RNFL) thickness measurement has become a widely employedclinical technique for glaucoma assessment.1–3 Optical coherence tomography (OCT) is atechnology providing RNFL thickness measurements in a non-contact and non-invasivefashion.4 5 RNFL thickness is measured on a cross-sectional retinal image sampled along a3.4 mm circle centred to optic nerve head (ONH).6 Due to the relatively slow axial scan rateof standard time-domain OCT (TD-OCT, 400 axial scans per second, or ~0.64 s scanningfor 256 axial scans per circle used in Stratus OCT (Carl Zeiss Meditec, Dublin, California)),the actual OCT axial scans may occur in the vicinity of the planned scanning path—a 3.4mm circle around the ONH—jittering due to eye motion, one of the major sources ofmeasurement variability (fig 1A, left). In order to minimise the influence of eye motion,three consecutive circular OCT scans are performed, and the mean RNFL thickness iscomputed after obtaining the measurements on each circular scan.7 Another source ofvariability is scan circle placement. This affects where the OCT scan is projected onto retina(fig 1A, right). Since circle placement is manually controlled, it is difficult to ensureconsistent image sampling location.
The recent introduction of spectral domain OCT (SD-OCT) has improved the scanningspeed (60–100× faster, or 24 000–55 000 axial scans per second) and axial resolution (3.5–8μm vs 8–10 μm with conventional TD-OCT) enabling high-resolution, three-dimensional(3D) volume sampling.8–11 By performing a raster scan to acquire a volumetric data set andsumming the back scattered signal at each transverse point on the retina, 3D SD-OCT datacan be visualised as an en face image of the scanned area on the retina, which is called anOCT fundus image (fig 1B, upper).10 12 The OCT fundus image allows us to detect eyemotion during scanning by checking the retinal blood vessel integrity (fig 1B, lower).
Commercial SD-OCT (Cirrus HD-OCT; Carl Zeiss Meditec; software version: 3.0) acquiresa volumetric data set and uses software to detect the ONH margin automatically on the OCTfundus image and calculate the geometric centre of a given ONH. Then, it resamples the 3DOCT data to generate a virtual 3.4 mm circular scan mimicking the conventionalperipapillary OCT scan in order to maintain backward data comparability. With this fullyautomated RNFL thickness measurement method, the previously mentioned imageregistration limitation due to eye motion should be reduced. With these advantages, wehypothesise that SD-OCT shows a lower RNFL thickness measurement variability thanconventional TD-OCT.
Fully automated SD-OCT measurements may still not be perfect, however, because nosingle OCT fundus image is identical to others. In other words, factors like minor eyemotion during scanning, head position and a slight shift of subjects’ fixation points maydistort the OCT fundus image very slightly, but enough to be detected when superimposedonto other OCT fundus images (fig 2). In the past, scanning laser ophthalmoscope (SLO;Heidelberg Retina Tomography (HRT), Heidelberg Engineering, Heidelberg, Germany)exhibited a similar registration problem. Their solution for this problem was to import theONH margin from the baseline image onto other images so that multiple scans share oneuniversal ONH margin minimising scan-to-scan sampling variability.
Cirrus software does not import the ONH margin information from one scan to another, butit may be advantageous to share one universal ONH margin as the HRT does in order tominimise RNFL measurement variability. The purpose of this study was (1) to compareRNFL thickness measurement reproducibility between TD-OCT and SD-OCT and (2) toevaluate the performance of centring the ONH each time (Centred Each Time (CET)) orusing one universal ONH centre (Centred Once (CO)) among repetitive scans, in terms ofRNFL thickness measurement reproducibility.
Kim et al. Page 2
Br J Ophthalmol. Author manuscript; available in PMC 2010 April 29.
NIH
-PA Author Manuscript
NIH
-PA Author Manuscript
NIH
-PA Author Manuscript
METHODSTwenty-seven eyes of 14 healthy subjects from the University of Pittsburgh Medical CenterEye Center were enrolled. Eyes with no history or evidence of intraocular surgery, retinaldisease or glaucoma, refractive error less than 8 D and normal-appearing ONHs qualified asnormal healthy subjects.
All eyes showed normal comprehensive ocular examination and automated perimetry withglaucoma hemifield test (GHT) within normal limits (Humphrey Field Analyzer, Carl ZeissMeditec). The peripapillary region was scanned on all eyes using conventional OCT (StratusOCT) and SD-OCT (Cirrus) at the same visit. All scans were performed through undilatedpupils. Institutional review board and ethics committee approval were obtained for thestudy, and informed consent was obtained from all subjects. This study followed the tenetsof the Declaration of Helsinki and was conducted in compliance with the Health InsurancePortability and Accountability Act.
Image acquisitionStratus OCT—Circular scans centred on the ONH were obtained using the “Fast RNFLScan” pattern, which performs three 3.4 mm diameter circular scans (with 256 A-scan)around the ONH in a rapid succession (1.92 s). Three fast RNFL scans were obtained fromeach eye in a single session by one operator. The scan circle was centred on the ONHmanually. Images with a signal strength (SS) less than 6 were discarded as poor-qualityimages as recommended by the manufacturer. RNFL thickness was measured using theStratus OCT system (software version 5.0). Segmentation failure was defined as obviousdeviation of the segmented inner and/or outer RNFL borders from the subjectively perceivedborders. Consecutive 15% or cumulative 20% segmentation failure within a given imagewas considered to be of poor analysis quality and discarded.
Cirrus HD-OCT—3D cube OCT data were obtained using the “Optic Disc Cube 200×200Scan” pattern, which performed raster scanning in a 6×6 mm square centred on the ONH(total scan time was 1.48 s) consisting of 200 frames of horizontal linear B-scans with 200A-scan lines per B-scan. Images with SS less than 8 were discarded as poor-quality images.This cut-off is different from Stratus SS because, despite both representing signal strength,they are different measurements. There is no validated consensus about the ideal cut-off forCirrus SS, but the manufacturer recommends that SS 8 or above should be consideredacceptable images. In addition to SS, images with detectable eye motion (larger than onevessel diameter or a major distortion of the ONH) in OCT fundus images were alsodiscarded (fig 2B). Analysis quality criteria were the same as Stratus OCT and based on 3.4mm circular virtual OCT scan images. Three Optic Disc Cube scans were obtained fromeach eye in a single session by a single operator (KRS).
RNFL thickness measurementsTD-OCT—Global mean, four quadrants, and 12 clock hour RNFL thickness were measuredfor each of three fast RNFL scans.
SD-OCT—A virtual circular scan with 3.4 mm diameter (256 sampling along the circle)was automatically resampled on each 3D OCT cube data by Cirrus system software afterdetermining the ONH centre. Two methods for determining the ONH centre were employedon Cirrus images:
• Centred Each Time (CET) method. The ONH centre was detected automatically bythe Cirrus system separately for each image. RNFL thickness parameters (global,four quadrants and 12 clock hours) were measured along the virtual circle for each
Kim et al. Page 3
Br J Ophthalmol. Author manuscript; available in PMC 2010 April 29.
NIH
-PA Author Manuscript
NIH
-PA Author Manuscript
NIH
-PA Author Manuscript
of the three Optic Disc Cube scans (fig 3). This is the method currentlyimplemented in the Cirrus system software.
• Centred Once (CO) method. The ONH centre was automatically detected on thefirst data cube by the Cirrus system software as described above, then this ONHcentre location was imported to the two other data cube sets by registering the OCTfundus image of the first data cube (baseline) to the others (second and third scans).Registration of the OCT fundus images was performed using ImageJ,13 the public-domain image-processing software for bio-science with TurboReg plug-in(Biomedical Imaging Group, Swiss Federal Institute of Technology, Lausanne,Switzerland) (fig 4).14 TurboReg registered two given images (baseline againsteither second or third scans) by performing x, y translation and torsional rotationbased on ONH and retinal vessel information. This approach is similar to the ONHanalysis method used by HRT. RNFL thickness parameters (global, four quadrants,and 12 clock hours) were then measured along the virtual circle for each of thethree Optic Disc Cube scans sharing one universal ONH centre.
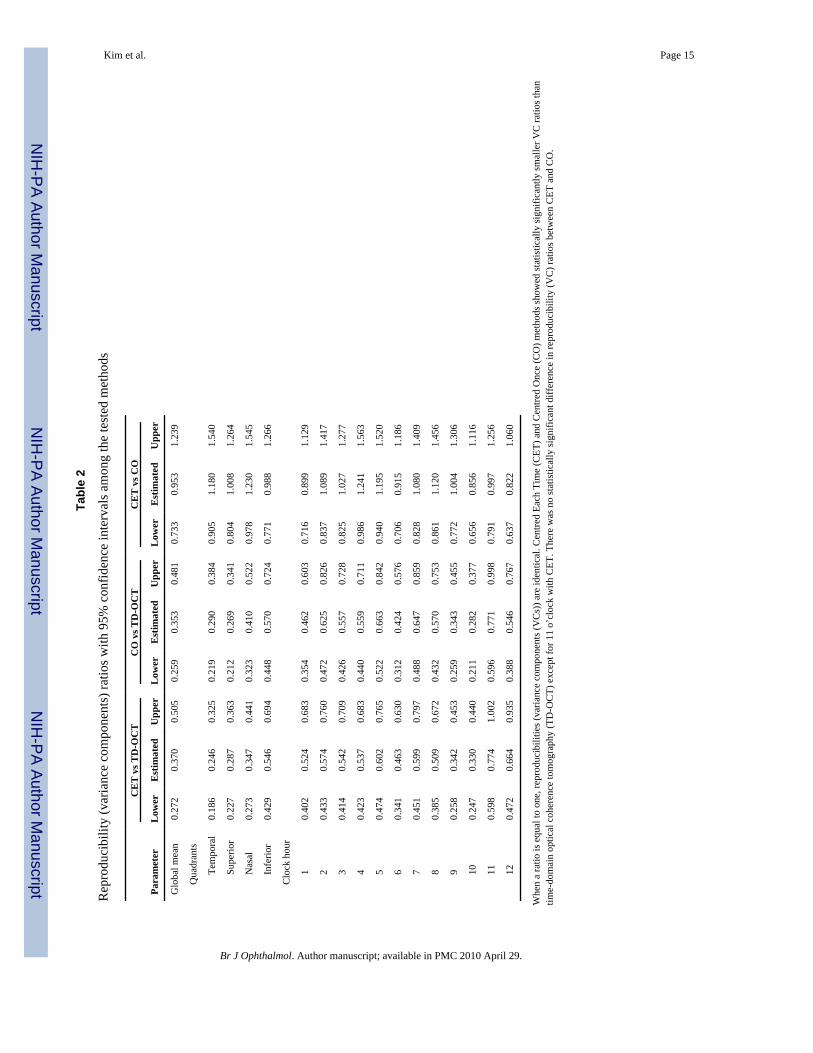
Statistical analysisLinear mixed effect models15–17 were used to analyse the data from the hierarchical studydesign and compute the components of variance for the following random effects: subjects,eyes within subjects, eyes within subjects by method interaction and scans within eyeswithin subjects. The statistical models included both a fixed effect for methods and arandom interaction effect between methods and eyes within subjects. The square root of thescan variance component (VC) was computed for each method. Reproducibility isconventionally defined as 2.77 times the square root of the scan variance component. Thisvalue represents the difference between two measurements that would be needed in order tohave 95% confidence that an observed difference is not due solely to measurement error.Because repeated measurements are taken for each eye of each subject, 95% confidenceintervals on the ratios of the reproducibilities for each possible pair of methods had to becomputed in order to assess differences in reproducibility between methods. When the ratiobetween methods is equal to one, the reproducibilities are identical. When the 95%confidence interval does not include one, the reproducibilities for the methods arestatistically significant at or below the 5% level of significance. More importantly, the 95%confidence intervals indicate the plausible range of the true ratios of reproducibility and thusindicate how precisely (narrow interval) or imprecisely (wide interval) the ratios are known.The intraclass correlation coefficients (ICCs) were also calculated for each parameter andmethod using the ratios of the appropriate variance components.
In addition to reproducibility, the distance between ONH centres identified by the CET andCO methods sets was calculated on the second and third 3D OCT scans. Since the centrelocation is the same for the baseline cube data for CET and CO, baseline cube data wereexcluded from this analysis.
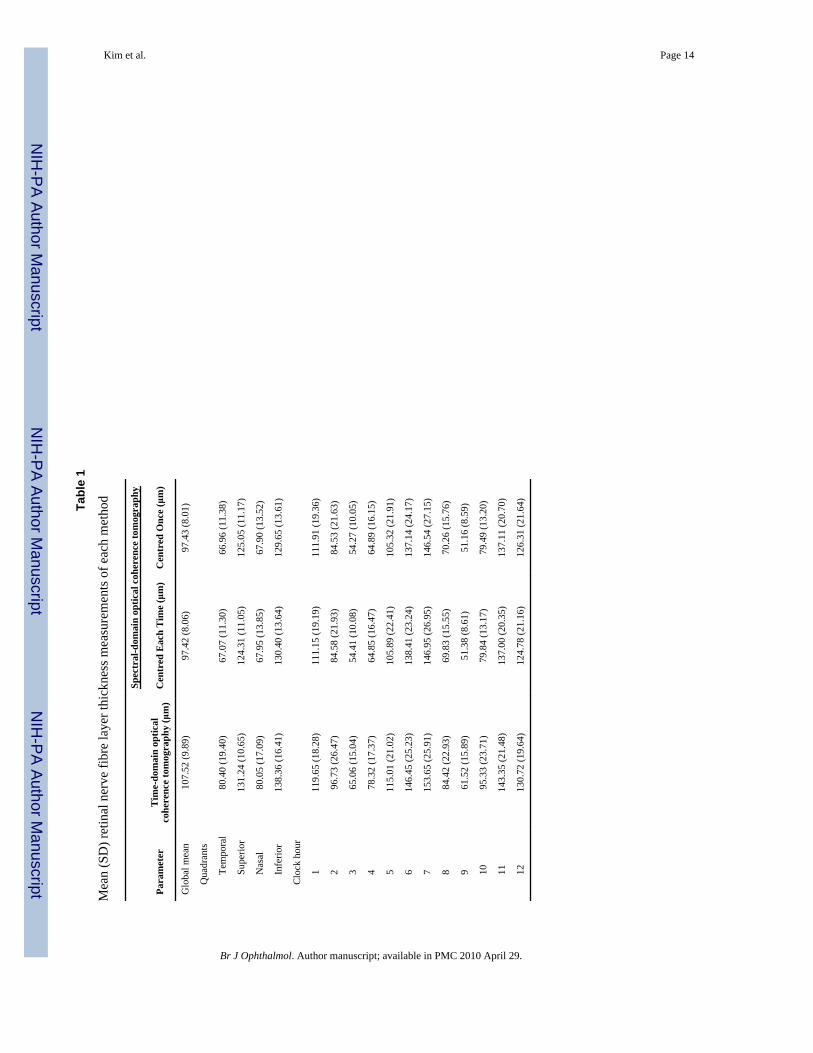
RESULTSThe mean age of the 14 healthy volunteers (three males and 11 females) was 37.3 (10.3)years. The mean RNFL thickness measurements were 107.5 (9.9) μm (TD-OCT), 97.4 (8.1)μm (SD-OCT: CET) and 97.4 (8.0) μm (SD-OCT: CO) (table 1). There was one instance ofalgorithm failure, and this scan was excluded from the study. No scan was excluded due toeye motion.
The mean ONH centre location distance between CET and CO was 1.92 (1.63) pixels, whichwas equivalent to 58 (49) μm on the retina. For global RNFL thickness measurements, the
Kim et al. Page 4
Br J Ophthalmol. Author manuscript; available in PMC 2010 April 29.
NIH
-PA Author Manuscript
NIH
-PA Author Manuscript
NIH
-PA Author Manuscript
estimated reproducibility ratio for CET/TD-OCT was 0.370 (95% CI 0.272 to 0.505), whichindicates that the reproducibility for CET was better (ie, the variance was smaller) than forTD-OCT (37% of the reproducibility value for TD-OCT). Because the 95% CI does notinclude one, this indicates that the reproducibilities are statistically significantly different atthe 5% level of significance. Similarly, the estimated reproducibility ratios were 0.353 (CI0.259 to 0.481) for CO/TD-OCT, and 0.953 (CI 0.733 to 1.239) for CET/CO (table 2). Forsector RNFL thickness measurements, SD-OCT using CET and CO showed statisticallysignificantly smaller reproducibility ratios than TD-OCT except for 11 o’clock with CET.The reproducibility ratio results imply that, regardless of the ONH centring method, SD-OCT significantly improves RNFL thickness measurement reproducibility (reducesvariability) in comparison with conventional TD-OCT. There was no statistically significantdifference in reproducibility ratios between CET and CO in any of the global or sectoralmeasurements.
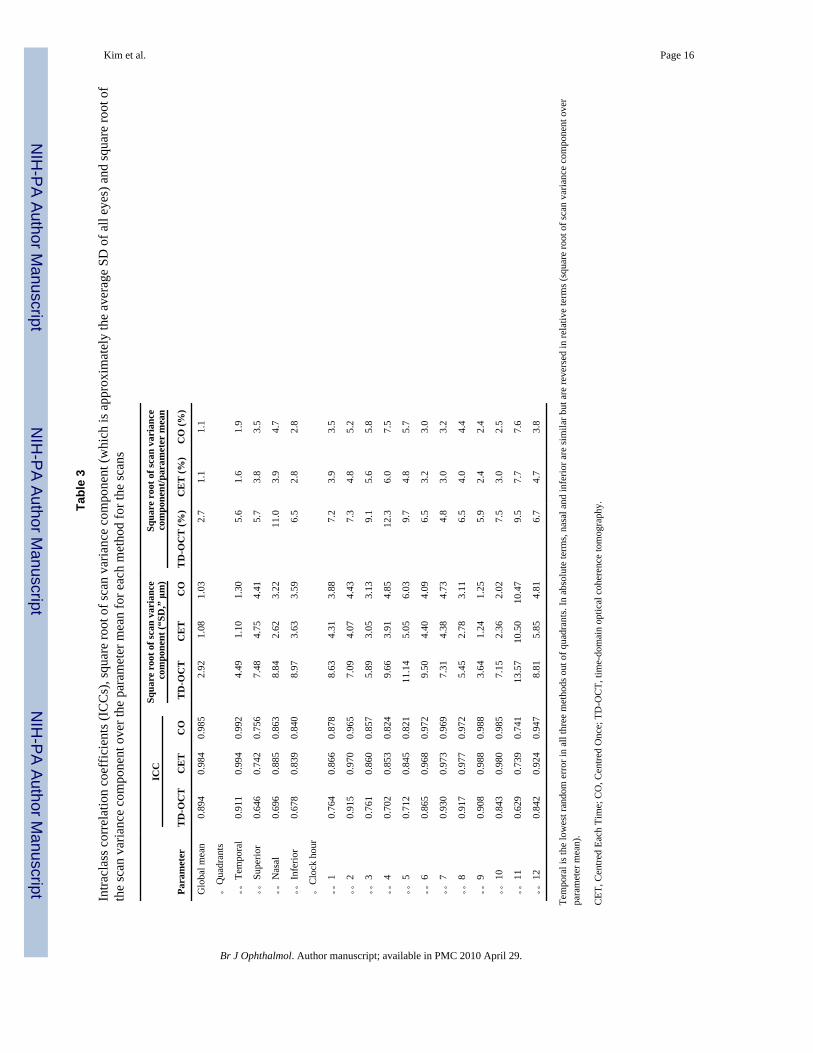
ICCs for each parameter and method are shown in table 3 along with the correspondingsquare root of the variance component for scans. ICCs (table 3) from all three methods (TD-OCT, CET and CO) at 11 o’clock were lower than other ICCs. Figure 5 shows that thereproducibility of both CET and CO methods was uniformly and substantially better thanTD-OCT, and the differences were statistically significant.
DISCUSSIONThe present results showed that the RNFL thickness measurement reproducibility wasstatistically significantly improved over conventional TD-OCT when using SD-OCT. Theacquisition of a 3D data set is likely an important factor in the improvement. The OCTsegmentation algorithm takes advantage of the three-dimensional neighbouring structureinformation available in SD-OCT, which is not possible with a two-dimensionalconventional TD-OCT scan, making the SD-OCT segmentation more robust. The higheraxial resolution of SD-OCT is a likely contributor as well, as segmentation is more reliablewith better-defined RNFL borders.
It is interesting to consider the fact that the scanning time of the SD-OCT 3D cube scan isactually slower than conventional TD-OCT yet achieves a lower RNFL measurementvariability. Circular resampling on a 3D cube data requires 56.7% of the 3D data in order toobtain the 3.4 mm circle data (114 out of 200 frames (3.42 mm); each frame verticallycovers 30 μm on the retina) that take 0.84 s to acquire, while a single circular scan with TD-OCT takes 0.64 s to acquire. Assuming the characteristics of eye motion during scanning areconstant, data acquired using a longer scan time should contain more eye motion artefacts.Nevertheless, SD-OCT showed a lower measurement variability than TD-OCT. This may bebecause the OCT fundus image provides an easy and reliable way to detect significant eyemotion (like a saccade) during a scan so that the eye can be rescanned, if necessary, tominimise eye motion artefacts. With TD-OCT there is no systematic way to detect themagnitude of eye motion during scanning, since the corresponding fundus reference imageis captured after the actual OCT scan. It is also possible that the SD-OCT segmentationalgorithm is more robust than the TD-OCT algorithm because of a higher axial resolutionand readily available 3D structural information as discussed above.
We frequently observed apparent variability in the shape of the automatically detected ONHmargins using the Cirrus system software. Because the disc centre was defined based on thelocation of the disc margin, it was surprising that the CET method did not show a greatervariability than the CO method. This is likely because the only information that the virtualcircular scan resampling needs is the ONH centre location; it does not take into accountONH shape. Actually, only a 58 μm difference in the ONH centre location was observed
Kim et al. Page 5
Br J Ophthalmol. Author manuscript; available in PMC 2010 April 29.
NIH
-PA Author Manuscript
NIH
-PA Author Manuscript
NIH
-PA Author Manuscript
between the CET and CO methods. Gabriele et al reported that the peripapillary circularscan has ±350 μm of measurement stability margin where the overall RNFL thicknessmeasurement error stays within the expected measurement error range.18 The present resultof 58 μm ONH centre location deviation is well within this stability margin. Furtherinvestigation is needed to see if the same is true on eyes with glaucoma and otherpathologies.
In conclusion, SD-OCT 3D cube data provide significantly lower RNFL thicknessmeasurement reproducibility compared with conventional TD-OCT (eg, Stratus OCT). Sincethe CO method does not have any advantage in measurement reproducibility over the CETmethod, the RNFL thickness measurement circle placement method employed by themanufacturer is clinically useful.
AcknowledgmentsFunding: National Institutes of Health contracts R01-EY13178-09, R01-EY11289-23 and P30-EY08098-20(Bethesda, Maryland), The Eye and Ear Foundation (Pittsburgh, Pennsylvania) and unrestricted grants fromResearch to Prevent Blindness (New York).
REFERENCES1. Schuman JS, Hee MR, Puliafito CA, et al. Quantification of nerve fiber layer thickness in normal
and glaucomatous eyes using optical coherence tomography. Arch Ophthalmol 1995;113:586–96.[PubMed: 7748128]
2. Kamal DS, Bunce C, Hitchings RA. Use of the GDx to detect differences in retinal nerve fibre layerthickness between normal, ocular hypertensive and early glaucomatous eyes. Eye 2000;14:367–70.[PubMed: 11027002]
3. Wollstein G, Schuman JS, Price LL, et al. Optical coherence tomography longitudinal evaluation ofretinal nerve fiber layer thickness in glaucoma. Arch Ophthalmol 2005;123:464–70. [PubMed:15824218]
4. Huang D, Swanson EA, Lin CP, et al. Optical coherence tomography. Science 1991;254:1178–81.[PubMed: 1957169]
5. Schuman JS, Hee MR, Arya AV, et al. Optical coherence tomography: a new tool for glaucomadiagnosis. Curr Opin Ophthalmol 1995;6:89–95. [PubMed: 10150863]
6. Ishikawa H, Piette S, Liebmann JM, et al. Detecting the inner and outer borders of the retinal nervefiber layer using optical coherence tomography. Graefes Arch Clin Exp Ophthalmol 2002;240:362–71. [PubMed: 12073059]
7. Schuman JS, Pedut-Kloizman T, Hertzmark E, et al. Reproducibility of nerve fiber layer thicknessmeasurements using optical coherence tomography. Ophthalmology 1996;103:1889–98. [PubMed:8942887]
8. de Boer JF, Cense B, Park BH, et al. Improved signal-to-noise ratio in spectral-domain comparedwith time-domain optical coherence tomography. Opt Lett 2003;28:2067–9. [PubMed: 14587817]
9. Choma MA, Hsu K, Izatt JA. Swept source optical coherence tomography using an all-fiber 1300-nm ring laser source. J Biomed Opt 2005;10:44009. [PubMed: 16178643]
10. Wojtkowski M, Srinivasan V, Fujimoto JG, et al. Three-dimensional retinal imaging with high-speed ultrahigh-resolution optical coherence tomography. Ophthalmology 2005;112:1734–46.[PubMed: 16140383]
11. Nassif N, Cense B, Park BH, et al. In vivo human retinal imaging by ultrahigh-speed spectraldomain optical coherence tomography. Opt Lett 2004;29:480–2. [PubMed: 15005199]
12. Wojtkowski M, Bajraszewski T, Gorczynska I, et al. Ophthalmic imaging by spectral opticalcoherence tomography. Am J Ophthalmol 2004;138:412–19. [PubMed: 15364223]
13. Rasband, WS. ImageJ. 1.39 ed. US National Institutes of Health; Bethesda: 1997–2006.14. Thévenaz P, Ruttimann UE, Unser M. A pyramid approach to subpixel registration based on
intensity. IEEE Trans Image Process 1998;7:27–41. [PubMed: 18267377]
Kim et al. Page 6
Br J Ophthalmol. Author manuscript; available in PMC 2010 April 29.
NIH
-PA Author Manuscript
NIH
-PA Author Manuscript
NIH
-PA Author Manuscript

15. Pinheiro, JC.; Bates, DM. Mixed-effects models in S and S-PLUS. Springer; New York: 2000.16. Demidenko, E. Mixed models: theory and applications. Wiley; Hoboken: 2004.17. Sahai, H.; Ojeda, MM. Analysis of variance for random models: theory, methods, applications, and
data analysis. Vol. Vol. I. Birkhäuser; Boston: 2004.18. Gabriele ML, Ishikawa H, Wollstein G, et al. Optical coherence tomography scan circle location
and mean retinal nerve fiber layer measurement variability. Invest Ophthalmol Vis Sci2008;49:2315–21. [PubMed: 18515577]
Kim et al. Page 7
Br J Ophthalmol. Author manuscript; available in PMC 2010 April 29.
NIH
-PA Author Manuscript
NIH
-PA Author Manuscript
NIH
-PA Author Manuscript
Figure 1.(A) Major sources of retinal nerve fibre layer thickness measurement variability using 3.4mm circular time-domain optical coherence tomography scan centred on the optic nervehead. Schematic presentation of sampling points scattered along 3.4 mm diameter circle dueto eye motion during the scan (left). Scanning circle placement may vary from scan to scan(right; yellow, green, and blue circles). (B) Spectral-domain optical coherence tomographyfundus (en face) image, generated by summing the back scattering signal at each axial scanon the retina. The pseudo-three-dimensional representation on the upper-left shows thedirection of summation, and the output image (optical coherence tomography fundus image)is shown on the upper right. Eye motion is detected as disrupted retinal vessels on an optical
Kim et al. Page 8
Br J Ophthalmol. Author manuscript; available in PMC 2010 April 29.
NIH
-PA Author Manuscript
NIH
-PA Author Manuscript
NIH
-PA Author Manuscript

coherence tomography fundus image (lower-left), which can be emphasised with edge-detection filtering (lower-right).
Kim et al. Page 9
Br J Ophthalmol. Author manuscript; available in PMC 2010 April 29.
NIH
-PA Author Manuscript
NIH
-PA Author Manuscript
NIH
-PA Author Manuscript
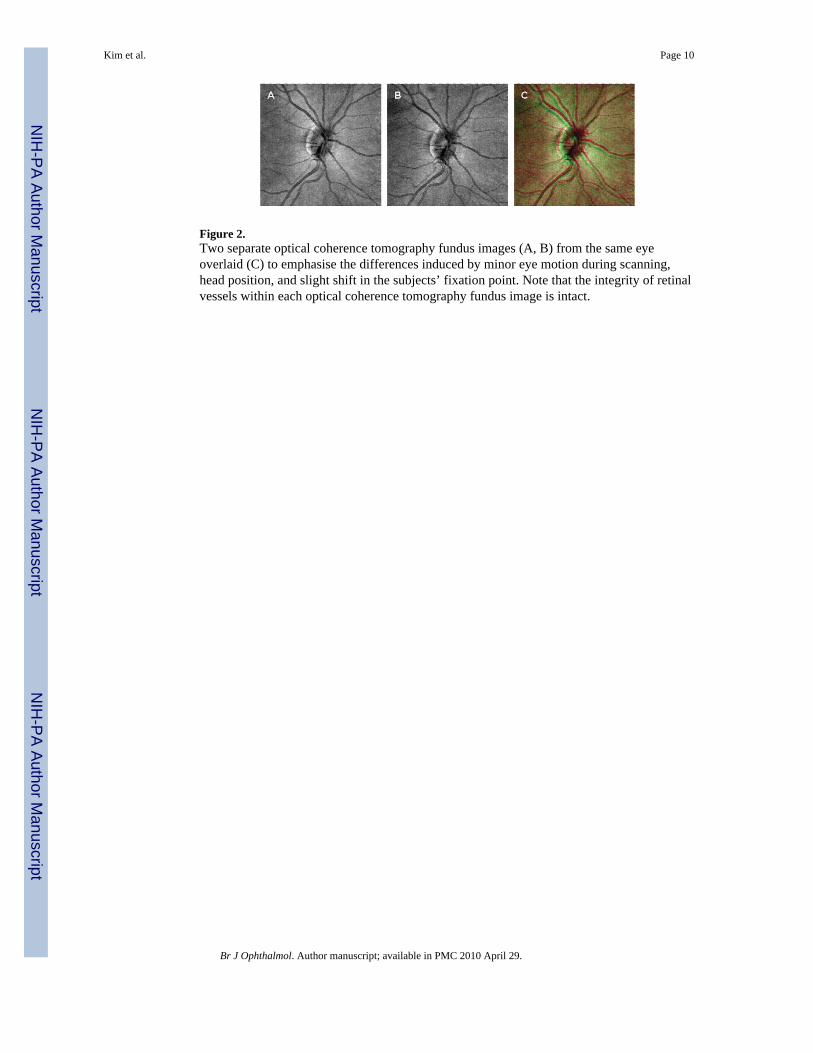
Figure 2.Two separate optical coherence tomography fundus images (A, B) from the same eyeoverlaid (C) to emphasise the differences induced by minor eye motion during scanning,head position, and slight shift in the subjects’ fixation point. Note that the integrity of retinalvessels within each optical coherence tomography fundus image is intact.
Kim et al. Page 10
Br J Ophthalmol. Author manuscript; available in PMC 2010 April 29.
NIH
-PA Author Manuscript
NIH
-PA Author Manuscript
NIH
-PA Author Manuscript
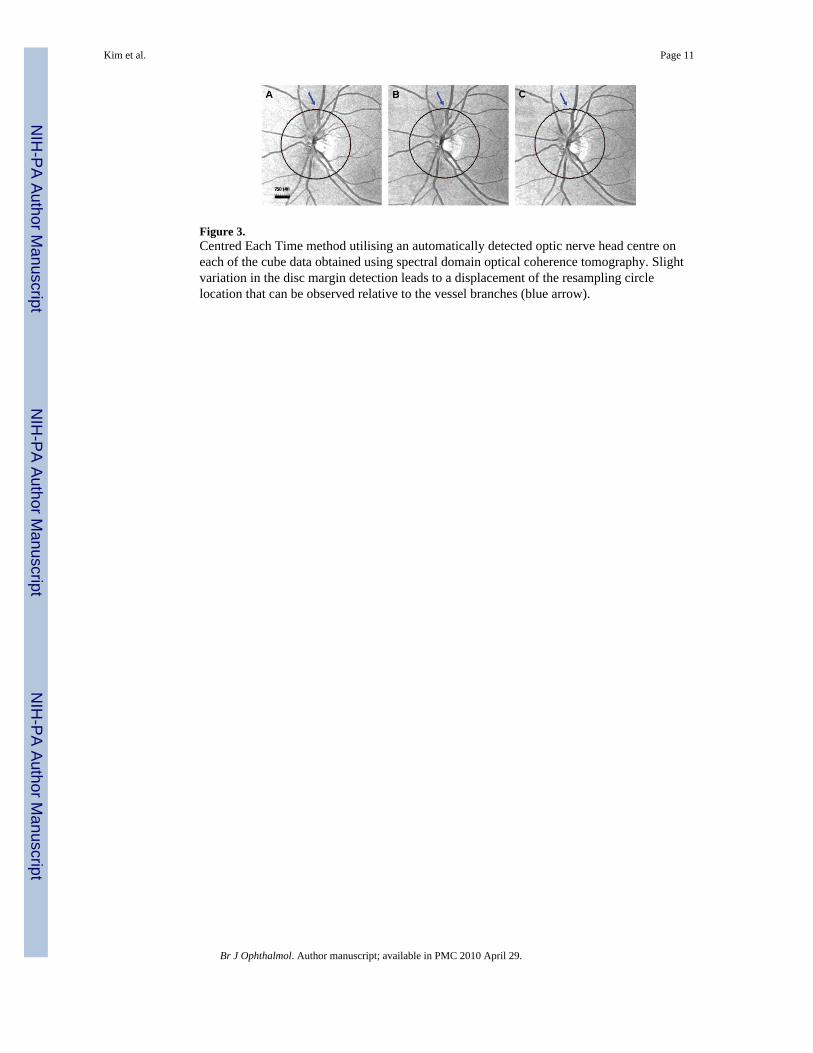
Figure 3.Centred Each Time method utilising an automatically detected optic nerve head centre oneach of the cube data obtained using spectral domain optical coherence tomography. Slightvariation in the disc margin detection leads to a displacement of the resampling circlelocation that can be observed relative to the vessel branches (blue arrow).
Kim et al. Page 11
Br J Ophthalmol. Author manuscript; available in PMC 2010 April 29.
NIH
-PA Author Manuscript
NIH
-PA Author Manuscript
NIH
-PA Author Manuscript
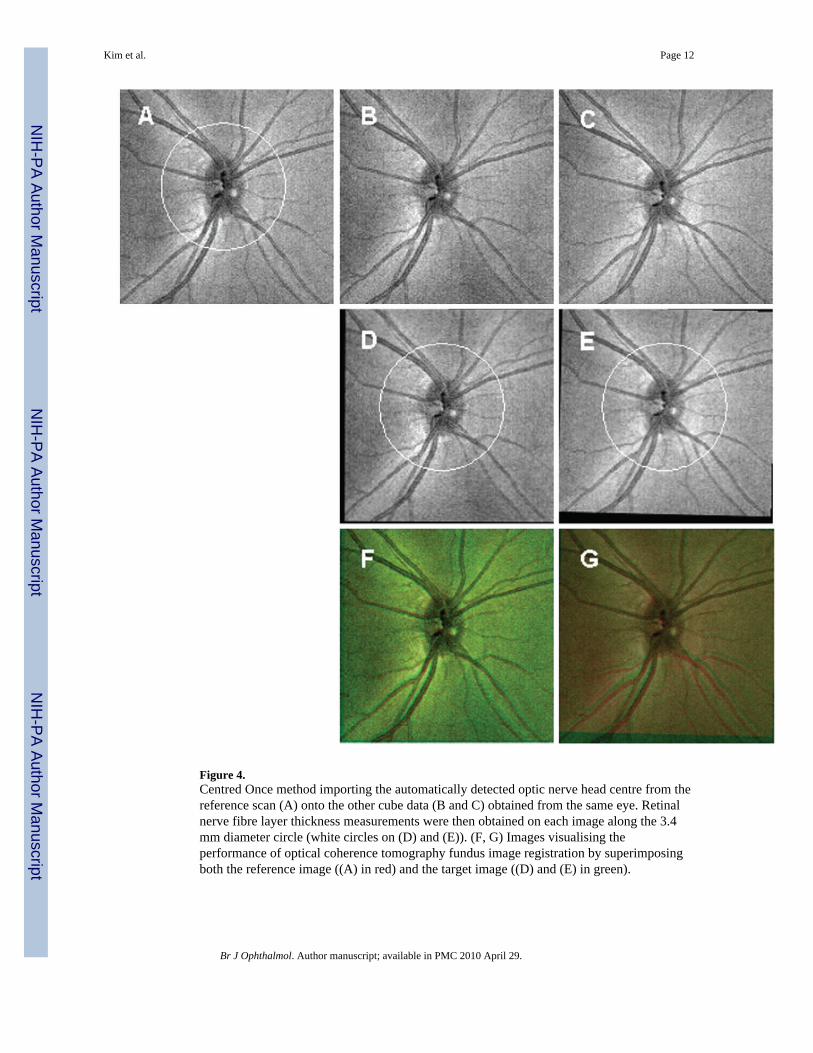
Figure 4.Centred Once method importing the automatically detected optic nerve head centre from thereference scan (A) onto the other cube data (B and C) obtained from the same eye. Retinalnerve fibre layer thickness measurements were then obtained on each image along the 3.4mm diameter circle (white circles on (D) and (E)). (F, G) Images visualising theperformance of optical coherence tomography fundus image registration by superimposingboth the reference image ((A) in red) and the target image ((D) and (E) in green).
Kim et al. Page 12
Br J Ophthalmol. Author manuscript; available in PMC 2010 April 29.
NIH
-PA Author Manuscript
NIH
-PA Author Manuscript
NIH
-PA Author Manuscript

Figure 5.Square root of scan variance component (“SD”) plot from table 3. The reproducibility ofboth Centred Each Time (CET) and Centred Once (CO) methods was uniformly andsubstantially better than time-domain optical coherence tomography (TD-OCT) and thedifferences were statistically significant.
Kim et al. Page 13
Br J Ophthalmol. Author manuscript; available in PMC 2010 April 29.
NIH
-PA Author Manuscript
NIH
-PA Author Manuscript
NIH
-PA Author Manuscript
NIH
-PA Author Manuscript
NIH
-PA Author Manuscript
NIH
-PA Author Manuscript
Kim et al. Page 14
Tabl
e 1
Mea
n (S
D) r
etin
al n
erve
fibr
e la
yer t
hick
ness
mea
sure
men
ts o
f eac
h m
etho
d
Spec
tral
-dom
ain
optic
al c
oher
ence
tom
ogra
phy
Para
met
erT
ime-
dom
ain
optic
alco
here
nce
tom
ogra
phy
(μm
)C
entr
ed E
ach
Tim
e (μ
m)
Cen
tred
Onc
e (μ
m)
Glo
bal m
ean
107.
52 (9
.89)
97.4
2 (8
.06)
97.4
3 (8
.01)
Q
uadr
ants
Tem
pora
l80
.40
(19.
40)
67.0
7 (1
1.30
)66
.96
(11.
38)
Supe
rior
131.
24 (1
0.65
)12
4.31
(11.
05)
125.
05 (1
1.17
)
Nas
al80
.05
(17.
09)
67.9
5 (1
3.85
)67
.90
(13.
52)
Infe
rior
138.
36 (1
6.41
)13
0.40
(13.
64)
129.
65 (1
3.61
)
C
lock
hou
r
111
9.65
(18.
28)
111.
15 (1
9.19
)11
1.91
(19.
36)
296
.73
(26.
47)
84.5
8 (2
1.93
)84
.53
(21.
63)
365
.06
(15.
04)
54.4
1 (1
0.08
)54
.27
(10.
05)
478
.32
(17.
37)
64.8
5 (1
6.47
)64
.89
(16.
15)
511
5.01
(21.
02)
105.
89 (2
2.41
)10
5.32
(21.
91)
614
6.45
(25.
23)
138.
41 (2
3.24
)13
7.14
(24.
17)
715
3.65
(25.
91)
146.
95 (2
6.95
)14
6.54
(27.
15)
884
.42
(22.
93)
69.8
3 (1
5.55
)70
.26
(15.
76)
961
.52
(15.
89)
51.3
8 (8
.61)
51.1
6 (8
.59)
1095
.33
(23.
71)
79.8
4 (1
3.17
)79
.49
(13.
20)
1114
3.35
(21.
48)
137.
00 (2
0.35
)13
7.11
(20.
70)
1213
0.72
(19.
64)
124.
78 (2
1.16
)12
6.31
(21.
64)
Br J Ophthalmol. Author manuscript; available in PMC 2010 April 29.
NIH
-PA Author Manuscript
NIH
-PA Author Manuscript
NIH
-PA Author Manuscript
Kim et al. Page 15
Tabl
e 2
Rep
rodu
cibi
lity
(var
ianc
e co
mpo
nent
s) ra
tios w
ith 9
5% c
onfid
ence
inte
rval
s am
ong
the
test
ed m
etho
ds
CE
T v
s TD
-OC
TC
O v
s TD
-OC
TC
ET
vs C
O
Para
met
erL
ower
Est
imat
edU
pper
Low
erE
stim
ated
Upp
erL
ower
Est
imat
edU
pper
Glo
bal m
ean
0.27
20.
370
0.50
50.
259
0.35
30.
481
0.73
30.
953
1.23
9
Q
uadr
ants
Tem
pora
l0.
186
0.24
60.
325
0.21
90.
290
0.38
40.
905
1.18
01.
540
Supe
rior
0.22
70.
287
0.36
30.
212
0.26
90.
341
0.80
41.
008
1.26
4
Nas
al0.
273
0.34
70.
441
0.32
30.
410
0.52
20.
978
1.23
01.
545
Infe
rior
0.42
90.
546
0.69
40.
448
0.57
00.
724
0.77
10.
988
1.26
6
C
lock
hou
r
10.
402
0.52
40.
683
0.35
40.
462
0.60
30.
716
0.89
91.
129
20.
433
0.57
40.
760
0.47
20.
625
0.82
60.
837
1.08
91.
417
30.
414
0.54
20.
709
0.42
60.
557
0.72
80.
825
1.02
71.
277
40.
423
0.53
70.
683
0.44
00.
559
0.71
10.
986
1.24
11.
563
50.
474
0.60
20.
765
0.52
20.
663
0.84
20.
940
1.19
51.
520
60.
341
0.46
30.
630
0.31
20.
424
0.57
60.
706
0.91
51.
186
70.
451
0.59
90.
797
0.48
80.
647
0.85
90.
828
1.08
01.
409
80.
385
0.50
90.
672
0.43
20.
570
0.75
30.
861
1.12
01.
456
90.
258
0.34
20.
453
0.25
90.
343
0.45
50.
772
1.00
41.
306
100.
247
0.33
00.
440
0.21
10.
282
0.37
70.
656
0.85
61.
116
110.
598
0.77
41.
002
0.59
60.
771
0.99
80.
791
0.99
71.
256
120.
472
0.66
40.
935
0.38
80.
546
0.76
70.
637
0.82
21.
060
Whe
n a
ratio
is e
qual
to o
ne, r
epro
duci
bilit
ies (
varia
nce
com
pone
nts (
VC
s)) a
re id
entic
al. C
entre
d Ea
ch T
ime
(CET
) and
Cen
tred
Onc
e (C
O) m
etho
ds sh
owed
stat
istic
ally
sign
ifica
ntly
smal
ler V
C ra
tios t
han
time-
dom
ain
optic
al c
oher
ence
tom
ogra
phy
(TD
-OC
T) e
xcep
t for
11
o’cl
ock
with
CET
. The
re w
as n
o st
atis
tical
ly si
gnifi
cant
diff
eren
ce in
repr
oduc
ibili
ty (V
C) r
atio
s bet
wee
n C
ET a
nd C
O.
Br J Ophthalmol. Author manuscript; available in PMC 2010 April 29.
NIH
-PA Author Manuscript
NIH
-PA Author Manuscript
NIH
-PA Author Manuscript
Kim et al. Page 16
Tabl
e 3
Intra
clas
s cor
rela
tion
coef
ficie
nts (
ICC
s), s
quar
e ro
ot o
f sca
n va
rianc
e co
mpo
nent
(whi
ch is
app
roxi
mat
ely
the
aver
age
SD o
f all
eyes
) and
squa
re ro
ot o
fth
e sc
an v
aria
nce
com
pone
nt o
ver t
he p
aram
eter
mea
n fo
r eac
h m
etho
d fo
r the
scan
s
ICC
Squa
re r
oot o
f sca
n va
rian
ceco
mpo
nent
(“SD
,” μ
m)
Squa
re r
oot o
f sca
n va
rian
ceco
mpo
nent
/par
amet
er m
ean
Para
met
erT
D-O
CT
CE
TC
OT
D-O
CT
CE
TC
OT
D-O
CT
(%)
CE
T (%
)C
O (%
)
Glo
bal m
ean
0.89
40.
984
0.98
52.
921.
081.
032.
71.
11.
1
。Q
uadr
ants
。。Te
mpo
ral
0.91
10.
994
0.99
24.
491.
101.
305.
61.
61.
9
。。Su
perio
r0.
646
0.74
20.
756
7.48
4.75
4.41
5.7
3.8
3.5
。。N
asal
0.69
60.
885
0.86
38.
842.
623.
2211
.03.
94.
7
。。In
ferio
r0.
678
0.83
90.
840
8.97
3.63
3.59
6.5
2.8
2.8
。C
lock
hou
r
。。1
0.76
40.
866
0.87
88.
634.
313.
887.
23.
93.
5
。。2
0.91
50.
970
0.96
57.
094.
074.
437.
34.
85.
2
。。3
0.76
10.
860
0.85
75.
893.
053.
139.
15.
65.
8
。。4
0.70
20.
853
0.82
49.
663.
914.
8512
.36.
07.
5
。。5
0.71
20.
845
0.82
111
.14
5.05
6.03
9.7
4.8
5.7
。。6
0.86
50.
968
0.97
29.
504.
404.
096.
53.
23.
0
。。7
0.93
00.
973
0.96
97.
314.
384.
734.
83.
03.
2
。。8
0.91
70.
977
0.97
25.
452.
783.
116.
54.
04.
4
。。9
0.90
80.
988
0.98
83.
641.
241.
255.
92.
42.
4
。。10
0.84
30.
980
0.98
57.
152.
362.
027.
53.
02.
5
。。11
0.62
90.
739
0.74
113
.57
10.5
010
.47
9.5
7.7
7.6
。。12
0.84
20.
924
0.94
78.
815.
854.
816.
74.
73.
8
Tem
pora
l is t
he lo
wes
t ran
dom
err
or in
all
thre
e m
etho
ds o
ut o
f qua
dran
ts. I
n ab
solu
te te
rms,
nasa
l and
infe
rior a
re si
mila
r but
are
reve
rsed
in re
lativ
e te
rms (
squa
re ro
ot o
f sca
n va
rianc
e co
mpo
nent
ove
rpa
ram
eter
mea
n).
CET
, Cen
tred
Each
Tim
e; C
O, C
entre
d O
nce;
TD
-OC
T, ti
me-
dom
ain
optic
al c
oher
ence
tom
ogra
phy.
Br J Ophthalmol. Author manuscript; available in PMC 2010 April 29.
Related Documents