Retinal blood flow analysis using joint Spectral and Time domain Optical Coherence Tomography Anna Szkulmowska, Maciej Szkulmowski, Tomasz Bajraszewski, Andrzej Kowalczyk, Maciej Wojtkowski Institute of Physics, Nicolaus Copernicus University, ul. Grudziadzka 5, PL87-100 Torun, Poland ABSTRACT We propose a new technique of measuring and analysis of OCT signals: joint Spectral and Time domain Optical Coherence Tomography (STdOCT). This technique is based on a multiple spectral interferogram registration in time increments. The analysis of a single spectral interferogram provides an axial structure of a sample. The analysis of signals registered in time enables velocity estimation of moving sample. The method is applied to biomedical imaging, in particular to in vivo measurements of retinal blood circulation. The velocity estimations obtained with joint STdOCT are compared with the ones obtained by known, phase-resolved OCT. In contrast to the phase – resolved technique, STdOCT correctly reproduces parabolic shape of the flow velocity distribution despite decreasing signal-to-noise ratio (SNR). Keywords: Optical Coherence Tomography, Fourier methods, Doppler flow analysis 1. INTRODUCTION Optical Coherence Tomography (OCT) provides cross-sectional images of internal structure of objects with micrometer resolution. OCT can be performed using either time 1 or frequency domain detection 2 . The latter can be implemented in two ways: by analysis of spectral interference fringe signal i.e. Spectral OCT (SOCT) 3 and by using a narrowband wavelength-swept laser sources, i.e. optical frequency domain imaging (OFDI) 4 or Swept-Source OCT (SS-OCT) 5 . Spectral OCT is particularly useful for medical examinations 6, 7 . In addition to morphological images, SOCT can provide visualization of a physiological parameters 8-12 . Such functional imaging can be a powerful tool both for fundamental studies of the retina and for the early ophthalmic diagnosis. The retinal blood flow is an important physical parameter in the functional studies. The experiments demonstrating measurements of bidirectional flow by Spectral OCT have been demonstrated by many groups 9, 13, 14 . In all of these publications, authors used the same analysis scheme based on direct, linear dependence between the phase difference of consecutive spectral fringe signals and the velocity of the moving sample. This technique is analogous to phase-resolved approach applied in the OCT methods with the time domain detection 15 . Two main factors deteriorating and even precluding velocity recovery in the phase-resolved techniques are: phase instabilities and low SNR. Both problems frequently occur in OCT measurements in vivo of biomedical objects. Recently, Bachmann et al. 16 proposed a method of the quantitative flow analysis based on intensity measurements to minimize the influence of phase instabilities. For similar reasons Wang et al. 17 proposed a qualitative approach to retinal blood flow imaging, that relies on introducing a constant Doppler frequency to separate mobile and static components within sample. The idea of using frequency modulation in SOCT was first put forward by Yasuno et al. in 2006 18 , although not to image velocity distribution but to achieve the full range imaging. In this paper we present an alternative method of measuring and processing of OCT signals yielding information on the spatial distribution of flow velocities. We propose simultaneous spectral and time domain detection of interferometric OCT signals (joint STdOCT). The information about the velocity is obtained from the time dependent beating frequency due to the Doppler shift between the reference and the sample light beams. Since the velocity estimation is not based on Ophthalmic Technologies XVIII, edited by Fabrice Manns, Per G. Söderberg, Arthur Ho, Bruce E. Stuck, Michael Belkin, Proc. of SPIE Vol. 6844, 68440K, (2008) · 1605-7422/08/$18 · doi: 10.1117/12.762725 Proc. of SPIE Vol. 6844 68440K-1

Welcome message from author
This document is posted to help you gain knowledge. Please leave a comment to let me know what you think about it! Share it to your friends and learn new things together.
Transcript
Retinal blood flow analysis using joint Spectral and Time domain Optical Coherence Tomography
Anna Szkulmowska, Maciej Szkulmowski, Tomasz Bajraszewski,
Andrzej Kowalczyk, Maciej Wojtkowski
Institute of Physics, Nicolaus Copernicus University, ul. Grudziadzka 5, PL87-100 Torun, Poland
ABSTRACT
We propose a new technique of measuring and analysis of OCT signals: joint Spectral and Time domain Optical Coherence Tomography (STdOCT). This technique is based on a multiple spectral interferogram registration in time increments. The analysis of a single spectral interferogram provides an axial structure of a sample. The analysis of signals registered in time enables velocity estimation of moving sample. The method is applied to biomedical imaging, in particular to in vivo measurements of retinal blood circulation. The velocity estimations obtained with joint STdOCT are compared with the ones obtained by known, phase-resolved OCT. In contrast to the phase – resolved technique, STdOCT correctly reproduces parabolic shape of the flow velocity distribution despite decreasing signal-to-noise ratio (SNR).
Keywords: Optical Coherence Tomography, Fourier methods, Doppler flow analysis
1. INTRODUCTION Optical Coherence Tomography (OCT) provides cross-sectional images of internal structure of objects with micrometer resolution. OCT can be performed using either time1 or frequency domain detection 2. The latter can be implemented in two ways: by analysis of spectral interference fringe signal i.e. Spectral OCT (SOCT) 3 and by using a narrowband wavelength-swept laser sources, i.e. optical frequency domain imaging (OFDI) 4 or Swept-Source OCT (SS-OCT)5. Spectral OCT is particularly useful for medical examinations 6, 7. In addition to morphological images, SOCT can provide visualization of a physiological parameters 8-12. Such functional imaging can be a powerful tool both for fundamental studies of the retina and for the early ophthalmic diagnosis. The retinal blood flow is an important physical parameter in the functional studies.
The experiments demonstrating measurements of bidirectional flow by Spectral OCT have been demonstrated by many groups 9, 13, 14. In all of these publications, authors used the same analysis scheme based on direct, linear dependence between the phase difference of consecutive spectral fringe signals and the velocity of the moving sample. This technique is analogous to phase-resolved approach applied in the OCT methods with the time domain detection 15. Two main factors deteriorating and even precluding velocity recovery in the phase-resolved techniques are: phase instabilities and low SNR. Both problems frequently occur in OCT measurements in vivo of biomedical objects. Recently, Bachmann et al. 16 proposed a method of the quantitative flow analysis based on intensity measurements to minimize the influence of phase instabilities. For similar reasons Wang et al. 17 proposed a qualitative approach to retinal blood flow imaging, that relies on introducing a constant Doppler frequency to separate mobile and static components within sample. The idea of using frequency modulation in SOCT was first put forward by Yasuno et al. in 2006 18, although not to image velocity distribution but to achieve the full range imaging.
In this paper we present an alternative method of measuring and processing of OCT signals yielding information on the spatial distribution of flow velocities. We propose simultaneous spectral and time domain detection of interferometric OCT signals (joint STdOCT). The information about the velocity is obtained from the time dependent beating frequency due to the Doppler shift between the reference and the sample light beams. Since the velocity estimation is not based on
Ophthalmic Technologies XVIII, edited by Fabrice Manns, Per G. Söderberg, Arthur Ho, Bruce E. Stuck,Michael Belkin, Proc. of SPIE Vol. 6844, 68440K, (2008) · 1605-7422/08/$18 · doi: 10.1117/12.762725
Proc. of SPIE Vol. 6844 68440K-1
ReferenceMirror
DG x
Eye
explicit extraction of phase information from interferometric fringes, the proposed variant of velocity estimation is significantly less sensitive to all undesired phase instabilities and free from phase-wrapping errors. Joint STdOCT does not require severe hardware modifications in a standard SOCT instrument. It rather involves a selection of specific measurement protocols and signal processing procedures based on two independent Fourier transforms performed both in time and optical frequency domain. We also demonstrate the potential of STdOCT to obtain information about flow velocities within the time frame required by a regular OCT imaging.
2. MATERIALS AND METHODS 2.1. Experimental setup
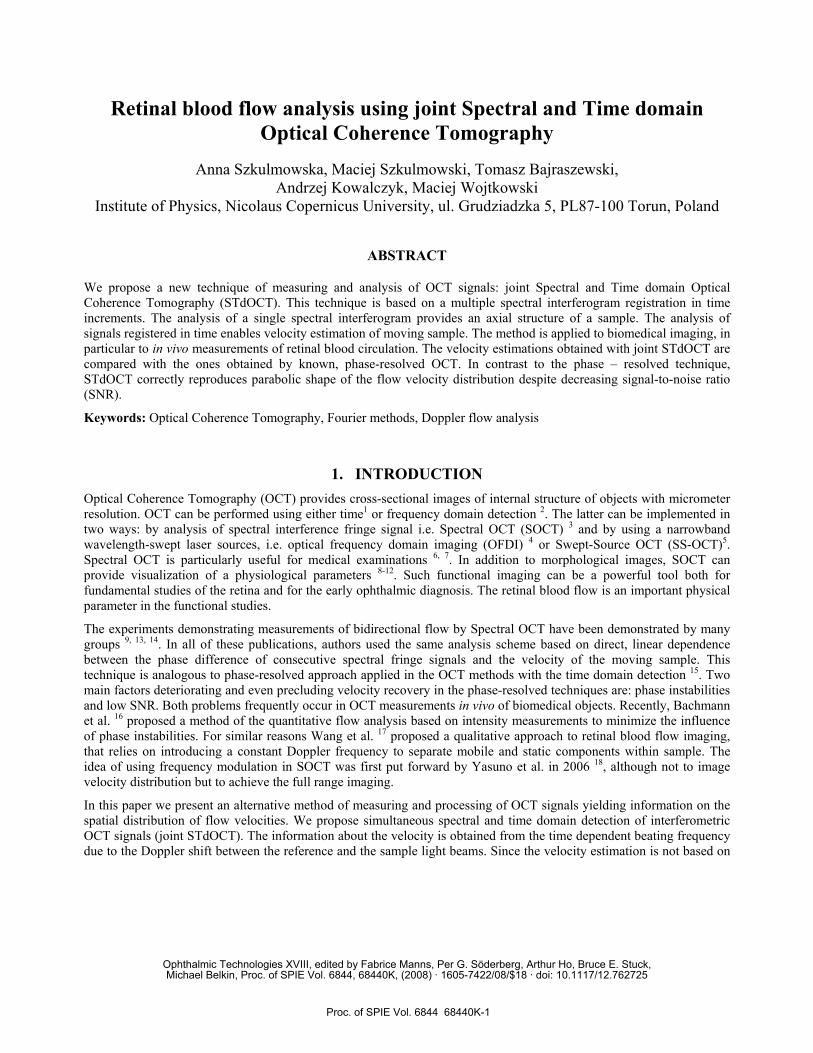
The proposed velocity estimation method is demonstrated using the SOCT system illustrated in Fig.1. The light ( λ∆ = 90 nm, central wavelength 840 nm, Broadlighter, Superlum) is coupled into a fiber-optic Michelson interferometer through an optical isolator OI and split into reference and object arms by a 50:50 fiber coupler FC. The collimated reference beam passes through a polarization controller PC, a dispersion compensator DC, neutral density filter NDF and it reflects from a fixed reference mirror. Two different configurations of the measurement head are used; for capillary flow imaging the galvo-scanner X and the lens L1 in the object arm move the probing beam across the object and for the human retina blood vessels imaging there is a pair of lenses creating telescope configuration and imaging the pivot of the galvo-scanner onto the eye’s pupil. The light returning from the sample and reference arms is brought to the interference. The interference signal is spectrally analysed and registered by the custom design spectrometer comprising the volume phase holographic grating DG (1200 grooves/mm) and an achromatic lens which focuses spectrum on 12-bit CCD line-scan camera (Aviiva M2, Atmel). The optical power for retinal imaging was 750 µW at the cornea.
Fig. 1. Spectral OCT system used for presented study: OI optical isolator, FC fiber coupler, PC polarization controller, DC dispersion compensator, NDF neutral density filter, X galvo-scanner, L1 lens, DG volume phase holographic grating, CCD line-scan camera.
Proc. of SPIE Vol. 6844 68440K-2
2.2. Theory
Let us assume that a sample contains L backreflecting interfaces and each l -th interface moves with an axial velocity
lv In Spectral OCT an interferometric fringes signal can be described as a function of wavenumber k and time t. The
movement results in the change in time of the optical path difference between the reference mirror and the l -th interface in the sample. Then an interferometric fringes signal can be expressed as:
( ) ( ) ( )( )⎟⎠
⎞⎜⎝
⎛⋅++= ∑∑
llrlr
ll ktzRRRRkStkI 2cos2, , (1)
where ( )tkI , is the spectral fringe signal, ( )kS is spectral density of the light source, rR and lR denote the reflectivity of the reference mirror and l -th interface within the sample, respectively. The information about the sample is encoded in spectral fringes described by the last term of Eq. 1. The time-dependent optical path difference between the reference mirror and the l -th interface in the sample is marked by ( )tzl .
Phase resolved SOCT
In phase-resolved SOCT the velocity of the l -th interface lv is recovered from the phase difference ∆Φ between successively recorded depth profiles at the same position of the probing beam. The expression Eq. 1 can be rewritten as:
( ) ( ) ( )⎟⎠
⎞⎜⎝
⎛+++= ∑∑
llrlr
ll kzzRRRRkStkI )(2cos2, δ (2)
The time-dependent optical path difference between the reference mirror and the l -th interface in the sample ( )tzl is
expressed as a static part lz and some extra difference zδ , that may occur if the l -th interface is moving. Knowing zδ
and the time t∆ between two consecutive measurements the velocity of the l -th interface can be calculated. Since zδ is much smaller than lz , the difference between two consecutive measurements appears as a phase change ∆Φ of Fourier transformed interferometric fringes signal. The velocity of the l -th interface can be calculated as:
π
λ ∆Φ∆
=∆
∆Φ=
ttkvl 42
, (3)
where λ is a wavelength corresponding to a central wavenumber 0k . To avoid π2 ambiguity in bi-directional flow
imaging the maximum detectable phase difference is π±=∆Φ±max . A simple phase-wrapping is applied: if π<∆Φ || , the phase shift is left as it is, and when ππ 2|| <∆Φ< , the phase shift is replaced by π2)(∆Φ−∆Φ sign . Usually to obtain better quality images, the velocity estimation is based on several averaged phase differences.
Upper and lower velocity measurement ranges are limited by maximum and minimum detectable phase difference, respectively. The minimum phase difference min∆Φ is equal to the standard deviation of the estimator of the phase
differences ∆Φσ and is limited by signal-to-noise ratio (SNR) of a measurement 19-21.
Proc. of SPIE Vol. 6844 68440K-3
fringes
VD velocity
::EEEEE } 2nd subset 1ileI I I
I _____________}lstsubsetS 0 5
______ 4Nsamples ID FT for each z
(a) of spectral fringes H along tL structural
/ for each t '1'••••••••••••••••r••••••••••••T5 aragin _______________________________________
(b)- along k 0 Z —s 0 5 Z
Joint STdOCT
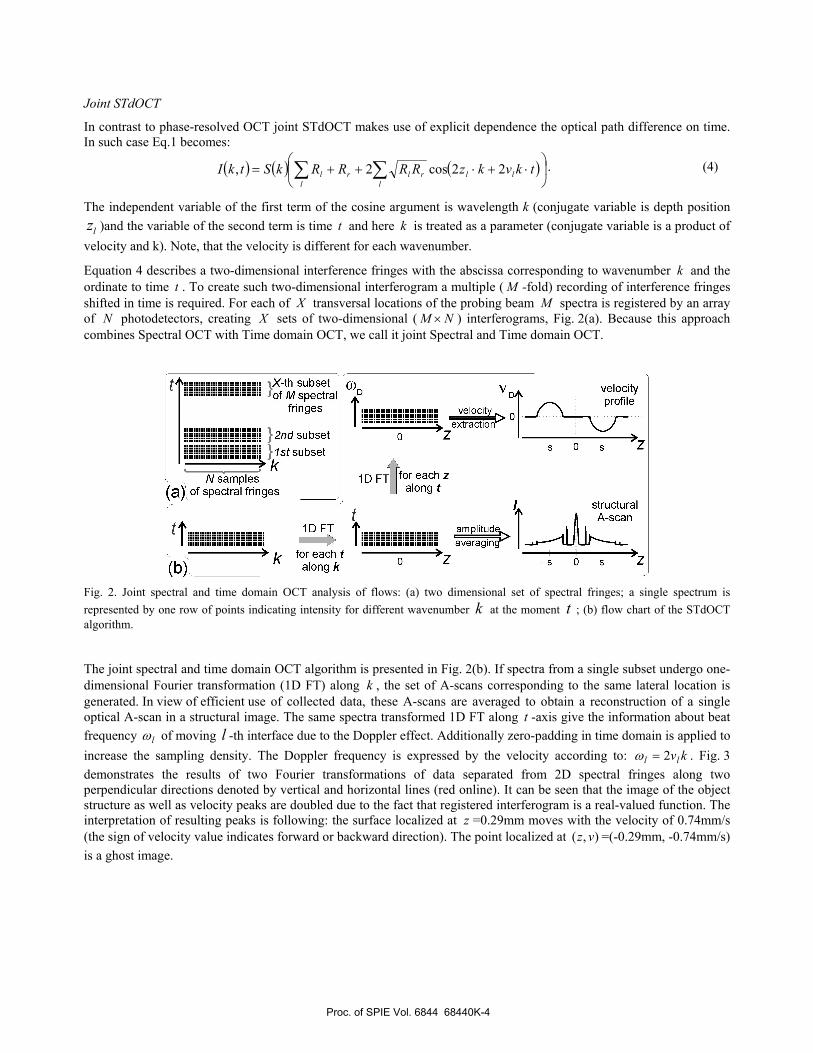
In contrast to phase-resolved OCT joint STdOCT makes use of explicit dependence the optical path difference on time. In such case Eq.1 becomes:
( ) ( ) ( )⎟⎠
⎞⎜⎝
⎛⋅+⋅++= ∑∑
lllrlr
ll tkvkzRRRRkStkI 22cos2, . (4)
The independent variable of the first term of the cosine argument is wavelength k (conjugate variable is depth position
lz )and the variable of the second term is time t and here k is treated as a parameter (conjugate variable is a product of velocity and k). Note, that the velocity is different for each wavenumber.
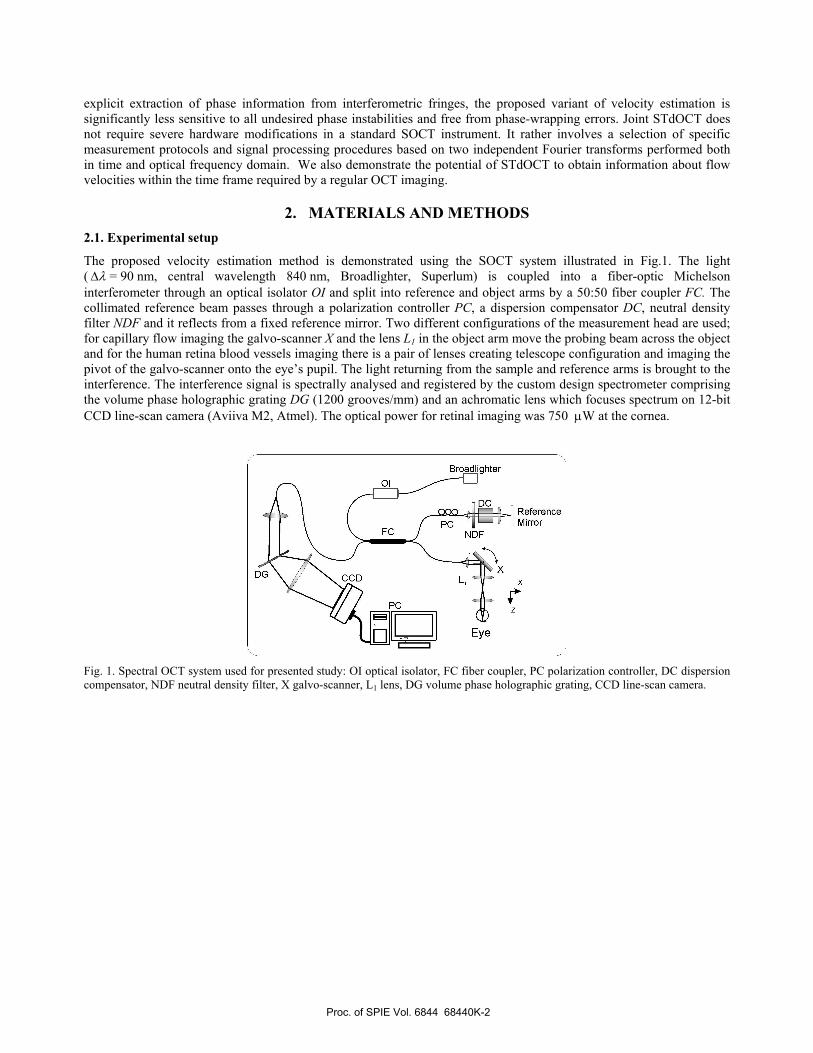
Equation 4 describes a two-dimensional interference fringes with the abscissa corresponding to wavenumber k and the ordinate to time t . To create such two-dimensional interferogram a multiple ( M -fold) recording of interference fringes shifted in time is required. For each of X transversal locations of the probing beam M spectra is registered by an array of N photodetectors, creating X sets of two-dimensional ( NM × ) interferograms, Fig. 2(a). Because this approach combines Spectral OCT with Time domain OCT, we call it joint Spectral and Time domain OCT.
Fig. 2. Joint spectral and time domain OCT analysis of flows: (a) two dimensional set of spectral fringes; a single spectrum is represented by one row of points indicating intensity for different wavenumber k at the moment t ; (b) flow chart of the STdOCT algorithm.
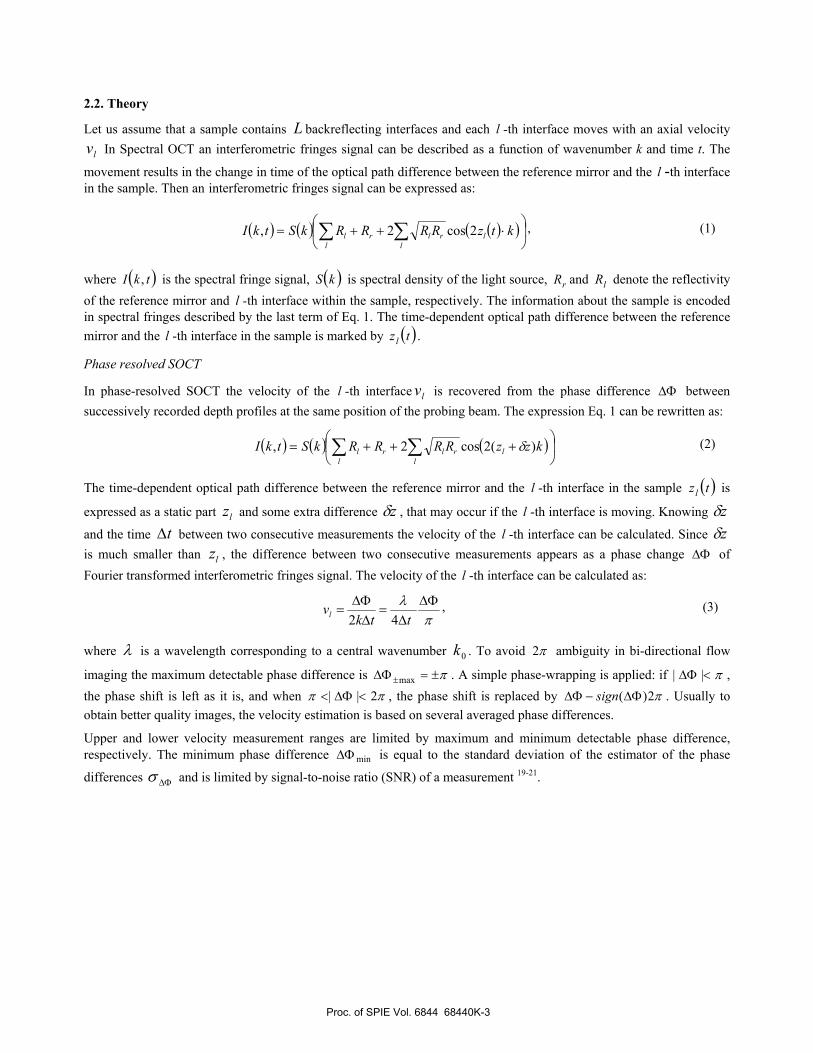
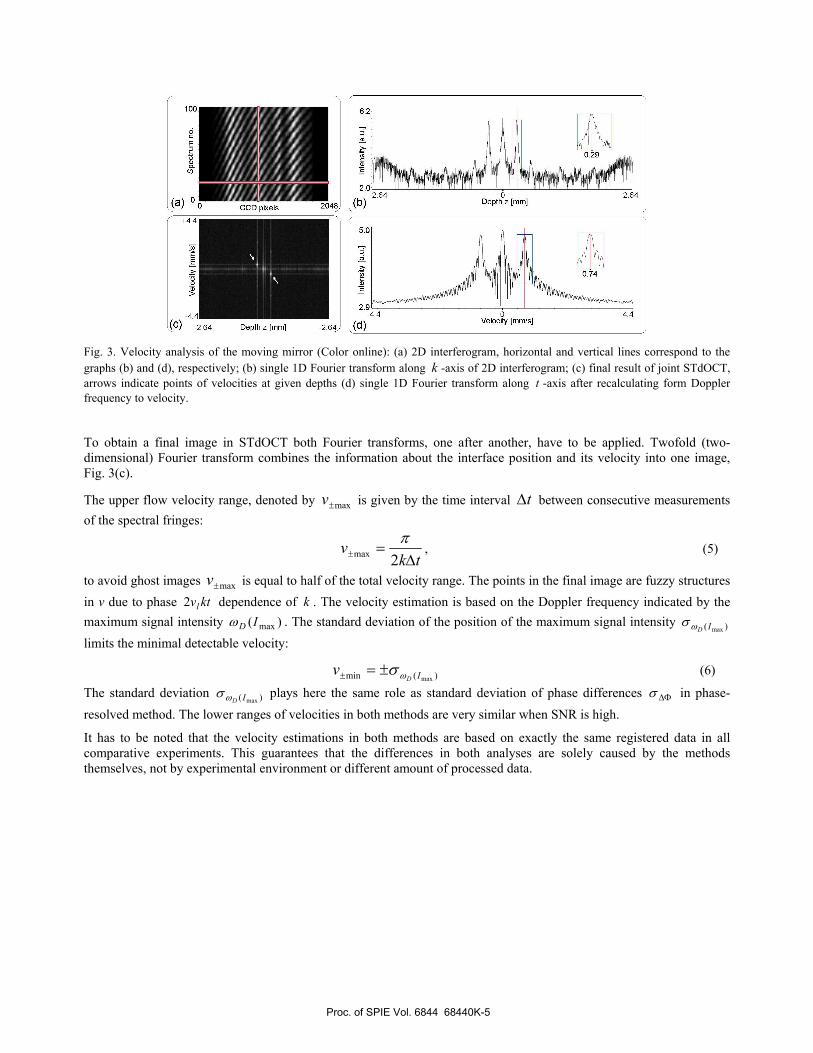
The joint spectral and time domain OCT algorithm is presented in Fig. 2(b). If spectra from a single subset undergo one-dimensional Fourier transformation (1D FT) along k , the set of A-scans corresponding to the same lateral location is generated. In view of efficient use of collected data, these A-scans are averaged to obtain a reconstruction of a single optical A-scan in a structural image. The same spectra transformed 1D FT along t -axis give the information about beat frequency lω of moving l -th interface due to the Doppler effect. Additionally zero-padding in time domain is applied to increase the sampling density. The Doppler frequency is expressed by the velocity according to: kvll 2=ω . Fig. 3 demonstrates the results of two Fourier transformations of data separated from 2D spectral fringes along two perpendicular directions denoted by vertical and horizontal lines (red online). It can be seen that the image of the object structure as well as velocity peaks are doubled due to the fact that registered interferogram is a real-valued function. The interpretation of resulting peaks is following: the surface localized at z =0.29mm moves with the velocity of 0.74mm/s (the sign of velocity value indicates forward or backward direction). The point localized at ),( vz =(-0.29mm, -0.74mm/s) is a ghost image.
Proc. of SPIE Vol. 6844 68440K-4
(a)
5.02.9-4.4 0
(c) -2 64 Depth z [mm] -2 64 (d)Velocity [mm/s]
Fig. 3. Velocity analysis of the moving mirror (Color online): (a) 2D interferogram, horizontal and vertical lines correspond to the graphs (b) and (d), respectively; (b) single 1D Fourier transform along k -axis of 2D interferogram; (c) final result of joint STdOCT, arrows indicate points of velocities at given depths (d) single 1D Fourier transform along t -axis after recalculating form Doppler frequency to velocity.
To obtain a final image in STdOCT both Fourier transforms, one after another, have to be applied. Twofold (two-dimensional) Fourier transform combines the information about the interface position and its velocity into one image, Fig. 3(c).
The upper flow velocity range, denoted by max±v is given by the time interval t∆ between consecutive measurements of the spectral fringes:
tk
v∆
=± 2maxπ
, (5)
to avoid ghost images max±v is equal to half of the total velocity range. The points in the final image are fuzzy structures in v due to phase ktvl2 dependence of k . The velocity estimation is based on the Doppler frequency indicated by the maximum signal intensity )( maxIDω . The standard deviation of the position of the maximum signal intensity )( maxIDωσ limits the minimal detectable velocity:
)(min maxIDv ωσ±=± (6)
The standard deviation )( maxIDωσ plays here the same role as standard deviation of phase differences ∆Φσ in phase-resolved method. The lower ranges of velocities in both methods are very similar when SNR is high.
It has to be noted that the velocity estimations in both methods are based on exactly the same registered data in all comparative experiments. This guarantees that the differences in both analyses are solely caused by the methods themselves, not by experimental environment or different amount of processed data.
Proc. of SPIE Vol. 6844 68440K-5
(a) Structural (b) STdOCT (c) Phasetomogram resolved
I I I
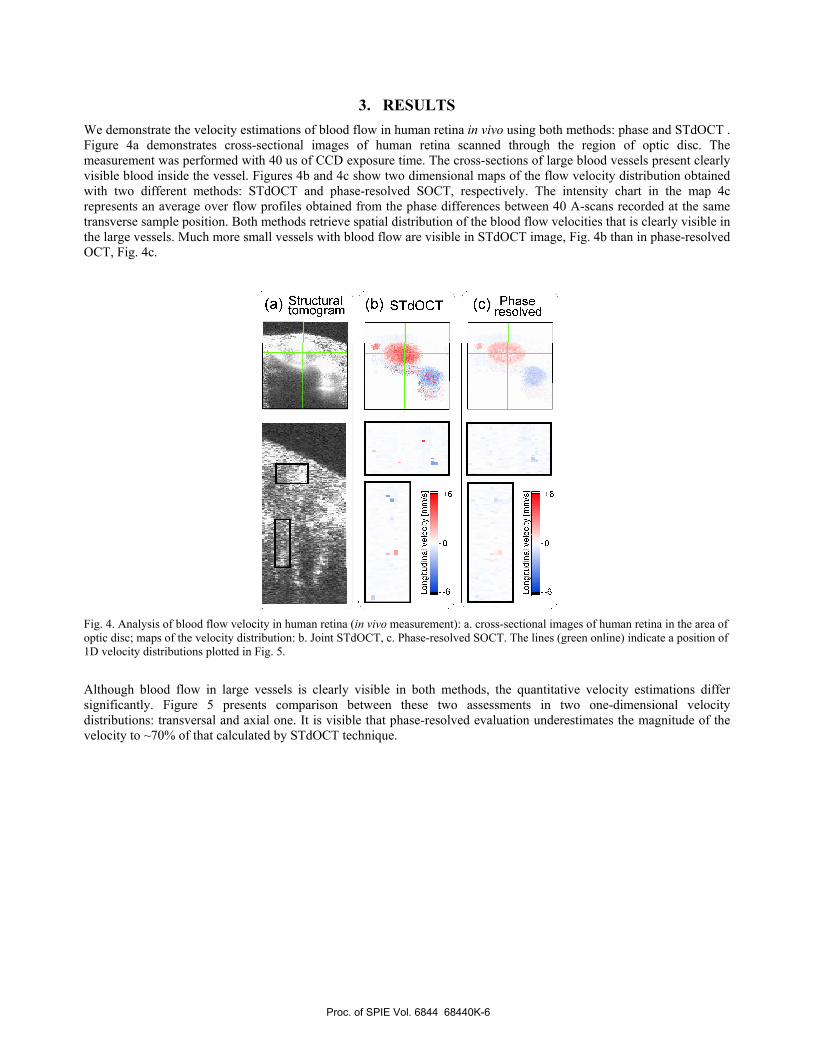
3. RESULTS We demonstrate the velocity estimations of blood flow in human retina in vivo using both methods: phase and STdOCT . Figure 4a demonstrates cross-sectional images of human retina scanned through the region of optic disc. The measurement was performed with 40 us of CCD exposure time. The cross-sections of large blood vessels present clearly visible blood inside the vessel. Figures 4b and 4c show two dimensional maps of the flow velocity distribution obtained with two different methods: STdOCT and phase-resolved SOCT, respectively. The intensity chart in the map 4c represents an average over flow profiles obtained from the phase differences between 40 A-scans recorded at the same transverse sample position. Both methods retrieve spatial distribution of the blood flow velocities that is clearly visible in the large vessels. Much more small vessels with blood flow are visible in STdOCT image, Fig. 4b than in phase-resolved OCT, Fig. 4c.
Fig. 4. Analysis of blood flow velocity in human retina (in vivo measurement): a. cross-sectional images of human retina in the area of optic disc; maps of the velocity distribution: b. Joint STdOCT, c. Phase-resolved SOCT. The lines (green online) indicate a position of 1D velocity distributions plotted in Fig. 5.
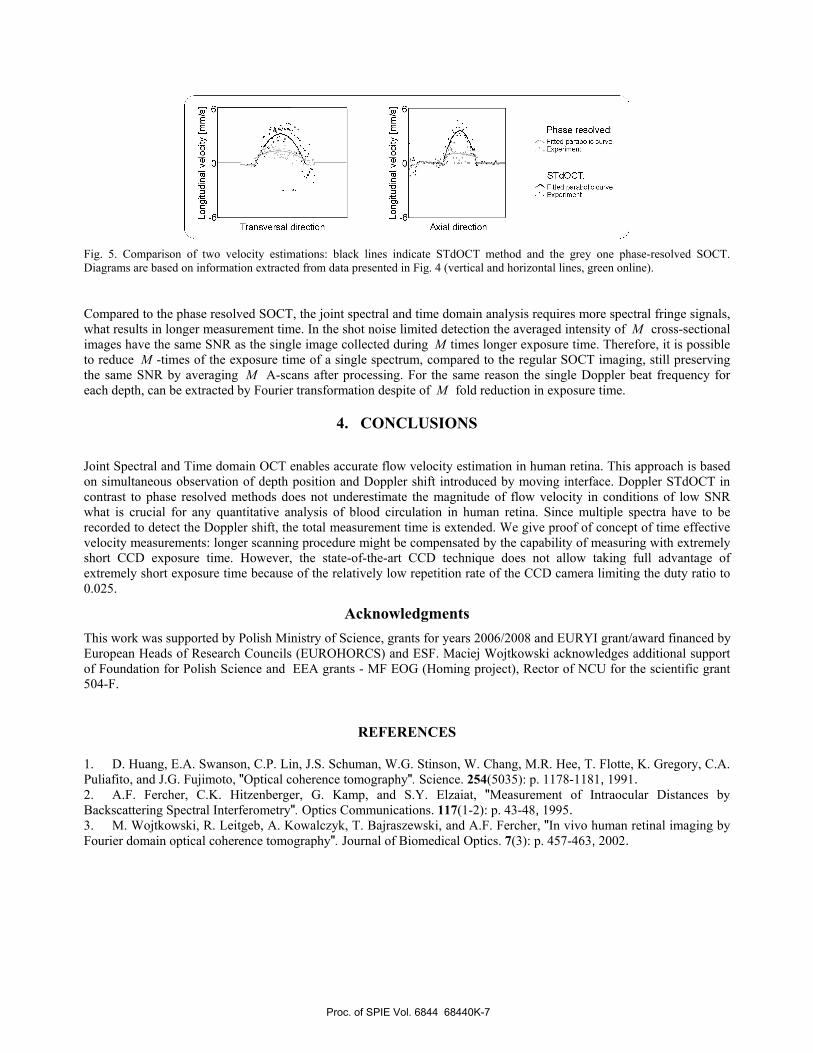
Although blood flow in large vessels is clearly visible in both methods, the quantitative velocity estimations differ significantly. Figure 5 presents comparison between these two assessments in two one-dimensional velocity distributions: transversal and axial one. It is visible that phase-resolved evaluation underestimates the magnitude of the velocity to ~70% of that calculated by STdOCT technique.
Proc. of SPIE Vol. 6844 68440K-6
E .. EC. Phase resolved:
A: ... "- Filled parabolic carve
8 8 : .Expecmect
;..
- .. - . STdOCT:"- Filled parabolic curve••. Experiment
0) 0)C C0 0-i-c _i_cTransversal direction Ajdal direction
Fig. 5. Comparison of two velocity estimations: black lines indicate STdOCT method and the grey one phase-resolved SOCT. Diagrams are based on information extracted from data presented in Fig. 4 (vertical and horizontal lines, green online).
Compared to the phase resolved SOCT, the joint spectral and time domain analysis requires more spectral fringe signals, what results in longer measurement time. In the shot noise limited detection the averaged intensity of M cross-sectional images have the same SNR as the single image collected during M times longer exposure time. Therefore, it is possible to reduce M -times of the exposure time of a single spectrum, compared to the regular SOCT imaging, still preserving the same SNR by averaging M A-scans after processing. For the same reason the single Doppler beat frequency for each depth, can be extracted by Fourier transformation despite of M fold reduction in exposure time.
4. CONCLUSIONS
Joint Spectral and Time domain OCT enables accurate flow velocity estimation in human retina. This approach is based on simultaneous observation of depth position and Doppler shift introduced by moving interface. Doppler STdOCT in contrast to phase resolved methods does not underestimate the magnitude of flow velocity in conditions of low SNR what is crucial for any quantitative analysis of blood circulation in human retina. Since multiple spectra have to be recorded to detect the Doppler shift, the total measurement time is extended. We give proof of concept of time effective velocity measurements: longer scanning procedure might be compensated by the capability of measuring with extremely short CCD exposure time. However, the state-of-the-art CCD technique does not allow taking full advantage of extremely short exposure time because of the relatively low repetition rate of the CCD camera limiting the duty ratio to 0.025.
Acknowledgments This work was supported by Polish Ministry of Science, grants for years 2006/2008 and EURYI grant/award financed by European Heads of Research Councils (EUROHORCS) and ESF. Maciej Wojtkowski acknowledges additional support of Foundation for Polish Science and EEA grants - MF EOG (Homing project), Rector of NCU for the scientific grant 504-F.
REFERENCES
1. D. Huang, E.A. Swanson, C.P. Lin, J.S. Schuman, W.G. Stinson, W. Chang, M.R. Hee, T. Flotte, K. Gregory, C.A. Puliafito, and J.G. Fujimoto, "Optical coherence tomography". Science. 254(5035): p. 1178-1181, 1991. 2. A.F. Fercher, C.K. Hitzenberger, G. Kamp, and S.Y. Elzaiat, "Measurement of Intraocular Distances by Backscattering Spectral Interferometry". Optics Communications. 117(1-2): p. 43-48, 1995. 3. M. Wojtkowski, R. Leitgeb, A. Kowalczyk, T. Bajraszewski, and A.F. Fercher, "In vivo human retinal imaging by Fourier domain optical coherence tomography". Journal of Biomedical Optics. 7(3): p. 457-463, 2002.
Proc. of SPIE Vol. 6844 68440K-7
4. S. Yun, G. Tearney, J. de Boer, N. Iftimia, and B. Bouma, "High-speed optical frequency-domain imaging". Optics Express. 11(22): p. 2953-2963, 2003. 5. M.A. Choma, M.V. Sarunic, C.H. Yang, and J.A. Izatt, "Sensitivity advantage of swept source and Fourier domain optical coherence tomography". Optics Express. 11(18): p. 2183-2189, 2003. 6. V.J. Srinivasan, M. Wojtkowski, A.J. Witkin, J.S. Duker, T.H. Ko, M. Carvalho, J.S. Schuman, A. Kowalczyk, and J.G. Fujimoto, "High-definifion and 3-dimensional imaging of macular pathologies with high-speed ultrahigh-resolution optical coherence tomography". Ophthalmology. 113(11): p. 2054-2065, 2006. 7. B.J. Kaluzy, J.J. Kaluzny, A. Szkulmowska, I. Gorczynska, M. Szkulmowski, T. Bajraszewski, M. Wojtkowski, and P. Targowski, "Spectral Optical Coherence Tomography: A Novel Technique for Cornea Imaging". Cornea. 25(8): p. 960-965, 2006. 8. R. Leitgeb, M. Wojtkowski, A. Kowalczyk, C.K. Hitzenberger, M. Sticker, and A.F. Fercher, "Spectral measurement of absorption by spectroscopic frequency-domain optical coherence tomography". Optics Letters. 25(11): p. 820-2, 2000. 9. R.A. Leitgeb, L. Schmetterer, W. Drexler, A.F. Fercher, R.J. Zawadzki, and T. Bajraszewski, "Real-time assessment of retinal blood flow with ultrafast acquisition by color Doppler Fourier domain optical coherence tomography". Optics Express. 11(23): p. 3116-3121, 2003. 10. Y. Yasuno, S. Makita, Y. Sutoh, M. Itoh, and T. Yatagai, "Birefringence imaging of human skin by polarization-sensitive spectral interferometric optical coherence tomography". Opt Lett. 27(20): p. 1803-1805, 2002. 11. M.A. Choma, A.K. Ellerbee, S. Yazdanfar, and J.A. Izatt, "Doppler flow imaging of cytoplasmic streaming using spectral domain phase microscopy". Journal of Biomedical Optics. 11(2) 2006. 12. F. Rothenberg, A.M. Davis, and J.A. Izatt, "Non-invasive investigations of early embryonic cardiac blood flow with optical coherence tomography". Faseb Journal. 20(4): p. A451-A451, 2006. 13. B.R. White, M.C. Pierce, N. Nassif, B. Cense, B.H. Park, G.J. Tearney, B.E. Bouma, T.C. Chen, and J.F. de Boer, "In vivo dynamic human retinal blood flow imaging using ultra-high-speed spectral domain optical Doppler tomography". Optics Express. 11(25): p. 3490-3497, 2003. 14. S. Makita, Y. Hong, M. Yamanari, T. Yatagai, and Y. Yasuno, "Optical coherence angiography". Optics Express. 14(17): p. 7821-7840, 2006. 15. Y. Zhao, Z. Chen, C. Saxer, S. Xiang, J.F. de Boer, and J.S. Nelson, "Phase-resolved optical coherence tomography and optical Doppler tomography for imaging blood flow in human skin with fast scanning speed and high velocity sensitivity". Optics Letters. 25(2): p. 114-16, 2000. 16. A.H. Bachmann, M.L. Villiger, C. Blatter, T. Lasser, and R.A. Leitgeb, "Resonant Doppler flow imaging and optical vivisection of retinal blood vessels". 15(2): p. 408-422, 2007. 17. R.K. Wang, S.L. Jacques, Z. Ma, S. Hurst, S.R. Hanson, and A. Gruber, "Three dimensional optical angiography". 15(7): p. 4083-4097, 2007. 18. Y. Yasuno, S. Makita, T. Endo, G. Aoki, M. Itoh, and T. Yatagai, "Simultaneous BM-mode scanning method for real-time full-range Fourier domain optical coherence tomography". 45(8): p. 1861-1865, 2006. 19. S. Yazdanfar, C. Yang, M. Sarunic, and J. Izatt, "Frequency estimation precision in Doppler optical coherence tomography using the Cramer-Rao lower bound". 13(2): p. 410-416, 2005. 20. B.H. Park, M.C. Pierce, B. Cense, S.H. Yun, M. Mujat, G. Tearney, B. Bouma, and J. de Boer, "Real-time fiber-based multi-functional spectral-domain optical coherence tomography at 1.3 µm". Optics Express. 13(11): p. 3931-3944, 2005. 21. B. Vakoc, S. Yun, J. de Boer, G. Tearney, and B. Bouma, "Phase-resolved optical frequency domain imaging". Optics Express. 13(14): p. 5483-5493, 2005.
Proc. of SPIE Vol. 6844 68440K-8
Related Documents