www.npro.no www.norwegianproperty.no Results 2nd Quarter 2007 10 August 2007

Welcome message from author
This document is posted to help you gain knowledge. Please leave a comment to let me know what you think about it! Share it to your friends and learn new things together.
Transcript
www.npro.nowww.norwegianproperty.no
Results2nd Quarter 2007
10 August 2007
2 | Results 2nd Quarter 2007
Contents
Highlights 2nd Quarter
Results 2nd Quarter
Portfolio overview
Going forward– Value drivers– The Norwegian Commercial Property market– M&A– Financing– Shareholder structure
Summary
Appendix– Details property portfolio– Share indices
3 | Results 2nd Quarter 2007
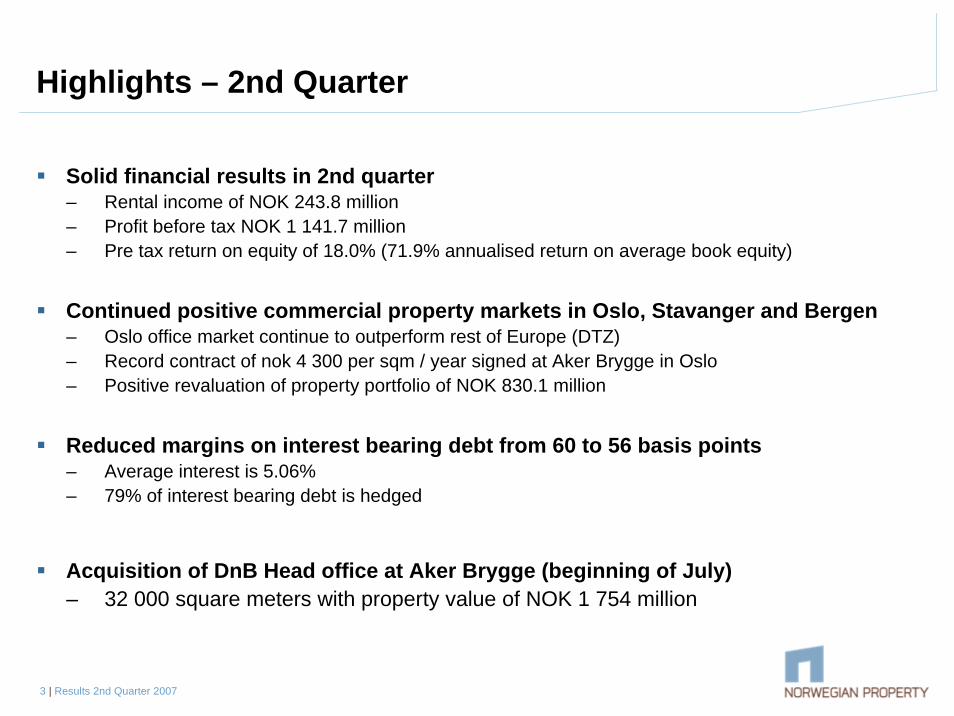
Highlights – 2nd Quarter
Solid financial results in 2nd quarter– Rental income of NOK 243.8 million– Profit before tax NOK 1 141.7 million– Pre tax return on equity of 18.0% (71.9% annualised return on average book equity)
Continued positive commercial property markets in Oslo, Stavanger and Bergen– Oslo office market continue to outperform rest of Europe (DTZ)– Record contract of nok 4 300 per sqm / year signed at Aker Brygge in Oslo– Positive revaluation of property portfolio of NOK 830.1 million
Reduced margins on interest bearing debt from 60 to 56 basis points– Average interest is 5.06%– 79% of interest bearing debt is hedged
Acquisition of DnB Head office at Aker Brygge (beginning of July)– 32 000 square meters with property value of NOK 1 754 million
4 | Results 2nd Quarter 2007
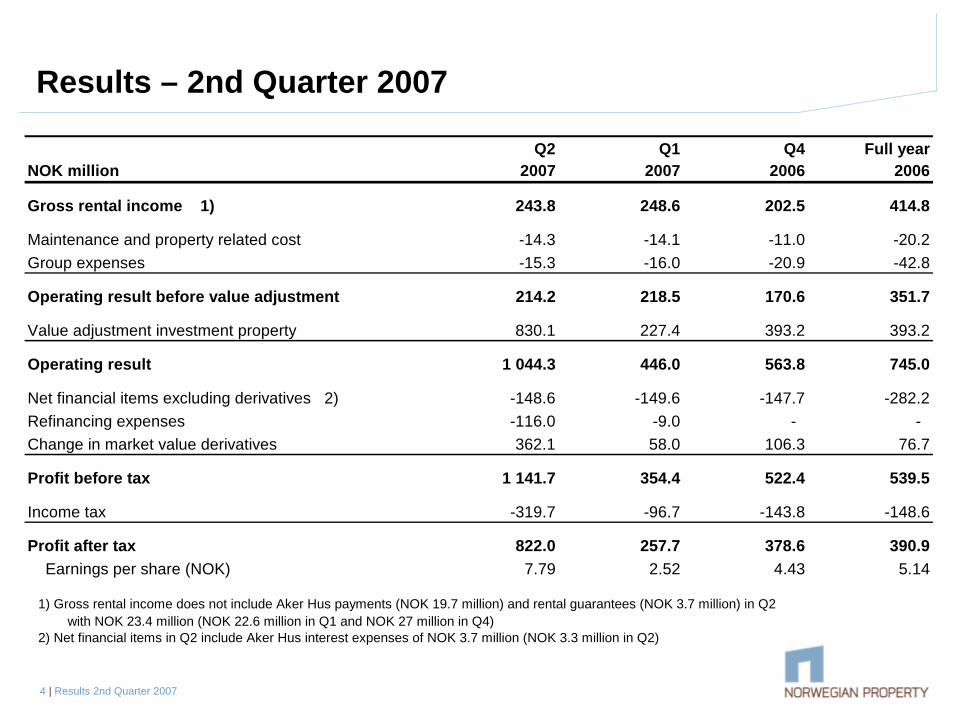
Results – 2nd Quarter 2007
Q2 Q1 Q4 Full yearNOK million 2007 2007 2006 2006
Gross rental income 1) 243.8 248.6 202.5 414.8
Maintenance and property related cost -14.3 -14.1 -11.0 -20.2Group expenses -15.3 -16.0 -20.9 -42.8
Operating result before value adjustment 214.2 218.5 170.6 351.7
Value adjustment investment property 830.1 227.4 393.2 393.2
Operating result 1 044.3 446.0 563.8 745.0
Net financial items excluding derivatives 2) -148.6 -149.6 -147.7 -282.2Refinancing expenses -116.0 -9.0 - - Change in market value derivatives 362.1 58.0 106.3 76.7
Profit before tax 1 141.7 354.4 522.4 539.5
Income tax -319.7 -96.7 -143.8 -148.6
Profit after tax 822.0 257.7 378.6 390.9 Earnings per share (NOK) 7.79 2.52 4.43 5.14
1) Gross rental income does not include Aker Hus payments (NOK 19.7 million) and rental guarantees (NOK 3.7 million) in Q2 with NOK 23.4 million (NOK 22.6 million in Q1 and NOK 27 million in Q4) 2) Net financial items in Q2 include Aker Hus interest expenses of NOK 3.7 million (NOK 3.3 million in Q2)
5 | Results 2nd Quarter 2007
Balance sheet – 2nd Quarter 2007
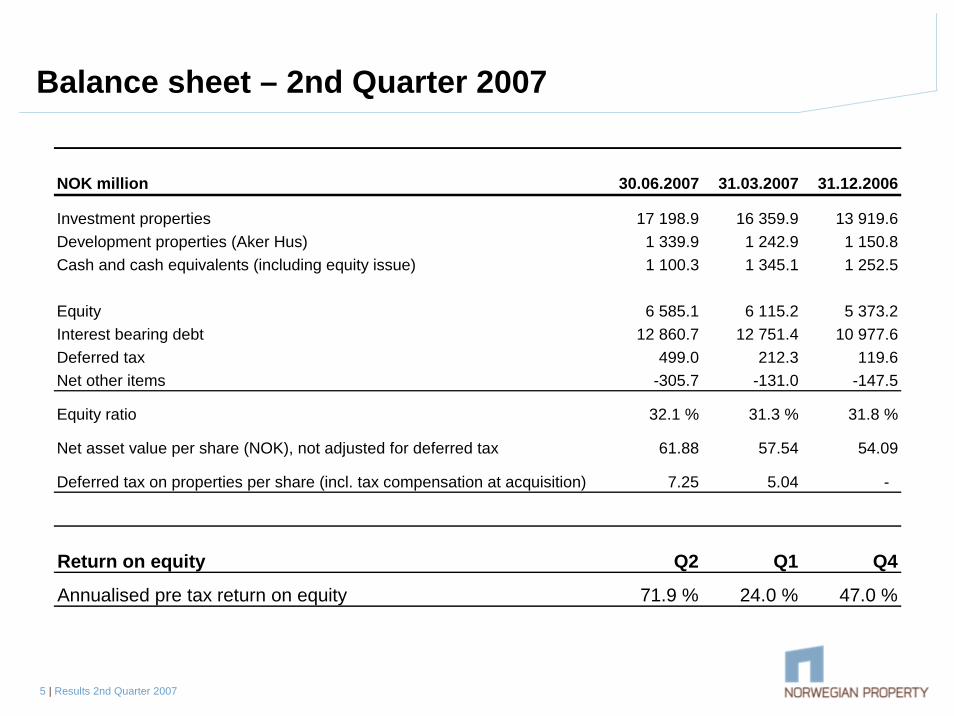
NOK million 30.06.2007 31.03.2007 31.12.2006
Investment properties 17 198.9 16 359.9 13 919.6Development properties (Aker Hus) 1 339.9 1 242.9 1 150.8Cash and cash equivalents (including equity issue) 1 100.3 1 345.1 1 252.5
Equity 6 585.1 6 115.2 5 373.2Interest bearing debt 12 860.7 12 751.4 10 977.6Deferred tax 499.0 212.3 119.6Net other items -305.7 -131.0 -147.5
Equity ratio 32.1 % 31.3 % 31.8 %
Net asset value per share (NOK), not adjusted for deferred tax 61.88 57.54 54.09
Deferred tax on properties per share (incl. tax compensation at acquisition) 7.25 5.04 -
Return on equity Q2 Q1 Q4
Annualised pre tax return on equity 71.9 % 24.0 % 47.0 %
6 | Results 2nd Quarter 2007
Property valuation – 30 June 2007
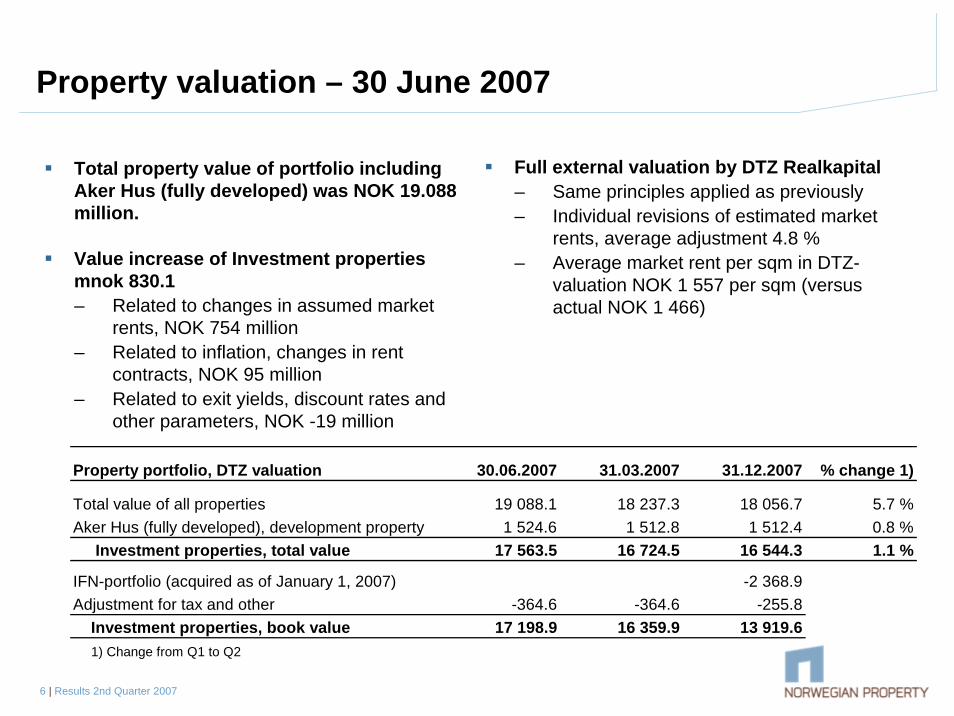
Total property value of portfolio includingAker Hus (fully developed) was NOK 19.088 million.
Value increase of Investment propertiesmnok 830.1– Related to changes in assumed market
rents, NOK 754 million– Related to inflation, changes in rent
contracts, NOK 95 million– Related to exit yields, discount rates and
other parameters, NOK -19 million
Full external valuation by DTZ Realkapital – Same principles applied as previously– Individual revisions of estimated market
rents, average adjustment 4.8 %– Average market rent per sqm in DTZ-
valuation NOK 1 557 per sqm (versus actual NOK 1 466)
Property portfolio, DTZ valuation 30.06.2007 31.03.2007 31.12.2007 % change 1)
Total value of all properties 19 088.1 18 237.3 18 056.7 5.7 %Aker Hus (fully developed), development property 1 524.6 1 512.8 1 512.4 0.8 % Investment properties, total value 17 563.5 16 724.5 16 544.3 1.1 %
IFN-portfolio (acquired as of January 1, 2007) -2 368.9Adjustment for tax and other -364.6 -364.6 -255.8 Investment properties, book value 17 198.9 16 359.9 13 919.6 1) Change from Q1 to Q2
7 | Results 2nd Quarter 2007
Property valuation – 30 June 2007- tax and sensitivity to key parameters
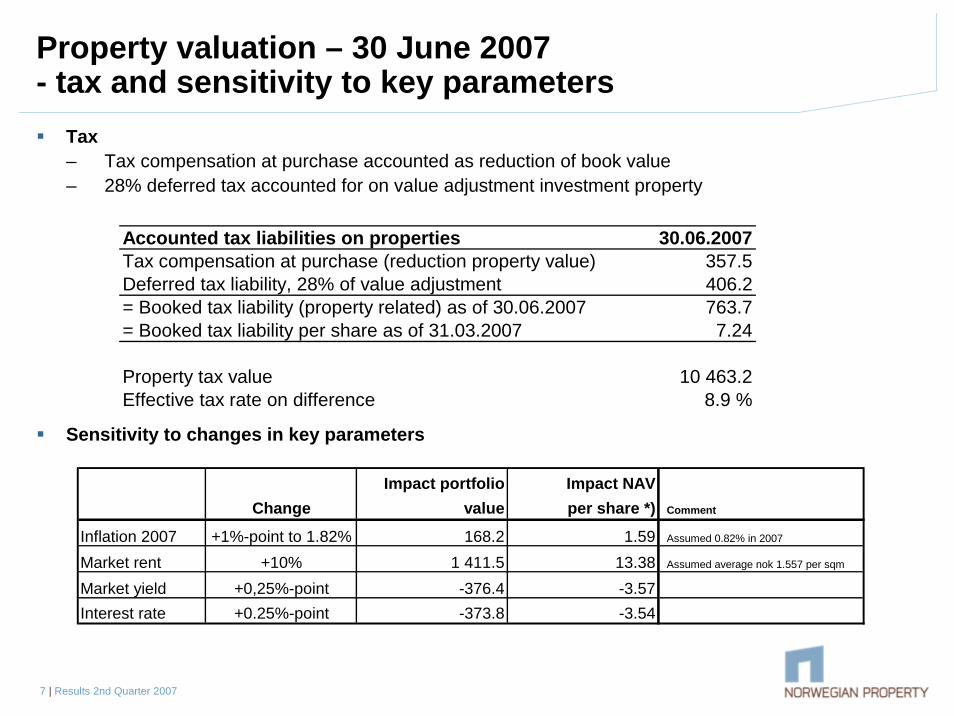
Tax– Tax compensation at purchase accounted as reduction of book value– 28% deferred tax accounted for on value adjustment investment property
Sensitivity to changes in key parameters
Accounted tax liabilities on properties 30.06.2007Tax compensation at purchase (reduction property value) 357.5Deferred tax liability, 28% of value adjustment 406.2= Booked tax liability (property related) as of 30.06.2007 763.7= Booked tax liability per share as of 31.03.2007 7.24
Property tax value 10 463.2Effective tax rate on difference 8.9 %
Impact portfolio Impact NAVChange value per share *) Comment
Inflation 2007 +1%-point to 1.82% 168.2 1.59 Assumed 0.82% in 2007
Market rent +10% 1 411.5 13.38 Assumed average nok 1.557 per sqm
Market yield +0,25%-point -376.4 -3.57Interest rate +0.25%-point -373.8 -3.54
8 | Results 2nd Quarter 2007
Financing - Key numbers
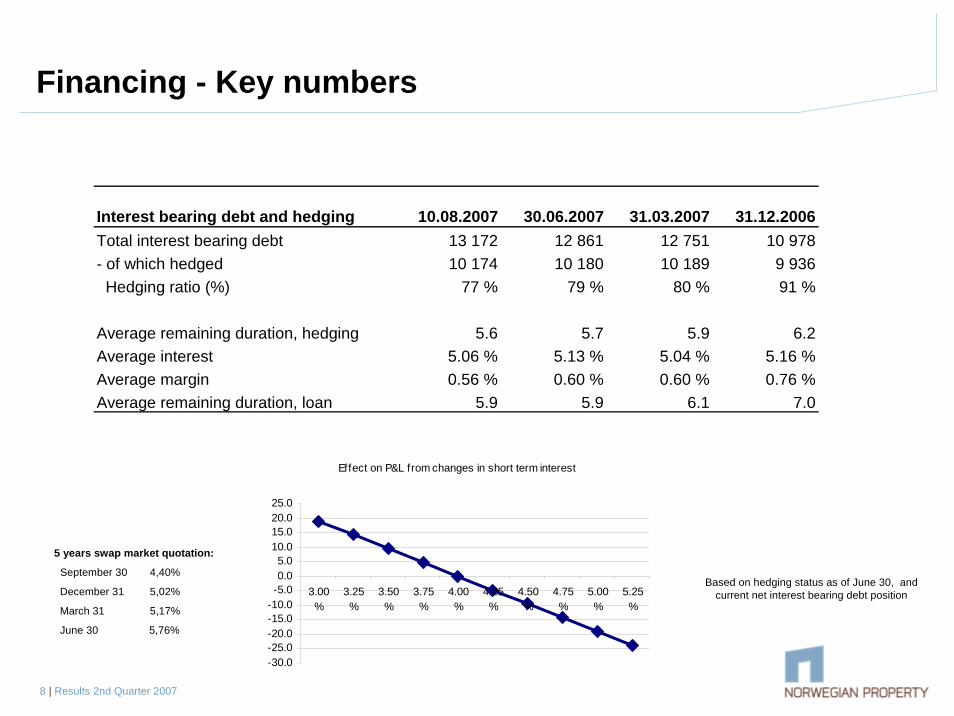
5 years swap market quotation:
September 30 4,40%
December 31 5,02%
March 31 5,17%
June 30 5,76%
Based on hedging status as of June 30, and current net interest bearing debt position
Interest bearing debt and hedging 10.08.2007 30.06.2007 31.03.2007 31.12.2006Total interest bearing debt 13 172 12 861 12 751 10 978- of which hedged 10 174 10 180 10 189 9 936 Hedging ratio (%) 77 % 79 % 80 % 91 %
Average remaining duration, hedging 5.6 5.7 5.9 6.2Average interest 5.06 % 5.13 % 5.04 % 5.16 %Average margin 0.56 % 0.60 % 0.60 % 0.76 %Average remaining duration, loan 5.9 5.9 6.1 7.0
Effect on P&L from changes in short term interest
-30.0-25.0-20.0-15.0-10.0-5.00.05.0
10.015.020.025.0
3.00%
3.25%
3.50%
3.75%
4.00%
4.25%
4.50%
4.75%
5.00%
5.25%
9 | Results 2nd Quarter 2007
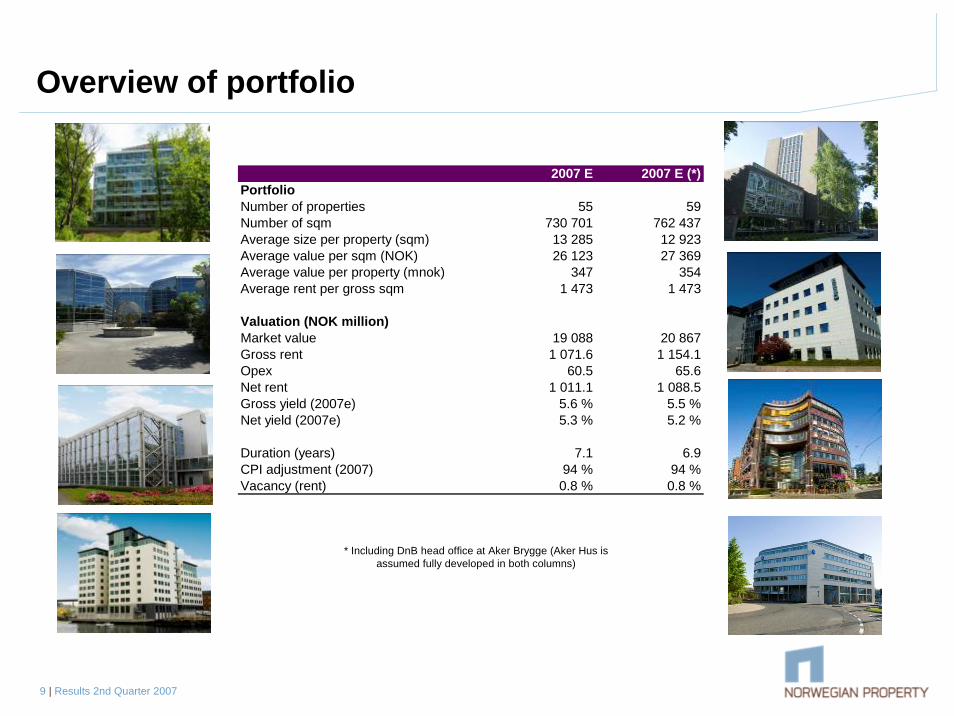
Overview of portfolio
* Including DnB head office at Aker Brygge (Aker Hus is assumed fully developed in both columns)
2007 E 2007 E (*)PortfolioNumber of properties 55 59Number of sqm 730 701 762 437Average size per property (sqm) 13 285 12 923Average value per sqm (NOK) 26 123 27 369Average value per property (mnok) 347 354Average rent per gross sqm 1 473 1 473
Valuation (NOK million)Market value 19 088 20 867Gross rent 1 071.6 1 154.1Opex 60.5 65.6Net rent 1 011.1 1 088.5Gross yield (2007e) 5.6 % 5.5 %Net yield (2007e) 5.3 % 5.2 %
Duration (years) 7.1 6.9CPI adjustment (2007) 94 % 94 %Vacancy (rent) 0.8 % 0.8 %

10 | Results 2nd Quarter 2007
Public14 %
Private86 %Oslo
88 %
Bergen1 %
Other1 %
Stavanger10 %
Parking5 %
Office78 %
Warehouse2 %
Retail10 %
Other5 %
3 - 6 years24 %
6 - 10 years36 %
> 10 years28 %
< 3 years13 %
Norwegian Property– The portfolio – including DnB head office at Aker Brygge
Tenant mix**
Lease duration mix (Y)***Property mix**
Geographic focus*
Target Actual
Actual
*By Value **By rent ***Contractual rent
Actual
Target Actual
Weighted average duration ca.
6.9years
11 | Results 2nd Quarter 2007
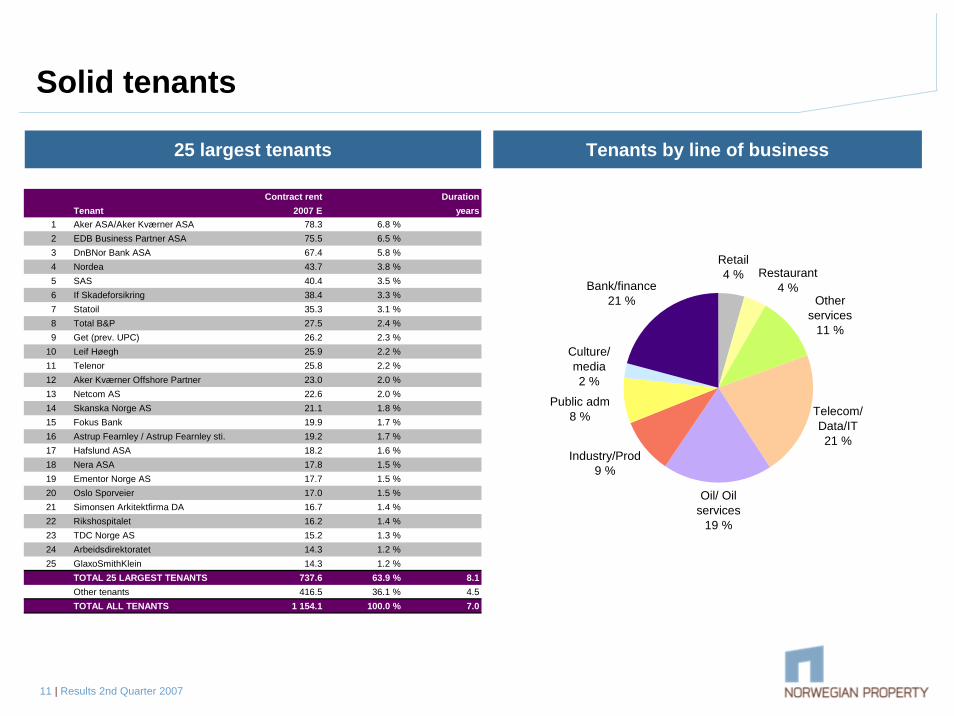
Solid tenants
**25 largest tenants Tenants by line of business
Restaurant4 %
Industry/Prod9 %
Public adm8 %
Bank/finance21 % Other
services11 %
Retail4 %
Telecom/Data/IT21 %
Culture/media2 %
Oil/ Oil services
19 %
Contract rent DurationTenant 2007 E years
1 Aker ASA/Aker Kværner ASA 78.3 6.8 %2 EDB Business Partner ASA 75.5 6.5 %3 DnBNor Bank ASA 67.4 5.8 %4 Nordea 43.7 3.8 %5 SAS 40.4 3.5 %6 If Skadeforsikring 38.4 3.3 %7 Statoil 35.3 3.1 %8 Total B&P 27.5 2.4 %9 Get (prev. UPC) 26.2 2.3 %
10 Leif Høegh 25.9 2.2 %11 Telenor 25.8 2.2 %12 Aker Kværner Offshore Partner 23.0 2.0 %13 Netcom AS 22.6 2.0 %14 Skanska Norge AS 21.1 1.8 %15 Fokus Bank 19.9 1.7 %16 Astrup Fearnley / Astrup Fearnley sti. 19.2 1.7 %17 Hafslund ASA 18.2 1.6 %18 Nera ASA 17.8 1.5 %19 Ementor Norge AS 17.7 1.5 %20 Oslo Sporveier 17.0 1.5 %21 Simonsen Arkitektfirma DA 16.7 1.4 %22 Rikshospitalet 16.2 1.4 %23 TDC Norge AS 15.2 1.3 %24 Arbeidsdirektoratet 14.3 1.2 %25 GlaxoSmithKlein 14.3 1.2 %
TOTAL 25 LARGEST TENANTS 737.6 63.9 % 8.1Other tenants 416.5 36.1 % 4.5TOTAL ALL TENANTS 1 154.1 100.0 % 7.0
12 | Results 2nd Quarter 2007
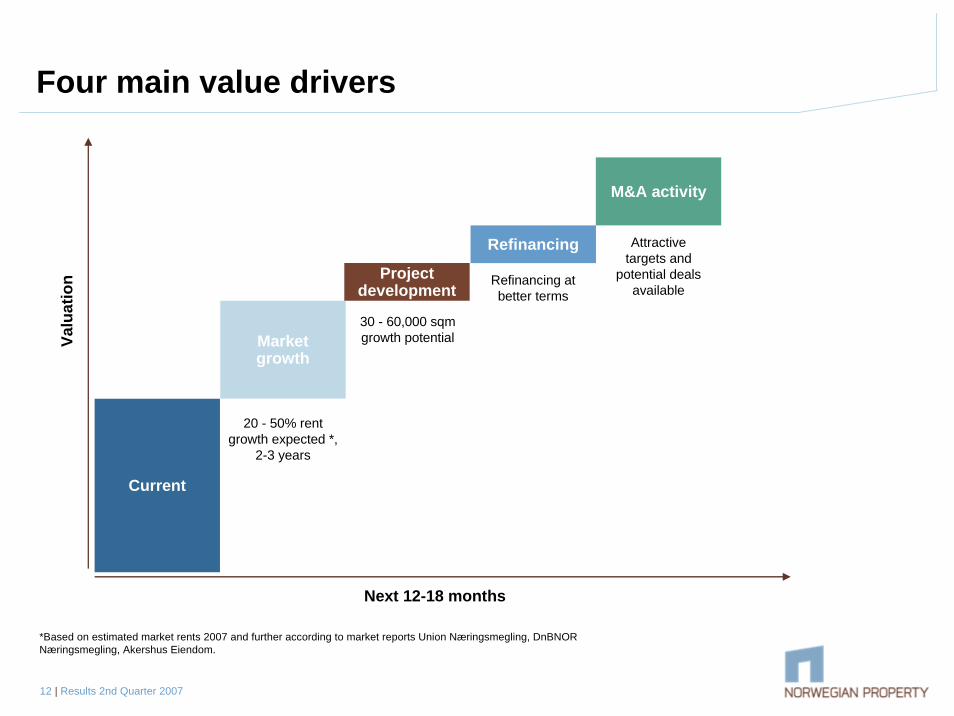
Four main value drivers
Current
Market growth
Project development
Refinancing
M&A activity
Refinancing at better terms
20 - 50% rent growth expected *,
2-3 years
30 - 60,000 sqmgrowth potential
Attractive targets and
potential deals available
Next 12-18 months
Valu
atio
n
*Based on estimated market rents 2007 and further according to market reports Union Næringsmegling, DnBNORNæringsmegling, Akershus Eiendom.
13 | Results 2nd Quarter 2007
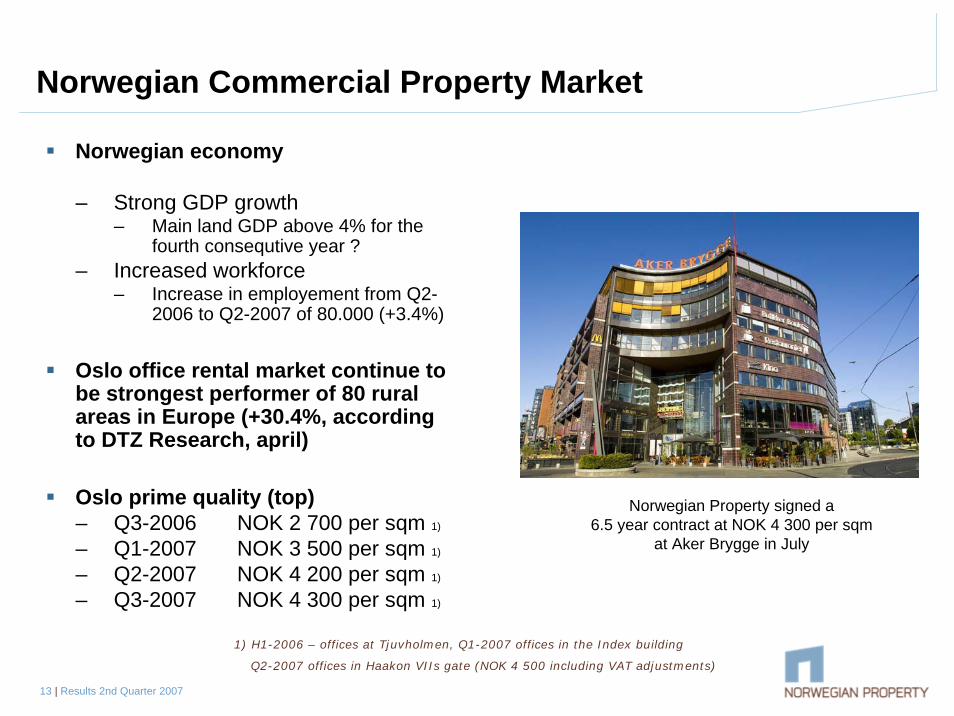
Norwegian Commercial Property Market
Norwegian economy
– Strong GDP growth– Main land GDP above 4% for the
fourth consequtive year ?– Increased workforce
– Increase in employement from Q2-2006 to Q2-2007 of 80.000 (+3.4%)
Oslo office rental market continue to be strongest performer of 80 rural areas in Europe (+30.4%, accordingto DTZ Research, april)
Oslo prime quality (top)– Q3-2006 NOK 2 700 per sqm 1)
– Q1-2007 NOK 3 500 per sqm 1)
– Q2-2007 NOK 4 200 per sqm 1)
– Q3-2007 NOK 4 300 per sqm 1)
1) H1-2006 – offices at Tjuvholmen, Q1-2007 offices in the Index building
Q2-2007 offices in Haakon VIIs gate (NOK 4 500 including VAT adjustments)
Norwegian Property signed a6.5 year contract at NOK 4 300 per sqm
at Aker Brygge in July
14 | Results 2nd Quarter 2007
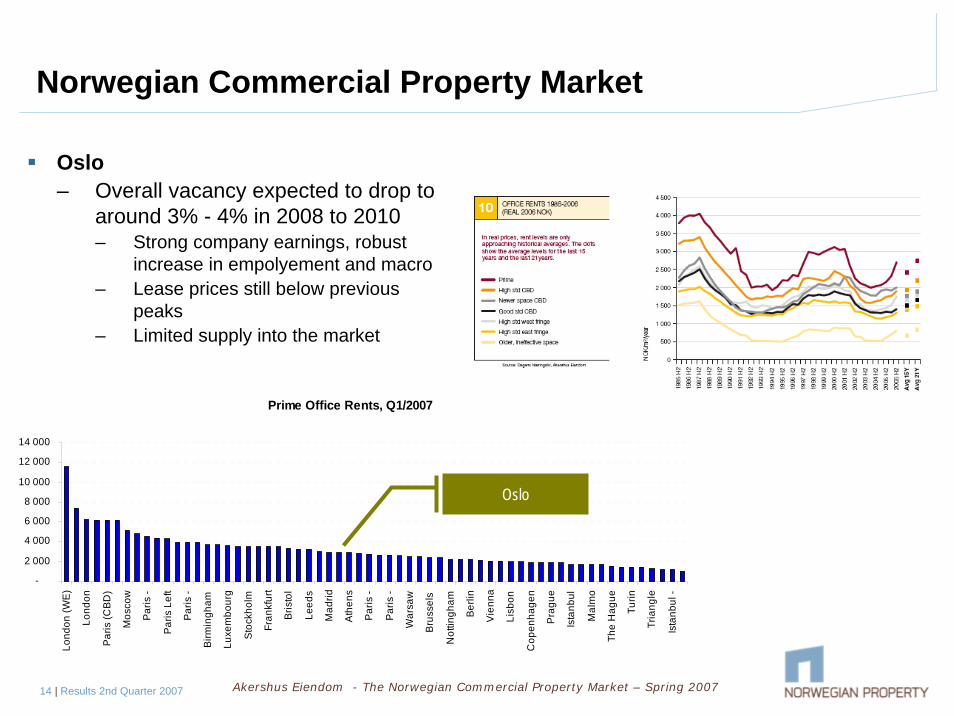
Norwegian Commercial Property Market
Oslo – Overall vacancy expected to drop to
around 3% - 4% in 2008 to 2010– Strong company earnings, robust
increase in empolyement and macro– Lease prices still below previous
peaks– Limited supply into the market
Akershus Eiendom - The Norwegian Commercial Property Market – Spring 2007
Prime Office Rents, Q1/2007
-
2 000
4 000
6 000
8 000
10 000
12 000
14 000
Lond
on (W
E)
Lond
on
Paris
(CBD
)
Mos
cow
Paris
-
Paris
Lef
t
Paris
-
Birm
ingh
am
Luxe
mbo
urg
Stoc
khol
m
Fran
kfur
t
Bris
tol
Leed
s
Mad
rid
Ath
ens
Paris
-
Paris
-
War
saw
Bru
ssel
s
Not
tingh
am
Berli
n
Vie
nna
Lisb
on
Cop
enha
gen
Prag
ue
Ista
nbul
Mal
mo
The
Hag
ue
Turin
Tria
ngle
Ista
nbul
-
Oslo
15 | Results 2nd Quarter 2007
Norwegian commercial property market
Stavanger– Price increase of 40% in Stavanger CBD last 12 months according to Vaagen Eiendom, top
price registered NOK 2 300 (*)– Vacancy in line with CBD in Oslo– More supply in pipeline, mainly reated to the Forus area
Bergen– Reduced vacancy and increasing rents
Property transactions– Significant number of projects in markets– Yields maintained at attractive levels
– Pirsenteret in Trondheim– Akerselva Atrium in Oslo
*Sources: Vaagen Eiendom, Enskilda and Pareto
Low vacancy and limited supply will drive rental prices foranother two to four years
16 | Results 2nd Quarter 2007
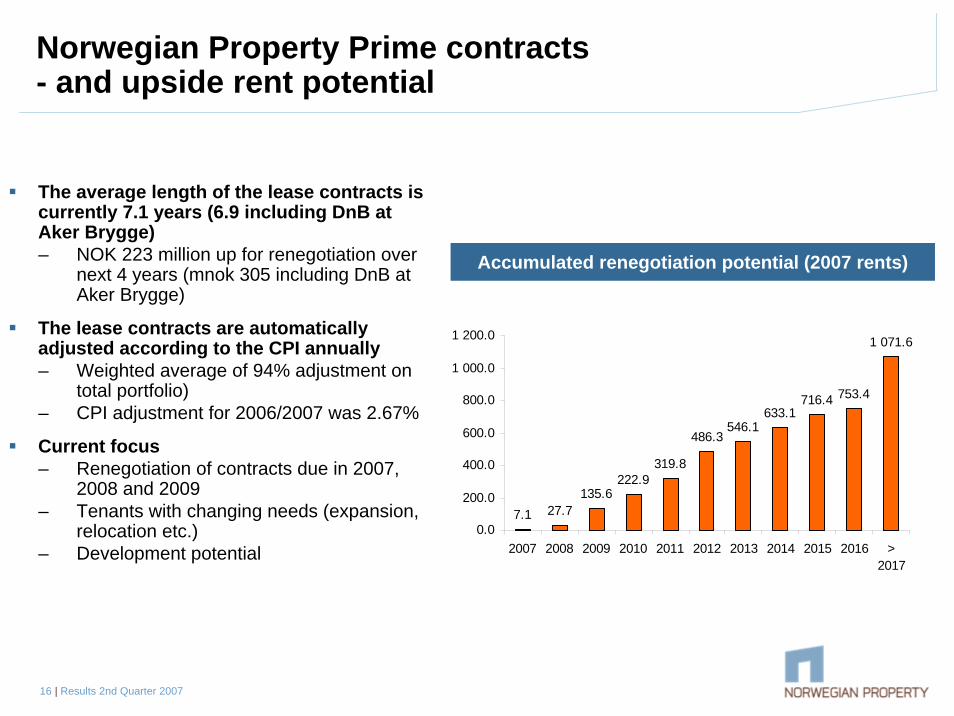
Norwegian Property Prime contracts - and upside rent potential
The average length of the lease contracts is currently 7.1 years (6.9 including DnB at Aker Brygge)– NOK 223 million up for renegotiation over
next 4 years (mnok 305 including DnB at Aker Brygge)
The lease contracts are automatically adjusted according to the CPI annually– Weighted average of 94% adjustment on
total portfolio)– CPI adjustment for 2006/2007 was 2.67%
Current focus– Renegotiation of contracts due in 2007,
2008 and 2009– Tenants with changing needs (expansion,
relocation etc.)– Development potential
Accumulated renegotiation potential (2007 rents)
7.1 27.7135.6
222.9319.8
486.3546.1
633.1716.4 753.4
1 071.6
0.0
200.0
400.0
600.0
800.0
1 000.0
1 200.0
2007 2008 2009 2010 2011 2012 2013 2014 2015 2016 >2017
17 | Results 2nd Quarter 2007
M&A- Main focus
Priorities– Preferably off market and larger portfolios– Evaluating portfolios in excess of NOK 10 billion– New investments must meet investment requirements
– Geography and quality– Financial requirements based on current interest rates– Many possible transactions not meeting investment requirements
– Evaluating structural and accretive transactions
Trends in market– Many possible transactions in the market– High competition on small and medium sized deals (yield pressure)– Tendencies to transaction pricing differentiating between cash flow properties and
properties with reversionary potential
18 | Results 2nd Quarter 2007
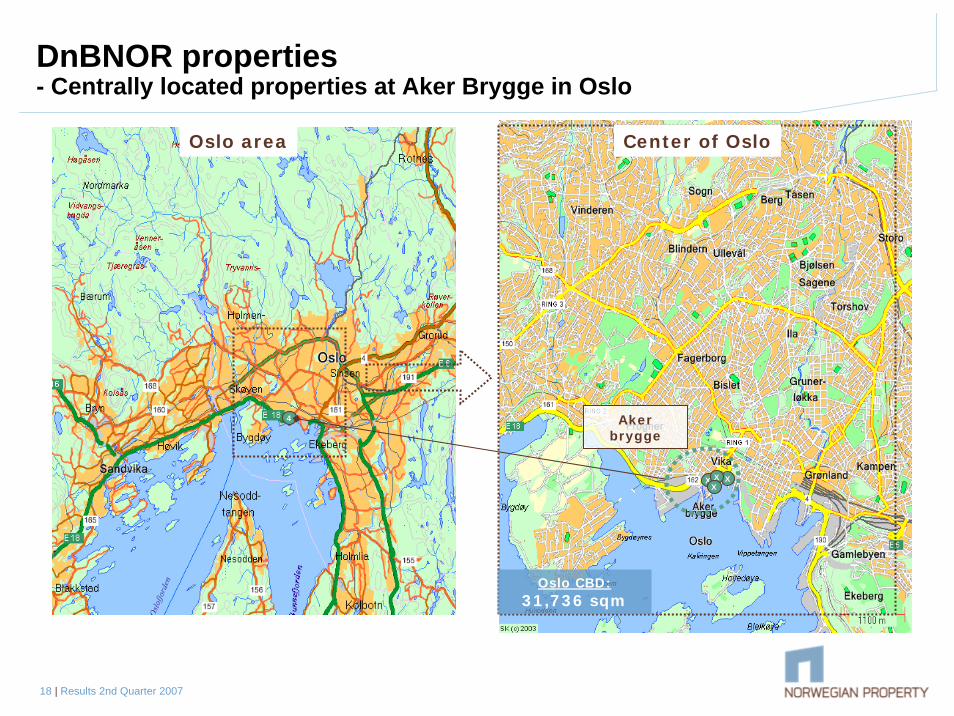
DnBNOR properties- Centrally located properties at Aker Brygge in Oslo
Center of OsloOslo area
Oslo CBD:31,736 sqm
4 Aker brygge
X XXX
19 | Results 2nd Quarter 2007
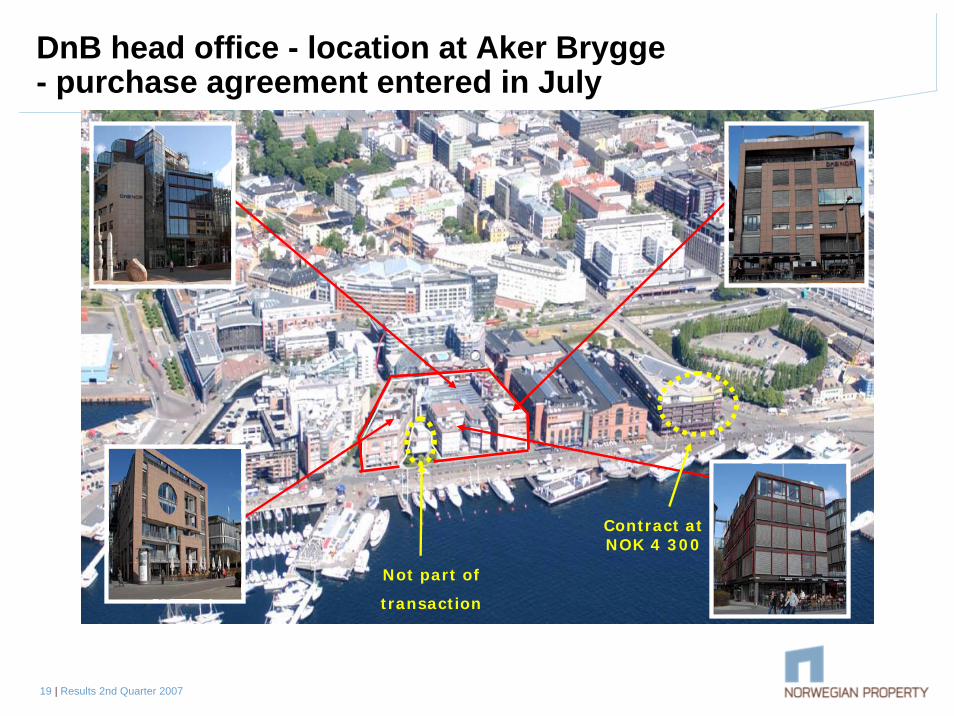
DnB head office - location at Aker Brygge- purchase agreement entered in July
Not part of
transaction
Contract at NOK 4 300
20 | Results 2nd Quarter 2007
Main points regarding DnBNOR properties, Aker Brygge
4 attractive office and retail properties of approx. 31,736 sqm
Gross rent of approx. NOK 82.5 million and net rent of approx. NOK 77.4 million
Great potential for increased rental income in the coming years due to re-negotiation of lease contracts– Average office rent per sqm in the properties are approximately NOK 2,700– Office market rent at Aker Brygge is between NOK 3,500 and NOK 4,000 and are
estimated to increase to between 4,000 and 5,000 during the nest 2-3 years
Purchase price NOK 1 740 million (NOK 1 754 million before tax adjustment)– Average return on equity is approx. 13% (pre-tax) given:
– The conditions which Norwegian Property achieves in the current market– A relatively conservative projection of current market rent level– Re-negotiation at higher market levels over the coming years
21 | Results 2nd Quarter 2007
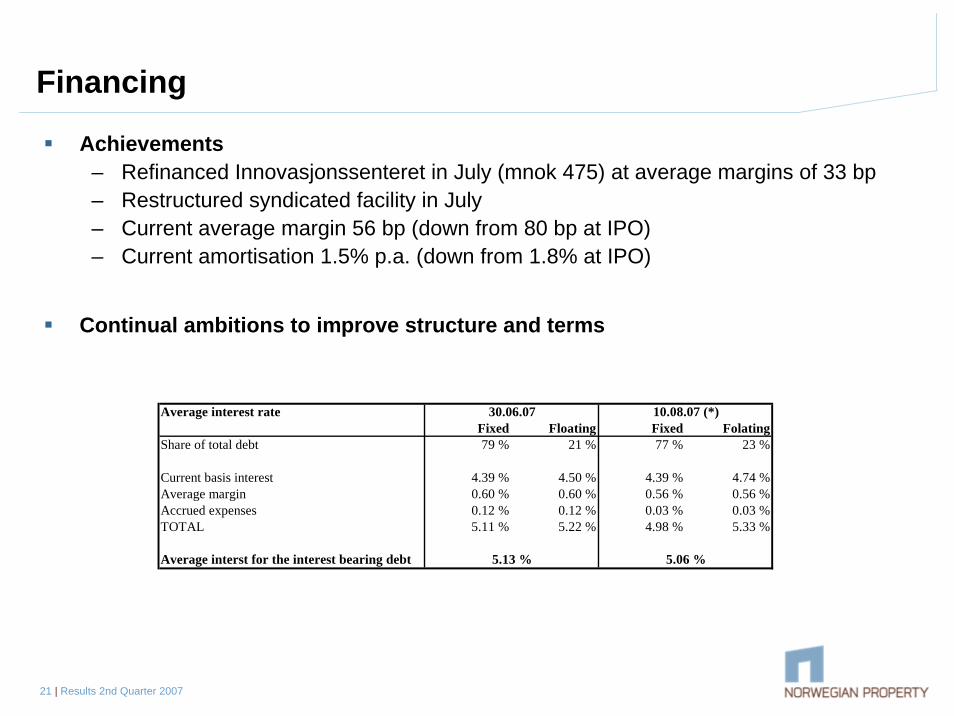
Financing
Achievements– Refinanced Innovasjonssenteret in July (mnok 475) at average margins of 33 bp– Restructured syndicated facility in July– Current average margin 56 bp (down from 80 bp at IPO)– Current amortisation 1.5% p.a. (down from 1.8% at IPO)
Continual ambitions to improve structure and terms
Average interest rateFixed Floating Fixed Folating
Share of total debt 79 % 21 % 77 % 23 %
Current basis interest 4.39 % 4.50 % 4.39 % 4.74 %Average margin 0.60 % 0.60 % 0.56 % 0.56 %Accrued expenses 0.12 % 0.12 % 0.03 % 0.03 %TOTAL 5.11 % 5.22 % 4.98 % 5.33 %
Average interst for the interest bearing debt
30.06.07 10.08.07 (*)
5.13 % 5.06 %
22 | Results 2nd Quarter 2007
Broad shareholder base- liquid trading on Oslo Stock Exchange
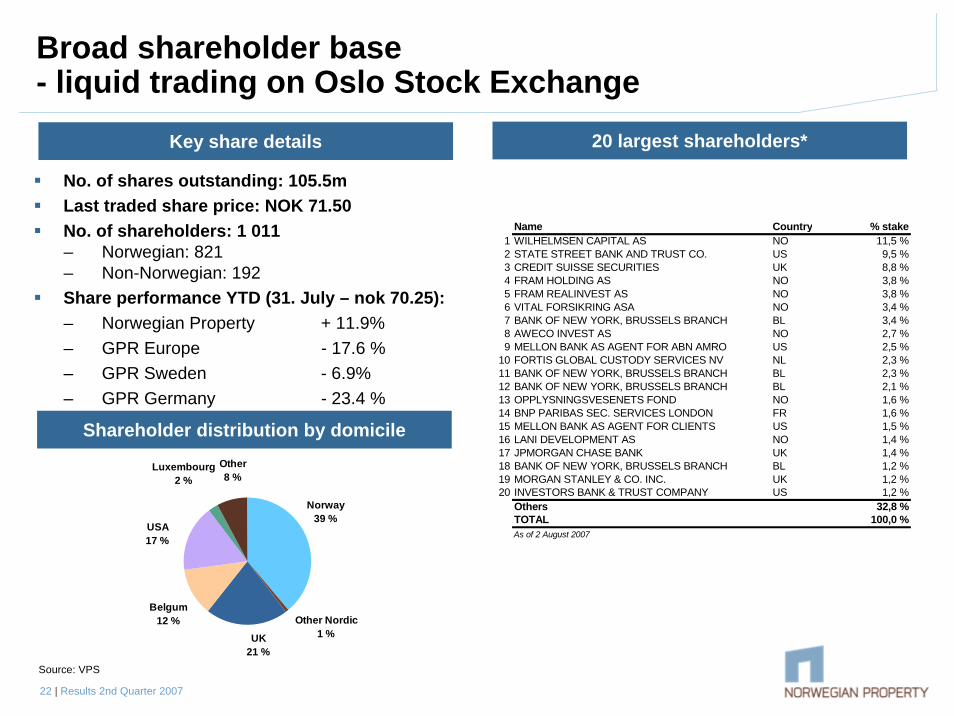
No. of shares outstanding: 105.5mLast traded share price: NOK 71.50No. of shareholders: 1 011– Norwegian: 821– Non-Norwegian: 192Share performance YTD (31. July – nok 70.25):– Norwegian Property + 11.9%– GPR Europe - 17.6 %– GPR Sweden - 6.9%– GPR Germany - 23.4 %
Source: VPS
Key share details
Shareholder distribution by domicile
20 largest shareholders*
Luxembourg2 %
Other8 %
UK21 %
Belgum12 %
USA17 %
Other Nordic1 %
Norway39 %
Name Country % stake1 WILHELMSEN CAPITAL AS NO 11,5 %2 STATE STREET BANK AND TRUST CO. US 9,5 %3 CREDIT SUISSE SECURITIES UK 8,8 %4 FRAM HOLDING AS NO 3,8 %5 FRAM REALINVEST AS NO 3,8 %6 VITAL FORSIKRING ASA NO 3,4 %7 BANK OF NEW YORK, BRUSSELS BRANCH BL 3,4 %8 AWECO INVEST AS NO 2,7 %9 MELLON BANK AS AGENT FOR ABN AMRO US 2,5 %
10 FORTIS GLOBAL CUSTODY SERVICES NV NL 2,3 %11 BANK OF NEW YORK, BRUSSELS BRANCH BL 2,3 %12 BANK OF NEW YORK, BRUSSELS BRANCH BL 2,1 %13 OPPLYSNINGSVESENETS FOND NO 1,6 %14 BNP PARIBAS SEC. SERVICES LONDON FR 1,6 %15 MELLON BANK AS AGENT FOR CLIENTS US 1,5 %16 LANI DEVELOPMENT AS NO 1,4 %17 JPMORGAN CHASE BANK UK 1,4 %18 BANK OF NEW YORK, BRUSSELS BRANCH BL 1,2 %19 MORGAN STANLEY & CO. INC. UK 1,2 %20 INVESTORS BANK & TRUST COMPANY US 1,2 %
Others 32,8 %TOTAL 100,0 %As of 2 August 2007

23 | Results 2nd Quarter 2007
Summary- Attractively positioned in a prime property market
Norwegian Property is a prime real estate investment play in a strong Norwegian market in the years to come
Norwegian Property offers unique exposure to high quality real estate
Management focus going forward– Exploit the expected and realised rental growth– 30-60,000 sqm. expansion potential in existing portfolio– Continue refinancing at improved terms– Evaluate attractive and accretive M&A possibilities– Cost reduction initiative for Facility Management
Norwegian Property targets attractive returns to investors– Attractive return on equity– Attractive dividend yield– Liquid share
www.npro.nowww.norwegianproperty.no
Questions ?
25 | Results 2nd Quarter 2007
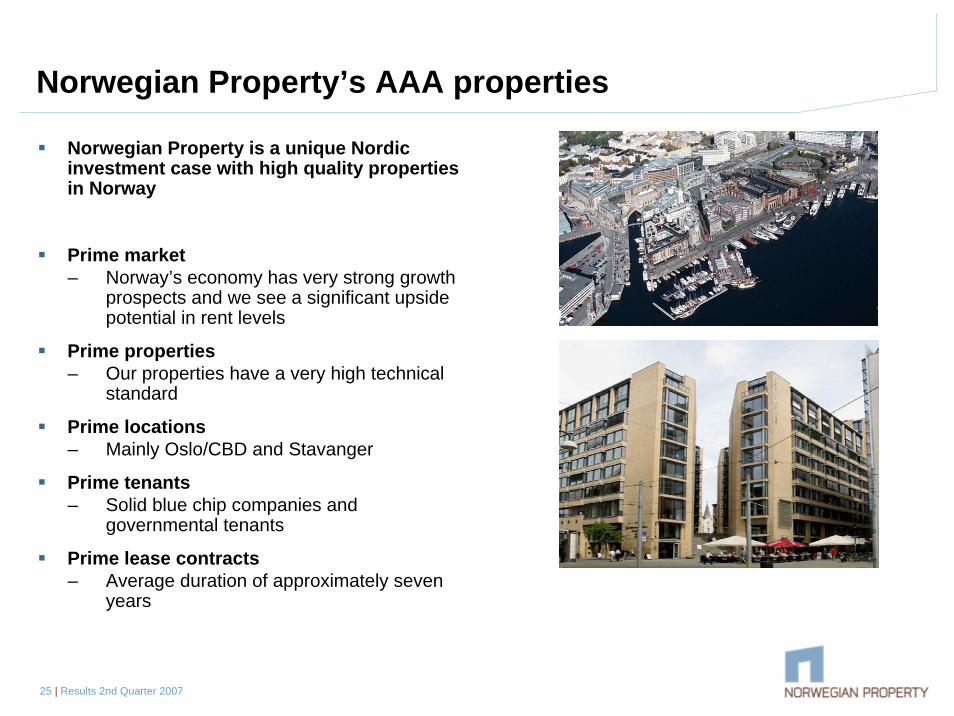
Norwegian Property’s AAA properties
Norwegian Property is a unique Nordic investment case with high quality properties in Norway
Prime market– Norway’s economy has very strong growth
prospects and we see a significant upside potential in rent levels
Prime properties – Our properties have a very high technical
standard
Prime locations – Mainly Oslo/CBD and Stavanger
Prime tenants – Solid blue chip companies and
governmental tenants
Prime lease contracts – Average duration of approximately seven
years
26 | Results 2nd Quarter 2007
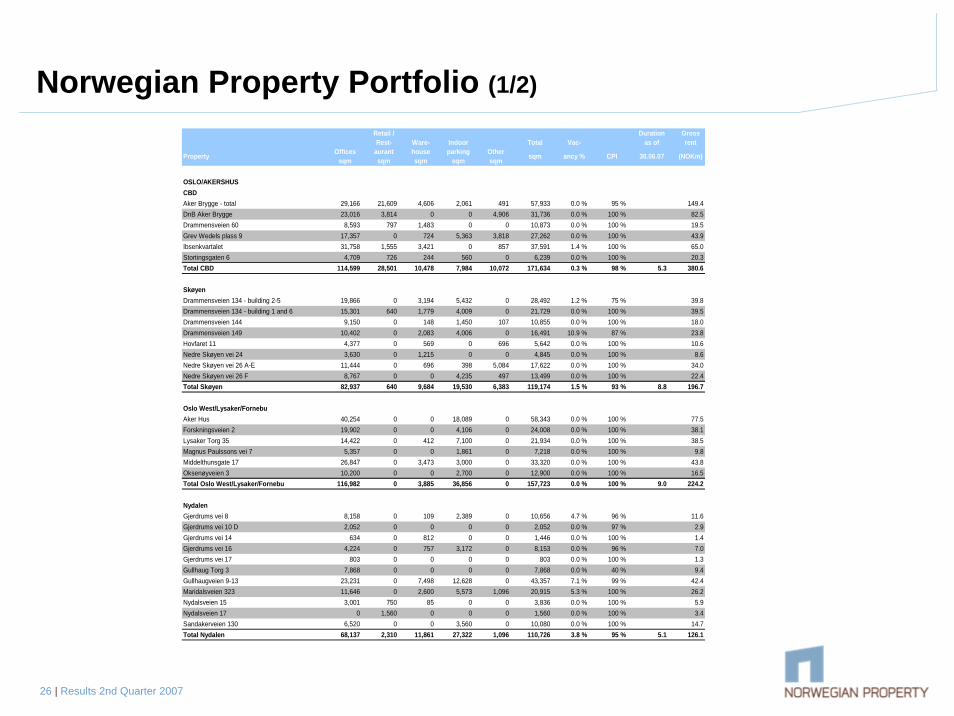
Norwegian Property Portfolio (1/2)
Retail / Duration GrossRest- Ware- Indoor Total Vac- as of rent
Property Offices sqm
aurant sqm
house sqm
parking sqm
Other sqm sqm ancy % CPI 30.06.07 (NOKm)
OSLO/AKERSHUSCBDAker Brygge - total 29,166 21,609 4,606 2,061 491 57,933 0.0 % 95 % 149.4DnB Aker Brygge 23,016 3,814 0 0 4,906 31,736 0.0 % 100 % 82.5Drammensveien 60 8,593 797 1,483 0 0 10,873 0.0 % 100 % 19.5Grev Wedels plass 9 17,357 0 724 5,363 3,818 27,262 0.0 % 100 % 43.9Ibsenkvartalet 31,758 1,555 3,421 0 857 37,591 1.4 % 100 % 65.0Stortingsgaten 6 4,709 726 244 560 0 6,239 0.0 % 100 % 20.3Total CBD 114,599 28,501 10,478 7,984 10,072 171,634 0.3 % 98 % 5.3 380.6
SkøyenDrammensveien 134 - building 2-5 19,866 0 3,194 5,432 0 28,492 1.2 % 75 % 39.8Drammensveien 134 - building 1 and 6 15,301 640 1,779 4,009 0 21,729 0.0 % 100 % 39.5Drammensveien 144 9,150 0 148 1,450 107 10,855 0.0 % 100 % 18.0Drammensveien 149 10,402 0 2,083 4,006 0 16,491 10.9 % 87 % 23.8Hovfaret 11 4,377 0 569 0 696 5,642 0.0 % 100 % 10.6Nedre Skøyen vei 24 3,630 0 1,215 0 0 4,845 0.0 % 100 % 8.6Nedre Skøyen vei 26 A-E 11,444 0 696 398 5,084 17,622 0.0 % 100 % 34.0Nedre Skøyen vei 26 F 8,767 0 0 4,235 497 13,499 0.0 % 100 % 22.4Total Skøyen 82,937 640 9,684 19,530 6,383 119,174 1.5 % 93 % 8.8 196.7
Oslo West/Lysaker/FornebuAker Hus 40,254 0 0 18,089 0 58,343 0.0 % 100 % 77.5Forskningsveien 2 19,902 0 0 4,106 0 24,008 0.0 % 100 % 38.1Lysaker Torg 35 14,422 0 412 7,100 0 21,934 0.0 % 100 % 38.5Magnus Paulssons vei 7 5,357 0 0 1,861 0 7,218 0.0 % 100 % 9.8Middelthunsgate 17 26,847 0 3,473 3,000 0 33,320 0.0 % 100 % 43.8Oksenøyveien 3 10,200 0 0 2,700 0 12,900 0.0 % 100 % 16.5Total Oslo West/Lysaker/Fornebu 116,982 0 3,885 36,856 0 157,723 0.0 % 100 % 9.0 224.2
NydalenGjerdrums vei 8 8,158 0 109 2,389 0 10,656 4.7 % 96 % 11.6Gjerdrums vei 10 D 2,052 0 0 0 0 2,052 0.0 % 97 % 2.9Gjerdrums vei 14 634 0 812 0 0 1,446 0.0 % 100 % 1.4Gjerdrums vei 16 4,224 0 757 3,172 0 8,153 0.0 % 96 % 7.0Gjerdrums vei 17 803 0 0 0 0 803 0.0 % 100 % 1.3Gullhaug Torg 3 7,868 0 0 0 0 7,868 0.0 % 40 % 9.4Gullhaugveien 9-13 23,231 0 7,498 12,628 0 43,357 7.1 % 99 % 42.4Maridalsveien 323 11,646 0 2,600 5,573 1,096 20,915 5.3 % 100 % 26.2Nydalsveien 15 3,001 750 85 0 0 3,836 0.0 % 100 % 5.9Nydalsveien 17 0 1,560 0 0 0 1,560 0.0 % 100 % 3.4Sandakerveien 130 6,520 0 0 3,560 0 10,080 0.0 % 100 % 14.7Total Nydalen 68,137 2,310 11,861 27,322 1,096 110,726 3.8 % 95 % 5.1 126.1
27 | Results 2nd Quarter 2007
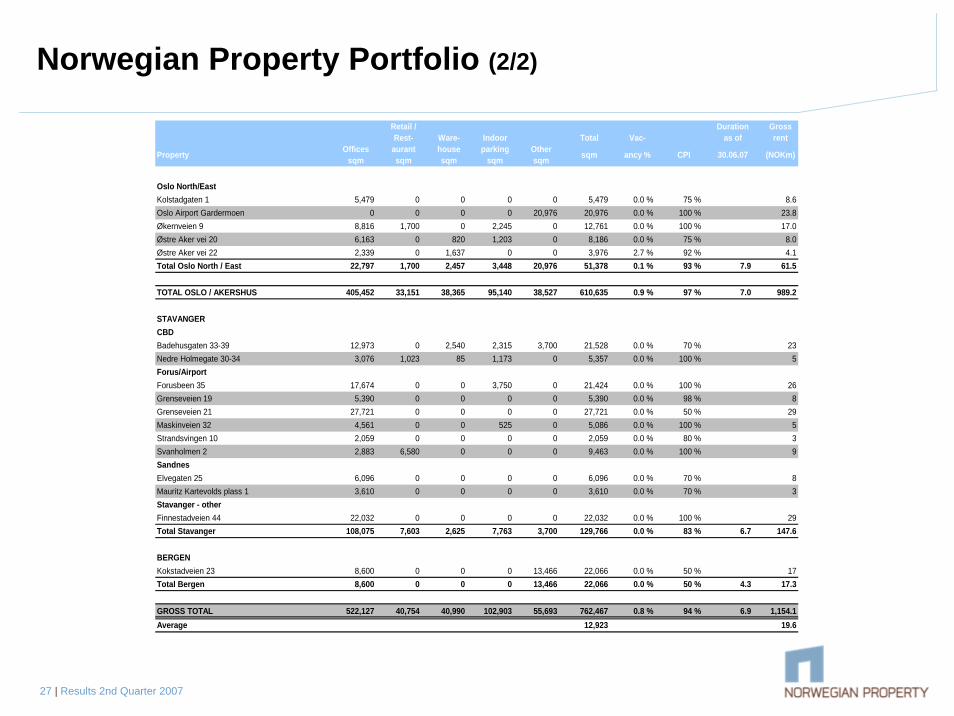
Norwegian Property Portfolio (2/2)
Retail / Duration GrossRest- Ware- Indoor Total Vac- as of rent
Property Offices sqm
aurant sqm
house sqm
parking sqm
Other sqm sqm ancy % CPI 30.06.07 (NOKm)
Oslo North/EastKolstadgaten 1 5,479 0 0 0 0 5,479 0.0 % 75 % 8.6Oslo Airport Gardermoen 0 0 0 0 20,976 20,976 0.0 % 100 % 23.8Økernveien 9 8,816 1,700 0 2,245 0 12,761 0.0 % 100 % 17.0Østre Aker vei 20 6,163 0 820 1,203 0 8,186 0.0 % 75 % 8.0Østre Aker vei 22 2,339 0 1,637 0 0 3,976 2.7 % 92 % 4.1Total Oslo North / East 22,797 1,700 2,457 3,448 20,976 51,378 0.1 % 93 % 7.9 61.5
TOTAL OSLO / AKERSHUS 405,452 33,151 38,365 95,140 38,527 610,635 0.9 % 97 % 7.0 989.2
STAVANGERCBDBadehusgaten 33-39 12,973 0 2,540 2,315 3,700 21,528 0.0 % 70 % 23Nedre Holmegate 30-34 3,076 1,023 85 1,173 0 5,357 0.0 % 100 % 5Forus/AirportForusbeen 35 17,674 0 0 3,750 0 21,424 0.0 % 100 % 26Grenseveien 19 5,390 0 0 0 0 5,390 0.0 % 98 % 8Grenseveien 21 27,721 0 0 0 0 27,721 0.0 % 50 % 29Maskinveien 32 4,561 0 0 525 0 5,086 0.0 % 100 % 5Strandsvingen 10 2,059 0 0 0 0 2,059 0.0 % 80 % 3Svanholmen 2 2,883 6,580 0 0 0 9,463 0.0 % 100 % 9SandnesElvegaten 25 6,096 0 0 0 0 6,096 0.0 % 70 % 8Mauritz Kartevolds plass 1 3,610 0 0 0 0 3,610 0.0 % 70 % 3Stavanger - otherFinnestadveien 44 22,032 0 0 0 0 22,032 0.0 % 100 % 29Total Stavanger 108,075 7,603 2,625 7,763 3,700 129,766 0.0 % 83 % 6.7 147.6
BERGENKokstadveien 23 8,600 0 0 0 13,466 22,066 0.0 % 50 % 17Total Bergen 8,600 0 0 0 13,466 22,066 0.0 % 50 % 4.3 17.3
GROSS TOTAL 522,127 40,754 40,990 102,903 55,693 762,467 0.8 % 94 % 6.9 1,154.1Average 12,923 19.6
28 | Results 2nd Quarter 2007
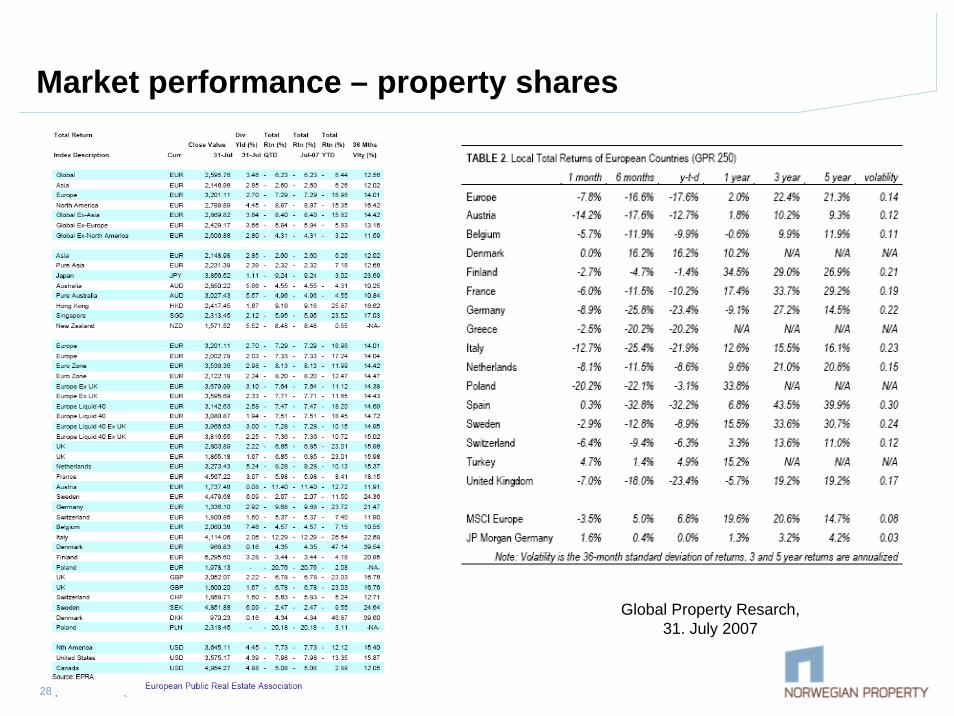
Market performance – property shares
Global Property Resarch,31. July 2007
Related Documents