Resource Slides “Future Talk” with County Councils Extension to Communities

Resource Slides “Future Talk” with County Councils Extension to Communities.
Dec 16, 2015
Welcome message from author
This document is posted to help you gain knowledge. Please leave a comment to let me know what you think about it! Share it to your friends and learn new things together.
Transcript
Resource Slides
“Future Talk”with
County CouncilsExtension to Communities

Governor’s Strategic Planning Council2010 Goals
1. Iowa Welcomes a Diverse Population
2. Electronically Connected to Each Other and the World
3. Life Sciences Capital of the World
4. A Great Place to Visit and to Live
5. Higher Wages and Income
6. Education for a Lifetime
7. Protecting and Preserving Our Natural Resources
8. Smart Government Works for Iowans

Prepared by
Census Services
Iowa State UniversityExtension to Communities
with support from Iowa PROfiles and Department of Economics
ISU Census Services
Trends inWarren County
Margaret Hanson Georgeann Artz Renea Miller Mark Imerman Willis Goudy
April 2001
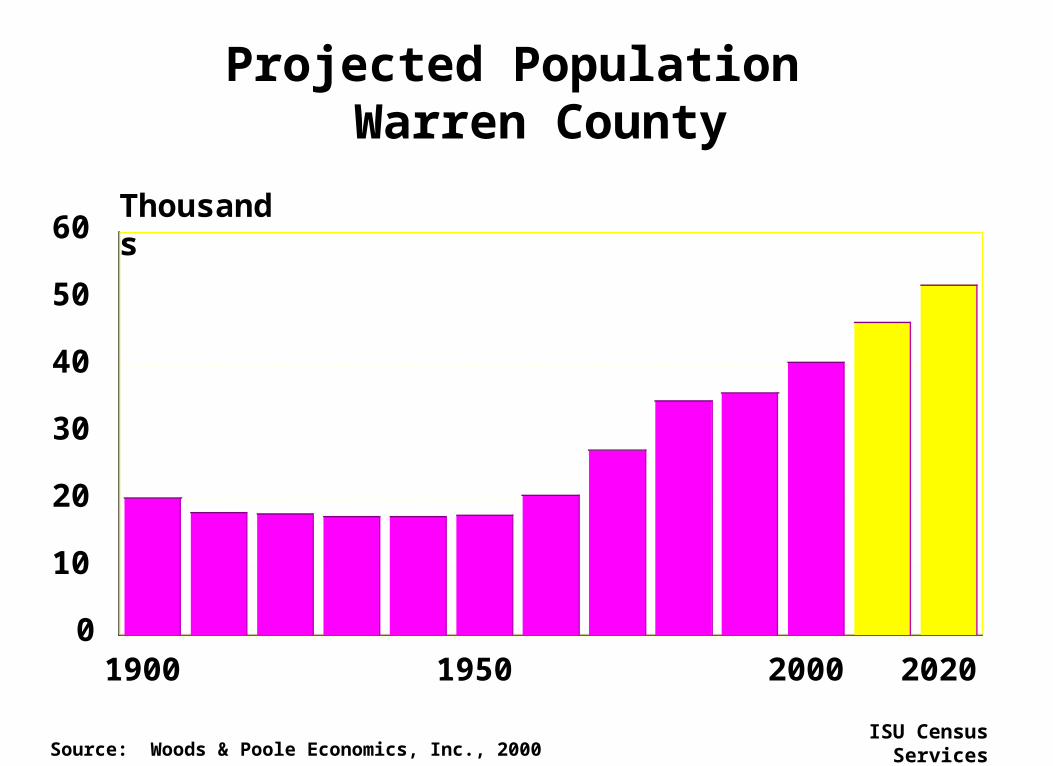
1900 1950 2000 20200
10
20
30
40
50
60Thousands
Projected Population Warren County
ISU Census ServicesSource: Woods & Poole Economics, Inc., 2000
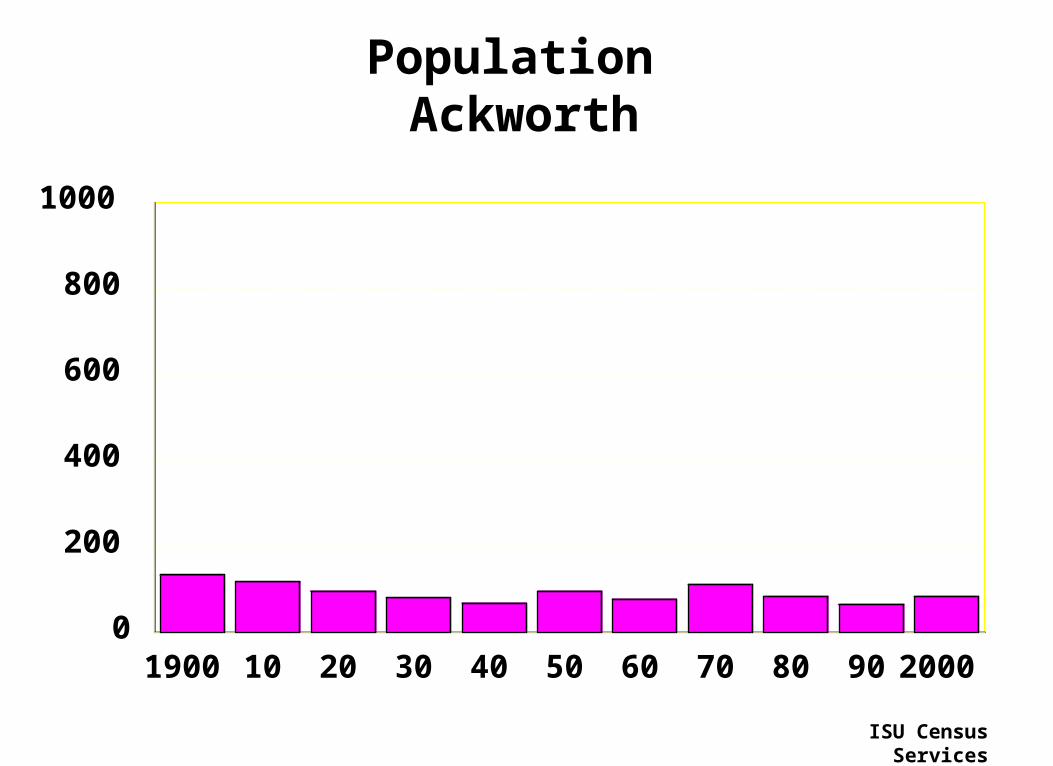
Population Ackworth
1900 10 20 30 40 50 60 70 80 90 20000
200
400
600
800
1000
ISU Census Services

Population Carlisle
1900 10 20 30 40 50 60 70 80 90 20000
1
2
3
4
5Thousands
ISU Census Services
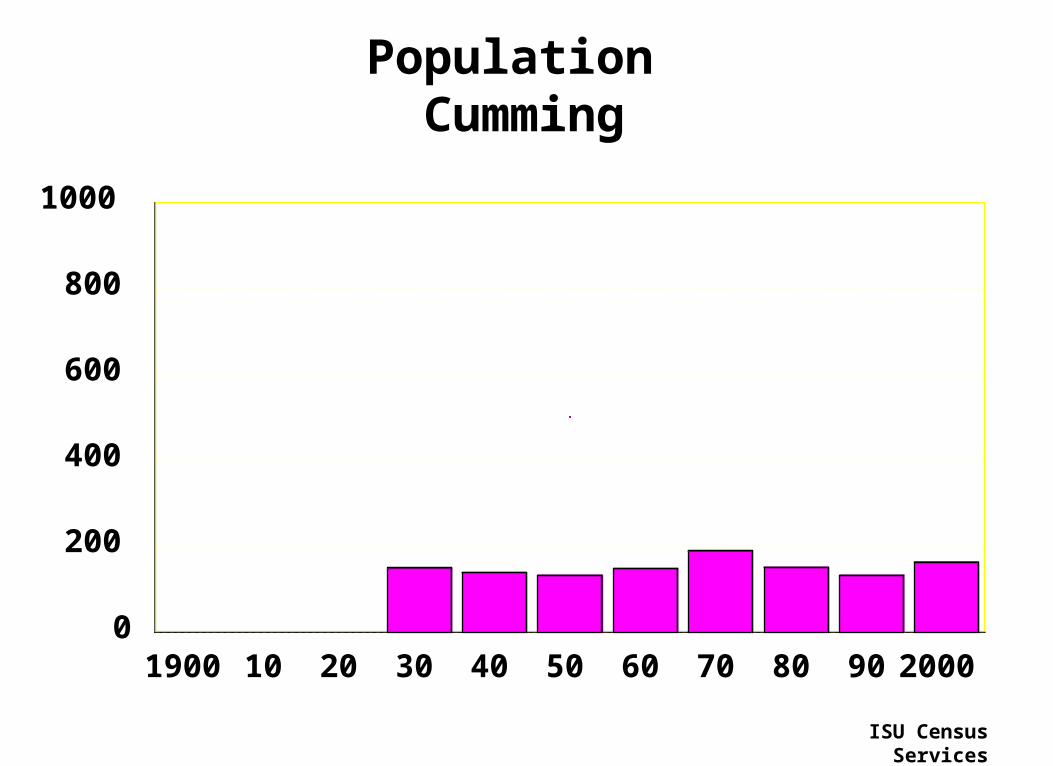
Population Cumming
1900 10 20 30 40 50 60 70 80 90 20000
200
400
600
800
1000
ISU Census Services
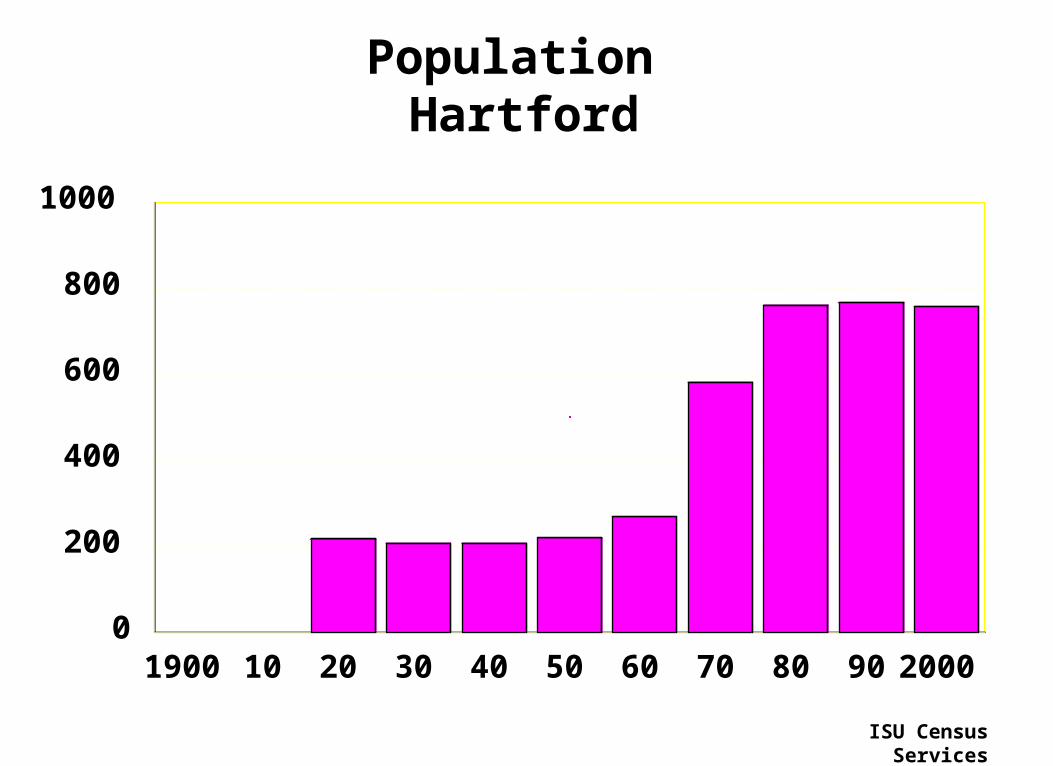
Population Hartford
1900 10 20 30 40 50 60 70 80 90 20000
200
400
600
800
1000
ISU Census Services
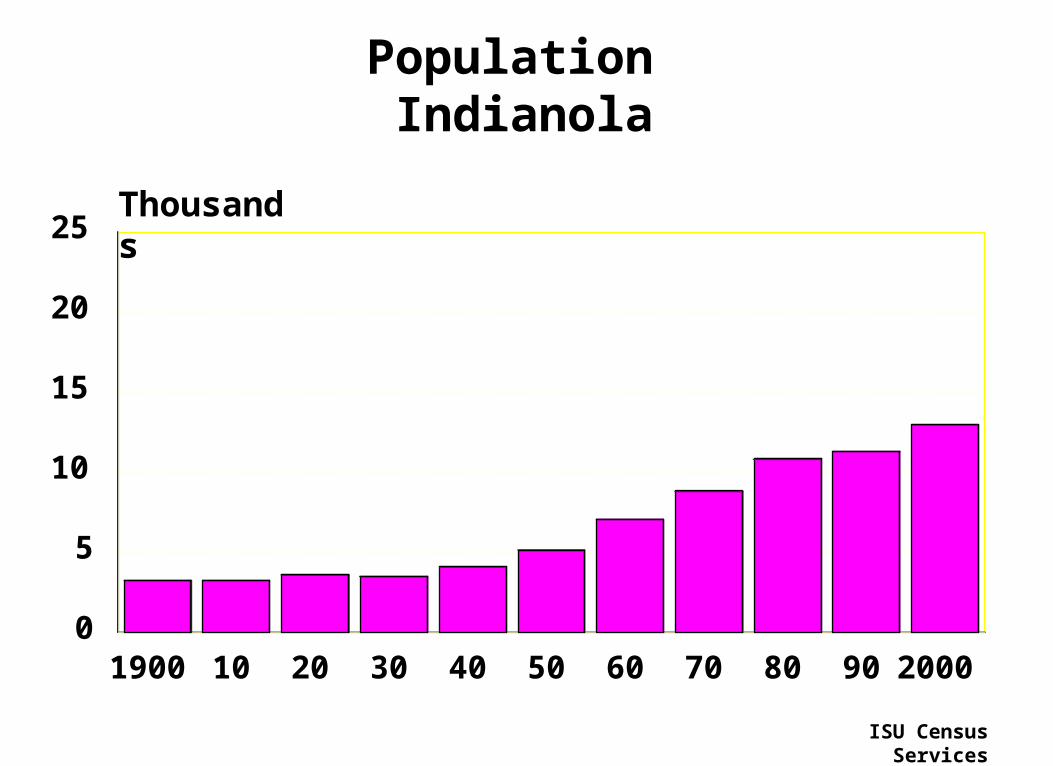
Population Indianola
1900 10 20 30 40 50 60 70 80 90 20000
5
10
15
20
25Thousands
ISU Census Services
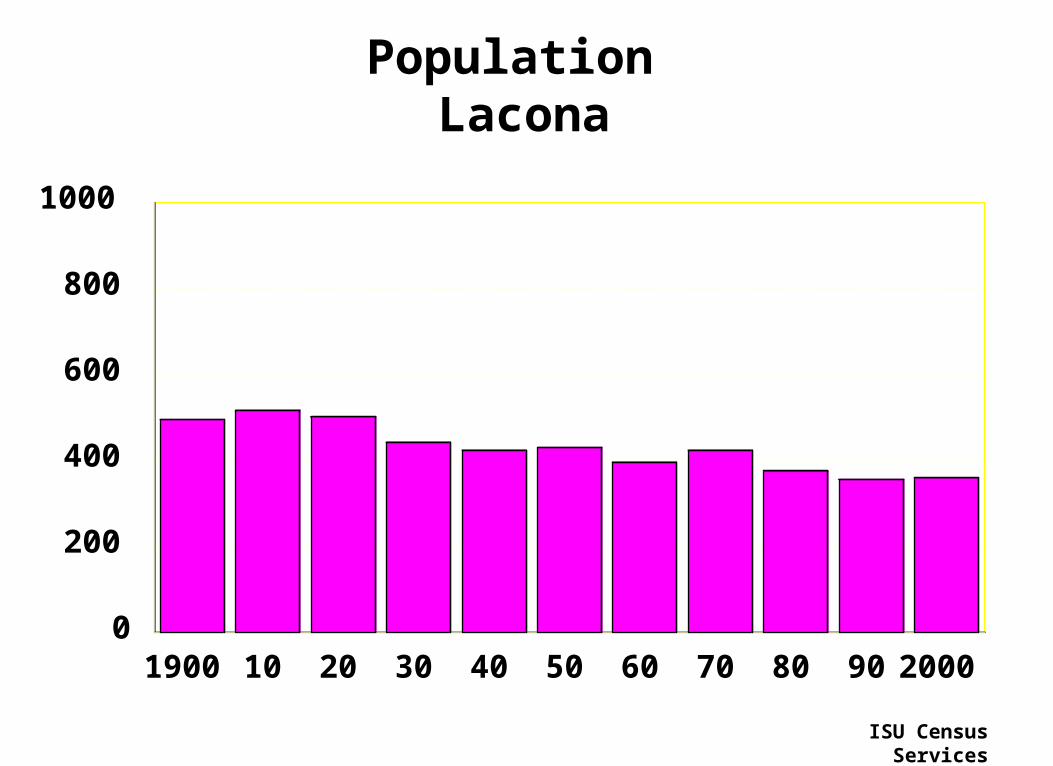
Population Lacona
1900 10 20 30 40 50 60 70 80 90 20000
200
400
600
800
1000
ISU Census Services
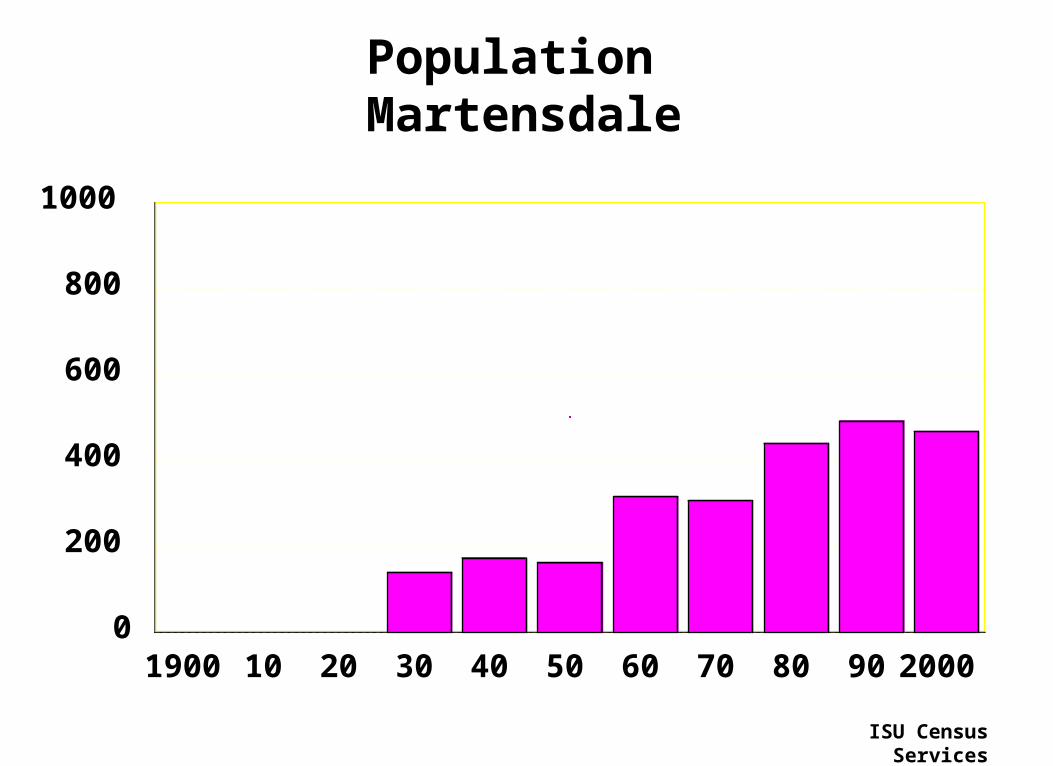
Population Martensdale
1900 10 20 30 40 50 60 70 80 90 20000
200
400
600
800
1000
ISU Census Services
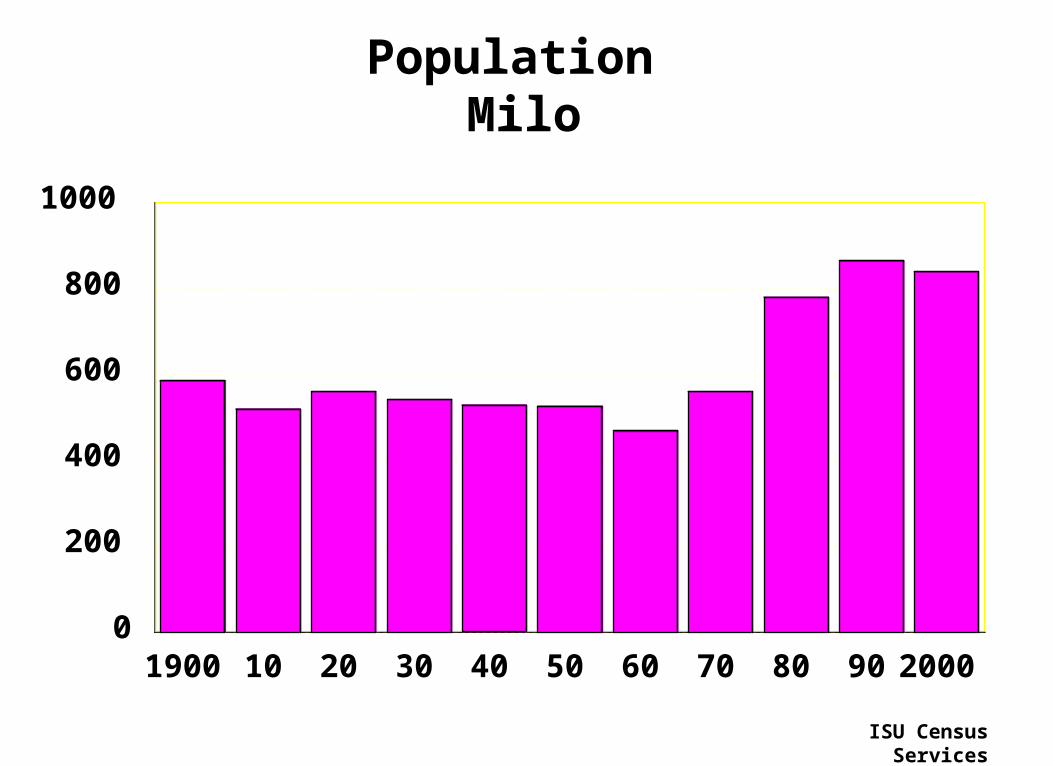
Population Milo
1900 10 20 30 40 50 60 70 80 90 20000
200
400
600
800
1000
ISU Census Services

Population New Virginia
1900 10 20 30 40 50 60 70 80 90 20000
200
400
600
800
1000
ISU Census Services

Population Norwalk
1900 10 20 30 40 50 60 70 80 90 20000
2
4
6
8
10Thousands
ISU Census Services
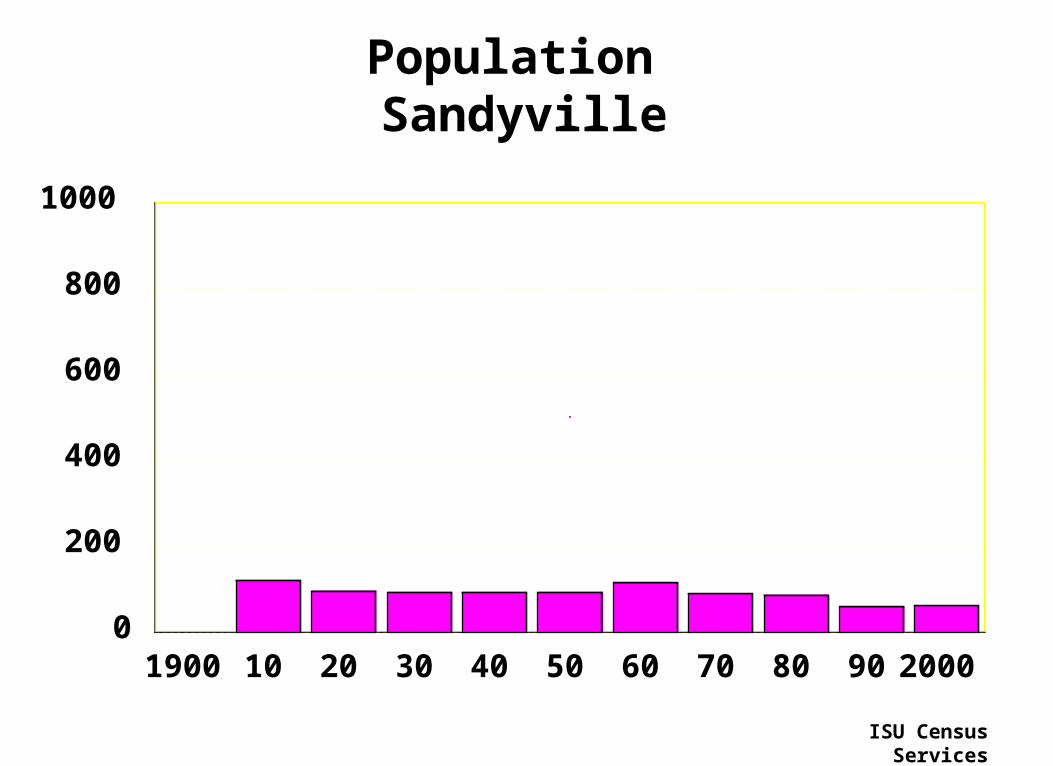
Population Sandyville
1900 10 20 30 40 50 60 70 80 90 20000
200
400
600
800
1000
ISU Census Services
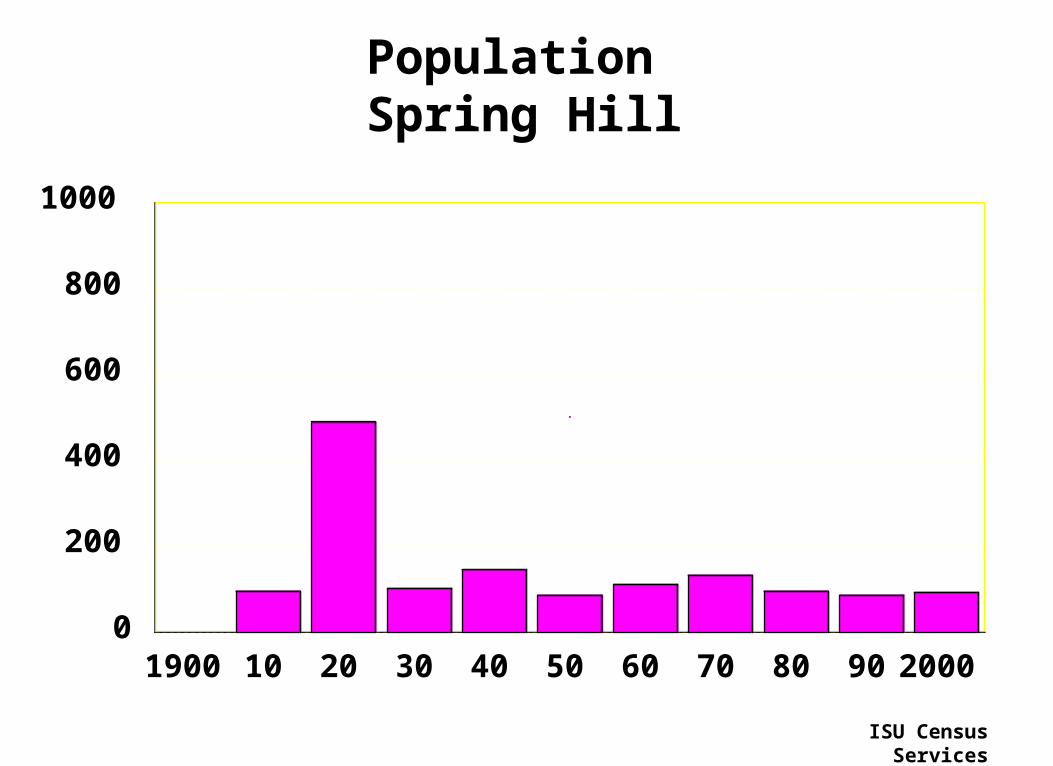
Population Spring Hill
1900 10 20 30 40 50 60 70 80 90 20000
200
400
600
800
1000
ISU Census Services
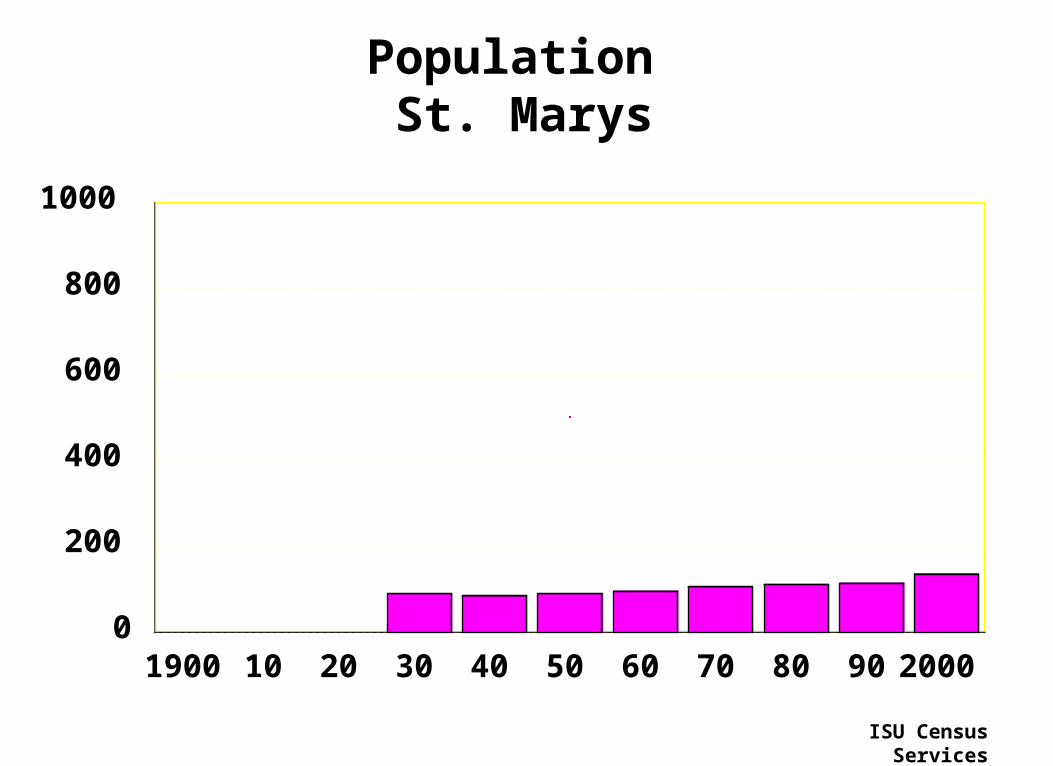
Population St. Marys
1900 10 20 30 40 50 60 70 80 90 20000
200
400
600
800
1000
ISU Census Services
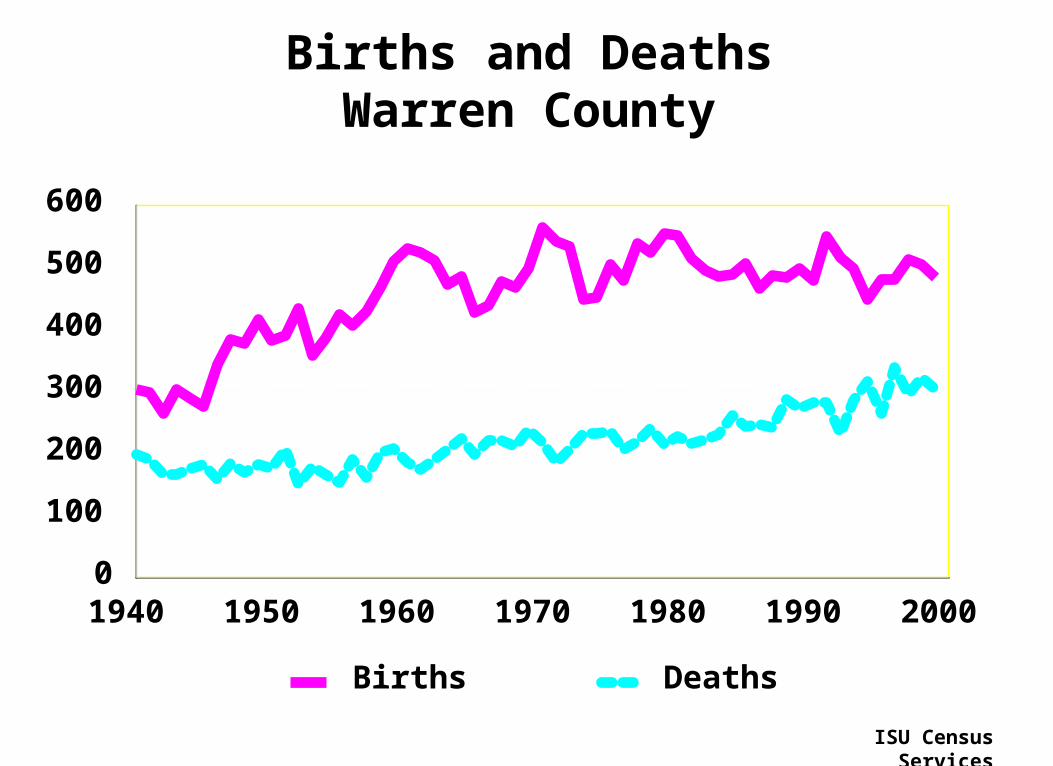
Births and DeathsWarren County
1940 1950 1960 1970 1980 1990 20000
100
200
300
400
500
600
Births Deaths
ISU Census Services
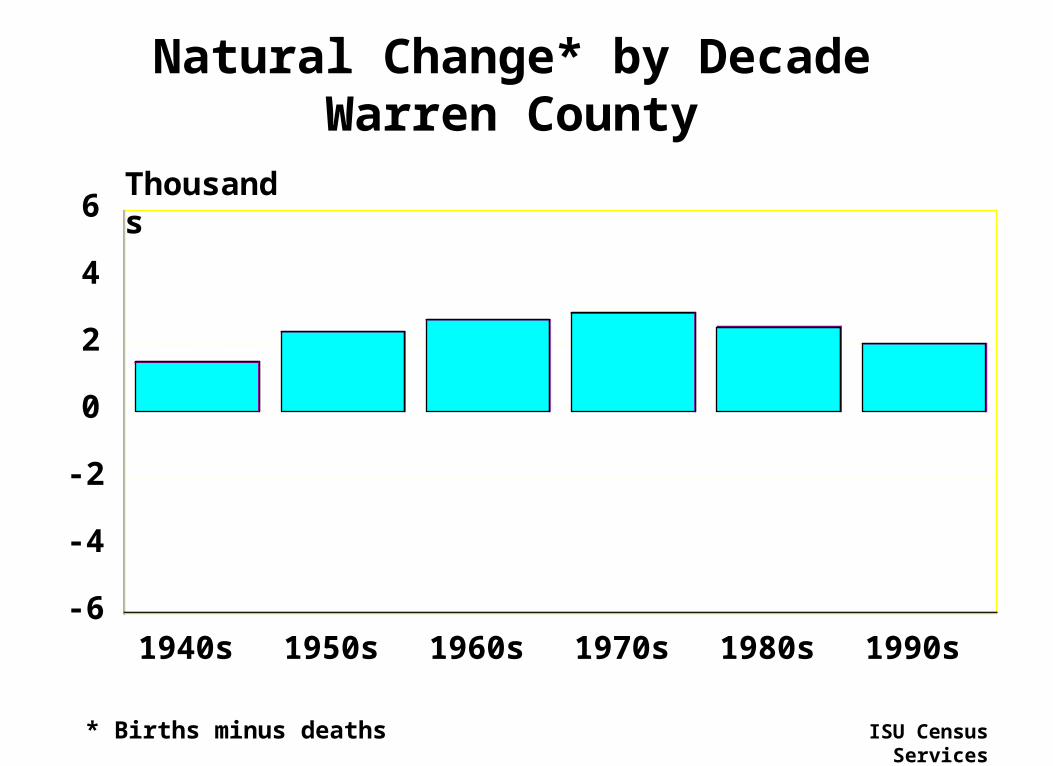
Natural Change* by DecadeWarren County
1940s 1950s 1960s 1970s 1980s 1990s
0
2
4
6
-2
-4
-6
Thousands
ISU Census Services* Births minus deaths
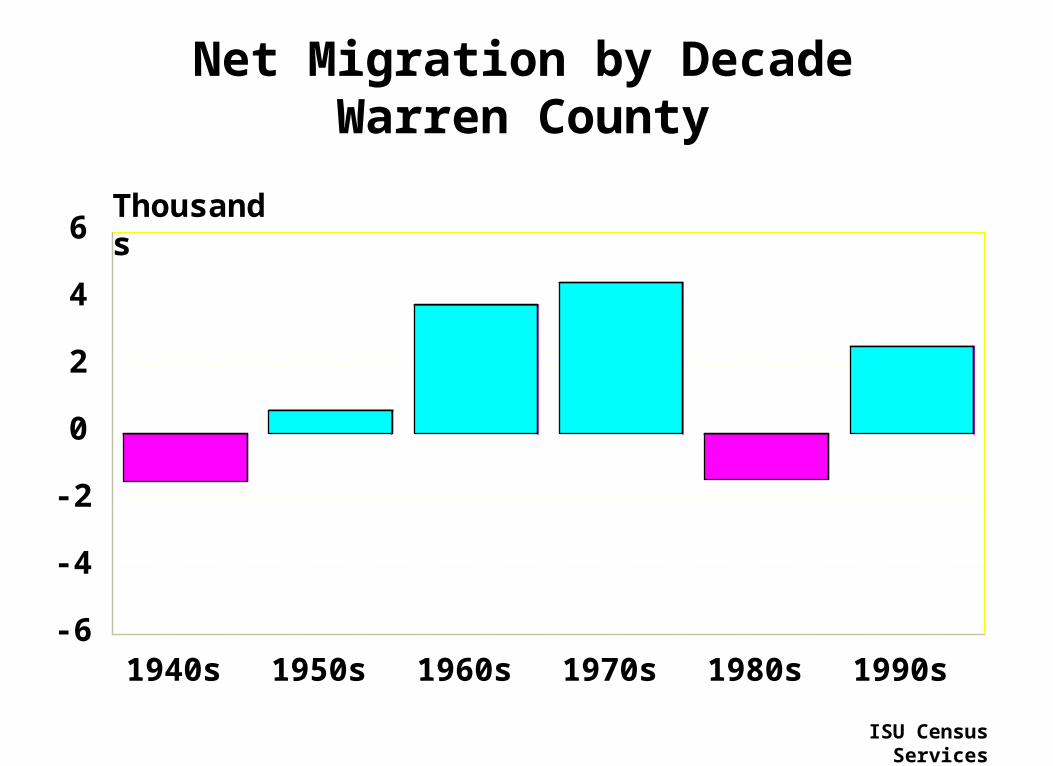
Net Migration by DecadeWarren County
1940s 1950s 1960s 1970s 1980s 1990s
0
2
4
6
-2
-4
-6
Thousands
ISU Census Services
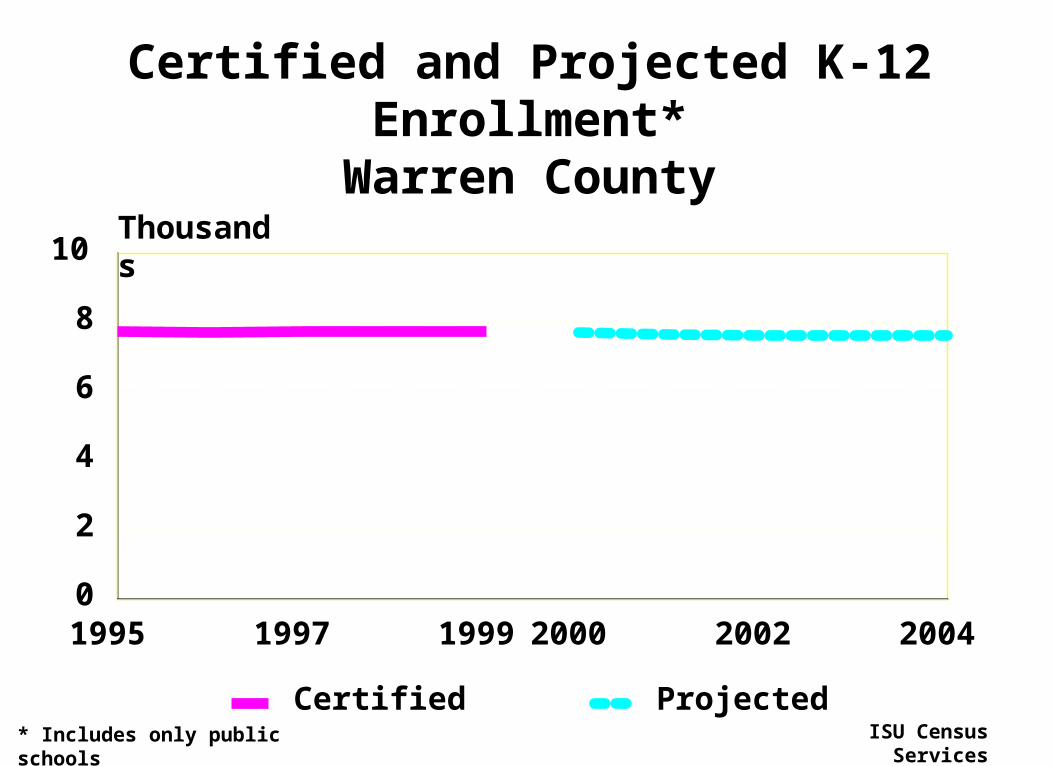
Certified and Projected K-12 Enrollment*Warren County
1995 1997 1999 2000 2002 20040
2
4
6
8
10Thousands
Certified Projected* Includes only public schools ISU Census Services
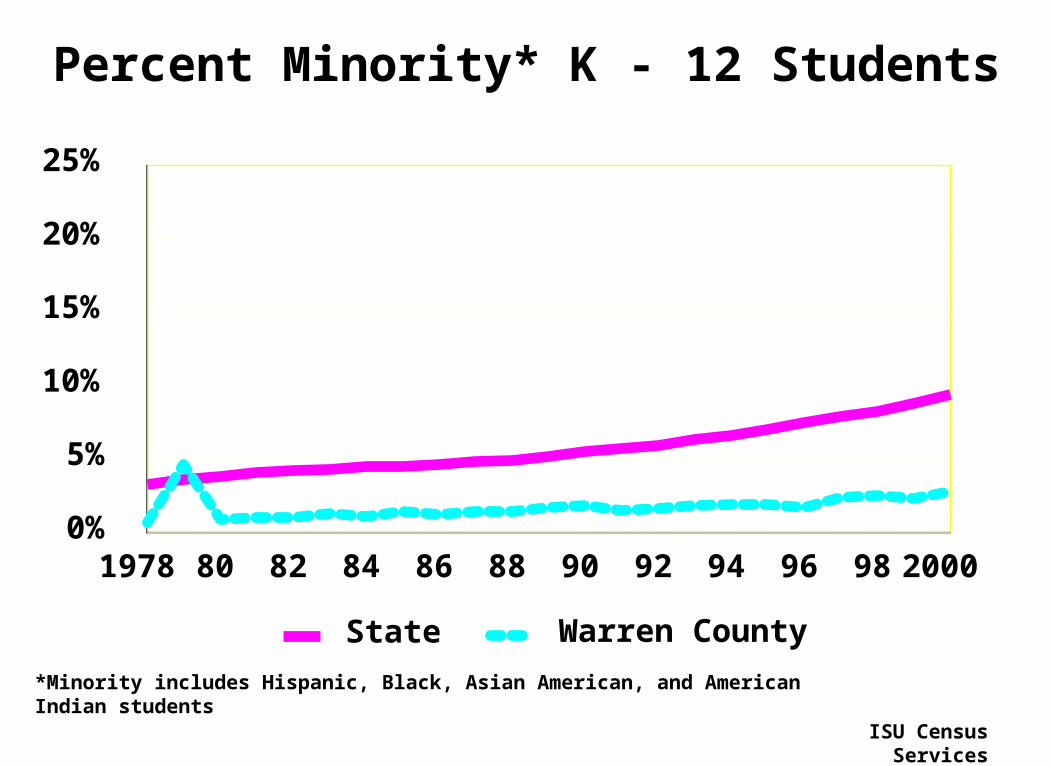
1978 80 82 84 86 88 90 92 94 96 98 20000%
5%
10%
15%
20%
25%
*Minority includes Hispanic, Black, Asian American, and American Indian students
State Warren County
Percent Minority* K - 12 Students
ISU Census Services
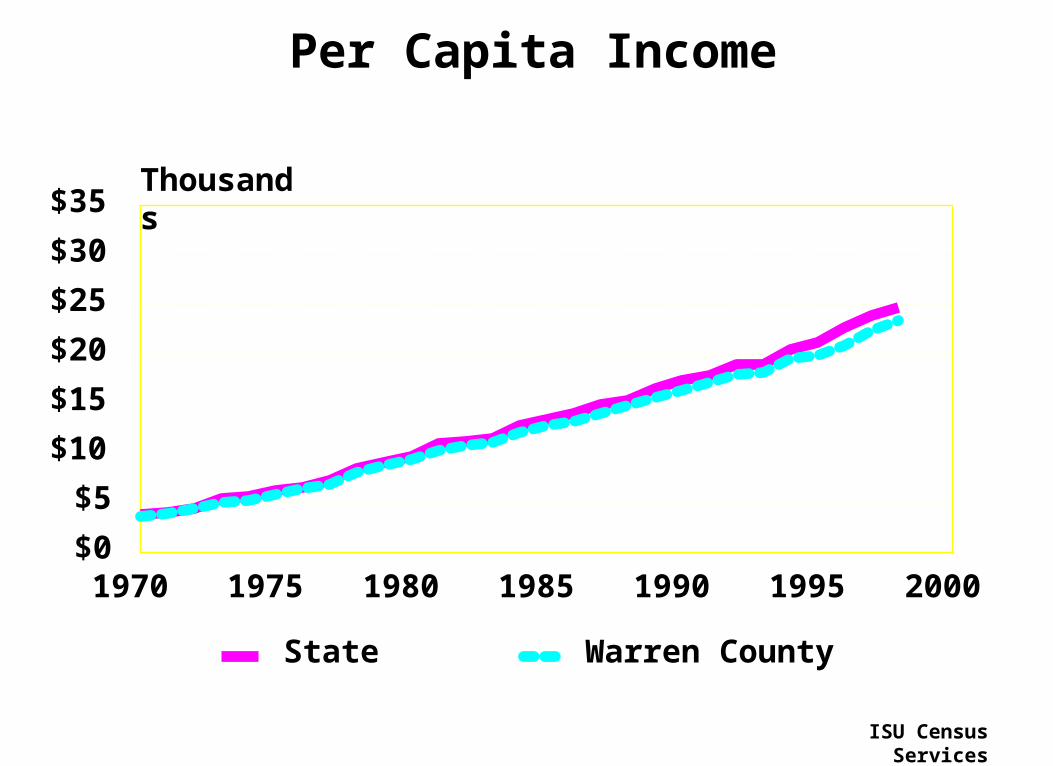
1970 1975 1980 1985 1990 1995 2000$0
$5
$10
$15
$20
$25
$30
$35Thousands
State Warren County
Per Capita Income
ISU Census Services
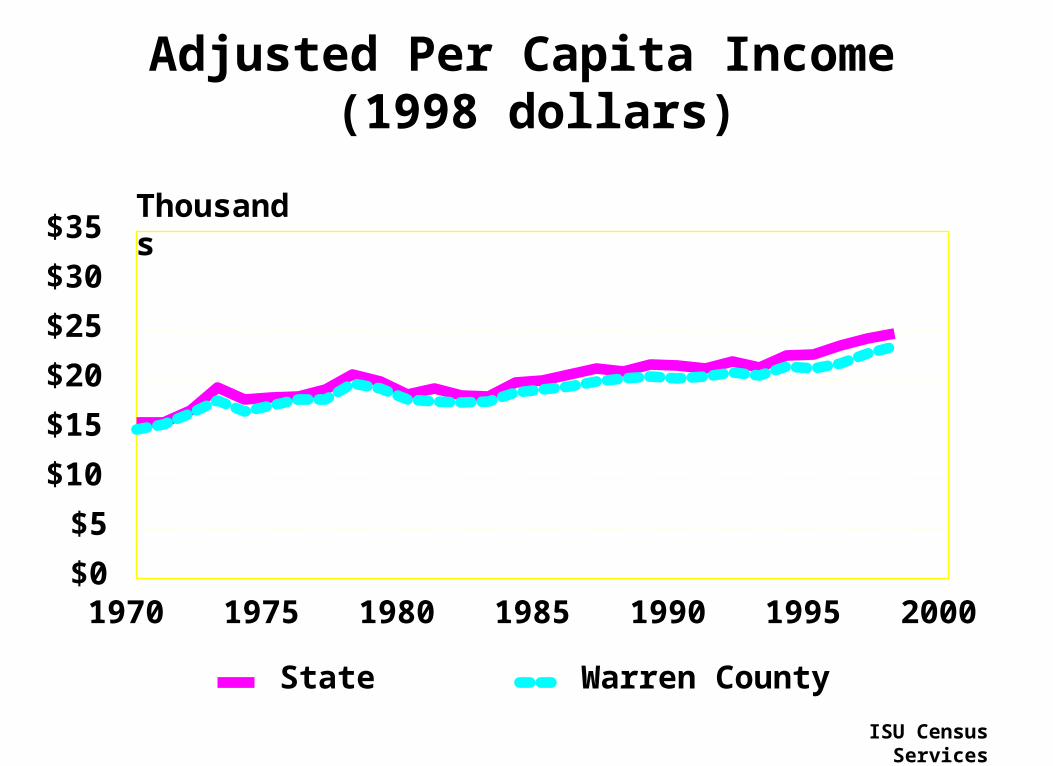
1970 1975 1980 1985 1990 1995 2000$0
$5
$10
$15
$20
$25
$30
$35Thousands
State Warren County
Adjusted Per Capita Income (1998 dollars)
ISU Census Services
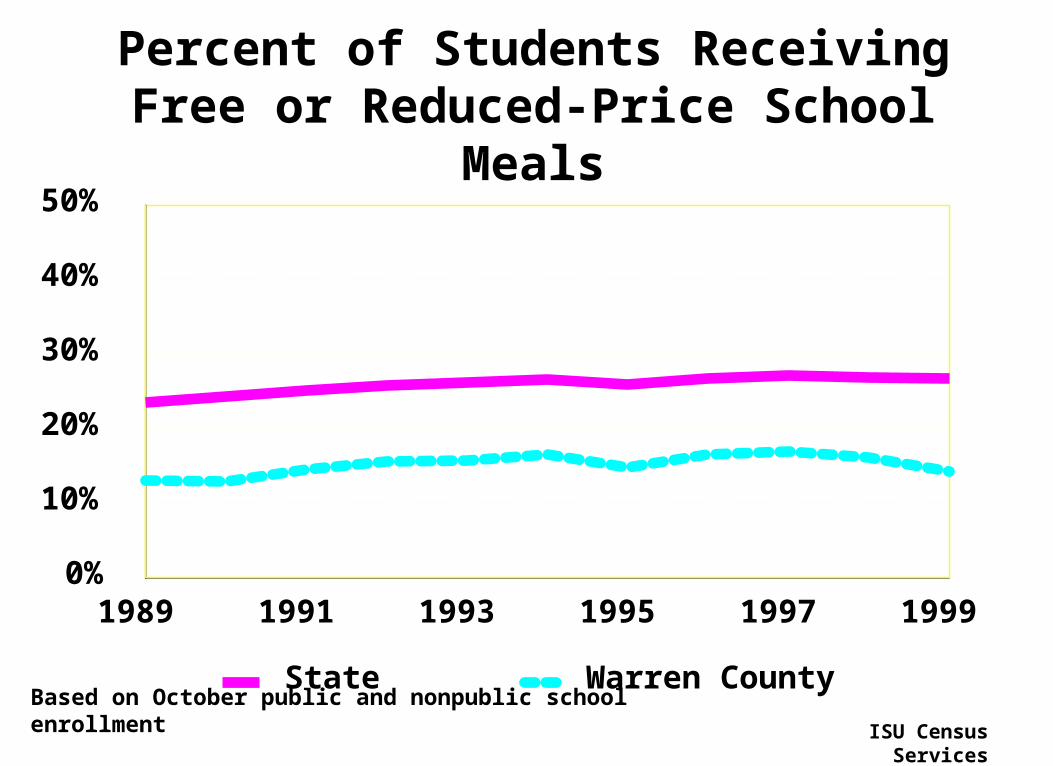
1989 1991 1993 1995 1997 19990%
10%
20%
30%
40%
50%
Based on October public and nonpublic school enrollment
State Warren County
Percent of Students Receiving Free or Reduced-Price School Meals
ISU Census Services

Population Under 5 and 75 or OlderWarren County
1940 1950 1990 20000
500
1000
1500
2000
2500
3000
198019701960
ISU Census Services
Under 5 75 or older

Population 2000Warren County
85+80 - 8475 - 7970 - 7465 - 6960 - 6455 - 6950 - 5445 - 4940 - 4435 - 3930 - 3425 - 2920 - 2415 - 1910 - 14
5 - 90 - 4
0%1%2%3%4%5%6% 0% 1% 2% 3% 4% 5% 6%
Male Female
ISU Census Services
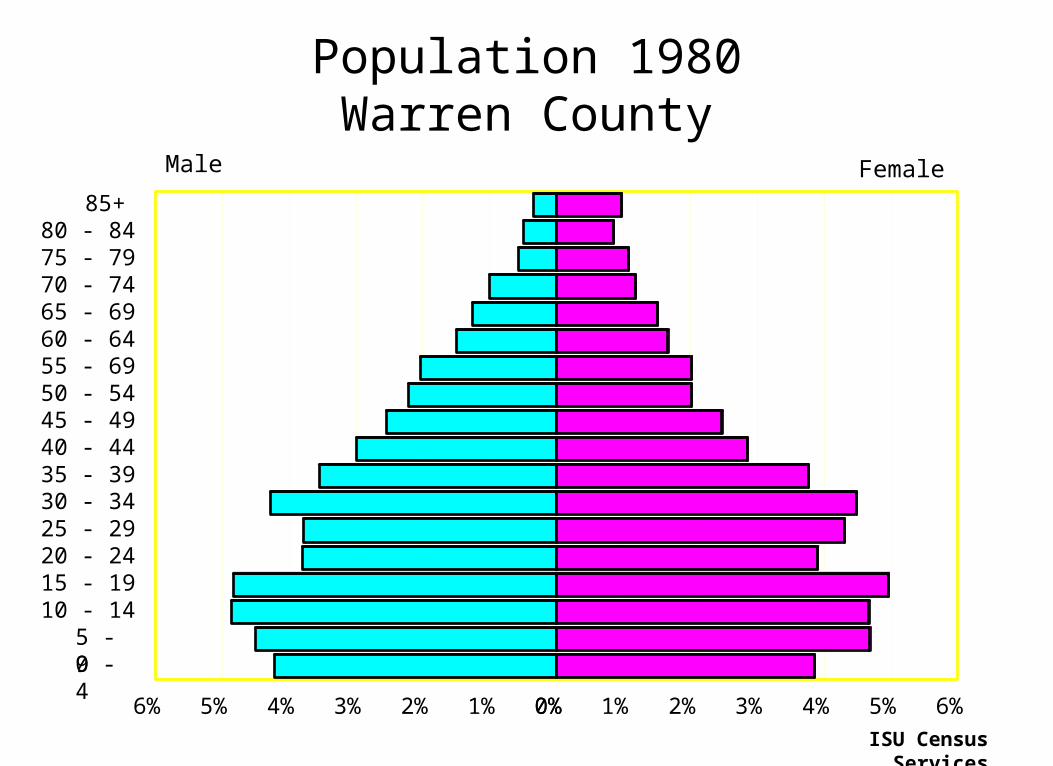
Population 1980Warren County
85+80 - 8475 - 7970 - 7465 - 6960 - 6455 - 6950 - 5445 - 4940 - 4435 - 3930 - 3425 - 2920 - 2415 - 1910 - 14
5 - 90 - 4
0%1%2%3%4%5%6% 0% 1% 2% 3% 4% 5% 6%
Male Female
ISU Census Services
Surplus or Leakage of Retail Sales
• An indicator of the economic health of the county’s retail sector
• A positive number means there is a net inflow (surplus) of retail sales into the county
• A negative number means there is a net outflow of retail sales (leakage)
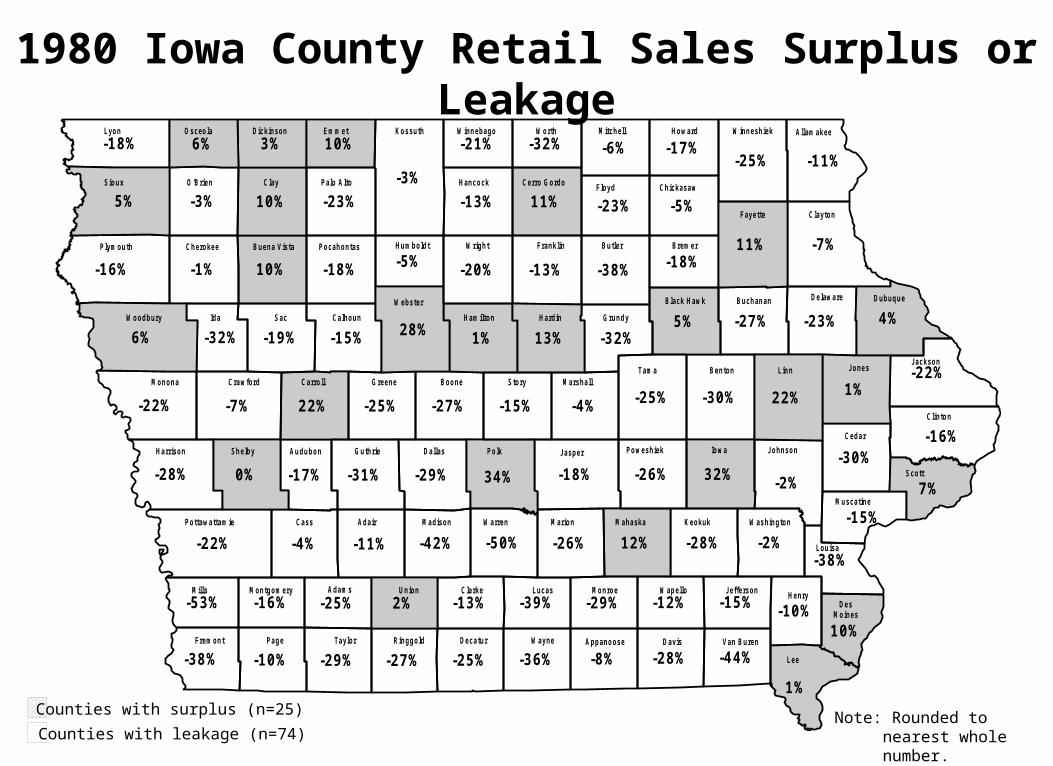
1980 Iowa County Retail Sales Surplus or Leakage
-11%
-25%
-11%
-8%
-17%
-30%
5%
-27%
-18%
-27%
10% -38%
-15%
22%
-4%
-30%
11%
-1%
-5%
-13%
10%
-7%
-16%
-7%
-29%
-28%-25%
-23%
10%
3%
4%
10%
11%
-23%
-13%
-38%
-25%
-32%
-31%
1%
-13%
13%
-28%
-10%
-17%
-5%
-32%
32%
-22%
-18%
-15%
-2%
1%
-28%
-3%
1%
22%
-38%
-39%
-18%
-42% 12%-26%
-4%
-53%
-6%
-22%
-29%-16%
-15%
-3%
6%
-10%
-23%
-16% -18%
34%
-22%
-26%
-27%
-19%
7%0%
5%
-15% -25%
-29%
2%
-44%
-12%
-50% -2%
-36%
28%
-21%-25%
6%
-32%
-20%
Lyon
Sioux
Plym outh
W oodbury
Montgom ery
Harrison
Monona
Pottawattam ie
Mills
Frem ont Page Taylor Ringgold Decatur W ayne Appanoose Davis
Adam s Union Clarke Lucas Monroe W apello Jefferson
Van Buren
Lee
HenryDes
Moines
Cass Adair Madison W arren Marion Mahaska Keokuk W ashington
Louisa
Muscatine
Scott
Cedar
Clinton
JacksonJonesLinn
Johnson
Osceola
O'Brien
Cherokee
Ida
Dickinson
Clay
Buena Vista
Em m et
Palo Alto
Pocahontas
Sac
Crawford
Shelby Audubon
Carroll
Calhoun
Greene
Guthrie
Kossuth
Hum boldt
W ebster
Boone
Dallas Polk Jasper Poweshiek Iowa
Tam a BentonStory Marshall
Ham ilton Hardin Grundy
Black Hawk Buchanan Delaware Dubuque
W right Franklin Butler Brem er
Fayette Clayton
W inneshiek Allam akeeW innebago
Hancock
W orth
Cerro Gordo
Mitchell
Floyd
Howard
Chickasaw
Counties with surplus (n=25)
Counties with leakage (n=74)Note: Rounded to nearest
whole number.
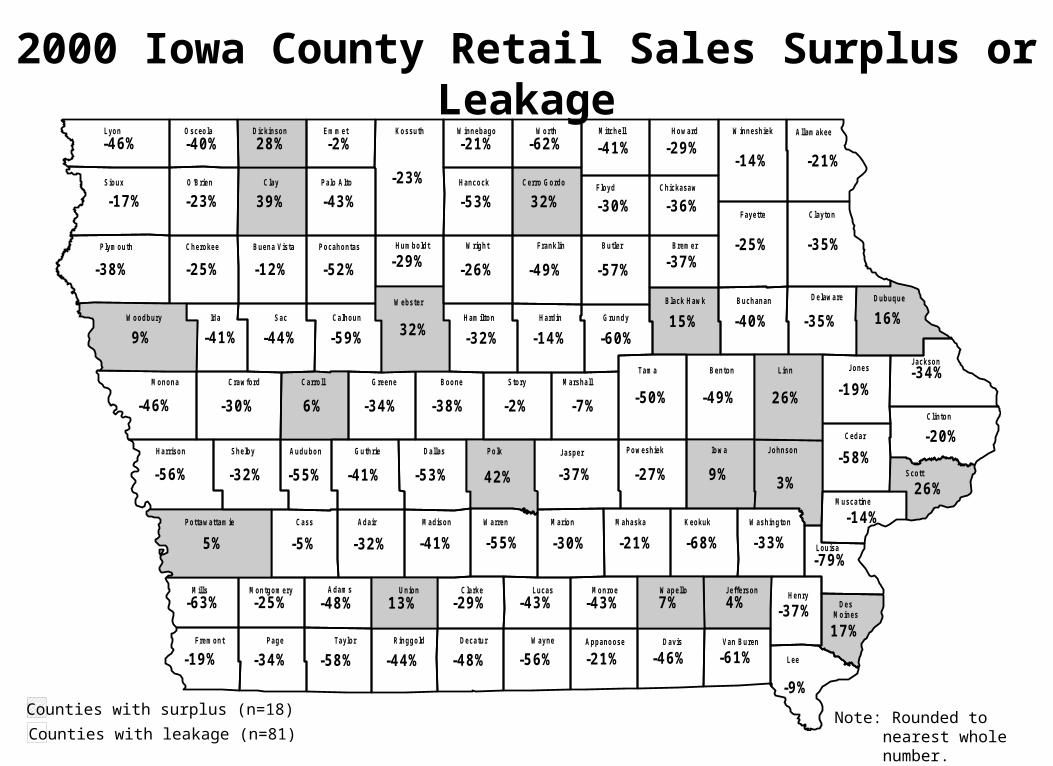
2000 Iowa County Retail Sales Surplus or Leakage
-32%
-48%
-21%
-21%
-55%
-49%
15%
-38%
-37%
-40%
-12% -57%
-59%
6%
-5%
-58%
32%
-25%
-36%
-29%
39%
-35%
-20%
-30%
-53%
-46%-48%
-35%
17%
28%
16%
-2%
-25%
-30%
-49%
-19%
-34%
-60%
-41%
-32%
-53%
-14%
-56%
-37%
-29%
-29%
-41%
9%
-34%
-37%
4%
3%
-19%
-68%
-23%
-9%
26%
-79%
-43%
-46%
-41% -21%-30%
-7%
-63%
-41%
-46%
-43%-25%
-14%
-23%
-40%
-34%
-43%
-38% -52%
42%
5%
-27%
-44%
-44%
26%-32%
-17%
-2% -50%
-58%
13%
-61%
7%
-55% -33%
-56%
32%
-21%-14%
9%
-62%
-26%
Lyon
Sioux
Plym outh
W oodbury
Montgom ery
Harrison
Monona
Pottawattam ie
Mills
Frem ont Page Taylor Ringgold Decatur W ayne Appanoose Davis
Adam s Union Clarke Lucas Monroe W apello Jefferson
Van Buren
Lee
HenryDes
Moines
Cass Adair Madison W arren Marion Mahaska Keokuk W ashington
Louisa
Muscatine
Scott
Cedar
Clinton
JacksonJonesLinn
Johnson
Osceola
O'Brien
Cherokee
Ida
Dickinson
Clay
Buena Vista
Em m et
Palo Alto
Pocahontas
Sac
Crawford
Shelby Audubon
Carroll
Calhoun
Greene
Guthrie
Kossuth
Hum boldt
W ebster
Boone
Dallas Polk Jasper Poweshiek Iowa
Tam a BentonStory Marshall
Ham ilton Hardin Grundy
Black Hawk Buchanan Delaware Dubuque
W right Franklin Butler Brem er
Fayette Clayton
W inneshiek Allam akeeW innebago
Hancock
W orth
Cerro Gordo
Mitchell
Floyd
Howard
Chickasaw
Counties with surplus (n=18)
Counties with leakage (n=81)Note: Rounded to nearest
whole number.
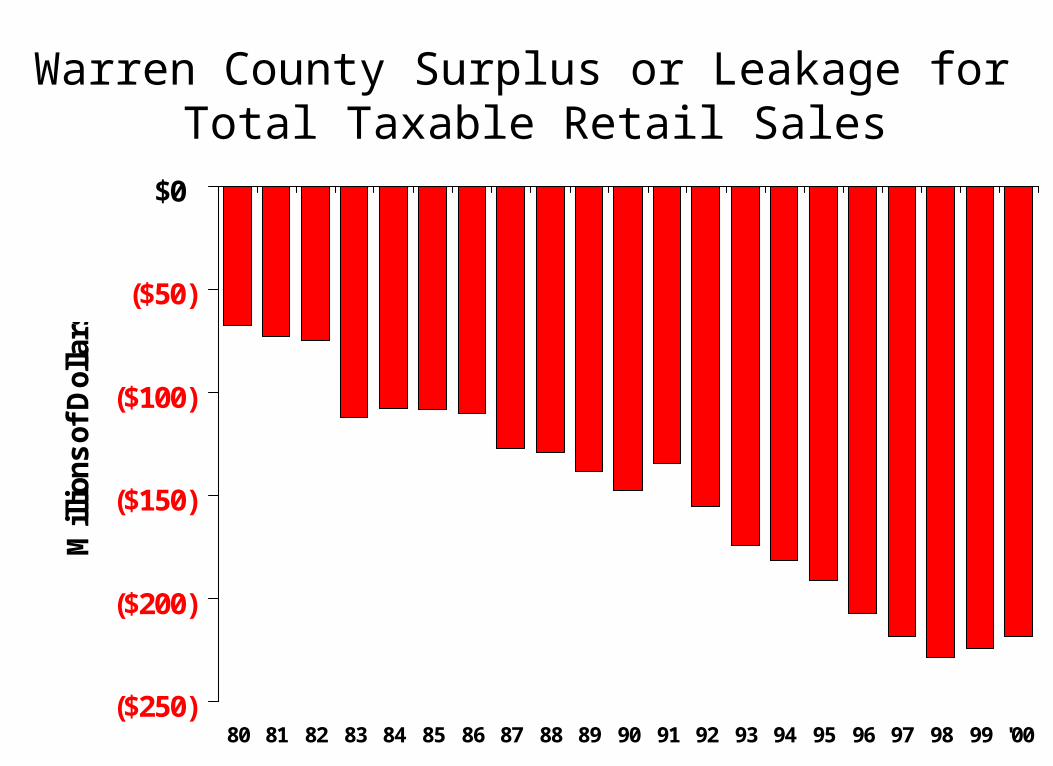
Warren County Surplus or Leakage for Total Taxable Retail Sales
($250)
($200)
($150)
($100)
($50)
$0
80 81 82 83 84 85 86 87 88 89 90 91 92 93 94 95 96 97 98 99 '00
Mil
lion
s of
Dol
lars
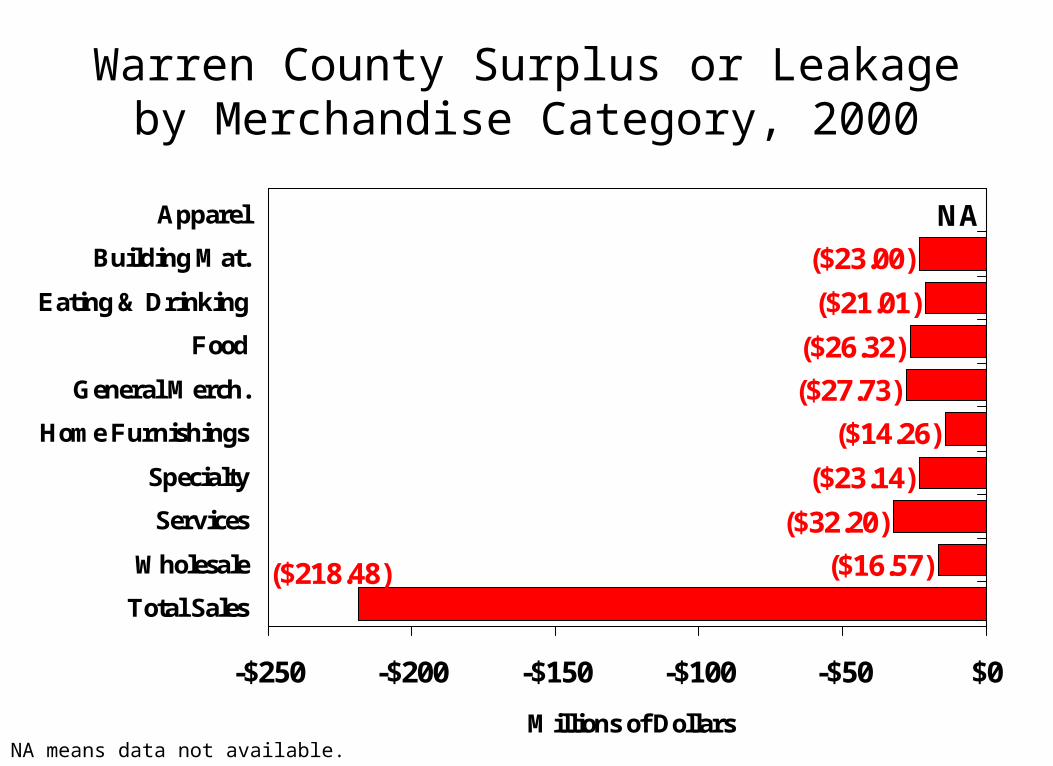
Warren County Surplus or Leakage by Merchandise Category, 2000
($16.57)
($32.20)
($23.14)
($14.26)
($27.73)
($26.32)
($21.01)
($23.00)
NA
($218.48)
-$250 -$200 -$150 -$100 -$50 $0
Total Sales
Wholesale
Services
Specialty
Home Furnishings
General Merch.
Food
Eating & Drinking
Building Mat.
Apparel
Millions of DollarsNA means data not available.
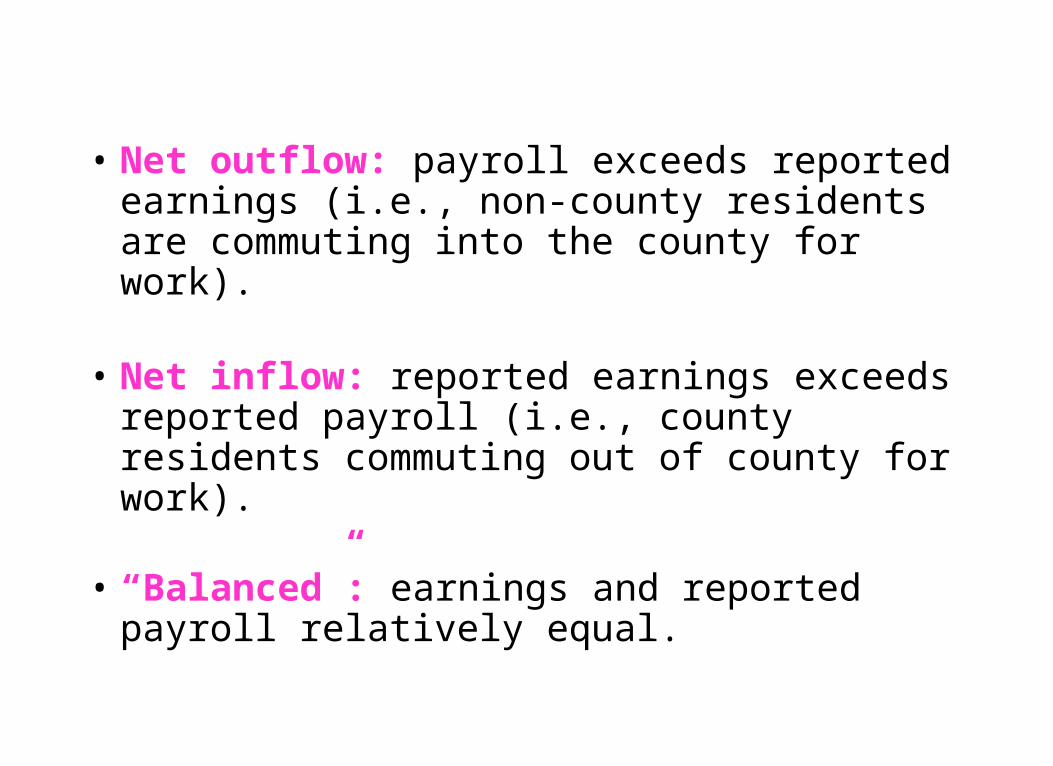
• Net outflow: payroll exceeds reported earnings (i.e., non-county residents are commuting into the county for work).
• Net inflow: reported earnings exceeds reported payroll (i.e., county residents commuting out of county for work).
• “Balanced”: earnings and reported payroll relatively equal.
Lyon
Sioux
Plym outh
W oodbury
Montgom ery
Harrison
Monona
Pottawattam ie
Mills
Frem ont Page Taylor Ringgold Decatur W ayne Appanoose Davis
Adam s Union Clarke Lucas Monroe W apello Jefferson
Van Buren
Lee
HenryDes
Moines
Cass Adair Madison W arren Marion Mahaska Keokuk W ashington
Louisa
Muscatine
Scott
Cedar
Clinton
JacksonJonesLinn
Johnson
Osceola
O'Brien
Cherokee
Ida
Dickinson
Clay
Buena Vista
Em m et
Palo Alto
Pocahontas
Sac
Crawford
Shelby Audubon
Carroll
Calhoun
Greene
Guthrie
Kossuth
Hum boldt
W ebster
Boone
Dallas Polk Jasper Poweshiek Iowa
Tam a BentonStory Marshall
Ham ilton Hardin Grundy
Black Hawk Buchanan Delaware Dubuque
W right Franklin Butler Brem er
Fayette Clayton
W inneshiek Allam akeeW innebago
Hancock
W orth
Cerro Gordo
Mitchell
Floyd
Howard
Chickasaw
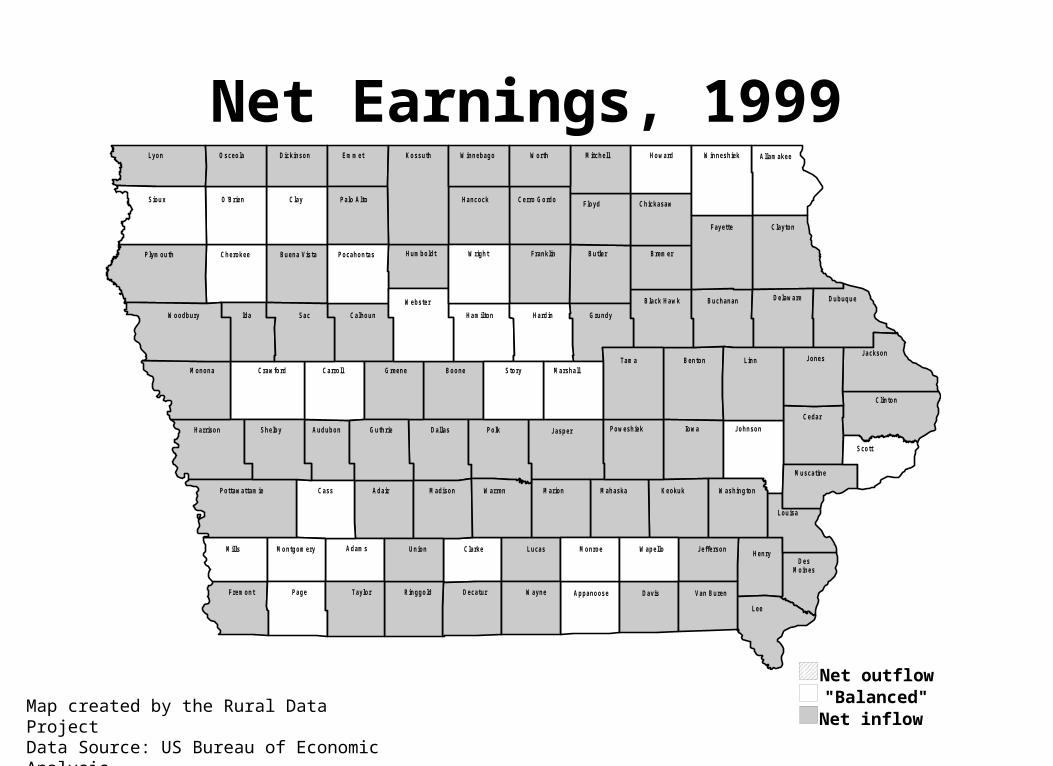
Net Earnings, 1999
Map created by the Rural Data ProjectData Source: US Bureau of Economic Analysis
Net outflow"Balanced"Net inflow
Related Documents