Resilience design in smallholder farming systems Measurement Toolkit

Welcome message from author
This document is posted to help you gain knowledge. Please leave a comment to let me know what you think about it! Share it to your friends and learn new things together.
Transcript
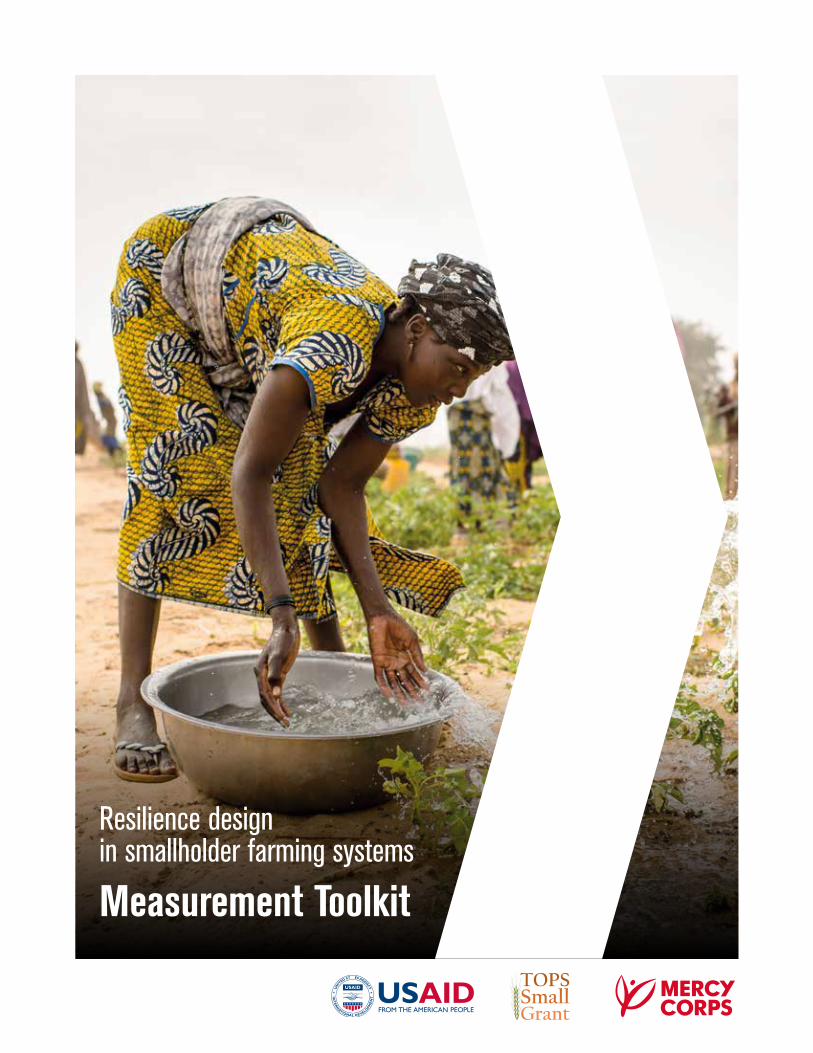
Resilience design in smallholder farming systems
Measurement Toolkit
Glossary of acronyms GPS Global positioning system
HDD Household dietary diversity
M&E Monitoring and evaluation
MSC Most significant change
PIA Participatory impact assessment
RD Resilience design
TOPS Technical and Operational Performance Support program
This toolkit was developed by
Elin L Duby, consultant for
Mercy Corps and
The TOPS Program
Cover photograph:
Sean Sheridan/Mercy Corps The development of this tool was made possible by a grant from The Technical and Operational Performance
Support (TOPS) Program. The TOPS Small Grants Program Improvement Award (PIA) is made possible by the
generous support and contribution of the American people through the U.S. Agency for International Development
(USAID). The contents of the materials produced through the PIAs do not necessarily reflect the views of TOPS,
USAID, or the U.S. Government.
Contents
Overview 4
Indicators and measurement 5 Indicators
Measurement tools
Farm-level measurements 9 Farm Resilience Assessment
Farm Production Assessment
Soil Health Assessment
Community-level measurements 12Food Security Impact Calendar: Measuring changes in food security
Before and After Scoring: Measuring changes in food source
Before and After Scoring: Measuring changes in dietry diversity
Simple Scoring with Nominal Baseline: Measuring changes in farm production
Simple Scoring with Nominal Baseline: Measuring changes in income from farm production
Before and After Scoring: Measuing time-saving benefits
Before and After Scoring: Measuring changes in perceived adaptive capacity
Most Significant Change Stories: Capturing stories of innovation, capacity building and change
Annexes 1 Resilience Design Indicator Table 23
2 Farm Resilience Assessment Tool 30
3 Farm Production Assessment Tool 35
4 Soil Health Assessment Tool 37
Endnotes 42
4Resilience Design Measurement Toolkit | Mercy Corps
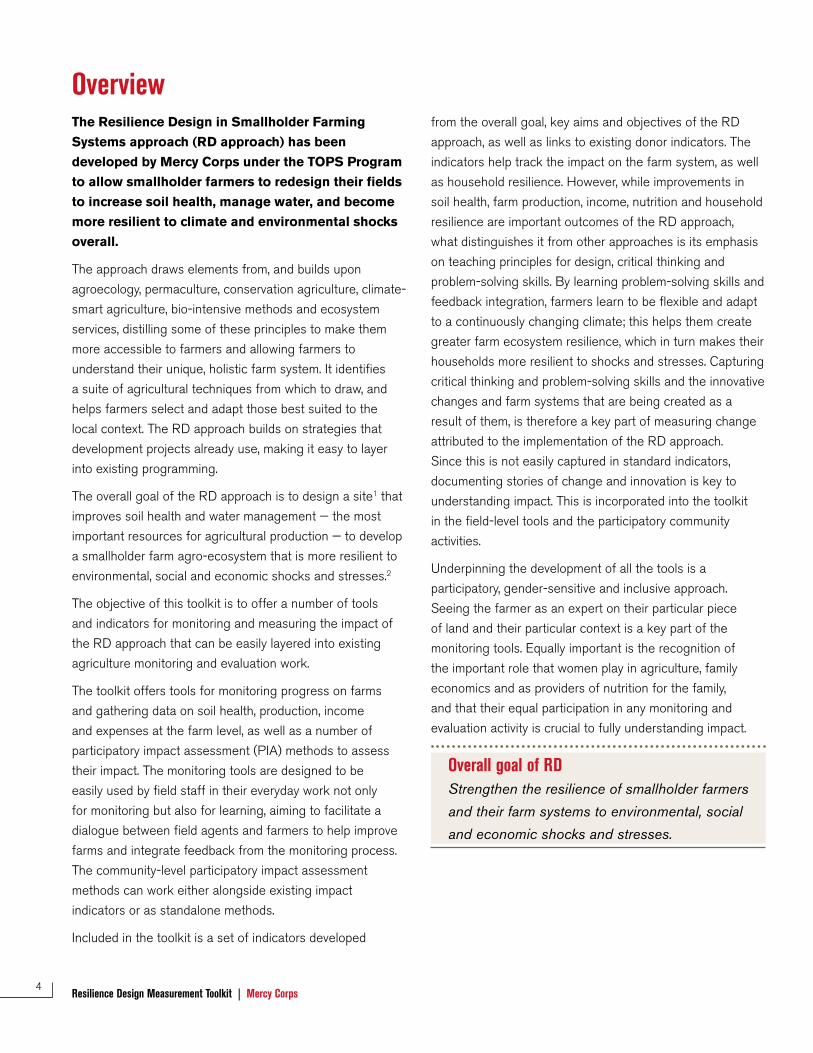
Overview The Resilience Design in Smallholder Farming
Systems approach (RD approach) has been
developed by Mercy Corps under the TOPS Program
to allow smallholder farmers to redesign their fields
to increase soil health, manage water, and become
more resilient to climate and environmental shocks
overall.
The approach draws elements from, and builds upon
agroecology, permaculture, conservation agriculture, climate-
smart agriculture, bio-intensive methods and ecosystem
services, distilling some of these principles to make them
more accessible to farmers and allowing farmers to
understand their unique, holistic farm system. It identifies
a suite of agricultural techniques from which to draw, and
helps farmers select and adapt those best suited to the
local context. The RD approach builds on strategies that
development projects already use, making it easy to layer
into existing programming.
The overall goal of the RD approach is to design a site1 that
improves soil health and water management — the most
important resources for agricultural production — to develop
a smallholder farm agro-ecosystem that is more resilient to
environmental, social and economic shocks and stresses.2
The objective of this toolkit is to offer a number of tools
and indicators for monitoring and measuring the impact of
the RD approach that can be easily layered into existing
agriculture monitoring and evaluation work.
The toolkit offers tools for monitoring progress on farms
and gathering data on soil health, production, income
and expenses at the farm level, as well as a number of
participatory impact assessment (PIA) methods to assess
their impact. The monitoring tools are designed to be
easily used by field staff in their everyday work not only
for monitoring but also for learning, aiming to facilitate a
dialogue between field agents and farmers to help improve
farms and integrate feedback from the monitoring process.
The community-level participatory impact assessment
methods can work either alongside existing impact
indicators or as standalone methods.
Included in the toolkit is a set of indicators developed
from the overall goal, key aims and objectives of the RD
approach, as well as links to existing donor indicators. The
indicators help track the impact on the farm system, as well
as household resilience. However, while improvements in
soil health, farm production, income, nutrition and household
resilience are important outcomes of the RD approach,
what distinguishes it from other approaches is its emphasis
on teaching principles for design, critical thinking and
problem-solving skills. By learning problem-solving skills and
feedback integration, farmers learn to be flexible and adapt
to a continuously changing climate; this helps them create
greater farm ecosystem resilience, which in turn makes their
households more resilient to shocks and stresses. Capturing
critical thinking and problem-solving skills and the innovative
changes and farm systems that are being created as a
result of them, is therefore a key part of measuring change
attributed to the implementation of the RD approach.
Since this is not easily captured in standard indicators,
documenting stories of change and innovation is key to
understanding impact. This is incorporated into the toolkit
in the field-level tools and the participatory community
activities.
Underpinning the development of all the tools is a
participatory, gender-sensitive and inclusive approach.
Seeing the farmer as an expert on their particular piece
of land and their particular context is a key part of the
monitoring tools. Equally important is the recognition of
the important role that women play in agriculture, family
economics and as providers of nutrition for the family,
and that their equal participation in any monitoring and
evaluation activity is crucial to fully understanding impact.
Overall goal of RDStrengthen the resilience of smallholder farmers
and their farm systems to environmental, social
and economic shocks and stresses.
5Resilience Design Measurement Toolkit | Mercy Corps
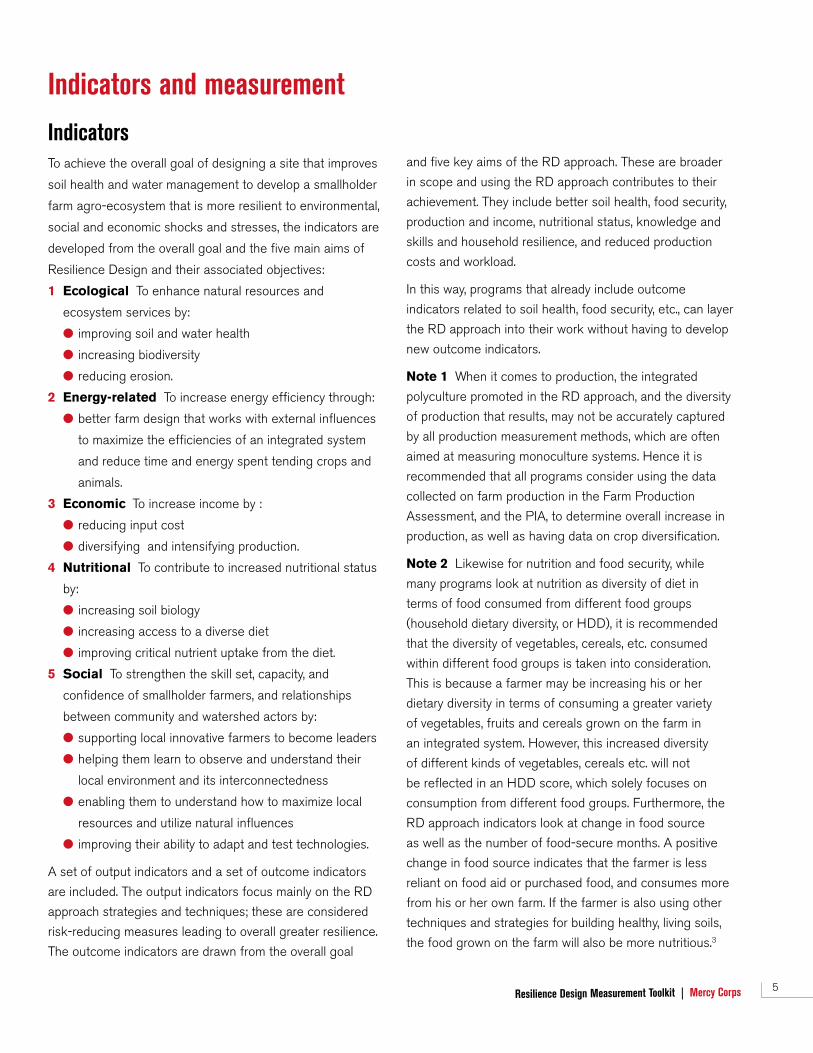
Indicators and measurement
Indicators To achieve the overall goal of designing a site that improves
soil health and water management to develop a smallholder
farm agro-ecosystem that is more resilient to environmental,
social and economic shocks and stresses, the indicators are
developed from the overall goal and the five main aims of
Resilience Design and their associated objectives:
1 Ecological To enhance natural resources and
ecosystem services by:
● improving soil and water health
● increasing biodiversity
● reducing erosion.
2 Energy-related To increase energy efficiency through:
● better farm design that works with external influences
to maximize the efficiencies of an integrated system
and reduce time and energy spent tending crops and
animals.
3 Economic To increase income by :
● reducing input cost
● diversifying and intensifying production.
4 Nutritional To contribute to increased nutritional status
by:
● increasing soil biology
● increasing access to a diverse diet
● improving critical nutrient uptake from the diet.
5 Social To strengthen the skill set, capacity, and
confidence of smallholder farmers, and relationships
between community and watershed actors by:
● supporting local innovative farmers to become leaders
● helping them learn to observe and understand their
local environment and its interconnectedness
● enabling them to understand how to maximize local
resources and utilize natural influences
● improving their ability to adapt and test technologies.
A set of output indicators and a set of outcome indicators
are included. The output indicators focus mainly on the RD
approach strategies and techniques; these are considered
risk-reducing measures leading to overall greater resilience.
The outcome indicators are drawn from the overall goal
and five key aims of the RD approach. These are broader
in scope and using the RD approach contributes to their
achievement. They include better soil health, food security,
production and income, nutritional status, knowledge and
skills and household resilience, and reduced production
costs and workload.
In this way, programs that already include outcome
indicators related to soil health, food security, etc., can layer
the RD approach into their work without having to develop
new outcome indicators.
Note 1 When it comes to production, the integrated
polyculture promoted in the RD approach, and the diversity
of production that results, may not be accurately captured
by all production measurement methods, which are often
aimed at measuring monoculture systems. Hence it is
recommended that all programs consider using the data
collected on farm production in the Farm Production
Assessment, and the PIA, to determine overall increase in
production, as well as having data on crop diversification.
Note 2 Likewise for nutrition and food security, while
many programs look at nutrition as diversity of diet in
terms of food consumed from different food groups
(household dietary diversity, or HDD), it is recommended
that the diversity of vegetables, cereals, etc. consumed
within different food groups is taken into consideration.
This is because a farmer may be increasing his or her
dietary diversity in terms of consuming a greater variety
of vegetables, fruits and cereals grown on the farm in
an integrated system. However, this increased diversity
of different kinds of vegetables, cereals etc. will not
be reflected in an HDD score, which solely focuses on
consumption from different food groups. Furthermore, the
RD approach indicators look at change in food source
as well as the number of food-secure months. A positive
change in food source indicates that the farmer is less
reliant on food aid or purchased food, and consumes more
from his or her own farm. If the farmer is also using other
techniques and strategies for building healthy, living soils,
the food grown on the farm will also be more nutritious.3
6Resilience Design Measurement Toolkit | Mercy Corps
Mer
cy C
orps
Pho
togr
aph:
Mig
uel S
ampe
r/
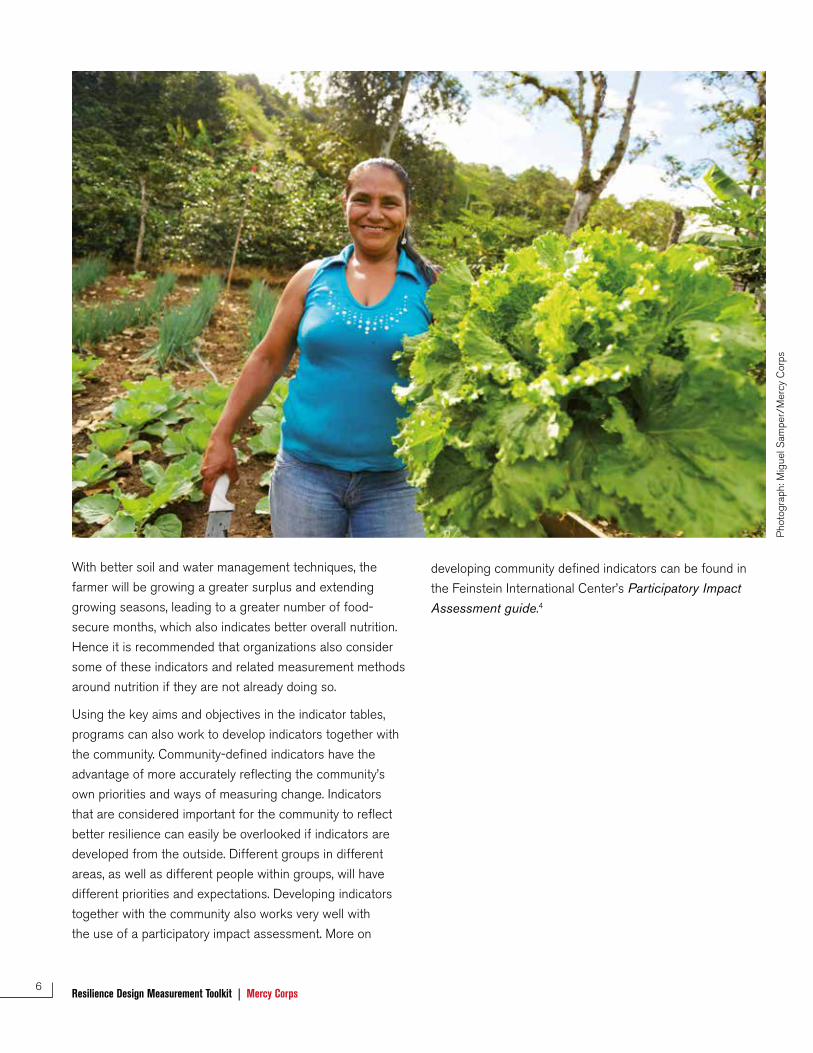
With better soil and water management techniques, the
farmer will be growing a greater surplus and extending
growing seasons, leading to a greater number of food-
secure months, which also indicates better overall nutrition.
Hence it is recommended that organizations also consider
some of these indicators and related measurement methods
around nutrition if they are not already doing so.
Using the key aims and objectives in the indicator tables,
programs can also work to develop indicators together with
the community. Community-defined indicators have the
advantage of more accurately reflecting the community’s
own priorities and ways of measuring change. Indicators
that are considered important for the community to reflect
better resilience can easily be overlooked if indicators are
developed from the outside. Different groups in different
areas, as well as different people within groups, will have
different priorities and expectations. Developing indicators
together with the community also works very well with
the use of a participatory impact assessment. More on
developing community defined indicators can be found in
the Feinstein International Center’s Participatory Impact Assessment guide.4
7Resilience Design Measurement Toolkit | Mercy Corps
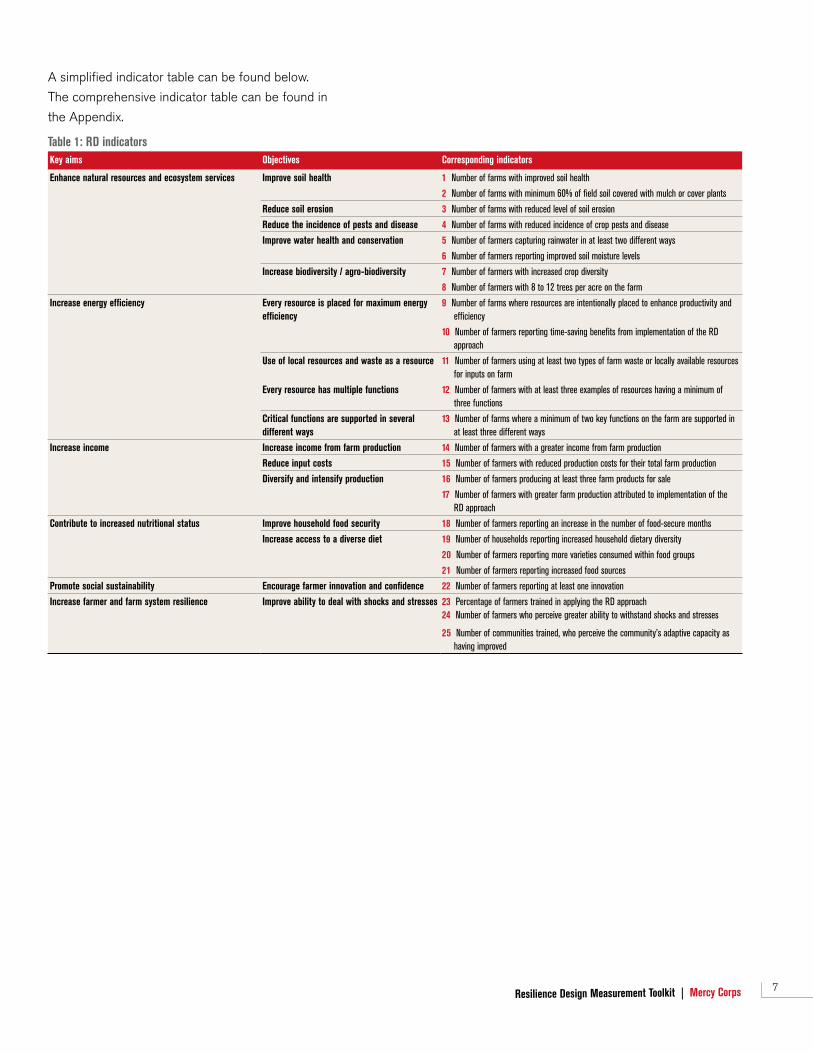
A simplified indicator table can be found below.
The comprehensive indicator table can be found in
the Appendix.
Table 1: RD indicatorsKey aims Objectives Corresponding indicators
Enhance natural resources and ecosystem services Improve soil health 1 Number of farms with improved soil health
2 Number of farms with minimum 60% of field soil covered with mulch or cover plants
Reduce soil erosion 3 Number of farms with reduced level of soil erosion
Reduce the incidence of pests and disease 4 Number of farms with reduced incidence of crop pests and disease
Improve water health and conservation 5 Number of farmers capturing rainwater in at least two different ways
6 Number of farmers reporting improved soil moisture levels
Increase biodiversity / agro-biodiversity 7 Number of farmers with increased crop diversity
8 Number of farmers with 8 to 12 trees per acre on the farm
Increase energy efficiency Every resource is placed for maximum energy efficiency
9 Number of farms where resources are intentionally placed to enhance productivity and efficiency
10 Number of farmers reporting time-saving benefits from implementation of the RD approach
Use of local resources and waste as a resource 11 Number of farmers using at least two types of farm waste or locally available resources for inputs on farm
Every resource has multiple functions 12 Number of farmers with at least three examples of resources having a minimum of three functions
Critical functions are supported in several different ways
13 Number of farms where a minimum of two key functions on the farm are supported in at least three different ways
Increase income Increase income from farm production 14 Number of farmers with a greater income from farm production
Reduce input costs 15 Number of farmers with reduced production costs for their total farm production
Diversify and intensify production 16 Number of farmers producing at least three farm products for sale
17 Number of farmers with greater farm production attributed to implementation of the RD approach
Contribute to increased nutritional status Improve household food security 18 Number of farmers reporting an increase in the number of food-secure months
Increase access to a diverse diet 19 Number of households reporting increased household dietary diversity
20 Number of farmers reporting more varieties consumed within food groups
21 Number of farmers reporting increased food sources
Promote social sustainability Encourage farmer innovation and confidence 22 Number of farmers reporting at least one innovation
Increase farmer and farm system resilience Improve ability to deal with shocks and stresses 23 Percentage of farmers trained in applying the RD approach24 Number of farmers who perceive greater ability to withstand shocks and stresses
25 Number of communities trained, who perceive the community’s adaptive capacity as having improved
8Resilience Design Measurement Toolkit | Mercy Corps
Measurement toolsThe Measurement Toolkit offers tools for monitoring
at the farm level and suggests participatory methods
for evaluating impact together with communities.
Details on each tool, and how and when to use it are
given below.
Farm-level tools are developed so that they easily fit into and
support a field agent’s daily activities. These tools collect
data for the output indicators that track whether or not
farmers are implementing RD strategies and techniques, as
well as some data for the outcome indicators on production,
income, production costs, and farm agro-ecosystem and
household resilience.
The farm-level tools include the Farm Resilience Assessment, Farm Production Assessment and Soil Health Assessment. Among these, the Farm Resilience
Assessment is the core tool, tracking the output indicators
that show whether or not the farmer is applying the RD
approach’s techniques and strategies, the implementation
of which are also considered to lead to greater resilience.
More than just a monitoring tool, it is also a tool for learning,
aiming to facilitate a dialogue between field agents and
farmers to improve farm production and resilience by actively
integrating feedback from the monitoring process.
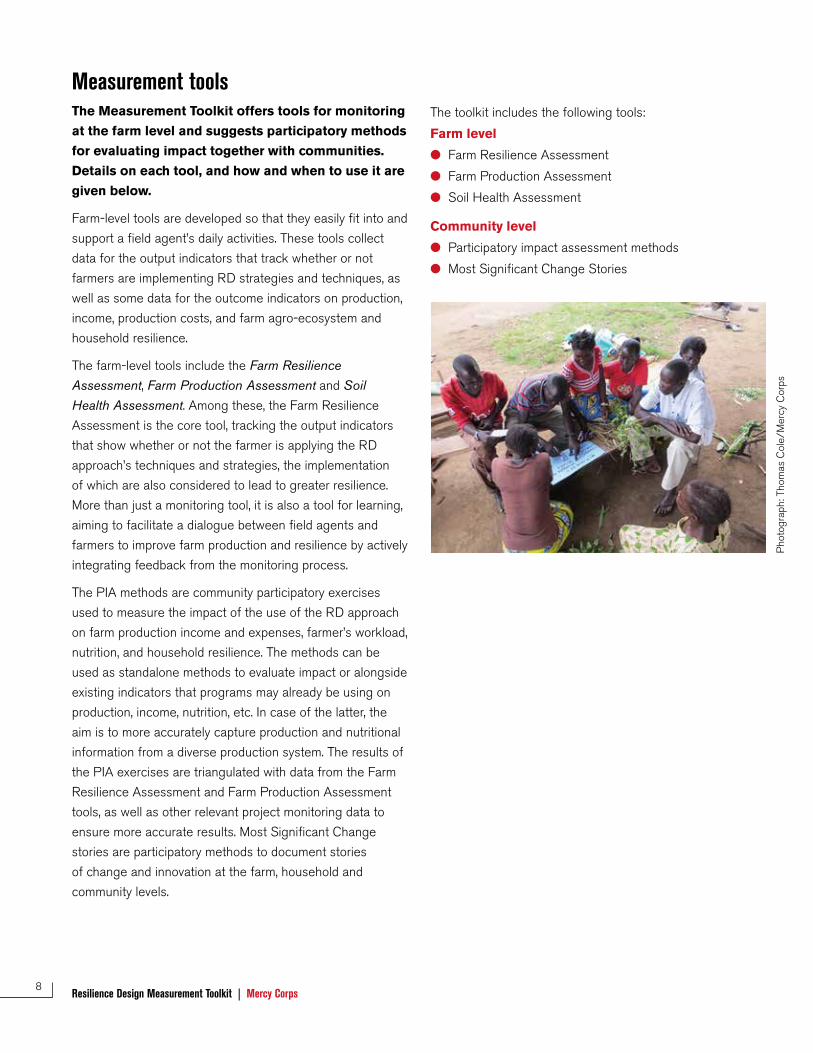
The PIA methods are community participatory exercises
used to measure the impact of the use of the RD approach
on farm production income and expenses, farmer’s workload,
nutrition, and household resilience. The methods can be
used as standalone methods to evaluate impact or alongside
existing indicators that programs may already be using on
production, income, nutrition, etc. In case of the latter, the
aim is to more accurately capture production and nutritional
information from a diverse production system. The results of
the PIA exercises are triangulated with data from the Farm
Resilience Assessment and Farm Production Assessment
tools, as well as other relevant project monitoring data to
ensure more accurate results. Most Significant Change
stories are participatory methods to document stories
of change and innovation at the farm, household and
community levels.
The toolkit includes the following tools:
Farm level
● Farm Resilience Assessment
● Farm Production Assessment
● Soil Health Assessment
Community level
● Participatory impact assessment methods
● Most Significant Change Stories
Mer
cy C
orps
hom
as C
ole/
Pho
togr
aph:
T
9Resilience Design Measurement Toolkit | Mercy Corps
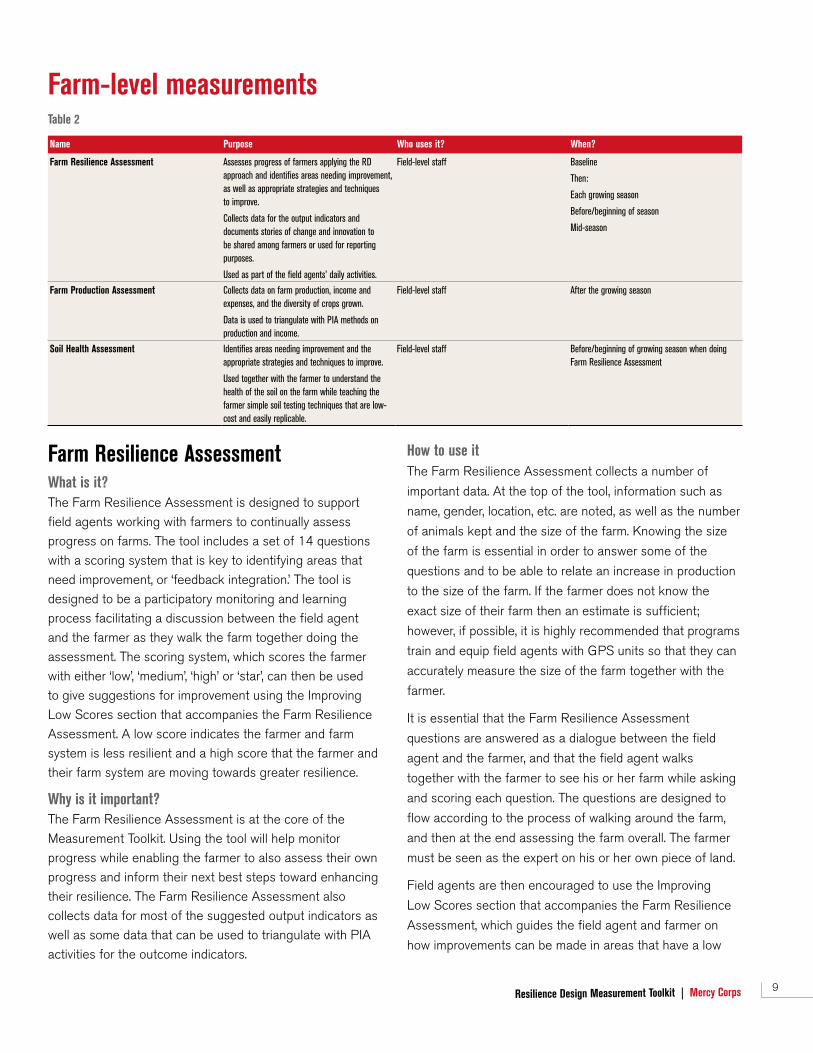
Farm-level measurements Table 2
Name Purpose Who uses it? When?
Farm Resilience Assessment Assesses progress of farmers applying the RD approach and identifies areas needing improvement, as well as appropriate strategies and techniques to improve.
Collects data for the output indicators and documents stories of change and innovation to be shared among farmers or used for reporting purposes.
Used as part of the field agents’ daily activities.
Field-level staff Baseline
Then:
Each growing season
Before/beginning of season
Mid-season
Farm Production Assessment Collects data on farm production, income and expenses, and the diversity of crops grown.
Data is used to triangulate with PIA methods on production and income.
Field-level staff After the growing season
Soil Health Assessment Identifies areas needing improvement and the appropriate strategies and techniques to improve.
Used together with the farmer to understand the health of the soil on the farm while teaching the farmer simple soil testing techniques that are low-cost and easily replicable.
Field-level staff Before/beginning of growing season when doing Farm Resilience Assessment
Farm Resilience Assessment What is it? The Farm Resilience Assessment is designed to support field agents working with farmers to continually assess progress on farms. The tool includes a set of 14 questions with a scoring system that is key to identifying areas that need improvement, or ‘feedback integration.’ The tool is designed to be a participatory monitoring and learning process facilitating a discussion between the field agent and the farmer as they walk the farm together doing the assessment. The scoring system, which scores the farmer with either ‘low’, ‘medium’, ‘high’ or ‘star’, can then be used to give suggestions for improvement using the Improving Low Scores section that accompanies the Farm Resilience Assessment. A low score indicates the farmer and farm system is less resilient and a high score that the farmer and their farm system are moving towards greater resilience.
Why is it important? The Farm Resilience Assessment is at the core of the Measurement Toolkit. Using the tool will help monitor progress while enabling the farmer to also assess their own progress and inform their next best steps toward enhancing their resilience. The Farm Resilience Assessment also collects data for most of the suggested output indicators as well as some data that can be used to triangulate with PIA activities for the outcome indicators.
How to use itThe Farm Resilience Assessment collects a number of
important data. At the top of the tool, information such as
name, gender, location, etc. are noted, as well as the number
of animals kept and the size of the farm. Knowing the size
of the farm is essential in order to answer some of the
questions and to be able to relate an increase in production
to the size of the farm. If the farmer does not know the
exact size of their farm then an estimate is sufficient;
however, if possible, it is highly recommended that programs
train and equip field agents with GPS units so that they can
accurately measure the size of the farm together with the
farmer.
It is essential that the Farm Resilience Assessment
questions are answered as a dialogue between the field
agent and the farmer, and that the field agent walks
together with the farmer to see his or her farm while asking
and scoring each question. The questions are designed to
flow according to the process of walking around the farm,
and then at the end assessing the farm overall. The farmer
must be seen as the expert on his or her own piece of land.
Field agents are then encouraged to use the Improving
Low Scores section that accompanies the Farm Resilience
Assessment, which guides the field agent and farmer on
how improvements can be made in areas that have a low
10Resilience Design Measurement Toolkit | Mercy Corps
score. This is known as feedback integration
and is essential to helping ensure the farm design is
working well.
The Farm Resilience Assessment also asks the field agents
to record stories of change or innovation. These stories of
change, and in particular stories of effective and innovative
systems that farmers have designed, can be used as case
studies both for reporting purposes and for sharing between
farmer groups for inspiration and the sharing of information
resources.
A total score for the Farm Resilience Assessment is
calculated at the end of the 14 questions. A low score
is assigned a value of 1, a medium score a value of 2, a
high score 3, and a star score 4. The total score is then
calculated and is used for indicator No. 23 Percentage of farmers trained in using RD approach. A minimum score of
30 is required for a farmer to be considered to be ‘applying’
the RD approach.
The total score can also be used for reporting purposes
where a farmer’s scores at the end of project can be used
against baseline scores. It can also enable programs to draw
out the areas where farmers have made the most progress
and the areas that are lacking.
When to use it
The Farm Resilience Assessment should be used first to
establish a baseline, then before the growing season or at
the very beginning of the growing season, and then again in
the middle of the growing season. The tool should be used
each agricultural season, so if there is one growing season
a year, the tool is used twice a year; if there are two growing
seasons, it is used four times. Using the tool before the
growing season or at the beginning of the growing season
mainly serves to provide time to give advice to the farmer on
how to improve.
Key things to think about It essential that that Farm Resilience Assessment is
carried out as a participatory process where the farmer is
considered the expert.
These questions will help field agents to be more accurate
and consistent in their assessment:
What is the estimated percentage of erosion on the
farm, and estimated percentage of soil covered by
mulch?
Discuss a few examples of what the different scores and
their associated percentages would look like.
What are the number of trees per acre?
Ensure that it is clear that the trees counted are those in
the field for growing crops and are related to the size of the
farm.
Which resources will be intentionally placed?
Discuss what intentional placement means and what to look
for in the different scores.
What farmer-innovative changes will be applied?
Discuss what innovation means and emphasize that these
are things developed by the farmers themselves and not
taught.
Farm Production Assessment What is it? The Farm Production Assessment includes two tables.
The Farm Production and Income table, gathers information
on the farm’s total production from crops, total amount sold,
and the income from the amount sold. The Farm Expenses
table gathers information on expenses related to production
Why is it important? Resilience Design aims to diversify and intensify production
and increase income. The Farm Production Assessment
helps to gather data on the total production, income and
expenses.
How to use it The Farm Production Assessment consists of two tables
on which field agents fill in information in discussion with
farmers. Field agents fill in production disaggregated by
crop, using the local measurement used for that specific
crop. For example, farmers often do not know their
production of sorghum in kilograms, but in tins or bags,
while production of vegetables such as cowpeas is often
only known in bunches, etc. Field agents are prompted to
put the amount in kilograms in brackets if they know the
conversion, but it is essential that they note both.
.
11Resilience Design Measurement Toolkit | Mercy Corps
For production costs, field agents ask the farmer which
expenses they had and note these, item by item and note
the total expense per item.
The Farm Production Assessment is done by farmer recall;
however, programs are also encouraged to train farmers on
keeping records for the same items (total harvested, total
sold, income from sales and expenses listed by item).
The Farm Production Assessment records the number of
animals kept on the farm as part of the beneficiary data
collected, but does not collect information from farmers
on production or sales of animals or animal products since
the production is not tied to a specific harvest time but
rather is harvested throughout the year. It is recommended
that programs encourage farmers to keep track of animal
products and animals kept, collected, harvested, slaughtered
and sold. This can be done giving farmers notebooks and
training them on keeping simple records along the lines of
the Farm Production Assessment tables. This data would
need to be collected on a regular basis to ensure accuracy.
The production data collected in the Farm Production
Assessment can be cross-checked against the size of the
farm — recorded as part of beneficiary data at the top of the
tool — to ensure that a large increase in production is not
due to a farmer having acquired a new field.
The Farm Production Assessment collects all the data
needed to calculate total farm value if needed farm — an
indicator used by many programs.
For more information on farmer financial literacy,
participatory farm budgets, and farm records for smallholder
farmers, programs can refer to Mercy Corps’ Farming for a profit: Technical guidance for smallholder farmer financial planning5 and the FAO’s Participatory farm management methods for farm management and record keeping.6
When to use it The Farm Production Assessment should be done
within 2 months of harvest to best capture information
from farmers.
Key things to think about Training farmers to keep records — even very simple ones
— will greatly enhance the ability of any program to capture
more accurate data on production.
Soil Health Assessment What is it? The Soil Health Assessment is a simple soil test requiring no technical expertise and no tools except a shovel and a can of water. The Soil Health Assessment is for field agents to do together with farmers, and includes a set of simple directions to determine where to take the soil test and a set of questions to determine soil structure and soil health. The assessment is designed to be simple enough for farmers to be able to do by themselves.
Why is it important? Soil health is one of the key foundations of resilience in Resilience Design. Besides helping to test the health of the soil, the process helps field agents and farmers to understand what the indicators of healthy soils are.
How to use it The Soil Health Assessment is preferably carried out in three or four different locations on the farm. A set of questions guides the field agent and farmer through assessing soil structure, the presence of organic matter and micro- and macrofauna, the soil moisture profile and infiltration capacity. The answers are scored as low, medium, high or star. The results are then calculated in the soil health index with a low score given a value of 1, a medium score a value of 2, a high score a value of 3 and a star a value of 4. The total score enables field agents and farmers to compare the scores from previous seasons. An Improving Low Scores section accompanies the soil health index just as for the Farm Resilience Assessment Tool. Designed as a participatory tool, this helps the field guide and the farmer integrate feedback from the process of conducting the Soil Health Assessment.
When to use it The Soil Health Assessment is carried out as a baseline, midline and endline at the very beginning of the rains, right before planting. It can be done in conjunction with the first Farm Resilience Assessment of the season. It only needs to be done once a year, even if there are two agricultural seasons in the year.
Key things to think aboutEncourage field agents to work alongside farmers conducting the soil health index. This way of testing the soil is a simple tool for the farmer to start assessing their farm’s soil health by themselves.
12Resilience Design Measurement Toolkit | Mercy Corps
Community-level measurementsThe community-level participatory methods are used
to assess the impact of the implementation of the RD
approach on farm ecosystem and household resilience.
The community participatory methods include participatory
impact assessment and Most Significant Change (MSC)
stories. PIA methods can produce both qualitative and
quantitative data on project impact and can also create
a good learning opportunity together with beneficiaries,
and space for dialogue to discuss how programs could be
improved. PIA methods in Table 3 use scoring or ranking
alongside open-ended interviews that ask the participants to
explain their scoring. The results of these exercises are then
triangulated with data from the Farm Resilience Assessment
and the Farm Production Assessment and other project-
monitoring data. This use of a number of ways of assessing
impact ensures greater accuracy. MSC stories are used to
draw out impact beyond what is captured in the indicators:
farmer innovation and changes at the farm, household and
community levels. In particular, they help understand the
changes that the farmers themselves consider the most
significant.
It is suggested that, at a minimum, all of the PIA methods
are used as an endline. If possible, the PIA exercises should
also be done as a midline to help with adaptive project
management, in particular when looking at the reasons
behind the scores.
The PIA methods described in Table 3, and the examples
given, are all drawn from the Feinstein International Center’s
Participatory Impact Assessment: A design guide7 and Impact assessment of honey microfinance and livestock value chain interventions.8 For more in-depth information on
PIA, please consult the former.
Mer
cy C
orps
aban
a/P
hoto
grap
h: J
oni K
13Resilience Design Measurement Toolkit | Mercy Corps
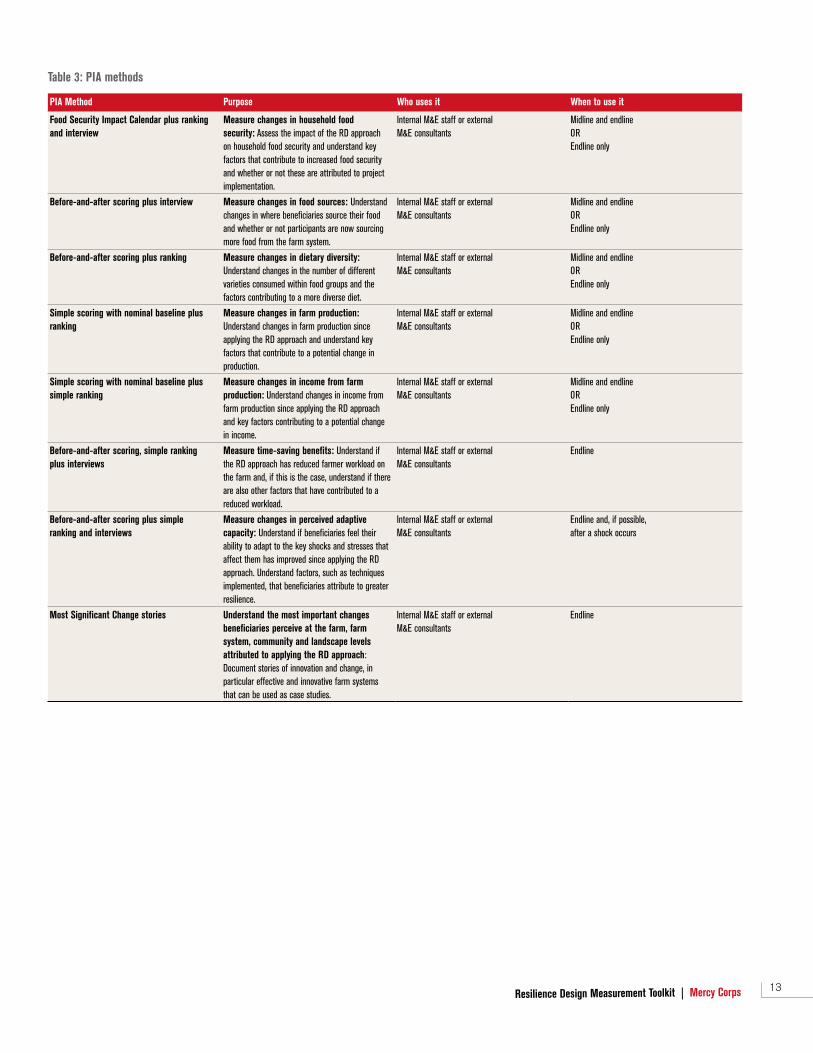
Table 3: PIA methods
PIA Method Purpose Who uses it When to use it
Food Security Impact Calendar plus ranking and interview
Measure changes in household food security: Assess the impact of the RD approach on household food security and understand key factors that contribute to increased food security and whether or not these are attributed to project implementation.
Internal M&E staff or external M&E consultants
Midline and endline OR Endline only
Before-and-after scoring plus interview Measure changes in food sources: Understand changes in where beneficiaries source their food and whether or not participants are now sourcing more food from the farm system.
Internal M&E staff or external M&E consultants
Midline and endline OR Endline only
Before-and-after scoring plus ranking Measure changes in dietary diversity: Understand changes in the number of different varieties consumed within food groups and the factors contributing to a more diverse diet.
Internal M&E staff or external M&E consultants
Midline and endline OR Endline only
Simple scoring with nominal baseline plus ranking
Measure changes in farm production: Understand changes in farm production since applying the RD approach and understand key factors that contribute to a potential change in production.
Internal M&E staff or external M&E consultants
Midline and endline OR Endline only
Simple scoring with nominal baseline plus simple ranking
Measure changes in income from farm production: Understand changes in income from farm production since applying the RD approach and key factors contributing to a potential change in income.
Internal M&E staff or external M&E consultants
Midline and endline OR Endline only
Before-and-after scoring, simple ranking plus interviews
Measure time-saving benefits: Understand if the RD approach has reduced farmer workload on the farm and, if this is the case, understand if there are also other factors that have contributed to a reduced workload.
Internal M&E staff or external M&E consultants
Endline
Before-and-after scoring plus simple ranking and interviews
Measure changes in perceived adaptive capacity: Understand if beneficiaries feel their ability to adapt to the key shocks and stresses that affect them has improved since applying the RD approach. Understand factors, such as techniques implemented, that beneficiaries attribute to greater resilience.
Internal M&E staff or external M&E consultants
Endline and, if possible, after a shock occurs
Most Significant Change stories Understand the most important changes beneficiaries perceive at the farm, farm system, community and landscape levels attributed to applying the RD approach: Document stories of innovation and change, in particular effective and innovative farm systems that can be used as case studies.
Internal M&E staff or external M&E consultants
Endline
14Resilience Design Measurement Toolkit | Mercy Corps
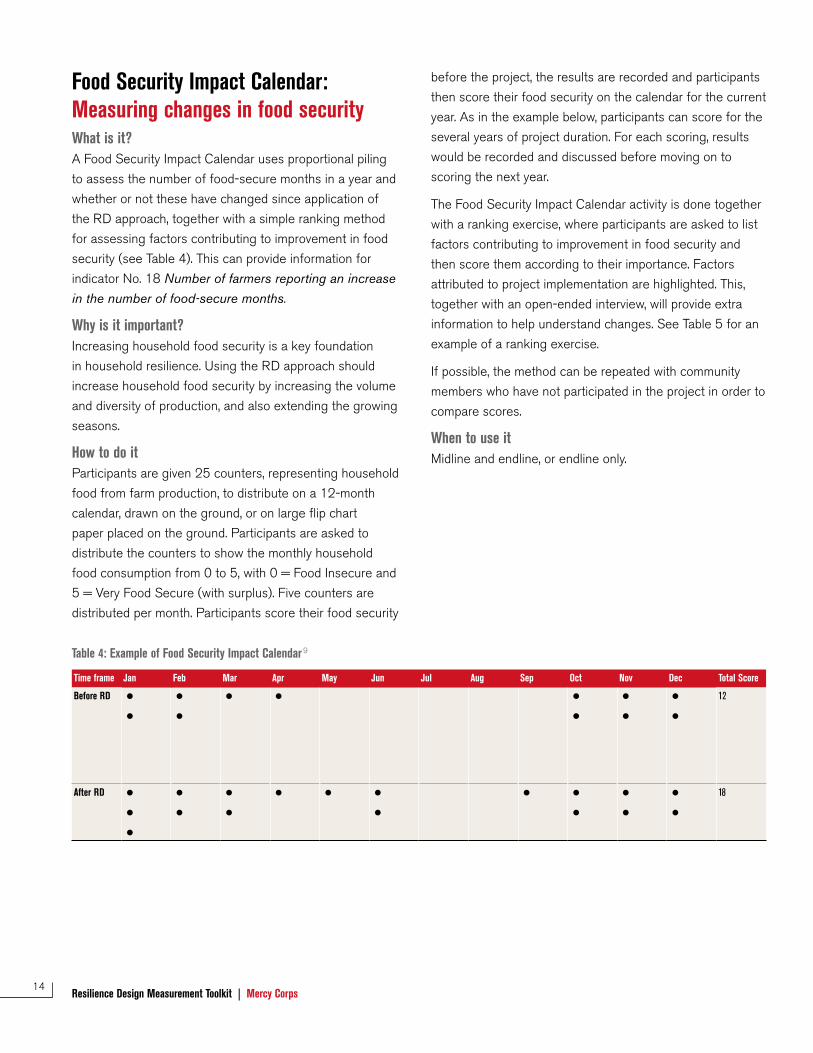
Food Security Impact Calendar: Measuring changes in food security What is it? A Food Security Impact Calendar uses proportional piling
to assess the number of food-secure months in a year and
whether or not these have changed since application of
the RD approach, together with a simple ranking method
for assessing factors contributing to improvement in food
security (see Table 4). This can provide information for
indicator No. 18 Number of farmers reporting an increase in the number of food-secure months.
Why is it important? Increasing household food security is a key foundation
in household resilience. Using the RD approach should
increase household food security by increasing the volume
and diversity of production, and also extending the growing
seasons.
How to do it Participants are given 25 counters, representing household
food from farm production, to distribute on a 12-month
calendar, drawn on the ground, or on large flip chart
paper placed on the ground. Participants are asked to
distribute the counters to show the monthly household
food consumption from 0 to 5, with 0 = Food Insecure and
5 = Very Food Secure (with surplus). Five counters are
distributed per month. Participants score their food security
before the project, the results are recorded and participants
then score their food security on the calendar for the curren
year. As in the example below, participants can score for the
several years of project duration. For each scoring, results
would be recorded and discussed before moving on to
scoring the next year.
The Food Security Impact Calendar activity is done together
with a ranking exercise, where participants are asked to list
factors contributing to improvement in food security and
then score them according to their importance. Factors
attributed to project implementation are highlighted. This,
together with an open-ended interview, will provide extra
information to help understand changes. See Table 5 for an
example of a ranking exercise.
If possible, the method can be repeated with community
members who have not participated in the project in order t
compare scores.
When to use it Midline and endline, or endline only.
t
o
Table 4: Example of Food Security Impact Calendar9
Time frame Jan Feb Mar Apr May Jun Jul Aug Sep Oct Nov Dec Total Score
Before RD ●
●
●
●
● ● ●
●
●
●
●
●
12
After RD ●
●
●
●
●
●
●
● ● ●
●
● ●
●
●
●
●
●
18
15Resilience Design Measurement Toolkit | Mercy Corps
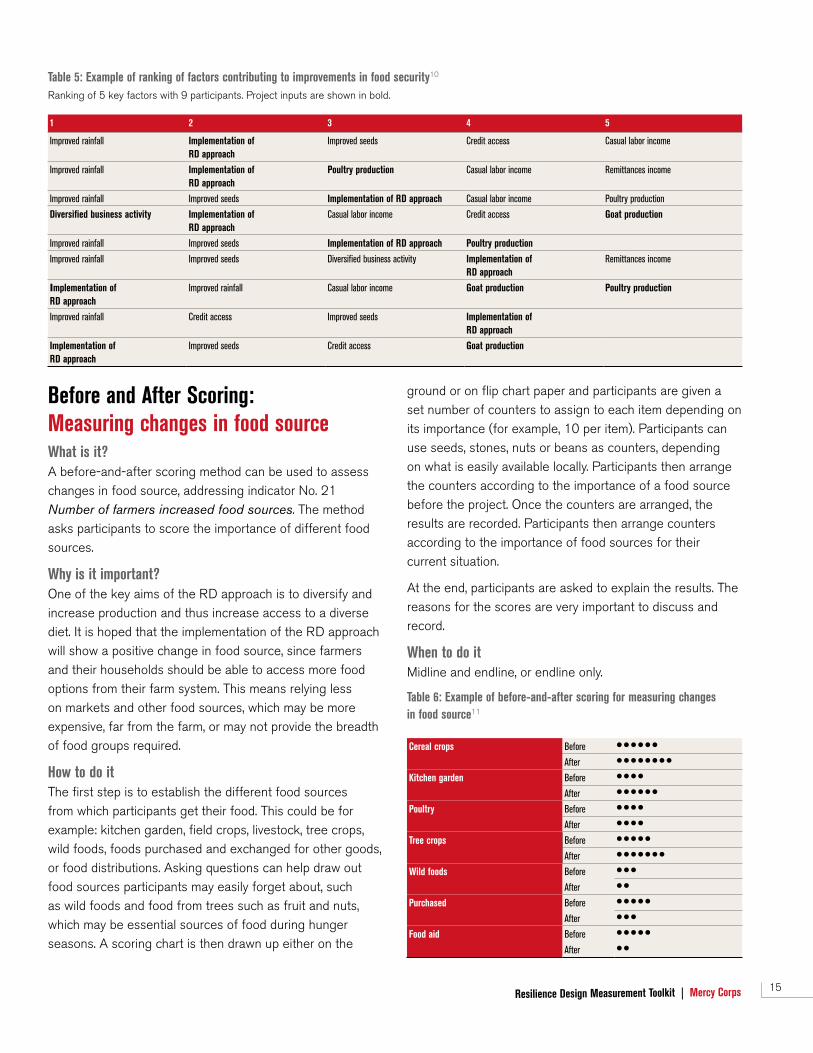
Table 5: Example of ranking of factors contributing to improvements in food security10 Ranking of 5 key factors with 9 participants. Project inputs are shown in bold.
1 2 3 4 5
Improved rainfall Implementation of RD approach
Improved seeds Credit access Casual labor income
Improved rainfall Implementation of RD approach
Poultry production Casual labor income Remittances income
Improved rainfall Improved seeds Implementation of RD approach Casual labor income Poultry production
Diversified business activity Implementation of RD approach
Casual labor income Credit access Goat production
Improved rainfall Improved seeds Implementation of RD approach Poultry production
Improved rainfall Improved seeds Diversified business activity Implementation of RD approach
Remittances income
Implementation of RD approach
Improved rainfall Casual labor income Goat production Poultry production
Improved rainfall Credit access Improved seeds Implementation of RD approach
Implementation of RD approach
Improved seeds Credit access Goat production
Before and After Scoring: Measuring changes in food source What is it? A before-and-after scoring method can be used to assess changes in food source, addressing indicator No. 21 Number of farmers increased food sources. The method asks participants to score the importance of different food sources.
Why is it important? One of the key aims of the RD approach is to diversify and increase production and thus increase access to a diverse diet. It is hoped that the implementation of the RD approach will show a positive change in food source, since farmers and their households should be able to access more food options from their farm system. This means relying less on markets and other food sources, which may be more expensive, far from the farm, or may not provide the breadth of food groups required.
How to do it The first step is to establish the different food sources from which participants get their food. This could be for example: kitchen garden, field crops, livestock, tree crops, wild foods, foods purchased and exchanged for other goods, or food distributions. Asking questions can help draw out food sources participants may easily forget about, such as wild foods and food from trees such as fruit and nuts, which may be essential sources of food during hunger seasons. A scoring chart is then drawn up either on the
ground or on flip chart paper and participants are given a set number of counters to assign to each item depending on its importance (for example, 10 per item). Participants can use seeds, stones, nuts or beans as counters, depending on what is easily available locally. Participants then arrange the counters according to the importance of a food source before the project. Once the counters are arranged, the results are recorded. Participants then arrange counters according to the importance of food sources for their current situation.
At the end, participants are asked to explain the results. The reasons for the scores are very important to discuss and record.
When to do it Midline and endline, or endline only.
Table 6: Example of before-and-after scoring for measuring changes in food source11
Cereal crops Before ● ● ● ● ● ●
After ● ● ● ● ● ● ● ●
Kitchen garden Before ● ● ● ●
After ● ● ● ● ● ●
Poultry Before ● ● ● ●
After ● ● ● ●
Tree crops Before ● ● ● ● ●
After ● ● ● ● ● ● ●
Wild foods Before ● ● ●
After ● ●
Purchased Before ● ● ● ● ●
After ● ● ●
Food aid Before ● ● ● ● ●
After ● ●
16Resilience Design Measurement Toolkit | Mercy Corps
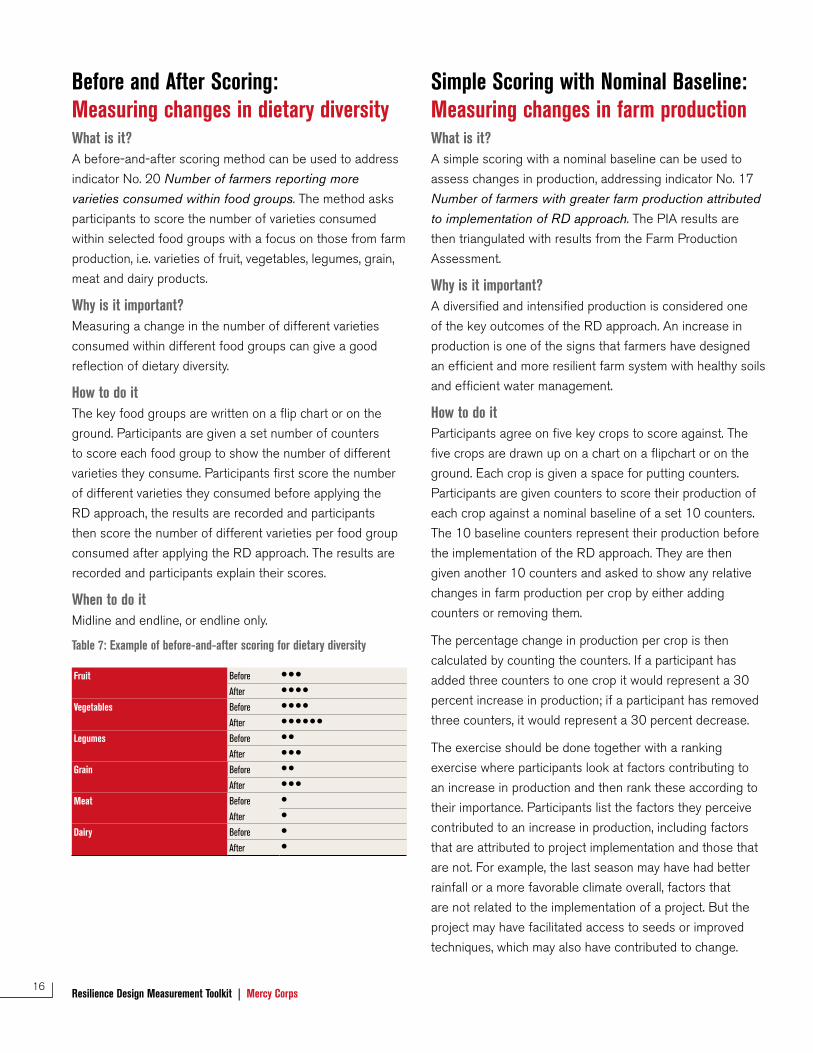
Before and After Scoring: Measuring changes in dietary diversityWhat is it? A before-and-after scoring method can be used to address
indicator No. 20 Number of farmers reporting more varieties consumed within food groups. The method asks
participants to score the number of varieties consumed
within selected food groups with a focus on those from farm
production, i.e. varieties of fruit, vegetables, legumes, grain,
meat and dairy products.
Why is it important? Measuring a change in the number of different varieties
consumed within different food groups can give a good
reflection of dietary diversity.
How to do it The key food groups are written on a flip chart or on the
ground. Participants are given a set number of counters
to score each food group to show the number of different
varieties they consume. Participants first score the number
of different varieties they consumed before applying the
RD approach, the results are recorded and participants
then score the number of different varieties per food group
consumed after applying the RD approach. The results are
recorded and participants explain their scores.
When to do it Midline and endline, or endline only.
Table 7: Example of before-and-after scoring for dietary diversity
Fruit Before ● ● ●
After ● ● ● ●
Vegetables Before ● ● ● ●
After ● ● ● ● ● ●
Legumes Before ● ●
After ● ● ●
Grain Before ● ●
After ● ● ●
Meat Before ●
After ●
Dairy Before ●
After ●
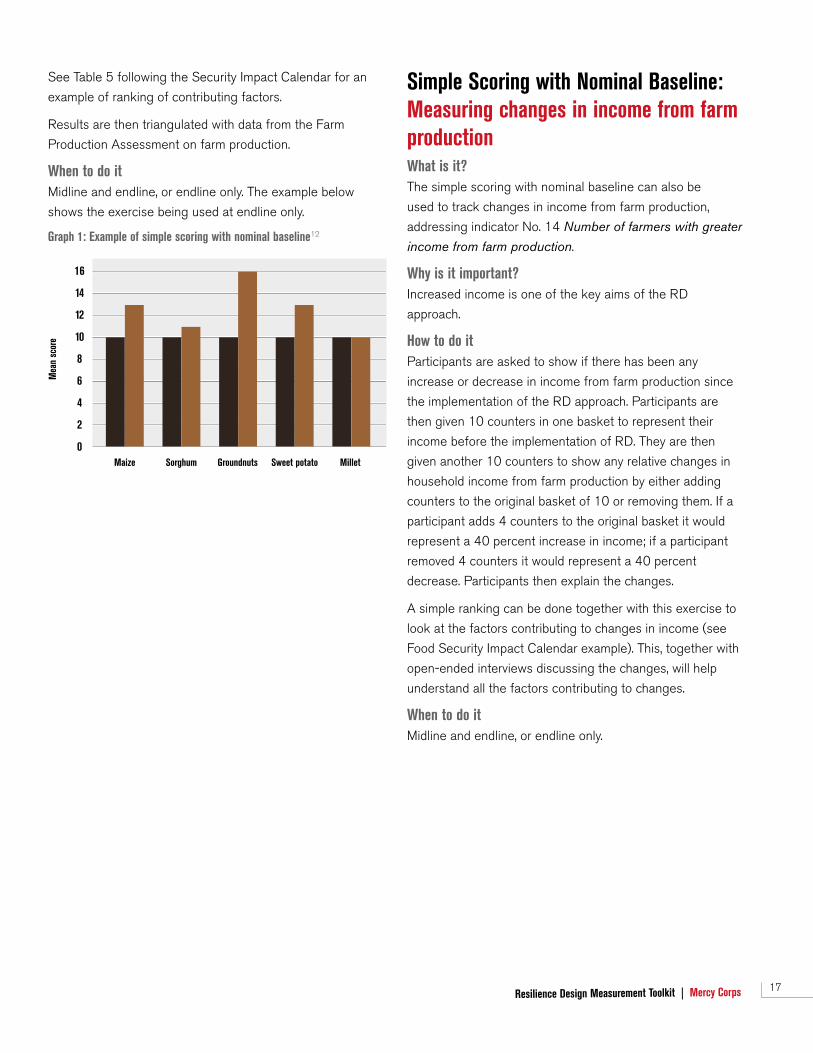
Simple Scoring with Nominal Baseline: Measuring changes in farm production What is it? A simple scoring with a nominal baseline can be used to
assess changes in production, addressing indicator No. 17
Number of farmers with greater farm production attributed to implementation of RD approach. The PIA results are
then triangulated with results from the Farm Production
Assessment.
Why is it important? A diversified and intensified production is considered one
of the key outcomes of the RD approach. An increase in
production is one of the signs that farmers have designed
an efficient and more resilient farm system with healthy soils
and efficient water management.
How to do it Participants agree on five key crops to score against. The
five crops are drawn up on a chart on a flipchart or on the
ground. Each crop is given a space for putting counters.
Participants are given counters to score their production of
each crop against a nominal baseline of a set 10 counters.
The 10 baseline counters represent their production before
the implementation of the RD approach. They are then
given another 10 counters and asked to show any relative
changes in farm production per crop by either adding
counters or removing them.
The percentage change in production per crop is then
calculated by counting the counters. If a participant has
added three counters to one crop it would represent a 30
percent increase in production; if a participant has removed
three counters, it would represent a 30 percent decrease.
The exercise should be done together with a ranking
exercise where participants look at factors contributing to
an increase in production and then rank these according to
their importance. Participants list the factors they perceive
contributed to an increase in production, including factors
that are attributed to project implementation and those that
are not. For example, the last season may have had better
rainfall or a more favorable climate overall, factors that
are not related to the implementation of a project. But the
project may have facilitated access to seeds or improved
techniques, which may also have contributed to change.
17Resilience Design Measurement Toolkit | Mercy Corps
See Table 5 following the Security Impact Calendar for an
example of ranking of contributing factors.
Results are then triangulated with data from the Farm
Production Assessment on farm production.
When to do it Midline and endline, or endline only. The example below
shows the exercise being used at endline only.
Graph 1: Example of simple scoring with nominal baseline12
0Maize Sorghum Groundnuts Sweet potato Millet
2
4
6
8
10
Mea
n sc
ore
12
14
16
Simple Scoring with Nominal Baseline: Measuring changes in income from farm production What is it? The simple scoring with nominal baseline can also be
used to track changes in income from farm production,
addressing indicator No. 14 Number of farmers with greater income from farm production.
Why is it important? Increased income is one of the key aims of the RD
approach.
How to do itParticipants are asked to show if there has been any
increase or decrease in income from farm production since
the implementation of the RD approach. Participants are
then given 10 counters in one basket to represent their
income before the implementation of RD. They are then
given another 10 counters to show any relative changes in
household income from farm production by either adding
counters to the original basket of 10 or removing them. If a
participant adds 4 counters to the original basket it would
represent a 40 percent increase in income; if a participant
removed 4 counters it would represent a 40 percent
decrease. Participants then explain the changes.
A simple ranking can be done together with this exercise to
look at the factors contributing to changes in income (see
Food Security Impact Calendar example). This, together with
open-ended interviews discussing the changes, will help
understand all the factors contributing to changes.
When to do it Midline and endline, or endline only.
18Resilience Design Measurement Toolkit | Mercy Corps
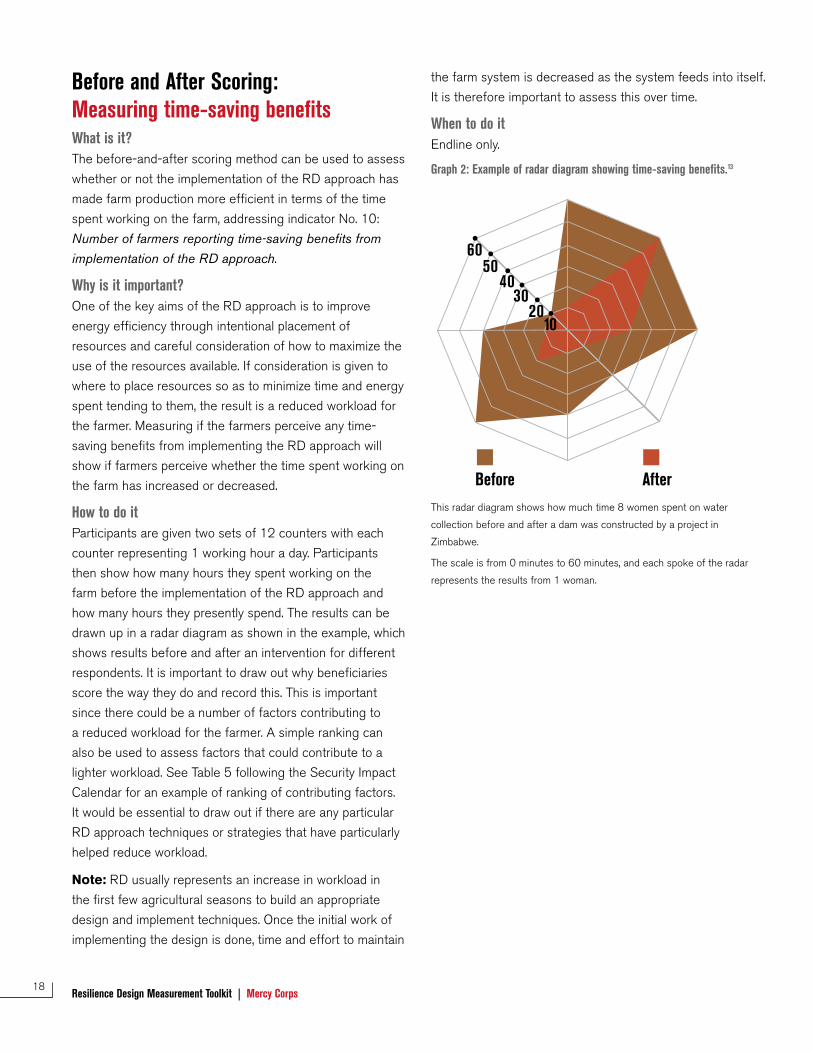
Before and After Scoring: Measuring time-saving benefitsWhat is it? The before-and-after scoring method can be used to assess
whether or not the implementation of the RD approach has
made farm production more efficient in terms of the time
spent working on the farm, addressing indicator No. 10:
Number of farmers reporting time-saving benefits from implementation of the RD approach.
Why is it important? One of the key aims of the RD approach is to improve
energy efficiency through intentional placement of
resources and careful consideration of how to maximize the
use of the resources available. If consideration is given to
where to place resources so as to minimize time and energy
spent tending to them, the result is a reduced workload for
the farmer. Measuring if the farmers perceive any time-
saving benefits from implementing the RD approach will
show if farmers perceive whether the time spent working on
the farm has increased or decreased.
How to do it Participants are given two sets of 12 counters with each
counter representing 1 working hour a day. Participants
then show how many hours they spent working on the
farm before the implementation of the RD approach and
how many hours they presently spend. The results can be
drawn up in a radar diagram as shown in the example, which
shows results before and after an intervention for different
respondents. It is important to draw out why beneficiaries
score the way they do and record this. This is important
since there could be a number of factors contributing to
a reduced workload for the farmer. A simple ranking can
also be used to assess factors that could contribute to a
lighter workload. See Table 5 following the Security Impact
Calendar for an example of ranking of contributing factors.
It would be essential to draw out if there are any particular
RD approach techniques or strategies that have particularly
helped reduce workload.
Note: RD usually represents an increase in workload in
the first few agricultural seasons to build an appropriate
design and implement techniques. Once the initial work of
implementing the design is done, time and effort to maintain
the farm system is decreased as the system feeds into itself.
It is therefore important to assess this over time.
When to do it Endline only.
Graph 2: Example of radar diagram showing time-saving benefits.13
1020
3040
5060
Before AfterThis radar diagram shows how much time 8 women spent on water
collection before and after a dam was constructed by a project in
Zimbabwe.
The scale is from 0 minutes to 60 minutes, and each spoke of the radar
represents the results from 1 woman.
19Resilience Design Measurement Toolkit | Mercy Corps
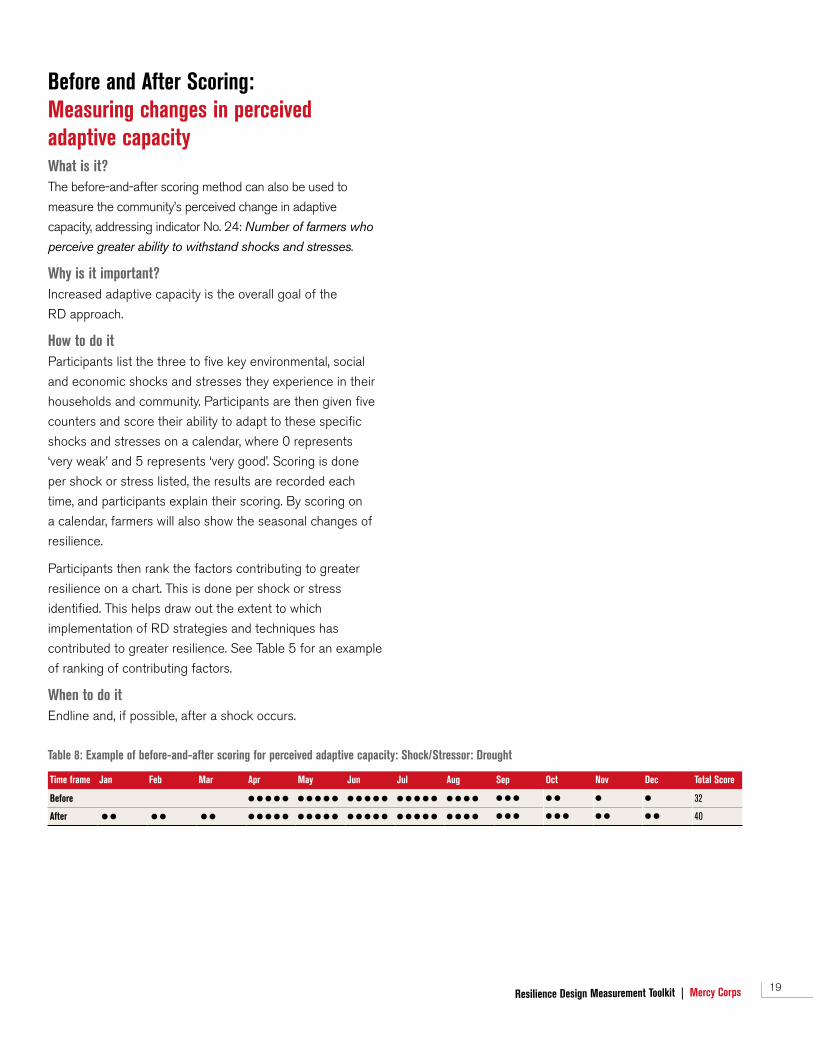
Before and After Scoring: Measuring changes in perceived adaptive capacity What is it? The before-and-after scoring method can also be used to
measure the community’s perceived change in adaptive
capacity, addressing indicator No. 24: Number of farmers who perceive greater ability to withstand shocks and stresses.
Why is it important? Increased adaptive capacity is the overall goal of the
RD approach.
How to do it Participants list the three to five key environmental, social
and economic shocks and stresses they experience in their
households and community. Participants are then given five
counters and score their ability to adapt to these specific
shocks and stresses on a calendar, where 0 represents
‘very weak’ and 5 represents ‘very good’. Scoring is done
per shock or stress listed, the results are recorded each
time, and participants explain their scoring. By scoring on
a calendar, farmers will also show the seasonal changes of
resilience.
Participants then rank the factors contributing to greater
resilience on a chart. This is done per shock or stress
identified. This helps draw out the extent to which
implementation of RD strategies and techniques has
contributed to greater resilience. See Table 5 for an example
of ranking of contributing factors.
When to do it Endline and, if possible, after a shock occurs.
Table 8: Example of before-and-after scoring for perceived adaptive capacity: Shock/Stressor: Drought
Time frame Jan Feb Mar Apr May Jun Jul Aug Sep Oct Nov Dec Total Score
Before ● ● ● ● ● ● ● ● ● ● ● ● ● ● ● ● ● ● ● ● ● ● ● ● ● ● ● ● ● ● ● 32
After ● ● ● ● ● ● ● ● ● ● ● ● ● ● ● ● ● ● ● ● ● ● ● ● ● ● ● ● ● ● ● ● ● ● ● ● ● ● ● ● 40
20Resilience Design Measurement Toolkit | Mercy Corps
Most Significant Change Stories: Capturing stories of innovation, capacity building and changeWhat is it? Most Significant Change stories are stories collected from
the community on the most significant change they feel
they have experienced since the beginning of the program
or since starting to apply the techniques taught. Community
members are prompted to tell stories that relate particularly
to the changes on their farm and the changes that these
have made to their household, their wellbeing and their
overall resilience. The community then choose a few
stories they feel best represent important changes in their
community to be documented.
Why is it important? Storytelling helps capture changes beyond what indicators
or household surveys can measure. Stories can help capture
farmers’ improvement in critical thinking, problem-solving
skills and innovation as a result of learning the RD approach.
It can also help capture ‘butterfly’ effects of changes
(impacts beyond the intended outcomes) and provide
case studies for reports and for sharing among beneficiary
communities.
How to do it The community gets together in groups of six to eight
people each. The groups are asked to tell stories of the
most significant changes they have seen as a result of
using the RD approach. The facilitator explains that these
can be changes on the farm resulting from applying the RD
approach, for example, implementation of the RD approach
strategies or techniques; a particularly effectively working
system the farmer has developed; changes at the household
level in terms of increased wellbeing; or perceived resilience
or in the community overall.
Depending on the number of groups and participants, either
one story per group is chosen or, if the numbers are small,
several stories per group can be chosen. The stories chosen
are related back to the whole group and documented by a
recorder.
One person is selected to document the stories in detail
together with the storytellers. The stories should be brief,
just a few paragraphs, or even told in pictures especially if
illiterate participants are involved in the discussion, but with
enough detail to be meaningful to people who may not have
attended the meeting.
When to do itEndline
Key things to think aboutIt is essential for the facilitator to also draw out how and
why the stories are significant and to emphasize that stories
should be related to implementation of RD approach.
21Resilience Design Measurement Toolkit | Mercy Corps
Mer
cy C
orps
Pho
togr
aph:
Erin
Gra
y/
22Resilience Design Measurement Toolkit | Mercy Corps
Mer
cy C
orps
Pho
togr
aph:
Lau
ra H
ajar
/
23Resilience Design Measurement Toolkit | Mercy CorpsAnnex 1
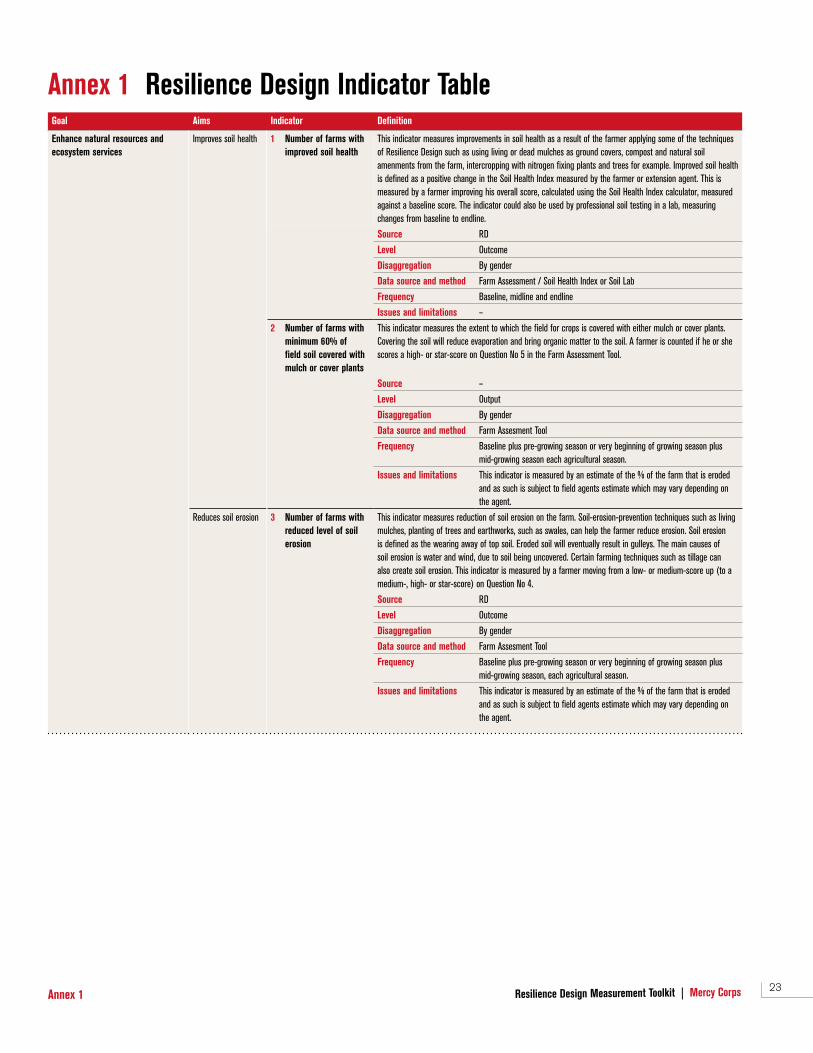
Annex 1 Resilience Design Indicator Table Goal Aims Indicator Definition
Enhance natural resources and ecosystem services
Improves soil health 1 Number of farms with improved soil health
This indicator measures improvements in soil health as a result of the farmer applying some of the techniques of Resilience Design such as using living or dead mulches as ground covers, compost and natural soil amenments from the farm, intercropping with nitrogen fixing plants and trees for example. Improved soil health is defined as a positive change in the Soil Health Index measured by the farmer or extension agent. This is measured by a farmer improving his overall score, calculated using the Soil Health Index calculator, measured against a baseline score. The indicator could also be used by professional soil testing in a lab, measuring changes from baseline to endline.
Source RD
Level Outcome
Disaggregation By gender
Data source and method Farm Assessment / Soil Health Index or Soil Lab
Frequency Baseline, midline and endline
Issues and limitations –
2 Number of farms with minimum 60% of field soil covered with mulch or cover plants
This indicator measures the extent to which the field for crops is covered with either mulch or cover plants. Covering the soil will reduce evaporation and bring organic matter to the soil. A farmer is counted if he or she scores a high- or star-score on Question No 5 in the Farm Assessment Tool.
Source –
Level Output
Disaggregation By gender
Data source and method Farm Assesment Tool
Frequency Baseline plus pre-growing season or very beginning of growing season plus mid-growing season each agricultural season.
Issues and limitations This indicator is measured by an estimate of the % of the farm that is eroded and as such is subject to field agents estimate which may vary depending on the agent.
Reduces soil erosion 3 Number of farms with reduced level of soil erosion
This indicator measures reduction of soil erosion on the farm. Soil-erosion-prevention techniques such as living mulches, planting of trees and earthworks, such as swales, can help the farmer reduce erosion. Soil erosion is defined as the wearing away of top soil. Eroded soil will eventually result in gulleys. The main causes of soil erosion is water and wind, due to soil being uncovered. Certain farming techniques such as tillage can also create soil erosion. This indicator is measured by a farmer moving from a low- or medium-score up (to a medium-, high- or star-score) on Question No 4.
Source RD
Level Outcome
Disaggregation By gender
Data source and method Farm Assesment Tool
Frequency Baseline plus pre-growing season or very beginning of growing season plus mid-growing season, each agricultural season.
Issues and limitations This indicator is measured by an estimate of the % of the farm that is eroded and as such is subject to field agents estimate which may vary depending on the agent.
24Resilience Design Measurement Toolkit | Mercy Corps Annex 1
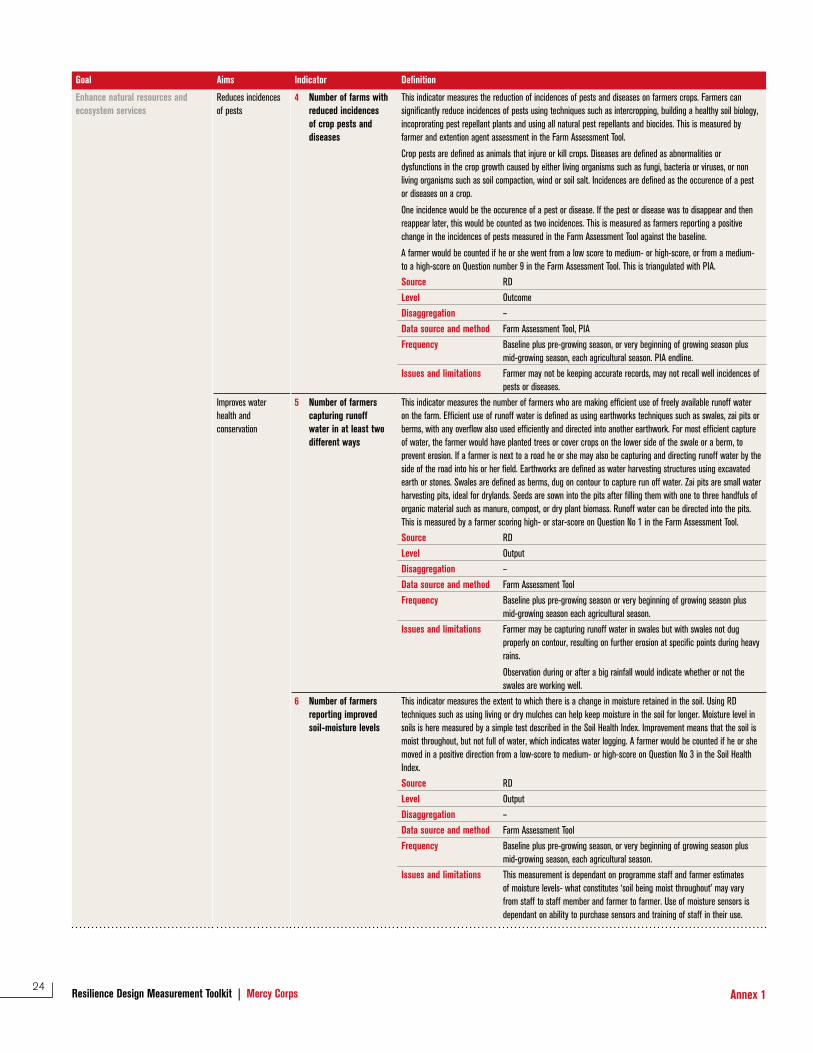
Goal Aims Indicator Definition
Enhance natural resources and ecosystem services
Reduces incidences of pests
4 Number of farms with reduced incidences of crop pests and diseases
This indicator measures the reduction of incidences of pests and diseases on farmers crops. Farmers can significantly reduce incidences of pests using techniques such as intercropping, building a healthy soil biology, incoprorating pest repellant plants and using all natural pest repellants and biocides. This is measured by farmer and extention agent assessment in the Farm Assessment Tool.
Crop pests are defined as animals that injure or kill crops. Diseases are defined as abnormalities or dysfunctions in the crop growth caused by either living organisms such as fungi, bacteria or viruses, or non living organisms such as soil compaction, wind or soil salt. Incidences are defined as the occurence of a pest or diseases on a crop.
One incidence would be the occurence of a pest or disease. If the pest or disease was to disappear and then reappear later, this would be counted as two incidences. This is measured as farmers reporting a positive change in the incidences of pests measured in the Farm Assessment Tool against the baseline.
A farmer would be counted if he or she went from a low score to medium- or high-score, or from a medium- to a high-score on Question number 9 in the Farm Assessment Tool. This is triangulated with PIA.
Source RD
Level Outcome
Disaggregation –
Data source and method Farm Assessment Tool, PIA
Frequency Baseline plus pre-growing season, or very beginning of growing season plus mid-growing season, each agricultural season. PIA endline.
Issues and limitations Farmer may not be keeping accurate records, may not recall well incidences of pests or diseases.
Improves water health and conservation
5 Number of farmers capturing runoff water in at least two different ways
This indicator measures the number of farmers who are making efficient use of freely available runoff water on the farm. Efficient use of runoff water is defined as using earthworks techniques such as swales, zai pits or berms, with any overflow also used efficiently and directed into another earthwork. For most efficient capture of water, the farmer would have planted trees or cover crops on the lower side of the swale or a berm, to prevent erosion. If a farmer is next to a road he or she may also be capturing and directing runoff water by the side of the road into his or her field. Earthworks are defined as water harvesting structures using excavated earth or stones. Swales are defined as berms, dug on contour to capture run off water. Zai pits are small water harvesting pits, ideal for drylands. Seeds are sown into the pits after filling them with one to three handfuls of organic material such as manure, compost, or dry plant biomass. Runoff water can be directed into the pits. This is measured by a farmer scoring high- or star-score on Question No 1 in the Farm Assessment Tool.
Source RD
Level Output
Disaggregation –
Data source and method Farm Assessment Tool
Frequency Baseline plus pre-growing season or very beginning of growing season plus mid-growing season each agricultural season.
Issues and limitations Farmer may be capturing runoff water in swales but with swales not dug properly on contour, resulting on further erosion at specific points during heavy rains.
Observation during or after a big rainfall would indicate whether or not the swales are working well.
6 Number of farmers reporting improved soil-moisture levels
This indicator measures the extent to which there is a change in moisture retained in the soil. Using RD techniques such as using living or dry mulches can help keep moisture in the soil for longer. Moisture level in soils is here measured by a simple test described in the Soil Health Index. Improvement means that the soil is moist throughout, but not full of water, which indicates water logging. A farmer would be counted if he or she moved in a positive direction from a low-score to medium- or high-score on Question No 3 in the Soil Health Index.
Source RD
Level Output
Disaggregation –
Data source and method Farm Assessment Tool
Frequency Baseline plus pre-growing season, or very beginning of growing season plus mid-growing season, each agricultural season.
Issues and limitations This measurement is dependant on programme staff and farmer estimates of moisture levels- what constitutes ‘soil being moist throughout’ may vary from staff to staff member and farmer to farmer. Use of moisture sensors is dependant on ability to purchase sensors and training of staff in their use.
25Resilience Design Measurement Toolkit | Mercy CorpsAnnex 1
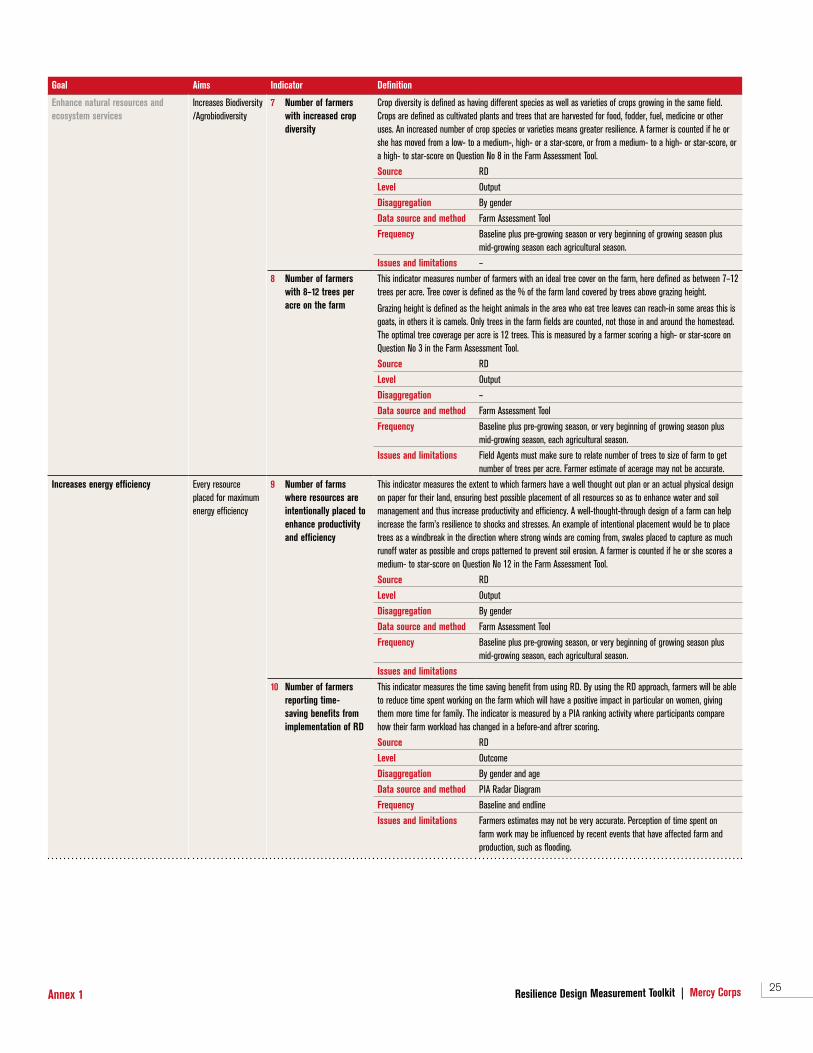
Goal Aims Indicator Definition
Enhance natural resources and ecosystem services
Increases Biodiversity /Agrobiodiversity
7 Number of farmers with increased crop diversity
Crop diversity is defined as having different species as well as varieties of crops growing in the same field. Crops are defined as cultivated plants and trees that are harvested for food, fodder, fuel, medicine or other uses. An increased number of crop species or varieties means greater resilience. A farmer is counted if he or she has moved from a low- to a medium-, high- or a star-score, or from a medium- to a high- or star-score, or a high- to star-score on Question No 8 in the Farm Assessment Tool.
Source RD
Level Output
Disaggregation By gender
Data source and method Farm Assessment Tool
Frequency Baseline plus pre-growing season or very beginning of growing season plus mid-growing season each agricultural season.
Issues and limitations –
8 Number of farmers with 8–12 trees per acre on the farm
This indicator measures number of farmers with an ideal tree cover on the farm, here defined as between 7–12 trees per acre. Tree cover is defined as the % of the farm land covered by trees above grazing height.
Grazing height is defined as the height animals in the area who eat tree leaves can reach-in some areas this is goats, in others it is camels. Only trees in the farm fields are counted, not those in and around the homestead. The optimal tree coverage per acre is 12 trees. This is measured by a farmer scoring a high- or star-score on Question No 3 in the Farm Assessment Tool.
Source RD
Level Output
Disaggregation –
Data source and method Farm Assessment Tool
Frequency Baseline plus pre-growing season, or very beginning of growing season plus mid-growing season, each agricultural season.
Issues and limitations Field Agents must make sure to relate number of trees to size of farm to get number of trees per acre. Farmer estimate of acerage may not be accurate.
Increases energy efficiency Every resource placed for maximum energy efficiency
9 Number of farms where resources are intentionally placed to enhance productivity and efficiency
This indicator measures the extent to which farmers have a well thought out plan or an actual physical design on paper for their land, ensuring best possible placement of all resources so as to enhance water and soil management and thus increase productivity and efficiency. A well-thought-through design of a farm can help increase the farm’s resilience to shocks and stresses. An example of intentional placement would be to place trees as a windbreak in the direction where strong winds are coming from, swales placed to capture as much runoff water as possible and crops patterned to prevent soil erosion. A farmer is counted if he or she scores a medium- to star-score on Question No 12 in the Farm Assessment Tool.
Source RD
Level Output
Disaggregation By gender
Data source and method Farm Assessment Tool
Frequency Baseline plus pre-growing season, or very beginning of growing season plus mid-growing season, each agricultural season.
Issues and limitations
10 Number of farmers reporting time-saving benefits from implementation of RD
This indicator measures the time saving benefit from using RD. By using the RD approach, farmers will be able to reduce time spent working on the farm which will have a positive impact in particular on women, giving them more time for family. The indicator is measured by a PIA ranking activity where participants compare how their farm workload has changed in a before-and aftrer scoring.
Source RD
Level Outcome
Disaggregation By gender and age
Data source and method PIA Radar Diagram
Frequency Baseline and endline
Issues and limitations Farmers estimates may not be very accurate. Perception of time spent on farm work may be influenced by recent events that have affected farm and production, such as flooding.
26Resilience Design Measurement Toolkit | Mercy Corps Annex 1
Goal Aims Indicator Definition
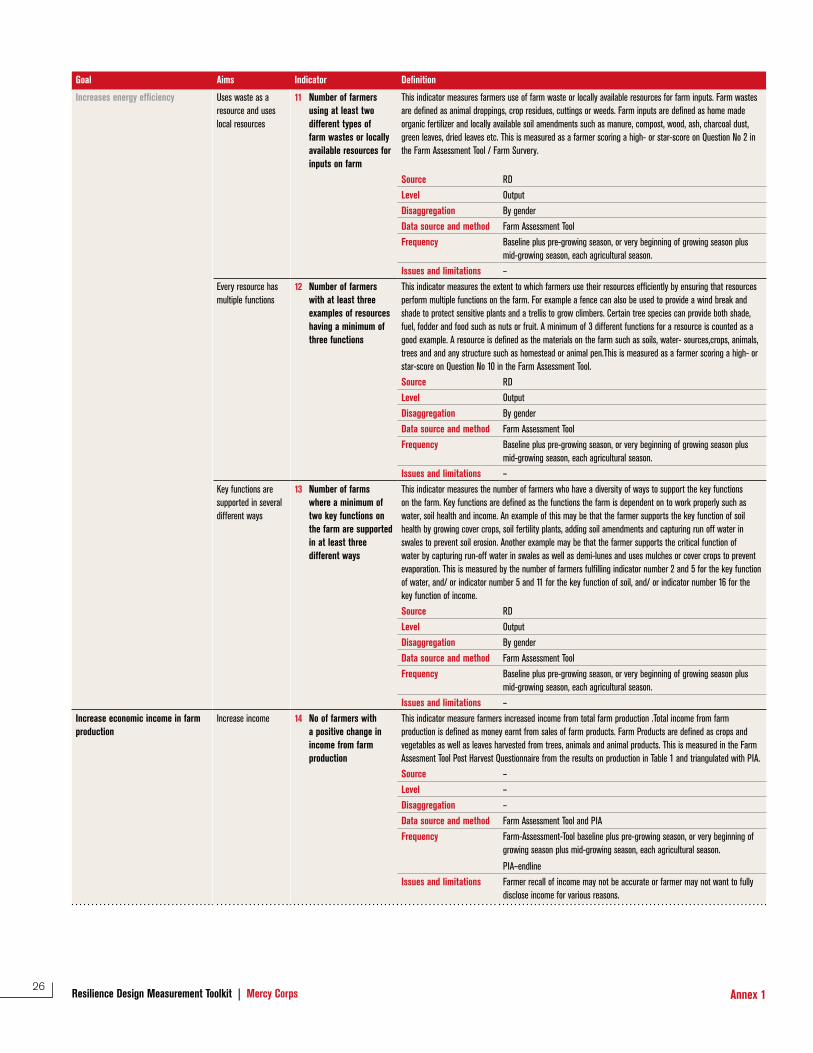
Increases energy efficiency Uses waste as a resource and uses local resources
11 Number of farmers using at least two different types of farm wastes or locally available resources for inputs on farm
This indicator measures farmers use of farm waste or locally available resources for farm inputs. Farm wastes are defined as animal droppings, crop residues, cuttings or weeds. Farm inputs are defined as home made organic fertilizer and locally available soil amendments such as manure, compost, wood, ash, charcoal dust, green leaves, dried leaves etc. This is measured as a farmer scoring a high- or star-score on Question No 2 in the Farm Assessment Tool / Farm Survery.
Source RD
Level Output
Disaggregation By gender
Data source and method Farm Assessment Tool
Frequency Baseline plus pre-growing season, or very beginning of growing season plus mid-growing season, each agricultural season.
Issues and limitations –
Every resource has multiple functions
12 Number of farmers with at least three examples of resources having a minimum of three functions
This indicator measures the extent to which farmers use their resources efficiently by ensuring that resources perform multiple functions on the farm. For example a fence can also be used to provide a wind break and shade to protect sensitive plants and a trellis to grow climbers. Certain tree species can provide both shade, fuel, fodder and food such as nuts or fruit. A minimum of 3 different functions for a resource is counted as a good example. A resource is defined as the materials on the farm such as soils, water- sources,crops, animals, trees and and any structure such as homestead or animal pen.This is measured as a farmer scoring a high- or star-score on Question No 10 in the Farm Assessment Tool.
Source RD
Level Output
Disaggregation By gender
Data source and method Farm Assessment Tool
Frequency Baseline plus pre-growing season, or very beginning of growing season plus mid-growing season, each agricultural season.
Issues and limitations –
Key functions are supported in several different ways
13 Number of farms where a minimum of two key functions on the farm are supported in at least three different ways
This indicator measures the number of farmers who have a diversity of ways to support the key functions on the farm. Key functions are defined as the functions the farm is dependent on to work properly such as water, soil health and income. An example of this may be that the farmer supports the key function of soil health by growing cover crops, soil fertility plants, adding soil amendments and capturing run off water in swales to prevent soil erosion. Another example may be that the farmer supports the critical function of water by capturing run-off water in swales as well as demi-lunes and uses mulches or cover crops to prevent evaporation. This is measured by the number of farmers fulfilling indicator number 2 and 5 for the key function of water, and/ or indicator number 5 and 11 for the key function of soil, and/ or indicator number 16 for the key function of income.
Source RD
Level Output
Disaggregation By gender
Data source and method Farm Assessment Tool
Frequency Baseline plus pre-growing season, or very beginning of growing season plus mid-growing season, each agricultural season.
Issues and limitations –
Increase economic income in farm production
Increase income 14 No of farmers with a positive change in income from farm production
This indicator measure farmers increased income from total farm production .Total income from farm production is defined as money earnt from sales of farm products. Farm Products are defined as crops and vegetables as well as leaves harvested from trees, animals and animal products. This is measured in the Farm Assesment Tool Post Harvest Questionnaire from the results on production in Table 1 and triangulated with PIA.
Source –
Level –
Disaggregation –
Data source and method Farm Assessment Tool and PIA
Frequency Farm-Assessment-Tool baseline plus pre-growing season, or very beginning of growing season plus mid-growing season, each agricultural season.
PIA–endline
Issues and limitations Farmer recall of income may not be accurate or farmer may not want to fully disclose income for various reasons.
27Resilience Design Measurement Toolkit | Mercy CorpsAnnex 1
Goal Aims Indicator Definition
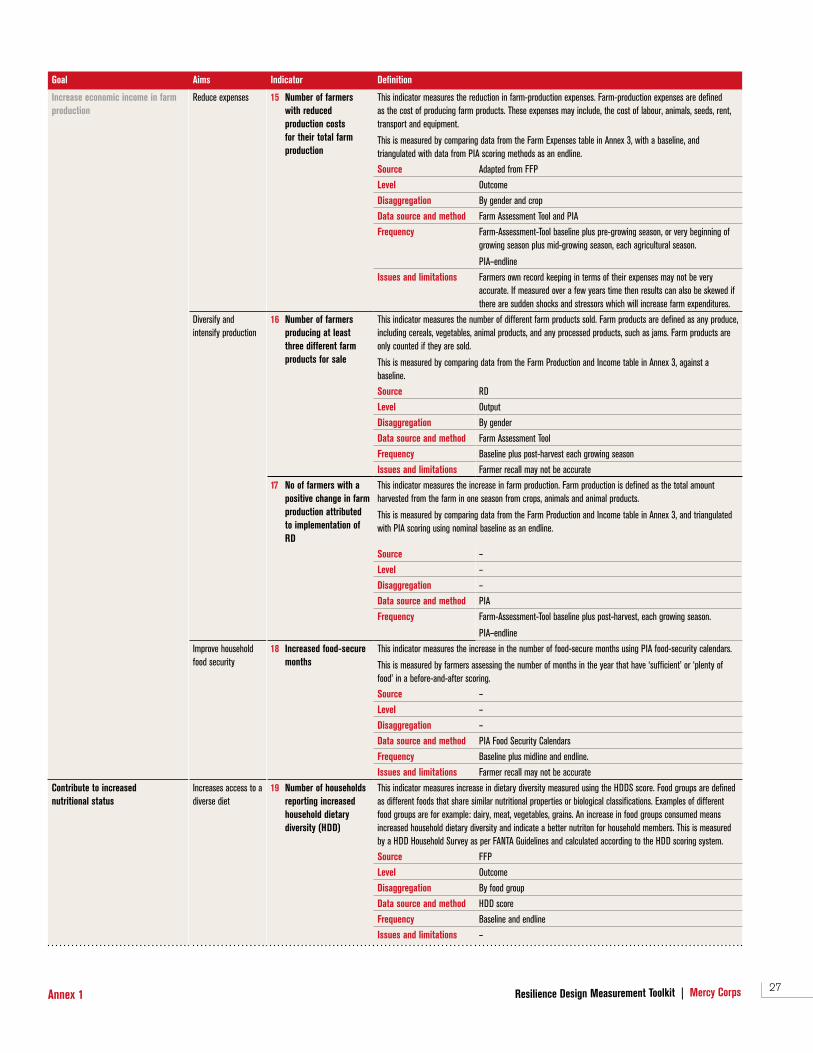
Increase economic income in farm production
Reduce expenses 15 Number of farmers with reduced production costs for their total farm production
This indicator measures the reduction in farm-production expenses. Farm-production expenses are defined as the cost of producing farm products. These expenses may include, the cost of labour, animals, seeds, rent, transport and equipment.
This is measured by comparing data from the Farm Expenses table in Annex 3, with a baseline, and triangulated with data from PIA scoring methods as an endline.
Source Adapted from FFP
Level Outcome
Disaggregation By gender and crop
Data source and method Farm Assessment Tool and PIA
Frequency Farm-Assessment-Tool baseline plus pre-growing season, or very beginning of growing season plus mid-growing season, each agricultural season.
PIA–endline
Issues and limitations Farmers own record keeping in terms of their expenses may not be very accurate. If measured over a few years time then results can also be skewed if there are sudden shocks and stressors which will increase farm expenditures.
Diversify and intensify production
16 Number of farmers producing at least three different farm products for sale
This indicator measures the number of different farm products sold. Farm products are defined as any produce, including cereals, vegetables, animal products, and any processed products, such as jams. Farm products are only counted if they are sold.
This is measured by comparing data from the Farm Production and Income table in Annex 3, against a baseline.
Source RD
Level Output
Disaggregation By gender
Data source and method Farm Assessment Tool
Frequency Baseline plus post-harvest each growing season
Issues and limitations Farmer recall may not be accurate
17 No of farmers with a positive change in farm production attributed to implementation of RD
This indicator measures the increase in farm production. Farm production is defined as the total amount harvested from the farm in one season from crops, animals and animal products.
This is measured by comparing data from the Farm Production and Income table in Annex 3, and triangulated with PIA scoring using nominal baseline as an endline.
Source –
Level –
Disaggregation –
Data source and method PIA
Frequency Farm-Assessment-Tool baseline plus post-harvest, each growing season.
PIA–endline
Improve household food security
18 Increased food-secure months
This indicator measures the increase in the number of food-secure months using PIA food-security calendars.
This is measured by farmers assessing the number of months in the year that have ‘sufficient’ or ‘plenty of food’ in a before-and-after scoring.
Source –
Level –
Disaggregation –
Data source and method PIA Food Security Calendars
Frequency Baseline plus midline and endline.
Issues and limitations Farmer recall may not be accurate
Contribute to increased nutritional status
Increases access to a diverse diet
19 Number of households reporting increased household dietary diversity (HDD)
This indicator measures increase in dietary diversity measured using the HDDS score. Food groups are defined as different foods that share similar nutritional properties or biological classifications. Examples of different food groups are for example: dairy, meat, vegetables, grains. An increase in food groups consumed means increased household dietary diversity and indicate a better nutriton for household members. This is measured by a HDD Household Survey as per FANTA Guidelines and calculated according to the HDD scoring system.
Source FFP
Level Outcome
Disaggregation By food group
Data source and method HDD score
Frequency Baseline and endline
Issues and limitations –
28Resilience Design Measurement Toolkit | Mercy Corps Annex 1
Goal Aims Indicator Definition
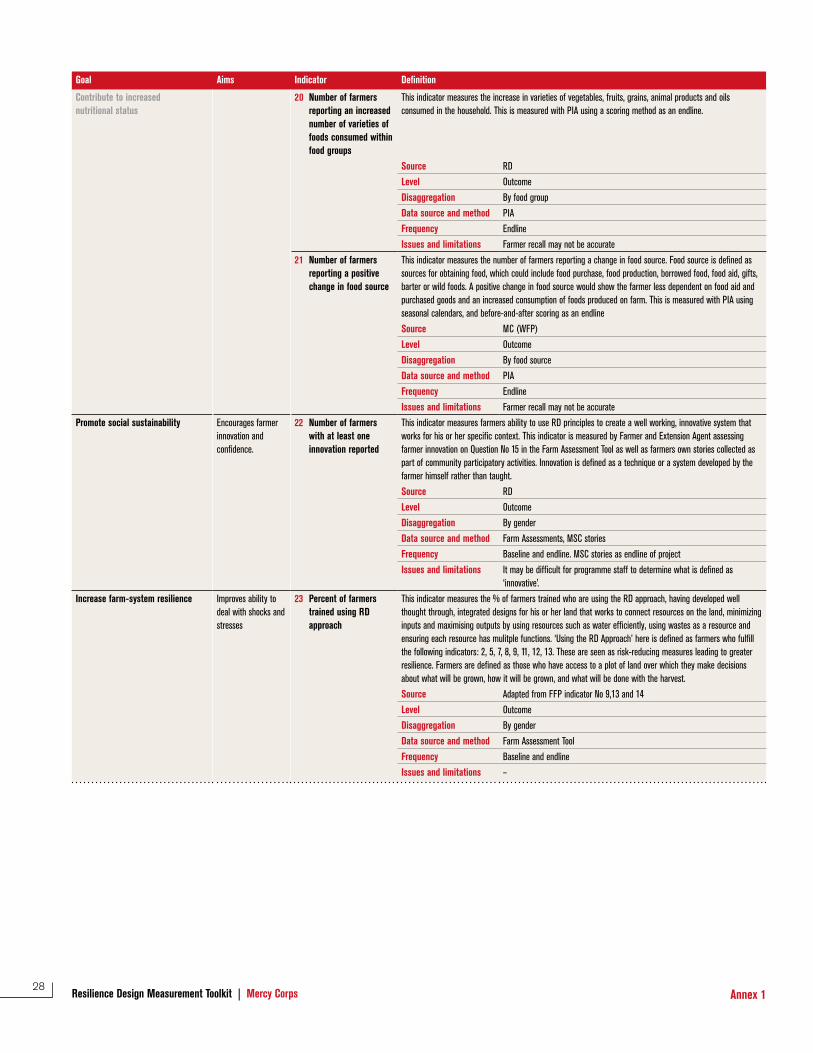
Contribute to increased nutritional status
20 Number of farmers reporting an increased number of varieties of foods consumed within food groups
This indicator measures the increase in varieties of vegetables, fruits, grains, animal products and oils consumed in the household. This is measured with PIA using a scoring method as an endline.
Source RD
Level Outcome
Disaggregation By food group
Data source and method PIA
Frequency Endline
Issues and limitations Farmer recall may not be accurate
21 Number of farmers reporting a positive change in food source
This indicator measures the number of farmers reporting a change in food source. Food source is defined as sources for obtaining food, which could include food purchase, food production, borrowed food, food aid, gifts, barter or wild foods. A positive change in food source would show the farmer less dependent on food aid and purchased goods and an increased consumption of foods produced on farm. This is measured with PIA using seasonal calendars, and before-and-after scoring as an endline
Source MC (WFP)
Level Outcome
Disaggregation By food source
Data source and method PIA
Frequency Endline
Issues and limitations Farmer recall may not be accurate
Promote social sustainability Encourages farmer innovation and confidence.
22 Number of farmers with at least one innovation reported
This indicator measures farmers ability to use RD principles to create a well working, innovative system that works for his or her specific context. This indicator is measured by Farmer and Extension Agent assessing farmer innovation on Question No 15 in the Farm Assessment Tool as well as farmers own stories collected as part of community participatory activities. Innovation is defined as a technique or a system developed by the farmer himself rather than taught.
Source RD
Level Outcome
Disaggregation By gender
Data source and method Farm Assessments, MSC stories
Frequency Baseline and endline. MSC stories as endline of project
Issues and limitations It may be difficult for programme staff to determine what is defined as ‘innovative’.
Increase farm-system resilience Improves ability to deal with shocks and stresses
23 Percent of farmers trained using RD approach
This indicator measures the % of farmers trained who are using the RD approach, having developed well thought through, integrated designs for his or her land that works to connect resources on the land, minimizing inputs and maximising outputs by using resources such as water efficiently, using wastes as a resource and ensuring each resource has mulitple functions. ‘Using the RD Approach’ here is defined as farmers who fulfill the following indicators: 2, 5, 7, 8, 9, 11, 12, 13. These are seen as risk-reducing measures leading to greater resilience. Farmers are defined as those who have access to a plot of land over which they make decisions about what will be grown, how it will be grown, and what will be done with the harvest.
Source Adapted from FFP indicator No 9,13 and 14
Level Outcome
Disaggregation By gender
Data source and method Farm Assessment Tool
Frequency Baseline and endline
Issues and limitations –
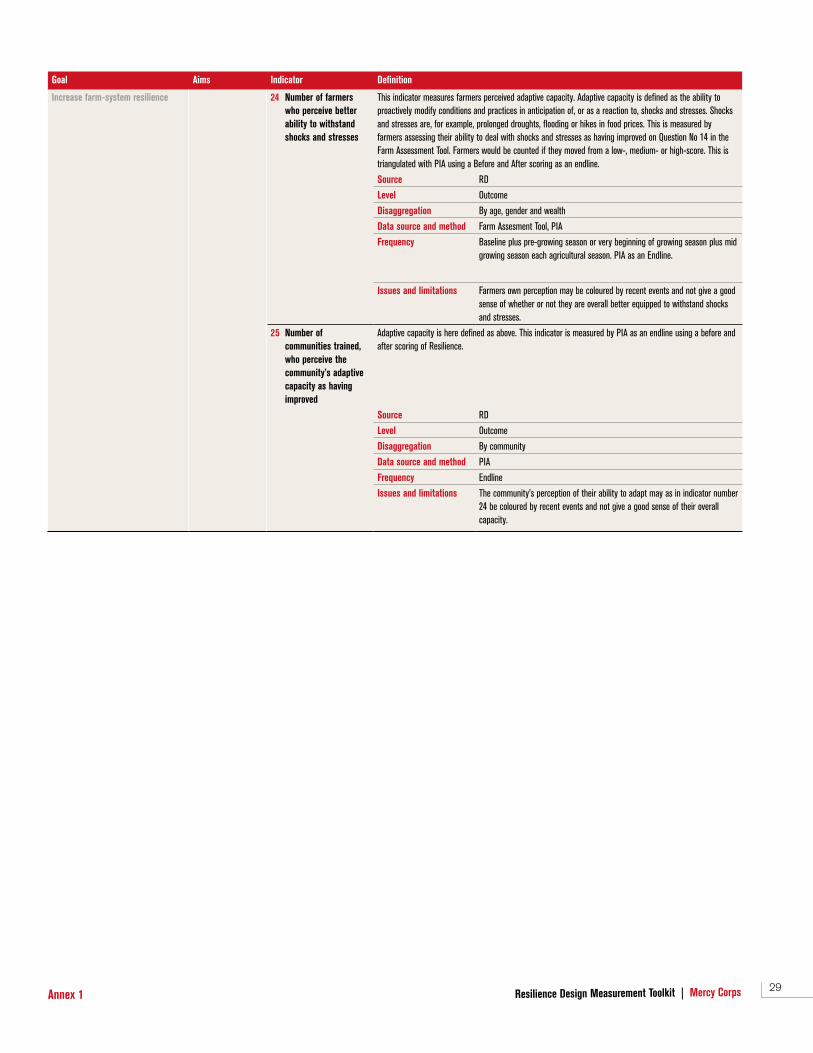
29Resilience Design Measurement Toolkit | Mercy CorpsAnnex 1
Goal Aims Indicator Definition
Increase farm-system resilience 24 Number of farmers who perceive better ability to withstand shocks and stresses
This indicator measures farmers perceived adaptive capacity. Adaptive capacity is defined as the ability to proactively modify conditions and practices in anticipation of, or as a reaction to, shocks and stresses. Shocks and stresses are, for example, prolonged droughts, flooding or hikes in food prices. This is measured by farmers assessing their ability to deal with shocks and stresses as having improved on Question No 14 in the Farm Assessment Tool. Farmers would be counted if they moved from a low-, medium- or high-score. This is triangulated with PIA using a Before and After scoring as an endline.
Source RD
Level Outcome
Disaggregation By age, gender and wealth
Data source and method Farm Assesment Tool, PIA
Frequency Baseline plus pre-growing season or very beginning of growing season plus mid growing season each agricultural season. PIA as an Endline.
Issues and limitations Farmers own perception may be coloured by recent events and not give a good sense of whether or not they are overall better equipped to withstand shocks and stresses.
25 Number of communities trained, who perceive the community’s adaptive capacity as having improved
Adaptive capacity is here defined as above. This indicator is measured by PIA as an endline using a before and after scoring of Resilience.
Source RD
Level Outcome
Disaggregation By community
Data source and method PIA
Frequency Endline
Issues and limitations The community’s perception of their ability to adapt may as in indicator number 24 be coloured by recent events and not give a good sense of their overall capacity.
30Resilience Design Measurement Toolkit | Mercy Corps Annex 2
Name of farmer
Gender
Age
Size of farm field(s) for growing crops(Farmer estimate if exact measures not available)
Number of animals kept
Location
Date
Extension agent / staff member
Farm Resilience Assessment The Farm Resilience Assessment is done with the farmer while visiting
his or her farm.
Ask to speak with the person in the household who makes
the decisions about what to plant and when, what inputs to
buy and what to do with the harvest. This could either be
one person or two, if decisions are made jointly. If decisions
are made jointly, ensure the assessment is done with both.
Walk the land with the farmer to understand what has been
implemented or not.
When to do itBaseline, before the growing season, or at very beginning of
growing season, and in the middle of the growing season.
Annex 2 Farm Resilience Assessment Tool
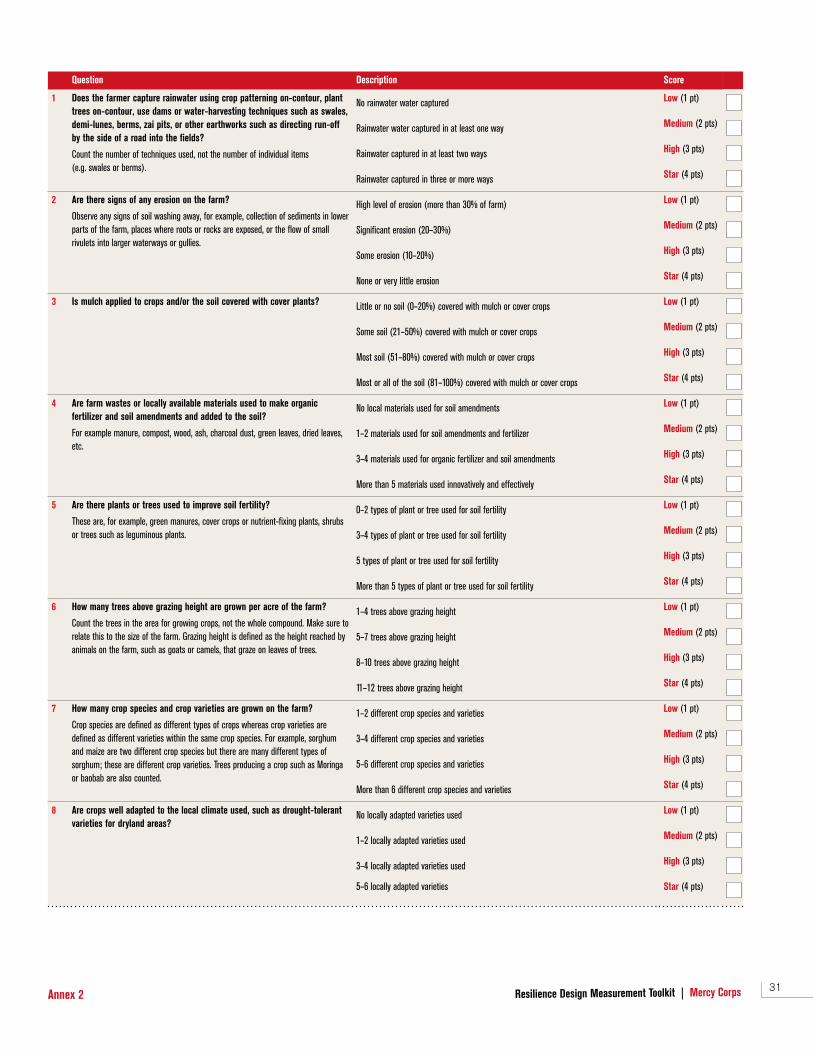
31Resilience Design Measurement Toolkit | Mercy CorpsAnnex 2
Question Description Score
1 Does the farmer capture rainwater using crop patterning on-contour, plant trees on-contour, use dams or water-harvesting techniques such as swales, demi-lunes, berms, zai pits, or other earthworks such as directing run-off by the side of a road into the fields?
Count the number of techniques used, not the number of individual items (e.g. swales or berms).
No rainwater water captured Low (1 pt)
Rainwater water captured in at least one way Medium (2 pts)
Rainwater captured in at least two ways High (3 pts)
Rainwater captured in three or more ways Star (4 pts)
2 Are there signs of any erosion on the farm?
Observe any signs of soil washing away, for example, collection of sediments in lower parts of the farm, places where roots or rocks are exposed, or the flow of small rivulets into larger waterways or gullies.
High level of erosion (more than 30% of farm) Low (1 pt)
Significant erosion (20–30%) Medium (2 pts)
Some erosion (10–20%) High (3 pts)
None or very little erosion Star (4 pts)
3 Is mulch applied to crops and/or the soil covered with cover plants? Little or no soil (0–20%) covered with mulch or cover crops Low (1 pt)
Some soil (21–50%) covered with mulch or cover crops Medium (2 pts)
Most soil (51–80%) covered with mulch or cover crops High (3 pts)
Most or all of the soil (81–100%) covered with mulch or cover crops Star (4 pts)
4 Are farm wastes or locally available materials used to make organic fertilizer and soil amendments and added to the soil?
For example manure, compost, wood, ash, charcoal dust, green leaves, dried leaves, etc.
No local materials used for soil amendments Low (1 pt)
1–2 materials used for soil amendments and fertilizer Medium (2 pts)
3–4 materials used for organic fertilizer and soil amendments High (3 pts)
More than 5 materials used innovatively and effectively Star (4 pts)
5 Are there plants or trees used to improve soil fertility?
These are, for example, green manures, cover crops or nutrient-fixing plants, shrubs or trees such as leguminous plants.
0–2 types of plant or tree used for soil fertility Low (1 pt)
3–4 types of plant or tree used for soil fertility Medium (2 pts)
5 types of plant or tree used for soil fertility High (3 pts)
More than 5 types of plant or tree used for soil fertility Star (4 pts)
6 How many trees above grazing height are grown per acre of the farm?
Count the trees in the area for growing crops, not the whole compound. Make sure to relate this to the size of the farm. Grazing height is defined as the height reached by animals on the farm, such as goats or camels, that graze on leaves of trees.
1–4 trees above grazing height Low (1 pt)
5–7 trees above grazing height Medium (2 pts)
8–10 trees above grazing height High (3 pts)
11–12 trees above grazing height Star (4 pts)
7 How many crop species and crop varieties are grown on the farm?
Crop species are defined as different types of crops whereas crop varieties are defined as different varieties within the same crop species. For example, sorghum and maize are two different crop species but there are many different types of sorghum; these are different crop varieties. Trees producing a crop such as Moringa or baobab are also counted.
1–2 different crop species and varieties Low (1 pt)
3–4 different crop species and varieties Medium (2 pts)
5–6 different crop species and varieties High (3 pts)
More than 6 different crop species and varieties Star (4 pts)
8 Are crops well adapted to the local climate used, such as drought-tolerant varieties for dryland areas?
No locally adapted varieties used Low (1 pt)
1–2 locally adapted varieties used Medium (2 pts)
3–4 locally adapted varieties used High (3 pts)
5–6 locally adapted varieties Star (4 pts)
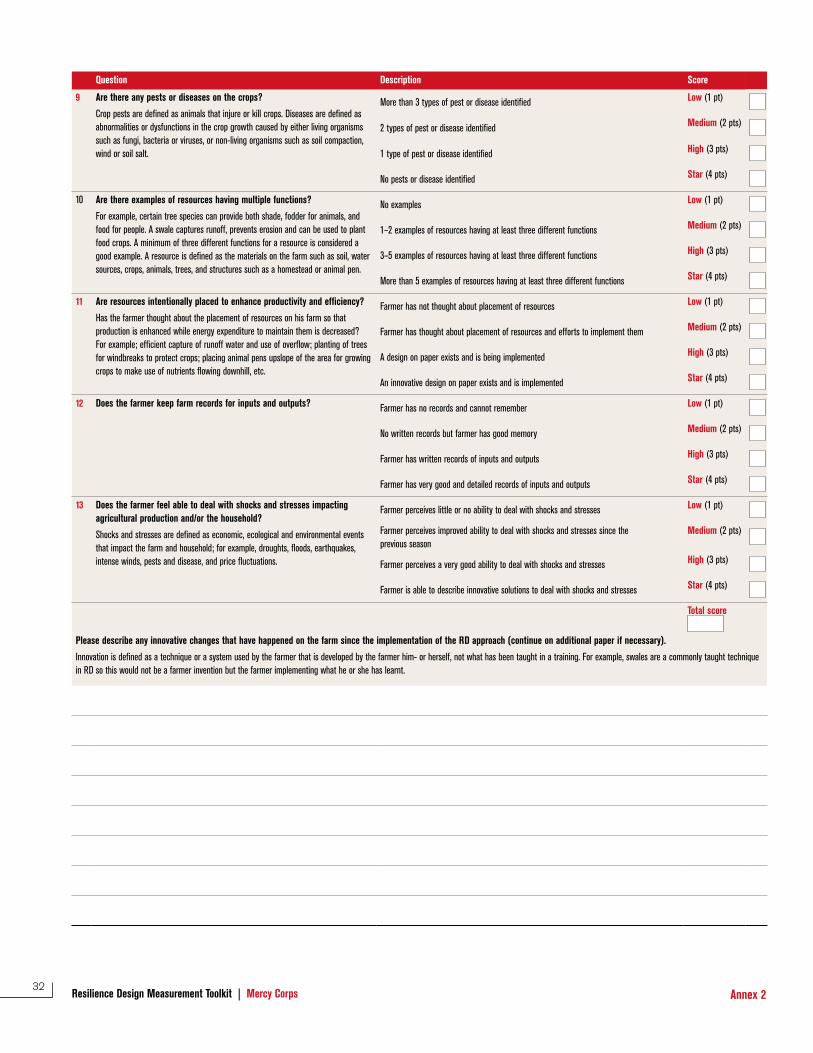
32Resilience Design Measurement Toolkit | Mercy Corps Annex 2
Question Description Score
9 Are there any pests or diseases on the crops?
Crop pests are defined as animals that injure or kill crops. Diseases are defined as abnormalities or dysfunctions in the crop growth caused by either living organisms such as fungi, bacteria or viruses, or non-living organisms such as soil compaction, wind or soil salt.
More than 3 types of pest or disease identified Low (1 pt)
2 types of pest or disease identified Medium (2 pts)
1 type of pest or disease identified High (3 pts)
No pests or disease identified Star (4 pts)
10 Are there examples of resources having multiple functions?
For example, certain tree species can provide both shade, fodder for animals, and food for people. A swale captures runoff, prevents erosion and can be used to plant food crops. A minimum of three different functions for a resource is considered a good example. A resource is defined as the materials on the farm such as soil, water sources, crops, animals, trees, and structures such as a homestead or animal pen.
No examples Low (1 pt)
1–2 examples of resources having at least three different functions Medium (2 pts)
3–5 examples of resources having at least three different functions High (3 pts)
More than 5 examples of resources having at least three different functions Star (4 pts)
11 Are resources intentionally placed to enhance productivity and efficiency?
Has the farmer thought about the placement of resources on his farm so that production is enhanced while energy expenditure to maintain them is decreased? For example; efficient capture of runoff water and use of overflow; planting of trees for windbreaks to protect crops; placing animal pens upslope of the area for growing crops to make use of nutrients flowing downhill, etc.
Farmer has not thought about placement of resources Low (1 pt)
Farmer has thought about placement of resources and efforts to implement them Medium (2 pts)
A design on paper exists and is being implemented High (3 pts)
An innovative design on paper exists and is implemented Star (4 pts)
12 Does the farmer keep farm records for inputs and outputs? Farmer has no records and cannot remember Low (1 pt)
No written records but farmer has good memory Medium (2 pts)
Farmer has written records of inputs and outputs High (3 pts)
Farmer has very good and detailed records of inputs and outputs Star (4 pts)
13 Does the farmer feel able to deal with shocks and stresses impacting agricultural production and/or the household?
Shocks and stresses are defined as economic, ecological and environmental events that impact the farm and household; for example, droughts, floods, earthquakes, intense winds, pests and disease, and price fluctuations.
Farmer perceives little or no ability to deal with shocks and stresses Low (1 pt)
Farmer perceives improved ability to deal with shocks and stresses since the previous season
Medium (2 pts)
Farmer perceives a very good ability to deal with shocks and stresses High (3 pts)
Farmer is able to describe innovative solutions to deal with shocks and stresses Star (4 pts)
Total score
Please describe any innovative changes that have happened on the farm since the implementation of the RD approach (continue on additional paper if necessary).
Innovation is defined as a technique or a system used by the farmer that is developed by the farmer him- or herself, not what has been taught in a training. For example, swales are a commonly taught technique in RD so this would not be a farmer invention but the farmer implementing what he or she has learnt.
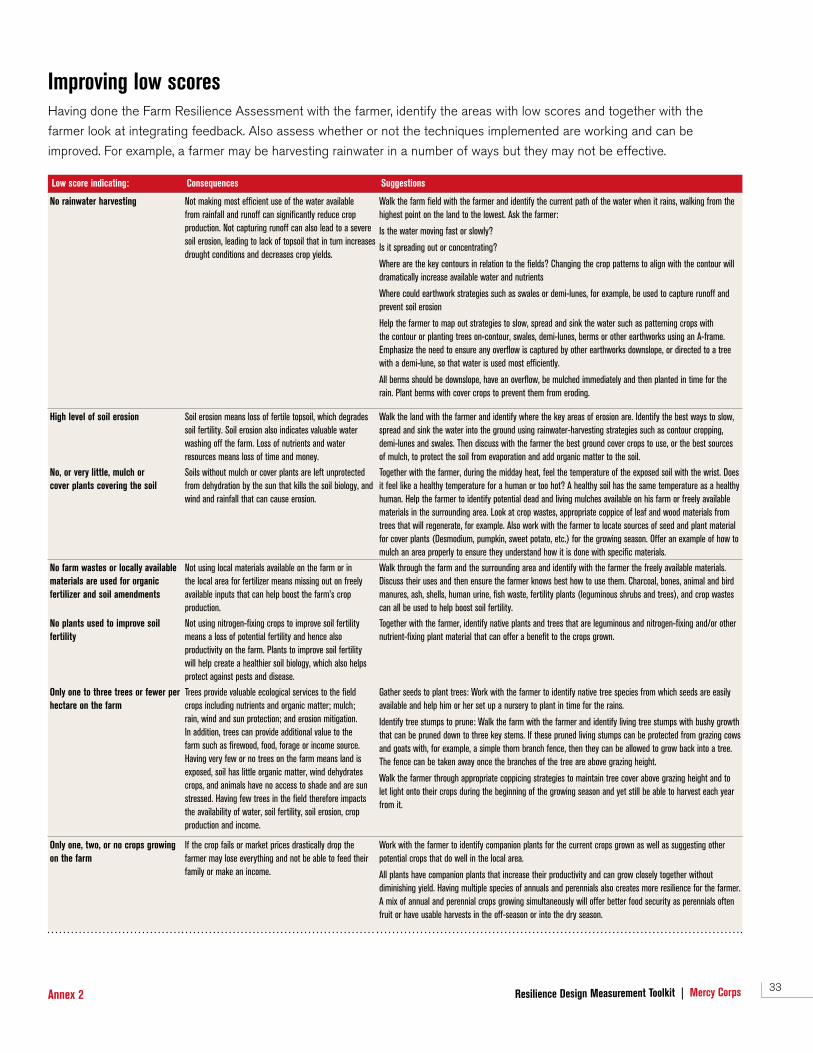
33Resilience Design Measurement Toolkit | Mercy CorpsAnnex 2
Improving low scores Having done the Farm Resilience Assessment with the farmer, identify the areas with low scores and together with the
farmer look at integrating feedback. Also assess whether or not the techniques implemented are working and can be
improved. For example, a farmer may be harvesting rainwater in a number of ways but they may not be effective.
Low score indicating: Consequences Suggestions
No rainwater harvesting Not making most efficient use of the water available from rainfall and runoff can significantly reduce crop production. Not capturing runoff can also lead to a severe soil erosion, leading to lack of topsoil that in turn increases drought conditions and decreases crop yields.
Walk the farm field with the farmer and identify the current path of the water when it rains, walking from the highest point on the land to the lowest. Ask the farmer:
Is the water moving fast or slowly?
Is it spreading out or concentrating?
Where are the key contours in relation to the fields? Changing the crop patterns to align with the contour will dramatically increase available water and nutrients
Where could earthwork strategies such as swales or demi-lunes, for example, be used to capture runoff and prevent soil erosion
Help the farmer to map out strategies to slow, spread and sink the water such as patterning crops with the contour or planting trees on-contour, swales, demi-lunes, berms or other earthworks using an A-frame. Emphasize the need to ensure any overflow is captured by other earthworks downslope, or directed to a tree with a demi-lune, so that water is used most efficiently.
All berms should be downslope, have an overflow, be mulched immediately and then planted in time for the rain. Plant berms with cover crops to prevent them from eroding.
High level of soil erosion Soil erosion means loss of fertile topsoil, which degrades soil fertility. Soil erosion also indicates valuable water washing off the farm. Loss of nutrients and water resources means loss of time and money.
Walk the land with the farmer and identify where the key areas of erosion are. Identify the best ways to slow, spread and sink the water into the ground using rainwater-harvesting strategies such as contour cropping, demi-lunes and swales. Then discuss with the farmer the best ground cover crops to use, or the best sources of mulch, to protect the soil from evaporation and add organic matter to the soil.
No, or very little, mulch or cover plants covering the soil
Soils without mulch or cover plants are left unprotected from dehydration by the sun that kills the soil biology, and wind and rainfall that can cause erosion.
Together with the farmer, during the midday heat, feel the temperature of the exposed soil with the wrist. Does it feel like a healthy temperature for a human or too hot? A healthy soil has the same temperature as a healthy human. Help the farmer to identify potential dead and living mulches available on his farm or freely available materials in the surrounding area. Look at crop wastes, appropriate coppice of leaf and wood materials from trees that will regenerate, for example. Also work with the farmer to locate sources of seed and plant material for cover plants (Desmodium, pumpkin, sweet potato, etc.) for the growing season. Offer an example of how to mulch an area properly to ensure they understand how it is done with specific materials.
No farm wastes or locally available materials are used for organic fertilizer and soil amendments
Not using local materials available on the farm or in the local area for fertilizer means missing out on freely available inputs that can help boost the farm’s crop production.
Walk through the farm and the surrounding area and identify with the farmer the freely available materials. Discuss their uses and then ensure the farmer knows best how to use them. Charcoal, bones, animal and bird manures, ash, shells, human urine, fish waste, fertility plants (leguminous shrubs and trees), and crop wastes can all be used to help boost soil fertility.
No plants used to improve soil fertility
Not using nitrogen-fixing crops to improve soil fertility means a loss of potential fertility and hence also productivity on the farm. Plants to improve soil fertility will help create a healthier soil biology, which also helps protect against pests and disease.
Together with the farmer, identify native plants and trees that are leguminous and nitrogen-fixing and/or other nutrient-fixing plant material that can offer a benefit to the crops grown.
Only one to three trees or fewer per hectare on the farm
Trees provide valuable ecological services to the field crops including nutrients and organic matter; mulch; rain, wind and sun protection; and erosion mitigation. In addition, trees can provide additional value to the farm such as firewood, food, forage or income source. Having very few or no trees on the farm means land is exposed, soil has little organic matter, wind dehydrates crops, and animals have no access to shade and are sun stressed. Having few trees in the field therefore impacts the availability of water, soil fertility, soil erosion, crop production and income.
Gather seeds to plant trees: Work with the farmer to identify native tree species from which seeds are easily available and help him or her set up a nursery to plant in time for the rains.
Identify tree stumps to prune: Walk the farm with the farmer and identify living tree stumps with bushy growth that can be pruned down to three key stems. If these pruned living stumps can be protected from grazing cows and goats with, for example, a simple thorn branch fence, then they can be allowed to grow back into a tree. The fence can be taken away once the branches of the tree are above grazing height.
Walk the farmer through appropriate coppicing strategies to maintain tree cover above grazing height and to let light onto their crops during the beginning of the growing season and yet still be able to harvest each year from it.
Only one, two, or no crops growing on the farm
If the crop fails or market prices drastically drop the farmer may lose everything and not be able to feed their family or make an income.
Work with the farmer to identify companion plants for the current crops grown as well as suggesting other potential crops that do well in the local area.
All plants have companion plants that increase their productivity and can grow closely together without diminishing yield. Having multiple species of annuals and perennials also creates more resilience for the farmer. A mix of annual and perennial crops growing simultaneously will offer better food security as perennials often fruit or have usable harvests in the off-season or into the dry season.
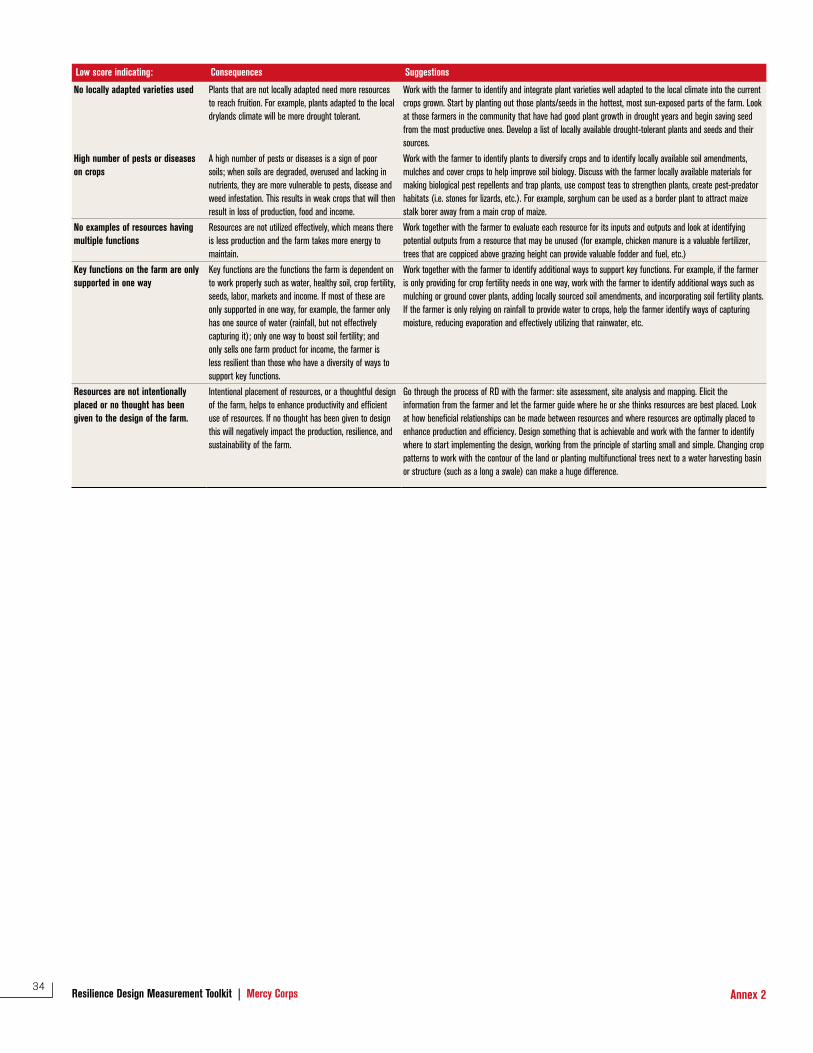
34Resilience Design Measurement Toolkit | Mercy Corps Annex 2
Low score indicating: Consequences Suggestions
No locally adapted varieties used Plants that are not locally adapted need more resources to reach fruition. For example, plants adapted to the local drylands climate will be more drought tolerant.
Work with the farmer to identify and integrate plant varieties well adapted to the local climate into the current crops grown. Start by planting out those plants/seeds in the hottest, most sun-exposed parts of the farm. Look at those farmers in the community that have had good plant growth in drought years and begin saving seed from the most productive ones. Develop a list of locally available drought-tolerant plants and seeds and their sources.
High number of pests or diseases on crops
A high number of pests or diseases is a sign of poor soils; when soils are degraded, overused and lacking in nutrients, they are more vulnerable to pests, disease and weed infestation. This results in weak crops that will then result in loss of production, food and income.
Work with the farmer to identify plants to diversify crops and to identify locally available soil amendments, mulches and cover crops to help improve soil biology. Discuss with the farmer locally available materials for making biological pest repellents and trap plants, use compost teas to strengthen plants, create pest-predator habitats (i.e. stones for lizards, etc.). For example, sorghum can be used as a border plant to attract maize stalk borer away from a main crop of maize.
No examples of resources having multiple functions
Resources are not utilized effectively, which means there is less production and the farm takes more energy to maintain.
Work together with the farmer to evaluate each resource for its inputs and outputs and look at identifying potential outputs from a resource that may be unused (for example, chicken manure is a valuable fertilizer, trees that are coppiced above grazing height can provide valuable fodder and fuel, etc.)
Key functions on the farm are only supported in one way
Key functions are the functions the farm is dependent on to work properly such as water, healthy soil, crop fertility, seeds, labor, markets and income. If most of these are only supported in one way, for example, the farmer only has one source of water (rainfall, but not effectively capturing it); only one way to boost soil fertility; and only sells one farm product for income, the farmer is less resilient than those who have a diversity of ways to support key functions.
Work together with the farmer to identify additional ways to support key functions. For example, if the farmer is only providing for crop fertility needs in one way, work with the farmer to identify additional ways such as mulching or ground cover plants, adding locally sourced soil amendments, and incorporating soil fertility plants. If the farmer is only relying on rainfall to provide water to crops, help the farmer identify ways of capturing moisture, reducing evaporation and effectively utilizing that rainwater, etc.
Resources are not intentionally placed or no thought has been given to the design of the farm.
Intentional placement of resources, or a thoughtful design of the farm, helps to enhance productivity and efficient use of resources. If no thought has been given to design this will negatively impact the production, resilience, and sustainability of the farm.
Go through the process of RD with the farmer: site assessment, site analysis and mapping. Elicit the information from the farmer and let the farmer guide where he or she thinks resources are best placed. Look at how beneficial relationships can be made between resources and where resources are optimally placed to enhance production and efficiency. Design something that is achievable and work with the farmer to identify where to start implementing the design, working from the principle of starting small and simple. Changing crop patterns to work with the contour of the land or planting multifunctional trees next to a water harvesting basin or structure (such as a long a swale) can make a huge difference.
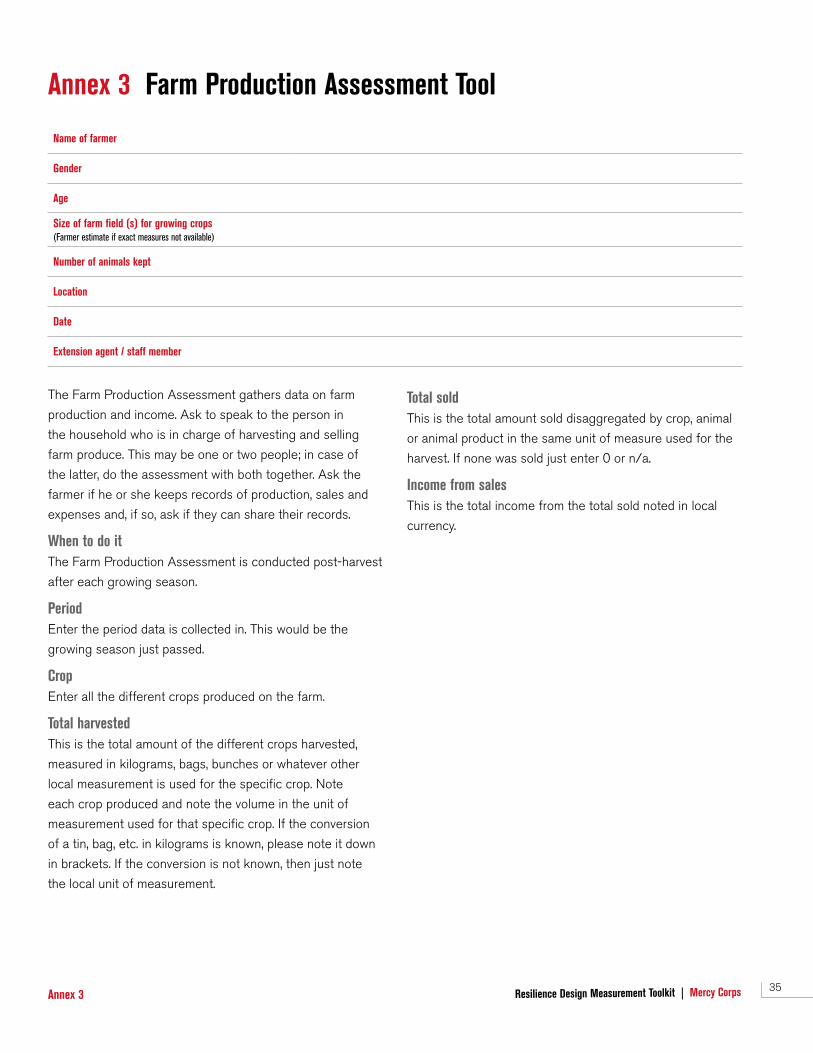
35Resilience Design Measurement Toolkit | Mercy CorpsAnnex 3
The Farm Production Assessment gathers data on farm
production and income. Ask to speak to the person in
the household who is in charge of harvesting and selling
farm produce. This may be one or two people; in case of
the latter, do the assessment with both together. Ask the
farmer if he or she keeps records of production, sales and
expenses and, if so, ask if they can share their records.
When to do itThe Farm Production Assessment is conducted post-harvest
after each growing season.
PeriodEnter the period data is collected in. This would be the
growing season just passed.
CropEnter all the different crops produced on the farm.
Total harvestedThis is the total amount of the different crops harvested,
measured in kilograms, bags, bunches or whatever other
local measurement is used for the specific crop. Note
each crop produced and note the volume in the unit of
measurement used for that specific crop. If the conversion
of a tin, bag, etc. in kilograms is known, please note it down
in brackets. If the conversion is not known, then just note
the local unit of measurement.
Annex 3 Farm Production Assessment Tool
Name of farmer
Gender
Age
Size of farm field (s) for growing crops(Farmer estimate if exact measures not available)
Number of animals kept
Location
Date
Extension agent / staff member
Total soldThis is the total amount sold disaggregated by crop, animal
or animal product in the same unit of measure used for the
harvest. If none was sold just enter 0 or n/a.
Income from sales This is the total income from the total sold noted in local
currency.
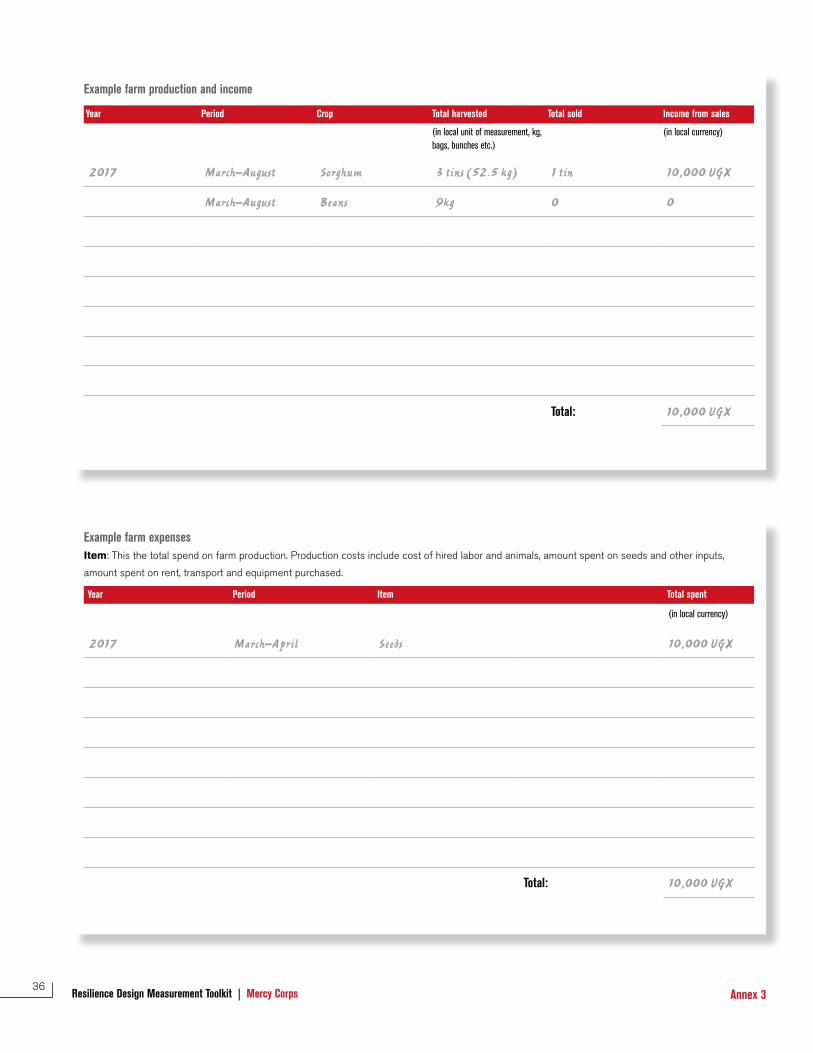
36Resilience Design Measurement Toolkit | Mercy Corps Annex 3
Example farm production and income
Year Period Crop Total harvested Total sold Income from sales
(in local unit of measurement, kg, bags, bunches etc.)
(in local currency)
2017 March–August Sorghum 3 tins (52.5 kg) 1 tin 10,000 UGX
March–August Beans 9kg 0 0
Total: 10,000 UGX
Example farm expenses Item: This the total spend on farm production. Production costs include cost of hired labor and animals, amount spent on seeds and other inputs,
amount spent on rent, transport and equipment purchased.
Year Period Item Total spent
(in local currency)
2017 March–April Seeds 10,000 UGX
Total: 10,000 UGX
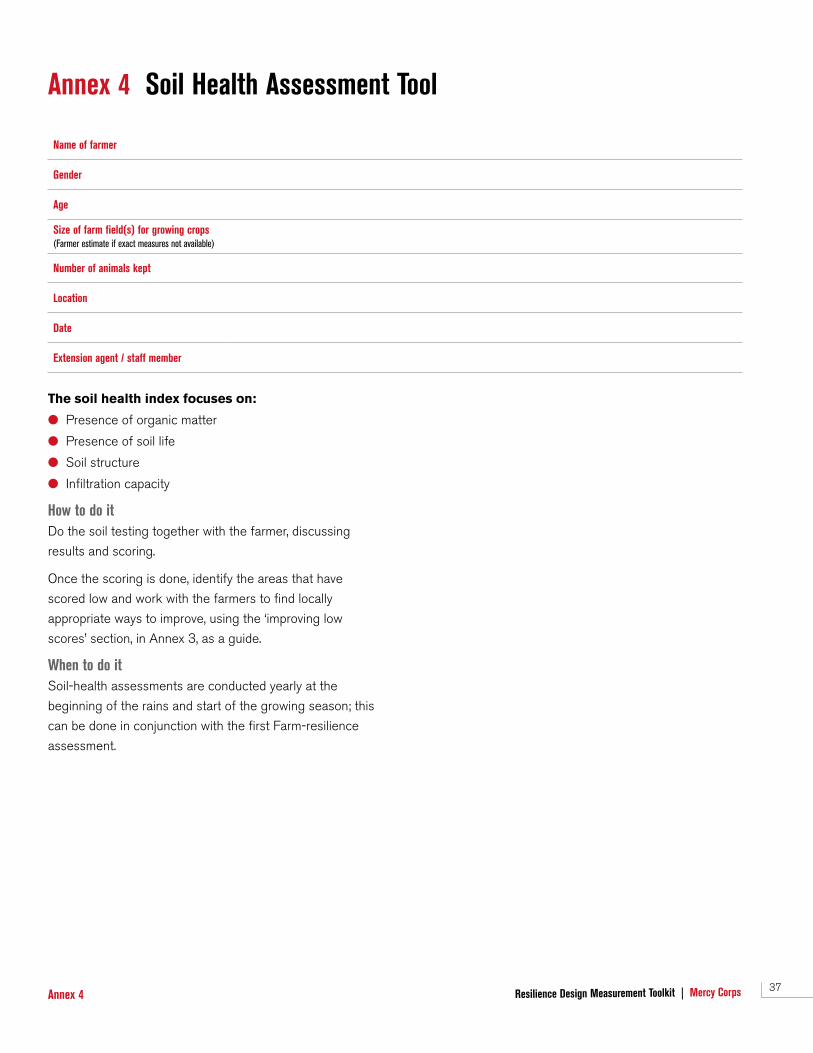
37Resilience Design Measurement Toolkit | Mercy CorpsAnnex 4
Annex 4 Soil Health Assessment Tool
Name of farmer
Gender
Age
Size of farm field(s) for growing crops(Farmer estimate if exact measures not available)
Number of animals kept
Location
Date
Extension agent / staff member
The soil health index focuses on:
● Presence of organic matter
● Presence of soil life
● Soil structure
● Infiltration capacity
How to do it Do the soil testing together with the farmer, discussing
results and scoring.
Once the scoring is done, identify the areas that have
scored low and work with the farmers to find locally
appropriate ways to improve, using the ‘improving low
scores’ section, in Annex 3, as a guide.
When to do it Soil-health assessments are conducted yearly at the
beginning of the rains and start of the growing season; this
can be done in conjunction with the first Farm-resilience
assessment.
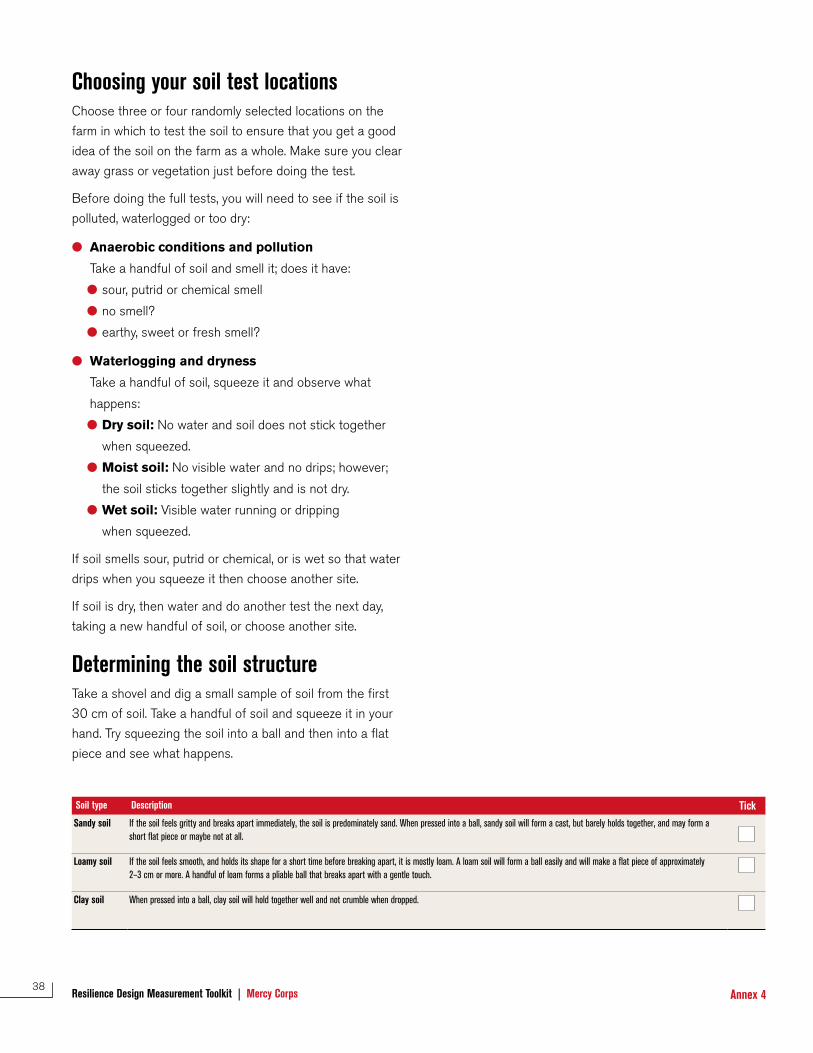
38Resilience Design Measurement Toolkit | Mercy Corps Annex 4
Choosing your soil test locations Choose three or four randomly selected locations on the
farm in which to test the soil to ensure that you get a good
idea of the soil on the farm as a whole. Make sure you clear
away grass or vegetation just before doing the test.
Before doing the full tests, you will need to see if the soil is
polluted, waterlogged or too dry:
● Anaerobic conditions and pollution
Take a handful of soil and smell it; does it have:
● sour, putrid or chemical smell
● no smell?
● earthy, sweet or fresh smell?
● Waterlogging and dryness
Take a handful of soil, squeeze it and observe what
happens:
● Dry soil: No water and soil does not stick together
when squeezed.
● Moist soil: No visible water and no drips; however;
the soil sticks together slightly and is not dry.
● Wet soil: Visible water running or dripping
when squeezed.
If soil smells sour, putrid or chemical, or is wet so that water
drips when you squeeze it then choose another site.
If soil is dry, then water and do another test the next day,
taking a new handful of soil, or choose another site.
Determining the soil structure Take a shovel and dig a small sample of soil from the first
30 cm of soil. Take a handful of soil and squeeze it in your
hand. Try squeezing the soil into a ball and then into a flat
piece and see what happens.
Soil type Description TickSandy soil If the soil feels gritty and breaks apart immediately, the soil is predominately sand. When pressed into a ball, sandy soil will form a cast, but barely holds together, and may form a
short flat piece or maybe not at all.
Loamy soil If the soil feels smooth, and holds its shape for a short time before breaking apart, it is mostly loam. A loam soil will form a ball easily and will make a flat piece of approximately 2–3 cm or more. A handful of loam forms a pliable ball that breaks apart with a gentle touch.
Clay soil When pressed into a ball, clay soil will hold together well and not crumble when dropped.
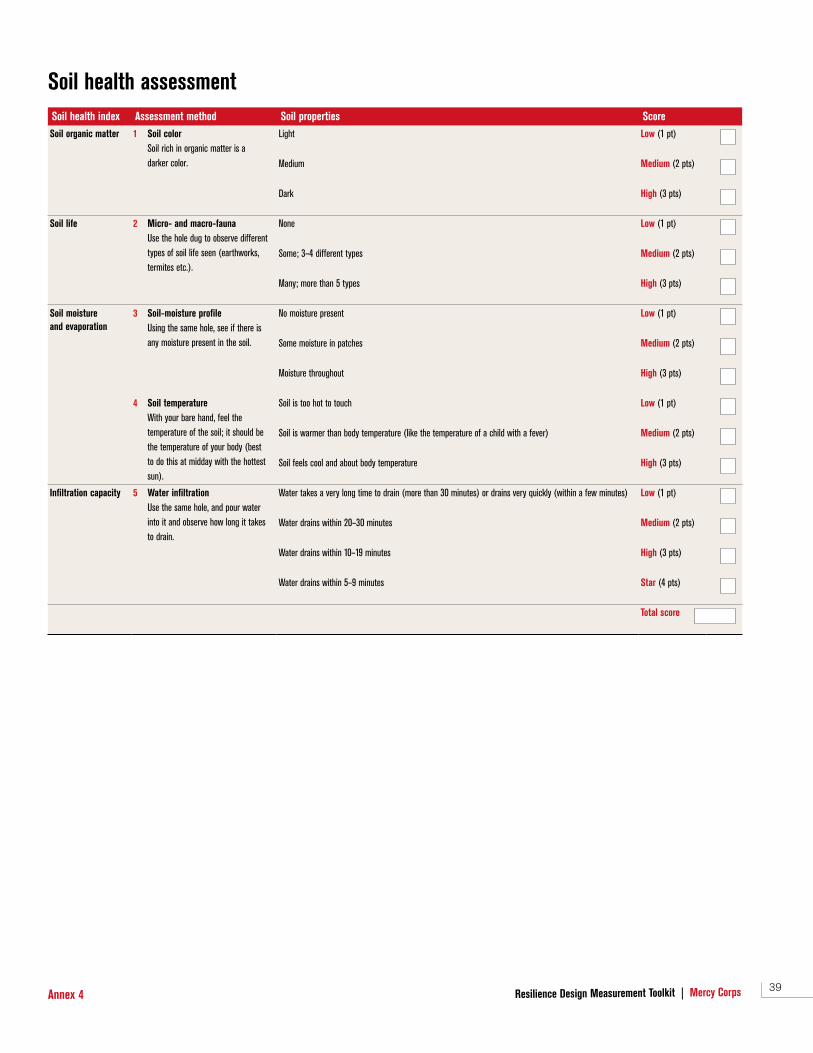
39Resilience Design Measurement Toolkit | Mercy CorpsAnnex 4
Soil health assessmentSoil health index Assessment method Soil properties Score Soil organic matter 1 Soil color
Soil rich in organic matter is a darker color.
Light Low (1 pt)
Medium Medium (2 pts)
Dark High (3 pts)
Soil life 2 Micro- and macro-fauna Use the hole dug to observe different types of soil life seen (earthworks, termites etc.).
None Low (1 pt)
Some; 3–4 different types Medium (2 pts)
Many; more than 5 types High (3 pts)
Soil moisture and evaporation
3 Soil-moisture profile Using the same hole, see if there is any moisture present in the soil.
No moisture present Low (1 pt)
Some moisture in patches Medium (2 pts)
Moisture throughout High (3 pts)
4 Soil temperature With your bare hand, feel the temperature of the soil; it should be the temperature of your body (best to do this at midday with the hottest sun).
Soil is too hot to touch Low (1 pt)
Soil is warmer than body temperature (like the temperature of a child with a fever) Medium (2 pts)
Soil feels cool and about body temperature High (3 pts)
Infiltration capacity 5 Water infiltration Use the same hole, and pour water into it and observe how long it takes to drain.
Water takes a very long time to drain (more than 30 minutes) or drains very quickly (within a few minutes) Low (1 pt)
Water drains within 20–30 minutes Medium (2 pts)
Water drains within 10–19 minutes High (3 pts)
Water drains within 5–9 minutes Star (4 pts)
Total score
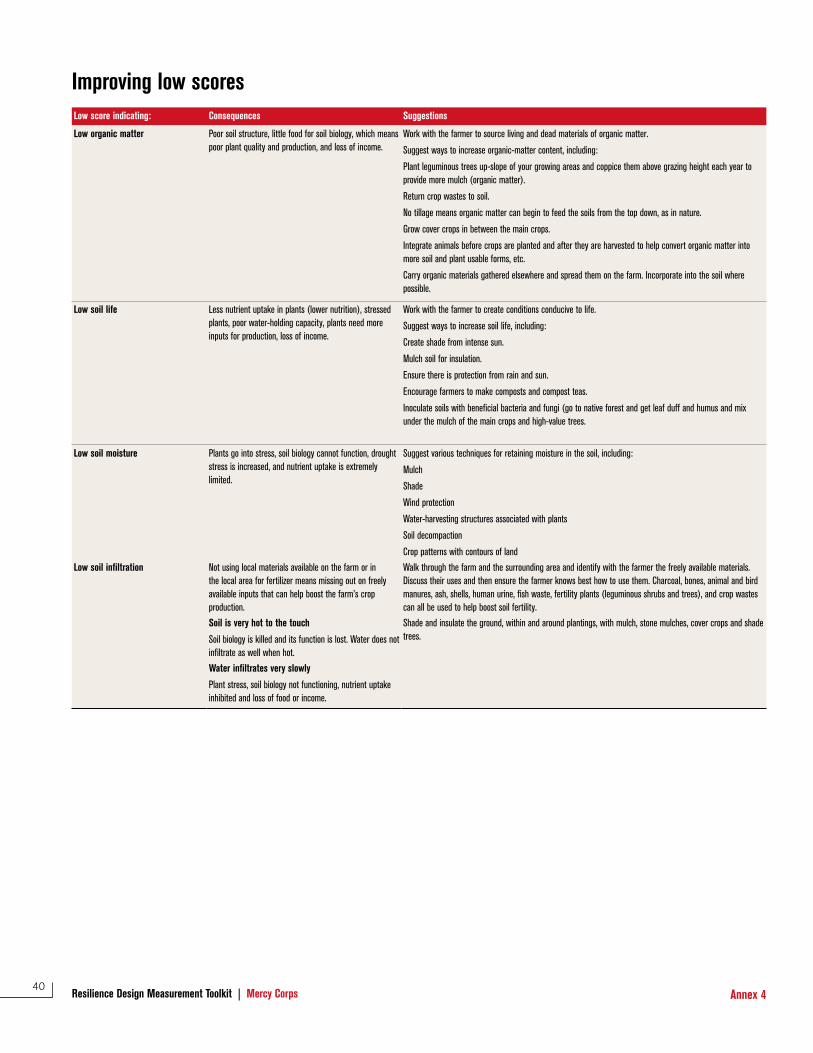
40Resilience Design Measurement Toolkit | Mercy Corps Annex 4
Improving low scores Low score indicating: Consequences Suggestions
Low organic matter Poor soil structure, little food for soil biology, which means poor plant quality and production, and loss of income.
Work with the farmer to source living and dead materials of organic matter.
Suggest ways to increase organic-matter content, including:
Plant leguminous trees up-slope of your growing areas and coppice them above grazing height each year to provide more mulch (organic matter).
Return crop wastes to soil.
No tillage means organic matter can begin to feed the soils from the top down, as in nature.
Grow cover crops in between the main crops.
Integrate animals before crops are planted and after they are harvested to help convert organic matter into more soil and plant usable forms, etc.
Carry organic materials gathered elsewhere and spread them on the farm. Incorporate into the soil where possible.
Low soil life Less nutrient uptake in plants (lower nutrition), stressed plants, poor water-holding capacity, plants need more inputs for production, loss of income.
Work with the farmer to create conditions conducive to life.
Suggest ways to increase soil life, including:
Create shade from intense sun.
Mulch soil for insulation.
Ensure there is protection from rain and sun.
Encourage farmers to make composts and compost teas.
Inoculate soils with beneficial bacteria and fungi (go to native forest and get leaf duff and humus and mix under the mulch of the main crops and high-value trees.
Low soil moisture Plants go into stress, soil biology cannot function, drought stress is increased, and nutrient uptake is extremely limited.
Suggest various techniques for retaining moisture in the soil, including:
Mulch
Shade
Wind protection
Water-harvesting structures associated with plants
Soil decompaction
Crop patterns with contours of land
Low soil infiltration Not using local materials available on the farm or in the local area for fertilizer means missing out on freely available inputs that can help boost the farm’s crop production.
Walk through the farm and the surrounding area and identify with the farmer the freely available materials. Discuss their uses and then ensure the farmer knows best how to use them. Charcoal, bones, animal and bird manures, ash, shells, human urine, fish waste, fertility plants (leguminous shrubs and trees), and crop wastes can all be used to help boost soil fertility.
Soil is very hot to the touch
Soil biology is killed and its function is lost. Water does not infiltrate as well when hot.
Shade and insulate the ground, within and around plantings, with mulch, stone mulches, cover crops and shade trees.
Water infiltrates very slowly
Plant stress, soil biology not functioning, nutrient uptake inhibited and loss of food or income.
41Resilience Design Measurement Toolkit | Mercy Corps
Mer
cy C
orps
her
Coo
k/ha
tcP
hoto
grap
h: T
42Resilience Design Measurement Toolkit | Mercy Corps
Endnotes 1 A site could be a garden, a farm, a community or
watershed.
2 Some shocks are short term, others long term. Some
come unexpectedly while others are predictable. And
some are more severe while others slowly erode farmers’
ability to farm. Resilience in action. 2014. Farming First.
https://farmingfirst.org/resilience
3 FAO. 2015. Healthy soils are the basis for a healthy food production. FAO Fact Sheet. http://www.fao.org/
documents/card/en/c/645883cd-ba28-4b16-a7b8-
34babbb3c505/
4 Catley, A., Burns, J., Abebe, D., and Suji, O. 2014.
Participatory Impact Assessment: A design guide.
Somerville, Massachusetts: Feinstein International Center,
Tufts University. http://fic.tufts.edu/publication-item/
participatory-impact-assessment-a-design-guide/
5 TOPS. 2017. Farming for a profit: Technical guidance for smallholder farmer financial planning. Washington DC:
TOPS
6 Dorward, P., Shepherd, D. and Galpin, M. 2007.
Participatory farm management methods for analysis, decision making and communication. Rome, Italy: FAO.
7 Catley, A., Burns, J., Abebe, D. and Suji, O. 2014.
Participatory Impact Assessment: A design guide. Somerville, Massachusetts: Feinstein International Center,
Tufts University. http://fic.tufts.edu/publication-item/
participatory-impact-assessment-a-design-guide/
8 Burns, J. and Bogale, S. 2012. Impact assessment of honey microfinance and livestock value chain interventions: Final impact assessment of the PSNP Plus project in Sekota. Somerville, Massachusetts:
Feinstein International Center, Tufts University.
9 Adapted from: Burns, J. and Bogale, S. 2012. Impact assessment of honey microfinance and livestock value chain interventions: Final impact assessment of the PSNP Plus project in Sekota. Somerville, Massachusetts:
Feinstein International Center, Tufts University.
10 Adapted from: Burns, J. and Bogale, S. 2012. Impact assessment of honey microfinance and livestock value chain interventions: Final impact assessment of the PSNP Plus project in Sekota. Somerville, Massachusetts:
Feinstein International Center, Tufts University.
11 Adapted from: Catley, A., Burns, J., Abebe, D. and Suji, O.
2014. Participatory Impact Assessment: A design guide. Somerville, Massachusetts: Feinstein International Center,
Tufts University.
12 Catley, A., Burns, J., Abebe, D. and Suji, O. 2014.
Participatory Impact Assessment: A design guide.
Somerville, Massachusetts: Feinstein International Center,
Tufts University.
13 Catley, A., Burns, J., Abebe, D. and Suji, O. 2014.
Participatory Impact Assessment: A design guide.
Somerville, Massachusetts: Feinstein International Center,
Tufts University
Mercy Corps is a leading global organization powered by the belief that a
better world is possible. In disaster, in hardship, in more than 40 countries
around the world, we partner to put bold solutions into action — helping
people triumph over adversity and build stronger communities from within.
Now, and for the future.
Mercy Corps
45 SW Ankeny Street
Portland, Oregon 97204
888.842.0842
mercycorps.org
Contact
Sandrine Chetail
Director, Agriculture Technical Support unit
Andrea Mottram
Senior Agriculture Specialist
Related Documents