Research Article Determination of the Mechanical Properties of Rubber by FT-NIR Rattapol Pornprasit, 1 Philaiwan Pornprasit, 2 Pruet Boonma, 1 and Juggapong Natwichai 1 1 Department of Computer Engineering, Faculty of Engineering, Chiang Mai University, Chiang Mai 50200, ailand 2 Rubber and Polymer Technology Program, Faculty of Engineering and Agro-Industry, Maejo University, Chiang Mai 50290, ailand Correspondence should be addressed to Juggapong Natwichai; [email protected] Received 22 November 2015; Accepted 7 February 2016 Academic Editor: Vincenza Crupi Copyright © 2016 Rattapol Pornprasit et al. is is an open access article distributed under the Creative Commons Attribution License, which permits unrestricted use, distribution, and reproduction in any medium, provided the original work is properly cited. Mechanical tests, for example, tensile and hardness tests, are usually used to evaluate the properties of rubber materials. In this work, mechanical properties of selected rubber materials, that is, natural rubber (NR), styrene butadiene rubber (SBR), nitrile butadiene rubber (NBR), and ethylene propylene diene monomer (EPDM), were evaluated using a near infrared (NIR) spectroscopy technique. Here, NR/NBR and NR/EPDM blends were first prepared. All of the samples were then scanned using a FT-NIR spectrometer and fitted with an integration sphere working in a diffused reflectance mode. e spectra were correlated with hardness and tensile properties. Partial least square (PLS) calibration models were built from the spectra datasets with preprocessing techniques, that is, smoothing and second derivative. is indicated that reasonably accurate models, that is, with a coefficient of determination [ 2 ] of the validation greater than 0.9, could be achieved for the hardness and tensile properties of rubber materials. is study demonstrated that FT-NIR analysis can be applied to determine hardness and tensile values in rubbers and rubber blends effectively. 1. Introduction Polymers are one of the most important organic materials. Due to their excellent properties, polymers are applied in various fields ranging from everyday life products, for exam- ple, containers, coating, shoes, tires, rubber bands, and tubes, to industrial products, for example, construction parts and automotive materials [1, 2]. e demand of polymers around the world was as high as 17 million tons in 2000, and this number increased to 28.7 million tons in 2014 [3]. In order to support such high demands, the production of polymers must be efficient; thus, the speed and the reliability should be considered carefully during production. Furthermore, the measuring and monitoring methods for quality control must be implemented to aid production. Comparing natural and synthetic polyisoprene polymers, the utilization of the latter, which are obtained from fossil fuels, has been reduced due to fuel depletion. Furthermore, natural polyisoprenes have high performance properties that cannot easily be obtained with synthetic polymers. ese properties include resilience, elasticity, abrasion resistance, efficient heat dispersion, and impact resistance [4, 5]. us, natural polyisoprenes have been extensively used as raw materials for household, medical, and industrial products, such as gloves, tubes, and tires. To utilize natural polyisoprenes, detailed information regarding the polyisoprene content is required for the selec- tion of high-polyisoprene-containing lines and for deter- mination of growth conditions. Established quantification methods of natural polyisoprenes in polyisoprene-producing plants include (i) gravimetric analysis of dried latex [6], (ii) extracted polyisoprene [7], and (iii) Fourier transform infrared spectroscopy (FT-IR) and pyrolysis-gas chromatog- raphy/mass spectrometry (PyGC/MS) analysis of extracted polyisoprene [8]. e first method is the simplest. It can be carried out with a high throughput analysis; however, the accuracy of this method is not reliable because of contam- ination in the latex. Meanwhile, the second and the third Hindawi Publishing Corporation Journal of Spectroscopy Volume 2016, Article ID 4024783, 7 pages http://dx.doi.org/10.1155/2016/4024783

Welcome message from author
This document is posted to help you gain knowledge. Please leave a comment to let me know what you think about it! Share it to your friends and learn new things together.
Transcript
Research ArticleDetermination of the Mechanical Properties ofRubber by FT-NIR
Rattapol Pornprasit,1 Philaiwan Pornprasit,2 Pruet Boonma,1 and Juggapong Natwichai1
1Department of Computer Engineering, Faculty of Engineering, Chiang Mai University, Chiang Mai 50200, Thailand2Rubber and Polymer Technology Program, Faculty of Engineering and Agro-Industry, Maejo University,Chiang Mai 50290, Thailand
Correspondence should be addressed to Juggapong Natwichai; [email protected]
Received 22 November 2015; Accepted 7 February 2016
Academic Editor: Vincenza Crupi
Copyright © 2016 Rattapol Pornprasit et al. This is an open access article distributed under the Creative Commons AttributionLicense, which permits unrestricted use, distribution, and reproduction in any medium, provided the original work is properlycited.
Mechanical tests, for example, tensile and hardness tests, are usually used to evaluate the properties of rubber materials. In thiswork, mechanical properties of selected rubber materials, that is, natural rubber (NR), styrene butadiene rubber (SBR), nitrilebutadiene rubber (NBR), and ethylene propylene dienemonomer (EPDM),were evaluated using a near infrared (NIR) spectroscopytechnique. Here, NR/NBR and NR/EPDM blends were first prepared. All of the samples were then scanned using a FT-NIRspectrometer and fitted with an integration sphere working in a diffused reflectance mode. The spectra were correlated withhardness and tensile properties. Partial least square (PLS) calibrationmodels were built from the spectra datasets with preprocessingtechniques, that is, smoothing and second derivative. This indicated that reasonably accurate models, that is, with a coefficient ofdetermination [𝑅2] of the validation greater than 0.9, could be achieved for the hardness and tensile properties of rubber materials.This study demonstrated that FT-NIR analysis can be applied to determine hardness and tensile values in rubbers and rubber blendseffectively.
1. Introduction
Polymers are one of the most important organic materials.Due to their excellent properties, polymers are applied invarious fields ranging from everyday life products, for exam-ple, containers, coating, shoes, tires, rubber bands, and tubes,to industrial products, for example, construction parts andautomotive materials [1, 2]. The demand of polymers aroundthe world was as high as 17 million tons in 2000, and thisnumber increased to 28.7 million tons in 2014 [3]. In orderto support such high demands, the production of polymersmust be efficient; thus, the speed and the reliability shouldbe considered carefully during production. Furthermore, themeasuring and monitoring methods for quality control mustbe implemented to aid production.
Comparing natural and synthetic polyisoprene polymers,the utilization of the latter, which are obtained from fossilfuels, has been reduced due to fuel depletion. Furthermore,natural polyisoprenes have high performance properties that
cannot easily be obtained with synthetic polymers. Theseproperties include resilience, elasticity, abrasion resistance,efficient heat dispersion, and impact resistance [4, 5]. Thus,natural polyisoprenes have been extensively used as rawmaterials for household, medical, and industrial products,such as gloves, tubes, and tires.
To utilize natural polyisoprenes, detailed informationregarding the polyisoprene content is required for the selec-tion of high-polyisoprene-containing lines and for deter-mination of growth conditions. Established quantificationmethods of natural polyisoprenes in polyisoprene-producingplants include (i) gravimetric analysis of dried latex [6],(ii) extracted polyisoprene [7], and (iii) Fourier transforminfrared spectroscopy (FT-IR) and pyrolysis-gas chromatog-raphy/mass spectrometry (PyGC/MS) analysis of extractedpolyisoprene [8]. The first method is the simplest. It can becarried out with a high throughput analysis; however, theaccuracy of this method is not reliable because of contam-ination in the latex. Meanwhile, the second and the third
Hindawi Publishing CorporationJournal of SpectroscopyVolume 2016, Article ID 4024783, 7 pageshttp://dx.doi.org/10.1155/2016/4024783
2 Journal of Spectroscopy
methods are much more reliable, although they require moretime for the purification and extraction processes.
Near infrared (NIR) spectroscopy is a nondestructivetechnique which can provide detailed analysis in terms ofthe quantity and the quality of agricultural products [9,10]. Specifically, NIR light can cover the region from 4,000to 12,500 cm−1. The C-H, O-H, C-O, and N-H bands canbe observed due to stimulations of such vibrations in thisspectral range [9]. The NIR spectroscopy technique hasseveral attractive features including short analytical time, easeof operation, and having a diffused reflectance mode. Thus,NIR has been used widely in both laboratory scaled workand in industrial sectors for the qualitative and quantitativemeasurements of chemical components in several areas, forexample, foods [11–13], agricultural products [14], materials[15], pharmaceuticals [16, 17], and even the oil industry[18]. Generally, multivariate calibration analysis, such as apartial least square (PLS) regression model, is built to extractinformation from the rather featureless NIR spectra [19].Specifically, the model is developed from the relationshipbetween the spectral data and their interested constituents.
For rubbers, the resin and the rubber concentration inguayule were effectively evaluated by NIR [20]. In addition,NIR has been used to study the composition of syntheticpolymers and rubbers in [21–23]. Takeno et al. [8] described aFourier transformnear infrared (FT-NIR) spectroscopy tech-nique coupled with a PLS regression model to quantify natu-ral polyisoprene inEucommia ulmoides leaves. It was reportedthat the optimal model was obtained with second derivativeNIR spectra in the region between 400 and 6000 cm−1 (𝑅2,0.95). Marinho and Monteiro [23] studied the applicationof NIR spectroscopy for analyzing the natural trans- andcis-polyisoprenes from Ficus elastica (cis-1,4-polyisoprene),gutta-percha (trans-1,4-polyisoprene), and mixtures of thesepolymers. Sirisomboon et al. [24] used FT-NIR spectroscopyin the wavelength of 1100–2500 nm to evaluate the dry rubbercontent of rubber latex. Sirisomboon et al. [25] also usedshort wave NIR spectroscopy in the wavelength of 700–950 nm to evaluate the dry rubber content and the total solidscontent. Their work can be applied in a concentrated latexfactory.
To the best of our knowledge, applying NIR spectroscopyto evaluate the mechanical strength of vulcanized and rein-forced rubber, proposed in this research, has yet to be carriedout. In the process known as curing or vulcanization, sulfuris usually combinedwith rubbermaterials to accelerate cross-linkage, which increases the hardness and abrasion resistanceof the rubber materials [4, 26]. However, vulcanized rubbersmay not exhibit satisfactory results in tensile strength stiff-ness, abrasion resistance, and tear resistance [27, 28]. Theseproperties can be enhanced by filler constituents, such ascarbon black, which act as reinforcing agents for the physicalproperties of rubber materials. The reinforcement by suchfiller usually has to be carried out before the vulcanizationstep. Arroyo et al. [29] reported that a reinforcing filler affectsphysical properties. Manufacturers usually fill polymers withcarbon black particles to improve the stiffness and thetoughness of the material, to enhance their resistance to fireand ignition, or simply to reduce the cost.
Polymer blends can lead to new materials, which mayhave better properties than each individual polymer in theblend.Apolymer blend iswidely accepted in industries due tothe economy of scale [30]. Although a large number of com-binations of polymers are available, there are a few systemswhich are totally miscible. Among the miscible blends, thecombinations of natural rubber (NR)with ethylene propylenediene monomer (EPDM) and NR with nitrile butadienerubber (NBR) are widely accepted and applied [31–33]. Theblending between NR and EPDM can combine the excellentphysical properties of NR with the ozone-resistant propertiesof EPDM. A principal target application of this type of blendis pneumatic tire sidewalls [34], where ozone cracking is amain factor limiting the lifetime of pneumatic tires. As aconsequence, many usages which were dominated by NR,such as domestic appliances and weather seal profiles forvehicles, are almost entirely replaced by polymer blends.
In this paper, selected rubber materials, for example,natural rubber (NR) and some synthetic rubbers, such asstyrene butadiene rubber (SBR), nitrile butadiene rubber(NBR), and ethylene propylene diene monomer (EPDM) arecharacterized. Their mechanical strength, that is, hardnessand tensile, was analyzed by FT-NIR spectroscopy, and aPLS regression model was built as the calibration model.Subsequently, the performance of this model was tested usingthe standard error of prediction (SEP) and the root meansquare error of prediction (RMSEP).
2. Materials and Methods
The compositions used in the present study were obtainedby using roll mill equipment, according to the formulationspresented in Table 1. The preparation techniques have beendescribed elsewhere [35]. The composites were vulcanizedfor 20 minutes at 150 ± 2∘C under pressure of approximately40 kg/cm2. The reinforced materials can be obtained by mix-ing 50 parts filler (carbon black) to the vulcanized materials.The samples were in the form of slabs with a thickness ofapproximately 20.5mm. The rubber master batch was com-pounded with ingredients, for example, homogenizing agent,activators, fillers, and accelerators, using the internal mixer.The temperature of mixing was 90–120∘C.The curatives wereadded onto the two-roll mill to protect from scorching of thecompound.
Materials. NR, SBR, NBR, and EPDM used in this study weresupplied by Lucky Four Company (Nonthaburi, Thailand).All other rubber ingredients used were of commercial gradesupplied by the same company. The compounding formula-tions are given in Table 1.
Preparation of Rubber Compound. The rubber was firstmixed with a filler (carbon black: N330) in a dispersionkneader (Yong Fong Machinery Co. Ltd., Thailand) witha mixing chamber of 3 L at 80∘C for 15 minutes. ZnO,stearic acid, MBTS, and TMTD were sequentially added.The obtained mixture was then introduced to a laboratorytwo-roll mill (Yong Fong Machinery Co. Ltd., Thailand), andsulfur was added and mixed with the mixture on the mill for
Journal of Spectroscopy 3
Table 1: Percentage of constituents in the reinforced sample materials.
NR SBR NBR EPDM NR+NBR NR+EPDMConstituents phr Constituents phr Constituents phr Constituents phr Constituents phr Constituents phr
NR (raw) 100 SBR (raw) 100 NBR (raw) 100 EPDM (raw) 100 NR (raw) 80 NR (raw) 80NBR (raw) 20 EPDM (raw) 20
ZnO 5 ZnO 5 ZnO 5 ZnO 5 ZnO 5 ZnO 5Stearic acid 2 Stearic acid 2 Stearic acid 2 Stearic acid 2 Stearic acid 2 Stearic acid 2MBTS 1.5 MBTS 2 MBTS 1.5 MBTS 1.5 Sulfur 0.5 Sulfur 0.5TMTD 0.5 TMTD 0.5 TMTD 0.5 TMTD 0.5 MBTS 1.5 MBTS 1.5Sulfur 2.5 Sulfur 2.5 Sulfur 2.5 Sulfur 2.5 TMTD 0.5 TMTD 0.5Carbon black 50 Carbon black 50 Carbon black 50 Carbon black 50 Carbon black 50 Carbon black 50phr: part per hundred in rubber; MBTS: 2,2-dibenzothiazyl disulfide; TMTD: tetramethylthiuram disulfide; ZnO: zinc oxide.
approximately 15 minutes. The compound was then sheetedout and left at room temperature for at least 16 hours beforefabricating and testing.
Cure Characteristics. The cure characteristics of the com-pounds were examined according to ASTMD 5289 at testingtemperatures of 150∘C, using a moving die rheometer (MDR)(UR-2010, U-CAN Dynatex Inc., Taiwan). The minimumtorque (𝑀
𝐿), maximum torque (𝑀
𝐻), torque difference
(𝑀𝐻−𝑀𝐿), scorch time, cure time, and cure rate index (CRI)
were determined using NIR spectroscopy.NIR diffuse-reflectance spectra were collected using an
FT-NIR spectrophotometer (Bruker MPA) and processedwith BrukerOptics’ OPUS 7.0.TheNIR spectra were acquiredby an integrating sphere scanning an area with 1 cm indiameter. Sixty-four scanswere averaged per scan at a spectralresolution of 16 cm−1 between 12,500 and 3,600 cm−1. Themeasurements were carried out at room temperature (25∘C)and Bruker Optics’ OPUS software was used for spectralacquisition and instrumental control.
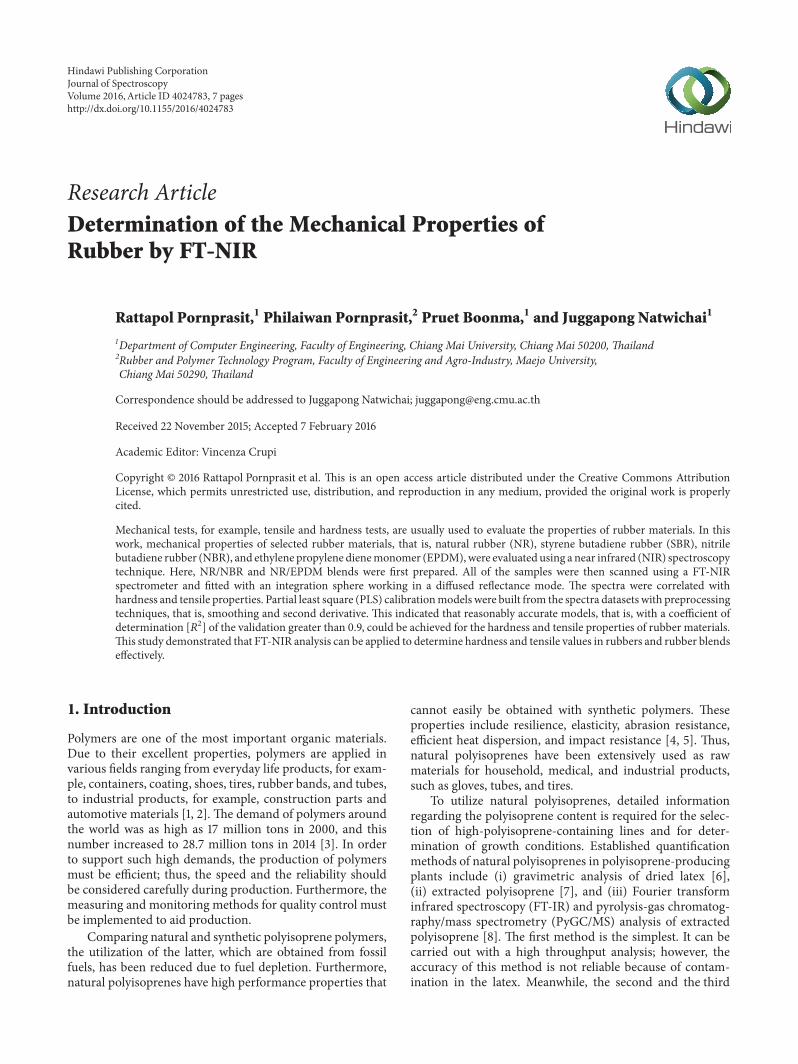
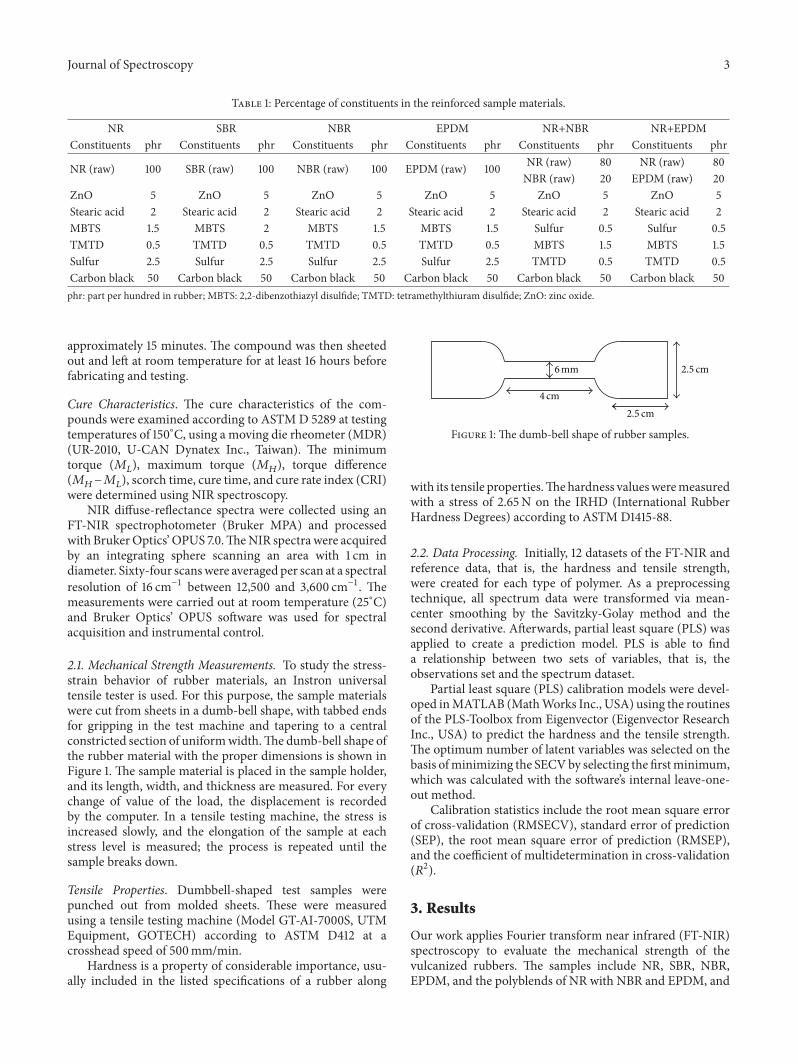
2.1. Mechanical Strength Measurements. To study the stress-strain behavior of rubber materials, an Instron universaltensile tester is used. For this purpose, the sample materialswere cut from sheets in a dumb-bell shape, with tabbed endsfor gripping in the test machine and tapering to a centralconstricted section of uniformwidth.The dumb-bell shape ofthe rubber material with the proper dimensions is shown inFigure 1. The sample material is placed in the sample holder,and its length, width, and thickness are measured. For everychange of value of the load, the displacement is recordedby the computer. In a tensile testing machine, the stress isincreased slowly, and the elongation of the sample at eachstress level is measured; the process is repeated until thesample breaks down.
Tensile Properties. Dumbbell-shaped test samples werepunched out from molded sheets. These were measuredusing a tensile testing machine (Model GT-AI-7000S, UTMEquipment, GOTECH) according to ASTM D412 at acrosshead speed of 500mm/min.
Hardness is a property of considerable importance, usu-ally included in the listed specifications of a rubber along
4 cm
6mm 2.5 cm
2.5 cm
Figure 1: The dumb-bell shape of rubber samples.
with its tensile properties.Thehardness valuesweremeasuredwith a stress of 2.65N on the IRHD (International RubberHardness Degrees) according to ASTM D1415-88.
2.2. Data Processing. Initially, 12 datasets of the FT-NIR andreference data, that is, the hardness and tensile strength,were created for each type of polymer. As a preprocessingtechnique, all spectrum data were transformed via mean-center smoothing by the Savitzky-Golay method and thesecond derivative. Afterwards, partial least square (PLS) wasapplied to create a prediction model. PLS is able to finda relationship between two sets of variables, that is, theobservations set and the spectrum dataset.
Partial least square (PLS) calibration models were devel-oped inMATLAB (MathWorks Inc., USA) using the routinesof the PLS-Toolbox from Eigenvector (Eigenvector ResearchInc., USA) to predict the hardness and the tensile strength.The optimum number of latent variables was selected on thebasis ofminimizing the SECVby selecting the firstminimum,which was calculated with the software’s internal leave-one-out method.
Calibration statistics include the root mean square errorof cross-validation (RMSECV), standard error of prediction(SEP), the root mean square error of prediction (RMSEP),and the coefficient of multidetermination in cross-validation(𝑅2).
3. Results
Our work applies Fourier transform near infrared (FT-NIR)spectroscopy to evaluate the mechanical strength of thevulcanized rubbers. The samples include NR, SBR, NBR,EPDM, and the polyblends of NR with NBR and EPDM, and
4 Journal of Spectroscopy
Table 2: Cure characteristics of the rubber compounds.
𝑀𝐿𝑀𝐻
Delta torque 𝑡𝑠𝑡𝑐90
CRI(dNm) (dNm) (dNm) (min) (min) (min−1)
NR+ 2.64 21.97 19.33 1.08 5.36 22.44SBR+ 2.18 24.95 22.77 2.48 15.00 8.19NBR+ 1.43 27.97 26.54 1.04 5.40 21.73EPDM+ 2.53 18.03 15.50 3.19 30.00 3.75NR+NBR+ 3.6 19.14 15.54 1.43 7.3 17.3NR+EPDM+ 2.86 15.42 12.56 1.55 10.23 11.81NR 0.67 8.61 7.94 5.00 12.30 13.35SBR 0.74 11.55 10.81 8.25 25.18 5.93NBR 0.46 12.56 12.10 2.40 7.17 21.69EPDM 0.92 6.90 5.98 17.24 41.57 4.07NR+NBR 0.67 5.96 5.29 3.18 8.37 18.79NR+EPDM 0.69 6.03 5.34 5.22 15.18 10.07
all of the samples were reinforced by carbon black. Note herethat the blending ratio of NR with NBR and NR with EPDMis (70/30) as suggested by [36]. From the 600 samples, 90%were assigned as the calibration set and 10% as the validationset. The rubber materials were cured in their conditions.
Table 2 shows the cure characteristics of the compoundscontaining different rubber types with unfilled and filledcarbon black.The scorch time (𝑡
𝑠) generally defines the onset
set of vulcanization at a particular temperature and thusrepresents the time limit available for processing. Cure time(𝑡𝑐90
) is the time required during the vulcanization step fora required amount of cross-linking to occur, yielding thedesired properties. Minimum torque (𝑀
𝐿) is related with
the viscosity or plasticity of the unvulcanized stock, whilemaximum torque (𝑀
𝐻) and torque difference (Delta torque)
may give an idea of the maximum extent of curing (i.e., thecross-link density).
The incorporation of carbon black increased the viscosityof rubber. Scorch time and cure time are also shorter whencarbon black loading is employed.The carbon black generatesheat buildup in the compounds under shear conditions in thekneader. When the filler is used, heat is also generated in thesystem because the compound tends to be more viscous. As aconsequence, vulcanization reactions can occur more readilyso that the viscosity increases while the scorch time and thecure time are shortened.
The minimum and maximum torques, 𝑀𝐿and 𝑀
𝐻,
and the Delta torque increase with increasing carbon blackcontent. The increase in Delta torque is in line with the well-known behavior of a viscosity increase with the addition ofcarbon black. Delta torque is generally related to the degreeof cross-linking, and hence its increase can be attributed tothe increase of the cross-link density. The decrease in thescorch time is due to the restriction of the mobility andthe deformability of the matrix with the introduction ofmechanical restraints. The increase of the cure rate indexresults from the basicity of carbon black, which acceleratesthe vulcanization reaction.The effects of carbon black loadingon rheological properties are shown in Table 3.
Table 3:The values of themechanical strength in rubber compoundsamples.
Sample Reinforced Hardness Tensile (MPa)NR + 77.15 17.59SBR + 75.36 15.4NBR + 79.74 15.29EPDM + 64.86 10.79NR+NBR + 70.22 21.19NR+EPDM + 70.4 20.99NR − 43.24 3.04SBR − 48.15 1.53NBR − 51.75 2.02EPDM − 32.7 0.58NR+NBR − 35.29 15.95NR+EPDM − 35.11 13.21
From Chough and Chang [37], the number of allylichydrogen atoms influences the cure rate of a rubber com-pound. A higher allylic hydrogen content uses a lower overallapparent activation energy of curing, thereby increasing thespeed of the cure rate. Therefore, longer scorch and curetimes are attributed to lower allylic hydrogen contents of theblended rubber compounds. Generally, statistical repeatedunits of NR and SBR have 7 and 3.3 allylic hydrogen atoms,respectively [37].
The mechanical properties of polymer-based materials,such as the deformation of the sample in terms of tensionand the depth of penetration, determine their potentialapplications through tensile and hardness tests. Table 3 showsthe results of the average of the mechanical strength ofeach sample. This table shows that the carbon black affectedthe mechanical strength in all sample types. In addition,polyblend samples show higher mechanical strengths thanthose of unfilled vulcanized rubbers. This finding mightbe attributed to good rubber-filler interactions. While theuncured rubber blended well with carbon black for a periodof time, rubber chains have a certain probability to be incontact with carbon black, causing the chains to be entangledor trapped in the voids of carbon black aggregates. Thesurfaces of carbon black particles were covered by entangledrubber chains and can be considered as physical cross-links.The physical cross-linking hinders the mobility of rubberchains and restrains the deformation of rubber; thus, 𝑀
𝐿
of filled rubber enhances even though it is in the uncuredstate. The entanglement of polymer chains with carbon blackincreases the torque; thereby, carbon black serves as physicalcross-links in rubbers. 𝑀
𝐿, the torque of melting uncured
rubbers at 150∘C, is an indicator of the degree of physicalcross-linking.
The hardness of vulcanized rubber materials is between32 and 51 in which NBR shows the highest hardness due tothe acrylonitrile component in its molecular structure, whilethe tensile strength is between 0.5 and 15MPa, with the poly-blend of NR/NBR showing the highest tensile property. Ingeneral, reinforced rubber materials show higher mechanicalstrengths than unfilled vulcanized rubbers.
Journal of Spectroscopy 5
BiasRMSEPSEP
RMSECV
R2
R2
NR+
SBR+
NBR
+
EPD
M+
NR+
NBR
+
NR+
EPD
M+
NR
SBR
NBR
EPD
M
NR+
NBR
NR+
EPD
M
−0.2
−0.1
0.00.10.20.30.40.50.60.70.80.91.0
−1.0
−0.5
0.00.51.01.52.02.53.03.54.04.55.0
Bias
, RM
SEP,
SEP,
and
RMSE
CV
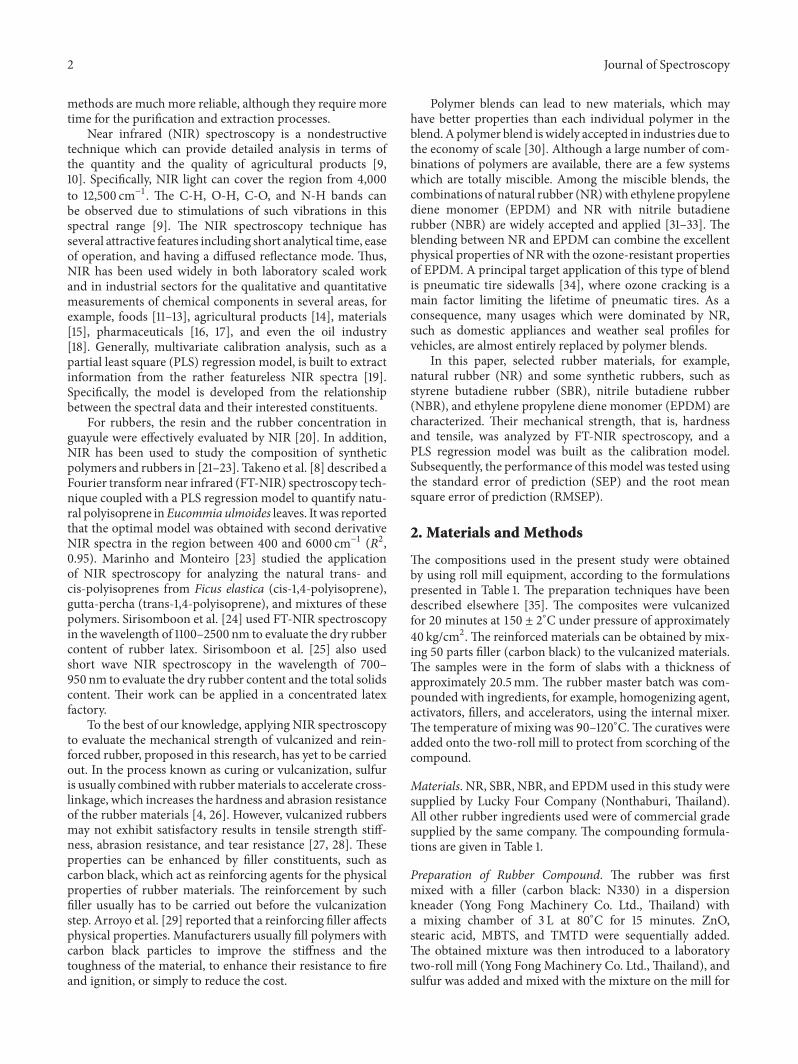
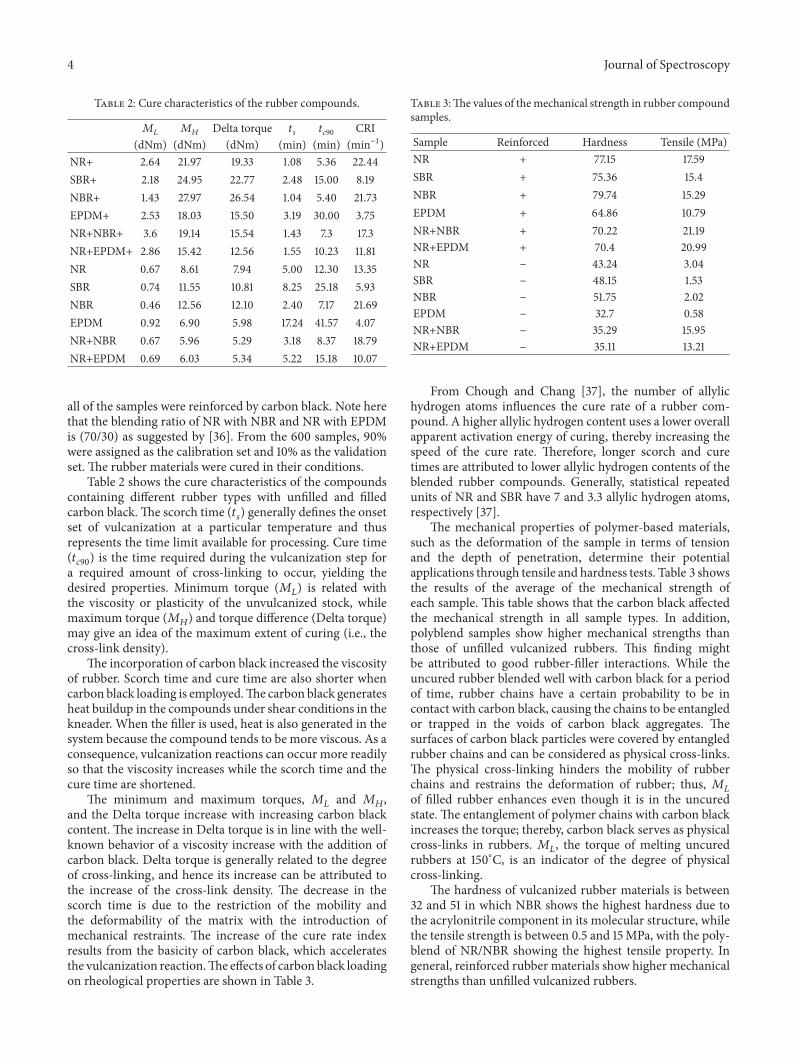
Figure 2: The calibration performance of the PLS regression forhardness.
Hardness is one of the most widely measured propertiesin rubber materials, as it is a practical way of determiningthe degree of vulcanization. The hardness represents theelasticity of the material. In Figure 2, the results showedthe performance of the PLS model for each dataset fromtheir prediction model. Overall, the models are very good,achieving high 𝑅2s between 0.88 and 0.99 and also bias well.From this figure, the dataset of the polyblend ofNRwithNBRshows high RMSECV, SEP, and RMSEP values with good 𝑅2.
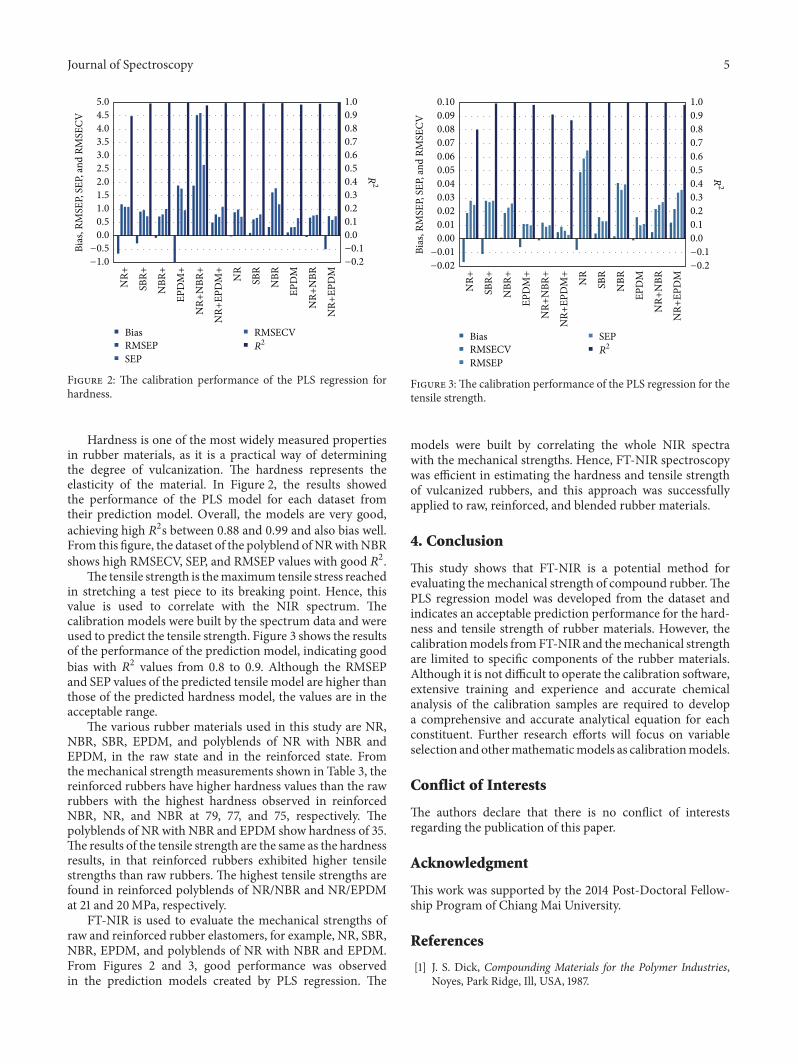
The tensile strength is themaximum tensile stress reachedin stretching a test piece to its breaking point. Hence, thisvalue is used to correlate with the NIR spectrum. Thecalibration models were built by the spectrum data and wereused to predict the tensile strength. Figure 3 shows the resultsof the performance of the prediction model, indicating goodbias with 𝑅2 values from 0.8 to 0.9. Although the RMSEPand SEP values of the predicted tensile model are higher thanthose of the predicted hardness model, the values are in theacceptable range.
The various rubber materials used in this study are NR,NBR, SBR, EPDM, and polyblends of NR with NBR andEPDM, in the raw state and in the reinforced state. Fromthe mechanical strength measurements shown in Table 3, thereinforced rubbers have higher hardness values than the rawrubbers with the highest hardness observed in reinforcedNBR, NR, and NBR at 79, 77, and 75, respectively. Thepolyblends of NR with NBR and EPDM show hardness of 35.The results of the tensile strength are the same as the hardnessresults, in that reinforced rubbers exhibited higher tensilestrengths than raw rubbers. The highest tensile strengths arefound in reinforced polyblends of NR/NBR and NR/EPDMat 21 and 20MPa, respectively.
FT-NIR is used to evaluate the mechanical strengths ofraw and reinforced rubber elastomers, for example, NR, SBR,NBR, EPDM, and polyblends of NR with NBR and EPDM.From Figures 2 and 3, good performance was observedin the prediction models created by PLS regression. The
BiasRMSECVRMSEP
SEPR2
NR+
SBR+
NBR
+
EPD
M+
NR+
NBR
+
NR+
EPD
M+
NR
SBR
NBR
EPD
M
NR+
NBR
NR+
EPD
M
R2
−0.2
−0.1
0.00.10.20.30.40.50.60.70.80.91.0
−0.02
−0.01
0.000.010.020.030.040.050.060.070.080.090.10
Bias
, RM
SEP,
SEP,
and
RMSE
CV
Figure 3:The calibration performance of the PLS regression for thetensile strength.
models were built by correlating the whole NIR spectrawith the mechanical strengths. Hence, FT-NIR spectroscopywas efficient in estimating the hardness and tensile strengthof vulcanized rubbers, and this approach was successfullyapplied to raw, reinforced, and blended rubber materials.
4. Conclusion
This study shows that FT-NIR is a potential method forevaluating themechanical strength of compound rubber.ThePLS regression model was developed from the dataset andindicates an acceptable prediction performance for the hard-ness and tensile strength of rubber materials. However, thecalibrationmodels fromFT-NIR and themechanical strengthare limited to specific components of the rubber materials.Although it is not difficult to operate the calibration software,extensive training and experience and accurate chemicalanalysis of the calibration samples are required to developa comprehensive and accurate analytical equation for eachconstituent. Further research efforts will focus on variableselection andothermathematicmodels as calibrationmodels.
Conflict of Interests
The authors declare that there is no conflict of interestsregarding the publication of this paper.
Acknowledgment
This work was supported by the 2014 Post-Doctoral Fellow-ship Program of Chiang Mai University.
References
[1] J. S. Dick, Compounding Materials for the Polymer Industries,Noyes, Park Ridge, Ill, USA, 1987.
6 Journal of Spectroscopy
[2] S. Chuayjuljit, A. Imvittaya, N. Na-Ranong, and P. Potiyaraj,“Effects of particle size and amount of carbon black and calciumcarbonate on curing characteristics and dynamic mechanicalproperties of natural rubber,” Journal of Metals, Materials andMinerals, vol. 12, no. 1, pp. 51–57, 2002.
[3] Departmentof Statistics Malaysia, “Natural Rubber statistics2015,” Report,Malaysia Rubber Board, Kuala Lumpur,Malaysia,2015, http://www.lgm.gov.my/nrstat/nrstats.pdf.
[4] M. Morton, Rubber Technology, Springer Science & BusinessMedia, Boston, Mass, USA, 2013.
[5] H. Ismail, Z. Ahmad, and Z. A. Mohd Ishak, “Comparisonof cetyltrimethylammonium maleate and sulphenamide as anaccelerator in carbon black filled natural rubber compounds,”Polymer Testing, vol. 20, no. 6, pp. 607–614, 2001.
[6] P. Suwanmanee, N. Sirinupong, and W. Suvachittanont, “Reg-ulation of the expression of 3-hydroxy-3-methylglutaryl-CoAsynthase gene in Hevea brasiliensis (B.H.K.) Mull. Arg,” PlantScience, vol. 166, no. 2, pp. 531–537, 2004.
[7] K. Cornish,M.H. Chapman, F. S. Nakayama, S. H. Vinyard, andL. C. Whitehand, “Latex quantification in guayule shrub andhomogenate,” Industrial Crops and Products, vol. 10, no. 2, pp.121–136, 1999.
[8] S. Takeno, T. Bamba, Y. Nakazawa, E. Fukusaki, A. Okazawa,and A. Kobayashi, “Quantification of trans-1,4-polyisoprenein Eucommia ulmoides by fourier transform infrared spec-troscopy and pyrolysis-gas chromatography/mass spectrome-try,” Journal of Bioscience and Bioengineering, vol. 105, no. 4, pp.355–359, 2008.
[9] P. Williams and K. Norris, Near-Infrared Technology in theAgricultural and Food Industries, American Association ofCereal Chemists, Eagan, Minn, USA, 2nd edition, 2001.
[10] P. Williams and K. Norris, Near-Infrared Technology in theAgricultural and Food Industries, American Association ofCereal Chemists, 1987.
[11] L. Nørgaard, M. T. Hahn, L. B. Knudsen, I. A. Farhat, and S. B.Engelsen, “Multivariate near-infrared andRaman spectroscopicquantifications of the crystallinity of lactose in whey permeatepowder,” International Dairy Journal, vol. 15, no. 12, pp. 1261–1270, 2005.
[12] H. Cen, Y. Bao, Y. He, and D.-W. Sun, “Visible and near infraredspectroscopy for rapid detection of citric and tartaric acids inorange juice,” Journal of Food Engineering, vol. 82, no. 2, pp. 253–260, 2007.
[13] T. Ikeda, S. Kanaya, T. Yonetani, A. Kobayashi, and E. Fukusaki,“Prediction of Japanese green tea ranking by fourier transformnear-infrared reflectance spectroscopy,” Journal of Agriculturaland Food Chemistry, vol. 55, no. 24, pp. 9908–9912, 2007.
[14] V. A. McGlone and S. Kawano, “Firmness, dry-matter andsoluble-solids assessment of postharvest kiwifruit by NIR spec-troscopy,” Postharvest Biology and Technology, vol. 13, no. 2, pp.131–141, 1998.
[15] P. J. Corish, “Analysis of cis- and trans-1:4 contents of polyiso-prenes by near infra-red spectroscopy,” SpectrochimicaActa, vol.15, pp. 598–604, 1959.
[16] C. Bodson,W.Dewe, P.Hubert, and L.Delattre, “Comparison ofFT-NIR transmission and UV-vis spectrophotometry to followthe mixing kinetics and to assay low-dose tablets containingriboflavin,” Journal of Pharmaceutical and Biomedical Analysis,vol. 41, no. 3, pp. 783–790, 2006.
[17] M. J. Barajas, A. R. Cassiani, W. Vargas et al., “Near-infraredspectroscopic method for real-time monitoring of pharmaceu-tical powders during voiding,” Applied Spectroscopy, vol. 61, no.5, pp. 490–496, 2007.
[18] M. Blanco, S. Maspoch, I. Villarroya, X. Peralta, J. M. Gonzalez,and J. Torres, “Determination of physico-chemical parame-ters for bitumens using near infrared spectroscopy,” AnalyticaChimica Acta, vol. 434, no. 1, pp. 133–141, 2001.
[19] M. P. Fuller, G. L. Ritter, and C. S. Draper, “Partial least-squaresquantitative analysis of infrared spectroscopic data. Part II.Application to detergent analysis,”Applied Spectroscopy, vol. 42,no. 2, pp. 228–236, 1988.
[20] L. T. Black, G. E. Hamerstrand, and W. F. Kwolek, “Analysis ofrubber, resin, and moisture content of guayule by near infraredreflectance spectroscopy,” Rubber Chemistry and Technology,vol. 58, no. 2, pp. 304–313, 1985.
[21] J. Guilment and L. Bokobza, “Determination of polybutadienemicrostructures and styrene-butadiene copolymers composi-tion by vibrational techniques combined with chemometrictreatment,” Vibrational Spectroscopy, vol. 26, no. 1, pp. 133–149,2001.
[22] L. Kleine and M. Foster, “Chemometric NIR calibration forguayule analysis,” in Proceedings of the 1st International Confer-ence on New Industrial Crops and Products, pp. 8–10, Riverside,Calif, USA, 1990.
[23] J. R. D. Marinho and E. E. C. Monteiro, “Analysis of natural cis-and trans-polyisoprene mixtures by near-infrared spectropho-tometry,” Polymer Testing, vol. 19, no. 6, pp. 667–672, 2000.
[24] P. Sirisomboon, A. Kaewkuptong, and P. Williams, “Feasibilitystudy on the evaluation of the dry rubber content of field andconcentrated latex of Para rubber by diffuse reflectance nearinfrared spectroscopy,” Journal of Near Infrared Spectroscopy,vol. 21, no. 2, pp. 149–156, 2013.
[25] P. Sirisomboon, M. Deeprommit, W. Suchaiboonsiri, and W.Lertsri, “Shortwave near infrared spectroscopy for determina-tion of dry rubber content and total solids content of Pararubber (Hevea brasiliensis) latex,” Journal of Near InfraredSpectroscopy, vol. 21, no. 4, pp. 269–279, 2013.
[26] A. K. Bhowmick, Rubber Products Manufacturing Technology,CRC Press, New York, NY, USA, 1994.
[27] A. R. Payne, “The dynamic properties of carbon black−loadednatural rubber vulcanizates. Part I,” Journal of Applied PolymerScience, vol. 6, pp. 57–63, 1962.
[28] O. H. Yeoh, “Characterization of elastic properties of carbon-black-filled rubber vulcanizates,” Rubber Chemistry and Tech-nology, vol. 63, no. 5, pp. 792–805, 1990.
[29] M. Arroyo, M. A. Lopez-Manchado, and B. Herrero, “Organo-montmorillonite as substitute of carbon black in natural rubbercompounds,” Polymer, vol. 44, no. 8, pp. 2447–2453, 2003.
[30] D. R. Paul, Polymer Blends, vol. 1, Elsevier, 2012.[31] M. H. Walters and D. N. Keyte, “Heterogeneous structure in
blends of rubber polymers,” Rubber Chemistry and Technology,vol. 38, no. 1, pp. 62–75, 1965.
[32] M. Xanthos and S. Dagli, “Compatibilization of polymer blendsby reactive processing,” Polymer Engineering & Science, vol. 31,pp. 929–935, 1991.
[33] L. Yu, K. Dean, and L. Li, “Polymer blends and composites fromrenewable resources,” Progress in Polymer Science, vol. 31, no. 6,pp. 576–602, 2006.
[34] A. Tinker and K. Jones, UNCFC-In Blends of Natural Rubber,United Nations Common Fund for Commodities, 1998.

Journal of Spectroscopy 7
[35] S. E. Gwaily, G. M. Nasr, M. M. Badawy, and H. H. Hassan,“Thermal properties of ceramic-loaded conductive butyl rubbercomposites,” Polymer Degradation and Stability, vol. 47, no. 3,pp. 391–395, 1995.
[36] J. Clarke, B. Clarke, P. K. Freakley, and I. Sutherland, “Com-patibilising effect of carbon black on morphology of NR-NBR blends,” Plastics, Rubber and Composites Processing andApplications, vol. 30, no. 1, pp. 39–44, 2001.
[37] S.-H. Chough and D.-H. Chang, “Kinetics of sulfur vulcaniza-tion of NR, BR, SBR, and their blends using a rheometer andDSC,” Journal of Applied Polymer Science, vol. 61, no. 3, pp. 449–454, 1996.

Submit your manuscripts athttp://www.hindawi.com
Hindawi Publishing Corporationhttp://www.hindawi.com Volume 2014
Inorganic ChemistryInternational Journal of
Hindawi Publishing Corporation http://www.hindawi.com Volume 2014
International Journal ofPhotoenergy
Hindawi Publishing Corporationhttp://www.hindawi.com Volume 2014
Carbohydrate Chemistry
International Journal of
Hindawi Publishing Corporationhttp://www.hindawi.com Volume 2014
Journal of
Chemistry
Hindawi Publishing Corporationhttp://www.hindawi.com Volume 2014
Advances in
Physical Chemistry
Hindawi Publishing Corporationhttp://www.hindawi.com
Analytical Methods in Chemistry
Journal of
Volume 2014
Bioinorganic Chemistry and ApplicationsHindawi Publishing Corporationhttp://www.hindawi.com Volume 2014
SpectroscopyInternational Journal of
Hindawi Publishing Corporationhttp://www.hindawi.com Volume 2014
The Scientific World JournalHindawi Publishing Corporation http://www.hindawi.com Volume 2014
Medicinal ChemistryInternational Journal of
Hindawi Publishing Corporationhttp://www.hindawi.com Volume 2014
Chromatography Research International
Hindawi Publishing Corporationhttp://www.hindawi.com Volume 2014
Applied ChemistryJournal of
Hindawi Publishing Corporationhttp://www.hindawi.com Volume 2014
Hindawi Publishing Corporationhttp://www.hindawi.com Volume 2014
Theoretical ChemistryJournal of
Hindawi Publishing Corporationhttp://www.hindawi.com Volume 2014
Journal of
Spectroscopy
Analytical ChemistryInternational Journal of
Hindawi Publishing Corporationhttp://www.hindawi.com Volume 2014
Journal of
Hindawi Publishing Corporationhttp://www.hindawi.com Volume 2014
Quantum Chemistry
Hindawi Publishing Corporationhttp://www.hindawi.com Volume 2014
Organic Chemistry International
ElectrochemistryInternational Journal of
Hindawi Publishing Corporation http://www.hindawi.com Volume 2014
Hindawi Publishing Corporationhttp://www.hindawi.com Volume 2014
CatalystsJournal of
Related Documents