Insert Division/Sub heading/Date/etc. Delete this text box if not needed. delwp.vic.gov.au Report on 2017-18 Council Budgets Analysis by Local Government Victoria

Welcome message from author
This document is posted to help you gain knowledge. Please leave a comment to let me know what you think about it! Share it to your friends and learn new things together.
Transcript
Insert Division/Sub heading/Date/etc. Delete this text box if not needed.
delwp.vic.gov.au
Report on 2017-18 Council Budgets
Analysis by Local Government Victoria

AuthorLocal Government Victoria
Photo credit“532,195”, by Local Government Victoria.
Report on 2017-18 Council Budgets................................................................................2Executive summary....................................................................................................................................... 2
Analysis..............................................................................................................................3Revenue.......................................................................................................................................................... 3
Rates and Charges...................................................................................................................................... 4Grants........................................................................................................................................................... 9
Expenditure.................................................................................................................................................. 11Capital Works............................................................................................................................................ 12Staff expenditure....................................................................................................................................... 14
Financial performance and position..........................................................................................................15
Cash and debt.............................................................................................................................................. 16
Appendices 18
Appendix A Council Cohorts....................................................................................20
Contents
Report on 2017-18 Council BudgetsAnalysis by Local Government Victoria
1
Section 127 of the Local Government Act 1989 (the Act) requires that councils prepare a budget for each financial year that contains financial statements, a description of the services and initiatives to be funded, and information about rates and charges.1 The budget is council’s key resource planning document for the next financial year (short term), and commonly includes forecasts for the next four financial years from the strategic resource plan (medium term).
Executive summaryEach year Victorian councils must develop a proposed budget for consideration by their community.2 After complying with the relevant legislative requirements, including giving public notice and considering any submissions on the proposed budget, a council may adopt their budget.3
Local Government Victoria (LGV) have reviewed and analysed the information available in the 79 adopted council budgets for 2017-18. Collectively, these documents set out the budgeted financial performance and position of the sector for the next financial year. Key points are:
Collectively, Victorian councils are budgeting to generate an operating surplus of $1.3 billion in 2017-18;
The sector is budgeting to hold cash and investments worth $3.3 billion and have borrowings of $1.29 billion as at 30 June 2018;
Sector-wide capital works expenditure of $2.8 billion is budgeted for 2017-18;
Councils are budgeting to employ 36,213 full time equivalent staff members at 30 June 2018;
The average general rate increase publicised by councils for the 2017-18 year is 2.1% (2.6% in 2016-17); and
Several councils sought to restructure their rates and charges revenue for 2017-18 and some faced considerable community reaction against the changes proposed.
The analysis presented separates the 79 councils into groupings based on size and geographic location. These cohort groups are as follows: Metropolitan Councils, Interface Councils, Regional Cities, Large Shires and Small Shires. These groupings are consistent with the Know Your Council website groupings.
A list of council cohorts and their membership is attached at Appendix A.
1 .For 2017-18, the due date for adoption of council budgets was extended from 30 June to 31 August 2017. Section 130 of the Local Government Act 1989 requires all councils to submit a copy of the budget, or revised budget, to the Minister for Local Government within 28 days of adopting the budget.
2 .Section 127 of the Local Government Act 19893 .Section 130(1) of the Local Government Act 1989
Report on 2017-18 Council Budgets
2 Report on 2017-18 Council BudgetsAnalysis by Local Government Victoria
AnalysisThe analysis contained in this report is based on data extracted from the 2017-18 Council Adopted Budgets. At times, the analysis has been supplemented with data from the 2017-18 Strategic Resource Plans (SRP), which contain medium term (four year) budget intentions of councils.
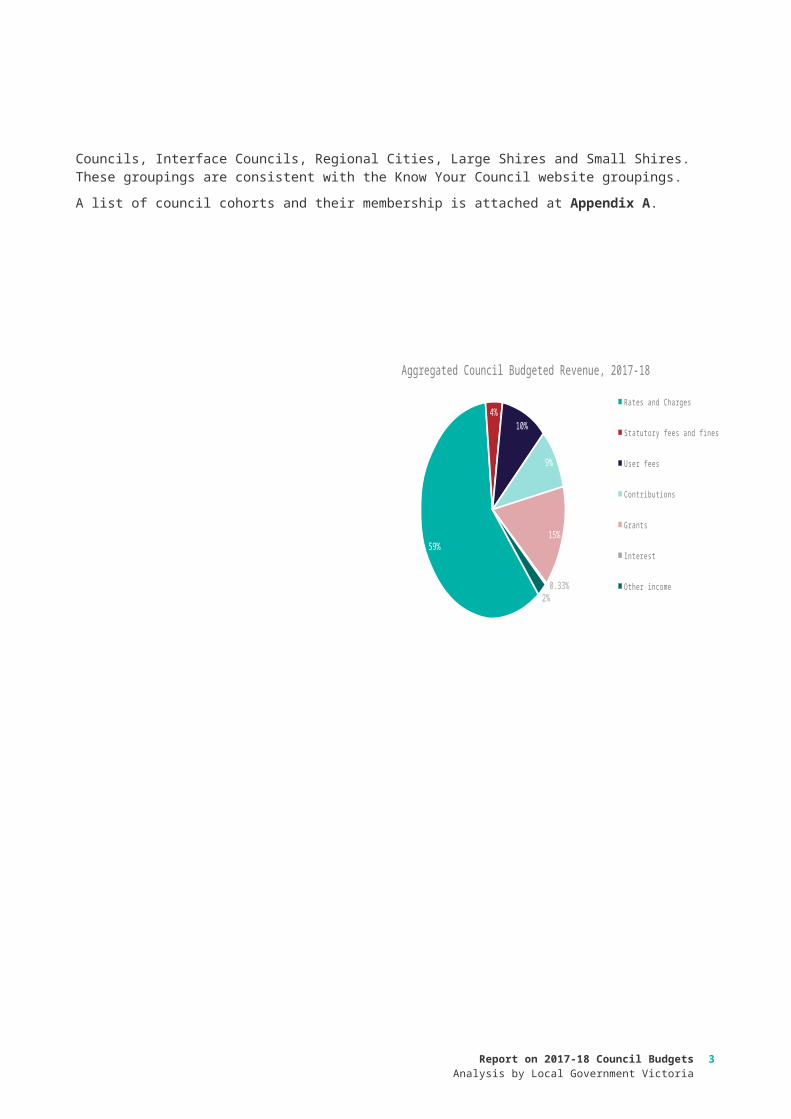
RevenueCouncils are budgeting for total revenue of $9.57 billion in 2017-18. This consists mostly of rates and charges ($5.6 billion or 59%) and grants ($1.47 billion or 15%). User fees and contributions are also key sources of income for councils, accounting for 11% and 9% of forecast total income, respectively.
The composition of revenue varies significantly between cohorts, which distorts the overall sector result. For example, interface councils receive 22% of their income through developer contributions which significantly increases the sector result.
Within council cohorts there can be significant variability in the amount of total income forecast by each individual council. The small shire with the highest forecast income is Hepburn Shire council ($32.9 million), about 2.5 times the size of the Borough of Queenscliffe ($13.5 million), the small shire with the lowest forecast income.
The variability of forecast income between interface councils is significant. Wyndham City Council’s forecast income ($491 million) is almost six times the lowest forecast income within the cohort, belonging to Nillumbik Shire Council ($86.8 million).
More than half of interface councils are expecting more income than every metropolitan council in the 2017-18 financial year, except for Melbourne City Council. Despite the large income size of these interface councils, there are also interface councils that have a similar amount of income to large shires and regional cities.
There is also significant variability within the Regional City council cohort.
Adopted Budget 2016-17
Forecast Actual
2016-17
Adopted Budget 2017-18
2017-18 SRP for 2018-19
2017-18 SRP for 2019-20
2017-18 SRP for 2020-21
0
100000000
200000000
300000000
400000000
500000000
600000000
Income forecast by Interface Councils, 2016-17 to 2020-21
Cardinia Shire Council Interface Council
Casey City Council Interface Council
Hume City Council Interface Council
Melton City Council Interface Council
Mornington Peninsula Shire Council Interface Council
Nillumbik Shire Council Interface Council
Whittlesea City Council Interface Council
Wyndham City Council Interface Council
Yarra Ranges Shire Council Interface Council
59%
4%10%
9%
15%
0.33%2%
Aggregated Council Budgeted Revenue, 2017-18
Rates and Charges Statutory fees and fines
User fees Contributions
Grants Interest
Other income
Report on 2017-18 Council BudgetsAnalysis by Local Government Victoria
3
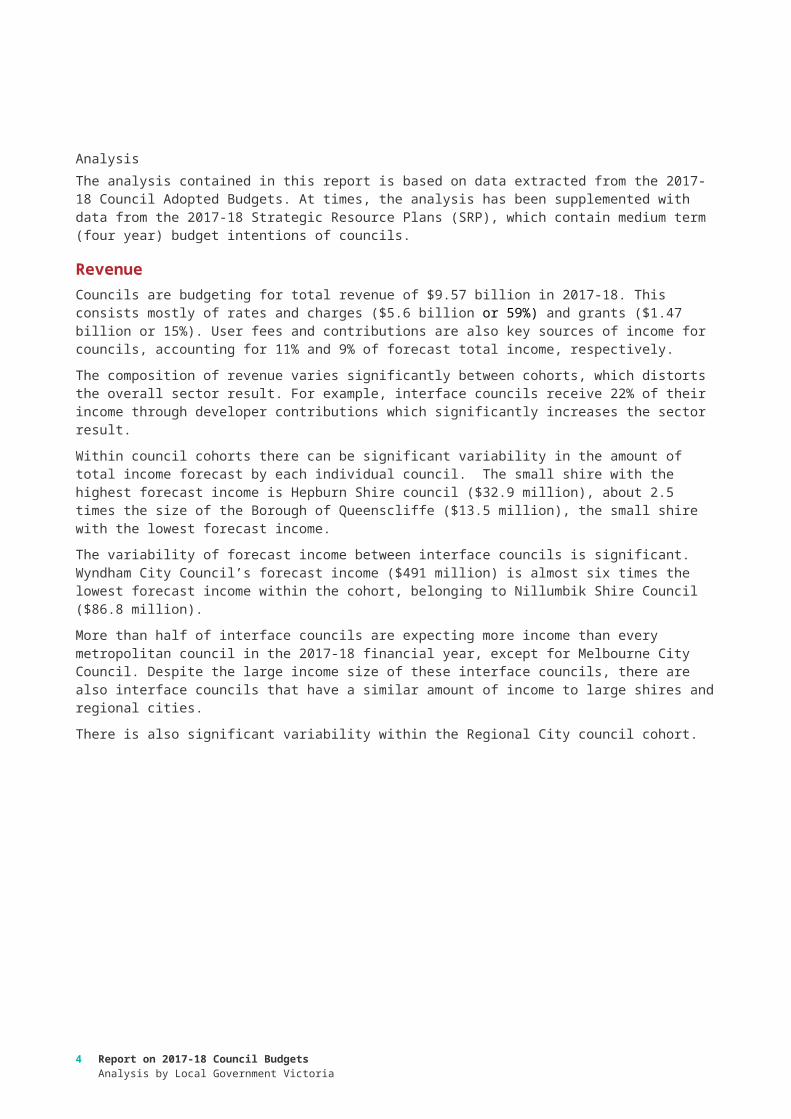
The graph on the previous page shows the variability of size and growth of forecast income by individual interface councils. It highlights the rapid growth and change in outer suburban Melbourne. This variability also demonstrates the different revenue raising opportunities available to councils.
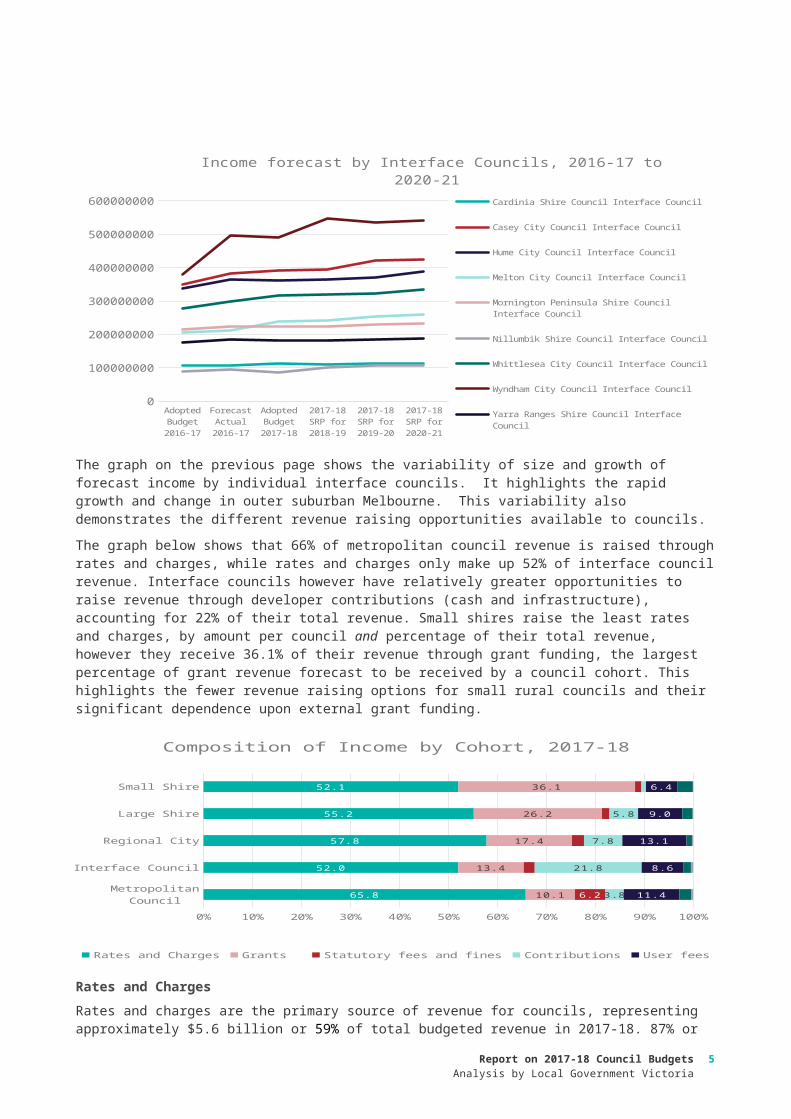
The graph below shows that 66% of metropolitan council revenue is raised through rates and charges, while rates and charges only make up 52% of interface council revenue. Interface councils however have relatively greater opportunities to raise revenue through developer contributions (cash and infrastructure), accounting for 22% of their total revenue. Small shires raise the least rates and charges, by amount per council and percentage of their total revenue, however they receive 36.1% of their revenue through grant funding, the largest percentage of grant revenue forecast to be received by a council cohort. This highlights the fewer revenue raising options for small rural councils and their significant dependence upon external grant funding.
Metropolitan Council
Interface Council
Regional City
Large Shire
Small Shire
0% 10% 20% 30% 40% 50% 60% 70% 80% 90% 100%
65.8
52.0
57.8
55.2
52.1
10.1
13.4
17.4
26.2
36.1
6.2 3.8
21.8
7.8
5.8
11.4
8.6
13.1
9.0
6.4
Composition of Income by Cohort, 2017-18
Rates and Charges Grants Statutory fees and fines Contributions User fees Other income Interest
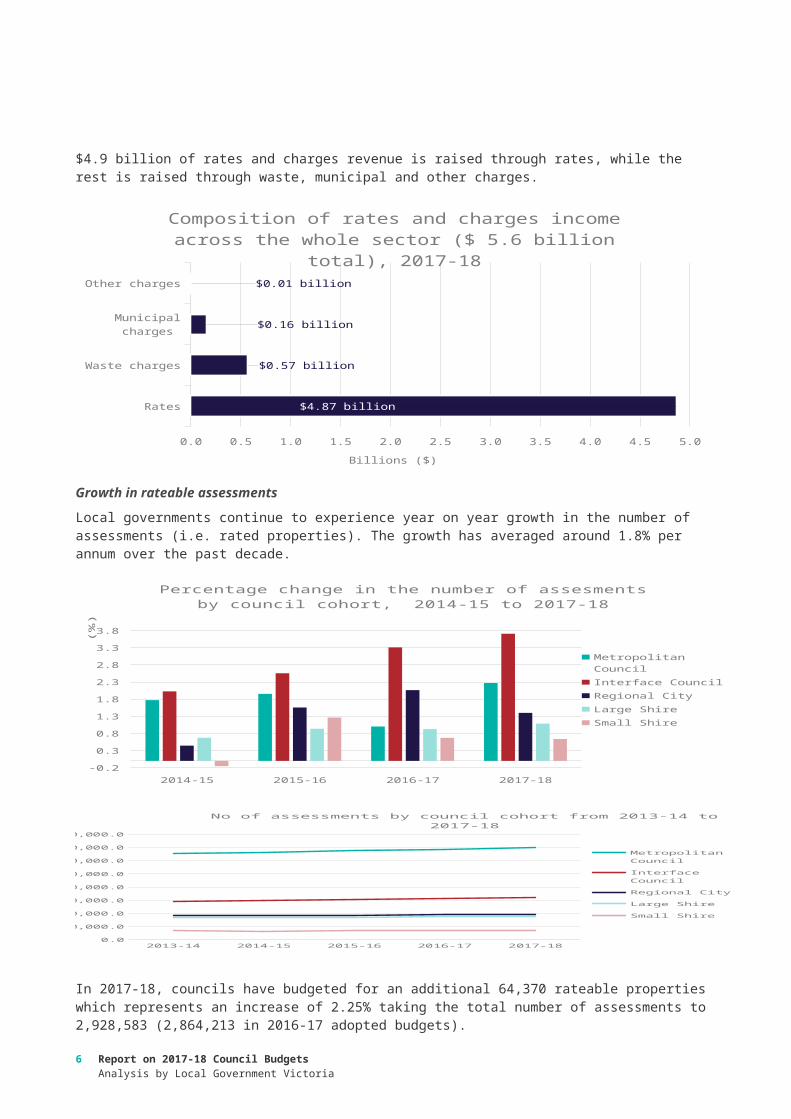
Rates and Charges Rates and charges are the primary source of revenue for councils, representing approximately $5.6 billion or 59% of total budgeted revenue in 2017-18. 87% or $4.9 billion of rates and charges revenue is raised through rates, while the rest is raised through waste, municipal and other charges.
Rates
Waste charges
Municipal charges
Other charges
0.0 0.5 1.0 1.5 2.0 2.5 3.0 3.5 4.0 4.5 5.0
$4.87 billion
$0.57 billion
$0.16 billion
$0.01 billion
Composition of rates and charges income across the whole sector ($ 5.6 billion total), 2017-18
Billions ($)
Growth in rateable assessmentsLocal governments continue to experience year on year growth in the number of assessments (i.e. rated properties). The growth has averaged around 1.8% per annum over the past decade.
4 Report on 2017-18 Council BudgetsAnalysis by Local Government Victoria
2014-15 2015-16 2016-17 2017-18-0.2
0.3
0.8
1.3
1.8
2.3
2.8
3.3
3.8
Percentage change in the number of assesments by council cohort, 2014-15 to 2017-18
Metropolitan Council
Interface Council
Regional City
Large Shire
Small Shire
(%)
2013-14 2014-15 2015-16 2016-17 2017-180.0
200,000.0
400,000.0
600,000.0
800,000.0
1,000,000.0
1,200,000.0
1,400,000.0
1,600,000.0
No of assessments by council cohort from 2013-14 to 2017-18
Metropolitan Council
Interface Council
Regional City
Large Shire
Small Shire
In 2017-18, councils have budgeted for an additional 64,370 rateable properties which represents an increase of 2.25% taking the total number of assessments to 2,928,583 (2,864,213 in 2016-17 adopted budgets).
The average growth in local government assessments is consistent with Victoria’s population growth between 2006 and 2016, which also averaged an increase of 1.8% per annum.
2007 2008 2009 2010 2011 2012r 2013r 2014r 2015r 2016p-0.5
0.0
0.5
1.0
1.5
2.0
2.5
3.0
3.5
4.0
Change in population, 2007 to 2016
Metropolitan Council Interface Council Regional CityLarge Shire Small Shire
(%)
Interface councils have consistently seen the largest growth in their population during the last ten years, while small shires are the only council cohort to see a decline in population over the same period. This demonstrates how the rate of population growth in the past decade has been most concentrated in the interface councils, and the challenge of declining and aging populations for small rural shires.
Total rates and charges increasesThe increase in the total rates and charges income for the 79 Council’s is 4.1% (4.6% in 2016-17), for a budgeted total amount of $5.6 billion. The combined pool includes general rates, municipal charges, garbage charges, supplementary rates and rates in lieu.
Over the past two years the difference between the increase in the rate cap and the increase in the total rates and charges income pool has been approximately 2.0%. This variance is caused by the natural growth
Report on 2017-18 Council BudgetsAnalysis by Local Government Victoria
5
in the rate base (driven by population growth) and the increase in charges not subject to the rate cap, mainly waste charges, which have been higher than both the rate cap increases and the equivalent CPI increases.
Fair Go Rates System and publicised rate risesThe average general rate increase by councils for the 2017-18 year is 2.1% (2.6% in 2016-17). This is marginally above the rate cap of 2.0%. The higher average amount above the 2017-18 rate cap is caused by the four rate cap variations approved by the Essential Services Commission (ESC), partially offset by another four councils who chose to declare rate increases lower than the cap amount.
For the 2017-18 financial year, four councils made successful applications to the ESC for a variation to the rate cap. These vary between single year and multiple year applications as follows:
• Hindmarsh Shire Council (2017-18: 4%);
• Pyrenees Shire Council (2017-18: 3.5%, 2018-19: 3.5%);
• Towong Shire Council (2017-18: 5.55%, 2018-19: 5.55%, 2019-20: 5.55%, 2020-21: 5.55%); and
• West Wimmera Shire Council (2017-18: 3.5%, 2018-19: 3.5%, 2019-20: 3.5%, 2020-21: 3.5%).
The Borough of Queenscliffe’s application for a 4.5% increase was not approved.
Alpine Shire Council (1.90%), Colac Otway Shire Council (0.63%), Moreland City Council (1.60%) and Nillumbik Shire Council (0.00%) chose to declare rate increases lower than the 2.00% rate cap in 2017-18.
The remaining 71 councils declared a rate rise of 2.0%, in line with the rate cap.
Moorabool Shire, Northern Grampians Shire and Wellington Shire were found to be non-compliant with the Fair Go Rates System (FGRS) rate cap by the ESC. Based on explanations provided by these councils, and commitments to prevent reoccurrence, the ESC do not consider that there are any systemic causes for concern.
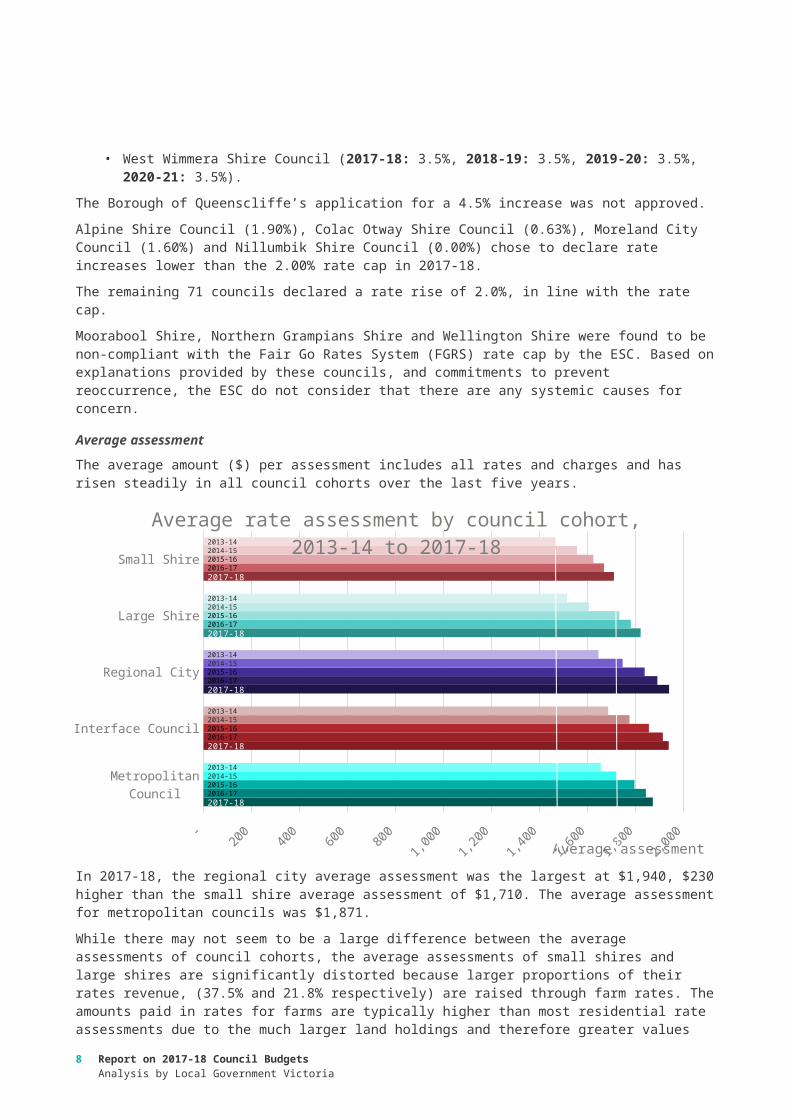
Average assessmentThe average amount ($) per assessment includes all rates and charges and has risen steadily in all council cohorts over the last five years.
Metropolitan Council
Interface Council
Regional City
Large Shire
Small Shire
- 200 400 600 800 1,000 1,200 1,400 1,600 1,800 2,000
2017-18
2017-18
2017-18
2017-18
2017-18
2016-17
2016-17
2016-17
2016-17
2016-17
2015-16
2015-16
2015-16
2015-16
2015-16
2014-15
2014-15
2014-15
2014-15
2014-15
2013-14
2013-14
2013-14
2013-14
2013-14
Average rate assessment by council cohort, 2013-14 to 2017-18
Average assessment ($)
6 Report on 2017-18 Council BudgetsAnalysis by Local Government Victoria

In 2017-18, the regional city average assessment was the largest at $1,940, $230 higher than the small shire average assessment of $1,710. The average assessment for metropolitan councils was $1,871.
While there may not seem to be a large difference between the average assessments of council cohorts, the average assessments of small shires and large shires are significantly distorted because larger proportions of their rates revenue, (37.5% and 21.8% respectively) are raised through farm rates. The amounts paid in rates for farms are typically higher than most residential rate assessments due to the much larger land holdings and therefore greater values compared to residential assessments, notwithstanding the widespread use of differential rates to affect a discount for farm assessments.
It is also important to note that the average assessment is impacted by population. For example, the relatively high average assessment for rural and regional councils highlights the smaller population (and number of assessments) base in rural and regional areas and a limited range of income sources. By comparison, the average assessments in metropolitan and interface cohorts are positively impacted by total rates being distributed across a larger population base and often access to revenue streams other than rates.
The largest increase in the average assessment was between the years 2014-15 and 2015-16 in the large shire (7.9%) council cohort, the year before the implementation of the Fair Go Rates System (FGRS) implementation.
2013-14 2014-15 2015-16 2016-17 2017-18 1,400
1,500
1,600
1,700
1,800
1,900
2,000
Average assessment by council cohort, 2013-14 to 2017-18
Metropolitan Council Interface Council Regional CityLarge Shire Small Shire
($)
FGRS implement-ation
Post implementation of the FGRS, the year on year increase of the average assessment has significantly decreased for all council cohorts, showing the effect of the rate cap.
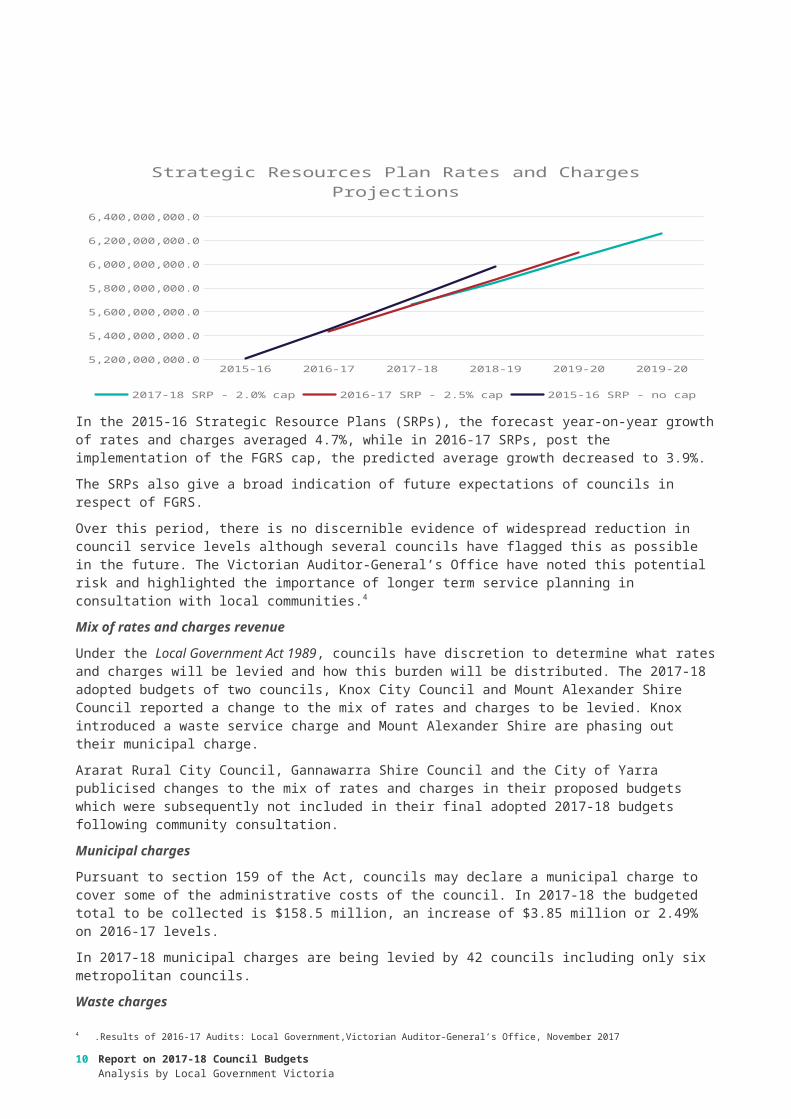
The following graph demonstrates that in the forward projections of councils since implementation of the FGRS there is a trend of lower growth in forecast income from rates and charges. The 2015-16 (prior to cap) projections are shown to show the difference.
Report on 2017-18 Council BudgetsAnalysis by Local Government Victoria
7
2015-16 2016-17 2017-18 2018-19 2019-20 2019-205,200,000,000.0
5,400,000,000.0
5,600,000,000.0
5,800,000,000.0
6,000,000,000.0
6,200,000,000.0
6,400,000,000.0
Strategic Resources Plan Rates and Charges Projec-tions
2017-18 SRP - 2.0% cap 2016-17 SRP - 2.5% cap 2015-16 SRP - no cap
In the 2015-16 Strategic Resource Plans (SRPs), the forecast year-on-year growth of rates and charges averaged 4.7%, while in 2016-17 SRPs, post the implementation of the FGRS cap, the predicted average growth decreased to 3.9%.
The SRPs also give a broad indication of future expectations of councils in respect of FGRS.
Over this period, there is no discernible evidence of widespread reduction in council service levels although several councils have flagged this as possible in the future. The Victorian Auditor-General’s Office have noted this potential risk and highlighted the importance of longer term service planning in consultation with local communities.4
Mix of rates and charges revenue
Under the Local Government Act 1989, councils have discretion to determine what rates and charges will be levied and how this burden will be distributed. The 2017-18 adopted budgets of two councils, Knox City Council and Mount Alexander Shire Council reported a change to the mix of rates and charges to be levied. Knox introduced a waste service charge and Mount Alexander Shire are phasing out their municipal charge.
Ararat Rural City Council, Gannawarra Shire Council and the City of Yarra publicised changes to the mix of rates and charges in their proposed budgets which were subsequently not included in their final adopted 2017-18 budgets following community consultation.
Municipal charges
Pursuant to section 159 of the Act, councils may declare a municipal charge to cover some of the administrative costs of the council. In 2017-18 the budgeted total to be collected is $158.5 million, an increase of $3.85 million or 2.49% on 2016-17 levels.
In 2017-18 municipal charges are being levied by 42 councils including only six metropolitan councils.
Waste charges
Section 162 of the Act allows councils to raise service rates and charges. Service charges are most commonly raised in relation to waste services. Service charges are not currently subject to the rate cap. Across the sector there is a great diversity in waste service charges. Councils commonly provide services to individual properties such as garbage, recycling and green waste collection.
Councils that do not levy a separate waste charge:
Banyule City Council;
Maribyrnong City Council;
4 .Results of 2016-17 Audits: Local Government,Victorian Auditor-General’s Office, November 2017
8 Report on 2017-18 Council BudgetsAnalysis by Local Government Victoria

Melbourne City Council;
Monash City Council;
Whitehorse City Council;
Whittlesea City Council; and
Yarra City Council.
Separate waste charges are levied by 72 of the 79 Councils. This effectively means that the waste services provided by the remaining seven councils are funded by general rates.
The increase in budgeted waste charges revenue over the last three years has been substantially higher than both budgeted general rates revenue and consumer price index increases, with a 9.4% increase in 2015-16, 9.6% in 2016-17 and 5.7% in 2017-18.
A portion of the larger than normal increases in 2015-16 and 2016-17 can be attributed to councils realigning their rating structures to ensure that waste charges are reflecting the actual cost of the service. Some councils made one-off increases in their waste charges to ensure that the charge reflected the cost of the service. In some instances, part of the cost of the service had historically been funded from general rate revenue. Increased landfill levies over the past few years have increased this upward pressure on costs also, translating into waste charge increases.
An emerging feature of waste services provided by councils is the capacity to select from a range of service options. Due to the multiple combinations available, any analysis of year on year increases must recognise that additional revenue can also be the result of a request for additional services.
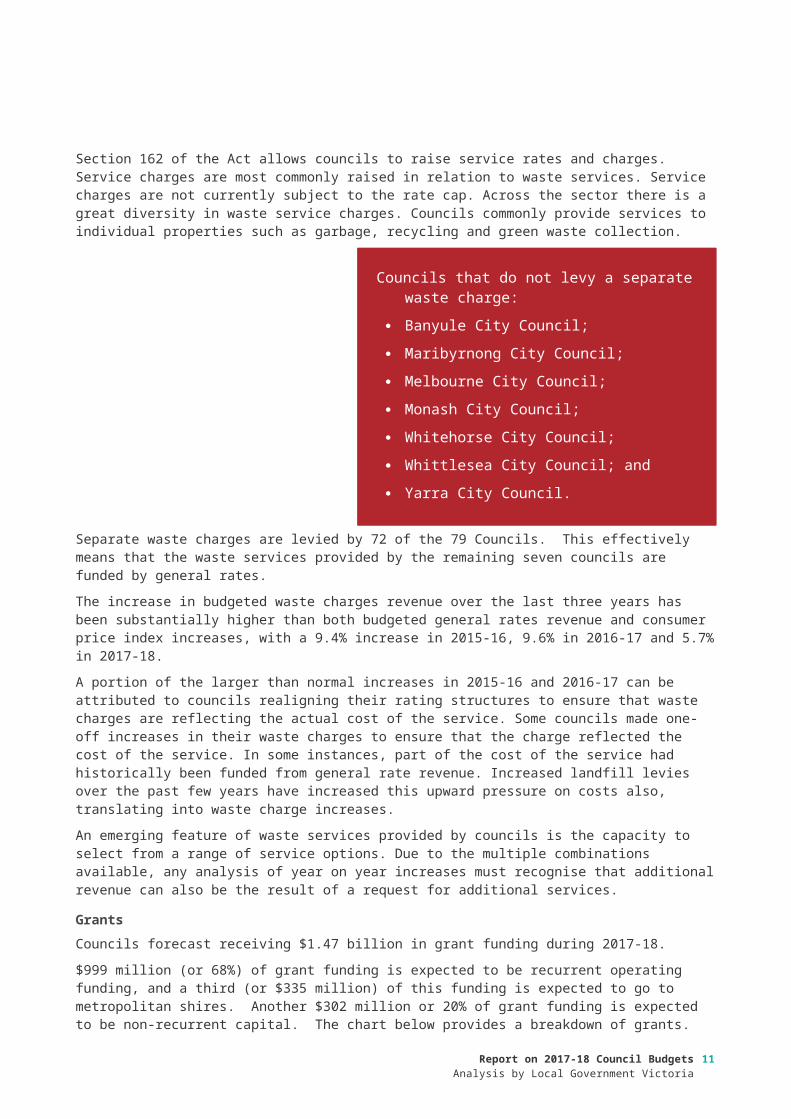
GrantsCouncils forecast receiving $1.47 billion in grant funding during 2017-18.
$999 million (or 68%) of grant funding is expected to be recurrent operating funding, and a third (or $335 million) of this funding is expected to go to metropolitan shires. Another $302 million or 20% of grant funding is expected to be non-recurrent capital. The chart below provides a breakdown of grants.
Report on 2017-18 Council BudgetsAnalysis by Local Government Victoria
9
10 Report on 2017-18 Council BudgetsAnalysis by Local Government Victoria
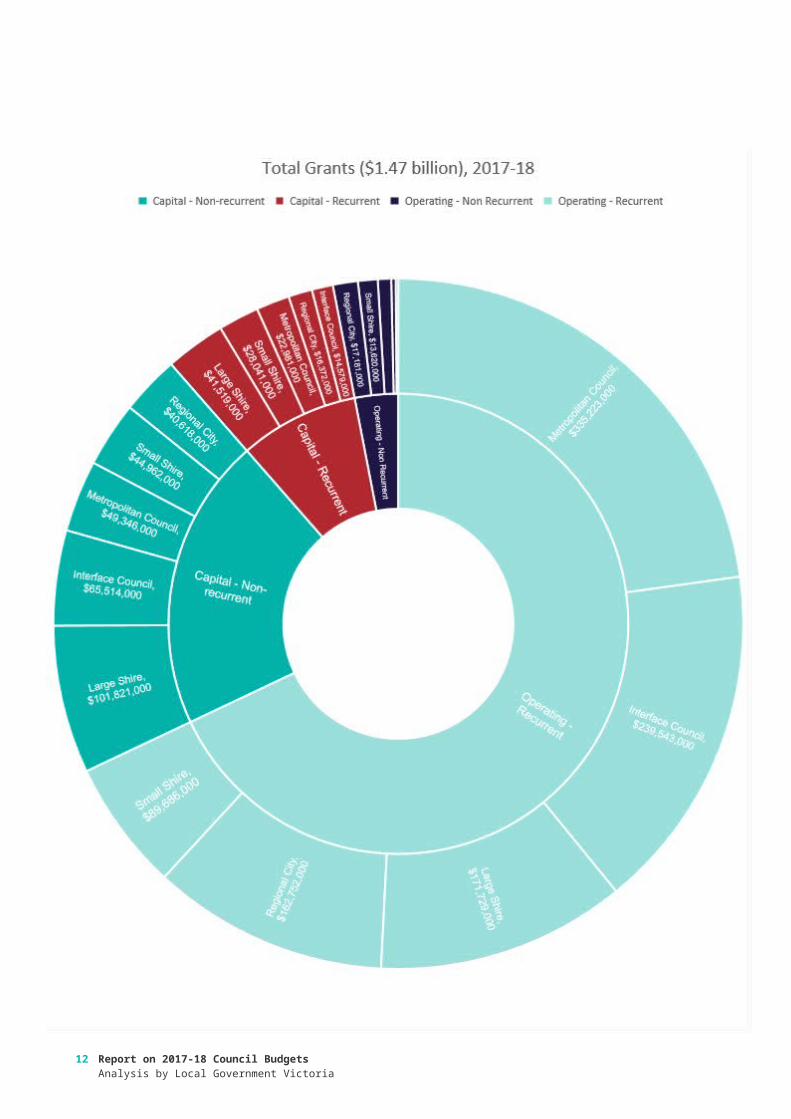
ExpenditureCouncils are budgeting for total expenditure of $8.20 billion in 2017-18. This consists mostly of employee costs ($3.47 billion or 42%) and materials and services ($2.97 billion or 36%). The graph below shows the main expenditure budgeted by councils.
Another significant expenditure item is depreciation. Depreciation is the allocation of the cost of an asset over its useful life and reflects the pattern of consumption of the asset (i.e. wear and tear) over time. Depreciation is a significant expense of local government due to the asset intensive nature of the sector, particularly in relation to the management of fixed assets such as roads, bridges, drains and buildings.
Forecast Ac-tual 2016-17
Adopted Budget 2017-
18
2017-18 SRP for 2018-19
2017-18 SRP for 2019-20
2017-18 SRP for 2020-21
0.0
500,000,000.0
1,000,000,000.0
1,500,000,000.0
2,000,000,000.0
2,500,000,000.0
3,000,000,000.0
3,500,000,000.0
4,000,000,000.0
Total expenditure, forecasted to 2020-21
Asset Write Offs
Bad and doubtful debts
Borrowing costs
Depreciation and amortisation
Employee costs
Materials and services
Other expenses
Expenditure is forecast to increase at a steady rate over the next four years, with the highest increases being depreciation and amortisation, growing at an average of 3.7% per year over the next four years, and employee costs, growing at an average of 3.4% per year over the next four years.
Metropolitan Council
Interface Council
Regional City
Large Shire
Small Shire
0% 10% 20% 30% 40% 50% 60% 70% 80% 90% 100%
$563,097,000
$297,245,000
$237,013,000
$238,946,000
$113,335,000
Council expenditure by type and cohort, 2017-18 (depreciation highlight)
Asset Write Offs Bad and doubtful debts Borrowing costs Depreciation and amortisation
Employee costs Materials and services Other expenses
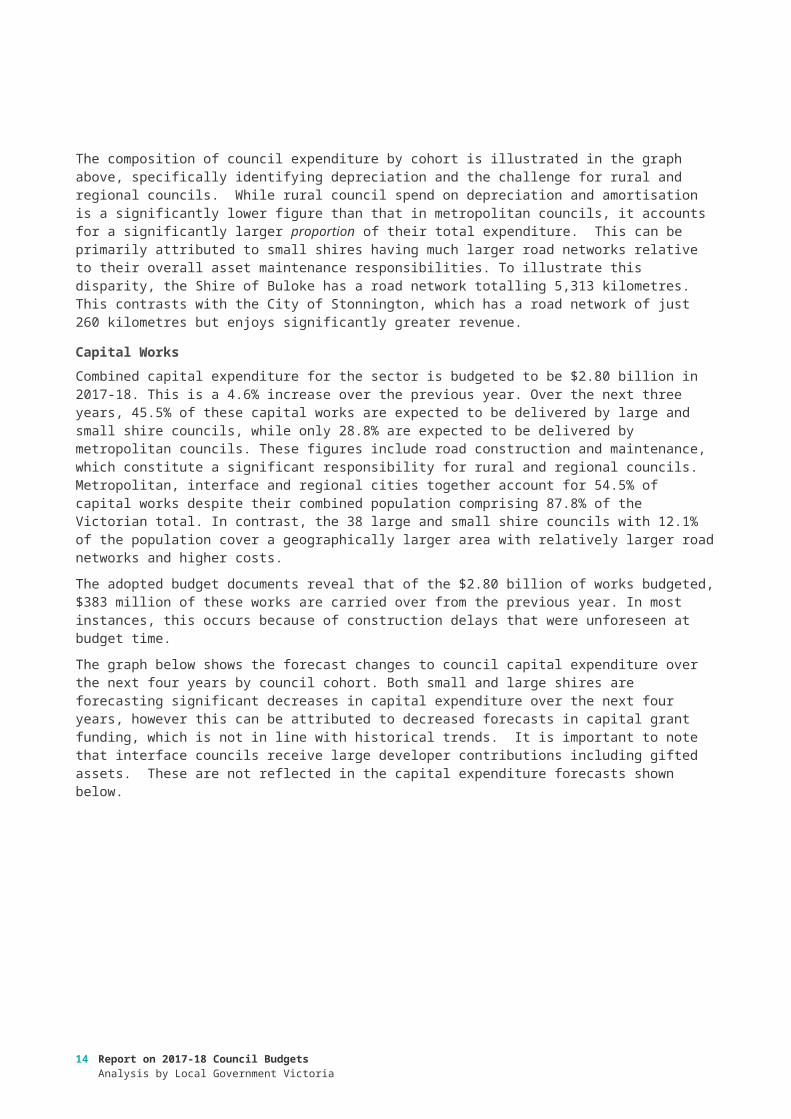
The composition of council expenditure by cohort is illustrated in the graph above, specifically identifying depreciation and the challenge for rural and regional councils. While rural council spend on depreciation and amortisation is a significantly lower figure than that in metropolitan councils, it accounts for a significantly larger proportion of their total expenditure. This can be primarily attributed to small shires having much larger road networks relative to their overall asset maintenance responsibilities. To illustrate this disparity, the
Report on 2017-18 Council BudgetsAnalysis by Local Government Victoria
11
Shire of Buloke has a road network totalling 5,313 kilometres. This contrasts with the City of Stonnington, which has a road network of just 260 kilometres but enjoys significantly greater revenue.
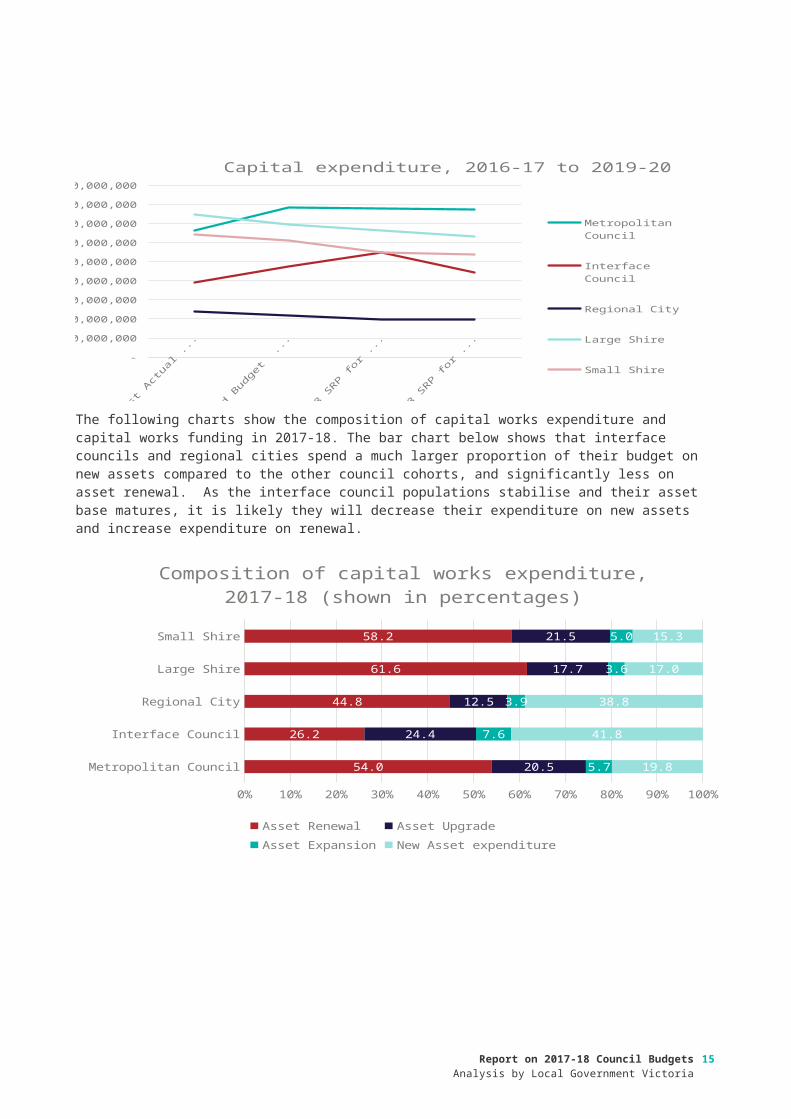
Capital WorksCombined capital expenditure for the sector is budgeted to be $2.80 billion in 2017-18. This is a 4.6% increase over the previous year. Over the next three years, 45.5% of these capital works are expected to be delivered by large and small shire councils, while only 28.8% are expected to be delivered by metropolitan councils. These figures include road construction and maintenance, which constitute a significant responsibility for rural and regional councils. Metropolitan, interface and regional cities together account for 54.5% of capital works despite their combined population comprising 87.8% of the Victorian total. In contrast, the 38 large and small shire councils with 12.1% of the population cover a geographically larger area with relatively larger road networks and higher costs.
The adopted budget documents reveal that of the $2.80 billion of works budgeted, $383 million of these works are carried over from the previous year. In most instances, this occurs because of construction delays that were unforeseen at budget time.
The graph below shows the forecast changes to council capital expenditure over the next four years by council cohort. Both small and large shires are forecasting significant decreases in capital expenditure over the next four years, however this can be attributed to decreased forecasts in capital grant funding, which is not in line with historical trends. It is important to note that interface councils receive large developer contributions including gifted assets. These are not reflected in the capital expenditure forecasts shown below.
Fore
cast A
ctual
...
Ado
pted B
udget
...
2017-
18 S
RP fo
r ...
2017
-18 S
RP fo
r ...
-
100,000,000
200,000,000
300,000,000
400,000,000
500,000,000
600,000,000
700,000,000
800,000,000
900,000,000
Capital expenditure, 2016-17 to 2019-20
Metropolitan Council
Interface Council
Regional City
Large Shire
Small Shire
The following charts show the composition of capital works expenditure and capital works funding in 2017-18. The bar chart below shows that interface councils and regional cities spend a much larger proportion of their budget on new assets compared to the other council cohorts, and significantly less on asset renewal. As the interface council populations stabilise and their asset base matures, it is likely they will decrease their expenditure on new assets and increase expenditure on renewal.
12 Report on 2017-18 Council BudgetsAnalysis by Local Government Victoria
Metropolitan Council
Interface Council
Regional City
Large Shire
Small Shire
0% 10% 20% 30% 40% 50% 60% 70% 80% 90% 100%
54.0
26.2
44.8
61.6
58.2
20.5
24.4
12.5
17.7
21.5
5.7
7.6
3.9
3.6
5.0
19.8
41.8
38.8
17.0
15.3
Composition of capital works expenditure, 2017-18 (shown in percentages)
Asset Renewal Asset Upgrade Asset Expansion New Asset expenditure
2014-15 2015-16 2016-17 2017-18 2018-19 2019-200%
20%
40%
60%
80%
100%
120%
Asset renewal compared to depreciation
Metropolitan Interface Regional CitiesLarge Shires Small Shires
Ratio
of R
enew
al ex
pend
iture
to d
epre
ciatio
n
The chart above is based on data from Know Your Council and shows the actual and forecast asset renewal ratio (sometimes referred to as the ‘renewal gap’) which is the potential gap between planned expenditure on asset renewal compared to the forecast cost of depreciation. The ratio is an indicator of whether council spending on asset renewal is keeping pace with the rate of consumption of those assets and a ratio of 100% or greater is desirable. The chart shows that interface councils have lower levels of asset renewal spending
Report on 2017-18 Council BudgetsAnalysis by Local Government Victoria
13
due to their asset expenditure typically focusing on new rather than established assets due to recent growth. It also shows small shires and regional cities have relatively lower levels of asset renewal, with both cohorts around the 70-75% level. According to this indicator none of the council cohorts’ actual or forecast results reach a level of 1:1 renewal spend against depreciation.
It is important to note that the renewal ‘gap’ is hypothetical, but does highlight the possibility that many councils are not planning to invest sufficiently to maintain assets at their current levels. This can be due to planned service level reductions, financial constraints or both.
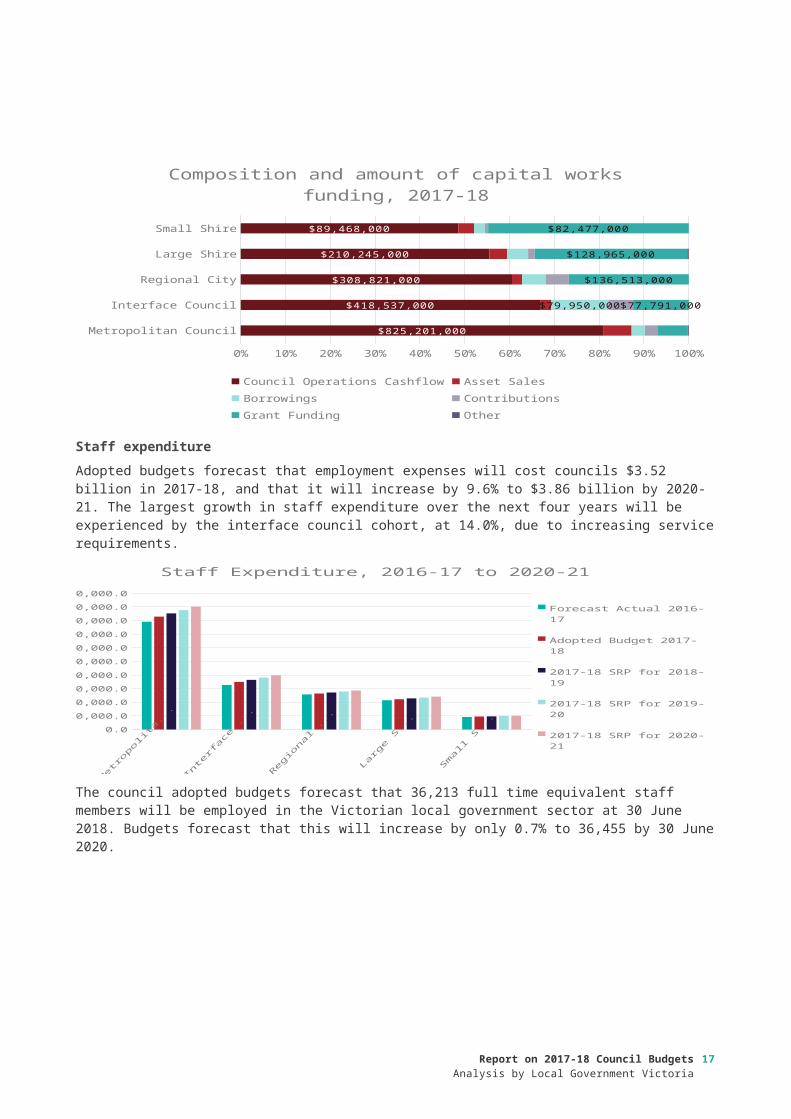
The graph below shows that a significantly larger proportion of capital works in rural and regional council areas are reliant on grant funding, while most metropolitan and interface council capital works are funded by own source revenue.
Metropolitan Council
Interface Council
Regional City
Large Shire
Small Shire
0% 10% 20% 30% 40% 50% 60% 70% 80% 90% 100%
$825,201,000
$418,537,000
$308,821,000
$210,245,000
$89,468,000
$79,950,000 $77,791,000
$136,513,000
$128,965,000
$82,477,000
Composition and amount of capital works funding, 2017-18
Council Operations Cashflow Asset Sales BorrowingsContributions Grant Funding Other
Staff expenditureAdopted budgets forecast that employment expenses will cost councils $3.52 billion in 2017-18, and that it will increase by 9.6% to $3.86 billion by 2020-21. The largest growth in staff expenditure over the next four years will be experienced by the interface council cohort, at 14.0%, due to increasing service requirements.
Metropolitan Council
Interface Council
Regional City
Large Shire Small Shire0.0
200,000,000.0
400,000,000.0
600,000,000.0
800,000,000.0
1,000,000,000.0
1,200,000,000.0
1,400,000,000.0
1,600,000,000.0
1,800,000,000.0
2,000,000,000.0
Staff Expenditure, 2016-17 to 2020-21
Forecast Actual 2016-17
Adopted Budget 2017-18
2017-18 SRP for 2018-19
2017-18 SRP for 2019-20
2017-18 SRP for 2020-21
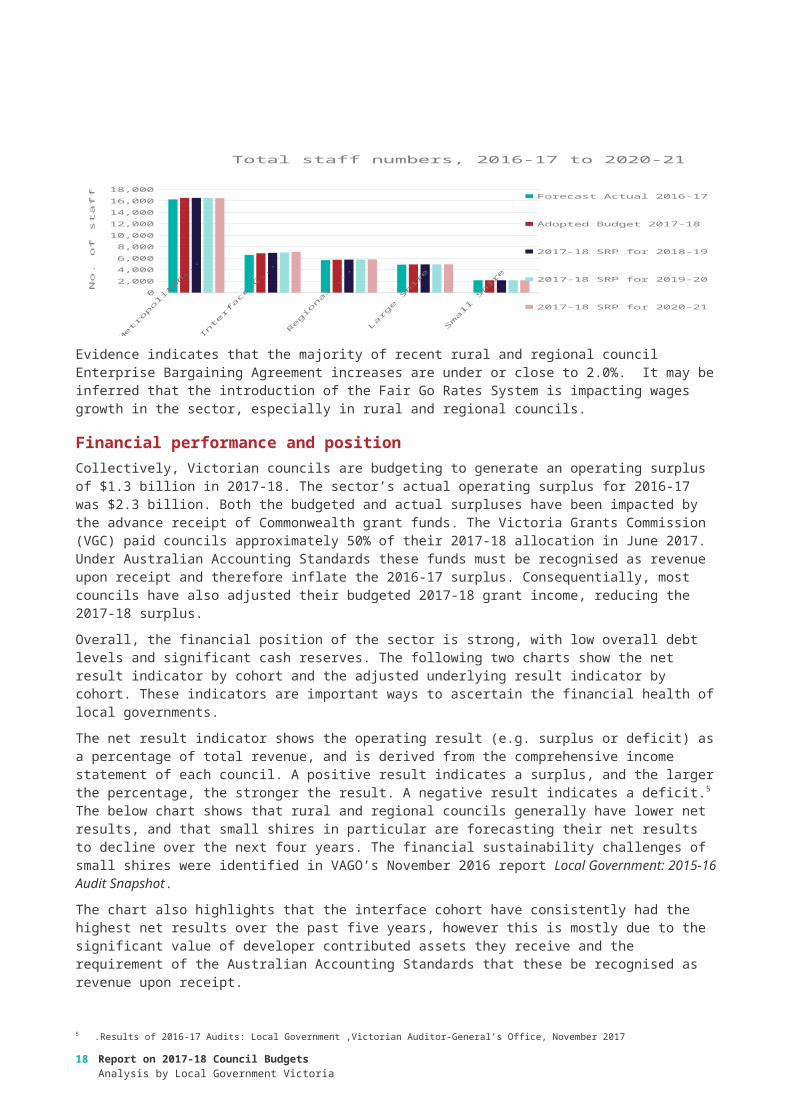
The council adopted budgets forecast that 36,213 full time equivalent staff members will be employed in the Victorian local government sector at 30 June 2018. Budgets forecast that this will increase by only 0.7% to 36,455 by 30 June 2020.
14 Report on 2017-18 Council BudgetsAnalysis by Local Government Victoria
Metropolitan Council
Interface Council
Regional City
Large Shire Small Shire0
2,000
4,000
6,000
8,000
10,000
12,000
14,000
16,000
18,000
Total staff numbers, 2016-17 to 2020-21
Forecast Actual 2016-17
Adopted Budget 2017-18
2017-18 SRP for 2018-19
2017-18 SRP for 2019-20
2017-18 SRP for 2020-21
No.
of
sta
ff
Evidence indicates that the majority of recent rural and regional council Enterprise Bargaining Agreement increases are under or close to 2.0%. It may be inferred that the introduction of the Fair Go Rates System is impacting wages growth in the sector, especially in rural and regional councils.
Financial performance and positionCollectively, Victorian councils are budgeting to generate an operating surplus of $1.3 billion in 2017-18. The sector’s actual operating surplus for 2016-17 was $2.3 billion. Both the budgeted and actual surpluses have been impacted by the advance receipt of Commonwealth grant funds. The Victoria Grants Commission (VGC) paid councils approximately 50% of their 2017-18 allocation in June 2017. Under Australian Accounting Standards these funds must be recognised as revenue upon receipt and therefore inflate the 2016-17 surplus. Consequentially, most councils have also adjusted their budgeted 2017-18 grant income, reducing the 2017-18 surplus.
Overall, the financial position of the sector is strong, with low overall debt levels and significant cash reserves. The following two charts show the net result indicator by cohort and the adjusted underlying result indicator by cohort. These indicators are important ways to ascertain the financial health of local governments.
The net result indicator shows the operating result (e.g. surplus or deficit) as a percentage of total revenue, and is derived from the comprehensive income statement of each council. A positive result indicates a surplus, and the larger the percentage, the stronger the result. A negative result indicates a deficit.5 The below chart shows that rural and regional councils generally have lower net results, and that small shires in particular are forecasting their net results to decline over the next four years. The financial sustainability challenges of small shires were identified in VAGO’s November 2016 report Local Government: 2015-16 Audit Snapshot.
The chart also highlights that the interface cohort have consistently had the highest net results over the past five years, however this is mostly due to the significant value of developer contributed assets they receive and the requirement of the Australian Accounting Standards that these be recognised as revenue upon receipt.
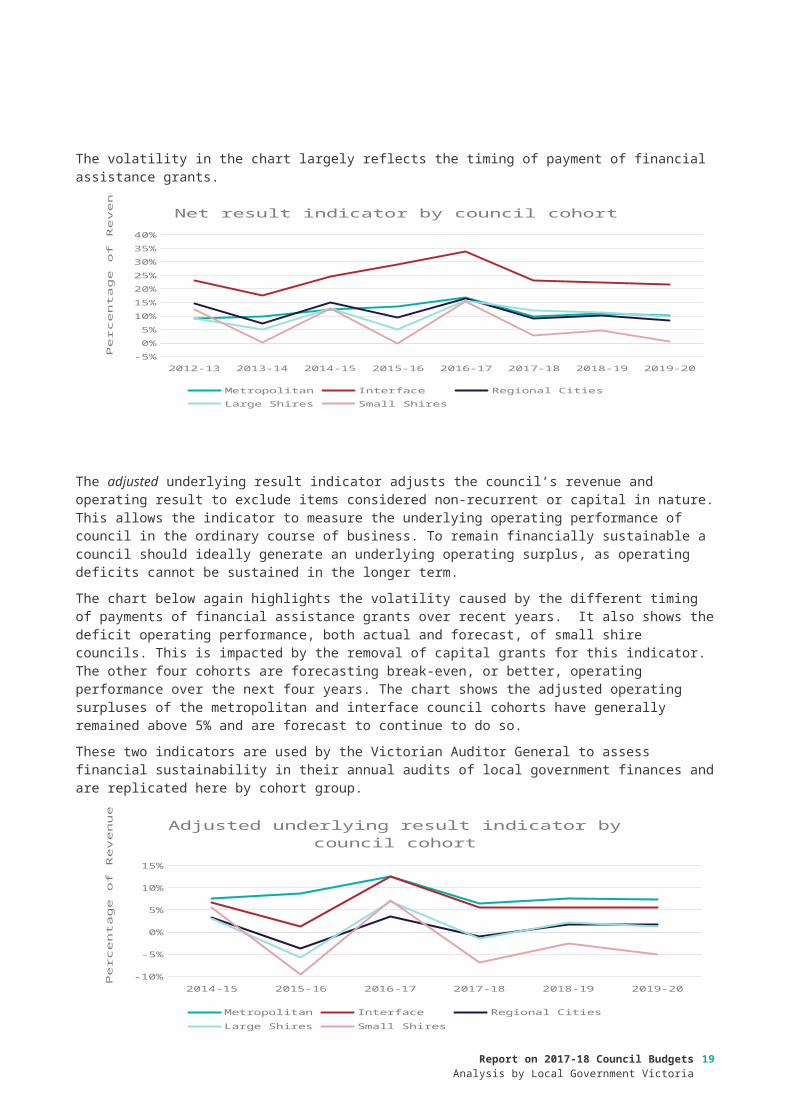
The volatility in the chart largely reflects the timing of payment of financial assistance grants.
5 .Results of 2016-17 Audits: Local Government ,Victorian Auditor-General’s Office, November 2017
Report on 2017-18 Council BudgetsAnalysis by Local Government Victoria
15

2012-13 2013-14 2014-15 2015-16 2016-17 2017-18 2018-19 2019-20-5%
0%
5%
10%
15%
20%
25%
30%
35%
40%
Net result indicator by council cohort
Metropolitan Interface Regional CitiesLarge Shires Small Shires
Perc
enta
ge o
f R
evenue
The adjusted underlying result indicator adjusts the council’s revenue and operating result to exclude items considered non-recurrent or capital in nature. This allows the indicator to measure the underlying operating performance of council in the ordinary course of business. To remain financially sustainable a council should ideally generate an underlying operating surplus, as operating deficits cannot be sustained in the longer term.
The chart below again highlights the volatility caused by the different timing of payments of financial assistance grants over recent years. It also shows the deficit operating performance, both actual and forecast, of small shire councils. This is impacted by the removal of capital grants for this indicator. The other four cohorts are forecasting break-even, or better, operating performance over the next four years. The chart shows the adjusted operating surpluses of the metropolitan and interface council cohorts have generally remained above 5% and are forecast to continue to do so.
These two indicators are used by the Victorian Auditor General to assess financial sustainability in their annual audits of local government finances and are replicated here by cohort group.
2014-15 2015-16 2016-17 2017-18 2018-19 2019-20-10%
-5%
0%
5%
10%
15%
Adjusted underlying result indicator by council cohort
Metropolitan Interface Regional CitiesLarge Shires Small Shires
Perc
enta
ge o
f R
evenue
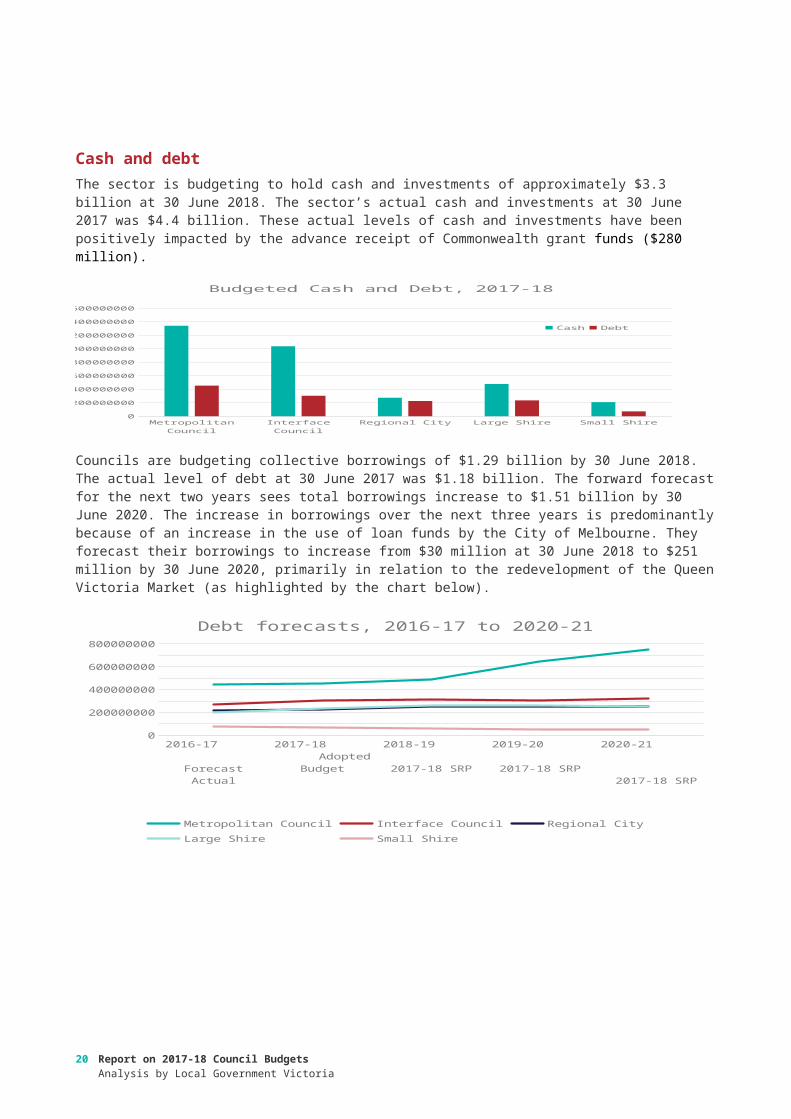
Cash and debtThe sector is budgeting to hold cash and investments of approximately $3.3 billion at 30 June 2018. The sector’s actual cash and investments at 30 June 2017 was $4.4 billion. These actual levels of cash and investments have been positively impacted by the advance receipt of Commonwealth grant funds ($280 million).
16 Report on 2017-18 Council BudgetsAnalysis by Local Government Victoria
Metropolitan Council
Interface Council Regional City Large Shire Small Shire0
200000000
400000000
600000000
800000000
1000000000
1200000000
1400000000
1600000000
Budgeted Cash and Debt, 2017-18
Cash Debt
Councils are budgeting collective borrowings of $1.29 billion by 30 June 2018. The actual level of debt at 30 June 2017 was $1.18 billion. The forward forecast for the next two years sees total borrowings increase to $1.51 billion by 30 June 2020. The increase in borrowings over the next three years is predominantly because of an increase in the use of loan funds by the City of Melbourne. They forecast their borrowings to increase from $30 million at 30 June 2018 to $251 million by 30 June 2020, primarily in relation to the redevelopment of the Queen Victoria Market (as highlighted by the chart below).
2016-17 Forecast Actual
2017-18 Adopted Budget
2018-19 2017-18 SRP
2019-20 2017-18 SRP
2020-21 2017-
18 SRP
0
100000000
200000000
300000000
400000000
500000000
600000000
700000000
800000000
Debt forecasts, 2016-17 to 2020-21
Metropolitan Council Interface Council Regional CityLarge Shire Small Shire
Report on 2017-18 Council BudgetsAnalysis by Local Government Victoria
17
18 Report on 2017-18 Council BudgetsAnalysis by Local Government Victoria
Appendices
Report on 2017-18 Council BudgetsAnalysis by Local Government Victoria
19
COUNCIL VLGCG GROUPING
Banyule City Council Metropolitan
Bayside City Council Metropolitan
Boroondara City Council Metropolitan
Brimbank City Council Metropolitan
Darebin City Council Metropolitan
Frankston City Council Metropolitan
Glen Eira City Council Metropolitan
Greater Dandenong City Council Metropolitan
Hobsons Bay City Council Metropolitan
Kingston City Council Metropolitan
Knox City Council Metropolitan
Manningham City Council Metropolitan
Maribyrnong City Council Metropolitan
Maroondah City Council Metropolitan
Melbourne City Council Metropolitan
Monash City Council Metropolitan
Moonee Valley City Council Metropolitan
Moreland City Council Metropolitan
Port Phillip City Council Metropolitan
Stonnington City Council Metropolitan
Whitehorse City Council Metropolitan
Yarra City Council Metropolitan
COUNCIL VLGCG GROUPING
Cardinia Shire Council Interface
Casey City Council Interface
Hume City Council Interface
Melton Shire Council Interface
Mornington Peninsula Shire Council Interface
Nillumbik Shire Council Interface
Whittlesea City Council Interface
Wyndham City Council Interface
Yarra Ranges Shire Council Interface
Appendix A Council Cohorts
20 Report on 2017-18 Council BudgetsAnalysis by Local Government Victoria
COUNCIL VLGCG GROUPING
Ballarat City Council Regional City
Greater Bendigo City Council Regional City
Greater Geelong City Council Regional City
Greater Shepparton City Council Regional City
Horsham Rural City Council Regional City
Latrobe City Council Regional City
Mildura Rural City Council Regional City
Wangaratta Rural City Council Regional City
Warrnambool City Council Regional City
Wodonga City Council Regional City
COUNCIL VLGCG GROUPING
Bass Coast Shire Council Large Shire
Baw Baw Shire Council Large Shire
Campaspe Shire Council Large Shire
Colac Otway Shire Council Large Shire
Corangamite Shire Council Large Shire
East Gippsland Shire Council Large Shire
Glenelg Shire Council Large Shire
Golden Plains Shire Council Large Shire
Macedon Ranges Shire Council Large Shire
Mitchell Shire Council Large Shire
Moira Shire Council Large Shire
Moorabool Shire Council Large Shire
Mount Alexander Shire Council Large Shire
Moyne Shire Council Large Shire
South Gippsland Shire Council Large Shire
Southern Grampians Shire Council Large Shire
Surf Coast Shire Council Large Shire
Swan Hill Rural City Council Large Shire
Wellington Shire Council Large Shire
Report on 2017-18 Council BudgetsAnalysis by Local Government Victoria
21

COUNCIL VLGCG GROUPING
Alpine Shire Council Small Shire
Ararat Rural City Council Small Shire
Benalla Rural City Council Small Shire
Buloke Shire Council Small Shire
Central Goldfields Shire Council Small Shire
Gannawarra Shire Council Small Shire
Hepburn Shire Council Small Shire
Hindmarsh Shire Council Small Shire
Indigo Shire Council Small Shire
Loddon Shire Council Small Shire
Mansfield Shire Council Small Shire
Murrindindi Shire Council Small Shire
Northern Grampians Shire Council Small Shire
Pyrenees Shire Council Small Shire
Borough of Queenscliffe Small Shire
Strathbogie Shire Council Small Shire
Towong Shire Council Small Shire
West Wimmera Shire Council Small Shire
Yarriambiack Shire Council Small Shire
22 Report on 2017-18 Council BudgetsAnalysis by Local Government Victoria
Related Documents