Report of Investigation Performance of Upham Beach T-Groin Installation September 2006 to October 2009 Submitted to: Surfrider Foundation, Inc. 3381 SE Diamond Hill Terrace Hobe Sound, FL 33455 Submitted by: ___________________________ Randall W. Parkinson, Ph.D., P.G. President RWParkinson Consulting, Inc. 2018 Melbourne Ct. Suite 205 Melbourne, FL 32901 Draft: November 11, 2010 Revised and Final: December 30, 2010 Updated: January 25, 2011 RWParkinson Consulting, Inc.

Welcome message from author
This document is posted to help you gain knowledge. Please leave a comment to let me know what you think about it! Share it to your friends and learn new things together.
Transcript
Report of Investigation
Performance of Upham Beach T-Groin Installation September 2006 to October 2009
Submitted to: Surfrider Foundation, Inc.
3381 SE Diamond Hill Terrace Hobe Sound, FL 33455
Submitted by:
___________________________ Randall W. Parkinson, Ph.D., P.G.
President RWParkinson Consulting, Inc. 2018 Melbourne Ct. Suite 205
Melbourne, FL 32901
Draft: November 11, 2010 Revised and Final: December 30, 2010
Updated: January 25, 2011
RWParkinson Consulting, Inc.
Report of Investigation Upham Beach T-Groin Performance
Randall W. Parkinson Version control January 25, 2011
i RWParkinson Consulting, Inc. Melbourne, Florida (321) 373-0976 www.rwparkinson.com
Executive Summary The goal of this investigation was to characterize the performance of the Upham Beach T-Groin installation with regards to (1) mitigating erosion at the public beach and (2) avoiding erosion of the adjacent “downdrift beach”. To achieve these goals, documents generated in association with the permitting, construction, and monitoring of the groin field at Upham Beach were sought and reviewed. In addition, an attempt was made to address the following specific tasks: (1) construct a littoral drift budget for the public and “downdrift” beaches, (2) assess treatment of structural volume when elevation profiles transect a groin, (3) locate reference to a May 2008 beach fill construction event, and (4) construct a pre-project shoreline map. The results of this investigation are therefore organized into two sections: (1) general review and T-Groin performance assessment and (2) resolution of specific tasks. General Review and T-Groin Performance Assessment A final assessment of groin performance is contained in the Executive Summary of USF Monitoring Report No. 6, wherein the USF researchers conclude: • “The T-groins have reduced the rate of beach erosion at Upham Beach to a certain degree.” • “No clear negative impact from the T-groin field to the downdrift shoreline can be
identified.” • Comparison between the 2000 - 2002 (sand only) and 2006 - 2008 (included groin field
installation) nourishment projects indicates the “beach retained more sand with the structures.”
Based upon 80+ hours of review and analysis of the six USF monitoring reports, I find their favorable assessment of groin field performance in slowing erosion while not impacting the adjacent downdrift beach is not substantiated by the USF data. This finding is a result of myriad design, monitoring, and analytical flaws. Specific Task Results Regarding completion of the four specific tasks:
1. It was not possible to construct a littoral sediment budget using the USF data, nor therefore to use a sediment budget to evaluate the performance of the groins in mitigating erosion.
2. The USF profile data did not distinguish between the presence of a groin structure or unconsolidated sand; however the resulting sand volume change estimates likely had no significant effect on the performance assessments of the groin field.
3. No reference to a May 2008 beach fill construction event at Upham Beach was made in the technical documents reviewed during this investigation.
4. A map of the public beach shoreline prior to the 2006 beach fill project was constructed.

Report of Investigation Upham Beach T-Groin Performance
Randall W. Parkinson Version control January 25, 2011
ii RWParkinson Consulting, Inc. Melbourne, Florida (321) 373-0976 www.rwparkinson.com
Table of Contents Heading Page Number Executive Summary i Table of Contents ii I. Background 1
A. Project Goal 1 B. Scope of Work 1
II. Results 1 A. T-Groin Performance 1
1. Background 1 2. Statement of Finding and Rationale 2
a. Flawed experimental design and monitoring protocol 5 b. Comparison between the 2000 and 2006 nourishment projects 6
B. Specific Tasks 10 1. Sediment Budget 10 2. Structural Volume Effects 11 3. May 2008 Beach Fill 11 4. Pre-Construction Shoreline Location 12
List of Figures
Figure 1 – Profiles in the T-Groin field of the project area 3 Figure 2 – Long Key profiles in the downdrift segment of the project 4 Figure 3 – Aerial photo of groin field in January 2008 8 Figure 4 – Estimate of shoreline position before and after 2006 nourishment 13
List of Tables Table 1 – Beach fill volume changes before and after groin installation 9 Table 2 – Shoreline distance before and after 2006 nourishment 14
Appendices Appendix I – Summary of shoreline and profile volume changes EF1 Appendix II – Summary of profiles extending to “depth of closure” EF Appendix III – Estimate of shoreline distance before and after 2006 nourishment NP2
1 EF – Appendix is an Excel spreadsheet file provided under separate cover. 2 NP – Appendix is not paginated.

Report of Investigation Upham Beach T-Groin Performance
Randall W. Parkinson Version control January 25, 2011
1 RWParkinson Consulting, Inc. Melbourne, Florida (321) 373-0976 www.rwparkinson.com
I. Background A. Project Goal
The goal of this investigation is to characterize the performance of the Upham Beach T-Groin installation with regards to (1) mitigating public beach erosion and (2) avoiding “downdrift beach” erosion.
B. Scope of Work
To achieve the project goals, the following scope of work was undertaken: Task 1a. Data mining and analysis
1) Search and acquisition of technical documents generated in association with the Upham Beach installation.
2) General review and analysis of the acquired technical documents to assess T-groin performance.
3) Review and analysis of technical documents in an attempt to resolve the following specific issues: (a) Sediment budget – Construct a littoral drift budget for the public and “downdrift”
beaches. (b) Structural volume effects – Determine what consideration was given to profile data and
the resulting volume change estimate when a transect crossed some or all of a groin structure.
(c) May 2008 beach fill – Locate reference to a beach fill project observed in May 2008; do subsequent performance assessments acknowledge this action and modify volume change estimates accordingly.
(d) Pre-construction shoreline location – Map the shoreline location (i.e., 0.0 m NAVD88) before groin installation.
Task 1b. Reporting
1) Draft Report of Investigation 2) Revised and final Report of Investigation
II. Results
The results of this investigation are organized into two sections: (1) general review and T-Groin performance assessment and (2) specific tasks. A. T-Groin Performance
1. Background Between 2004 and 2006, five T-groin structures (aka groins) were installed as an attempt to mitigate the rapid and persistent erosion at Upham Beach (aka public beach). Construction commenced “shortly after completion of the 2004 Upham Beach nourishment project”.
Report of Investigation Upham Beach T-Groin Performance
Randall W. Parkinson Version control January 25, 2011
2 RWParkinson Consulting, Inc. Melbourne, Florida (321) 373-0976 www.rwparkinson.com
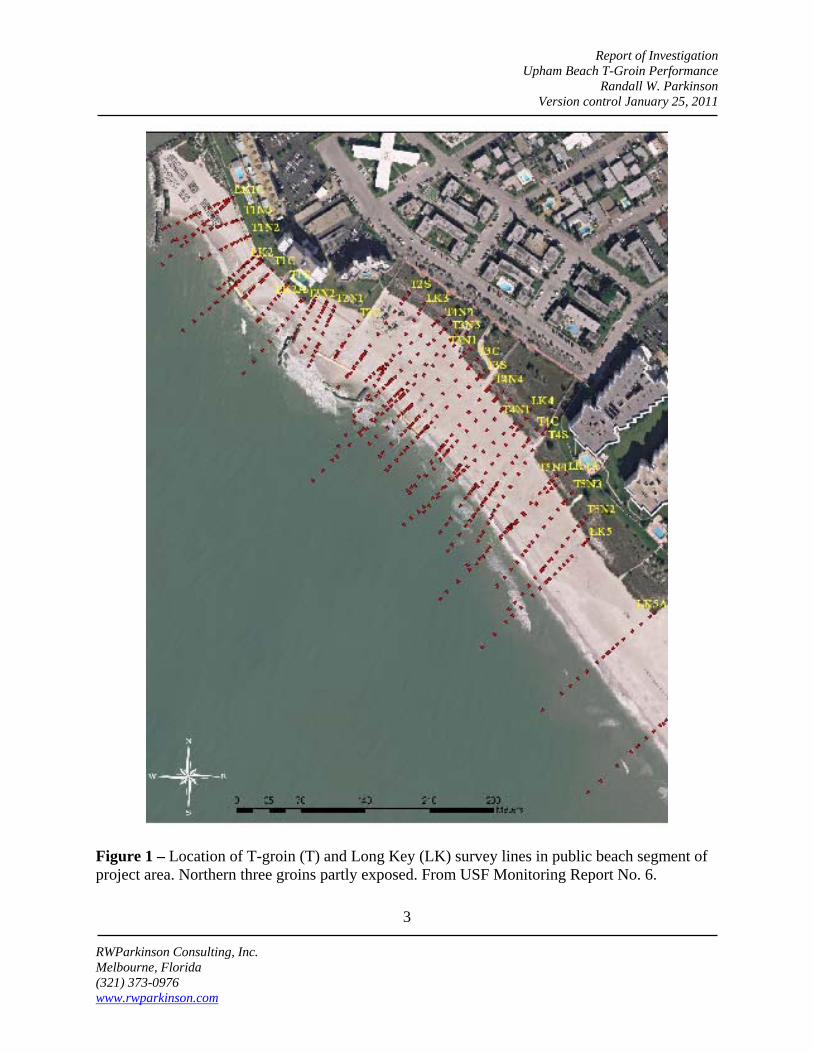
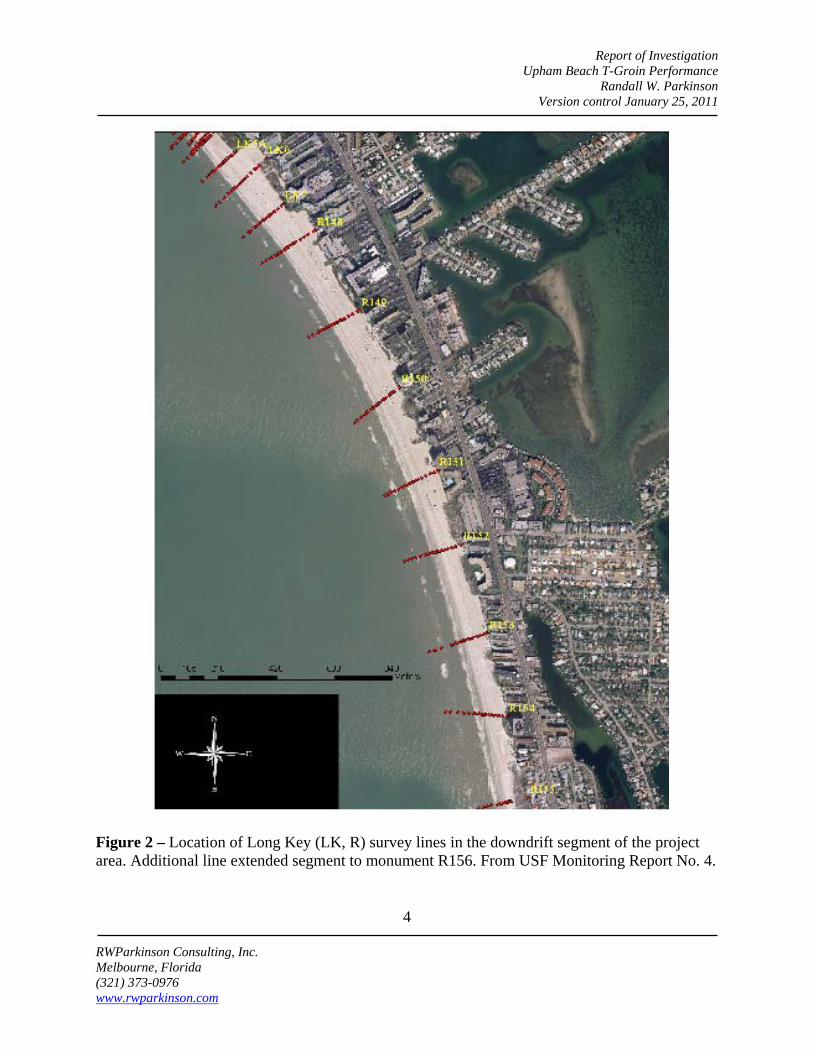
Concomitant with groin construction was the “tightening” of the existing south jetty at Blind Pass and burial of the groin field using approximately 380,000 yds3 of fill obtained from a nearby borrow area. By the time all five groins had been installed, the northern three structures were exposed. The entire field was again buried using approximately 125,000 yds3 of fill during a 2006 beach nourishment project. A monitoring program was designed and implemented by the University of South Florida (USF) to quantify the performance of the groins and their impact on the adjacent downdrift beach. The impact assessment was based upon data gathered during monthly beach-profile surveys conducted within the groin field and along the adjacent downdrift beach. Within the groin field, a series of profiles were established along which elevation data were collected to an initial depth of -1.2 m (Figure 1). Another series of profiles extending to a depth of -3.0 m were established throughout the northern end of Long Key and including both groin field and downdrift shoreline segments (Figure 2). The USF team submitted six progress reports, each of which included a cumulative summary of the monitoring data and assessment of groin performance in mitigating erosion of the public and downdrift beaches:
1. Initial 3 Months: September 2006 to December 2006 (duration 3 months) 2. 2006 – 2007 Winter: December 2006 to April 2007 (duration 4 months) 3. 2007 Summer: April 2007 to October 2007 (duration 6 months) 4. 2007 – 2008 Winter: October 2007 to April 2008 (duration 6 months) 5. 2008 Summer: April 2008 to October 2008 (duration 6 months) 6. 2008 – 2009 Winter: October 2008 to April 2009 (duration 6 months)
A final assessment of groin performance is contained in the Executive Summary of USF Monitoring Report No. 6, wherein the USF researchers conclude: • “The T-groins have reduced the rate of beach erosion at Upham Beach to a certain
degree.” • “No clear negative impact from the T-groin field to the downdrift shoreline can be
identified.” • Comparison between 2000 - 2002 and 2006 - 2008 (hereafter 2000 and 2006)
nourishment indicates the “beach retained more sand with the structures.” .
2. Statement of Finding and Rationale Based upon 80+ hours of review and analysis of the six USF monitoring reports, I find their favorable assessment of groin field performance in slowing erosion while not impacting the adjacent downdrift beach is not substantiated by the USF data. This
Report of Investigation Upham Beach T-Groin Performance
Randall W. Parkinson Version control January 25, 2011
3 RWParkinson Consulting, Inc. Melbourne, Florida (321) 373-0976 www.rwparkinson.com
Figure 1 – Location of T-groin (T) and Long Key (LK) survey lines in public beach segment of project area. Northern three groins partly exposed. From USF Monitoring Report No. 6.
Report of Investigation Upham Beach T-Groin Performance
Randall W. Parkinson Version control January 25, 2011
4 RWParkinson Consulting, Inc. Melbourne, Florida (321) 373-0976 www.rwparkinson.com
Figure 2 – Location of Long Key (LK, R) survey lines in the downdrift segment of the project area. Additional line extended segment to monument R156. From USF Monitoring Report No. 4.
Report of Investigation Upham Beach T-Groin Performance
Randall W. Parkinson Version control January 25, 2011
5 RWParkinson Consulting, Inc. Melbourne, Florida (321) 373-0976 www.rwparkinson.com
finding is a result of myriad design, monitoring, and analytical flaws including: a. Flawed experimental design and monitoring protocol
The experimental design of any impact assessment is typically structured as follows: 1. Establish and monitor identical control and impact sites for an interval of time
sufficient to capture background (or prevailing) conditions including variability induced by seasonal and event signals.
2. Modify the impact site by changing one environmental parameter (i.e., beach fill, groin installation).
3. Resume monitoring of the control and impact sites using protocol identical to the pre-impact interval.
4. Analyze the control and impact data obtained before and after the environmental parameter was changed at the impact site.
The USF study violated many of the experimental design and monitoring protocol requirements described in the preceding paragraph. For example, no control site was established and monitored. Thus, the effect of stochastic events (i.e., landfall of a 100 year storm) could not be quantified as distinct from shoreline behavior triggered by the impact (aka environmental change) for which the study was designed to measure. USF monitoring did not include a “pre-impact” data set to establish shoreline behavior during prevailing conditions. USF monitoring was initiated in June 2006; a month after groin construction was completed (May 2006). Furthermore, construction of the groin field was initiated immediately after a 2004 beach fill project was completed and within two years of completion of a 2000 nourishment project. To what extent did the residual effects of either project influence the data collected and conclusions drawn by USF staff? Concomitant with groin construction was the “tightening” of the Blind Pass south jetty and groin field burial using approximately 380,000 yds3 of fill. Thus, the “post-construction” monitoring data collected by USF also quantified shoreline and volume changes induced, in part, by these two events. The entire groin installation was again buried by some 124,000 yds3 of fill during a 2006 beach fill project. Monitoring data collected after the 2006 beach fill therefore reflects shoreline response to groin construction, but also the cumulative effects of as many as five other coastal construction projects. With regard to the collection of monitoring data using identical protocol before and after impact (see also Appendix I): 1. Profiles within the groin field were extended from a water depth of -1.2 m to a depth

Report of Investigation Upham Beach T-Groin Performance
Randall W. Parkinson Version control January 25, 2011
6 RWParkinson Consulting, Inc. Melbourne, Florida (321) 373-0976 www.rwparkinson.com
of -1.5 m prior to collecting the 2007 summer data. 2. Prior to collecting the 2007 summer data, the downdrift shoreline segment was
lengthened by the addition of a profile at monument R-150. 3. The length of the downdrift shoreline segment monitored by USF was again
increased to include monuments through R-156 prior to collection of the 2007-2008 winter data.
4. Surveys between monuments R-151 and R-156 were terminated at the landward limit of the offshore bar during the 2007-2008 winter monitoring interval. It is not clear whether this modification was applied to the subsequent two monitoring intervals or if the surveys conducted at these monuments terminated at a depth of -3m as before.
Furthermore (see also Appendix 1 and Appendix 2), 5. No consistent time interval could be associated with the six monitoring reports. The
initial duration was 3 months, followed by an increase to 4 months, and then finally 6 months.
6. All of the groin field surveys and some of the Long Key surveys did not extend to the depth of closure (DOC) reported by USF to be -3 m NAVD88. Only profiles extending to or beyond the DOC are suitable for use in quantifying profile volume change or to construct a littoral sediment budget for the project area.
After consideration of these shortcomings, the only conclusions substantiated by the USF monitoring data are as follows: 1. Groin field shoreline and profile volume change were erosional following 2006
nourishment. 2. Shoreline and profile volume change throughout the project area were cyclic in
response to seasonal (i.e., summer and winter) weather conditions. There are other small-scale inconsistencies in the USF reports.1 However, a discussion of these has been omitted herein because their consequence is minor in comparison to the fundamental flaws in experimental design and monitoring protocol as have been described in the preceding sections.
b. Comparison between the 2000 and 2006 nourishment projects In the 5th monitoring report, a performance comparison is made between Upham Beach nourishment projects constructed in 2000 – 2002 and 2006 – 2008. As the groin field was present prior to the second nourishment, the comparison is purported
1 c.f. “suspect data” identified in Figure 4 and Table 2
Report of Investigation Upham Beach T-Groin Performance
Randall W. Parkinson Version control January 25, 2011
7 RWParkinson Consulting, Inc. Melbourne, Florida (321) 373-0976 www.rwparkinson.com
to provide a means to assess the effect of groin field installation on fill retention. Researchers at USF conclude: (1) “...the 2006 – 2008 nourishment with structures performed better than the 2000 – 2002 nourishment without structures... (pg. 54)” and (2) “...the structures have not influenced the downdrift beach during the first two years (pg. 55)”. Their conclusions are based upon a comparison of profile volume changes acquired during a two year interval immediately following each nourishment event (Table 1). A number of conditions must be satisfied to properly compare the performance of these two nourishment projects including:
• Same shoreline length. • Similar shoreface profile monitored using surveys that extend to or beyond the
depth of closure (DOC; aka wave base). • Same construction design (i.e. fill template and volume). • Beach fill acquired from the same borrow area and therefore with similar
sedimentologic characteristics. • Projects constructed and monitored during the same time of year. • Same seasonal, event, and stochastic2 conditions. • Same monitoring protocol used to collect data before and after impact.
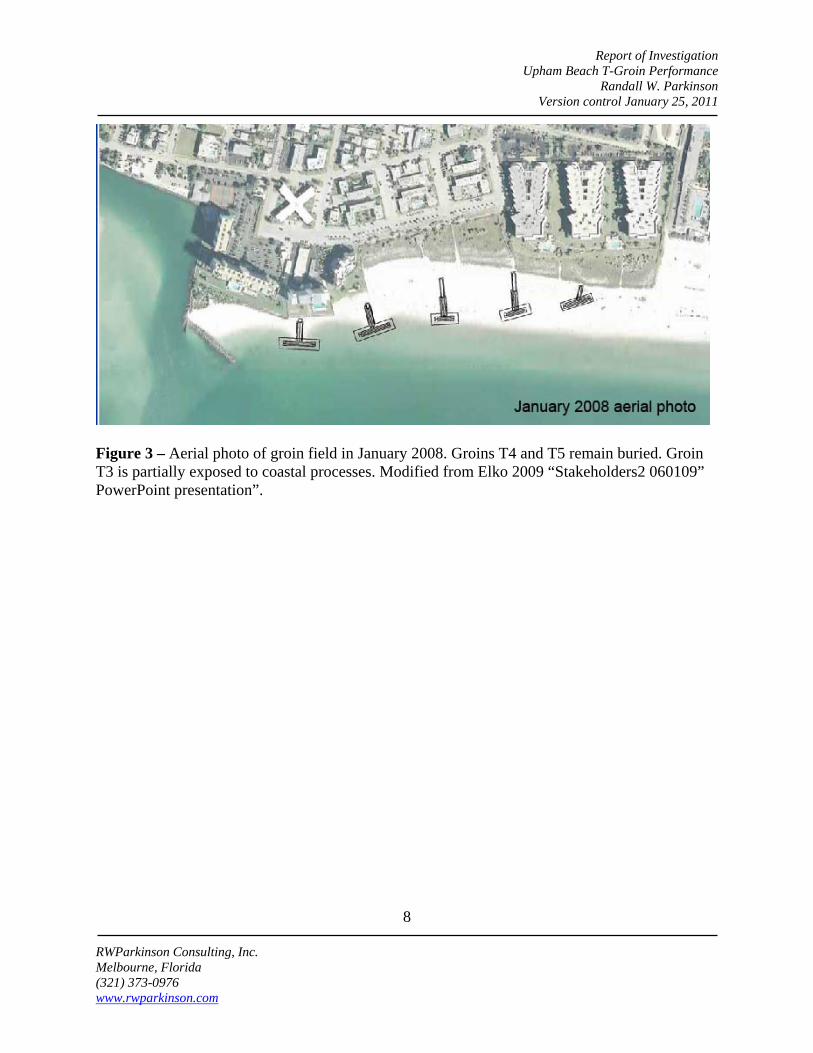
The extent to which any of these conditions were satisfied was not discussed in the USF report. However, even if all of these conditions were met, alternate conclusions can be drawn using the same data provided in the USF report. According to the USF researchers: (1) the beach generally eroded less with the structures and (2) the difference between the volume retained before and after groin installation increases southward (i.e., the highest fill retention increase of 92% corresponds to T5, located at the southern end of the groin field). However, the T5 groin was never exposed during USF monitoring. Put another way, the T5 groin never interacted with coastal processes and could not therefore have had any effect on (1) prevailing waves and current conditions or (2) fill retention (aka project performance). Fill retention at the T4 site is reported to have increased by 61% as a consequence of groin installation. Yet the T4 groin and its interaction with coastal process occurred in February 2008 (c.f. Figure 3), nearly two years after the 2006 nourishment was completed. An equally compelling interpretation of the USF data as presented in Table 1 is that the
2 Condition not required if both projects include control and impact shoreline segments monitored before and after impact.
Report of Investigation Upham Beach T-Groin Performance
Randall W. Parkinson Version control January 25, 2011
8 RWParkinson Consulting, Inc. Melbourne, Florida (321) 373-0976 www.rwparkinson.com
Figure 3 – Aerial photo of groin field in January 2008. Groins T4 and T5 remain buried. Groin T3 is partially exposed to coastal processes. Modified from Elko 2009 “Stakeholders2 060109” PowerPoint presentation”.
Report of Investigation Upham Beach T-Groin Performance
Randall W. Parkinson Version control January 25, 2011
9 RWParkinson Consulting, Inc. Melbourne, Florida (321) 373-0976 www.rwparkinson.com
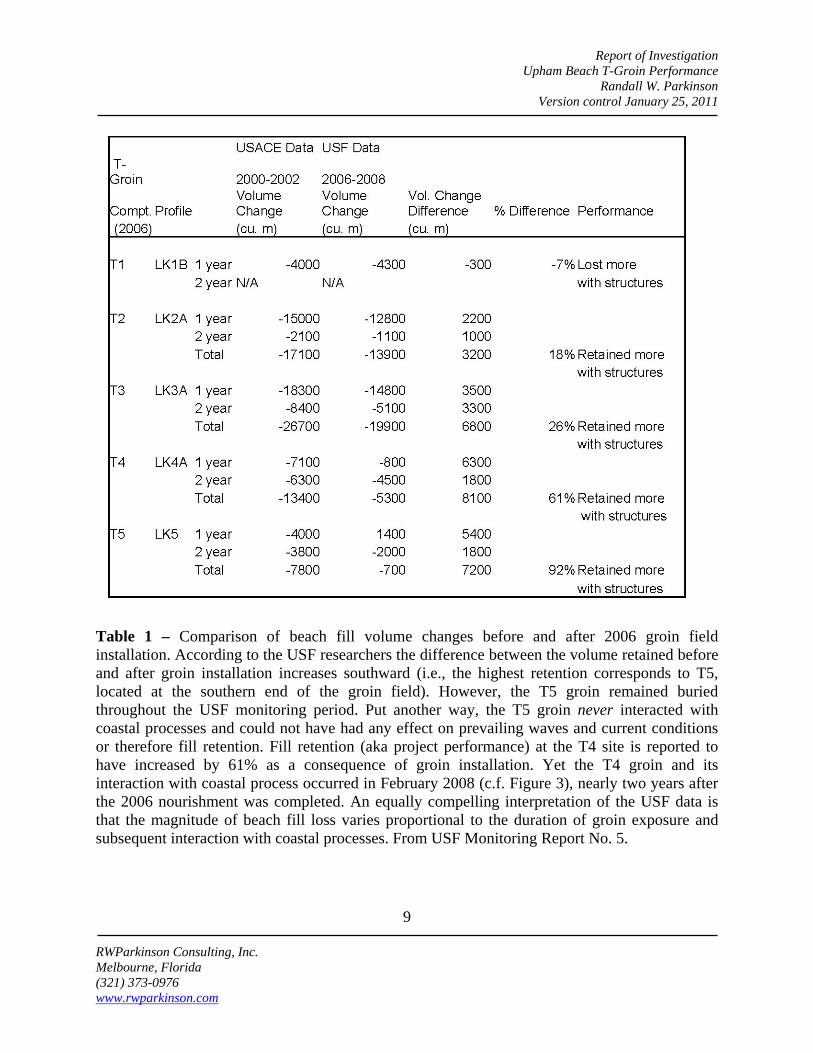
Table 1 – Comparison of beach fill volume changes before and after 2006 groin field installation. According to the USF researchers the difference between the volume retained before and after groin installation increases southward (i.e., the highest retention corresponds to T5, located at the southern end of the groin field). However, the T5 groin remained buried throughout the USF monitoring period. Put another way, the T5 groin never interacted with coastal processes and could not have had any effect on prevailing waves and current conditions or therefore fill retention. Fill retention (aka project performance) at the T4 site is reported to have increased by 61% as a consequence of groin installation. Yet the T4 groin and its interaction with coastal process occurred in February 2008 (c.f. Figure 3), nearly two years after the 2006 nourishment was completed. An equally compelling interpretation of the USF data is that the magnitude of beach fill loss varies proportional to the duration of groin exposure and subsequent interaction with coastal processes. From USF Monitoring Report No. 5.
Report of Investigation Upham Beach T-Groin Performance
Randall W. Parkinson Version control January 25, 2011
10 RWParkinson Consulting, Inc. Melbourne, Florida (321) 373-0976 www.rwparkinson.com
magnitude of beach fill loss varies proportional to the duration of groin exposure and subsequent interaction with coastal processes; i.e., the longer a groin is exposed to coastal process, the more sand is eroded from the beach. Obviously, the effect of groin installation on beach fill retention cannot be quantified using the USF 2000 and 2006 beach fill data. The rationale for USF researchers to also suggest “the structures have not influenced the downdrift beach during the first two years (pg. 55)” (USF Monitoring Report No. 5) remains enigmatic.
B. Specific Tasks 1. Sediment Budget
The Consultant attempted to establish a sediment budget for the public and downdrift beaches using data contained in the six USF monitoring reports. Once constructed, this sediment budget could be used to quantify groin performance in mitigating erosion at Upham Beach. However, the utility of this budget will always be of limited value because a sediment budget had not been established prior to groin installation. A spreadsheet was initially constructed to summarize both shoreline and profile-volume change as a function of time following construction of the groin field (Appendix I). However, during construction of the spreadsheet it soon became clear an Upham Beach post-construction sediment budget could not be generated using the USF data. Thus, the effects of groin installation on sediment erosion, transport, and deposition at Upham Beach will never be known. Specific problems encountered when attempting to establish a post-construction sediment budget at Upham Beach include the following (see also Appendix I):
a. The length of the Long Key downdrift shoreline segment surveyed by USF was changed. The initial southern boundary coincided with monument R149, but was lengthened to include monument R150 and then again to include monuments through R156. These changes altered the physical dimensions of the study area while monitoring was underway and thus violate a fundamental condition of a properly designed impact assessment. Some of the changes reported by USF may simply reflect the effects of increased shoreline length.
b. The maximum survey depth within the groin field was increased from -1.2 m to -1.5 m prior to the April – October 2007 monitoring interval. These changes also altered the physical dimensions of the study area while monitoring was underway and thus violate a fundamental condition of an impact assessment. Some of the changes reported by USF may simply reflect the effects of increased cross-shore survey length.
Report of Investigation Upham Beach T-Groin Performance
Randall W. Parkinson Version control January 25, 2011
11 RWParkinson Consulting, Inc. Melbourne, Florida (321) 373-0976 www.rwparkinson.com
c. The interval of time associated with each monitoring report was not constant. The initial duration was three months, followed by an increase to four months, and then finally six months. These survey data were not normalized to a standard interval of time and thus violate a fundamental condition of a properly designed impact assessment. Some of the changes reported by USF may simply reflect the effects of a non-uniform monitoring interval.
d. All of the groin field surveys and some of the Long Key surveys did not extend to the DOC, reported by the USF team to be -3.0 m NAVD88 (Appendix II). The USF groin field surveys initially terminated at -1.2 m NAVD88 and then at -1.5 m NAVD88. Most of the Long Key surveys extended to a depth of -3.0 m NAVD88. As the DOC delineates the seaward limit of nearshore sediment motion induced by shallow-water waves, only those profiles that extend to or beyond the DOC are suitable for use in quantifying profile volume change and thereafter a littoral sediment budget for the project area.
2. Structural Volume Effects
The Consultant sought to determine what consideration was given to the profile data and corresponding volume change estimates when a survey transect crossed some or all of a groin structure. The volume occupied by each of the groin structures could theoretically yield an overestimate of retained fill volume and therefore project performance. The USF profile data did not distinguish between the presence of a groin structure or unconsolidated sand. However this structural volume is small relative to the scale of the project. Furthermore, this “error” was carried over to each subsequent monitoring interval. Thus, the inclusion of the structures when quantifying sand volume change likely had no significant effect on the groin field performance assessment.
3. May 2008 Beach Fill The Consultant attempted to locate reference to a beach fill project observed by the client in May 2008. No reference to a May 2008 construction event at Upham Beach was contained in the technical documents reviewed during this investigation.
. 4. Pre-Construction Shoreline Location
The Consultant constructed a map illustrating the location of the Upham Beach shoreline (i.e., 0.0 m NAVD88) prior to groin field installation.
Report of Investigation Upham Beach T-Groin Performance
Randall W. Parkinson Version control January 25, 2011
12 RWParkinson Consulting, Inc. Melbourne, Florida (321) 373-0976 www.rwparkinson.com
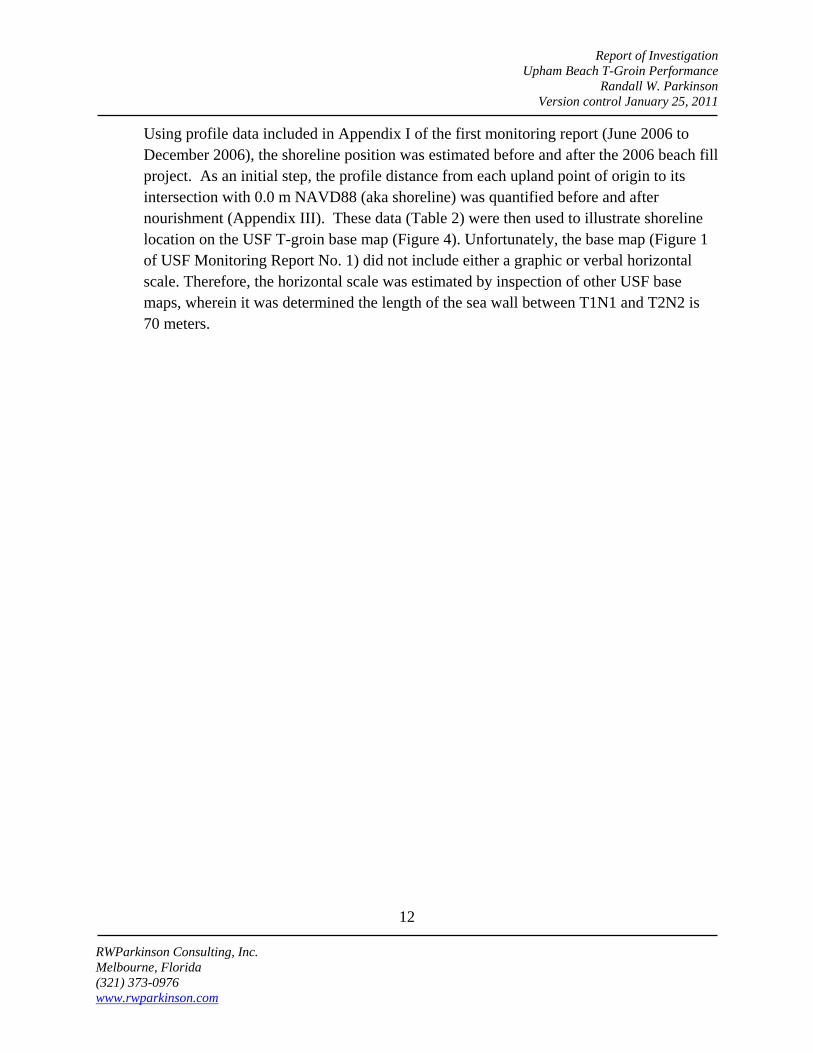
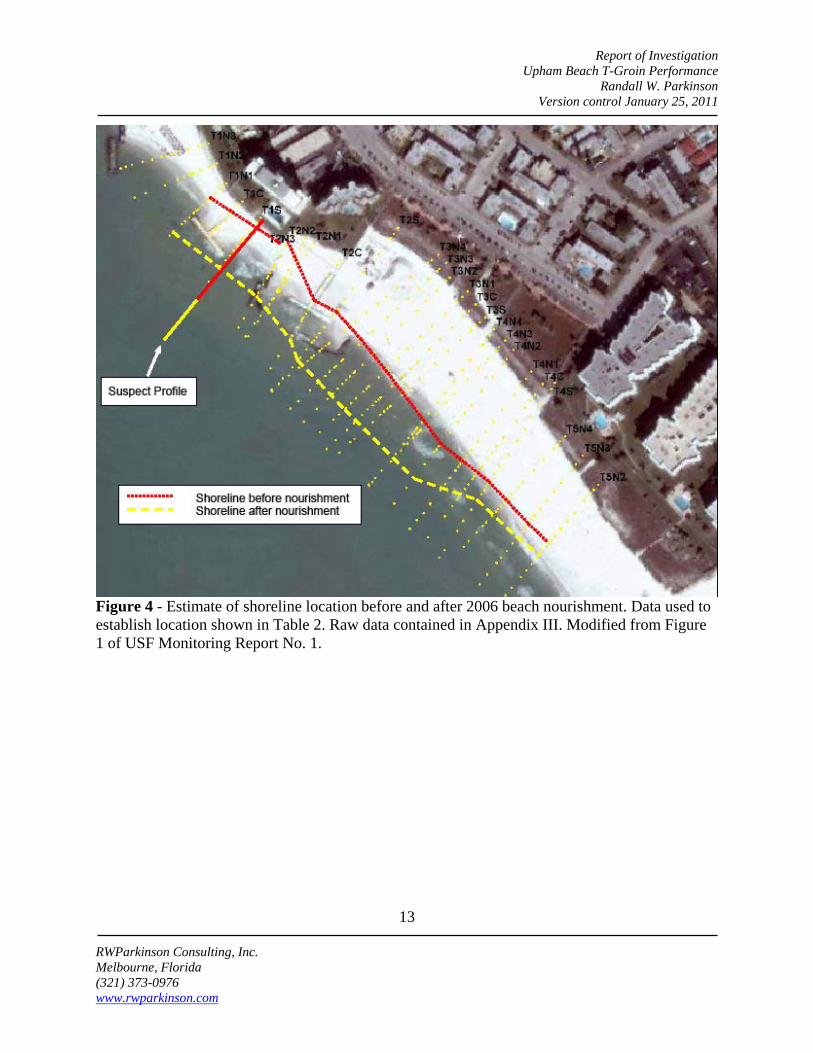
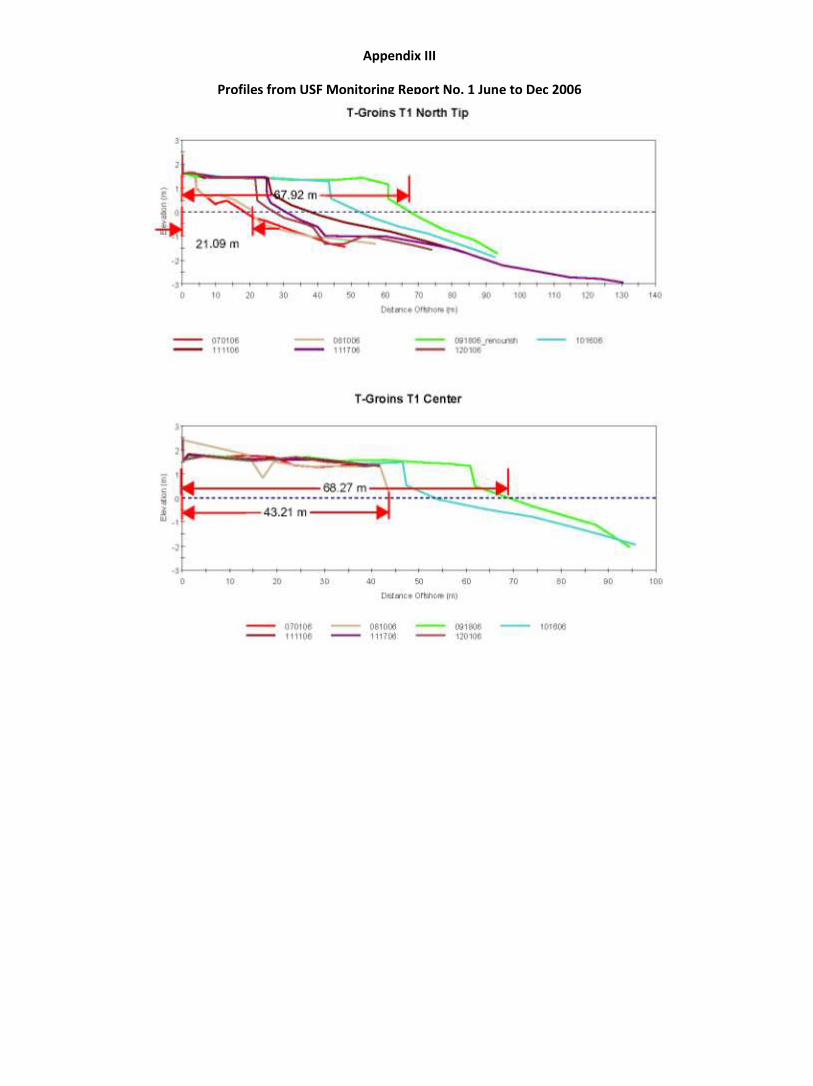
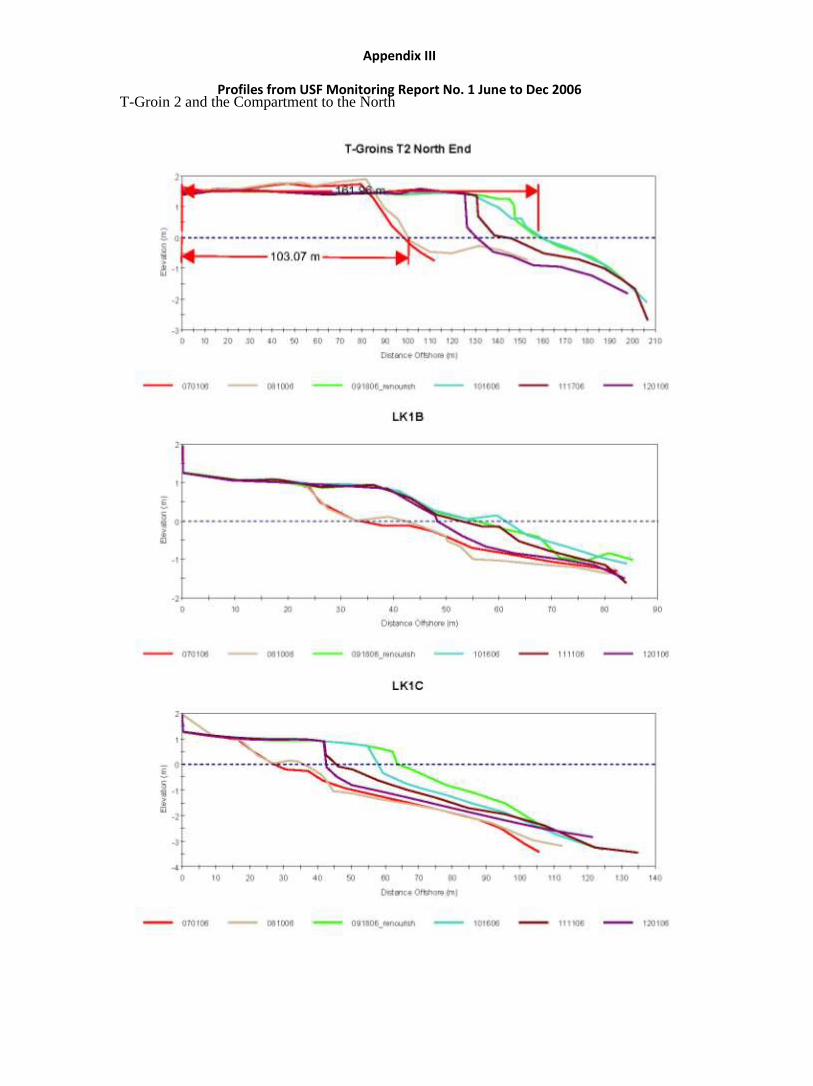
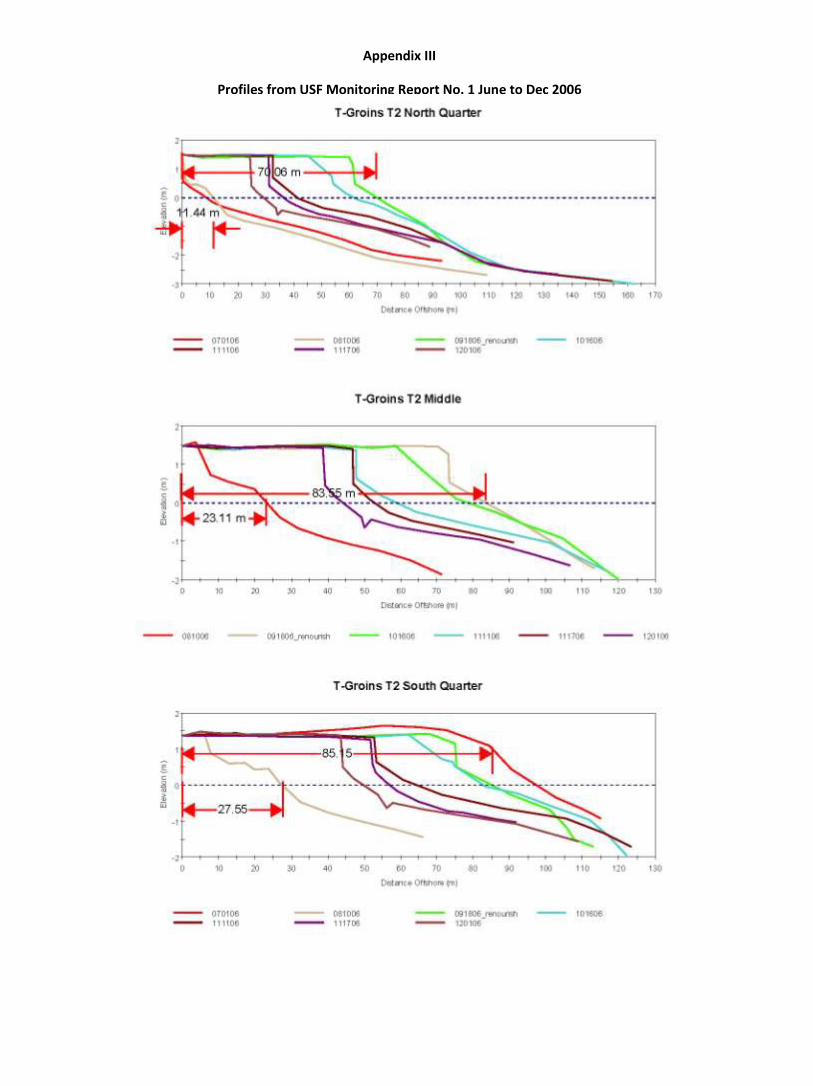
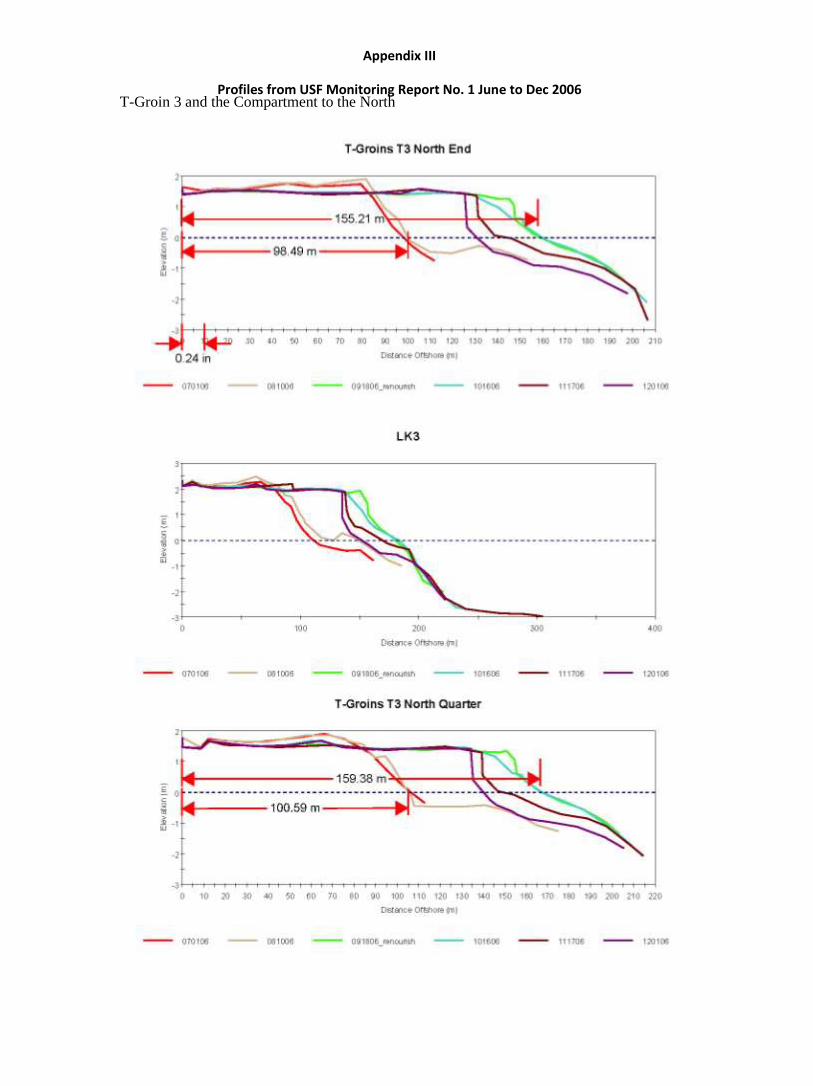
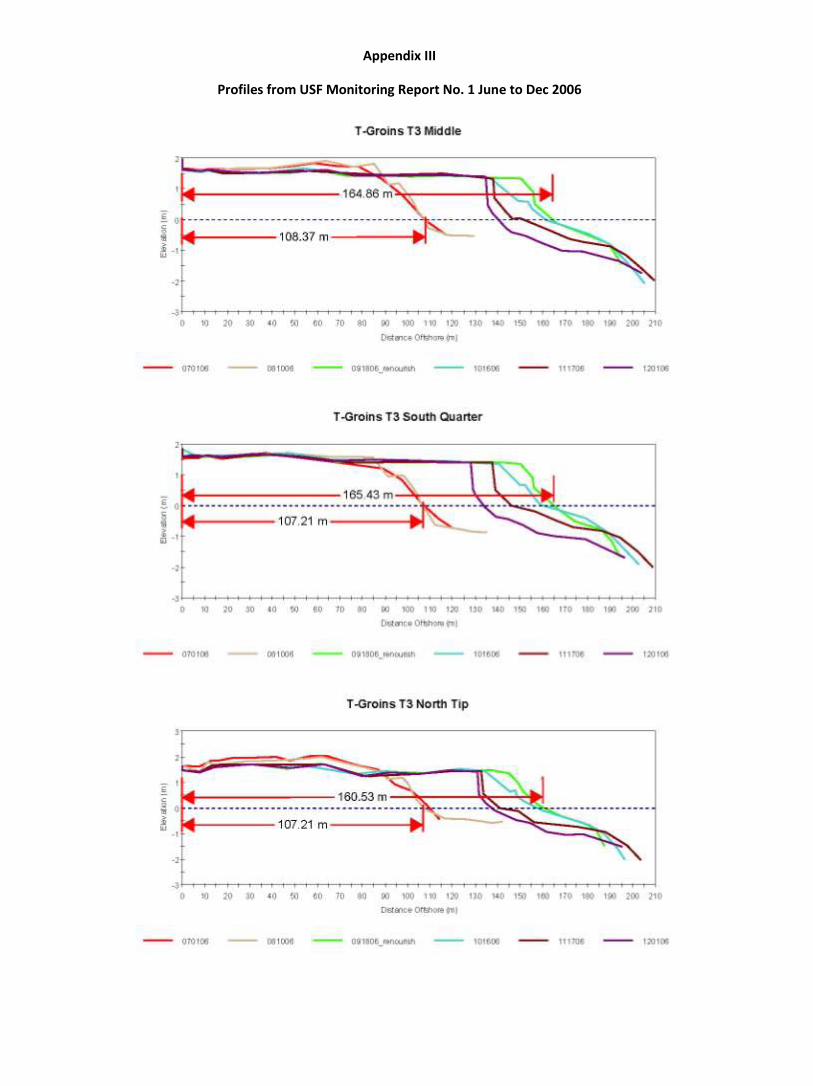
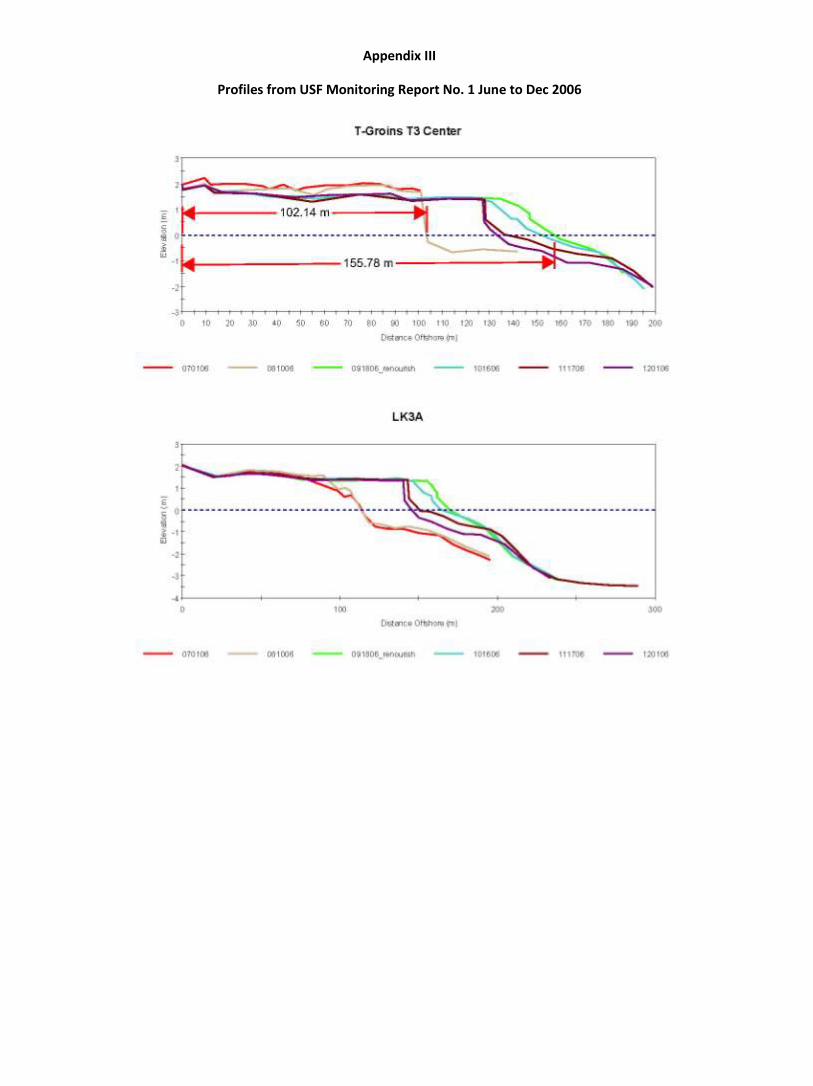
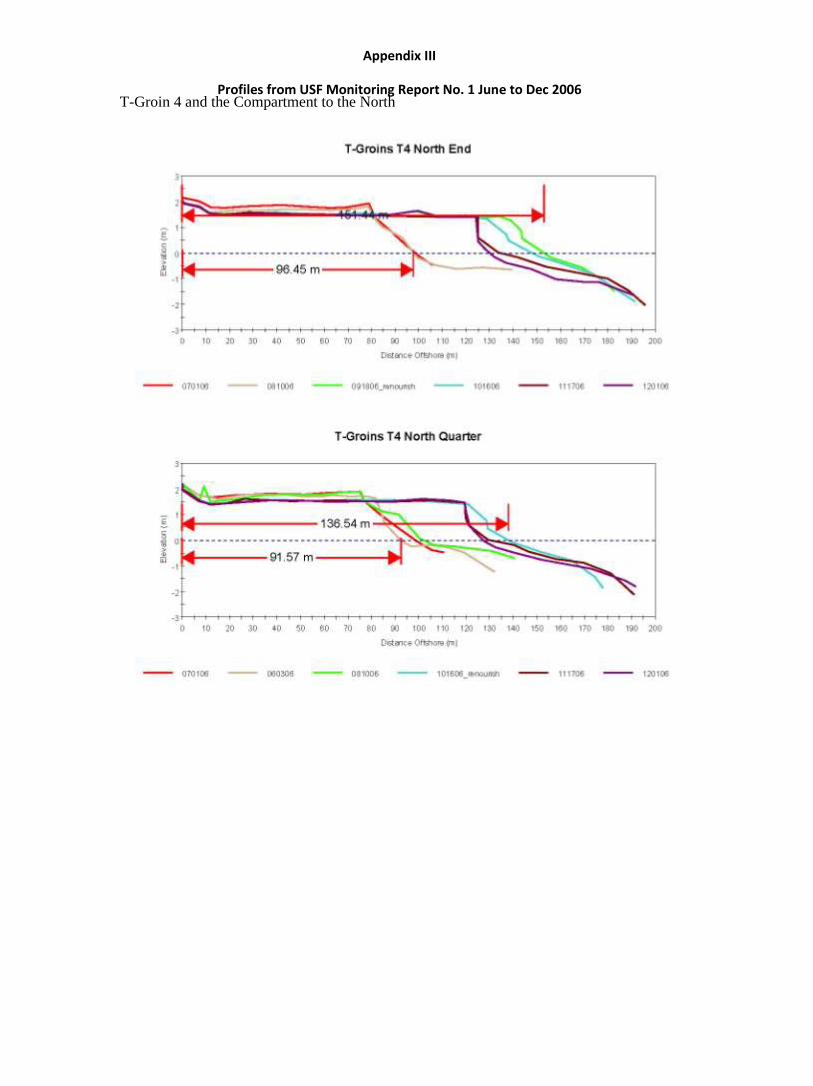
Using profile data included in Appendix I of the first monitoring report (June 2006 to December 2006), the shoreline position was estimated before and after the 2006 beach fill project. As an initial step, the profile distance from each upland point of origin to its intersection with 0.0 m NAVD88 (aka shoreline) was quantified before and after nourishment (Appendix III). These data (Table 2) were then used to illustrate shoreline location on the USF T-groin base map (Figure 4). Unfortunately, the base map (Figure 1 of USF Monitoring Report No. 1) did not include either a graphic or verbal horizontal scale. Therefore, the horizontal scale was estimated by inspection of other USF base maps, wherein it was determined the length of the sea wall between T1N1 and T2N2 is 70 meters.
Report of Investigation Upham Beach T-Groin Performance
Randall W. Parkinson Version control January 25, 2011
13 RWParkinson Consulting, Inc. Melbourne, Florida (321) 373-0976 www.rwparkinson.com
Figure 4 - Estimate of shoreline location before and after 2006 beach nourishment. Data used to establish location shown in Table 2. Raw data contained in Appendix III. Modified from Figure 1 of USF Monitoring Report No. 1.
Report of Investigation Upham Beach T-Groin Performance
Randall W. Parkinson Version control January 25, 2011
14 RWParkinson Consulting, Inc. Melbourne, Florida (321) 373-0976 www.rwparkinson.com
Appendix I Profile labels
Text Profile labels
Before (m)
After (m)
Difference (m)
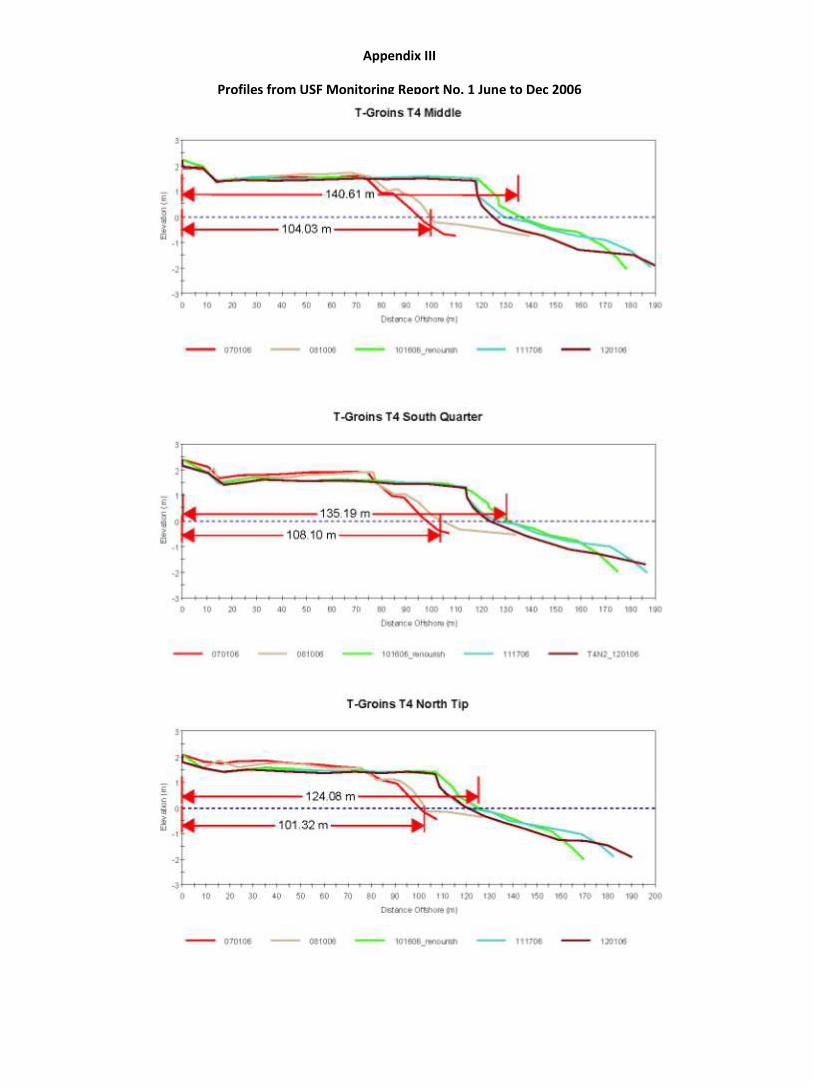
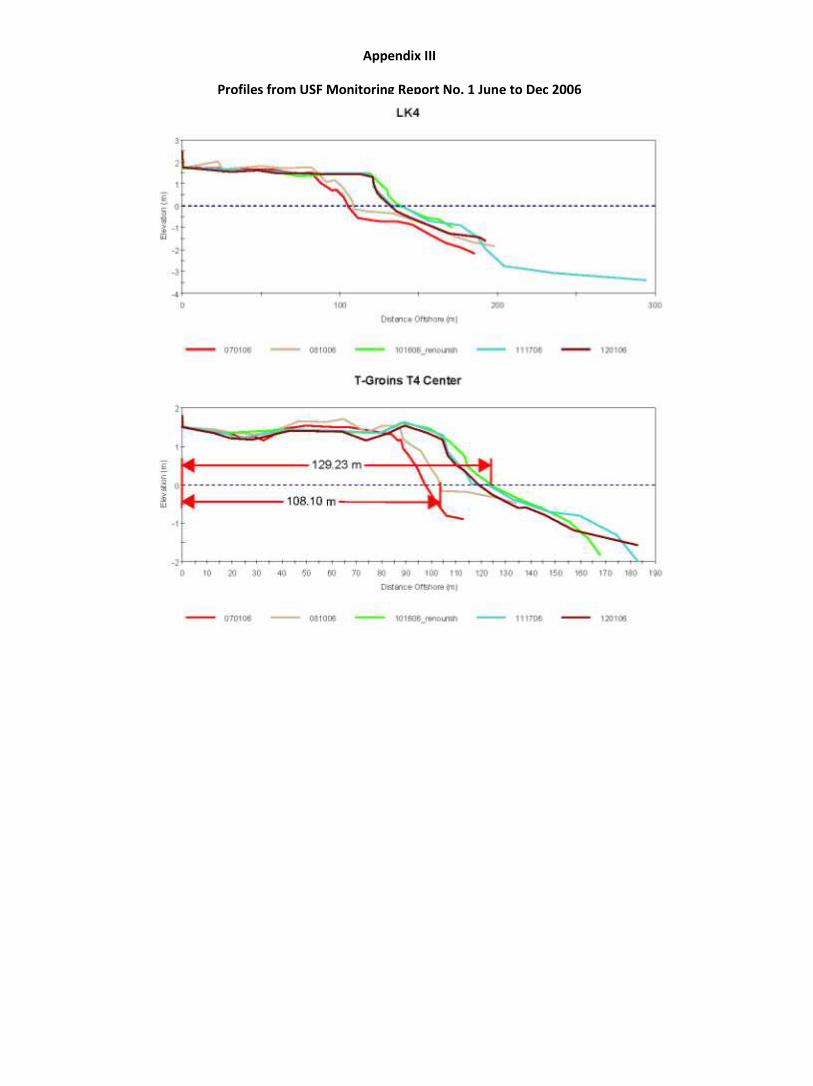
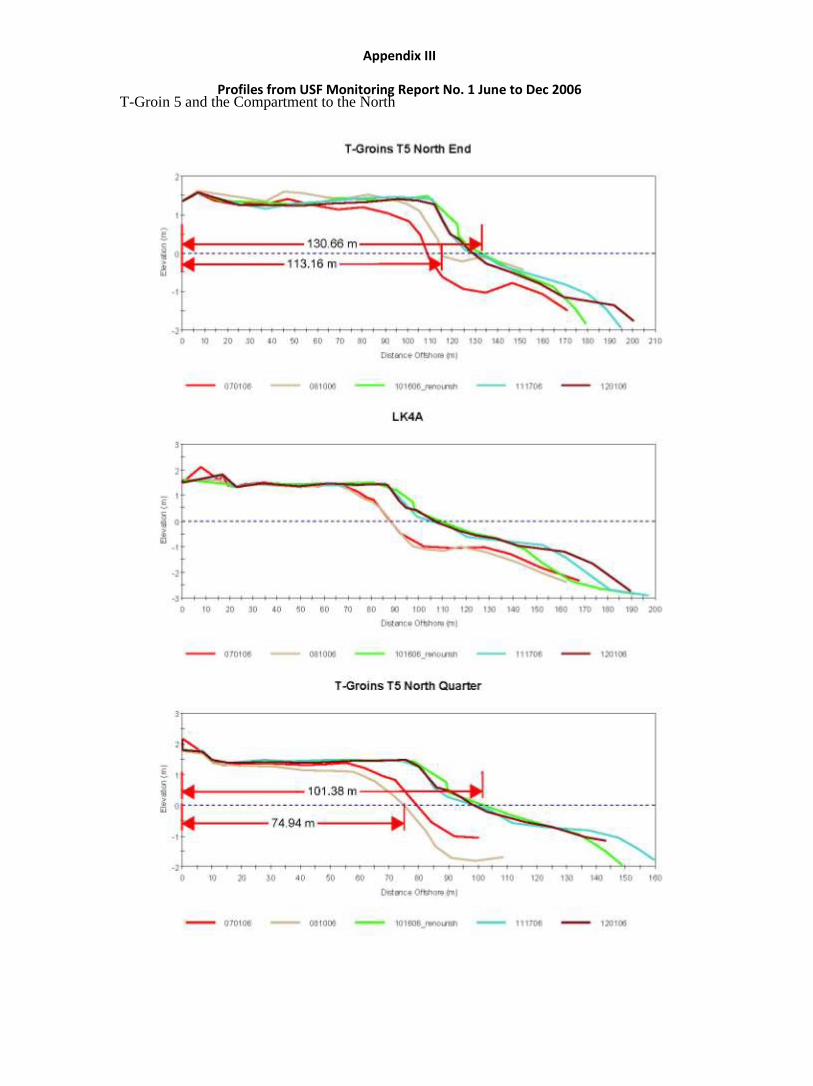
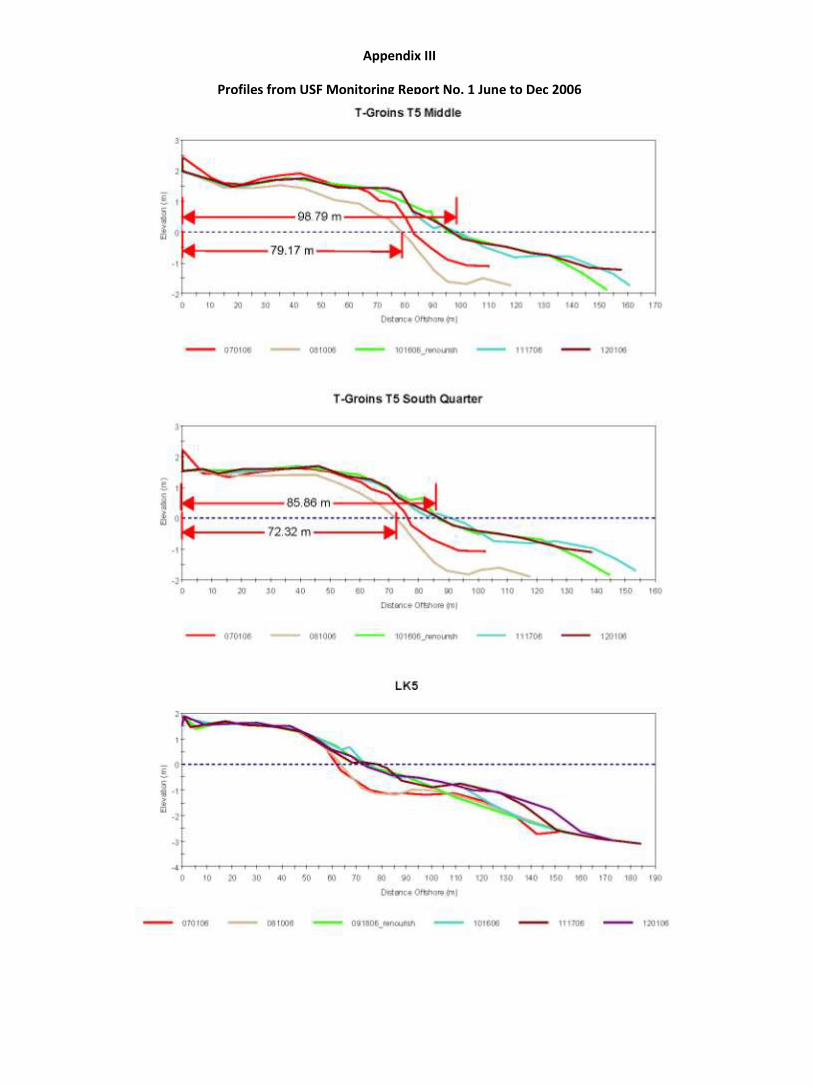
T1M T1N3 35 67 32 T1SQ T1N2 25 67 43 T1NT T1N1 21 68 47 T1C T1C 43 68 25 T2NE T1S 103 162 59 T2NQ T2N3 11 70 59 T2M T2N2 23 84 60 T2SQ T2N1? 28 85 58 T2NT T2N1? 29 86 57 T2C T2C 47 91 44 T3NE T2S 98 155 57 T3NQ T3N4 101 159 59 T3M T3N3 108 165 56 T3SQ T3N2 107 165 58 T3NT T3N1 107 161 53 T3C T3C 102 156 54 T4NE T3S 96 151 55 T4NQ T4N4 92 137 45 T4M T4N3 104 141 37 T4SQ T4N2 108 135 27 T4NT T4N1 101 124 23 T4C T4C 108 129 21 T5NE T4S 113 131 18 T5NQ T5N4 75 101 26 T5M T5N3 79 99 20 T5SQ T5N2 72 86 14
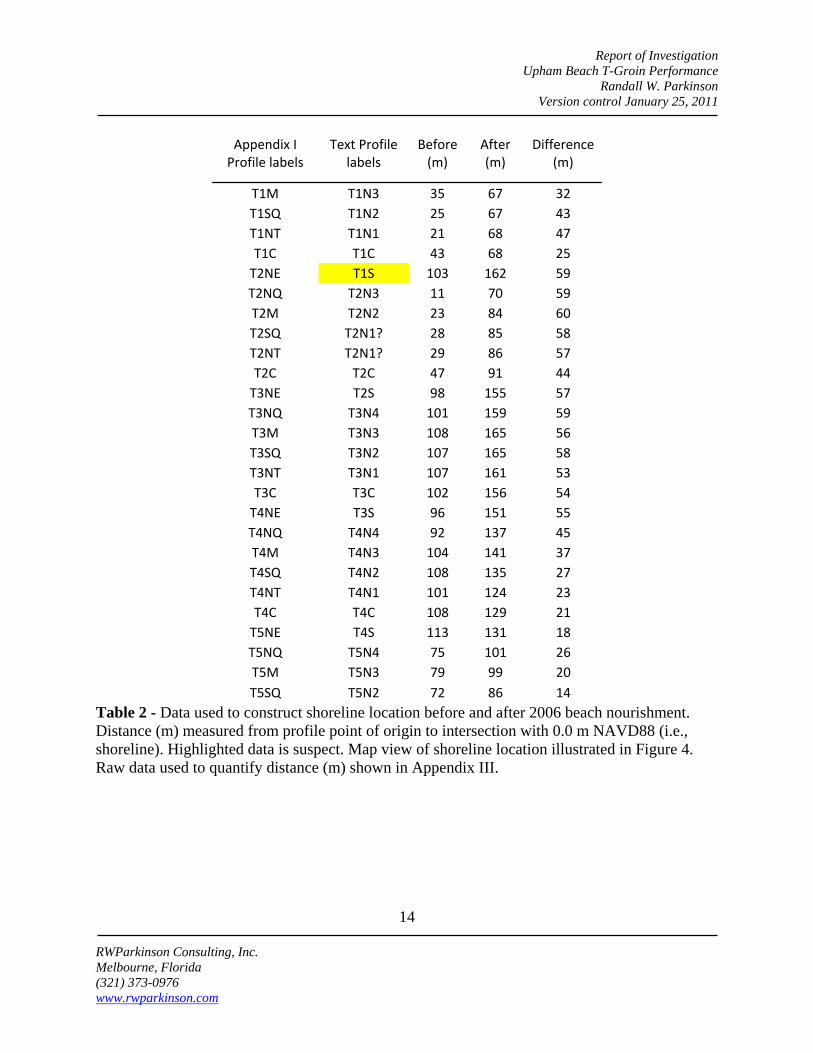
Table 2 - Data used to construct shoreline location before and after 2006 beach nourishment. Distance (m) measured from profile point of origin to intersection with 0.0 m NAVD88 (i.e., shoreline). Highlighted data is suspect. Map view of shoreline location illustrated in Figure 4. Raw data used to quantify distance (m) shown in Appendix III.
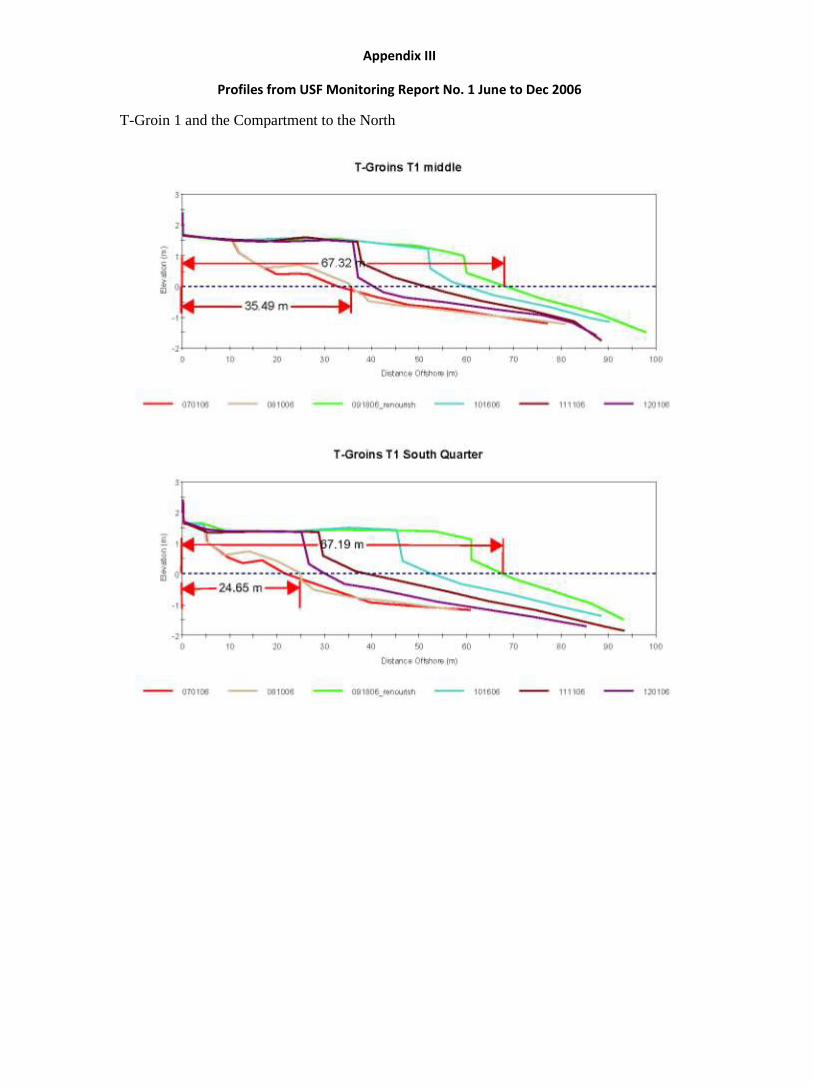
Appendix III
Profiles from USF Monitoring Report No. 1 June to Dec 2006
T-Groin 1 and the Compartment to the North
Appendix III
Profiles from USF Monitoring Report No. 1 June to Dec 2006
Appendix III
Profiles from USF Monitoring Report No. 1 June to Dec 2006 T-Groin 2 and the Compartment to the North
Appendix III
Profiles from USF Monitoring Report No. 1 June to Dec 2006
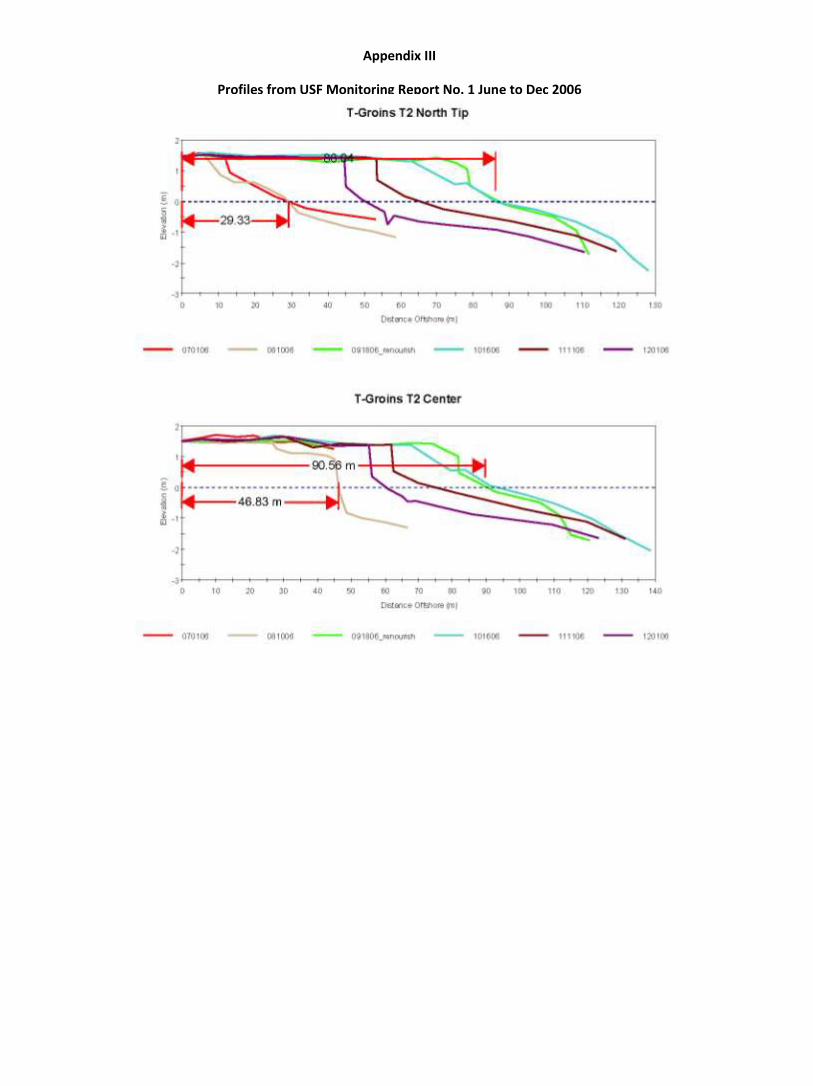
Appendix III
Profiles from USF Monitoring Report No. 1 June to Dec 2006
Appendix III
Profiles from USF Monitoring Report No. 1 June to Dec 2006 T-Groin 3 and the Compartment to the North
Appendix III
Profiles from USF Monitoring Report No. 1 June to Dec 2006
Appendix III
Profiles from USF Monitoring Report No. 1 June to Dec 2006
Appendix III
Profiles from USF Monitoring Report No. 1 June to Dec 2006 T-Groin 4 and the Compartment to the North
Appendix III
Profiles from USF Monitoring Report No. 1 June to Dec 2006
Appendix III
Profiles from USF Monitoring Report No. 1 June to Dec 2006
Appendix III
Profiles from USF Monitoring Report No. 1 June to Dec 2006 T-Groin 5 and the Compartment to the North
Appendix III
Profiles from USF Monitoring Report No. 1 June to Dec 2006
Related Documents