Repo runs: Evidence from the tri-party repo market * Adam Copeland † , Antoine Martin ‡ , and Michael Walker § May 13, 2011 Abstract This paper provides a quantitative account of the tri-party repo market during the fi- nancial crisis. We use data from July 2008 to early 2010 to show that the level of haircuts and the amount of funding were surprisingly stable in this market. The stability of the haircuts is in contrast to evidence from the bilateral repo market, as shown in Gorton and Metrick (2010). Adjustments in volume of funding to dealers is not gradual, but the amount of funding in the tri-party repo market can decrease precipitously. This suggests that runs in the tri-party repo market resemble traditional bank runs. Keywords: Tri-party repo, Wholesale funding, Short-term funding JEL classification: E44, E58, G24 * We would like to thank Viral Acharya, Brian Begalle, Michele Braun, Lucinda Brickler, Dan Dehlinger, Darrell Duffie, Michael Fleming, Ken Garbade, Gary Gorton, Jamie McAndrews, Susan McLaughlin, Steve Pesek, Andy Sturm, and members of the Task Force, for helpful comments on an earlier draft. All remaining errors are our own. The views expressed in this paper are those of the authors and do not necessarily reflect the position of the Federal Reserve Bank of New York or the Federal Reserve System. † Federal Reserve Bank of New York; e-mail: [email protected] ‡ Federal Reserve Bank of New York; e-mail: [email protected] § Federal Reserve Bank of New York; e-mail: [email protected]

Welcome message from author
This document is posted to help you gain knowledge. Please leave a comment to let me know what you think about it! Share it to your friends and learn new things together.
Transcript

Repo runs: Evidence from the tri-party repo market ∗
Adam Copeland†, Antoine Martin‡, and Michael Walker§
May 13, 2011
Abstract
This paper provides a quantitative account of the tri-party repo market during the fi-nancial crisis. We use data from July 2008 to early 2010 to show that the level of haircutsand the amount of funding were surprisingly stable in this market. The stability of thehaircuts is in contrast to evidence from the bilateral repo market, as shown in Gortonand Metrick (2010). Adjustments in volume of funding to dealers is not gradual, but theamount of funding in the tri-party repo market can decrease precipitously. This suggeststhat runs in the tri-party repo market resemble traditional bank runs.
Keywords: Tri-party repo, Wholesale funding, Short-term fundingJEL classification: E44, E58, G24
∗We would like to thank Viral Acharya, Brian Begalle, Michele Braun, Lucinda Brickler, Dan Dehlinger,Darrell Duffie, Michael Fleming, Ken Garbade, Gary Gorton, Jamie McAndrews, Susan McLaughlin, StevePesek, Andy Sturm, and members of the Task Force, for helpful comments on an earlier draft. All remainingerrors are our own. The views expressed in this paper are those of the authors and do not necessarily reflect theposition of the Federal Reserve Bank of New York or the Federal Reserve System.
†Federal Reserve Bank of New York; e-mail: [email protected]‡Federal Reserve Bank of New York; e-mail: [email protected]§Federal Reserve Bank of New York; e-mail: [email protected]

1 Introduction
This paper studies the behavior of haircuts and quantities in the US tri-party repo market during
the crisis. This is a large market which plays an important role as a key source of short-term
funding for large securities dealers. As such, it is important to understand the stability of this
market during times of stress, and the potential for runs in this market. Indeed, the problems
experienced by Bear Stearns and Lehman Brothers during the crisis were associated with a
large and precipitous decrease of their tri-party repo funding. We show that when a securities
dealer’s solvency is called into question, the main margin of adjustment in the tri-party repo
market is a decrease in the quantity of funding, as opposed to changes in the level of haircuts.
Further, the adjustment in funding appears to be highly non-linear, in that funding does not
seem to affected until some critical threshold is reached, after which funding dramatically falls.
We argue these run dynamics resemble those of traditional bank runs and we documented how
they differ from runs observed in other repo markets.
The US tri-party repo market has evolved into the main source of funding for securities
dealers. Large dealers typically obtain several hundred billion dollars of funding in this market
from cash investors, including money market mutual funds and securities lenders. This funding
was mostly in overnight term before and during the crisis. The tri-party repo market owes its
name to the fact that two clearing banks provide intermediation services. The clearing banks
settle the repos on their books, guarantee the availability of the collateral in case of dealer
default, value the collateral, and provide services to help dealers allocate the collateral to repos.
In addition, the clearing banks extend large amounts of intraday credit to dealers.1
We show that haircuts in the tri-party repo market barely moved during the crisis, in stark
contrast with the behavior of haircuts in other repo markets, as documented by Gorton and
Metrick (2010). Gorton and Metrick study an interdealer bilateral repo market and show that
haircuts increased dramatically, similar to “haircut spirals” modeled in Brunnermeier and Ped-
1One of the goals of the the Task Force on Tri-Party Repo Infrastructure is to sharply reduce the amount ofintraday credit extended by the clearing banks in this market.
1

Figure 1: Differences in Haircuts Between Bilateral Repo and Tri-Party Repo
−10
0
10
20
30
40
50D
iffer
ence
(P
erce
ntag
e P
oint
s)
Jul08 Oct08 Jan09 Apr09 Jul09 Oct09 Jan10date
Treasury Agency GSE MBSAgency CMO High−Grade Corp Debt Alt−A, Prime MBSSubprime
Note: Difference in medians calculated as bilateral repo median minus tri-party repo median for each asset class.Vertical black line corresponds to Lehman Brothers’ bankruptcy.
ersen (2009). In the tri-party market, haircuts for all but the lowest quality collateral changed
very little. Even for low quality collateral, the increase in haircut was much less pronounced
than in the bilateral market. Figure 1 shows the differences in the average haircut between the
tri-party and the bilateral repo market. We discuss this figure in more detail later in the paper,
but note here that the increase in the spread between tri-party and bilateral repos is almost
entirely driven by increases in bilateral repo haircuts. Furthermore, these spreads are sizable
for high-grade corporate debt (over 10 percentage points in 2009) and enormous for Alt-A and
Subprime collateral (over 30 percentage points in 2009).
We also show that investors did not seem to make gradual adjustments to the quantity of
funding they provided. Instead, funding was mostly stable during and after the crisis period,
except in rare cases where funding dropped precipitously. We show that the Lehman’s tri-party
repo book decreased dramatically just days before the holding company declared bankruptcy.2
2We do not have data for Bear Sterns, but anecdotal evidence suggests that its experience was similar to that
2

Further, we show that for four other events where securities dealers which suffered adverse
shocks, funding and haircuts remained remarkably stable. The lack of adjustment in haircuts
and the potentially sharp adjustments in quantities make runs in the tri-party repo resemble
traditional bank runs (see Martin, Skeie, and von Thadden (2010) for a theoretical study).
Our paper is related to Gorton and Metrick (2010), who study the bilateral repo market. Our
paper does not add new evidence regarding this market but allows for a comparison between
the bilateral and the tri-party repo market. Krishnamurthy, Nagel, and Orlov (2011) have data
on the investments of money market mutual fund and securities lenders. Both of these types
of investors represent a large share of cash invested in the tri-party repo market. Consistent
with our paper, they show that funding appears mostly stable in the tri-party repo market. We,
however, are able to document the dealers’ funding positions in tri-party repo during the crisis,
which is especially interesting given the central role as a source of funding played by the US
tri-party repo market.
The remainder of the paper proceeds as follows...
2 The tri-party repo market in the US
In the US, a tri-party repo is a form of repo for which a third party, called the clearing bank,
provides intermediation services to the cash investor and the collateral provider.3 Tri-party
repos are popular in part because of the efficiency gains associated with the intermediation
role of the clearing bank.
2.1 Main actors in tri-party repo
There are three main actors in the US tri-party repo market: collateral providers, cash investors,
and the clearingbanks.
of Lehman. See, for example, Friedman (2010).3Appendix C in Copeland, Martin, and Walker (2010) defines and provides a brief overview of repos. See
also Garbade (2006).
3

Collateral providers borrow cash from the cash investors and secure the transaction by
posting collateral. The collateral providers supplying the majority of collateral in the tri-party
repo market are “primary dealers”. Primary dealers are banks or securities broker-dealers that
can trade directly with the Federal Reserve.4 Some large hedge funds and other institutions
with large portfolios of securities also participate in the tri-party repo market, but they represent
a small share of the total volume. From July 2008 to January 2010, there were at least 40
collateral providers in the tri-party repo market. We use the terms “collateral providers” and
“dealers” interchangeably in this paper.
There are at least two reasons why collateral providers enter the tri-party repo market. First,
dealers seek to economize on their use of capital, and so prefer to borrow cash to purchase the
securities they hold (Tuckman 2010). In turn, the securities can serve as collateral to obtain
cash. This is one way in which securities dealers can obtain leverage. 5
Second, dealers provide intermediation services to clients seeking cash, for example in
their role as prime brokers to hedge funds. This is typically done through a repo transaction,
where the dealer extends cash to the client and takes collateral. This collateral can then be
rehypothecated in the tri-party repo market, provided the clients allows it.
The second set of actors is the cash investors. They are more numerous and diverse than
the set of collateral providers. There are over 4,000 individual firms active as cash investors.
Money market mutual funds represent between a quarter and a third of the cash invested in the
tri-party repo market and securities lenders representing about 25 percent. Securities lenders
use the tri-party repo market to re-invest the cash collateral they receive when they loan secu-
4For more information on primary dealers, see http://www.newyorkfed.org/markets/primarydealers.html.5Consider the stylized example of a dealer with $1 billion in capital. This dealer can use its capital to buy
$1 billion in securities and repo these securities to obtain cash. If the haircut on the repo is 5%, the dealer canget $950 million in cash. With this cash, the dealer can buy new securities and repo them out to get more cash.Assuming the same haircut, the dealer can get an additional $902.5 million in cash in that way. Continuing thisprocess, the dealer can obtain a portfolio of securities worth $20 billion with its $1 billion in capital. The formulato find the value of the portfolio of securities is: 1+0.95+0.952 + ... = ∑∞
i=0 0.95i = 11−0.95 = 20. This example
provides an upper bound, as it assumes that the dealer is fully levered, which is not generally the case.
4
rities.6
According to FRBNY (2010), the top ten cash borrowers account for approximately 85
percent of the value of tri-party repo securities being financed, and the top ten cash investors
provide about 65 percent of the funds invested. The largest individual borrowers routinely
finance more than $100 billion in securities through. At the peak of market activity, the largest
dealer positions exceeded $400 billion. The largest cash investors individually provide more
than $100 billion in tri-party repo financing daily.
The third set of actors is the clearing banks: JPMorgan Chase (JPMC) and the Bank of New
York Mellon (BNYM). The clearing banks play an important role as intermediaries between
the collateral provider and the cash investor. They take custody of securities used as collateral
in a tri-party repo transaction, they value the securities and make sure that the specified haircut
is applied, they settle the transaction on their books, and they offer services to help dealers
optimize the use of their collateral.7 The tri-party repo clearing banks do not match dealers
with cash investors nor do they play the role of brokers in that market.
The clearing banks act as an agent to the collateral providers and the cash investors in all
the roles noted above. In the U.S. tri-party repo market, the clearing banks also play the role of
principal because they finance the collateral provider’s securities during the day. We describe
the timing that leads to this extension of credit in the next section.
6In the US, a security cannot be sold short by an institution that does not borrow the secu-rity to make delivery, an activity also known as “naked” short selling (SEC regulation SHO, seehttp://www.sec.gov/divisions/marketreg/mrfaqregsho1204.htm). The ban on naked short selling creates an im-portant role for securities lending, which allows an institution that wants to sell a securities short to borrow it.Custodial banks often provide the service of lending the securities of their clients. In the US, most securitieslending is done against cash collateral. Hence, securities lenders usually have large pools of cash that they seekto re-invest, on behalf of their clients. While investment strategies for these pools of cash may differ, they oftenresemble the investment strategies of money market mutual funds. This is in part due to the fact that securitieslenders must return the cash collateral to a borrower of a security as soon as the borrower returns the security.Since the return of the security is at the discretion of the borrower, the securities lender is exposed to “redemptionrequests” that are somewhat similar to pressures faced by money market mutual funds.
7Each of these roles is considered in more details in Copeland, Martin, and Walker (2010).
5

2.2 Timing of events
This section describes the timing of events in the tri-party repo market. This description fo-
cuses on market practice prior to the proposed reforms announced on May 17, 2010.8 A par-
ticular important step in the timing of a repo is the morning unwind, described below, which
contributed to the fragility of this market.
2.2.1 Morning: Trade agreement
A cash investor and a collateral provider typically agree on a tri-party repo before 10 AM.
Anecdotal evidence suggests that 90 to 95 percent of a dealer’s tri-party repos are arranged
before that time. The agreement specifies the amount of cash the investor will provide, the
interest rate, the term of the repo, and the acceptable collateral.
The majority of tri-party repos are believed to be overnight or “open” repos. Open repos
roll over by default, unless one of the parties explicitly chooses to cancel the transaction. The
haircut that applies to a particular collateral class is not negotiated at the trade level but, instead,
is specified in the appendix of the custodial undertaking agreement between the three parties.
Hence, changing haircuts requires amending the agreement. Typically, the custodial under-
taking agreement contains several schedules specifying, for each schedule, which collateral is
acceptable and the haircut that applies. The acceptable collateral for a repo generally refers
to one such schedule. A trade agreed upon in the morning does not settle until the afternoon,
around 6 PM.
2.2.2 Afternoon: Collateral allocation
In the afternoon, after the close of Fedwirer Securities Service and the Depository Trust &
Clearing Corporation (DTCC), the collateral provider knows the composition of its portfolio,8The report of the Task Force on Tri-Party Repo Infrastructure is available at
http://www.newyorkfed.org/prc/report 100517.pdf. The Federal Reserve Bank of New York released awhite paper commenting on the report and describing the weaknesses in that market. The white paper is availableat http://www.newyorkfed.org/banking/nyfrb triparty whitepaper.pdf
6
since securities can no longer be traded. With this information, and with the information
provided by the cash investors regarding the amount of financing they will provide and the
securities they will accept as collateral, the dealers can allocate acceptable collateral to each
trade. The clearing-bank provide tools to make sure that only collateral that is acceptable to
the investor gets allocated to repos and to guarantee that the haircut specified in the custodial
agreement applies.
The settlement of the initial leg of the repo trade occurs on the books of the clearing banks
in the afternoon. Balances are transferred from the investor’s balances account to the collat-
eral provider’s balances account, while securities are transferred from the collateral provider’s
securities account to the cash investor’s securities account.
2.2.3 Next morning: The “unwind”
Between 8 and 8:30 AM the next morning, the clearing banks “unwind” the tri-party repo
trades. The unwind consists of sending the balances back to the investor’s balances account
and the securities back to the collateral provider’s securities account on the balance sheet of
the clearing bank. At the same time, the clearing banks extend intraday credit to the dealer
since the securities are no longer financed by the tri-party investors.
All repos are unwound, including terms repos and open repos that are rolled over, because
the unwind is mainly done for operational ease. Term trades are “rewound” every evening,
at the same time as the initial leg of new repos are settled. Reallocating collateral for term-
trades may be desirable even if the clearing bank did not extend intraday credit to the dealers.
Tri-party repo is considered “general collateral” financing, meaning that an investor may care
about the class of collateral it receives, but not about the specific issue. Hence, the optimal
collateralization of a trade could vary from day to day, or even intraday, as the dealer’s portfolio
of securities changes.
The unwind is important because collateral providers need access to their securities during
the day for their business activities. Unwinding the repos makes collateral substitutions easier.
7

Indeed, it is operationally complicated to substitute collateral in the cash investor’s account at
the clearing bank, especially for securities that are traded often, such as Treasuries. It is more
convenient to substitute collateral on the dealer’s account at the clearing bank. The clearing
bank has access to the whole pool of securities for each dealer, rather than the subset that each
investor takes as collateral.
Dealer often keep in custody at the clearing bank securities that are not financed through
tri-party repos. The clearing banks employ a risk management concept called Net Free Equity
(NFE) to ensure that the value assigned to the dealer’s securities on their book exceeds the
value of the intraday loan. Using NFE, the clearing banks can allow collateral providers to buy
and sell securities in an operationally efficient manner.
2.3 Empirical description
The Federal Reserve Bank of New York collects data on the tri-party repo market. The data
to which we have access are the quantity and type of collateral posted in this market and the
haircuts associated with various types of collateral. These data are not the universe of dealers
and investors, but rather all the major players, whom account for the vast majority of tri-party
repo activity. For each dealer, we observe the daily total value of collateral posted and the
amount of posted collateral associated with the haircut, by collateral class. For example, we
observe that dealer X posted $102 billion of Agency MBS on January 1, 2009 as collateral
and that $2 billion of that collateral is for the haircut. Hence, we can deduce that dealer X
borrowed $100 billion in cash, securing that loan with $102 in Agency MBS.9
For investors, we have the data in two different forms. For one clearing bank, denoted
clearing bank A, we know the joint distribution of collateral and investors. For each investor,
we observe the daily total value of collateral accepted by asset class (WITH OR WITHOUT
THE HAIRCUT/accured interest?). For the other clearing bank, denoted clearing bank B, we
9The collateral valuations include accrued interest, and so our calculations of cash borrowed will be overstatedby the amount of accrued interest. This is a tiny amount, however, especially since we are considering a periodof very low interest rates.
8

Figure 2: Tri-Party Repo Market Size ($ billions of collateral)
0
500
1,000
1,500
2,000
2,500B
illio
ns (
$)
Jul−08 Oct−08 Jan−09 Apr−09 Jul−09 Oct−09 Jan−10 Apr−10
US Treasuries and Strips Agency DebentureAgency MBS Other Fed−EligibleNon Fed−Eligible Cash
Note: July 17, 2008 excluded due to missing data from one clearing bank. Vertical line represents LehmanBrothers’ bankruptcy.
know the joint distribution of investors and dealers. For each dealer, we observe the daily total
amount of cash lent by investors. Both the investor and dealer data are at a daily frequency,
from July 1, 2008 to January 27, 2010.
Our data begins after the fall of Bear Stearns but before the Lehman Brothers bankruptcy.
Before Lehman declared bankruptcy, almost $2.5 trillion worth of collateral was posted in the
tri-party repo market each day. This is slightly down from a historic high of $2.8 trillion in
April 2008 (FRBNY 2010). After Lehman Brothers declared bankruptcy, there was a gradual
fall in collateral posted in this market until about July 2009, after which the amount of collateral
posted in the tri-party repo market stabilized at a level slightly above $1.5 trillion (see figure 2).
This decline is also seen in the amount of cash borrowed, and so is not a product of haircuts
increasing over time. We believe the decline in collateral posted in tri-party repo reflect a
number of outside processes, rather than reflecting problems with the tri-party repo market
itself. These include: a general de-leveraging by dealers in response to the financial crisis;
9

runoff caused by maturing assets and a decline in new issuance; declines in valuations that
reduced the size of dealers’ portfolios and the removal of Agency MBS securities through the
Federal Reserve’s Large Scale Asset Purchase (LSAP) program.10 Given the tri-party repo
market stabilized in terms of quantity of collateral posted in the summer of 2009, we divide
our sample into two periods. We denote from July 2008 to July 2009 as the “crisis” period and
from July 2009 to January 2010 as the “stable” period.
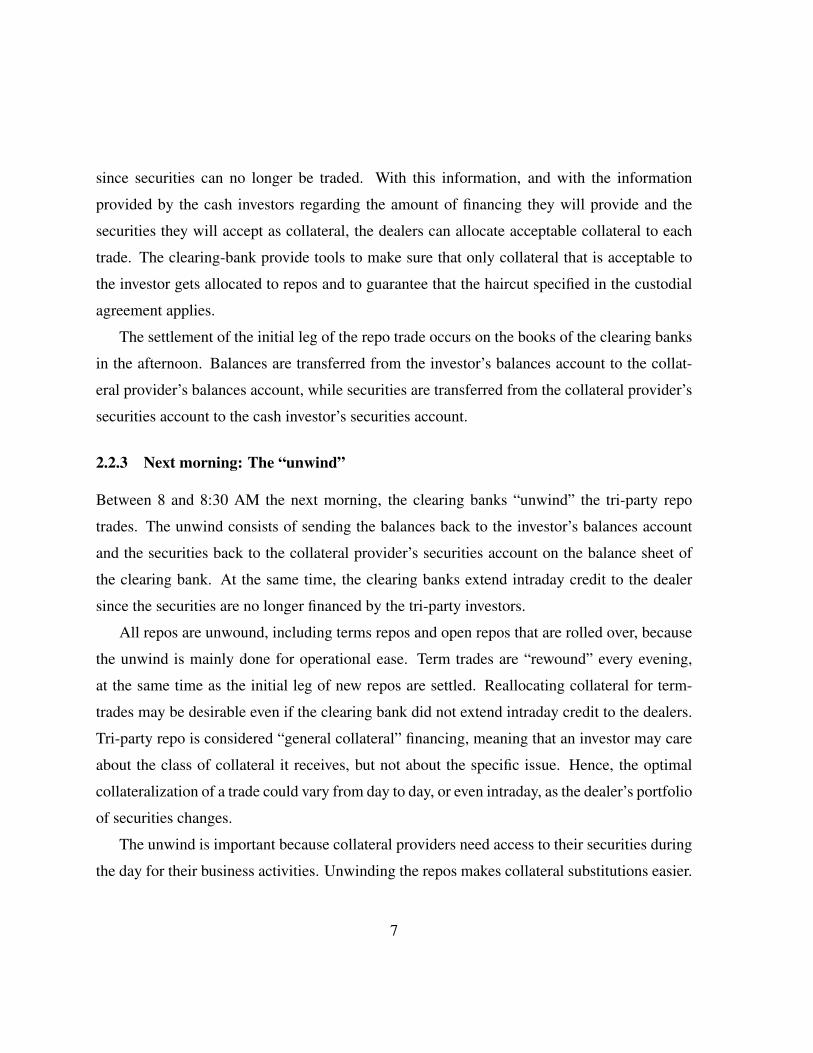
Across these two periods, the composition of collateral posted in tri-party repo did not
change much (see table 1). Highly liquid securities, such as US Treasuries, Agency MBS, and
Agency Debt, composed over three-quarters of all collateral posted over the whole sample.
The next largest asset class, Corporate Bonds, maintains a share of just over 5 percent of the
market. However, the comparison between the stable and the crisis period does obscure a
substantial fall in non Fed-eligible collateral.11 As seen in figure 2, there was about $600
billion non Fed-eligible collateral in July and August of 2008. Starting around September
2008 (the same month Lehman Brothers declared bankruptcy), the amount of non Fed-eligible
collateral posted in tri-party repo steadily fell until the first quarter of 2009, when it leveled
out around $300 billion.(see Krishnamurthy, Nagel, and Orlov (2011) for more details on the
decline of use non Fed-eligible securities as collateral in repo transactions.).
From July 2008 to January 2010, there were 32 dealers active in our sample, the majority
of which are primary dealers. Even within our sample of the larger dealers in tri-party repo,
the dealer side of the market is quite concentrated, with the top 5 dealers accounting for 57
percent of collateral posted and the top 10 accounting of 86 percent. We separate dealers into
two categories: “large” dealers that provide more than $50 billion in collateral on average,
and “small” dealers that provide less than $50 billion.12 On average, “large” dealers provide
about $140 billion of collateral each day using a 11 different types of collateral, while “small”
10Background on the LSAP can be found at http://www.newyorkfed.org/markets/funding_archive/lsap.html.11Fed-eligible securities are securities that can be settled on the Fedwirer Securities Service, while Non-Fed
eligible, also called DTC-eligible, can be settled by the Depository Trust Company (DTC).12The one exception is that we treat Lehman Brothers as a large dealer, as it averaged $173 billion prior to
September 15, 2008.
10
Table 1: Composition of Tri-Party Repo Collateral (percent)Crisis Stable All
Agency Debentures 12.6 11.4 12.2Agency MBS 37.4 36.3 37.1
Fed-eligible Agency Remic 4.1 4.6 4.2collateral Ginnie Mae MBS Pools 0.9 1.2 1.0
Ginnie Mae REMICs 0.3 0.3 0.3US Treasuries and Strips 26.8 29.0 27.4
sub-total 82.1 82.7 82.2Asset Backed Securities 2.2 2.4 2.2
Commercial Paper 0.4 0.3 0.4Corporate Bonds 5.5 5.9 5.6
Non Fed-eligible DTC-Other 0.1 0.4 0.2collateral Equity 4.1 4.0 4.1
Money Market 1.3 1.6 1.4Municipal Bonds 0.9 0.7 0.9
Other 0.1 0.1 0.1Private Label CMO 2.7 2.0 2.5
Whole Loans 0.7 0.1 0.5sub-total 18.0 17.5 17.9
Note: ‘Crisis’ is the period from July 2008 to July 2009, ‘Stable’ is from July 2009 to January 2010 and ‘All’covers both sample periods. Fed-eligible securities are securities that can be settled on the Fedwirer SecuritiesService, while Non-Fed eligible, also called DTC-eligible, can be settled by the Depository Trust Company(DTC).
11

dealers provide $10 billion using 6 types of collateral.
Relatedly, we find that large dealers tend to borrow from a number of investors. Using the
investor data from clearing bank B, we find that the top 5 dealers borrow from an average of
53 investors each. Yet dealers still rely significantly on specific investors; for the top 5 dealers,
the largest investor’s share of a dealer’s overall borrowing is 19%. Not surprisingly, smaller
dealers borrow from fewer investors. The median number of investors for the five dealers who
borrow the smallest amounts is 1.13
On the investor side of the tri-party repo market, our data includes 241 investors. Like the
dealer side, there is concentration on the investor side, with 59 percent of collateral posted
being held by the largest 10 investors in our data. As indicated by their size distribution,
investors are quite heterogenous. The two largest groups, however, are money market mutual
funds (MMMF) and securities lending firms.
The largest group of investors typically lend about $20 billion each day, across a number of
dealers (CHECK NUMBER – CONDITIONAL ON CLEARING BANK or matching investors
across clearing banks?). Using the investor data from clearing bank B, we find that the largest
number of dealers to which an investor loaned cash on a single day was 8. Small investors,
which make up the majority of the investors in our data but account for only a small fraction of
the cash lent, generally lend to a single dealer. The value-weighted median number of dealers
to which an investor will lend cash on a single day is 5. The statistics on the number of dealers
to which an investor will lend are understated, however, since they are based on data from one
clearing bank and the larger cash investors are active with both clearing banks.
13The composition of dealers for each clearing bank differ slightly. While each clearing bank had the samenumber of dealers from July 1, 2009 to January 27, 2010, the average dealer at one clearing bank provided abouttwice as much collateral in tri-party repo than the average dealer at the other clearing bank. These differencesin dealer composition should be kept in mind when considering statistics based on activity on one clearing bank.THAT SAID, BONY INCLUDED GCF and JPMC DID NOT.
12

3 Main Empirical Findings
In this section we focus on haircuts and the stability of investor-dealer relationships in the
tri-party repo market. We first document how haircuts differ across collateral classes and
counterparties. Next, we detail how haircuts did not move during the recent financial crisis,
for the most part. Finally, we document how little investors and dealers alter the collateral-
posted or cash-invested portions of their repo arrangements, on a daily basis. This last result is
particularly surprising given the recent turmoil in financial markets and our understanding that
the vast majority of tri-party repo contracts in our data are overnight.14
3.1 Haircuts in tri-party repo
If the dealer defaults on its repo agreement, the collateral securing the transaction partially
protects the cash investor from losses. The haircut on a repo transaction, which measures
how much a repo transaction is over-collateralized, is a way for a cash investor to minimize
losses from liquidating collateral in the event of default. Given that collateral classes differ in
liquidity, we expect to see haircuts differ across collateral class.
Our data shows that haircuts, as expected, differ across collateral type, with more illiquid
collateral commanding higher haircuts. We list average haircuts by collateral class in table 2
for the whole sample, as well as for the crisis and stable sub-periods. As expected, the more
liquid securities, such as US Treasuries, Agency Debentures, and Agency MBS, have lower
haircuts relative to the less liquid securities, such as Asset Backed Securities and Corporate
Bonds. Further, the standard deviations of haircuts by collateral class increase as we move
from more to less liquid collateral. This suggests that counterparty risk may play a role in the
setting of haircuts, especially for the less liquid collateral classes.
To better illustrate the variance in haircuts by counterparty, in figure 3 we plot median
14While we lack maturity information in our data, industry contacts consistently report that the largest tenor inthis market is, by far, overnight. For example, FitchRatings Fund & Asset Manager Rating Group reports in theirMoney Market Funds U.S.A. Special Report (Oct. 4, 2010) that 81.8% of repo allocations by Fitch-Rated taxablemoney market funds as of August 31, 2010 were overnight.
13

Table 2: Tri-Party Repo Haircuts: Mean and Standard DeviationCrisis Stable All
mean sd mean sd mean sd
Agency Debentures 101.9 0.49 101.9 0.39 101.9 0.47Fed-eligible Agency MBS 102.3 0.60 102.0 0.40 102.2 0.56
collateral Agency Remic 103.1 1.31 102.6 0.53 103.0 1.14Ginnie Mae MBS Pools 102.0 0.42 101.9 0.23 102.0 0.36
Ginnie Mae REMICs 102.5 1.09 102.2 1.18 102.4 1.12US Treasuries and Strips 101.7 0.59 101.8 0.42 101.7 0.54Asset Backed Securities 107.1 3.90 105.8 1.73 106.7 3.40
Commercial Paper 104.2 1.75 103.9 0.63 104.1 1.57Corporate Bonds 106.2 2.80 106.0 1.71 106.1 2.50
Non Fed-eligible DTC-Other 103.0 1.34 103.6 1.34 103.3 1.38collateral Equity 106.3 1.57 108.5 2.28 107.0 2.08
Money Market 103.8 1.29 104.1 1.19 103.9 1.26Municipal Bonds 107.7 7.74 105.3 3.76 107.1 7.04
Other 104.3 76.9 102.3 1.03 103.8 66.47Private Label CMO 106.3 2.83 105.9 3.43 106.2 2.99
Whole Loans 108.7 1.16 108.3 4.74 108.7 1.58All 102.8 3.98 102.7 2.01 102.8 3.49
Note: ‘Crisis’ haircuts are computed over July 2008 to July 2009, ‘Stable’ haircuts over July 2009 to January2010, and ‘All’ haircuts over both sample periods. ‘sd’ is standard deviation. Average haircuts are computed usingthe value of the collateral as weights. Fed-eligible securities are securities that can be settled on the Fedwirer
Securities Service, while Non-Fed eligible, also called DTC-eligible, can be settled by the Depository TrustCompany (DTC).
14

Figure 3: Median Dealer Haircuts by Asset Class
100
105
110
115
120M
edia
n H
airc
ut
Age
ncy M
BS
US T
reas
uries
and
Stri
ps
Age
ncy D
eben
ture
Cor
pora
te B
onds
Age
ncy R
emic
Equ
ity
Priv
ate
Labe
l CM
O
Ass
et B
acke
d Sec
uritie
s
Mon
ey M
arke
t
Ginn
ie M
ae M
BS Poo
ls
Mun
icipa
l Bon
ds
Who
le Lo
ans
Com
mer
cial P
aper
Ginn
ie M
ae R
EMIC
s
DTC−O
ther
Oth
er
Cas
h
Note: Two median haircuts, associated with the same dealer, of 126 and 135 for Private Label CMO and AssetBacked Securities, respectively, are not shown. Each dealer is assigned a different color-symbol combinationwhich is consistent across asset classes. The asset classes are ordered from left to right by total volume over thesample.
haircuts by dealer and collateral class. Two features stand out: First, there is substantial het-
erogeneity in the haircuts dealers face, even for highly liquid assets such as US Treasuries.
Second, some dealers face high haircuts relative to their peers across all asset classes. While
the use of collateral to secure loans can be thought of as a mechanism to minimize counterparty
risk, this figure nonetheless shows that differences among dealers is an important factor in the
setting of haircuts.15
15An additional item of note is that haircuts on cash collateral are not zero for all dealers. Cash is sometimesincluded in a tri-party repo if a dealer does not have enough securities to pledge as collateral, for example becausefails were higher than expected. Cash, which is usually borrowed from the clearing bank, would then make thedifference between the value of the available securities and the amount of the repo. The fact that the haircuton cash is not always zero may be due to investors that assign the same haircut to all asset classes, consistentwith the idea that some investors do not actively manage haircuts. It could also be the result of cash not beinga perfect security. Perfecting a security means that a party has taken the legal steps necessary to establish a lien
15
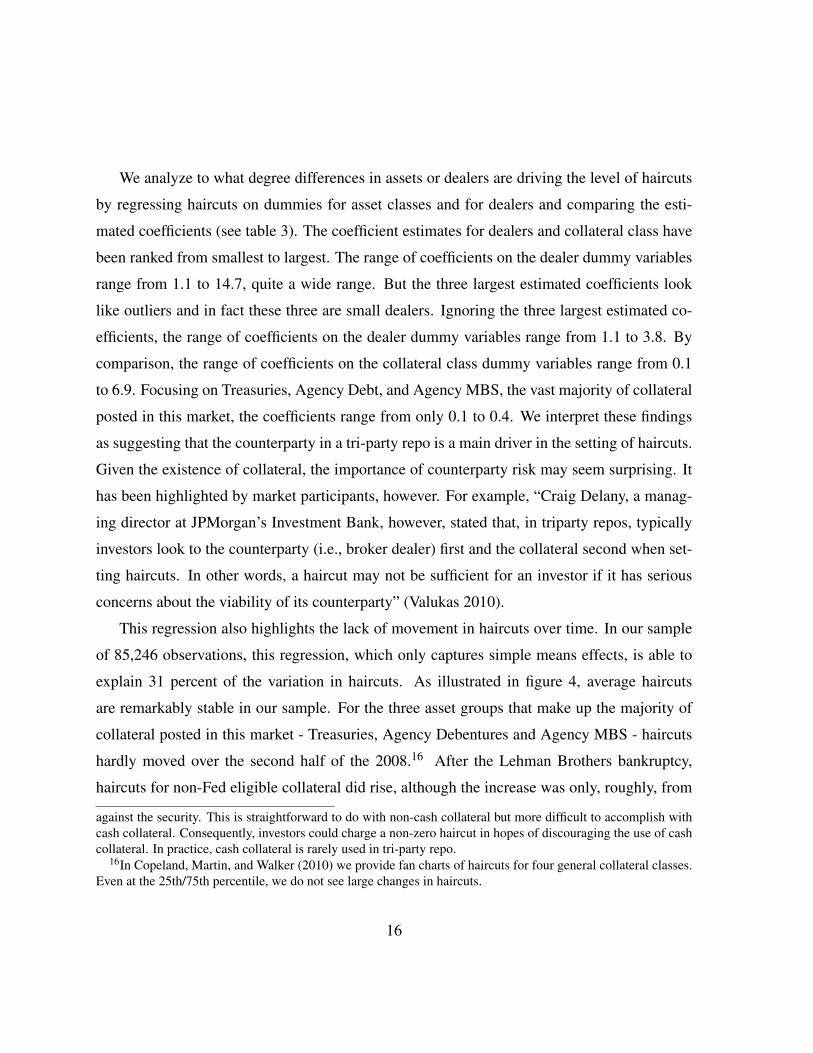
We analyze to what degree differences in assets or dealers are driving the level of haircuts
by regressing haircuts on dummies for asset classes and for dealers and comparing the esti-
mated coefficients (see table 3). The coefficient estimates for dealers and collateral class have
been ranked from smallest to largest. The range of coefficients on the dealer dummy variables
range from 1.1 to 14.7, quite a wide range. But the three largest estimated coefficients look
like outliers and in fact these three are small dealers. Ignoring the three largest estimated co-
efficients, the range of coefficients on the dealer dummy variables range from 1.1 to 3.8. By
comparison, the range of coefficients on the collateral class dummy variables range from 0.1
to 6.9. Focusing on Treasuries, Agency Debt, and Agency MBS, the vast majority of collateral
posted in this market, the coefficients range from only 0.1 to 0.4. We interpret these findings
as suggesting that the counterparty in a tri-party repo is a main driver in the setting of haircuts.
Given the existence of collateral, the importance of counterparty risk may seem surprising. It
has been highlighted by market participants, however. For example, “Craig Delany, a manag-
ing director at JPMorgan’s Investment Bank, however, stated that, in triparty repos, typically
investors look to the counterparty (i.e., broker dealer) first and the collateral second when set-
ting haircuts. In other words, a haircut may not be sufficient for an investor if it has serious
concerns about the viability of its counterparty” (Valukas 2010).
This regression also highlights the lack of movement in haircuts over time. In our sample
of 85,246 observations, this regression, which only captures simple means effects, is able to
explain 31 percent of the variation in haircuts. As illustrated in figure 4, average haircuts
are remarkably stable in our sample. For the three asset groups that make up the majority of
collateral posted in this market - Treasuries, Agency Debentures and Agency MBS - haircuts
hardly moved over the second half of the 2008.16 After the Lehman Brothers bankruptcy,
haircuts for non-Fed eligible collateral did rise, although the increase was only, roughly, from
against the security. This is straightforward to do with non-cash collateral but more difficult to accomplish withcash collateral. Consequently, investors could charge a non-zero haircut in hopes of discouraging the use of cashcollateral. In practice, cash collateral is rarely used in tri-party repo.
16In Copeland, Martin, and Walker (2010) we provide fan charts of haircuts for four general collateral classes.Even at the 25th/75th percentile, we do not see large changes in haircuts.
16
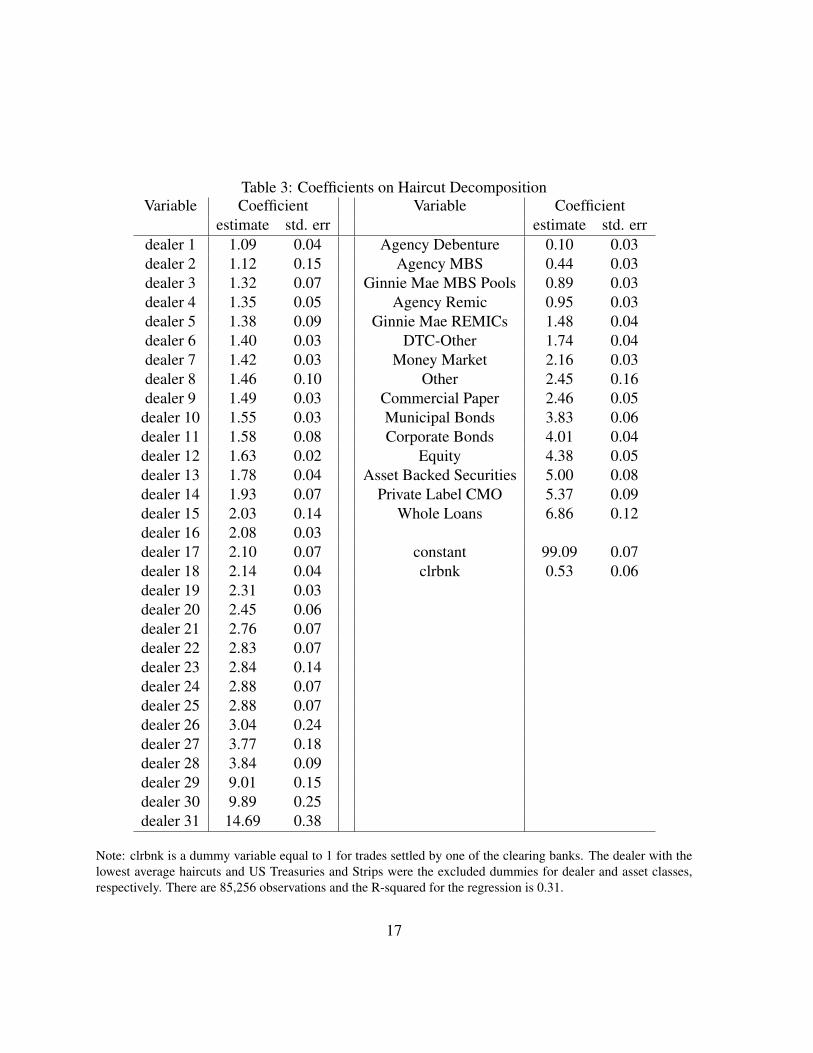
Table 3: Coefficients on Haircut DecompositionVariable Coefficient Variable Coefficient
estimate std. err estimate std. errdealer 1 1.09 0.04 Agency Debenture 0.10 0.03dealer 2 1.12 0.15 Agency MBS 0.44 0.03dealer 3 1.32 0.07 Ginnie Mae MBS Pools 0.89 0.03dealer 4 1.35 0.05 Agency Remic 0.95 0.03dealer 5 1.38 0.09 Ginnie Mae REMICs 1.48 0.04dealer 6 1.40 0.03 DTC-Other 1.74 0.04dealer 7 1.42 0.03 Money Market 2.16 0.03dealer 8 1.46 0.10 Other 2.45 0.16dealer 9 1.49 0.03 Commercial Paper 2.46 0.05
dealer 10 1.55 0.03 Municipal Bonds 3.83 0.06dealer 11 1.58 0.08 Corporate Bonds 4.01 0.04dealer 12 1.63 0.02 Equity 4.38 0.05dealer 13 1.78 0.04 Asset Backed Securities 5.00 0.08dealer 14 1.93 0.07 Private Label CMO 5.37 0.09dealer 15 2.03 0.14 Whole Loans 6.86 0.12dealer 16 2.08 0.03dealer 17 2.10 0.07 constant 99.09 0.07dealer 18 2.14 0.04 clrbnk 0.53 0.06dealer 19 2.31 0.03dealer 20 2.45 0.06dealer 21 2.76 0.07dealer 22 2.83 0.07dealer 23 2.84 0.14dealer 24 2.88 0.07dealer 25 2.88 0.07dealer 26 3.04 0.24dealer 27 3.77 0.18dealer 28 3.84 0.09dealer 29 9.01 0.15dealer 30 9.89 0.25dealer 31 14.69 0.38
Note: clrbnk is a dummy variable equal to 1 for trades settled by one of the clearing banks. The dealer with thelowest average haircuts and US Treasuries and Strips were the excluded dummies for dealer and asset classes,respectively. There are 85,256 observations and the R-squared for the regression is 0.31.
17

Figure 4: Median Haircuts by Asset Type
100
102
104
106
108
Jul08 Oct08 Jan09 Apr09 Jul09 Oct09 Jan10 Apr10
US Treasuries and Strips Agency DebentureAgency MBS Other Fed−EligibleNon Fed−Eligible
Note: Vertical line denotes the date of Lehman Brothers’ bankruptcy filing.
105 to 107.
As highlighted in the introduction, this lack of changes in haircuts is very different from
the large change in haircuts documented in Gorton and Metrick (2010) for an interdealer repo
market for low quality collateral. To further explore the difference in haircut dynamics in
tri-party repo versus bilateral repo markets, we use confidential survey data on haircuts of
bilateral repos from the Markets group at the New York Federal Reserve.17 These haircuts
reflect what dealers charge their customers, the majority of which are prime-brokerage clients.
The bilateral repo market is one where dealers are liquidity providers and hedge funds, real
estate investment trusts, and banks are collateral providers. To some extent, the securities that
dealers obtain as collateral in the bilateral repo market are rehypothecated by the dealer and
used as collateral in the tri-party repo market. In these cases, the dealers role is to serve as an
intermediary between cash investors in tri-party (e.g. mutual funds and securities lenders) and
17Aggregate level data is available at xxx
18

Table 4: Matching of asset classesDealers as cash providers Dealers as collateral providers(bilateral) (tri-party)Treasury US Treasuries and StripsAgency Agency DebenturesGSE MBS Agency MBSAgency CMO Agency RemicHigh-Grade Corp Debt Corp BondsAlt-A, Prime MBS Private Label CMOSubprime Asset Backed Securities
a dealer’s prime-brokerage clients (e.g. hedge funds).
To compare haircuts in the tri-party and bilateral repo markets, we first need to match
asset classes for the collateral used in both markets as best as possible. Table 4 provides the
descriptions of the collateral classes we were able to match with some degree of confidence,
from most to least liquid collateral. While the match is not perfect, the collateral classes
are roughly similar. We then graphically present the differences in median haircuts between
the two repo markets, or haircut spread, in figure 1 (in the introduction). A positive spread
of 10 indicates that the haircut is lower in the tri-party repo market by 10 percentage points
compared to the bilateral repo market (e.g. haircuts of 105 versus 115). As detailed in the
figure, average haircuts in tri-party repo were lower compared to the bilateral repo market for
all collateral classes except Treasuries. Further, after the Lehman Brothers bankruptcy, these
haircut spreads increased, reaching more than 40 percentage points for subprime collateral. In
general, the haircut spreads increased during the fall of 2008, peak sometime in the first half
of 2009, and close to their July 2008 level at the beginning of 2010. Figure 1 highlights how
dealers are much more willing to increase haircuts in a bilateral repo transaction than the cash
investors of the tri-party repo market.
The different behavior of haircuts between the bilateral and the tri-party repo markets is a
puzzle. We offer some potential explanation in section 4.
19
3.2 Subtitle?
In isolation, it is difficult to judge the importance of a change in haircuts. One measure of im-
portance is to compare how much cash a dealer portfolio would raise before and after changes
in haircuts. We take the hypothetical dealer portfolio listed in Yavorsky and Young (2010),
who construct a portfolio based on the Task Force report (Task Force 2010).18 We compute
that this portfolio would raise $250.0 billion in cash given the average haircuts observed over
July and August 2008, before the Lehman Brothers’ bankruptcy. Using the average haircuts
in September through December of 2008, after the Lehman Brothers bankruptcy, this portfolio
would have raised $248.9 billion in cash, $1.1 billion less, or 0.4% of the original portfolio.
Hence, the rise in haircuts in the tri-party repo market after the Lehman Brothers’ bankruptcy
translates into a minimal funding shortfall, representing less than half a percent of the value
of the hypothetical portfolio. Consequently, the small haircut changes we observe in tri-party
repo translate into small changes in cash raised.
It should be noted that this measure of cash raised is imperfect since it does not take into
account the changes in the size and composition of portfolios observed during the crisis. In
addition, this measure would miss the effect of investors refusing to further lend to a counter-
party (in effect setting the haircuts to infinity). Nevertheless, it gives us a rough measure of the
liquidity impact of increased haircuts during the crisis.
We use this same approach to measure the importance of the haircut spreads between tri-
party and bilateral repo markets. We assume that the aforementioned hypothetical portfolio
is composed of collateral the dealer received from bilateral repos. We then assume the dealer
re-hypothecates the collateral to the tri-party repo market. Using the average haircuts for the
tri-party and bilateral data over the same period as above, for the asset classes we were able to
match, our hypothetical dealer raised an additional 1.7% on its portfolio relative to the amount
it could have raised prior to the crisis.
18This portfolio includes $257 billion in assets, almost 80 percent of which are Fed-eligible assets. See table15 in Appendix C of Copeland, Martin, and Walker (2010) for more details.
20

3.3 Investor-dealer relations in tri-party repo
The previous section established that haircuts barely moved in the tri-party repo market over
our sample period. It is possible, however, that investors managed their risk in the tri-party
repo market by altering the quantity repoed, rather than the haircut charged. This margin of
adjustment reflects if there is a relationship between the investor and dealer, whereby dealers
can rely on investors to provide a stable source of funding and investor can count on dealers to
provide them with a return on cash. As we show in this section, we find a lot of persistence be-
tween dealers and investors; from day-to-day, investors will consistently lend the same amount
to a dealer and accept the same amount and type of collateral. We interpret this result to reflect
strong relationships between the typical investor and dealer.
To measure the persistence of the dealer-investor relationship, we would ideally want data
on the amount dealers borrow from investors by collateral type. Because we do not have
this data, we examine the dynamics of the relationship between dealers and investors from
two viewpoints. We start by looking at dealers and the day-to-day change in the collateral
they post and then look at investors and the day-to-day change in the collateral they accept.19
(MICHAEL: FOR INVESTORS IS IT CASH INVESTED OR COLLATERAL POSTED?)
For each dealer, we look at the level and change daily value of collateral posted.20 We
report the results in table 5, where we have divided dealers into two groups: Large and Small.
The top panel of table 5 describes the distribution of collateral posted by dealers. The median
value in the top panel is the median amount of collateral a dealer posted. Large dealers posted
a median amount of $103 billion each day, while small dealers posted a median amount of $4
billion. We describe the distribution of collateral posted by reporting the average difference
between the (75th, 25th), (90th,10th) and (99th,1st) percentiles. These statistics demonstrate
a fairly narrow distribution, suggesting that among the group of large dealers, a fairly similar19For this quantity analysis, we dropped the six quarterly end dates in our sample. Rather than being mean-
ingful economic phenomenon, the seasonal variation at quarter-end is likely due to window-dressing efforts byfinancial institutions who report quarter-end results.
20If a dealer exited the market on a particular day, the change on market value would be a missing value. Byand large, only small dealers did not consistently finance securities in tri-party repo in our sample.
21

Table 5: Statistics on Dealer’s Daily Aggregate Position by SizeStatistic Dealer Type
Large SmallDistribution of Collateral Posted ($million)
Median 103,000 3,74075th - 25th 6,740 21790th - 10th 11,700 47899th - 1st 17,200 758
Distribution of the Daily Change in Collateral Posted ($million)Median 0 0
75th - 25th 4,580 12490th - 10th 9,410 35899th - 1st 15,900 782
Distribution of the Daily Change in Collateral Posted (percent)Median 0 0
75th - 25th 4.9 2.890th - 10th 10.0 9.399th - 1st 19.5 25.9
Note: The statistics “Xth - Yth” denote the difference of the Yth percentile from the Xth percentile of the relevantdistribution for a dealer in a given month.
22

total amount of collateral is posted in tri-party repo.
The middle and bottom panels describe the distribution of the day-to-day change in collat-
eral posted by dealers in level and percent terms. Focusing first on the middle panel, the zero
median values for both types of dealers mean that dealers typically post the same total amount
of collateral each day. Further, for both types of dealers, this distribution of the daily change
in collateral posted is narrow. For large dealers, for example, the difference between the 90th
and 10th percentiles is only $9.4 billion, small compared to the total amount of collateral an
average large dealer posts. The bottom panel reaffirms this result, showing that in percent
terms, there are small differences between the 90th and 10th percentiles of the distribution.
These results suggest that from day-to-day dealers only rarely decide to substantially change
how much they finance in tri-party repo.
We also compute the daily change in the amount a dealer finances for each asset class.
This might be important, because in reaction to negative news, an investor may ask for higher
quality collateral. Hence, a dealer still might borrow the same amount of cash from day-to-
day, but be required to post higher quality collateral. For the most part, even at this level of
detail, there is little day-to-day change in collateral posted. The median daily change is less
than $5,000 in absolute value, and the difference between the 75th and 25th quartiles on the
distribution of the daily change in securities financed is $207 million, about 7 percent of the
average value invested at the dealer-asset class level. Unlike at the dealer level, however, we
do see more dramatic changes in the tail of the distribution. The difference between the 99th
and 1st percentiles is $1.2 billion, or 47 percent of the average amount financed at the dealer-
asset class level (AC/MW: make sure these numbers are consistent with the small/large dealer
definitions).
The above analysis confirms that dealers typically borrow similar amounts from day-to-
day, using essentially the same portfolio of general collateral. Hence there is substantial sta-
bility on the dealer-side of the market from day-to-day, implying a predictable amount of se-
curities are supplied to the tri-party repo market. Nevertheless, these statistics do not directly
23

address the investor’s side of the market. In particular, do investors typically lend to the same
set of dealers? To answer this question, we examine whether investors invest the same amount
of cash from day-to-day, using all our investor data.
Given the heterogeneity on the investor side, we group investors into quartiles based on the
daily amount invested. In this analysis, we consider investors on each clearingbank separately,
and so do not aggregate an investor’s position across the 2 clearingbanks. This is because it
is difficult for us to determine when the investor is the same across the two banks. While
the names may be similar, the investor may be lending cash on behalf of different clients.
Indeed, there are dealers showing up as large cash investors, but their names suggest that
these dealers are actually investing cash on behalf of different clients. Rather than guessing
which investors should be aggregated across clearingbanks and which should not, we chose
the more transparent path of treating investors on different clearingbanks separately. Under
this approach, for the group of smallest investors, the typical total cash amount loaned is $11
million a day (see table 6). In contrast, for the largest investor group, the typical investor loans
$19.6 billion a day. Like dealers, investors do not often significantly change the amount they
invest in the tri-party repo market from day-to-day. For all groups of investors, the median
change in amount invested is $0, and the difference between the 75th and 25th quartiles on the
distribution of the daily change in amount invested is a small amount for each investor group.
Unlike dealers, however, we do see large changes in the amount loaned from day-to-day in the
tail of the distribution. With the exception of the smallest investors, the difference between
90th and 10th percentiles as well as the 99th and 1st percentiles is fairly large both in level and
percentage terms (see the middle and bottom panels of Table 6). Hence, investors do make
large changes to the amount of cash they lend in tri-party repo, albeit rarely.
Interestingly, the smallest group of investors acts quite differently from larger investors,
and provide extraordinarily stable funding. One explanation for this difference could be the
predictability of payment flows for smaller investors relative to larger investors. If payment
flows are more predictable for smaller investors, it could be easier for them to select the amount
24

Table 6: Statistics on Investor’s Daily Aggregate Position by SizeStatistic Firm Size (from low to high)
Quartile 1 Quartile 2 Quartile 3 Quartile 4Distribution of Daily Amount Invested ($million)
Median 11 200 1,140 19,60075th - 25th 0 44 205 2,11090th - 10th 0 83 382 4,00099th - 1st 0 124 556 5,820
Distribution of the Change in Daily Amount Invested ($million)Median 0 0 0 0
75th - 25th 0 12 55 1,32090th - 10th 0 51 230 3,04099th - 1st 0 129 550 5,500
Distribution of the Change in Daily Amount Invested (ratio)Median 0 0 0 0
75th - 25th 0 6.3 5.8 6.390th - 10th 0 26.2 18.6 14.199th - 1st 0 61.1 47.4 26.3
Note: The statistics “Xth - Yth” denote the difference of the Yth percentile from the Xth percentile of the relevantdistribution for an investor on a clearingbank in a given month.
25

they would like to continually roll over in tri-party or to use term contracts versus overnight
deals.
3.4 Spider graphs around the crisis events
Up until this point, we looked at haircuts and volumes of collateral posted independently. In
this section, we look at the changes in both variables around crisis dates for specific dealers.
Our goal is to determine if (or how) collateral volumes and haircuts moved around dealer stress
events.
We identify dates of adverse events for individual dealers, of their bank holding company
affiliates, and compare changes in haircuts and collateral posted for the stressed dealer to other
large dealers, our control group. We use dates normalized by the day of the event (or the
first business day following the event, if it occurred on a weekend), where t = 0 corresponds
to the event date. We limit our focus to three weeks before and after the event date. If event
windows overlapped with one another, the dealers involved in these events were excluded from
the control groups. To analyze haircuts, we compute the value-weighted mean spread of the
average haircut faced by a stressed dealer across asset classes in comparison to the control
group. A haircut spread of 1 means that a dealer’s average haircut is 1 percentage point higher,
for example at 103 for the stressed dealer and 102 for the control group. For collateral posted,
we calculate the total cash received for posted collateral, normalizing by the total quantity of
cash received for each dealer on the event date. A collateral spread of 0.1 indicates that the
stressed dealer’s tri-party book is 10 percent higher, relative to the event date, than that of the
control group, relative to the event date. Roughly speaking, the amount of collateral posted by
the control group does not change for any of the crisis events we consider. Consequently, the
collateral spread of 0.1 can be interpreted as simply the 10 percent increase in collateral posted
by the stressed dealer, relative to event date.
We plot the spread in haircuts for stressed dealers relative to the control dealers in figures
5 and 7. These figures indicate that haircuts were remarkably stable during stress events for
26

dealers. Even Lehman Brothers did not experience a dramatic increase in haircuts until the
day it declared bankruptcy; while Lehman’s haircuts began moving up slightly 5 days before
its bankruptcy filing, these increases were modest at less than 1.3 basis points. The haircut
spreads for the other dealer stress events we examine in this analysis remained between -1 and
0.65 basis points, indicating that these stressed dealers were not paying substantially higher
haircuts than the control group. In fact, in the case of Event 1, the dealer paid consistently less
than the control group throughout the event window. The stability of these spreads, coupled
with the stability of haircut levels shown in figure 4, provide strong evidence that haircut spirals
did not occur in the tri-party repo market, in contrast to the experience of some other bilateral
repo markets.21
The behavior of quantities shows a striking difference between Lehman Brothers and other
dealers, as displayed in Figures 6 and 8, respectively. The size of Lehman’s tri-party repo
book decreased dramatically in the days leading up to the holding company’s bankruptcy. In
contrast, other stressed dealers were able to maintain relatively stable funding. *Note variation
with respect to standard deviations in new tables.*22 Although there is some variation from
day-to-day, there are no sharp declines in the week before or after the event date, and all series
finish at similar or higher values than at the beginning of the event window. This suggests
that quantities were relatively stable, even for stressed dealers, with the exception of Lehman
Brothers. *May be useful to note something about levels here as well, similar to the paragraph
above*.21Our results are robust to different control groups and are not driven by the exclusion of overlapping event
dates.22We were able to examine the number of investors in one of the stressed dealers other than Lehman around
its event date and found the number of investors to remain roughly constant during the days leading up to andfollowing the stress event. This suggests that variations in this dealer’s book value were not due to investorsmoving all of their funds elsewhere.
27

Figure 5: Lehman Brothers: Haircut Spread
0
1
2
3
4
5
6
7
8
9
10
11
Mar
gin
Spr
ead
−20 −15 −10 −5 0 5 10 15 20
t
Figure 6: Lehman Brothers: Quantity Spread
−1
0
1
2
Qua
ntity
Spr
ead
−20 −15 −10 −5 0 5 10 15 20
t
Figure 7: Adverse Events: Haircut Spread
−1
−.5
0
.5
Mar
gin
Spr
ead
−20 −15 −10 −5 0 5 10 15 20
t
UBS Margin Spread Citi (Nov) Margin SpreadCiti (Jan) Margin Spread BofA Margin Spread
Figure 8: Adverse Events: Quantity Spread
−.2
−.1
0
.1
.2
.3
Qua
ntity
Spr
ead
−20 −15 −10 −5 0 5 10 15 20
t
UBS Quantity Spread Citi (Nov) Quantity SpreadCiti (Jan) Quantity Spread BofA Quantity Spread
28
4 Discussion of results, Policy Analysis
In this section, we briefly consider three questions: Why did haircuts in the bilateral repo
market increase so much? Why did the haircuts in the tri-party repo market increase so little?
How can we characterize runs in the tri-party repo market?
4.1 Why did haircuts in the bilateral repo market increase so much?
Gorton and Metrick (2010) argue that the increase in haircuts in the bilateral repo market is
driven by the fact that securities being repoed became “informationally-sensitive”. Increasing
haircuts reduces the information-sensitivity of the security from the perspective of the cash
provider, as it reduced the likelihood that selling the securities will not cover the face value
of the repo. This explanation is consistent with the fact that haircuts in the bilateral market
increased more for less liquid securities, as shown in figure 1.
The increase in haircuts could also reflect an increase in riskiness of the dealers’ counter-
parties, notably hedge funds and other dealers, during the crisis. Hence, the increase in haircut
during the crisis would simply reflect the increased risk taken by dealers when providing cash
to their clients or to other dealers through repos.
Another possibility is that dealers offering prime brokerage services enjoyed “monopoly
rents” at the height of the crisis. According to industry analysts, before the fall of Bear Stearns
many hedge funds had only one prime broker. The fall of Bear made these institutions re-
alize the risk of such a situation and many tried to diversify their source of prime brokerage
services. However, establishing such relationships can take time and, because of the rush of
new demands for services, some prime brokers turned down requests. In this environment,
and at the height of the crisis, it is possible that dealers were able to negotiate very favorable
terms from their prime brokerage clients when lending cash. This explanation, however, may
not explain why haircuts increased in the interdealer market studied in Gorton and Metrick
(2010).
29
4.2 Why did the haircuts in the tri-party repo market increase so little?
Some cash investors appear to be reluctant or unprepared to take possession of the collateral
and prefer to withdraw funding if they think a dealer is not credit worthy, as noted in section
3.1. The level of haircuts and the type of collateral may be unimportant for such investors and
they may not manage either carefully. For example, SEC rules prevent money market mutual
funds from holding outright some of the securities they accept as collateral.23
In addition, major categories of tri-party repo investors, such as money market mutual
funds and commingled securities lending cash reinvestment pools, have to worry that they
may face withdrawal pressures from their own investors. As a result, they are very intolerant
of liquidity and credit risk. Upon learning that a money fund in which they have invested is
financing a dealer perceived to be having creditworthiness issues or was financing a dealer now
in default, these investors may preemptively withdraw their funds, regardless of the risk that
liquidating the collateral actually represents. This “headline” risk, the risk that a money fund
may find itself in the headline of a news story, is another reason why money funds may not use
haircuts to manage their risk.
Another potential explanation is that tri-party repos were mainly overnight and the clearing
bank would unwind repos every morning. Hence, the cash investors were only exposed to the
dealers overnight, from approximately 6 PM to 8 AM the next day. Cash investors may have
felt that they could always pull away from a troubled dealer before it would have to declare
bankruptcy, making the management of haircuts less important.
4.3 How can we characterize runs in the tri-party repo market?
In this section, we argue that runs in the tri-party repo market resembled traditional bank runs.
Investors have the ability to “withdraw” most of their funding everyday and, in some cases,
the amount of funding obtained in the tri-party repo market decreased precipitously.
23For example, a money market mutual fund may not be able to hold a 20 year Treasury bond, as the remainingmaturity of money market mutual fund’s assets must not exceed 13 months.
30
Because so much of the cash in the tri-party repo market was invested overnight, it provided
considerable flexibility for investors who needed to respond to their own investors’ redemp-
tions. Our data shows that while large investors provided a stable amount of funding to the
market, this amount would occasionally fluctuate by a large amount, consistent with the need
to meet a large redemption. However, because these potential need for cash “withdrawals” may
not correlated, the supply of funds to dealers can remain stable. This resemble the motivation
for banking provided by Diamond and Dybvig (1983).
In addition haircuts barely moved in the tri-party repo market, as we documented. Hence,
changes to dealer funding was mainly driven by changes in quantities of cash made available.
Our data suggests that most dealers received a very stable amount of funding during the cri-
sis, even during relatively stressful time, with one key exception. We show that the size of
Lehman’s tri-party repo book decreased sharply in the days leading to the bankruptcy of the
Lehman holding company. This decrease in funding is also consistent with the view that the
run on Lehman resembled a traditional bank run.
5 Conclusion
This paper provides an empirical investigation of the tri-party repo market during the crisis,
focusing on the behavior of haircuts and quantity of funding. This market is a key source of
funding for large dealers and sharp decreases in the funding obtained in this market contributed
to the difficulties experienced by Bear Stearns and Lehman Brothers. Because the tri-party repo
market is so large, and so central to dealer funding, it is important to understand its potential
vulnerability to runs. Our paper provides evidence of such runs.
Our main findings are that haircuts barely moved in the tri-party repo market and that
funding was very stable for most dealers, with some dramatic exceptions. The behavior of
haircuts is in sharp contrast to the bilateral market studied by Gorton and Metrick (2010),
where haircuts increased sharply during the crisis. The difference between Lehman, which
saw a precipitous decline in its tri-party repo book, and other dealers, which barely saw any
31

change at all, even during stressful times, is consistent with run dynamics.
32

References
BRUNNERMEIER, M. K., AND L. H. PEDERSEN (2009): “Market Liquidity and Funding
Liquidity,” Review of Financial Studies, 22, 2201–2238.
COPELAND, A., A. MARTIN, AND M. WALKER (2010): “The tri-party repo market before
the 2010 reforms,” Federal Reserve Bank of New York Staff Report No. 477.
DIAMOND, D., AND P. DYBVIG (1983): “Bank runs, deposit insurance, and liquidity,” Journal
of Political Economy, 91, 401419.
FRBNY (2010): “Tri-Party Repo Infrastructure Reform,” White Paper, Federal Reserve Bank
of New York.
FRIEDMAN, P. (2010): “Testimony of Paul Friedman Before the Financial Crisis
Inquiry Commission,” http://fcic-static.law.stanford.edu/cdn media/fcic-testimony/2010-
0505-Friedman.pdf.
GARBADE, K. D. (2006): “The Evolution of Repo Contracting Conventions in the 1980s,”
Federal Reserve Bank of New York Economic Policy Review, 12(1), 27–42.
GORTON, G., AND A. METRICK (2010): “Securitized Banking and the Run on Repo,” Journal
of Financial Economics, doi:10.1016/j.jfineco.2011.03.016.
KRISHNAMURTHY, A., S. NAGEL, AND D. ORLOV (2011): “Sizing Up Repo,” manuscript.
MARTIN, A., D. SKEIE, AND E.-L. VON THADDEN (2010): “Repo runs,” Federal Reserve
Bank of New York Staff Report No.444.
TASK FORCE (2010): “Task Force on Tri-Party Repo Infrastructure,” Report, Payments Risk
Committee.
TUCKMAN, B. (2010): “Systemic Risk and the Tri-Party Repo Clearing Banks,” CFS Policy
Paper.
33
VALUKAS, A. (2010): “Report of Anton R. Valukas, Examiner,” Report, In re Lehman Broth-
ers Holdings Inc., et al, Debtors.
YAVORSKY, A., AND R. YOUNG (2010): “Tri-Party Repo Market Remains a Systemic Risk
Pending Implementation of Industry Reforms,” Special Comment, Moody’s Investor Ser-
vices.
34
Related Documents