REMOTE SENSING APPLICATIONS IN FORESTIRY REMOTE SENSING APPLICATIONS TO FOREST VEGETATION CLASSIFICATION AND CONIFER VIGOR LOSS DUE TO DWARF MISTLETOE by Robert W. Douglass Merle P. M'eyer D. W. French College of Forestry University of Minnesota Final Report 30 September 1972 A 7eport of research performed under the auspices of the Forestry Remote Sensing Laboratory, School of Forestry and Conservation University of California Berkeley, California A CoordinationTask Carried Out in Cooperation with The Forest Service, U. S. Department of Agriculture For EARITH RESOURCES SURVEY PROGRAM OFFICE OF SPACE SCIENCES AND APPLICATIONS NATIONAL AERONAUTICS AND SPACE ADMINISTRATION (NASA-CR-138806) REMOTE SENSING N74-2780 APPLICATIONS TO FOREST VEGETATION CLASSIFICATION AND CONIFER VIGOR LOSS DUE TO DWARF HIS'LETOE Remote (Minnesota Unclas iUniv.) 102 p HC $8.25 CSCL 02F G3/13 16549 https://ntrs.nasa.gov/search.jsp?R=19740019691 2018-07-08T16:09:36+00:00Z

Welcome message from author
This document is posted to help you gain knowledge. Please leave a comment to let me know what you think about it! Share it to your friends and learn new things together.
Transcript
REMOTE SENSING APPLICATIONSIN FORESTIRY
REMOTE SENSING APPLICATIONS TO FORESTVEGETATION CLASSIFICATION AND CONIFER
VIGOR LOSS DUE TO DWARF MISTLETOE
by
Robert W. DouglassMerle P. M'eyer
D. W. French
College of ForestryUniversity of Minnesota
Final Report 30 September 1972
A 7eport of research performed under the auspices of the
Forestry Remote Sensing Laboratory,School of Forestry and Conservation
University of California
Berkeley, California
A Coordination Task Carried Out in Cooperation withThe Forest Service, U. S. Department of Agriculture
For
EARITH RESOURCES SURVEY PROGRAMOFFICE OF SPACE SCIENCES AND APPLICATIONSNATIONAL AERONAUTICS AND SPACE ADMINISTRATION
(NASA-CR-138806) REMOTE SENSING N74-2780APPLICATIONS TO FOREST VEGETATIONCLASSIFICATION AND CONIFER VIGOR LOSS DUETO DWARF HIS'LETOE Remote (Minnesota UnclasiUniv.) 102 p HC $8.25 CSCL 02F G3/13 16549
https://ntrs.nasa.gov/search.jsp?R=19740019691 2018-07-08T16:09:36+00:00Z
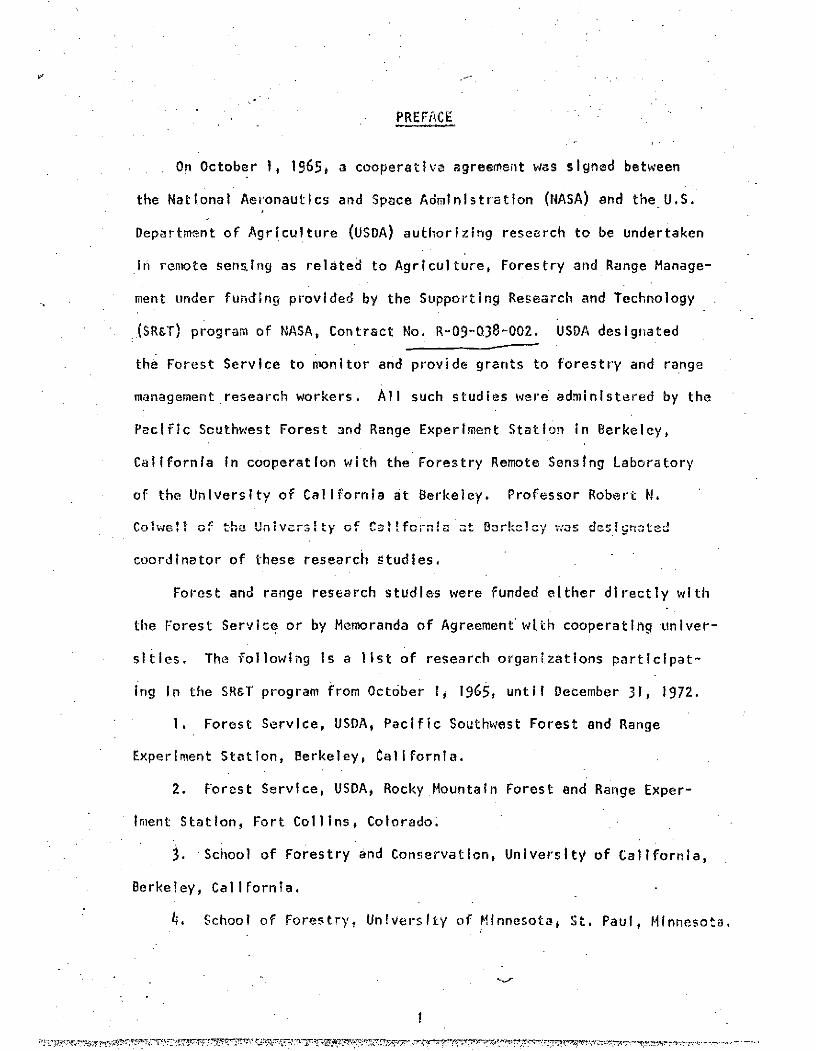
PREFACE
On October 1, 1965, a cooperative agreement was signed between
the National Aeronautics and Space Administration (NASA) and the U.S.
Department of Agriculture (USDA) authorizing research to be undertaken
in remote sensing as related to Agriculture, Forestry and Range Manage-
ment under funding provided by the Supporting Research and Technology
(SR&T) program of NASA, Contract No. R-09-038-002. USDA designated
the Forest Service to monitor and provide grants to forestry and range
management research workers. All such studies were administered by the
Pacific Southwest Forest 3nd Range Experiment Station in Berkeley,
California in cooperation with the Forestry Remote Sensing Laboratory
of the University of California at Berkeley. Professor Robert N.
Colwell of the Univers! ty of Cal!forn!a at 0Brk' 'cy ;as da eicnrated
coordinator of these research studies.
Forest and range research studies were funded either directly with
the Forest Service or by Memoranda of Agreement wtth cooperating univer-
sities. The following Is a list of research organizations participat-
ing In the SR&T program from October 1, 1965, until December 31, 1972.
1. Forest Service, USDA, Pacific Southwest Forest and Range
Experiment Station, Berkeley, California.
2. Forest Service, USDA, Rocky Mountain Forest and Range Exper-
Iment Station, Fort Collins, Colorado.
3. 'School of Forestry and Conservation, University of California,
Berkeley, California.
i, School of Forestry, University of Minnesota St. Paul, Minnesota.
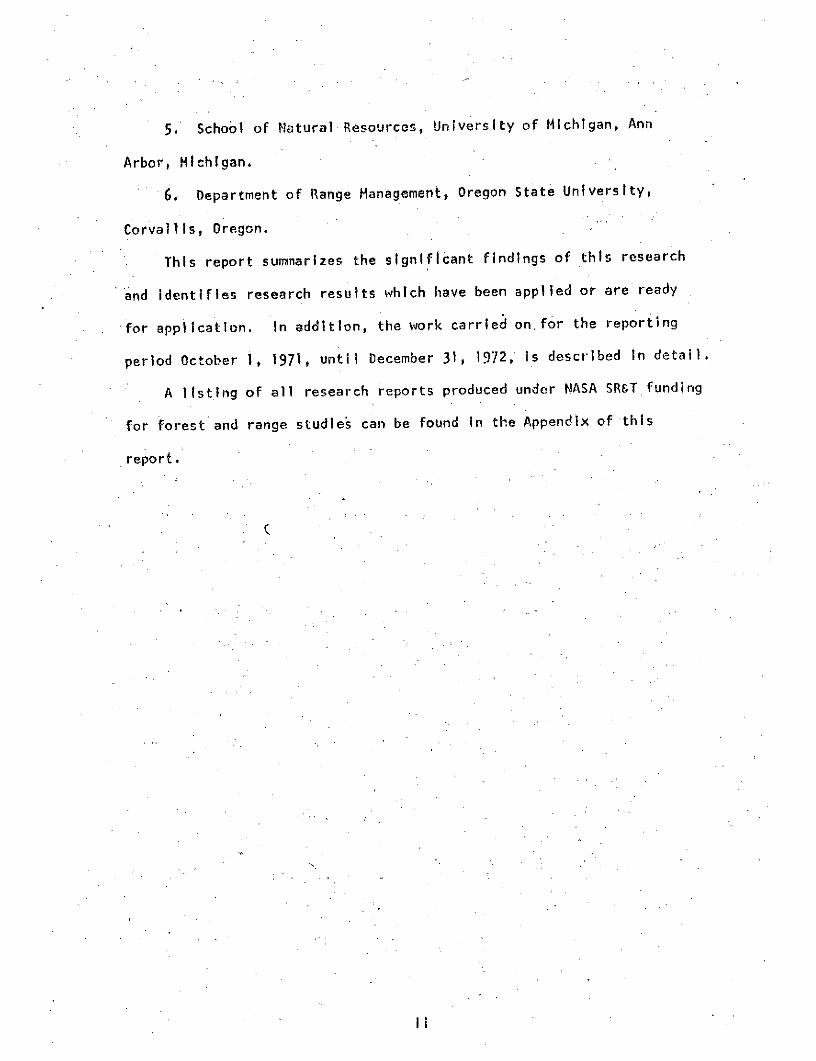
5. School of Natural Resources, University of Michigan, Ann
Arbor, Michigan.
6. Department of Range Management, Oregon State University,
Corvallis, Oregon.
This report summarizes the significant findings of this research
and identifies research results which have been applied or are ready
for application. In addition, the work carried on. for the reporting
period October i, 1971, until December 31, 1972, is described in detail.
A listing of all research reports produced under NASA SR&T funding
for forest and range studies can be found In the Appendix of this
report.
ABSTRACT
The primary objective of this project was to establish criteria for
practical remote sensing of vegetation stress and mortality caused by
dwarf mistletoe infections in black spruce sub-boreal forest stands. The
project was accomplished in two stages.: (1) A fixed tower-tramway site
in an infected black spruce stand was used for periodic multispectral
photo coverage to establish basic film/filter/scale/season/weather param-
eters; (2) The photographic combinations suggested by the tower-tramway
tests were used in low, medium and high altitude aerial photography.
At a variety of scales color infrared proved to be the most effec-
tive film used, not only because of the healthy-versus-stressed vegeta-
tion color contrasts attained at lower altitudes, but also because of
the generally better atmospheric penetration at extremely h!gh altitudcs.
Actually, the physical characteristics of the infection centers (e.g.,
the "moth-eaten" appearance) were generally visible on all film-filter-
scale combinations, once the stands had been identified as black spruce.
But spectral differences per se between dead and healthy vegetation sur-
vived scale reduction to only medium scale, and then only on the color
infrared photography.
Image enhancement, by means of optically combining multispectral
imagery and the masking and density slicing of single emulsions, generally
tended to improve the ease of visual detectability of stress but did not
appear to improve, or extend, the actual threshold of detection. In gen-
eral, the study suggests the use of high altitude imagery to identify
spruce forests and locate questionable stand openings therein -- then
iii
following up with relatively large-scale color infrared aerial photography
of the suspected problem areas for final location and assessment of actual
infection centers.
Since vegetation classification is basic to most forest management
decisions (including tree stress considerations), a study was made in our
ERTS-oriented study of the applicability of very small-scale aerial photog-
raphy. Practicing professional foresters were able to classify vegetation
to an 85 percent level of accuracy on 1:118,000 Infrared color photography.
taken in the fall of the year. Accuracy levels were reduced with color
photography and by using summer season photography (color and infrared
color). The usefulness of very small-scale aerial photography for multi-
stage forest vegetation classification and sampling.was obvious.
Additional subprojects which were Initiated, but which are not yet
finished, involve possible applications of remote sensing to the detection
of hypoxylon canker of aspen, A.ir Liia root rot of pine plantations, and
post-logging controlled burn planning and management. In all cases, a high
degree of success was achieved, and the development of a variety of prac-
tical techniques for these purposes appears assured for the very near future.
iv
ACKNOWLEDGEMENTS
The research described here is part of the Earth Resources Survey
Program In Agriculture/Forestry which was sponsored, and financially
assisted, by the National Aeronautics and Space Administration (Contract
R-09-038-002). The following constitut.es the final report of this coopera-
tive study with the U.S. Department of Agriculture, Forest Service, and
the University of Minnesota College of Forestry. NASA funding of projects
under the terms cf Contract R-09-038-002 terminated in April, 1972, before
this project (among others) was completed. However, the work underway was
continued and brought to a logical conclusion as a result of funding by
the University of Minnesota College of Forestry, the Minnesota Agricultural
Experiment Station ] and a most timely grant from NASA's Office of Univer-
sity Affairs.
Credit for findings of practical value produced by this project cannot
be claimed by the investigators alone since much of what was accomplished
came as a result of significant Inputs in the form of encouragement, advice,
facility availability and personal assistance provided by many individuals
and agencies. Our special thanks go to Dr. Thomas F. McLintock of the
USDA, Forest'Service, who made it possible for us to initiate this project
in 1970; the Minnesota Department of Natural Resources, Division of Lands
and Forestry (in particular, District Foresters Eugene Wroe and Elmer
Homstad), who provided field assistance, advice and test areas; Chippewa
National Forest Staff Officer M. B. Hathaway, U.S. Forest Service, who,
along with a number of other professional personnel of the Forest Service,
provided advice, test sites, ground truth, and interpretation assistance
Authorized for publication as Scientific Journal Series Paper No. 8156by the University of Minnesota Agricultural Experiment Station.
v
in the forest vegetation classification subproject; Dr. Peter Dress of the
Pennsylvania State University School of Forestry who provided statistical
advice; Robert C. Heller, project leader in charge of research in remote
sensing at the Pacific Southwest Forest and Range Experiment Station, whose
staff and facilities played an important role in a number of phases of the
investigation; and Dr. Gene Thorley, Director of the University of Califor-
nia Forestry Remote Sensing Laboratory, and Mr; Harry W. Camp, Director of
the U.S. Forest Service Pacific Southwest Forest and Range Experiment Sta-
tlion who, with members of their staffs, really "put it all together" for
all of us involved In these investigations.
vi
TABLE OF CONTENTS
Page
PREFACE . . . . . . . . . . . . . . . . .. . . . . .. . . .
ABSTRACT . . . .. . .. . . - . . . ill
ACKNOWLEDGEMENTS ...........- ............. v
INTRODUCTION . . .... . . . . . . . 1
REVIEW OF LITERATURE . . . . . . . . . . . . .. . .. . . . . 7
METHODS OF INVESTIGATION . . . . ... ..... ...... . . .
Introduction . ..- ........ . .... . . . .. . . . ... 11
Dwarf Mistletoe Detection . . . . . . . . .. 18
Dwarf Mistletoe Image Analysis . . . . . . . . . . . . . . 27
Hypoxylon Canker Detection . . .. 32
Armillaria Root Rot Detection ..... . . . . . . . . . . . 34
Forest Vegetation Classification . ... . ........... . .. 36
Post-burn Survey Analysis ......... .. ... . . . 43
INVESTIGATION RESULTS - 4S
Dwarf Mistletoe Detection . .. ... .. . .. .. 45
Hypoxylon Canker Detection . ... . .. .. . . . . 65
Armillaria Root Rot Detection ..... .. .. . . . . 68
Forest Vegetation Classification . . . .... ..... . .. 69
SUMMARY AND CONCLUSIONS ... ... ........ . . . .- . . . 77
LITERATURE CiTED. . . . . ... . . ... ". .. .. . ... 84
APPENDIX A .... . . .. .. . . . . . . . . . . .. . .. 87
vil
REMOTE SENSING APPLICATIONS TO FOREST VEGETATIONCLASSIFICATION AND CONIFER VIGOR LOSS DUE TO DWARF MISTLETOE
By
Robert W. DouglassMerle P. MeyerD. W.- French
College of ForestryUniversity of Minnesota
INTRODUCTION
Efforts by the National Aeronautics and Space Administration (NASA)
to launch a satellite for observing earth resources have created an inter-
est in the application of small-scale imagery to the natural resource
field. In an effort to determine the knowledge needed for utilization of
the data generated by the Earth Resources Technology Satellite (ERTS) pro-
gram, scientists throughout the world have embarked upon a multidisciplined
program to learn more about the use of remote sensing systems in earth
resource evaluation.
Availability of very small-scale photography as a result of the NASA
aircraft overflights has provided land managers with another tool to aid
In making decisions. Some of the projects funded by NASA have dealt spe-
cifically with forest land problems of disease, forest cover types, and
land-use classification.
Forest land managers are being asked to make decisions concerning
natural resources that will affect more than three-fourths of the land
area of the United States (15). The demands for food, fiber, water, min-
erals, and grazing resources are intensifying, and new and equally
-- '. r r - . 'r, -. - - - - - -'
selective demands are gaining in national importance. During the past
decade there has been a forestland recreational boom that has made recrea-
tion the main resource on some of the public forestlands, especially
within the Eastern United States (10).
All of this means that forested lands must provide more resources at
the same time the environmental quality'standards of society are being
met. Therefore, some form of land use planning or zoning will be needed
to assist in the allocation of resources. Very high-altitude photography
has been considered as a tool for wildland use planning (12).
General Statement of the Problem
This study is concerned with remote sensing techniques as they are
applied to forest resource evaluation in the sub-boreal forests of
Minnesota. The major emphasis is on the use of hlgh-altitude photography
to detect and locate vigor loss in trees, as caused by disease, and to
classify forest vegetation over large areas.
The primary research effort was focused upon the detection of eastern
dwarf mistletoe (Arceuthobium pusillum, Peck) within stands of black spruce
(Picea mariana, Mill). Dwarf mistletoe causes extensive losses on black
spruce and has infected an estimated 150,000 acres of Minnesota's black
spruce forest (19).
Recent studies have indicated that eastern dwarf mistletoe can be
controlled by the use of fire following logging (29, 42), but the lack of
a good system of disease detection and location has become a major limita-
'tion to controlling the disease. Black spruce forests are dense, even-age
stands that usually grow on flat, poorly drained soils and "old" bogs.
2
Ground travel within the black spruce forests is limited by the bog condi-
tions. Also, there is no topographic relief sufficient to assist visual
observation. Therefore, aerial photography appears to provide the best
method of surveying black spruce stands for the purpose of detecting
infection centers.
Another part of this study concerns the detectability of hypoxylon
canker (Hypoxylon mammatum, Miller) within aspen (Populus tremuloides,
Michx) stands. Hypoxylon canker occurs throughout the range of trembling
aspen, except in Alaska (20). It is the lack of hypoxylon canker within
the Alaskan forest that gives importance to this portion of the study.
Remote sensing-techniques, if available, would aid in locating the infes-
tations of aspen in Canada. This would provide a system for monitoring
any spread of this disease into Alaska, where it could pose a serious
threat to the aspen stands. Aspen is an Important tree species in Alaska
although it rareiy exceeds 70 feet in height there. It is one of the
four commercial timber types of Alaska, .occupying approximately 2.5 mil-
lion acres (14).
This great reserve of timber could be threatened if the gap between
the diseased aspen of Canada and the .disease-free aspen stands of Alaska
were bridged. To obtain more complete knowledge of the threat posed by
H. mammatum, a system for detecting the presence of the disease and for
monitoring Its movement Is required. The vast territory to be sampled
lends itself to the use of remote sensing (20).
The use of conventional photographic.scales and film-filter combina-
tions would cause problems related to mass data handling and high costs
3
:associated with the need to obtain and interpret repeated coverages. As
Is the case in most of the United States, panchromatic and infrared black-
and-white films are most commonly used for aerial photography in northern
Minnesota (6, 2). However, other film-filter combinations should be
investigated to determine the one that is best suited for detecting
stressed vegetation.
The selection of the best film-filter combination requires a know-
ledge of film response, filter characteristics, and spectral reflectance
characteristics of stressed forest trees. A seasonal variation in the
vegetation's reflectivity has been well documented (21, 24). If:a signa-
ture, spectral or geometric, can be found for dwarf mistletoe in black
spruce, its detectability must be defined for various scales of photog-
raphy. Can dwarf mistletoe infection centers that are visible on large-
scale photography be detected on very small-scale photographs? -What,
scale photos are best for detection and monitoring this disease?
Recent emphasis on very high-altitude photography of the type obtain-
able from Earth Resource Technology Satellites has resulted in research
concerned with extraction of data from small-scale and poor-resolution
imagery. Ulliman uses the criteria indicated In Table I when discussing
photographic scale (25).
Photographic scale is a function of flying height and camera focal
length. Therefore, an increase in the photo scale reciprocal (sometimes
called the "scale-factor") results from an increase in flying height above
the terrain for any given camera focal length:
flying height above terrain (Ho)photo scale reciprocal (PSR) = focal length in feet (f)
I6
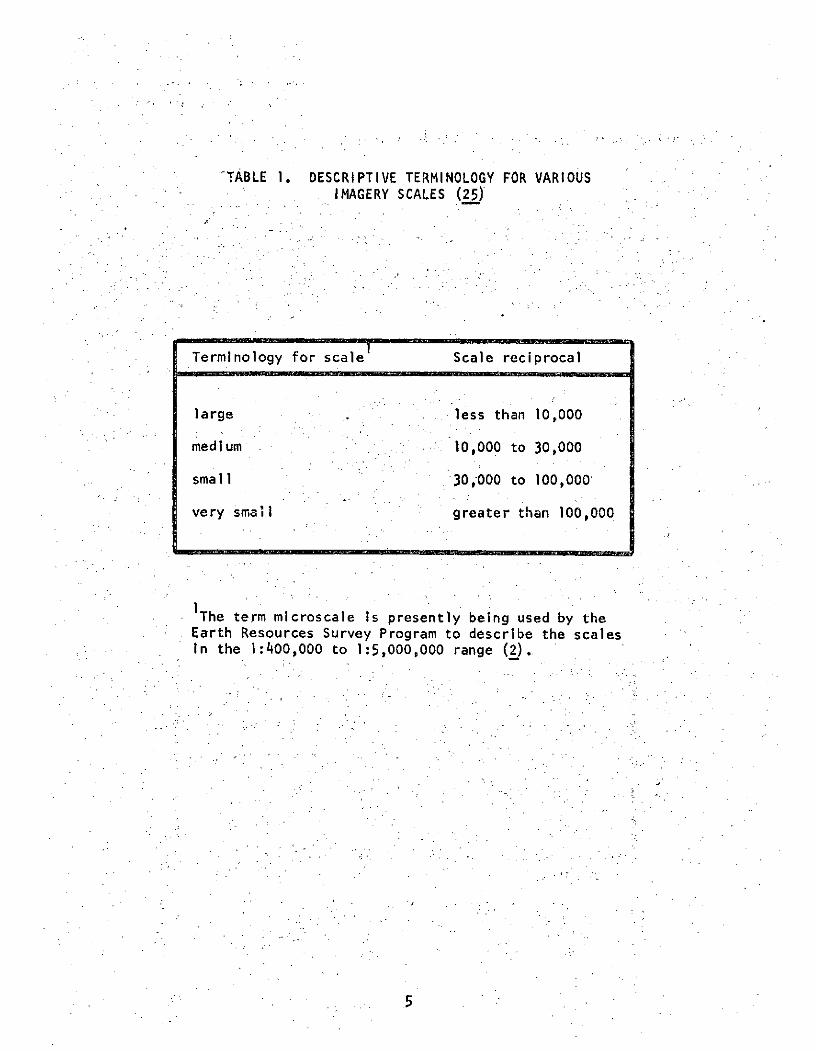
TABLE 1. DESCRIPTIVE TERMINOLOGY FOR VARIOUSIMAGERY SCALES (25)
Terminology for scaleT Scale reciprocal
large. . less than 10,000
medium 10,000 to 30,000
small 30,000 to 100,000'
very small greater than 100,000
IThe term microscale Is presently being used by theEarth Resources Survey Program to describe the scalesIn the 1:400,000 to 1:5,000,000 range (2).
5
A system of economically detecting stress In forest trees by remote
sensing techniques could provide a capability for monitoring the Inten-
sity of Infection and Its rate of spread. Very small-scale photography
or satellite Imagery might provide the means for such disease monitoring
In that a small number of photographs cover a large area (1, L, 11). The
smaller the number of scenes required to fulfill a mission, the more effi-
cient will be the handling, preparation, storage, and interpretation of
the photographs. An example of this reduction in processing and handling
costs is pointed out by the fact that one Apollo 9 vertical photograph
covered an area of 100 x 100 miles (1).
The lack of high resolution in very small-scale photography presents
some problems of data extraction. More information Is buried within a
photograph than Is readily available to the .lnterpreter. Ross points out
that one square inch of color film Is capable of recording more than a
billion bits of Information (22). Mechanical, optical, and electronic
methods of aiding in the extraction of information are available under
research conditions. Processing methods, such as masking, enhance or
isolate given density levels. Another process, density level slicing,
separates selected density levels. The recombining of spectral slices
of the same scene can provide a picture that contains either true or
false colors (9). One example of such a procedure Is embodied in the
system used in the ERTS-I Satellite (8).
Objectives of the Study
At the outset, the following objectives were established:
1. To investigate the best techniques for locating disease infection
6
centers in forest stands through high-altitude imagery.
2. To evaluate the usefulness of very small-scale photography
(1:118,000 to 1:450,000) in forest vegetation classification.
3. To evaluate selected film-filter combinations for use In
stressed vegetation detection and classification.
REVIEW OF LITERATURE
In that this study is primarily concerned with the detection of
disease-stressed vegetation by remote sensing techniques, a discussion
of stressed vegetation and remote sensing is in order.
Stressed vegetation is that plant material which is being affected
by conditions that are adverse to normal growth. Some of the adverse
conditions could result from insect attacks, disease, drought, flooding,
soil compaction, or mechanical injury to trees. Factors that cause seri-
ous damage to the tree bring on a change within the foliage. The symptoms
can vary from loss of foliage to leaf discoloration. In any case, the
tonal rendition of a "stressed" tree is altered by these adverse conditions.
Remote sensing is the obtaining of information concerning an object
without actually contacting that object. Generally, the use of a system
to collect reflected or emitted energy from a scene of interest and to
record it in a usable manner is considered remote sensing. As it is used
in forestry today, remote sensing is the collection of data by cameras or
other recording systems mounted on airborne platforms or satellites (9).
The capability of detecting stressed vegetation is needed by today's
forest land managers to help combat the threat of disease and insect
attacks on our forest resources. Several million cubic feet of timber are
7
lost to insects and diseases every year (4). Six percent of the annual
drain on forests is attributed to Insects and disease, while the direct
annual loss caused by, disease damage to trees is estimated to be approxi-
mately $83 million (7, 9). Dwarf mistletoes are second only to root rots
in causing damage to conifers (3), Including 157,000 acres of the black
spruce type in Minnesota (19).
Diseases can be classed as either pathogenic or nonpathogenic. In
the pathogenic class it is the parasitic organism, or pathogen, interfer-
ing with the host plant that results in the disease. Nonpathogenic
diseases caused by environmental factors cause stress within plants and
are widespread. These are usually deficiency related and more pertinent
to agricultural crops of short rotation than to forest stands (28). How-
ever, environmental changes within forest stands caused by water table
changes, ground fires, and similar events can cause stress in trees.
Viruses, bacteria, and fungi can also act as pathogenic agents. Also,
seed-bearing plants, such as the mistletoes, can be pathogens.
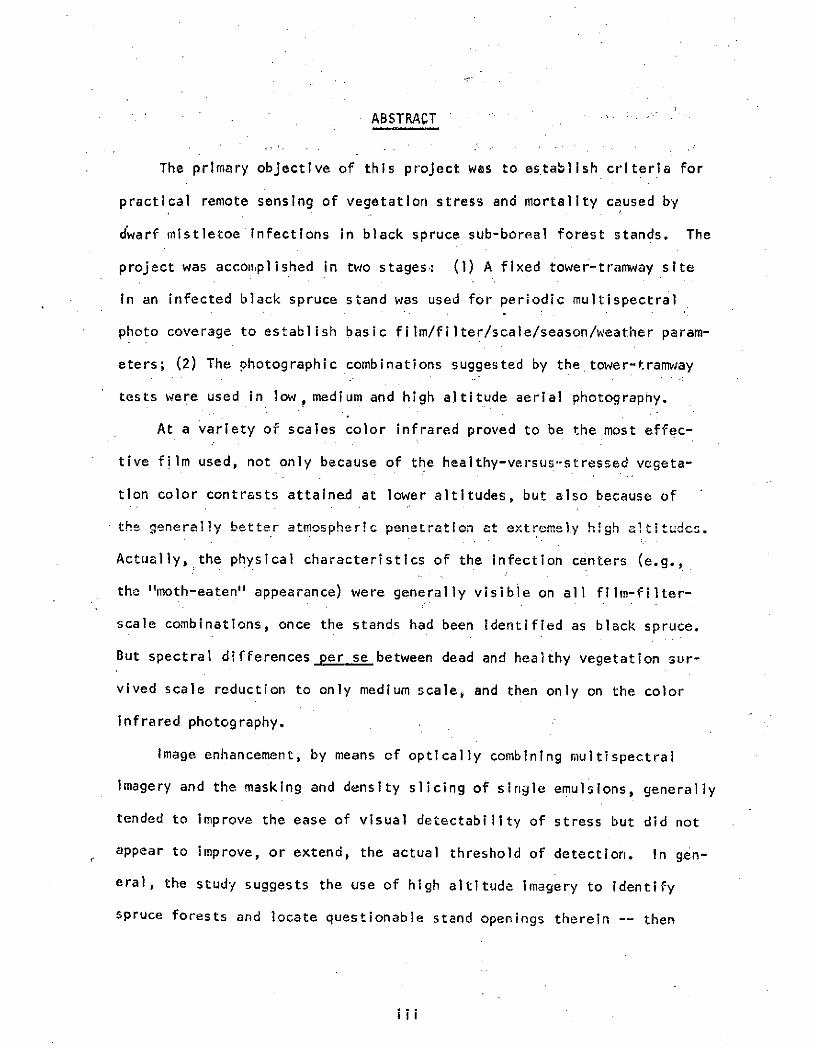
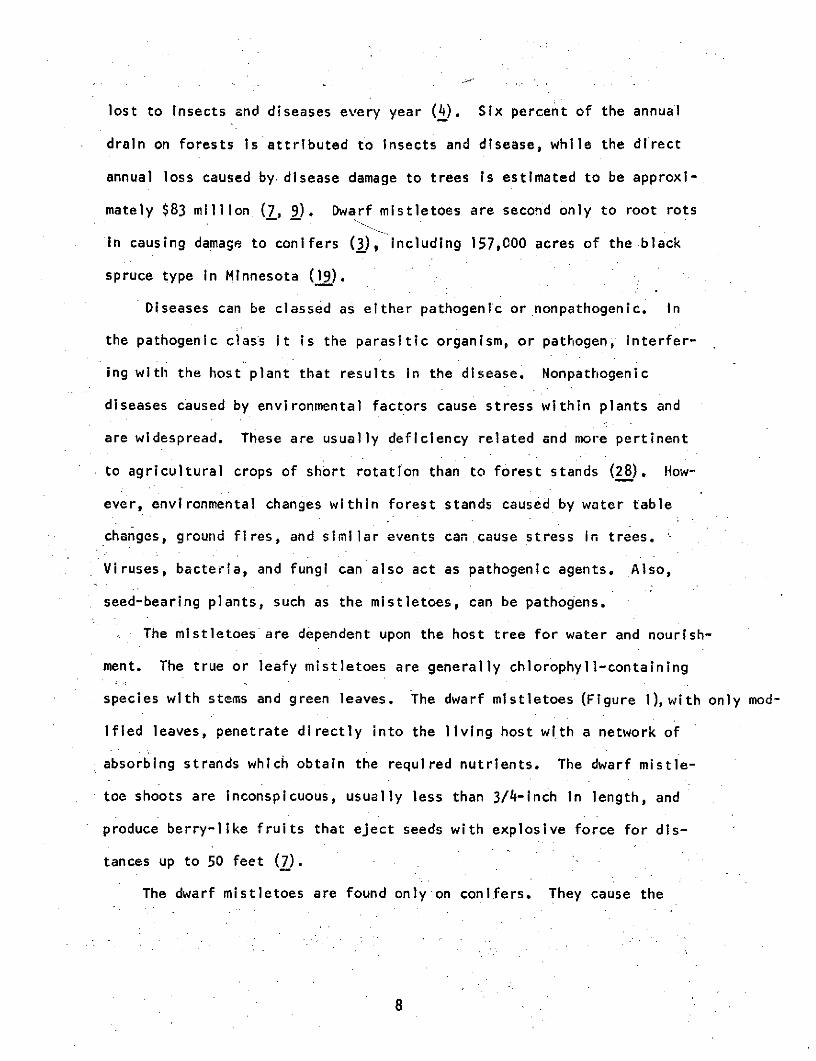
The mistletoes are dependent upon the host tree for water and nourish-
ment. The true or leafy mistletoes are generally chlorophyll-containing
species with stems and green leaves. The dwarf mistletoes (Figure 1),with only mod-
ified leaves, penetrate directly into the living host with a network of
absorbing strands which obtain the required nutrients. The dwarf mistle-
toe shoots are inconspicuous, usually less than 3/4-inch In length, and
produce berry-like fruits that eject seeds with explosive force for dis-
tances up to 50 feet (7).
The dwarf mistletoes are found only on conifers. They cause the
8
I
II A l
Figure']. Dwarf mistletoe infection on black spruce branch.
I A:zr r
I 'p-:~ -* r
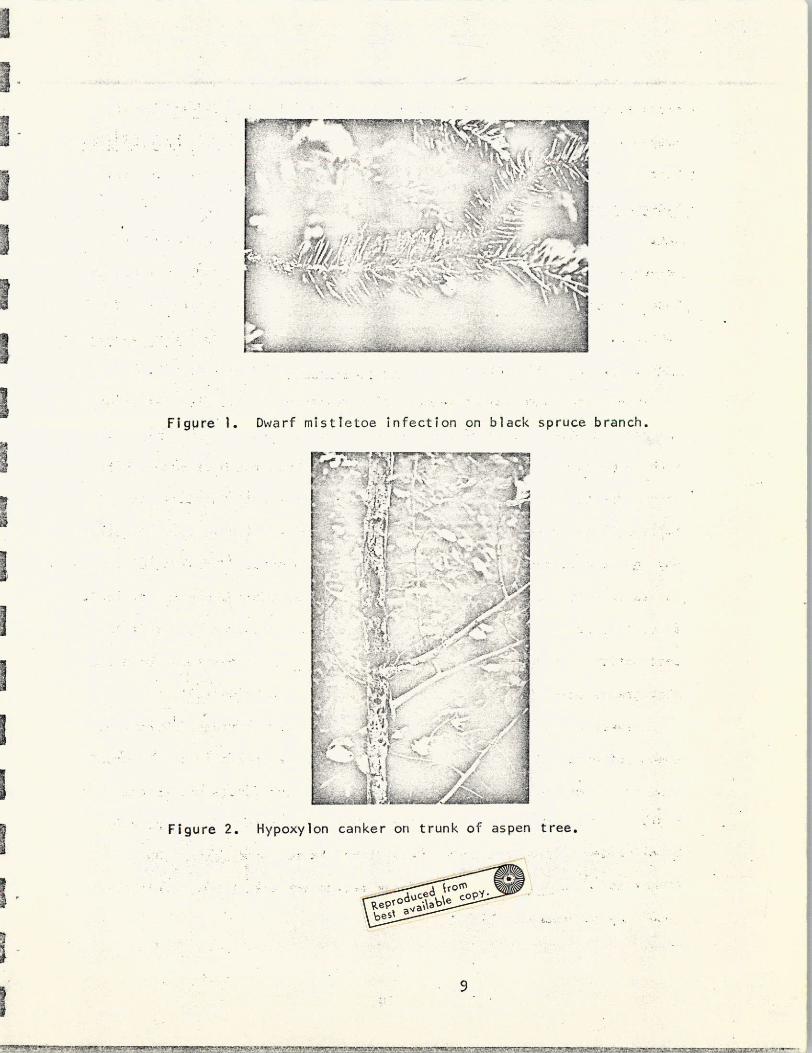
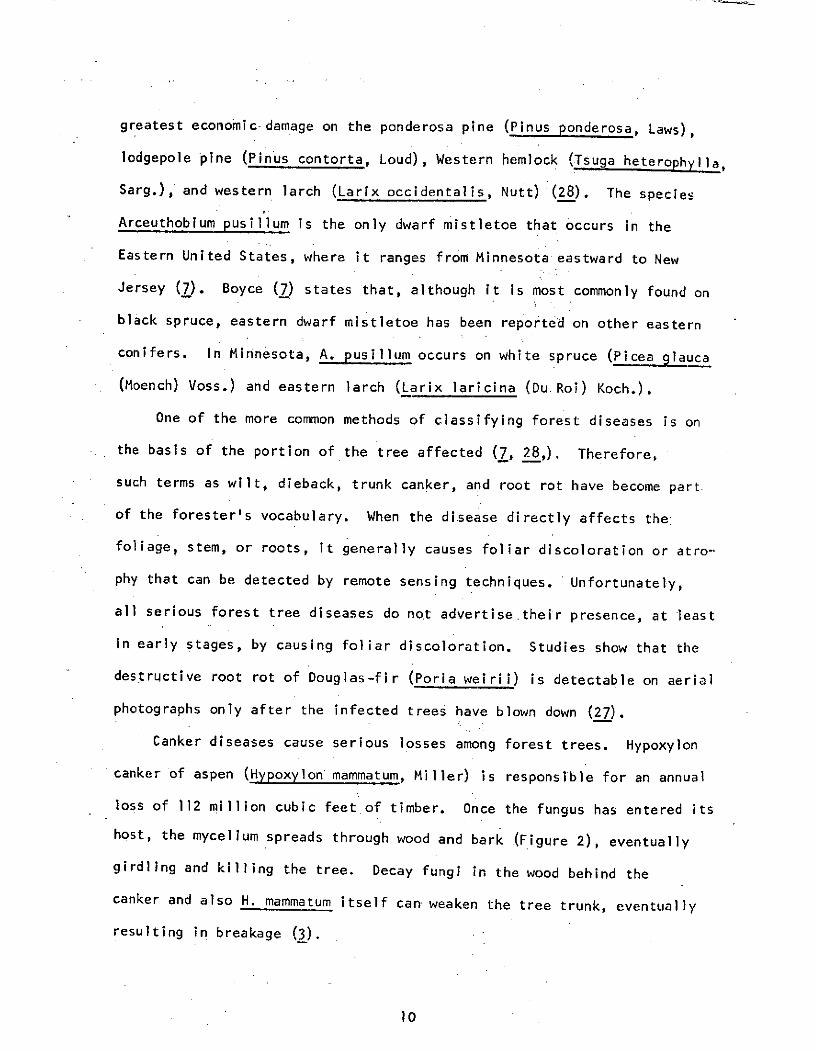
IFigure 2. Hypoxy ion canker on trunk of aspen tree.
II
1\.e
greatest economic-damage on the ponderosa pine (Pinus ponderosa, Laws),
lodgepole pine (Pinus contorta, Loud), Western hemlock (Tsuga heterophylla,
Sarg.), and western larch (Larix occidentalis, Nutt) (28). The species
Arceuthobium pusillum is the only dwarf mistletoe that occurs in the
Eastern United States, where it ranges from Minnesota eastward to New
Jersey (7). Boyce (7) states that, although it is most commonly found on
black spruce, eastern dwarf mistletoe has been reported on other eastern
conifers. In Minnesota, A. pusillum occurs on white spruce (Picea glauca
(Moench) Voss.) and eastern larch (Larix laricina (Du.Roi) Koch.).
One of the more common methods of classifying forest diseases is on
the basis of the portion of the tree affected (7, 28,). Therefore,
such terms as wilt, dieback, trunk canker, and root rot have become part.
of the forester's vocabulary. When the disease directly affects the:
foliage, stem, or roots, it generally causes foliar discoloration or atro-
phy that can be detected by remote sensing techniques. Unfortunately,
all serious forest tree diseases do not advertise.their presence, at least
in early stages, by causing foliar discoloration. Studies show that the
destructive root rot of Douglas-fir (Poria weirii) is detectable on aerial
photographs only after the infected trees have blown down (27).
Canker diseases cause serious losses among forest trees. Hypoxylon
canker of aspen (Hypoxylon mammatum, Miller) is responsible for an annual
loss of 112 million cubic feetof timber. Once the fungus has entered its
host, the mycelium spreads through wood and bark (Figure 2), eventually
girdling and killing the tree. Decay fungi in the wood behind the
canker and also H. mammatum itself can- weaken the tree trunk, eventually
resulting in breakage (3).
10
METHODS OF INVESTIGATION
Introduction
Five substudies in the sub-boreal forests of northern Minnesota
comprise the overall investigation of this study:
1, Detection and location of dwarf mistletoe in black spruce
stands.
2. Detection and location of hypoxylon canker In aspen.
3. Detection and location of Armillaria root rot in red pine plan-
tations.
4. Classification of major forest vegetation cover types with very
high-altitude photography.
5. Remote sensing evaluation of post-burn surveys.
A brief introduction to each substudy follows, including test site
descriptions and locations, along with the investigative methods and tech-
niques employed.
Eastern Dwarf Mistletoe
Eastern dwarf mistletoe was selected because of its importance, geo-
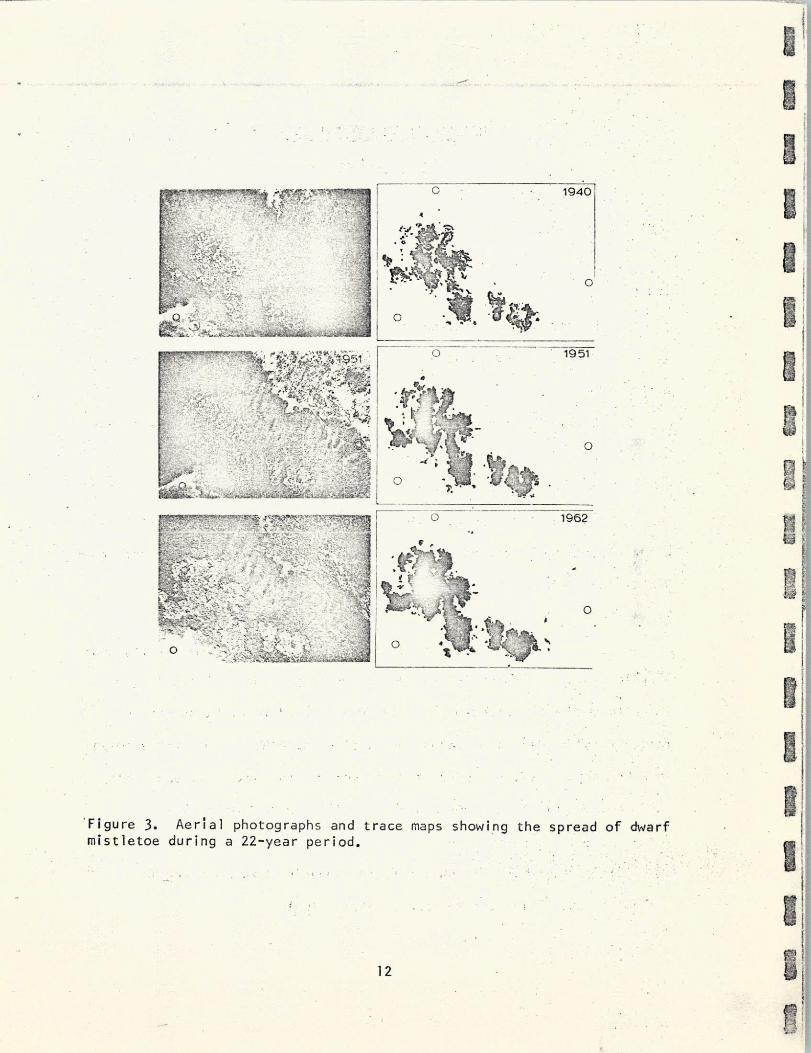
-- graphic range, and potential for detection (Figure 3). It is an econ-
omically important pathogen occurring over the range of black spruce.
While it is in most cases parasitic to black spruce, it does cause losses
in other spruce species and eastern larch. It has been estimated that
seven percent of the two and a quarter million acres of black spruce
forest type in Minnesota are infected with dwarf mistletoe (19).
This pathogen is well suited for a study in remote sensing in
disease detection for the following reasons (20).
11
0 1940
0
- 0 -1951
S01962
Figure 3. Aerial photographs and trace maps showing the spread of dwarfmistletoe during a 22-year period.
12
I. The disease development is uniform.
2. It occurs within pure stands of black spruce.
3. Only one species of dwarf mistletoe is present.
4. All stages of disease development are present.
5. The Infected stands are even-aged and generally uniform in
height so as to be very suitable for aerial photographic interpretation.
6. Its main host, black spruce, is easy to detect on aerial photo-
graphs.
Within recent years, studies have indicated that successful control
of dwarf mistletoe can be obtained by removal of infected trees accom-
panied by prescribed burning of the cutover land (13). Since a control
is known, a technique for location, detection, and monitoring becomes a
necessity If an operational eradication program Is to be effective.
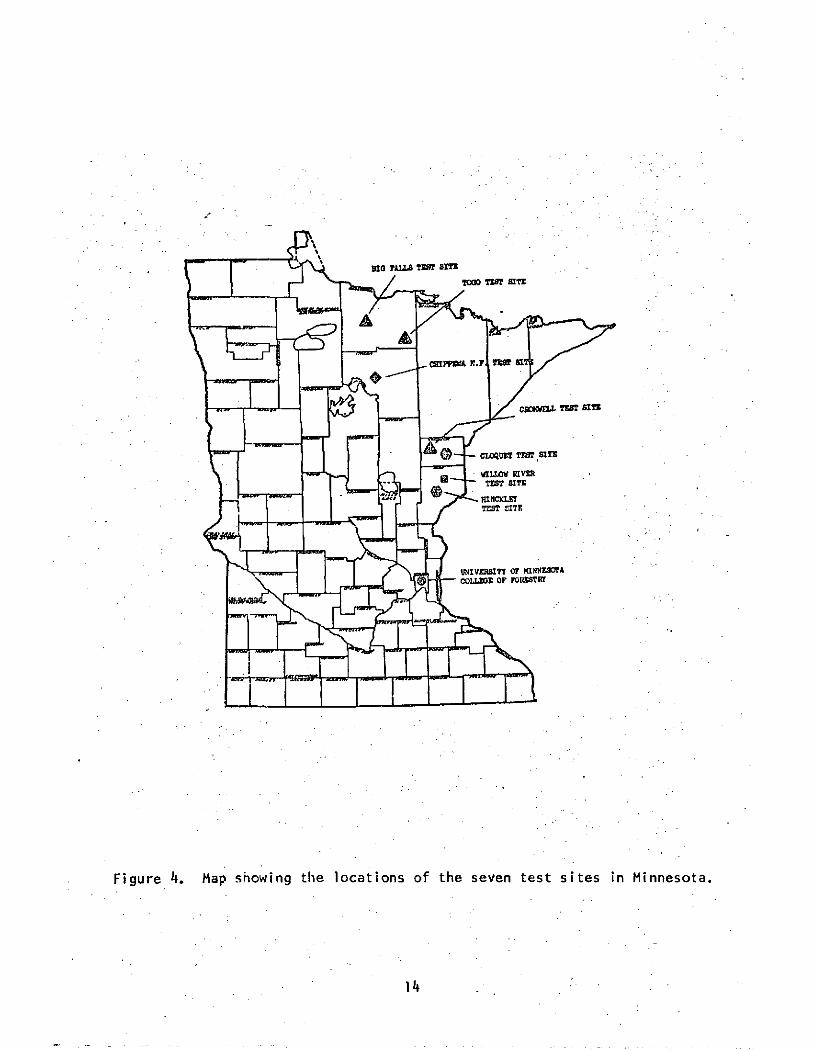
Study sites .(Figuro 4) were.originally established at two locations
in northern Minnesota. A fixed-scene site was established near Cromwell
in Carlton County, and an extensive survey area was delineated north of
Togo in Koochiching County (Figure 4).
Hypoxylon Canker
Hypoxylon canker is the most important disease affecting aspen (3,
20). The causal organism, H. mammatum, is a canker-forming fungus that
girdles and kills the-tree. Since the disease takes from three to ten
years to kill a tree, the infections appear more endemic than epidemic,
because the dead trees appear singularly rather than In concentrated
disease centers as is the case with many other diseases.
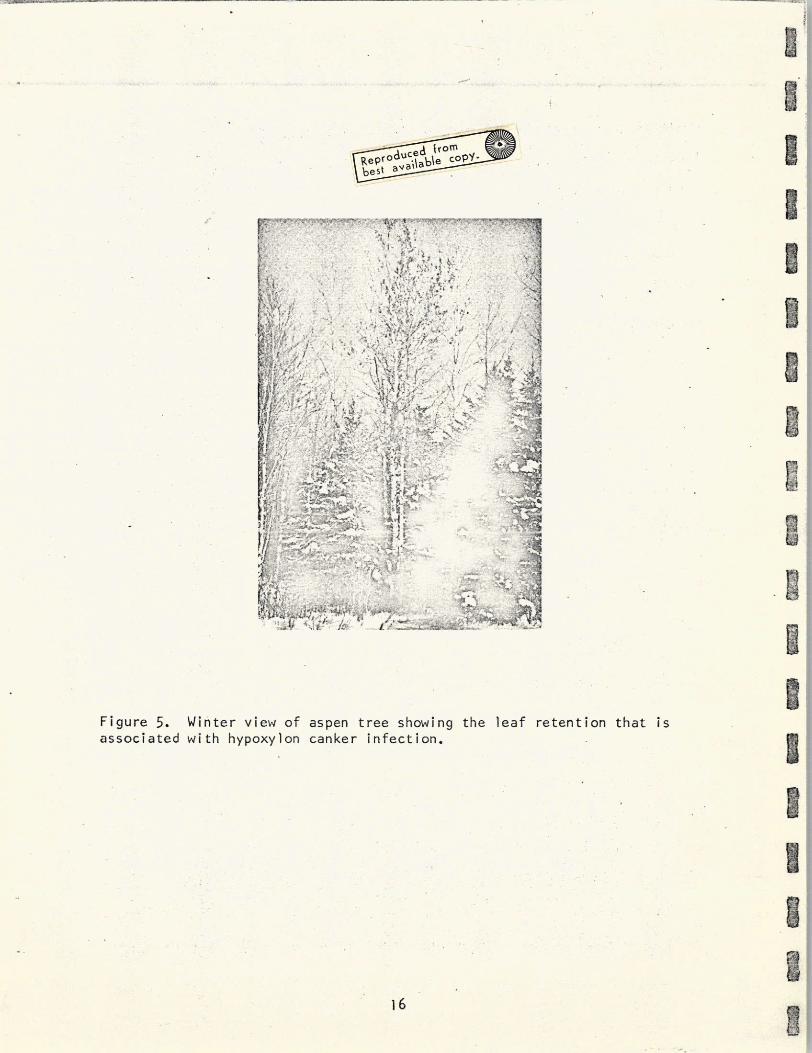
Aspen trees with cankers tend to retain their leaves into the winter
13
BI(I FALIA TER BITSI
TUOIVER SIT FMES0
OLL OF ESTSSTIR
Figure 4. Map showing the locations of the seven test sites in Minnesota.
14
craOvcM asm BITC
WLLOW EVIERTEST SITE
TEST ETE
VNIVAMTY OF MINNES9rACODS OF 1(OWTRf
Figure 4.Map showing the locations of the seven test sites in Minnesota.
14
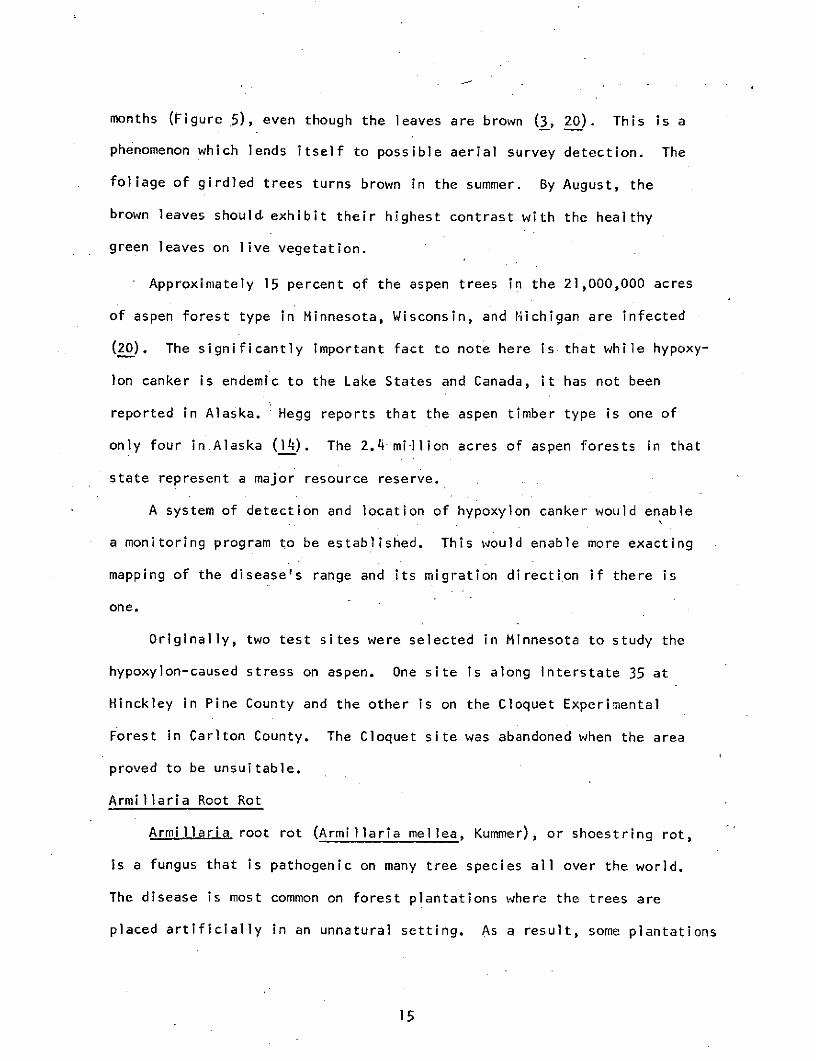
months (Figure 5), even though the leaves are brown (3, 20). This is a
phenomenon which lends itself to possible aerial survey detection. The
foliage of girdled trees turns brown in the summer. By August, the
brown leaves should exhibit their highest contrast with the healthy
green leaves on live vegetation.
Approximately 15 percent of the aspen trees in the 21,000,000 acres
of aspen forest type in Minnesota, Wisconsin, and Michigan are infected
(20). The significantly important fact to note here is that while hypoxy-
lon canker is endemic to the Lake States and Canada, it has not been
reported in Alaska. Hegg reports that the aspen timber type is one of
only four in.Alaska (14). The 2.4 mi-llion acres of aspen forests in that
state represent a major resource reserve.
A system of detection and location of hypoxylon canker would enable
a monitoring program to be established. This would enable more exacting
mapping of the disease's range and its migration direction if there is
one.
Originally, two test sites were selected in Minnesota to study the
hypoxylon-caused stress on aspen. One site is along Interstate 35 at
Hinckley in Pine County and the other is on the Cloquet Experimental
Forest in Carlton County. The Cloquet site was abandoned when the area
proved to be unsuitable.
Armillaria Root Rot
Armillaria root rot (Armillaria mellea, Kummer), or shoestring rot,
is a fungus that is pathogenic on many tree species all over the world.
The disease is most common on forest plantations where the trees are
placed artificially in an unnatural setting. As a result, some plantations
15
e duced jrOmPep ",,J~ble COPYbest
i / ;-
%rl
1A
Figure 5. Winter view of aspen tree showing the leaf retention that is
associated with hypoxylon canker
infection.
j6I
,i I16" i* s
of red pines within Minnesota have lost as many as 55 percent of the trees
to this disease. Ten percent mortality due to shoestring rot is common.
A part of an active plantation management program calls for replanting in
areas having mortality losses to maintain the integrity of the stand. An
economic detection system, perhaps airborne, would provide the manager
with the information to plan on replantings or to change species. Red
pine plantations in Pine County were selected for the Armillaria study
sites.
Forest Vegetation Classification
The Marcell Ranger District of the Chippewa National Forest in Itasca
County served as a study site. This site was used to test levels of dif-
ference In ability to interpret major forest vegetation cover types on
very small-scale photography.' Studies by Aldrich indicate that the use
of Apollo 9 phctography reduced the sampling error by 58 percent in a
multistage forest inventory in the Lower Mississippi Valley (1). Also,
satellite imagery provides the advantage of syncptic views which can be
used for several levels of sampling to achieve greater informational
gains (1).
To what extent can the upper stage of the sample, the satellite or
very high altitude imagery, be used in stratifying the forests being
inventoried? By working with the very small-scale photos of the Marcell
Ranger District, this study will measure the ability of skilled photo-
graphic interpreters of various disciplines to interpret the same major
forest cover types of northern Minnesota.
Post-burn Survey Analysis
The possibility for making post-burn analyses was suggested after
17
the initial overflight in 1965. Several locations of black spruce slash
burnings were Included on infrared color photographs. Photo interpreta-
tion Indicated that the potential might exist for assessing the pattern,
extent, and intencsity of the burn. These variables could be used to rate
the success of the prescription burn developed by Irving and French as a
technique for controlling dwarf mistletoe (16).
Dwarf Mistletoe Detection
Aerial Photography and Field Data Collection
Cromwell Test Site. The intensive test site at Cromwell was selected
to investigate the variables affecting spectral signatures of the infested
black spruce. The work at this site was begun In the spring of 1970. The
variables first considered in looking for an indicative spectral signature
for dwarf mistletoe were:
Effects of sun angle
Light intensity
Season of the year
Atmospheric conditions
Condition of infected trees
Development stage of the parasite
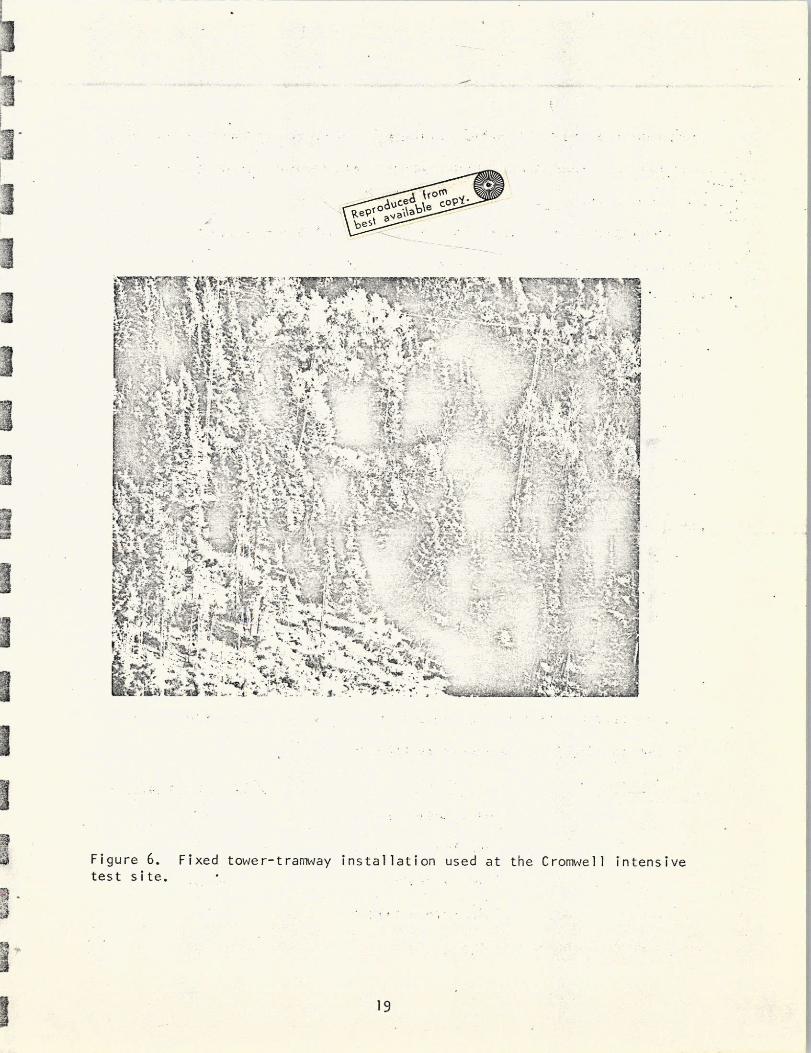
A two-tower tramway system (Figure 6) was constructed so that a camera plat-
form could be moved across the site at a height of approximately 100 feet. The
towers were placed 100 feet apart, enabling the tramway to cover a section
of black spruce bog that contained trees with several stages of infection.
The University of Minnesota's quadricamera mount was used on a trolley.
Fifty millimeter lenses were used in the four 70 mm Hasselblad cameras to
18
I~
~ce~ col
I ,
3- 4 ,' '
N~*%
j-j
test site.a~;
19III :i ,
i_~ 2 1 i: : Vs~~;~; i .J,:, ';Ir
S~
Id L;-tPIIi. ii;I~~~~~~~~ Fgr6.Fxdtwrtawyinsaltonue tth rmel nesv
test';: site.*;: l[ fi- ;1r= 19 'r si
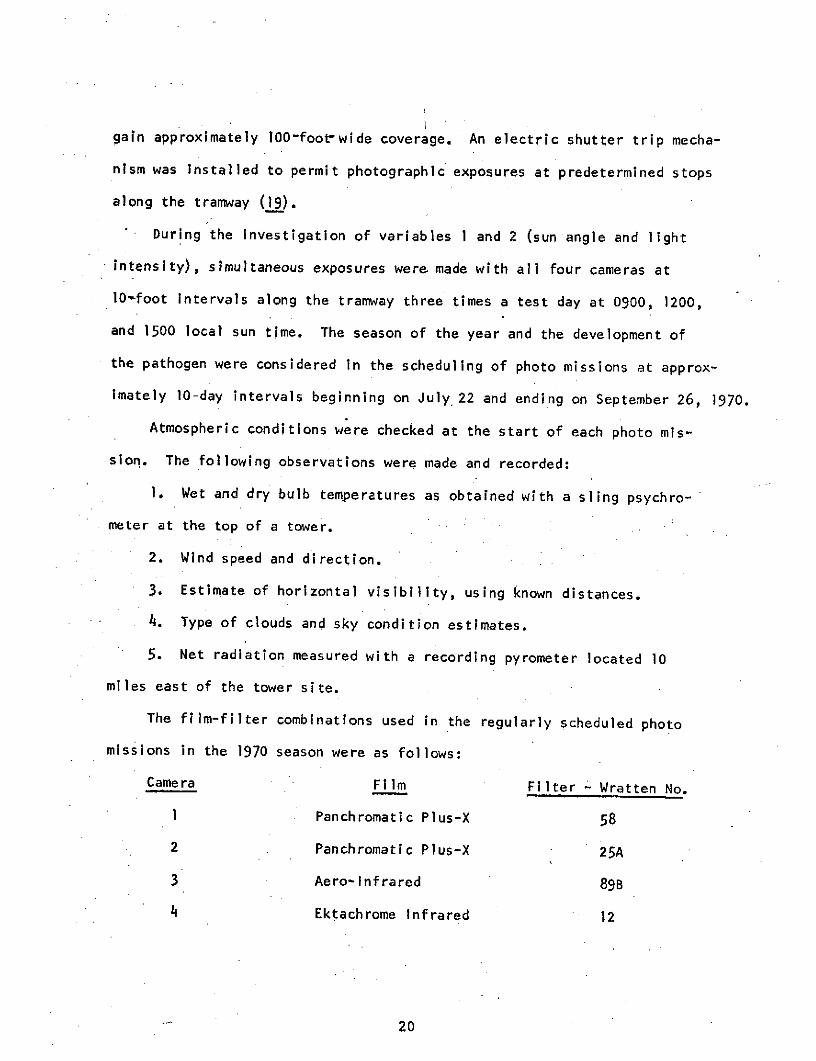
gain approximately 100-foot-wide coverage. An electric shutter trip mecha-
nism was installed to permit photographic exposures at predetermined stops
along the tramway (19).
During the investigation of variables 1 and 2 (sun angle and light
intensity), simultaneous exposures were made with all four cameras at
10-foot intervals along the tramway three times a test day at 0900, 1200,
and 1500 local sun time. The season of the year and the development of
the pathogen were considered in the scheduling of photo missions at approx-
imately 10-day intervals beginning on July.22 and ending on September 26, 1970.
Atmospheric conditions were checked at the start of each photo mis-
sion. The following observations were made and recorded:
1. Wet and dry bulb temperatures as obtained with a sling psychro-
meter at the top of a tower.
2. Wind speed and direction.
3. Estimate of horizontal visibility, using known distances.
4. Type of clouds and sky condition estimates.
5. Net radiation measured with a recording pyrometer located 10
miles east of the tower site.
The film-filter combinations used in the regularly scheduled photo
missions in the 1970 season were as follows:
Camera Film Filter - Wratten No.
1 Panchromatic Plus-X 58
2 Panchromatic Plus-X 25A
3 Aero-Infrared 89B
4 Ektachrome Infrared 12
20
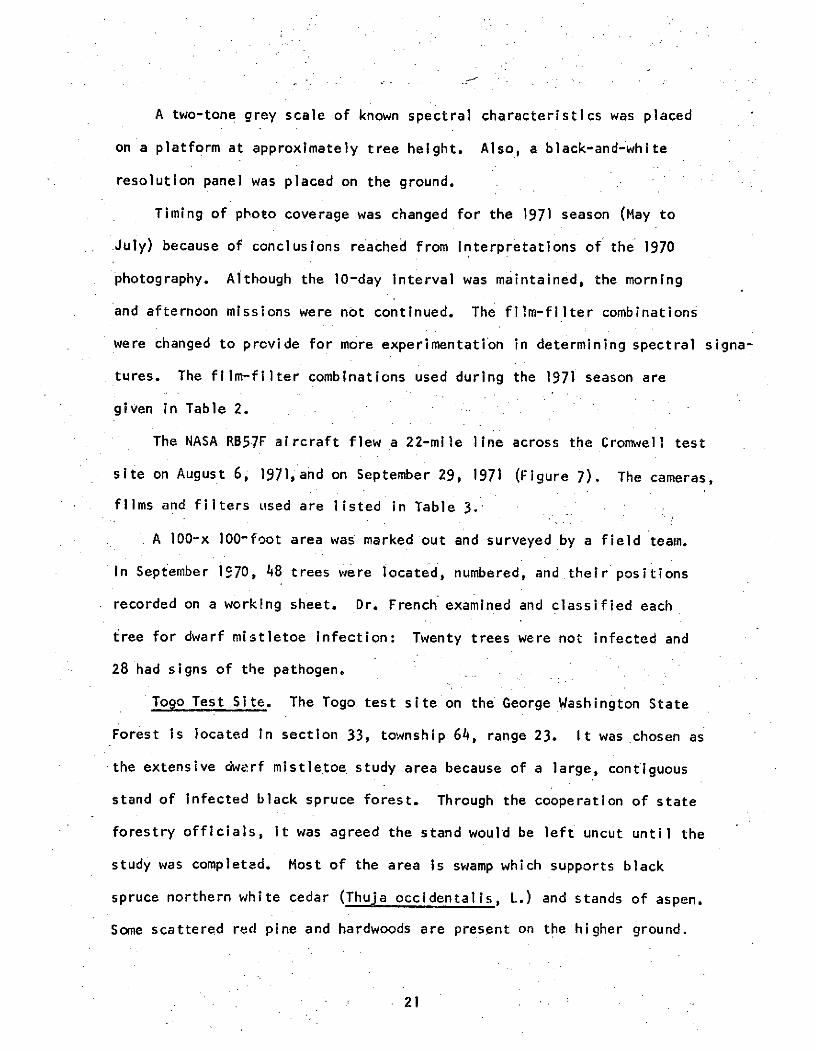
A two-tone grey scale of known spectral characteristics was placed
on a platform at approximately tree height. Also, a black-and-white
resolution panel was placed on the ground.
Timing of photo coverage was changed for the 1971 season (May to
July) because of conclusions reached from Interpretations of the 1970
photography. Although the 10-day interval was maintained, the morning
and afternoon missions were not continued. The film-filter combinations
were changed to provide for more experimentation in determining spectral signa-
tures. The film-filter combinations used during the 1971 season are
given in Table 2.
The NASA RB57F aircraft flew a 22-mile line across the Cromwell test
site on August 6, 1971,and on September 29, 1971 (Figure 7). The cameras,
films and filters used are listed in Table 3.
A 100-x 100-foot area was marked out and surveyed by a field team.
In September 1970, 48 trees were located, numbered, and their positions
recorded on a working sheet. Dr. French examined and classified each
tree for dwarf mistletoe infection: Twenty trees were not infected and
28 had signs of the pathogen.
Togo Test Site. The Togo test site on the George Washington State
Forest is located In section 33, township 64, range 23. It was chosen as
the extensive dwarf mistletoe. study area because of a large, contiguous
stand of infected black spruce forest. Through the cooperation of state
forestry officials, It was agreed the stand would be left uncut until the
study was completed. Most of the area Is swamp which supports black
spruce northern white cedar (Thuja occidentalis, L.) and stands of aspen.
Some scattered red pine and hardwoods are present on the higher ground.
21
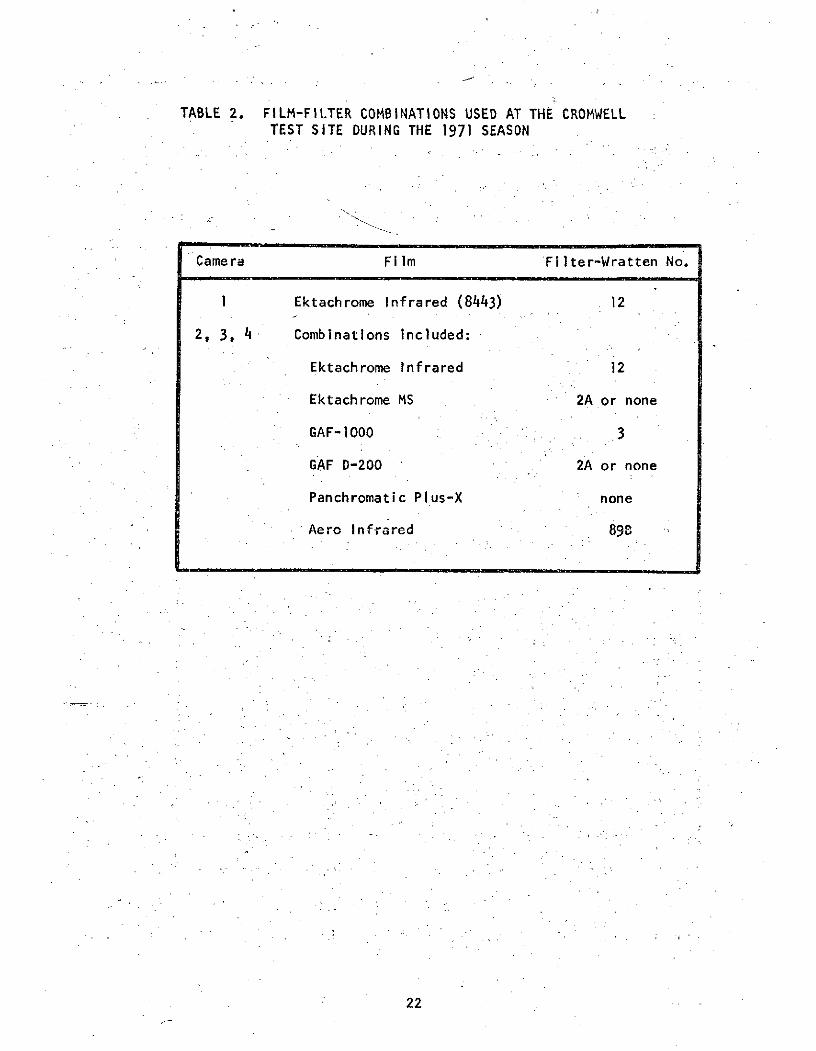
TABLE 2. FILM-FILTER COMBINATIONS USED AT THE CROMWELLTEST SITE DURING THE 1971 SEASON
Camera Film Fllter-Wratten No.
1 Ektachrome Infrared (8443) 12
2, 3, 4 Combinations included:
Ektachrome Infrared 12
Ektachrome MS 2A or none
GAF-1000 3
GAF D-200 2A or none
Panchromatic Plus-X none
Aero Infrared 89U
22
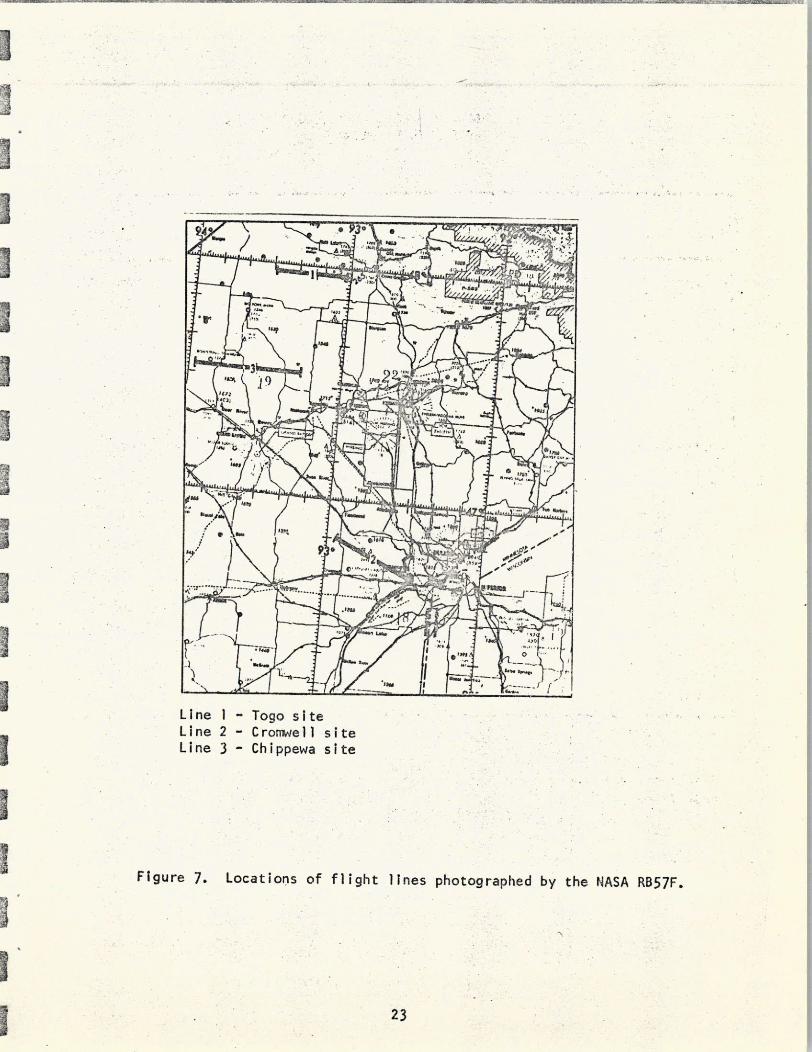
199)*
Line - Togo si te
23
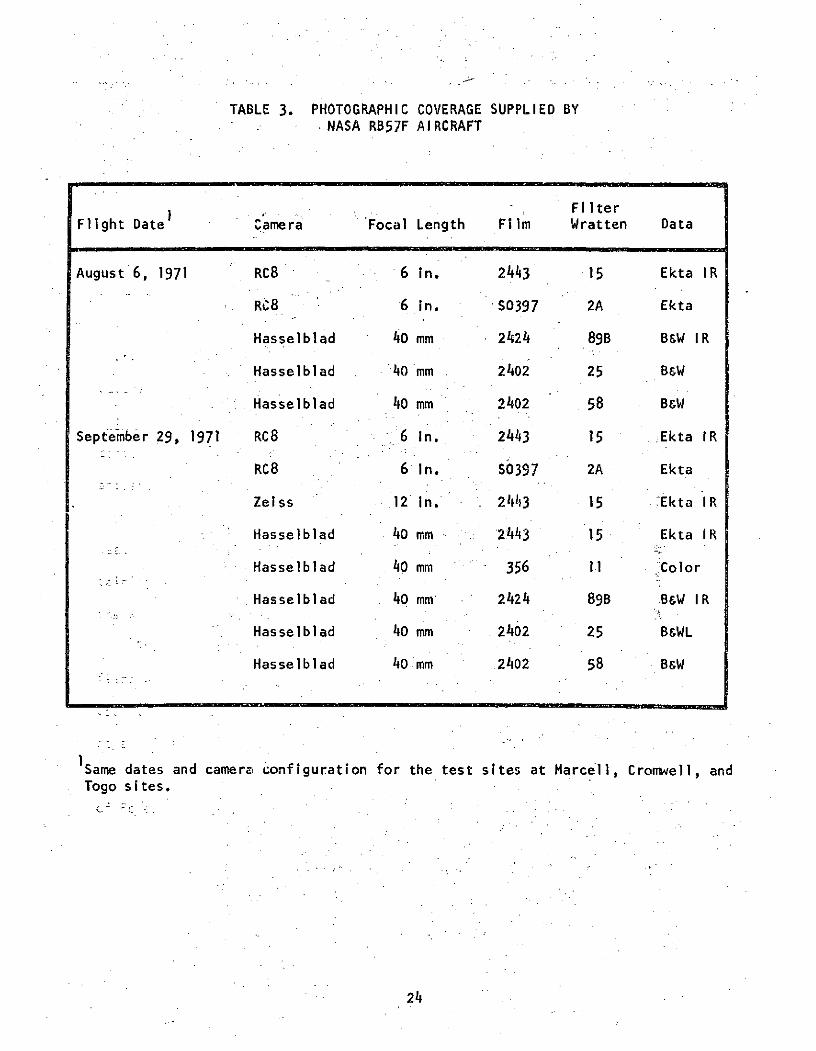
TABLE 3. PHOTOGRAPHIC COVERAGE SUPPLIED BY.NASA RB57F AIRCRAFT
FilterFlight Date1 Camera Focal Length Film Wratten Data
August 6, 1971 RC8 6 In. 2443 15 Ekta IR
RC8 6 in. S0397 2A Ekta
Hasselblad 40 mm 2424 89B B&W IR
Hasselblad 40 mm 2402 25 B&W
Hasselblad 40 mm 2402 58 B&W
September 29, 1971 RC8 6 In. 2443 15 ,Ekta IR
RC8 6 In. S0397 2A Ekta
Zeiss 12 in. 24143 15 ?Ekta IR
Hasselblad 40 mm 2443 15 Ekta IR
Hasselblad 40 mm 356 1I1 :Color
Hasselblad 40 mm 2424 89B B&W IR
Hasselblad 40 mm 2402 25 B&WL
Hasselblad 40 mm 2402 58 B&W
Same dates and camere configuration for the test sites at Marcell, Cromwell, andTogo sites.
24
Some scatterid red pine and hardwoods are present on the higher ground.
Ground trips were made into the Togo test site to obtain a general
orientation Of the area, to check on tree species at specific locations,
and to collect dato on giound conditions at the time of the NASA RB57F
overflight o., August 6, 1971.
The timber on the test site is classified as 5-to 9-inch diameter
black spruce. The 5-to 9-inch diameter trees are approximately 200 years
old. Occasionally, the two classes occur on the same site to create a
two-story stand. Much of the open, logged-over area is covered with
Laborador tea (Ledum groenlandicum, L.), sphagnum mosses, and bog laurel
(Kalmia angustifolia, L.). Ope'nings within the.stand of black spruce
contain bunchberry (Cornus canadensis, L.), Laborador tea, -sphagnum mosses
and speckled alder (Alnus rugosa, DuRoi).
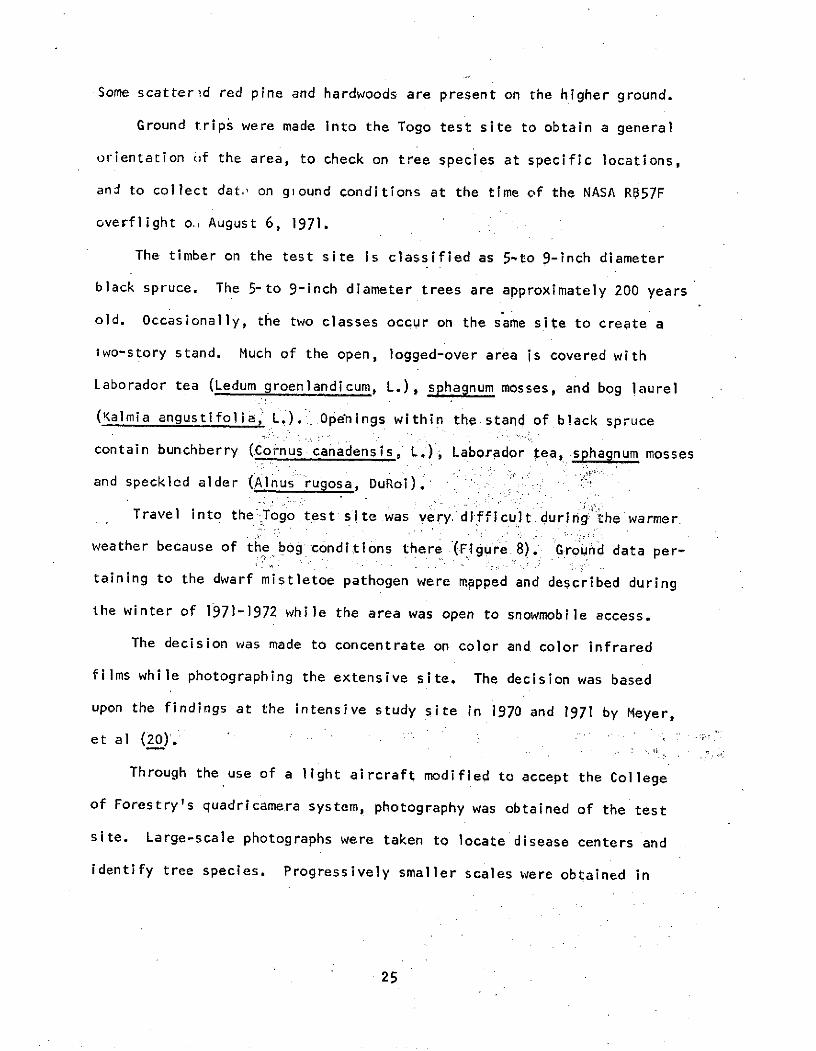
Travel into the Togo test site was very difficult during the warmer.
weather because of the bog conditions there (Figure. 8). Ground data per-
taining to the dwarf mistletoe pathogen were mapped and described during
the winter of 1971-1972 while the area was open to snowmobile access.
The decision was made to concentrate on color and color infrared
films while photographing the extensive site. The decision was based
upon the findings at the intensive study site in 1970 and 1971 by Meyer,
et al (20). . .
Through the use of a light aircraft modified to accept the College
of Forestry's quadricamera system, photography was obtained of the test
site. Large-scale photographs were taken to locate disease centers and
identify tree species. Progressively smaller scales were obtained in
25
.3iReP .o ~be .cop
Figure 8. All-terrain vehicles or snowmobiles were used to enter sprucebog at the Togo test site.
26
order to give a representative range of scales up to the RB57F photog-
raphy for photo Interpretation.
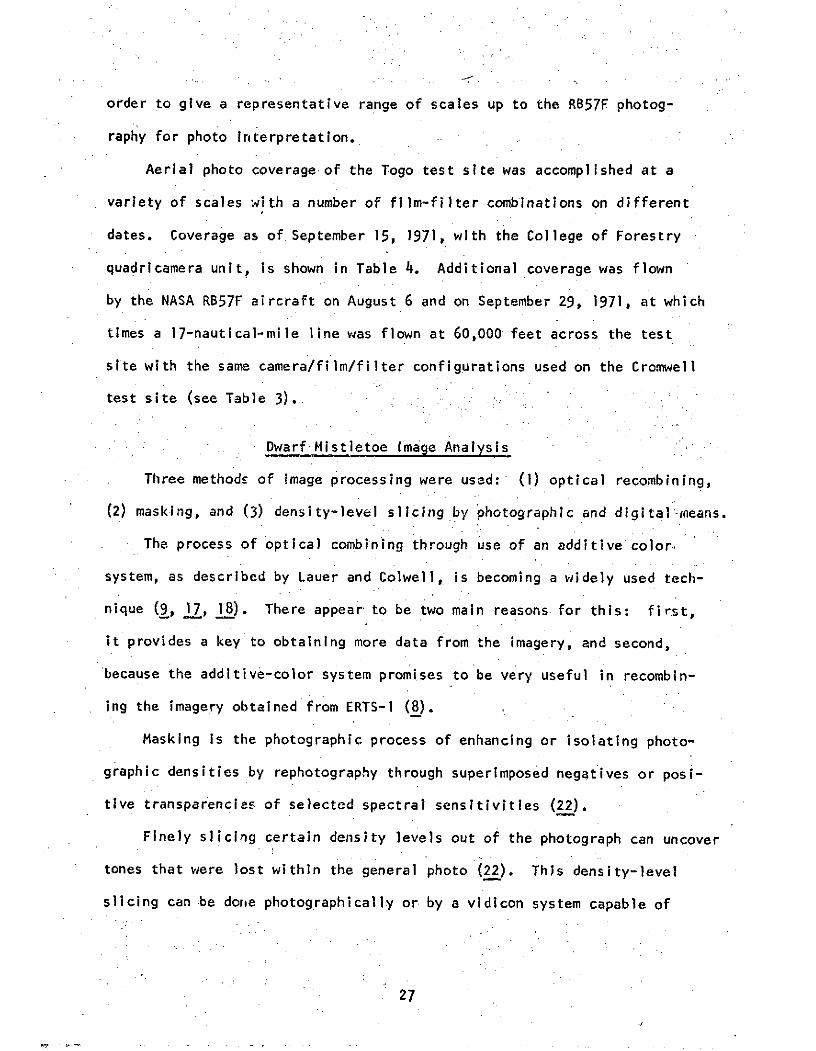
Aerial photo coverage of the Togo test site was accomplished at a
variety of scales with a number of film-filter combinations on different
dates. Coverage as of September 15, 1971, with the College of Forestry
quadricamera unit, is shown in Table 4. Additional coverage was flown
by the NASA RB57F aircraft on August 6 and on September 29, 1971, at which
times a 17-nautical-mile line was flown at 60,000 feet across the test
site with the same camera/film/filter configurations used on the Cromwell
test site (see Table 3).
Dwarf Mistletoe Image Analysis
Three methods of image processing were used: (1) optical recombining,
(2) masking, and (3) density-level slicing by photographic and digital'ineans.
The process of optical combining through use of an additive color.
system, as described by Lauer and Colwell, is becoming a widely used tech-
nique (9, 17, 18). There appear to be two main reasons for this: first,
it provides a key to obtaining more data from the imagery, and second,
because the additive-color system promises to be very useful in recombin-
ing the imagery obtained from ERTS-1 (8).
Masking is the photographic process of enhancing or isolating photo-
graphic densities by rephotography through superimposed negatives or posi-
tive transparencies of selected spectral sensitivities (22).
Finely slicling certain density levels out of the photograph can uncover
tones that were lost within the general photo (22). This density-level
slicing can be done photographically or by a vidicon system capable of
27
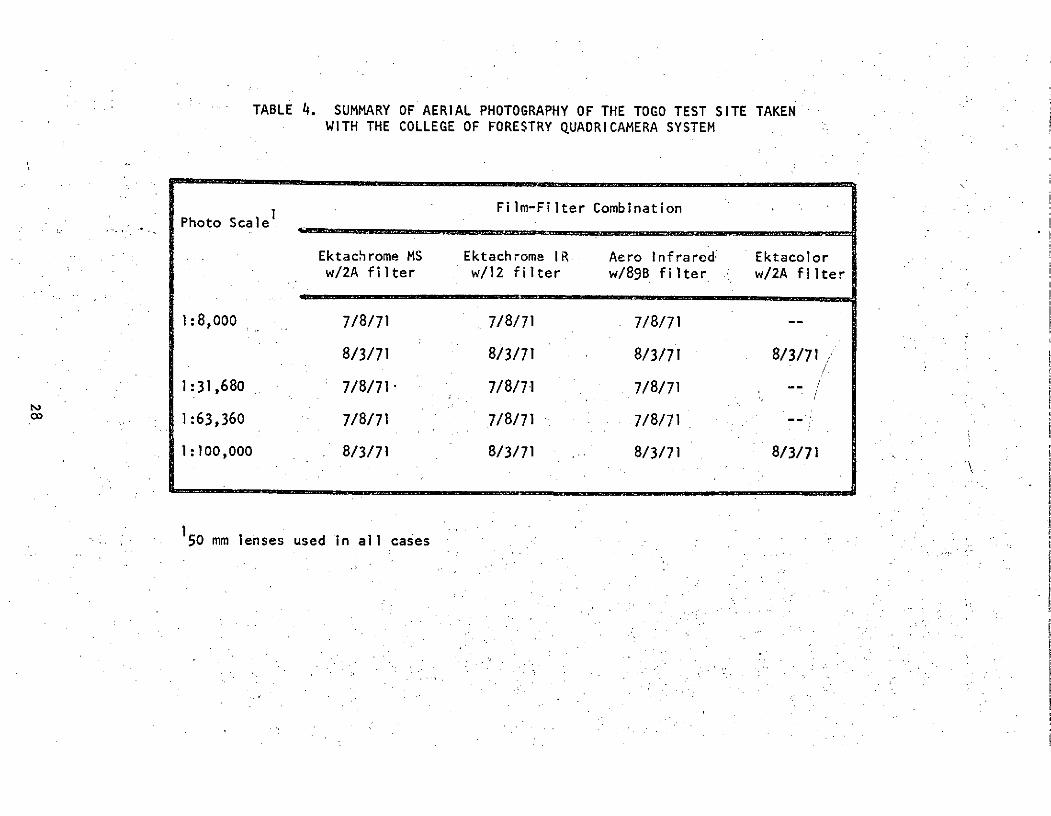
TABLE 4. SUMMARY OF AERIAL PHOTOGRAPHY OF THE TOGO TEST SITE TAKENWITH THE COLLEGE OF FORESTRY QUADRICAMERA SYSTEM
Film-Filter CombinationPhoto Scale.
Ektachrome MS Ektachrome IR Aero Infrared Ektacolorw/2A filter w/12 filter w/89B filter w/2A filter
1:8,000 7/8/71 7/8/71 7/8/71 --
8/3/71 8/3/71 8/3/71 8/3/71 ,/
1:31,680 7/8/71 7/8/71 7/8/71
1:63,360 7/8/71 7/8/71 7/8/71 --
1:100,000 8/3/71 8/3/71 8/3/71 8/3/71
50 mm lenses used in all cases
converting signals from analog to digital.
Arrangements were made with International Imaging Systems of Mountain
View, California, to provide a masking and density-slicing job on the Togo
test site area. The use of their Addcol and Digicol systems was part of
the contract.
Glass mounts were made from each of the three simultaneous exposures
of the NASA Hasseiblad photographs taken on Augus-t 6, 1971,at a scale of
1:462,000. The film-filter combinations used to produce the black-and-
-white transparencies were those used in the standard NASA RB57F package
to simulate the channels of the ERTS-1 return-beam vidicon system. The
three spectral slices obtained are listed in Table 5. They were the com-
monly used combination of green, red, and deep red filters (Wratten num-
bers 58, 25, 898) with panchromatic black-and-white .film number 2402 and
infrared black-and-white film number 2424.
Several combinations of masks involving positive and negative prints
on high-and low-contrast paper were made by the technicians at the Inter-
national Imaging Systems (I S) Laboratories.
The scene selected for the masking investigation was in frame number
9539 of the August 6, 1971,NASA RB57F overflight. This 9-x 9-inch
1:118,000 scale exposure was taken on Ektachrome infrared film through a
Wratten 15 filter with an RC-8 camera from a flying height of 59,000 feet.
The color infrared film was selected because of its clear scene and supe-
rior tonal balance.
12S photo engineer Paul Fedilchak prepared the high-and low-contrast
positives and negatives. These were used in various combinations by placing
29
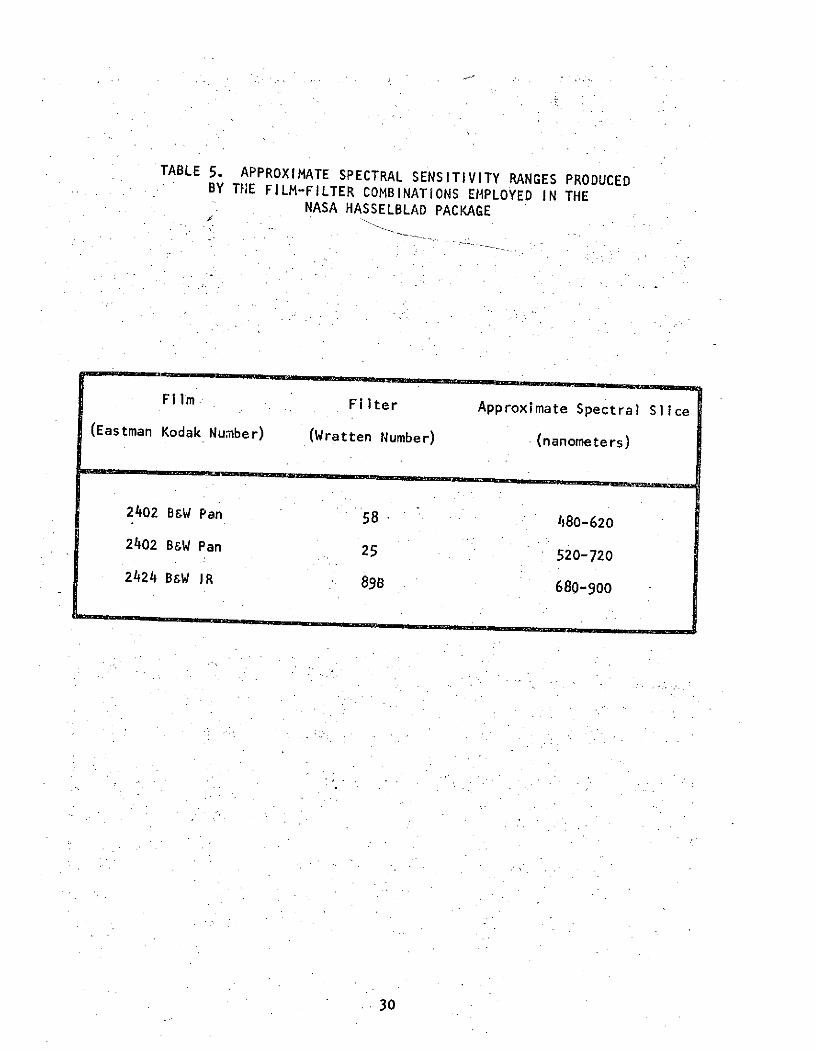
TABLE 5. APPROXIMATE SPECTRAL SENSITIVITY RANGES PRODUCEDBY THE FILM-FILTER COMBINATIONS EMPLOYED IN THE
NASA HASSELBLAD PACKAGE
Film Filter Approximate Spectral Slice
(Eastman Kodak Number) (Wratten Number) (nanometers)
2402 B&W Pan 58 480-620
2402 B&W Pan 25 520-720
2424 B&W IR 898 680-900
30
a positive in registration with a negative and photographing onto a
high-or low-contrast film as a positive or as a negative. The infrared
color positive was used in some of the combinations.
Registration of a negative onto a positive transparency causes the
loss of much of the background density. A small edge enhancement is
caused around the densitites not eliminated by the masking. This enhance-
ment, or unsharp masking, is brought about by the total film thickness
created in stacking of the negatives and positive.
A complete mechanical density-level slicing package was prepared
from the most promising separation in the masking procedure. This was
a red separation using an A-29 filter. It was made of the high-contrast
negative-to-positive mask on panchromatic film.
A high-contrast negative on a high-contrast positive, when photo-
graphed onto a low-contrast film, produces a subtractive effect that
removes some of the background. On the other hand, the use of high-con-
trast film highlights the reds within the scene. The latter combination
was chosen for the complete density level separation.
Sixteen density slices, were made of the red separation on black-
and-white film by 12S. The first separation was black and the next
seven were printed on separate transparencies in another color. Sepa-
rations 9 through! 16 were color-coded in the same order as separations
I through 8. The color coded slices were enclosed in a folder to ensure
their proper registration.
A video-aided density slicing approach was undertaken by using the
12S Digicol Image Enhancer. The red separation positive mentioned above
31
was studied on the Digicol system. This system gives an instant read-out
on a color television screen of up to 36 density levels. Photographic
records were made on 35 mm slides of the images exhibited on the Digicol
screen. Attempts were unsuccessful in using the color infrared positive
on the Digicol. The light source on the video camera was not strong
enough to penetrate the color densities.
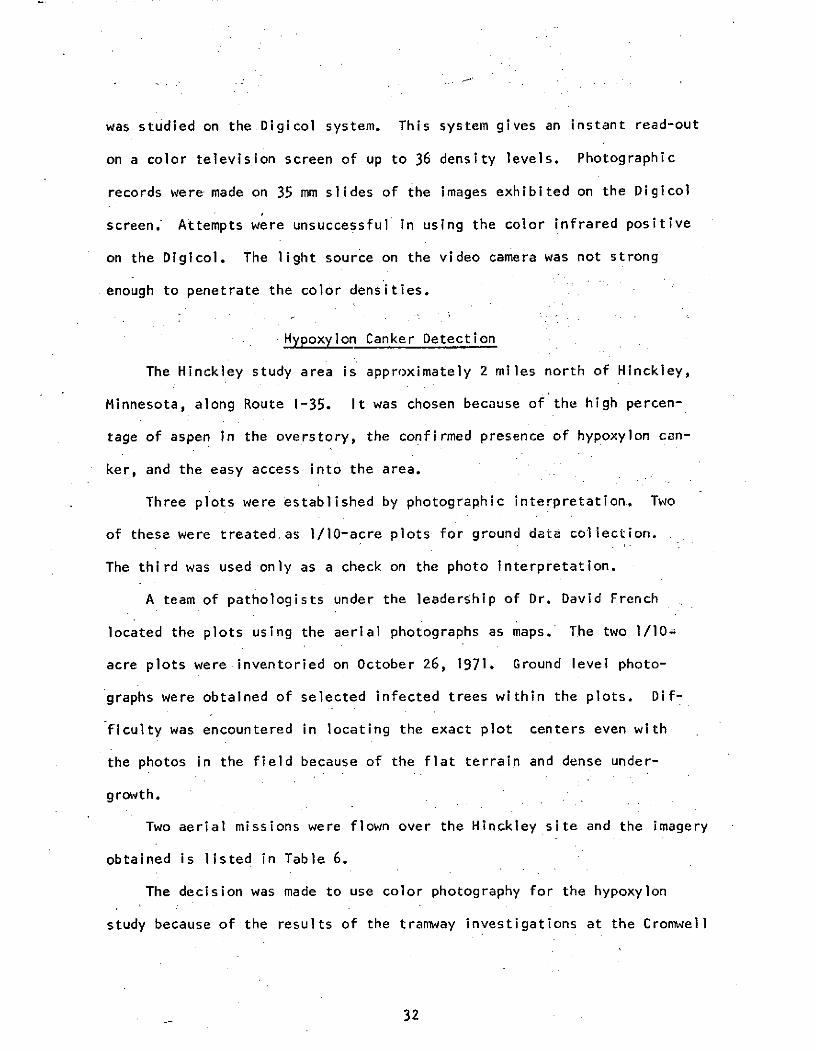
Hypoxylon Canker Detection
The Hinckley study area is approximately 2 miles north of Hinckley,
Minnesota, along Route 1-35. It was chosen because of the high percen-
tage of aspen in the overstory, the confirmed presence of hypoxylon can-
ker, and the easy access into the area.
Three plots were established by photographic interpretation. Two
of these were treated as 1/10-acre plots for ground data collection.
The third was used only as a check on the photo interpretation.
A team of pathologists under the leadership of Dr. David French
located the plots using the aerial photographs as maps. The two 1/10,
acre plots were inventoried on October 26, 1971. Ground level photo-
graphs were obtained of selected infected trees within the plots. Dif-
ficulty was encountered in locating the exact plot centers even with
the photos in the field because of the flat terrain and dense under-
growth.
Two aerial missions were flown over the Hinckley site and the imagery
obtained is listed in Table 6.
The decision was made to use color photography for the hypoxylon
study because of the results of the tramway investigations at the Cromwell
32
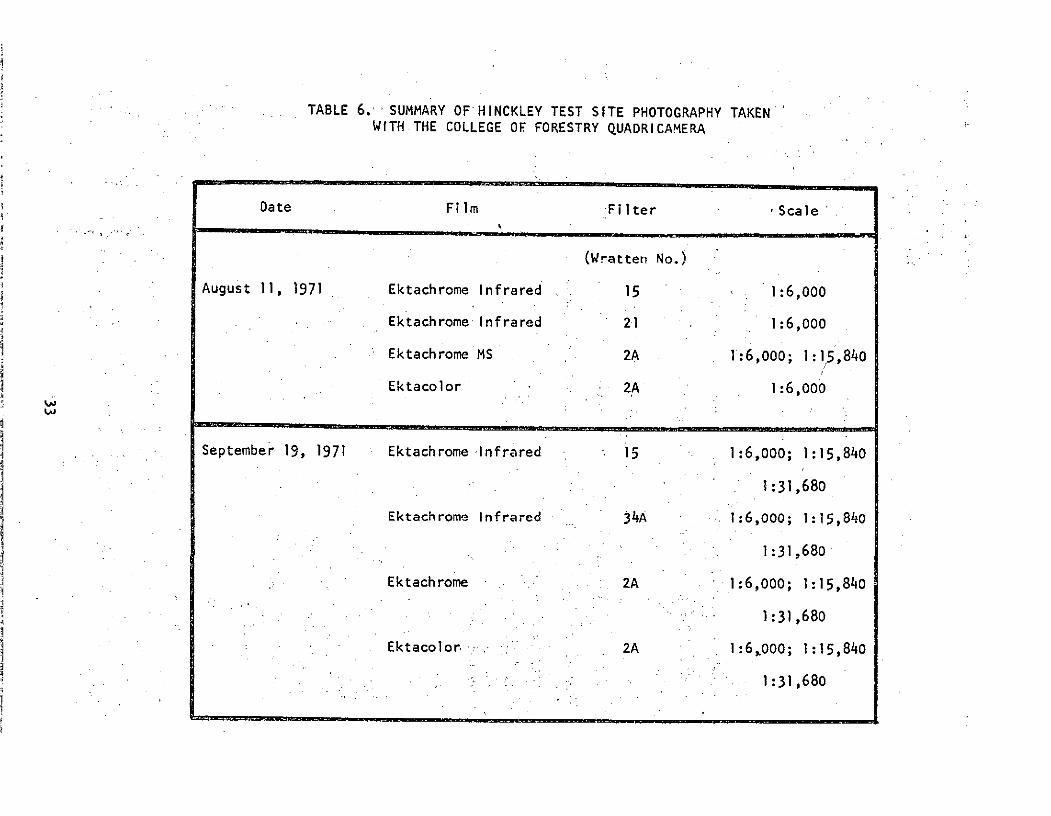
TABLE 6.' SUMMARY OF HINCKLEY TEST SITE PHOTOGRAPHY TAKENWITH THE COLLEGE OF FORESTRY QUADRICAMERA
Date Film Filter Scale
' (Wratten No.)
August II, 1971 Ektachrome Infrared 15 1:6,000
Ektachrome Infrared 21 1:6,000
Ektachrome MS 2A 1:6,000; 1:15,840
Ektacolor 2A 1:6, 000
September 19, 1971 Ektachrome Infrared 15 1:6,000; 1:15,840
1:31,680
Ektachrome Infrared 34A 1:6,000; 1:15,840
1:31,680
Ektachrome 2A 1:6,000; 1:15,840
- 1:31,680
Ektacolor 2A 1:6,000; 1:15,840
.1:31,680
test site. It was decided that Ektachrome infrared and Ektachrome MS
films would be the best to use for detecting the trees killed by the
hypoxylon canker. Two cameras were loaded with Ektachrome infrared film.
A Wratten 15 filter was used to produce the standard "false-color' ren-
dition, while a Wratten 21 or Wratten 34A filter was used on the second
camera to produce false-color pictures of deeper orange and reds. Cam-
era number three contained the standard Ektachrome MS film with a 2A
filter to produce a normal color scene. In anticipation of needing
prints, the fourth camera was loaded with Ektacolor film.
Armillaria Root Rot Detection
The Willow River test site is located in Pine County, Minnesota. It
consists of one flight line across a red pine plantation known to be
infected with the Armi!lar.ia root rot. A commerciel flight was made over
the test site on July 8, 1971, with the quadricamera unit and 50 mm
lenses. On August 28, 1971, a follow-tp overflight was made. The imagery
obtained for this test site is listed in Table 7.
Sample row portions were selected along the line of flight. The
trees within these samples examined were classified by the following sys-
tem:
Healthy
Trees which died in 1968
Trees which died in 1969
Trees which died in 1970
Trees currently dying
34
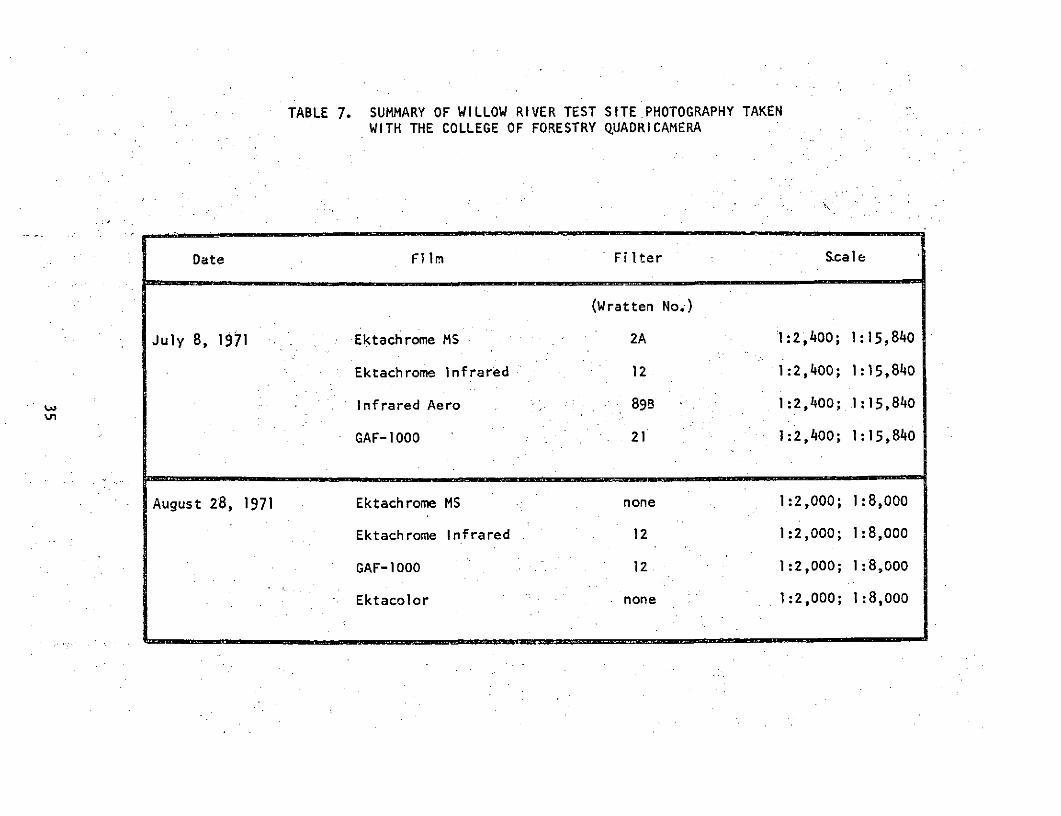
TABLE 7. SUMMARY OF WILLOW RIVER TEST SITE PHOTOGRAPHY TAKENWITH THE COLLEGE OF FORESTRY QUADRICAMERA
Date Film Filter S cale
(Wratten No.)
July 8, 1971 Ektachrome MS 2A 11:2,400; 1:15,840
Ektachrome Infrared 12 1:2,400; 1:15,840
Infrared Aero 89B 1:2,400; 1:15,840
GAF-1000 21 1:2,400; 1:15,840
August 28, 1971 Ektachrome MS none 1:2,000; 1:8,000
Ektachrome Infrared 12 1:2,000; 1:8,000
GAF-100 .- 12 1:2,000; 1:8,000
Ektacolor none . 1:2,000; 1:8,000
Forest Vegetation Classification
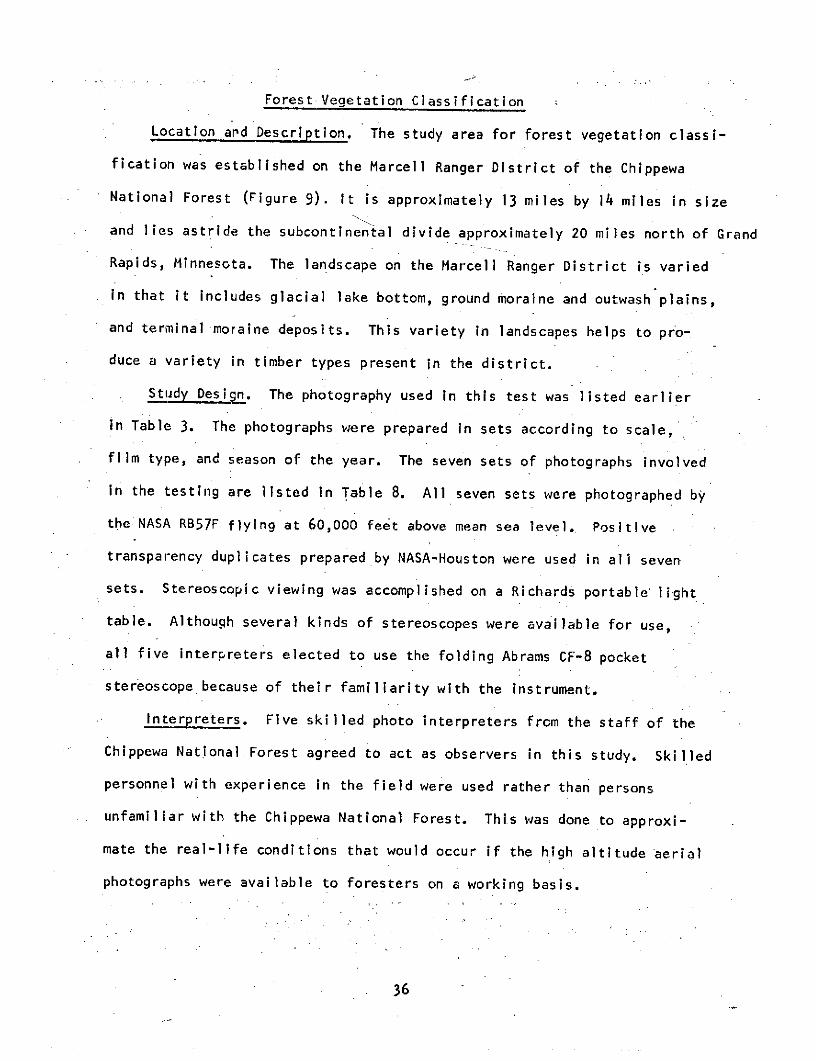
Location ard Description. The study area for forest vegetation classi-
fication was established on the Marcell Ranger District of the Chippewa
National Forest (Figure 9). It is approximately 13 miles by 14 miles in size
and lies astride the subcontinental divide approximately 20 miles north of Grand
Rapids, Minnesota. The landscape on the Marcell Ranger District is varied
in that it includes glacial lake bottom, ground moraine and outwash plains,
and terminal moraine deposits. This variety in landscapes helps to pro-
duce a variety in timber types present in the district.
Study Design. The photography used in this test was listed earlier
in Table 3. The photographs were prepared in sets according to scale,
film type, and season of the year. The seven sets of photographs involved
in the testing are listed in Table 8. All seven sets were photographed by
the-NASA RB57F flying at 60,000 feet above mean sea level. Positive
transparency duplicates prepared by NASA-Houston were used in all seven
sets. Stereoscopic viewing was accomplished on a Richards portable light
table. Although several kinds of stereoscopes were available for use,
all five interpreters elected to use the folding Abrams CF-8 pocket
stereoscope because of their familiarity with the instrument.
Interpreters. Five skilled photo interpreters from the staff of the
Chippewa National.Forest agreed to act as observers in this study. Skilled
personnel with experience in the field were used rather than persons
unfamiliar with the Chippewa National Forest. This was done to approxi-
mate the real-life conditions that would occur if the high altitude aerial
photographs were available to foresters on a working basis.
36
Ifo
A4~
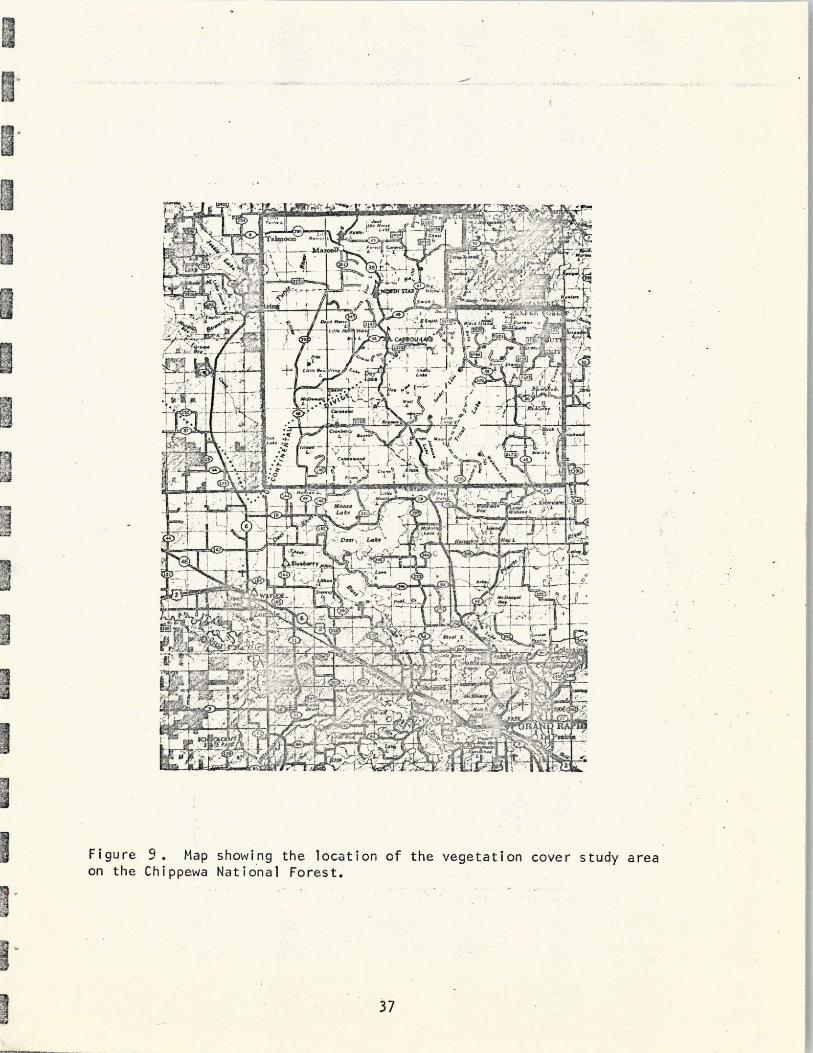
I
7
Figure 9. Map showi *ng the location of the vegetation cover study areaon the Chippewa National Forest.
37
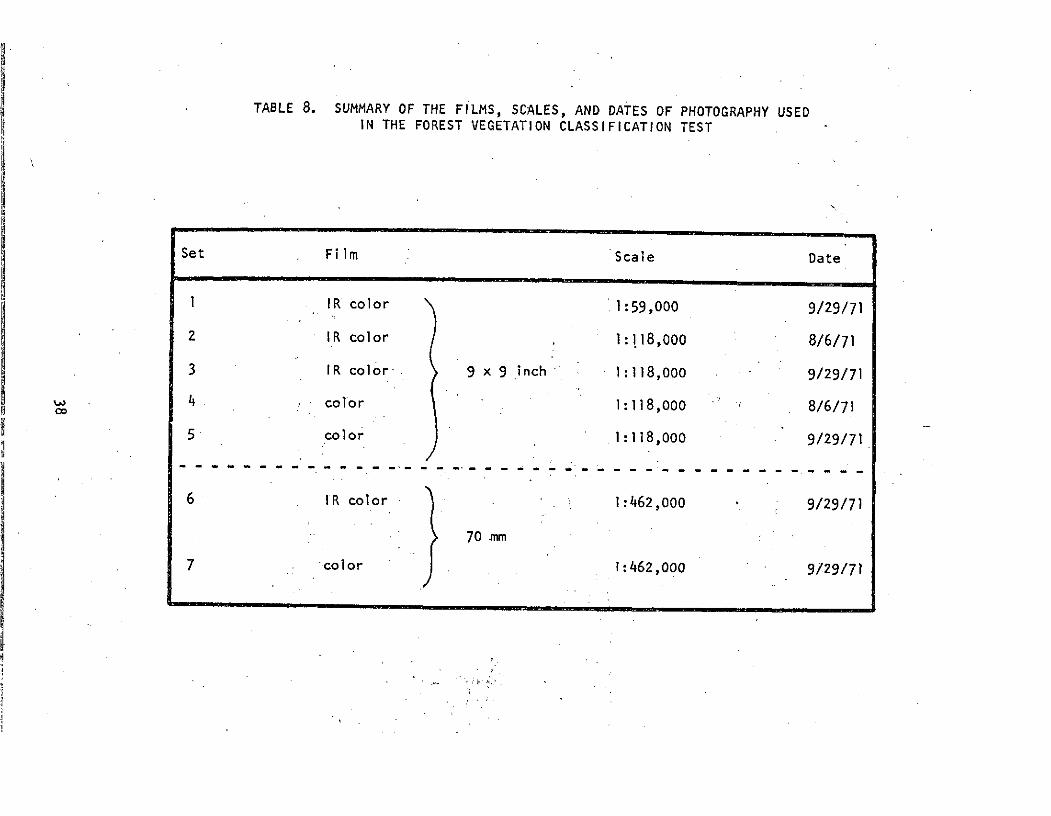
TABLE 8. SUMMARY OF THE FILMS, SCALES, AND DATES OF PHOTOGRAPHY USEDIN THE FOREST VEGETATION CLASSIFICATION TEST
Set Film Scale Date
1 IR color 1:59,000 9/29/71
2 IR color 1:118,000 8/6/71
3 IR color 9 x 9 inch 1:118,000 9/29/71
4 color 1:118,000 8/6/71
5 color 1:118,000 9/29/71
--------- ------------------ - ----- ------- - -- --- --- --------- -- -- ------- --
6 IR color 70 .mm 1:462,000 9/29/71
70 mm
7 color )1:462,000 9/29/71
Although the interpreters were selected to give a cross section of
photo-user personnel on. a forest, no effort was made to compare the pro-
ficiency of the various professions involved.
Each of the five interpreters had a different Job background:
Resource forester
Soils scientist
Timber management assistant
Engineering technician
Wildlife biologist
Interpretation. The interpreters were given the test one at a time.
After a briefing by the investigator, the interpreter was given a key to
the vegetation cover types as the types appeared on the various sets of
photographs in the test. Five plots that appeared on a training stereo-
pair for each set were marked for study and reference by the interpreters.
These five plots were the same on each set and occurred just east of the
designated study area. Although only four types were Involved in the
study, five were marked on the training pair. This was done because jack
pine (Pinus banksiana, Lamb) and red pine were discernible to the trained
interpreter even though all pines were lumped generically in the test.
This step was taken to allay confusion over what was actually pine on the
photograph interpretation.
The five plots marked on each training stereo-pair were:
1. Aspen
2. Spruce-fir
3. Red pine
4. Jack pine
39
5. Northern hardwoods
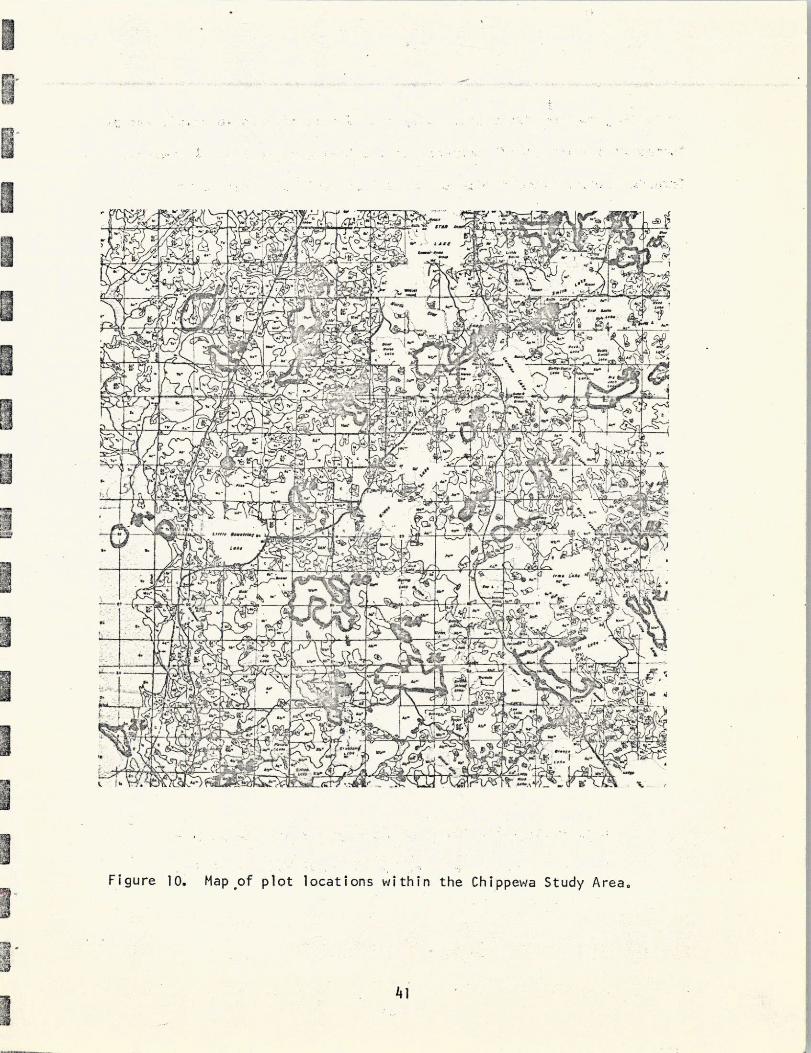
Plot Selection. Plots for interpretation were selected randomly for
each cover type to eliminate bias of the program designer. This was accom-
plished by gridd:ng a vegetation cover type map (Figure 10) of the Marcel Ranger
District and numbering the grid intersections.- The grid numbers werethen
selected by using a table of random numbers (23). All of the plot selec-
tion was completed on the vegetation cover map.supplied by the Chippewa
National Forest without consulting the aerial photographs. This procedure-
was followed to prevent bias from influencing the plot choice based upon
the investigator's ability to interpret .the plot.
In order to produce cells with equal numbers, two plots of each type
were chosen randomly for each set of photographs. Since there were four
cover types, eight plots were selected for each of the seven sets. This
made a total of 56 plots that each observer was to interpret.
Administration. Eight numbered plots were marked on each set of
photographs with india ink. An answer form with the corresponding num-
bers was given to the interpreter with each set of photographs. The sets
were given out one at a time and collected with the answer sheets as the
interpreter completed the questionnaire form. No time limits were placed
upon the interpreters other than those existing relative to their con-
tributing time away from other duties.
Analysis of Study Results. Analysis of the results was made by using
factorial designs to test for significant differences related to scale,
film type, timber type, and observer. Dr. Peter Dress, Associate Professor
of Forestry of the Pennsylvania State University, acted as a consultant
40
C_
r T~~V\\~'SI ~Jle~~ '" L s- r\~v* z~4~aa~X;i~BhifT ~ora~irfq~ ~ ~LL TY
cr~v i rrr~ iurlu c ~I L) ~ ;il - tr, rrrr rr-; r-l~n - ~wX,UE '" (i~:LL- U~ Y 1V C
r 1" I ,.- P ;t r- ,7~1ev *C c i w
- ~ e2ir~a, te - = ~g~ gY O 4, , '1 -J o(X1~ "' ~v
*- 1~~aj.r IIEI '. J-j'-,r- rri- ra j~lP~
rr ,.LV -%I i II Y(rt-c- ITTFI :-\T - 7-r~7~VT~Y K7~- ~\~ti~P ~Y *- Y 1- \\.\
IZr.-HkU~MrJ F-5~'6 tc '~
Y ~3f~, Z~J" ~'~+~IMPfLUC~I~P~;~~I~~ ''c ,~6i~-&Jd114;l.;h Irl_'bd!, vr':i ts)h UX~lj~s~h~~pl~ r-l \/ *- r I:d '~C~ r\S~IPC:M.r~
C -,,U"hi a--L'~I rarl ~C~lt~- &CLUI)-,/LIT~aFL-rl a Y r
ri r rrr Ir rrC;k Ac~k~v'C r-~"'~EXn~Y~~S~) W~
~ ~,I~ *c;7-JP7-~.~.~3-rzro~vl~i~YPr'l/~, ~ Cle I~a~lp ,,,L;n
L LIPUIY ~l~ur~*-&T. ~X-"dc/- Y~%P~B/iPfil~ F~llrr ~gi ~I 11
h' [_-r aAT"'iC r I 1"3
r cfirr vr"
r U,c , aic-, r- ~7 L*' Y 'CI
:a' Ir " ~\~nryurr ,rnr\ r *~ :.J
pr \r3u~N I~fV ~a~l~ ~ts iu~i'i~-.l~1SM ~h~r I*i urr21 b9,w _ UI~ LCL~ V
4. SBI (r.- u.I U.,- c * ~lk~i . a I
Figure 10, Map~of plot locations within the Chippewa Study Area,
111
1
in setting up the statistical analysis. The statistical analysis was per-
formed on the IBM 360/71 computer at the Pennsylvania State University
Computer Center using standard analysis of variance programming.
The responses of the interpreters were analyzed using multiple and
single classification analyses of variance to test the following null
hypotheses.
Hypothesis IA - There is no significant difference in
the scores of the interpreters by scale, type of film,
or vegetation cover type.
Hypothesis IB - There is no significant interaction
among the scales, film types, and vegetation cover
types and the interpreters' scores.
A 2 x 2 x 4 factorial was used in this test of significant differ-
ence. The main effects were scale (2 levels), film type (2 levels), and
vegetation cover types (4 levels).
II.
Hypothesis II A - There are no significant differences
among the scores by scale and vegetation cover type
on Infrared color film.
Hypothesis II B - There are no significant interactions
between the scale and vegetation cover types on infrared
color film.
42
A 3 x 4 factorial was used in this test of significant difference.
The main effects were photo scale (3 levels) and timber type (4 levels).
III..
,Hypoth'esis IllA - There is no significant difference
among the scores of the five interpreters.
A one-way classification of a fixed model was used to test the effect
of the treatment. Tukey's procedure for testing the significant differ-
ence was used to determine if the observers' scores were significantly
different from one. another.
The questionnaires were hand scored and the scores entered by scale,
film, and type for each set so that the scores could be used as units or
as cells in the ANOVA.
Publications of the University of California Forestry Remote Sensing
Laboratory indicate that many of the statistical designs used in analyzing
remote sensing experiments have been weak because the one-way analysis is
used in most instances (2). This study has attempted to avoid the problefT
of isolating only the two sources of variation associated with one design.
The factorial designs used were designed to isolate more sources of vari-
ation and to reduce the error term (23).
Post-burn Survey Analysis
The Big Falls test site is located in Koochiching County, west of
Big Falls, Minnesota. It is a clear-cut black spruce stand where the
slash had been distributed in the proper manner for prescribed burning.
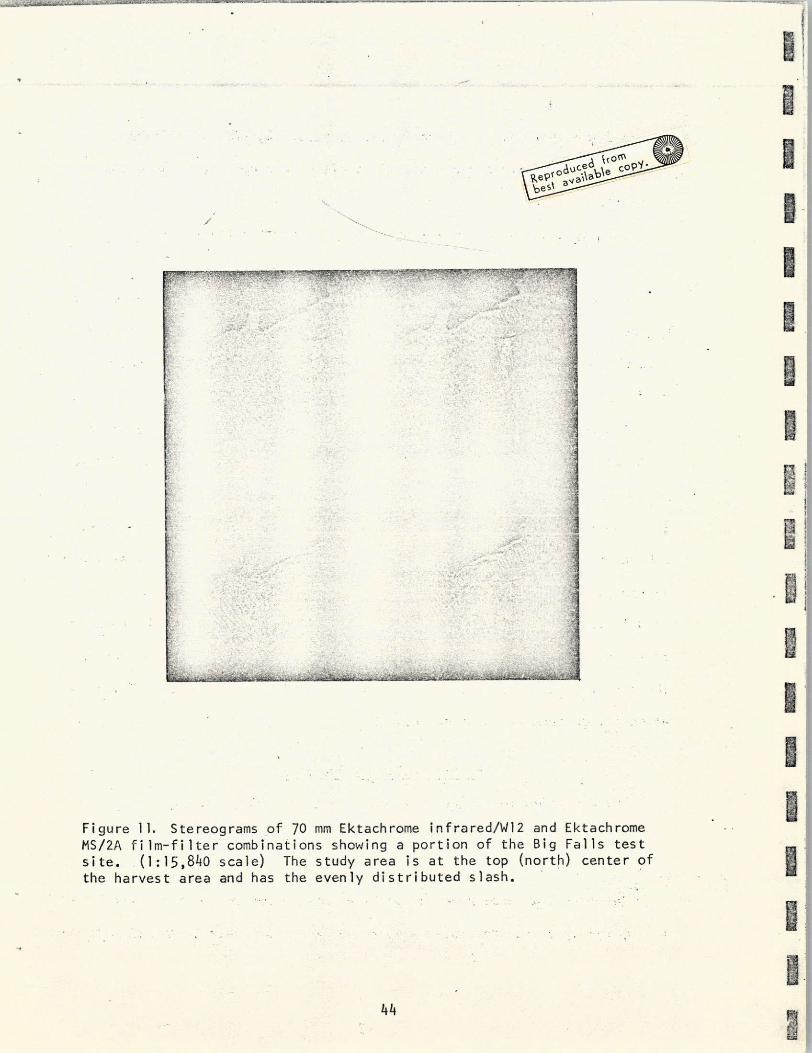
One overflight was made on August 3, 1971, prior to the prescribed bu
ure ll).The quadricamera system with 50 mm lenses was used to get simultant
43
estII°
I$
4"rnoPj
exposures using the following film-filter combinations:
Film Filter
Ektachrome MS 2A
Ektachrome Infrared 8443 12
Aero Infrared 89B
Ektacolor 2A
The mission was flown to achieve scales of 1:6,000 and 1:16,000 (see
Figure 11). Unfavorable weather delayed the burn until too late for the
post-burn mission in 1971..
The cut-over area was entered on the.ground for the purpose of ana-
lyzing and mapping the slash distributed on the area. Following the burn,
:the site was again examined and mapped In order to relate to the pattern
and the Intensity of the prescribed burn.
This substudyw!#! be completed at a later date when the post-burn
imagery is available.
INVESTIGATION RESULTS ..
Dwarf Mistletoe Detection
Cromwell Test Site
A definite spectral signature associated with dwarf mistletoe was not
evident. Non-visible physiological differences that might be induced by
dwarf mistletoe were not detected by any combination of films and filters,
and the foliage of partially infected trees gave no spectral indication
of stress that registered in the tramway photography.
The disease kills the tree over a period of several years; therefore,
portions of the crown on trees that appear healthy on the photographs
45
actually are dead. Trees with a great deal of dead foliage had a signa-
ture approximately the same as that of dead trees. Only dead trees gave
a consistently different spectral signature from non-infected trees.
Recombining of multispectral photography to produce a color-enhanced
image was performed at the University of California Remote Sensing Labor-
atory In Berkeley. Several combinations of colored filters were used in
the three projectors to give color to the projected image. The color
enhancement approximating the tri-emulsion Ektachrome infrared film pre-
sented the most favorable color-enhanced image for interpretation.
In no case did the optical combining display any situation that was
not detectable on the Ektachrome infrared film. Also the two-camera dis-
play was as good as the three-camera display. The use of photography
taken on panchromatic film 2402 with a Wratten 58 filter did not add
detail to the projected image.
The tower photography was difficult to use In the University of
California optical combiner. Orientation and registration of the multi-
spectral imagery was time-consuming. Highly accurate registration of the
recombined image was impossible,and the imperfectly registered photo-
graphs caused highlights on the projected image that were confusing to
the interpreter. Differential parallax, caused by camera placement in
the mount, Interfered with exact registration. In certain cases, because
of exposure bracketing and photograph selection procedures, the images
being superimposed were not simultaneous. The short period in time
. between exposures permitted some sun movement and disorientation by wind
sway.
46
Considerable light fall-off occurs toward the edges of Hasselblad
photography when the 50 mm lens is used. Rephotography of the combined
image done with the same system resulted in poor reproduction because of
the light fall-off problem.
Togo Test Site
Ground Data Collection. Infection centers of dwarf mistletoe, occur-
ring both as openings and as clusters of standing, but infected, black
spruce trees, were found in Section 33. Some single infected trees were
plotted in scattered locations. However, dwarf mistletoe is so slow in
killing a tree that infected trees may have large amounts of healthy
foliage. Isolated infected trees checked on the ground had invariably
been killed by some cause other than dwarf mistletoe. Many isolated dead
trees were identified as balsam fir (Abies balsamea, Mill). During the
several years dwarf mistletoe takes to kill the infected black spruce
tree, mistletoe seeds spread the disease to neighboring trees (7).
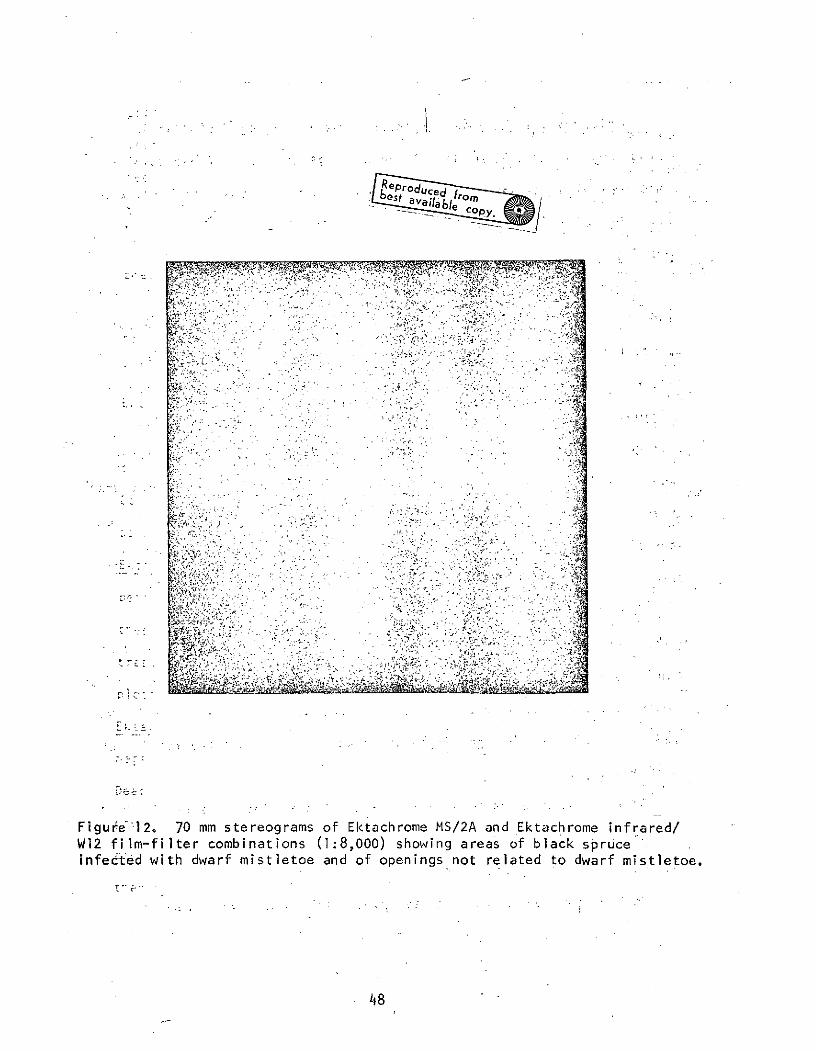
The photographs in Figure 12 show areas plotted during the field
work. Most of the ragged openings on the southwest edge were results of
dwarf mistletoe. Two of the most distinctive openings in the black spruce
canopy were not caused by dwarf mistletoe and could serve as comparative
areas. All of the other openings in the spruce stand are the results of
dwarf mistletoe.
On two infection centers, all of the infected trees are still stand-
ing (see plots 4 and 5 on Figure 12). Plots 4 and 5 are, respectively,
300 and 1500 square feet in area.
Both of the openings not caused by dwarf mistletoe are covered by
47
Reprodu frombest ava c Co
. . ;~ ~:~ l~ ,. • : - . . -.'--'
P.4
*c r
.r
W, ..
Fi gute- 12. 70 mm stereograns of Ektachrome MS/2A and Ektachrome infrared!W12 f-ilm-filter combinations (1:8,000) showing areas of black spruceinfecte-d with dwarf mistletoe and of openings not related to dwarf mistletoe.
48
D- z "" -" 2 '*. , . : ".. - - , "
"
" .-. I, "'- .... .< ; . .. - ".: ,- \ .",-:::":
.;L. . -. • - . J, ':- ,E.l . -"; ,-, ' ,.~ ~ ~ ~ ~ ~ ~ ~ ~~ ~~- %', " -""" . .::'--, '3, 7 t",..
r-r : :....."" - " ->i :-','~ " "" .. ' . -. - , . . _:
} -i " : - -- ' -:" " ..
5 :.... . . . . . . .
.... ~~~~~~ : ... •..:,
'.~ ' ' , ""
r i. -. ,. ,-.-:- .": " .: - "- . .- ., :: - , = . ,..
-iuk' 2 ,&:.:.. -m .tro rm :_ Ekahrm .S2 .... Ek..-om . ,: .. . ......W.L
: fim-ile "obnain - ".
:!'"0 "hwn "ra •, -lc -'•'
infedt':d;""'" dw r "iteo ' n of "pnig no "eae "o ""ar "" !2 ""-! iie
',:, " 9, . " L:' '*
" . -',8 t . : " ::'"- - . ' '
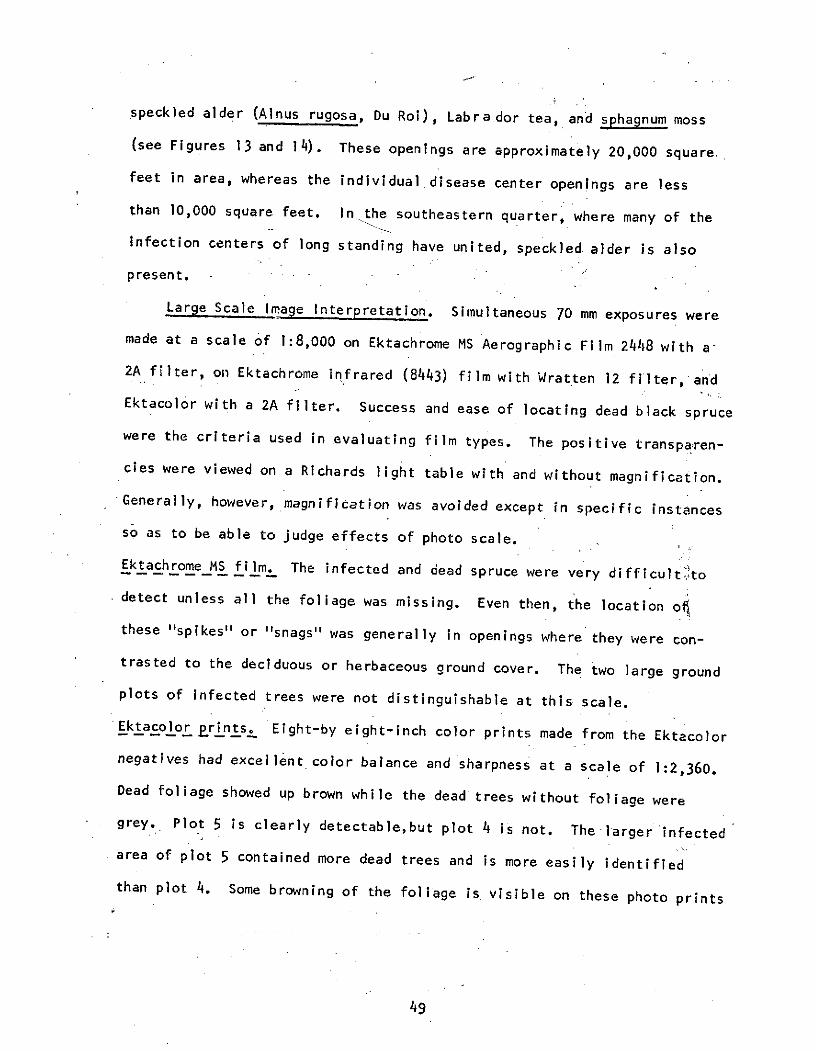
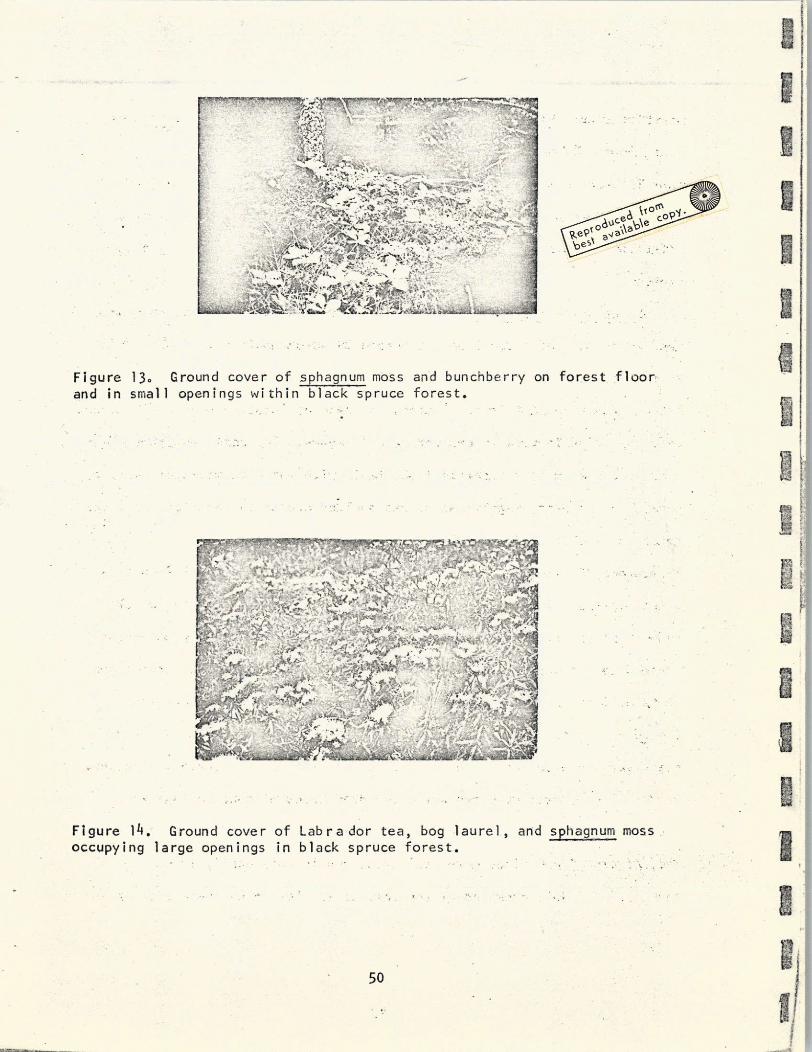
speckled alder (Alnus rugosa, Du Roi), Labrador tea, and sphagnum moss
(see Figures 13 and 14). These openings are approximately 20,000 square,.
feet in area, whereas the individual disease center openings are less
than 10,000 square feet. In the southeastern quarter, where many of the
infection centers of long standing have united, speckled alder is also
present.
Large Scale Image Interpretation. Simultaneous 70 mm exposures were
made at a scale of 1:8,000 on Ektachrome MS Aerographic Film 2448 with a-
2A filter, on Ektachrome infrared (8443) film with Wratten 12 filter, and
Ektacolor with a 2A filter. Success and ease of locating dead black spruce
were the criteria used in evaluating film types. The positive transpa-ren-
cies were viewed on a Richards light table with and without magnification.
Generally, however, magnification was avoided except in specific instances
so as to be able to judge effects of photo scale.
Ektachrome MS film. The infected and dead spruce were very difficult.ito
detect unless all the foliage was missing. Even then, the location of,
these "spikes" or "snags" was generally in openings where they were con-
trasted to the deciduous or herbaceous ground cover. The two large ground
plots of infected trees were not distinguishable at this scale.
Ektacolor ri nts. Eight-by eight-inch color prints made from the Ektacolor
negatives had excellent color balance and sharpness at a scale of 1:2,360.
Dead foliage showed up brown while the dead trees without foliage were
grey.. Plot 5 is clearly detectable,but plot 4 is not. The larger infected
area of plot 5 contained more dead trees and is more easily identified
than plot 4. Some browning of the foliage is visible on these photo prints
49
IC
q~pW a3~i(\B*' -:"-
Figure 13. Ground cover of sphagnum moss and bunchberry on forest ffloorrIand in small openings within black spruce forest.
Figure 14. Ground cover of Labrador tea, bog laurel, and sphagnum mossoccupying large openings in black spruce forest.i
50/
+++ ... 7,+ J,+ + .+ + +r
i . °,;+.. ~
+'+ "~1: ct .i
1 . -. .. .1O #+,++ + +
oQ ;
Figure 14. Ground cover of Labrador tea, bog laurel, and sphagnum moss is
occupying large openings in black spruce forest.
at plot 4. No tonal differences are apparent between the dead spruce of
the non-infected and infected openings.
Apparent, heavily Infected spruce stands were easily located on these
prints, and ground checking verified the interpretation of dwarf mistletoe
areas. The two non-infected stands were the exceptions because they were
interpreted as being dwarf mistletoe centers.
Ektachrome infrared film. The dead spruce foliage exhibited the charac-
teristic blue tone generally associated with dead trees on false-color
film. Plot 5 is visible as clusters of blue crowns as are other infection
centers in the area with standing trees (Figure 12). The'clusters of blue
crowns are not apparent on plot 4 in spite of the ease of locating the
many single dead trees that show up readily on this film.
No tonal differences appear between the non-infected openings and :the
infection centers containing alder. The more common situation occurs
where many scattered trees in various stages of infection are present..
These areas have a ground cover lacking alder and appear pink rather than
red (Figure 12).
A scattered ring of dead (blue) spruce Is evident around the openings,
Indicating that those openings are enlarging. This ring is present on the
two non-infected openings as well as the infected ones.
Small-Scale Image Interpretation. Three flying heights were used to
obtain imagery with the 70 mm Hasselblad cameras. 1:31,680, 1:63,360,
and 1:100,000 scale photographic coverage was obtained during the summer
of 1971.
Plot 5 is detectable on the 1:31,680 photography and is detectable,
51
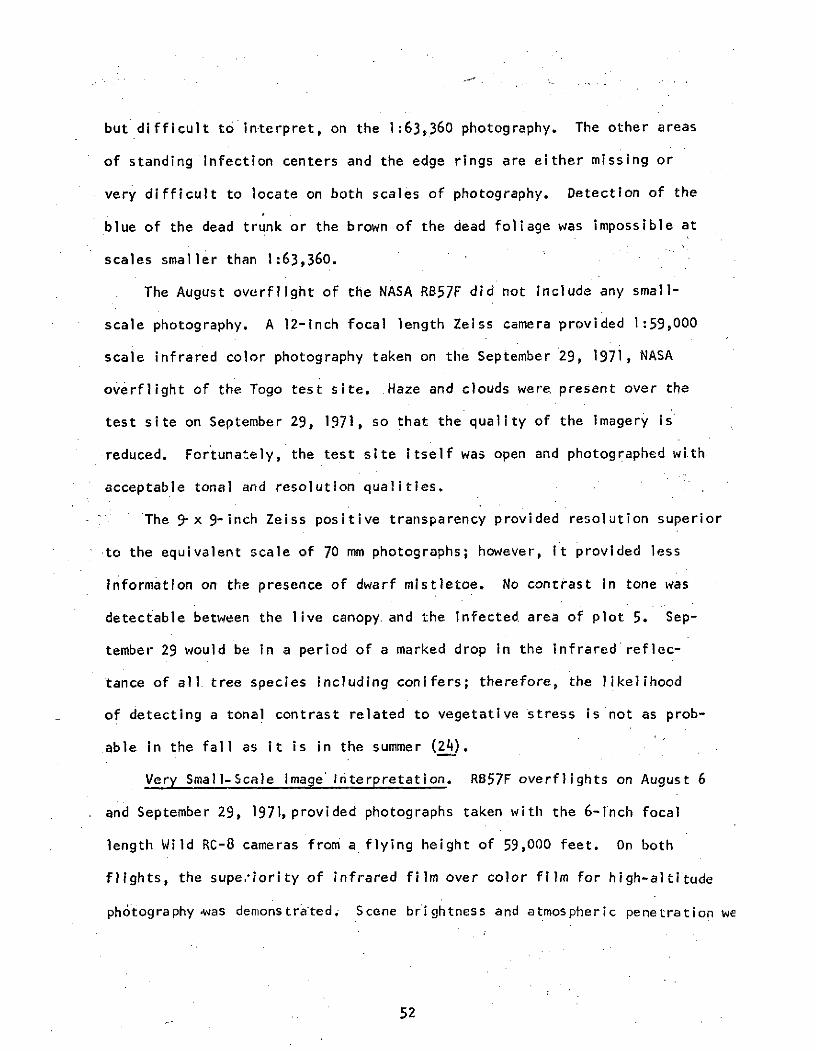
but difficult to interpret, on the 1:63,360 photography. The other areas
of standing Infection centers and the edge rings are either missing or
very difficult to locate on both scales of photography. Detection of the
blue of the dead trunk or the brown of the dead foliage was impossible at
scales smaller than 1:63,360.
The August overflight of the NASA RB57F did not include any small-
scale photography. A 12-inch focal length Zeiss camera provided 1:59,000
scale infrared color photography taken on the September 29, 1971, NASA
overflight of the Togo test site. Haze and clouds were. present over the
test site on September 29, 1971, so that the quality of the imagery is
reduced. Fortunately, the test site itself was open and photographed with
acceptable tonal and resolution qualities.
The 9-x 9-inch Zeiss positive transparency provided resolution superior
to the equivalent scale of 70 mm photographs; however, it provided less
Information on the presence of dwarf mistletoe. No contrast in tone was
detectable between the live canopy.and the Infected, area of plot 5. Sep-
tember 29 would be in a period of a marked drop in the infrared reflec-
tance of all tree species including conifers; therefore, the likelihood
of detecting a tonal contrast related to vegetative stress is not as prob-
able in the fall as it is in the summer (24).
Very Small-Scale Image Interpretation. RB57F overflights on August 6
and September 29, 1971, provided photographs taken with the 6-inch focal
length Wild RC-8 cameras from a flying height of 59,000 feet. On both
flights, the supeiority of infrared film over color film for high-altitude
ph6tography was demonstrated. Scene brightness and atmospheric penetration we
52
superior on the infrared color imagery; therefore, most interpretive work
was accomplished on this film.
No evidence of a spectral signature related to the dying or dead
spruce trees could be located visually on the 1:118,000 photography. Any
spectral reflectivity attributed to small numbers of infected trees was
integrated into the total reflectivity of the stand.
Openings of one-half chain radius (i.e., 33 feet) were detectable on
the infrared color film taken during both overflights. The summer photo-
graph presented a much brighter scene, because the infrared reflectivity
of the alder, sphagnum, and Labrador tea was at a high level. This made
the location of the one-half chain radius plot easier to detect on the
summer infrared photography than on the fall infrared photography. Magni-
fication was required to detect the small plots on color film.
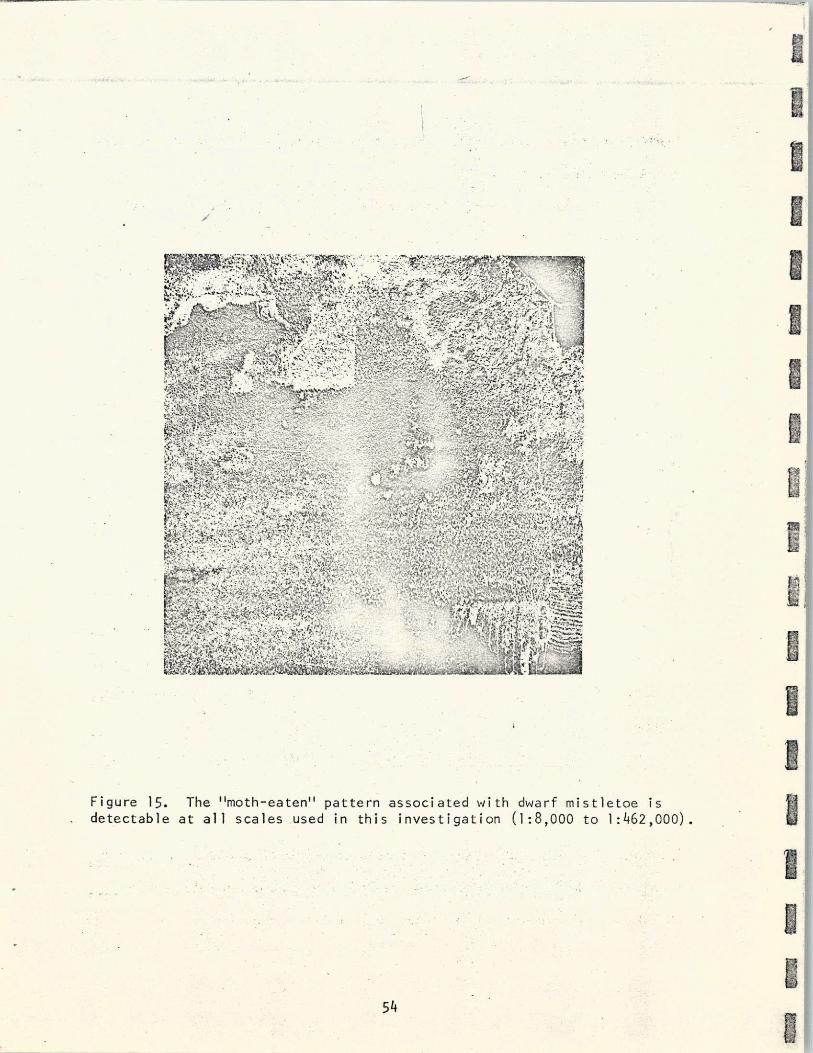
The visibility of the many small openings produces an irregular,
spotty pattern within the otherwise uniform tone and texture of the black
spruce stand. This pattern has a "moth-eaten" appearance when viewed on
very small-scale photography. Figure 15 shows an example of this pattern
resulting from openings mostly associated with the dwarf mistletoe infec-
tions.
Microscale Image Interpretation. Direct interpretation of the micro-
scale (1:462,000) photography indicated that the moth-eaten pattern of
extensive dwarf mistletoe infestations could be located under certain con-
ditions. The location of the infected area was difficult on the duplicates
supplied by NASA, so high-contrast copies were made of the three black-
and-white film types taken on August 6 (see Table 9).
53
iIi
-i 11I
Figure 15. The "moth-eaten" pattern associated with dwarf mistletoe is Idetectable at all scales used in this investigation (1:8,000 to 1:462,000).
54 -
- ?I
~~~ .-
.,L.
~~II
Figue 1. Te "otheate" ptten asocate w;~i dwarf mitlto idetetabl at ll salesusedin tis ivestgatin (:8~:,000 to1:6,00)
:;ii-~*1~'~ ~F=c ~ C ;I
~P;~i5F1~I
,1-- i
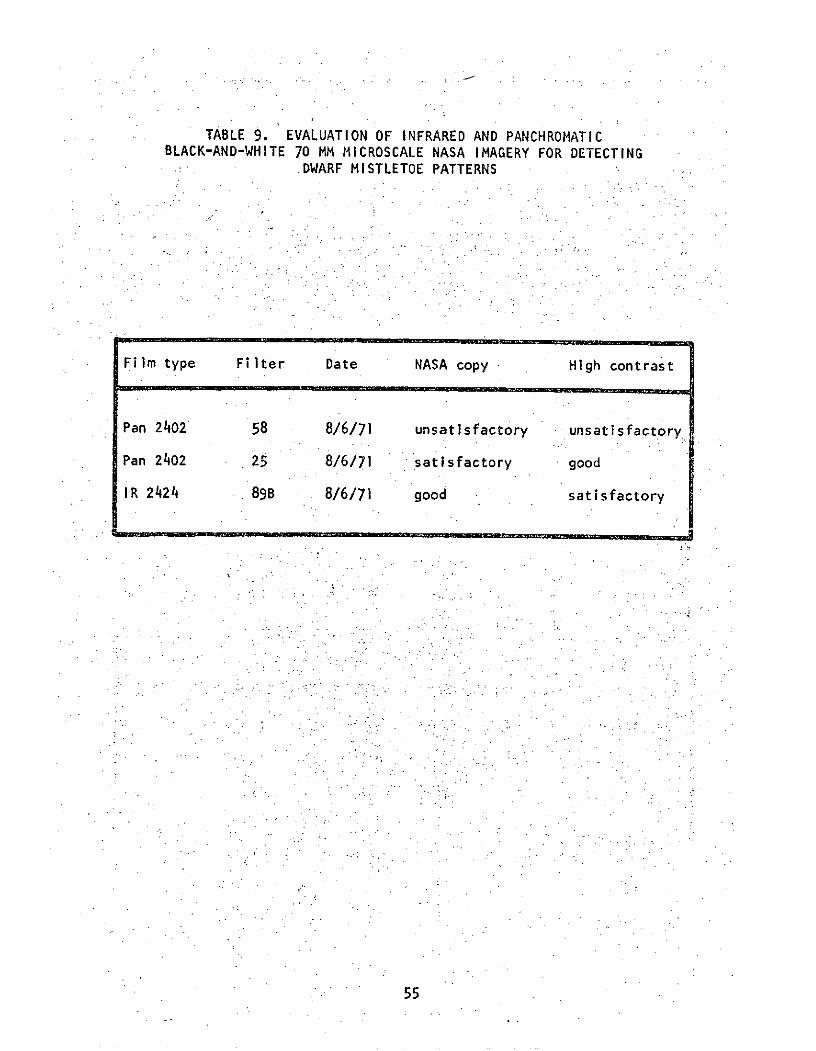
TABLE 9. EVALUATION OF INFRARED AND PANCHROMATICBLACK-AND-WHITE 70 MM MICROSCALE NASA IMAGERY FOR DETECTING
DWARF MISTLETOE PATTERNS
Film type Fi ter Date NASA copy Hi gh contrast
Pan 2402 58 8/6/71 unsatisfactory unsatisfactory
Pan 2402 25 8/6/71 satisfactory good
IR 2424 898 8/6/71 good. satisfactory
55
The panchromatic film type 2402 with a Wratten 58 filter did not show
the Infestation on either the NASA duplication or the high-contrast copy
without magnification; however, magnification (2.4X) revealed some of the
pattern. Panchromatic film type 2402 with a Wratten 25 filter showed the
dwarf mistletoe pattern clearly and without magnification on the high-con-
trast copy. Although the pattern was detectable on both copies of the
black-and-white infrared film (type 2424) with a Wratten 89B filter, it
was most satisfactory on the NASA copy and not on the high-contrast copy.
This resulted from too many density levels being exaggerated by the high-
contrast copy.
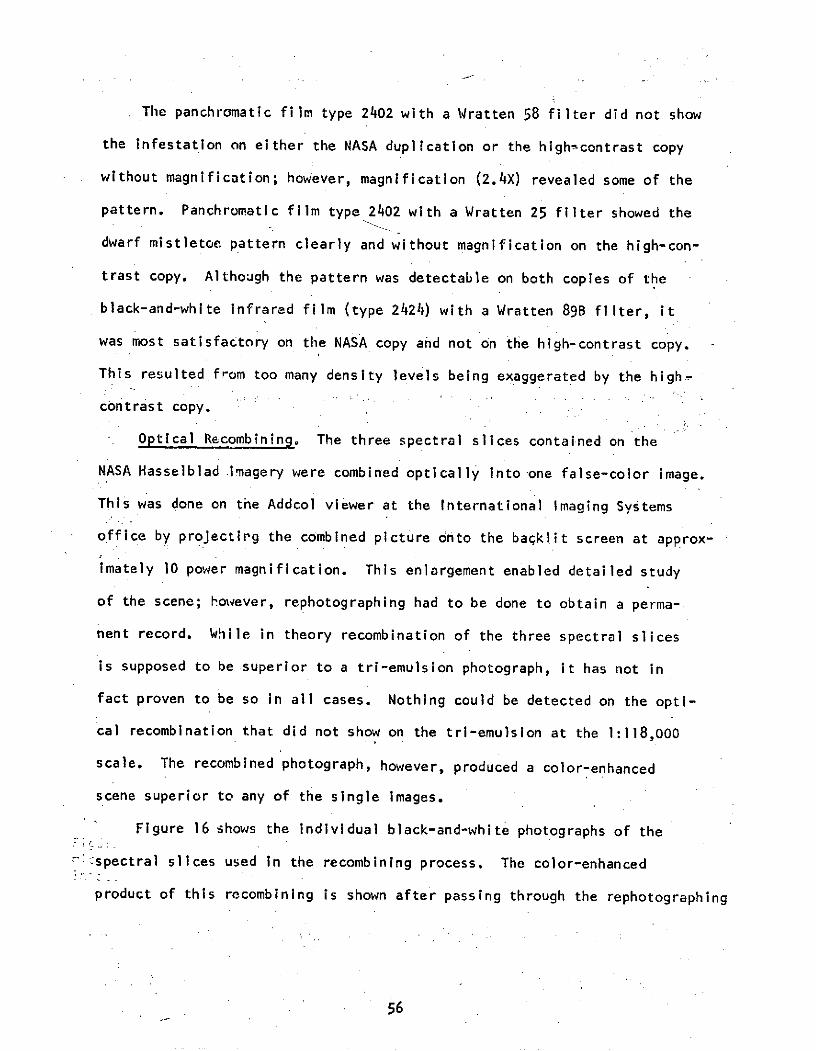
Optical Recombining. The three spectral slices contained on the
NASA Hasselblad imagery were combined optically into-one false-color image.
This was done on the Addcol viewer at the International Imaging Systems
office by projectirg the combined picture onto the backlit screen at approx-
Imately 10 power magnification. This enlargement enabled detailed study
of the scene; however, rephotographing had to be done to obtain a perma-
nent record. While in theory recombination of the three spectral slices
is supposed to be superior to a tri-emulsion photograph, it has not in
fact proven to be so in all cases. Nothing could be detected on the opti-
cal recombination that did not show on the tri-emulsion at the 1:118,000
scale. The recombined photograph, however, produced a color-enhanced
scene superior to any of the single images.
Figure 16 shows the individual black-and-white photographs of the
--spectral slices used in the recombining process. The color-enhanced
product of this recombining is shown after passing through the rephotographing
56
IPanchromatic/58 Irom
Reproduc be copYP. Vbest ava
-'b - .7%
Blue
Panch romat i c/25
Green
B & W Infrared/W89B
A.Red
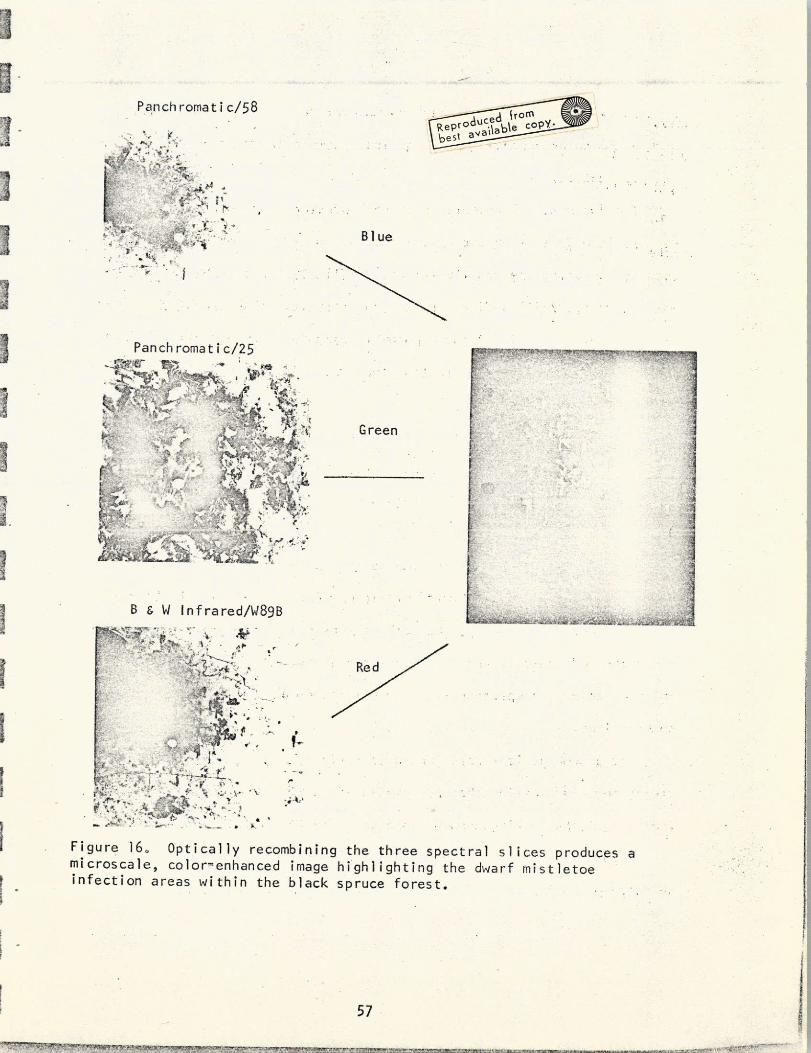
Figure 16. Optically recombining the three spectral slices produces amicroscale, color-enhanced image highlighting the dwarf mistletoeinfection areas within the black spruce forest.
57
process by a Yashica 35 mm camera on Kodachrome II film. Some detail
within the color-enhanced scene was lost in this extra step required for
its publication.
The "moth-eaten" appearance of the infected black spruce stand is
detectable with ease on the color-enhanced image. The optimum scene was
obtained by using the red (infrared 2424 film/89B) and green (panchro-
matic 2402 film/25A) projectors at high intensity. The use of the third
projector with the blue light component (panchromatic 2402 film/58) did
not appear to make any contribution that was helpful' in locating the
dwarf mistletoe infections.
Although no special effects could be brought out by changing intensi-
ties and filters on different projectors, the overall infection area could
'be high-lighted. The use of red and green projectors.provided the scene
needed to locate these areas.
Masking. Several masking combinations were used to locate density
. differences resulting from dwarf mistletoe infection within the black
spruce stand. Essentially, the combinations used in the masking employed
the high- and low-contrast positives, negatives, and films available. The
infrared color transparency itself was included in some of the masking
combinations.
Three combinations were chosen as having the greatest promise of pro-
viding more information than was available in the infrared color positive.
The best of the masking combinations used are listed in Table 10.
Figure 17 shows the Togo test site as it appears on each of the three
selected masks listed in Table 10. Mask number 1 creates a harsh black-
58
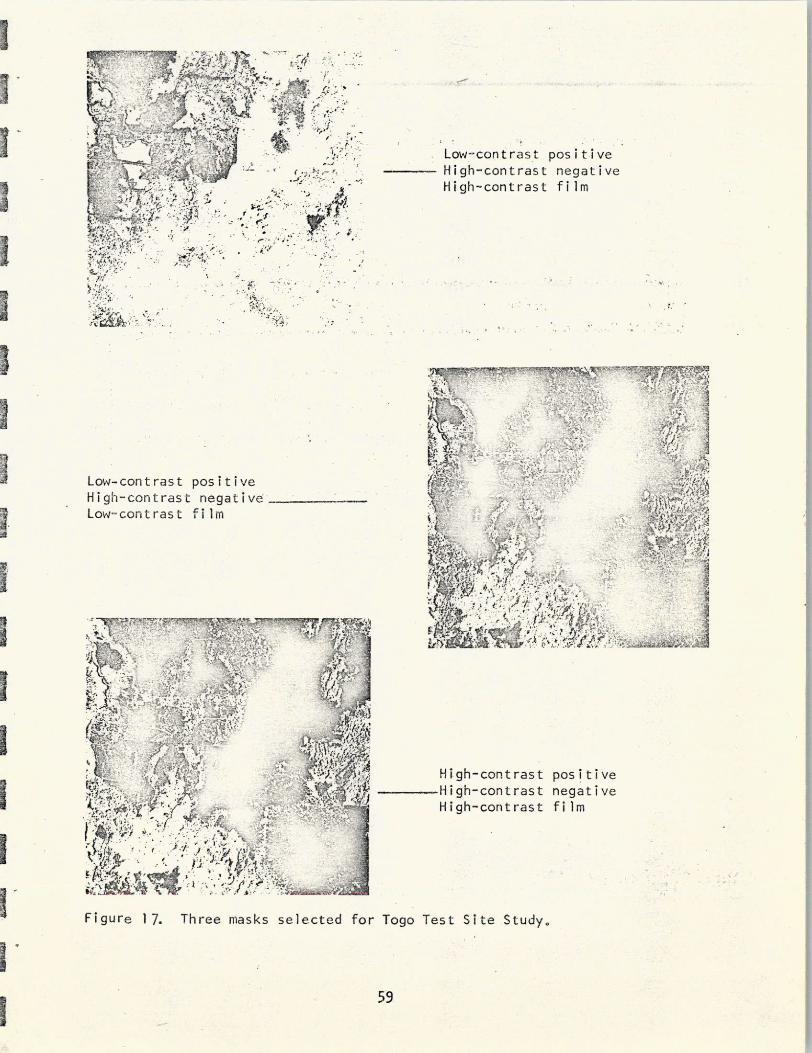
.~-4 I. - I:
I ... ___Low-contrast positiveHigh-contrast negative
I High-contrast film~~ ,
~~1~ - ..l~c. - - '~?P .:
IL
7
Low-contrast positive i
High-contrast negative 4Low-contrast film
I i
Ii___ High-contrast positiveIV High-contrast negative
I !lK High-contrast film
Id-Figure 17. Three masks selected for Togo Test Site Study.
5i59 : I
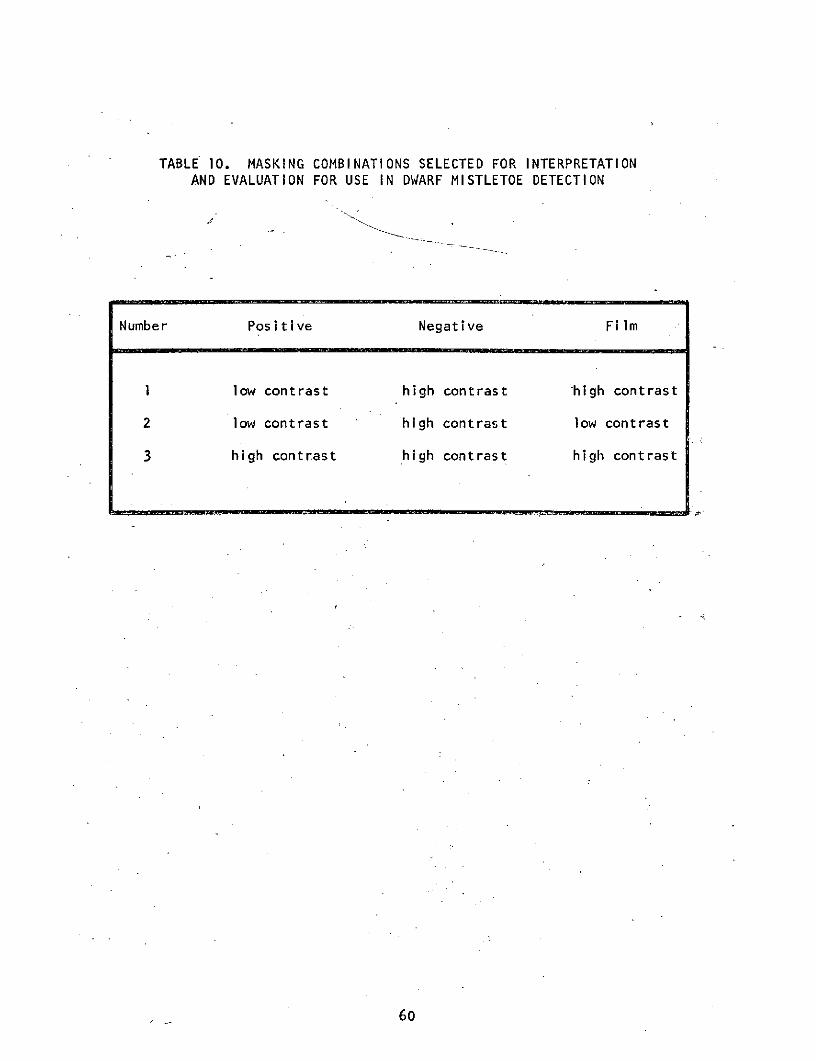
TABLE 10. MASKING COMBINATIONS SELECTED FOR INTERPRETATIONAND EVALUATION FOR USE IN DWARF MISTLETOE DETECTION
Number Positive Negative Film
1 low contrast high contrast high contrast
2 low contrast high contrast low contrast
3 high contrast high contrast high contrast
60
to-white contrast by eliminating most of the densities except for that
of the black spruce stand and some shadows. This brings out many small
spots of dwarf mistletoe infection and any other density not caused by
black spruce or shadows. All of the field-checked openings are visible,
including the one-half-chain radius plot, when the mask is viewed on the
light table. However, none of the infected plots of standing trees are
displayed. Openings in the black spruce can be detected on this mask
that are not visible on the color infrared positives. Mask number 1
rates a superior for opening detection and a good for location of those
openings in relation with their surroundings.
Mask number 2 (low-con'trast positive and film with high-contrast
negative) is more-interpretable in that it contains more density levels
than mask number 1. Because of the many density levels remaining on the
film, the black spruce stand is easily located. An "unsharp" masking
effect is present on mask number 2; however, It may be the result of
registration rather than the result of the masking combination. Mask,
number 2 rates a good for ease of opening detection and a superior for
opening locations.
Mask number 3 uses high-contrast positive, negative, and film.
This high-contrast combination reverses the effect created by the other
masks. It eliminates the density for the black spruce and causes the
openings to show up as dark tones. It does detect the openings in the
black spruce; however, the openings are difficult to separate from simi-
lar spots showing all over the photograph. Small spots appear whenever
the film density is similar to th'e density of the openings. This causes
61
the clear background to be cluttered with thousands of unrelated spots
with very little to use in orientation and location of the spots. Mask
number 3 rates a good for opening detection but a poor for location.
Of the three masks selected, number I would provide the greatest
information on infection centers that have caused openings. The com-
bination of the positive, the negative, and the film used in obtaining
mask number 2 is a good compromise. It provides most of the information
that was present in mask combination number 1, as well as being easier
to use for plot location. The difficulty in using mask number 3 for
plot location would reduce its value in a disease survey from a high
altitude.
Density Level-Slicing. The color-enhanced density separations
present an impressive appearance, but do not provide any more Information
than is available' on the infrared color transparency. This would:agree
with the findings at the Cromwell site, where no distinct spectral sig-
nature could be determined for infected black spruce trees.
Orientation problems exist in trying to locate disease-related den-
sities because of the loss of background detail. Using overlays for
ground detail causes registration and lighting problems that confound
detailed interpretation. Figure 18 shows the test area as it appears
when all 16 density slices are stacked together.
The Digicol electronic image enhancer (Figure 19) enabled the dif-
ferent densities to be highlighted and colored with ease. It detected
density differences in and around the black spruce stand that were not
visible on the photography. These density differences, however, were
unrelated to dwarf mistletoe. Density differences related to the disease
.62
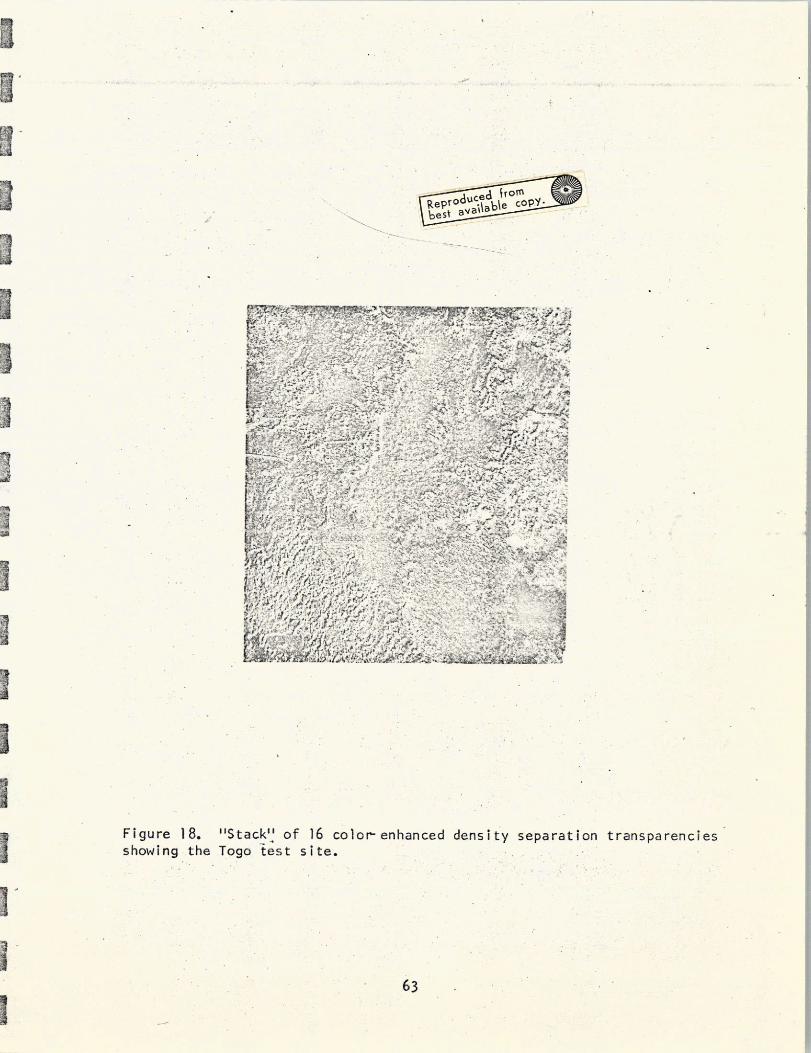
I.[
V poducd irOm
best 8vai~a~ o
-rA ~
1 - i"~;
II
I~ ~Fiur . Stck o 1 clor,-ehnd densit sepaaintasaeceI ~s i 3~~I~~1
showig th Togotestsite
I- ~I:~~ -i:~,~ ~,g- x 63
I~a
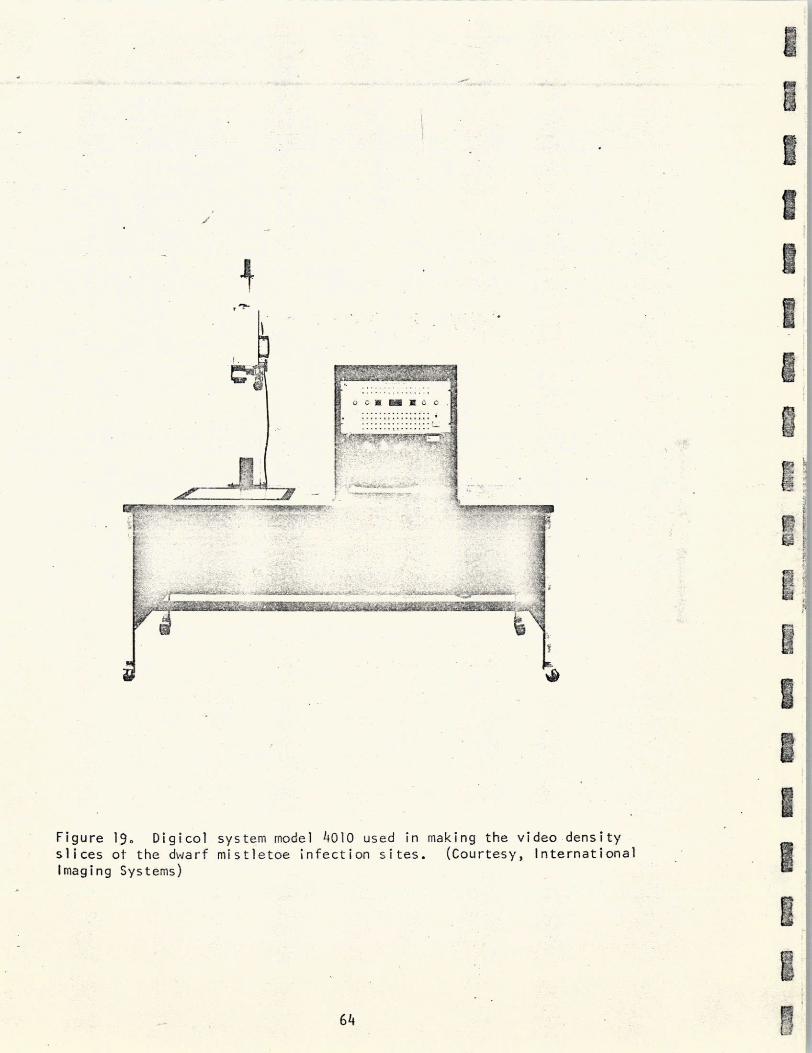
II
II
V. I* I
!
0 0 G CC
II
.1
Figure 19. Digicol system model 4010 used in making the video densityslices ot the dwarf mistletoe infection sites. (Courtesy, International 3Imaging Systems)
II
• 64
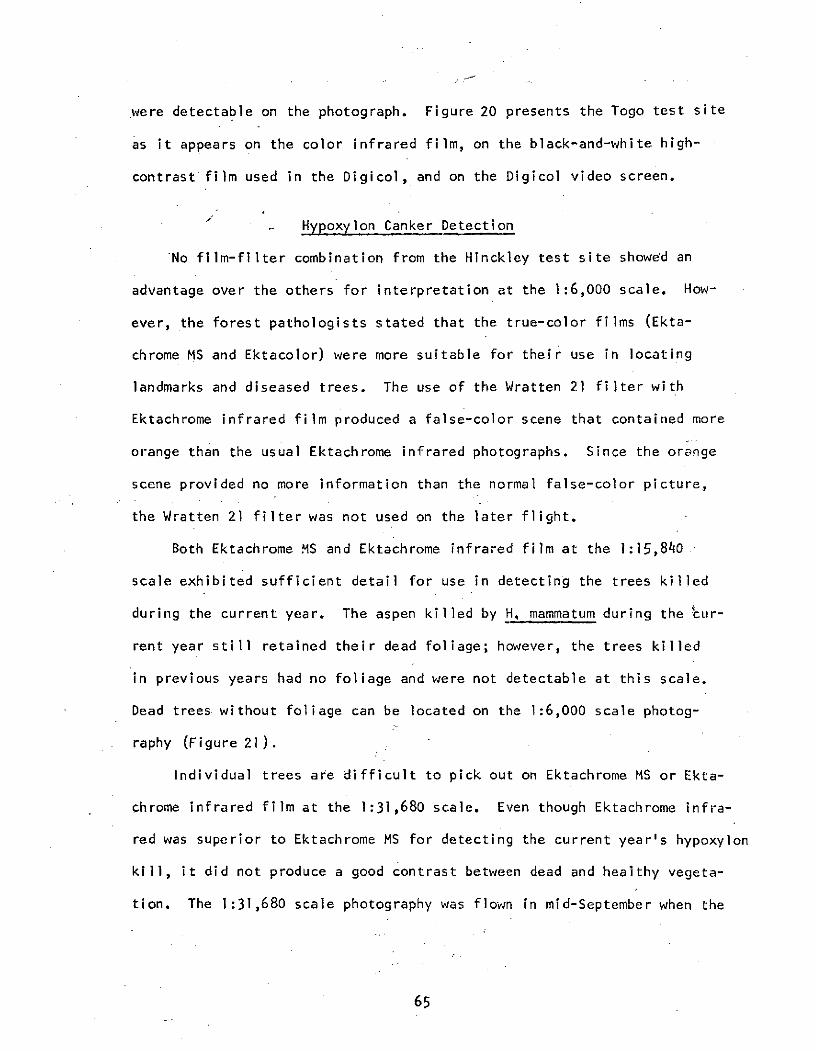
were detectable on the photograph. Figure 20 presents the Togo test site
as it appears on the color infrared film, on the black-and-white high-
contrast film used in the Digicol, and on the Digicol video screen.
Hypoxylon Canker Detection
No film-filter combination from the Hinckley test site showed an
advantage over the others for interpretation at the 1:6,000 scale. How-
ever, the forest pathologists stated that the true-color films (Ekta-
chrome MS and Ektacolor) were more suitable for their use in locating
landmarks and diseased trees. The use of the Wratten 21 filter with
Ektachrome infrared film produced a false-color scene that contained more
orange than the usual Ektachrome infrared photographs. Since the orange
scene provided no more information than the normal false-color picture,
the Wratten 21 filter was not used on the later flight.
Both Ektachrome MS and Ektachrome infrared film at the 1:15,840
scale exhibited sufficient detail for use in detecting the trees killed
during the current year. The aspen killed by H, mammatum during the 'cur-
rent year still retained their dead foliage; however, the trees killed
in previous years had no foliage and were not detectable at this scale.
Dead trees without foliage can be located on the 1:6,000 scale photog-
raphy (Figure 21).
Individual trees are difficult to pick out on Ektachrome MS or Ekta-
chrome infrared film at the 1:31,680 scale. Even though Ektachrome infra-
red was superior to Ektachrome MS for detecting the current year's hypoxylon
kill, it did not produce a good contrast between dead and healthy vegeta-
tion. The 1:31,680 scale photography was flown in mid-September when the
65
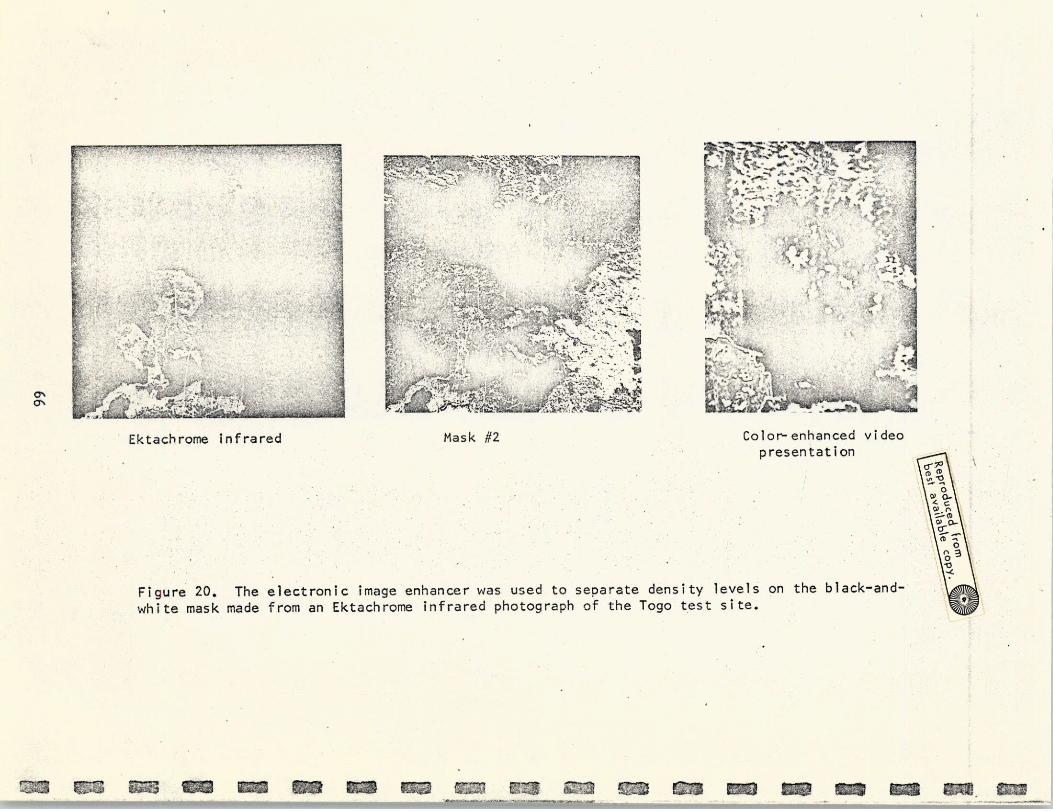
;c~n~bi 'Nil
ON Lila
Ektachrome infrared Mask #2 Color-enhanced video
presentation
0
* *C
.;s
0, 0
Figure 20. The electronic image enhancer was used to separate density levels on the black-and-
white mask made from an Ektachrome infrared photograph of the Togo test site.
pr ese ntai n a
~ku"~~j: Ok,7O
:::: n :r :~0:0I Q.
B~iV: e.'ces.d0
h'~~~~ --1 rY r;I 1 ~1'I sl i~p, -i
h ~i0
m -f
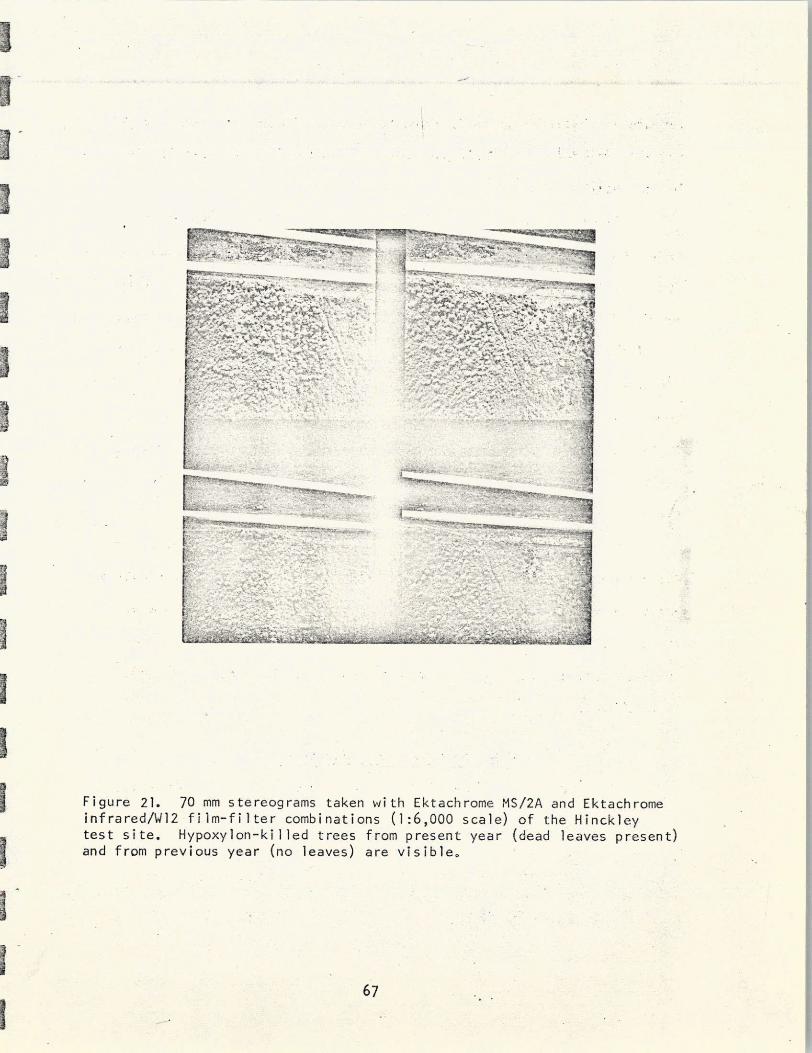
I
I.. .... --. .-*4 .... ... ... .." < L )
,- " T 1'S I-
Fium sa tae: l o
et iy -k
nd rm reiousye (olave) e isi e
S7-.. -
~-i~
I and; frmpeiu ya n evs)aevsbe I i
ph67
Ii _ '-
infrared reflectance on all vegetation had declined. Even the large -
scale infrared color photography taken in September exhibits this loss
in contrast.
In field checking, Dr. D. W. French found that every one of the
.hypoxylon-killed overstory trees had been detected by photo interpreta-
tion. Trees under 3 inches in diameter and infected living trees were
not evident on the photography, due to lack of size and foliage effects.
Those trees detected on the photographs as being dead or dying were
all aspen; however, they were not all victims of hypoxylon canker. Three
trees were victims of some combination of heart rot and overmaturity.
Of the 25 trees with hypoxylon canker, 17 were detected on the large-
scale photographs. The eight undetected, infected trees were under 3
inches in diameter (six trees) or still alive (two trees).
The 1:15,840 scale photography detected 18 of the 19 marked over-
story trees. Only a partially killed crown was missed. The mid-September
photography produces a darker brown tone to the dead foliage; however,
it shows a beginning of fall coloration change which, along with the
infrared reflectance dropoff, makes medium-scale photography difficult
to interpret.
Armillaria Root Rot Detection
During the ground check of the Willow River test site, 309 trees
were examined, located on the photographs, and classified as follows:
Class Number of Trees
1. Healthy 265
2. Died in 1968 5
68
Class Number of Trees
3. Died in 1969 11
4. Died in 1970 13
'5. Currently dying--.._ 15
On the July 8, 1971 photography (Figure 22), interpreters were able
to detect only those trees which had died in 1970, and with some slight
difficulty the trees which had died in 1969 (Table 11). These latter trees
had lost most of their foliage. Trees which died in early 1971 were
detected with considerable difficulty, and none of those trees which died
later in 1961 could be detected on either of the two film types (Ekta-
chrome MS and Ektachrome infrared).
Forest Vegetation Classification
Statistical Investigation
Null Hypothesis I (Film, Season, and Cover type). A three-way fac-
torial was designed to investigate the relationships and interactions of
film, season, and vegetation cover type. Color infrared and color RB57F
photography taken on August 8 and September 29, 1971, at a scale of
1:118,000 was used in this analysis.
The effect of film was significant at the 95 percent level, while
the effect of the season was significant at the 99 percent level. Vege-
tative cover type did not have a significant influence on the scores at
the 95 percent level. Based on the significance of the two effects,
Null Hypothesis IA must be rejected.
Interpreters scored 64 out of a possible 80 on the color infrared
film and 53 out of 80 on the color film. Fall photography was superior
69
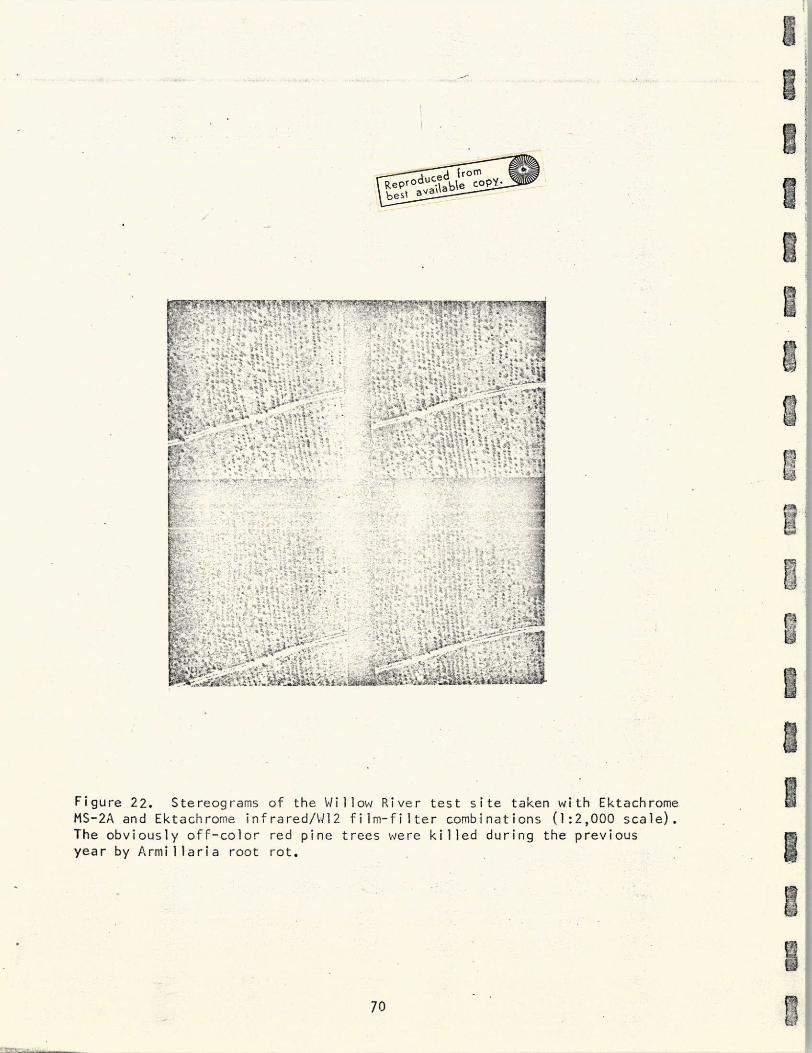
dfromOucb~ copY~~
best va~I
-;. "' ' ~
'-gn . , t, -
?=I$~4 -,~
:UFigre 2. Steeogam ofth WillowEia* Rive tes sietknwt Etcrm
tIS-2A ~I and Ekahrm inrrdW2fl-itrcmbntos(:,0 cl)Th oviusyof-clo edpie reswee ile urigth reuyear~' by Arilai rotrt
ii ~ 3:j .-~ a~" i10~I
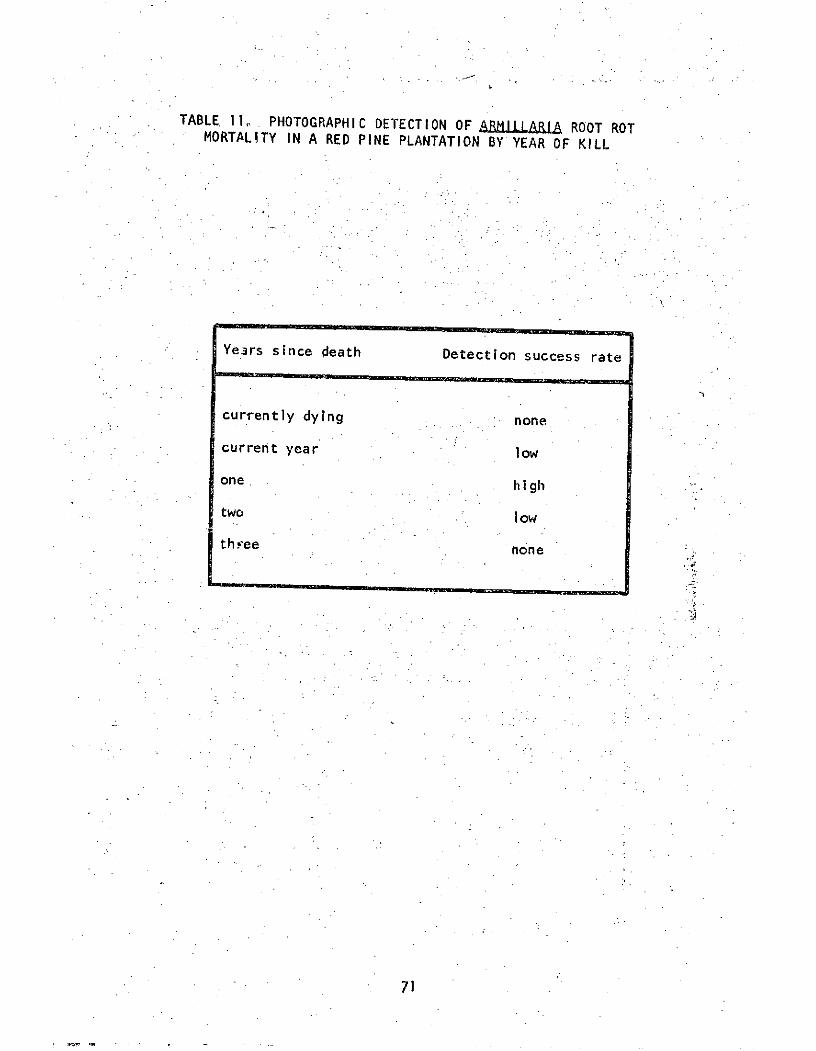
TABLE 11Io PHOTOGRAPHIC DETECTION OF ABMJLARIAl ROOT ROTMORTALITY IN A RED PINE PLANTATION BY YEAR OF KILL
Years since death Detection success rate
currently dying none
current year low
one high
two low
three none
71
to summer photography by a score of 66 to 51. No significant difference
In identification of vegetative cover type was shown in this experiment.
Interaction between the film type and the season proved to be highly
significant (99 percent level) while the other first-order interactions
were not significant. The second-order interaction of film, season, and
cover type was significant at the 95 percent level. Based on the signifi-
cance of the interactions, Null Hypothesis IB must be rejected (see
Table 12).
The summer-color film scored 19 out of a possible 40 while the other
three combinations each scored 32 (Infrared color film in both summer and
fall) or 34 (color film-fall). Season made no difference in the interpre-
tation of the infrared color film. This Is contrary to the comments of
the Interpreters who stated that they had difficulty with the summer.
infrared color.
Null Hypothesis II. A two-way factorial analysis was designed to
investigate the relationships and interactions of photograph scale and;
vegetation cover types. Color infrared photographs taken on September 29,
1971, at scales of 1:59,000, 1:118,000, and 1:462,000 were used in this
test.
The effect of photographic scale was significant at the 99 percent
level. Vegetation cover type did not have a significant effect at the
95 percent level. Null Hypothesis llA should be rejected because of the
significance shown in the Analysis of Variance summary in Table 13.
Since no significance can be attached to the effect of Interactions,
there is no basis for rejecting Null Hypothesis IIB .
72
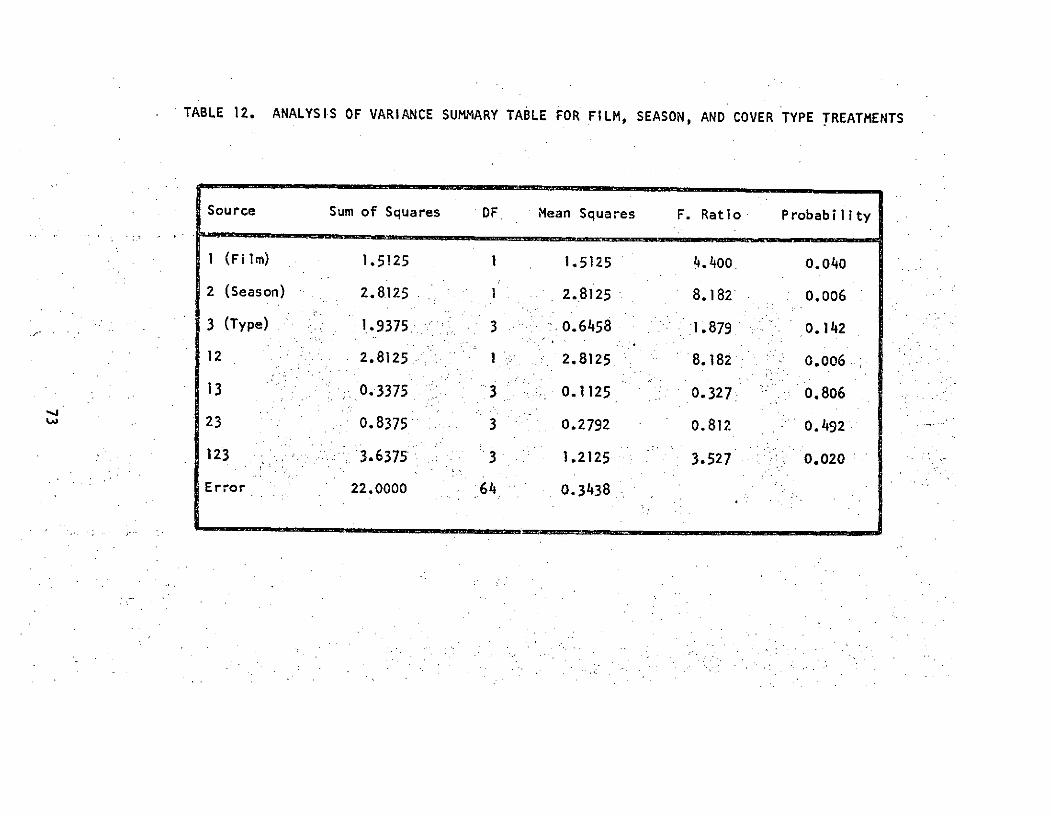
TABLE 12. ANALYSIS OF VARIANCE SUMMARY TABLE FOR FILM, SEASON, AND COVER TYPE TREATMENTS
Source Sum of Squares DF Mean Squares F. Ratio. Probability
1 (Film) 1.5125 1 1.5125 4.400 0.040
2 (Season) 2.8125 1 2.8125 8.182 0.006
3 (Type) 1.9375 3 0.6458 1.879 0.142
12 2.8125 1 2.8125 8.182 0.006
13 0.3375 3 0.1125 0.327 0.806
23 0.8375 3 0.2792 0.812 0.492
123 3.6375 3 1.2125 3.527 0.020
Error 22.0000 64 0.3438
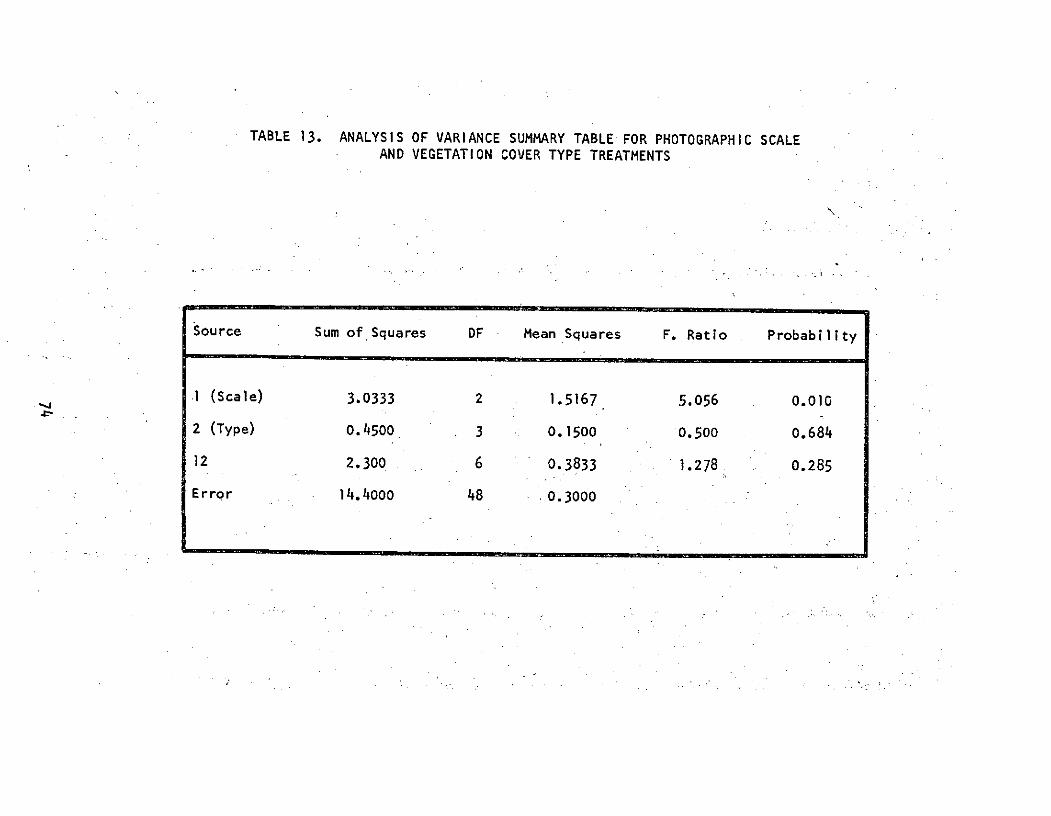
TABLE 13. ANALYSIS OF VARIANCE SUMMARY TABLE FOR PHOTOGRAPHIC SCALEAND VEGETATION COVER TYPE TREATMENTS
Source Sum of Squares DF Mean Squares F. Ratio Probability
.1 (Scale) 3.0333 2 1.5167 5.056 0.010
2 (Type) 0.4500 3 0.1500 0.500 0.684
12 2.300 6 0.3833 1.278 0.285
Error 14.4000 48 .0.3000
Scores of 38, 32, and 27 out of a possible 40 were made respectively
on 1:59,000, 1:118,000, and 1:462,000 scales of photography (see Table 13).
Hypothesis ill. A one-way classification was made to test for dif-
ferences among the Interpreters' scores. The analysis of variance analy-
sis produced an F-ratio that was not significant at the 95 percent level;
therefore, the Null Hypothesis IIIA is not disproven. This implies that
there are no significant differences among the interpreters' scores (see
Table 14).
No multiple-comparison procedure was performed on the data because
the F-ratio showed no significant difference in the-scores. Steel and
Torrie (23) recommend against making multiple-comparison tests when the
F-ratio is not significant.
General Observations. All of the interpreters agreed that the
pocket stereoscope was satisfactory for use with the NASA photography
even though sorme situations required that both photographs in the stereo
pair be rolled. Since transparencies are used on a light table, no over-
lap is possible in the area being viewed. The 9-inch x 9-inch format
photography will overlap when viewed through a pocket stereoscope; there-
fore, the overlapping portions must be rolled out of the viewing area.
This operation was q~uickly mastered by all of the interpreters.
The Interpreters commented that the fall photography with color
infrared film was superior to the other film-season combinations for vege-
tative and soils analysis. Each man stated that he could do better work
with less effort on that combination. Summer color photography was con-
sidered to be the least desirable combination. The interpreters were
75
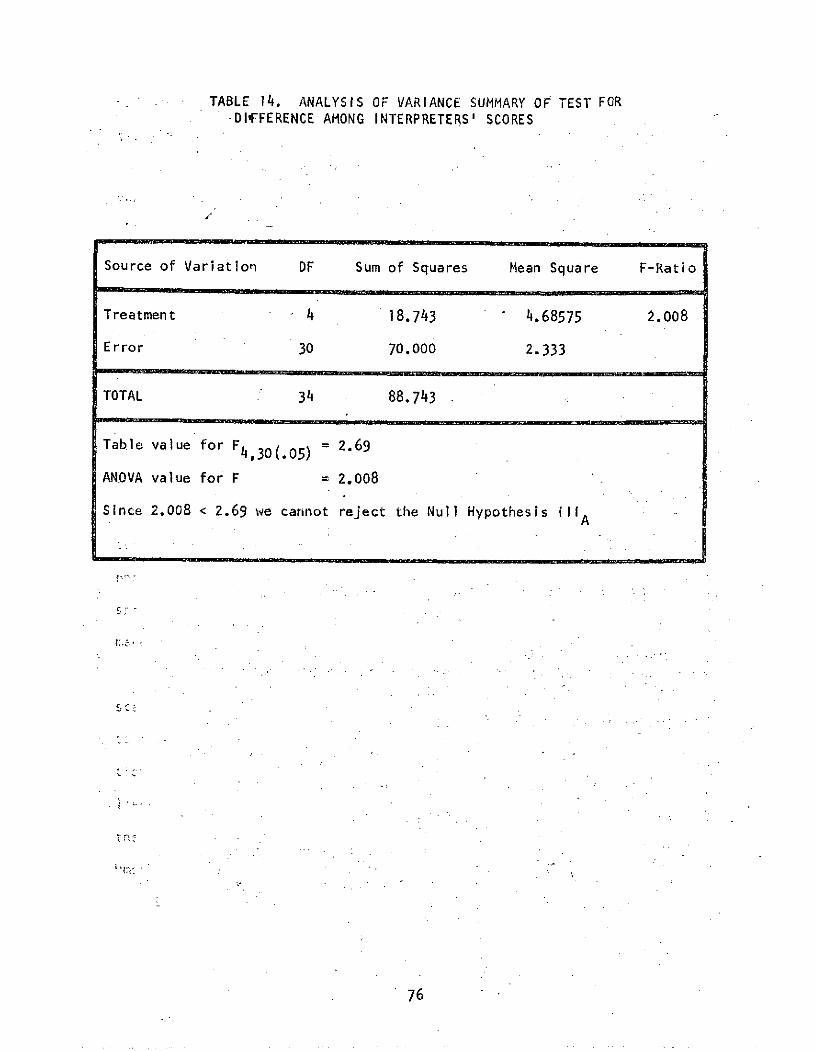
TABLE 14. ANALYSIS OF VARIANCE SUMMARY OF TEST FORDIFFERENCE AMONG INTERPRETERS' SCORES
Source of Variation DF Sum of Squares Mean Square F-Ratio
Treatment 4 18.743 4.68575 2.008
Error 30 70.000 2.333
TOTAL 34 88.743
Table value for F4, 30 (.05) = 2.69
ANOVA value for F = 2.008
Since 2.008 < 2.69 we cannot reject the Null Hypothesis IliA
76
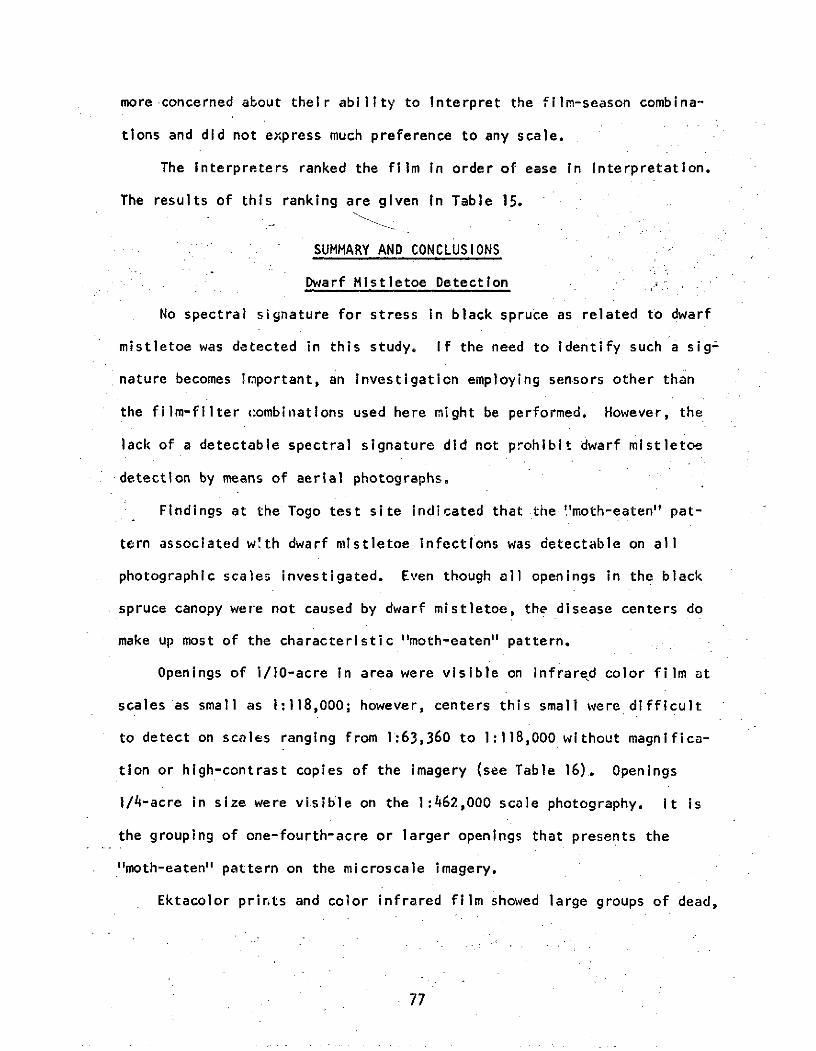
more concerned about their ability to interpret the film-season combina-
tions and did not express much preference to any scale.
The interpreters ranked the film in order of ease in interpretation.
The results of this ranking are given in Table 15.
SUMMARY AND CONCLUSIONS
Dwarf Mistletoe Detection
No spectral signature for stress in black spruce as related to dwarf
mistletoe was detected in this study. If the need to identify such a sig-
nature becomes important, an investigation employing sensors other than
the film-filter c:ombinations used here might be performed. However, the
lack of a detectable spectral signature did not prohibit dwarf mistletoe
detection by means of aerial photographs.
Findings at the Togo test site indicated that the "moth-eaten" pat-
tern associated w'th dwarf mistletoe infections was detectable on all
photographic scales investigated. Even though all openings in the black
spruce canopy were not caused by dwarf mistletoe, the disease centers do
make up most of the characteristic "moth-eaten" pattern.
Openings of i/10-acre in area were visible on infrared color film at
scales as small as 1:118,000; however, centers this small were difficult
to detect on scales ranging from 1:63,360 to 1:118,000 without magnifica-
tion or high-contrast copies of the imagery (see Table 16). Openings
1/4-acre in size were visib]e on the 1:462,000 scale photography. It is
the grouping of one-fourth-acre or larger openings that presents the
"moth-eaten" pattern on the microscale imagery.
Ektacolor prints and color infrared film showed large groups of dead,
77
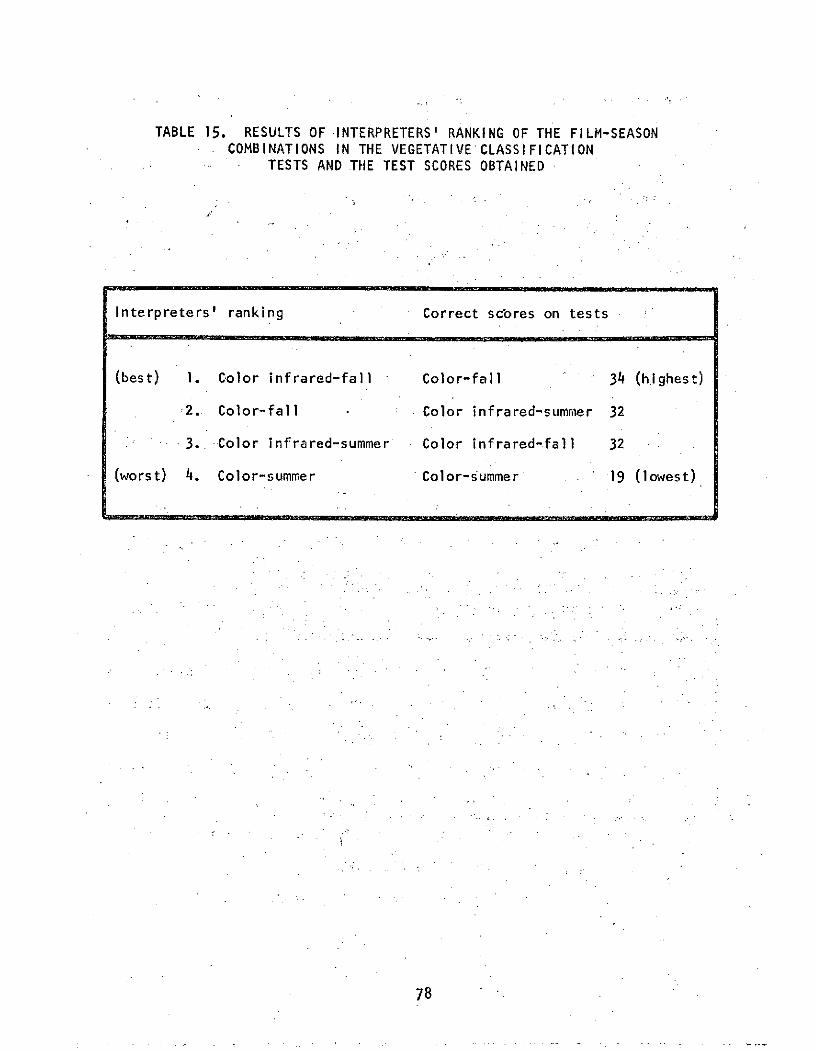
TABLE 15. RESULTS OF INTERPRETERS' RANKING OF THE FILM-SEASONCOMBINATIONS IN THE VEGETATIVE •CLASSIFICATION
TESTS AND THE TEST SCORES OBTAINED
Interpreters' ranking Correct sc'ores on tests
(best) 1. Color infrared-fall Color-fall 34 (highest)
2. Color-fall Color infrared-summer 32
3. Color infrared-summer Color infrared-fall 32
(worst) 4. Color-summer Color-summer 19 (lowest)
78
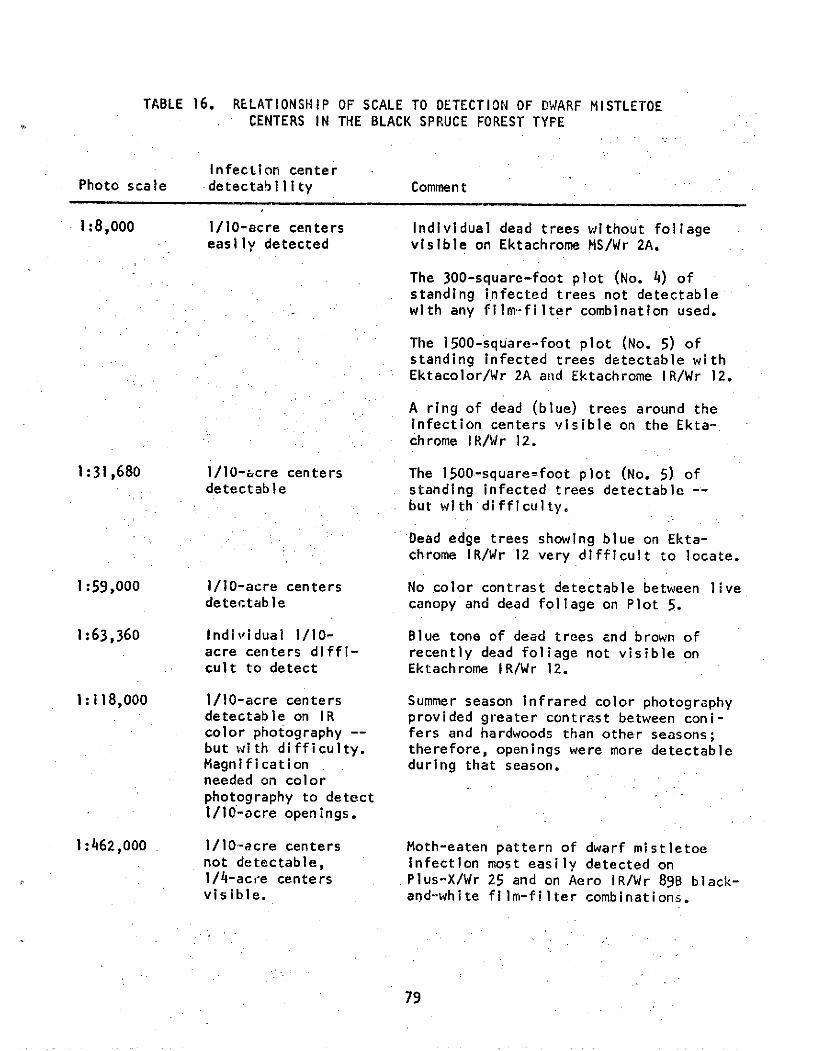
TABLE 16. RELATIONSHIP OF SCALE TO DETECTION OF DWARF MISTLETOECENTERS IN THE BLACK SPRUCE FOREST TYPE
Infection centerPhoto scale detectability Comment
1:8,000 1/10-acre centers Individual dead trees without foliageeasily detected visible on Ektachrome MS/Wr 2A.
The 300-square-foot plot (No. 4) ofstanding infected trees not detectablewith any film-filter combination used.
The 1500-square-foot plot (No. 5) ofstanding infected trees detectable withEktacolor/Wr 2A and Ektachrome IR/Wr 12.
A ring of dead (blue) trees around theinfection centers visible on the Ekta-chrome IR/Wr 12.
1:31,680 1/10-acre centers The 1500--square--foot plot (No. 5) ofdetectable standing infected trees detectable--
but with difficulty.
Dead edge trees showing blue on Ekta-chrome IR/Wr 12 very difficult to locate.
1:59,000 1/lO-acre centers No .color contrast detectable between livedetectable canopy and dead foliage on Plot 5.
1:63,360 Individual 1/10- Blue tone of dead trees and brown ofacre centers diffi- recently dead foliage not visible oncult to detect Ektachrome IR/Wr 12.
1:118,000 1/10-acre centers Summer season infrared color photographydetectable on IR provided greater contrast between coni-color photography -- fers and hardwoods than other seasons;but with difficulty. therefore, openings were more detectableMagnification . during that season.needed on colorphotography to detecti/l1-acre openings.
1:462,000 . /l10-acre centers Moth-eaten pattern of dwarf mistletoenot detectable, infection most easily detected on1/4-acre centers Plus-X/Wr 25 and on Aero IR/Wr 89B black-visible. and-white film-filter combinations.
79
but standing, trees; however, Ektachrome MS did not. All films investi-
gated did show the "moth-eaten" pattern for dwarf mistletoe infections.
Color contrasts between the live canopy and the dead foliage on the
1500-square-foot plot of infected standing trees were visible on the Ekta-
color and infrared color films at scales larger than 1:59,000. The blue
color assocl.ated with dead, defoliated trees on infrared color was present
at scales greater than 1:63,360.
Based on the findings of this study, a multistage sampling project
could be designed for use with very high-altitude photography. Very small-
scale or microscale photography (1:120,000 to 1:462,000 scale) taken on
color infrared film through a deep yellow filter could serve as the upper
stage. This scale of photography would give maximum area coverage with a
small number of photographs.- Ground checks could be used as the second
stage of the project.
Optical recombining can be used to create a color-enhanced scene
from black-and-white photographs. Specific points of interest can be
highlighted by varying the color combinations and light intensities; how-
ever, no hidden information was made available by the use of the optical
recombination. Everything that was visible on the color-enhanced scene
was also visible on the spectral slices and on the tri-emulsion films.
Although two masking combinations were given high ratings for detec-
tion or location of dwarf mistletoe patterns, none of the masks revealed
infection centers that were not present on the color infrared photograph
used in making the masks. The expense and interpretation difficulties of
masking as an image.-enhancement technique were not justified by any
80
information return.
Density-level slicing and color coding were not useful in the location
of dwarf mistletoe. The electronic Image enhancer did enable densities
to be highlighted. None of these newly highlighted densities aided in the
detection of dwarf mistletoe. In light of the success, although very lim-
ited, of the electronic image enhancer, further studies should be made in
the area.
Hypoxylon Canker Detection
Detection of hypoxylon canker in aspen stands based-upon the presence
of persistent de3d foliage is possible from large-scale (1:6,000) and
medium-scale (1:15,840) photography. The small-scale (1:31,680) photography
did not provide satisfactory definition of the individual trees to permit
the detection of single dead crowns.
Satisfactory hypoxylon canker detection was achieved on all the film-
filter combinations used at the 1:6,000 scale. The Ektacolor and Ekta-
chrome photographs were reported to be easier to work with in the field
because of the field team's inexperience with infrared color photography.
At the 1:6,000 scale, the photography showed individual dead trees
that had no foliage. These snags were the result of hypoxylon kill during
previous years. Although the snags are not identifiable on the 1:15,840
photography, individual trees of the current year's mortality are detect-
able because of the persistent dead foliage associated with the hypoxylon
canker infections. The 1:31,680 scale photography was not successful in
detecting single dead trees as is necessitated by the character of this
disease. Therefore, the small-scale photography taken for this study did
81
not prove to be of value for direct Interpretation of hypoxylon canker
in aspen.
Further investigation of hypoxylon canker detection by remote sensing
techniques will be carried out to study the effects of seasons on detect-
ability.
Armillaria Root Rot Detection
The Willow River Study indicates an Armillaria root rot detection
program could be successful if done with large-scale photography. Only
red pine mortality of the previous year had a high rating of detectability --
trees killed during any othef year were difficult, or impossible, to.detect.
These findings indicate that an aerial detection or survey program for
Armillaria root rot should be designed to utilize the fact that only the
.previous year's mortality is readily detectable.
Forest Vegetation Classification
The scale of the photographs had a very significant effect (0.010
probability) on the interpreters' ability to identify the vegetation cover
types. Scores of 38, 32, and 27 out of a possible 40 were made respectively
on 1:59,000, 1:118,000, and 1:462,000 scale photography. However, the
Interpreters commented that they had no preferences for any of the scales
that they had used in the sub-study.
The vegetative cover types did not have any significant effect on the
interpreters' scores when considered as a treatment or within an interaction.
The observer's comments were mostly concerned with the season that
the photographs were taken. The season did have a significant effect on
the interpreters' scores. The fall photography produced higher scores
82
than did the summer photography (66 for fall; 51 for summer) for all
scales.
Color infrared film produced the highest score, with 64 correct
plots out of an 80 possible score. Color film produced a score of 53
out of a possible 80. However, the film-season combination of fall-
color produced the highest score. The interpreters' stated preference
was for the infrared color film exposed during the fall season even
though this combination produced a lower score in the study than did the
color-fall combination. The summer-color combination produced the poorest
results in this sub-study.
This study suggests that very small-scale fall photography on co-lo-r
infrared film could be used to stratify areas by vegetation cover types-
and thereby serve as the first, or second, stage of a multistage sampling
project.
83
LITERATURE CITED
I. Aldrich, R. C. 1971. Space photos for land use and forestry.Photogrammetric Engineering, 37(4):389-401.
2. Aldrich, R. C. and W. J. Greentree. 1971. Microscale photo inter-
pretation of forest and non-forest land classes. AnnualProgress Report for Earth Resources Survey Program, OSSA/NASA,by the Pacific Southwest Forest and Range Experiment Station,36.pp., illus.
3. Anderson, R. L. 1967. Hypoxylon canker of aspen. Imported Forest
Insects and Diseases of Mutual Concern to Canada, the United
States and Mexico. Department of Forestry and Rural Development,Publication No. 1180, Canada, 248 pp.
4. Avery, T. E. 1970. Photo interpretation for land managers. Kodak
Publication No. M-76, Eastman Kodak Company, Rochester, New
York, 26 pp.
5. Avery, T. E. and M. P. Meyer. 1962. Contracting for forest aerialphotography in the United States. USDA, Forest Service, Lake
States Forest Experiment Station Paper No. 96, 37 pp.
6. Baker, R. D. 1970. Aerial photograph use in timber management pro-grams in-the South. Proceedings, American Society of Photogram-metry, Washington, D.C., March, 1970.
7. Boyce, J. S. 1948. Forest Pathology. McGraw-Hill, Inc., New York,550 pp.
8. Colvocoresses, A. P. 1972. Image resolutions for ERTS, Skylab and
Gemini/Apollo. Photogrammetric Engineering, 38(l):33-35.
9. Colwell, R, N. 1969. An evaluation of earth resources using Apollo 9photography. Final Report for Earth Resources Survey Program,NASA, by Forestry Remote Sensing Laboratory, University ofCalifornia, Berkeley.
10. Douglass, R. W. 1969. Forest Recreation. Pergamon Press, New York,356 pp.
11. Draeger, W. C. 1967. The interpretability of high altitude multi-spectral imagery for evaluation of wildland resources. Annual
Progress Report for Earth Resources Survey Program, NASA, byForestry Remote Sensing Laboratory, University of California,Berkeley.
84
12. Eyre, L. A. 1971. High altitude color photos. PhotogrammetricEngineering, 37(11):1149-1153.
13. French, D. W., M. P. Meyer and R. L. Anderson. 1968. Control ofdwarf mistletoe in black spruce. Journal of Forestry,66(4) :359-360.
-14. Hegg, K. 14. 1967. A photo identification guide for the land andforest types of interior Alaska. USDA, Forest Service ResearchPaper NOR-3, 55 pp.
15. Hopkins, W. S. 1970. Are foresters adequately contributing to thesolution of America's critical social.problem? Journal ofForestry, 68(1):17-21.
16. Irving, F. D. and D. W. French. 1971. Control by fire of dwarfmistletoe in black spruce. Journal of Forestry, 69(1):28-30.
17. Lauer, D. T. 1967. The feasibility of identifying forest speciesand delineating major timber types by means of high altitudemultispectral imagery. Annual Progress Report for Earth ResourcesSurvey Program, NASA, by Forestry Remote Sensing Laboratory,University of California, Berkeley, 106 pp.
18. Lauer, D. T. 1968. Forest species identification and timber typedelineation on multispectral photography. Annual ProgressReport for Earth Resources Survey Program, NASA, by ForestryRemote Sensing Laboratory, University of California, Berkeley,85 pp.
19. Meyer, M. P., D. W. French, R. P. Latham, and C. E. Nelson. 1970.Vigor loss in conifers due to dwarf mistletoe. Annual ProgressReport for Earth Resources Survey Program, NASA, by School ofForestry, University of Minnesota, St. Paul, 21 pp.
20. Meyer, M. P., D. W. French, R. P. Latham, C. A. Nelson and R. W.Douglass. 1971. Remote sensing of vigor loss in conifers dueto dwarf mistletoe. Annual Progress Report for Earth ResourcesSurvey Program, NASA, by School of Forestry, University ofMinnesota, St. Paul, 40 pp.
21. Olson, C. E., Jr. and R. E. Good. 1962. Seasonal change in lightreflectance from forest vegetation. Photogrammetric Engineering,28(1):107.
22. Ross, D. S. 1969. Image-tone enhancement. Proceedings, AmericanSociety of Photogrammetry, Washington, D.C.
23. Steel, R. G. and J. H. Torrie. 1960. Principles and procedures ofstatistics with special reference to the biological sciences.McGraw-Hill, Inc., New York, 481 pp.
85
24. Steiner, D. and T. Gutermann. 1966. Russian data on spectral reflec-
tance of vegetation, soil and rock types. European ResearchOffice. U.S. Army, 231 pp.
25. Ulliman, J. J. and M. P. Meyer. 1971. The feasibility of forestcover type interpretation using small scale aerial photographs.Proceedings, Seventh international Symposium on Remote Sensingof Environment, Ann Arbor, Michigan, May, 1971.
26. Ulliman, J. J. and M. P. Meyer. 1968. An index to aerial photographyin Minnesota. Minnesota Forestry Research Note No. 206. 4 pp.
27. Weber, F. P. and F. C. Polcyn. 1972. Remote sensing to detectstress in forests. Photogrammetric Engineering, 38(2):163-175.
28. Wood, J. I. 1953. Three billion dollars a year. Plant Diseases,Yearbook of Agriculture, U.S. Department of Agriculture,Washington, D.C., 940 pp.
86

APPENDIX A
NASA-USDA FORESTRY AND RANGE REMOTE SENSING RESEARCH PROGRAM
"REMOTE SENSING APPLICATIONS IN FORESTRY" SERIES
1966 Annual Reports
STAR* No. Title
N67-19905 Carneggie, D. M., W. C. Draeger and D. T. Lauer. The
use of high altitude, color and spectrozonal imagery for
the inventory of wildland resources. Vol. I: The timber
resource. School of Forestry and Conservation, Univer-
sity. of California, Berkeley. 75 pages.
N66-39698 Carneggie, D. M., E. H. Roberts and R. N. Colwell. The
use of high altitude, color and spectrozonal imagery for
the inventory of wildland resources. Vol. II: The
range resource. School of Forestry and Conservation,University of.California, Berkeley. 22 pages.
N67-19939 Carneggie, D. M. and R. N. Colwell. The use of highaltityde, color and spectrozonal imagery for the inven-
tory of wildland resources. Vol. III: The soil, water,wildlife and recreation resource. School of Forestryand Conservation, University of California, Berkeley.
42 pages.
N66-39304 Heller, R. C. et al. The use of multispectral sensing
techniques to detect ponderosa pine trees under stressfrom insect or pathogenic organisms. Pacific Southwest..Forest and Range Experiment Station, U.S. Forest Service-,USDA. 60 pages.
N66-39386 Lauer, D. T. The feasibility of identifying forestspecies and delineating major timber types in Californiaby means of high altitude small scale aerial photography.School of Forestry and Conservation, University of Cal-ifornia, Berkeley. 130 pages.
N66-39700 Wear, J. F. The development of spectro-signature indi-cators of root disease on large forest areas. PacificSouthwest Forest and Range Experiment Station, U.S.Forest Service, USDA. 24 pages.
*Available through NASA Scientific Technical and Information Facility,P. 0. Box 33, College Park, Maryland 20740.
87
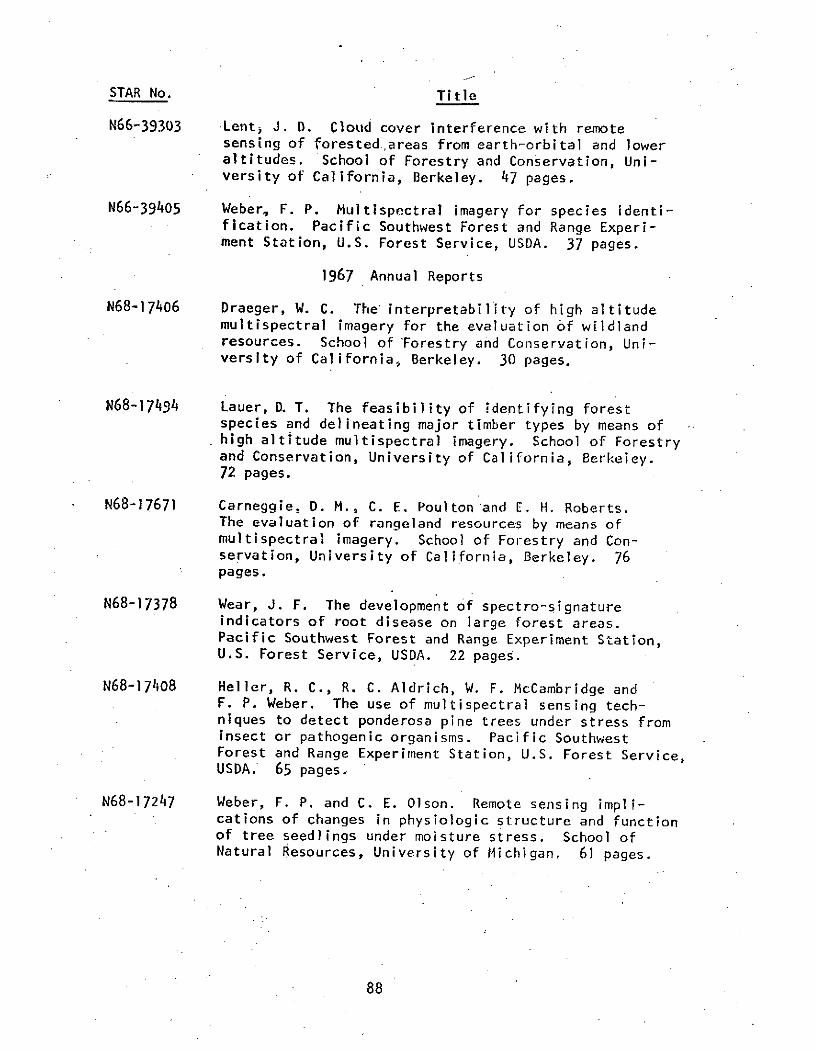
STAR No. Title
N66-39303 Lent, J. D. Cloud cover interference with remotesensing of forestedareas from earth-orbital and loweraltitudes. School of Forestry and Conservation, Uni-versity of California, Berkeley. 47 pages.
N66-39405 Weber, F. P. Multispectral imagery for species identi-fication. Pacific Southwest Forest and Range Experi-ment Station, U.S. Forest Service, USDA. 37 pages.
1967 Annual Reports
N68-17406 Draeger, W. C. The interpretability of high altitudemultispectral imagery for the evaluation of wildlandresources. School of Forestry and Conservation, Uni-versity of California, Berkeley. 30 pages.
N68-17494 Lauer, D. T. The feasibility of identifying forestspecies and delineating major timber types by means ofhigh altitude multispectral imagery. School of Forestryand Conservation, University of California, Berkeley.72 pages.
N68-17671 Carneggie. D. M., C. E. Poulton and E. H. Roberts.The evaluation of rangeland resources by means ofmultispectral imagery. School of Forestry and Con-servation, University of California, Berkeley. 76pages.
N68-17378 Wear, J. F. The development of spectro-signatureindicators of root disease on large forest areas.Pacific Southwest Forest and Range Experiment Station,U.S. Forest Service, USDA. 22 pages.
N68-17408 Heller, R. C., R. C. Aldrich, W. F. McCambridge andF. P. Weber. - The use of multispectral sensing tech-niques to detect ponderosa pine trees under stress frominsect or pathogenic organisms. Pacific SouthwestForest and Range Experiment Station, U.S. Forest Service,USDA. 65 pages.
N68-17247 Weber, F. P. and C. E. Olson. Remote sensing impli-cations of changes in physiologic structure and functionof tree seedlings under moisture stress. School ofNatural Resources, University of Michigan, 61 pages.
88
STAR No. Title
1968 Annual Reports
N69-16461 Lent, J. D. The feasibility of identifying wildlandresources through the analysis of digitally recordedremote sensing data. School of Forestry and Conserva-tion, University of California, Berkeley. 130 pages.
N69-25632 Carneggie, D. M. Analysis of remote sensing data forrange resource management. School of Forestry andConservation, University of California, Berkeley.62 pages.
N69-16113 Lauer, D. T. Forest species identification and timbertype delineation on multispectral photography. Schoolof Forestry and Conservation, University of California,Berkeley. 85 pages.
N72-74471 Driscoll, R. S. and J. N. Reppert. The identificationand quantification of plant species, communities andother resource features in herbland and shrubland.environments from large scale aerial photography.Rocky Mountain Forest and Range Experiment Station,U.S. Forest Service, USDA. 62 pages.
•** Wear, J. F. The development of spectro-signatureindicators of root disease impact on forest stands.Pacific Southwest Forest and Range Experiment Station,U.S. Forest Service, USDA. 27 pages.
N69-16390 Poulton, C. E., B. J. Schrumpf and E. Garcia-Moya.The feasibility of inventorying native vegetation andrelated resources from space photography. Departmentof RangeManagement, Agricultural Experiment Station,Oregon State University. 47 pages.
N71-37947 Heller, R. C., R. C. Aldrich. W. F. McCambridge, F. P.Weber and S. L. Wert. The use of multispectral sensingtechniques to detect ponderosa pine trees under stressfrom insect or pathogenic organisms. Pacific SouthwestForest and Range Experiment Station, U.S. Forest Service,USDA. 45 pages.
N69-!2159 Draeger, W. C. The interpretability of high altitudemultispectral imagery for the evaluation of wildlandresources. School of Forestry and Conservation, Uni-versity of California, Berkeley. 68 pages.
**STAR number not available.
89
STAR No. Title
N72-74472 Langley, P. G. and D. A. Sharpnack. The development ofan earth resources information system using aerialphotographs and digital computers. Pacific SouthwestForest and Range Experiment Station, U.S. Forest Service,USDA. 26 pages.
N69-15856 Olson, C. E. and J - M . Ward. Remote sensing of changesin morphology and physiology of trees under stress.School of Natural Resources, University of Michigan.
43 pages.
1969 Annual Reports
N70-41162 Olson, C. E., J. M. Ward and W. G. Rohde. Remotesensing of changes in morphology and physiology oftrees under stress. School of Natural Resources,University of Michigan. 43 pages.
N70-41164 Heller, R. C., R. C. Aldrich, W. F. McCambridge andF. P. Weber. The use of multispectral sensing tech-niques to detect ponderosa pine trees under stress frominsect or diseases. Pacific Southwest Forest and Range
/Experiment Station, U.S. Forest Service, USDA. 59 pages.
N70-42044 Langley, P. G., D. A.-Sharpnack, R. M. Russell andJ; Van Roessel. The development of an earth resourcesinformation system using aerial photographs and digital.computers. Pacific Southwest Forest and Range Experi-ment Station, U.S. Forest Service, USDA. 43 pages.
N70-41064 Driscoll, R. S. The identification and quantificationof herbland and s'irubland vegetation resources fromaerial and space photography. Rocky Mountain Forestand Range Experiment Station, U.S. Forest Service,USDA. 55 pages.
N70-41282 Colwell, R. N. et al. Analysis of remote sensing datafor evaluating forest and range resources. School ofForestry and Conservation, University of California,Berkeley. 207 pages.
N70-41063 Poulton, C. E., E. Garcia-Moya, J. R. Johnson andB. J. Schrumpf. Inventory of native vegetation andrelated resources from space photography. Departmentof Range Management, Agricultural Experiment Station,Oregon State University. 66 pages.
90
STAR No. Title
N70-41217 Wear, J. F. and F. P. Weber. The development of spectro-signature indicators of root disease impacts on foreststands. Pacific Southwest Forest and Range ExperimentStation, U.S. Forest Service, USDA. 58 pages.
1970 Annual Reports
** Wilson, R. C. Potentially efficient forest and rangeapplications of remote sensing using earth orbitalspacecraft -- circa 1980. School of Forestry and Con-servation, University of California, Berkeley. 199 pages.
** Aldrich, R. C., W. J. Greentree, R. C. Heller and N. X.Norick. The use of space and high altitude aerialphotography to classify forest land and to detect forestdisturbances. Pacific Southwest Forest and Range Experi-ment Station, U.S. Forest Service, USDA. 36 pages.
** Driscoll, R. S. and R. E. Francis. Multistage, multi-seasonal and multiband imagery to identify and quantify.non-forest vegetation resources. Rocky Mountain Forestand Range Experiment Station, U.S. Forest.Service, USDA.65 pages.
A* Personnel of Forestry Remote Sensing Laboratory.Analysis of remote sensing data for evaluating vegeta-tion resources. School of Forestry and Conservation,University of California, Berkeley. 171 pages.
** Meyer, M. P., D. W. French, R. P. Lathain and C. A.Nelson. Vigor loss in conifers due to dwarf mistletoe.School of Forestry, University of Minnesota. 21 pages.
N71-36770 Langley, P. G., J. Van Roessel, D. A. Sharpnack andR. M. Russell. The development of an earth resourcesInformation system using aerial photographs and digitalcomputers. Pacific Southwest Forest and Range Experi-ment Station, U.S. Forest Service, USDA. 32 pages.
N72-28321 Weber, F. P. and J. F. Wear. The development of spectro-signature indicators of root disease impacts on foreststands. Pacific Southwest Forest and Range ExperimentStation, U.S. Forest Service, USDA. 46 pages.
** Heller, R. C., F..P. Weber and K. A. Zealear. The useof multispectral sensing techniques to detect ponderosapine trees under stress from insects or diseases. PacificSouthwest Forest and Range Experiment Station, U.S. ForestService, USDA. 50 pages.
**STAR number not available.
91

STAR No. Title
N72-27375 Olson, C. E., W. G. Rohde and J. M. Ward. Remotesensing of changes in morphology and physiology of treesunder stress. School of Natural Resources, Universityof Michigan. 26 pages.
1971 Annual Reports
N71-32815 Dana, R. W. Calibration of color aerial photography.Pacific Southwest Forest and Range Experiment Station,U.S. Forest Service, USDA. 14 pages.
N72-28327 Driscoll, R. S. and R. E. Francis. Multistage, multi-band and sequential imagery to identify and quantifynon-forest vegetation resources. Rocky Mountain Forestand Range Experiment Station, U.S. Forest Service,USDA. 75 pages.
N72-28328 Amidon, E. L., D. A. Sharpnack and R. M. Russell. Thedevelopment of an earth resources information systemusing aerial photographs and digital computers. PacificSouthwest Forest and Range Experiment Station, U.S.Forest Service, USDA. 7 pages.
N72-28324 Personnel of the Remote Sensing Research Work Unit.Monitoring forest land from high altitude and fromspace. Pacific Southwest Forest and Range ExperimentStation, U.S. Forest Service, USDA. 179 pages.
N72-28326 Poulton, C. E., D. P. Faulkner, J. R. Johnson, D. A.Mouat and B. J. Schrumpf. Inventory and analysis ofnatural vegetation and related resources from spaceand high altitude photography. Department of RangeManagement, Agricultural Experiment Station, OregonState University. 59 pages.
N72-28325 Meyer, M. P., D. W. French, R. P. Latham, C. A. Nelsonand R. W. Douglass. Remote sensing of vigor loss inconifers due to dwarf mistletoe. School of Forestry,University of Minnesota. 40 pages.
N72-28037 Olson, C. E., W. G. Rohde and J. M. Ward. Remote sensingof changes in morphology and physiology of trees understress. School of Natural Resources, University ofMichigan. 77 pages.
** Personnel of Forestry Remote Sensing Laboratory.Analysis of remote sensing data for evaluating vegeta-tion resources. School of Forestry and Conservation,University of California. 195 pages.
**STAR number not available.
92
STAR No. Title
1972 Annual Reports
*. /v,& Driscoll, R. S. and R. E. Francis. Multistage, multi-e-9-'73 band and sequential imagery to identify and quantify
non-forest vegetation resources. Rocky Mountain Forestand Range Experiment Station, U.S. Forest Service,USDA. 42 pages.
** Amidon, E. L., D. A. Sharpnack and R. M. Russell. Thedevelopment of an earth resources information systemusing aerial photographs and digital computers. PacificSouthwest Forest and Range Experiment Station, U.S.Forest Service, USDA. 23 pages.
** Aad Poulton, C. E. Inventory and analysis of natural vege--30-;.3 tation and related resources from space and high alti-
tude photography. Range Management Program, Agricul-tural Experiment Station, Oregon State University. 48pages.
**. / d Personnel of the Remote Sensing Research Work Unit.7.-30-73: Monitoring forest land from high altitude and from
space. Pacific Southwest Forest and Range ExperimentStation, U.S. -Forest Service, USDA. 200 pages.
S' U1s:- :; f ,, dr., C. E. Remote scnsing of c-anges n morphul-
7, .7, ogy and physiology of trees under stress. School ofNatural Resources, University of Michigan. 26 pages.
** /P'rd Personnel of the Forestry Remote Sensing Laboratory.7-3g 7 Analysis of remote sensing data for evaluating vegeta-
tion resources. School of Forestry and Conservation,University of Califdrnia, Berkeley. 245 pages.
** * Douglass, R. W., M. P. Meyer and D. W. French. Reiotesensing applications to forest vegetation classification
7-3L and conifer vigor loss due to dwarf mistletoe. Coliegeof Forestry, University of Minnesota. 86 pages.
**STAR number not available.
93
Related Documents