University of the Incarnate Word University of the Incarnate Word The Athenaeum The Athenaeum Theses & Dissertations 5-2017 Relationship Between Generations of Entrepreneurs and Relationship Between Generations of Entrepreneurs and Entrepreneurial Traits Entrepreneurial Traits Ihsan Eken University of the Incarnate Word, [email protected] Follow this and additional works at: https://athenaeum.uiw.edu/uiw_etds Part of the Entrepreneurial and Small Business Operations Commons Recommended Citation Recommended Citation Eken, Ihsan, "Relationship Between Generations of Entrepreneurs and Entrepreneurial Traits" (2017). Theses & Dissertations. 36. https://athenaeum.uiw.edu/uiw_etds/36 This Dissertation is brought to you for free and open access by The Athenaeum. It has been accepted for inclusion in Theses & Dissertations by an authorized administrator of The Athenaeum. For more information, please contact [email protected].

Welcome message from author
This document is posted to help you gain knowledge. Please leave a comment to let me know what you think about it! Share it to your friends and learn new things together.
Transcript
University of the Incarnate Word University of the Incarnate Word
The Athenaeum The Athenaeum
Theses & Dissertations
5-2017
Relationship Between Generations of Entrepreneurs and Relationship Between Generations of Entrepreneurs and
Entrepreneurial Traits Entrepreneurial Traits
Ihsan Eken University of the Incarnate Word, [email protected]
Follow this and additional works at: https://athenaeum.uiw.edu/uiw_etds
Part of the Entrepreneurial and Small Business Operations Commons
Recommended Citation Recommended Citation Eken, Ihsan, "Relationship Between Generations of Entrepreneurs and Entrepreneurial Traits" (2017). Theses & Dissertations. 36. https://athenaeum.uiw.edu/uiw_etds/36
This Dissertation is brought to you for free and open access by The Athenaeum. It has been accepted for inclusion in Theses & Dissertations by an authorized administrator of The Athenaeum. For more information, please contact [email protected].
RELATIONSHIP BETWEEN GENERATIONS OF ENTREPRENEURS AND
ENTREPRENEURIAL TRAITS
by
IHSAN EKEN
A DISSERTATION
submitted to the Faculty of the University of the Incarnate Word
in partial fulfillment of the requirements
for the degree of
DOCTOR OF BUSINESS ADMINISTRATION
UNIVERSITY OF THE INCARNATE WORD
May 2017

ii
Copyright 2017
by
Ihsan Eken

iii
ACKNOWLEDGMENTS
Education has always been a sacred means to me. I have tremendous respect for
educators who dedicate their lives to educate new and older generations to get them ahead. I
would like to thank those three brilliant educators who made this doctoral dissertation possible.
First of all, I would like to thank and express my sincere gratitude to Dr. Osman Ozturgut, Dean
of Research and Graduate Studies at UIW, who has been a tremendous mentor for me. I would
also like to thank my committee members Dr. David S. Fike and Dr. Adam A. Guerrero for their
valued input that helped me with my research methodology and kept me on track.
Throughout the doctoral program, I came to realize that the synonym of success is
sacrifice. People must sacrifice in order to attain success or accomplish a task. Sacrificing has
become a core concept for me and my parents. We have sacrificed the “togetherness” as a family
for over two decades in order for me to reach this level of achievement. This sacrifice includes
not being with them during religious celebrations, birthday parties, weddings, and funerals.
However, with this achievement, I believe that all of these sacrifices ultimately made sense.
Therefore, I would like to dedicate this dissertation to my father, Dr. Hasan Eken, and my
mother, Mrs. Nuriye Eken, who have been an endless source of support and encouragement
throughout my education. They have always loved me unconditionally and educated me to work
hard for the things that I aspire to achieve. I love you Eken family.
iv
RELATIONSHIP BETWEEN GENERATIONS OF ENTREPRENEURS AND
ENTREPRENEURIAL TRAITS
Ihsan Eken, DBA
University of the Incarnate Word, 2017
This quantitative descriptive study investigated the relationship between 3 different generations
of entrepreneurs and entrepreneurship traits. The specific purpose of this study was to investigate
the relationship between entrepreneurial traits and generations of U.S. entrepreneurs in
Southwest (San Antonio), Northeast (Dallas), Center (Austin), and Southeast (Houston) Texas,
to see whether generational differences are associated with entrepreneurial traits. 3 different
generations of entrepreneurs were investigated in the study: baby boomers, generations Xers, and
millennials. The research aimed to contribute beneficial insights to their understanding in
enterprising potential and differentiate themselves in entrepreneurial traits in (a) need for
achievement, (b) need for autonomy, (c) creative tendency, (d) calculated risk taking, and (e)
locus of control. The GET2 test was used to collect the data to analyze the differences and
similarities between generations of entrepreneurs and entrepreneurial traits at EO in Texas’
major cities.
The study used descriptive statistics (frequencies, percentages, means, and standard
deviations) to analyze the question 1 and question 2. An ANOVA test was used to address the
question 3 to see whether there are significant differences in entrepreneurial trait scores between
generations. And lastly, a 5-multiple regression test was employed for the question 4 to see
whether there are significant differences in entrepreneurial trait scores between generations after
v
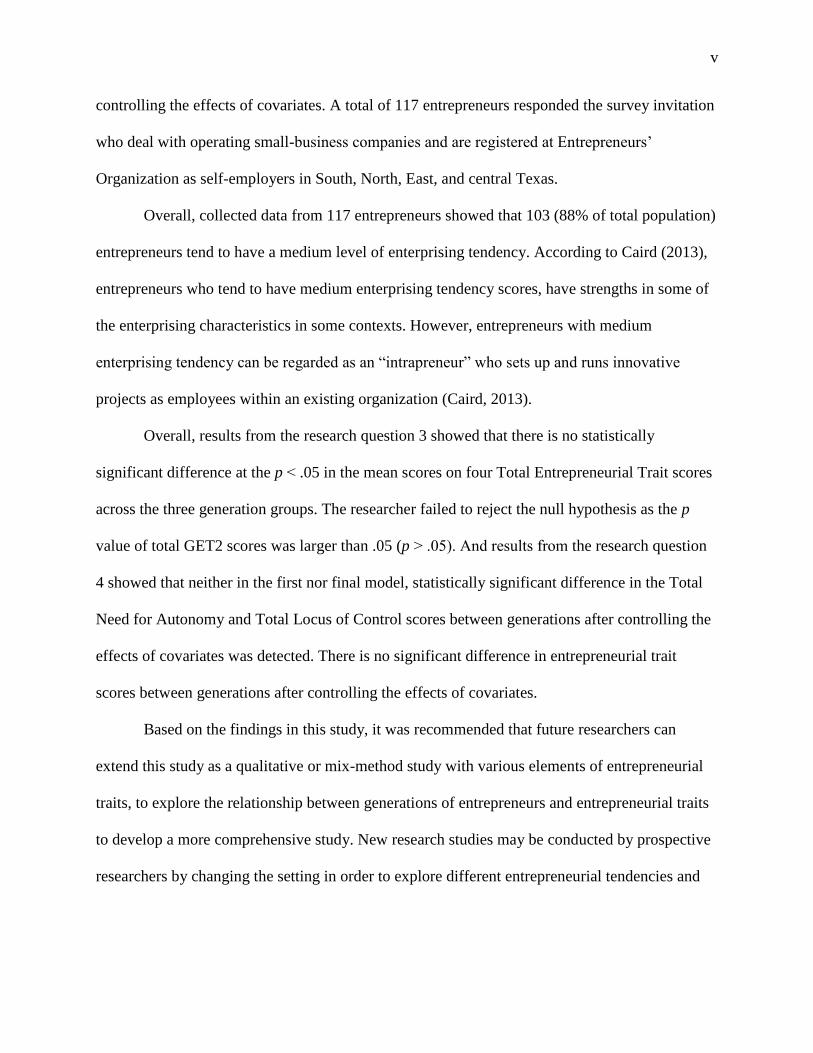
controlling the effects of covariates. A total of 117 entrepreneurs responded the survey invitation
who deal with operating small-business companies and are registered at Entrepreneurs’
Organization as self-employers in South, North, East, and central Texas.
Overall, collected data from 117 entrepreneurs showed that 103 (88% of total population)
entrepreneurs tend to have a medium level of enterprising tendency. According to Caird (2013),
entrepreneurs who tend to have medium enterprising tendency scores, have strengths in some of
the enterprising characteristics in some contexts. However, entrepreneurs with medium
enterprising tendency can be regarded as an “intrapreneur” who sets up and runs innovative
projects as employees within an existing organization (Caird, 2013).
Overall, results from the research question 3 showed that there is no statistically
significant difference at the p ˂ .05 in the mean scores on four Total Entrepreneurial Trait scores
across the three generation groups. The researcher failed to reject the null hypothesis as the p
value of total GET2 scores was larger than .05 (p ˃ .05). And results from the research question
4 showed that neither in the first nor final model, statistically significant difference in the Total
Need for Autonomy and Total Locus of Control scores between generations after controlling the
effects of covariates was detected. There is no significant difference in entrepreneurial trait
scores between generations after controlling the effects of covariates.
Based on the findings in this study, it was recommended that future researchers can
extend this study as a qualitative or mix-method study with various elements of entrepreneurial
traits, to explore the relationship between generations of entrepreneurs and entrepreneurial traits
to develop a more comprehensive study. New research studies may be conducted by prospective
researchers by changing the setting in order to explore different entrepreneurial tendencies and

vi
abilities, have larger sample size to understand the entrepreneurial traits amongst various groups,
and increase entrepreneurs’ productivities in local or global environments.

vii
TABLE OF CONTENTS
ACKNOWLEDGMENTS ............................................................................................................. iii
CHAPTER ONE—OVERVIEW .................................................................................................... 1
Context of the Study ........................................................................................................... 1
Statement of the Problem .................................................................................................... 4
Purpose of the Study ........................................................................................................... 5
Research Questions and Hypothesis ................................................................................... 5
Definition of Terms............................................................................................................. 6
Summary of Methodology .................................................................................................. 7
Theoretical Framework ....................................................................................................... 9
Contribution to the Field of Business ............................................................................... 10
Limitations of the Study.................................................................................................... 11
CHAPTER TWO—LITERATURE REVIEW ............................................................................. 13
Introduction ....................................................................................................................... 13
Generation ......................................................................................................................... 14
Baby Boomers ....................................................................................................... 16
Generation X ......................................................................................................... 18
Generation Y (Millennials) ................................................................................... 20
Entrepreneurship and Traits .............................................................................................. 22
Need for achievement ........................................................................................... 24
Need for autonomy ............................................................................................... 24

viii
Creative tendency.................................................................................................. 25
Calculated risk-taking ........................................................................................... 25
Locus of control .................................................................................................... 26
Theoretical Framework ..................................................................................................... 27
Summary ........................................................................................................................... 28
CHAPTER THREE––METHODOLOGY ................................................................................... 34
Overall Approach and Rationale ....................................................................................... 34
Setting ............................................................................................................................... 35
Research Strategy.............................................................................................................. 38
Participants. ........................................................................................................... 39
Instrumentation. .................................................................................................... 40
Data collection. ..................................................................................................... 42
Protection of Human Subjects: Ethical Considerations .................................................... 43
Data Analysis .................................................................................................................... 43
CHAPTER FOUR—RESULTS ................................................................................................... 46
Introduction ....................................................................................................................... 46
Demographic characteristics of the study participants ..................................................... 49
Research question one....................................................................................................... 55
Research question two. ..................................................................................................... 60
Research question three.. .................................................................................................. 62
Research question four. ..................................................................................................... 67
Summary of Results .......................................................................................................... 92
CHAPTER FIVE—DISCUSSION, CONCLUSIONS, AND RECOMMENDATIONS............. 93

ix
Introduction ....................................................................................................................... 93
Interpretation of the findings ............................................................................................ 94
What are the distributions of entrepreneurial traits of entrepreneurs? .................. 94
What are the distributions of generations represented by entrepreneurs? ............ 96
Is there a significant difference in entrepreneurial trait scores between
generations? .......................................................................................................... 98
Is there a significant difference in entrepreneurial trait scores between generations
after controlling the effects of covariates? ............................................................ 99
Conclusions ..................................................................................................................... 108
Limitations of the Study.................................................................................................. 112
Recommendations ........................................................................................................... 113
Practitioners. ....................................................................................................... 114
Policy Makers. .................................................................................................... 114
Future researchers. .............................................................................................. 115
REFERENCES ........................................................................................................................... 116
APPENDICES ............................................................................................................................ 125
Appendix A—Instrumentation Permission ..................................................................... 123
Appendix B—Informed Consent .................................................................................... 126
Appendix C—Instrument ................................................................................................ 127
Appendix D—IRB Approval .......................................................................................... 131
Appendix E—Nonsignificant values (Question 3) ......................................................... 132
x
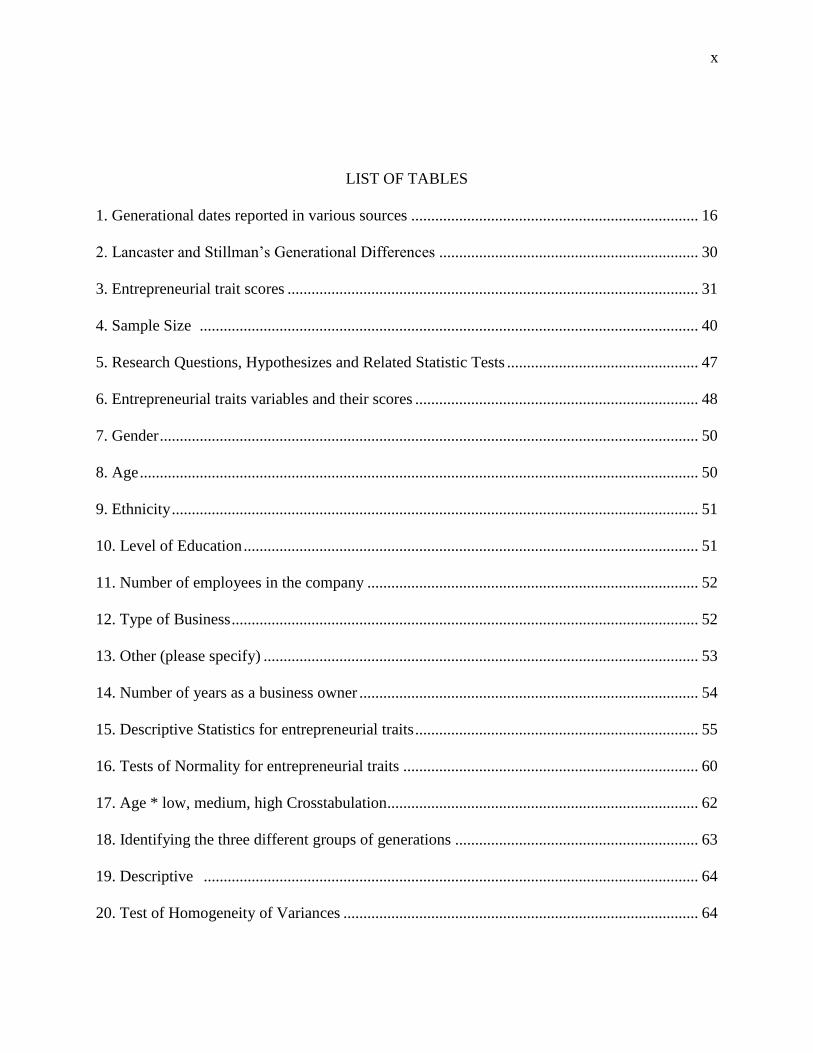
LIST OF TABLES
1. Generational dates reported in various sources ........................................................................ 16
2. Lancaster and Stillman’s Generational Differences ................................................................. 30
3. Entrepreneurial trait scores ....................................................................................................... 31
4. Sample Size ............................................................................................................................. 40
5. Research Questions, Hypothesizes and Related Statistic Tests ................................................ 47
6. Entrepreneurial traits variables and their scores ....................................................................... 48
7. Gender ....................................................................................................................................... 50
8. Age ............................................................................................................................................ 50
9. Ethnicity .................................................................................................................................... 51
10. Level of Education .................................................................................................................. 51
11. Number of employees in the company ................................................................................... 52
12. Type of Business ..................................................................................................................... 52
13. Other (please specify) ............................................................................................................. 53
14. Number of years as a business owner ..................................................................................... 54
15. Descriptive Statistics for entrepreneurial traits ....................................................................... 55
16. Tests of Normality for entrepreneurial traits .......................................................................... 60
17. Age * low, medium, high Crosstabulation.............................................................................. 62
18. Identifying the three different groups of generations ............................................................. 63
19. Descriptive ............................................................................................................................ 64
20. Test of Homogeneity of Variances ......................................................................................... 64

xi
21. ANOVA: Total Calculated Risk Taking ................................................................................. 65
22. Multiple Comparisons (Tukey HSD): Total Calculated Risk Taking score ........................... 66
23. Recategorization of categorical variables ............................................................................... 68
24. Model Summary: total need for achievement vs. generations and all covariates/predictors .. 69
25. ANOVA: total need for achievement vs. generations and all covariates/predictors .............. 70
26. Coefficients: total need for achievement vs. generations and all covariates/predictors ......... 71
27. Model Summary: total need for achievement vs. generations and controlled
covariates/predictors ..................................................................................................................... 72
28. ANOVA: total need for achievement vs. generations and controlled covariates/predictors .. 72
29. Coefficients: total need for achievement vs. generations and controlled covariates .............. 73
30. Model Summary: total need for autonomy vs. generations and all covariates/predictors .... 75
31. ANOVA: total need for autonomy vs. generations and all covariates/predictors ................... 75
32. Coefficients: total need for autonomy vs. generations and all covariates/predictors ............. 76
33. Model Summary: total creative tendency vs. generations and all covariates/predictors ...... 78
34. ANOVA: total creative tendency vs. generations and all covariates/predictors ..................... 78
35. Coefficients: total creative tendency vs. generations and all covariates/predictors ................ 79
36. Model Summary: total creative tendency vs. generations and controlled covariates ........... 80
37. ANOVA: total creative tendency vs. generations and controlled covariates/predictors ........ 80
38. Coefficients: total creative tendency vs. generations and controlled covariates/predictors . 81
39. Model Summary: total calculated risk taking vs. generations and all covariates/predictors .. 83
40. ANOVA: total calculated risk taking vs. generations and all covariates/predictors ............... 83
41. Coefficients: total calculated risk taking vs. generations and all covariates/predictors ....... 84
42. Model Summary: total calculated risk taking vs. generations and controlled
covariates/predictors ..................................................................................................................... 86

xii
43. ANOVA: total calculated risk taking vs. generations and controlled covariates/predictors .. 86
44. Coefficients: total calculated risk taking vs. generations and controlled covariates/predictors
....................................................................................................................................................... 87
45. Casewise Diagnostics: total calculated risk taking vs. generations and controlled
covariates/predictors ..................................................................................................................... 87
46. Model Summary: total locus of control vs. generations and all covariates/predictors ........... 89
47. ANOVA: total locus of control vs. generations and all covariates/predictors ........................ 89
48. Coefficients: total locus of control vs. generations and all covariates/predictors ................... 90
49. Casewise Diagnostics: total locus of control vs. generations and all covariates/predictors ... 90

xiii
LIST OF FIGURES
1. Histogram for need for achievement ......................................................................................... 58
2. Histogram for autonomy ........................................................................................................... 58
3. Histogram for creative tendency ............................................................................................... 59
4. Histogram for calculated risk taking ......................................................................................... 59
5. Histogram for locus of control .................................................................................................. 60
6. Normal probability plot (P-P) of the regression standardized residual: total need for
achievement vs. generations and all covariates/predictors. .......................................................... 71
7. Normal probability plot (P-P) of the regression standardized residual: total need for
achievement vs. generations and controlled covariates/predictors. .............................................. 74
8. Normal probability plot (P-P) of the regression standardized residual: total need for autonomy
vs. generations and all covariates/predictors. ............................................................................... 77
9. Normal probability plot (P-P) of the regression standardized residual: total creative tendency
vs. generations and all covariates/predictors. ............................................................................... 79
10. Normal probability plot (P-P) of the regression standardized residual: total creative tendency
vs. generations and controlled covariates/predictors. ................................................................... 82
11. Normal probability plot (P-P) of the regression standardized residual: total calculated risk
taking vs. generations and all covariates/predictors. .................................................................... 85
12. Normal Probability Plot (P-P) of the Regression Standardised Residual: total calculated risk
taking vs. generations and controlled covariates/predictors ......................................................... 88
13. Normal Probability Plot (P-P) of the Regression Standardised Residual: total locus of control
vs. generations and all covariates/predictors ................................................................................ 91
1
Chapter One—Overview
Context of the Study
“If you hear a voice within you saying ‘you are not a painter’ then by all means paint and that
voice will be silenced.”
-Vincent Van Gogh
“Imagination is more important than knowledge. Knowledge is limited. Imagination encircles
the world.”
-Albert Einstein
The United States has become the world’s most entrepreneurial, dynamic, and flexible
economy as opposed to other countries (Decker, Haltiwanger, Jarmin, & Miranda, 2014).
Providing individuals a freedom to easily and quickly start a business (Sadeghi, 2008), holding a
higher self-employment rate (Rupasingha & Goetz, 2013), and having numerous small firms that
create tremendous amounts of jobs (Audretsch, 2002) to name a few are reasons why the United
States is considered as leading the most dynamic economy in the world. Zimmerer, Scarborough,
and Wilson (2008) asserted that economic growth and prosperity rely on entrepreneurs who
focus merely on reaching success by creating and marketing innovative, customer-focused
products and services. The importance, benefits, and virtuosity of entrepreneurship, on the
growth of the U.S. economy, have been theoretically and scientifically recognized by numerous
research studies (Banda, 2007).
The term entrepreneur was first used in an economic context in 1755 (Banda, 2007).
Since then, the study of entrepreneurship has increased, kept its popularity, and has been an
interesting research topic for many books and articles within economics (Banda, 2007; Kerr,
Nanda, & Kropf, 2014). Many psychologists, anthropologists, sociologists, and economists have
contributed new definitions of entrepreneurship into their academic research fields (Banda,
2007). For instance, Zimmerer et al. (2008) defined entrepreneur as “one who creates a new
business in the face of risk and uncertainty for the purpose of achieving profit and growth by

2
identifying significant opportunities and assembling the necessary resources to capitalize on
them” (p. 3). As a new contribution to this research field, this study focuses on the relationship
between different generations of entrepreneurs and entrepreneurial traits, and how entrepreneurs
from different generations differ in entrepreneurial traits in the creation, assessment,
development of entrepreneurs, or operation of new ventures (McGourty, 2009). Zemke, Raines,
and Filipczak (2000) stated that “there is a growing realization that the gulf of misunderstanding
and resentment between older, not so old, and younger employees in the workplace is growing
and problematic” (p. 1).
The statistical data of the U.S. Census Bureau (2015) stated that the population of the
United States, since 2010, tends to be larger, older, and racially and ethnically more diverse than
ever before. According to the 2015 U.S. Census Bureau report, the United States hosts a
population of 321.4 million people and there is a 3.9% growth in a population of 281.4 million
people since 2010. How could the United States sustain the most dynamic economy in the world
with such a large population? The answer to this question is embedded in the importance of
having a tremendous amount of small-businesses which enhance local economic growth and
quality of life, and new job opportunities in the United States (Bednarzik, 2000; Decker et
al.,2014; Hathaway & Litan, 2014; Longenecker & Schoen, 1975; Olson, 1987; Rupasingha &
Goetz, 2013; Scales, 2011). According to the U.S. Small Business Administration’s (SBA) 2014
statistics, the number of small-businesses, owned and operated by different generations of
entrepreneurs, has quickly increased and the rate of failures for small businesses has dropped
while big corporations are downsizing. Small Business Administration (2014) reported that 28
million small-businesses created 56 million jobs across the Unites States in which real gross
3
domestic product (GDP) grew at an annual rate of 5% in the third quarter of 2014. These are
findings reported since 2003.
From 1946 to present, nearly five decades, the United States has seen racially, ethnically,
and economically different generations of entrepreneurs. Different generations of entrepreneurs
who distinguish themselves in “perspective on work, distinct and preferred ways of managing
and being managed, idiosyncratic styles, and unique ways of viewing such work-world issue as
quality and service” (Zemke et al., 2000, p. 25) have vividly contributed largely to today’s
economic growth (BLS, 2016). For instance, some successful entrepreneurs from different
generations such as Bill Gates, co-founder of Microsoft PC software company, Mark
Zuckerberg, co-founder of Facebook the social networking website, and many other independent
entrepreneurs have contributed new merchandise and services to the United States to make it
more efficient and beneficial.
A positive relationship between entrepreneurship and economic growth has empirically
been detected by many economists as a result of entrepreneurs from different generations
establishing small businesses in the United States (Banda, 2007; Batabyal & Nijkamp, 2012;
Galindo & Picazo, 2013; Glaeser, Kerr, P., & Kerr, 2015). The important role of entrepreneurs
from different generations in the U.S. economy has been taken into consideration in this study.
Three different generations of entrepreneurs and five different entrepreneurial traits are
examined to determine whether generational differences affect entrepreneurial traits. Analyzing
the characteristically different generations of entrepreneurs (Baby Boomers, Generation Xers,
and Millennials) and their entrepreneurial traits (need for achievement, need for autonomy,
creative tendency, calculated risk taking, and locus of control) may shed a new light on their
perspectives on business activities.

4
Statement of the Problem
As previously stated that entrepreneurs have substantially contributed to local economic
growth, quality of life, and the workforce to the United States economy positively. Furthermore,
Stephens, Partridge, and Faggian (2013) suggested that higher levels of entrepreneurship in rural
and remote regions is a key means to increasing economic growth. To enhance or at least keep
the United States economic growth steady, the need of addressing, understanding and analyzing
generationally diverse entrepreneurs and their distinguished characteristics has come out of
necessity. Previous research studies reported that failure to understanding generational
differences may result in misunderstanding and miscommunication, conflict in the workplace,
and lower employee productivity (Fyock, 1990; Adams, 2000).
Generations differ from each other in values and views, workplace aspirations, politics,
music, sports, movie heroes, dreads, hopes, fears, delights, and disappointments (Zemke et al.
2000) while generations that were born in the same time period share common historical
experiences, economic and social conditions, and technological advances (Spector, 2008).
Lancaster and Stillman (2002)’s theory claims that three different generations of entrepreneurs,
Baby Boomers, Generation Xers, and Millennials, have their own work ethics and they tend to be
diverse in today’s high-performance workplace. Therefore, three different generations of
entrepreneurs’ characteristics are needed to be analyzed. These characteristics are as follows:
need for achievement, need for autonomy, creative tendency, calculated risk-taking, and locus of
control (Caird, 2006). Measuring and analyzing these entrepreneurial characteristics among
different generations of entrepreneurs may contribute beneficial insights to their understanding in
enterprising potential and differentiate themselves in entrepreneurial traits. Entrepreneurship has
become a powerful factor in the United State economy in which it is believed that economic

5
growth, dynamic workforce, and wealth reside in the hands of entrepreneurs. As the scope of
small-business increases in the United States, paying attention to entrepreneurship in local
business has been increasing and has been a challenge among different generations of
entrepreneurs.
Purpose of the Study
The purpose of this study is to investigate the relationship between entrepreneurial traits
and generations of U.S. entrepreneurs in Southwest (San Antonio), Northeast (Dallas), Center
(Austin), and Southeast (Houston) Texas, to see whether generational differences are associated
with entrepreneurial traits.
Research Questions and Hypothesis
Regardless of gender and ethnicity, local entrepreneurs from different generations, the
Baby Boomers, Generation Xers, and Millennials, in major cities in Texas (San Antonio, Dallas,
Austin, and Houston) were selected as the research subjects based on their entrepreneurial traits:
need for achievement, need for autonomy, creative tendency, calculated risk-taking, and locus of
control.
The central questions for this research are:
(1) What are the distributions of entrepreneurial traits of entrepreneurs?
(2) What are the distributions of generations represented by entrepreneurs?
(3) Is there a significant difference in entrepreneurial trait scores between
generations?
Hypothesis: Using one-way ANOVA in the Null (H0) and Alternate (H1), the hypotheses
are:

6
• H0: There is no significant difference in entrepreneurial trait scores between
generations.
• H1: There is a significant difference in entrepreneurial trait scores between
generations.
(4) Is there a significant difference in entrepreneurial trait scores between generations
after controlling the effects of covariates?
Hypothesis: Using five multiple regression analyses in the Null (H0) and Alternate (H1)
the hypotheses are:
• H0: There is no significant difference in entrepreneurial trait scores between
generations after controlling the effects of covariates.
• H1: There is a significant difference in entrepreneurial trait scores between
generations after controlling the effects of covariates.
Definition of Terms
Generation: “A special cohort-group whose length approximates the span of a phase of
life and whose boundaries are fixed by peer personality” (Strauss & Howe, 1991, p. 60).
Baby Boomers: Born between the years -1946 and 1964 (Lancaster & Stillman, 2002)
Generation X: Born between the years 1965 - and 1980 (Lancaster & Stillman, 2002)
Millennials: Individuals who were born between the years - 1981 and 1999 (Lancaster &
Stillman, 2002)
Small-Business: Is a business that is “profit oriented and is independently owned and
operated with fewer than 500 employees in non-manufacturing industries which makes a
significant contribution to the U.S. economy through payment of taxes or use of American
products, materials or labor” (SBA, n.d.).

7
Entrepreneur: “Is one who creates a new business in the face of risk and uncertainty for
the purpose of achieving profit and growth by identifying significant opportunities and
assembling the necessary resources to capitalize on them” (Scarborough & Zimmerer, 2005, p.3).
Entrepreneurship: “The scholarly examination of how, by whom, and with what effects
opportunities to create future goods and services are discovered, evaluated, and exploited”
(Shane & Venkataraman, 2000, p. 218).
Need for achievement: McClelland (1953) defined this trait as “an arousal when there is
competition with a standard of excellence in situations where performance may be assessed for
success or failure” (as cited in Caird, 1990a, p. 141).
Need for autonomy: Johnson, Marks, Matthews, & Pike (1987) defined this trait as
“attributes of independence self-confidence” (as cited in Caird, 1990a, p. 142).
Creative tendency: Schumpeter (1950) defined this trait as risk-bearing “entrepreneurial
function in terms of revolutionary innovation of new products or new processes to improve
products” (as cited in Caird, 1990a, p. 141).
Calculated risk-taking: Caird (1991a) defined calculated risk-taking as “the ability to deal
with incomplete information and act on a risky option, that requires skill, to actualize challenging
but realistic goals” (p. 179).
Locus of control: Weinstein (1969) conceptualized this trait as “responsibility for success
and failures is due to ability and effort rather than to task difficulty, luck, fates, powerful others
or being in the right place at the right time” (as cited in Caird, 1990a, p. 142).
Summary of Methodology
This study intended to explore different generations of entrepreneurs’ entrepreneurial
traits through the General Measure of Enterprising Tendency (GET) test, which was first
8
developed in 1987-1988 by Sally Caird and Cliff Johnson at Durham University Business
School. Due to extensive interest in this tool, Caird (2006) revised the original test to make the
GET2 test, which has been widely used with an average of 1,000 users per month, and the GET2
test has been adopted by over 80 institutions and organizations in over 30 countries.
This study was a quantitative study, in which correlation was analyzed between different
generations of entrepreneurs and entrepreneurial traits. The reason of relying on the quantitative
research was that the numerical demonstration of collected data provides articulate interpretation
of the phenomena. Creswell (2012) describes one of the characteristics of quantitative research,
which is aligned with this study, as “analyzing trends, comparing groups, or relating variables
using statistical analysis, and interpreting results by comparing them with prior predictions and
past research” (p. 13). In this quantitative study, the researcher used a proven, valid, and reliable
instrument to measure variables and utilize multiple statistical procedures to form objectivity in
order not to influence the results by avoiding biases or personal opinions into the study
(Creswell, 2012).
A quantitative descriptive study was used as an appropriate research design and research
method to collect, analyze, and interpret data to acquire empirical evidence about the purpose of
the study. The research was a contribution to the business academic studies about self-awareness
of today’s entrepreneurs from different generations in (a) need for achievement, (b) need for
autonomy, (c) creative tendency, (d) calculated risk taking, and (e) locus of control. In this
quantitative descriptive study, a reliable and valid survey instrument GET2 was used to collect
data from participants who are currently associated with the Entrepreneurs’ Organization (EO) in
San Antonio, Dallas, Austin, and Houston. Sekaran and Bougie (2013) stated that “surveys are

9
useful and powerful in finding answers to research questions through data collection and
subsequent analyses” (p. 240).
Theoretical Framework
This descriptive study was guided by the theoretical framework of entrepreneurial
tendencies that was provided by Caird (2006) whose previous research studies found that
enterprising individuals who are believed to have high entrepreneurial tendencies displayed high
scores in GET2 test. Caird (2013) underlined the importance of GET2 that “the basic premise of
the test is that the enterprising person shares entrepreneurial characteristics, and that these
characteristics may be nurtured via education and training, and assessed” (p. 3). The GET2 test
was adopted for this study in order to determine the differences and similarities between
generations of entrepreneurs and entrepreneurial traits at EO in Southwest (San Antonio),
Northeast (Dallas), Center (Austin), and Southeast (Houston), Texas.
Lyons, Lynn, and Bhaird (2015) purported that “trait approach assumes that the
entrepreneur has a unique personality with discernible psychological characteristics, and if a
method of locating these characteristics were to be developed, researchers would be able to
locate entrepreneurs in a sample” (p.139). Caird’s (2006) entrepreneurial tendency test was
substantially aligned with this correlational study, as the test was aimed to identify and correlate
the key characteristics of different generations of entrepreneurs at EO in the major cities in
Texas. Validity and reliability of GET2 was demonstrated in previous studies by other scholars
(Caird, 1990a, 1991a, 1993, 2006; Dada, Watson, & Kirby, 2015; Demirci, 2013; Estay, Durrieu,
& Akhter, 2013; Lyons et al., 2015). Estay et al., (2013) reported that the internal coherence
coefficients ρ were used instead of Cronbach α to measure the reliability of their test which
resulted in above .8. while the coefficients of convergent validity were close or superior to .5. In
10
assessing reliability, the results of Cronbach’s alpha coefficient for different samples were
satisfying for researchers (.811 and .785) while GET tests results indicated that the criteria for
internal consistency was met (Dada et al.,2015; Demirci, 2013). Cromie (2000, p. 22)
underpinned the test model that “a comprehensive, accessible, easy to administer and score, and,
though additional work is needed to verify its psychometric properties, some studies have found
that the GET test has criterion and convergent validity and good internal consistency” (as cited in
Lyons et al., 2015, pp. 143,144).
Overall, this study was supported by a theoretical framework that focused on the theory
of enterprising tendency (trait theory) adopted from Caird (2006) in order to investigate if any of
entrepreneurial traits possibly vary among local entrepreneurs from different generations. Each
generations, Baby Boomers, Generation Xers, and Millennials, has their unique entrepreneurial
traits as this study intended to distinguish by utilizing the GET2 instrument. The instrument of
GET2 is comprised of five traits in conjunction with 54 questions which are associated with need
for achievement, need for autonomy, creative tendency, calculated risk taking, and locus of
control.
Contribution to the Field of Business
A variety of studies have been referenced in this study in order to provide useful
information for practitioners, policy makers, and future researchers. This study intended to
explore whether there is a correlation between generations of entrepreneurs and entrepreneurial
traits. In this study, participants were entrepreneurs with small businesses. The study also
intended to make contribution to the academic literature by profiling Southwest (San Antonio),
Northeast (Dallas), Center (Austin), and Southeast (Houston) Texas region entrepreneurs.
11
Entrepreneurship has become a powerful factor in the U.S. economy in which it is
believed that economic growth, dynamic workforce and wealth reside in the hands of
entrepreneurs. As the scope of small-business increases in the United States, paying attention to
entrepreneurship in local business has been increasing and has been a challenge among different
generations of entrepreneurs. Different generations of entrepreneurs display different
characteristics in self-employment roles. Thus, it should be an essential factor for policymakers,
local economic development departments, to understand to what extent generations’ differences
are associated with entrepreneurial traits, in order to receive a higher quality of output from
entrepreneurs in the Southwest, Northeast, Center, and Southeast Texas metropolitan regions.
The research was presented as a quantitative descriptive study of entrepreneurs from
different generations and entrepreneurial traits by utilizing the GET2 instrument. Future
researchers could extend this study as a mix-method study with various elements of
entrepreneurial traits, to explore the relationship between generations of entrepreneurs and
entrepreneurial traits in order to develop a more comprehensive study. For future research, in
addition to the knowledge obtained from this study, new research studies may be conducted by
prospective researchers by changing the setting in order to increase entrepreneurs’ productivities
in local or global environments.
Limitations of the Study
The limitation of the study was based on three major benchmarks: (a) investigating a
correlation between generations of entrepreneurs and entrepreneurial traits, (b) generations who
are distinguished by Baby Boomers, Generation Xers, and Millennials, (c) entrepreneurs who
consider themselves as self-employed and run small-businesses in Southwest (San Antonio),
Northeast (Dallas), Center (Austin), and Southeast (Houston) Texas metropolitan regions. The
12
study was limited to investigating the generations of entrepreneurs and entrepreneurial traits
while previous/current research studies either focused merely on students in business schools or
clustered around educating individuals who want to be taught to be a better entrepreneur (Lazear,
2005; Macko & Tyszka, 2009; McGourty, 2009; Morris, Webb, Fu, & Singhal, 2013).
The study employed a reliable questionnaire developed by Caird (2006) that had only
been validated in entrepreneurial research studies. The questionnaire consists of five
entrepreneurial characteristics in conjunction with a total of 54 questions which was sent out to
local entrepreneurs via Survey Monkey. The research subjects were chosen from local
entrepreneurs in the Southwest (San Antonio), Northeast (Dallas), Center (Austin), and Southeast
(Houston) Texas metropolitan regions where the current total population was 5,997,991 (U.S.
Census Bureau, 2016).
Though the study was aimed to reach its purpose, there were several unavoidable
limitations that were needed to be taken into account. The following are the limitations of the
study:
1) The research study will be restricted in Southwest, Northeast, Center, and
Southeast Texas metropolitan regions of the United States.
2) A survey instrument will be relied upon in data collection process.
3) Entrepreneurs with small business owners may not have enough time to fill
out the survey properly.
4) The study will include participants from different generations such as Baby
Boomers, Generation Xers, and Millennials.
5) Data will be self-reported.
13
Chapter Two—Literature Review
Introduction
Boote and Beile (2005) state that “to advance our collective understanding, a researcher
or scholar needs to understand what has been done before, the strengths and weaknesses of
existing studies, and what they might mean” (p.3). Furthermore, Boote and Belie (2005)
underline the importance of the literature review that a scholar or researcher is not going to be
able to perform a significant research study without understanding of this area, and yet, lack of
understanding prior research studies will also be a disadvantage for a researcher. Boote and Belie
(2005) asserted that “to be useful and meaningful, education research must be cumulative; it
must build on and learn from prior research and scholarship on the topic” (p.3). Therefore, a
review of associated literature needed to be done in this study to examine the related existing
studies and foundations.
The purpose of this research study was to provide an understanding of the relationship
between generations and entrepreneurial traits, and contribute new, productive and dynamic
concepts into the business area. A variety of studies have been referenced in this research study
in order to underpin and compare information regarding interactions between generations and
entrepreneurial traits. In chapter 2, this research further provides an in-depth presentation of
generation of entrepreneurs, entrepreneurial traits, and a discussion of how entrepreneurs from
different generations distinguish themselves in entrepreneurial traits. The benefits of this study
would be providing entrepreneurs from different generations, such as Baby Boomers, Generation
Xers, and Millennials, an interpretation, assessment, a comparison, and a chance of measuring
their potential entrepreneurial traits within the framework of: (a) need for achievement, (b) need
for autonomy, (c) creative tendency, (d) calculated risk taking, and (e) locus of control among
14
EO in Southwest (San Antonio), Northeast (Dallas), Center (Austin), and Southeast (Houston),
Texas. The information in this literary review was gathered over an eight-week time period
beginning November 3, 2016. Research articles that are used for this study were peer reviewed
from the “Business Source Complete”, available at the University of the Incarnate Word’s
library. The sources of the literature included: Primo Search, ProQuest, EBSCO, SAGE Journals,
ERIC, and the research library of the University of the Incarnate Word. The research books that
are used for this research study were provided by the library of the University of the Incarnate
Word. Reviewed sources are stated to be from the years between 1974 and 2016.
Generation
The term generation has sociologically been conceptualized and articulated by well-
known generational scholars that have done most of the revolutionary work in this field (Strauss
& Howe, 1991; Zemke, Raines, & Filipczak, 2000). They define generation as a “a cohort-group
whose length approximates the span of a phase of life and whose boundaries are fixed by peer
personality” (Strauss & Howe, 1991, p. 60). In this definition, Strauss and Howe underlined peer
personality as “a generational persona recognized and determined by (1) common age location;
(2) common beliefs and behavior; and (3) perceived membership in a common generation” (p.
64) to find the boundaries and identify a generation. In the twenty-two years period, generations
shares a set of collective attitudes such as “family life, sex roles, institutions, politics, religion,
lifestyle, and the future. It can be safe or reckless, calm or aggressive, self-absorbed or outer-
driven, generous or selfish, spiritual or secular, interested in culture or interested in politics”
(Strauss & Howe, 1991, p. 63).
According to Zemke et al. (2000), having “the mix of race, gender, ethnicity, and
generation make today’s American workforce unique and singular” (p. 1). Zemke et al. (2000)

15
further added that “the three generations that occupy today’s workplace and the fourth generation
that is entering it are clearly distinguishable by all these criteria – their demographics, their early
life experiences, the headlines that defined their times, their heroes, music, and sociology, and
their early days in the workplace” (p. 17). However, misunderstanding and hatred could be a
problem between older, not so old, and younger generations in the workforce that needs to be
addressed and confronted (Zemke et al., 2000).
Just like in today’s American workforce, each generation of entrepreneurs displays its
own generational personality as well. Strauss and Howe (1991) state that these “personalities are
arrayed in a generational constellation that changes according to a predictable generational cycle.
Projecting the cycle is a new way to predict consumer attitudes and lifestyles” (p. 25). Zemke et
al. (2000) asserted that “understanding generational differences is critical to making them work
for the organization and not against it” (p. 17).
In the phase of literature review, generational differences, particularly the differences
between generations of entrepreneurs defined variously as Baby Boomers generation, Generation
X, and Generation Y (millennial generation), are widely discussed in the light of well-known
scholarly publications (Lancaster & Stillman, 2002; Strauss & Howe, 1991; Zemke et al. 2000).
The three different generations were elaborated on in the phase of literature review with the
intention of bridging the gap in the literature among entrepreneurship traits, such as need for
achievement, need for autonomy, creative tendency, calculated risk taking, and locus of control,
to unveil the relationship among these variables and how they affect entrepreneurial outcome.
Understanding and bridging the gap between the different generations of entrepreneurs and
entrepreneurial traits could help out the future entrepreneurs. Because, each different generation
has its distinctive work ethics, perspectives on work, managing and idiosyncratic styles, and
16
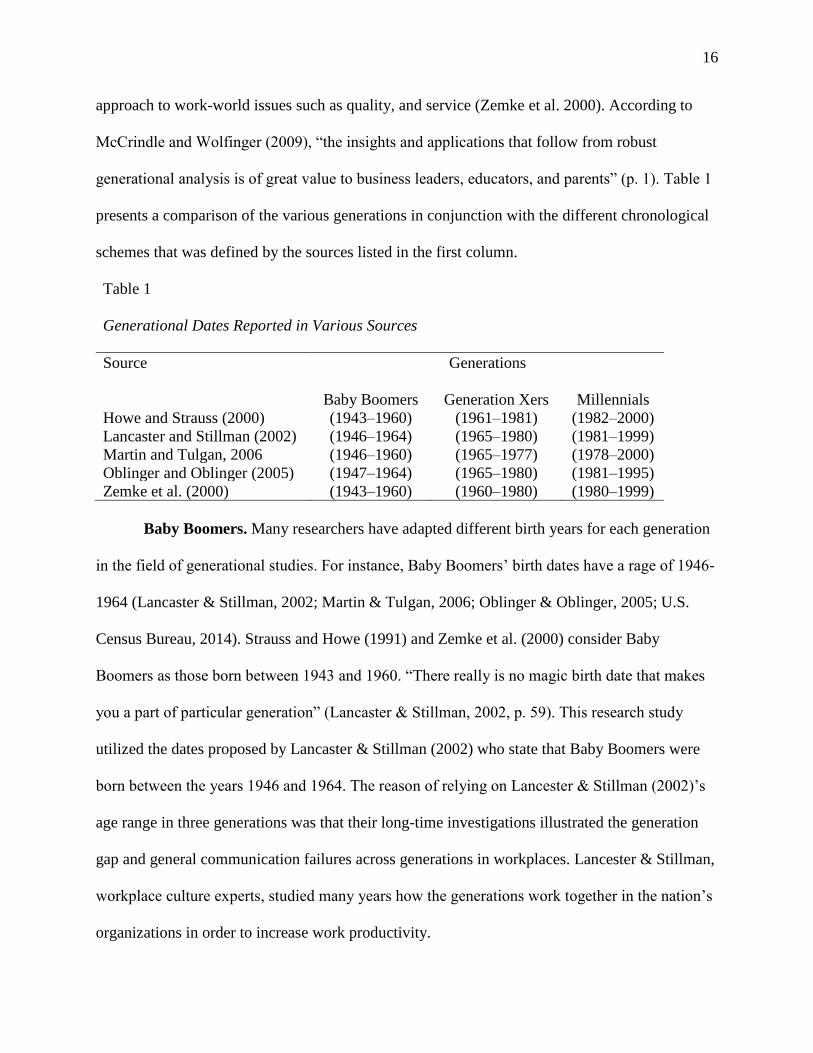
approach to work-world issues such as quality, and service (Zemke et al. 2000). According to
McCrindle and Wolfinger (2009), “the insights and applications that follow from robust
generational analysis is of great value to business leaders, educators, and parents” (p. 1). Table 1
presents a comparison of the various generations in conjunction with the different chronological
schemes that was defined by the sources listed in the first column.
Table 1
Generational Dates Reported in Various Sources
Source Generations
Baby Boomers Generation Xers Millennials
Howe and Strauss (2000) (1943–1960) (1961–1981) (1982–2000)
Lancaster and Stillman (2002) (1946–1964) (1965–1980) (1981–1999)
Martin and Tulgan, 2006 (1946–1960) (1965–1977) (1978–2000)
Oblinger and Oblinger (2005) (1947–1964) (1965–1980) (1981–1995)
Zemke et al. (2000) (1943–1960) (1960–1980) (1980–1999)
Baby Boomers. Many researchers have adapted different birth years for each generation
in the field of generational studies. For instance, Baby Boomers’ birth dates have a rage of 1946-
1964 (Lancaster & Stillman, 2002; Martin & Tulgan, 2006; Oblinger & Oblinger, 2005; U.S.
Census Bureau, 2014). Strauss and Howe (1991) and Zemke et al. (2000) consider Baby
Boomers as those born between 1943 and 1960. “There really is no magic birth date that makes
you a part of particular generation” (Lancaster & Stillman, 2002, p. 59). This research study
utilized the dates proposed by Lancaster & Stillman (2002) who state that Baby Boomers were
born between the years 1946 and 1964. The reason of relying on Lancester & Stillman (2002)’s
age range in three generations was that their long-time investigations illustrated the generation
gap and general communication failures across generations in workplaces. Lancester & Stillman,
workplace culture experts, studied many years how the generations work together in the nation’s
organizations in order to increase work productivity.

17
The Baby Boomers, as the generation of Americans, is commonly believed to have begun
at World War II which was marked by one of the largest generations in U.S. history (Lancaster
& Stillman, 2002; U.S. Census Bureau, 2014). As its name “boom” implies, this generation
remarkably boomed American economy, education, housing, and science and was featured in
Fortune magazine as “the Great American Boom” in 1946 (Strauss & Howe, 1991). It is
believed that a generation of 80 million Americans born between 1946 and 1964 which formed a
Baby Boomer generation (Lancaster & Stillman, 2002). At present in 2016, the Baby Boomers
are at the age of between 52 and 70. The Boomers generation witnessed and participated in the
political and social turbulent of their time such as the Vietnam War, the women’s and human
rights movement, the Kennedy and King assassinations, Watergate and the sexual revolution
(Adams, 2000; Lancaster & Stillman, 2002).
The generation of Baby Boomers in the United States was intended to elaborate more on
their work habits and ethics rather than breaking down on literature of sociology. Baby Boomers
are believed to be competitive (Lancaster & Stillman, 2002), optimistic, team orientated, healthy,
workaholic, and had personal gratification (Zemke et al., 2000) at work and in their
organizations. The Baby Boomers are highly motivated in doing a “stellar career” in their salary,
title, recognition, and perks (Lancaster & Stillman, 2002; Sandeen, 2008). Wiedmer (2015)
portrayed the Baby Boomers as independent, well established and goal-oriented generations as
they believe in power, hierarchical structure, and rankings which resulted in earned significant
positions of responsibility and authority in the workforce for them. “They are genuinely
passionate and concerned about participation and spirit in the workplace, about bringing heart
and humanity to the office, and about creating a fair and level playing field for all” (Zemke et al.
2000, p.79). The Baby Boomers are also less likely to change jobs when they view their current

18
job negatively, as compared with generation Xers (Lancaster & Stillman, 2002; Wiedmer, 2015;
Zemke et al. 2000). This generation is the first to be educated and graded as opposed to other
generations (Lancaster & Stillman, 2002; Wiedmer, 2015; Zemke et al. 2000).
Generation X. This generation is also called Gen X, Gen Xers, Post-Boomers, Twenty-
Something’s, Baby Busters (Wiedmer, 2015), and The Thirteenth generation, because it is the
13th generation to know the American nation and flag (Howe & Strauss, 1991; Keeling, 2003).
Using a range of birth years has helped many researchers to define and differentiate generations.
Many researchers have set up different birth years for this generation as well. For instance,
Generation X is referred to as those who were born between the 1960s and 1980s (Lyons &
Kuron, 2013; Zemke et al. 2000), between 1961 and 1981 (Howe & Strauss, 1991; Keeling,
2003; Ryan, 2004; Sandeen, 2008; Wiedmer, 2015), and lastly between 1965 and 1980
(Lancaster & Stillman, 2002). This research study utilized the dates proposed by Lancaster &
Stillman (2002) who stated that Generation Xers were born between the years 1965 and 1980,
following the Baby Boomer generation.
The Generation X was born after the Western Post-World War II Baby Boomers when
the United States experienced severe economic recessions during this time period, due to the
existence of lower birth rates, as opposed to previous Baby Boomers (Martin & Tulgan, 2006;
Wiedmer, 2015; Zemke et al., 2000). According to U.S. Census Bureau (2014), Generation Xers
contribute a population of 84 million people in the United States. The Generation Xers are, at
present in 2016, at the age of between 36 and 51. Therefore, sometimes differentiating whether
some individuals are Generation Xers or late Boomers could be difficult. According to Zemke et
al. (2000), asking individuals where they were when John F. Kennedy was shot could be the best
question to determine their generation. If they are not old enough to remember when John F.
19
Kennedy was shot, they are then probably part of Generation X. As a solution to this, the
researcher asked participants to indicate their age range in demographic questionnaire in the
survey (Baby boomers: 52-70, generation Xers: 36-51, millennials:18-35).
According to Zemke et al. (2000), this “middle child” generations’ birthing recession
significantly caused weak-workforce, robust job market, and economic panic in Generation X
time period. Generation Xers were the resilient survivors both economically and psychologically,
although characteristically pessimistic, independent, self-reliant, and skeptical (Sandeen, 2008;
Zemke et al., 2000). They have a sense of being thrown out of job without warning, logic, and
apology by corporations (Zemke et al., 2000). They are more apt to job hop than previous
generations due to being too skeptical (Wiedmer, 2015). Generation Xers are very
technologically savvy and have strong technical skills (Lancaster & Stillman, 2002; Strauss &
Howe, 1991; Zemke et al., 2000). They have reached the era of computer, video games, internet,
digital TV, and cell phones that prove that Generation Xers are adaptable to change (Zemke et
al., 2000). According to Zemke et al. (2000), being well acquainted with technology makes
Generation Xers more eligible than the Baby Boomers. Therefore, Generation Xers who are
working in high-tech companies are most likely supervising the Baby Boomers who would
question about the work ethic and commitment of the Generation Xers. Some well-known
Generation X members, “Michael Dell at Dell Computer, Jeff Bezos at Amazon, David Lauren
at Swing Magazine, Jerry Yang and David Filo at Yahoo, are already heading up their own
companies” (Zemke et al., 2000, pp.94-95).

20
Generation Y (Millennials). Generation Y is also known as the Echo Boom, the Baby
Busters, Generation Next (Lancaster & Stillman, 2002), the Internet Generation, Nintendo
Generation, Generation 2001 (Zemke et al., 2000), and Millennials (Howe & Strauss, 2000;
Lancaster & Stillman, 2002; Zemke et al., 2000). Different birth year parameters have been set
by different researchers, for this generation. For instance, Millennials are referred to as those
who were born between 1980 and 2000 (Zemke et al., 2000), 1981 and 1999 (Lancaster &
Stillman, 2002), and 1982 and 2000 (Strauss & Howe, 1991). This research study adopted the
dates proposed by Lancaster & Stillman (2002) who stated that Generation Y was born between
the years 1981 and 1999 followed by the Baby Boomers generations and Generation Xers.
Wiedmer (2015) stated that a generation of 71 million Millennials, born since the Boomers,
forms the largest generational cohort group. According to United States Census Bureau (2015),
Millennials have reached 83.1 million in numbers, and they represent more than one quarter of
the nation’s population. Millennials are currently between the ages of 17 and 35.
The Millennials have witnessed several historical incidents that include the death of
Princess Diana, the World Trade Center attacks, the Columbine High School shootings, and the
Oklahoma City federal building bombing (Wiedmer, 2015; Zemke et al., 2000). This generation
is talented in using technology that has been a part of their lives (DeMaria, 2013; Howe &
Strauss, 2000; Lancaster & Stillman, 2002; Murray, 2015; Zemke et al., 2000). As a result of
Millennials having grown up with the Internet, cell phones, text messaging, and social media
(Murray, 2015), differentiating them from prior generations, they are considered “Internet
Pioneers” (DeMaria, 2013). Being “Internet Pioneers” and having an innate capability to use
technology, Millennials, who are the first to be born when Internet and cell phones already
existed, have the opportunity to be a transformational generation (DeMaria, 2013). According to
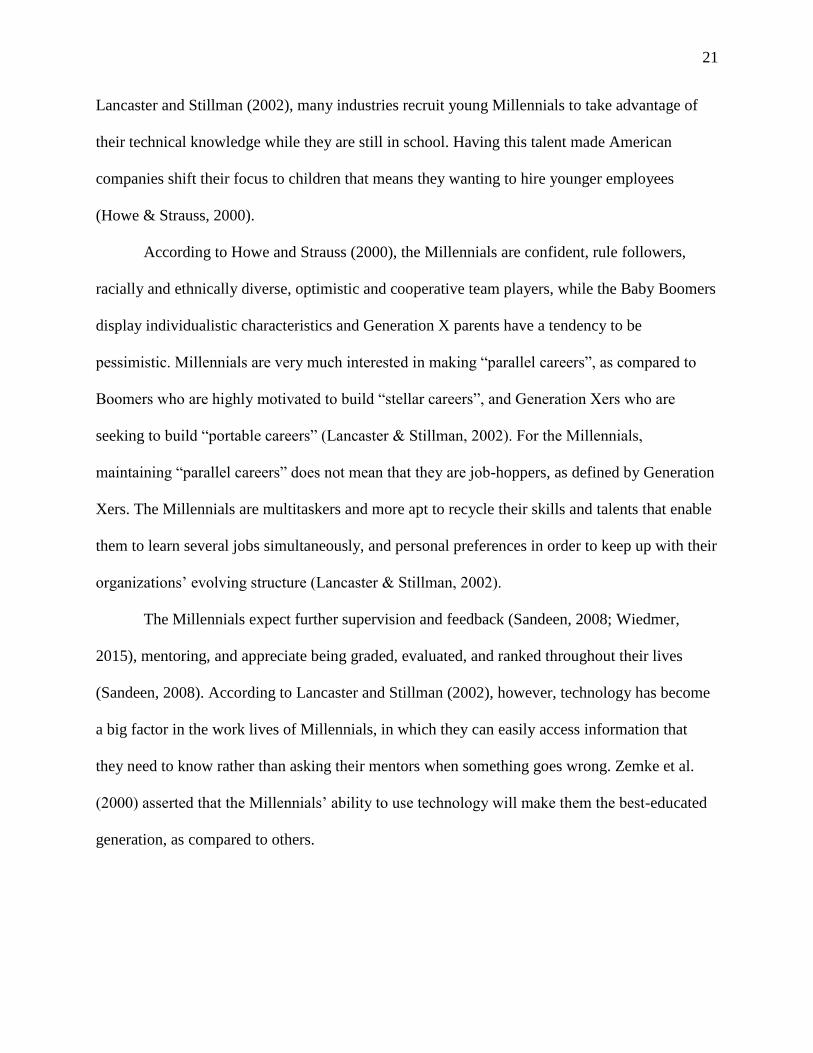
21
Lancaster and Stillman (2002), many industries recruit young Millennials to take advantage of
their technical knowledge while they are still in school. Having this talent made American
companies shift their focus to children that means they wanting to hire younger employees
(Howe & Strauss, 2000).
According to Howe and Strauss (2000), the Millennials are confident, rule followers,
racially and ethnically diverse, optimistic and cooperative team players, while the Baby Boomers
display individualistic characteristics and Generation X parents have a tendency to be
pessimistic. Millennials are very much interested in making “parallel careers”, as compared to
Boomers who are highly motivated to build “stellar careers”, and Generation Xers who are
seeking to build “portable careers” (Lancaster & Stillman, 2002). For the Millennials,
maintaining “parallel careers” does not mean that they are job-hoppers, as defined by Generation
Xers. The Millennials are multitaskers and more apt to recycle their skills and talents that enable
them to learn several jobs simultaneously, and personal preferences in order to keep up with their
organizations’ evolving structure (Lancaster & Stillman, 2002).
The Millennials expect further supervision and feedback (Sandeen, 2008; Wiedmer,
2015), mentoring, and appreciate being graded, evaluated, and ranked throughout their lives
(Sandeen, 2008). According to Lancaster and Stillman (2002), however, technology has become
a big factor in the work lives of Millennials, in which they can easily access information that
they need to know rather than asking their mentors when something goes wrong. Zemke et al.
(2000) asserted that the Millennials’ ability to use technology will make them the best-educated
generation, as compared to others.

22
Entrepreneurship and Traits
Entrepreneurs from different generations and entrepreneurial traits were the focus of this
research study. The topic of entrepreneurship is not a new phenomenon and its reputation is ever-
increasing in the business field. Conceptualizing the term entrepreneurship has been ongoing
since 1755 (Banda, 2007) by numerous scholars to contribute new definitions, terms, and
beneficial information into different disciplines. However, interest in entrepreneurship has never
been greater than in the twenty-first century (Zimmerer & Scarborough, 2005). As Zimmerer and
Scarborough predicted back in 2005, the future of entrepreneurial activity is outstanding as
entrepreneurs continue launching their businesses at high levels. This has caused large
companies to continue downsizing and focusing on transitioning to small-businesses in order to
sustain market share. Interest in entrepreneurship has steered many researchers toward consensus
on the importance of entrepreneurial activity in promoting considerable local economic growth,
enhancing quality of life, expanding the job market, reduction in poverty, and unemployment
rates in the U.S. economy (Audretsch, 2002; Banda, 2007; Batabyal & Nijkamp, 2012;
Bednarzik, 2000; Brereton, 1974; Decker et al., 2014; Demirci, 2013; Galindo & Picaz, 2013;
Glaeser, Kerr, P., & Kerr, 2015; Longenecker & Schoen, 1975; Minniti, 2008; Picazo, Martin, &
Soriano, 2012; Rupasingha & Goetz, 2013; Stephens et al., 2013; Zimmerer & Scarborough,
2005). This literature review was designed to contribute to our understanding of entrepreneurship
and entrepreneurial traits as described by Caird (2006).
According to Hisrich (2014), the definition of entrepreneurship tends to vary depending
on whether it is viewed from an economic, psychological, anthropological, historical,
sociological, or management perspective. Hisrich (2014) stated entrepreneurship from these
different disciplines in the following definition:
23
To an economist, an entrepreneur is one who brings resources, labor, materials and other
assets into combinations that make their value greater than before, and also one who
introduces changes, innovations and a new order. To a psychologist, such a person is
typically driven by certain forces- need to obtain or attain something, to experiment, to
accomplish or perhaps to escape authority of others. To one businessman, an entrepreneur
appears as a threat, an aggressive competitor, whereas to another businessman, the same
entrepreneur may be an ally, a source of supply, a customer or someone who creates
wealth for others, as well as finds better ways to utilize sources, reduces waste, and
produces jobs others are glad to get. (p. 8)
Regardless of how different disciplines describe what entrepreneurship means, in the
phase of this literature review, the study focused solely on the characteristics of entrepreneurs. It
is commonly agreed and statistically proven with statistical hypothesis tests (p ˂ .05) by many
scholars that entrepreneurs take risks (Estay et al., 2013; Lazear, 2005; Zhao, Seibert, &
Lumpkin, 2010; Zimmerer & Scarborough, 2005), have a high tendency toward innovation
(Audretsch, 2002; Banda, 2007; Batabyal & Nijkamp, 2012; Brereton, 1974; Dada et al., 2015;
Estay et al., 2013; Galindo & Picazo; Stephens et al., 2013; Olson, 1987; Scales, 2011), are self-
employed (Banda, 2007; Bednarzik, 2000; Lazear, 2005; Rupasingha & Goetz, 2013), are profit
and growth oriented (Banda, 2007; Estay et al., 2013; Galindo & Picazo, 2005; Longenecker &
Schoen, 1975; Olson, 1987; Sadeghi, 2008; Shane & Venkataraman, 2000; Zhao et al.,2010;
Zimmerer et al., 2008), and have a higher sense of self-efficacy or confidence (Brereton, 1974;
Dada et al., 2015; Estay et al., 2013; Morris et al., 2013; Lyons et al., 2015; Macko & Tyszka,
2009).
To examine the entrepreneurial characteristics of the generations of entrepreneurs in the
Southwest (San Antonio), Northeast (Dallas), Center (Austin), and Southeast (Houston) Texas
metropolitan regions of the United States, GET2 test, that was redeveloped in 2006 by Caird,
was adopted to determine the differences and similarities, in the context of enterprising tendency,
among Baby Boomers, Generation Xers, and Millennials. According to Caird (2006),

24
enterprising persons share entrepreneurial characteristics. Parallel to this, GET2 test, also
measures key characteristics of entrepreneurial people who are associated with entrepreneurial
behavior and the entrepreneurial act itself. The key characteristics of entrepreneurs which are the
five dependent variables for this study are: need for achievement, need for autonomy, creative
tendency, calculated risk-taking, and locus of control.
Need for achievement. McClelland (1953) asserted that entrepreneurs with high
motivation are characterized by the need for achievement by which entrepreneurs are driven (as
cited in Caird, 1990a). The need for achievement associated with motivation stems from an
individual’s desire for excellence while excellence is derived from personal accomplishments
(Caird, 2006; Johnson, 1990; Nistler, Lamm, & Stedman, 2011). As a foundation of motivation,
the need for achievement is recognized as an important characteristic of entrepreneurs (Demirci,
2013). Entrepreneurs with a high need for achievement score have a strong desire to be
successful and are highly committed to getting things done (Caird, 2006). Previous research
studies conducted by several scholars indicated that there is a significant relationship between
the need for achievement and entrepreneurship (Collins, Hanges, & Locke, 2004; Johnson, 1990;
Shaver, 1995). McClelland (1968) underlined that the high need for achievement is associated
with certain attributes. For example, possessing self-awareness, determination, motivation, and
decision making abilities, and being energetic, innovative, a risk-taker, and responsible (as cited
in Caird, 1990a).
Need for autonomy. According to Watkins (1976), in Caird, 1990a, the need for
autonomy is the strongest reason for entrepreneurs to start a business. Broeck, Vansteenkiste,
Witte, Soenens, and Lens (2010) defined autonomy as the inherent need or desire of individuals
to feel volitional and to experience a sense of choice and psychological freedom when

25
performing an intended task to be accomplished. Hackman and Oldham (1976) defined
autonomy as “substantial freedom, independence and discretion to the individual in scheduling
the work and in determining the procedures to be used in carrying it out” (as cited in Broeck et
al., 2010, p. 258). Entrepreneurs with test results showing a high need for autonomy often
display dissatisfaction and a feeling of discomfort when expected to work within the constraints,
boundaries, and business rules that were previously established (Demirci, 2010). According to
the 2006 research results by Caird, and the 2008 results by Raposo, Paco, and Ferreira,
entrepreneurs with a high need for autonomy are independent, that is, preferring to work alone,
self-expressive, individualistic and unresponsive to group pressure, leaders, unconventional,
opinionated, and determined.
Creative tendency. The entrepreneurial trait of creative tendency is one of the core
driving forces that plays a crucial role that is associated with innovation and entrepreneurship
(Caird, 2006; Demirci, 2010). According to Caird (1991a), the definition of creative tendency
should involve imagination, innovation, curiosity, and versatility. Demirci (2010) described
successful entrepreneurs as “those who can develop new ideas, seize the gaps in the market and
create value through bringing ideas and resources together in a different way” (p. 24). An
enterprising person should have a broad horizon regarding new ideas, new products and
processes such as new technologies, businesses, projects, organizations, have a tendency for
constructive problem solving, and look at life in a different way from others (Caird, 2006).
Calculated risk-taking. As it has been discussed earlier in the literature phase, one of the
very inherent parts of entrepreneurial behaviors is risk-taking. The role of risk in entrepreneurial
behavior was first pointed out by Cantillon in 1755 (as cited in Caird, 1991a; Zhao et al., 2010).
Entrepreneurs who are wise and calculate and assess the risk involved in the initiative, often take
26
into consideration the risk-taking option when their decisions are made under uncertainty, driven
by the lack of knowledge and information (Demirci, 2010). Atkinson (1957), as cited in Caird
(1991a), underlined the importance of being a moderate risk-taker by suggesting that it is a
function of strength of the motive to achieve or avoid failure which, according to Demirci
(2010), differentiates between gambling and calculated risk- taking. According to Caird (2006),
an enterprising person should be opportunistic and be seeking information and expertise when
taking risks as these characteristics would be valued in any initiative. Entrepreneurs who are
scored as high calculated risk-takers have the following qualities: decisiveness, self-awareness,
are analytical and goal-oriented, and possess effective information management skills (Caird,
2006).
Locus of control. Reviewing the literature on entrepreneurial traits, many scholars have
made important contributions to enterprising tendency in the locus of control. This psychological
behavior is known as one of the dominant psychological traits in which individuals have control
over their own life and are responsible for the outcomes of the decisions they make (Dada et
al.,2015; Demirci, 2010; Lyons et al., 2015). Weinstein (1969) argued that individuals with an
internal locus of control tend to be responsible for successes and failures, and attribute outcomes
to his or her own ability and effort while individuals with an external locus of control attribute
outcomes to task ease or difficulty, luck, fate, the influence of powerful others (such as doctors,
the police, or government officials) or being in the right place at the right time (as cited in Caird,
1991a). Beugelsdijk (2007) stated that “success is not a matter of luck and having connections,
but of hard work” (p.196). According to Caird (2006), individuals with an internal locus of
control are opportunistic, self-confident, proactive, determined and express a strong-willed
control over life, and self-belief, that is, equating the results achieved with the effort made.

27
Theoretical Framework
In the literature review, two different topics, generations and entrepreneurship traits, were
described through the point of view of several scholars, from a variety of disciplines such as
psychology, anthropology, sociology, and economics. The results of previous research studies
conducted by those scholars have made substantial contributions to this research study in the
context of definitions of generations, entrepreneurship, and entrepreneurship traits. Enterprising
Tendency Theory is the selected theoretical framework for this study. This theory which was
chosen in an effort to test the theory, resulting from prior research findings, on entrepreneurship
traits.
The idea of When Generations Collide that was designed by Lancaster and Stillman
(2002) was adopted for this research study to understand how the different generations think,
understand one another and act in the workplace. According to Lancaster and Stillman (2002),
bridging the generation gaps at work by understanding the differences can provide a colossal
advantage when it comes to recruiting, retaining, managing, and motivating before or after
generations. Lancaster and Stillman’s (2002) theory was described in the literature review as a
set of distinctive characteristics among the three generations of Baby Boomers, Generation Xers,
and Millennials.
The theory of Enterprising Tendency (trait theory) that was created and developed by
Caird (2006) was addressed in this correlational research study. The entrepreneurial trait theory
claims that the entrepreneurs have distinctive perceivable psychological characteristics that can
be nurtured via education and training, and assessment through GET2 test. The test that
reliability and validity were proofed by many scholars includes five dependent variables that are
need for achievement, need for autonomy, creative tendency, calculated risk-taking, and locus of

28
control with 50 questions. According to Caird (2006), individuals can involve themselves in an
enterprise activity when they are highly motivated (to achieve something themselves) by a good
idea and will manage risks, information and uncertainties because they believe they can succeed.
Summary
The literature review aimed to provide an in-depth understanding of three generations of
entrepreneurs, entrepreneurial traits, and how entrepreneurs from different generations
distinguish themselves in entrepreneurial traits. The chapter of literature review has been broken
down into two categories: Generations and entrepreneurial traits. In the first phase of the
literature review, differences between generations were introduced to readers respectively as
Baby Boomers, Generation Xers, and Millennials.
The literature review began with the definition of generation. It was generally agreed by
many well-known generational scholars upon the definition of generation. According to scholars,
generations display different characteristics behavior from each other in values and views,
workplace aspirations and perspectives, politics, music, sport, and disappointments etc.
However, still, generations that were born in the same time period share common historical
experiences, economic and social conditions, and technological advances. Generational literature
focused entirely on portraying the three different generations and how to differ and manage those
generations in the workplace (Table 2). Understanding the gap among the different generations
of entrepreneurs could help out many organizations in the context of increasing recruitment,
retention, and productivity. Because, as Zemke et al. (2000) pointed out, each generation
displays distinctive work ethics, perspectives on work, managing and idiosyncratic styles, and
approach to work-world issues such as quality, and service.
29
Shifting to the entrepreneurial literature, entrepreneurship and entrepreneurial traits were
the focus of the study. It is also generally agreed by many scholars from a wide array of
disciplines upon the importance of entrepreneurial activity in promoting considerable local
economic growth, enhancing quality of life, expanding the job market, reduction in poverty, and
unemployment rates in the U.S. economy. It is commonly and statistically proven with statistical
hypothesis tests (p ˂ .05) by many scholars that entrepreneurs take risks, have a high tendency
toward innovation, are self-employed, are profit and growth oriented, and have a higher sense of
self-efficacy or confidence.
Finally, to end this chapter, entrepreneurial traits: need for achievement, need for
autonomy, creative tendency, calculated risk-taking, and locus of control were addressed (Table
3). To summarize all, need for achievement, as an important characteristic of entrepreneurs,
refers to motivation which stems from an individual’s desire for excellence. The need for
autonomy is attributed to psychological freedom and being independent when performing an
intended task to be accomplished. Creative tendency, one of the core driving forces, refers to
imagination, innovation, curiosity, and versatility. Calculated risk-taking, one of the integral
parts of entrepreneurial behaviors, is an essential factor for entrepreneurs when their decisions
are made under uncertainty, driven by the lack of knowledge and information. And lastly, locus
of control was addressed in the literature. In this entrepreneurial trait, individuals have control
over their own life and are responsible for the outcomes of the decisions they make. Individuals
with a high internal locus of control score believe in being responsible for successes and failures,
and attribute outcomes to his or her own ability and effort. Alternatively, individuals with an
external locus of control attribute outcomes to task ease or difficulty, luck, fate, powerful others
or being in the right place at the right time.

30
Table 2
Lancaster and Stillman’s Generational Differences
Factor
Attitude
Baby Boomers
Optimistic
Generation Xers
Skeptical
Millennials
Realistic
Overview They believe in possibilities,
and often idealistically strive
to make a positive difference
in the world. They are also
competitive and seek ways to
change the system to get
ahead.
The most misunderstood
generation, they are very
resourceful and independent and
do not depend on others to help
them out.
They appreciate diversity,
prefer to collaborate instead
of being ordered, and are very
pragmatic when solving
problems.
Description
Numbered at 80 million, the
largest of the groups, Boomers
were born between 1946 and
1964. They were influenced by
Martin Luther King, JFK,
Gloria Steinem, and The
Beatles. Places such as the
Hanoi Hilton, Woodstock, and
Kent State resonate for this
group. Television changed
their world dramatically. In
general, they can be described
as optimistic. This was the
generation that believed
anything was possible— that
they really could change the
world.
Born between 1965 and 1980,
this relatively small (46 million)
segment of the workforce saw
the likes of Bill Clinton, Al
Bundy, Madonna, Beavis and
Butthead, and Dennis Rodman
make headlines during their
formative years. Their world
shape changed to include the
former Soviet Union,
Lockerbie, Scotland, and the
Internet—in fact, this is the
generation that, more than any
other, is defined by media and
technology. For Gen- Xers, the
watchword is skepticism—this
group puts more faith in the
individual, in themselves, than
in any institution, from marriage
to their employer.
The youngest members of
what will be the next Boomer
wave, some 76 million
Millennials were born
between 1981 and 1999.
Although they are just starting
to trickle into the workforce,
this group grew up with
everybody from Prince
William to Winky Tinky,
Felicity, Marilyn Manson,
Venus and Serena Williams,
and Britney Spears. They
have already lived through
Columbine, the Columbia
Space Shuttle disaster, and
September 11. Stillman and
Lancaster describe this group
as realistic, confident, and
pragmatic. Raised by
optimistic Boomers,
Millennials feel empowered to
take positive action when
things go wrong.
Work
Habits
-They have an optimistic
outlook.
-They are hard workers who
want personal gratification
from the work they do.
-They believe in self-
improvement and growth
-They are aware of diversity and
think globally.
-They want to balance work
with other parts of life. They
tend to be informal.
-They rely on themselves.
-They are practical in their
approach to work.
-They want to have fun at work.
-They like to work with the
latest technology.
-They have an optimistic
outlook.
-They are self-assured and
achievement focused.
-They believe in strong
morals and serving the
community.
-They are aware of diversity.
Note. From Handbook of Research on Educational Communications and Technology (p. 301) by
Spector, J. M., 2008, New York: Lawrence Erlbaum Associates. Copyright (2008) by Taylor &
Francis Group, LLC.

31
Table 3
Entrepreneurial Trait Scores
Low Medium High
Need for
achievement
Low score is ranked
between 0-6.
Achievement may not
be one of your high
priorities. Perhaps
setting up and running
an enterprise would be
too much hard work
and commitment.
Perhaps you prefer to
take life at a more even
pace.
Medium score is ranked
between 7-9. You probably
wish to consider ‘tried and
tested’ enterprising ideas that
fit in with your lifestyle.
High score is 10-12.
- An orientation towards the future,
-Reliance on your own ability,
- An optimistic rather than a
pessimistic outlook,
- A strong task orientation,
- Effective time management,
- Results-oriented with yourself and
others,
- Restlessness, driven and energetic,
-Opinionated in defense of your
ideas and views,
-Determination to ensure your
objectives are met even when
difficulties arise,
-Responsible and persistent in
pursuit of aims,
-Oriented towards challenging but
realistic goals,
-Willingness to work long and hard
when necessary to complete tasks.
Need for
autonomy
Low sore is ranked
between 0-2. You
probably prefer to be
advised about managing
your work and would
not enjoy the
responsibility of taking
charge of an enterprise.
Medium score is ranked
between 3. You may be
happy to work as an
intrapreneur as a valuable
member of an organizational
team. If you start your own
enterprise, you may need to
cultivate Stronger
independent leadership
qualities. Starting a business
is not the only option for you.
You would be probably
equally happy to work as an
employee as part of an
organizational team or on
your own projects.
High core is 4-6.
-Independence, preferring to work
alone especially if you cannot be
top dog,
-Self expressive, feeling a strongly
need to do your own thing your
way, rather than work on other
people’s projects,
-Individualistic and unresponsive to
group pressure,
- Leadership, preferring to be in
charge and disliking taking orders,
- Unconventional, and prepared to
stand out as being different to
others,
- Opinionated, having to say what
you think and make up their own
mind about issues,
- Determination, strong willed and
stubborn about your interests.
Creative
tendency
Low score is ranked
between 0-6. You
would probably look to
others for
entrepreneurial ideas
but are probably content
with proven, traditional
approaches to business
Medium score is ranked
between 7-9. You probably
wish to consider tried and
tested enterprising ideas that
are more straightforward to
implement and fit in with
your lifestyle.
High score is 10-12.
- Imaginative, inventive or
innovative tendency to come up
with new ideas,
- Intuitive, being able to synthesis
ideas and knowledge, and make
good guesses when necessary,
- Change-orientated, preferring
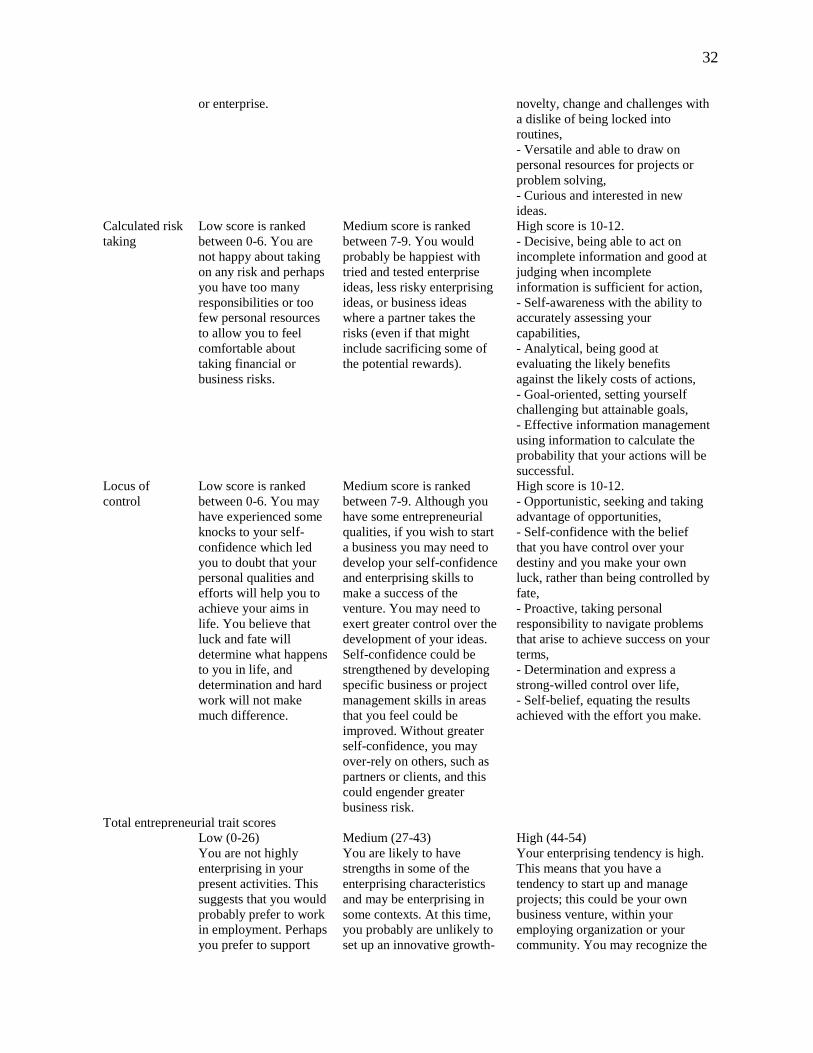
32
or enterprise. novelty, change and challenges with
a dislike of being locked into
routines,
- Versatile and able to draw on
personal resources for projects or
problem solving,
- Curious and interested in new
ideas.
Calculated risk
taking
Low score is ranked
between 0-6. You are
not happy about taking
on any risk and perhaps
you have too many
responsibilities or too
few personal resources
to allow you to feel
comfortable about
taking financial or
business risks.
Medium score is ranked
between 7-9. You would
probably be happiest with
tried and tested enterprise
ideas, less risky enterprising
ideas, or business ideas
where a partner takes the
risks (even if that might
include sacrificing some of
the potential rewards).
High score is 10-12.
- Decisive, being able to act on
incomplete information and good at
judging when incomplete
information is sufficient for action,
- Self-awareness with the ability to
accurately assessing your
capabilities,
- Analytical, being good at
evaluating the likely benefits
against the likely costs of actions,
- Goal-oriented, setting yourself
challenging but attainable goals,
- Effective information management
using information to calculate the
probability that your actions will be
successful.
Locus of
control
Low score is ranked
between 0-6. You may
have experienced some
knocks to your self-
confidence which led
you to doubt that your
personal qualities and
efforts will help you to
achieve your aims in
life. You believe that
luck and fate will
determine what happens
to you in life, and
determination and hard
work will not make
much difference.
Medium score is ranked
between 7-9. Although you
have some entrepreneurial
qualities, if you wish to start
a business you may need to
develop your self-confidence
and enterprising skills to
make a success of the
venture. You may need to
exert greater control over the
development of your ideas.
Self-confidence could be
strengthened by developing
specific business or project
management skills in areas
that you feel could be
improved. Without greater
self-confidence, you may
over-rely on others, such as
partners or clients, and this
could engender greater
business risk.
High score is 10-12.
- Opportunistic, seeking and taking
advantage of opportunities,
- Self-confidence with the belief
that you have control over your
destiny and you make your own
luck, rather than being controlled by
fate,
- Proactive, taking personal
responsibility to navigate problems
that arise to achieve success on your
terms,
- Determination and express a
strong-willed control over life,
- Self-belief, equating the results
achieved with the effort you make.
Total entrepreneurial trait scores
Low (0-26) Medium (27-43) High (44-54)
You are not highly
enterprising in your
present activities. This
suggests that you would
probably prefer to work
in employment. Perhaps
you prefer to support
You are likely to have
strengths in some of the
enterprising characteristics
and may be enterprising in
some contexts. At this time,
you probably are unlikely to
set up an innovative growth-
Your enterprising tendency is high.
This means that you have a
tendency to start up and manage
projects; this could be your own
business venture, within your
employing organization or your
community. You may recognize the
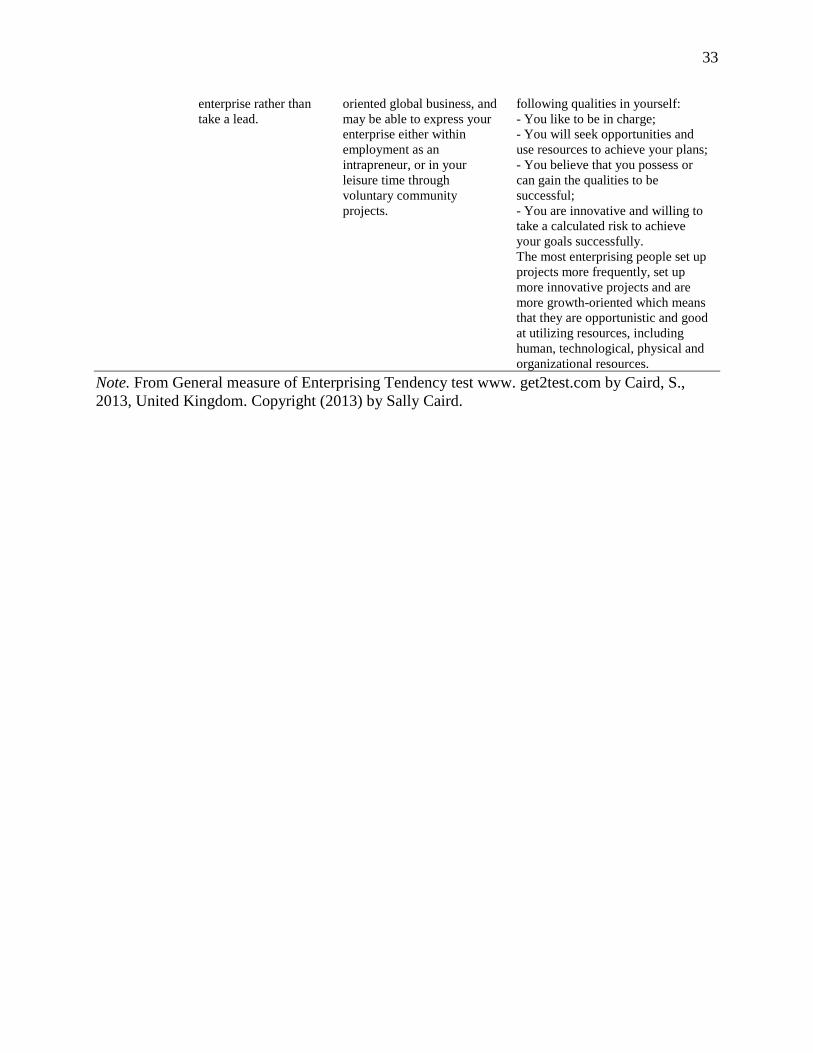
33
enterprise rather than
take a lead.
oriented global business, and
may be able to express your
enterprise either within
employment as an
intrapreneur, or in your
leisure time through
voluntary community
projects.
following qualities in yourself:
- You like to be in charge;
- You will seek opportunities and
use resources to achieve your plans;
- You believe that you possess or
can gain the qualities to be
successful;
- You are innovative and willing to
take a calculated risk to achieve
your goals successfully.
The most enterprising people set up
projects more frequently, set up
more innovative projects and are
more growth-oriented which means
that they are opportunistic and good
at utilizing resources, including
human, technological, physical and
organizational resources.
Note. From General measure of Enterprising Tendency test www. get2test.com by Caird, S.,
2013, United Kingdom. Copyright (2013) by Sally Caird.
34
Chapter Three––Methodology
Overall Approach and Rationale
Chapter 3 elaborated on and justifies the intended research methodology utilized in a
descriptive study of generationally different entrepreneurs with small business owners in Texas’
metropolitan regions in the United States. The population in the study included entrepreneurs
with small business owners who are currently living in Southwest (San Antonio), Northeast
(Dallas), Center (Austin), and Southeast (Houston), Texas. And sample will be drawn from EO.
The target participants were presented to review and acknowledge a detailed consent form,
which asked them if they were willing to participate in the study. All respondents that
participated in the study were held in confidence. This research study intended to analyze three
different generations of entrepreneurs (Baby Boomers, Generation Xers, and Millennials) and
their entrepreneurial traits through GET2 test to investigate how generations differ from one
another in entrepreneurial traits. This study was a quantitative research study, in which
correlation was analyzed between the generations and entrepreneurial traits. The reason of
relying on the quantitative research was that the numerical demonstration of collected data
provides a more articulate interpretation of the phenomena.
Creswell (2012) underlined the importance of the quantitative method approach that is
the process of collecting, comparing groups, analyzing, interpreting, and documenting the results
of an intended study, using statistical analysis by comparing acquired results with prior
predictions and past research, while qualitative research method is designed for an inquiry
approach useful for exploring and understanding a central phenomenon. In this quantitative
research study, the objective hypothesizes by examining the relationship among variables were
35
measured, typically through instruments, so that numbered data were analyzed using statistical
procedures.
The study rejected the applicability of an experimental design, because there were no
attempts to manipulate any of the independent variables (Creswell, 2012). However, a
descriptive research was the most suitable design to investigate the problem. According to
Creswell (2012), descriptive research design helps researchers indicate and summarize general
tendencies in the data. For example, mean, mode, and median, provide an understanding of how
spread of scores, such as variance, standard deviation, and range, and provide insight into a
comparison of how one score relates to all others such as z scores and percentile rank.
A quantitative descriptive study was utilized as an appropriate research design and
research method to describe the enterprising tendencies of three different generations of
entrepreneurs by collecting, analyzing, and interpreting data to acquire empirical evidence. The
research was a contribution to the business academic studies about competences of today’s
generations of Baby Boomers, Generation Xers, and Millennials entrepreneurs in need for
achievement, need for autonomy, creative tendency, calculated risk-taking, and locus of control.
In this quantitative study, reliable and valid survey instruments were used to collect data from
participants who are currently associated with EO in Southwest (San Antonio), Northeast
(Dallas), Center (Austin), and Southeast (Houston), Texas.
Setting
San Antonio is located on an area of 368.6 square miles in South Central Texas, at
approximately 140 miles northwest of the Gulf of Mexico, and 150 miles northeast of the city of
Laredo on the Mexican border (San Antonio Chamber of Commerce [SACC], 2016). The Milken
Institute and The Brookings Institute have recognized the city of San Antonio as one of 2015’s
36
best-performing cities and the strongest-performing economies among the 100 largest
metropolitan areas in the United States, as the city is ranked as number one in growing strong,
doing business, high employment and low unemployment levels (as cited in San Antonio
Economic Development foundation [SAEDF], 2016). According to SAEDF, City of San
Antonio, and SACC (2016), San Antonio, the seventh largest city in the United States. and the
second largest in Texas, is anticipated to grow at an annual pace of about 4% and grew by 8%
between 2010 and 2016, as the city is projected to grow an additional 7% through the year 2021.
Diversity is the key factor of the city’s robust economic structure, as it can help work with
diverse cultures (SACC and City of San Antonio, 2016). Its strategic and accessible geographic
location have enabled the city to play a dynamic role in both commerce and culture between the
east and west coasts and the Gulf of Mexico (City of San Antonio, 2016). The city’s growth
industries include: aerospace, financial services, government and military, healthcare &
biosciences, hospitality & entertainment, information technology and cybersecurity,
manufacturing, transportation and logistics (City of San Antonio & SAEDF, 2016).
According to U.S. Bureau of Labor Statistics (2016), San Antonio’s civilian labor
workforce in July 2016 was 1,125,996 with an associated unemployment rate of 4% which is
representing approximately 59,000 people as the city holds a population of 1,469,845 people
(U.S. Census Bureau, 2016). Furthermore, 15 area colleges and universities graduate
approximately 25,000 students that enter the workforce each year (SAEDF, 2016). Given the
importance of doing business in San Antonio, the GET2 survey, data collection and analysis was
conducted in the southwest US metropolitan region, San Antonio, Texas.
According to city of Houston, Houston is the fourth most populous city in the nation
(trailing only New York, Los Angeles and Chicago), and is the largest in the southern U.S. and

37
Texas. Houston has a 2015 population of 2,296,224 million and covers 8,778 square miles (U.S.
Census Bureau, 2016). According to U.S. Census Bureau (2016), the metro area's population of
5.95 million in 2010 is 6th largest among U.S. cities. If Houston were an independent nation, it
would rank as the world's 30th largest economy (City of Houston, 2016). According to U.S.
Bureau of Labor Statistics (2016), Houston has reached second in employment growth rate and
fourth in nominal employment growth among the 10 most populous metro areas in the United
States. In 2006, the Houston metropolitan area was featured first in Texas and third in the United
States within the category of “Best Places for Business and Careers” in Forbes magazine (City of
Houston, 2016). Houston hosts more than 5,000 energy related firms and is considered by many
as the Energy Capital of the world. Houston's economy has a broad industrial base in the energy,
aeronautics, and technology industries and 23 Fortune 500 companies are headquartered in
Houston (City of Houston, 2016). The Port of Houston is the 9th largest port in the world. The
Port handled 220 million short tons of domestic and foreign cargo in 2010 (City of Houston,
2016).
Dallas is the 3rd largest city in Texas and the 9th largest city in the United States, and is
located at the center of the Dallas-Fort Worth-Arlington metropolitan area (City of Dallas, 2016).
Dallas has a 2015 population of 1,300,092 and covers 6,490 square miles (U.S. Census Bureau,
2016). According to Encyclopedia.com (2016), Dallas has become a financial and cargo center
serving the oil wells after oil discovery in 1930 in east Texas which caused a boost in the Dallas
economy. According to Dallas Regional Chamber (2016), Dallas-Fort Worth holds about 43% of
the state's high tech workers, along with 13 privately-held companies which are headquartered in
the area, with at least $1 billion in annual revenues. City of Dallas (2016) reported that Dallas
entered the 21st century a center for banking, oil, cotton, and high technology.
38
The capital of Texas, Austin, is the 14th largest city in the United States and is located in
central Texas (AustinTexas.gov, 2016). Austin has a 2015 population of 931,830 and covers
271.8 square miles (U.S. Census Bureau, 2016). According to AustinTexas.gov (2016), Austin
hosts many high-tech and other companies, such as Forestar Group and Whole Foods Market,
which are headquartered here; AMD, Apple, Broadcom, Google, IBM, Intel, Qualcomm,
ShoreTel, Synopsys and Texas Instruments have prominent regional offices here. According to
U.S. Census Bureau (2016), Austin is the nation’s second fastest growing economy with a GDP
at a 5 percent rate in 2015.
Research Strategy
In this quantitative study, the researcher aimed to describe the major characteristics and
objectives of this qualitative research under three chapters; the introduction, the review of the
literature, and the methods (Creswell, 2012). In Chapter 1, purpose statements, research
questions, and hypotheses, which are supported by the literature review (Chapter 2) to justify the
importance of the research problem and provide a rationale for the purpose of the study.
Research questions and hypotheses were designed as specific, narrow, and measurable in order
to collect, analyze, interpret, and compare numeric data using statistical analysis from a large
number of population, using the GET2 survey instrument with preset questions (Creswell, 2012).
The research strategy of the proposal is followed by Chapter 3, the research methodology, on the
basis of detailing the research study’s overall approach and rationale, setting, research strategy,
participants, instrumentations, data collection, ethical considerations, and data analysis.
A quantitative research study was performed in order to investigate the relationship
between generations and entrepreneurial traits. This quantitative descriptive research study,
specifically, aimed to understand to what extent generations of entrepreneurs display similarities
39
and differences in entrepreneurial traits. Using statistical analyses to describe critical
characteristic traits of different generations of entrepreneurs, the study provided a description of
the enterprising tendencies of San Antonio based entrepreneurs who deal with operating small-
business companies as self-employers. According to Creswell (2012), quantitative data help
researchers measure variables, provide particular numbers and results which assess the frequency
and magnitude of trends, and present beneficial information to describe trends about a large
number of people.
Participants. The process of selecting the appropriate individuals from a certain
population as representative data is known as sampling (Creswell, 2012; Sekaran & Bougie,
2013). In this quantitative descriptive research study, samples which enable researchers to draw
conclusions that are generalizable to the population was meticulously selected from a population
of entrepreneurs at EO to apply and generalize the results from a small number of people to the
entire different generations of entrepreneurs (Creswell, 2012; Sekaran & Bougie, 2013).
According to Alreck and Settle (2004), “only a small fraction of the entire population usually
represents the group as a whole with enough accuracy to base decisions on the results with
confidence” (p.55). Each entrepreneur who are legally registered at EO in the southwest US
metropolitan region, had an equal chance of being selected as sample subjects in the population
that is called probability sampling (Creswell, 2012; Sekaran & Bougie, 2013).
The participants of interest in the research study consisted of three different generations:
Baby Boomers, Generation Xers, and Millennials of entrepreneurs that operate small-business
within fewer than 500 employees in major cities, Texas. Data was acquired using a web-based
tool (Survey Monkey) in Southwest (San Antonio), Northeast (Dallas), Center (Austin), and
Southeast (Houston) in metropolitan region, Texas with the titles of entrepreneur at EO. The
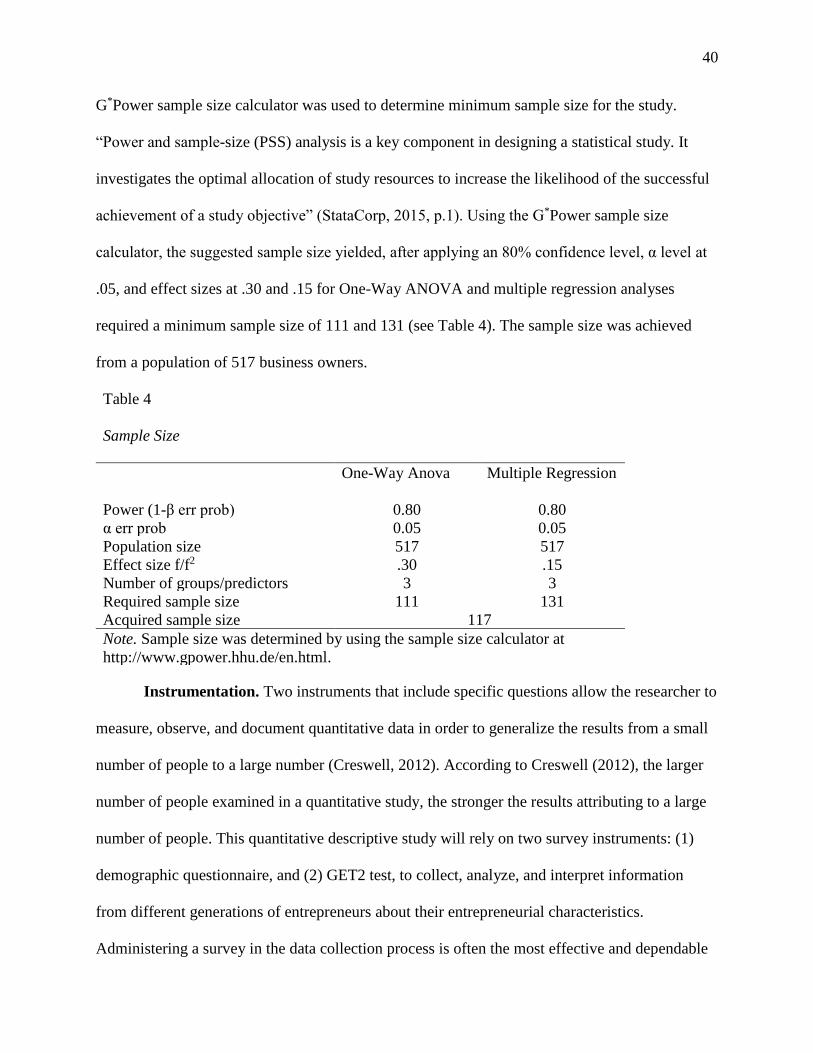
40
G*Power sample size calculator was used to determine minimum sample size for the study.
“Power and sample-size (PSS) analysis is a key component in designing a statistical study. It
investigates the optimal allocation of study resources to increase the likelihood of the successful
achievement of a study objective” (StataCorp, 2015, p.1). Using the G*Power sample size
calculator, the suggested sample size yielded, after applying an 80% confidence level, α level at
.05, and effect sizes at .30 and .15 for One-Way ANOVA and multiple regression analyses
required a minimum sample size of 111 and 131 (see Table 4). The sample size was achieved
from a population of 517 business owners.
Table 4
Sample Size
One-Way Anova Multiple Regression
Power (1-β err prob) 0.80 0.80
α err prob 0.05 0.05
Population size 517 517
Effect size f/f2 .30 .15
Number of groups/predictors 3 3
Required sample size 111 131
Acquired sample size 117
Note. Sample size was determined by using the sample size calculator at
http://www.gpower.hhu.de/en.html.
Instrumentation. Two instruments that include specific questions allow the researcher to
measure, observe, and document quantitative data in order to generalize the results from a small
number of people to a large number (Creswell, 2012). According to Creswell (2012), the larger
number of people examined in a quantitative study, the stronger the results attributing to a large
number of people. This quantitative descriptive study will rely on two survey instruments: (1)
demographic questionnaire, and (2) GET2 test, to collect, analyze, and interpret information
from different generations of entrepreneurs about their entrepreneurial characteristics.
Administering a survey in the data collection process is often the most effective and dependable
41
way to gather information from a group or population (Alreck & Settle, 2004). According to
Fink (2003), “a survey is a system for collecting information from or about people to describe,
compare, or explain their knowledge, attitudes, and behavior” (as cited in Sekeran & Bougie,
2013, p.102).
GET2 test was adopted for this quantitative descriptive study to investigate the
similarities and differences between generations of entrepreneurs and entrepreneurial traits in
Southwest (San Antonio), Northeast (Dallas), Center (Austin), and Southeast (Houston) at EO.
The reason of selecting the GET2 test for this study is that the test is generally recognized as one
of the most useful, comprehensive, easy to access, administer, and score measures of
entrepreneurial potential (Demirci, 2013; Lyons et al., 2015; Kirby & Ibrahim, 2011). Caird
(2006) claimed that enterprising people with high entrepreneurial tendency scored high in GET2
test which was demonstrated in terms of validity and reliability in previous studies by other
scholars (Caird, 1990a, 1991a, 1993, 2006; Dada et al., 2015; Demirci, 2013; Estay et al., 2013;
Lyons et al., 2015) and development consultancies around the world. Caird’s (1991a, 1991b)
findings demonstrated the construct validity and reliability of the test that was established by
testing the measure on occupational groups. Findings were reported that entrepreneurs were
significantly more enterprising than teachers, nurses, civil servants and clerical workers and
lecturers and trainers, using t-tests for statistical analysis (p ˂ .05).
As an additional supportive data from the subjects, the demographic data was gathered
via email using a demographic questionnaire which is comprised of a one page source of general
information about subjects. Alreck and Settle (2004) asserted the importance of the demographic
data in a research study that is “demographics can be used to identify segments, groups,
audiences, or constituencies of people who are both identifiable and behave in similar ways”
42
(p.24). Demographic questions covered gender, age, race, education level, type of business,
number of years as a small business owner, and number of employees in a multiple choice
format.
An approval was obtained from Institutional Review Board (UIW). The data was
gathered via Survey Monkey including a consent letter, a demographic questionnaire, GET2
(Caird, 2006) test to measure generations of entrepreneurs’ entrepreneurial traits. GET2 test is
designed to measure five common traits of entrepreneurship: Need for achievement, need for
autonomy, creative tendency, calculated risk-taking, and locus of control. GET2 test consists of a
54 item questionnaire that is measured on a two point scale where A for ‘Tend to Agree’, D for
‘Tend to Disagree.
Data collection. “Data collection methods are an integral part of research design”
(Sekaran & Bougie, 2013, p.116). In quantitative data collection, the use of an instrument such as
a questionnaire is one effective, dependable, and simple way to measure, observe, and document
information (Alreck & Settle, 2004; Creswell, 2012). Participants with the titles of entrepreneurs
were given the opportunity to participate in this study by filling out an online questionnaire that
was distributed via email. The sample size was obtained by sending an online invitation link via
Internet on social-media to 517 small business owners entrepreneurs and asking them to
participate the online questionnaire software (Survey Monkey). The online questionnaire
included a consent letter, asking whether or not participants would like to participate in this
study, along with contact information if participants have possible questions, or additional
questions and to report a problem that may be related to this study, demographic questionnaire,
and a 54-item questionnaire. The internet was a main means for accessing the link to the
questionnaire. The duration of the questionnaire could be no longer than 10 minutes and there are

43
no more than minimal risks associated with their participation in this research. Participants were
not asked to provide their name or local address information to insure anonymity. The survey
was sent to over 500 entrepreneurs in Southwest (San Antonio), Northeast (Dallas), Center
(Austin), and Southeast (Houston) in metropolitan region, Texas. The data that was gathered by
the questionnaire were analyzed in the section of descriptive statistics and correlation analyses
was performed through SPSS.
Protection of Human Subjects: Ethical Considerations
During the process of surveying participants at EO, the researcher made significant effort
to ensure that the people did not feel uncomfortable in any manner, and to emphasize that none
of their personal information was disclosed in any way. Participation in this study was strictly
voluntary and each participant will receive a letter of invitation to be a participant explaining the
purpose and benefits, and risks if any, of the study and the role and time commitment of the
participants. Complete anonymity was maintained. Names did not appear in any data collected,
and participants were not be identified through the demographic data. According to Code of
Federal Regulations (2009), participants have the right to privacy of their personal answers that
have submitted in the form of surveys. The researcher made sure that all participants are kept
anonymous. Therefore, an online confidentiality agreement was ready for the participants so that
they understood how the researcher would utilize their answer.
Data Analysis
Conducting a survey and drawing conclusions from that was a process of gathering and
analyzing data. The data collected for this study were analyzed descriptively. Descriptive
statistics were employed to address the demographic characteristics of the participants in this
study. The purpose of the descriptive analysis was to describe, present, and summarize the means
44
for all of the descriptive data such as the survey participants’ demographic variables.
Demographic questionnaire was provided by the researcher to detect the profiles of the
participants and be more comprehensive in identifying demographic differences among
participants. Participants were asked questions concerning their gender, age, ethnicity, type of
business, number of employees supervised, and number of years as a business owner.
Descriptive statistics were used to determine the distributions of entrepreneurial traits of
entrepreneurs and the distributions of generations represented by entrepreneurs. Violation of
assumptions were met for descriptive statistics in both research questions one and two.
According to Pallant (2013), prior to doing any of the statistical analyses, such as t-test,
ANOVA, correlation etc., it is very substantial to check if any of the assumptions are violated by
the individual test. Testing of assumptions requires acquiring descriptive statistics on variables,
such as the mean, standard deviation, range of scores, skewness and kurtosis (Pallant, 2013).
Frequencies procedures were used to acquire descriptive statistics for categorical variables (e.g.
gender, ethnicity, education, type of business). The distribution of scores on continuous variables
was explored using skewness and kurtosis values. To assess the normality of the distribution of
scores, Kolmogorov-Smirnov statistic was employed in both research questions. To detect the
actual shape of the distribution for each group, histograms were used in both research questions.
The third research question was addressed using the analysis of variance test (ANOVA).
“Analysis of variance is used to compare two or more means to see if there are any statistically
significant differences among them” (Tabachnick & Fidell, 2013, p. 37). The ANOVA was used
to compare the variances (variability) in entrepreneurial traits scores between the generations
with the variability within each of the groups (Pallant, 2013). According to Pallant (2013), the
ANOVA is used when researchers have one independent (three born generations groups)
45
variable and one dependent continuous (entrepreneurial traits) variable. The ANOVA was
separately utilized for five different entrepreneurial traits as dependent variables while born
generations were considered as independent variables.
For the last research question, multiple regression analysis was used to test the hypothesis
whether there is a statistically difference in the Total Entrepreneurial Traits scores across three
generations of entrepreneurs after controlling covariates. Multiple regression analysis technique
that allows researchers to build a model that explore the relationship between one continuous
dependent variable and a number of independent variables or predictors (Pallant, 2013). Multiple
regression analysis suited the last question well because this analysis allowed the researcher to
test whether adding a variable contributes to the predictive ability of the model, over and above
those variables already included in the model (Pallant, 2013). According to Pallant (2013), there
are three main research questions that multiple regression can be used to address: “how well a set
of variables is able to predict a particular outcome”, “which variable in a set of variables is the
best predictor of an outcome”, “whether a particular predictor variable is still able to predict an
outcome when the effects of another variable are controlled for” (p. 155).
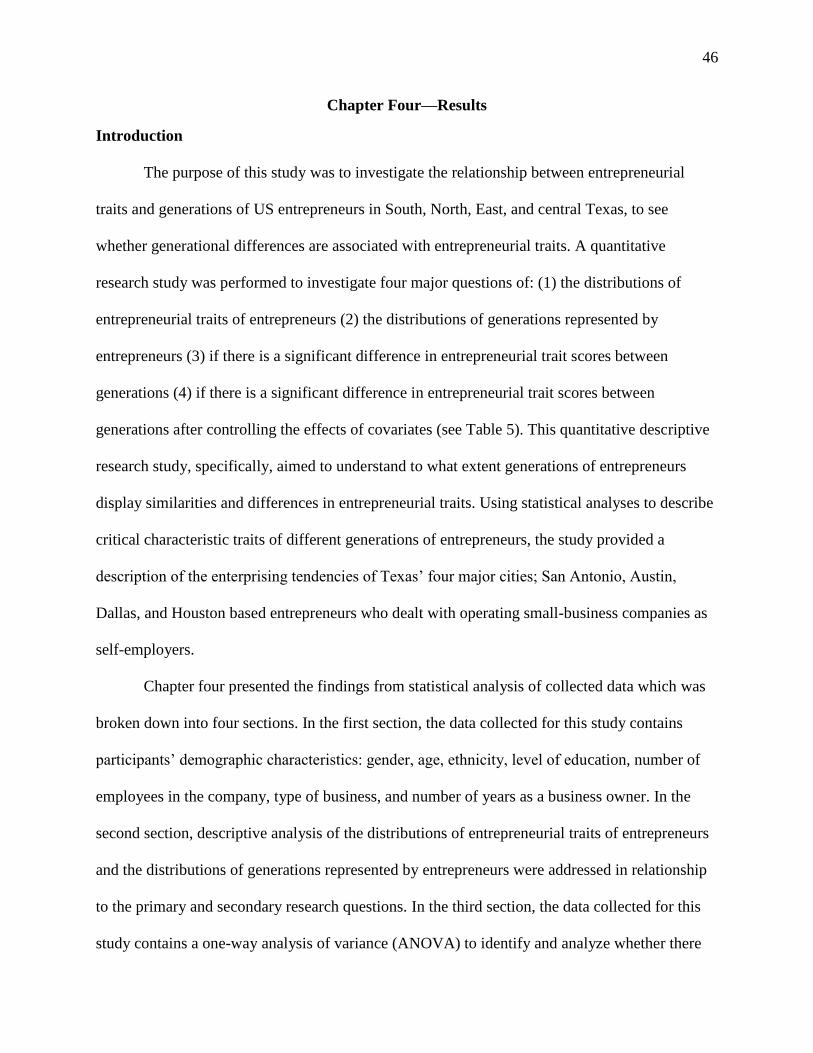
46
Chapter Four—Results
Introduction
The purpose of this study was to investigate the relationship between entrepreneurial
traits and generations of US entrepreneurs in South, North, East, and central Texas, to see
whether generational differences are associated with entrepreneurial traits. A quantitative
research study was performed to investigate four major questions of: (1) the distributions of
entrepreneurial traits of entrepreneurs (2) the distributions of generations represented by
entrepreneurs (3) if there is a significant difference in entrepreneurial trait scores between
generations (4) if there is a significant difference in entrepreneurial trait scores between
generations after controlling the effects of covariates (see Table 5). This quantitative descriptive
research study, specifically, aimed to understand to what extent generations of entrepreneurs
display similarities and differences in entrepreneurial traits. Using statistical analyses to describe
critical characteristic traits of different generations of entrepreneurs, the study provided a
description of the enterprising tendencies of Texas’ four major cities; San Antonio, Austin,
Dallas, and Houston based entrepreneurs who dealt with operating small-business companies as
self-employers.
Chapter four presented the findings from statistical analysis of collected data which was
broken down into four sections. In the first section, the data collected for this study contains
participants’ demographic characteristics: gender, age, ethnicity, level of education, number of
employees in the company, type of business, and number of years as a business owner. In the
second section, descriptive analysis of the distributions of entrepreneurial traits of entrepreneurs
and the distributions of generations represented by entrepreneurs were addressed in relationship
to the primary and secondary research questions. In the third section, the data collected for this
study contains a one-way analysis of variance (ANOVA) to identify and analyze whether there
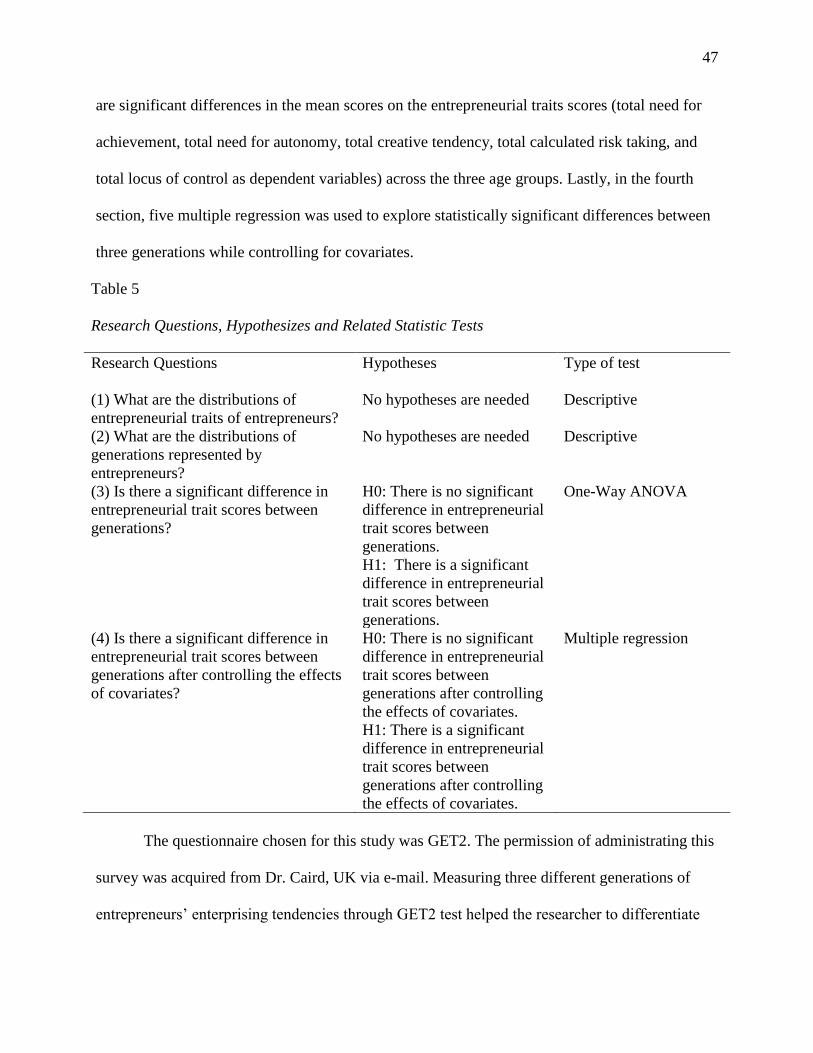
47
are significant differences in the mean scores on the entrepreneurial traits scores (total need for
achievement, total need for autonomy, total creative tendency, total calculated risk taking, and
total locus of control as dependent variables) across the three age groups. Lastly, in the fourth
section, five multiple regression was used to explore statistically significant differences between
three generations while controlling for covariates.
Table 5
Research Questions, Hypothesizes and Related Statistic Tests
Research Questions Hypotheses Type of test
(1) What are the distributions of
entrepreneurial traits of entrepreneurs?
No hypotheses are needed Descriptive
(2) What are the distributions of
generations represented by
entrepreneurs?
No hypotheses are needed Descriptive
(3) Is there a significant difference in
entrepreneurial trait scores between
generations?
H0: There is no significant
difference in entrepreneurial
trait scores between
generations.
H1: There is a significant
difference in entrepreneurial
trait scores between
generations.
One-Way ANOVA
(4) Is there a significant difference in
entrepreneurial trait scores between
generations after controlling the effects
of covariates?
H0: There is no significant
difference in entrepreneurial
trait scores between
generations after controlling
the effects of covariates.
H1: There is a significant
difference in entrepreneurial
trait scores between
generations after controlling
the effects of covariates.
Multiple regression
The questionnaire chosen for this study was GET2. The permission of administrating this
survey was acquired from Dr. Caird, UK via e-mail. Measuring three different generations of
entrepreneurs’ enterprising tendencies through GET2 test helped the researcher to differentiate

48
the similarities and differences between different generations of entrepreneurs and
entrepreneurial traits in need for achievement, need for autonomy, creative tendency, calculated
risk taking, and locus of control. GET2 test is a survey instrument that is comprised of items with
dichotomous response options – tend to agree or tend to disagree. The instrument measures
levels of agreement. The scale and subscales were treated as continuous in compliance with
research questions. The generation variable is a single variable with three categories: baby
boomers, generation Xers, and millennials and the five entrepreneurial traits were treated as
categorical (low, medium, high). The overall GET2 score is a number between 0 and 54. In the
study, participants answered every question regarding the following two categories: demographic
and five different entrepreneurial traits (enterprising tendencies). An analysis of the results
revealed the demographics of the three different generations of entrepreneurs and unearthed
findings regarding the four descriptive quantitative research questions.
Table 6
Entrepreneurial Traits Variables and Their Scores
Related Questions High Score Medium Score Low Score
Need for achievement 1, 10, 19, 28, 37, 46,
6, 15, 24, 33, 42, 51
10-12 7-9 0-6
Need for autonomy 3, 12, 21, 30, 39, 48 4-6 3 0-2
Creative tendency 5, 14, 23, 32, 41, 50,
8, 17, 26, 35, 44, 53
10-12 7-9 0-6
Calculated risk taking 2, 11, 20, 29, 38, 47,
9, 18, 27, 36, 45, 54
10-12 7-9 0-6
Locus of control 4, 13, 22, 31, 40, 49,
7, 16, 25, 34, 43, 52
10-12 7-9 0-6
Total 44-54 27-43 0-26
A descriptive data analysis was performed using an SPSS statistical software package for
each of the three generational cohorts: Baby Boomers, Generation Xers, and Millennial
Generations. The independent variable was the generations with three categories. The dependent
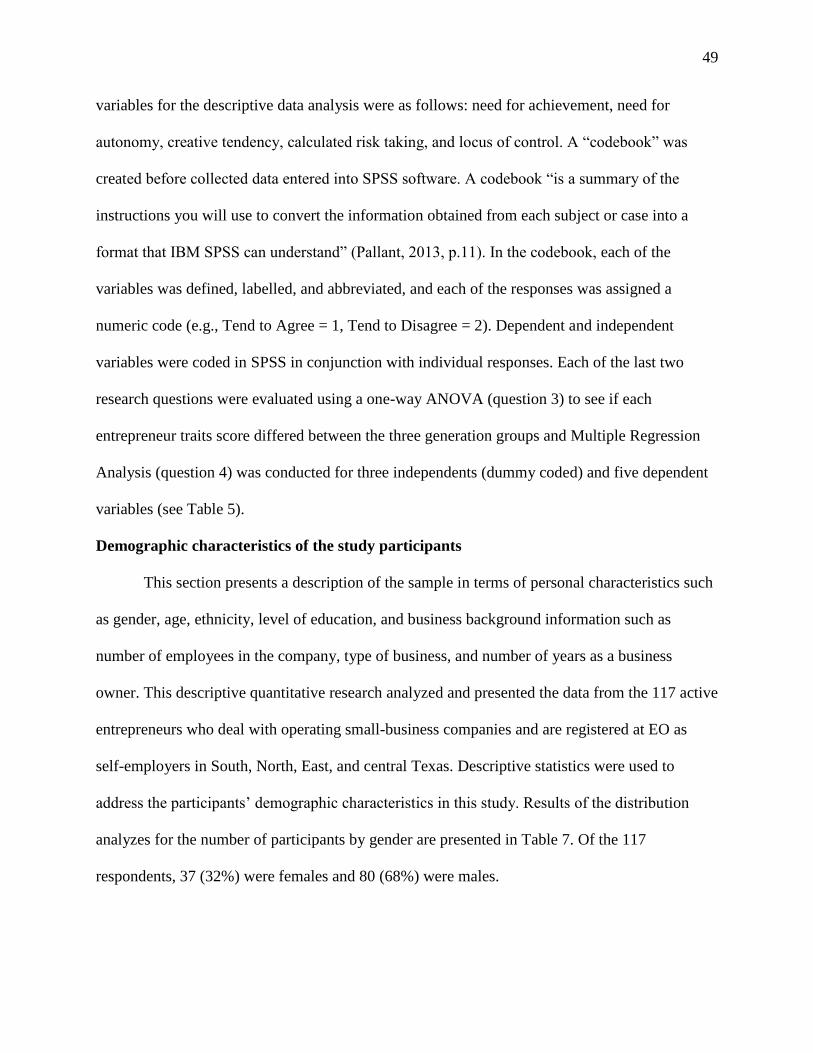
49
variables for the descriptive data analysis were as follows: need for achievement, need for
autonomy, creative tendency, calculated risk taking, and locus of control. A “codebook” was
created before collected data entered into SPSS software. A codebook “is a summary of the
instructions you will use to convert the information obtained from each subject or case into a
format that IBM SPSS can understand” (Pallant, 2013, p.11). In the codebook, each of the
variables was defined, labelled, and abbreviated, and each of the responses was assigned a
numeric code (e.g., Tend to Agree = 1, Tend to Disagree = 2). Dependent and independent
variables were coded in SPSS in conjunction with individual responses. Each of the last two
research questions were evaluated using a one-way ANOVA (question 3) to see if each
entrepreneur traits score differed between the three generation groups and Multiple Regression
Analysis (question 4) was conducted for three independents (dummy coded) and five dependent
variables (see Table 5).
Demographic characteristics of the study participants
This section presents a description of the sample in terms of personal characteristics such
as gender, age, ethnicity, level of education, and business background information such as
number of employees in the company, type of business, and number of years as a business
owner. This descriptive quantitative research analyzed and presented the data from the 117 active
entrepreneurs who deal with operating small-business companies and are registered at EO as
self-employers in South, North, East, and central Texas. Descriptive statistics were used to
address the participants’ demographic characteristics in this study. Results of the distribution
analyzes for the number of participants by gender are presented in Table 7. Of the 117
respondents, 37 (32%) were females and 80 (68%) were males.

50
Table 7
Gender
Frequency Percent
Female 37 32%
Male 80 68%
Table 8
Age
Frequency Percent
Millennials (18-35) 43 37%
Generation Xers (36-51) 50 43%
Baby Boomers (52-70) 24 20%
Descriptive statistics were also used to address the three different generations of
entrepreneurs’ demographic characteristics in age. Results of the distribution analyzes for the
number of participants by age are presented in Table 8. The three different generations were
selected using Lancaster & Stillman (2002) who state that Baby Boomers were born between the
years 1946 and 1964 who are, at present, at the age of 52-70 (n=24, 20% of total response). This
research study utilized the dates proposed by Lancaster & Stillman (2002) who state that
Generation Xers were born between the years 1965 and 1980 who are, at present, at the age of
36-51 (n= 50, 43% of total response). Lastly, the cohort of Millennials was defined by Lancaster
& Stillman (2002) as individuals who were born between the years of 1981 and 1999 who are, at
present, at the age of 18-35 (n= 43, 37% of total response).
Table 9 illustrates the diversity of the three different generations of entrepreneurs. The
participants were chosen in the data of the 117 active entrepreneurs who deal with operating
small-business companies and are registered at EO as self-employers in South, North, East, and
central Texas. With the exception of one missing response, most entrepreneurs were Hispanic or
51
Latino, accounting for 48% of the total. White/Caucasian made up 41% of the total, Asian or
Pacific Islander 19%, and Black or African American 7%, and American Indian or Alaskan
Native accounted for only 1% of the total.
Table 9
Ethnicity
Frequency Percent
American Indian or Alaskan Native 1 .9%
Asian or Pacific Islander 19 16.2%
Black or African American 7 6.0%
Hispanic or Latino 48 41.0%
White / Caucasian 41 35.0%
Prefer not to answer 1 .9%
The results show that the majority of the entrepreneurs that have responded to the survey
have Bachelor’s degrees (48 individuals). 20% of total respondents (24 individuals) have
Master's degrees. 17% of total participants has associates degrees (20 individuals). Only 2% and
3% of participants respectively has professional (2 individuals) and doctoral degrees (3
individuals). Complete results were displayed in Table 10.
Table 10
Level of Education
Frequency Percent
High School/GED 10 8.5%
Some College 10 8.5%
Associates Degree 20 17.1%
Bachelor's Degree 48 41.0%
Master's Degree 24 20.5%
Professional Degree 2 1.7%
Doctoral Degree 3 2.6%
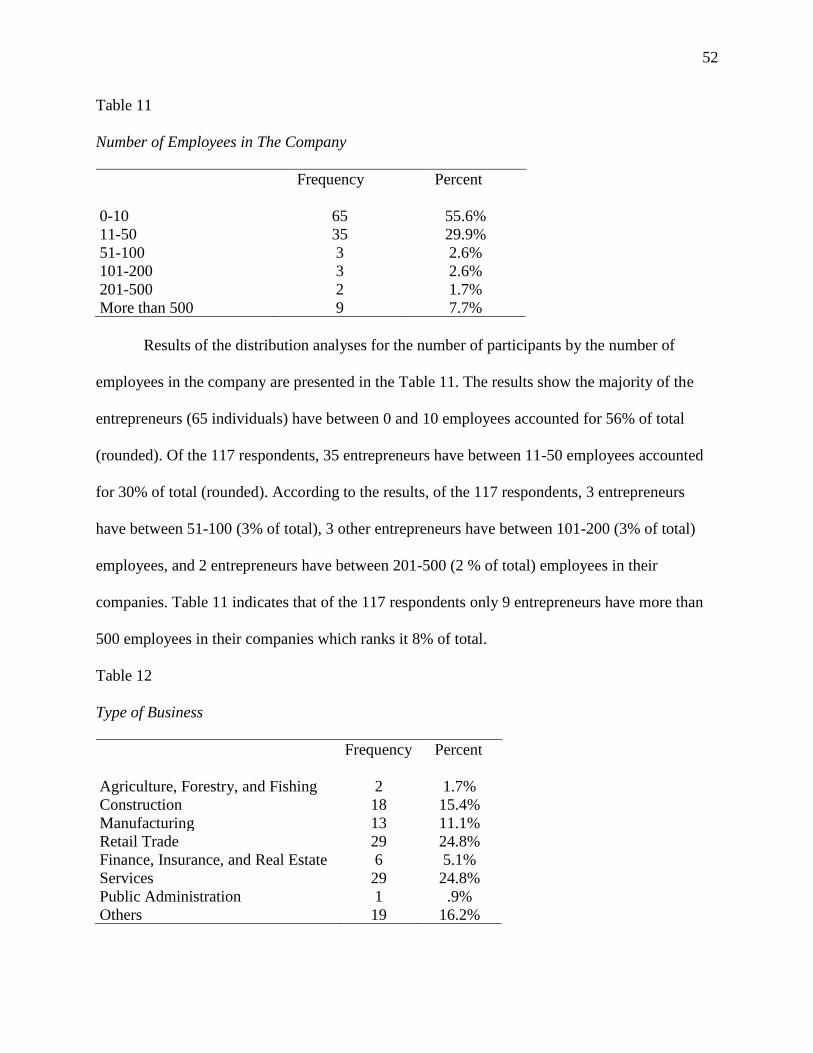
52
Table 11
Number of Employees in The Company
Frequency Percent
0-10 65 55.6%
11-50 35 29.9%
51-100 3 2.6%
101-200 3 2.6%
201-500 2 1.7%
More than 500 9 7.7%
Results of the distribution analyses for the number of participants by the number of
employees in the company are presented in the Table 11. The results show the majority of the
entrepreneurs (65 individuals) have between 0 and 10 employees accounted for 56% of total
(rounded). Of the 117 respondents, 35 entrepreneurs have between 11-50 employees accounted
for 30% of total (rounded). According to the results, of the 117 respondents, 3 entrepreneurs
have between 51-100 (3% of total), 3 other entrepreneurs have between 101-200 (3% of total)
employees, and 2 entrepreneurs have between 201-500 (2 % of total) employees in their
companies. Table 11 indicates that of the 117 respondents only 9 entrepreneurs have more than
500 employees in their companies which ranks it 8% of total.
Table 12
Type of Business
Frequency Percent
Agriculture, Forestry, and Fishing 2 1.7%
Construction 18 15.4%
Manufacturing 13 11.1%
Retail Trade 29 24.8%
Finance, Insurance, and Real Estate 6 5.1%
Services 29 24.8%
Public Administration 1 .9%
Others 19 16.2%
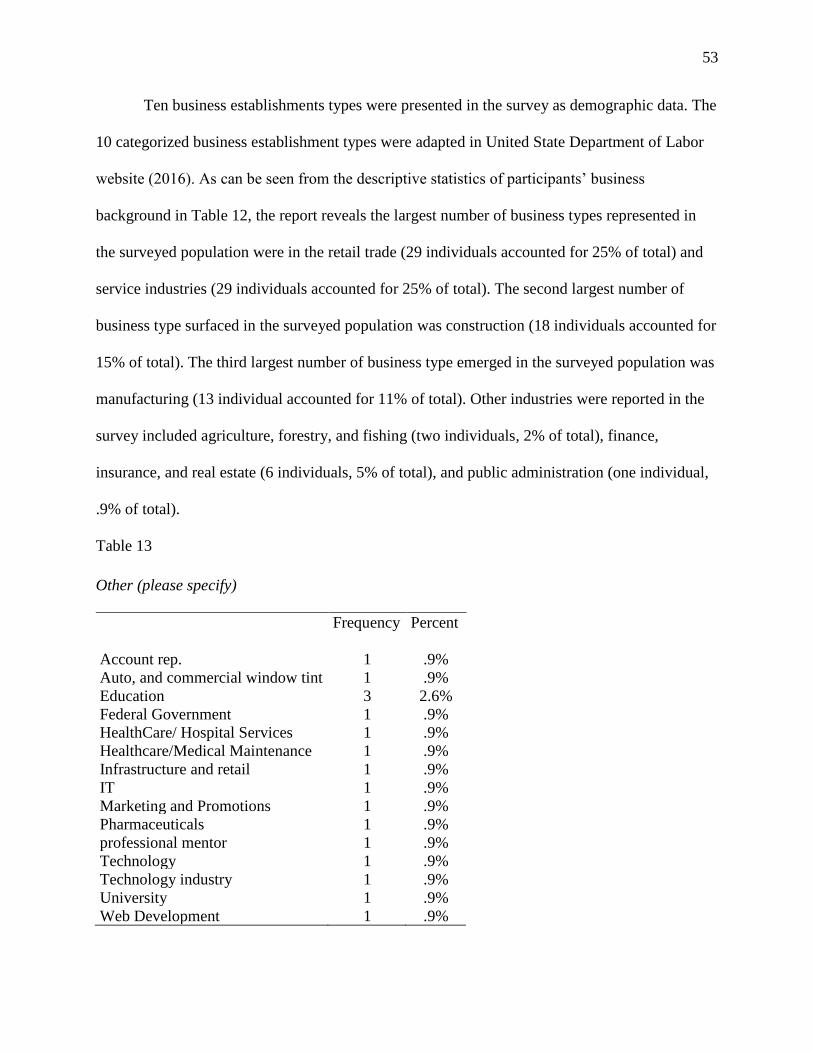
53
Ten business establishments types were presented in the survey as demographic data. The
10 categorized business establishment types were adapted in United State Department of Labor
website (2016). As can be seen from the descriptive statistics of participants’ business
background in Table 12, the report reveals the largest number of business types represented in
the surveyed population were in the retail trade (29 individuals accounted for 25% of total) and
service industries (29 individuals accounted for 25% of total). The second largest number of
business type surfaced in the surveyed population was construction (18 individuals accounted for
15% of total). The third largest number of business type emerged in the surveyed population was
manufacturing (13 individual accounted for 11% of total). Other industries were reported in the
survey included agriculture, forestry, and fishing (two individuals, 2% of total), finance,
insurance, and real estate (6 individuals, 5% of total), and public administration (one individual,
.9% of total).
Table 13
Other (please specify)
Frequency Percent
Account rep. 1 .9%
Auto, and commercial window tint 1 .9%
Education 3 2.6%
Federal Government 1 .9%
HealthCare/ Hospital Services 1 .9%
Healthcare/Medical Maintenance 1 .9%
Infrastructure and retail 1 .9%
IT 1 .9%
Marketing and Promotions 1 .9%
Pharmaceuticals 1 .9%
professional mentor 1 .9%
Technology 1 .9%
Technology industry 1 .9%
University 1 .9%
Web Development 1 .9%
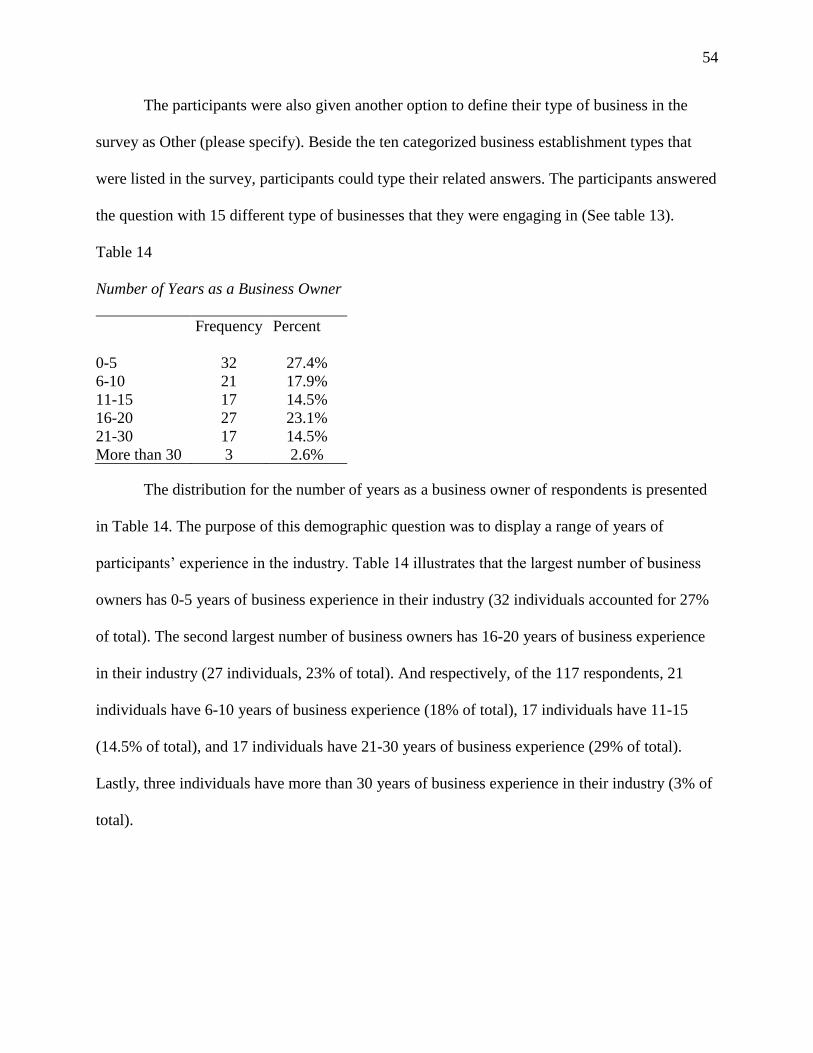
54
The participants were also given another option to define their type of business in the
survey as Other (please specify). Beside the ten categorized business establishment types that
were listed in the survey, participants could type their related answers. The participants answered
the question with 15 different type of businesses that they were engaging in (See table 13).
Table 14
Number of Years as a Business Owner
Frequency Percent
0-5 32 27.4%
6-10 21 17.9%
11-15 17 14.5%
16-20 27 23.1%
21-30 17 14.5%
More than 30 3 2.6%
The distribution for the number of years as a business owner of respondents is presented
in Table 14. The purpose of this demographic question was to display a range of years of
participants’ experience in the industry. Table 14 illustrates that the largest number of business
owners has 0-5 years of business experience in their industry (32 individuals accounted for 27%
of total). The second largest number of business owners has 16-20 years of business experience
in their industry (27 individuals, 23% of total). And respectively, of the 117 respondents, 21
individuals have 6-10 years of business experience (18% of total), 17 individuals have 11-15
(14.5% of total), and 17 individuals have 21-30 years of business experience (29% of total).
Lastly, three individuals have more than 30 years of business experience in their industry (3% of
total).
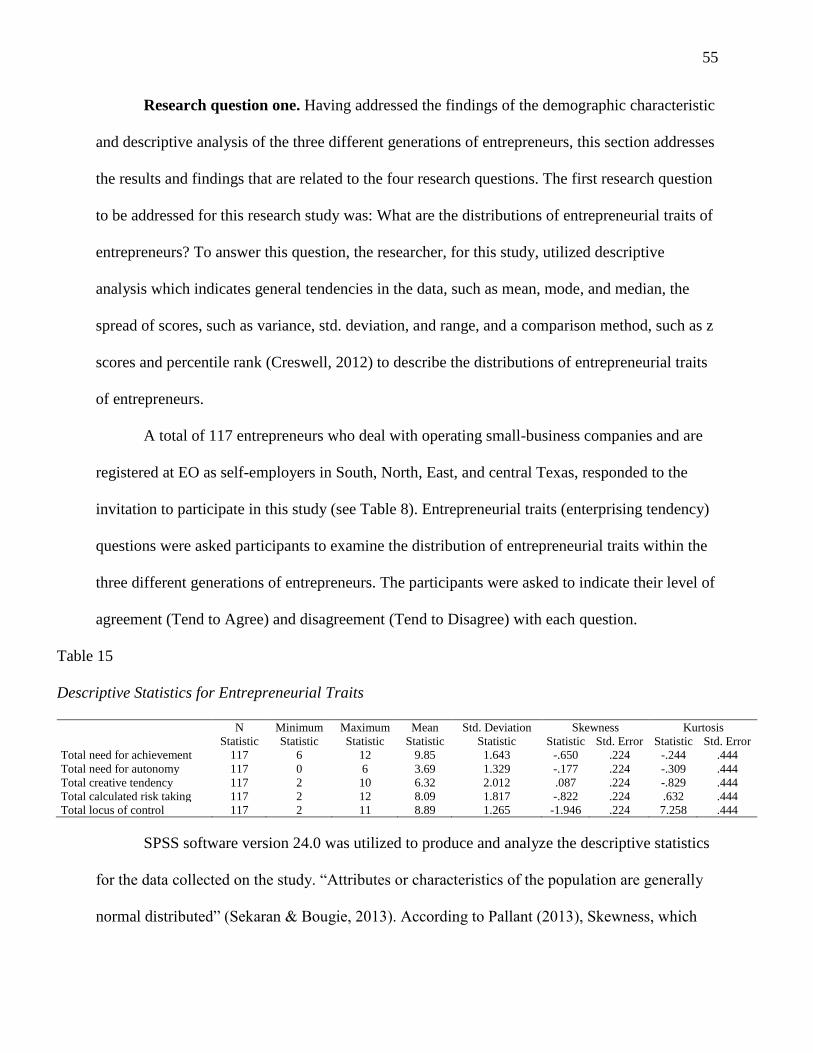
55
Research question one. Having addressed the findings of the demographic characteristic
and descriptive analysis of the three different generations of entrepreneurs, this section addresses
the results and findings that are related to the four research questions. The first research question
to be addressed for this research study was: What are the distributions of entrepreneurial traits of
entrepreneurs? To answer this question, the researcher, for this study, utilized descriptive
analysis which indicates general tendencies in the data, such as mean, mode, and median, the
spread of scores, such as variance, std. deviation, and range, and a comparison method, such as z
scores and percentile rank (Creswell, 2012) to describe the distributions of entrepreneurial traits
of entrepreneurs.
A total of 117 entrepreneurs who deal with operating small-business companies and are
registered at EO as self-employers in South, North, East, and central Texas, responded to the
invitation to participate in this study (see Table 8). Entrepreneurial traits (enterprising tendency)
questions were asked participants to examine the distribution of entrepreneurial traits within the
three different generations of entrepreneurs. The participants were asked to indicate their level of
agreement (Tend to Agree) and disagreement (Tend to Disagree) with each question.
Table 15
Descriptive Statistics for Entrepreneurial Traits
N Minimum Maximum Mean Std. Deviation Skewness Kurtosis
Statistic Statistic Statistic Statistic Statistic Statistic Std. Error Statistic Std. Error
Total need for achievement 117 6 12 9.85 1.643 -.650 .224 -.244 .444
Total need for autonomy 117 0 6 3.69 1.329 -.177 .224 -.309 .444
Total creative tendency 117 2 10 6.32 2.012 .087 .224 -.829 .444
Total calculated risk taking 117 2 12 8.09 1.817 -.822 .224 .632 .444
Total locus of control 117 2 11 8.89 1.265 -1.946 .224 7.258 .444
SPSS software version 24.0 was utilized to produce and analyze the descriptive statistics
for the data collected on the study. “Attributes or characteristics of the population are generally
normal distributed” (Sekaran & Bougie, 2013). According to Pallant (2013), Skewness, which

56
provides an indication of the symmetry of the distribution, and Kurtosis, which provides an
indication of the peakedness of the distribution, values provide some information concerning the
distribution of scores on continuous variables. Table 15 indicates that, overall, the score of Need
for Achievement higher than any other entrepreneurial traits based upon the 12 items scale
(mean: 9.85 out of 12 possible highest score). The second highest score belongs to Locus of
Control based upon the same 12 items scale which accounted for 8.89 out of 12 possible highest
score. Respectively, Total Calculating Risk Taking (8.09 out of 12 possible highest score) and
Total Creative Tendency (6.32 out of 12 possible highest score). Total Need for Autonomy
accounted for 3.69 in mean score which can only achieve a maximum score of 6. Total Need for
Autonomy had a higher relative mean score than Total Creative Tendency when accounting for
the maximum scores.
Normality of variables were assessed by both Skewness and Kurtosis. Table 15 shows
that Skewness scores for need for achievement (-.650), need for autonomy (-.177), calculated
risk taking (-.822), and locus of control (-1.946) are negative which means there is a tendency for
values to cluster just to the right of the mean and the left tail is too long (Tabachnick & Fidell,
2013). Skewness score for creative tendency has a positive score (.087) which indicates that
there is a tendency for values to cluster just to the left of the mean and right tail is too long
(Tabachnick & Fidell, 2013).
Table 15 also provides Kurtosis scores for each entrepreneurial trait. Need for
achievement (-.244), need for autonomy (-.309), and creative tendency (-.829) have negative
kurtosis scores which indicate that a distribution that is too flat with many cases in the tails
(Tabachnick & Fidell, 2013). However, calculated risk taking (.632) and locus of control (7.258)
have positive kurtosis scores which indicate that a distribution that is too peaked with short and
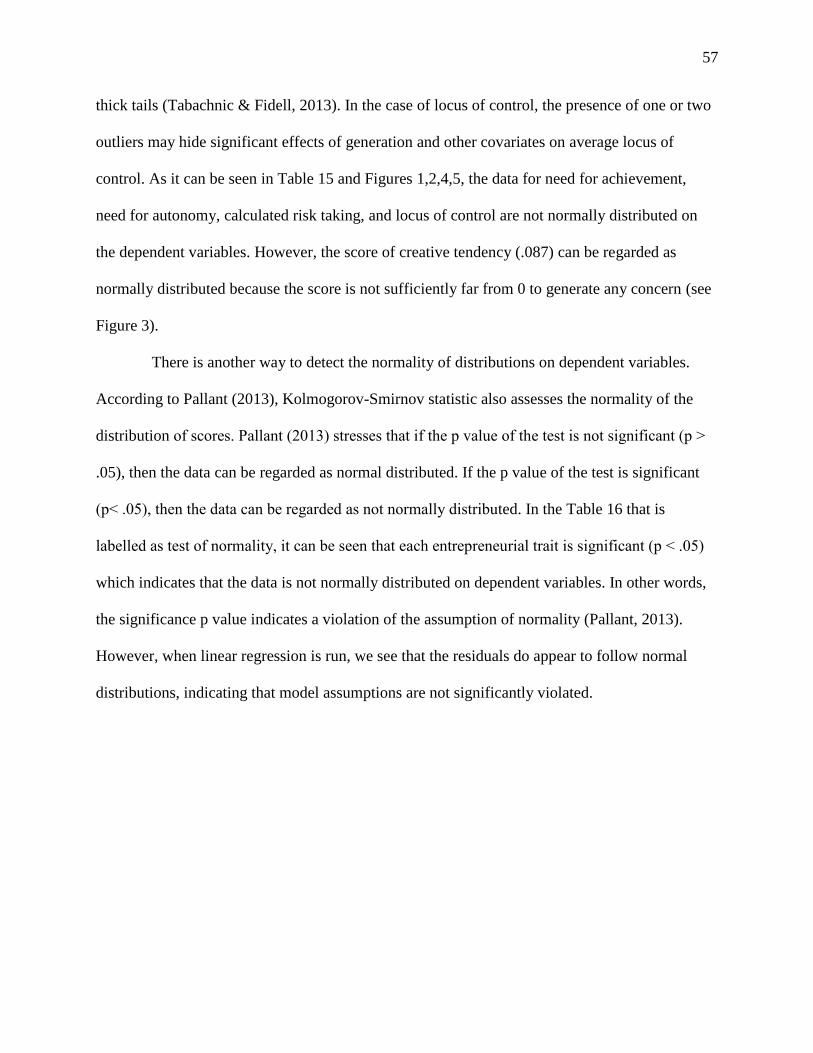
57
thick tails (Tabachnic & Fidell, 2013). In the case of locus of control, the presence of one or two
outliers may hide significant effects of generation and other covariates on average locus of
control. As it can be seen in Table 15 and Figures 1,2,4,5, the data for need for achievement,
need for autonomy, calculated risk taking, and locus of control are not normally distributed on
the dependent variables. However, the score of creative tendency (.087) can be regarded as
normally distributed because the score is not sufficiently far from 0 to generate any concern (see
Figure 3).
There is another way to detect the normality of distributions on dependent variables.
According to Pallant (2013), Kolmogorov-Smirnov statistic also assesses the normality of the
distribution of scores. Pallant (2013) stresses that if the p value of the test is not significant (p ˃
.05), then the data can be regarded as normal distributed. If the p value of the test is significant
(p˂ .05), then the data can be regarded as not normally distributed. In the Table 16 that is
labelled as test of normality, it can be seen that each entrepreneurial trait is significant (p ˂ .05)
which indicates that the data is not normally distributed on dependent variables. In other words,
the significance p value indicates a violation of the assumption of normality (Pallant, 2013).
However, when linear regression is run, we see that the residuals do appear to follow normal
distributions, indicating that model assumptions are not significantly violated.
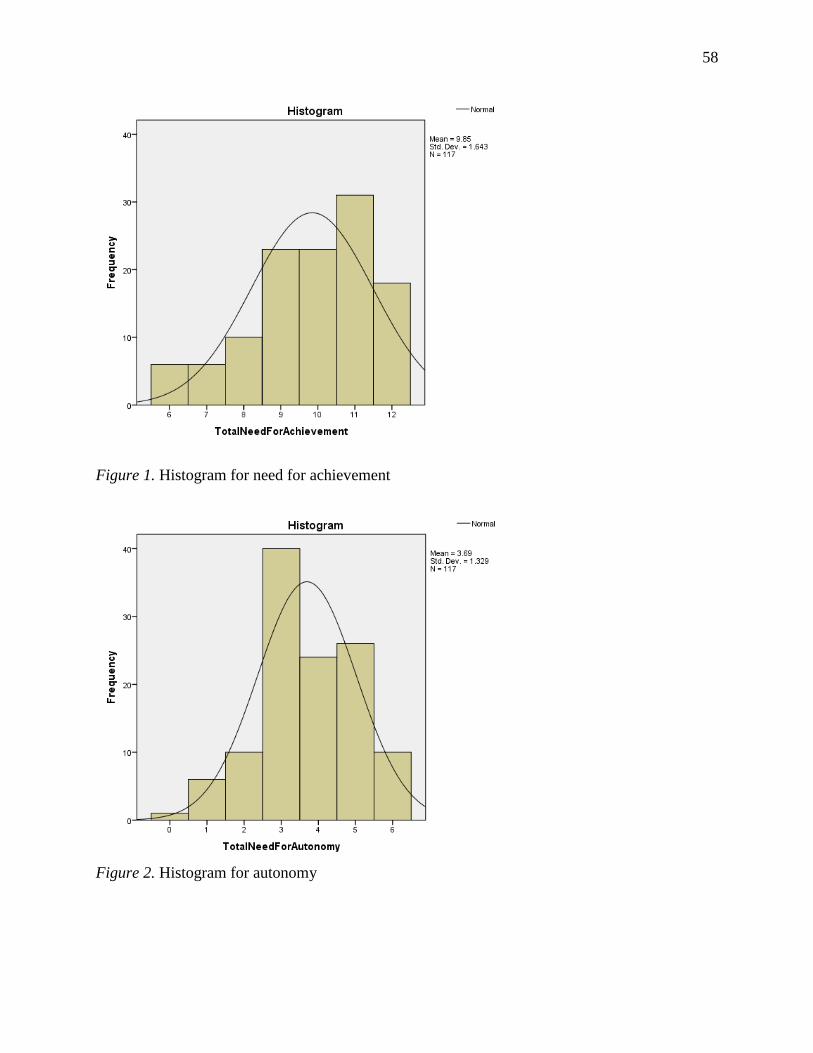
58
Figure 1. Histogram for need for achievement
Figure 2. Histogram for autonomy

59
Figure 3. Histogram for creative tendency
Figure 4. Histogram for calculated risk taking
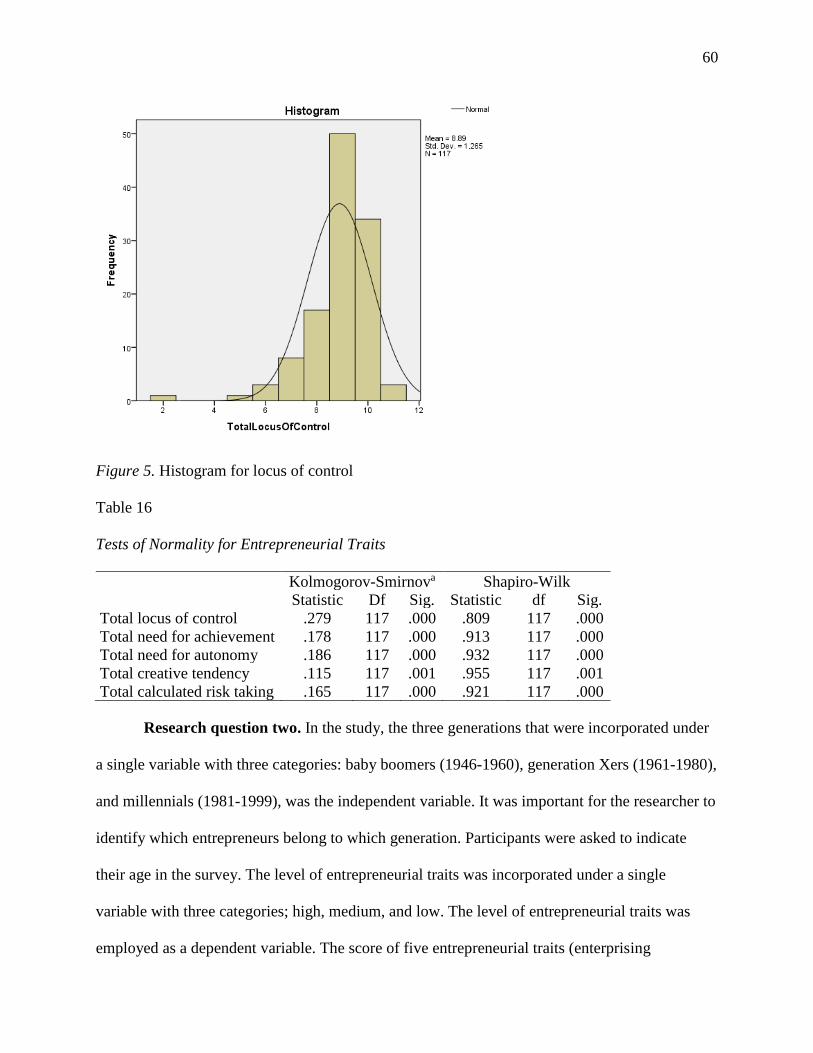
60
Figure 5. Histogram for locus of control
Research question two. In the study, the three generations that were incorporated under
a single variable with three categories: baby boomers (1946-1960), generation Xers (1961-1980),
and millennials (1981-1999), was the independent variable. It was important for the researcher to
identify which entrepreneurs belong to which generation. Participants were asked to indicate
their age in the survey. The level of entrepreneurial traits was incorporated under a single
variable with three categories; high, medium, and low. The level of entrepreneurial traits was
employed as a dependent variable. The score of five entrepreneurial traits (enterprising
Table 16
Tests of Normality for Entrepreneurial Traits
Kolmogorov-Smirnova Shapiro-Wilk
Statistic Df Sig. Statistic df Sig.
Total locus of control .279 117 .000 .809 117 .000
Total need for achievement .178 117 .000 .913 117 .000
Total need for autonomy .186 117 .000 .932 117 .000
Total creative tendency .115 117 .001 .955 117 .001
Total calculated risk taking .165 117 .000 .921 117 .000

61
tendencies) was scored as follows: the maximum score in General Enterprising Tendency is 54
which represents a high enterprising tendency scored between 44-54. Entrepreneurs who have a
medium enterprising tendency was limited between 27-43 while entrepreneurs who have a low
enterprising tendency was limited between 0-26 (see Table 6).
The second research question to be addressed for this research study was: what are the
distributions of generations represented by entrepreneurs? To answer this question, descriptive
statistical analyses were accompanied through cross-tabulations to study the association between
the independent and dependent variables. “Descriptive studies are designed to gain more
information about a particular characteristic within a particular field of study” (Simon & Francis,
2001, p. 27). A cross-tabulation tool was used for the collected data to analyze the extent to what
each of the three generations’ entrepreneurial traits levels is and the frequency distribution of two
categorical variables: generations and entrepreneurial traits levels (Pallant, 2013).
The frequency distribution of two categorical variables with three ordinal levels are
presented in Table 17. Overall, collected data from 117 entrepreneurs showed that 103 (88% of
total population) entrepreneurs tend to have a medium level of enterprising tendency. According
to Caird (2013), entrepreneurs who tend to have medium enterprising tendency scores have
strengths in some of the enterprising characteristics in some contexts. However, entrepreneurs
with medium enterprising tendency are unlikely to set up an innovative growth-oriented global
business (Caird, 2013). Moreover, they can consider themselves as an intrapreneur within
employment, or they can work in their leisure time through voluntary community projects (see
Table 3).

62
Table 17
Age: Low, Medium, High Crosstabulation
Entrepreneurial traits levels
Total High Low Medium
Age* 18-35 Count 5 1 37 43
% within Age 11.6% 2.3% 86.0% 100.0%
% within low, medium, high 50.0% 25.0% 35.9% 36.8%
% of Total 4.3% 0.9% 31.6% 36.8%
36-51 Count 4 3 43 50
% within Age 8.0% 6.0% 86.0% 100.0%
% within low, medium, high 40.0% 75.0% 41.7% 42.7%
% of Total 3.4% 2.6% 36.8% 42.7%
52-70 Count 1 0 23 24
% within Age 4.2% 0.0% 95.8% 100.0%
% within low, medium, high 10.0% 0.0% 22.3% 20.5%
% of Total 0.9% 0.0% 19.7% 20.5%
Total Count 10 4 103 117
% within Age 8.5% 3.4% 88.0% 100.0%
% within low, medium, high 100.0% 100.0% 100.0% 100.0%
% of Total 8.5% 3.4% 88.0% 100.0%
Note. N = 117. *Age
Research question three. Having addressed the findings of the distributions of
entrepreneurial traits of entrepreneurs and the distributions of generations represented by
entrepreneurs, this section addresses the results and findings that are related to the third research
question. The third research question to be addressed for this research study was: Is there a
significant difference in entrepreneurial trait scores between generations. To answer this
question, the one-way analysis of variance (ANOVA) was suitable for the third research question
to determine whether there are significant differences in the mean scores on each of the
entrepreneurial trait score across the three groups (Pallant, 2013). The three generations of
entrepreneurs were asked to indicate their age in the survey and three generations were coded
differently in SPSS software (see Table 18).
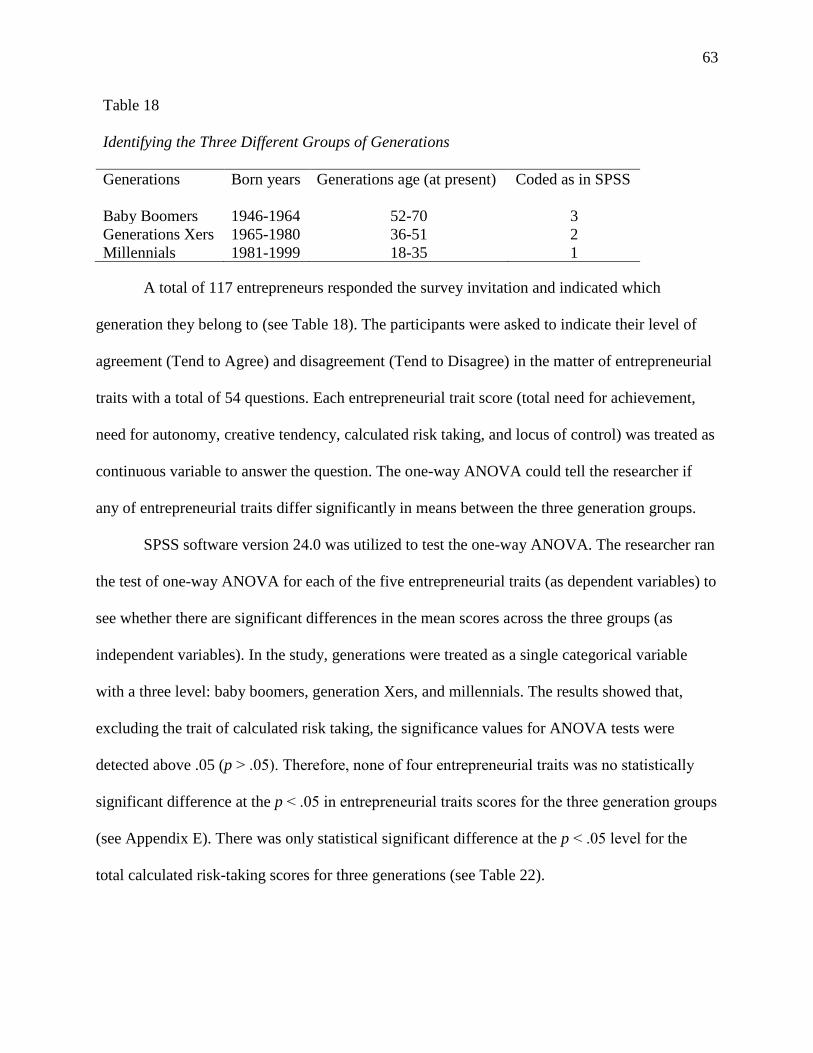
63
Table 18
Identifying the Three Different Groups of Generations
Generations Born years Generations age (at present) Coded as in SPSS
Baby Boomers 1946-1964 52-70 3
Generations Xers 1965-1980 36-51 2
Millennials 1981-1999 18-35 1
A total of 117 entrepreneurs responded the survey invitation and indicated which
generation they belong to (see Table 18). The participants were asked to indicate their level of
agreement (Tend to Agree) and disagreement (Tend to Disagree) in the matter of entrepreneurial
traits with a total of 54 questions. Each entrepreneurial trait score (total need for achievement,
need for autonomy, creative tendency, calculated risk taking, and locus of control) was treated as
continuous variable to answer the question. The one-way ANOVA could tell the researcher if
any of entrepreneurial traits differ significantly in means between the three generation groups.
SPSS software version 24.0 was utilized to test the one-way ANOVA. The researcher ran
the test of one-way ANOVA for each of the five entrepreneurial traits (as dependent variables) to
see whether there are significant differences in the mean scores across the three groups (as
independent variables). In the study, generations were treated as a single categorical variable
with a three level: baby boomers, generation Xers, and millennials. The results showed that,
excluding the trait of calculated risk taking, the significance values for ANOVA tests were
detected above .05 (p ˃ .05). Therefore, none of four entrepreneurial traits was no statistically
significant difference at the p ˂ .05 in entrepreneurial traits scores for the three generation groups
(see Appendix E). There was only statistical significant difference at the p ˂ .05 level for the
total calculated risk-taking scores for three generations (see Table 22).

64
Table 19
Descriptive: Total Calculated Risk-Taking Score
N Mean
Std.
Deviation Std. Error
95% Confidence
Interval for Mean
Minimum Maximum
Lower
Bound
Upper
Bound
18-35 43 8.70 1.337 .204 8.29 9.11 5 11
36-51 50 7.84 1.983 .280 7.28 8.40 2 12
52-70 24 7.50 1.956 .399 6.67 8.33 3 10
Total 117 8.09 1.817 .168 7.75 8.42 2 12
The descriptive statistics associated with the level of total calculated risk taking across
three born generations were reported in Table 19. It can be seen that the group of baby boomers
(52-70) generation were associated with the numerically smallest mean level of total calculated
risk taking (or General Enterprising Tendency) score (M = 7.50). The group of millennials (18-
35) generation was associated with the numerically highest mean level of total calculated risk-
taking score (M = 8.70). The mean score for generation Xers (36-51) falls in between these two
generations (M = 7.84).
Table 20
Test of Homogeneity of Variances: Total Calculated Risk Taking
Levene Statistic df1 df2 Sig.
2.401 2 114 .095
Table 20 presents the Levene’s test for homogeneity of variances. This test helps
researchers to test whether the variance in scores is the same for each of the three generation
groups (Pallant, 2013). The significance value for Levene’s test was checked (p = .095). The p
value is greater than .05 which means that the assumption of homogeneity of variance was not
violated (Pallant, 2013).
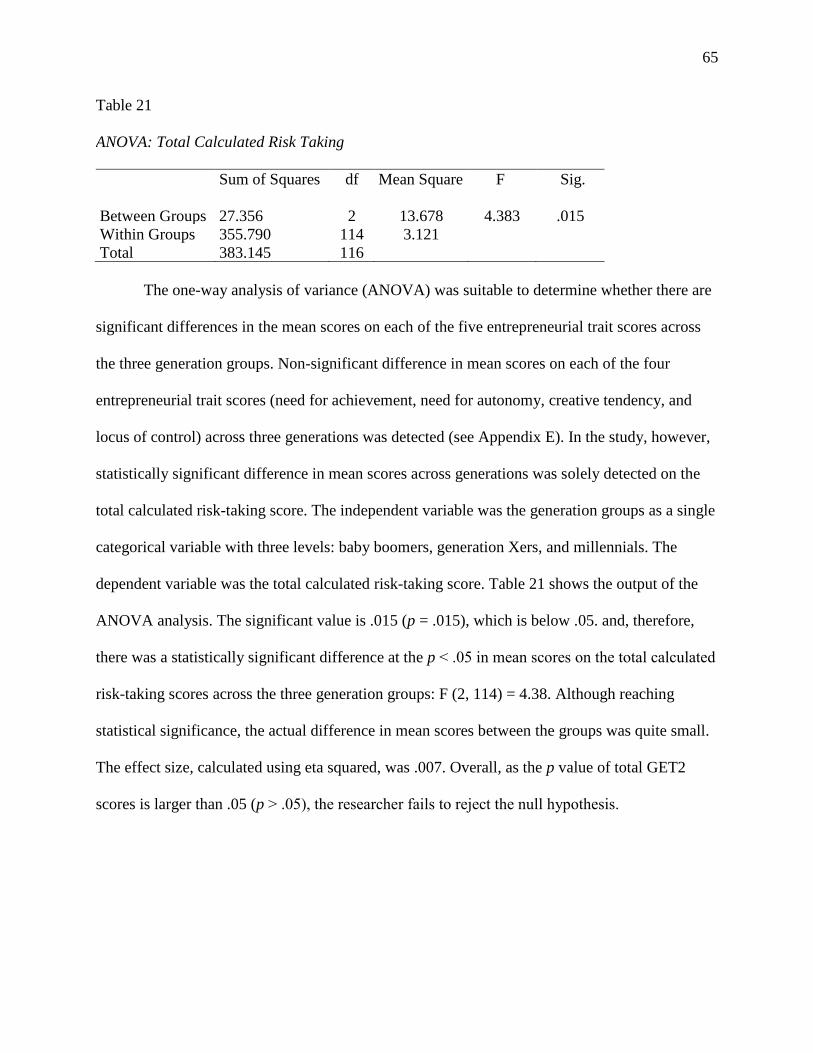
65
Table 21
ANOVA: Total Calculated Risk Taking
Sum of Squares df Mean Square F Sig.
Between Groups 27.356 2 13.678 4.383 .015
Within Groups 355.790 114 3.121
Total 383.145 116
The one-way analysis of variance (ANOVA) was suitable to determine whether there are
significant differences in the mean scores on each of the five entrepreneurial trait scores across
the three generation groups. Non-significant difference in mean scores on each of the four
entrepreneurial trait scores (need for achievement, need for autonomy, creative tendency, and
locus of control) across three generations was detected (see Appendix E). In the study, however,
statistically significant difference in mean scores across generations was solely detected on the
total calculated risk-taking score. The independent variable was the generation groups as a single
categorical variable with three levels: baby boomers, generation Xers, and millennials. The
dependent variable was the total calculated risk-taking score. Table 21 shows the output of the
ANOVA analysis. The significant value is .015 (p = .015), which is below .05. and, therefore,
there was a statistically significant difference at the p ˂ .05 in mean scores on the total calculated
risk-taking scores across the three generation groups: F (2, 114) = 4.38. Although reaching
statistical significance, the actual difference in mean scores between the groups was quite small.
The effect size, calculated using eta squared, was .007. Overall, as the p value of total GET2
scores is larger than .05 (p ˃ .05), the researcher fails to reject the null hypothesis.

66
Table 22
Multiple Comparisons
Dependent Variable: Total calculated risk-taking score
Tukey HSD
(I) Age (J) Age
Mean
Difference (I-J) Std. Error Sig.
95% Confidence
Interval
Lower
Bound
Upper
Bound
18-35 36-51 .858 .367 .055 -.01 1.73
52-70 1.198* .450 .024 .13 2.27
36-51 18-35 -.858 .367 .055 -1.73 .01
52-70 .340 .439 .719 -.70 1.38
52-70 18-35 -1.198* .450 .024 -2.27 -.13
36-51 -.340 .439 .719 -1.38 .70
Note. *The mean difference is significant at the .05 level.
According to Pallant (2013), post-hoc comparisons using the Tukey HSD test indicates
exactly where the differences among the groups occur. Having an asterisk means that the two
groups being compared are significantly different from one another at the p ˂ .05 level (Pallant,
2013). As it can be seen in Table 22 above, there are two asterisks (*) next to the values listed in
the column of mean difference. This indicates that only the group of millennials (M = 8.70, std =
1.34) and baby boomers (M = 7.50, std = 1.96) are statistically significantly different from one
another. That is, entrepreneurs with the age of between 18-35 and 52-70 differ significantly in
terms of their total calculated risk-taking scores. The generation Xers (M = 7.84, std = 1.98) did
not differ significantly from either baby boomers and millennials. Having addressed statistically
different between millennials and baby boomers in the mean score on the total calculated risk-
taking score, millennials have the highest risk-taking trait in comparison of the baby boomers
(see Table 19).

67
Research question four. For the last research question in the study, the researcher
utilized a multiple regression analysis which is used to explain the relationship between one
continuous dependent variable and a number of independent variables or predictors (Tabachnick
& Fidell, 2013; Pallant, 2013). The fourth research question to be addressed for this research
study was: is there a significant difference in entrepreneurial trait scores between generations
after controlling the effects of covariates? Five multiple regression analyses were conducted for
each entrepreneurial trait (dependent as continuous variables) to analyze: a) how well and which
set of variables (generation, ethnicity, level of education, number of employees in the company,
type of business, and number of years as a business owner as categorical variables) are able to
make the best prediction of the value on the dependent variables, b) whether the predictor
variables are still able to predict the outcome when the effects of another categorical variables
variable are controlled for (Pallant, 2013).
Five multiple regression analyses were performed through SPSS software version 24.0
where the categorical predictor variables (independent variables) were dummy coded and the
dependent variables were the 5 entrepreneurial traits (see Table 23). Dummy variables which
have two or more distinct levels, allow researchers to use nominal or ordinal variables as
independent variables to predict the dependent variable (Sekaran & Bougie, 2013). In the
multiple regression approach, the categorical predictor variables were collapsed into two or three
categories to facilitate analysis. For each categorical predictor variable, one category which
serves as a reference group, was chosen to reduce the group to two or three categories and to
compare each of the other categories (Acock, 2008).

68
Table 23
Recategorization of Categorical Variables
Dummy code names Dummy codes Other dummy
codes within groups
Age Generation Xers 1 0
Baby boomers 1 0
Ethnicity Hispanic or Latino 1 0
Level of education Undergrad degree 1 0
Graduate degree 1 0
Number of employees
in the company
Less than 50 employees 1 0
Type of business Agriculture 1 0
Mining, construction,
and manufacturing
1 0
Utilities 1 0
Trade 1 0
Assets 1 0
Service and public
Administration
1 0
Number of years as a
business owner
Less than 10 years 1 0
Five multiple regression analyses were run after categorical variables were recategorized
as dummy codes. The principle of parsimony was adopted by the researcher to simplify the
models. The reason of relying on parsimonious models was that they help researchers to achieve
a desired level of prediction with as few predictor variables as possible (Andale, 2015).
According to Andale (2015), parsimonious models have optimal parsimony and the right number
of predictors needed to explain the model well.
To test five multiple regression analyses, the researcher started with all of the covariates
and one dependent variable in the model. Then, nonsignificant independent variables were
systematically removed until the remaining variables were significant (the final model); all
covariates other than Generations were fitted individually as well so that effects on the
relationship between Generations and Entrepreneurial Traits were not rejected early on in the full

69
model. For the model to achieve goodness of fit, the ANOVA table was expected to have p < .05.
The R-squared statistic was checked to identify how much of the variance in the dependent
variable was explained by the model. The distribution of the residuals using the Normal
Probability Plot (P-P) of the Regression Standardized Residual were presented.
Total need for achievement vs. generations and all covariates/predictors. A multiple
linear regression was conducted to predict whether there is a significant difference in Total Need
for Achievement scores between generations after controlling the effects of covariates. Firstly,
the researcher started with all of the covariates in the model to see how well a number of
independent variables (generations and covariates) could predict Total Need for Achievement
scores (dependent variable). Further, how much variance in the dependent variables could be
explained by the independent variable was reported in the initial model. The value of Adjusted R
Square was checked which indicated that 7.5% of the variance in Total Need for Achievement
scores was explained by the model (see Table 24). The ANOVA table indicated that the model
with all covariates/predictors is not statistically significant, F (12, 104) = 1.78, p ˃ .05 (see Table
25).
Table 24
Model Summary
R R Square Adjusted R Square Std. Error of the Estimate
.413 .171 .075 1.581
Note. Predictors: (Constant), Less than 10 years, assets, Hispanic, agriculture, less
than 50, generation Xers, service and public admin, undergrad degree, trade, baby
boomers, graduate degree, mining construction manufacturing. Dependent Variable:
total need for achievement.

70
Table 25
ANOVA
Sum of Squares df Mean Square F Sig.
Regression 53.416 12 4.451 1.782 .061
Residual 259.815 104 2.498
Total 313.231 116
Note. Dependent Variable: total need for achievement. Predictors: (Constant), less
than 10 years, assets, Hispanic, agriculture, less than 50, Generation Xers, service
and public admin, undergrad degree, trade, baby boomers, graduate degree, mining
construction manufacturing.
The coefficients table (See Table 26) was presented as part of the multiple regression
procedure. The table presents the whole variables in the model contributed to the prediction of
the dependent variable (Pallant, 2013). However, the p values of each predictors indicated that
none of the predictors in the model made a statistically significant contribution to the prediction
of the dependent variable (p ˃ .05). Overall, due to not achieving a significant goodness of fit
value (ANOVA) and having nonsignificant differences in the all coefficients (p values are
nonsignificant, p ˃.05), none of the independent variables contributed any prediction to the
dependent variable.
If any generation and covariate/predictor had made statistically significant contribution to
the prediction of the Total Need for Achievement, the researcher would have identified
multicollinearity by looking at the values of Tolerance and VIF (Table 26). In the first model, the
value of Tolerance is higher than .10 and the value of VIF is less than 10 were detected. Thus,
the researcher would have reported that those scores indicated that the presence of
multicollinearity was not found in the first model (Pallant, 2013). If the first model had showed
significant differences, the assumptions would have been checked through the normal probability
plot (P-P) of the regression standardized residual.

71
Table 26
Coefficients
Unstandardized
Coefficients
Standardized
Coefficients
t Sig.
95%
Confidence
Interval for B Correlations
Collinearity
Statistics
B
Std.
Error Beta
Lower
Bound
Upper
Bound
Zero-
order Partial Part Tolerance VIF
(Constant) 8.790 .778 11.300 .000 7.248 10.333 BabyBoomers -.816 .508 -.201 -1.605 .111 -1.824 .192 -.095 -.156 -.143 .507 1.974
GenerationXers -.354 .395 -.107 -.897 .372 -1.137 .429 .018 -.088 -.080 .559 1.788
Undergrad degree .158 .430 .048 .368 .714 -.695 1.012 .090 .036 .033 .474 2.111
Graduate degree .818 .519 .216 1.574 .119 -.213 1.848 -.031 .153 .141 .424 2.356
Hispanic .499 .345 .150 1.446 .151 -.186 1.184 .185 .140 .129 .740 1.351
Less than 50 .713 .525 .154 1.359 .177 -.328 1.754 .213 .132 .121 .624 1.603
Agriculture .432 1.246 .034 .347 .730 -2.039 2.903 .012 .034 .031 .818 1.222
Mining construction
manufacturing
1.097 .577 .296 1.902 .060 -.047 2.240 .234 .183 .170 .330 3.032
Trade .355 .561 .094 .632 .529 -.758 1.468 -.019 .062 .056 .364 2.750
Assets 1.033 .786 .139 1.314 .192 -.525 2.590 .046 .128 .117 .711 1.406
Service and public
Admin
.373 .543 .100 .687 .494 -.704 1.450 -.052 .067 .061 .380 2.633
Less than 10 years -.594 .399 -.181 -1.490 .139 -1.385 .197 -.145 -.145 -.133 .541 1.847
Note. Dependent Variable: total need for achievement.
Figure 6. Normal probability plot (P-P) of the regression standardized residual.
Total need for achievement vs. generations and controlled covariates/predictors. After
performing multiple linear regression with all of the predictors which resulted in none of the

72
predictors in the model made a statistically significant contribution to the prediction of the
dependent variable (p ˃ .05), nonsignificant independent variables in the model were
systematically removed. To test multiple regression analyses, in compliance with the principle of
parsimony, nonsignificant independent variables were systematically removed until the
remaining variables were significant (the final parsimonious model). Multiple linear regression
was reperformed with Total Need for Achievement as a dependent variable and Baby Boomers,
Generation Xers, and Less than 10 Years (number of years as a business owner) as independent
variables. The value of Adjusted R Square was checked. The score indicated that 4% (rounded)
of the variance in Total Need for Achievement scores was explained by the model (see Table
27). The ANOVA table indicated that the new model with predictors is statistically significant, F
(5, 111) = 2.505, p ˂ .05 (see Table 28).
Table 27
Model Summary
Model R R Square Adjusted R Square Std. Error of the Estimate
.250 .062 .037 1.612
Note. Predictors: (Constant), baby boomers, less than 10 years, generation
Xers. Dependent Variable: total need for achievement.
Table 28
ANOVA
Sum of Squares df Mean Square F Sig.
Regression 37.445 5 7.489 2.505 .046
Residual 275.785 111 2.485
Total 313.231 116
Note. Dependent Variable: total need for achievement. Predictors:
(Constant), baby boomers, less than 10 years, generation Xers.
With the principle of parsimony, nonsignificant variables were removed in the first model
systematically until the final model contains only statistically significant predictors. The
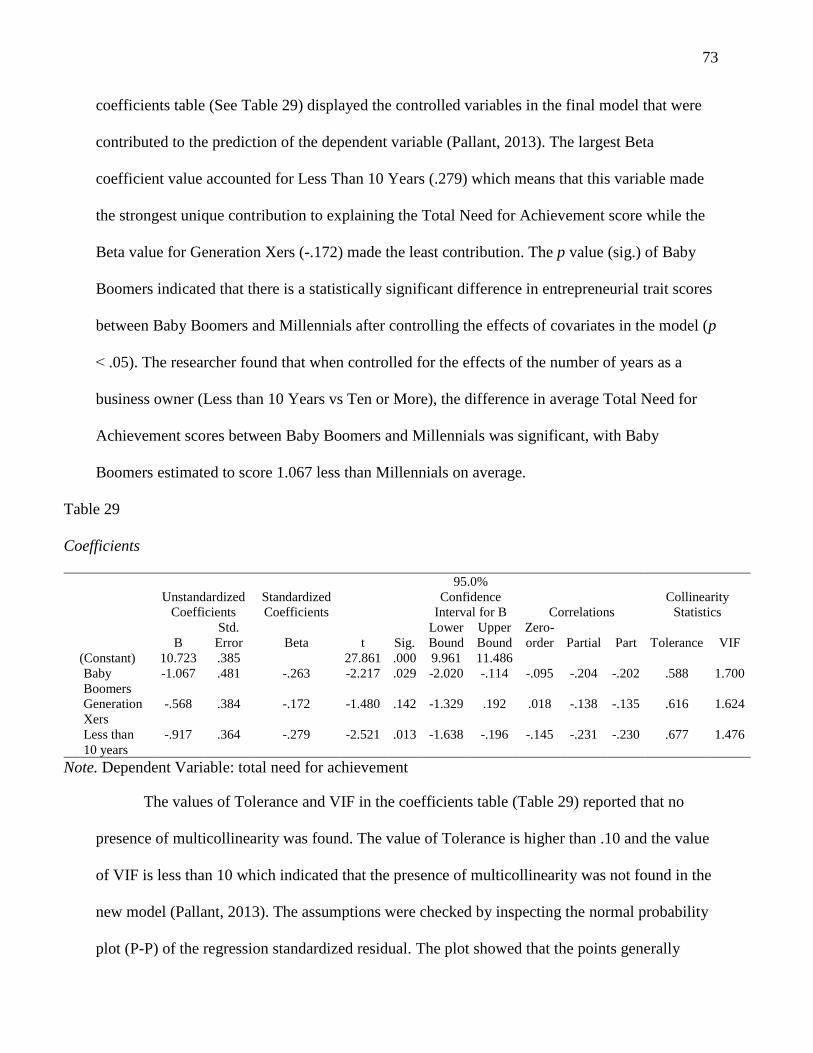
73
coefficients table (See Table 29) displayed the controlled variables in the final model that were
contributed to the prediction of the dependent variable (Pallant, 2013). The largest Beta
coefficient value accounted for Less Than 10 Years (.279) which means that this variable made
the strongest unique contribution to explaining the Total Need for Achievement score while the
Beta value for Generation Xers (-.172) made the least contribution. The p value (sig.) of Baby
Boomers indicated that there is a statistically significant difference in entrepreneurial trait scores
between Baby Boomers and Millennials after controlling the effects of covariates in the model (p
˂ .05). The researcher found that when controlled for the effects of the number of years as a
business owner (Less than 10 Years vs Ten or More), the difference in average Total Need for
Achievement scores between Baby Boomers and Millennials was significant, with Baby
Boomers estimated to score 1.067 less than Millennials on average.
Table 29
Coefficients
Unstandardized
Coefficients
Standardized
Coefficients
t Sig.
95.0%
Confidence
Interval for B Correlations
Collinearity
Statistics
B
Std.
Error Beta
Lower
Bound
Upper
Bound
Zero-
order Partial Part Tolerance VIF
(Constant) 10.723 .385 27.861 .000 9.961 11.486
Baby
Boomers
-1.067 .481 -.263 -2.217 .029 -2.020 -.114 -.095 -.204 -.202 .588 1.700
Generation
Xers
-.568 .384 -.172 -1.480 .142 -1.329 .192 .018 -.138 -.135 .616 1.624
Less than
10 years
-.917 .364 -.279 -2.521 .013 -1.638 -.196 -.145 -.231 -.230 .677 1.476
Note. Dependent Variable: total need for achievement
The values of Tolerance and VIF in the coefficients table (Table 29) reported that no
presence of multicollinearity was found. The value of Tolerance is higher than .10 and the value
of VIF is less than 10 which indicated that the presence of multicollinearity was not found in the
new model (Pallant, 2013). The assumptions were checked by inspecting the normal probability
plot (P-P) of the regression standardized residual. The plot showed that the points generally

74
follow the normal line with no strong deviations which indicated that the residuals were normally
distributed (see Figure 7).
Figure 7. Normal probability plot (P-P) of the regression standardized residual.
Total need for autonomy vs. generations and all covariates/predictors. A multiple linear
regression was conducted to predict whether there is a significant difference in Total Need for
Autonomy scores between generations after controlling the effects of covariates. Initially, the
researcher started with all of the covariates in the model to see how well a number of
independent variables (generation and covariates) could predict the total need for autonomy
scores (dependent variable). Also, how much variance in the dependent variables could be
explained by the independent variable was reported in the initial model. The value of Adjusted R
Square was checked. The value indicated that 3% (rounded) of the variance in total need for
autonomy scores was explained by the model (see Table 30). The ANOVA table indicated that
the model with all covariates/predictors is not statistically significant, F (12, 104) = 1.291, p ˃
.05 (see Table 31).
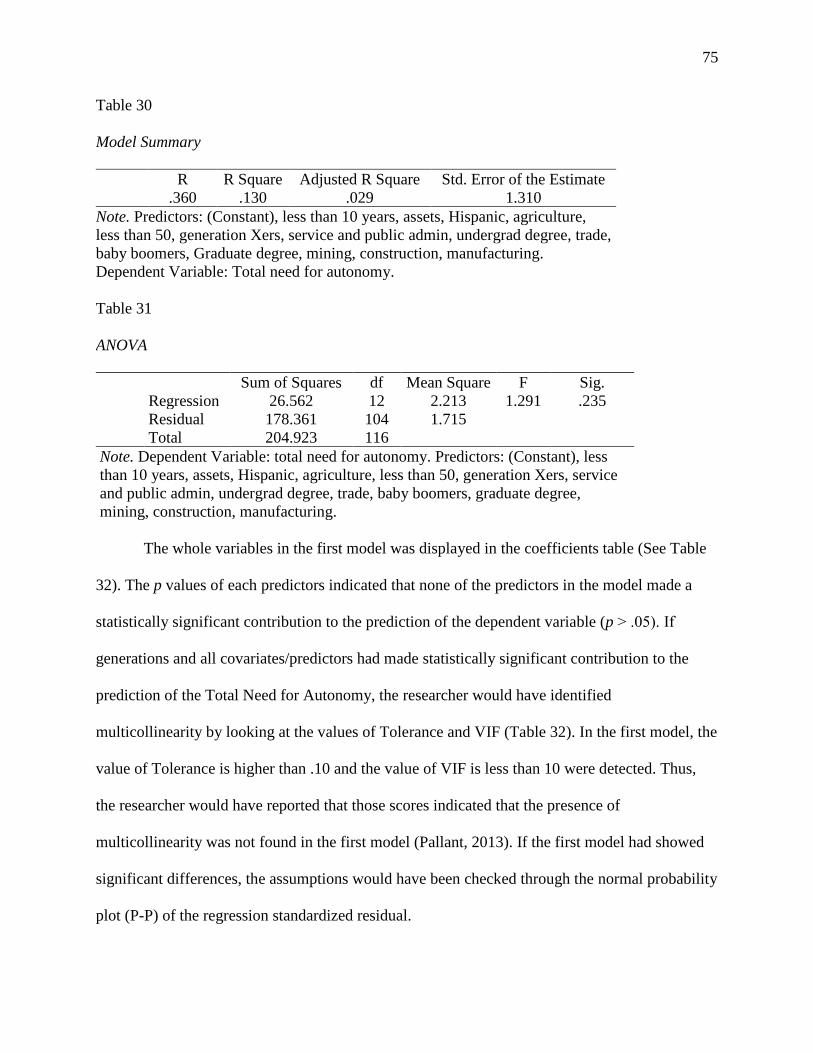
75
Table 30
Model Summary
R R Square Adjusted R Square Std. Error of the Estimate
.360 .130 .029 1.310
Note. Predictors: (Constant), less than 10 years, assets, Hispanic, agriculture,
less than 50, generation Xers, service and public admin, undergrad degree, trade,
baby boomers, Graduate degree, mining, construction, manufacturing.
Dependent Variable: Total need for autonomy.
Table 31
ANOVA
Sum of Squares df Mean Square F Sig.
Regression 26.562 12 2.213 1.291 .235
Residual 178.361 104 1.715
Total 204.923 116
Note. Dependent Variable: total need for autonomy. Predictors: (Constant), less
than 10 years, assets, Hispanic, agriculture, less than 50, generation Xers, service
and public admin, undergrad degree, trade, baby boomers, graduate degree,
mining, construction, manufacturing.
The whole variables in the first model was displayed in the coefficients table (See Table
32). The p values of each predictors indicated that none of the predictors in the model made a
statistically significant contribution to the prediction of the dependent variable (p ˃ .05). If
generations and all covariates/predictors had made statistically significant contribution to the
prediction of the Total Need for Autonomy, the researcher would have identified
multicollinearity by looking at the values of Tolerance and VIF (Table 32). In the first model, the
value of Tolerance is higher than .10 and the value of VIF is less than 10 were detected. Thus,
the researcher would have reported that those scores indicated that the presence of
multicollinearity was not found in the first model (Pallant, 2013). If the first model had showed
significant differences, the assumptions would have been checked through the normal probability
plot (P-P) of the regression standardized residual.

76
Table 32
Coefficients
Unstandardized
Coefficients
Standardized
Coefficients
t Sig.
95.0%
Confidence
Interval for B Correlations
Collinearity
Statistics
B
Std.
Error Beta
Lower
Bound
Upper
Bound
Zero-
order Partial Part
Toler
ance VIF
(Constant) 4.015 .645 6.230 .000 2.737 5.293 Baby Boomers -.080 .421 -.025 -.191 .849 -.916 .755 -.010 -.019 -.017 .507 1.974
Generation Xers -.174 .327 -.065 -.531 .597 -.823 .475 .057 -.052 -.049 .559 1.788
Undergrad degree .436 .357 .163 1.223 .224 -.271 1.143 .222 .119 .112 .474 2.111
Graduate degree -.175 .430 -.057 -.406 .685 -1.028 .679 -.181 -.040 -.037 .424 2.356
Hispanic -.413 .286 -.154 -1.445 .152 -.981 .154 -.042 -.140 -.132 .740 1.351
Less than 50 .177 .435 .047 .406 .685 -.686 1.039 .087 .040 .037 .624 1.603
Agriculture -1.418 1.033 -.139 -1.373 .173 -3.466 .629 -.169 -.133 -.126 .818 1.222
Mining,
construction,
manufacturing
-.228 .478 -.076 -.477 .634 -1.175 .719 .037 -.047 -.044 .330 3.032
Trade -.075 .465 -.024 -.161 .873 -.997 .847 .059 -.016 -.015 .364 2.750
Assets .616 .651 .103 .947 .346 -.674 1.907 .142 .092 .087 .711 1.406
Service and public
admin
-.526 .450 -.174 -1.169 .245 -1.418 .366 -.100 -.114 -.107 .380 2.633
Less than 10 years -.480 .331 -.180 -1.451 .150 -1.135 .176 -.139 -.141 -.133 .541 1.847
Note. Dependent Variable: total need for autonomy.
Statistically nonsignificant difference in the Need for Autonomy scores between
generations after controlling the effects of covariates in the model was detected. Multiple linear
regression was retested by removing nonsignificant variables systematically hoping to reach a
statistically significant difference in the dependent variable between generations (p ˂ .05). In
compliance with the principle of parsimony, however, removing and adding predictors in the
new model to get a significant result did not help. None of the predictors in the model predicted a
significant amount of the variance in the dependent variable. Overall, three generations do not
differ in Total Need for Autonomy after controlling for covariates.
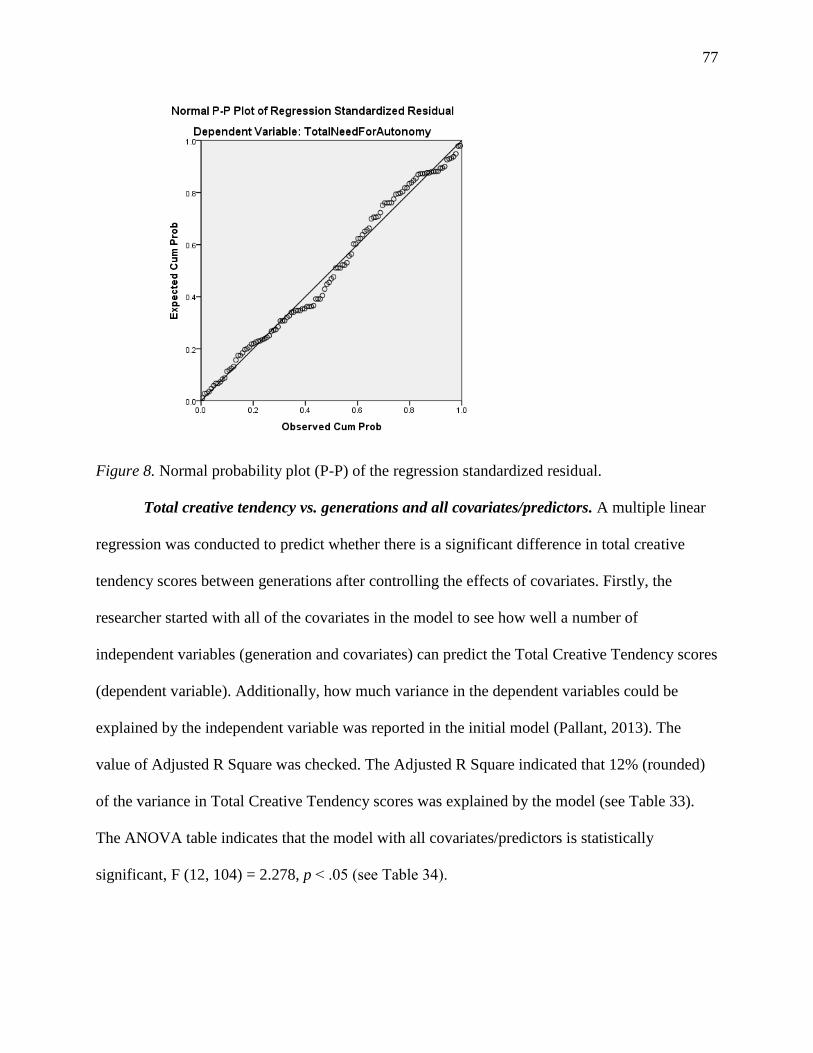
77
Figure 8. Normal probability plot (P-P) of the regression standardized residual.
Total creative tendency vs. generations and all covariates/predictors. A multiple linear
regression was conducted to predict whether there is a significant difference in total creative
tendency scores between generations after controlling the effects of covariates. Firstly, the
researcher started with all of the covariates in the model to see how well a number of
independent variables (generation and covariates) can predict the Total Creative Tendency scores
(dependent variable). Additionally, how much variance in the dependent variables could be
explained by the independent variable was reported in the initial model (Pallant, 2013). The
value of Adjusted R Square was checked. The Adjusted R Square indicated that 12% (rounded)
of the variance in Total Creative Tendency scores was explained by the model (see Table 33).
The ANOVA table indicates that the model with all covariates/predictors is statistically
significant, F (12, 104) = 2.278, p ˂ .05 (see Table 34).

78
Table 33
Model Summary
R R Square
Adjusted R Square Std. Error of the Estimate
.456 .208 .117 1.891
Note. Predictors: (Constant), less than 10 years, assets, Hispanic, agriculture, less than
50, generation Xers, service and public admin, undergrad degree, trade, baby
boomers, graduate degree, mining construction, manufacturing. Dependent Variable:
total creative tendency.
Table 34
ANOVA
Sum of Squares df Mean Square F Sig.
Regression 97.752 12 8.146 2.278 .013
Residual 371.906 104 3.576
Total 469.658 116
Note. Dependent Variable: total creative tendency. Predictors: (Constant), less than
10 years, assets, Hispanic, agriculture, less than 50, generation Xers, service and
public admin, undergrad degree, trade, baby boomers, graduate degree, mining,
construction, and manufacturing.
The coefficients table (See Table 35) indicated that the p values of Trade (type of
business) and Service and Public Administrations (type of business) predictors made a
statistically significant contribution to the prediction of the dependent variable (p ˂ .05) while
other predictors in the first model did not make any statistically significant contribution (p ˃ .05).
If generations and all covariates/predictors had made statistically significant contribution to the
prediction of the Total Creative Tendency, the researcher would have identified multicollinearity
by looking at the values of Tolerance and VIF (Table 35). In the first model, the value of
Tolerance is higher than .10 and the value of VIF is less than 10 were detected. Thus, the
researcher would have reported that those scores indicate that the presence of multicollinearity
was not found in the first model (Pallant, 2013). If the first model had showed significant

79
differences, the assumptions would have been checked through the normal probability plot (P-P)
of the regression standardized residual.
Table 35
Coefficients
Unstandardized
Coefficients
Standardized
Coefficients
t Sig.
95.0%
Confidence
Interval for B Correlations
Collinearity
Statistics
B
Std.
Error Beta
Lower
Bound
Upper
Bound
Zero-
order Partial Part
Toler
ance VIF
(Constant) 7.022 .931 7.545 .000 5.177 8.868
Baby Boomers -.262 .608 -.053 -.430 .668 -1.468 .945 -.114 -.042 -.038 .507 1.974
Generation Xers -.342 .473 -.085 -.725 .470 -1.280 .595 -.071 -.071 -.063 .559 1.788
Undergrad degree .575 .515 .142 1.118 .266 -.446 1.596 -.061 .109 .098 .474 2.111
Graduate degree .722 .622 .156 1.162 .248 -.510 1.954 .193 .113 .101 .424 2.356
Hispanic -.138 .413 -.034 -.334 .739 -.957 .681 -.144 -.033 -.029 .740 1.351
Less than 50 .064 .628 .011 .102 .919 -1.181 1.310 -.175 .010 .009 .624 1.603
Agriculture -.221 1.491 -.014 -.148 .882 -3.178 2.735 .077 -.015 -.013 .818 1.222
Mining, construction,
manufacturing
-
1.341
.690 -.295 -1.945 .055 -2.709 .026 -.097 -.187 -.170 .330 3.032
Trade -
2.002
.671 -.431 -2.982 .004 -3.334 -.671 -.212 -.281 -.260 .364 2.750
Assets .514 .940 .057 .546 .586 -1.350 2.377 .194 .054 .048 .711 1.406
Service and public
admin
-
1.307
.650 -.285 -2.012 .047 -2.596 -.019 -.076 -.194 -.176 .380 2.633
Less than 10 years .343 .477 .085 .718 .474 -.604 1.289 .238 .070 .063 .541 1.847
Note. Dependent Variable: total creative tendency.
Figure 9. Normal probability plot (P-P) of the regression standardized residual.

80
Total creative tendency vs. generations and controlled covariates/predictors. Multiple
linear regression with two predictors (Trade and Service and Public Administrations) in the
model made a statistically significant contribution to the prediction of the dependent variable (p
˂ .05). However, remaining predictors in the first model showed nonsignificant contribution to
the prediction of the dependent variable (p ˃ .05). Therefore, nonsignificant independent
variables in the new model were systematically removed in compliance with the parsimonious
model. Multiple linear regression was reperformed with Total Creative Tendency as a dependent
variable and Baby Boomers, Generation Xers, and Trade (type of business) as independent
variables. The value of Adjusted R Square was checked. The score indicated that 7% (rounded)
of the variance in Total Creative Tendency scores was explained by the model (see Table 36).
The ANOVA table indicated that the new model with predictors is statistically significant, F (3,
113) = 3.746, p ˂ .05 (see Table 37).
Table 36
Model Summary
R R Square Adjusted R Square Std. Error of the Estimate
.301 .090 .066 1.944
Note. Predictors: (Constant), trade, generation Xers, assets, baby boomers.
Dependent Variable: total creative tendency.
Table 37
ANOVA
Sum of Squares df Mean Square F Sig.
Regression 42.484 3 14.161 3.746 .013b
Residual 427.174 113 3.780
Total 469.658 116
Note. Dependent Variable: Total Creative Tendency, b. Predictors: (Constant), Trade,
Generation Xers, Baby Boomers.

81
With the principle of parsimony, nonsignificant variables were removed in the first model
systematically until the final model contains only statistically significant predictors. The
coefficients table (See Table 38) indicated the contribution of each independent variable to
explaining the dependent variable (Pallant, 2013). The largest Beta coefficient value of -.247
(ignoring the negative sign) accounted for Trade (type of business) which indicated that the
variable made the strongest unique contribution to explaining The Total Creative Tendency
score. The Beta value for Generation Xers made the least contribution (-.174). The p value of
Baby Boomers indicated that there is a statistically significant difference in entrepreneurial trait
scores between Baby Boomers and Millennials after controlling the effects of Trade in the model
(p ˂ .05).
Table 38
Coefficients
Unstandardized
Coefficients
Standardized
Coefficients
t Sig.
95.0%
Confidence
Interval for B Correlations
Collinearity
Statistics
B
Std.
Error Beta
Lower
Bound
Upper
Bound
Zero-
order Partial Part Tolerance VIF
(Constant) 7.141 .327 21.847 .000 6.493 7.788 Baby Boomers -1.122 .503 -.226 -2.233 .028 -2.118 -.127 -.114 -.206 -.200 .784 1.275
Generation Xers -.706 .406 -.174 -1.738 .085 -1.510 .099 -.071 -.161 -.156 .801 1.248
Trade -1.146 .422 -.247 -2.714 .008 -1.983 -.310 -.212 -.247 -.243 .971 1.030
Note. Dependent Variable: Total Creative Tendency
The values of Tolerance and VIF in the coefficients table (Table 38) reported that no
presence of multicollinearity was found. The value of Tolerance is higher than .10 and the value
of VIF is less than 10 which indicated that the presence of multicollinearity was not found in the
model (Pallant, 2013). The assumptions were checked by inspecting the normal probability plot
(P-P) of the regression standardized residual. The plot shows that the points generally follow the
normal line with no strong deviations which indicated that the residuals were normally
distributed (see Figure 10).
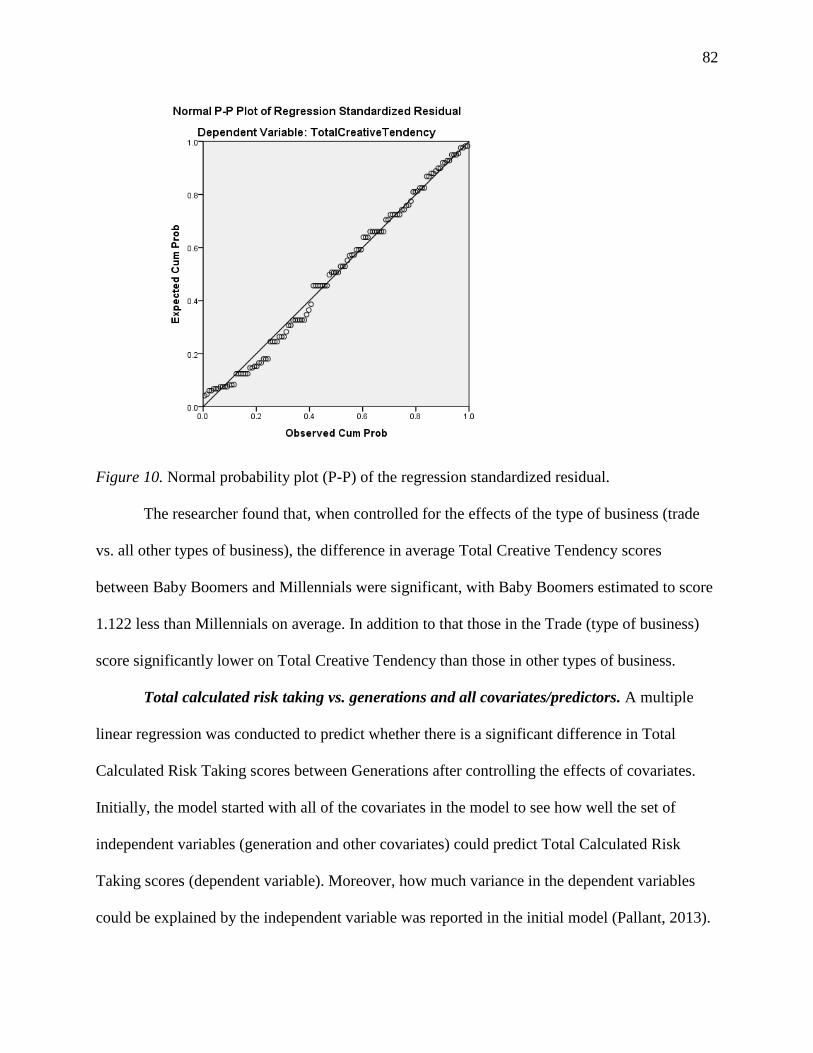
82
Figure 10. Normal probability plot (P-P) of the regression standardized residual.
The researcher found that, when controlled for the effects of the type of business (trade
vs. all other types of business), the difference in average Total Creative Tendency scores
between Baby Boomers and Millennials were significant, with Baby Boomers estimated to score
1.122 less than Millennials on average. In addition to that those in the Trade (type of business)
score significantly lower on Total Creative Tendency than those in other types of business.
Total calculated risk taking vs. generations and all covariates/predictors. A multiple
linear regression was conducted to predict whether there is a significant difference in Total
Calculated Risk Taking scores between Generations after controlling the effects of covariates.
Initially, the model started with all of the covariates in the model to see how well the set of
independent variables (generation and other covariates) could predict Total Calculated Risk
Taking scores (dependent variable). Moreover, how much variance in the dependent variables
could be explained by the independent variable was reported in the initial model (Pallant, 2013).

83
The value of Adjusted R Square was checked. The Adjusted R Square indicated that 3%
(rounded) of the variance in Total Calculated Risk Taking scores was explained by the model
(see Table 39). The ANOVA table indicates that the model with all covariates/predictors is not
statistically significant, F (12, 104) = 1.263, p ˃ .05 (see Table 40).
Table 39
Model Summary
R R Square Adjusted R Square Std. Error of the Estimate
.357 .127 .026 1.793
Note. Predictors: (Constant), less than 10 years, assets, Hispanic, agriculture,
less than 50, generation Xers, service and public admin, undergrad degree,
trade, baby boomers, graduate degree, mining, construction, manufacturing.
Dependent Variable: Total calculated risk taking.
Table 40
ANOVA
Sum of Squares df Mean Square F Sig.
Regression 48.732 12 4.061 1.263 .252
Residual 334.414 104 3.216
Total 383.145 116
Note. Dependent Variable: total calculated risk taking. Predictors: (Constant),
less than 10 years, assets, Hispanic, agriculture, less than 50, generation Xers,
service and public admin, undergrad degree, trade, baby boomers, graduate
degree, mining, construction, manufacturing.
The coefficients table (See Table 41) was presented as part of the multiple regression
procedure. The p values of each predictors indicated that none of the predictors in the model
made a statistically significant contribution to the prediction of the dependent variable (p ˃ .05).
Overall, due to not achieving a significant goodness of fit value (ANOVA) and having
nonsignificant differences in the all coefficients (p values are nonsignificant, p ˃.05), none of the
independent variables can contribute any prediction to the dependent variable.
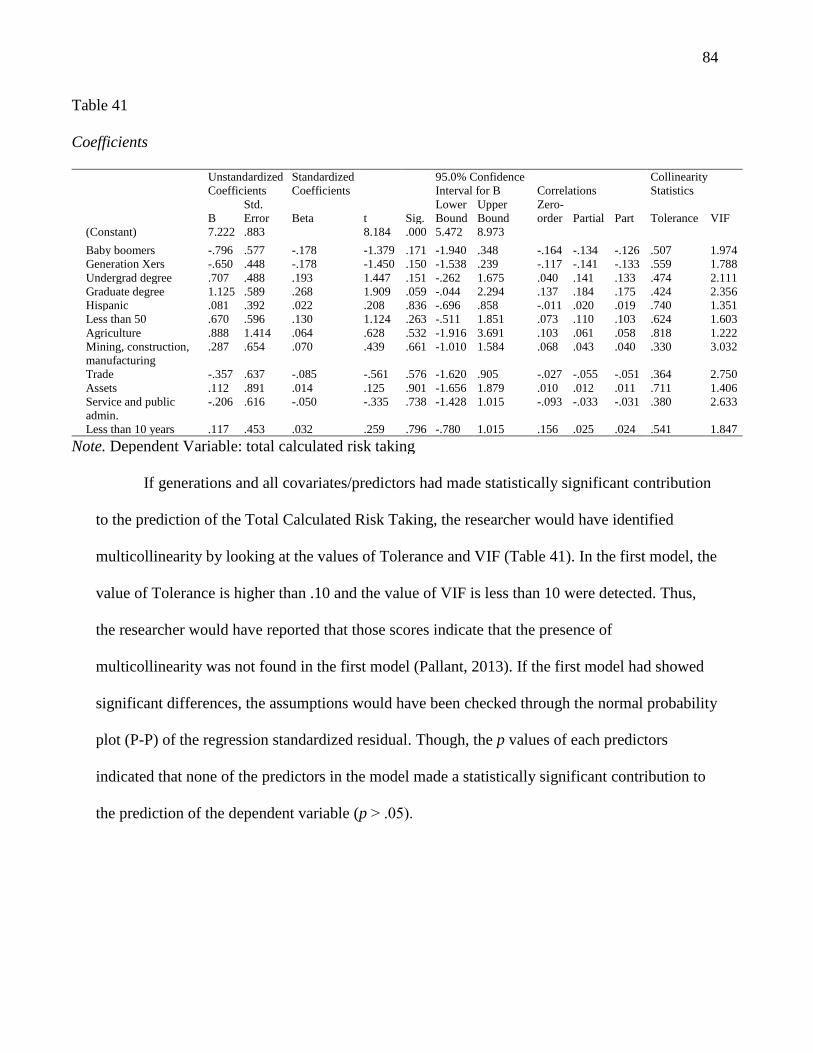
84
Table 41
Coefficients
Unstandardized
Coefficients
Standardized
Coefficients
t Sig.
95.0% Confidence
Interval for B Correlations
Collinearity
Statistics
B
Std.
Error Beta
Lower
Bound
Upper
Bound
Zero-
order Partial Part Tolerance VIF
(Constant) 7.222 .883 8.184 .000 5.472 8.973 Baby boomers -.796 .577 -.178 -1.379 .171 -1.940 .348 -.164 -.134 -.126 .507 1.974
Generation Xers -.650 .448 -.178 -1.450 .150 -1.538 .239 -.117 -.141 -.133 .559 1.788
Undergrad degree .707 .488 .193 1.447 .151 -.262 1.675 .040 .141 .133 .474 2.111
Graduate degree 1.125 .589 .268 1.909 .059 -.044 2.294 .137 .184 .175 .424 2.356
Hispanic .081 .392 .022 .208 .836 -.696 .858 -.011 .020 .019 .740 1.351
Less than 50 .670 .596 .130 1.124 .263 -.511 1.851 .073 .110 .103 .624 1.603
Agriculture .888 1.414 .064 .628 .532 -1.916 3.691 .103 .061 .058 .818 1.222
Mining, construction,
manufacturing
.287 .654 .070 .439 .661 -1.010 1.584 .068 .043 .040 .330 3.032
Trade -.357 .637 -.085 -.561 .576 -1.620 .905 -.027 -.055 -.051 .364 2.750
Assets .112 .891 .014 .125 .901 -1.656 1.879 .010 .012 .011 .711 1.406
Service and public
admin.
-.206 .616 -.050 -.335 .738 -1.428 1.015 -.093 -.033 -.031 .380 2.633
Less than 10 years .117 .453 .032 .259 .796 -.780 1.015 .156 .025 .024 .541 1.847
Note. Dependent Variable: total calculated risk taking
If generations and all covariates/predictors had made statistically significant contribution
to the prediction of the Total Calculated Risk Taking, the researcher would have identified
multicollinearity by looking at the values of Tolerance and VIF (Table 41). In the first model, the
value of Tolerance is higher than .10 and the value of VIF is less than 10 were detected. Thus,
the researcher would have reported that those scores indicate that the presence of
multicollinearity was not found in the first model (Pallant, 2013). If the first model had showed
significant differences, the assumptions would have been checked through the normal probability
plot (P-P) of the regression standardized residual. Though, the p values of each predictors
indicated that none of the predictors in the model made a statistically significant contribution to
the prediction of the dependent variable (p ˃ .05).

85
Figure 11. Normal probability plot (P-P) of the regression standardized residual.
Total calculated risk taking vs. generations and controlled covariates/predictors.
Multiple linear regression with the all of the predictors resulted in none of the predictors in the
model made a statistically significant contribution to the prediction of Total Calculated Risk
Taking score (p ˃ .05). Therefore, nonsignificant independent variables in the model were
systematically removed in compliance with the principle of parsimony. Multiple linear
regression was reperformed until the model reached the significant level with Total Calculated
Risk Taking score as a dependent variable and Baby Boomers, Generation Xers, Graduate
Degree (education level), and Undergrad Degree (education level) as independent variables. The
value of Adjusted R Square was checked. The score indicated that 6% of the variance in Total
Calculated Risk Taking scores was explained by the model (see Table 42). The ANOVA table

86
indicates that the new model with predictors is statistically significant, F (4, 112) = 2.949, p ˂
.05 (see Table 43).
Table 42
Model Summary
R R Square Adjusted R Square Std. Error of the Estimate
.309 .095 .063 1.759
Note. Predictors: (Constant), Graduate degree, Baby Boomers, Generation Xers,
Undergrad degree.
Table 43
ANOVA
Sum of Squares df Mean Square F Sig.
Regression 36.503 4 9.126 2.949 .023
Residual 346.642 112 3.095
Total 383.145 116
Note. Dependent Variable: Total Calculated Risk Taking. Predictors: (Constant), Graduate
degree, Baby Boomers, Generation Xers, Undergrad degree
The contribution of each independent variable to explain the dependent variable was
indicated by the coefficients table indicated (see Table 44). The largest Beta coefficient value of
-.212 (ignoring the negative sign) accounted for Baby Boomers which means that this variable
made the strongest unique contribution to explain the Total Creative Tendency score. The Beta
value of Undergrad Degree (education) made the least contribution (.189). The p values of Baby
Boomers and Generation Xers indicated that there is a statistically significant difference in
entrepreneurial trait scores between Baby Boomers and Millennials, and Generation Xers and
Millennials after controlling the effects of covariates in the model (p ˂ .05).
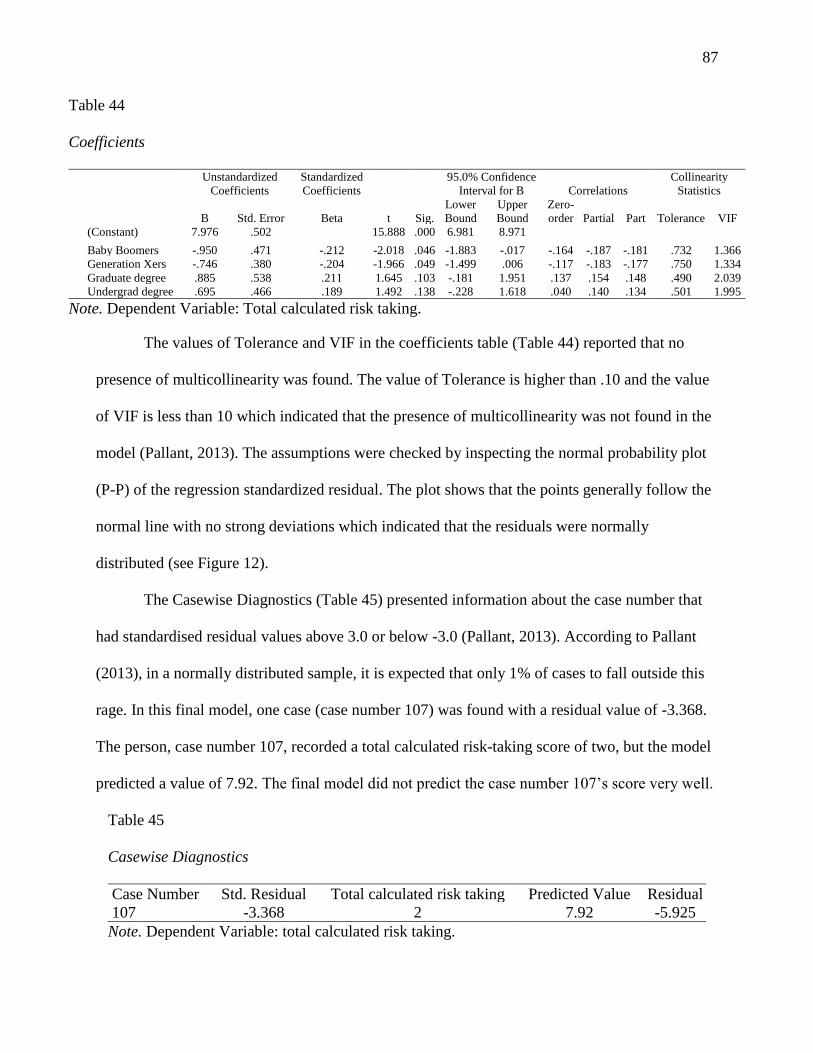
87
Table 44
Coefficients
Unstandardized
Coefficients
Standardized
Coefficients
t Sig.
95.0% Confidence
Interval for B Correlations
Collinearity
Statistics
B Std. Error Beta
Lower
Bound
Upper
Bound
Zero-
order Partial Part Tolerance VIF
(Constant) 7.976 .502 15.888 .000 6.981 8.971 Baby Boomers -.950 .471 -.212 -2.018 .046 -1.883 -.017 -.164 -.187 -.181 .732 1.366
Generation Xers -.746 .380 -.204 -1.966 .049 -1.499 .006 -.117 -.183 -.177 .750 1.334
Graduate degree .885 .538 .211 1.645 .103 -.181 1.951 .137 .154 .148 .490 2.039
Undergrad degree .695 .466 .189 1.492 .138 -.228 1.618 .040 .140 .134 .501 1.995
Note. Dependent Variable: Total calculated risk taking.
The values of Tolerance and VIF in the coefficients table (Table 44) reported that no
presence of multicollinearity was found. The value of Tolerance is higher than .10 and the value
of VIF is less than 10 which indicated that the presence of multicollinearity was not found in the
model (Pallant, 2013). The assumptions were checked by inspecting the normal probability plot
(P-P) of the regression standardized residual. The plot shows that the points generally follow the
normal line with no strong deviations which indicated that the residuals were normally
distributed (see Figure 12).
The Casewise Diagnostics (Table 45) presented information about the case number that
had standardised residual values above 3.0 or below -3.0 (Pallant, 2013). According to Pallant
(2013), in a normally distributed sample, it is expected that only 1% of cases to fall outside this
rage. In this final model, one case (case number 107) was found with a residual value of -3.368.
The person, case number 107, recorded a total calculated risk-taking score of two, but the model
predicted a value of 7.92. The final model did not predict the case number 107’s score very well.
Table 45
Casewise Diagnostics
Case Number Std. Residual Total calculated risk taking Predicted Value Residual
107 -3.368 2 7.92 -5.925
Note. Dependent Variable: total calculated risk taking.
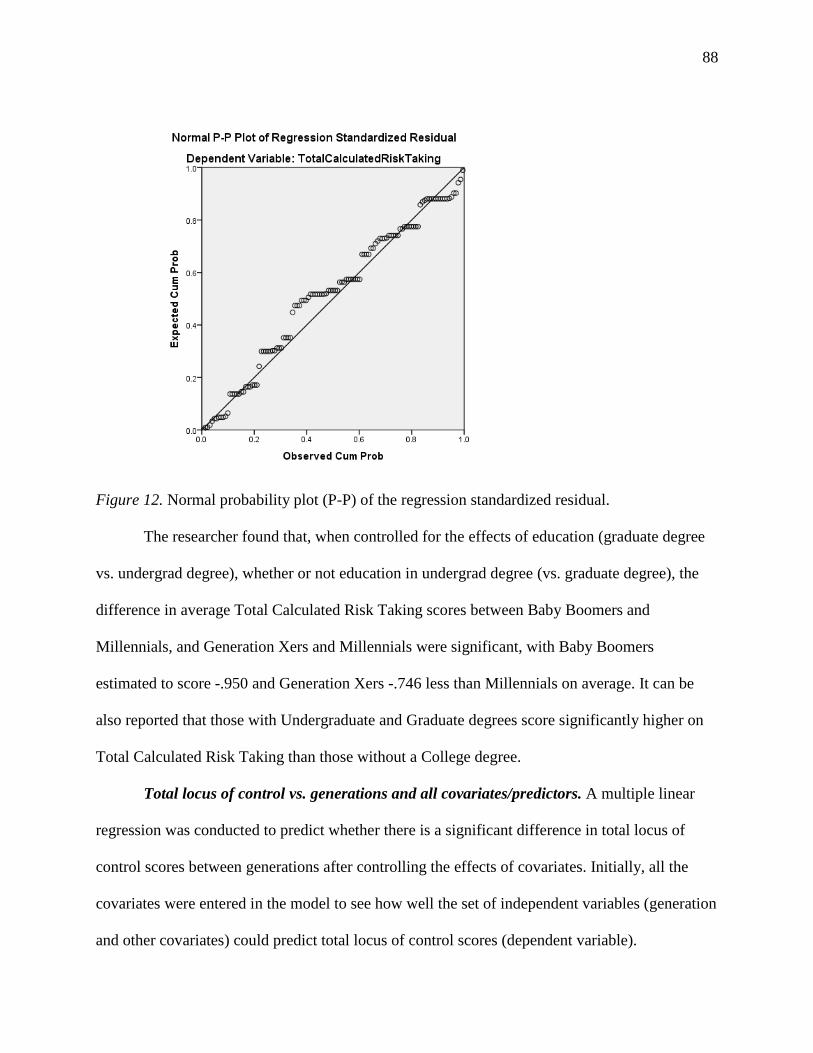
88
Figure 12. Normal probability plot (P-P) of the regression standardized residual.
The researcher found that, when controlled for the effects of education (graduate degree
vs. undergrad degree), whether or not education in undergrad degree (vs. graduate degree), the
difference in average Total Calculated Risk Taking scores between Baby Boomers and
Millennials, and Generation Xers and Millennials were significant, with Baby Boomers
estimated to score -.950 and Generation Xers -.746 less than Millennials on average. It can be
also reported that those with Undergraduate and Graduate degrees score significantly higher on
Total Calculated Risk Taking than those without a College degree.
Total locus of control vs. generations and all covariates/predictors. A multiple linear
regression was conducted to predict whether there is a significant difference in total locus of
control scores between generations after controlling the effects of covariates. Initially, all the
covariates were entered in the model to see how well the set of independent variables (generation
and other covariates) could predict total locus of control scores (dependent variable).
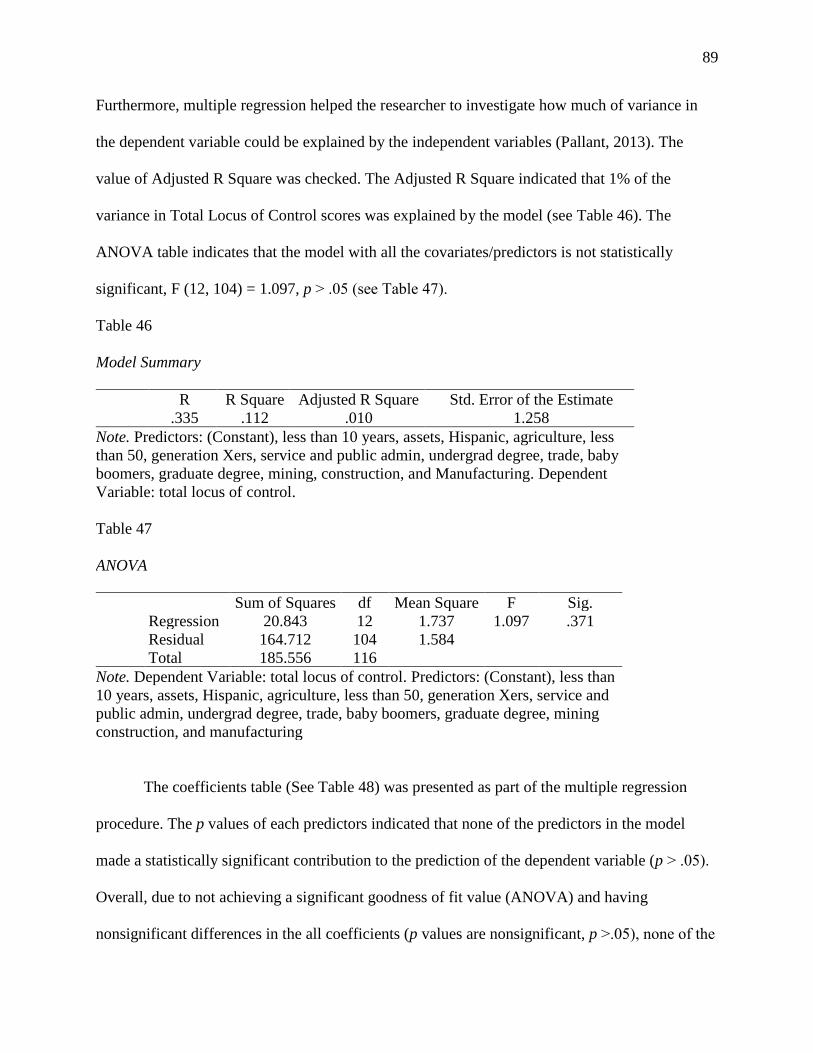
89
Furthermore, multiple regression helped the researcher to investigate how much of variance in
the dependent variable could be explained by the independent variables (Pallant, 2013). The
value of Adjusted R Square was checked. The Adjusted R Square indicated that 1% of the
variance in Total Locus of Control scores was explained by the model (see Table 46). The
ANOVA table indicates that the model with all the covariates/predictors is not statistically
significant, F (12, 104) = 1.097, p ˃ .05 (see Table 47).
Table 46
Model Summary
R R Square Adjusted R Square Std. Error of the Estimate
.335 .112 .010 1.258
Note. Predictors: (Constant), less than 10 years, assets, Hispanic, agriculture, less
than 50, generation Xers, service and public admin, undergrad degree, trade, baby
boomers, graduate degree, mining, construction, and Manufacturing. Dependent
Variable: total locus of control.
Table 47
ANOVA
Sum of Squares df Mean Square F Sig.
Regression 20.843 12 1.737 1.097 .371
Residual 164.712 104 1.584
Total 185.556 116
Note. Dependent Variable: total locus of control. Predictors: (Constant), less than
10 years, assets, Hispanic, agriculture, less than 50, generation Xers, service and
public admin, undergrad degree, trade, baby boomers, graduate degree, mining
construction, and manufacturing
The coefficients table (See Table 48) was presented as part of the multiple regression
procedure. The p values of each predictors indicated that none of the predictors in the model
made a statistically significant contribution to the prediction of the dependent variable (p ˃ .05).
Overall, due to not achieving a significant goodness of fit value (ANOVA) and having
nonsignificant differences in the all coefficients (p values are nonsignificant, p ˃.05), none of the
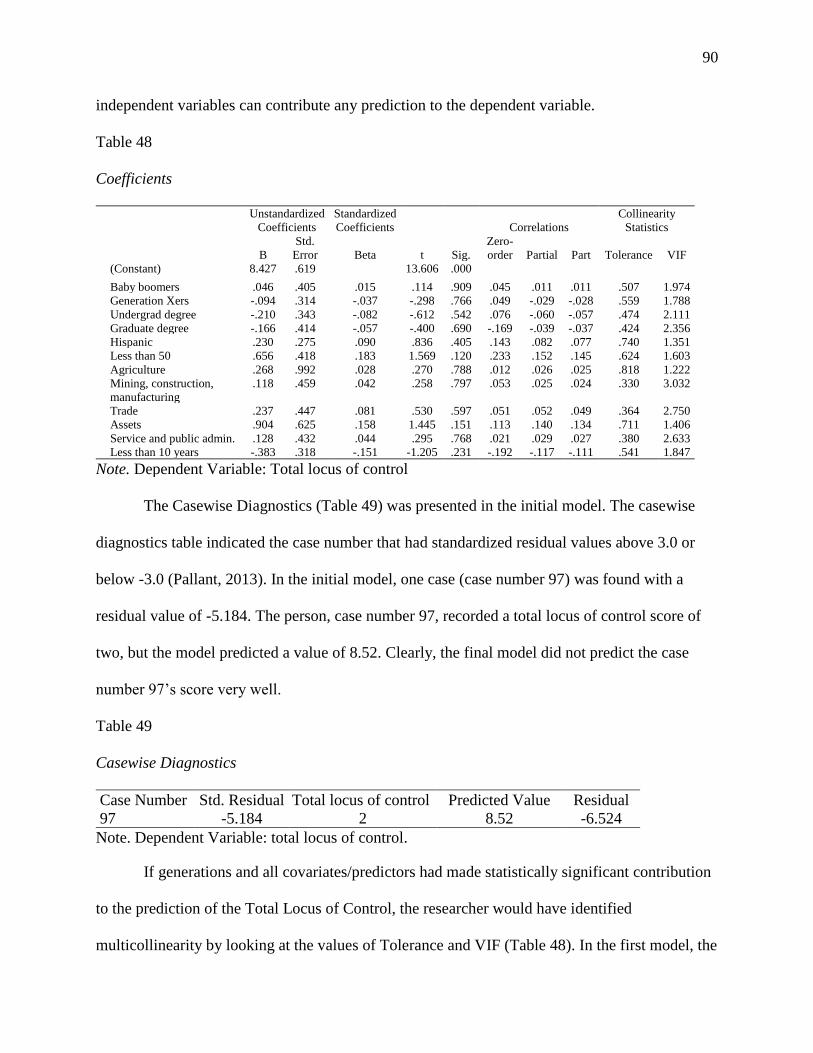
90
independent variables can contribute any prediction to the dependent variable.
Table 48
Coefficients
Unstandardized
Coefficients
Standardized
Coefficients
t Sig.
Correlations
Collinearity
Statistics
B
Std.
Error Beta
Zero-
order Partial Part Tolerance VIF
(Constant) 8.427 .619 13.606 .000 Baby boomers .046 .405 .015 .114 .909 .045 .011 .011 .507 1.974
Generation Xers -.094 .314 -.037 -.298 .766 .049 -.029 -.028 .559 1.788
Undergrad degree -.210 .343 -.082 -.612 .542 .076 -.060 -.057 .474 2.111
Graduate degree -.166 .414 -.057 -.400 .690 -.169 -.039 -.037 .424 2.356
Hispanic .230 .275 .090 .836 .405 .143 .082 .077 .740 1.351
Less than 50 .656 .418 .183 1.569 .120 .233 .152 .145 .624 1.603
Agriculture .268 .992 .028 .270 .788 .012 .026 .025 .818 1.222
Mining, construction,
manufacturing
.118 .459 .042 .258 .797 .053 .025 .024 .330 3.032
Trade .237 .447 .081 .530 .597 .051 .052 .049 .364 2.750
Assets .904 .625 .158 1.445 .151 .113 .140 .134 .711 1.406
Service and public admin. .128 .432 .044 .295 .768 .021 .029 .027 .380 2.633
Less than 10 years -.383 .318 -.151 -1.205 .231 -.192 -.117 -.111 .541 1.847
Note. Dependent Variable: Total locus of control
The Casewise Diagnostics (Table 49) was presented in the initial model. The casewise
diagnostics table indicated the case number that had standardized residual values above 3.0 or
below -3.0 (Pallant, 2013). In the initial model, one case (case number 97) was found with a
residual value of -5.184. The person, case number 97, recorded a total locus of control score of
two, but the model predicted a value of 8.52. Clearly, the final model did not predict the case
number 97’s score very well.
Table 49
Casewise Diagnostics
Case Number Std. Residual Total locus of control Predicted Value Residual
97 -5.184 2 8.52 -6.524
Note. Dependent Variable: total locus of control.
If generations and all covariates/predictors had made statistically significant contribution
to the prediction of the Total Locus of Control, the researcher would have identified
multicollinearity by looking at the values of Tolerance and VIF (Table 48). In the first model, the

91
value of Tolerance is higher than .10 and the value of VIF is less than 10 were detected. Thus,
the researcher would have reported that those scores indicate that the presence of
multicollinearity was not found in the first model (Pallant, 2013). If the first model had showed
significant differences, the assumptions would have been checked through the normal probability
plot (P-P) of the regression standardized residual. Though, the p values of each predictors
indicated that none of the predictors in the model made a statistically significant.
Figure 13. Normal probability plot (P-P) of the regression standardized residual.
Nonsignificant difference in Total Locus of Control scores between generations after
controlling the effects of covariates in the model was detected. In compliance with the principle
of parsimony method, multiple linear regression was retested by removing nonsignificant
variables systematically until the researcher reached a statistically significant difference in the
dependent variable between generations (p ˂ .05). However, removing and adding predictors in
the new model to get a significant result did not help. None of the predictors in the model
predicted a significant amount of the variance in the dependent variable.
92
Summary of Results
This study examined three generations of entrepreneurs and their entrepreneurial traits
(enterprising tendencies). The study was to investigate the relationship between entrepreneurial
traits and generations of US entrepreneurs in Southwest (San Antonio), Northeast (Dallas),
Center (Austin), and Southeast (Houston) in Texas, to see whether generational differences are
associated with entrepreneurial traits. Generation of entrepreneur was defined as Baby Boomers,
Generation Xers, and Millennials. Entrepreneurial traits were categorized as need for
achievement, need for autonomy, creative tendency, calculated risk taking, and locus of control.
During the period of December 2016 and March 2017, a total of 117 Texans
entrepreneurs from different generations participated in the study to measure generational
differences in entrepreneurial traits. A demographic survey instrument analyzed the
demographics of the sample size. The GET2 instrument was employed to scale enterprising
tendencies of participants.
Four research questions were investigated in this quantitative research study. The
research questions of one and two were investigated through descriptive research methods. A
descriptive statistical analysis using frequencies and percentages were used to describe the
distributions of entrepreneurial traits of entrepreneurs and the distributions of generations
represented by entrepreneurs. Two hypotheses were tested (question three and question four) in
the study. Data were analyzed by using different statistical methods including One-way ANOVA
and Multiple Regression test for the research question three and four. Chapter Five covers an
interpretation of the findings.
93
Chapter Five—Discussion, Conclusions, and Recommendations
Introduction
Entrepreneurship was described as a multidisciplinary field which benefited significantly
from economics and social psychology (Bezzina, 2010; Singh & Denoble, 2003). In social
psychology literature, the characteristics of entrepreneurship were well documented by many
researchers (Caird, 1990a, 1991a, 1991b; McClelland, 1987). Psychological entrepreneurial
characteristics that have received meticulous attention in the entrepreneurial literature are: need
for achievement, need for autonomy, need for creative tendency, calculated risk taking, and locus
of control.
Regardless of generational differences, the important role of entrepreneurial activity in
the United States economic growth has been stressed by economists for many decades (Tang &
Koveos, 2004). The level of entrepreneurship in the United States has a significant positive effect
on the level of local economic growth and development (Goetz, Partridge, Deller, & Fleming,
2010; Hafer, 2013; Moller, Schjerning, & Sorensen, 2011). Having addressed the importance of
the entrepreneurship in the Unites States economy growth, understanding generational
differences in entrepreneurship traits could also contribute to stimulating and boosting the United
States economy.
The last chapter is the conclusion of the study and contains the discussions, and
recommendations for further research. The results were derived from 117 Texan entrepreneurs
from three different generations: Baby Boomers, Generation Xers, and Millennials. The purpose
of this study was to investigate the relationship between entrepreneurial traits and generations of
US entrepreneurs in Southwest (San Antonio), Northeast (Dallas), Center (Austin), and
94
Southeast (Houston) in Texas, to see whether generational differences are associated with
entrepreneurial traits.
The quantitative methodology approach was designed to investigate from 117
entrepreneurs who deal with operating small-business companies as self-employers, critical
characteristic traits of different generations of entrepreneurs, the relationship between
generations and entrepreneurial traits, and to provide a description of the enterprising tendencies
of Texans (San Antonio, Dallas, Houston, and Austin) based entrepreneurs. Two descriptive and
two null hypotheses research questions were developed for this study. Using statistical analyses,
four research questions were addressed for the study:
1) What are the distributions of entrepreneurial traits of entrepreneurs?
2) What are the distributions of generations represented by entrepreneurs?
3) Is there a significant difference in entrepreneurial trait scores between generations?
4) Is there is significant difference in entrepreneurial trait scores between generations
after controlling the effects of covariates?
Interpretation of the findings
What are the distributions of entrepreneurial traits of entrepreneurs? Quantitative
descriptive statistics was used to describe the basic features of data through frequency analysis
and distributions, to summarize and measure the data by mean (measure of central tendency),
standard deviation (the spread of scores and relation to the sample mean), range, and variance to
answer this question (Creswell, 2012). A total of 117 entrepreneurs who deal with operating
small-business companies and are registered at EO as self-employers in San Antonio, Dallas,
Houston, and Austin Texas, responded to the invitation to participate in this study.
Entrepreneurial traits (enterprising tendency) questions were asked participants to examine the

95
distribution of entrepreneurial traits within the three different generations of entrepreneurs. Each
entrepreneurship trait was treated as continuous variable.
To assess normal distribution of the entrepreneurial traits, Skewness (an indication of the
symmetry of the distribution) and Kurtosis (an indication of the peakedness of the distribution)
values were considered. According to Sekaran and Bougie (2013), attributes or characteristics of
a certain population are generally normal distributed. Skewness scores for Need for Achievement
(-.650), Need for Autonomy (-.177), Calculated Risk Taking (-.822), and Locus of Control (-
1.946) were detected as negative which means there is a tendency for values to cluster just to the
right of the mean and the left tail is too long (Tabachnick & Fidell, 2013). Only Creative
Tendency had a positive skewness score (.087) which indicated that there is a tendency for
values to cluster just to the left of the mean and right tail is too long (Tabachnick & Fidell,
2013). Kurtosis scores for each entrepreneurial trait were checked. Need for achievement (-.244),
Need for Autonomy (-.309), and Creative Tendency (-.829) have negative kurtosis scores which
indicated that a distribution that is too flat with many cases in the tails (Tabachnick & Fidell,
2013). However, Calculated Risk Taking (.632) and Locus of Control (7.258) had positive
kurtosis scores which indicated that a distribution that is too peaked with short and thick tails
(Tabachnic & Fidell, 2013). In the case of locus of control, the presence of one or two outliers
may hide significant effects of generation and other covariates on average locus of control. The
data for Need for Achievement, Need for Autonomy, Calculated Risk Taking, and Locus of
Control are not normally distributed on the dependent variables. However, the score of Creative
Tendency (.087) was considered as normally distributed because the score was not sufficiently
far from 0 to generate any concern.

96
Kolmogorov-Smirnov statistic was also checked to assess the normality of the
distribution of scores on dependent variables. In Table 16, test of normality was presented. Each
entrepreneurial trait was significant (p ˂ .05) which indicates that the data are not normally
distributed on dependent variables. In other words, the significance p value indicates a violation
of the assumption of normality (Pallant, 2013).
Overall, the score of Need for Achievement was observed higher than any other
entrepreneurial traits based upon the 12 items scale (mean: 9.85 out of 12 possible highest score).
Locus of Control had the second highest score based upon the same 12 items scale which
accounted for 8.89 out of 12 possible highest score. Respectively, Total Calculating Risk Taking
(8.09 out of 12 possible highest score) and Total Creative Tendency (6.32 out of 12 possible
highest score). Total Need for Autonomy accounted for 3.69 in mean score which can only
achieve a maximum score of 6.
What are the distributions of generations represented by entrepreneurs? In the
study, the three generations were a single variable with three categories: baby boomers (1946-
1960), generation Xers (1961-1980), and millennials (1981-1999), as an independent variable.
To identify each entrepreneurs’ average age was crucial in the survey. The level of
entrepreneurial traits was a single dependent variable with three categories; high, medium, and
low. Five entrepreneurial traits were scored in three categories: the high General Enterprising
Tendency score was ranked between 44-54. Entrepreneurs who have a medium enterprising
tendency was limited between 27-43 while entrepreneurs who have a low enterprising tendency
was limited between 0-26 (see Table 6).
Descriptive statistical analyses were accompanied through cross-tabulations to study the
association between the independent and dependent variables. A cross-tabulation tool was used
97
for the collected data to analyze the extent to what each of the three generations’ entrepreneurial
traits levels and the frequency distribution of two categorical variables: generations and
entrepreneurial traits levels (Pallant, 2013). The descriptive cross-tabulation indicated that, of the
117 entrepreneurs, 43 (37% of the total population) were millennials, 50 (43% of the total
population) generation Xers, and 24 (20% of the total population) were baby boomers.
Medium level enterprising tendency was mostly observed in each generation. Of the 43,
37 millennials (86% of total millennials population) were detected with medium level
enterprising tendency. Five millennials (11.6% of total millennials) indicated high level and only
one millennial (2.3% of totals millennial) indicated the low level of enterprising tendency. Of the
50, 43 generation Xers (86% of total generation Xers) showed the medium level of enterprising
tendency while four baby boomers (8% of total generation Xers) high and three baby boomers
(6% of total generation Xers) low. Of the 24, 23 baby boomers indicated their enterprising
tendency as medium level (96% of total baby boomers) while one baby boomer showed a high
enterprising tendency.
As a result, collected data of the 117 entrepreneurs, 103 (88% of total population)
entrepreneurs showed medium level of enterprising tendency. According to Caird (2013),
entrepreneurs who tend to have medium enterprising tendency scores, have strengths in some of
the enterprising characteristics in some contexts. However, entrepreneurs with medium
enterprising tendency are unlikely to set up an innovative growth-oriented global business
(Caird, 2013). Moreover, they can consider themselves as an intrapreneur within employment, or
they can work in their leisure time through voluntary community projects (see Table 3).

98
Is there a significant difference in entrepreneurial trait scores between generations?
To answer this question, the one-way analysis of variance (ANOVA) was taken advantage of to
determine whether there are significant differences in the mean scores on each of the
entrepreneurial trait score across the three groups (Pallant, 2013). A total of 54 questions related
to entrepreneurial traits were asked to the participants to indicate their level of agreement (Tend
to Agree) and disagreement (Tend to Disagree). The dependent variables were the Total
Entrepreneurial Trait scores (Total Need for Achievement, Total Need for Autonomy, Total
Creative Tendency, Total Calculated Risk Taking, and Total Locus of Control) which were
treated as continuous variables to answer the question. For each of the five entrepreneurial traits
(as dependent variables) the test of one-way ANOVA was performed separately to see whether
there are significant differences in the mean scores across the three groups (as independent
variables).
For the question three, generations were treated as a single categorical variable with a
three level: Baby Boomers, Generation Xers, and Millennials. The significance value for
Levene’s test was checked (p = .095). The p value is greater than .05 which means that the
assumption of homogeneity of variance was not violated (Pallant, 2013). The results showed
that, excluding the Total Calculated Risk Taking score, non-significant p values were detected (p
˃ .05) in the one-way ANOVA tests.
There was only statistical significant difference F (2, 114) = 4.38. at the p ˂ .05 level in
the mean scores in the Total Calculated Risk Taking scores across the three generations (see
Table 22). The Tukey HSD test was checked which indicates exactly where the differences
among the groups occur for the Total Calculated Risk Taking scores across the three generations.
In the Tukey HSD test, only the group of Millennials (M = 8.70, std = 1.34) and Baby Boomers

99
(M = 7.50, Std = 1.96) are statistically significantly different from one another. That is,
entrepreneurs with the age of between 18-35 and 52-70 differ significantly in terms of their Total
Calculated Risk Taking scores. The generation Xers (M = 7.84, std = 1.98) did not differ
significantly from either Baby Boomers and Millennials. Having addressed statistically
difference between Millennials and Baby Boomers in the mean score on the Total Calculated
Risk Taking score, Millennials have the highest risk taking trait in comparison of the Baby
Boomers (see Table 19).
The group of Baby Boomers (52-70) was associated with the numerically smallest mean
level of Total Calculated Risk Taking score (M = 7.50). The group of Millennials (18-35) was
associated with the numerically highest mean level of Total Calculated Risk Taking score (M =
8.70). The mean score for generation Xers (36-51) falls in between these two generations (M =
7.84). The researcher fails to reject the null hypothesis as the p value of total GET2 scores is
larger than .05 (p ˃ .05). Overall, results showed that there is no statistically significant
difference at the p ˂ .05 in the mean scores on four Total Entrepreneurial Trait scores across the
three generation groups (see Appendix E).
Is there a significant difference in entrepreneurial trait scores between generations
after controlling the effects of covariates? A five-multiple regression analysis was performed
to explain the relationship between one continuous dependent variable and several independent
variables or predictors. Five multiple regression analyses were conducted for each
entrepreneurial trait (dependent as continuous variables) to analyze:
a) how well and which set of variables (generation, ethnicity, level of education, number
of employees in the company, type of business, and number of years as a business owner as
100
categorical variables) are able to make the best prediction of the value on the dependent
variables,
b) whether the predictor variables are still able to predict the outcome when the effects of
another categorical variables variable are controlled for (Pallant, 2013).
To utilize five multiple regression analyses, the categorical predictor variables
(independent variables) were dummy coded. The dependent variables were the five
entrepreneurial trait scores (Total Need for Achievement, Total Need for Autonomy, Total
Creative Tendency, Total Calculated Risk Taking, and Total Locus of Control). In the multiple
regression approach, the categorical predictor variables were collapsed into two or three
categories (to compare each of the other categories) to facilitate the analysis where one category
served as a reference group.
The principle of parsimony was adopted to simplify the each model. In the five multiple
regression analyses, the researcher started with all of the covariates and one dependent variable
at a time. (the first model). Subsequently, nonsignificant independent variables were
systematically removed until the remaining variables were significant (the final model); all
covariates other than Generations were fitted individually. By doing so, effects on the
relationship between Generations and Entrepreneurial Traits were not rejected early on in the full
model. For the model to achieve significant goodness of fit, the ANOVA table was expected to
have p < .05. The R-squared statistic was checked to identify how much of the variance in the
dependent variable was explained by the model. The distribution of the residuals using the
normal probability plot (P-P) of the regression standardized residual were reported.
In the first model, the relationship between Total need for achievement vs. generations
and all covariates/predictors was investigated. A multiple linear regression was conducted to
101
predict whether there is a significant difference in Total Need for Achievement scores between
generations after controlling the effects of covariates. Firstly, all covariates were added in the
model to see how well a number of independent variables (generations and covariates) could
predict Total Need for Achievement scores (dependent variable). Further, how much variance in
the dependent variables could be explained by the independent variable was reported in the
initial model. The value of Adjusted R Square was checked which indicated that 7.5% of the
variance in Total Need for Achievement scores was explained by the model (see Table 24). The
ANOVA table indicated that the model with all covariates/predictors is not statistically
significant, F (12, 104) = 1.78, p ˃ .05 (see Table 25). Moreover, the coefficients table (See
Table 26) reported that the p values of each predictors failed to make a statistically significant
contribution to the prediction of the dependent variable (p ˃ .05). Overall, due to not achieving a
significant goodness of fit value (ANOVA) and having nonsignificant differences in the all
coefficients (p values are nonsignificant, p ˃.05), none of the independent variables contributed
any prediction to the dependent variable.
In the final model, the relationship between Total need for achievement vs. generations
and controlled covariates/predictors was investigated. To test multiple regression analyses, in
compliance with the principle of parsimony, nonsignificant independent variables were
systematically removed until the remaining variables were significant (the final parsimonious
model). Multiple linear regression was reperformed with Total Need for Achievement as a
dependent variable and Baby Boomers, Generation Xers, and Less than 10 Years (number of
years as a business owner) as independent variables. The value of Adjusted R Square indicated
that 4% (rounded) of the variance in Total Need for Achievement scores was explained by the
model (see Table 27). The ANOVA table indicated that the new model with predictors is

102
statistically significant, F (5, 111) = 2.505, p ˂ .05 (see Table 28). The coefficients table (See
Table 29) indicated that the largest Beta coefficient value accounted for Less Than 10 Years
(.279) which means that this variable made the strongest unique contribution to explaining the
Total Need for Achievement score while the B value for Generation Xers (-.172) made the least
contribution. The p value (sig.) of Baby Boomers indicated that there is a statistically significant
difference in entrepreneurial trait scores between Baby Boomers and Millennials after
controlling the effects of covariates in the model (p ˂ .05). The researcher found that, when the
effects of the number of years as a business owner (Less than 10 Years vs Ten or More), the
difference in average Total Need for Achievement scores between Baby Boomers and
Millennials was significant, with Baby Boomers estimated to score 1.067 less than Millennials
on average. The values of Tolerance and VIF in the coefficients table (Table 29) reported that no
presence of multicollinearity was found. The assumptions were checked by inspecting the
normal probability plot (P-P) of the regression standardized residual. The plot showed that the
points generally follow the normal line with no strong deviations which indicated that the
residuals were normally distributed (see Figure 7).
In the first model, the relationship between Total need for autonomy vs. generations and
all covariates/predictors was investigated. A multiple linear regression was conducted to predict
whether there is a significant difference in Total Need for Autonomy scores between Generations
after controlling the effects of covariates. Initially, all covariates were added in the first model to
see how well a number of independent variables (generation and covariates) could predict the
total need for autonomy scores (dependent variable). Also, how much variance in the dependent
variables could be explained by the independent variable was reported in the initial model. The
value of Adjusted R Square was checked. The value indicated that 3% (rounded) of the variance
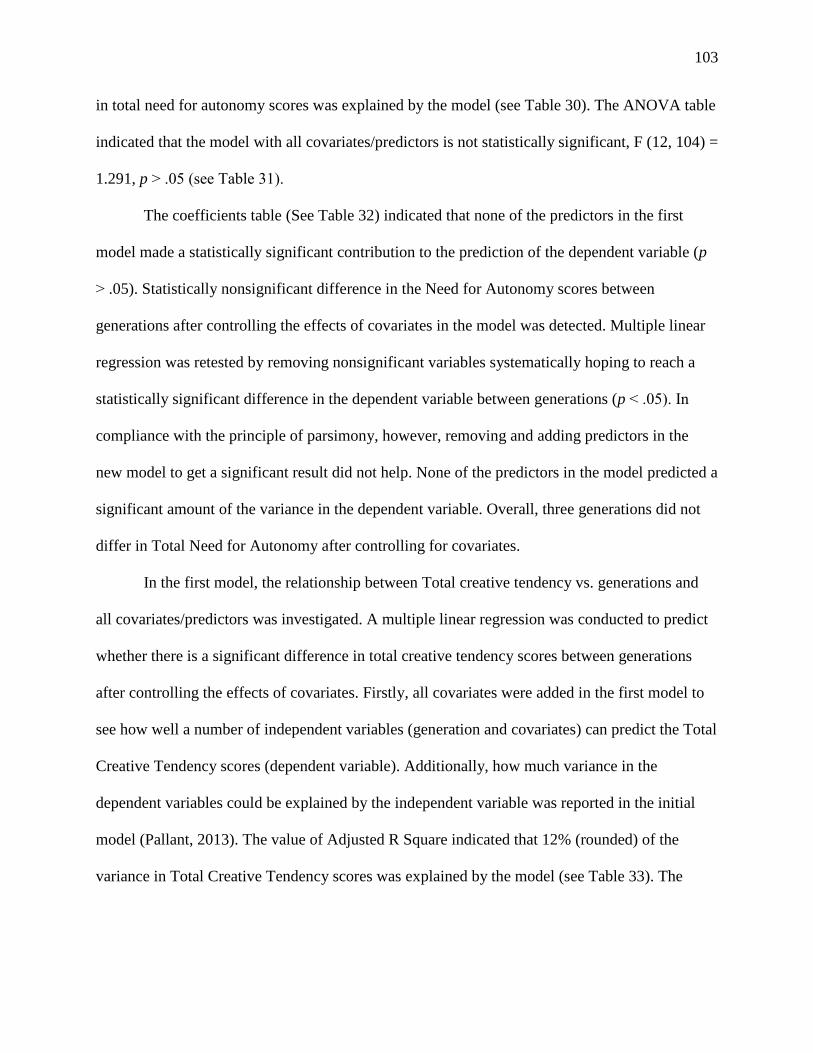
103
in total need for autonomy scores was explained by the model (see Table 30). The ANOVA table
indicated that the model with all covariates/predictors is not statistically significant, F (12, 104) =
1.291, p ˃ .05 (see Table 31).
The coefficients table (See Table 32) indicated that none of the predictors in the first
model made a statistically significant contribution to the prediction of the dependent variable (p
˃ .05). Statistically nonsignificant difference in the Need for Autonomy scores between
generations after controlling the effects of covariates in the model was detected. Multiple linear
regression was retested by removing nonsignificant variables systematically hoping to reach a
statistically significant difference in the dependent variable between generations (p ˂ .05). In
compliance with the principle of parsimony, however, removing and adding predictors in the
new model to get a significant result did not help. None of the predictors in the model predicted a
significant amount of the variance in the dependent variable. Overall, three generations did not
differ in Total Need for Autonomy after controlling for covariates.
In the first model, the relationship between Total creative tendency vs. generations and
all covariates/predictors was investigated. A multiple linear regression was conducted to predict
whether there is a significant difference in total creative tendency scores between generations
after controlling the effects of covariates. Firstly, all covariates were added in the first model to
see how well a number of independent variables (generation and covariates) can predict the Total
Creative Tendency scores (dependent variable). Additionally, how much variance in the
dependent variables could be explained by the independent variable was reported in the initial
model (Pallant, 2013). The value of Adjusted R Square indicated that 12% (rounded) of the
variance in Total Creative Tendency scores was explained by the model (see Table 33). The

104
ANOVA table indicates that the model with all covariates/predictors is statistically significant, F
(12, 104) = 2.278, p ˂ .05 (see Table 34).
The coefficients table (See Table 35) indicated that the p values of Trade (type of
business) and Service and Public Administrations (type of business) predictors made a
statistically significant contribution to the prediction of the dependent variable (p ˂ .05) while
other predictors in the first model did not make any statistically significant contribution (p ˃ .05).
In the final model, the relationship between Total creative tendency vs. generations and
controlled covariates/predictors was investigated. Only, Trade and Service and Public
Administrations predictors made a statistically significant contribution to the prediction of the
dependent variable in the first model of Multiple linear regression (p ˂ .05). However, remaining
predictors in the first model did not show any significant contribution to the prediction of the
dependent variable (p ˃ .05). Therefore, in the final model, nonsignificant independent variables
were systematically removed in compliance with the parsimonious model. Multiple linear
regression was reperformed with Total Creative Tendency as a dependent variable and Baby
Boomers, Generation Xers, and Trade (type of business) as independent variables. The value of
Adjusted R Square indicated that 7% (rounded) of the variance in Total Creative Tendency
scores was explained by the model (see Table 36). The ANOVA table indicated that the final
model with predictors is statistically significant, F (3, 113) = 3.746, p ˂ .05 (see Table 37).
The coefficients table (See Table 38) indicated that the largest Beta coefficient value of -
.247 (ignoring the negative sign) accounted for Trade (type of business) which indicated that the
variable made the strongest unique contribution to explaining the Total Creative Tendency score.
The Beta value for Generation Xers made the least contribution (-.174). The p value of Baby
Boomers indicated that there is a statistically significant difference in entrepreneurial trait scores
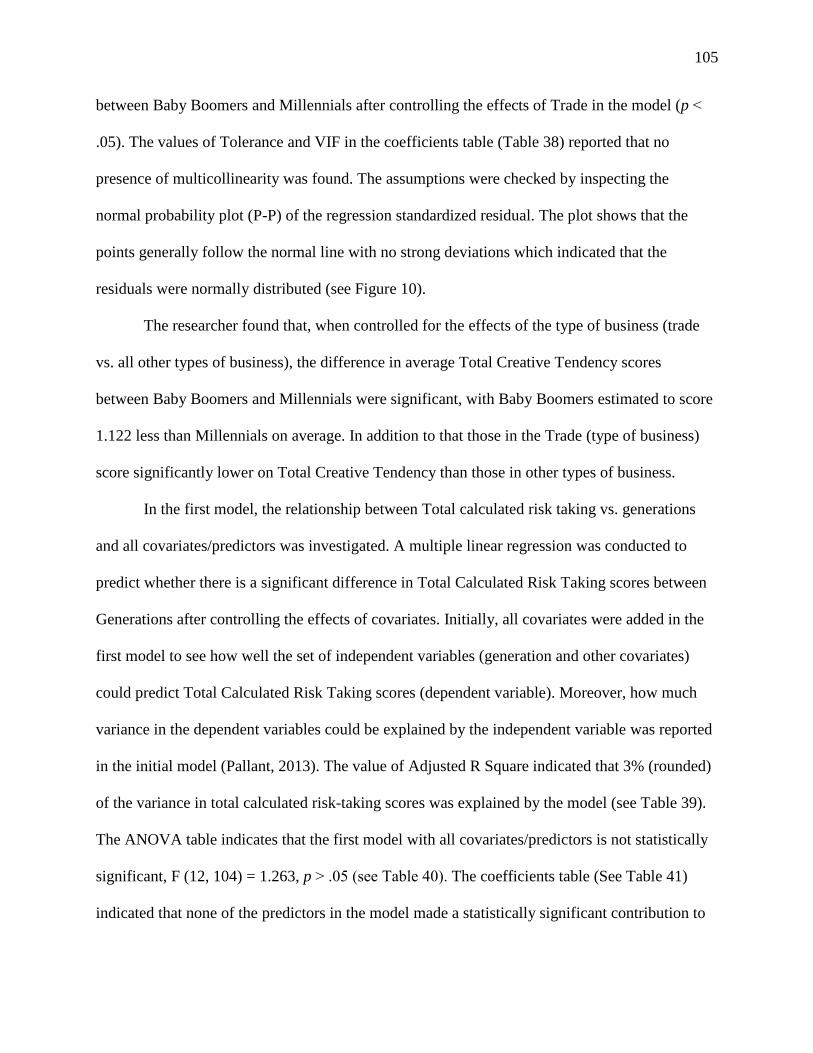
105
between Baby Boomers and Millennials after controlling the effects of Trade in the model (p ˂
.05). The values of Tolerance and VIF in the coefficients table (Table 38) reported that no
presence of multicollinearity was found. The assumptions were checked by inspecting the
normal probability plot (P-P) of the regression standardized residual. The plot shows that the
points generally follow the normal line with no strong deviations which indicated that the
residuals were normally distributed (see Figure 10).
The researcher found that, when controlled for the effects of the type of business (trade
vs. all other types of business), the difference in average Total Creative Tendency scores
between Baby Boomers and Millennials were significant, with Baby Boomers estimated to score
1.122 less than Millennials on average. In addition to that those in the Trade (type of business)
score significantly lower on Total Creative Tendency than those in other types of business.
In the first model, the relationship between Total calculated risk taking vs. generations
and all covariates/predictors was investigated. A multiple linear regression was conducted to
predict whether there is a significant difference in Total Calculated Risk Taking scores between
Generations after controlling the effects of covariates. Initially, all covariates were added in the
first model to see how well the set of independent variables (generation and other covariates)
could predict Total Calculated Risk Taking scores (dependent variable). Moreover, how much
variance in the dependent variables could be explained by the independent variable was reported
in the initial model (Pallant, 2013). The value of Adjusted R Square indicated that 3% (rounded)
of the variance in total calculated risk-taking scores was explained by the model (see Table 39).
The ANOVA table indicates that the first model with all covariates/predictors is not statistically
significant, F (12, 104) = 1.263, p ˃ .05 (see Table 40). The coefficients table (See Table 41)
indicated that none of the predictors in the model made a statistically significant contribution to
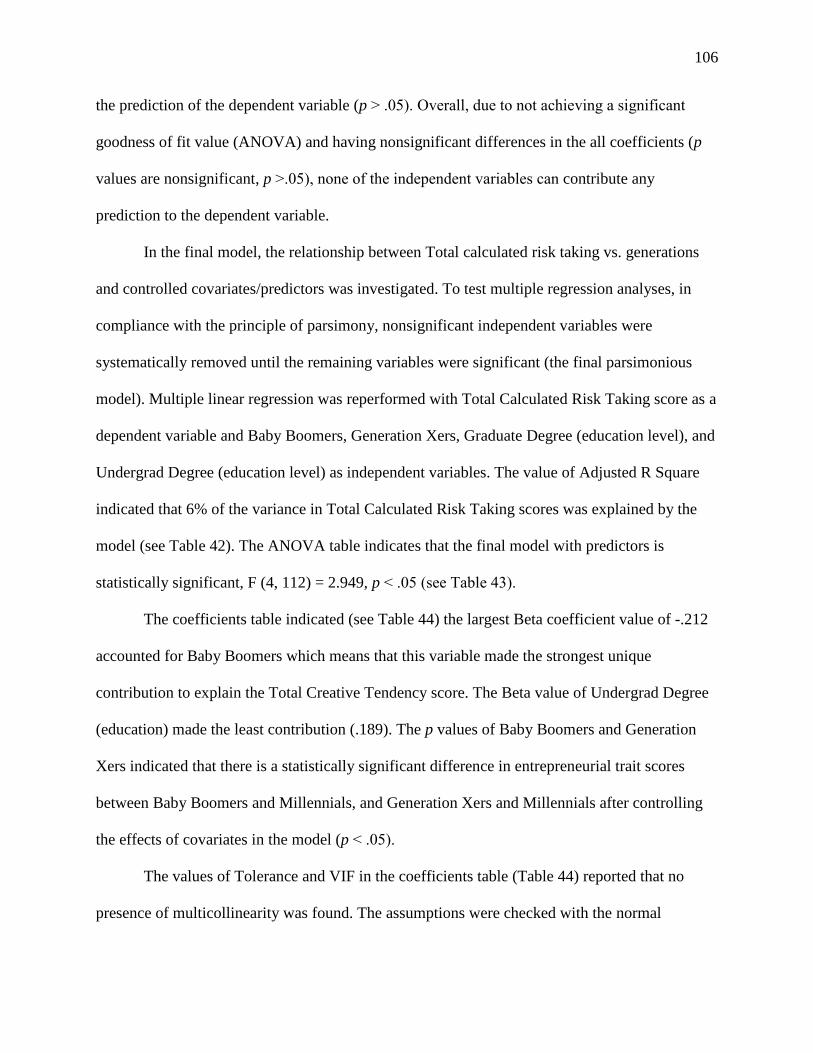
106
the prediction of the dependent variable (p ˃ .05). Overall, due to not achieving a significant
goodness of fit value (ANOVA) and having nonsignificant differences in the all coefficients (p
values are nonsignificant, p ˃.05), none of the independent variables can contribute any
prediction to the dependent variable.
In the final model, the relationship between Total calculated risk taking vs. generations
and controlled covariates/predictors was investigated. To test multiple regression analyses, in
compliance with the principle of parsimony, nonsignificant independent variables were
systematically removed until the remaining variables were significant (the final parsimonious
model). Multiple linear regression was reperformed with Total Calculated Risk Taking score as a
dependent variable and Baby Boomers, Generation Xers, Graduate Degree (education level), and
Undergrad Degree (education level) as independent variables. The value of Adjusted R Square
indicated that 6% of the variance in Total Calculated Risk Taking scores was explained by the
model (see Table 42). The ANOVA table indicates that the final model with predictors is
statistically significant, F (4, 112) = 2.949, p ˂ .05 (see Table 43).
The coefficients table indicated (see Table 44) the largest Beta coefficient value of -.212
accounted for Baby Boomers which means that this variable made the strongest unique
contribution to explain the Total Creative Tendency score. The Beta value of Undergrad Degree
(education) made the least contribution (.189). The p values of Baby Boomers and Generation
Xers indicated that there is a statistically significant difference in entrepreneurial trait scores
between Baby Boomers and Millennials, and Generation Xers and Millennials after controlling
the effects of covariates in the model (p ˂ .05).
The values of Tolerance and VIF in the coefficients table (Table 44) reported that no
presence of multicollinearity was found. The assumptions were checked with the normal
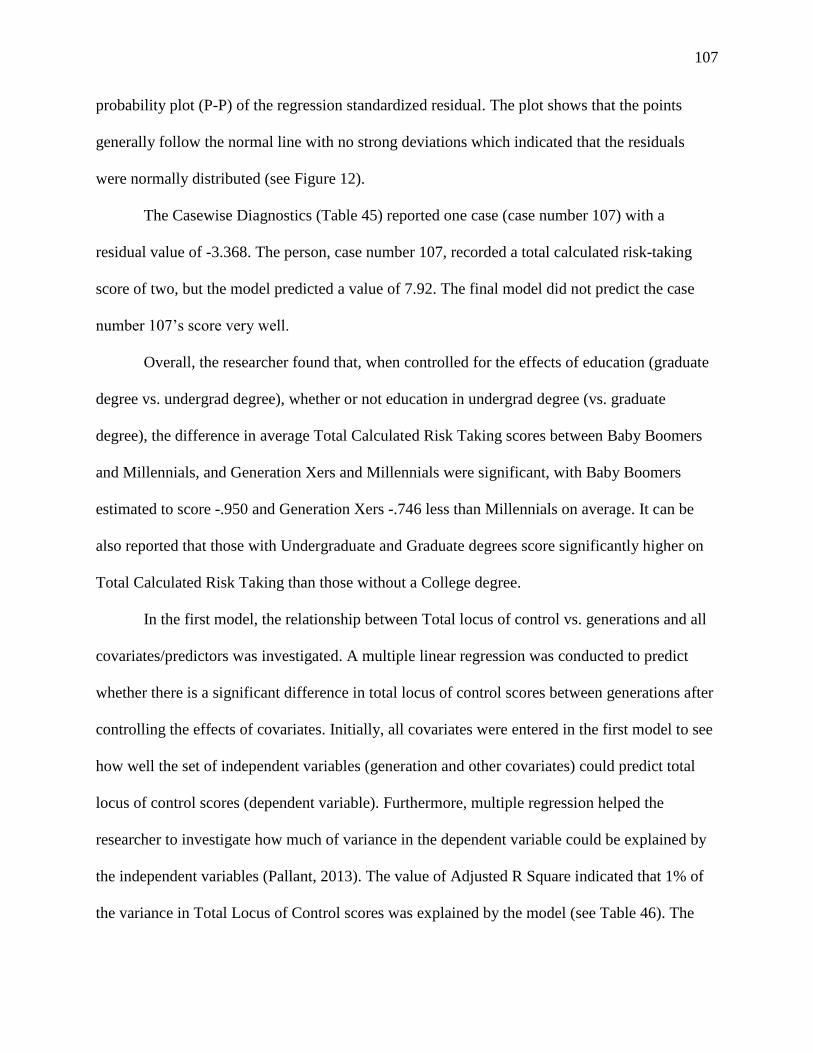
107
probability plot (P-P) of the regression standardized residual. The plot shows that the points
generally follow the normal line with no strong deviations which indicated that the residuals
were normally distributed (see Figure 12).
The Casewise Diagnostics (Table 45) reported one case (case number 107) with a
residual value of -3.368. The person, case number 107, recorded a total calculated risk-taking
score of two, but the model predicted a value of 7.92. The final model did not predict the case
number 107’s score very well.
Overall, the researcher found that, when controlled for the effects of education (graduate
degree vs. undergrad degree), whether or not education in undergrad degree (vs. graduate
degree), the difference in average Total Calculated Risk Taking scores between Baby Boomers
and Millennials, and Generation Xers and Millennials were significant, with Baby Boomers
estimated to score -.950 and Generation Xers -.746 less than Millennials on average. It can be
also reported that those with Undergraduate and Graduate degrees score significantly higher on
Total Calculated Risk Taking than those without a College degree.
In the first model, the relationship between Total locus of control vs. generations and all
covariates/predictors was investigated. A multiple linear regression was conducted to predict
whether there is a significant difference in total locus of control scores between generations after
controlling the effects of covariates. Initially, all covariates were entered in the first model to see
how well the set of independent variables (generation and other covariates) could predict total
locus of control scores (dependent variable). Furthermore, multiple regression helped the
researcher to investigate how much of variance in the dependent variable could be explained by
the independent variables (Pallant, 2013). The value of Adjusted R Square indicated that 1% of
the variance in Total Locus of Control scores was explained by the model (see Table 46). The
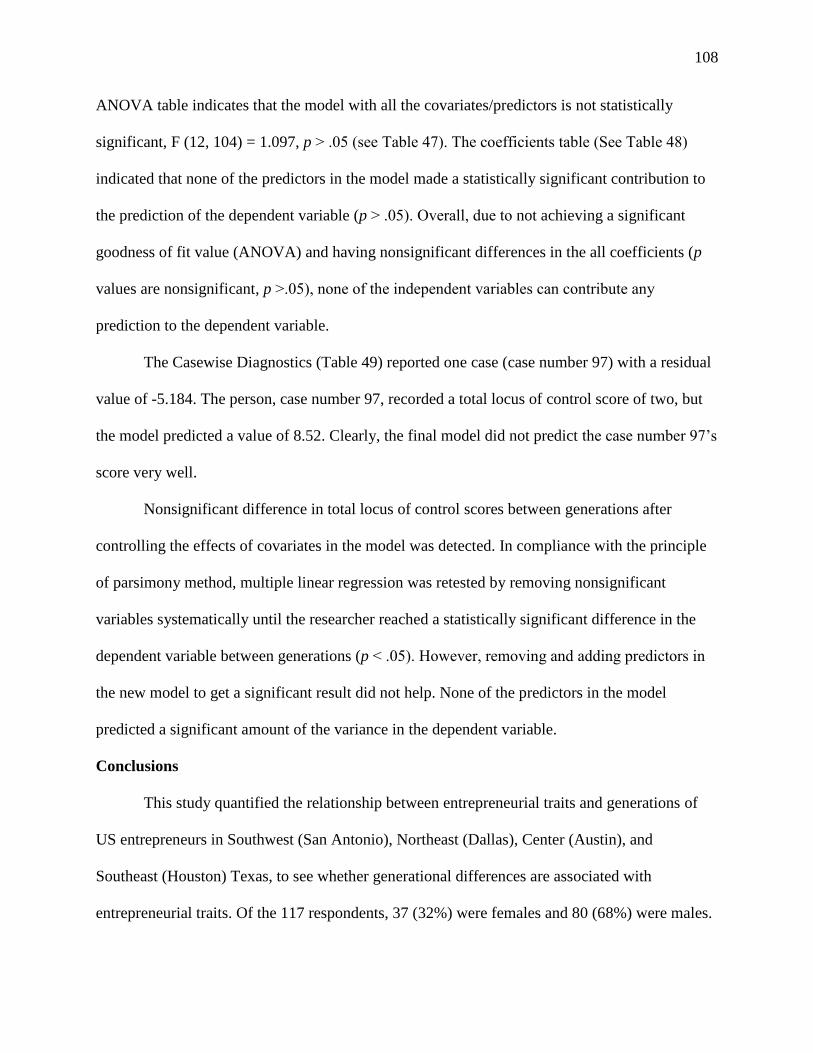
108
ANOVA table indicates that the model with all the covariates/predictors is not statistically
significant, F (12, 104) = 1.097, p ˃ .05 (see Table 47). The coefficients table (See Table 48)
indicated that none of the predictors in the model made a statistically significant contribution to
the prediction of the dependent variable (p ˃ .05). Overall, due to not achieving a significant
goodness of fit value (ANOVA) and having nonsignificant differences in the all coefficients (p
values are nonsignificant, p ˃.05), none of the independent variables can contribute any
prediction to the dependent variable.
The Casewise Diagnostics (Table 49) reported one case (case number 97) with a residual
value of -5.184. The person, case number 97, recorded a total locus of control score of two, but
the model predicted a value of 8.52. Clearly, the final model did not predict the case number 97’s
score very well.
Nonsignificant difference in total locus of control scores between generations after
controlling the effects of covariates in the model was detected. In compliance with the principle
of parsimony method, multiple linear regression was retested by removing nonsignificant
variables systematically until the researcher reached a statistically significant difference in the
dependent variable between generations (p ˂ .05). However, removing and adding predictors in
the new model to get a significant result did not help. None of the predictors in the model
predicted a significant amount of the variance in the dependent variable.
Conclusions
This study quantified the relationship between entrepreneurial traits and generations of
US entrepreneurs in Southwest (San Antonio), Northeast (Dallas), Center (Austin), and
Southeast (Houston) Texas, to see whether generational differences are associated with
entrepreneurial traits. Of the 117 respondents, 37 (32%) were females and 80 (68%) were males.

109
The three different generations were selected using Lancaster & Stillman (2002)’s birth years for
each generation. Respectively, Baby Boomers n=24, (20% of total response), Generation n= 50
(43% of total response), and Millennials n= 43 (37% of total response) participated in the study.
The findings from Chapters IV led the researcher to draw a number of conclusions concerning to
the four research questions.
McClelland (1987) and Cromie (2000) stated that Need for Achievement is a primary
entrepreneurial feature that forms single driving force for the successful entrepreneurship. In this
study, in parallel to McCelland (1987) and Cromie (2000)’s claim, the score of Need for
Achievement was found higher than any other entrepreneurial traits based upon the 12 items
scale (mean: 9.85 out of 12 possible highest score). The second highest score belongs to Locus of
Control based upon the same 12 items scale which accounted for 8.89 out of 12 possible highest
score. Respectively, Total Calculating Risk Taking (8.09 out of 12 possible highest score) and
Total Creative Tendency (6.32 out of 12 possible highest score). Total Need for Autonomy
accounted for 3.69 in mean score which can only achieve a maximum score of 6. Total Need for
Autonomy had a higher relative mean score than Total Creative Tendency when accounting for
the maximum scores.
Collected data from 117 entrepreneurs showed that 88% of total population (103
entrepreneurs) tend to have a medium level of enterprising tendency. Caird (2013) stated that
entrepreneurs with medium level enterprising tendency tend less likely to set up an innovative
high growth business venture. However, they may be able to express their enterprising tendency
within employment as intrapreneurs on in their leisure time (e.g. through voluntary community
projects) (see Table 3).
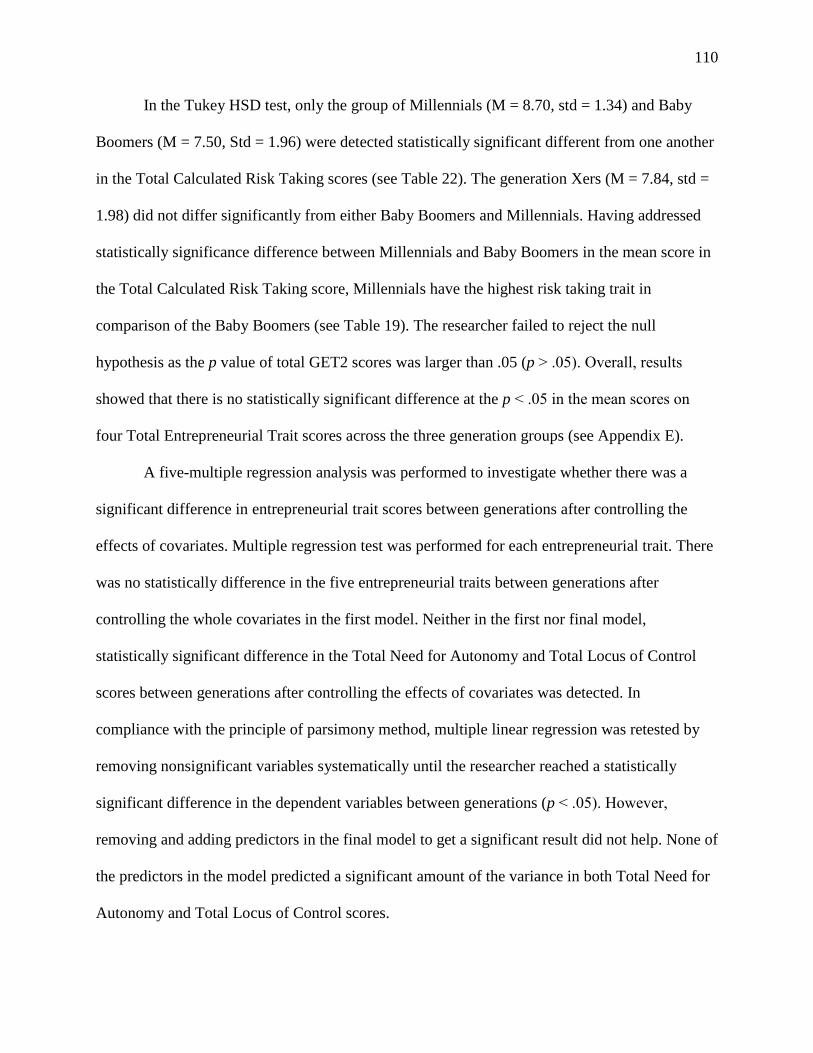
110
In the Tukey HSD test, only the group of Millennials (M = 8.70, std = 1.34) and Baby
Boomers (M = 7.50, Std = 1.96) were detected statistically significant different from one another
in the Total Calculated Risk Taking scores (see Table 22). The generation Xers (M = 7.84, std =
1.98) did not differ significantly from either Baby Boomers and Millennials. Having addressed
statistically significance difference between Millennials and Baby Boomers in the mean score in
the Total Calculated Risk Taking score, Millennials have the highest risk taking trait in
comparison of the Baby Boomers (see Table 19). The researcher failed to reject the null
hypothesis as the p value of total GET2 scores was larger than .05 (p ˃ .05). Overall, results
showed that there is no statistically significant difference at the p ˂ .05 in the mean scores on
four Total Entrepreneurial Trait scores across the three generation groups (see Appendix E).
A five-multiple regression analysis was performed to investigate whether there was a
significant difference in entrepreneurial trait scores between generations after controlling the
effects of covariates. Multiple regression test was performed for each entrepreneurial trait. There
was no statistically difference in the five entrepreneurial traits between generations after
controlling the whole covariates in the first model. Neither in the first nor final model,
statistically significant difference in the Total Need for Autonomy and Total Locus of Control
scores between generations after controlling the effects of covariates was detected. In
compliance with the principle of parsimony method, multiple linear regression was retested by
removing nonsignificant variables systematically until the researcher reached a statistically
significant difference in the dependent variables between generations (p ˂ .05). However,
removing and adding predictors in the final model to get a significant result did not help. None of
the predictors in the model predicted a significant amount of the variance in both Total Need for
Autonomy and Total Locus of Control scores.

111
In the final model, in compliance with the principle of parsimony method, a multiple
linear regression was reperformed with Total Need for Achievement as a dependent variable and
Baby Boomers, Generation Xers, and Less than 10 Years (number of years as a business owner)
as independent variables. The value of Adjusted R Square indicated that 4% (rounded) of the
variance in the Total Need for Achievement scores was explained by the model (see Table 27).
The ANOVA table indicated that the new model with predictors is statistically significant, F (5,
111) = 2.505, p ˂ .05 (see Table 28). The coefficient p values (see Table 29) indicated that there
is a statistically significant difference in entrepreneurial trait scores between Baby Boomers and
Millennials after controlling the effects of covariates in the model (p ˂ .05). The researcher
found that, when the effects of the number of years as a business owner (Less than 10 Years vs
Ten or More), the difference in average Total Need for Achievement scores between Baby
Boomers and Millennials was significant, with Baby Boomers estimated to score 1.067 less than
Millennials on average.
In the final model, in compliance with the principle of parsimony method, a multiple
linear regression was reperformed with Total Creative Tendency as a dependent variable and
Baby Boomers, Generation Xers, and Trade (type of business) as independent variables. The
value of Adjusted R Square indicated that 7% (rounded) of the variance in Total Creative
Tendency scores was explained by the model (see Table 36). The ANOVA table indicated that
the final model with predictors is statistically significant, F (3, 113) = 3.746, p ˂ .05 (see Table
37). The coefficient p values (see Table 38) indicated that there is a statistically significant
difference in entrepreneurial trait scores between Baby Boomers and Millennials after
controlling the effects of Trade in the model (p ˂ .05). The researcher found that, when the
effects of the type of business (trade vs. all other types of business), the difference in average
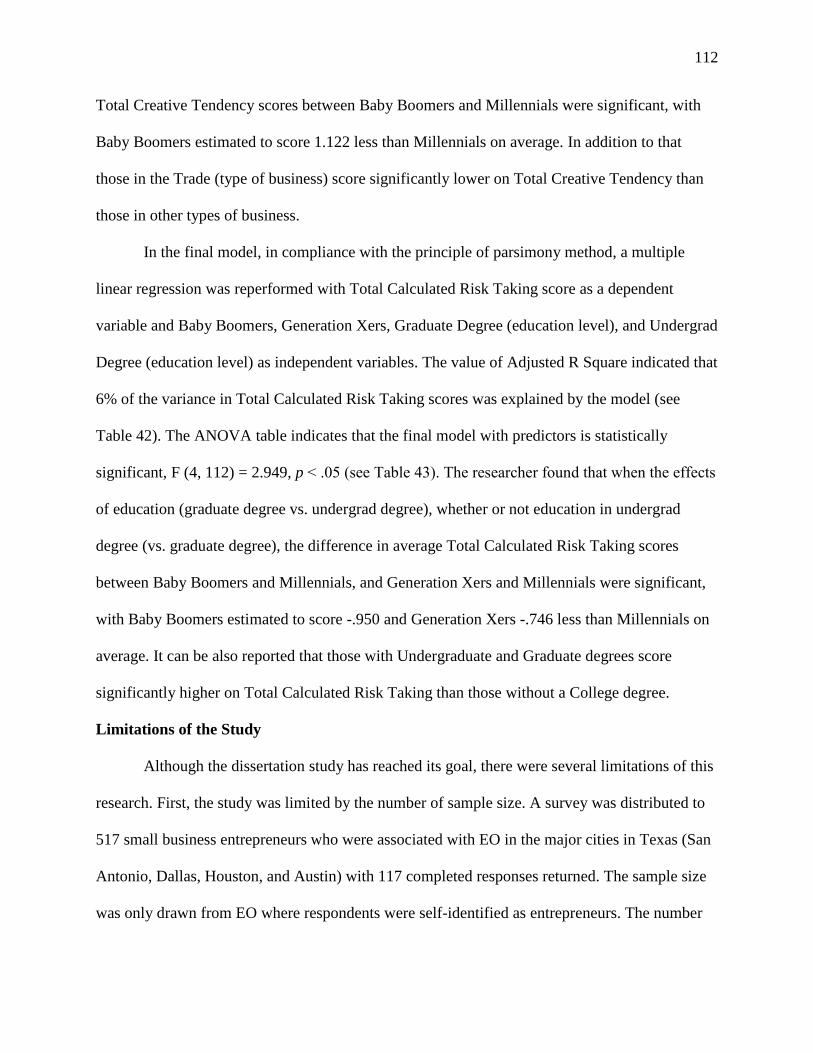
112
Total Creative Tendency scores between Baby Boomers and Millennials were significant, with
Baby Boomers estimated to score 1.122 less than Millennials on average. In addition to that
those in the Trade (type of business) score significantly lower on Total Creative Tendency than
those in other types of business.
In the final model, in compliance with the principle of parsimony method, a multiple
linear regression was reperformed with Total Calculated Risk Taking score as a dependent
variable and Baby Boomers, Generation Xers, Graduate Degree (education level), and Undergrad
Degree (education level) as independent variables. The value of Adjusted R Square indicated that
6% of the variance in Total Calculated Risk Taking scores was explained by the model (see
Table 42). The ANOVA table indicates that the final model with predictors is statistically
significant, F (4, 112) = 2.949, p ˂ .05 (see Table 43). The researcher found that when the effects
of education (graduate degree vs. undergrad degree), whether or not education in undergrad
degree (vs. graduate degree), the difference in average Total Calculated Risk Taking scores
between Baby Boomers and Millennials, and Generation Xers and Millennials were significant,
with Baby Boomers estimated to score -.950 and Generation Xers -.746 less than Millennials on
average. It can be also reported that those with Undergraduate and Graduate degrees score
significantly higher on Total Calculated Risk Taking than those without a College degree.
Limitations of the Study
Although the dissertation study has reached its goal, there were several limitations of this
research. First, the study was limited by the number of sample size. A survey was distributed to
517 small business entrepreneurs who were associated with EO in the major cities in Texas (San
Antonio, Dallas, Houston, and Austin) with 117 completed responses returned. The sample size
was only drawn from EO where respondents were self-identified as entrepreneurs. The number

113
of sample size would have been extended by sending the online survey link to other official
entrepreneurial social networks. By doing so, possible significant relationships from the data
would have been found. In statistical tests, it is usually expected a larger sample size to
generalize the results from a small number of people to a large number (Creswell, 2012).
Second, reaching out active entrepreneurs who were members at EO in major cities in
Texas was difficult. After survey questions were written and answer selections were formulated
on Survey Monkey (online survey software), a custom URL was created. The link was shared on
EO Facebook page (a social networking site) by the director of EO who has the authorization to
access, share information, and invite the EO members. The researcher allowed two weeks for
responses to achieve the desired level of power for the study. At the first attempt, there was not
enough responses, so the director of EO attempted a second request/reminder on Facebook which
was allowed two more weeks by the researcher. At the end of fourth week, the researcher
gathered a total of 117 sample size for the dissertation.
Third, prior research studies on the topic of generations and entrepreneurial traits were
limited. The most recent entrepreneurial literatures are clustered around entrepreneurship
education in which the discussion of whether entrepreneurship should be taught and learned is
ongoing (Fayolle, 2008). The researcher could not make a comparison between the findings of
this study and previous research studies.
Recommendations
The previous chapter presented the research results and synthesizing the findings based
on the trait theory created by Caird (2006) in a framework supported by the literature. The
descriptions of different generations of Texan small business entrepreneurs provided in the study
offer substantial opportunities for the use of the findings in terms of self-consciousness in

114
entrepreneurial traits and research possibilities. The following recommendations were broken
down into three sections: practitioners, policy makers, and for future research.
Practitioners. A variety of studies have been referenced in this research study in order to
provide useful information for practitioners, policy makers, and future researchers. This study
intends to explore whether there is a statistically difference between generations of entrepreneurs
and entrepreneurial traits. In this study, participants are entrepreneurs with small businesses. The
research study can also make contribution to the academic literature by profiling Southwest,
Northeast, Center, and Southeast Texas metropolitan region entrepreneurs.
This study has intended to contribute to the academic literature in understanding the
differences in the five entrepreneurial traits across three different generations of entrepreneurs.
This quantitative descriptive study can be useful for practitioners in self-assessment in their
entrepreneurial (enterprising) potential and can get an idea of the competency to start up and
manage projects. For instance, scores on the five trait dimensions can provide feedback to
practitioners regarding the degree to which they have a high, medium, or low entrepreneurial
tendency level. When the entrepreneurial tendency level is identified by practitioners, additional
entrepreneurial education or trainings may be needed for the right effect to develop
entrepreneurship amongst different generations of entrepreneurs.
Policy Makers. It is undisputed that entrepreneurship has made a significant contribution
to the economic growth, dynamic workforce and wealth in the U.S. economy. As indicated in
Chapter 1, entrepreneurs focus merely on reaching success by creating and marketing innovative,
customer-focused products and services in the purpose of contributing economic growth and
prosperity in the nations that they reside. Therefore, entrepreneurship should be an essential
factor for policymakers, local economic development departments, to understand the degree to
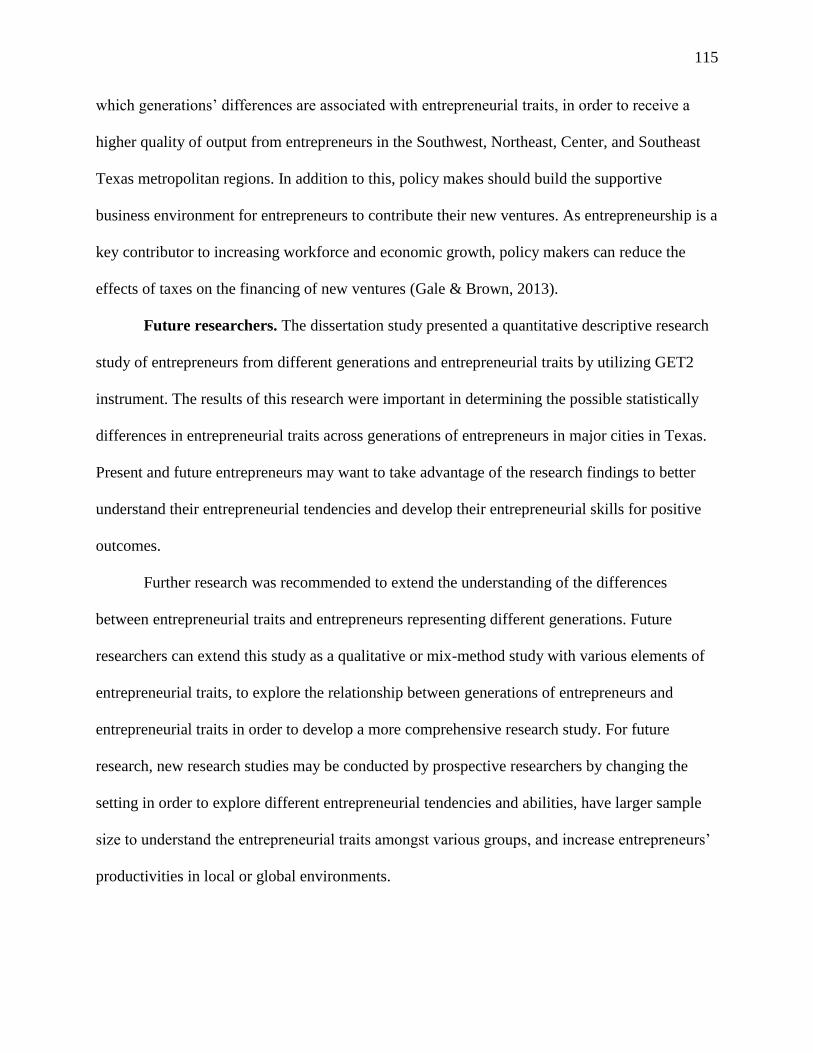
115
which generations’ differences are associated with entrepreneurial traits, in order to receive a
higher quality of output from entrepreneurs in the Southwest, Northeast, Center, and Southeast
Texas metropolitan regions. In addition to this, policy makes should build the supportive
business environment for entrepreneurs to contribute their new ventures. As entrepreneurship is a
key contributor to increasing workforce and economic growth, policy makers can reduce the
effects of taxes on the financing of new ventures (Gale & Brown, 2013).
Future researchers. The dissertation study presented a quantitative descriptive research
study of entrepreneurs from different generations and entrepreneurial traits by utilizing GET2
instrument. The results of this research were important in determining the possible statistically
differences in entrepreneurial traits across generations of entrepreneurs in major cities in Texas.
Present and future entrepreneurs may want to take advantage of the research findings to better
understand their entrepreneurial tendencies and develop their entrepreneurial skills for positive
outcomes.
Further research was recommended to extend the understanding of the differences
between entrepreneurial traits and entrepreneurs representing different generations. Future
researchers can extend this study as a qualitative or mix-method study with various elements of
entrepreneurial traits, to explore the relationship between generations of entrepreneurs and
entrepreneurial traits in order to develop a more comprehensive research study. For future
research, new research studies may be conducted by prospective researchers by changing the
setting in order to explore different entrepreneurial tendencies and abilities, have larger sample
size to understand the entrepreneurial traits amongst various groups, and increase entrepreneurs’
productivities in local or global environments.
116
References
Acock, A. C. (2008). A gentle introduction to Stata (2nd ed.). College Station, TX: Stata Corp
LP.
Adams, S. J. (2000). Generation X: How understanding this population leads to better safety
programs. Professional Safety, 45(1), 26-29.
Alreck, P., & Settle, R. B. (2004). Survey research handbook (3rd ed.). New York, NY:
McGraw-Hill.
Audretsch, D. B. (2002). The Dynamic Role of Small Firms: Evidence from the U.S. Small
Business Economics, 18(1), 13-40.
AustinTexas.gov. (n.d.). Retrieved 2016, from http://www.austintexas.gov/
Banda, H. S. (2007). Entrepreneurship and Economic Growth: An Empirical Analsis. Journal of
Developmental Entrepreneurship, 12(1), 3-29.
Batabyal, A. A., & Nijkamp, P. (2012). A Schumpeterian Model of Entrepreneurship,
Innovation, and Regional Economic Growth. International Regional Science
Review, 35(3), 339-361.
Bednarzik, R. W. (2000). The role of entrepreneurship in U.S. and European job
growth. Monthly Labor Review, 123(7), 3-16.
Beugelsdijk, S. (2007). Entrepreneurial culture, regional innovativeness and economic
growth. Journal of Evolutionary Economics, 17(2), 187-210.
Bezzina, F. (2010). Characteristics of the Maltese entrepreneur. International Journal of Arts and
Sciences, 3(7), 292-312.
Boote, D. N., & Beile, P. (2005). Scholars before researchers: On the centrality of the
dissertation literature review in research preparation. Educational Researcher, 34(6), 3-
15.
Brereton, P. R. (1974). The qualification for entrepreneurship. Journal of Small Business
Management, 12(4), 1-3.
Broeck, A., Vansteenkiste, M., Witte, H., Soenens, B., & Lens, W. (2010). Capturing autonomy,
competence, and relatedness at work: Construction and initial validation of the Work-
related Basic Need Satisfaction scale. Journal of Occupational and Organizational
Psychology, 83(4), 981-1002.
Caird, S. (1990a). What does it mean to be enterprising? British Journal of Management, 1(3),
137-147.
117
Caird, S. (1991a). Self assessments on enterprise training courses. British Journal of Education
and Work, 4(3), 63-80.
Caird, S. (1991b). Testing enterprising tendency in occupational groups. British Journal of
Management, 2(4), 177-186.
Caird, S. (1993) What do psychological tests suggest about entrepreneurs? Journal of
Managerial Psychology, 8(6), pp. 11-20
Caird, S. (2006). General measure of enterprising tendency Version 2 (GET2), Appendix in T.
Mazzarol, Entrepreneurship and Innovation Australia: Tilde University Press. May.
Caird, S. (2013). General measure of Enterprising Tendency test. www. get2test.com. Retrieved
April 12, 2017, from
https://www.researchgate.net/publication/301347695_General_measure_of_Enterprising_
Tendency_testwwwget2testnet.
City of Dallas. (n.d.). Retrieved 2016, from http://dallascityhall.com.
City of Houston eGovernment Center. (n.d.). Retrieved 2016, from http://www.houstontx.gov.
City of San Antonio. (n.d.). Retrieved 2016, from http://www.sanantonio.gov.
Collins, C. J., Hanges, P. J., & Locke, E. A. (2004). The relationship of achievement motivation
to entrepreneurial behavior: A Meta-Analysis. Human Performance, 17(1), 95-117.
Creswell, J. W. (2012). Education research: Planning, conducting, and evaluating quantitative
and qualitative research. (4th ed). Boston, MA: Pearson.
Cromie, S. (2000). Assessing entrepreneurial inclinations: Some approaches and empirical
evidence. European Journal of Work and Organizational Psychology, 9(1), 7-30.
Dada, O., Watson, A., & Kirby, D. (2015). Entrepreneurial tendencies in franchising: Evidence
from the UK. Journal of Small Business and Enterprise Development, 22(1), 82-98.
Dallas Regional Chamber. (n.d.). Retrieved 2016, from https://www.dallaschamber.org
Decker, R., Haltiwanger, J., Jarmin, R., & Miranda, J. (2014). The role of entrepreneurship in US
job creation and economic dynamism. Journal of Economic Perspectives, 28(3), 3-24.
DeMaria, A. N. (2013). Here come the Millennials. Journal of the American College of
Cardiology, 61(15), 1654-1656.
Demirci, A. E. (2013). Cross-cultural differences in entrepreneurial tendencies: An exploratory
view in Turkey and Canada. International Journal of Entrepreneurship, 17, 21-40.
118
Estay, C., Durrieu, F., & Akhter, M. (2013). Entrepreneurship: From motivation to start-
up. Journal of International Entrepreneurship, 11(3), 243-267.
Fayolle, A. (2008). Entrepreneurship education at a crossroads: Towards a more mature teaching
field. Journal of Enterprising Culture, 16(04), 325-337.
Fyock, C. D. (1990). America's work force is coming of age: What every business needs to know
to recruit, train, manage, and retain an aging work force (1st ed.). Lexington, MA:
Lexington Books.
Gale, W., & Brown, S. (2013). Small business, innovation, and tax policy: A review. National
Tax Journal, 66(4), 871-892.
Galindo, M. A., & Picazo, M. T. (2013). Innovation, entrepreneurship and economic
growth. Management Decision, 51(3), 501-514.
Glaeser, E. L., Kerr, S. P., & Kerr, W. R. (2015). Entrepreneurship and urban growth: An
empirical assessment with historical mines. Review of Economics and Statistics, 97(2),
498-520.
Hafer, R. (2013). Entrepreneurship and state economic growth. Journal of Entrepreneurship and
Public Policy, 2(1), 67-79.
Hathaway, I., & Litan, R. (2014). The other aging of America: The increasing dominance of
older firms. Retrieved July 19, 2016, from
http://www.brookings.edu/research/papers/2014/07/aging-america-increasing-
dominance-older-firms-litan.
Hisrich, R. D. (2014). Advanced introduction to entrepreneurship (1st ed.). Cheltenham: Elgar.
Howe, N., & Strauss, W. (2000). Millennials rising: The next great generation (1st ed.). New
York: Vantage.
Johnson, B. R. (1990). Toward a multidimensional model of entrepreneurship: The case of
achievement motivation and the entrepreneur. Entrepreneurship Theory and
Practice, 14(3), 39-54.
Keeling, S. (2003). Advising the millennial generation. NACADA Journal, 23(1-2), 30-36.
Kerr, W. R., Nanda, R., & Kropf, M. R. (2014). Entrepreneurship as experimentation. Journal of
Economic Perspectives, 28(3), 25-48.
Kirby, D.A. & Ibrahim, N. (2011). Entrepreneurship education and the creation of an enterprise
culture: provisional results from an experiment in Egypt. International Entrepreneurship
and Management, 7(2), 181-193.

119
Lancaster, L., & Stillman, D., (2002). When generations collide: Who they are, why they clash,
how to solve the generational puzzle at work (1st ed.). New York: Harper Business.
Lazear, E. P. (2005). Entrepreneurship. Journal of Labor Economics, 23(4), 649-680.
Longenecker, J. G., & Schoen, J. E. (1975). The essence of entrepreneurship. Journal of Small
Business Management, 13(3), 26-32.
Lyons, R., Lynn, T., & Bhaird, C. (2015). Individual level assessment in entrepreneurship
education: An investigation of theories and techniques. Journal of Entrepreneurship
Education, 18(1), 133-156.
Lyons, S., & Kuron, L. (2013). Generational differences in the workplace: A review of the
evidence and directions for future research. Journal of Organizational Behavior, 35, 139-
157.
Macko, A., & Tyszka, T. (2009). Entrepreneurship and risk taking. Applied Psychology, 58(3),
469-487.
Martin, C.A. & Tulgan, B. (2006). Managing the generation mix: from urgency to opportunity
(2nd ed.). Amherst, MA: HRD Press, Inc.
McClelland, D. (1987). Characteristics of successful entrepreneurs. Journal of Creative
Behavior, 21(3), 219-233.
McGourty, J. (2009). Entrepreneurship. Journal of Engineering Education, 98(2), 205-208.
Mchugh, M. L. (2013). The chi-square test of independence. Biochemia Medica, 23(2), 143-149.
Minniti, M. (2008). The role of government policy on entrepreneurial activity: Productive,
unproductive, or destructive? Entrepreneurship Theory and Practice, 32(5), 779-790.
Morris, M. H., Webb, J. W., Fu, J., & Singhal, S. (2013). A competency-based perspective on
entrepreneurship education: conceptual and empirical insights. Journal of Small Business
Management, 51(3), 352-369.
Murray, K. (2015). Millennials: The future workforce. Nursing Management, 46(4), 56.
Nistler, D. L., Lamm, A. J., & Stedman, N. (2011). Evaluating the influences on extension
professionals’ engagement in leadership roles. Journal of Agricultural Education, 52(3),
110-121.
Oblinger, D., & Oblinger, J. L. (2005). Educating the net generation (1st ed.). Boulder, CO:
Educause.
120
Olson, P. D. (1987). Entrepreneurship and management. Journal of Small Business
Management, 25(3), 7-13.
Pallant, J. (2013). SPSS survival manual: A step by step guide to data analysis using IBM SPSS
(5th ed.). London: McGraw-Hill.
Picazo, M. T., Martin, M. A., & Soriano, D. R. (2012). Governance, entrepreneurship and
economic growth. Entrepreneurship and Regional Development, 24(9-10), 865-877.
Raposo, M., Paco, A. D., & Ferreira, J. (2008). Entrepreneur's profile: A taxonomy of attributes
and motivations of university students. Journal of Small Business and Enterprise
Development, 15(2), 405-418.
Rupasingha, A., & Goetz, S. J. (2013). Self-employment and local economic performance:
Evidence from US counties. Papers in Regional Science, 91(1), 141-161.
Ryan, R. (2004). The next generation of entrepreneurs: How to attract, keep and grow them. The
Council of State Governments, 77(4), 37-39.
Sadeghi, A. (2008, December). The births and deaths of business establishments in the United
States. Monthly Labor Review, 131(12), 3-18.
San Antonio Chamber of Commerce. (n.d.). Retrieved 2016, from http://sachamber.org.
San Antonio Economic Development Foundation | SAEDF. (n.d.). Retrieved 2016, from
http://www.sanantonioedf.com.
Sandeen, C. (2008). Boomers, Xers, and Millennials: Who are they and what do they really want
from continuing higher education? Continuing Higher Eduction Review, 72, 11-31.
Scales, T. W. (2011). A booming economy. Journal of Applied Business and Economics, 12(3),
37-43.
Sekaran, U., & Bougie, R. (2013). Sampling. In research methods for business: A skill-building
approach (6th Ed). Chichester, West Sussex.
Shane, S., & Venkataraman, S. (2000). The promise of entrepreneurship as a field of
research. Academy of Management Review, 25(1), 217-226.
Shaver, K. G. (1995). The entrepreneurial personality myth. Business and Economic
Review, 41(3), 20-23.
Simon, M. K., & Francis, J. B. (2001). The dissertation and research cookbook from soup to
nuts: A practical guide to help you start and complete your dissertation or research
project (3rd ed.). Dubuque, IA: Kendall/Hunt.
121
Singh, G., & Denoble, A. (2003). Early retirees as the next generation of entrepreneurs.
Entrepreneurship Theory and Practice, 27(3), 207-226.
Spector, J. M. (2008). Handbook of research on educational communications and technology
(3rd ed.). New York: Lawrence Erlbaum Associates.
Stephens, H. M., Partridge, M. D., & Faggian, A. (2013). Innovation, entrepreneurship and
economic growth in lagging regions. Journal of Regional Science, 53(5), 778-812.
Strauss, W., & Howe, N. (1991). Generations: The history of America’s future, 1584 to 2069 (1st
ed.). New York: William Morrow.
Tabachnick, B. G., & Fidell, L. S. (2013). Using multivariate statistics (6th ed.). Boston:
Pearson.
U.S. Bureau of Labor Statistics. (n.d.). Retrieved 2016, from http://www.bls.gov.
United States Bureau of Labor Statistics. (n.d.). Retrieved 2016, from https://www.bls.gov.
Wiedmer, T. (2015). Generations do differ: best practices in leading Traditionalists, Boomers,
and Generations X, Y, and Z. Delta Kappa Gamma Bulletin, 82(1), 51-58.
Zemke, R., Raines, C, & Filipczak, B. (2000). Generations at work: Managing the clash of
Veterans, Boomers, Xers and Nexters in your workplace (1st ed.). New York, NY:
American Management Association.
Zhao, H., Seibert, S. E., & Lumpkin, G. (2010). The relationship of personality to entrepreneurial
intentions and performance: A meta-analytic review. Journal of Management, 36(2), 381-
404.
Zimmerer, T., Scarborough, N. M. (2005). Essentials of Entrepreneurship and Small Business
Management (4th ed.). Upper Saddle River, NJ: Pearson/Prentice Hall.
Zimmerer, T., Scarborough, N. M., & Wilson, D. (2008). Essentials of entrepreneurship and
small business management (5th ed.). Upper Saddle River, NJ: Pearson/Prentice Hall.

Appendices

123
Appendix A—Instrumentation Permission
From: Sally.Caird <[email protected]>
Sent: Tuesday, June 28, 2016 10:44 AM
To: Eken, Ihsan
Subject: RE: Permission for Enterprising Tendency test
Dear Ihsan
I am pleased to hear of your interest in using the General measure of Enterprising Tendency test
to support your research at the University of the Incarnate Word, San Antonio, Texas.
Over the past 20 years there has been considerable worldwide interest in the test of General
Enterprising Tendency (GET test) that I co-developed and tested as a researcher at the University
of Durham. Due to this interest and the volume of requests for the test, I created
http://www.get2test.net/, freely available to people who wish to test their enterprising tendency,
or for educational, training, development and research purposes. The GET tool has been widely
used with an average of 1000 users per month, and the GET test has been adopted by over 80
institutions and organisations in over 30 countries.
The GET2test is freely available for research purposes and to support education. Please note that
commercial use of the GET2test materials are separately licensed and that the intellectual
property is protected byOblinger, D., & Oblinger, J. L. (2005). Educating the net
generation. Boulder, CO: EDUCAUSE. copyright. Details on the GET test may be freely
downloaded from the Open University repository http://oro.open.ac.uk/5393/. The website
provides each respondent with a detailed report. Licensing arrangements are required for other
uses. There is a licensing arrangement with Oxford Innovations Services Ltd., a major UK-based
consultancy who use the test extensively to support SME start-ups and high growth companies.
The basic premise of the test is that the enterprising person shares entrepreneurial characteristics.
The psychological literature has different views on entrepreneurial characteristics and which
ones are important. The approach we took involved identifying key characteristics of
entrepreneurial people which are associated with entrepreneurial behaviour, and the
entrepreneurial act itself. The key entrepreneurial characteristics identified include: strong
motivation, characterised by a high need for achievement and for autonomy; creative tendency;
calculated risk-taking; and an internal locus of control (belief you have control over own destiny
and make your own 'luck'). People set up an enterprise because they are highly motivated (to
achieve something themselves) by a good idea and will manage risks, information and
uncertainties because they believe they can set up the enterprise successfully.
The test was developed from an analysis of psychological tests of these selected characteristics
and a literature review leading to the creation of a bank of entrepreneurial descriptions. This was
pilot tested with entrepreneurs and other occupational groups which established initial construct
validity and reliability. We reviewed psychological tests and created the GET test which was
validated with occupational and other groups during a one year research project. Further
validation of the test would be recommended although the test has been considered very useful

124
world-wide for research, education and development purposes. I see the GET2test primarily as
an educational tool rather than a predictive measure. It is not a definitive test of entrepreneurial
tendency but it is useful in educational settings to prompt thought and discussion about what it
means to be enterprising.
I would ask if you would acknowledge my support if you decide to use the GET2test web
materials. The acknowledgement should read as follows:
The General measure of Enterprising Tendency (GET) test was originally developed in 1988 by
Dr Sally Caird and Mr Cliff Johnson at Durham University Business School. Further
development by Dr Caird, The Open University led to the GET2 test website development
available via the open educational website http://www.get2test.net/ .
I would appreciate if you would keep me up-to-date on your work.
Best Wishes
Sally Caird
Dr Sally Caird FHEA
Research Fellow
School of Engineering and Innovation
Faculty of Science, Technology, Engineering & Mathematics, The Open University, Milton
Keynes MK7 6AA, UK.
email [email protected]
The Open University is incorporated by Royal Charter (RC 000391), an exempt charity in
England & Wales, and a charity registered in Scotland (SC 038302). The Open University is
authorised and regulated by the Financial Conduct Authority.
From: Eken, Ihsan [mailto:[email protected]]
Sent: 20 June 2016 22:55
To: Sally.Caird <[email protected]>
Subject: Permission for Enterprising Tendency test
Dear Dr. Caird,
My name is Ihsan Eken. I am currently a doctoral student in business administration program
in San Antonio, Texas. I was looking for a survey tool for my dissertation topic regarding entrepr
eneurial traits and I have come across your Enterprising Tendency test (Motivation, Creative ten
dency, calculated risk-taking, and locus of control). I was wondering if I utilize your survey tool
in my dissertation study (proposal will take place in Fall 2016) in order to detect entrepreneurs'
traits. I would like to have your permission to use this tool for this purpose.
Best regards,
Ihsan Eken, MBA
University of the Incarnate Word
This email and any files transmitted with it may be confidential or contain privileged information
and are intended solely for the use of the individual or entity to which they are addressed. If you
are not the intended recipient, please be advised that you have received this email in error and
that any use, dissemination, forwarding, printing, or copying of this email and any attachments is

125
strictly prohibited. If you have received this email in error, please immediately delete the email
and any attachments from your system and notify the sender. Any other use of this e-mail is
prohibited. Thank you for your compliance.

126
Appendix B—Informed Consent
Relationship Between Generations of Entrepreneurs and Entrepreneurial traits
University of the Incarnate Word
Ihsan Eken,
The following informed consent language will be the first page of the web-based survey and
responders will have to respond Yes or No to participate, indicating consent.
Consent to take part in the study
I am a graduate student at UIW working towards a doctoral degree in the concentration of Doctor
of Business Administration. You are being asked to take part in a research study regarding
relationship between generations of entrepreneurs and entrepreneurial traits. We want to learn if
there is a relationship between the three different generations and five different characteristics of
entrepreneurial traits and to contribute beneficial insights to your understanding in enterprising
potential and differentiate yourselves in entrepreneurial traits. You are being asked to take part in
this study because we are inviting all self-employed small-business owners with the title of
entrepreneur who play significant role in entrepreneurship.
If you decide to take part, you will complete a web-based survey with questions about General
measure of Enterprising Tendency test (GET2) and a few demographics. The duration of the
survey could be no longer than 10 minutes and there are no more than minimal risks associated
with your participation in this research. We do not guarantee that you will benefit from taking
part in this study. Everything we learn about you in the study will be confidential. If we publish
the results of the study, you will not be identified in any way. Your decision to take part in the
study is voluntary. You are free to choose not to take part in the study or to stop taking part at
any time. If you choose not to take part or to stop at any time, it will not affect your current and
future status at EO.
If you have questions, feel free to ask us. If you have additional questions later or you wish to
report a problem that may be related to this study, contact University of the Incarnate Word or at
210-367-6858. The University of the Incarnate Word committee that reviews research on human
subjects, the Institutional Review Board, will answer any questions about your rights as a
research subject (829-2759—Dean of Graduate Studies and Research).
Do you wish to participate in this study? Yes/ No

127
Appendix C—Instrument
Demographic Items
1. Gender (Male, Female)
2. Age (18-35, 36-51, 52-70)
3. Ethnicity (American Indian or Alaskan Native, Asian or Pacific Islander, Black or
African American, Hispanic or Latino, White/Caucasian, prefer not to answer, Other
please specify)
4. Level of Education (High School/GED, Some College, Associates Degree, Bachelor’s
Degree, Master’s Degree, Professional Degree, Doctoral Degree)
5. Number of employees in the company (0-10, 11-50, 51-100, 101-200, 201-500, more
than 500)
6. Type of business (Manufacturing, Consumer services, Retail, Wholesale/Distribution,
Business Services, Other)
7. Number of years as a small business owner (0-5, 6-10, 11-15, 16-20, 21-30, more than
30)
The GET2 Test
Instructions: For each of the 54 questions below, please select the answer that you most closely
feel reflects yourself. There is no time limit, so consider each question carefully and respond
with candor. A for ‘Tend to Agree’, D for ‘Tend to Disagree’.
1. I would not mind routine unchallenging work if the pay and pension prospects were
good.
A D
2. I like to test boundaries and get into areas where few have worked before.
A D
3. I tend not to like to stand out or be unconventional.
A D
4. Capable people who fail to become successful have not usually taken chances when they
have occurred.
A D
5. I rarely day dream.
A D
6. I find it difficult to switch off from work completely.
A D
7. You are either naturally good at something or you are not, effort makes no difference.
A D
8. Sometimes people find my ideas unusual.
A D
9. I would rather buy a lottery ticket than enter a competition.
A D
10. I like challenges that stretch my abilities and get bored with things I can do quite easily.
A D

128
11. I would prefer to have a moderate income in a secure job rather than a high income in a
job that depended on my performance.
A D
12. At work, I often take over projects and steer them my way without worrying about what
other people think.
A D
13. Many of the bad times that people experience are due to bad luck.
A D
14. Sometimes I think about information almost obsessively until I come up with new ideas
and solutions.
A D
15. If I am having problems with a task I leave it, forget it and move on to something else.
A D
16. When I make plans I nearly always achieve them.
A D
17. I do not like unexpected changes to my weekly routines.
A D
18. If I wanted to achieve something and the chances of success were 50/50 I would take the
risk.
A D
19. I think more of the present and past than of the future.
A D
20. If I had a good idea for making some money, I would be willing to invest my time and
borrow money to enable me to do it.
A D
21. I like a lot of guidance to be really clear about what to do in work.
A D
22. People generally get what they deserve.
A D
23. I am wary of new ideas, gadgets and technologies.
A D
24. It is more important to do a job well than to try to please people.
A D
25. I try to accept that things happen to me in life for a reason.
A D
26. Other people think that I‘m always making changes and trying out new ideas.
A D
27. If there is a chance of failure I would rather not do it.
A D
28. I get annoyed if people are not on time for meetings.
A D
29. Before I make a decision I like to have all the facts no matter how long it takes.
A D
30. I rarely need or want any assistance and like to put my own stamp on work that I do.
A D
31. You are not likely to be successful unless you are in the right place at the right time.

129
A D
32. I prefer to be quite good at several things rather than very good at one thing.
A D
33. I would rather work with a person I liked who was not good at the job, rather than work
with someone I did not like even if they were good at the job.
A D
34. Being successful is a result of working hard, luck has little to do with it.
A D
35. I prefer doing things in the usual way rather than trying out new methods.
A D
36. Before making an important decision I prefer to weigh up the pro's and con's fairly
quickly rather than spending a long time thinking about it.
A D
37. I would rather work on a task as part of a team rather than take responsibility for it
myself.
A D
38. I would rather take an opportunity that might lead to even better things than have an
experience that I am sure to enjoy.
A D
39. I usually do what is expected of me and follow instructions carefully.
A D
40. For me, getting what I want is a just reward for my efforts.
A D
41. I like to have my life organized so that it runs smoothly and to plan.
A D
42. When I am faced with a challenge I think more about the results of succeeding than the
effects of failing.
A D
43. I believe that destiny determines what happens to me in life.
A D
44. I like to spend time with people who have different ways of thinking.
A D
45. I find it difficult to ask for favors from other people.
A D
46. I get up early, stay late or skip meals if I have a deadline for some work that needs to be
done.
A D
47. What we are used to is usually better than what is unfamiliar.
A D
48. I get annoyed if superiors or colleagues take credit for my work.
A D
49. People's failures are rarely the result of their poor judgement.
A D
50. Sometimes I have so many ideas that I feel pressurized.
A D
51. I find it easy to relax on holiday and forget about work.

130
A D
52. I get what I want from life because I work hard to make it happen.
A D
53. It is harder for me to adapt to change than keep to a routine.
A D
54. I like to start interesting projects even if there is no guaranteed payback for the money or
time I have to put in.
A D

131
Appendix D—IRB Approval

132
Appendix E—Nonsignificant values (Question 3)
Total Need for Achievement vs. Generations
Descriptives
Total Need for Achievement
N Mean Std. Deviation Std. Error
95% Confidence
Interval for Mean
Minimum Maximum
Lower
Bound
Upper
Bound
18-35 43 9.98 1.640 .250 9.47 10.48 6 12
36-51 50 9.88 1.586 .224 9.43 10.33 6 12
52-70 24 9.54 1.793 .366 8.78 10.30 6 12
Total 117 9.85 1.643 .152 9.55 10.15 6 12
Test of Homogeneity of Variances
Total Need for Achievement
Levene Statistic df1 df2 Sig.
.595 2 114 .553
ANOVA
Total Need for Achievement
Sum of Squares df Mean Square F Sig.
Between Groups 3.016 2 1.508 .554 .576
Within Groups 310.215 114 2.721
Total 313.231 116
Multiple Comparisons
Dependent Variable: Total Need for Achievement
Tukey HSD
Age (J) Age Mean Difference (I-J) Std. Error Sig.
95% Confidence Interval
Lower Bound Upper Bound
18-35 36-51 .097 .343 .957 -.72 .91
52-70 .435 .420 .556 -.56 1.43
36-51 18-35 -.097 .343 .957 -.91 .72
52-70 .338 .410 .688 -.63 1.31
52-70 18-35 -.435 .420 .556 -1.43 .56
36-51 -.338 .410 .688 -1.31 .63
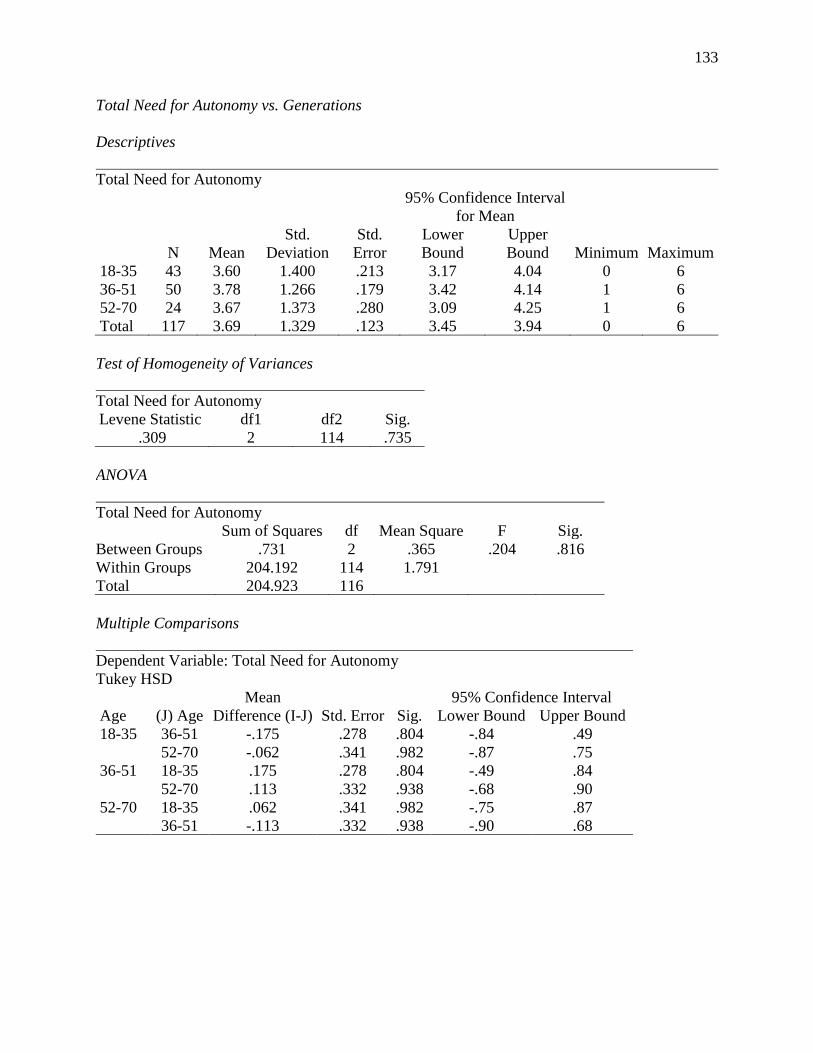
133
Total Need for Autonomy vs. Generations
Descriptives
Total Need for Autonomy
N Mean
Std.
Deviation
Std.
Error
95% Confidence Interval
for Mean
Minimum Maximum
Lower
Bound
Upper
Bound
18-35 43 3.60 1.400 .213 3.17 4.04 0 6
36-51 50 3.78 1.266 .179 3.42 4.14 1 6
52-70 24 3.67 1.373 .280 3.09 4.25 1 6
Total 117 3.69 1.329 .123 3.45 3.94 0 6
Test of Homogeneity of Variances
Total Need for Autonomy
Levene Statistic df1 df2 Sig.
.309 2 114 .735
ANOVA
Total Need for Autonomy
Sum of Squares df Mean Square F Sig.
Between Groups .731 2 .365 .204 .816
Within Groups 204.192 114 1.791
Total 204.923 116
Multiple Comparisons
Dependent Variable: Total Need for Autonomy
Tukey HSD
Age (J) Age
Mean
Difference (I-J) Std. Error Sig.
95% Confidence Interval
Lower Bound Upper Bound
18-35 36-51 -.175 .278 .804 -.84 .49
52-70 -.062 .341 .982 -.87 .75
36-51 18-35 .175 .278 .804 -.49 .84
52-70 .113 .332 .938 -.68 .90
52-70 18-35 .062 .341 .982 -.75 .87
36-51 -.113 .332 .938 -.90 .68

134
Total Creative Tendency vs. Generations
Descriptives
Total Creative Tendency
N Mean Std. Deviation Std. Error
95% Confidence
Interval for Mean
Minimum Maximum
Lower
Bound
Upper
Bound
18-35 43 6.77 2.114 .322 6.12 7.42 3 10
36-51 50 6.16 1.845 .261 5.64 6.68 2 10
52-70 24 5.88 2.092 .427 4.99 6.76 3 9
Total 117 6.32 2.012 .186 5.96 6.69 2 10
Test of Homogeneity of Variances
Total Creative Tendency
Levene Statistic df1 df2 Sig.
1.062 2 114 .349
ANOVA
Total Creative Tendency
Sum of Squares df Mean Square F Sig.
Between Groups 14.639 2 7.319 1.834 .164
Within Groups 455.019 114 3.991
Total 469.658 116
Multiple Comparisons
Dependent Variable: Total Creative Tendency
Tukey HSD
Age (J) Age
Mean
Difference (I-J) Std. Error Sig.
95% Confidence Interval
Lower Bound Upper Bound
18-35 36-51 .607 .416 .313 -.38 1.59
52-70 .892 .509 .190 -.32 2.10
36-51 18-35 -.607 .416 .313 -1.59 .38
52-70 .285 .496 .834 -.89 1.46
52-70 18-35 -.892 .509 .190 -2.10 .32
36-51 -.285 .496 .834 -1.46 .89

135
Total Locus of Control vs. Generations
Descriptives
Total Locus of Control
N Mean Std. Deviation Std. Error
95% Confidence
Interval for Mean
Minimum Maximum
Lower
Bound
Upper
Bound
18-35 43 8.74 1.157 .176 8.39 9.10 5 11
36-51 50 8.96 1.442 .204 8.55 9.37 2 11
52-70 24 9.00 1.063 .217 8.55 9.45 6 10
Total 117 8.89 1.265 .117 8.66 9.12 2 11
Test of Homogeneity of Variances
Total Locus of Control
Levene Statistic df1 df2 Sig.
.215 2 114 .807
ANOVA
Total Locus of Control
Sum of Squares df Mean Square F Sig.
Between Groups 1.450 2 .725 .449 .640
Within Groups 184.106 114 1.615
Total 185.556 116
Multiple Comparisons
Dependent Variable: Total Locus of Control
Tukey HSD
Age (J) Age
Mean Difference
(I-J) Std. Error Sig.
95% Confidence Interval
Lower
Bound
Upper
Bound
18-35 36-51 -.216 .264 .694 -.84 .41
52-70 -.256 .324 .710 -1.02 .51
36-51 18-35 .216 .264 .694 -.41 .84
52-70 -.040 .316 .991 -.79 .71
52-70 18-35 .256 .324 .710 -.51 1.02
36-51 .040 .316 .991 -.71 .79
Related Documents