1 Refining, Transportation & Marketing (RTM), and Petrochemicals Paulo Roberto Costa Downstream Director 26th October, 2011

Refining, transportation & marketing (rtc), and petrochemicals
Aug 20, 2015
Welcome message from author
This document is posted to help you gain knowledge. Please leave a comment to let me know what you think about it! Share it to your friends and learn new things together.
Transcript
1
Refining, Transportation & Marketing (RTM), and Petrochemicals
Paulo Roberto Costa
Downstream Director
26th October, 2011
2
This presentation may contain forward-looking statements. Such statements reflect only the expectations of the Company's management regarding the future conditions of the economy, the industry, the performance and financial results of the Company, among other factors. Such terms as "anticipate", "believe", "expect", "forecast", "intend", "plan", "project", "seek", "should", along with similar expressions, are used to identify such statements. These predictions evidently involve risks and uncertainties, whether foreseen or not by the Company. Consequently, these statements do not represent assurance of future results of the Company. Therefore, the Company's future results of operations may differ from current expectations, and readers must not base their expectations solely on the information presented herein. The Company is not obliged to update the presentation and forward-looking statements in light of new information or future developments. Amounts informed for the year 2011 and upcoming years are either estimates or targets.
The United States Securities and Exchange Commission permits oil and gas companies, in their filings with the SEC, to disclose proved reserves that a company has demonstrated by actual production or conclusive formation tests to be economically and legally viable under existing economic and operating conditions. We use certain terms in this presentation, such as discoveries, that the SEC’s guidelines strictly prohibit us from including in filings with the SEC.
Cautionary statement for U.S. investors:
DISCLAIMER
3
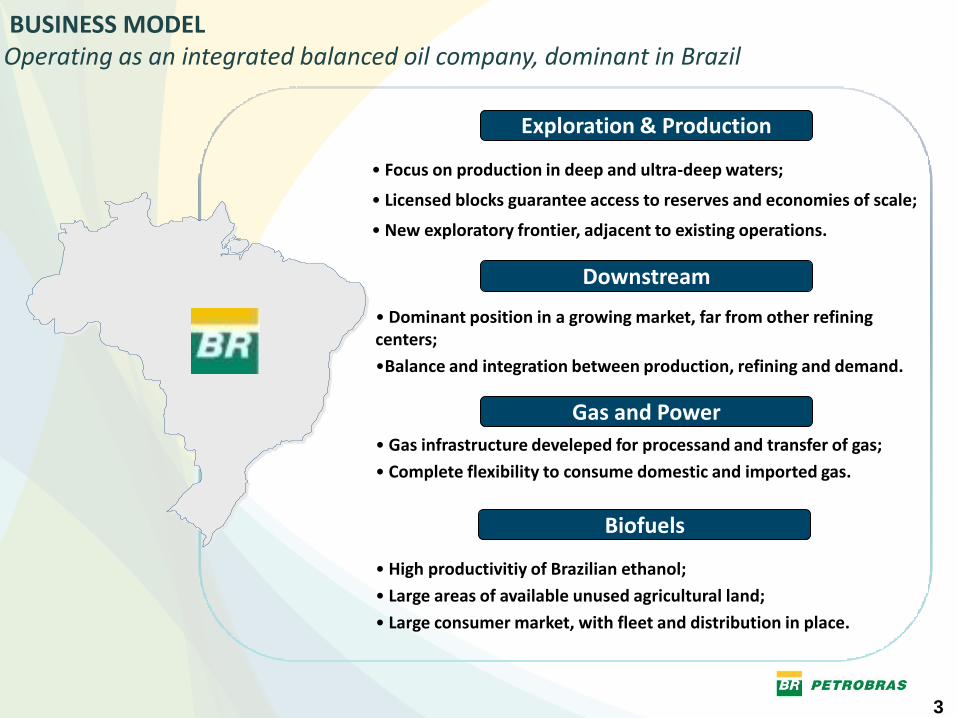
Exploration & Production
Gas and Power
Downstream
• Focus on production in deep and ultra-deep waters;
• Licensed blocks guarantee access to reserves and economies of scale;
• New exploratory frontier, adjacent to existing operations.
• Dominant position in a growing market, far from other refining centers;
•Balance and integration between production, refining and demand.
• Gas infrastructure develeped for processand and transfer of gas;
• Complete flexibility to consume domestic and imported gas.
Biofuels
• High productivitiy of Brazilian ethanol;
• Large areas of available unused agricultural land;
• Large consumer market, with fleet and distribution in place.
BUSINESS MODEL Operating as an integrated balanced oil company, dominant in Brazil
4
0
5.000
10.000
15.000
20.000
25.000
30.000
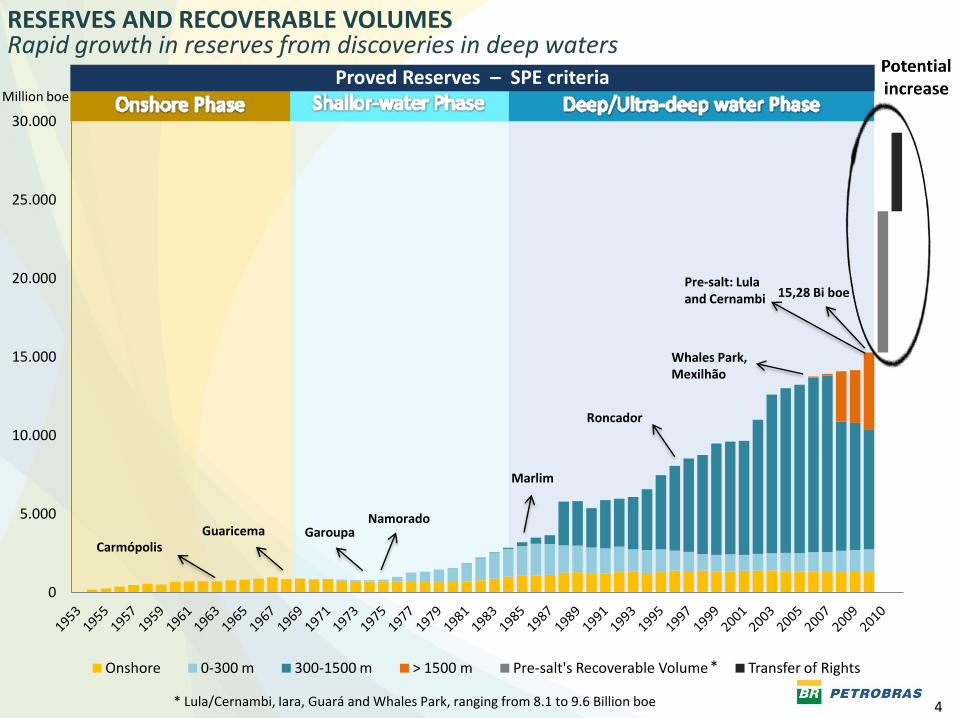
Onshore 0-300 m 300-1500 m > 1500 m Pre-salt's Recoverable Volume Transfer of Rights
Million boe Proved Reserves – SPE criteria
* Lula/Cernambi, Iara, Guará and Whales Park, ranging from 8.1 to 9.6 Billion boe
*
Garoupa Namorado
Marlim
Roncador
Whales Park, Mexilhão
Pre-salt: Lula and Cernambi 15,28 Bi boe
Carmópolis Guaricema
RESERVES AND RECOVERABLE VOLUMES Rapid growth in reserves from discoveries in deep waters
5
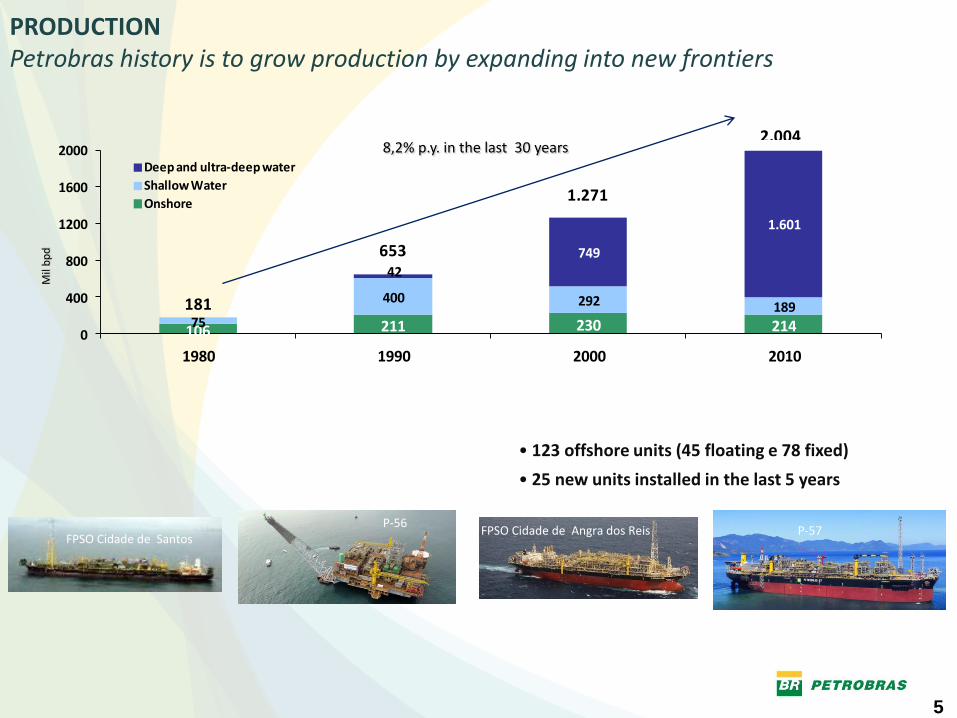
106 211 230 21475
400 292 189
42
749
1.601
0
400
800
1200
1600
2000
1980 1990 2000 2010
Deep and ultra-deep water
Shallow Water
Onshore
181
2.004
1.271
653
8,2% p.y. in the last 30 years
Mil
bp
d
FPSO Cidade de Santos
• 123 offshore units (45 floating e 78 fixed)
• 25 new units installed in the last 5 years
FPSO Cidade de Angra dos Reis P-56
P-57
PRODUCTION Petrobras history is to grow production by expanding into new frontiers
6
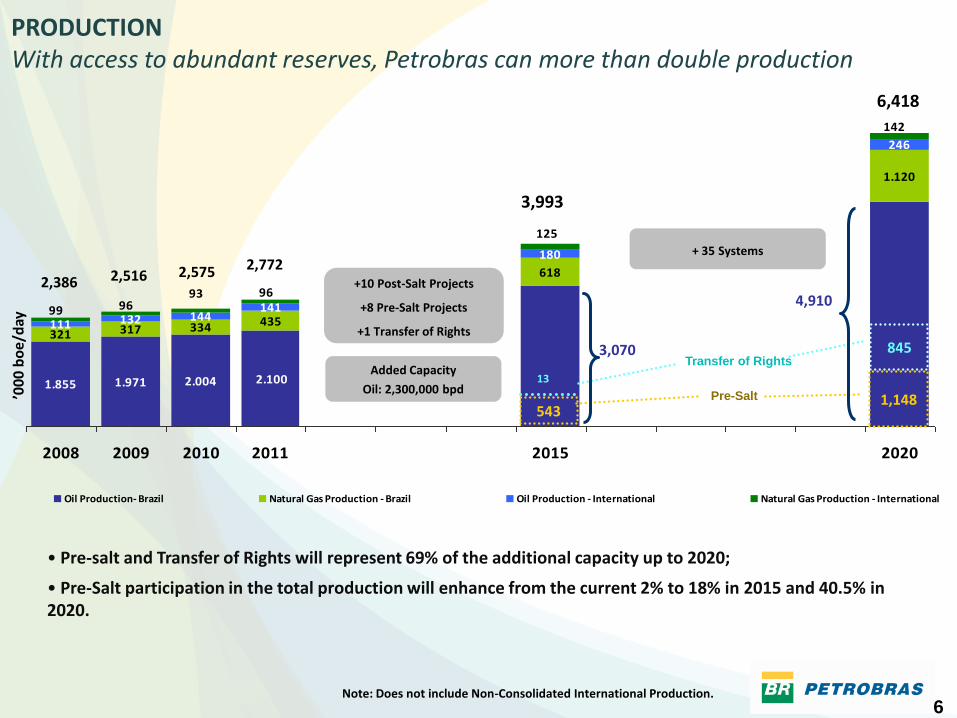
1.855 1.971 2.004
321 317 334 435
618
1.120
111 132 144141
180
246
2.100
99 9693 96
125
142
2008 2009 2010 2011 2015 2020
Oil Production- Brazil Natural Gas Production - Brazil Oil Production - International Natural Gas Production - International
2,386 2,516
6,418
3,993
1,148 543
Pre-Salt ’00
0 b
oe
/day
2,772
845 Transfer of Rights
13
+10 Post-Salt Projects
+8 Pre-Salt Projects
+1 Transfer of Rights
+ 35 Systems
Added Capacity
Oil: 2,300,000 bpd
2,575
Note: Does not include Non-Consolidated International Production.
• Pre-salt and Transfer of Rights will represent 69% of the additional capacity up to 2020;
• Pre-Salt participation in the total production will enhance from the current 2% to 18% in 2015 and 40.5% in 2020.
3,070
4,910
PRODUCTION With access to abundant reserves, Petrobras can more than double production
7
8
Distance
Crude freight
Product freight
• Lead-Times
• Tanks
• Inventories
• Ships
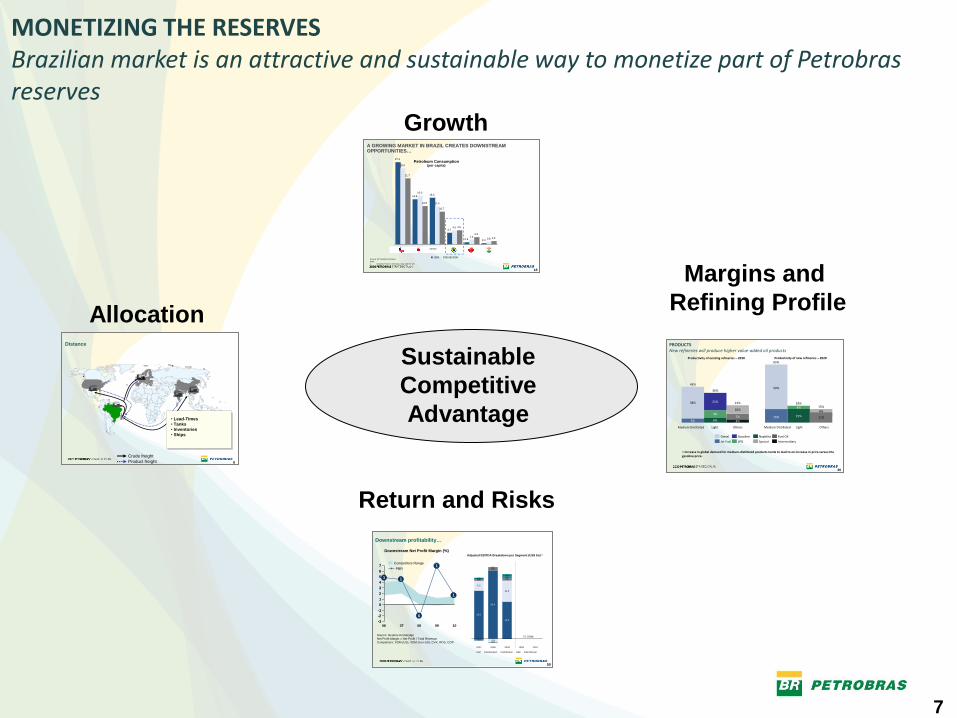
Allocation
18
A GROWING MARKET IN BRAZIL CREATES DOWNSTREAM A GROWING MARKET IN BRAZIL CREATES DOWNSTREAM OPPORTUNITIESOPPORTUNITIES……
Petroleum Consumption(per capita)
Source: BP Statistical Review
Note:
1. Includes France, Germany, Italy and the UK
27.1
14.815.3
3.7
0.6 0.3
25.0
16.0
12.4
4.5
1.40.8
21.7
12.6
10.7
4.6
2.3
1.0
US Japan OECD Brazil China India
1980 2000 2009
OECD1
Growth
40
21%
4%
7%
10%
Light
36%
6%
9%
21%
Medium Distillated
43%
5%
38%
Others
Fuel Oil
Special
Naphtha
LPG
Gasoline
Jet Fuel
Diesel
Intermediary
4%
15%
19%
4%
11%
15%
65%
15%
50%
Productivity of existing refineries – 2020
LightMedium Distillated Others
Productivity of new refineries – 2020
• Increase in global demand for medium-distillated products tends to lead to an increase in price versus the gasoline price.
PRODUCTSNew refineries will produce higher value-added oil products
Margins and
Refining Profile
MONETIZING THE RESERVES Brazilian market is an attractive and sustainable way to monetize part of Petrobras reserves
Sustainable
Competitive
Advantage
50
-3
-2
-1
0
1
2
3
4
5
6
7
-3
-2
-1
0
1
2
3
4
5
6
7
07 0806 1009
Competitors Range
1 1
1
1
6
PBR
Downstream Net Profit Margin (%)
Source: Reuters Knowledge
Net Profit Margin = Net Profit / Total Revenue
Competitors: XOM (US), XOM (non-US), CVX, RDS, COP
Downstream profitability…
Adjusted EBITDA Breakdown per Segment (US$ bn) 1
TO COME
25.0
35.4
19.3
5.2
-1.6
11.0
0.8
1.4
1.1
-0.8-0.2
0.90.5
0.2
1.1
2007 2008 2009 1S09 1S10
E&P Downstream Distribuition G&E International
Return and Risks

8
Growth Potential
9
-6
-4
-2
0
2
4
2011* 2010 2009 2008 2007 2006 2005 2004 2003 2002 2001 2000 -6
-4
-2
0
2
4
2010 2009 2008 2007 2006 2005 2004 2003 2002 2001 2000 2011*
-4
-2
0
2
4
6
8
10
12
2003 2002 2011* 2010 2009 2008 2007 2006 2005 2004 2001 2000
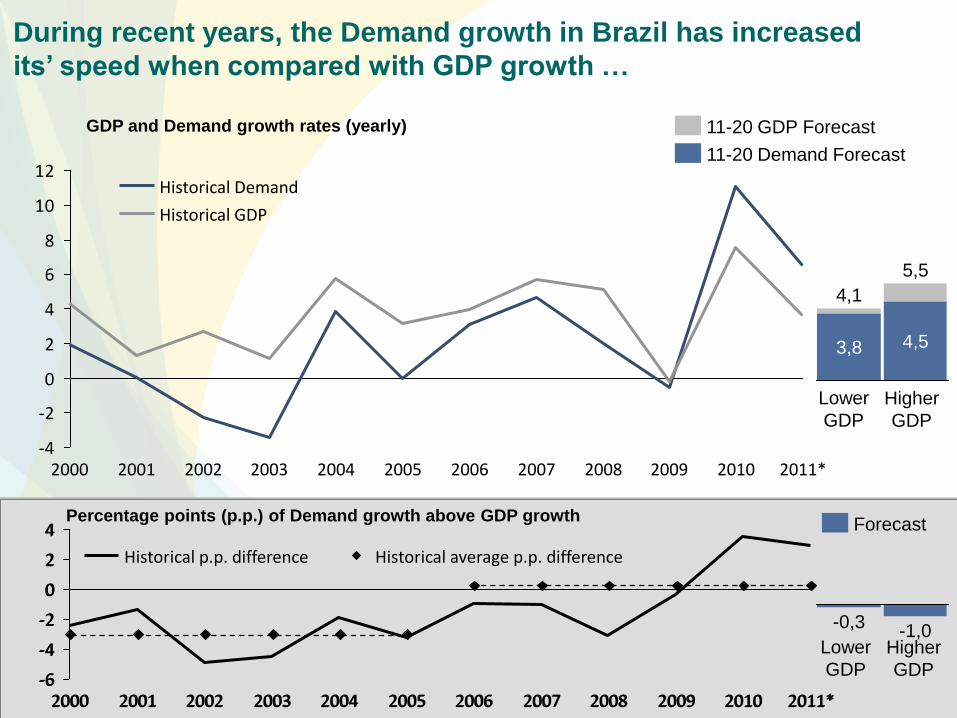
Percentage points (p.p.) of Demand growth above GDP growth
Historical GDP
Historical Demand
5,5
4,5
4,1
3,8
11-20 Demand Forecast
11-20 GDP Forecast
-1,0 -0,3
Historical average p.p. difference Historical p.p. difference
Forecast
Lower
GDP
Higher
GDP
During recent years, the Demand growth in Brazil has increased
its’ speed when compared with GDP growth …
GDP and Demand growth rates (yearly)
Lower
GDP
Higher
GDP
10
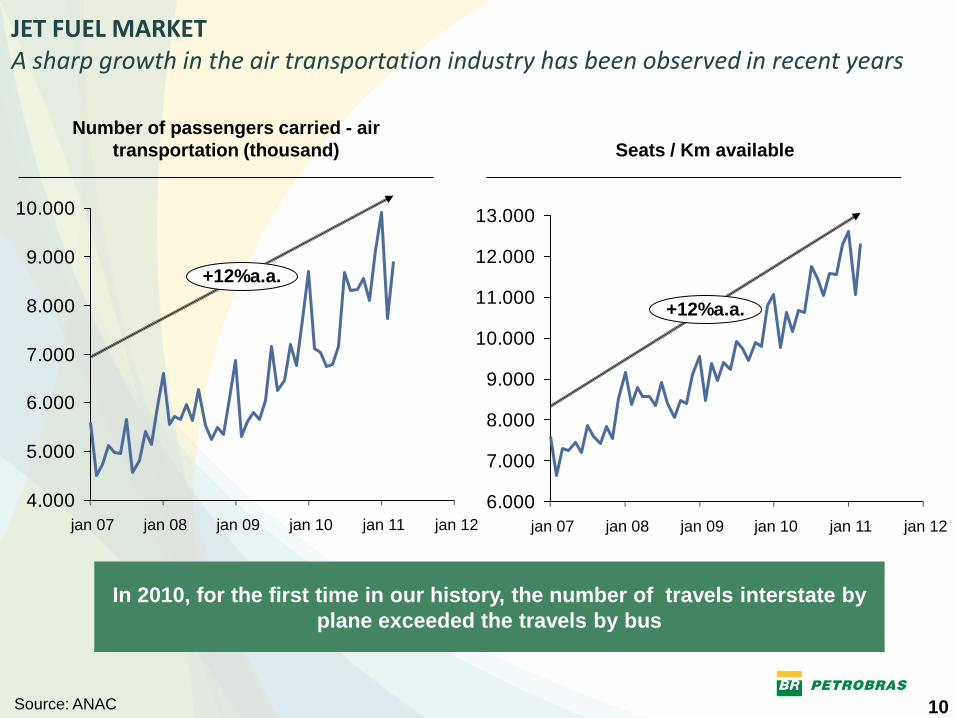
In 2010, for the first time in our history, the number of travels interstate by
plane exceeded the travels by bus
6.000
7.000
8.000
9.000
10.000
11.000
12.000
13.000
jan 12 jan 11 jan 10 jan 09 jan 08 jan 07
+12%a.a.
4.000
5.000
6.000
7.000
8.000
9.000
10.000
jan 10 jan 09 jan 08 jan 07
+12%a.a.
jan 12 jan 11
Source: ANAC
JET FUEL MARKET A sharp growth in the air transportation industry has been observed in recent years
Number of passengers carried - air
transportation (thousand) Seats / Km available
11
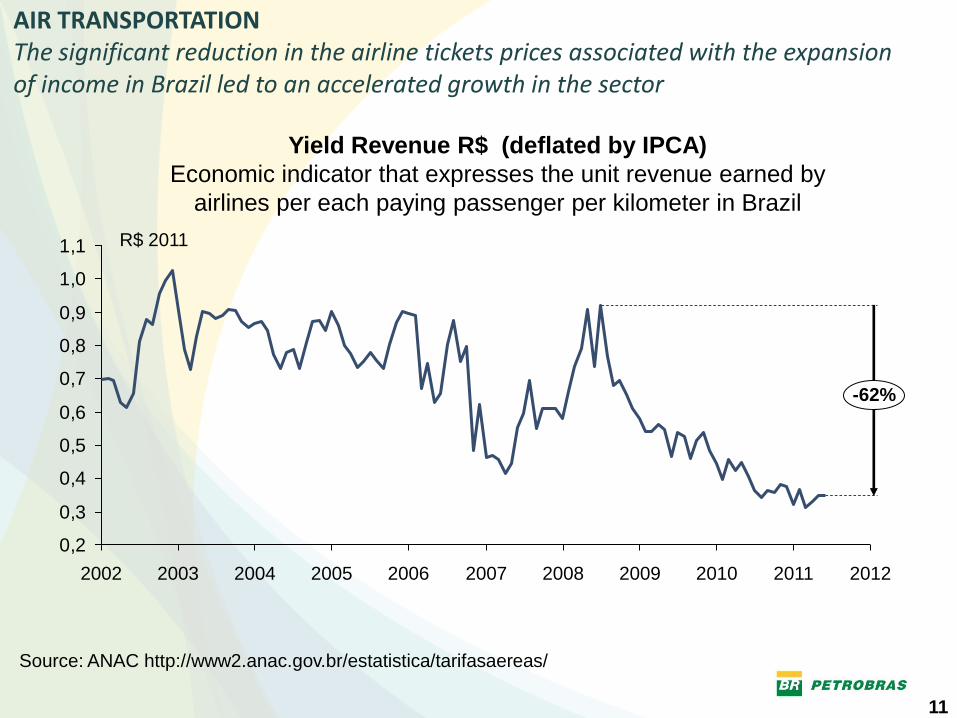
AIR TRANSPORTATION The significant reduction in the airline tickets prices associated with the expansion of income in Brazil led to an accelerated growth in the sector
0,2
0,3
0,4
0,5
0,6
0,7
0,8
0,9
1,0
1,1
2004 2003 2002
-62%
2005 2007 2012 2006 2008 2009 2010 2011
R$ 2011
Source: ANAC http://www2.anac.gov.br/estatistica/tarifasaereas/
Yield Revenue R$ (deflated by IPCA)
Economic indicator that expresses the unit revenue earned by
airlines per each paying passenger per kilometer in Brazil
12
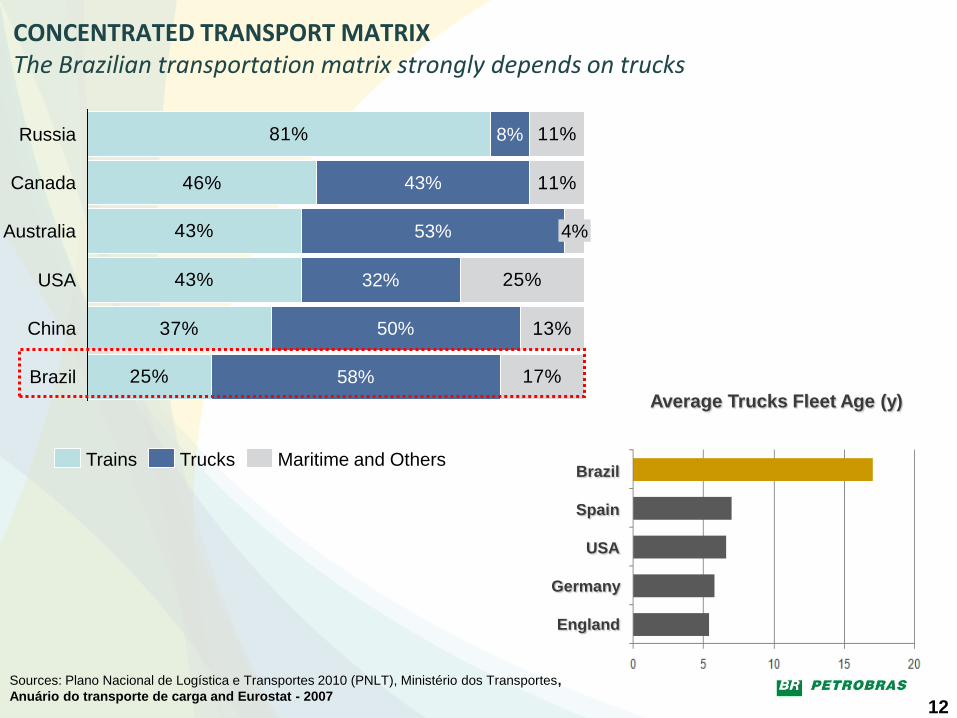
CONCENTRATED TRANSPORT MATRIX The Brazilian transportation matrix strongly depends on trucks
Sources: Plano Nacional de Logística e Transportes 2010 (PNLT), Ministério dos Transportes,
Anuário do transporte de carga and Eurostat - 2007
Average Trucks Fleet Age (y)
81%
46%
43%
43%
37%
25%
11%
11%
25%
13%
17%
8%
50%
32%
Brazil
China
USA
53% 4%
43%
Australia
Canada
Russia
58%
Trucks Maritime and Others Trains Brazil
Spain
USA
Germany
England
13
90
100
110
120
130
140
150
160
170
180
+52%
1Q
10
1Q
09
1Q
08
1Q
07
1Q
06
1Q
05
1Q
04
1Q
03
1Q
02
1Q
01
1Q
00
Agriculture GDP
GDP
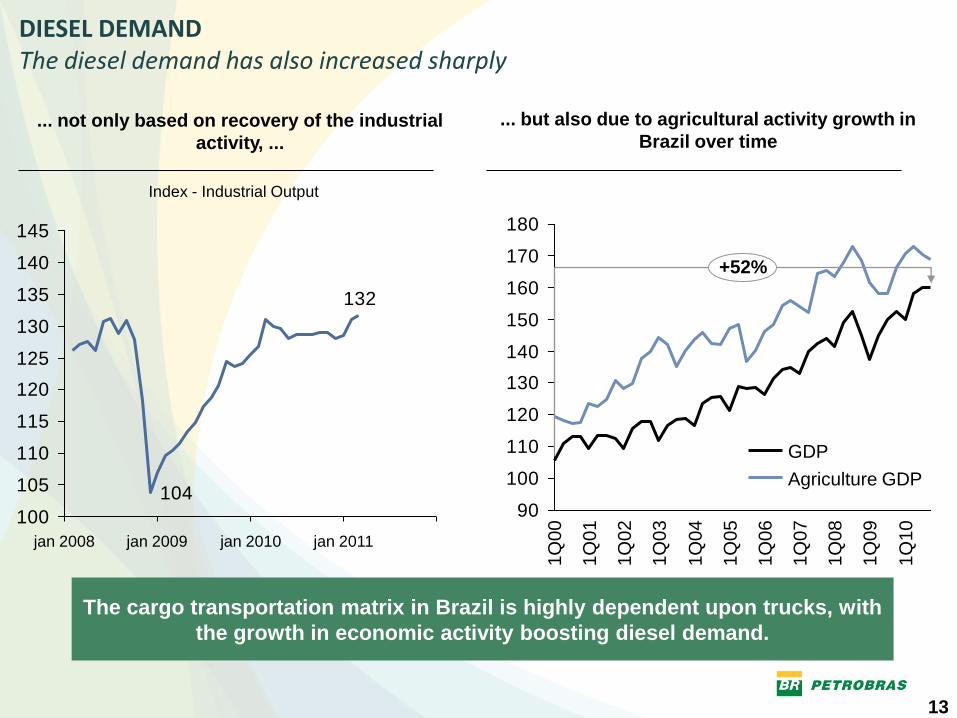
The cargo transportation matrix in Brazil is highly dependent upon trucks, with
the growth in economic activity boosting diesel demand.
132
104
100
105
110
115
120
125
130
135
140
145
jan 2011 jan 2010 jan 2009 jan 2008
DIESEL DEMAND The diesel demand has also increased sharply
... not only based on recovery of the industrial
activity, ...
... but also due to agricultural activity growth in
Brazil over time
Index - Industrial Output
14
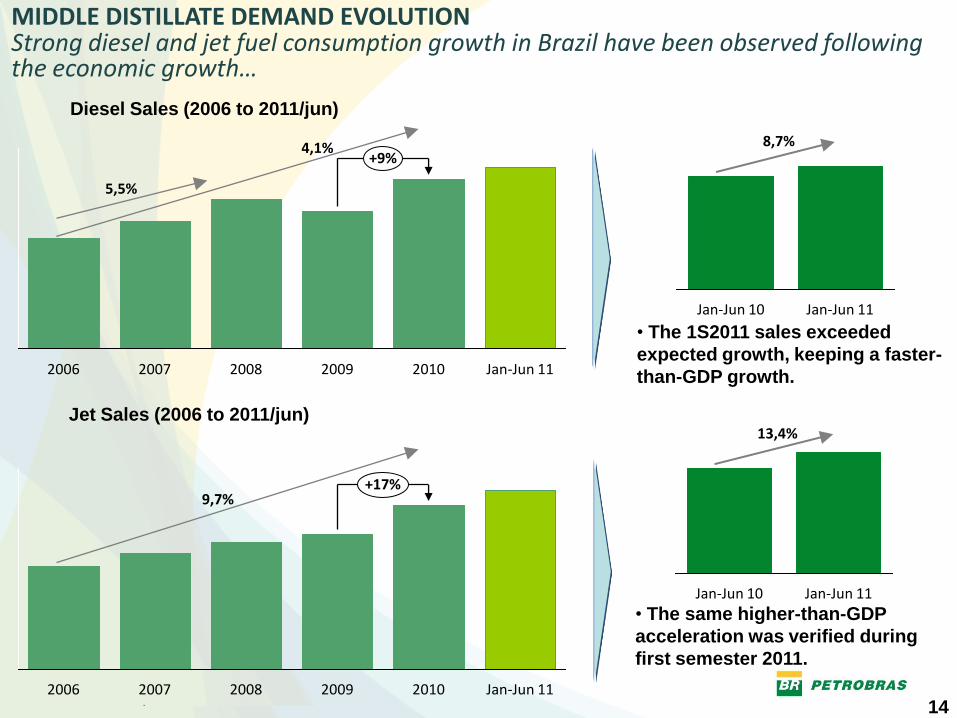
+9%
Jan-Jun 11 2010 2009 2008 2007 2006
8,7%
5,5%
4,1%
Jan-Jun 11 Jan-Jun 10
13,4%
Jan-Jun 11 Jan-Jun 10
2010
+17%
2007 Jan-Jun 11 2008 2006 2009
9,7%
• The 1S2011 sales exceeded
expected growth, keeping a faster-
than-GDP growth.
• The same higher-than-GDP
acceleration was verified during
first semester 2011.
Jet Sales (2006 to 2011/jun)
Diesel Sales (2006 to 2011/jun)
MIDDLE DISTILLATE DEMAND EVOLUTION Strong diesel and jet fuel consumption growth in Brazil have been observed following the economic growth…
15
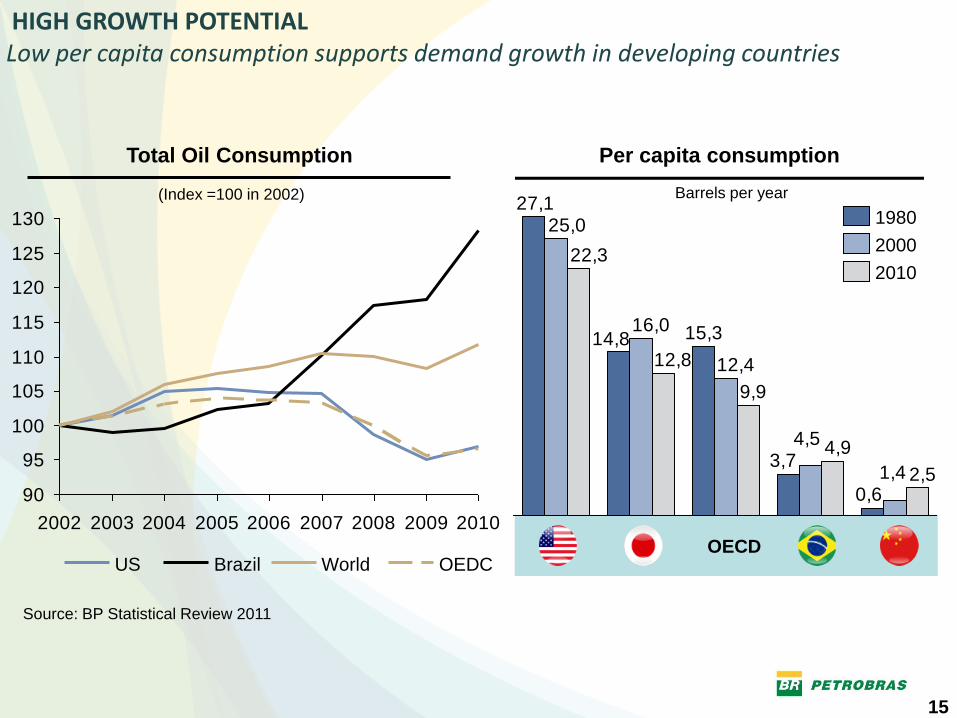
0,6
3,7
15,314,8
27,1
1,4
4,5
12,4
16,0
25,0
2,5
4,9
9,9
12,8
22,32010
2000
1980
90
95
100
105
110
115
120
125
130
2002 2003 2004 2005 2006 2007 2008 2009 2010
OEDC World Brazil US
Source: BP Statistical Review 2011
OECD
Total Oil Consumption Per capita consumption
Barrels per year (Index =100 in 2002)
HIGH GROWTH POTENTIAL Low per capita consumption supports demand growth in developing countries
16
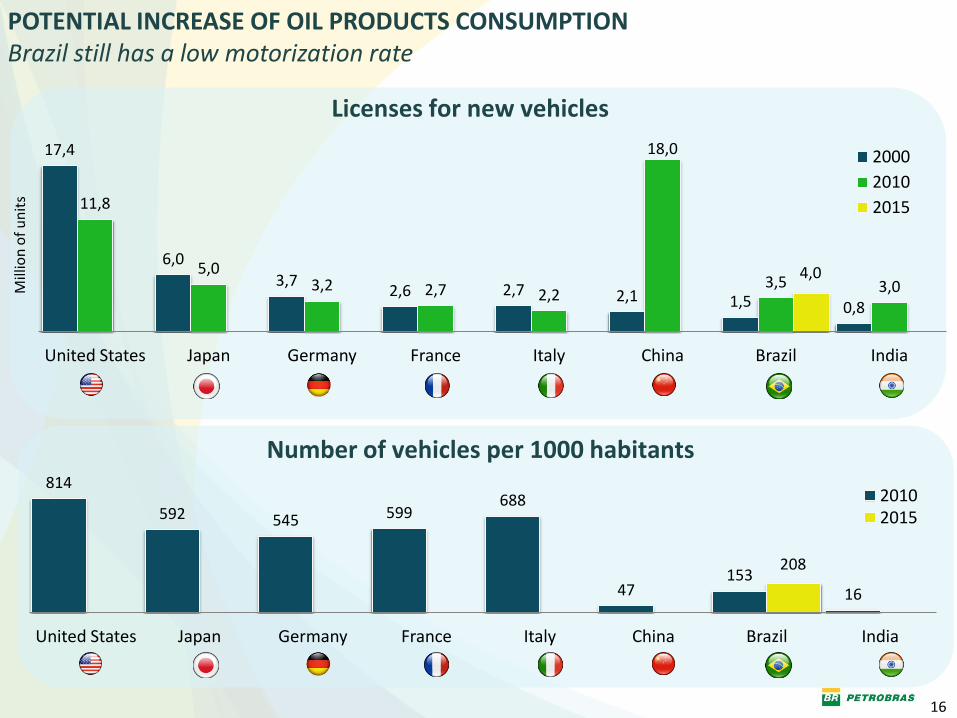
Licenses for new vehicles
17,4
6,0 3,7
2,6 2,7 2,1 1,5 0,8
11,8
5,0 3,2 2,7 2,2
18,0
3,5 3,0 4,0
United States Japan Germany France Italy China Brazil India
2000
2010
2015
Mill
ion
of
un
its
814
592 545 599 688
47 153
16
208
United States Japan Germany France Italy China Brazil India
2010 2015
Number of vehicles per 1000 habitants
POTENTIAL INCREASE OF OIL PRODUCTS CONSUMPTION Brazil still has a low motorization rate
17
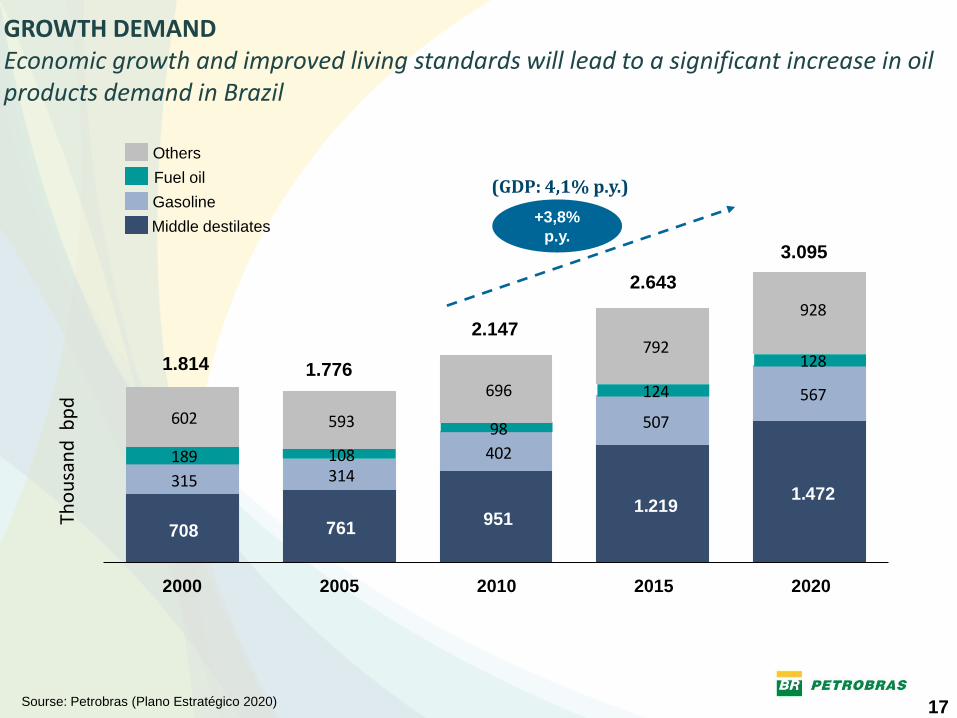
GROWTH DEMAND Economic growth and improved living standards will lead to a significant increase in oil products demand in Brazil
Sourse: Petrobras (Plano Estratégico 2020)
708 761951
1.2191.472
315 314
402
507
567
189 108
98
124
128
602 593
696
792
928
2000 2005 2010 2015 2020
3.095
2.147
2.643
+3,8%
p.y.
(GDP: 4,1% p.y.)
Tho
usa
nd
bp
d
1.814 1.776
Others
Fuel oil
Gasoline
Middle destilates
18
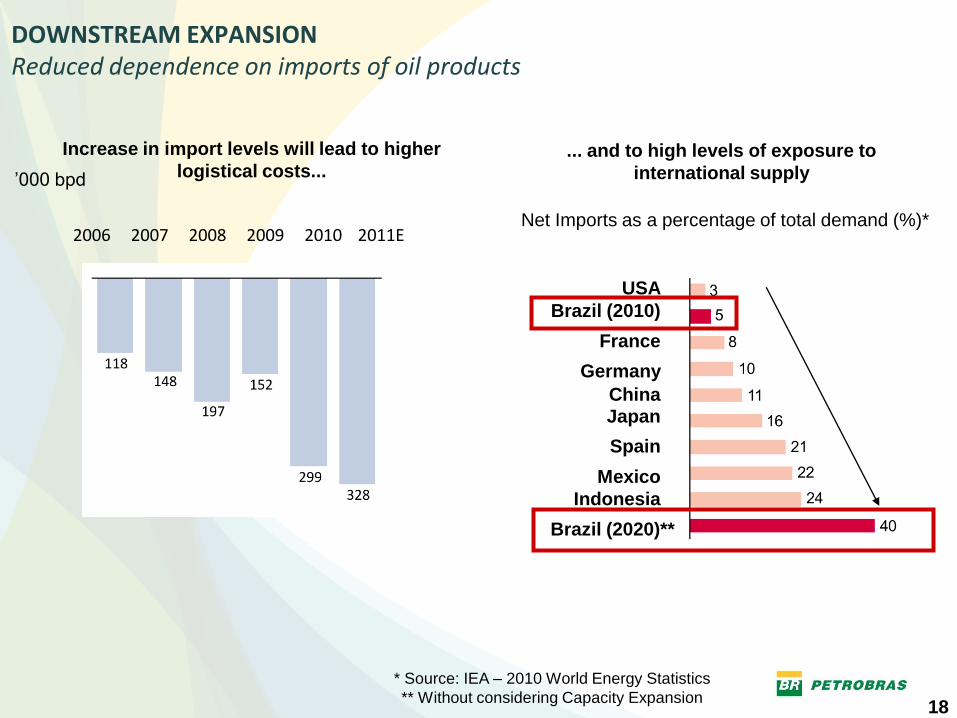
DOWNSTREAM EXPANSION
Reduced dependence on imports of oil products
* Source: IEA – 2010 World Energy Statistics
** Without considering Capacity Expansion
2006 2007 2008 2011E 2009 2010
Brazil (2020)**
Indonesia
Mexico
Spain
Japan China
Germany
France
Brazil (2010)
USA
Net Imports as a percentage of total demand (%)*
’000 bpd
Increase in import levels will lead to higher
logistical costs... ... and to high levels of exposure to
international supply
19
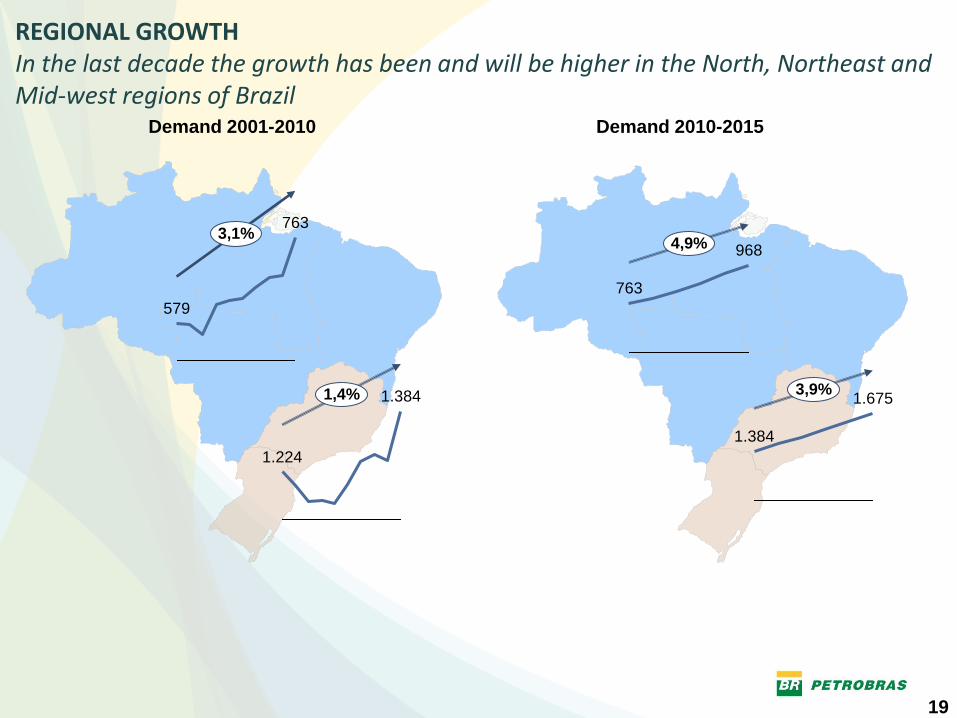
Demand 2001-2010 Demand 2010-2015
3,1% 763
579
1,4% 1.384
1.224
4,9% 968
763
1.675 3,9%
1.384
REGIONAL GROWTH In the last decade the growth has been and will be higher in the North, Northeast and Mid-west regions of Brazil
20
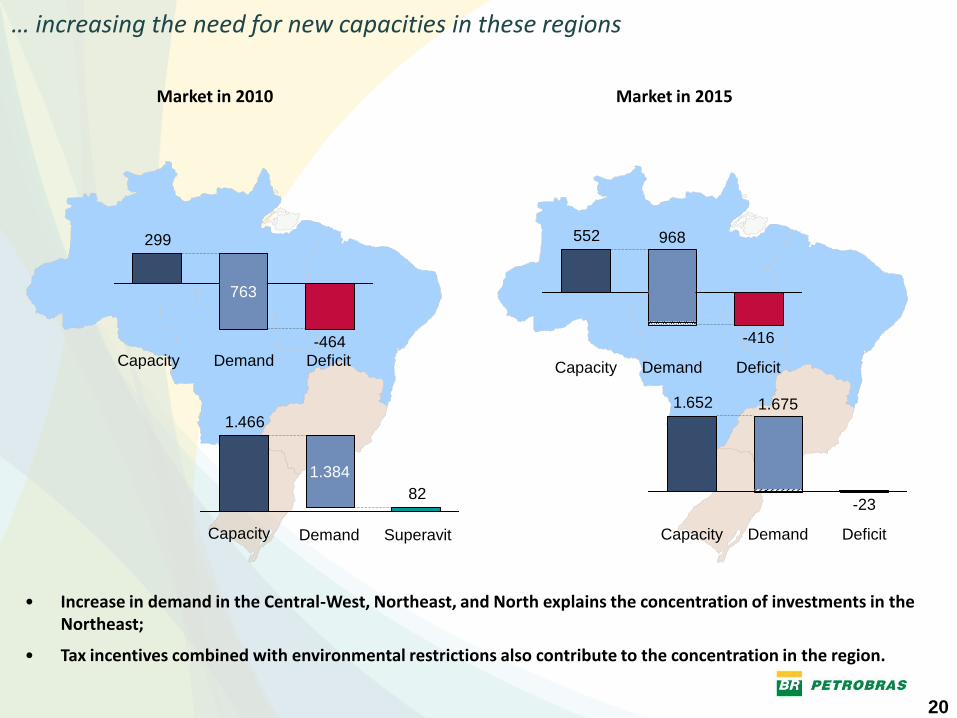
Market in 2015 Market in 2010
… increasing the need for new capacities in these regions
• Increase in demand in the Central-West, Northeast, and North explains the concentration of investments in the Northeast;
• Tax incentives combined with environmental restrictions also contribute to the concentration in the region.
552
Deficit
-416
Demand
968
Capacity
1.652
Deficit
-23
Demand
1.675
Capacity
299
-464
763
82
1.466
1.384
Deficit Demand Capacity
Superavit Demand Capacity
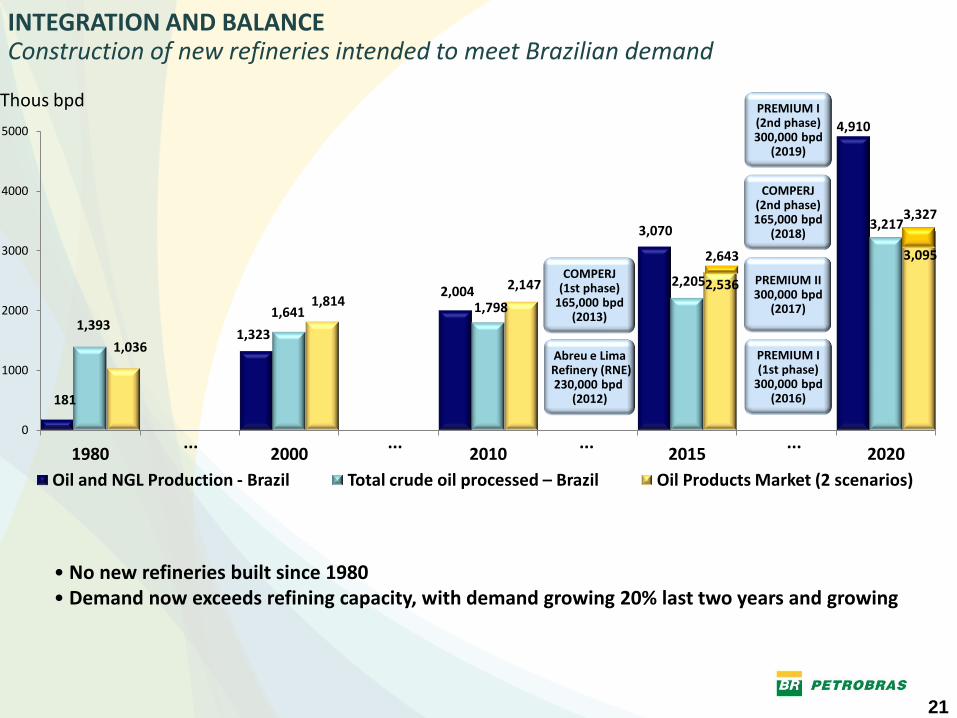
21
INTEGRATION AND BALANCE Construction of new refineries intended to meet Brazilian demand
• No new refineries built since 1980 • Demand now exceeds refining capacity, with demand growing 20% last two years and growing
0
1000
2000
3000
4000
5000
1980 2000 2010 2015 2020
Oil and NGL Production - Brazil Total crude oil processed – Brazil Oil Products Market (2 scenarios)
Abreu e Lima Refinery (RNE) 230,000 bpd
(2012)
COMPERJ (1st phase)
165,000 bpd (2013)
PREMIUM I (1st phase)
300,000 bpd (2016)
PREMIUM I (2nd phase) 300,000 bpd
(2019)
PREMIUM II 300,000 bpd
(2017)
COMPERJ (2nd phase) 165,000 bpd
(2018)
Thous bpd
2,536
2,643 3,095
3,327
1,641
2,205
3,217
181
2,004
3,070
4,910
1,393 1,798
1,036
2,147 1,814
1,323
... ... ... ...
22
Refining Profile and Margins
23
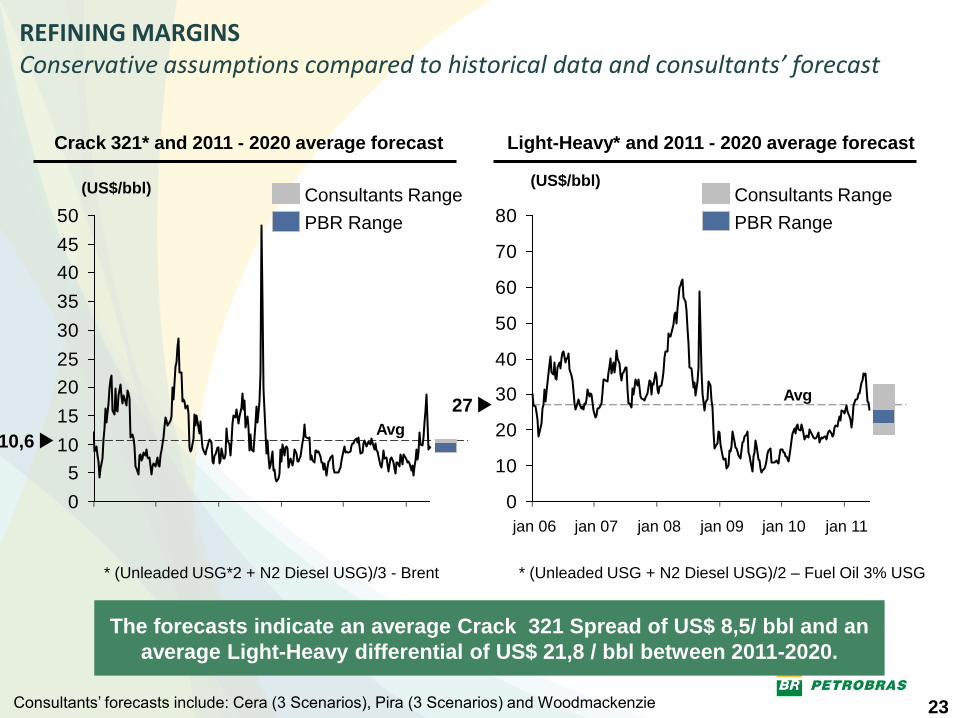
REFINING MARGINS Conservative assumptions compared to historical data and consultants’ forecast
The forecasts indicate an average Crack 321 Spread of US$ 8,5/ bbl and an
average Light-Heavy differential of US$ 21,8 / bbl between 2011-2020.
* (Unleaded USG + N2 Diesel USG)/2 – Fuel Oil 3% USG * (Unleaded USG*2 + N2 Diesel USG)/3 - Brent
0
5
10
15
20
25
30
35
40
45
50
10,6
Crack 321* and 2011 - 2020 average forecast
50
45
Avg
PBR Range
Consultants Range (US$/bbl)
Light-Heavy* and 2011 - 2020 average forecast
Avg
(US$/bbl)
0
10
20
30
40
50
60
70
80
jan 12 jan 11 jan 10 jan 09 jan 08 jan 07 jan 06
27
PBR Range
Consultants Range
Consultants’ forecasts include: Cera (3 Scenarios), Pira (3 Scenarios) and Woodmackenzie
24
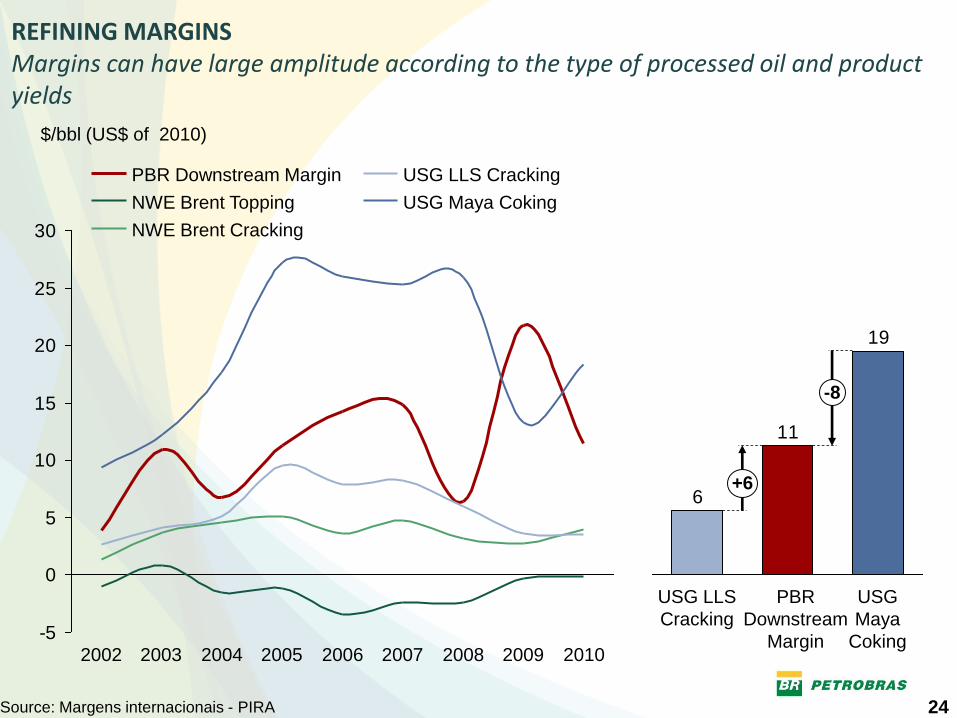
REFINING MARGINS Margins can have large amplitude according to the type of processed oil and product yields
-5
0
5
10
15
20
25
30
2010 2009 2008 2007 2006 2005 2004 2003 2002
USG Maya Coking
USG LLS Cracking
NWE Brent Cracking
NWE Brent Topping
PBR Downstream Margin
$/bbl (US$ of 2010)
Source: Margens internacionais - PIRA
19
11
6+6
-8
USG
Maya
Coking
PBR
Downstream
Margin
USG LLS
Cracking
25
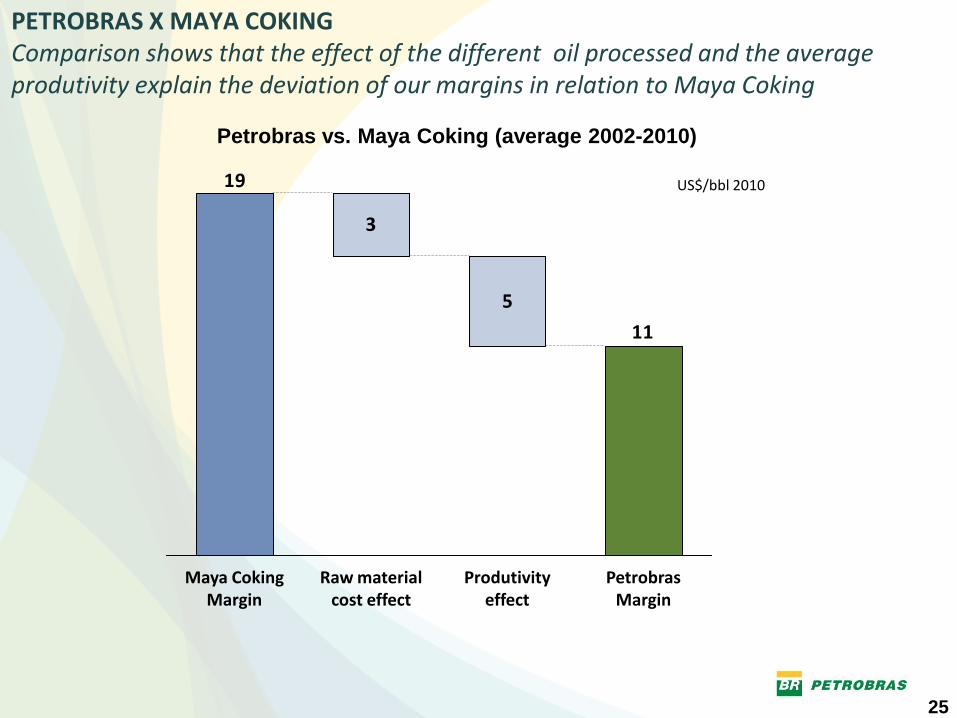
PETROBRAS X MAYA COKING Comparison shows that the effect of the different oil processed and the average produtivity explain the deviation of our margins in relation to Maya Coking
US$/bbl 2010
Petrobras vs. Maya Coking (average 2002-2010)
3
5
11
19
Maya Coking Margin
Raw material cost effect
Produtivity effect
Petrobras Margin
26
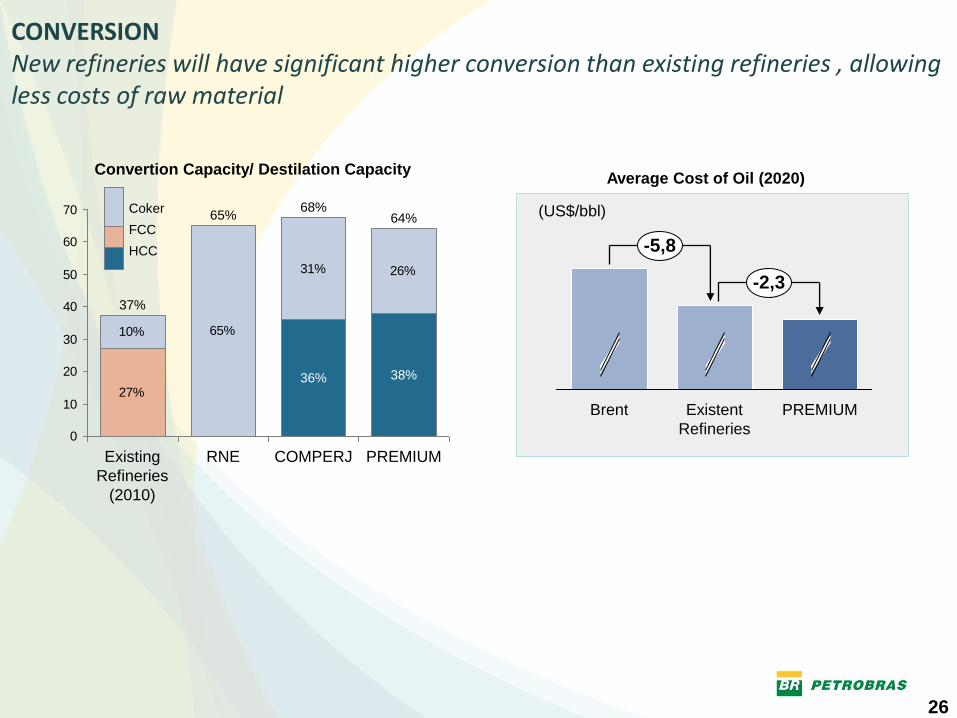
10% 65%
31% 26%
27%
0
10
20
30
40
50
60
70
PREMIUM
64%
38%
COMPERJ
68%
36%
RNE
65%
Existing
Refineries
(2010)
37%
HCC
FCC
Coker
CONVERSION New refineries will have significant higher conversion than existing refineries , allowing less costs of raw material
Average Cost of Oil (2020)
-5,8
-2,3
PREMIUM Existent
Refineries
Brent
(US$/bbl)
Convertion Capacity/ Destilation Capacity
27
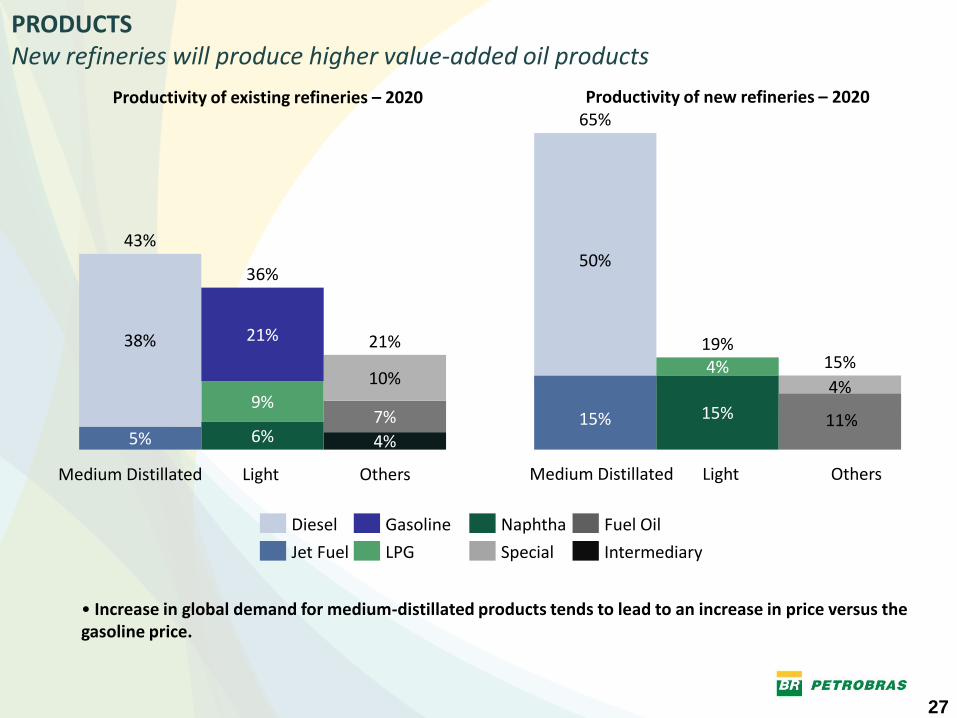
21%
4%
7%
10%
Light
36%
6%
9%
21%
Medium Distillated
43%
5%
38%
Others
Fuel Oil
Special
Naphtha
LPG
Gasoline
Jet Fuel
Diesel
Intermediary
4%
15%
19%
4%
11%
15%
65%
15%
50%
Productivity of existing refineries – 2020
Light Medium Distillated Others
Productivity of new refineries – 2020
• Increase in global demand for medium-distillated products tends to lead to an increase in price versus the gasoline price.
PRODUCTS New refineries will produce higher value-added oil products
28
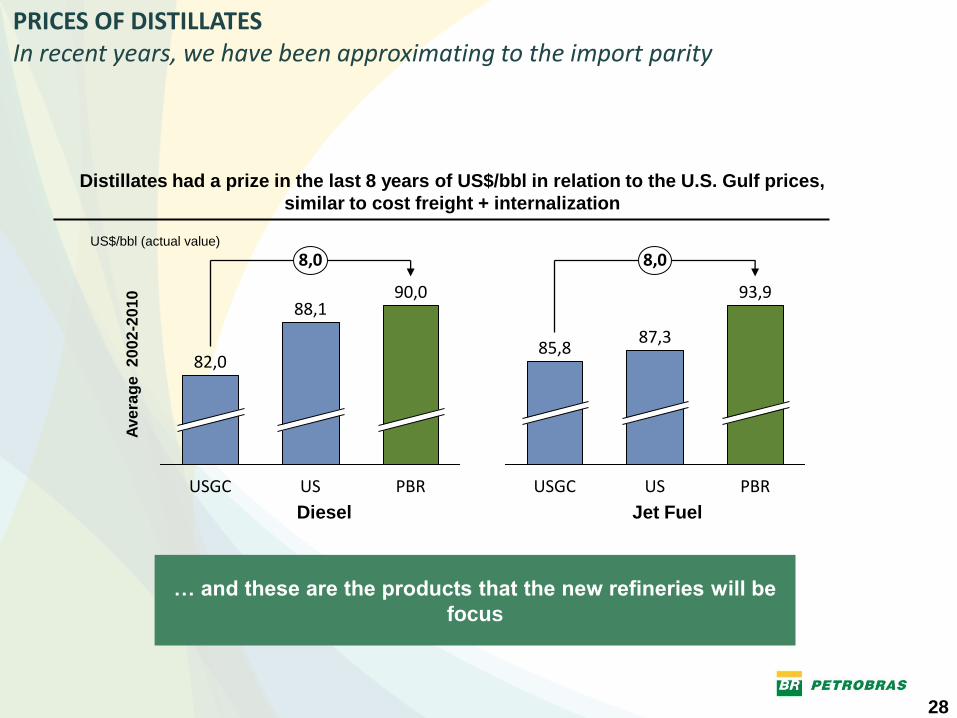
PRICES OF DISTILLATES In recent years, we have been approximating to the import parity
Ave
rag
e
20
02
-20
10
Jet Fuel Diesel
8,0
PBR
90,0
US
88,1
USGC
82,0
USGC
87,3
PBR
93,9
US
8,0
85,8
US$/bbl (actual value)
Distillates had a prize in the last 8 years of US$/bbl in relation to the U.S. Gulf prices,
similar to cost freight + internalization
… and these are the products that the new refineries will be
focus
29
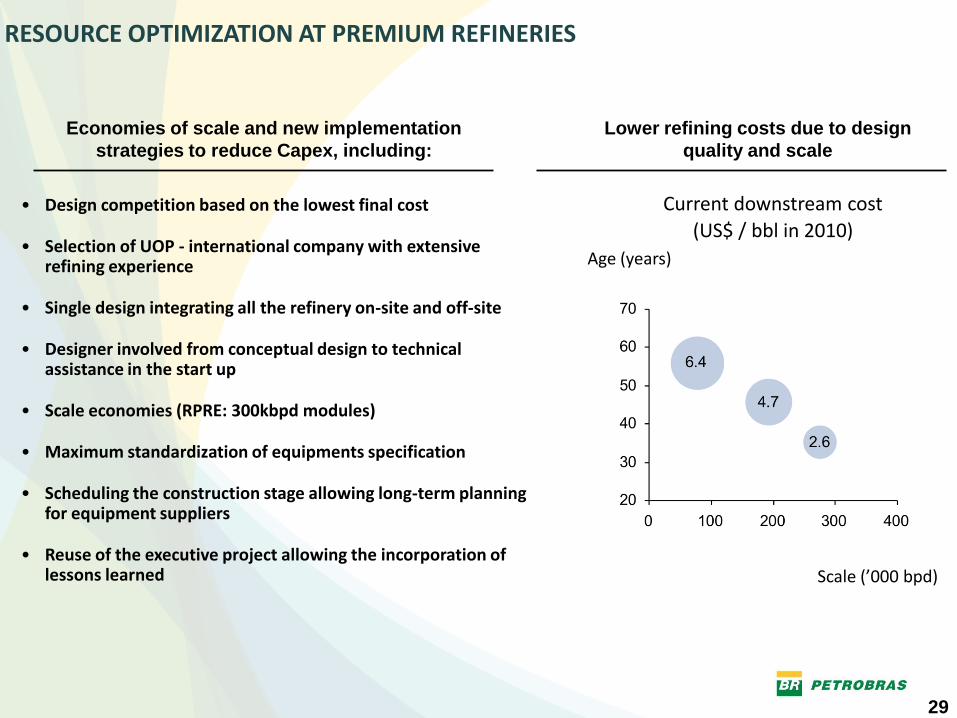
• Design competition based on the lowest final cost
• Selection of UOP - international company with extensive refining experience
• Single design integrating all the refinery on-site and off-site
• Designer involved from conceptual design to technical assistance in the start up
• Scale economies (RPRE: 300kbpd modules)
• Maximum standardization of equipments specification
• Scheduling the construction stage allowing long-term planning for equipment suppliers
• Reuse of the executive project allowing the incorporation of lessons learned
Age (years)
Scale (’000 bpd)
RESOURCE OPTIMIZATION AT PREMIUM REFINERIES
Current downstream cost
(US$ / bbl in 2010)
Lower refining costs due to design
quality and scale
Economies of scale and new implementation
strategies to reduce Capex, including:
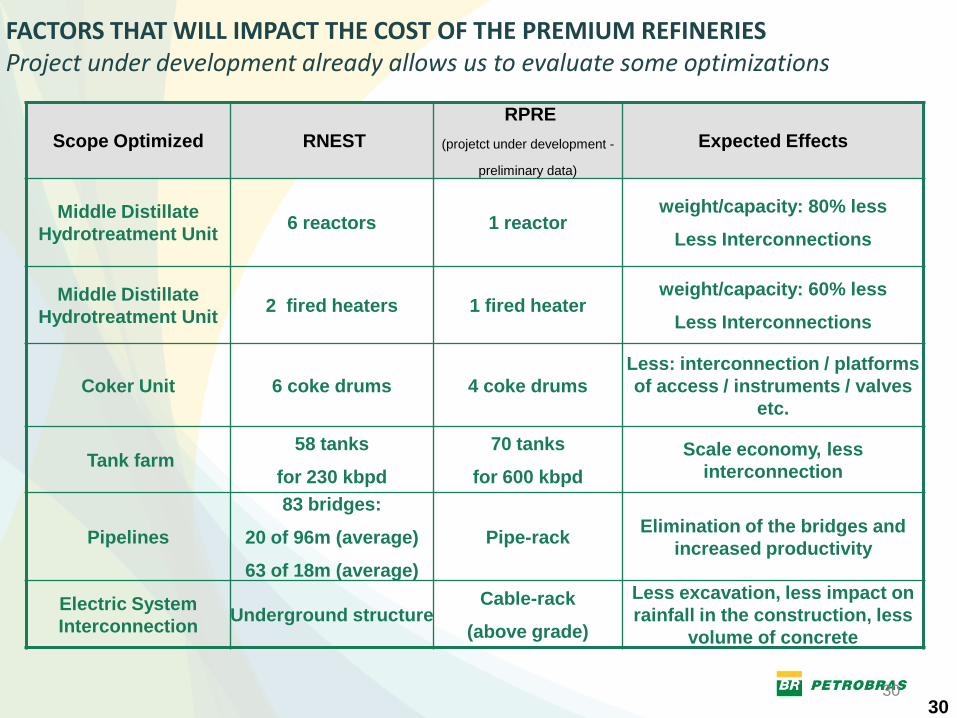
30 30
Scope Optimized RNEST
RPRE
(projetct under development -
preliminary data)
Expected Effects
Middle Distillate
Hydrotreatment Unit 6 reactors 1 reactor
weight/capacity: 80% less
Less Interconnections
Middle Distillate
Hydrotreatment Unit 2 fired heaters 1 fired heater
weight/capacity: 60% less
Less Interconnections
Coker Unit 6 coke drums 4 coke drums
Less: interconnection / platforms
of access / instruments / valves
etc.
Tank farm 58 tanks
for 230 kbpd
70 tanks
for 600 kbpd
Scale economy, less
interconnection
Pipelines
83 bridges:
20 of 96m (average)
63 of 18m (average)
Pipe-rack Elimination of the bridges and
increased productivity
Electric System
Interconnection Underground structure
Cable-rack
(above grade)
Less excavation, less impact on
rainfall in the construction, less
volume of concrete
FACTORS THAT WILL IMPACT THE COST OF THE PREMIUM REFINERIES Project under development already allows us to evaluate some optimizations

31
Market Location
32
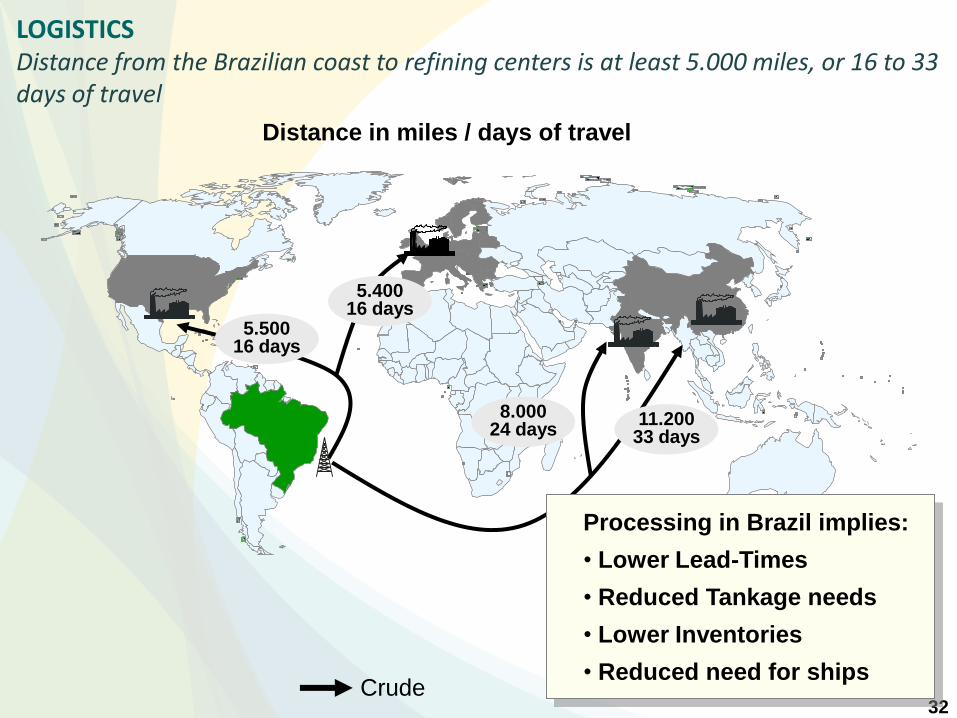
LOGISTICS Distance from the Brazilian coast to refining centers is at least 5.000 miles, or 16 to 33 days of travel
Crude
Processing in Brazil implies:
• Lower Lead-Times
• Reduced Tankage needs
• Lower Inventories
• Reduced need for ships
5.500 16 days
5.400 16 days
8.000 24 days
11.200 33 days
Distance in miles / days of travel
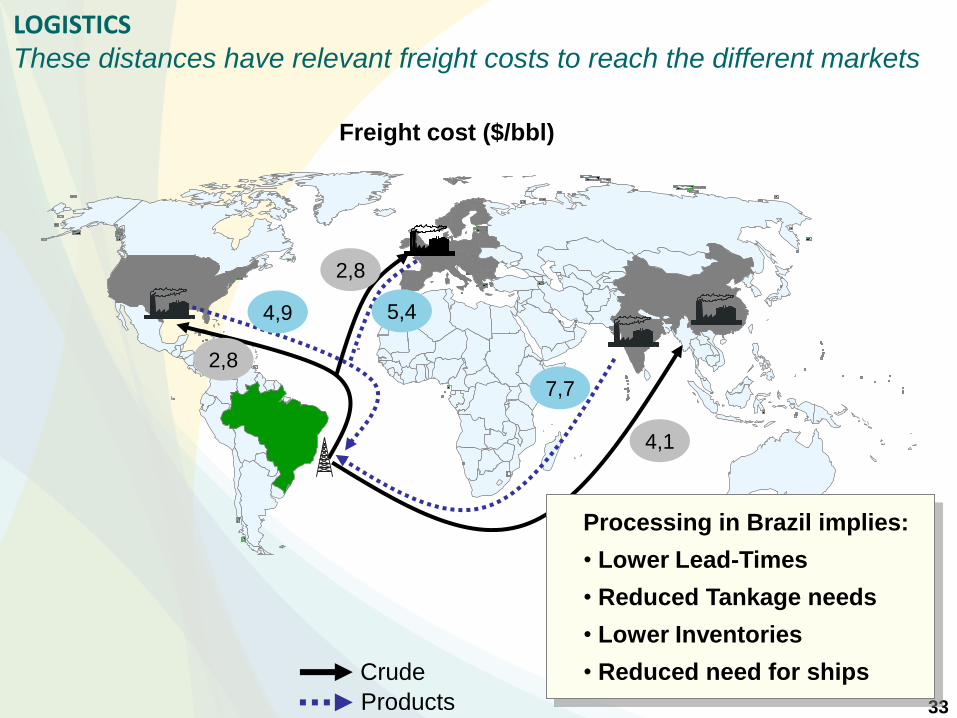
33
LOGISTICS
These distances have relevant freight costs to reach the different markets
Crude
Products
2,8
2,8
7,7
4,1
4,9 5,4
Processing in Brazil implies:
• Lower Lead-Times
• Reduced Tankage needs
• Lower Inventories
• Reduced need for ships
Freight cost ($/bbl)
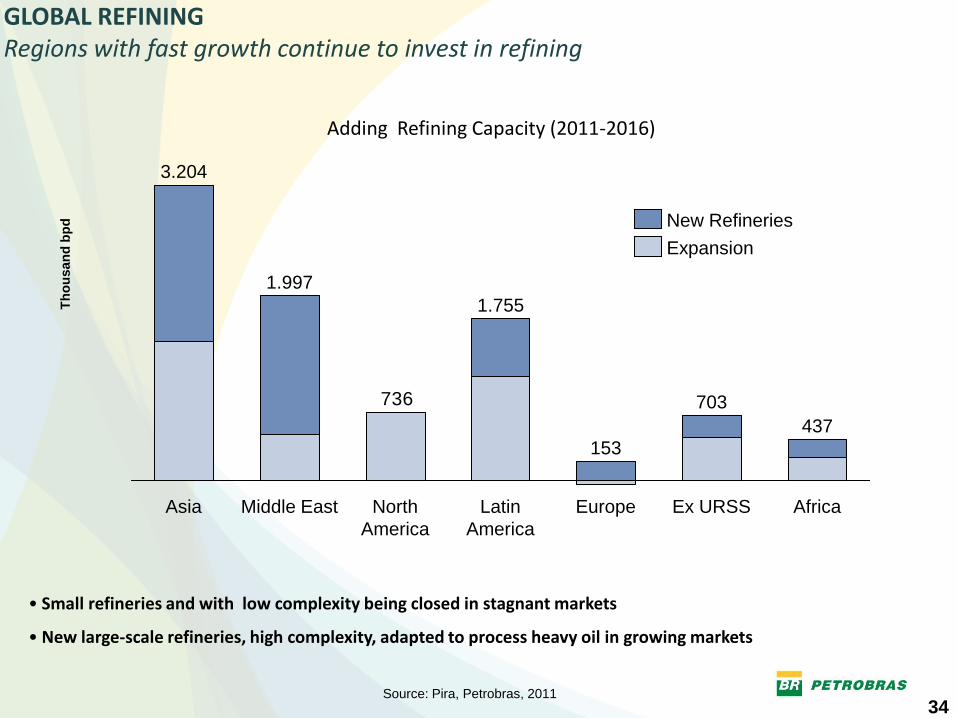
34
Adding Refining Capacity (2011-2016)
736 703
Europe Africa
153
Latin
America
437
Ex URSS
1.755
North
America
Middle East
1.997
Asia
3.204
New Refineries
Expansion
GLOBAL REFINING Regions with fast growth continue to invest in refining
• Small refineries and with low complexity being closed in stagnant markets
• New large-scale refineries, high complexity, adapted to process heavy oil in growing markets
Source: Pira, Petrobras, 2011
Th
ou
san
d b
pd

35
Risk and Return
36
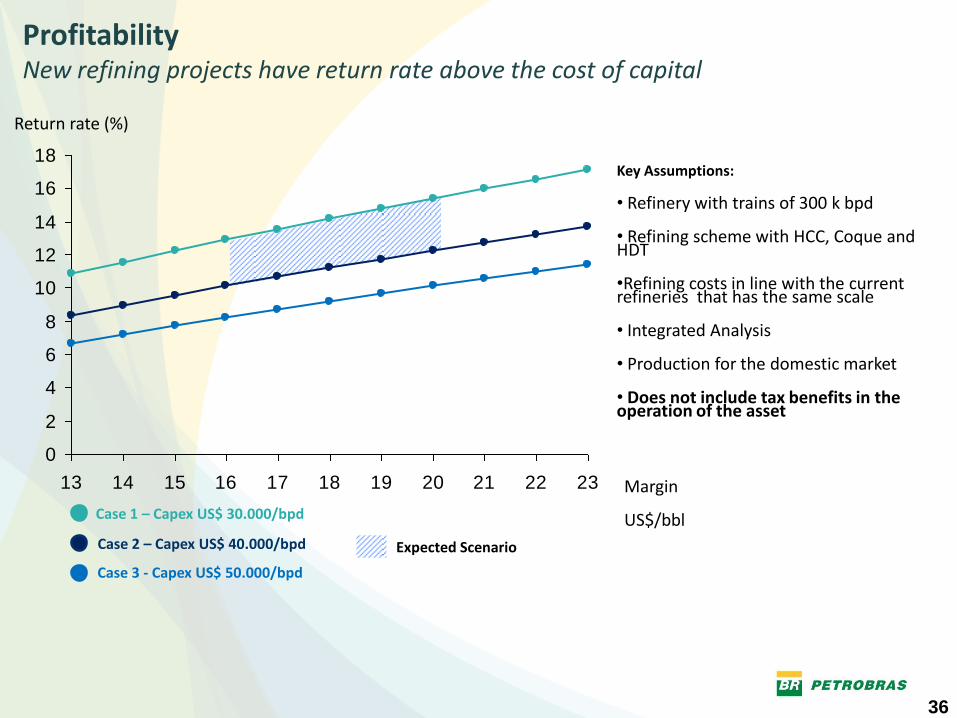
Return rate (%)
Key Assumptions:
• Refinery with trains of 300 k bpd
• Refining scheme with HCC, Coque and HDT
•Refining costs in line with the current refineries that has the same scale
• Integrated Analysis
• Production for the domestic market
• Does not include tax benefits in the operation of the asset
Case 3 - Capex US$ 50.000/bpd
Case 1 – Capex US$ 30.000/bpd
Case 2 – Capex US$ 40.000/bpd
Profitability New refining projects have return rate above the cost of capital
Margin
US$/bbl
Expected Scenario
0
2
4
6
8
10
12
14
16
18
13 14 15 16 17 18 19 20 21 22 23
37
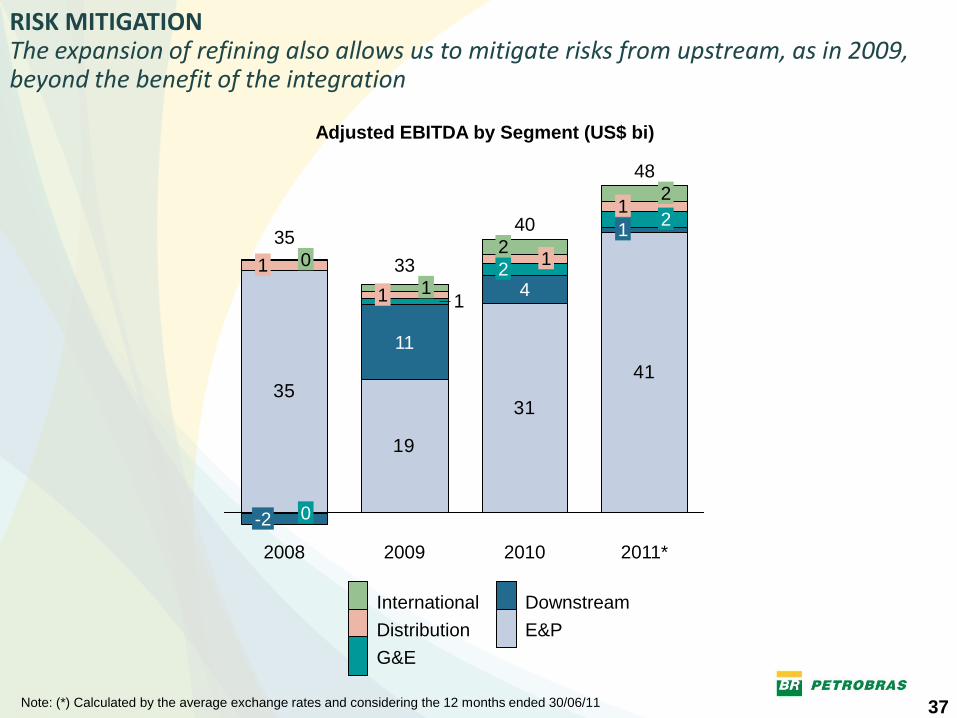
RISK MITIGATION The expansion of refining also allows us to mitigate risks from upstream, as in 2009, beyond the benefit of the integration
Adjusted EBITDA by Segment (US$ bi)
Note: (*) Calculated by the average exchange rates and considering the 12 months ended 30/06/11
19
31
41
1
35
2 33
2008 2009 2010
1 1
35
0
1 0 1 2
40
2011*
-2
11
4
2 1
2 1
48
International
G&E
Distribution
Downstream
E&P
38
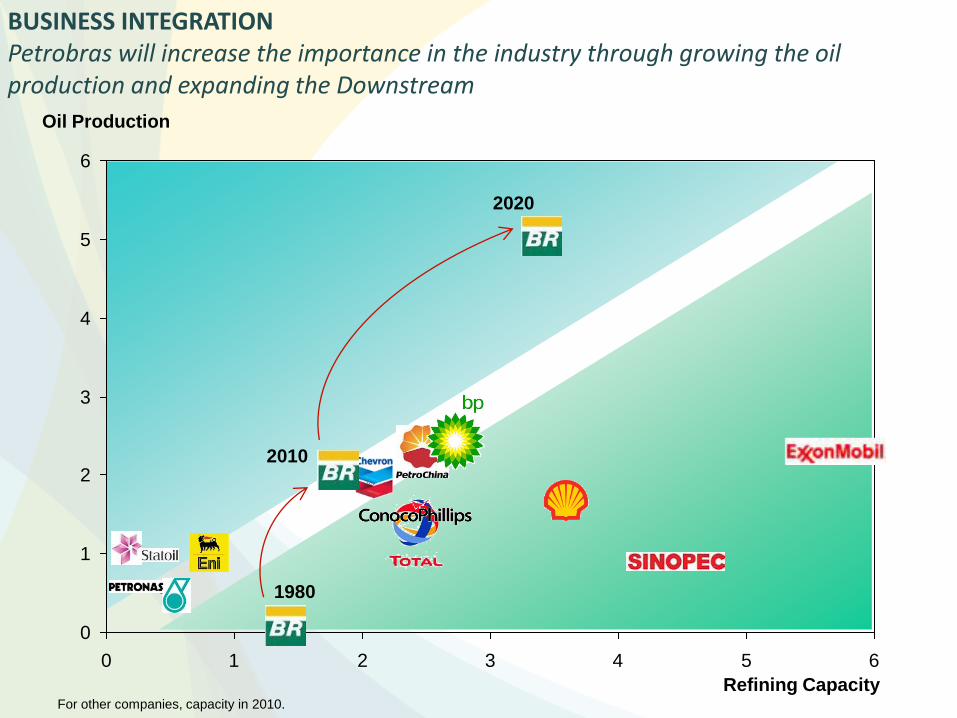
Refining Capacity
Oil Production
BUSINESS INTEGRATION Petrobras will increase the importance in the industry through growing the oil production and expanding the Downstream
For other companies, capacity in 2010.
0
1
2
3
4
5
6
0 1 2 3 4 5 6
1980
2010
2020
39
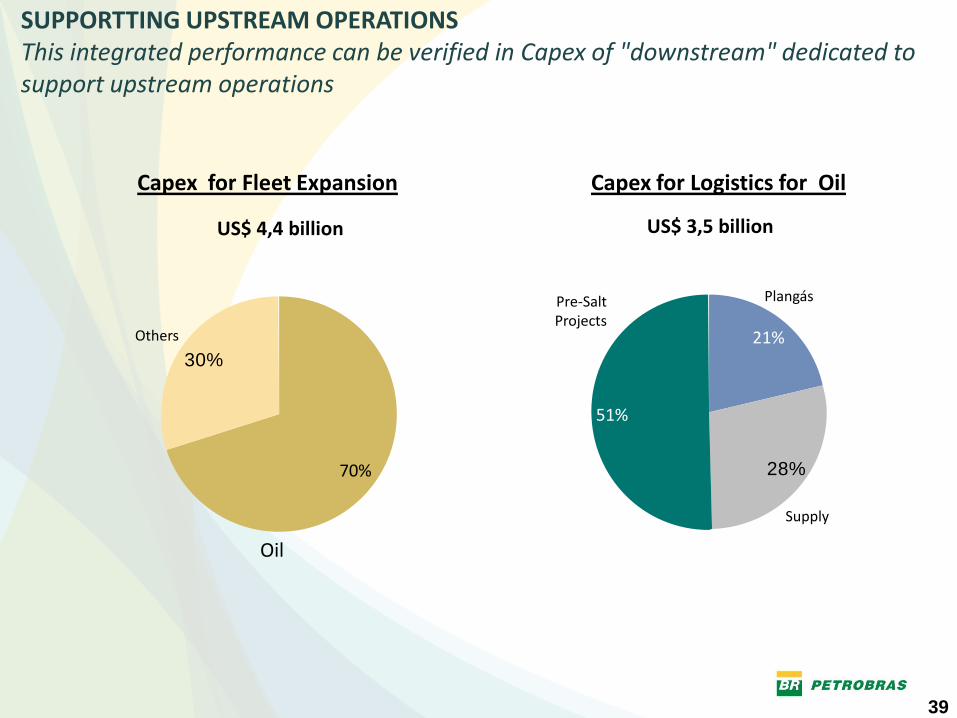
28%
51%
Supply
Pre-Salt Projects
21%
Plangás
30%
Others
70%
Oil
US$ 3,5 billion US$ 4,4 billion
Capex for Fleet Expansion Capex for Logistics for Oil
SUPPORTTING UPSTREAM OPERATIONS This integrated performance can be verified in Capex of "downstream" dedicated to support upstream operations
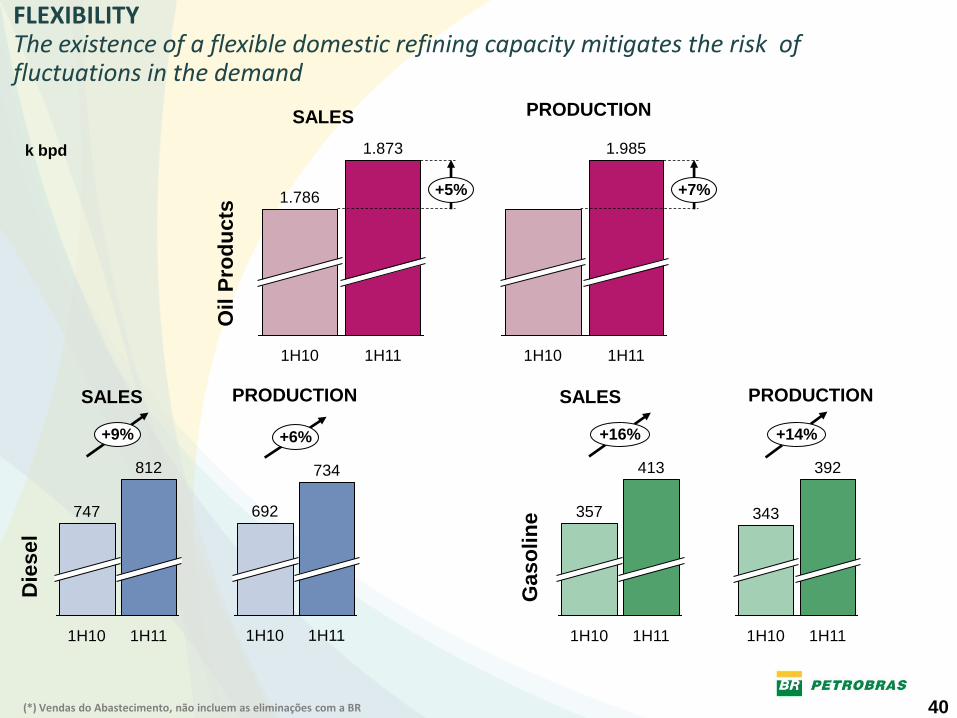
40 (*) Vendas do Abastecimento, não incluem as eliminações com a BR
+14%
1H11
392
1H10
343
PRODUCTION SALES
1.873
+5%
1H11 1H10
1.786
1.985
+7%
1H11 1H10
+6%
1H11
734
1H10
692
+16%
1H11
413
1H10
357
+9%
1H11
812
1H10
747
Die
sel
k bpd
FLEXIBILITY The existence of a flexible domestic refining capacity mitigates the risk of fluctuations in the demand
PRODUCTION
SALES
PRODUCTION SALES
Ga
so
lin
e
Oil
Pro
du
cts
41
Final Remarks
42
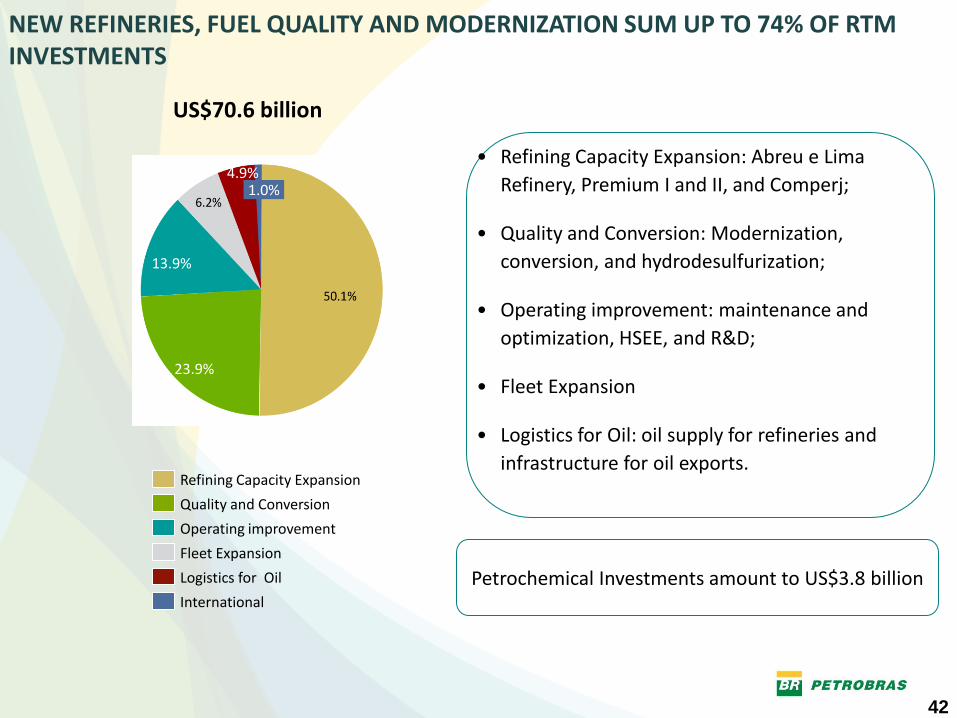
US$70.6 billion
• Refining Capacity Expansion: Abreu e Lima
Refinery, Premium I and II, and Comperj;
• Quality and Conversion: Modernization,
conversion, and hydrodesulfurization;
• Operating improvement: maintenance and
optimization, HSEE, and R&D;
• Fleet Expansion
• Logistics for Oil: oil supply for refineries and
infrastructure for oil exports.
1.1% 4.5%
26.4%
0.8% 15.2%
Logistics for Oil
International
Fleet Expansion
Quality and Conversion
Refining Capacity Expansion
Operating improvement
1.0%
23.9%
13.9%
4.9%
Petrochemical Investments amount to US$3.8 billion
NEW REFINERIES, FUEL QUALITY AND MODERNIZATION SUM UP TO 74% OF RTM INVESTMENTS
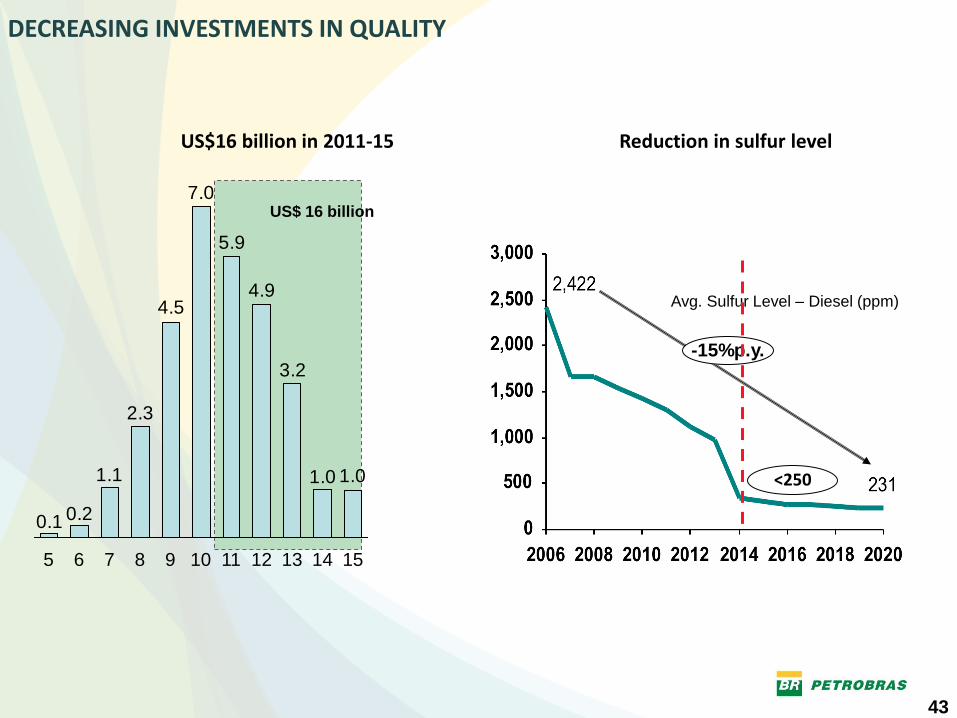
43
US$ 16 billion
1.01.0
3.2
4.9
5.9
7.0
4.5
2.3
1.1
0.20.1
15 14 13 12 11 10 9 8 7 6 5
-15%p.y.
DECREASING INVESTMENTS IN QUALITY
US$16 billion in 2011-15 Reduction in sulfur level
Avg. Sulfur Level – Diesel (ppm)
<250
44
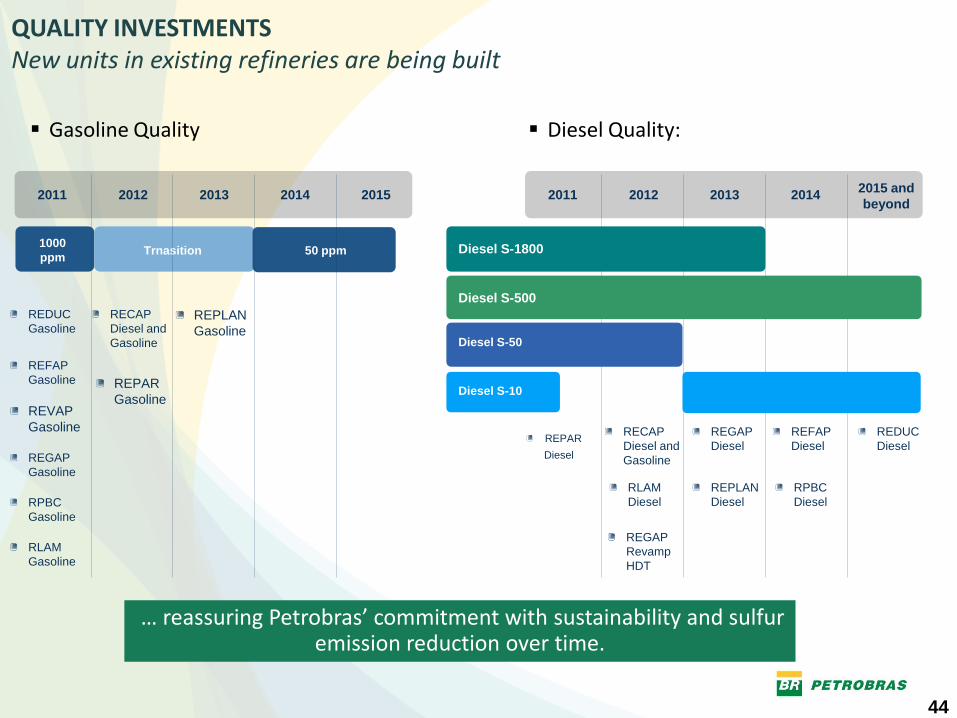
2011 2012 2013 2014 2015
1000
ppm Trnasition 50 ppm
RECAP
Diesel and
Gasoline
REFAP
Gasoline
REGAP
Gasoline
RLAM
Gasoline
RPBC
Gasoline
REPAR
Gasoline
REPLAN
Gasoline
REVAP
Gasoline
2011 2012 2013 2014 2015 and
beyond
Diesel S-1800
Diesel S-500
Diesel S-50
Diesel S-10
RECAP
Diesel and
Gasoline
RLAM
Diesel
REFAP
Diesel
REPLAN
Diesel
REGAP
Diesel
RPBC
Diesel
REGAP
Revamp
HDT
Gasoline Quality Diesel Quality:
… reassuring Petrobras’ commitment with sustainability and sulfur emission reduction over time.
REDUC
Gasoline
REDUC
Diesel REPAR
Diesel
QUALITY INVESTMENTS New units in existing refineries are being built
45
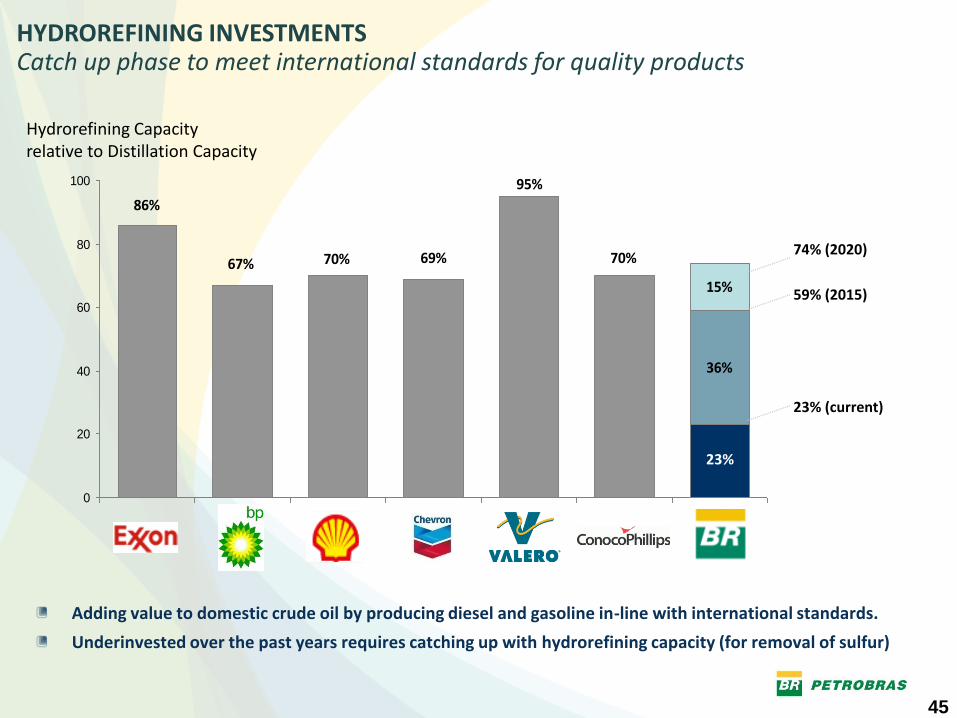
70%
95%
69%70%67%
86%
36%
15%
0
20
40
60
80
100
Hydrorefining Capacity relative to Distillation Capacity
23%
23% (current)
59% (2015)
74% (2020)
Adding value to domestic crude oil by producing diesel and gasoline in-line with international standards.
Underinvested over the past years requires catching up with hydrorefining capacity (for removal of sulfur)
HYDROREFINING INVESTMENTS Catch up phase to meet international standards for quality products
46
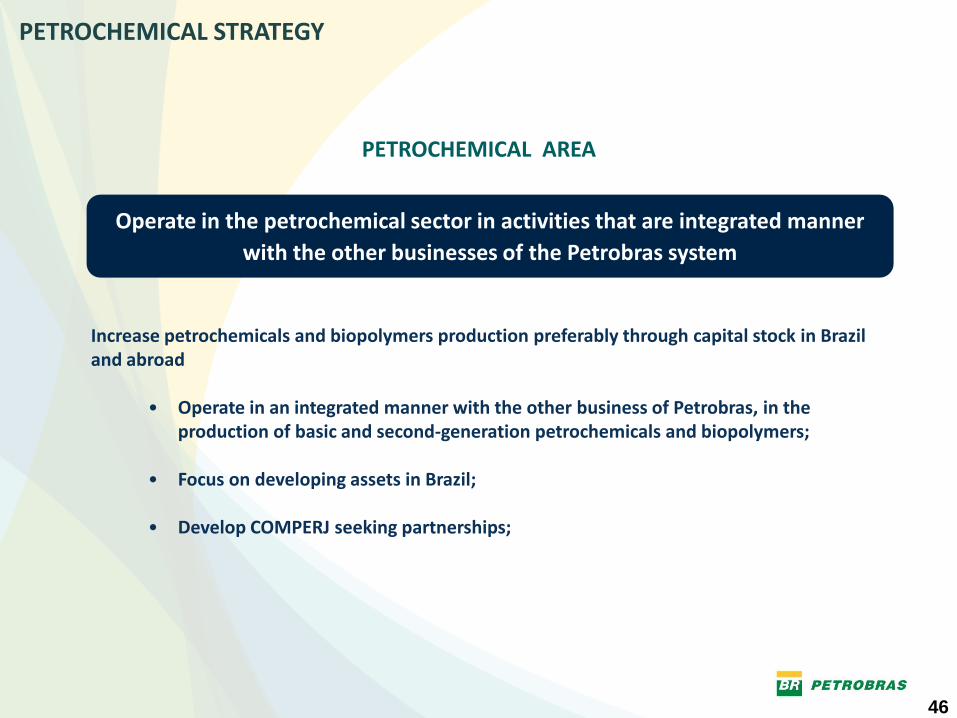
Increase petrochemicals and biopolymers production preferably through capital stock in Brazil and abroad
• Operate in an integrated manner with the other business of Petrobras, in the production of basic and second-generation petrochemicals and biopolymers;
• Focus on developing assets in Brazil;
• Develop COMPERJ seeking partnerships;
Operate in the petrochemical sector in activities that are integrated manner
with the other businesses of the Petrobras system
PETROCHEMICAL AREA
PETROCHEMICAL STRATEGY
47
Preserving our unique position in the Brazilian market as the best way to monetize our crude reserves
Shifting the refining system towards middle distillates production while increasing fuel quality standards
Reducing import levels through refining capacity expansion and domestic crude processing maximization
Optimizing capital allocation through new refining modules concept and implementation strategy
Creating efficient and reliable infrastructure to get the best value of crude oil export operations
Mitigate risks and use the flexibilities in the existing refining facilities to optimize the product portfolio
FINAL REMARKS Adding value in Refining, Transportation and Marketing (RTC) and Petrochemicals
Related Documents