Redistricting and Legislative Partisanship • • • Eric McGhee

Welcome message from author
This document is posted to help you gain knowledge. Please leave a comment to let me know what you think about it! Share it to your friends and learn new things together.
Transcript
Redistricting and Legislative Partisanship
• • •Eric McGhee
Redistricting and Legislative Partisanship
• • •Eric McGhee
with research support from Daniel Krimm
2008
Research publications reflect the views of the authors and do not necessarily reflect the views of the staff, officers, or Board of Directors of the Public Policy Institute of California.
Copyright © 2008 by Public Policy Institute of CaliforniaAll rights reserved San Francisco, CA
Short sections of text, not to exceed three paragraphs, may be quoted without written permission provided that full attribution is given to the source and the above copyright notice is included.
PPIC does not take or support positions on any ballot measure or on any local, state, or federal legislation, nor does it endorse, support, or oppose any political parties or candidates for public office.
Library of Congress Cataloging-in-Publication Data McGhee, Eric. Redistricting and legislative partisanship / Eric McGhee ; with research support from Daniel Krimm. p. cm. Includes bibliographical references (p. ). ISBN: 978-1-58213-131-3 1. California. Legislature—Election districts. 2. Representative government and representation—California. 3. Party affiliation—California. 4. Polarization (Social sciences) 5. California—Politics and government—1951– I. Title. JK8768.M37 2008 328.794'073455—dc22 2008034851
iii
Summary
A September 2007 PPIC survey found that 64 percent of Californians favored using “an independent commission of citizens, instead of the state Legislature and governor” to draw legislative districts and that 42 percent felt that “major changes” were needed in the process. Among other things, proponents of such a reform contend that current legislative districts, which were created after the 2000 national census by the Legislature itself, have removed the incentive for state lawmakers to reach consensus on important issues. The argument is that the districts are so lopsidedly partisan that legislators never risk losing their seats to the opposite party, leaving them little reason to listen to moderate voices or work across party lines in Sacramento.
The language of this reform argument can be strong: The current system benefits “the rock-ribbed right and the bleeding heart left” and offers “no consequences for legislators who can’t get anything done,” leading to “chronic gridlock.”1 In part, the language is strong because the argument makes sense. It is based on two accurate assumptions: Research has indeed shown that both the districts and the legislators who represent them have become more partisan over the last few decades. The argument makes so much sense that it is rarely if ever questioned.
In fact, there are several important reasons to doubt it. For one thing, the argument does not explain developments in other venues: Partisanship has also been increasing in the United States Senate, yet senators represent states that are never redrawn. And although only some states have drawn congressional districts as partisan as California’s, partisan behavior has become more common in the House of Representatives. In fact, plenty of reasons other than redistricting could explain why legislators have grown more partisan: voter polarization, growing activist influence in party affairs, and interest group intransigence on specific issues, to name just three. Before we expect redistricting reform to produce a more moderate
1 Quotations come from (in order of appearance): Wiegand (2007); “An Essential Reform: Redistricting Fix Is the Key to Many Problems”; “Thanks, Governor: Redistricting Would Spur Other Reforms.”
iv
Legislature, we need to determine whether redistricting has made it a partisan one in the first place.
This report is the first to examine closely the evidence on this important topic and to investigate the relationship between the partisanship of a legislator’s constituency and his or her voting record in Sacramento. Among the questions we try to answer: What have been the effects of the current districts on legislators’ policy decisions? How much might legislators change their behavior if forced to represent a different district with a different constituency? Are legislators from politically mixed districts more moderate than those from heavily Democratic or Republican districts? If so, by how much? Does the particular issue area—economic, environmental, or social—make a difference? Most important, did the redistricting of 2001 have an important effect on any of these relationships?
Some of our specific findings:
Legislators are more likely to vote with their own party than to •respond to the partisan complexion of their districts on most issues most of the time.Partisan legislators are at least as common as moderates in both •politically mixed and politically homogeneous districts.Partisan behavior was about as common just before the 2001 •redistricting as it has been since.Legislators are remarkably consistent in their voting habits over time, •even when their districts change. Legislators who are moderate on one issue are usually moderate on •others.Republicans are more inflexible about business regulation issues; •Democrats are more inflexible about abortion and contraception issues. Both parties show signs of moderation on environmental issues.Changing legislative districts to resemble those in existence before •the 2001 redistricting would probably not change the outcomes of many specific votes, such as the budget or hotly contested business regulation matters.
v
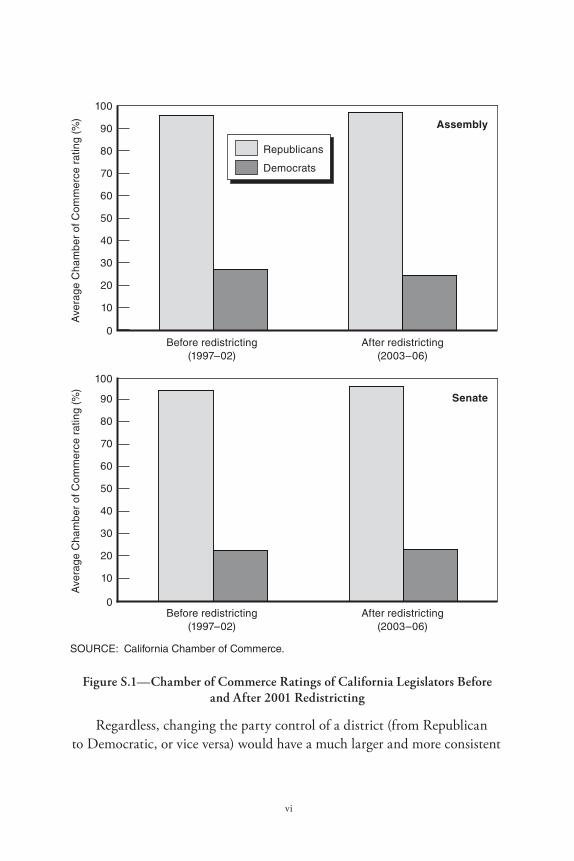
We conclude that the 2001 redistricting has had little effect on the way legislators vote on the bills that come before them in Sacramento. The link between partisan districts and partisan voting that seemed so obvious turns out to be largely absent.
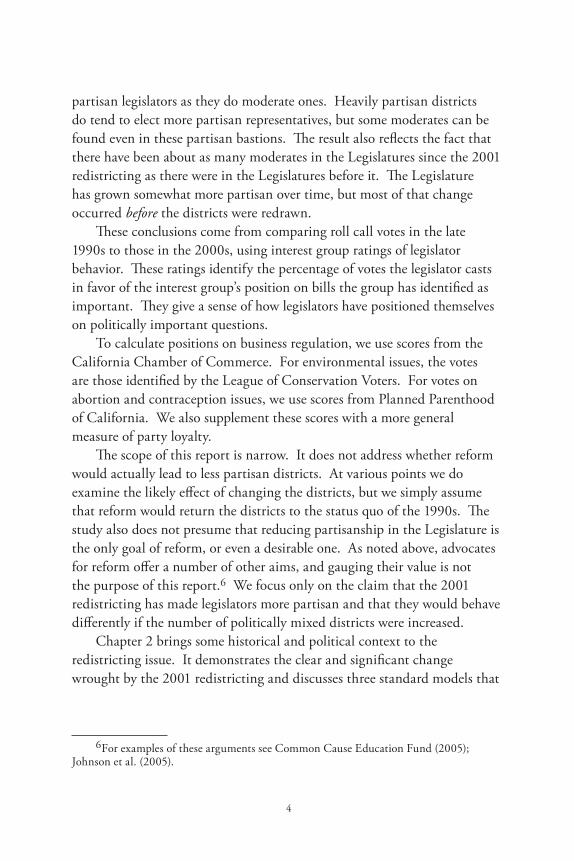
The remarkable consistency of voting patterns in the Legislature can be seen in Figure S.1, which shows the average California Chamber of Commerce rating for legislators before and after the 2001 redistricting. The Chamber tends to favor a conservative economic perspective that opposes the taxation and regulation of business. The gap between Republicans, who tend to support the Chamber’s positions, and Democrats, who tend to oppose them, is large and virtually identical under the pre- and post-2001 districts. Nor are these results limited to the Chamber of Commerce scores. The same basic result holds for other issues, as well. The 2001 districts did not make legislators more partisan—they were already partisan to begin with.
The results are also the same when we follow individual legislators or districts over time. The legislators who served immediately before and after the 2001 redistricting did not change their voting patterns in response to the changes in their districts. In fact, those legislators who served in both the pre- and post-2001 Legislatures have about the same voting record in each—even when they have switched chambers. Nor is there much sign that certain districts tend to elect moderates. Moderates who retire or lose an election are replaced by other moderates only about a quarter of the time. In short, moderation is as much or more an attribute of individuals than of the districts they represent.
Did the 2001 redistricting affect particular votes? Specifically, if legislators in the 2000s had represented the districts of the 1990s, would it have changed the outcomes of budget bills or of bills identified as important by the Chamber of Commerce? Our analysis suggests that the effect would be fairly minor but could have changed the outcome of one in seven bills in the Senate tracked by the Chamber of Commerce, since these bills are often decided by narrow margins anyway. There are also signs that the partisan consequences of changing the districts would be variable: On bills tracked by the Chamber of Commerce, they would generally benefit Republicans, whereas on budget bills, they would generally benefit Democrats.
vi
SOURCE: California Chamber of Commerce.
90
80
70
60
50
40
30
20
10
100
0
Republicans
Democrats
Ave
rage
Cha
mbe
r of
Com
mer
ce r
atin
g (%
)
Before redistricting(1997–02)
After redistricting(2003–06)
90
80
70
60
50
40
30
20
10
100
0
Ave
rage
Cha
mbe
r of
Com
mer
ce r
atin
g (%
)
Before redistricting(1997–02)
After redistricting(2003–06)
Assembly
Senate
Figure S.1—Chamber of Commerce Ratings of California Legislators Before and After 2001 Redistricting
Regardless, changing the party control of a district (from Republican to Democratic, or vice versa) would have a much larger and more consistent
vii
effect on the outcomes of specific roll call votes. This may be the real avenue of influence for redistricting reform: Increasing the number of more competitive districts would increase the prospects of changing the party balance in the Legislature in any given election year. But this would not increase moderation in the Legislature so much as shift the influence from one polarized party to the other.
If the ultimate goal of redistricting reform is to increase bipartisanship in Sacramento, other avenues may prove more fruitful. Campaign finance reform, open primaries, and the mobilization of complacent middle-of-the-road voters would probably be more effective. None of these could guarantee stronger moderating effects on the Legislature than redistricting reform, but our findings suggest that the effects could hardly be weaker.
Arguments for and against reform assume a wide variety of goals. This report does not take a position on whether any of these goals is worth pursuing—even that of encouraging moderation and bipartisanship. Instead, it examines whether redistricting reform would be an effective way to increase bipartisanship, if that is the goal. On this specific question, the evidence suggests that reform would have only a minor effect, at best. If the aim is to reduce partisanship, efforts should be directed elsewhere.

ix
Contents
Summary . . . . . . . . . . . . . . . . . . . . . . . . . . . . . . . . . . . . . . . . . . . . . . . . . . . . . . . . . . . . . . . . . . . . . . . . . . . iii Figures . . . . . . . . . . . . . . . . . . . . . . . . . . . . . . . . . . . . . . . . . . . . . . . . . . . . . . . . . . . . . . . . . . . . . . . . . . . . . . xi Tables . . . . . . . . . . . . . . . . . . . . . . . . . . . . . . . . . . . . . . . . . . . . . . . . . . . . . . . . . . . . . . . . . . . . . . . . . . . . . . xiii Guide to Online Technical Appendices . . . . . . . . . . . . . . . . . . . . . . . . . . . . . . . . . . . . . . . . xv Acknowledgments . . . . . . . . . . . . . . . . . . . . . . . . . . . . . . . . . . . . . . . . . . . . . . . . . . . . . . . . . . . . . . . xvii
1. INTRODUCTION . . . . . . . . . . . . . . . . . . . . . . . . . . . . . . . . . . . . . . . . . . . . . . . . . . . . . . . . . . 1
2. BACKGROUND AND CONTExT . . . . . . . . . . . . . . . . . . . . . . . . . . . . . . . . . . . . . . 7California Redistricting at the Close of the 20th Century . . . . . . . . . . . . . . 8 The 2001 Plan . . . . . . . . . . . . . . . . . . . . . . . . . . . . . . . . . . . . . . . . . . . . . . . . . . . . . . . . . . . . . . . . . 9 Partisan Redistricting Types . . . . . . . . . . . . . . . . . . . . . . . . . . . . . . . . . . . . . . . . . . . . . . . . 9 Models of Representation . . . . . . . . . . . . . . . . . . . . . . . . . . . . . . . . . . . . . . . . . . . . . . . . . . . 11 Representing Legislator Behavior . . . . . . . . . . . . . . . . . . . . . . . . . . . . . . . . . . . . . . . . . . 15
3. DISTRICTS AND LEGISLATORS . . . . . . . . . . . . . . . . . . . . . . . . . . . . . . . . . . . . . . 19Business Regulation Issues: The California Chamber of
Commerce . . . . . . . . . . . . . . . . . . . . . . . . . . . . . . . . . . . . . . . . . . . . . . . . . . . . . . . . . . . . 20 Environmental Issues: The League of Conservation Voters . . . . . . . . . . . 22Abortion and Contraception: Planned Parenthood. . . . . . . . . . . . . . . . . . . . 26 General Party Loyalty . . . . . . . . . . . . . . . . . . . . . . . . . . . . . . . . . . . . . . . . . . . . . . . . . . . . . . . 29 A Quick Validation: Comparing Votes over Time . . . . . . . . . . . . . . . . . . . . . . 32 Other District Measures . . . . . . . . . . . . . . . . . . . . . . . . . . . . . . . . . . . . . . . . . . . . . . . . . . . 34Estimating Maximum Effects . . . . . . . . . . . . . . . . . . . . . . . . . . . . . . . . . . . . . . . . . . . . . 36 Summary . . . . . . . . . . . . . . . . . . . . . . . . . . . . . . . . . . . . . . . . . . . . . . . . . . . . . . . . . . . . . . . . . . . . . 37
4. TRACKING INDIVIDUAL LEGISLATORS . . . . . . . . . . . . . . . . . . . . . . . . . . 41Changing Districts, Changing Legislators? . . . . . . . . . . . . . . . . . . . . . . . . . . . . . 42 Replacing One Legislator with Another . . . . . . . . . . . . . . . . . . . . . . . . . . . . . . . . . . 45 Moderation on Multiple Issues. . . . . . . . . . . . . . . . . . . . . . . . . . . . . . . . . . . . . . . . . . . . . 47 Summary . . . . . . . . . . . . . . . . . . . . . . . . . . . . . . . . . . . . . . . . . . . . . . . . . . . . . . . . . . . . . . . . . . . . 50
5. CHANGING VOTES . . . . . . . . . . . . . . . . . . . . . . . . . . . . . . . . . . . . . . . . . . . . . . . . . . . . . . 55Chamber of Commerce Votes . . . . . . . . . . . . . . . . . . . . . . . . . . . . . . . . . . . . . . . . . . . . . 56 Budget Votes . . . . . . . . . . . . . . . . . . . . . . . . . . . . . . . . . . . . . . . . . . . . . . . . . . . . . . . . . . . . . . . . 60 Divergent Results . . . . . . . . . . . . . . . . . . . . . . . . . . . . . . . . . . . . . . . . . . . . . . . . . . . . . . . . . . . 60 Summary . . . . . . . . . . . . . . . . . . . . . . . . . . . . . . . . . . . . . . . . . . . . . . . . . . . . . . . . . . . . . . . . . . . . . 62
x
6. CONCLUSIONS . . . . . . . . . . . . . . . . . . . . . . . . . . . . . . . . . . . . . . . . . . . . . . . . . . . . . . . . . . . . 65Alternative Explanations . . . . . . . . . . . . . . . . . . . . . . . . . . . . . . . . . . . . . . . . . . . . . . . . . . . . 65
Voters . . . . . . . . . . . . . . . . . . . . . . . . . . . . . . . . . . . . . . . . . . . . . . . . . . . . . . . . . . . . . . . . . . . . . . 65 Interest Groups . . . . . . . . . . . . . . . . . . . . . . . . . . . . . . . . . . . . . . . . . . . . . . . . . . . . . . . . . . 66 Party Leaders . . . . . . . . . . . . . . . . . . . . . . . . . . . . . . . . . . . . . . . . . . . . . . . . . . . . . . . . . . . . . 67 The Selection Effect . . . . . . . . . . . . . . . . . . . . . . . . . . . . . . . . . . . . . . . . . . . . . . . . . . . . . 68
Possible Reforms . . . . . . . . . . . . . . . . . . . . . . . . . . . . . . . . . . . . . . . . . . . . . . . . . . . . . . . . . . . . . 69Open Primaries . . . . . . . . . . . . . . . . . . . . . . . . . . . . . . . . . . . . . . . . . . . . . . . . . . . . . . . . . . . 69 Campaign Finance Reform . . . . . . . . . . . . . . . . . . . . . . . . . . . . . . . . . . . . . . . . . . . . . 70 Mobilizing Moderates . . . . . . . . . . . . . . . . . . . . . . . . . . . . . . . . . . . . . . . . . . . . . . . . . . . 71
Summary . . . . . . . . . . . . . . . . . . . . . . . . . . . . . . . . . . . . . . . . . . . . . . . . . . . . . . . . . . . . . . . . . . . . . 71
References . . . . . . . . . . . . . . . . . . . . . . . . . . . . . . . . . . . . . . . . . . . . . . . . . . . . . . . . . . . . . . . . . . . . . . . . . 73
About the Author . . . . . . . . . . . . . . . . . . . . . . . . . . . . . . . . . . . . . . . . . . . . . . . . . . . . . . . . . . . . . . . . 77
Related PPIC Publications . . . . . . . . . . . . . . . . . . . . . . . . . . . . . . . . . . . . . . . . . . . . . . . . . . . . . . 79
xi
Figures
S.1. Chamber of Commerce Ratings of California Legislators Before and After 2001 Redistricting . . . . . . . . . . . . . . . . . . . . . . . . . . . . . . vi
2.1. Hypothetical Redistricting Plans . . . . . . . . . . . . . . . . . . . . . . . . . . . . . . . . . . 10 2.2. Party Registration, Before and After the 2001 Redistricting . . . 12 2.3. Hypothetical Relationships Between Legislators and
Their Constituents . . . . . . . . . . . . . . . . . . . . . . . . . . . . . . . . . . . . . . . . . . . . . . . . . . . 16 3.1. District Partisanship and Assembly Chamber of Commerce
Scores . . . . . . . . . . . . . . . . . . . . . . . . . . . . . . . . . . . . . . . . . . . . . . . . . . . . . . . . . . . . . . . . . . 21 3.2. District Partisanship and Senate Chamber of Commerce
Scores . . . . . . . . . . . . . . . . . . . . . . . . . . . . . . . . . . . . . . . . . . . . . . . . . . . . . . . . . . . . . . . . . 23 3.3. District Partisanship and Assembly League of Conservation
Voters Scores . . . . . . . . . . . . . . . . . . . . . . . . . . . . . . . . . . . . . . . . . . . . . . . . . . . . . . . . . 24 3.4. District Partisanship and Senate League of Conservation
Voters Scores . . . . . . . . . . . . . . . . . . . . . . . . . . . . . . . . . . . . . . . . . . . . . . . . . . . . . . . . . . 25 3.5. District Partisanship and Assembly Planned Parenthood
Scores . . . . . . . . . . . . . . . . . . . . . . . . . . . . . . . . . . . . . . . . . . . . . . . . . . . . . . . . . . . . . . . . . 27 3.6. District Partisanship and Senate Planned Parenthood
Scores . . . . . . . . . . . . . . . . . . . . . . . . . . . . . . . . . . . . . . . . . . . . . . . . . . . . . . . . . . . . . . . . . 28 3.7. District Partisanship and Assembly Party Loyalty . . . . . . . . . . . . . . 30 3.8. District Partisanship and Senate Party Loyalty . . . . . . . . . . . . . . . . . . 31 3.9. Partisanship in Mixed and Partisan Districts, 1993–2006 . . . . . 33 4.1. Change in Chamber of Commerce Rating vs. Change in
District Partisanship . . . . . . . . . . . . . . . . . . . . . . . . . . . . . . . . . . . . . . . . . . . . . . . . 42 4.2. Change in League of Conservation Voters Rating vs.
Change in District Partisanship . . . . . . . . . . . . . . . . . . . . . . . . . . . . . . . . . . 44 4.3. Change in Planned Parenthood Rating vs. Change in
District Partisanship . . . . . . . . . . . . . . . . . . . . . . . . . . . . . . . . . . . . . . . . . . . . . . . . . 45 4.4. Change in Party Loyalty vs. Change in District
Partisanship . . . . . . . . . . . . . . . . . . . . . . . . . . . . . . . . . . . . . . . . . . . . . . . . . . . . . . . . . . 46 5.1. Predicting Chamber of Commerce Votes from Changes in
District Partisanship, 2005–06 . . . . . . . . . . . . . . . . . . . . . . . . . . . . . . . . . . . . 57

xiii
Tables
3.1. Actual and Hypothetical Moderates, 1997–02, Giving Maximum Credit to Redistricting . . . . . . . . . . . . . . . . . . . . . . . . . . . . . . . . 38
4.1. Correlation Between District Partisanship and Roll Call Voting, Separately by New and Sitting Legislators . . . . . . . . . . . . . . 47
4.2. Moderation in Mixed Districts, 1997–98 . . . . . . . . . . . . . . . . . . . . . . . . 50 4.3. Moderation in Mixed Districts, 2005–06 . . . . . . . . . . . . . . . . . . . . . . . . 52 4.4. Moderation by Turnover and Last Incumbent’s Record . . . . . . . . 53 4.5. Moderation by District Partisanship and Legislative
Competitiveness . . . . . . . . . . . . . . . . . . . . . . . . . . . . . . . . . . . . . . . . . . . . . . . . . . . . . . 53 5.1. Predicting Changes in Bill Outcomes from Changes in
District Partisanship . . . . . . . . . . . . . . . . . . . . . . . . . . . . . . . . . . . . . . . . . . . . . . . . . 59 5.2. Predicting Changes in Budget Votes from Changes in
District Partisanship . . . . . . . . . . . . . . . . . . . . . . . . . . . . . . . . . . . . . . . . . . . . . . . . . 61

xv
Guide to Online Technical Appendices1
Appendix A. RatingsThe report uses ratings from three interest groups and provides a
general measure of party loyalty. A number of issues encountered in the calculation and use of these rating scores are described here.
Appendix B. CounterfactualsThree sets of counterfactuals estimate the effect of the 2001
redistricting: one for the number of moderate legislators, one for votes on bills tracked by the Chamber of Commerce, and one for votes on budget bills. This appendix describes the procedure used to calculate each and provides details about the bills used in the counterfactual for the Chamber of Commerce–tracked legislation.
Appendix C. Alternative Scatter PlotsThroughout Chapter 3, we note the creation of additional scatter plots
to confirm the results of those in the main text. These additional scatter plots are presented here.
Appendix D. RegressionsThroughout the report we note regressions that verify our findings,
underlie our estimates, or illuminate specific points. They can be found in this appendix.
1 Technical appendices are available on the PPIC website: http://www.ppic.org/content/pubs/other/908EMR_appendix.pdf.

xvii
Acknowledgments
I would like to thank the many people outside PPIC who spoke with me about this project when it was still germinating and gave me helpful thoughts and ideas. These include Bruce Cain, Darren Chesin, Kathay Feng, Tim Hodson, Ethan Jones, Rick Simpson, George Skelton, Zabrae Valentine, and Dan Walters. Bruce Cain and Tim Hodson deserve particular thanks for their insightful comments on an early draft. I would also like to thank the anonymous staffers and former legislators, both Democrats and Republicans, who provided valuable input along the way.
Researchers at PPIC also deserve my thanks: Max Neiman, Richard Greene, Lynette Ubois, Dean Bonner, Deborah Reed, Dave Lesher, and Mark Baldassare. Daniel Krimm provided invaluable research assistance in getting the final pieces of the data together.
Research publications reflect the views of the authors and do not necessarily reflect the views of the staff, officers, or Board of Directors of the Public Policy Institute of California.

1
1. Introduction
Every 10 years, the California Legislature must draw new congressional, legislative, and Board of Equalization districts to reflect the changes in population that have occurred over the previous decade, as measured by the decennial national census. New districts must be virtually identical in population size, but beyond that requirement the Legislature has broad latitude to draw any plan it wants to.1 In 2001, the Legislature used this broad discretion to create a set of highly partisan Assembly and Senate districts, in which voter registration majorities were clearly Republican or Democrat. This plan made Republican-held seats more Republican and Democratic-held seats more Democratic. Since this map was put into place, party turnover in state legislative elections has vanished. In 300 races for Senate and Assembly seats since then, not one district has changed party hands.
These new districts have been the subject of heated debate. Chief among the many criticisms is that the districts have made legislators more partisan and less willing to compromise.2 Heavily partisan districts are assumed to be unwinnable for one party or the other, leaving party primaries as the only source of competition. The primaries then reinforce the district’s profile: If a legislator drifts too far to the center, a primary challenge from the right (for Republicans) or the left (for Democrats) will either push that legislator back toward the extremes or, if the challenge succeeds, replace him with someone more partisan. By the same logic, if the districts had a more balanced combination of Democratic and
1 There are some other constraints that tend to be less serious in practice. Two are relatively inflexible: The districts must be contiguous—every part of the district must touch every other part; and the Federal Voting Rights Act requires a certain amount of minority representation. Article xxI, Section 1(d) of the California Constitution also urges legislators to respect city and county lines (plus ill-defined “regions”) “to the extent possible,” but there is no legal penalty for ignoring this provision.
2 For some examples from the media in the last two years, see “Editorial: California Voters Should Embrace Newest Redistricting Plan”; “Thanks, Governor: Redistricting Would Spur Other Reforms”; “An Essential Reform: Redistricting Fix Is the Key to Many Problems”; “Editorial: What We Need in Sacramento: Redistricting, Not Retaliation”; Fund (2007); Wiegand (2007); Hertzberg and Brulte (2006).
2
Republican voters it would encourage more moderation—legislators from these districts would move to the political center to defeat a serious opponent from the other party in the general election.
This argument of a link between redistricting and partisan polarization is common because it makes intuitive sense. Legislators are in fact more partisan than they used to be, at least in the Assembly.3 Since their districts are more partisan as well, it hardly strains reason to see a connection between the two. The argument probably also thrives because it offers a straightforward solution to a difficult issue: If changing the districts weakened bipartisanship, then changing them back should strengthen it.
In fact, the perceived connection between the 2001 redistricting and both partisanship and gridlock has become an important reform argument. Reforms generally involve transferring redistricting authority from the Legislature to an independent commission, in the hopes (not unfounded) that such a commission will draw a more geographically regular and compact set of districts that are also more competitive.4 In fact, a major reform of this type has qualified for the November 2008 ballot. Proposition 11 would use a bureaucratic process, in place of legislators, to appoint a commission of ordinary citizens, while constraining the sorts of districts this commission could draw. Although many arguments have been offered in favor of this measure, the promise of greater moderation by legislators is clearly one of them.
Would a less partisan set of districts actually make the legislature less partisan? There are plenty of reasons for skepticism. Redistricting may not be the only, or even an important, cause of divisions between the parties. After all, the U.S. Senate has become more polarized in recent years, yet senators represent entire states, which have never been redrawn. Research on the U.S. House of Representatives also finds little connection between partisan districts and polarization.5
Other factors might be at work:
3 See Masket (2007); McGhee (2007). 4 See Johnson (2005); Johnson et al. (2005).5 See Ansolabehere, Snyder, and Stewart, (2001); McCarty, Poole, and Rosenthal,
(2006).
3
Interest groups: Interest groups might pressure legislators to take •uncompromising positions that increase partisanship. As one former legislator suggested in an interview for this report, “Interest groups want and expect 100 percent support for their agenda . . . 80 percent is not OK.”Fellow legislators: Legislators can face pressure to toe the line from •other members of their party caucus in the Legislature. Social and professional influence as well as efforts by the party leadership to reward and punish might force a legislator to the edges of the political spectrum. Voter sorting: Voters have sorted themselves into the parties more •effectively. Conservatives are more likely to identify as Republicans, moderates as independents, and liberals as Democrats. Even if the district is mixed overall, a homogeneous primary electorate might still vote for the candidate with the purest ideology. The result would be strongly partisan legislators from all types of districts.
With so many reasons to question the link between redistricting and partisanship, it becomes essential to compare the claims with the available evidence, giving rise to such questions as:
Do legislators from districts with even numbers of Democrats and •Republicans behave more like moderates than legislators from more partisan districts?Is there evidence that the redistricting of 2001 reduced the number of •moderates in either the Senate or the Assembly?What is likely to be the effect on policy of districts that more closely •resemble those of the 1990s?
To answer these questions in this report, we use interest group ratings and other measures to analyze voting patterns in four issue areas: business regulation, environmental protection, abortion/contraception, and general party loyalty.
Our conclusion is as striking as it is consistent: The 2001 redistricting had little effect on partisanship in the Legislature. This result partly reflects the weak link between districts and representation. Districts with balanced numbers of Democratic and Republican voters elect at least as many
4
partisan legislators as they do moderate ones. Heavily partisan districts do tend to elect more partisan representatives, but some moderates can be found even in these partisan bastions. The result also reflects the fact that there have been about as many moderates in the Legislatures since the 2001 redistricting as there were in the Legislatures before it. The Legislature has grown somewhat more partisan over time, but most of that change occurred before the districts were redrawn.
These conclusions come from comparing roll call votes in the late 1990s to those in the 2000s, using interest group ratings of legislator behavior. These ratings identify the percentage of votes the legislator casts in favor of the interest group’s position on bills the group has identified as important. They give a sense of how legislators have positioned themselves on politically important questions.
To calculate positions on business regulation, we use scores from the California Chamber of Commerce. For environmental issues, the votes are those identified by the League of Conservation Voters. For votes on abortion and contraception issues, we use scores from Planned Parenthood of California. We also supplement these scores with a more general measure of party loyalty.
The scope of this report is narrow. It does not address whether reform would actually lead to less partisan districts. At various points we do examine the likely effect of changing the districts, but we simply assume that reform would return the districts to the status quo of the 1990s. The study also does not presume that reducing partisanship in the Legislature is the only goal of reform, or even a desirable one. As noted above, advocates for reform offer a number of other aims, and gauging their value is not the purpose of this report.6 We focus only on the claim that the 2001 redistricting has made legislators more partisan and that they would behave differently if the number of politically mixed districts were increased.
Chapter 2 brings some historical and political context to the redistricting issue. It demonstrates the clear and significant change wrought by the 2001 redistricting and discusses three standard models that
6 For examples of these arguments see Common Cause Education Fund (2005); Johnson et al. (2005).
5
might describe the way legislators represent their districts: district delegate, partisan, and trustee.
Chapter 3 compares roll call voting from the 1997–98 Legislature with voting from the 2005–06 Legislature. Limiting the analysis to these two allows for the presentation of detailed graphs of legislator behavior while keeping the amount of information manageable. These two legislative sessions share a number of features—specifically, temporal proximity to both redistricting and a gubernatorial race—while still operating under different sets of district boundaries. If the 2001 redistricting made a significant difference, it should be visible in the behavior of these two Legislatures. Chapter 4 elaborates on the results of Chapter 3 by tracking individual legislators and districts over time. A great deal of the moderation currently found in the Legislature appears to be idiosyncratic and not dictated by the composition of a legislator’s district. Legislators who served both before and after the redistricting showed almost no change in their voting behavior, despite radical changes in some of the districts they represented. Chapter 4 also explores the connections between issues. A close examination suggests that legislators who are moderate on one issue tend to be moderate on others as well and that about half the legislators from mixed districts are not moderate on any of the voting scores.
Chapter 5 focuses on specific bills, to explore whether returning to the districts before the 2001 redistricting would change the outcomes of any post-2001 legislation. The analysis shows that reverting to the districts of the 1990s produces little change in any of these votes. Moreover, the changes do not consistently favor one party or the other.
Chapter 6 concludes by considering four possible influences other than district lines that might encourage legislators toward partisanship: partisan sorting among the general public, the effect of interest groups, the pressures from fellow legislators (specifically party leaders), and bias in the sort of people who get involved in politics in the first place. We then offer three possible ways to restore bipartisanship in the Legislature: open primaries, campaign finance reform, and the political mobilization of moderates. None would be a perfect solution, but each would likely have a stronger effect than redistricting reform.

7
2. Background and Context
In a series of groundbreaking decisions in the early 1960s, the U.S. Supreme Court established the constitutional principle of “one person, one vote,” which required that all congressional and legislative districts be as close as possible to equality in population size.1 These decisions upset a longstanding status quo in which some legislative districts had become dramatically larger in population than others. Districts with small populations had an advantage because their single representative was shared by fewer voters, so each voter’s influence on public policy was stronger.2
The states’ reluctance to change this status quo stemmed in part from rural interests and from incumbents.3 For incumbents, redistricting is a contentious and uncertain process. It was easier for them to tolerate inequalities in population size if it meant that they knew for certain which communities they represented and the likelihood of winning reelection the next time around. Rural interests also stood to lose a great deal of representation from any changes as well, since most of the underpopulated districts fell in rural areas. But the court’s new rules tolerated far less (and ultimately no) deviation from population equality. Since those decisions, each decennial census has been followed by a politically disruptive redistricting process, to create new legislative districts in accord with the shifts in population shown by the census.4
For California, the result of this legal sea change has been decades of controversy.5 Every one of the last four efforts to redraw California’s legislative districts resulted in either protracted conflict, an extra-legislative redistricting process, or both. Democrats have been a majority in the
1 See, for example, Baker v. Carr, 369 U.S. 186 (1962); Wesberry v. Sanders, 376 U.S. 1 (1964); Reynolds v. Sims, 377 U.S. 533 (1964).
2 See Dixon (1968); Cain, MacDonald, and McDonald (2005). 3 California redrew its districts following each census from 1920 through 1960, so it
did not avoid redistricting altogether. However, its districts differed enough in population size to warrant redrawing them in the mid-1960s following the Supreme Court’s decisions.
4 See Cox and Katz (2002).5 Many of the details of this history come from Kousser (2006).
8
Legislature in each of these redistricting cycles, but Republicans have always had enough leverage to force their interests to be considered.
California Redistricting at the Close of the 20th Century
In 1971 and 1991,6 the Democratic Legislature faced a Republican governor who vetoed its redistricting plan. In each case, the resulting stalemate put the job of drawing districts into the hands of special masters—a group of retired judges appointed by the courts who made the decisions independently of the Legislature. On these two occasions, they drew a relatively large number of politically mixed districts and gave little regard to the protection or electoral safety of incumbent legislators. They also respected city and county lines as much as possible and favored compact, “boxy” district shapes.
The outcome in 1981 was radically different, because the Democratic Legislature was paired with a Democratic governor. Without the threat of a veto, the Democrats drafted a set of districts that maximized the number of seats they were likely to win. The process might have ended there, but in California, the law allows a referendum on any bill that passes the Legislature with less than two-thirds support. Republicans took the redistricting plan to the voters, who rejected it. In response, the Democrats agreed to a plan that earned enough Republican support to avoid another referendum. But it came at a cost: The new plan protected all sitting incumbents by making many of the existing districts more partisan.7
Many Republicans and reformers outside the Legislature remained dissatisfied with this solution. Throughout the remainder of the decade, they attempted to pass a number of reforms that would have institutionalized the appointment of outside parties to draw new redistricting maps. None of these attempts was successful.
6 The census generates new population numbers in years ending in “0,” the process of drawing the lines typically occurs in years ending in “1,” and the new lines are first used in years ending in “2.” In two of these redistricting cycles (1971 and 1981), conflict over the new lines prevented the final districts from being used until a year ending in “4.”
7 See Johnson et al. (2005). Here and throughout the report, when we use the term “partisan” to describe legislative districts we refer to the number of Democrats and Republicans in a district, rather than to the ideological extremity of the constituents.
9
The 2001 PlanIn 2001, Democrats once again enjoyed undivided control of both the
Legislature and the governor’s office, but they also wanted to avoid another referendum. Republican leaders explicitly threatened to “referend” any redistricting plan that did not satisfy them.8 The result was an incumbent-protection plan similar to the one from the 1980s but even more extreme. The number of districts with even numbers of Democratic and Republican voters was reduced to a handful, and in the congressional delegation there were essentially no such seats at all. But the plan met its primary goal: It gave something to each party. Democrats avoided a drawn-out conflict, and Republicans established a floor for the number of seats they would hold.9
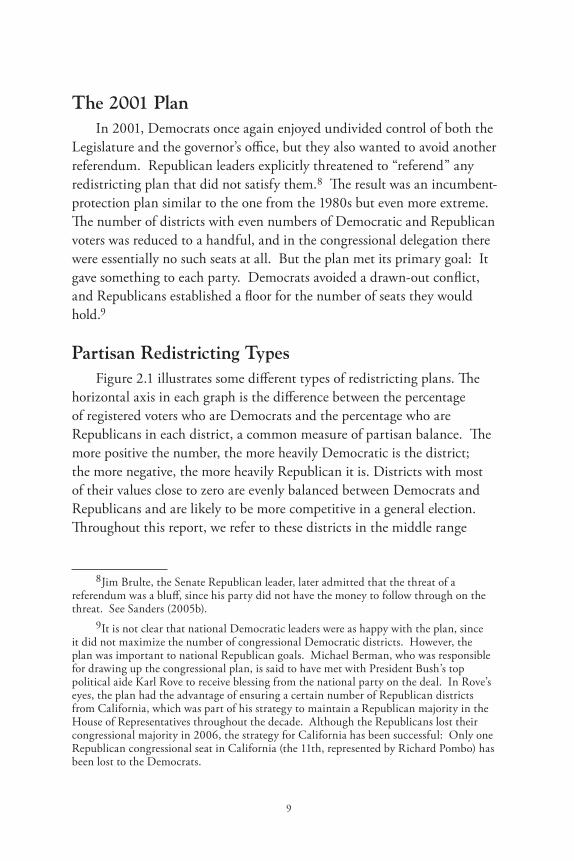
Partisan Redistricting TypesFigure 2.1 illustrates some different types of redistricting plans. The
horizontal axis in each graph is the difference between the percentage of registered voters who are Democrats and the percentage who are Republicans in each district, a common measure of partisan balance. The more positive the number, the more heavily Democratic is the district; the more negative, the more heavily Republican it is. Districts with most of their values close to zero are evenly balanced between Democrats and Republicans and are likely to be more competitive in a general election. Throughout this report, we refer to these districts in the middle range
8 Jim Brulte, the Senate Republican leader, later admitted that the threat of a referendum was a bluff, since his party did not have the money to follow through on the threat. See Sanders (2005b).
9 It is not clear that national Democratic leaders were as happy with the plan, since it did not maximize the number of congressional Democratic districts. However, the plan was important to national Republican goals. Michael Berman, who was responsible for drawing up the congressional plan, is said to have met with President Bush’s top political aide Karl Rove to receive blessing from the national party on the deal. In Rove’s eyes, the plan had the advantage of ensuring a certain number of Republican districts from California, which was part of his strategy to maintain a Republican majority in the House of Representatives throughout the decade. Although the Republicans lost their congressional majority in 2006, the strategy for California has been successful: Only one Republican congressional seat in California (the 11th, represented by Richard Pombo) has been lost to the Democrats.
10
NOTE: Numbers are hypothetical and represent the distribution of districts that might emerge from each type of redistricting strategy.
15
10
5
20
0
Num
ber
of d
istr
icts
–20 100–10 20Republican DemocratDistrict partisanship
Centrist
15
10
5
20
0
Num
ber
of d
istr
icts
–20 100–10 20Republican DemocratDistrict partisanship
Moderate incumbentprotection
15
10
5
20
0
Num
ber
of d
istr
icts
–20 100–10 20Republican DemocratDistrict partisanship
Strong incumbentprotection
Figure 2.1—Hypothetical Redistricting Plans
as “mixed” because they contain many voters from both major parties, while we refer to districts with a heavy concentration of one party or the other as “solid.” In most studies of redistricting, the terms of choice are
11
“competitive” and “safe,” but we avoid these terms because we want to distinguish the partisan complexion of the district on paper—which is largely set by its partisan registration—from its competitiveness on election day, which can stem from many other factors including incumbency, campaign effectiveness, and the performance of parties and candidates for other offices.10
The bars in Figure 2.1 show the number of districts that fall into each range of partisanship under each type of redistricting strategy. A “centrist” plan that maximizes the number of mixed districts resembles a mountain with a single peak around zero. The second panel turns this into a “moderate incumbent-protection” plan: The number of districts at the direct center has shrunk, and the number to either side has increased somewhat, but there are still more mixed districts in the middle than solid ones at the extremes. The final panel shows a “strong incumbent-protection” plan: The single peak in the center is gone because mixed districts have been eliminated. Instead, there are two peaks: one each for solid Democratic and Republican districts.
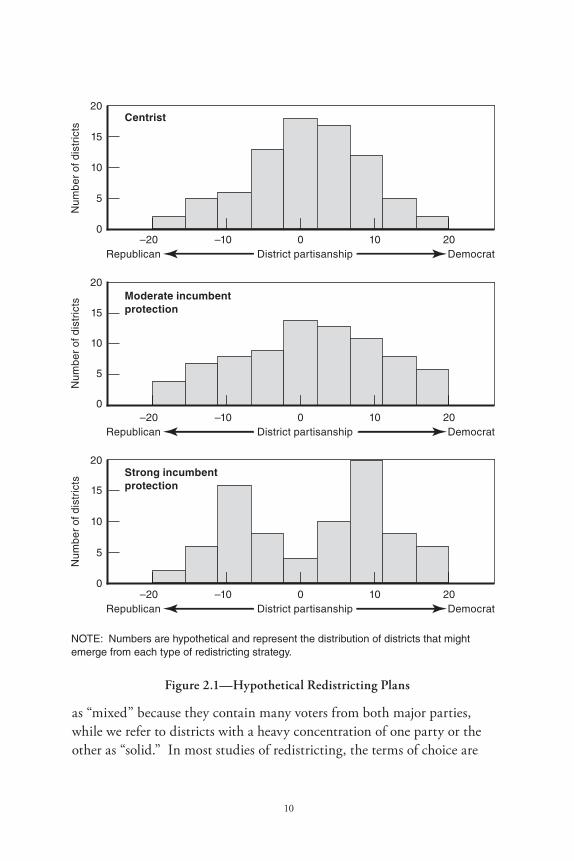
Figure 2.2 contains the actual distributions of the districts before and after the 2001 redistricting. Just before the new plan went into effect, the distributions of districts had the mountainous look of the classic centrist plan. Just after the redistricting, there was suddenly a canyon in the middle of each mountain: The number of mixed districts decreased and the number of solid districts increased dramatically. The distribution of districts now resembles a strong incumbent-protection plan. The lesson is clear: The 2001 redistricting replaced mixed districts with districts that favored one party or the other, at least on paper.
Models of RepresentationTo understand the effect that these districts might have on the policy
decisions that legislators make, it is important to think about the different ways legislators might represent their constituents. Political scientists
10 We also avoid the term “gerrymander” in this report, since it connotes a negative value judgment that we do not wish to make. We remain formally neutral as to which type of plan is preferable.
12
SOURCE: California Secretary of State.
NOTES: The graphs show the distribution of districts before and after the 2001 redistricting for each chamber. District partisanship is measured as the difference between the percentage of registered voters in each district who are Democratic minus the percentage who are Republican.
15
10
5
20
0
Num
ber
of d
istr
icts
District partisanship
6
4
2
8
0
Num
ber
of d
istr
icts
–50 500 100
Republican Democrat
District partisanship
–50 500 100
Republican Democrat
Assembly
Senate
Old districts:2001–02
New districts:2003–04
Old districts:2001–02
New districts:2003–04
–50 500 100
Republican Democrat
–50 500 100
Republican Democrat
Figure 2.2—Party Registration, Before and After the 2001 Redistricting
have identified three general models of representation that tend to describe most of the behavior we see in legislative politics.
13
District delegate: Legislators represent exactly what their constituents want. When deciding how to vote on any given issue, the district delegate canvasses opinion in the district and then follows the majority. A perfect district delegate would consult a public opinion poll of constituents before making any important decision, but this extreme version is of course impossible. A legislator can never know exactly how constituents think about every one of the thousands of choices that must be made during a term in office. Most legislators have an intuitive sense of where their constituents stand, from their long history in the community. They might also rely on the district’s demographics, industries, past voting history, or— most relevant for this study—its partisanship. The key question in the district delegate model is not how the constituents feel about an issue but how they might feel if someone explained all the details to them. Arguments that link redistricting reform and partisanship assume a district delegate model: The composition of the district matters because legislators are trying to represent opinion in their districts as closely as possible. If the districts are changed, so the theory goes, the legislators will change in response.
Partisan: Legislators identify as either Democrats or Republicans and vote reliably with other Democrats or Republicans in the Legislature. In a pure partisan model, legislators make little effort to respond to their constituents, at least on the big issues of the day. Instead, they accept the party’s position and let their constituents decide if they approve of this position by either reelecting their legislator or not. Political theorists tend to worry about the ability of voters to understand how to assign blame and credit for the things government does, so they favor the partisan model because it makes it easier to hold a legislature accountable for the collective decisions it makes. When voters choose a representative, they know they are really choosing a party platform, because all legislators are lock-step supporters of their party’s agenda.
The drawback of this model is that the legislator represents the party, not the district, and any constituency interest or point of view not represented by at least one of the two parties will be left out of the policymaking process. Voters in the middle might find this situation particularly frustrating. Moreover, if the districts themselves are lopsidedly Democratic or Republican, it might make it difficult for these
14
middle-of-the-road voters to exercise the one power they have in a partisan system: to switch sides and help replace the sitting representative with one from the other party. Legislators might then ignore moderate voters entirely.
Trustee: Legislators ignore all other influences and vote their consciences. A trustee’s voting behavior is difficult to predict, because decisions are not determined by anything easily observable. Trustees may choose the option they believe will benefit the district most in the long run (even if their constituents do not know it yet), or they may just do what seems best for the state or the country even if their constituents are hurt. Regardless, neither the party identification nor the composition of the trustee’s district can be used to predict how he or she will vote on any given issue.
As a practical matter, legislators are likely to exhibit a mixture of all three models. Most legislators are motivated by three desires: to be reelected, to have influence within the legislature, and to make good public policy.11 Reelection pressures make legislators behave like district delegates; a desire for influence makes them behave like partisans (since most power is distributed through political parties); and a desire for good public policy makes them behave like trustees. They will adopt the three models to varying degrees depending on the legislator, the issue, when that issue needs to be decided, and the context within which the decision is made. The goal is to identify not which model perfectly explains legislator behavior but which best predicts behavior in most circumstances.
This discussion of models has two important implications for this report. First, if the partisan makeup of districts matters for representation, then delegate behavior should be common. Only the district delegate model implies a strong connection between the sort of district a legislator represents and the kind of representation he or she provides. Second, if the 2001 redistricting helped create a climate of intense partisanship, then there should be fewer moderate legislators after the redistricting than before—but only because the districts themselves changed.
11 See Fenno (1973).
15
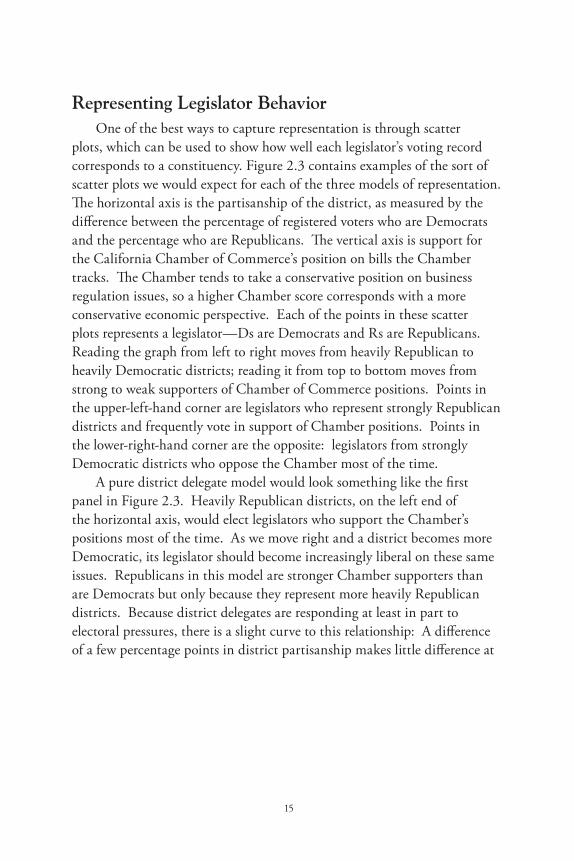
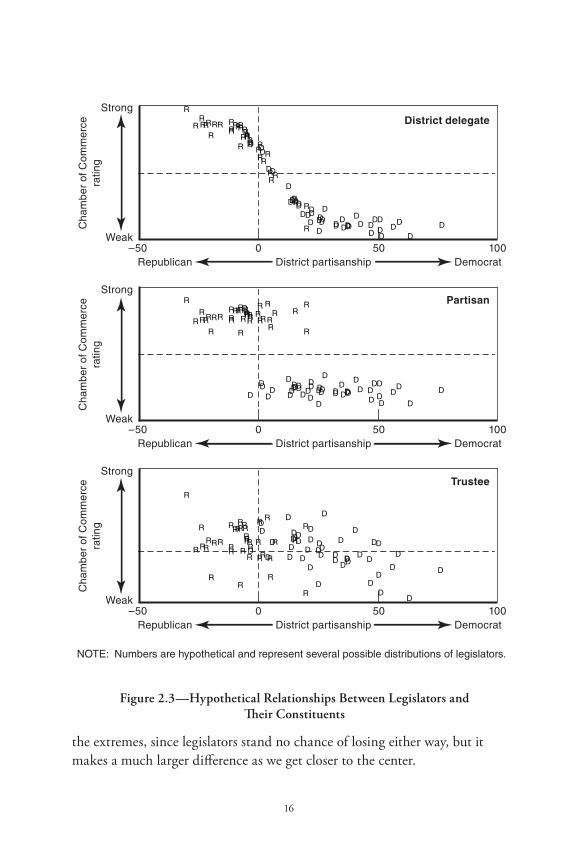
Representing Legislator BehaviorOne of the best ways to capture representation is through scatter
plots, which can be used to show how well each legislator’s voting record corresponds to a constituency. Figure 2.3 contains examples of the sort of scatter plots we would expect for each of the three models of representation. The horizontal axis is the partisanship of the district, as measured by the difference between the percentage of registered voters who are Democrats and the percentage who are Republicans. The vertical axis is support for the California Chamber of Commerce’s position on bills the Chamber tracks. The Chamber tends to take a conservative position on business regulation issues, so a higher Chamber score corresponds with a more conservative economic perspective. Each of the points in these scatter plots represents a legislator—Ds are Democrats and Rs are Republicans. Reading the graph from left to right moves from heavily Republican to heavily Democratic districts; reading it from top to bottom moves from strong to weak supporters of Chamber of Commerce positions. Points in the upper-left-hand corner are legislators who represent strongly Republican districts and frequently vote in support of Chamber positions. Points in the lower-right-hand corner are the opposite: legislators from strongly Democratic districts who oppose the Chamber most of the time.
A pure district delegate model would look something like the first panel in Figure 2.3. Heavily Republican districts, on the left end of the horizontal axis, would elect legislators who support the Chamber’s positions most of the time. As we move right and a district becomes more Democratic, its legislator should become increasingly liberal on these same issues. Republicans in this model are stronger Chamber supporters than are Democrats but only because they represent more heavily Republican districts. Because district delegates are responding at least in part to electoral pressures, there is a slight curve to this relationship: A difference of a few percentage points in district partisanship makes little difference at
16
NOTE: Numbers are hypothetical and represent several possible distributions of legislators.
D
RR
R
R
D
D
D
D
R
D D DD
R
D
D
DD
DDD
D
R
R
DD
R
R
R
D
RR
R
R
R
RR
DD
D
D
DD
DD
D DD D
DD
D
R
D
D
D
D
RR R
D
R
R
RRR
R
R
R
RRR
RR
D
RD
D
R
Strong
Weak
Cha
mbe
r of
Com
mer
ce
ratin
g
–50 500 100Republican DemocratDistrict partisanship
District delegate
D
RR
R R
D
D
DD
R
DD D
D
R
D
DD
D
DDD
D
RR
D D
R
R R
D
RRR RR RR
DDD DDD
DD
D DD D
DD
D
R
DD D
D
R
R
R
D
RR
RRR
RR
R
R
RR
RR
D
R
D D
R
Strong
Weak
Cha
mbe
r of
Com
mer
cera
ting
–50 500 100Republican DemocratDistrict partisanship
Partisan
D
R
RR
R
D
D
D
D
R
DD
D
D
R
D
D
D
D
D
D
D
DR
R DD
R
R
RDR
RR
RR RR
DDD
D
D
D D
D
D
D
D D
D
D
D
R D
D D
D
R
R
R
D
R
R
R
RR
R R
R
R
R
R
R
R
DR
D D
R
Strong
Weak
Cha
mbe
r of
Com
mer
cera
ting
–50 500 100Republican DemocratDistrict partisanship
Trustee
Figure 2.3—Hypothetical Relationships Between Legislators and Their Constituents
the extremes, since legislators stand no chance of losing either way, but it makes a much larger difference as we get closer to the center.
17
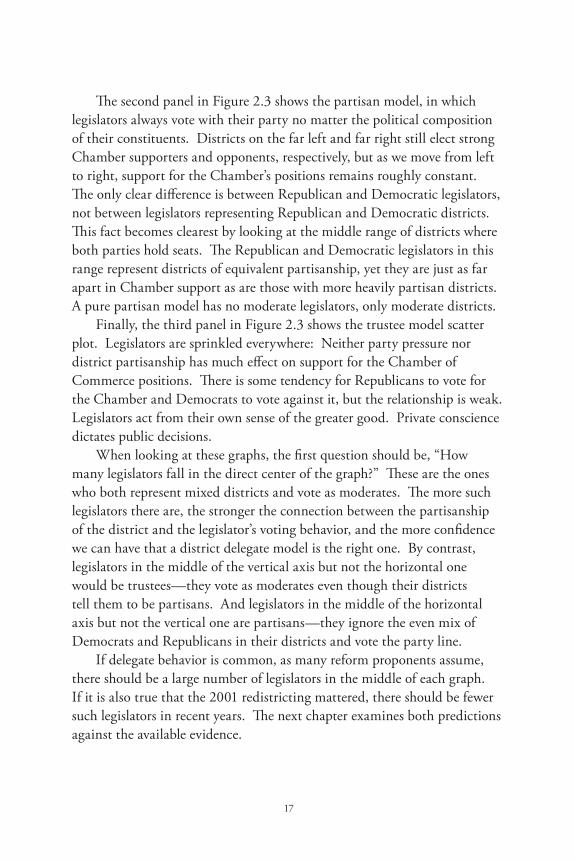
The second panel in Figure 2.3 shows the partisan model, in which legislators always vote with their party no matter the political composition of their constituents. Districts on the far left and far right still elect strong Chamber supporters and opponents, respectively, but as we move from left to right, support for the Chamber’s positions remains roughly constant. The only clear difference is between Republican and Democratic legislators, not between legislators representing Republican and Democratic districts. This fact becomes clearest by looking at the middle range of districts where both parties hold seats. The Republican and Democratic legislators in this range represent districts of equivalent partisanship, yet they are just as far apart in Chamber support as are those with more heavily partisan districts. A pure partisan model has no moderate legislators, only moderate districts.
Finally, the third panel in Figure 2.3 shows the trustee model scatter plot. Legislators are sprinkled everywhere: Neither party pressure nor district partisanship has much effect on support for the Chamber of Commerce positions. There is some tendency for Republicans to vote for the Chamber and Democrats to vote against it, but the relationship is weak. Legislators act from their own sense of the greater good. Private conscience dictates public decisions.
When looking at these graphs, the first question should be, “How many legislators fall in the direct center of the graph?” These are the ones who both represent mixed districts and vote as moderates. The more such legislators there are, the stronger the connection between the partisanship of the district and the legislator’s voting behavior, and the more confidence we can have that a district delegate model is the right one. By contrast, legislators in the middle of the vertical axis but not the horizontal one would be trustees—they vote as moderates even though their districts tell them to be partisans. And legislators in the middle of the horizontal axis but not the vertical one are partisans—they ignore the even mix of Democrats and Republicans in their districts and vote the party line.
If delegate behavior is common, as many reform proponents assume, there should be a large number of legislators in the middle of each graph. If it is also true that the 2001 redistricting mattered, there should be fewer such legislators in recent years. The next chapter examines both predictions against the available evidence.

19
3. Districts and Legislators
The claim that the 2001 redistricting has led to more partisanship in the Legislature rests on two premises that can be easily compared against the evidence. The first is that delegate behavior should be common: A scatter plot of voting records against the partisanship of each legislator’s district should produce a large number of legislators in the direct center, where mixed districts and moderation combine. The second is that the 2001 redistricting plan has weakened delegate behavior by increasing the importance of party primaries. This behavior should emerge in a comparison of Legislatures over time: More recent years should have fewer legislators in the center of the graph than in years before the new districts were put into place.
In this chapter, we compare voting records from the 1997–98 Legislature to those of the 2005–06 Legislature. The two are chosen because of their similarities. The 1997–98 Legislature was the third to last Legislature created by the 1991 redistricting, and the 2005–06 Legislature was the second to use the new 2001 districts. Legislators in both cases will have had enough time to understand their districts without yet worrying about the new districts they might soon have to represent. Other similarities include the fact that both Legislatures ended with a gubernatorial election: a landslide for Democrats in 1998 (Davis over Lungren) and a landslide for Republicans in 2006 (Schwarzenegger over Angelides). (To confirm the results, we also repeat the scatter plots for every Legislature in between and mention whenever these results shed light on the main analysis. These graphs can be found in Figures C.1 through C.12 of technical Appendix C. See p. xv for the web address of Appendix C.)
We capture legislator behavior with several measures.1 The first is California Chamber of Commerce scores. The Chamber tracks what it refers to as “major business legislation” and, more broadly, its agenda promotes the interests of the business community. Since many different
1 Details of these measures and how we resolved a variety of measurement issues can be found in technical Appendix A. See p. xv for the web address of Appendix A.
20
issues affect business interests, the bills tracked by the Chamber cover a wide range of topics, including economic development, education, health, legal affairs, labor relations, taxation, and the environment. These encompass a good cross-section of the most important legislation up for a vote each year.
The other two are narrower: League of Conservation Voters scores capture votes on environmental issues, and scores from Planned Parenthood capture votes on social issues, specifically abortion and reproductive rights. Finally, we widen the focus to look at party loyalty on all votes, with a measure of individual legislator behavior based on votes that divided the parties as a whole.
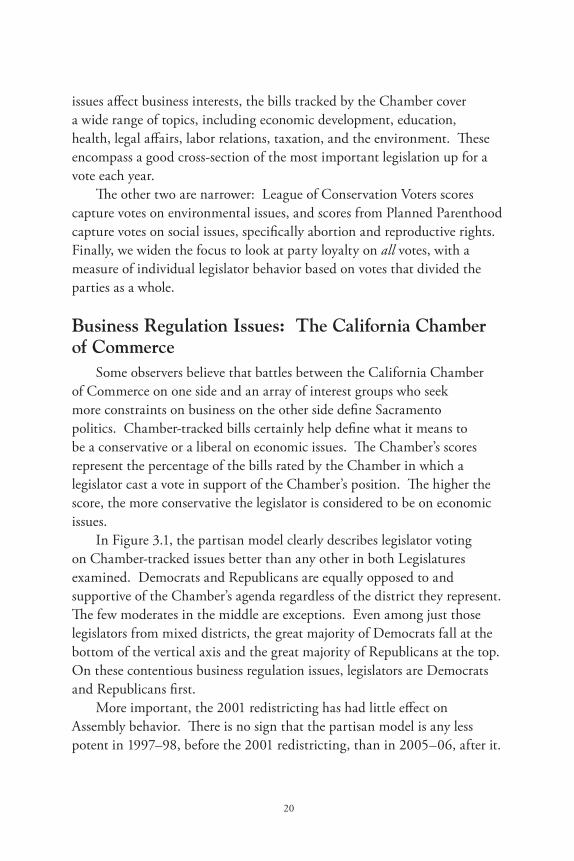
Business Regulation Issues: The California Chamber of Commerce
Some observers believe that battles between the California Chamber of Commerce on one side and an array of interest groups who seek more constraints on business on the other side define Sacramento politics. Chamber-tracked bills certainly help define what it means to be a conservative or a liberal on economic issues. The Chamber’s scores represent the percentage of the bills rated by the Chamber in which a legislator cast a vote in support of the Chamber’s position. The higher the score, the more conservative the legislator is considered to be on economic issues.
In Figure 3.1, the partisan model clearly describes legislator voting on Chamber-tracked issues better than any other in both Legislatures examined. Democrats and Republicans are equally opposed to and supportive of the Chamber’s agenda regardless of the district they represent. The few moderates in the middle are exceptions. Even among just those legislators from mixed districts, the great majority of Democrats fall at the bottom of the vertical axis and the great majority of Republicans at the top. On these contentious business regulation issues, legislators are Democrats and Republicans first.
More important, the 2001 redistricting has had little effect on Assembly behavior. There is no sign that the partisan model is any less potent in 1997–98, before the 2001 redistricting, than in 2005–06, after it.
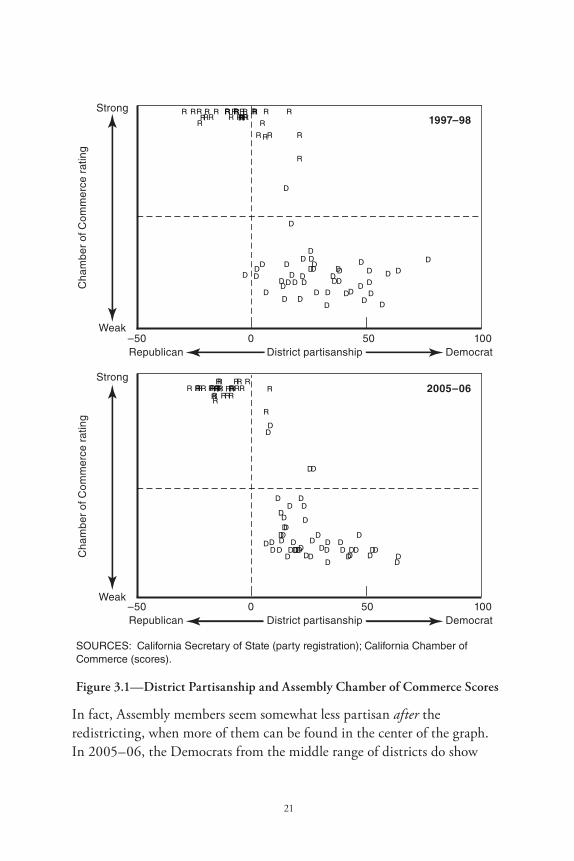
21
SOURCES: California Secretary of State (party registration); California Chamber of Commerce (scores).
Strong
Weak
Cha
mbe
r of
Com
mer
ce r
atin
g
–50 500 100Republican DemocratDistrict partisanship
D
RRR
R
D
DDD
R
D
DD D
R
D
D
D
D
DD
D
D
R
R
D
D
R
R R
D
RR
R
R
R RR
DD
DDD
D
D
D
D
D
DD
D DD
R
DD
D
D
R R
R
D
RR
RRR R
R
RR R
R
RR
D
R
DD
R1997–98
Strong
Weak
Cha
mbe
r of
Com
mer
ce r
atin
g
–50 500 100Republican DemocratDistrict partisanship
D
RR
RR
D
D
D
D
R
D
DD
D
R
D
D
D
D
D
D D
DD
RR
DD
R
D
D
R RR
D
RRR
DDD
D
DD
DDD
D
D D
D
D
DDDD
D
D
RR
D D
RRR
R
R
R
D
RRR
R RR
D
R
R
D
R 2005–06
Figure 3.1—District Partisanship and Assembly Chamber of Commerce Scores
In fact, Assembly members seem somewhat less partisan after the redistricting, when more of them can be found in the center of the graph. In 2005–06, the Democrats from the middle range of districts do show
22
some signs of moderation, but a majority are loyal partisans even in this range. In fact, legislators from mixed districts range from strongly partisan to middle-of-the road. A mixed district does not seem to compel these Democrats to be moderate so much as to provide the option to be moderate if the legislator wants to take it.
The results are very similar for the Senate (Figure 3.2). The composition of the district has very little effect on support for Chamber positions in either the 1997–98 or 2005–06 Senate, and the gulf between the parties in both years is quite large. Republicans are particularly disciplined, since none in their ranks supported the Chamber’s position less than 87 percent of the time in either year. Democrats, on the other hand, are more spread out and even have some legislators who supported the Chamber’s position more than 40 percent of the time: two in 1997–98 and three in 2005–06. But the broader portrait is one of partisan armies arrayed in lockstep against each other. Neither the composition of the districts nor redistricting has made much difference.
Environmental Issues: The League of Conservation Voters
Although environmental regulation can certainly overlap with Chamber concerns, any environmental issue that did not directly impinge on businesses would probably be omitted from the Chamber rating. Thus, a legislator could be a strong supporter of Chamber positions and at least a moderate environmentalist. The measure of “environmentalist” used here is the legislator’s rating by the League of Conservation Voters, an organization that advocates environmental protection.
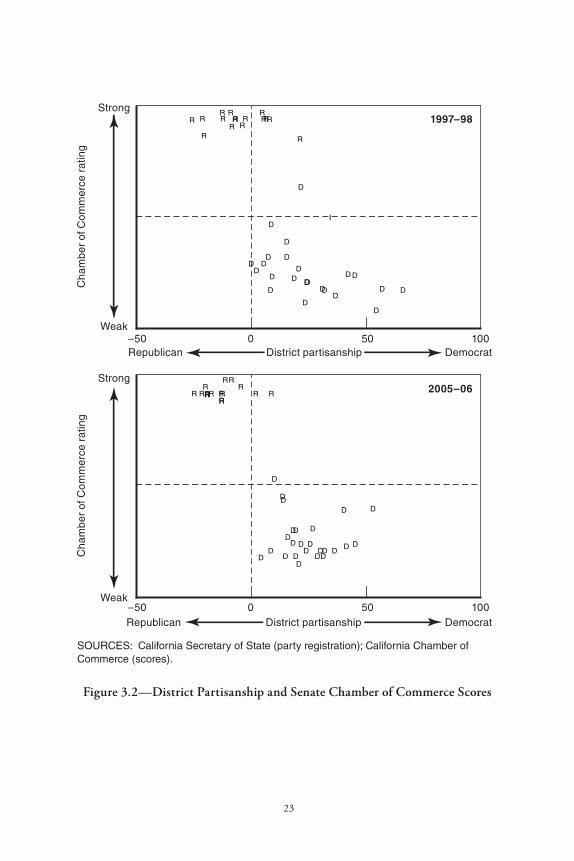
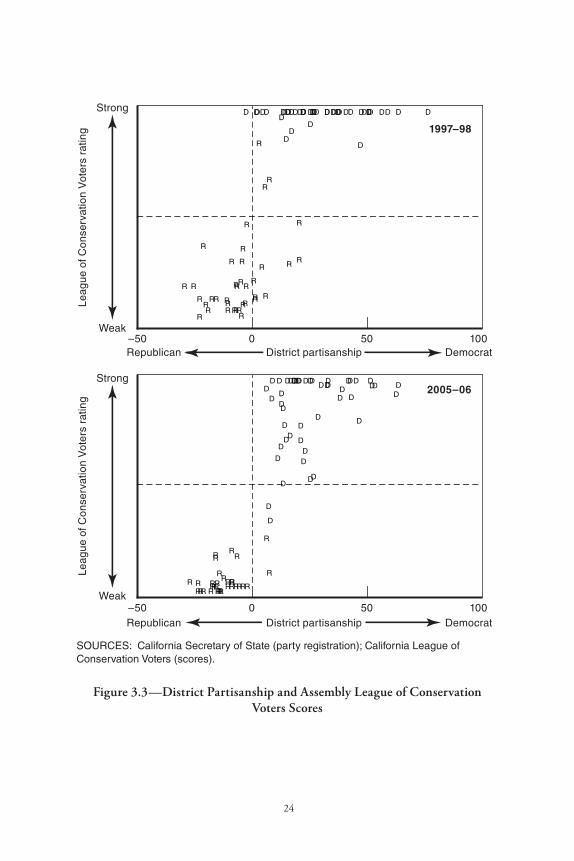
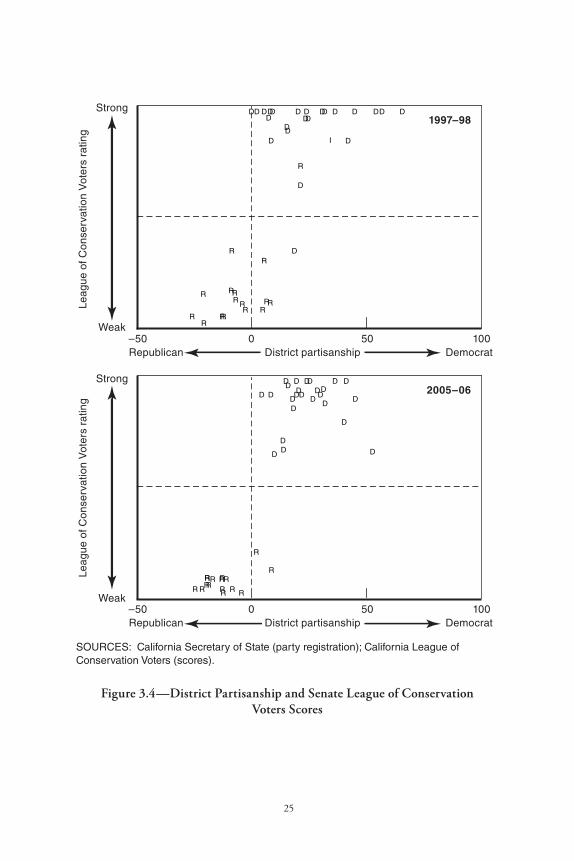
Scatter plots for these League of Conservation Voters scores in Figure 3.3 for the Assembly and in Figure 3.4 for the Senate show more evidence of district-delegate behavior than with the Chamber ratings, particularly for Assembly Republicans in 1997–98 and Assembly Democrats in 2005–06. Otherwise, the partisan model dominates, particularly in the Senate. More to the point, there is again no evidence that redistricting has made legislators consistently more partisan. Assembly Republicans do become markedly more partisan on these issues, but their Democratic colleagues are actually better delegates after the redistricting than before it.
23
SOURCES: California Secretary of State (party registration); California Chamber of Commerce (scores).
Strong
Weak
Cha
mbe
r of
Com
mer
ce r
atin
g
–50 500 100Republican DemocratDistrict partisanship
1997–98
Strong
Weak
Cha
mbe
r of
Com
mer
ce r
atin
g
–50 500 100Republican DemocratDistrict partisanship
2005–06
R
D
D
R
D D
R
I
D
DD
R
D
R
R
D
R
D
R
D
D
D
D
D D D
D D
R
D
R
D
RR
R RR
R
D
D
R
D
D
R
D
D
DD
D
DD
R
D
R R
D
RR R
D
D
D
DD
D
D
DD
R
D
R
D
R
D
RRR RR
D
D
Figure 3.2—District Partisanship and Senate Chamber of Commerce Scores
24
SOURCES: California Secretary of State (party registration); California League ofConservation Voters (scores).
Strong
Weak
Leag
ue o
f Con
serv
atio
n V
oter
s ra
ting
–50 500 100Republican DemocratDistrict partisanship
1997–98
Strong
Weak
Leag
ue o
f Con
serv
atio
n V
oter
s ra
ting
–50 500 100Republican DemocratDistrict partisanship
2005–06
R
R
R
D D
R
D
RRR
R
D
RR
D D
R
D
D
D
R
D D DD
R
D
R
D
R
R
DD D
R
R
D DD
R
R
D
R
D
R
DD
R
D
R
R
R
DD
RR
D
R
D
D
R
R
R
R
R
D DD D
R
R
D D D D DD D
R
D
R
DD
D
R
D D
R
R
DD
D
D
D
R
D
D
R
D
R
D
R
D
D
R
DD
R
R
D
R
RR
D
D
R
DD
RR
D D
R
DDD
D
D
RR
D
R
D
R
D
D
D
R
DD
D
D
R
R
D
R
DD
D
R R
D
R
DD
RR
D
R
D
Figure 3.3—District Partisanship and Assembly League of Conservation Voters Scores
25
SOURCES: California Secretary of State (party registration); California League ofConservation Voters (scores).
Strong
Weak
Leag
ue o
f Con
serv
atio
n V
oter
s ra
ting
–50 500 100Republican DemocratDistrict partisanship
1997–98
Strong
Weak
Leag
ue o
f Con
serv
atio
n V
oter
s ra
ting
–50 500 100Republican DemocratDistrict partisanship
2005–06
R
D D
R
DD
R
I
DD
D
R
D
R
R
D
R
D
R
DD DD
D D DD
D
R
D
R
D
RR
R
R
R
R
D
D
R
DD
R
D
D
D
DDD
D
R
D
R
R
D
RRR
DD
D
DD
D
D
D
D
R
D
R
D
R
D
RR
R RR
D
D
Figure 3.4—District Partisanship and Senate League of Conservation Voters Scores
26
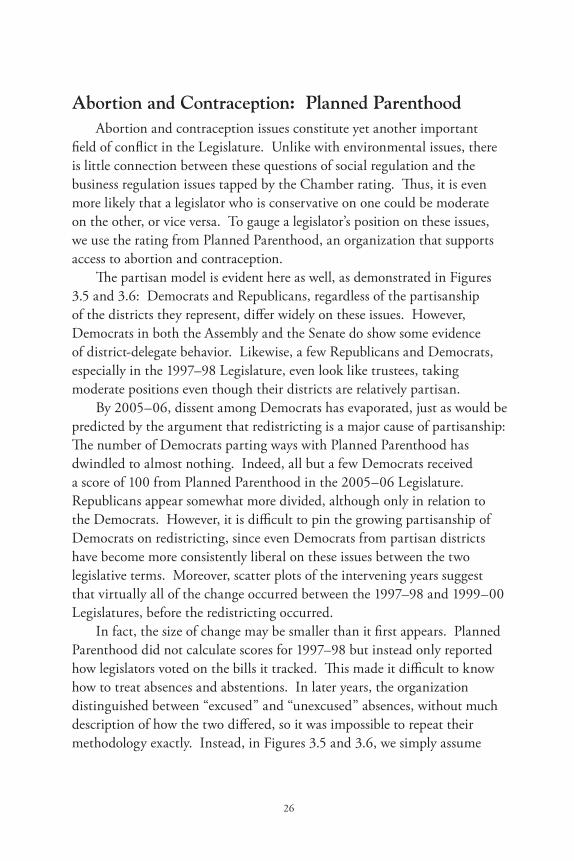
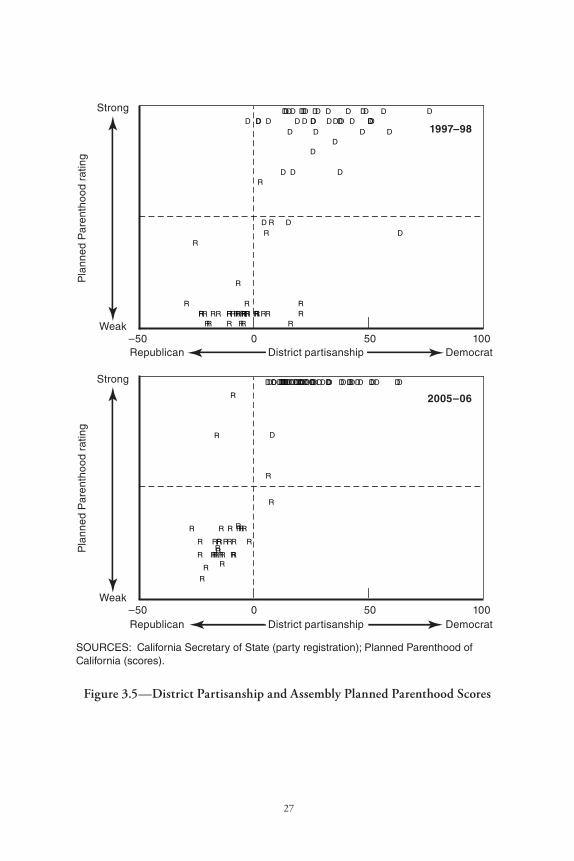
Abortion and Contraception: Planned ParenthoodAbortion and contraception issues constitute yet another important
field of conflict in the Legislature. Unlike with environmental issues, there is little connection between these questions of social regulation and the business regulation issues tapped by the Chamber rating. Thus, it is even more likely that a legislator who is conservative on one could be moderate on the other, or vice versa. To gauge a legislator’s position on these issues, we use the rating from Planned Parenthood, an organization that supports access to abortion and contraception.
The partisan model is evident here as well, as demonstrated in Figures 3.5 and 3.6: Democrats and Republicans, regardless of the partisanship of the districts they represent, differ widely on these issues. However, Democrats in both the Assembly and the Senate do show some evidence of district-delegate behavior. Likewise, a few Republicans and Democrats, especially in the 1997–98 Legislature, even look like trustees, taking moderate positions even though their districts are relatively partisan.
By 2005–06, dissent among Democrats has evaporated, just as would be predicted by the argument that redistricting is a major cause of partisanship: The number of Democrats parting ways with Planned Parenthood has dwindled to almost nothing. Indeed, all but a few Democrats received a score of 100 from Planned Parenthood in the 2005–06 Legislature. Republicans appear somewhat more divided, although only in relation to the Democrats. However, it is difficult to pin the growing partisanship of Democrats on redistricting, since even Democrats from partisan districts have become more consistently liberal on these issues between the two legislative terms. Moreover, scatter plots of the intervening years suggest that virtually all of the change occurred between the 1997–98 and 1999–00 Legislatures, before the redistricting occurred.
In fact, the size of change may be smaller than it first appears. Planned Parenthood did not calculate scores for 1997–98 but instead only reported how legislators voted on the bills it tracked. This made it difficult to know how to treat absences and abstentions. In later years, the organization distinguished between “excused” and “unexcused” absences, without much description of how the two differed, so it was impossible to repeat their methodology exactly. Instead, in Figures 3.5 and 3.6, we simply assume
27
SOURCES: California Secretary of State (party registration); Planned Parenthood of California (scores).
Strong
Weak
Pla
nned
Par
enth
ood
ratin
g
–50 500 100Republican DemocratDistrict partisanship
1997–98
Strong
Weak
Pla
nned
Par
enth
ood
ratin
g
–50 500 100Republican DemocratDistrict partisanship
2005–06
R RR
D D
R
D
R RR R
D
R
R
D
D
R
D
D
D
R
DD
DD
R
D
R
D
R
R
D
D D
RR
DD
D
R
R
D
R
D
R
D
D
R
D
R RR
D
D
RR
D
R
D
D
RRR
RR
D
DD
D
RR
D DD D
D
D D
R
D
R
D D D
R
D D
R
R
DD DDD
R
D D
R
D
R
D
R
DD
R
DD
R
R
D
R
R
R
DD
R
DD
R
R
D D
R
DDD DD
R
R
D
R
D
R
DDD
R
DD
D
D
R
R
D
R
DD D
R
R
D
R
D D
RR
D
R
D
Figure 3.5—District Partisanship and Assembly Planned Parenthood Scores
28
SOURCES: California Secretary of State (party registration); Planned Parenthood of California (scores).
Strong
Weak
Pla
nned
Par
enth
ood
ratin
g
–50 500 100Republican DemocratDistrict partisanship
1997–98
Strong
Weak
Pla
nned
Par
enth
ood
ratin
g
–50 500 100Republican DemocratDistrict partisanship
2005–06
R
D
D
R
D
D
R
I
DDD
R
D
R
R
D
R
D
R
DD
D
D
D D
D
D
D
R
D
R
D
R RR R RR
D
D
R
D D
R
D DD D DDD
R
D
R
R
D
R
R
R
D
D
DD D D DDD
R
D
R
D
R
D
RR
R
RR
D D
Figure 3.6—District Partisanship and Senate Planned Parenthood Scores
that all absences or abstentions in 1997–98 were unexcused and treated them as “no” votes on the underlying bill. By this measure, any legislator with a large number of “excused” absences would appear very disloyal.
29
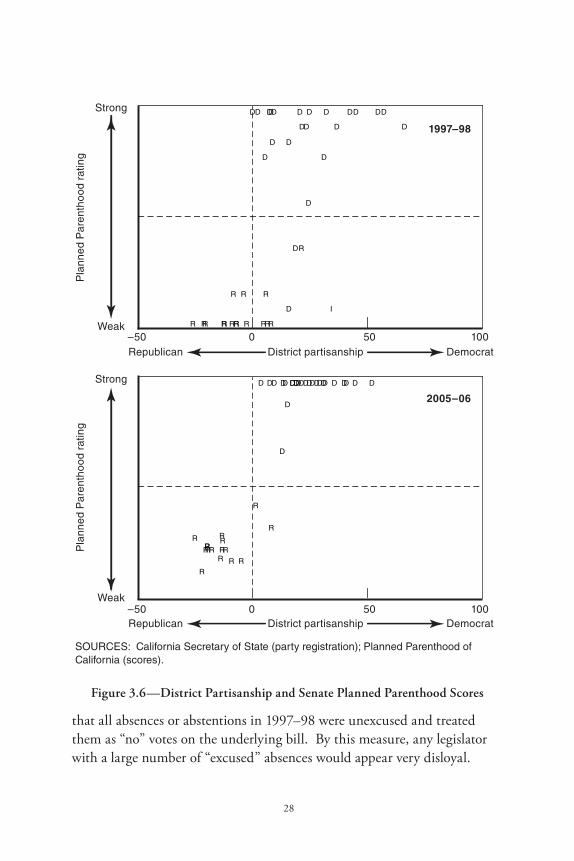
If instead all absences are treated as “excused” and omitted from the calculation—the opposite extreme—the voting patterns in 1997–98 and 2005–06 become almost identical (see Figure C.13 in the technical appendix; see p. xv for the web address of Appendix C). Thus, it is likely that at least some of the “change” in Figures 3.5 and 3.6 is a matter of definitions and nothing more.
General Party LoyaltyInterest group scores necessarily represent a small (albeit important)
subset of bills. Legislators can also be judged more broadly by party loyalty scores, a measure that has been used for decades by the Washington, D.C., journal Congressional Quarterly to evaluate the partisanship of members of Congress. The measure first identifies all votes that pit a majority of Democrats against a majority of Republicans. Then for each member, it calculates the percentage of these votes in which that member sided with his own party. The higher the loyalty score, the more likely it is that a member can be relied on to stand by his own party when it clearly differs with the opposition.
Figures 3.7 and 3.8 present this measure in 1997–98 and 2005–06. We have made only one change from the traditional party loyalty score. Instead of always measuring loyalty to one’s own party, the measure now captures loyalty to the Democratic Party in particular. This induces separation between the two parties and makes the scatter plots more comparable to the ones we have already seen, without affecting the substance of the analysis.
Among Republicans, we do see some signs in these graphs of district-delegate behavior in the 1997–98 Legislature. Republicans from the least partisan districts are themselves less partisan and closer to the Democratic position. In addition, and consistent with the redistricting reform argument, the few Republicans from mixed districts in 2005–06 are also disloyal to their party. The key difference is that there are fewer mixed districts than before.
By contrast, Democrats in the Assembly and the Senate in both years adopt a strictly partisan approach that is entirely consistent with the interest group ratings. This makes sense if we consider that the Democratic
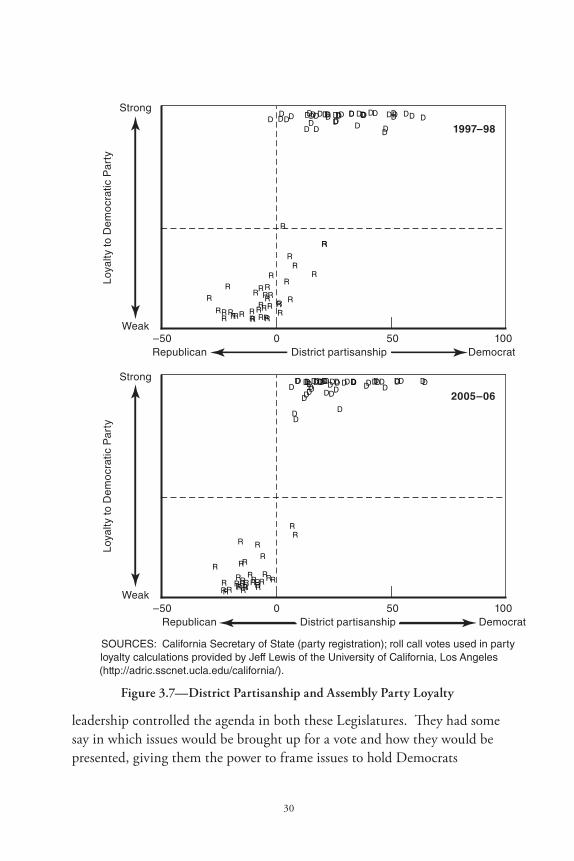
30
SOURCES: California Secretary of State (party registration); roll call votes used in party loyalty calculations provided by Jeff Lewis of the University of California, Los Angeles (http://adric.sscnet.ucla.edu/california/).
Strong
Weak
Loya
lty to
Dem
ocra
tic P
arty
–50 500 100Republican DemocratDistrict partisanship
1997–98
Strong
Weak
Loya
lty to
Dem
ocra
tic P
arty
–50 500 100Republican DemocratDistrict partisanship
2005–06
R
R
R
D D
R
D
R
R
R
R
D
RR
D D
R
D
D D
R
D D DD
R
D
R
D
R R
D
D D
R
R
D DD
R
R
D
R
D
R
DD
R
D
R
R
R
DD
RR
D
R
DD
R
R
R
R
R
DDD D
R
R
D D D D DD D
R
R
D D
D
R
D D
R
R
D
D
D
D
D
R
DD
R
D
R
D
R
DD
R
DD
R
R
D
R
RR
DD
R
DD
RR
D D
R
DDD
D
D
RR
D
R
D
R
DDD
R
DD
D
D
R
R
D
R
DD D
R
R
D
R
D
D
RR
D
R
D
Figure 3.7—District Partisanship and Assembly Party Loyalty
leadership controlled the agenda in both these Legislatures. They had some say in which issues would be brought up for a vote and how they would be presented, giving them the power to frame issues to hold Democrats
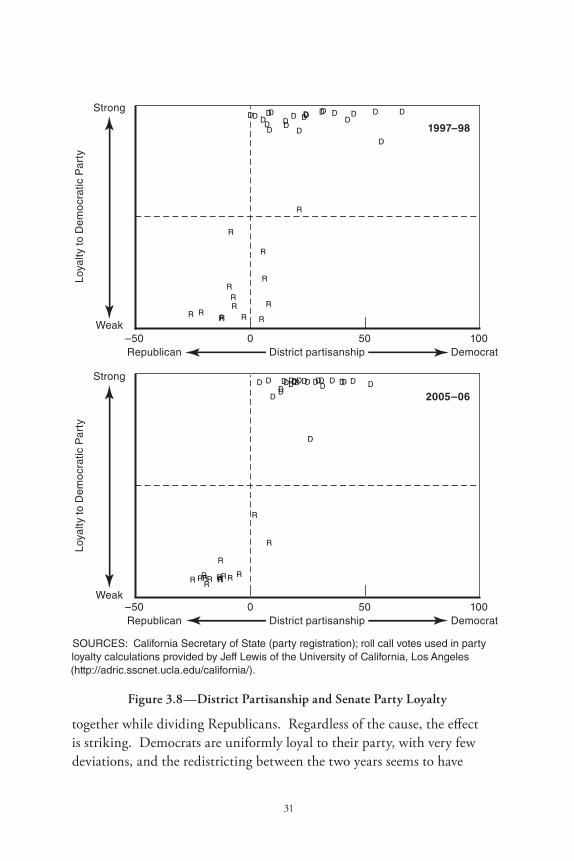
31
SOURCES: California Secretary of State (party registration); roll call votes used in party loyalty calculations provided by Jeff Lewis of the University of California, Los Angeles (http://adric.sscnet.ucla.edu/california/).
Strong
Weak
Loya
lty to
Dem
ocra
tic P
arty
–50 500 100Republican DemocratDistrict partisanship
1997–98
Strong
Weak
Loya
lty to
Dem
ocra
tic P
arty
–50 500 100Republican DemocratDistrict partisanship
2005–06
R
DD
D
D
D
R
D
D
D
R
DD
R
DD
R
D
R
R
R
DD
D
D
R
R
RR
DD D
R
D
R
D
R
D D
R
D
DDD
D
D
D
R
D
R
R
D
RR R
DD DD D D DDD
R
D
R
D
R
D
RR RR
DD
Figure 3.8—District Partisanship and Senate Party Loyalty
together while dividing Republicans. Regardless of the cause, the effect is striking. Democrats are uniformly loyal to their party, with very few deviations, and the redistricting between the two years seems to have
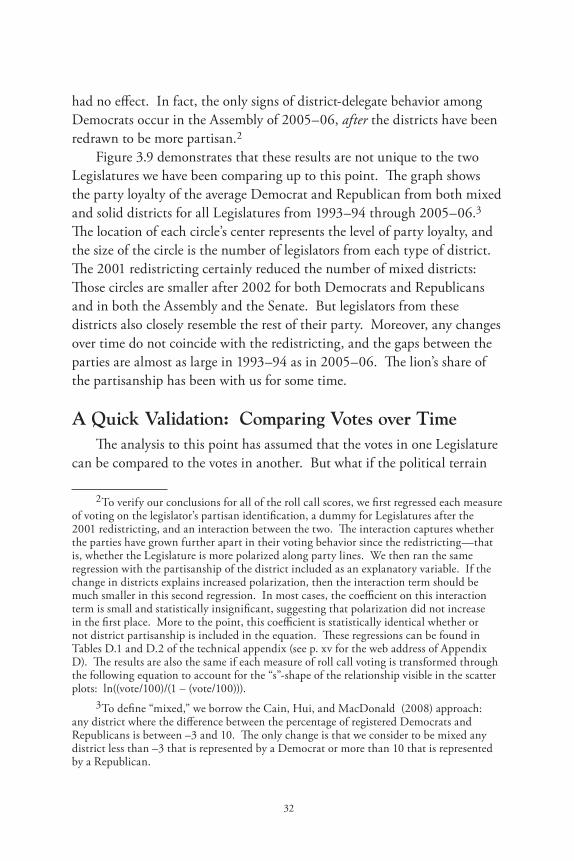
32
had no effect. In fact, the only signs of district-delegate behavior among Democrats occur in the Assembly of 2005–06, after the districts have been redrawn to be more partisan.2
Figure 3.9 demonstrates that these results are not unique to the two Legislatures we have been comparing up to this point. The graph shows the party loyalty of the average Democrat and Republican from both mixed and solid districts for all Legislatures from 1993–94 through 2005–06.3 The location of each circle’s center represents the level of party loyalty, and the size of the circle is the number of legislators from each type of district. The 2001 redistricting certainly reduced the number of mixed districts: Those circles are smaller after 2002 for both Democrats and Republicans and in both the Assembly and the Senate. But legislators from these districts also closely resemble the rest of their party. Moreover, any changes over time do not coincide with the redistricting, and the gaps between the parties are almost as large in 1993–94 as in 2005–06. The lion’s share of the partisanship has been with us for some time.
A Quick Validation: Comparing Votes over TimeThe analysis to this point has assumed that the votes in one Legislature
can be compared to the votes in another. But what if the political terrain
2 To verify our conclusions for all of the roll call scores, we first regressed each measure of voting on the legislator’s partisan identification, a dummy for Legislatures after the 2001 redistricting, and an interaction between the two. The interaction captures whether the parties have grown further apart in their voting behavior since the redistricting—that is, whether the Legislature is more polarized along party lines. We then ran the same regression with the partisanship of the district included as an explanatory variable. If the change in districts explains increased polarization, then the interaction term should be much smaller in this second regression. In most cases, the coefficient on this interaction term is small and statistically insignificant, suggesting that polarization did not increase in the first place. More to the point, this coefficient is statistically identical whether or not district partisanship is included in the equation. These regressions can be found in Tables D.1 and D.2 of the technical appendix (see p. xv for the web address of Appendix D). The results are also the same if each measure of roll call voting is transformed through the following equation to account for the “s”-shape of the relationship visible in the scatter plots: ln((vote/100)/(1 – (vote/100))).
3 To define “mixed,” we borrow the Cain, Hui, and MacDonald (2008) approach: any district where the difference between the percentage of registered Democrats and Republicans is between –3 and 10. The only change is that we consider to be mixed any district less than –3 that is represented by a Democrat or more than 10 that is represented by a Republican.
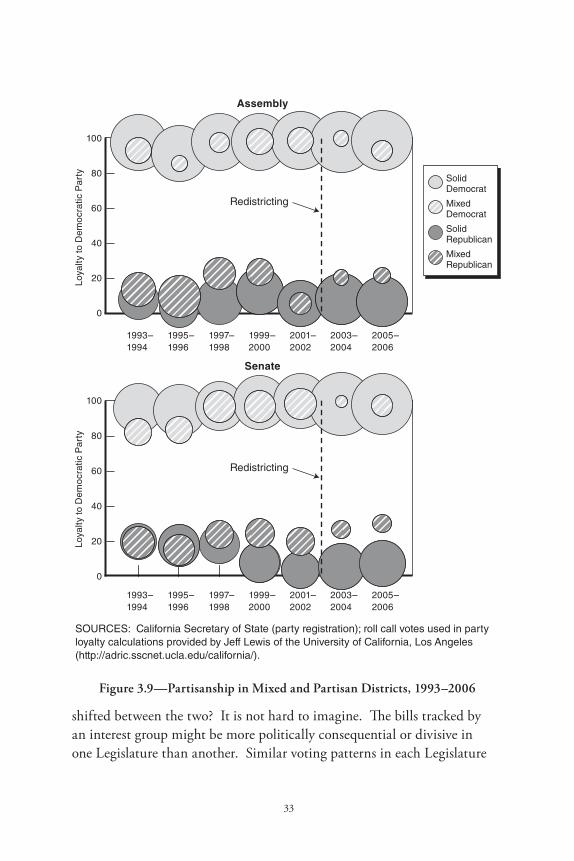
33
SOURCES: California Secretary of State (party registration); roll call votes used in party loyalty calculations provided by Jeff Lewis of the University of California, Los Angeles (http://adric.sscnet.ucla.edu/california/).
60
40
20
80
100
Loya
lty to
Dem
ocr
atic
Par
ty
0
2003–2004
2001–2002
1999–2000
1997–1998
1995–1996
1993–1994
2005–2006
60
40
20
80
100
Loya
lty to
Dem
ocr
atic
Par
ty
Assembly
Senate
0
2003–2004
2001–2002
1999–2000
1997–1998
1995–1996
1993–1994
2005–2006
Redistricting
Redistricting
SolidDemocrat
MixedDemocrat
SolidRepublican
MixedRepublican
Figure 3.9—Partisanship in Mixed and Partisan Districts, 1993–2006
shifted between the two? It is not hard to imagine. The bills tracked by an interest group might be more politically consequential or divisive in one Legislature than another. Similar voting patterns in each Legislature
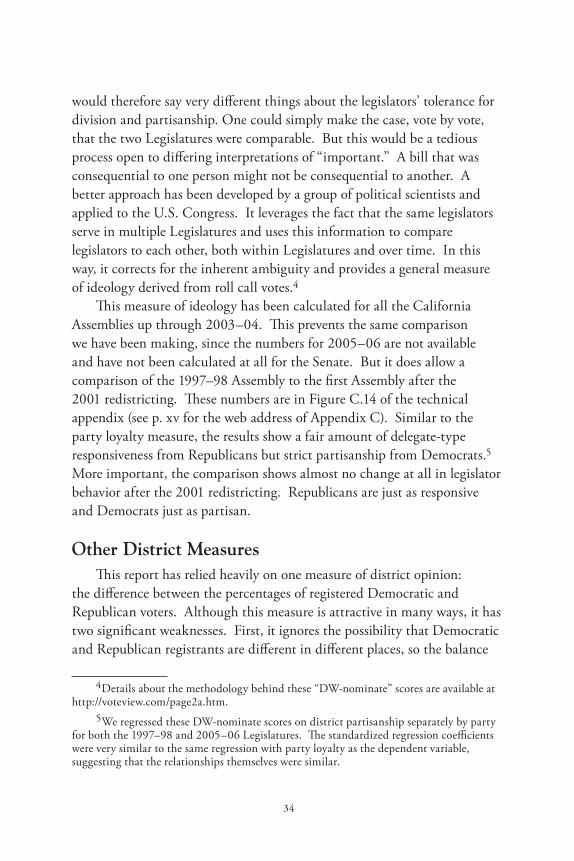
34
would therefore say very different things about the legislators’ tolerance for division and partisanship. One could simply make the case, vote by vote, that the two Legislatures were comparable. But this would be a tedious process open to differing interpretations of “important.” A bill that was consequential to one person might not be consequential to another. A better approach has been developed by a group of political scientists and applied to the U.S. Congress. It leverages the fact that the same legislators serve in multiple Legislatures and uses this information to compare legislators to each other, both within Legislatures and over time. In this way, it corrects for the inherent ambiguity and provides a general measure of ideology derived from roll call votes.4
This measure of ideology has been calculated for all the California Assemblies up through 2003–04. This prevents the same comparison we have been making, since the numbers for 2005–06 are not available and have not been calculated at all for the Senate. But it does allow a comparison of the 1997–98 Assembly to the first Assembly after the 2001 redistricting. These numbers are in Figure C.14 of the technical appendix (see p. xv for the web address of Appendix C). Similar to the party loyalty measure, the results show a fair amount of delegate-type responsiveness from Republicans but strict partisanship from Democrats.5 More important, the comparison shows almost no change at all in legislator behavior after the 2001 redistricting. Republicans are just as responsive and Democrats just as partisan.
Other District MeasuresThis report has relied heavily on one measure of district opinion:
the difference between the percentages of registered Democratic and Republican voters. Although this measure is attractive in many ways, it has two significant weaknesses. First, it ignores the possibility that Democratic and Republican registrants are different in different places, so the balance
4 Details about the methodology behind these “DW-nominate” scores are available at http://voteview.com/page2a.htm.
5 We regressed these DW-nominate scores on district partisanship separately by party for both the 1997–98 and 2005–06 Legislatures. The standardized regression coefficients were very similar to the same regression with party loyalty as the dependent variable, suggesting that the relationships themselves were similar.
35
of registered voters may not reflect the way voters actually cast their ballots. In one district, Democrats may be more conservative; in another, Republicans may be more liberal. Second, independents—known as “decline-to-state” in California—are the fastest-growing category of voters.6 Districts with large numbers of decline-to-state voters might encourage legislators to be more moderate. The balance of registered partisans ignores this possible dynamic.
To explore these ideas, we ran the party loyalty scatter plots from Figures 3.7 and 3.8 with (1) the average of a district’s Democratic percentage of the vote for president and governor in adjacent election cycles7 and (2) the percentage of voters in the district who registered as decline-to-state. The results are in Figures C.15 through C.18 in the technical appendix (see p. xv for the web address of Appendix C); they leave the conclusions of the report unchanged. The presidential-gubernatorial measure produces the same patterns of moderation and change over time that we have seen earlier. Moreover, there is essentially no relationship between decline-to-state registration and voting patterns. If anything, moderate legislators are more common in districts with fewer decline-to-state registrants (although the relationship is very weak).
But what about elections? It may be that the political tendencies of a legislator’s district—which is what we have been measuring—are less important than the legislator’s performance in his or her own race. Those who have recently faced a tough fight, regardless of their district’s competitiveness on paper, might be more inclined to moderate their behavior in the Legislature. Since mixed districts are more likely to be competitive, this sort of relationship might still preserve some connection between redistricting and legislative behavior.
To capture this idea, we generated scatter plots of each legislator’s overall party loyalty against the Democratic share of the two-party vote in that legislator’s last election for office. The results (presented in Figures C.19 and C.20 of the technical appendix; see p. xv for the web
6 See Baldassare (2008). 7 For the two Legislatures considered here, the presidential vote came from the last
election, and the gubernatorial vote came from the next one. For example, for the 1997–98 Legislature, the presidential vote came from 1996 and the gubernatorial vote came from 1998.
36
address of Appendix C) confirm the conclusions of the report: Even most legislators who have waged a tough fight to claim their seat remain highly partisan, and a legislator’s party label is easily the most important factor in explaining voting behavior overall. In fact, a regression that pits the legislator’s own electoral performance against his or her party identification and the partisanship of his or her district suggests that electoral performance is the least influential of the three in explaining roll call voting.8
Estimating Maximum EffectsThere have been about as many moderates in the years since the 2001
redistricting as there were in the years before it. Yet moderates in the late 1990s were still more common in mixed districts than solid ones. What if the redistricting pushed these moderates toward partisanship, but some other factor thus far unidentified pushed them back at the same time? The redistricting might then appear to have no effect, even though a future redistricting, in the absence of this unidentified factor, could have a substantial impact.
To give as much credit as possible to this idea, we simulated the effect of the 2001 redistricting based only on the circumstances of the late 1990s. First, we calculated the relationship between district partisanship and moderation in the last three Legislatures of the 1990s. This relationship was then used to predict how many of the moderates from these three Legislatures should have become partisans under the new set of districts.9 Since these estimates are derived only from the dynamics of the 1990s, any unidentified factor that might have led legislators back toward moderation would be neutralized.
Our measure of moderation is relative. For each of the four roll call voting scores—Chamber of Commerce, League of Conservation Voters, Planned Parenthood, and overall party loyalty—we classify legislators as “moderate” if they are further from the liberal side of the score for
8 These regressions are in Table D.3 of the technical appendix. See p. xv for the web address of Appendix D.
9 Further details of this process can be found in technical Appendix B. See p. xv for the web address of Appendix B.
37
Democrats and the conservative side for Republicans than 75 percent of the rest of their party’s caucus.10 We also identify what we call “multiple-issue” moderates: those who are moderate on at least three of the four roll call measures. It is important to keep the relativity of these measures in mind. A moderate might still be very partisan if his or her party caucus is also highly partisan. A legislator need only be less partisan than 75 percent of his or her fellow Republicans or Democrats. The measure serves as a rough indicator of the best targets for defection in each party’s caucus. These members should be more likely to join the opposition, even if they are not likely to do so in most cases.
The results of this exercise can be found in Table 3.1. The differences between the “actual” numbers in column one and the “hypothetical” numbers in column two do suggest that we should expect fewer moderates based solely on the relationship between district partisanship and moderation in these three Legislatures. But the changes are small. The largest shift is a loss of four Assembly moderates on League of Conservation Voters issues, for an average of about one moderate per Legislature. Thus, even when we give the redistricting as much credit as possible, the effect on voting behavior is weak.
SummaryOn every dimension—economic, environmental, social, and overall
party loyalty—there is little evidence that the 2001 redistricting had an effect on the partisanship of the Legislature. In fact, in several cases, legislators behaved more like district delegates after the new lines were drawn, when their districts were supposed to have pulled them out to the
10 For the League of Conservation Voters, Planned Parenthood, and overall party loyalty scores, Democrats with lower scores and Republicans with higher scores were more moderate. The Chamber of Commerce scores were the opposite: Democrats with higher scores and Republicans with lower scores were more moderate. Because of “lumpiness” in these data where legislators share the same score, the total number of moderates is not exactly one-quarter of the total number of legislators. In cases where there was no meaningful variation in scores among a party caucus, we defined all legislators as partisans. In the Assembly, this was true for Democrats on Planned Parenthood issues in 2001–02, 2003–04, and 2005–06 and on League of Conservation issues in 1997–98. In the Senate, it was true for Republicans on Chamber of Commerce issues in 2003–04 and for Democrats on Planned Parenthood issues in 2001–02, 2003–04, and 2005–06 and on League of Conservation issues in 1999–00.
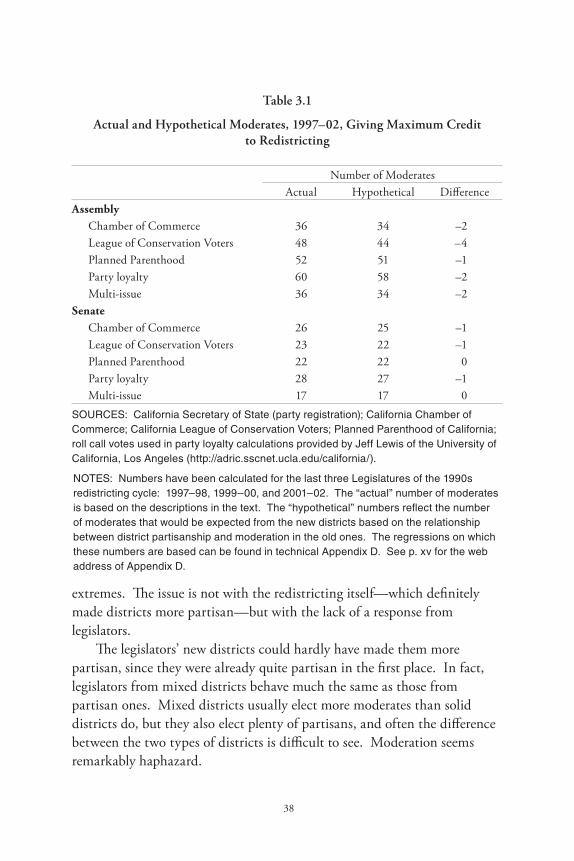
38
Table 3.1
Actual and Hypothetical Moderates, 1997–02, Giving Maximum Credit to Redistricting
Number of ModeratesActual Hypothetical Difference
AssemblyChamber of Commerce 36 34 –2League of Conservation Voters 48 44 –4Planned Parenthood 52 51 –1Party loyalty 60 58 –2Multi-issue 36 34 –2
SenateChamber of Commerce 26 25 –1League of Conservation Voters 23 22 –1Planned Parenthood 22 22 0Party loyalty 28 27 –1Multi-issue 17 17 0
SOURCES: California Secretary of State (party registration); California Chamber of Commerce; California League of Conservation Voters; Planned Parenthood of California; roll call votes used in party loyalty calculations provided by Jeff Lewis of the University of California, Los Angeles (http://adric.sscnet.ucla.edu/california/).
NOTES: Numbers have been calculated for the last three Legislatures of the 1990s redistricting cycle: 1997–98, 1999–00, and 2001–02. The “actual” number of moderates is based on the descriptions in the text. The “hypothetical” numbers reflect the number of moderates that would be expected from the new districts based on the relationship between district partisanship and moderation in the old ones. The regressions on which these numbers are based can be found in technical Appendix D. See p. xv for the web address of Appendix D.
extremes. The issue is not with the redistricting itself—which definitely made districts more partisan—but with the lack of a response from legislators.
The legislators’ new districts could hardly have made them more partisan, since they were already quite partisan in the first place. In fact, legislators from mixed districts behave much the same as those from partisan ones. Mixed districts usually elect more moderates than solid districts do, but they also elect plenty of partisans, and often the difference between the two types of districts is difficult to see. Moderation seems remarkably haphazard.
39
The results here strongly suggest that redistricting reform would not have much effect on the partisanship of the Legislature. Yet the redistricting might have had a more subtle influence on individual legislators, one that is difficult to identify when looking at larger patterns. The next chapter explores this idea by tracking individual legislators and districts, both over time and across issues.

41
4. Tracking Individual Legislators
The analysis in Chapter 3 demonstrated that there has been little change in the overall pattern of votes in the Legislature as a result of the 2001 redistricting. Legislators appear to be about as partisan now as they were in the late 1990s, and mixed districts—which ought to pressure representatives toward moderation—often elect politicians who are as partisan as anyone in the Legislature.
It is very difficult from this evidence to claim that the redistricting had a significant effect on legislative behavior. However, these overall patterns might obscure effects at the margins. Legislators might have been highly partisan before the redistricting, but their new districts might have made them still more partisan than they had been before. This phenomenon could manifest itself in several ways:
Legislators might have adjusted their behavior over time to match •their new—and more partisan—districts.Even if existing legislators continued to vote as they had before, •new legislators elected after the redistricting might have been more likely to match the characteristics of their districts. In this way, the Legislature could gradually become more partisan over time as old legislators are replaced with new ones.Legislators who are not moderate on one dimension might be •moderate on another, allowing for more responsiveness to their districts.
This chapter examines each possibility in turn. The results suggest that none is a very good description of legislator behavior over the last 10 years. Legislators did not respond to their changing districts, new legislators were generally as responsive as sitting legislators to their districts, and legislators who were moderate on one dimension tended to be moderate on others as well. This evidence points toward moderation as a choice: something legislators largely select for personal reasons and then stand by throughout their legislative careers. The only exception is that legislators who have experienced a competitive election in the recent past are somewhat more
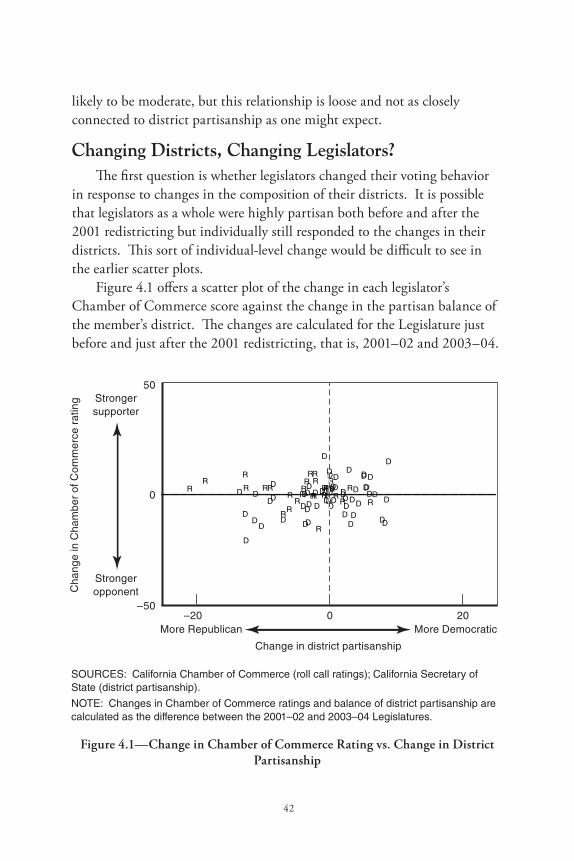
42
likely to be moderate, but this relationship is loose and not as closely connected to district partisanship as one might expect.
Changing Districts, Changing Legislators?The first question is whether legislators changed their voting behavior
in response to changes in the composition of their districts. It is possible that legislators as a whole were highly partisan both before and after the 2001 redistricting but individually still responded to the changes in their districts. This sort of individual-level change would be difficult to see in the earlier scatter plots.
Figure 4.1 offers a scatter plot of the change in each legislator’s Chamber of Commerce score against the change in the partisan balance of the member’s district. The changes are calculated for the Legislature just before and just after the 2001 redistricting, that is, 2001–02 and 2003–04.
R
RD D
RR
RR D
R DR
D
D
DD
D
DR
D
DD
R
R
D
DD
D
D
D
DDDR
R R
D D
R
D
DR
D
DR R
D
DD
D
R
R
RD
RR
RR D
D
DD
R
D
DR
DDR
DR
D
D
D
DD
DD
D
R
D
DD
D
D
DR
SOURCES: California Chamber of Commerce (roll call ratings); California Secretary of State (district partisanship).
NOTE: Changes in Chamber of Commerce ratings and balance of district partisanship are calculated as the difference between the 2001–02 and 2003–04 Legislatures.
Strongersupporter
StrongeropponentC
hang
e in
Cha
mbe
r of
Com
mer
ce r
atin
g
–20
50
0
–50200
More Republican More Democratic
Change in district partisanship
Figure 4.1—Change in Chamber of Commerce Rating vs. Change in District Partisanship
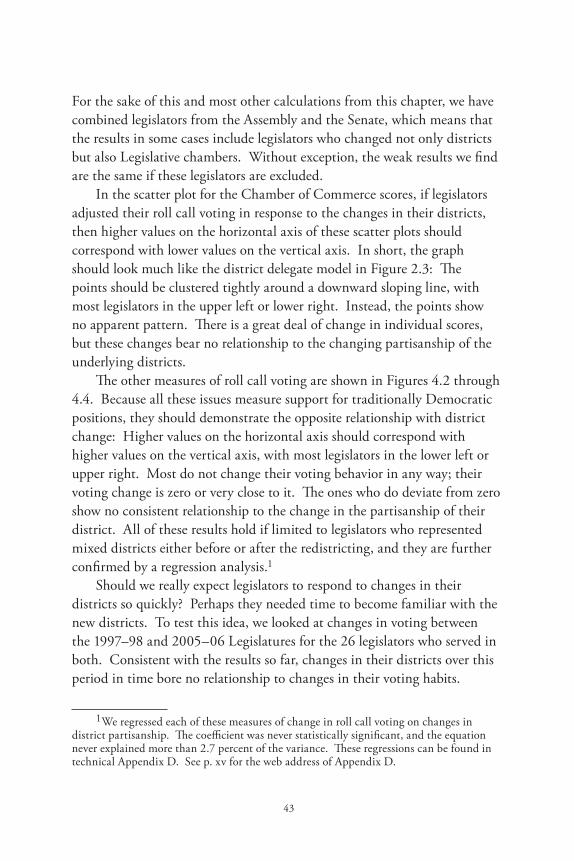
43
For the sake of this and most other calculations from this chapter, we have combined legislators from the Assembly and the Senate, which means that the results in some cases include legislators who changed not only districts but also Legislative chambers. Without exception, the weak results we find are the same if these legislators are excluded.
In the scatter plot for the Chamber of Commerce scores, if legislators adjusted their roll call voting in response to the changes in their districts, then higher values on the horizontal axis of these scatter plots should correspond with lower values on the vertical axis. In short, the graph should look much like the district delegate model in Figure 2.3: The points should be clustered tightly around a downward sloping line, with most legislators in the upper left or lower right. Instead, the points show no apparent pattern. There is a great deal of change in individual scores, but these changes bear no relationship to the changing partisanship of the underlying districts.
The other measures of roll call voting are shown in Figures 4.2 through 4.4. Because all these issues measure support for traditionally Democratic positions, they should demonstrate the opposite relationship with district change: Higher values on the horizontal axis should correspond with higher values on the vertical axis, with most legislators in the lower left or upper right. Most do not change their voting behavior in any way; their voting change is zero or very close to it. The ones who do deviate from zero show no consistent relationship to the change in the partisanship of their district. All of these results hold if limited to legislators who represented mixed districts either before or after the redistricting, and they are further confirmed by a regression analysis.1
Should we really expect legislators to respond to changes in their districts so quickly? Perhaps they needed time to become familiar with the new districts. To test this idea, we looked at changes in voting between the 1997–98 and 2005–06 Legislatures for the 26 legislators who served in both. Consistent with the results so far, changes in their districts over this period in time bore no relationship to changes in their voting habits.
1 We regressed each of these measures of change in roll call voting on changes in district partisanship. The coefficient was never statistically significant, and the equation never explained more than 2.7 percent of the variance. These regressions can be found in technical Appendix D. See p. xv for the web address of Appendix D.
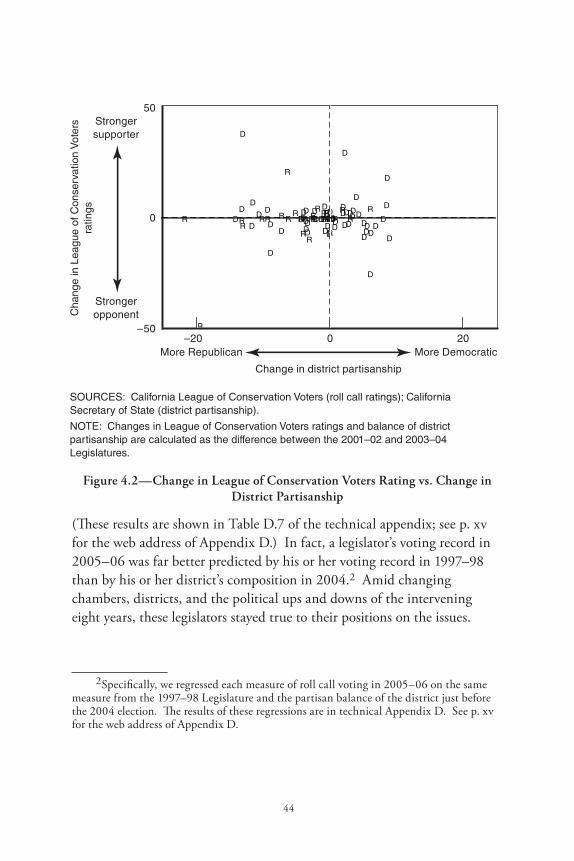
44
RRD
D
RRR
RD
R DR
DD
D
DDD
R
D
DD
RRD
DDD
DD
D
DD
RR RD
DR
D
D
RDD
RR
D
D
D
DR
R
R DR
R
RR
D
DD
D
RD
D
R DD
R
D
R
D
D
D
DD
DD DR D
D
D
D
D
DR
SOURCES: California League of Conservation Voters (roll call ratings); California Secretary of State (district partisanship).
NOTE: Changes in League of Conservation Voters ratings and balance of district partisanship are calculated as the difference between the 2001–02 and 2003–04 Legislatures.
Strongersupporter
StrongeropponentC
hang
e in
Lea
gue
of C
onse
rvat
ion
Vot
ers
ratin
gs
–20
50
0
–50200
More Republican More Democratic
Change in district partisanship
Figure 4.2—Change in League of Conservation Voters Rating vs. Change in District Partisanship
(These results are shown in Table D.7 of the technical appendix; see p. xv for the web address of Appendix D.) In fact, a legislator’s voting record in 2005–06 was far better predicted by his or her voting record in 1997–98 than by his or her district’s composition in 2004.2 Amid changing chambers, districts, and the political ups and downs of the intervening eight years, these legislators stayed true to their positions on the issues.
2 Specifically, we regressed each measure of roll call voting in 2005–06 on the same measure from the 1997–98 Legislature and the partisan balance of the district just before the 2004 election. The results of these regressions are in technical Appendix D. See p. xv for the web address of Appendix D.
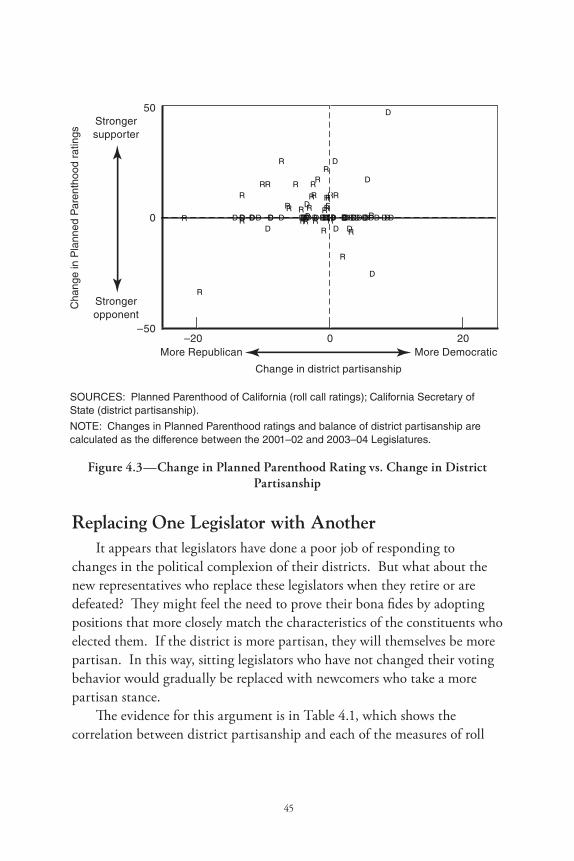
45
R
R
D D
R
R
R
RD
RD
R
DD
D
DDD
R
DDD
R
RD DDD DD
D
DD
R
R
RD
DR DD
R
DD
R
R
DDD D
R
R
RD
R
R
R
R
D DD DRD DR DD
R
D
R
D D
D
DD
D
D D
R
DD
D
D D D
R
SOURCES: Planned Parenthood of California (roll call ratings); California Secretary of State (district partisanship).
NOTE: Changes in Planned Parenthood ratings and balance of district partisanship are calculated as the difference between the 2001–02 and 2003–04 Legislatures.
Strongersupporter
Strongeropponent
Cha
nge
in P
lann
ed P
aren
thoo
d ra
tings
–20
50
0
–50200
More Republican More Democratic
Change in district partisanship
Figure 4.3—Change in Planned Parenthood Rating vs. Change in District Partisanship
Replacing One Legislator with AnotherIt appears that legislators have done a poor job of responding to
changes in the political complexion of their districts. But what about the new representatives who replace these legislators when they retire or are defeated? They might feel the need to prove their bona fides by adopting positions that more closely match the characteristics of the constituents who elected them. If the district is more partisan, they will themselves be more partisan. In this way, sitting legislators who have not changed their voting behavior would gradually be replaced with newcomers who take a more partisan stance.
The evidence for this argument is in Table 4.1, which shows the correlation between district partisanship and each of the measures of roll
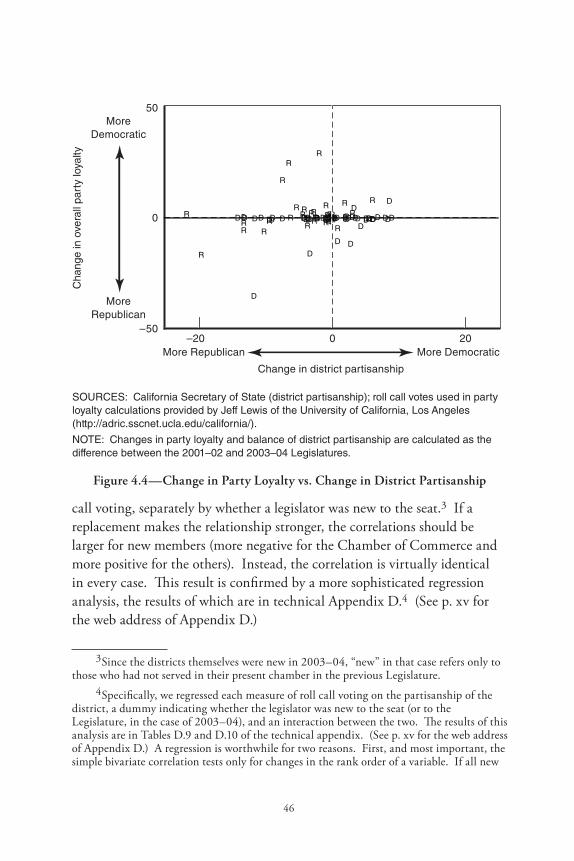
46
RRD DR
R
R
RD
R DR
D
D DD DD R DD
D
R
R
D
D
D
D
DD
D
DD
R
RR
D DR DDR
DDR
R DDD D
R
R
R
D
R
R
RR
D DD DRD DR DD R D
R
D D D DD DD DR DD DD D D
R
SOURCES: California Secretary of State (district partisanship); roll call votes used in party loyalty calculations provided by Jeff Lewis of the University of California, Los Angeles (http://adric.sscnet.ucla.edu/california/).
NOTE: Changes in party loyalty and balance of district partisanship are calculated as the difference between the 2001–02 and 2003–04 Legislatures.
MoreDemocratic
MoreRepublican
Cha
nge
in o
vera
ll pa
rty
loya
lty
–20
50
0
–50200
More Republican More Democratic
Change in district partisanship
Figure 4.4—Change in Party Loyalty vs. Change in District Partisanship
call voting, separately by whether a legislator was new to the seat.3 If a replacement makes the relationship stronger, the correlations should be larger for new members (more negative for the Chamber of Commerce and more positive for the others). Instead, the correlation is virtually identical in every case. This result is confirmed by a more sophisticated regression analysis, the results of which are in technical Appendix D.4 (See p. xv for the web address of Appendix D.)
3 Since the districts themselves were new in 2003–04, “new” in that case refers only to those who had not served in their present chamber in the previous Legislature.
4 Specifically, we regressed each measure of roll call voting on the partisanship of the district, a dummy indicating whether the legislator was new to the seat (or to the Legislature, in the case of 2003–04), and an interaction between the two. The results of this analysis are in Tables D.9 and D.10 of the technical appendix. (See p. xv for the web address of Appendix D.) A regression is worthwhile for two reasons. First, and most important, the simple bivariate correlation tests only for changes in the rank order of a variable. If all new
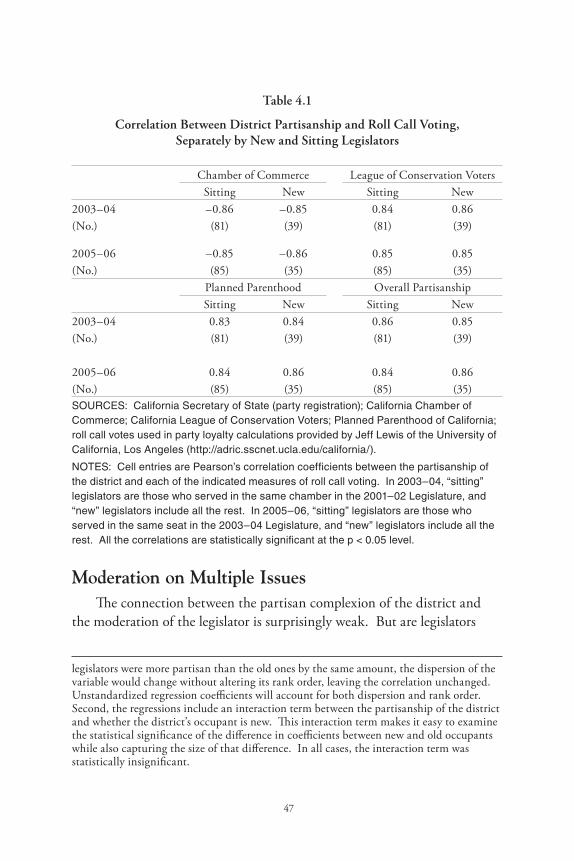
47
Table 4.1
Correlation Between District Partisanship and Roll Call Voting, Separately by New and Sitting Legislators
Chamber of Commerce League of Conservation VotersSitting New Sitting New
2003–04 –0.86 –0.85 0.84 0.86(No.) (81) (39) (81) (39)
2005–06 –0.85 –0.86 0.85 0.85(No.) (85) (35) (85) (35)
Planned Parenthood Overall PartisanshipSitting New Sitting New
2003–04 0.83 0.84 0.86 0.85(No.) (81) (39) (81) (39)
2005–06 0.84 0.86 0.84 0.86(No.) (85) (35) (85) (35)SOURCES: California Secretary of State (party registration); California Chamber of Commerce; California League of Conservation Voters; Planned Parenthood of California; roll call votes used in party loyalty calculations provided by Jeff Lewis of the University of California, Los Angeles (http://adric.sscnet.ucla.edu/california/).
NOTES: Cell entries are Pearson’s correlation coefficients between the partisanship of the district and each of the indicated measures of roll call voting. In 2003–04, “sitting” legislators are those who served in the same chamber in the 2001–02 Legislature, and “new” legislators include all the rest. In 2005–06, “sitting” legislators are those who served in the same seat in the 2003–04 Legislature, and “new” legislators include all the rest. All the correlations are statistically significant at the p < 0.05 level.
Moderation on Multiple IssuesThe connection between the partisan complexion of the district and
the moderation of the legislator is surprisingly weak. But are legislators
legislators were more partisan than the old ones by the same amount, the dispersion of the variable would change without altering its rank order, leaving the correlation unchanged. Unstandardized regression coefficients will account for both dispersion and rank order. Second, the regressions include an interaction term between the partisanship of the district and whether the district’s occupant is new. This interaction term makes it easy to examine the statistical significance of the difference in coefficients between new and old occupants while also capturing the size of that difference. In all cases, the interaction term was statistically insignificant.
48
from mixed districts more likely to be moderate on at least one issue? They might be lukewarm delegates, choosing one or two issues on which to be moderate and then voting reliably partisan on all others. Although this is hardly the district delegate ideal, it might still produce a loose connection between mixed districts and roll call votes.
Tables 4.2 and 4.3 look at moderation among the lawmakers from mixed districts in the 1997–98 and 2005–06 Legislatures.5 “Moderation” is defined the same way as in Chapter 3: legislators who are more moderate than 75 percent of the rest of their party caucus. If legislators respond to their districts by picking one or two issues on which to be moderate, then the xs should be scattered haphazardly around the table: Moderation on one dimension should not predict moderation on others. Instead, the tables are remarkably empty: 19 of the 39 legislators in Tables 4.2 and 4.3 are not moderate on anything. At the same time, if a legislator is moderate on one score, he or she is often moderate on the rest as well. In Chapter 3, we defined multiple-issue moderation as moderation on at least three of these dimensions of roll call voting. Of the 20 legislators who score moderate at least once, 12 are multiple-issue moderates.
Multiple-issue moderates are not limited to mixed districts: 72 percent came from partisan districts in the Legislatures from 1997–98 through 2005–06, compared to 86 percent of partisan legislators who came from partisan districts. In fact, moderates do not usually follow moderates in the same district (Table 4.4).6 When a moderate either retires or is defeated for reelection, he or she is replaced by a moderate just 26 percent of the time, compared to 89 percent of partisans who are replaced by other partisans. And while partisans are more likely to be replaced by moderates in mixed districts (31% versus 7%), moderates replace moderates at the same rate regardless of whether the district is mixed or solid.
5 “Mixed” is defined the same way as in Figure 3.9: a balance of 3 percent Republican to 10 percent Democratic.
6 Since these calculations require tracing a district back in time, the 1997–98 and 2003–04 Legislatures are not included. The 1997–98 Legislature is the first with values for all of these measures, so it is impossible to identify the moderation of the legislator in the previous Legislature. The 2003–04 Legislature is the first after the redistricting, so it is problematic to identify when a district “changed” its representative.
49
These numbers suggest that multiple-issue moderation has at least as much to do with the legislator as the district he or she represents. Only four Assembly districts (17, 19, 26, and 69) and three Senate districts (15, 16, and 40) were always represented by moderates in the last three Legislatures before the 2001 redistricting. In fact, regression analysis confirms that a legislator’s score on one issue is better predicted by that legislator’s scores on other issues than by the political complexion of his or her district. And among legislators reelected at least once, current roll call scores are better predicted by past voting scores than by current district partisanship (see Tables D.6 through D.8 in the technical appendix; see p. xv for the web address of Appendix D).
Some of this moderation is explained by whether a legislator faced a tough fight in the previous general election. Table 4.5 shows the percentage of legislators who were moderates, separately by the closeness of their last election and whether or not their district is mixed. An election is defined as “close” if the winner claimed less than 55 percent of the two-party vote. The table suggests that there are more moderates in mixed districts than in solid ones, yet in both kinds of districts, legislators who have faced a tough fight in the previous election are somewhat more likely to be moderate. In mixed districts, 37 percent who won a close race are moderate compared to 22 percent who had an easier time; in solid districts, the numbers are 43 percent to 12 percent.
To many observers, the results in Table 4.5 are exactly the point: The districts became safer on paper, which led to less competitive elections in the fall, which led to fewer moderates. But this explanation fails to hold together when its connections are examined more closely. Only 40 percent of mixed districts had close general elections between 1996 and 2004, and only 37 percent of these districts selected moderates. Since just 22 percent of districts were mixed before the 2001 redistricting, that leaves only 3 percent of legislators (37% of 40% of 22%) whose moderation could have been affected by the redistricting in the first place. This amounts to about three legislators in the Assembly and two in the Senate. When one considers that these legislators might have had reasons not to be perfectly responsive to changes in the partisan composition of their districts, the chances for a redistricting effect become even smaller.
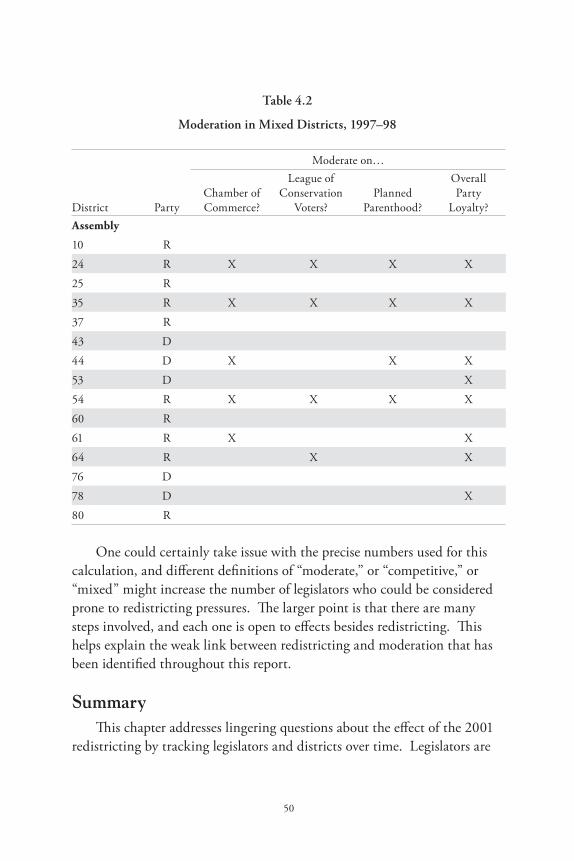
50
Table 4.2
Moderation in Mixed Districts, 1997–98
Moderate on…
District PartyChamber of Commerce?
League of Conservation
Voters?Planned
Parenthood?
Overall Party
Loyalty?Assembly
10 R
24 R x x x x
25 R
35 R x x x x
37 R
43 D
44 D x x x
53 D x
54 R x x x x
60 R
61 R x x
64 R x x
76 D
78 D x
80 R
One could certainly take issue with the precise numbers used for this calculation, and different definitions of “moderate,” or “competitive,” or “mixed” might increase the number of legislators who could be considered prone to redistricting pressures. The larger point is that there are many steps involved, and each one is open to effects besides redistricting. This helps explain the weak link between redistricting and moderation that has been identified throughout this report.
SummaryThis chapter addresses lingering questions about the effect of the 2001
redistricting by tracking legislators and districts over time. Legislators are
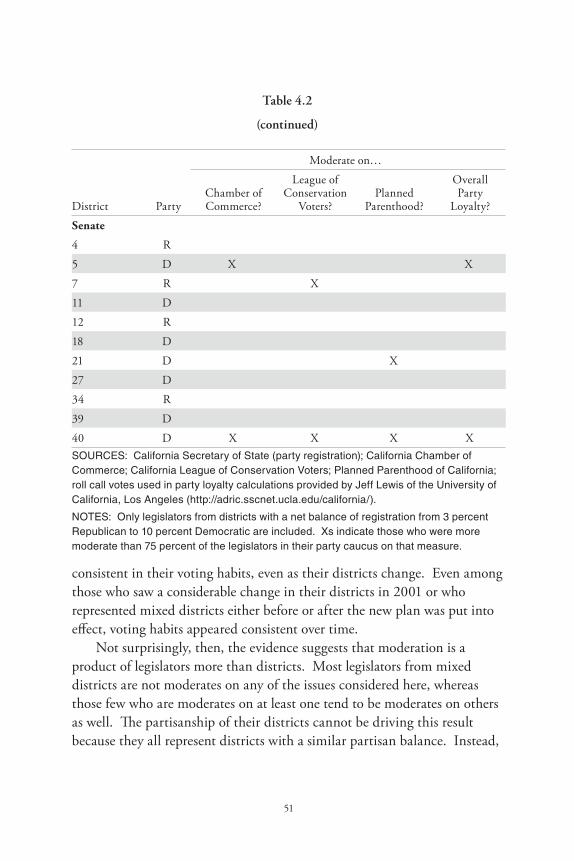
51
Table 4.2
(continued)
Moderate on…
District PartyChamber of Commerce?
League of Conservation
Voters?Planned
Parenthood?
Overall Party
Loyalty?
Senate
4 R
5 D x x
7 R x
11 D
12 R
18 D
21 D x
27 D
34 R
39 D
40 D x x x xSOURCES: California Secretary of State (party registration); California Chamber of Commerce; California League of Conservation Voters; Planned Parenthood of California; roll call votes used in party loyalty calculations provided by Jeff Lewis of the University of California, Los Angeles (http://adric.sscnet.ucla.edu/california/).
NOTES: Only legislators from districts with a net balance of registration from 3 percent Republican to 10 percent Democratic are included. Xs indicate those who were more moderate than 75 percent of the legislators in their party caucus on that measure.
consistent in their voting habits, even as their districts change. Even among those who saw a considerable change in their districts in 2001 or who represented mixed districts either before or after the new plan was put into effect, voting habits appeared consistent over time.
Not surprisingly, then, the evidence suggests that moderation is a product of legislators more than districts. Most legislators from mixed districts are not moderates on any of the issues considered here, whereas those few who are moderates on at least one tend to be moderates on others as well. The partisanship of their districts cannot be driving this result because they all represent districts with a similar partisan balance. Instead,
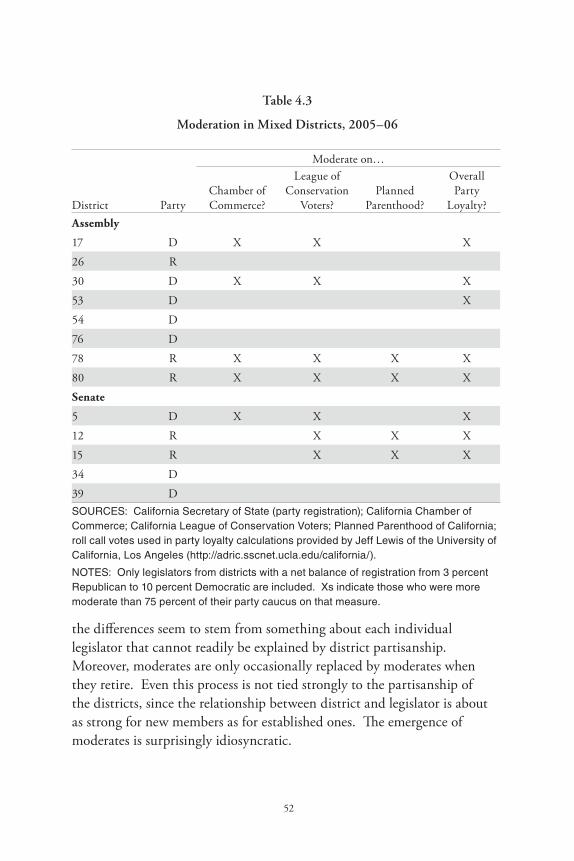
52
Table 4.3
Moderation in Mixed Districts, 2005–06
Moderate on…
District PartyChamber of Commerce?
League of Conservation
Voters?Planned
Parenthood?
Overall Party
Loyalty?Assembly
17 D x x x
26 R
30 D x x x
53 D x
54 D
76 D
78 R x x x x
80 R x x x x
Senate
5 D x x x
12 R x x x
15 R x x x
34 D
39 DSOURCES: California Secretary of State (party registration); California Chamber of Commerce; California League of Conservation Voters; Planned Parenthood of California; roll call votes used in party loyalty calculations provided by Jeff Lewis of the University of California, Los Angeles (http://adric.sscnet.ucla.edu/california/).
NOTES: Only legislators from districts with a net balance of registration from 3 percent Republican to 10 percent Democratic are included. Xs indicate those who were more moderate than 75 percent of their party caucus on that measure.
the differences seem to stem from something about each individual legislator that cannot readily be explained by district partisanship. Moreover, moderates are only occasionally replaced by moderates when they retire. Even this process is not tied strongly to the partisanship of the districts, since the relationship between district and legislator is about as strong for new members as for established ones. The emergence of moderates is surprisingly idiosyncratic.
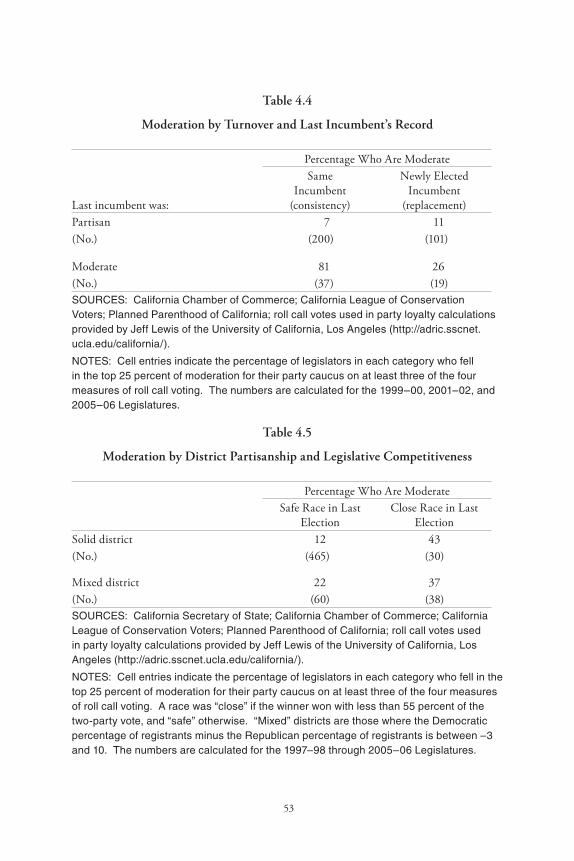
53
Table 4.4
Moderation by Turnover and Last Incumbent’s Record
Percentage Who Are Moderate
Last incumbent was:
SameIncumbent
(consistency)
Newly ElectedIncumbent
(replacement)Partisan 7 11(No.) (200) (101)
Moderate 81 26(No.) (37) (19)SOURCES: California Chamber of Commerce; California League of Conservation Voters; Planned Parenthood of California; roll call votes used in party loyalty calculations provided by Jeff Lewis of the University of California, Los Angeles (http://adric.sscnet.ucla.edu/california/).
NOTES: Cell entries indicate the percentage of legislators in each category who fell in the top 25 percent of moderation for their party caucus on at least three of the four measures of roll call voting. The numbers are calculated for the 1999–00, 2001–02, and 2005–06 Legislatures.
Table 4.5
Moderation by District Partisanship and Legislative Competitiveness
Percentage Who Are ModerateSafe Race in Last
ElectionClose Race in Last
ElectionSolid district 12 43(No.) (465) (30)
Mixed district 22 37(No.) (60) (38)SOURCES: California Secretary of State; California Chamber of Commerce; California League of Conservation Voters; Planned Parenthood of California; roll call votes used in party loyalty calculations provided by Jeff Lewis of the University of California, Los Angeles (http://adric.sscnet.ucla.edu/california/).
NOTES: Cell entries indicate the percentage of legislators in each category who fell in the top 25 percent of moderation for their party caucus on at least three of the four measures of roll call voting. A race was “close” if the winner won with less than 55 percent of the two-party vote, and “safe” otherwise. “Mixed” districts are those where the Democratic percentage of registrants minus the Republican percentage of registrants is between –3 and 10. The numbers are calculated for the 1997–98 through 2005–06 Legislatures.

55
5. Changing Votes
The evidence in the last chapter made it clear that the 2001 redistricting has had very little effect on the way legislators vote. But at some level, politics is not about averages or patterns; it is about discrete, notable events. Some votes in the Legislature are more important than others. They divide legislators and the general public over more consequential matters of public policy. Such bills are often decided at the margins, in key decisions made by individual politicians.
The last chapter told us a great deal about the backdrop to these individual decisions. We know with a fair amount of certainty that the great majority of Republicans will line up on one side of an issue and the great majority of Democrats on the other, with very little regard for the political complexion of each legislator’s constituency. Yet individual bills might still be decided by the actions of a few legislators in the middle. In particular, the decisive votes on important bills might consistently be cast by legislators from mixed districts, even if the deciding legislator is not the same in every case, and even if any given legislator usually votes the party line.
We would like to know whether the relationship between district partisanship and vote choice on important individual bills is strong enough that a different set of districts might have changed the outcomes on some of them. This is a different question than was asked at the beginning. The questions to be answered in this chapter are about specific policy. If we changed the districts, how might policy change? Which roll call votes on individual bills would change, and which way?
To predict how legislators from recent years might have voted had their districts looked more like those from the 1990s, we use a two-step process similar to the one that produced the numbers in Table 3.1. First, the relationship between the partisanship of the districts in the 2005–06 Legislature and votes on specific bills is examined. For each of these, we observe whether legislators from more Democratic districts voted for the bill more often than legislators from more Republican districts. We then use these relationships to predict how legislators might have voted on these bills if the relationship between district partisanship and voting remained
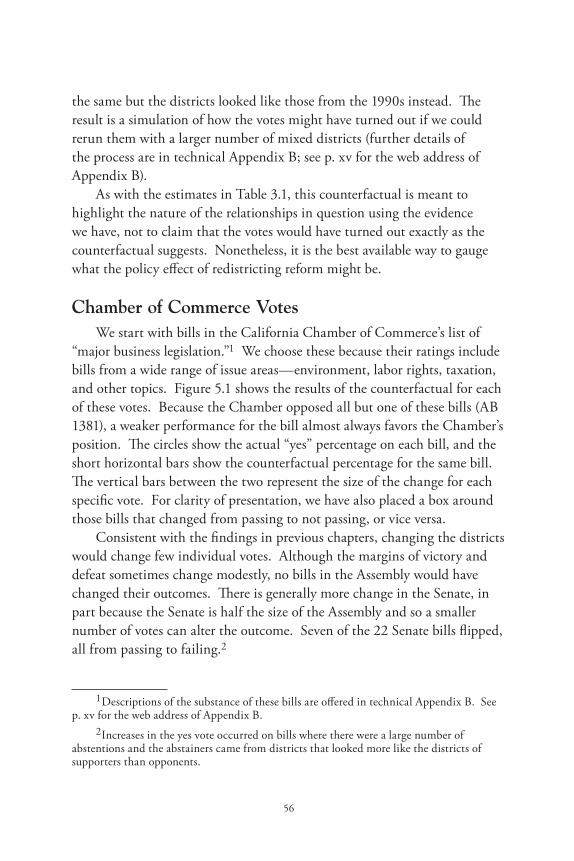
56
the same but the districts looked like those from the 1990s instead. The result is a simulation of how the votes might have turned out if we could rerun them with a larger number of mixed districts (further details of the process are in technical Appendix B; see p. xv for the web address of Appendix B).
As with the estimates in Table 3.1, this counterfactual is meant to highlight the nature of the relationships in question using the evidence we have, not to claim that the votes would have turned out exactly as the counterfactual suggests. Nonetheless, it is the best available way to gauge what the policy effect of redistricting reform might be.
Chamber of Commerce VotesWe start with bills in the California Chamber of Commerce’s list of
“major business legislation.”1 We choose these because their ratings include bills from a wide range of issue areas—environment, labor rights, taxation, and other topics. Figure 5.1 shows the results of the counterfactual for each of these votes. Because the Chamber opposed all but one of these bills (AB 1381), a weaker performance for the bill almost always favors the Chamber’s position. The circles show the actual “yes” percentage on each bill, and the short horizontal bars show the counterfactual percentage for the same bill. The vertical bars between the two represent the size of the change for each specific vote. For clarity of presentation, we have also placed a box around those bills that changed from passing to not passing, or vice versa.
Consistent with the findings in previous chapters, changing the districts would change few individual votes. Although the margins of victory and defeat sometimes change modestly, no bills in the Assembly would have changed their outcomes. There is generally more change in the Senate, in part because the Senate is half the size of the Assembly and so a smaller number of votes can alter the outcome. Seven of the 22 Senate bills flipped, all from passing to failing.2
1 Descriptions of the substance of these bills are offered in technical Appendix B. See p. xv for the web address of Appendix B.
2 Increases in the yes vote occurred on bills where there were a large number of abstentions and the abstainers came from districts that looked more like the districts of supporters than opponents.
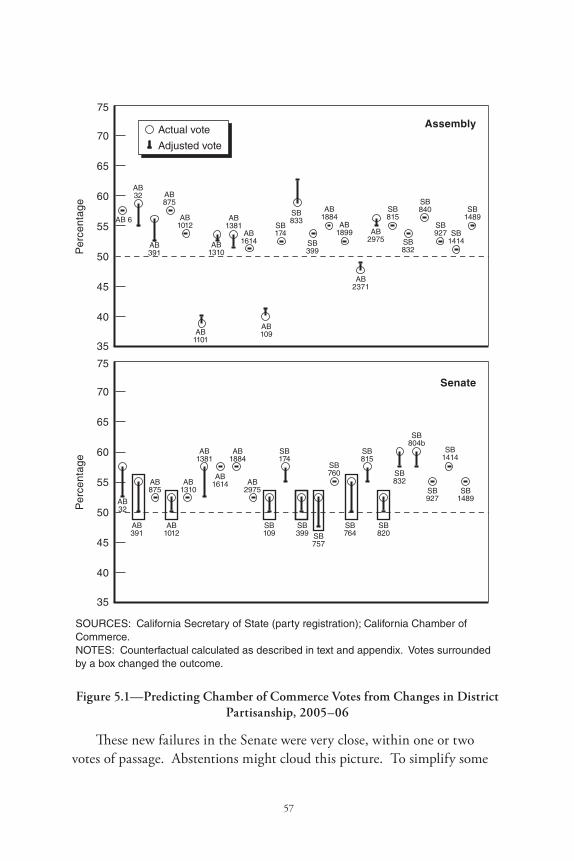
57
SOURCES: California Secretary of State (party registration); California Chamber of Commerce.NOTES: Counterfactual calculated as described in text and appendix. Votes surrounded by a box changed the outcome.
70
65
75
60
Per
cent
age
Assembly
Senate
55
50
45
40
35
70
65
75
60
Per
cent
age
55
50
45
40
35
Actual vote
Adjusted vote
AB32
AB391
AB1012
AB875
AB1310 SB
927SB
1489
AB2975
AB1381
AB1884
SB174
SB815
SB1414
SB832
SB760AB
1614
SB804b
SB764SB
757
SB399
SB820
SB109
AB32
AB 6
AB391
AB1012
AB875
AB1310
SB927
SB1489
AB1899
AB1381
AB1884
SB174
SB815
SB1414SB
832
AB2371
AB1614
SB840
AB2975
AB1101
SB399
SB833
AB109
Figure 5.1—Predicting Chamber of Commerce Votes from Changes in District Partisanship, 2005–06
These new failures in the Senate were very close, within one or two votes of passage. Abstentions might cloud this picture. To simplify some
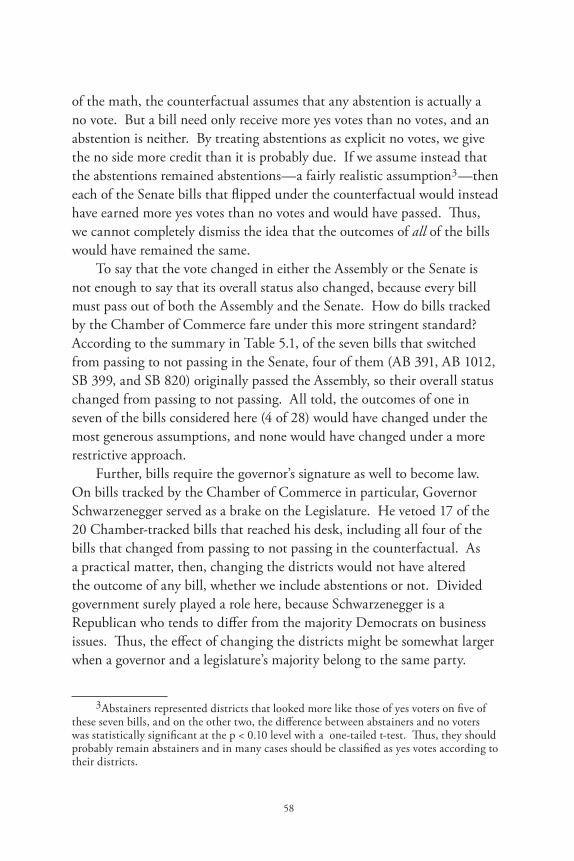
58
of the math, the counterfactual assumes that any abstention is actually a no vote. But a bill need only receive more yes votes than no votes, and an abstention is neither. By treating abstentions as explicit no votes, we give the no side more credit than it is probably due. If we assume instead that the abstentions remained abstentions—a fairly realistic assumption3—then each of the Senate bills that flipped under the counterfactual would instead have earned more yes votes than no votes and would have passed. Thus, we cannot completely dismiss the idea that the outcomes of all of the bills would have remained the same.
To say that the vote changed in either the Assembly or the Senate is not enough to say that its overall status also changed, because every bill must pass out of both the Assembly and the Senate. How do bills tracked by the Chamber of Commerce fare under this more stringent standard? According to the summary in Table 5.1, of the seven bills that switched from passing to not passing in the Senate, four of them (AB 391, AB 1012, SB 399, and SB 820) originally passed the Assembly, so their overall status changed from passing to not passing. All told, the outcomes of one in seven of the bills considered here (4 of 28) would have changed under the most generous assumptions, and none would have changed under a more restrictive approach.
Further, bills require the governor’s signature as well to become law. On bills tracked by the Chamber of Commerce in particular, Governor Schwarzenegger served as a brake on the Legislature. He vetoed 17 of the 20 Chamber-tracked bills that reached his desk, including all four of the bills that changed from passing to not passing in the counterfactual. As a practical matter, then, changing the districts would not have altered the outcome of any bill, whether we include abstentions or not. Divided government surely played a role here, because Schwarzenegger is a Republican who tends to differ from the majority Democrats on business issues. Thus, the effect of changing the districts might be somewhat larger when a governor and a legislature’s majority belong to the same party.
3 Abstainers represented districts that looked more like those of yes voters on five of these seven bills, and on the other two, the difference between abstainers and no voters was statistically significant at the p < 0.10 level with a one-tailed t-test. Thus, they should probably remain abstainers and in many cases should be classified as yes votes according to their districts.
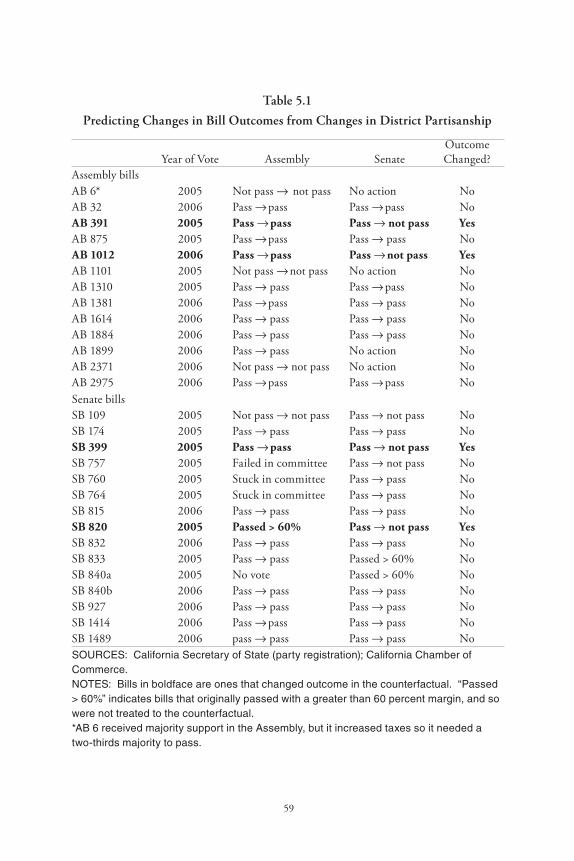
59
Table 5.1
Predicting Changes in Bill Outcomes from Changes in District Partisanship
Year of Vote Assembly SenateOutcome Changed?
Assembly billsAB 6* 2005 Not pass → not pass No action NoAB 32 2006 Pass → pass Pass → pass NoAB 391 2005 Pass → pass Pass → not pass YesAB 875 2005 Pass → pass Pass → pass NoAB 1012 2006 Pass → pass Pass → not pass YesAB 1101 2005 Not pass → not pass No action NoAB 1310 2005 Pass → pass Pass → pass NoAB 1381 2006 Pass → pass Pass → pass NoAB 1614 2006 Pass → pass Pass → pass NoAB 1884 2006 Pass → pass Pass → pass NoAB 1899 2006 Pass → pass No action NoAB 2371 2006 Not pass → not pass No action NoAB 2975 2006 Pass → pass Pass → pass NoSenate billsSB 109 2005 Not pass → not pass Pass → not pass NoSB 174 2005 Pass → pass Pass → pass NoSB 399 2005 Pass → pass Pass → not pass YesSB 757 2005 Failed in committee Pass → not pass NoSB 760 2005 Stuck in committee Pass → pass NoSB 764 2005 Stuck in committee Pass → pass NoSB 815 2006 Pass → pass Pass → pass NoSB 820 2005 Passed > 60% Pass → not pass YesSB 832 2006 Pass → pass Pass → pass NoSB 833 2005 Pass → pass Passed > 60% NoSB 840a 2005 No vote Passed > 60% NoSB 840b 2006 Pass → pass Pass → pass NoSB 927 2006 Pass → pass Pass → pass NoSB 1414 2006 Pass → pass Pass → pass NoSB 1489 2006 pass → pass Pass → pass NoSOURCES: California Secretary of State (party registration); California Chamber of Commerce. NOTES: Bills in boldface are ones that changed outcome in the counterfactual. “Passed > 60%” indicates bills that originally passed with a greater than 60 percent margin, and so were not treated to the counterfactual. *AB 6 received majority support in the Assembly, but it increased taxes so it needed a two-thirds majority to pass.
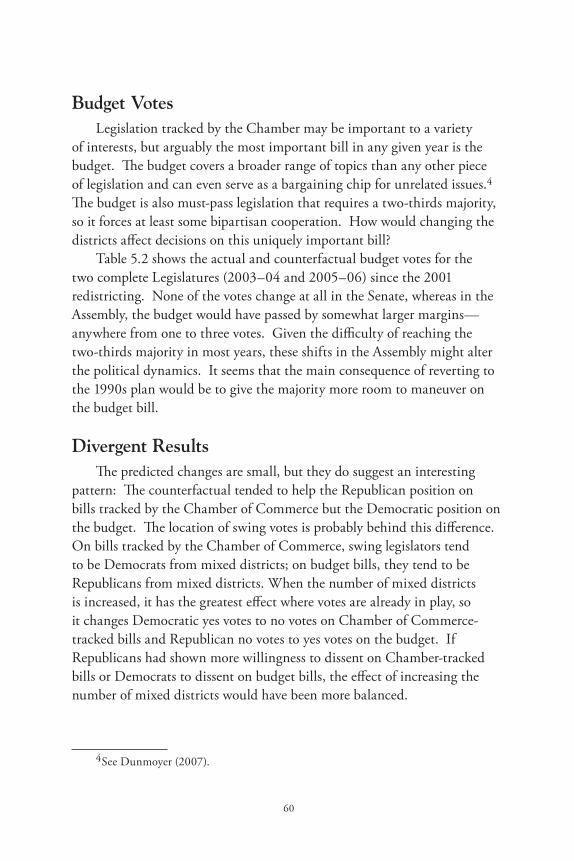
60
Budget VotesLegislation tracked by the Chamber may be important to a variety
of interests, but arguably the most important bill in any given year is the budget. The budget covers a broader range of topics than any other piece of legislation and can even serve as a bargaining chip for unrelated issues.4 The budget is also must-pass legislation that requires a two-thirds majority, so it forces at least some bipartisan cooperation. How would changing the districts affect decisions on this uniquely important bill?
Table 5.2 shows the actual and counterfactual budget votes for the two complete Legislatures (2003–04 and 2005–06) since the 2001 redistricting. None of the votes change at all in the Senate, whereas in the Assembly, the budget would have passed by somewhat larger margins—anywhere from one to three votes. Given the difficulty of reaching the two-thirds majority in most years, these shifts in the Assembly might alter the political dynamics. It seems that the main consequence of reverting to the 1990s plan would be to give the majority more room to maneuver on the budget bill.
Divergent ResultsThe predicted changes are small, but they do suggest an interesting
pattern: The counterfactual tended to help the Republican position on bills tracked by the Chamber of Commerce but the Democratic position on the budget. The location of swing votes is probably behind this difference. On bills tracked by the Chamber of Commerce, swing legislators tend to be Democrats from mixed districts; on budget bills, they tend to be Republicans from mixed districts. When the number of mixed districts is increased, it has the greatest effect where votes are already in play, so it changes Democratic yes votes to no votes on Chamber of Commerce-tracked bills and Republican no votes to yes votes on the budget. If Republicans had shown more willingness to dissent on Chamber-tracked bills or Democrats to dissent on budget bills, the effect of increasing the number of mixed districts would have been more balanced.
4 See Dunmoyer (2007).
61
Table 5.2
Predicting Changes in Budget Votes from Changes in District Partisanship
DifferenceYes Votes (Hypothetical –
Actual Hypothetical Actual)Assembly 2003 56 56 02004 69 70 +12005 65 68 +32006 54 55 +1Senate2003 27 27 02004 28 28 02005 34 34 02006 30 30 0SOURCES: California Secretary of State (party registration); California Legislative Counsel (budget votes).
NOTES: “Actual” column contains the number of yes votes actually cast for the budget in each year. “Hypothetical” column contains the yes votes predicted by the counterfactual described in the text.
For this reason, changing the political complexion of the districts generally has less predictable consequences than changing the partisan membership of either the Assembly or the Senate. For example, a shift from Democratic to Republican control of four seats in the Assembly and two seats in the Senate would produce vote shifts far more consistent across bills than would any of the changes in district composition already described. The result would always weaken support for bills important to the Chamber of Commerce and would flip the outcomes of 10 bills in the Assembly and eight in the Senate (see Figure C.21 in the technical appendix; see p. xv for the web address of Appendix C). Putting the results of the two chambers together, it would change the overall outcome of 46 percent of the bills (13 out of 28), compared to just 14 percent of the bills when only the districts are changed. If abstentions on these bills are left as abstentions, this number drops to four bills out of 28, but that is still more than the complete absence of change under the counterfactual.
62
The results are similar for the budget: Support always drops or stays steady when we change partisan control of a district rather than the partisanship of its constituents. Two of the four budget votes listed in Table 5.2 would remain unchanged in the Assembly as would one in the Senate. Support for the rest would drop by anywhere from one vote to three, and the outcome would actually fall below the 54 votes needed for passage in the 2006 Assembly.
The effect of reverting to the districts of the 1990s therefore depends on the issue in question. The party with more dissent will see that dissent increase as mixed districts are added because these districts are more likely to elect dissenters. This result holds even though the relationship between mixed districts and dissent is weak. The weak relationship affects only the magnitude of change that might be expected from adding more mixed districts. The patterns of dissent determine which party receives the greatest advantage from the change.
SummaryThe evidence supports two general conclusions. First, adding more
mixed districts would not significantly alter the political dynamics of most votes and would change the outcomes of even fewer. Some bills could see a modest change in the margin of passage, which might have important effects on the politics of the debate around each one. But only a few bills at most would end up with a different outcome—from passing to not passing, or vice versa—and even those could still be derailed in the other chamber or at the governor’s desk.
Second, a more politically mixed set of districts would typically undermine the position of the party with the greatest dissent on a given issue. The reason is simple: Mixed districts produce more dissenters, and since one party often has more such dissenters than the other, adding mixed districts is more damaging to that party’s position. As a practical matter, this means that the effect of redistricting reform on the relative status of the parties is likely to be uncertain and contingent. Some votes will change in one direction, some in the other. Whether the overall result is good or bad will depend on which issues change, how they change, and how one feels about those issues.
63
These results are generally in line with the weak effect of redistricting found throughout this report. The effect does seem larger here, simply because so many Chamber of Commerce bills—in the Senate in particular—have been decided by close margins. Both supporters and opponents of redistricting reform might consider it significant that one important bill in seven could change its outcome under the simulation, even though they could get a larger and more consistent effect just by changing the party control of a few seats. In fact, redistricting and party control effects are not mutually exclusive, because redistricting reform might contribute to greater turnover by placing more districts in the competitive range. At any rate, the effect of the redistricting on individual bills is likely to be small but perhaps large enough for attentive observers.

65
6. Conclusions
Redistricting has had at best a minor effect on partisanship in the California Legislature. There was just as much partisanship in the late 1990s, before the 2001 redistricting, as there was in the mid-2000s, after it. In fact, by the measures here, there is only weak evidence that legislators respond to the partisan composition of their districts at all. Partisans often outnumber moderates even in mixed districts, and moderates in one party are still very different from moderates in the other. One might argue that the 2001 redistricting was still meaningful because it protected legislators from accountability: Partisan legislators from mixed districts can at least be voted out of office, but with the current districts, not even that much is possible—in three election cycles, no legislative seats have changed party control. But this is a point separate from questions of moderation. Replacing a partisan of one party with a partisan of the other does not produce more moderation, just a change in the balance of power between two very different parties. Either way, voters in the middle do not get a candidate who represents their positions on the issues.
If redistricting is not responsible for partisanship, we are left with two important questions. First, why are so many California legislators so partisan? Second, what reforms might be more effective at making them less so? Thoroughly answering these questions is beyond the scope of this report. The possibilities enumerated below are not meant to be exhaustive and are not ranked by potential for success. But each one should be considered if the goal is to increase bipartisanship in the Legislature.
Alternative Explanations
VotersThe claim that self-serving redistricting led to partisanship in the
Legislature assumes that the explanation must lie with politicians. But voters themselves may be partly responsible. There is a great deal of evidence that voters sort themselves into political parties better now than
66
in the past.1 Voters are about as moderate as ever, but those just to the left of the middle are more likely to identify as Democrats and those just to the right as Republicans. The gulf between partisans on either side has grown as a result, and more voters directly in the middle are refusing to identify with the parties at all.2 In many cases, these independents choose not to vote, helping make the electorate more polarized than the general public.3
Adding to this development has been the rise of issue-based activists. Party organizations once played a large role in organizing campaigns and bringing voters to the polls. These organizations tended to focus more on winning than on promoting an ideological agenda. Today, political campaigns are centered on individual candidates who must raise money and build a volunteer base of their own if they are to be successful. The way to achieve these goals is often by appealing to passionate activists in the party base.
The consequences of these trends have less to do with the number of partisans in a district than with their type. These partisans expect candidates to hew closely to the party line on a number of issues, and they tolerate little or no dissent. They generally have their strongest influence in the primary, where their goals are less diluted by the participation of independents. Redistricting will not change this dynamic because adding or subtracting partisans from a district changes nothing about the attitudes of the partisans who remain.
Interest GroupsInterest groups are a second source of partisan pressure. They, too, have
taken advantage of the decline of party organizations by providing more financial and organizational support to campaigns. This development has contributed to the enormous (and growing) sums of money that now flow into elections for the Senate and Assembly. It also means that a legislator who crosses swords with enough of these interest groups risks losing their support, or worse: facing an opponent in the primary who receives that support instead.
1 See Abramowitz and Saunders (1998); Fiorina, Pope, and Abrams (2005).2 See Baldassare (2008). 3 See Bartels (2000).
67
These groups also wield influence between elections. They monitor legislation closely and make sure lawmakers are aware of their positions. The ratings used in this report would not have been available without the efforts and resources of these groups. The Legislature’s own staff facilitate this connection by identifying the interest group supporters and opponents of legislation in their official analyses of bills. Legislators rely on this information to help them cast votes on the vast range of legislation that comes before them in a typical legislative session. The general public does not have the time, money, or interest to match these efforts, so their voices often do not get heard. In politics, organization matters.
Party LeadersPressures need not come from outside the Legislature alone. The party
leadership can have some influence on members as well, although its power is far from absolute. Party leaders represent party members; they rarely have the desire or the authority to impose their own policy views against the majority will of their party’s caucus. Instead, they work to bring together the caucus they have.4 That includes moderates in either caucus, who can always threaten to defect and vote with the opposing party, or, if they grow too frustrated, can band together and elect new leadership. Thus, even the notion that there is a “leadership position” on a bill is something of a misnomer, since the leadership usually tries to promote any legislation that will unite the party caucus.
Nonetheless, the party leadership can encourage legislators to toe the party line. The leaders of the majority party—the Speaker of the Assembly and the President Pro Tem of the Senate—have the power to direct the flow of legislation, mostly behind the scenes through the Rules and Appropriations committees. These tools are a powerful mechanism for shaping legislation according to the preferences of the leadership. The leadership does not use these tools to force legislators into uncomfortable votes so much as to ensure that legislation has been, in the words of one staffer, “reasonably scrubbed” to avoid divisions within the majority party before it comes up for a final vote.
4 See Rohde (1991).
68
Leaders can also take more visible action. President Pro Tem Don Perata removed members of his party from the Appropriations Committee in 2005 and again in 2007 for failing to vote the party line. In the latter case, he temporarily locked the moderates out of their offices for participating in a caucus of fellow moderates dubbed the “Mod Squad.”5 Speaker Fabian Nuñez was accused of similar tactics when he removed moderate Joe Canciamilla from the chair of the Water, Parks and Wildlife Committee in 2005 (Nuñez denied the charge).6 And in a mix of inside and outside pressure, Senate Republican Leader Jim Brulte once threatened to campaign in the primary against any member of his caucus who voted for a tax increase.7 Whether the intent in each case was to punish or even threaten to punish moderates, some legislators were likely to interpret the events that way. In an interview for this report, one former legislator said the Mod Squad met in secret for fear of retribution from the leadership.
This activity suggests that there might be a threshold effect to a legislator’s ability to act on a moderate point of view. The moderate caucus might need to reach a certain size before it has the political muscle to obtain latitude from the leadership. The threshold was never reached in the period studied here, or we would have seen a great deal more moderation than was in fact the case.
The Selection EffectFinally, there is the simple fact that those who choose to serve in
politics are likely to be partisan before they ever reach the legislature.8 They may become introduced to politics through interest groups and activist causes that help to either create or reinforce a strongly conservative or liberal mindset. Those who hold moderate views may be less energized by political causes or less likely to see service in politics as a noble pursuit. The result is a bias toward partisan legislators in all districts.
5 See “State Senator Loses Post”; Goldmacher (2007a, 2007b).6 See Sanders (2005a). 7 See Gledhill (2003).8 This idea was mentioned in interviews with several legislative staffers and former
legislators.
69
This explanation suggests that legislators take positions that reflect sincere beliefs more than political calculation. It helps account for the weak link between a district’s partisanship and its legislator’s voting record and for the fact that legislators are often consistently moderate or partisan on all issues. Election to office is in part a chance to fight for the causes one already believes in.
Still, those who hold sincerely partisan beliefs might find more outlets in politics, more acceptance from party leaders, and more support from primary voters. Some of the other factors that have been mentioned are still important. There is almost certainly an element of behavior that is inherent to each individual legislator and his personal history, but it still might be shaped by the larger political environment.
Possible ReformsIf redistricting is not likely to promote bipartisanship in the
Legislature, are there approaches that might be more effective at achieving this goal? Based on the alternative explanations offered above, the following might be more fruitful avenues for reform.
Open PrimariesIf each party’s base has become too ideological to nominate moderates,
then it might make sense to broaden the party’s perspective by opening primaries to independents and members of the opposing party. Currently, parties in California can choose to admit decline-to-state voters into their primaries, and for most races both major parties do so. California experimented with something more radical—a blanket primary where voters from any party could vote for candidates of any other party in each race, much like a general election—but this scheme was overturned by the U.S. Supreme Court in 2000, just two years after it went into effect.
Would open primaries encourage moderation? The participation of decline-to-state voters does not seem to have made legislators more moderate in California, but there is some evidence that the blanket primary boosted moderation during its brief life span.9 Moreover, evidence from
9 See Gerber (2002).
70
other states suggests that open primaries are better than closed primaries at electing moderates.10 The California primary system could certainly open further without running afoul of the Supreme Court—for example, by letting registrants of the two major parties participate in the opposing party’s primary to the exclusion of any other, much as decline-to-state voters can do today. Such a reform might have at least a marginal effect on moderation in the Legislature.
Campaign Finance ReformOne possible way to limit interest group influence is to restrict these
groups’ ability to donate to political campaigns. Proposition 34 in 2000 capped donations, but the limits are high compared to the limits set by similar laws at the federal level, and a variety of loopholes remain. Tighter caps might lessen the influence or appearance of influence from campaign donations and free legislators to respond to a broader range of voters. A “clean elections” movement has also been developing. The states that have adopted such laws—currently Arizona, Maine, Vermont, and Connecticut—provide enough public money for candidates to wage viable campaigns, if they choose to, with little private financing. Legislative campaigns in these states are generally much cheaper to run than they are in California, but the idea has still received some attention in reform circles in this state.
The campaign finance reform movement struggles against the Supreme Court’s interpretations of the First Amendment, which generally forbid limits on candidate spending and on independent spending by individuals and interest groups.11 In fact, since the Proposition 34 caps were put in place, independent expenditures by interest groups have rapidly increased.12 The constraint affects clean-elections laws as well, since participation in the programs must always be voluntary. Lobbying activity between campaign seasons enjoys even stronger First Amendment protection, and its influence on legislators can be at least as large as the effect of donations around
10 See Gerber and Morton (1998); Kanthak and Morton (2001); Kaufmann, Gimpel, and Hoffman (2003).
11 See Cain (2007). 12 See Fair Political Practices Commission (2008).
71
elections. Nonetheless, as with open primaries, campaign finance reform might have some effect on partisanship at the margins and might be more effective than redistricting reform at achieving such goals.
Mobilizing ModeratesPotentially the most effective alternative to redistricting reform would
also be the hardest to accomplish: mobilizing middle-of-the-road voters, who currently sit on the sidelines of political debate. This might occur through a third-party movement, through one or more interest groups, or even through a particularly dynamic and energizing candidate. Such a movement could ensure that moderate voices are heard both during and between elections, and might give certain legislators in the middle the freedom to serve as swing votes.
Governors are often successful moderates. In fact, each of the last three governors—Pete Wilson, Gray Davis, and Arnold Schwarzenegger—arguably resided closer to the center of the spectrum than did the rest of their parties. The challenge has been to extend this individual movement to the center to lower-level offices, where interest groups and activists are more involved and have more influence. Whether such a movement could be built depends on a number of unpredictable factors, including the emergence of talented politicians who can bring the movement together and the willingness of moderate voters to be mobilized into greater political activism. But there is no doubt that a strong movement of moderates would be a powerful force for consistent change—more than any single reform could hope to achieve.
SummaryRedistricting reform is not an effective way to increase bipartisanship
in the Legislature. Adding more mixed districts would not significantly increase the number of moderates because the legislators representing such districts are not necessarily moderates now. Furthermore, the 2001 redistricting cannot be the cause of partisanship in the Legislature now because the number of moderates has not changed significantly since the plan was put in effect. A number of alternative ways to increase bipartisanship might work better than redistricting reform.
72
This report remains agnostic about whether redistricting reform should be implemented for other reasons, or even whether a more bipartisan Legislature would be a net benefit for California. But if bridging the partisan divide in Sacramento is the paramount objective, redistricting reform would be a poor way to achieve it.
73
References
Abramowitz, Alan I., and Kyle L. Saunders, “Ideological Realignment in the U.S. Electorate,” The Journal of Politics, Vol. 60, No. 3, 1998.
“An Essential Reform: Redistricting Fix Is the Key to Many Problems,” The San Diego Union-Tribune, March 10, 2008.
Ansolabehere, Stephen, James M. Snyder, Jr., and Charles Stewart III, “Candidate Positioning in U.S. House Elections,” American Journal of Political Science, Vol. 45, No. 1, 2001.
Baldassare, Mark, At Issue: California’s Post-Partisan Future, Public Policy Institute of California, San Francisco, California, 2008.
Bartels, Larry M., “Partisanship and Voting Behavior, 1952–1996,” American Journal of Political Science, Vol. 44, No. 1, 2000.
Cain, Bruce E., “Reform Studies: Political Science on the Firing Line,” PS: Political Science and Politics, Vol. 40, No. 4, 2007.
Cain, Bruce E., Karin MacDonald, and Michael P. McDonald, “From Equality to Fairness: The Path of Political Reform since Baker v. Carr,” in Thomas E. Mann and Bruce E. Cain, eds., Party Lines: Competition, Partisanship, and Congressional Redistricting, Brookings Press, Washington, D.C., 2005.
Cain, Bruce E., Iris Hui, and Karin MacDonald, “Sorting or Self-Sorting: Competition and Redistricting in California?” in Frédérick Douzet, Thad Kousser, and Kenneth P. Miller, eds., The New Political Geography of California, Berkeley Public Policy Press, Berkeley, California, 2008.
Common Cause Education Fund, Designer Districts: Safe Seats Tailor Made for Incumbents, Washington, D.C., 2005.
Cox, Gary W., and Jonathan N. Katz, Elbridge Gerry’s Salamander, Cambridge University Press, New York, 2002.
Dixon, Robert G., Jr., Democratic Representation: Reapportionment in Law and Politics, Oxford University Press, New York, 1968.
Dunmoyer, Dan, “You’ve Already Won, GOP,” Los Angeles Times, August 10, 2007.
“Editorial: California Voters Should Embrace Newest Redistricting Plan,” San Jose Mercury News, December 7, 2007.
“Editorial: What We Need in Sacramento: Redistricting, Not Retaliation,” San Jose Mercury News, February 14, 2008.
74
Fair Political Practices Commission, “Independent Expenditures: The Giant Gorilla in Campaign Finance,” Sacramento, California, 2008.
Fenno, Richard F., Congressmen in Committees, Little, Brown, Boston, Massachusetts, 1973.
Fiorina, Morris P., Jeremy C. Pope, and Samuel J. Abrams, Culture War? The Myth of a Polarized America, Pearson Longman, New York, 2005.
Fund, John, “Mad Maps: It’s Time to Draw the Line on Gerrymandering,” The Wall Street Journal, October 15, 2007.
Gerber, Elisabeth R., “Strategic Voting and Candidate Policy Positions,” in Bruce E. Cain and Elisabeth R. Gerber, eds., Voting at the Political Fault Line: California’s Experiment with the Blanket Primary, University of California, Berkeley, 2002.
Gerber, Elisabeth R., and Rebecca B. Morton, “Primary Election Systems and Representation,” The Journal of Law, Economics, and Organization, Vol. 14, No. 2, 1998.
Gledhill, Lynda, “GOP Caucus Warned Not to Budge,” The San Francisco Chronicle, June 5, 2003.
Goldmacher, Shane, “Capitol Alert Interview with Don Perata,” Sacramento Bee Capitol Alert, October 31, 2007a.
Goldmacher, Shane, “Perata Tilts Apropos Panel to the Left,” Sacramento Bee, October 31, 2007b.
Hertzberg, Robert M., and James L. Brulte, “Put Redistricting Proposal on Fall Ballot,” Sacramento Bee, June 24, 2006.
Johnson, Douglas, A Case Study of California’s Redistricting in the 1990s, The Rose Institute of State and Local Government, Claremont McKenna College, Claremont, California, 2005.
Johnson, Douglas, Elise Lampe, Justin Levitt, and Andrew Lee, Restoring the Competitive Edge, The Rose Institute of State and Local Government, Claremont McKenna College, Claremont California, 2005.
Kanthak, Kristin, and Rebecca Morton, “The Effects of Electoral Rules on Congressional Primaries,” in Peter F. Galderisi, Marni Ezra, and Michael Lyons, eds., Congressional Primaries and the Politics of Representation, Rowman and Littlefield, Lanham, Maryland, 2001.
Kaufmann, Karen M., James G. Gimpel, and Adam H. Hoffman, “A Promise Fulfilled? Open Primaries and Representation,” The Journal of Politics, Vol. 65, No. 2, 2003.
75
Kousser, J. Morgan, “Redistricting: California 1971–2001,” in Gerald C. Lubenow, ed., Governing California, Institute of Governmental Studies Press, University of California, Berkeley, California, 2006.
Masket, Seth E., “It Takes an Outsider: Extralegislative Organization and Partisanship in the California Assembly, 1849–2006,” American Journal of Political Science, Vol. 51, No. 3, 2007.
McCarty, Nolan, Keith T. Poole, and Howard Rosenthal, Polarized America: The Dance of Ideology and Unequal Riches, MIT Press, Cambridge, Massachusetts, 2006.
McGhee, Eric, At Issue: Legislative Reform, Public Policy Institute of California, San Francisco, California, 2007.
Rohde, David W., Parties and Leaders in the Post-Reform House, University of Chicago Press, Chicago, Illinois, 1991.
Sanders, Jim, “Some Moderates Claim Pressure by Nuñez,” Sacramento Bee, January 9, 2005a.
Sanders, Jim, “Precursor to Prop. 77 ‘Orchestrated Well,’” Sacramento Bee, October 19, 2005b.
“State Senator Loses Post,” Michael Gardner Copley News Service, June 7, 2005.
“Thanks, Governor: Redistricting Would Spur Other Reforms,” The San Diego Union-Tribune, December 5, 2007.
Wiegand, Steve, “Is Latest Remap Try Also DOA?” Sacramento Bee, October 27, 2007.

77
About the Author
ERIC MCGHEE
Eric McGhee is a research fellow at the Public Policy Institute of California, where his work focuses on elections, political participation, political polarization, legislative behavior, redistricting, and surveys and polling. Before joining PPIC as a research fellow, he was assistant professor of political science at the University of Oregon, and previously worked at PPIC on the Statewide Survey. He holds a Ph.D. in political science from the University of California, Berkeley.

79
Related PPIC Publications
Adapting to Term Limits: Recent Experiences and New Directions (2004) Bruce E. Cain, Thad Kousser
California’s Post-Partisan Future (2008) Mark Baldassare
Fiscal Realities: Budget Tradeoffs in California Government (2007) Tracy M. Gordon, Jaime Calleja Alderete, Patrick J. Murphy, Jon Sonstelie, Ping Zhang
Legislative Reform (2007) Eric McGhee
PPIC publications may be ordered by phone or from our website (800) 232-5343 [mainland U.S.]
(415) 291-4400 [Canada, Hawaii, overseas] www.ppic.org

Related Documents