14 April 2017 1 Approved Date: 14 April 2017 Janssen Research & Development * Statistical Analysis Plan A Phase 3, Multicenter, Randomized, Double-blind, Placebo-controlled Study Evaluating the Efficacy and Safety of Ustekinumab in the Treatment of Anti-TNF Į Refractory Subjects With Active Radiographic Axial Spondyloarthritis Protocol CNTO1275AKS3002; Phase 3 STELARA® (ustekinumab) *Janssen Research & Development is a global organization that operates through different legal entities in various countries. Therefore, the legal entity acting as the sponsor for Janssen Research & Development studies may vary, such as, but not limited to Janssen Biotech, Inc.; Janssen Products, LP; Janssen Biologics, BV; Janssen-Cilag International NV; Janssen, Inc; Janssen Infectious Diseases BVBA; Janssen R&D Ireland; or Janssen Research & Development, LLC. The term “sponsor” is used throughout the protocol to represent these various legal entities; the sponsor is identified on the Contact Information page that accompanies the protocol. Status: Approved Date: 14 April 2017 Prepared by: Janssen Research & Development Compliance: The study described in this report was performed according to the principles of Good Clinical Practice (GCP). Confidentiality Statement The information in this document contains trade secrets and commercial information that are privileged or confidential and may not be disclosed unless such disclosure is required by applicable law or regulations. In any event, persons to whom the information is disclosed must be informed that the information is privileged or confidential and may not be further disclosed by them. These restrictions on disclosure will apply equally to all future information supplied to you that is indicated as privileged or confidential. NCT02438787

Welcome message from author
This document is posted to help you gain knowledge. Please leave a comment to let me know what you think about it! Share it to your friends and learn new things together.
Transcript

14 April 2017 1 Approved Date: 14 April 2017
Janssen Research & Development *
Statistical Analysis Plan
A Phase 3, Multicenter, Randomized, Double-blind, Placebo-controlled Study Evaluating
the Efficacy and Safety of Ustekinumab in the Treatment of Anti-TNF Refractory Subjects With Active Radiographic Axial Spondyloarthritis
Protocol CNTO1275AKS3002; Phase 3
STELARA® (ustekinumab)
*Janssen Research & Development is a global organization that operates through different legal entities in various countries. Therefore, the legal entity acting as the sponsor for Janssen Research & Development studies may vary, such as, but not limited to Janssen Biotech, Inc.; Janssen Products, LP; Janssen Biologics, BV; Janssen-Cilag International NV; Janssen, Inc; Janssen Infectious Diseases BVBA; Janssen R&D Ireland; or Janssen Research & Development, LLC. The term “sponsor” is used throughout the protocol to represent these various legal entities; the sponsor is identified on the Contact Information page that accompanies the protocol.
Status: Approved Date: 14 April 2017 Prepared by: Janssen Research & Development Compliance: The study described in this report was performed according to the principles of Good Clinical Practice (GCP).
Confidentiality Statement The information in this document contains trade secrets and commercial information that are privileged or confidential and may not be disclosed unless such disclosure is required by applicable law or regulations. In any event, persons to whom the information is disclosed must be informed that the information is privileged or confidential and may not be further disclosed by them. These restrictions on disclosure will apply equally to all future information supplied to you that is indicated as privileged or confidential.
NCT02438787
STELARA® (ustekinumab) Statistical Analysis Plan CNTO1275AKS3002
14 April 2017 2 Approved Date: 14 April 2017
TABLE OF CONTENTS
TABLE OF CONTENTS .......................................................................................................................... 2
ABBREVIATIONS ................................................................................................................................... 5
1. INTRODUCTION ............................................................................................................................ 71.1. Trial Objectives ........................................................................................................................... 71.2. Trial Design................................................................................................................................. 71.3. Statistical Hypotheses for Trial Objectives ................................................................................... 91.4. Sample Size Justification ............................................................................................................ 91.5. Randomization and Blinding ...................................................................................................... 101.5.1. Randomization ....................................................................................................................... 101.5.2. Maintenance of the Blind........................................................................................................ 11
2. GENERAL ANALYSIS DEFINITIONS .......................................................................................... 122.1. Visit Windows ........................................................................................................................... 122.2. Pooling Algorithm for Analysis Centers ...................................................................................... 122.3. Analysis Sets ............................................................................................................................ 132.3.1. Efficacy Analysis Set.............................................................................................................. 132.3.2. Safety Analysis Set ................................................................................................................ 132.3.3. Pharmacokinetics Analysis Set .............................................................................................. 132.3.4. Immunogenicity Analysis Set ................................................................................................. 132.4. Definition of Subgroups ............................................................................................................. 13
3. INTERIM ANALYSIS AND DATA MONITORING COMMITTEE REVIEW ..................................... 143.1. Interim Analysis......................................................................................................................... 143.2. Data Monitoring Committee ....................................................................................................... 15
4. SUBJECT INFORMATION ........................................................................................................... 164.1. Demographics and Baseline Characteristics .............................................................................. 164.2. Disposition Information .............................................................................................................. 164.3. Treatment Compliance .............................................................................................................. 164.4. Extent of Exposure .................................................................................................................... 164.5. Protocol Deviations ................................................................................................................... 174.6. Prior and Concomitant Medications ........................................................................................... 17
5. EFFICACY ................................................................................................................................... 175.1. Analysis Specifications .............................................................................................................. 175.1.1. Level of Significance .............................................................................................................. 175.1.1.1. Multiplicity Adjustment for Testing Procedures .................................................................... 175.1.2. Data Handling Rules .............................................................................................................. 205.1.2.1. Treatment Failure ............................................................................................................... 205.1.2.2. Missing Data Imputation...................................................................................................... 215.1.2.3. Early Escape ...................................................................................................................... 215.2. Primary Efficacy Endpoint.......................................................................................................... 215.2.1. Definition ............................................................................................................................... 215.2.2. Analysis Methods ................................................................................................................... 225.2.3. Sensitivity Analyses ............................................................................................................... 235.2.4. Analysis Methods ................................................................................................................... 245.2.5. Supportive Analyses .............................................................................................................. 245.3. Major Secondary Endpoints ...................................................................................................... 255.3.1. Proportion of Subjects who Achieve an ASAS 20 Response at Week 24 ................................ 255.3.1.1. Definition ............................................................................................................................ 255.3.1.2. Analysis Methods ................................................................................................................ 255.3.1.3. Sensitivity Analyses ............................................................................................................ 25
NCT02438787

STELARA® (ustekinumab) Statistical Analysis Plan CNTO1275AKS3002
14 April 2017 3 Approved Date: 14 April 2017
5.3.2. Proportion of Subjects who Achieve at Least a 50% Improvement from Baseline in BASDAI at Week 24 ............................................................................................................................ 26
5.3.2.1. Definition ............................................................................................................................ 265.3.2.2. Analysis Methods ................................................................................................................ 265.3.2.3. Sensitivity Analyses ............................................................................................................ 265.3.3. Change from Baseline in Bath Ankylosing Spondylitis Functional Index (BASFI) at Week 24 .. 275.3.3.1. Definition ............................................................................................................................ 275.3.3.2. Analysis Methods ................................................................................................................ 275.3.3.3. Sensitivity Analyses ............................................................................................................ 275.3.4. Proportion of Subjects who Achieve ASDAS (CRP) inactive disease (<1.3) at Week 24 ......... 285.3.4.1. Definition ............................................................................................................................ 285.3.4.2. Analysis Methods ................................................................................................................ 285.3.4.3. Sensitivity Analyses ............................................................................................................ 285.4. Estimands of Primary and Major Secondary Endpoints .............................................................. 295.5. Other Secondary Endpoints ...................................................................................................... 315.5.1. Definition of Other Secondary Endpoints ................................................................................ 315.5.1.1. Low Disease Activity (ASAS Partial Remission) .................................................................. 315.5.1.2. ASAS 5/6 Response ........................................................................................................... 315.5.1.3. A 20%, 50%, 70%, 90% Improvement from baseline in BASDAI .................................. 315.5.1.4. ASDAS (CRP) .................................................................................................................... 315.5.1.5. ASDAS (CRP) Inactive Disease (<1.3) ................................................................................ 315.5.1.6. ASDAS (CRP) Major Improvement (Decrease 2.0) ............................................................ 315.5.1.7. ASDAS (CRP) Clinically Important Improvement (Decrease 1.1) ........................................ 315.5.1.8. Bath Ankylosing Spondylitis Metrology Index (BASMI) ........................................................ 325.5.1.9. Chest Expansion................................................................................................................. 325.5.1.10. MASES Enthesitis Scores ................................................................................................... 335.5.1.11. Inflammation ....................................................................................................................... 335.5.1.12. Total Back Pain .................................................................................................................. 335.5.1.13. Night Back Pain .................................................................................................................. 335.5.1.14. Patient Global Assessment ................................................................................................. 335.5.1.15. 36-Item Short-form Health Survey ....................................................................................... 345.5.1.16. Medical Outcomes Study Sleep Scale (MOS-SS) ............................................................... 355.5.1.17. Ankylosing Spondylitis Quality of Life (ASQoL) Questionnaire ............................................. 355.5.1.18. EuroQol 5 Dimension Questionnaire (EQ-5D) ..................................................................... 355.5.1.19. Functional Assessment of Chronic Illness Therapy-Fatigue Questionnaire (FACIT-
Fatigue) .............................................................................................................................. 365.5.2. Analysis Methods for Other Secondary Endpoints .................................................................. 36
6. SAFETY ....................................................................................................................................... 386.1. Safety Table Presentation ......................................................................................................... 386.1.1. Summaries through Week 16 ................................................................................................. 386.1.2. Summaries through Week 24 ................................................................................................. 396.1.3. Summaries through Week 64 ................................................................................................. 396.2. Adverse Events ......................................................................................................................... 406.3. Clinical Laboratory Tests ........................................................................................................... 406.4. Vital Signs ................................................................................................................................. 416.5. Electrocardiogram ..................................................................................................................... 41
7. PHARMACOKINETICS/PHARMACODYNAMICS ........................................................................ 417.1. Pharmacokinetics ...................................................................................................................... 417.1.1. PK Treatment Groups Through Week 24 ............................................................................... 437.1.2. PK Treatment Groups Through Week 52 ............................................................................... 437.1.3. PK Treatment Groups Through Week 64 ............................................................................... 437.2. Immune Response .................................................................................................................... 447.2.1. Immunogenicity Treatment Groups Through Week 24 ............................................................ 457.2.2. Immunogenicity Treatment Groups Through Week 52 ............................................................ 45
NCT02438787

STELARA® (ustekinumab) Statistical Analysis Plan CNTO1275AKS3002
14 April 2017 4 Approved Date: 14 April 2017
7.3. Pharmacodynamics................................................................................................................... 457.4. Pharmacokinetic/Pharmacodynamic Relationships .................................................................... 457.5. Microbiome Substudy ................................................................................................................ 457.6. Pharmacogenomics .................................................................................................................. 46
8. HEALTH ECONOMICS ................................................................................................................ 468.1. Definition................................................................................................................................... 468.1.1. Work Productivity and Activity Impairment Questionnaire ....................................................... 468.2. Analysis Methods ...................................................................................................................... 46
NCT02438787

STELARA® (ustekinumab) Statistical Analysis Plan CNTO1275AKS3002
14 April 2017 5 Approved Date: 14 April 2017
ABBREVIATIONS AE adverse event ALT alanine aminotransferaseANCOVA analysis of covariance ANOVA analysis of variance AS ankylosing spondylitis ASAS Assessment in SpondyloArthritis international SocietyASDAS Ankylosing Spondylitis Disease Activity ScoreASQoL Ankylosing Spondylitis Quality of Life questionnaireAST aspartate aminotransferaseAxSpA axial spondyloarthritis BASDAI Bath Ankylosing Spondylitis Disease Activity IndexBASFI Bath Ankylosing Spondylitis Functional IndexBASMI Bath Ankylosing Spondylitis Metrology IndexCI Confidence Interval CMH Cochran-Mantel-HaenszelCRP c-reactive protein DAS disease activity score DBL database lock DMARD disease-modifying antirheumatic drugsDMC Data Monitoring CommitteeeCRF electronic case report formEE early escape EQ-5D EuroQol 5 Dimension EU European Union FDA Food and Drug AdministrationGCP Good Clinical PracticeHCQ Hydroxychloroquine HRQOL Health-related quality of lifehs-CRP high sensitivity C-reactive proteinIB Investigator’s BrochureICF Informed consent formICH International Conference on HarmonisationIEC Independent ethics committeeITT Intent-to-Treat IWRS interactive web response systemLLOQ Lower limit of quantificationLOCF last observation carried forwardLSMeans Least-Squares Means MA musculoskeletal assessormAb monoclonal antibody MCS Mental Component SummaryMedDRA Medical Dictionary for Regulatory ActivitiesmITT MMRM
modified intention-to-treat Mixed Model for Repeated Measures
MOS-SS Medical Outcomes Study Sleep ScaleMRI magnetic resonance imagingmSASSS modified Stoke Ankylosing Spondylitis Spinal ScoreMTX Methotrexate NCI-CTCAE National Cancer Institute-Common Terminology Criteria for Adverse Events NONMEM nonlinear mixed effects modeling approachNSAID nonsteroidal anti-inflammatory drugPCS Physical Component SummaryPD Pharmacodynamics PFS prefilled syringe
NCT02438787

STELARA® (ustekinumab) Statistical Analysis Plan CNTO1275AKS3002
14 April 2017 6 Approved Date: 14 April 2017
PGA Patient’s Global AssessmentPK Pharmacokinetics PQC Product Quality ComplaintPRO Patient Reported OutcomePsA psoriatic arthritis q4w every 4 weeks q12w every 12 weeks RBC red blood cell SAE serious adverse event SAP Statistical Analysis PlanSC Subcutaneous SF-36 36-item short form health surveySpA Spondyloarthritis SSZ Sulfasalazine TB Tuberculosis TEAEs Treatment emergent adverse eventsTNF tumor necrosis factor alphaTST tuberculin skin test ULN upper limit of normal US United States VAS visual analog scale WBC white blood cell (count)WPAI-SHP Work Productivity and Activity Impairment Questionnaire - Specific Health Problem
NCT02438787
STELARA® (ustekinumab) Statistical Analysis Plan CNTO1275AKS3002
14 April 2017 7 Approved Date: 14 April 2017
1. INTRODUCTION This Statistical Analysis Plan (SAP) contains definitions of analysis sets, derived variables, and statistical methods for all planned analyses.
1.1. Trial Objectives This Phase 3, multicenter, randomized, double-blind, placebo-controlled, parallel-group study is to evaluate the efficacy and safety of ustekinumab (previously named CNTO1275), a human anti- IL-12/23p40 monoclonal antibody, administered subcutaneously (SC) in adult subjects with active radiographic AxSpA and who have been refractory to anti-TNF . The primary objective is to assess the efficacy of ustekinumab in adult anti-TNF refractory subjects with active radiographic AxSpA, as measured by the reduction in signs and symptoms of radiographic AxSpA. The secondary objectives are to assess the effect of treatment with ustekinumab in adult anti-TNF refractory subjects with active radiographic AxSpA on the following: Efficacy related to improving physical function, range of motion, health-related quality of life,
other health outcomes
Safety
Pharmacokinetics (PK) and immunogenicity
1.2. Trial Design This is a Phase 3, multicenter, randomized, double-blind, placebo-controlled study of ustekinumab 45 mg and 90 mg in adult anti-TNF refractory subjects with active radiographic AxSpA. The study consists of a screening phase of up to 8 weeks, a blinded treatment phase of approximately 1 year (i.e., 52 weeks) including a placebo controlled period from Week 0 to Week 24 and an active controlled period from Week 24 to Week 52, and, a safety follow-up phase of 12 weeks after the last administration of study treatment. An overview of the study design is provided in Figure 1.
NCT02438787
STELARA® (ustekinumab) Statistical Analysis Plan CNTO1275AKS3002
14 April 2017 8 Approved Date: 14 April 2017
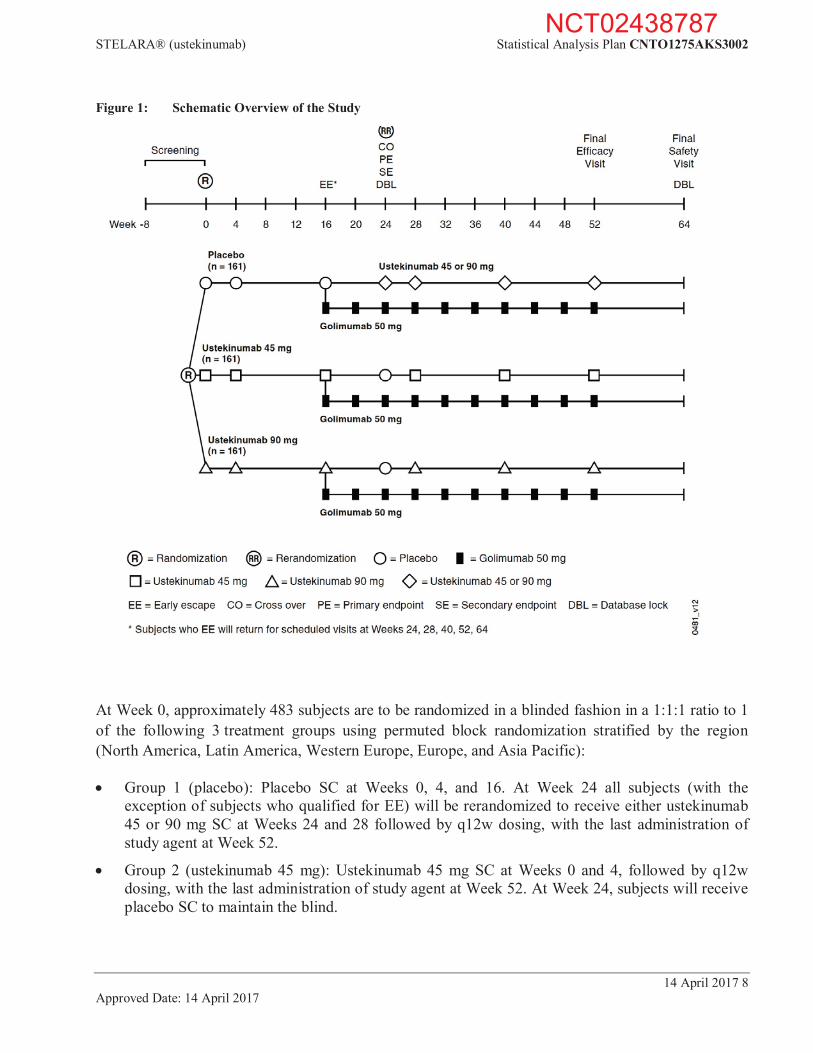
Figure 1: Schematic Overview of the Study
At Week 0, approximately 483 subjects are to be randomized in a blinded fashion in a 1:1:1 ratio to 1 of the following 3 treatment groups using permuted block randomization stratified by the region (North America, Latin America, Western Europe, Europe, and Asia Pacific):
Group 1 (placebo): Placebo SC at Weeks 0, 4, and 16. At Week 24 all subjects (with the exception of subjects who qualified for EE) will be rerandomized to receive either ustekinumab 45 or 90 mg SC at Weeks 24 and 28 followed by q12w dosing, with the last administration of study agent at Week 52.
Group 2 (ustekinumab 45 mg): Ustekinumab 45 mg SC at Weeks 0 and 4, followed by q12w dosing, with the last administration of study agent at Week 52. At Week 24, subjects will receive placebo SC to maintain the blind.
NCT02438787

STELARA® (ustekinumab) Statistical Analysis Plan CNTO1275AKS3002
14 April 2017 9 Approved Date: 14 April 2017
Group 3 (ustekinumab 90 mg): Ustekinumab 90 mg SC at Weeks 0 and 4, followed by q12w dosing, with the last administration of study agent at Week 52. At Week 24, subjects will receive placebo SC to maintain the blind.
Subjects in all 3 treatment groups who have <10% improvement from baseline in both total back pain and morning stiffness measures at both Week 12 and Week 16 will be considered as meeting EE criteria. Subjects who meet EE criteria will begin receiving open label golimumab 50 mg SC administrations at Week 16 and every 4 weeks (q4w) thereafter through Week 52.
The end of the study is defined as the last visit for the last subject. The last visit is the Week 64 visit.
There are 3 database locks (DBL) planned. The first database lock, which is for the purpose of interim analysis, occurs when approximately 50% of subjects have completed the Week 24 visit or end study participation before the Week 24 visit. The other 2 DBL will occur when all subjects complete the Week 24, and Week 64 visits respectively.
1.3. Statistical Hypotheses for Trial Objectives The primary endpoint in this study is the proportion of subjects achieving an ASAS 40 response at Week 24. This endpoint was chosen because it is well accepted by regulatory authorities and the clinical AS community.
The null hypothesis is that there is no difference between either of the ustekinumab groups and the placebo group with respect to reduction in signs and symptoms of radiographic AxSpA as measured by ASAS 40 response at Week 24.
1.4. Sample Size Justification The sample size of 483 subjects was chosen to achieve 90% power to detect a treatment difference between either ustekinumab group and placebo for the primary endpoint at a significance level of 0.05 (2-sided).
The assumptions for the sample size and power calculations were based on Week 24 data from the ustekinumab investigator-initiated study in AS and the certolizumab pegol AxSpA study (the ASAS 40 response rate is 16% in placebo and 48% in active).9
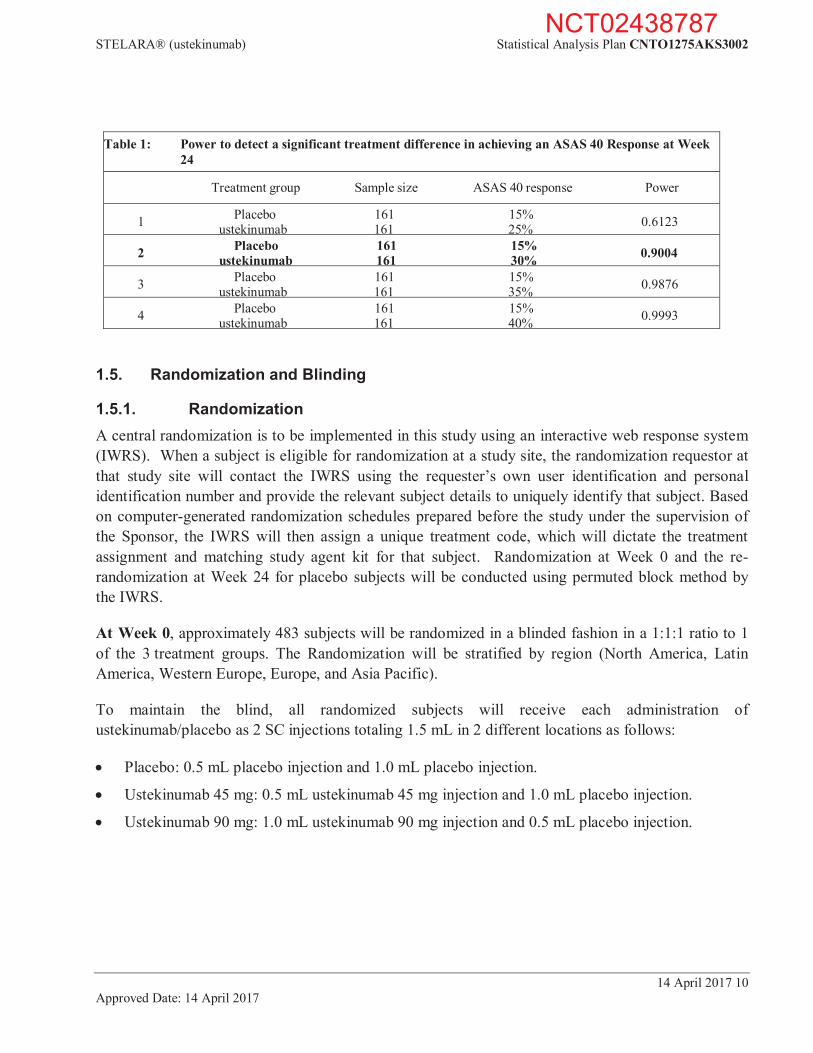
Table 1 shows the results of the power estimates for detecting a significant difference in the ASAS 40 response rates between the ustekinumab treatment group and the placebo treatment group.
NCT02438787
STELARA® (ustekinumab) Statistical Analysis Plan CNTO1275AKS3002
14 April 2017 10 Approved Date: 14 April 2017
Table 1: Power to detect a significant treatment difference in achieving an ASAS 40 Response at Week 24
Treatment group Sample size ASAS 40 response Power
1 Placebo 161 15% 0.6123 ustekinumab 161 25%
2 Placebo 161 15% 0.9004 ustekinumab 161 30%
3 Placebo 161 15% 0.9876 ustekinumab 161 35%
4 Placebo 161 15% 0.9993 ustekinumab 161 40%
1.5. Randomization and Blinding
1.5.1. Randomization A central randomization is to be implemented in this study using an interactive web response system (IWRS). When a subject is eligible for randomization at a study site, the randomization requestor at that study site will contact the IWRS using the requester’s own user identification and personal identification number and provide the relevant subject details to uniquely identify that subject. Based on computer-generated randomization schedules prepared before the study under the supervision of the Sponsor, the IWRS will then assign a unique treatment code, which will dictate the treatment assignment and matching study agent kit for that subject. Randomization at Week 0 and the re-randomization at Week 24 for placebo subjects will be conducted using permuted block method by the IWRS.
At Week 0, approximately 483 subjects will be randomized in a blinded fashion in a 1:1:1 ratio to 1 of the 3 treatment groups. The Randomization will be stratified by region (North America, Latin America, Western Europe, Europe, and Asia Pacific).
To maintain the blind, all randomized subjects will receive each administration of ustekinumab/placebo as 2 SC injections totaling 1.5 mL in 2 different locations as follows:
Placebo: 0.5 mL placebo injection and 1.0 mL placebo injection.
Ustekinumab 45 mg: 0.5 mL ustekinumab 45 mg injection and 1.0 mL placebo injection.
Ustekinumab 90 mg: 1.0 mL ustekinumab 90 mg injection and 0.5 mL placebo injection.
NCT02438787

STELARA® (ustekinumab) Statistical Analysis Plan CNTO1275AKS3002
14 April 2017 11 Approved Date: 14 April 2017
1.5.2. Maintenance of the Blind The study blind will be maintained for the duration of the study until after the final Week 64 database lock (DBL).
To maintain the study blind, the study agent container will have a multipart label containing the study name, study agent number, and reference number, and other information on each part. A tear-off label is designed to be torn off, separated from the study agent container, and attached to the subject's source documents. The label will not identify the study agent in the container. However, if it is necessary for a subject's safety, the study blind may be broken and the identity of the study agent ascertained. The study agent number will be entered in the case report form when the study agent is administered. The study agents will be identical in appearance and will be packaged in identical containers.
The investigator will not be provided with randomization codes. The codes will be maintained within the IWRS, which has the functionality to allow the investigator to break the blind for an individual subject.
Data that may potentially unblind the treatment assignment (ie, study agent serum concentrations, antibodies to study agent, and treatment allocation) will be handled with special care to ensure that the integrity of the blind is maintained, and the potential for bias is minimized. This can include making special provisions, such as segregating the data in question from view by the investigators, clinical team, or others as appropriate until the time of DBL and unblinding.
An investigator may be unblinded to a given subject’s treatment allocation when specific emergency treatment would be dictated by knowing the treatment status of the subject. In such cases, the investigator may determine the identity of the treatment by contacting the IWRS provider. It is strongly recommended that the investigator contact the Sponsor or its designee if possible to discuss the particular situation prior to unblinding via IWRS. Telephone contact with the Sponsor or its designee will be available 24 hours per day, 7 days per week. In the event that the investigator is unable to contact the Sponsor, or emergency unblinding is considered medically necessary, the investigator may determine the identity of the treatment via IWRS. However, the Sponsor must be informed as soon as possible. The date, time, and reason for the unblinding must be documented in the appropriate section of the eCRF, and in the source document. The documentation received from the IWRS indicating the code break must be retained with the subject's source documents in a secure manner (e.g., sealed envelope) so as to not unblind the treatment assignment to the subject, the study site, or Sponsor personnel. The investigator is also advised not to reveal the study treatment assignment to the subject, the study site, or Sponsor personnel. Subjects who have had their treatment assignment unblinded are expected to continue to return for scheduled evaluations. Further study agent administrations should be discussed with the study responsible physician.
NCT02438787
STELARA® (ustekinumab) Statistical Analysis Plan CNTO1275AKS3002
14 April 2017 12 Approved Date: 14 April 2017
A given subject’s treatment assignment may be unblinded to the Sponsor, Institutional Review Board/Independent Ethics Committee (IRB/IEC), and site personnel to fulfill regulatory reporting requirements for suspected unexpected serious adverse reactions (SUSARs). A separate code break procedure will be available for use by Janssen Global Medical Safety (GMS) to allow for unblinding of individual subjects to comply with specific requests from regulatory or health authorities.
The study responsible physician will remain blinded through the end of the study to subject level treatment assignment and dosing regimen. At the Week 24 DBL, the data will be unblinded for analysis to the Sponsor only, and not to investigative study site and/or subjects. Identification of Sponsor personnel who will have access to the unblinded subject level data will be documented prior to unblinding. Investigative sites and subjects will remain blinded to treatment assignment for the duration of the study, till after the final Week 64 DBL.
An independent, external DMC will monitor the safety of the study in unblinded fashion on a regular basis and whenever deemed necessary. In addition, the DMC will review unblinded efficacy data from interim analysis. The DMC’s roles and responsibilities, the safety data for DMC review, and other related information (such as, the general procedures, communications, etc.) was defined and documented in the DMC charter. The Sponsor medical monitor will review safety data in a blinded manner as the study is ongoing.
2. GENERAL ANALYSIS DEFINITIONS
2.1. Visit Windows Unless otherwise specified, nominal visits will be used for the summaries and listings over time with no visit windows applied.
For PK analyses, if a subject has an administration more than +/- 7 days of the scheduled dosing date, the concentration data collected between such a dosing visit and the subsequent dosing visit will be excluded from the by-visit data analyses. For the Week 24 visit, if the PK sampling time deviates more than +/- 3 days of the scheduled date, the PK concentration at this visit will be excluded from the by-visit data analyses.
2.2. Pooling Algorithm for Analysis Centers Unless otherwise specified, data from all investigational centers/sites will be pooled by region for analyses.
NCT02438787

STELARA® (ustekinumab) Statistical Analysis Plan CNTO1275AKS3002
14 April 2017 13 Approved Date: 14 April 2017
2.3. Analysis Sets
2.3.1. Efficacy Analysis Set The efficacy analysis data set (Full Analysis Set) includes all subjects who were randomized and received at least one administration of study agent, i.e., the modified Intent-to-Treat (mITT) Population.
In the efficacy analyses, subjects will be analyzed according to their assigned treatment group regardless of their actual treatment received.
2.3.2. Safety Analysis Set The safety analysis set includes all subjects who received at least 1 (partial or complete) administration of study agent, i.e., the treated population.
In the safety analyses, subjects will be analyzed according to the treatment they actually received, regardless of their randomized treatments.
2.3.3. Pharmacokinetics Analysis Set The pharmacokinetics (PK) analysis set includes all subjects who received at least 1 complete administration of ustekinumab and had at least 1 valid blood sample drawn for PK analysis.
In the PK analyses, subjects will be analyzed according to the treatment they actually received, regardless of their randomized treatments.
2.3.4. Immunogenicity Analysis Set The immunogenicity analysis set includes all subjects who received at least 1 (partial or complete) administration of ustekinumab and who have appropriate samples for detection of antibodies to ustekinumab (ie, subjects with at least 1 appropriate sample obtained after their first dose of ustekinumab).
In the immunogenicity analyses, subjects will be analyzed according to the treatment they actually received, regardless of their randomized treatments.
2.4. Definition of Subgroups To evaluate the consistency in the primary efficacy endpoint (proportion of subjects who achieve ASAS 40 response at Week 24) over demographics, baseline characteristics, prior and baseline medication use, subgroup analyses will be performed when the number of subjects in the subgroups permits (eg, at least 15 subjects per treatment group for a given subgroup). The subgroups for subgroup analyses may include, but are not limited to, the following:
NCT02438787

STELARA® (ustekinumab) Statistical Analysis Plan CNTO1275AKS3002
14 April 2017 14 Approved Date: 14 April 2017
1. Subgroups defined by demographics:
a) Gender (male, female) b) Race (White, Black or African American, Asian, Other) c) Geographic region (North America, Latin America, Western Europe, Europe, and Asia
Pacific) d) Age (< 65 years, 65 years) e) Body mass index: (Normal [<25 kg/m2], Overweight [ 25 kg/m2 to <30 kg/m2], Obese [ 30
kg/m2]) f) Body weight: as quartiles
2. Subgroups defined by baseline characteristics:
a) Years since inflammatory back pain first appeared (<= 10 years, > 10 years)
b) AS duration (<= 5 years, > 5 years)
c) BASDAI (<= 6, > 6)
d) BASFI (<= 5, > 5)
e) BASMI (<= median, > median)
f) Total back pain VAS (<= 7, > 7) in a 0 to 10 scale
g) HLA-B27 (positive, negative)
h) Laboratory CRP at baseline (<1.0 mg/dL, >=1.0 mg/dL)
i) Complete ankylosis (yes, no) 3. Subgroups defined by medication (baseline or prior) use:
a) Use of NSAIDs at baseline (yes, no)
b) Use of oral corticosteroids at baseline (yes, no)
c) Use of DMARDs (SSZ/MTX/HCQ) at baseline (yes, no)
d) Number of DMARDs used in the past (none, 1, at least 2)
3. INTERIM ANALYSIS AND DATA MONITORING COMMITTEE REVIEW
3.1. Interim Analysis The interim analysis will be conducted when approximately 50% of subjects have completed the Week 24 visit or ended study participation before the Week 24 visit.
The objectives of the interim analysis are:
To evaluate the level of significance for the primary endpoint based on O’Brien-Fleming alpha spending. If p-value is less than the predetermined significance level (0.0026) for both 45 mg and 90 mg doses of ustekinumab, the DMC will recommend stopping enrollment in the study because of superior efficacy.
NCT02438787

STELARA® (ustekinumab) Statistical Analysis Plan CNTO1275AKS3002
14 April 2017 15 Approved Date: 14 April 2017
To determine whether the probability of meeting the primary endpoint at the end of the study was sufficiently low to consider terminating the study based on the data accrued up to the interim analysis. If the p-value is greater than 0.5 for both 45 mg and 90 mg doses of ustekinumab, the DMC may recommend terminating the study due to futility. This is a non-binding futility rule. The results from the summary of each component of the primary endpoint and safety data may also be considered.
The final decision will be made by the Sponsor Committee. For the details of the interim analysis, refer to the interim analysis plan.
3.2. Data Monitoring Committee The independent DMC will monitor data on an ongoing basis to ensure the continuing safety of the subjects enrolled in this study. The committee will meet periodically to review interim data. After the review, the DMC will make recommendations regarding the continuation of the study. Any safety concerns will be communicated to the Sponsor.
The DMC are independent of the Sponsor. None of the members will be participating in the current study. The independent DMC consists of 3 medical experts in a relevant therapeutic area and 1 statistician. The members of the committee were specified prior to study initiation. The major function of this committee is to monitor the safety of the study agent and to provide recommendations for placing the study on hold or stopping the study in the event that any unanticipated serious events occur.
Periodic safety reviews will occur every 4 months. The DMC may change the frequency or number of reviews based on interim safety findings. The safety reviews will focus on particular AEs, SAEs, and mortality.
Serious adverse events reports will be provided to the DMC members on an ongoing basis. The DMC will have access to unblinded data and review tabulated safety summaries (if appropriate) and any additional data that the DMC may request. No formal statistical hypothesis testing is planned. In addition, during the study, the Sponsor's study responsible physician (or designee) will regularly review blinded safety data from the sites and notify the DMC and appropriate Sponsor personnel of any issues.
In addition, the independent Statistical Support Group (SSG) at DMC will perform the interim analysis described in Section 3.1 and the DMC members review findings from the interim analysis. If the p-value for both comparisons (45 mg versus placebo and 90 mg versus placebo) is significantly favorable to ustekinumab at the interim analysis, then the DMC should recommend stopping enrollment of more subjects, but no efficacy claim will be made based on the interim analysis results. All enrolled subjects will be followed through Week 24 for the Week 24 database lock and submission. In addition, all subjects enrolled in the study will be followed through Week 64 to obtain information about long-term efficacy and safety.
NCT02438787
STELARA® (ustekinumab) Statistical Analysis Plan CNTO1275AKS3002
14 April 2017 16 Approved Date: 14 April 2017
If the null hypothesis is accepted (ie, futility shown), upon careful review of the interim results for the primary endpoint and recent safety data, the DMC may recommend stopping the study.
The final decision will be made by the Sponsor Committee.
The content of the safety summaries and interim analyses, the DMC role and responsibilities and the general procedures (including communications) and their recommendations on the study conduct will be defined and documented in the DMC charter prior to the first DMC review.
4. SUBJECT INFORMATION
4.1. Demographics and Baseline Characteristics The baseline measurement is defined as the closest measurement taken at or before the first study agent administration (Week 0) unless otherwise stated.
Demographic and baseline characteristic will be summarized for all subjects randomized into the study by the randomized treatment group.
Subjects’ demographic data including age, race, sex, height, weight and BMI at baseline will be summarized. Baseline disease characteristics including duration of disease and baseline disease activity assessments will be summarized. Baseline concomitant medication usage will also be summarized. The number of subjects will also be summarized by geographic region, country, and investigational site.
4.2. Disposition Information The number of subjects screened, randomized and treated will be summarized by treatment group. Subjects who discontinued study agent through Weeks 24, and 52, and the reasons for discontinuing will also be summarized by randomized treatment group. Likewise, subjects who terminated study participation and the reasons for termination will also be summarized.
4.3. Treatment Compliance Subjects will be summarized by the study agent lot(s) received. Subjects will also be summarized by the treatment group to which the subjects were randomized versus the actual treatment received during the study.
4.4. Extent of Exposure The cumulative dose of ustekinumab (mg) received will be summarized by treatment group. The number of administrations will be summarized by treatment group. The average follow-up time will also be provided by treatment group in the safety tables.
NCT02438787
STELARA® (ustekinumab) Statistical Analysis Plan CNTO1275AKS3002
14 April 2017 17 Approved Date: 14 April 2017
4.5. Protocol Deviations Subjects who did not meet study selection criteria (e.g. AS disease criteria, medication criteria, laboratory criteria, and medical history criteria) will be summarized and listed by randomized treatment group.
Subjects with major protocol deviations will be identified in the blind fashion prior to database lock. Major protocol deviations will be tabulated separately and presented by treatment group for the following categories including subjects who entered the study but did not meet entry criteria, subjects who received the wrong medication or incorrect dose, subjects who received disallowed medication, and “other.”
4.6. Prior and Concomitant Medications Medications taken by subjects prior to starting the study and concomitant medications will be summarized by medication and randomized treatment group.
5. EFFICACY
5.1. Analysis Specifications
5.1.1. Level of Significance The primary endpoint is planned to be analyzed in the interim analysis based on O’Brien Fleming alpha spending, the 1-sided significance level is 0.0026. Consequently, the 1-sided significance level for the final primary endpoint analysis is 0.024 (0.048 2-sided) if the study continues. Unless otherwise stated, all treatment group comparisons except for the primary endpoint will be performed at a 2-sided alpha level of 0.05.
5.1.1.1. Multiplicity Adjustment for Testing Procedures The primary endpoint of this study is the proportion of subjects who achieve an ASAS 40 response at Week 24.
There are 4 major secondary endpoints in this study:
1. The proportion of subjects who achieve an ASAS 20 response at Week 24 2. The proportion of subjects who achieve at least a 50% improvement from baseline in
BASDAI at Week 24 3. The change from baseline in BASFI at Week 24 4. The proportion of subjects who achieve ASDAS (CRP) inactive disease (<1.3) at Week 24
NCT02438787
STELARA® (ustekinumab) Statistical Analysis Plan CNTO1275AKS3002
14 April 2017 18 Approved Date: 14 April 2017
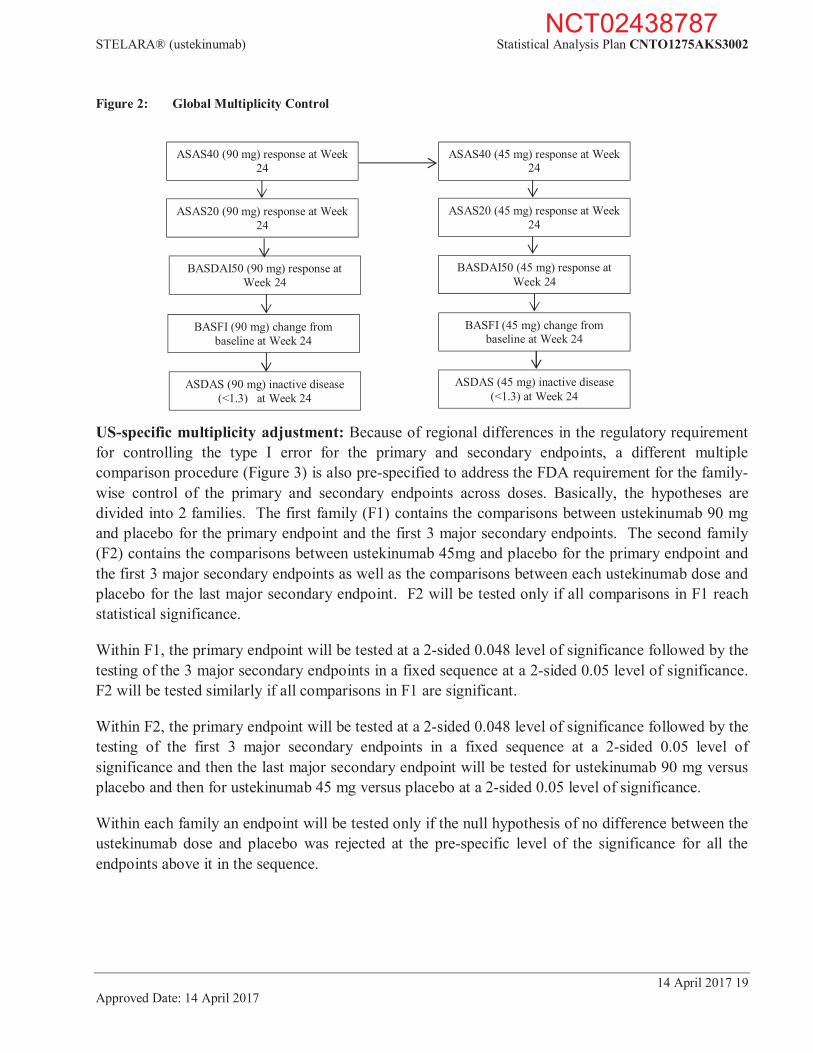
Global multiplicity adjustment (countries outside the United States): The primary endpoint will be tested to compare the 90 mg ustekinumab group with the placebo group at a 2-sided 0.048 level of significance first. If it is significant, the primary endpoint will be tested to compare the 45 mg ustekinumab group with the placebo group at a 2-sided 0.048 level of significance. Within an ustekinumab dose treatment group, the hypotheses for the major secondary endpoints will be tested only if the primary endpoint is significant for that ustekinumab dose treatment group. The hypotheses of the major secondary endpoints will be tested in a fixed sequence at the 2-sided level of 0.05 as follows (Figure 2). If a given comparison is not significant, the remaining treatment group comparisons in the sequence will be considered as supportive analyses.
NCT02438787
STELARA® (ustekinumab) Statistical Analysis Plan CNTO1275AKS3002
14 April 2017 19 Approved Date: 14 April 2017
Figure 2: Global Multiplicity Control
US-specific multiplicity adjustment: Because of regional differences in the regulatory requirement for controlling the type I error for the primary and secondary endpoints, a different multiple comparison procedure (Figure 3) is also pre-specified to address the FDA requirement for the family-wise control of the primary and secondary endpoints across doses. Basically, the hypotheses are divided into 2 families. The first family (F1) contains the comparisons between ustekinumab 90 mg and placebo for the primary endpoint and the first 3 major secondary endpoints. The second family (F2) contains the comparisons between ustekinumab 45mg and placebo for the primary endpoint and the first 3 major secondary endpoints as well as the comparisons between each ustekinumab dose and placebo for the last major secondary endpoint. F2 will be tested only if all comparisons in F1 reach statistical significance.
Within F1, the primary endpoint will be tested at a 2-sided 0.048 level of significance followed by the testing of the 3 major secondary endpoints in a fixed sequence at a 2-sided 0.05 level of significance. F2 will be tested similarly if all comparisons in F1 are significant.
Within F2, the primary endpoint will be tested at a 2-sided 0.048 level of significance followed by the testing of the first 3 major secondary endpoints in a fixed sequence at a 2-sided 0.05 level of significance and then the last major secondary endpoint will be tested for ustekinumab 90 mg versus placebo and then for ustekinumab 45 mg versus placebo at a 2-sided 0.05 level of significance.
Within each family an endpoint will be tested only if the null hypothesis of no difference between the ustekinumab dose and placebo was rejected at the pre-specific level of the significance for all the endpoints above it in the sequence.
BASFI (90 mg) change from baseline at Week 24
ASDAS (90 mg) inactive disease (<1.3) at Week 24
BASDAI50 (90 mg) response at Week 24
ASAS40 (90 mg) response at Week 24
ASAS20 (90 mg) response at Week 24
ASAS40 (45 mg) response at Week 24
ASAS20 (45 mg) response at Week 24
BASDAI50 (45 mg) response at Week 24
BASFI (45 mg) change from baseline at Week 24
ASDAS (45 mg) inactive disease (<1.3) at Week 24
NCT02438787

STELARA® (ustekinumab) Statistical Analysis Plan CNTO1275AKS3002
14 April 2017 20 Approved Date: 14 April 2017
Figure 3: US Specific Multiplicity Adjustment
5.1.2. Data Handling Rules Data handling rules discussed in this section will be applied to efficacy analyses through Week 24 when it is appropriate. In addition, selected data may also be reported using observed data without applying these data handling rules. No data imputation rules will be applied for the analyses after Week 24.
5.1.2.1. Treatment Failure A subject who meets any one of the following treatment failure criteria will be considered a treatment failure from that point onward.
ASAS20 (45 mg) response at Week 24
BASFI (90 mg) change from baseline at Week 24
BASDAI50 (45 mg) response at Week 24
BASFI (45 mg) change from baseline at Week 24
ASAS40 (45 mg) response at Week 24
ASDAS (45 mg) inactive disease (<1.3) at Week 24
ASDAS (90 mg) inactive disease (<1.3) at Week 24
BASDAI50 (90 mg) response at Week 24
ASAS40 (90 mg) response at Week 24
ASAS20 (90 mg) response at Week 24
NCT02438787
STELARA® (ustekinumab) Statistical Analysis Plan CNTO1275AKS3002
14 April 2017 21 Approved Date: 14 April 2017
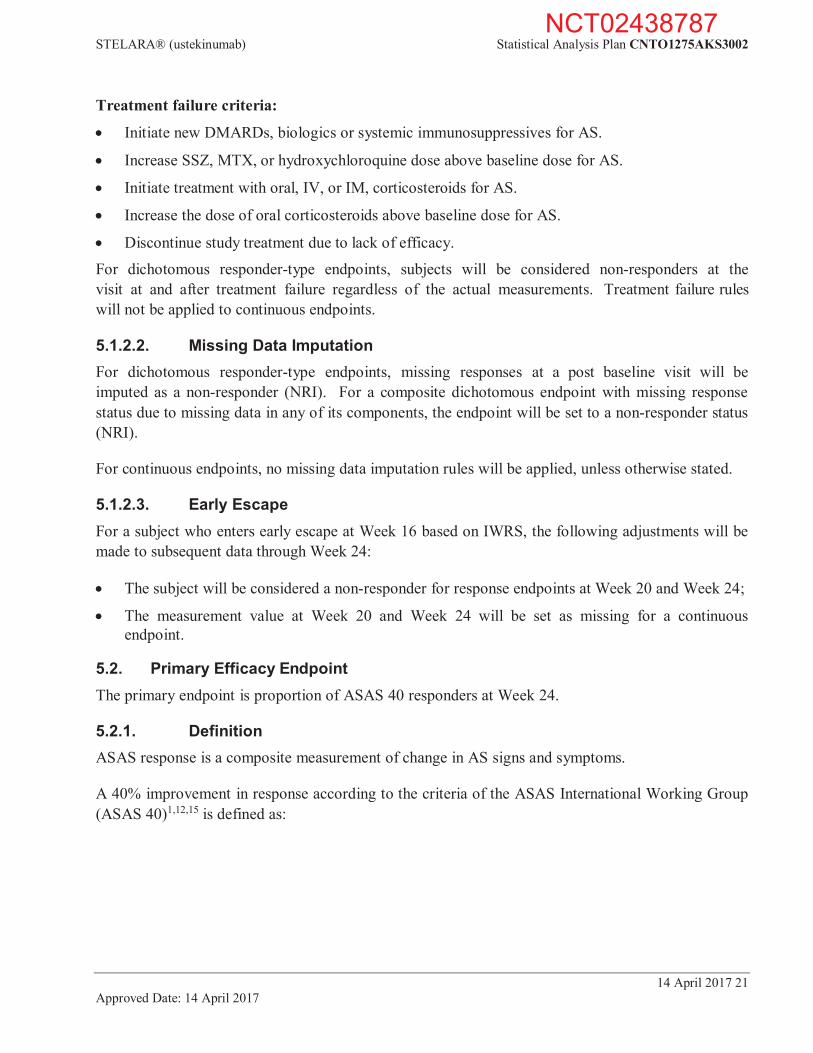
Treatment failure criteria:
Initiate new DMARDs, biologics or systemic immunosuppressives for AS.
Increase SSZ, MTX, or hydroxychloroquine dose above baseline dose for AS.
Initiate treatment with oral, IV, or IM, corticosteroids for AS.
Increase the dose of oral corticosteroids above baseline dose for AS.
Discontinue study treatment due to lack of efficacy.
For dichotomous responder-type endpoints, subjects will be considered non-responders at the visit at and after treatment failure regardless of the actual measurements. Treatment failure rules will not be applied to continuous endpoints.
5.1.2.2. Missing Data Imputation For dichotomous responder-type endpoints, missing responses at a post baseline visit will be imputed as a non-responder (NRI). For a composite dichotomous endpoint with missing response status due to missing data in any of its components, the endpoint will be set to a non-responder status (NRI).
For continuous endpoints, no missing data imputation rules will be applied, unless otherwise stated.
5.1.2.3. Early Escape For a subject who enters early escape at Week 16 based on IWRS, the following adjustments will be made to subsequent data through Week 24:
The subject will be considered a non-responder for response endpoints at Week 20 and Week 24;
The measurement value at Week 20 and Week 24 will be set as missing for a continuous endpoint.
5.2. Primary Efficacy Endpoint The primary endpoint is proportion of ASAS 40 responders at Week 24.
5.2.1. Definition ASAS response is a composite measurement of change in AS signs and symptoms.
A 40% improvement in response according to the criteria of the ASAS International Working Group (ASAS 40)1,12,15 is defined as:
NCT02438787

STELARA® (ustekinumab) Statistical Analysis Plan CNTO1275AKS3002
14 April 2017 22 Approved Date: 14 April 2017
1. An improvement of 40% from baseline and absolute improvement from baseline of at least 2 on a 0 to 10 cm scale in at least 3 of the following 4 domains:
i. Patient global ii. Total back pain iii. Function (BASFI) iv. Inflammation (average of the last 2 questions of the BASDAI concerning morning stiffness)
2. No worsening at all in the remaining domain.
Following are the definitions of each of the forgoing disease assessment criteria (components) that are used in the determination of ASAS40 response:
a) Patient’s Global Assessment: a measure from 0 (very well) to 10 (very poor) on a 0 to 10 cm VAS scale.
b) Total back pain: the average total back pain over the past week on a VAS (0 to 10 cm; 0 = no pain, 10 = most severe pain).
c) The BASFI is a subject’s self-assessment represented as a mean (VAS; 0 to 10 cm) of 10 questions, 8 of which relate to the subject’s functional anatomy and 2 of which relate to a subject’s ability to cope with everyday life.3 An increase along the scale indicates a worsening condition. (Section 5.3.3.1 for details)
d) Inflammation (average of the last 2 questions of the BASDAI concerning morning stiffness) (See Section 5.3.2.1 for BASDAI definition).
If a subject’s baseline value for a component is zero (ie, no disease activity as measured by that component), the subject should be considered as not achieving 40% improvement from baseline for that component since there is no room for improvement.
5.2.2. Analysis Methods
Analyses
To address the primary hypothesis, a Cochran-Mantel-Haenszel (CMH) test stratified by region (North America, Latin America, Western Europe, Europe, and Asia Pacific) will be used to test the difference between the ustekinumab group and the placebo group for the proportion of ASAS 40 responders at Week 24. A 95% confidence interval for the treatment difference will be calculated based on the Wald statistic18.
NCT02438787

STELARA® (ustekinumab) Statistical Analysis Plan CNTO1275AKS3002
14 April 2017 23 Approved Date: 14 April 2017
The adjusted proportion difference will be estimated as ,
where , is the number of subjects who are in the ith treatment and the jth stratum;
, is the estimated proportion of responders in the ith treatment and the jth
stratum, where i=1,2 for treatments and j=1,2,3,4 for regions.
Let , the Wald-type 95% confidence interval is defined as
Data handling rules
The data handling rules in Section 5.1.2.1 Treatment Failure, Section 5.1.2.2 Missing Data Imputation, and Section 5.1.2.3 Early Escape will be applied.
5.2.3. Sensitivity Analyses To test the robustness of the primary endpoint analysis, the following sensitivity analysis will be performed.
1. An analysis similar to that described in Section 5.2.2 will be performed with Treatment Failure, Missing Data Imputation, and Early Escape rules applied. However, subjects who discontinued study agent for any reason prior to Week 24 will be considered as ASAS 40 non-responders at Week 24.
2. An analysis similar to that described in Section 5.2.2 will be performed with Treatment Failure and Early Escape rules applied. However, Missing Data Imputation rule will not be applied.
3. ASAS 40 response status at Week 24 will be determined based on the observed data at Week 24 (retrieved dropout analysis). That is, no Treatment Failure, Missing Data Imputation, or Early Escape rules will be applied.
4. An analysis similar to that described in Section 5.2.2 will be performed with Missing Data Imputation and Early Escape rules applied. However, if at any one of the pre-week 24 visits (i.e., Weeks 4, 8, 12, 16, and 20) a subject meets any one of the treatment failure criteria and is an ASAS 40 non-responder at that visit, this subject should be considered a non-responder. Otherwise, the subject should be considered a responder for the primary efficacy analysis at Week 24 unless the subject’s ASAS 40 result at Week 24 is a non-responder.
NCT02438787

STELARA® (ustekinumab) Statistical Analysis Plan CNTO1275AKS3002
14 April 2017 24 Approved Date: 14 April 2017
5. An analysis similar to that described in Section 5.2.2 will be performed with Missing Data Imputation and Early escape rules applied. However, Treatment Failure rule will not be applied.
6. “Tipping Point analysis via exhaustive scenarios” will be performed to evaluate various deviations from the assumption of non-response. For subjects with missing response data at Week 24, responder status will be imputed in an increasing manner by subject level for each treatment group. Specifically, for each subject, a responder / non-responder status will be imputed starting with the scenario where all subjects being non-responders up to the scenario where all subjects are responders. This would include all possible scenarios of responder status for all missing data, including scenarios where subjects on ustekinumab have worse outcomes than subjects on placebo. For each scenario, an analysis similar to that described in Section 5.2.2 will be performed.
7. The following “Tipping Point” analysis based on multiple imputations will be performed to evaluate various deviations from the assumption of non-response. For the tipping point analysis, a will be assumed for each treatment group’s response rate to the imputed value for missing values based on a Bernoulli distribution. This will be repeated N (N=100) times to generate N multiple imputations. For a given value of , the analysis similar to Section 5.2.2 based on the multiple imputation approach will be carried out and the corresponding 95% CIs will be constructed to compare the difference in proportions in ASAS 40 responders between the placebo and each of ustekinumab groups. The analysis will be repeated for a range of values for (i.e. 0% to 100% in increments of 10% independently, for both the placebo and the ustekinumab group); and thus will include scenarios where subjects on ustekinumab have worse outcomes than subjects on placebo. If the number of missing subjects is less than 10 in both placebo and ustekinumab groups, then the range of values for would be 0% to 100% in increments of 25%. It should be noted that when the amount of missing data is small then this analysis should be interpreted with extra caution.
5.2.4. Analysis Methods To evaluate the consistency in the primary efficacy endpoint, ASAS 40 at Week 24, over demographic, baseline characteristics, and prior or baseline medication use, subgroup analyses will be performed. If needed, some of the cut-off points may be changed to increase sample sizes within categories.
Proportion difference and the respective 95% CIs will be used for all subgroup mentioned in this section. In addition, the nominal p-values based on CMH test controlling region for the subgroups will also be provided. The 95% CI for the treatment differences will also be calculated based on the Wald statistics. .
The subgroups are described in Section 2.4.
5.2.5. Supportive Analyses To evaluate the consistency of the primary endpoint, a supportive summary of each component of the composite endpoint will be summarized by treatment group with Treatment Failure and Early Escape rules applied. No missing data imputation rule will be applied.
NCT02438787

STELARA® (ustekinumab) Statistical Analysis Plan CNTO1275AKS3002
14 April 2017 25 Approved Date: 14 April 2017
5.3. Major Secondary Endpoints This section outlines the definition and analyses of the major secondary endpoints.
The major secondary endpoints are listed below:
1. The proportion of subjects who achieve an ASAS 20 response at Week 24
2. The proportion of subjects who achieve at least a 50% improvement from baseline in BASDAI at Week 24
3. The change from baseline in BASFI at Week 24
4. The proportion of subjects who achieve ASDAS (CRP) inactive disease (<1.3) at Week 24
5.3.1. Proportion of Subjects who Achieve an ASAS 20 Response at Week 24
5.3.1.1. Definition ASAS 20 is defined as a 20% improvement in 3 of the 4 ASAS response domains (Section 5.2.1), with an absolute improvement of at least 1 on a 0 to 10 cm scale, and absence of deterioration from baseline ( 20% and worsening of at least 1 on a 0 to 10 cm scale) in the potential remaining domain.
5.3.1.2. Analysis Methods A Cochran-Mantel-Haenszel (CMH) test stratified by region (North America, Latin America, Western Europe, Europe, and Asia Pacific) will be used to test the difference between the ustekinumab group and the placebo group for the proportion of ASAS 20 responders at Week 24. A 95% confidence interval for the treatment difference will be calculated based on the Wald statistic.
Data handling rules
Similarly, to the primary endpoint, Treatment Failure, Missing Data Imputation, and Early Escape rules will be applied.
5.3.1.3. Sensitivity Analyses ASAS 20 response status at Week 24 will be determined based on the observed data at Week 24 (retrieved dropout analysis). That is, no Treatment Failure, Missing Data Imputation, or Early Escape rules will be applied.
NCT02438787

STELARA® (ustekinumab) Statistical Analysis Plan CNTO1275AKS3002
14 April 2017 26 Approved Date: 14 April 2017
5.3.2. Proportion of Subjects who Achieve at Least a 50% Improvement from Baseline in BASDAI at Week 24
5.3.2.1. Definition The Bath Ankylosing Spondylitis Disease Activity Index (BASDAI) is a summary of six self- assessments using a VAS (0 to 10 cm) based on the following criteria:6
A. Fatigue B. Spinal pain C. Joint pain D. Enthesits E. Qualitative of morning stiffness F. Quantitative of morning stiffness
The BASDAI is a continuous parameter and is defined as follows:
BASDAI=0.2(A+B+C+D+0.5[E+F]) The index will be calculated if at least 3 of the 5 components are present. Otherwise BASDAI is missing. Percent improvement from baseline is calculated as baseline value minus post-baseline value divided by baseline value.
5.3.2.2. Analysis Methods A Cochran-Mantel-Haenszel (CMH) test stratified by region (North America, Latin America, Western Europe, Europe, and Asia Pacific) will be used to test the difference between the ustekinumab group and the placebo group for the proportion of subjects with at least 50% improvement from baseline in BASDAI at Week 24. A 95% confidence interval for the treatment difference will be calculated based on the Wald statistic.
Data handling rules Similarly, to the primary endpoint, Treatment Failure, Missing Data Imputation, and Early Escape rules will be applied.
5.3.2.3. Sensitivity Analyses The 50% improvement from baseline at Week 24 will be determined based on the observed data at Week 24 (retrieved dropout analysis). That is, no Treatment Failure, Missing Data Imputation, or Early Escape rules will be applied.
NCT02438787
STELARA® (ustekinumab) Statistical Analysis Plan CNTO1275AKS3002
14 April 2017 27 Approved Date: 14 April 2017
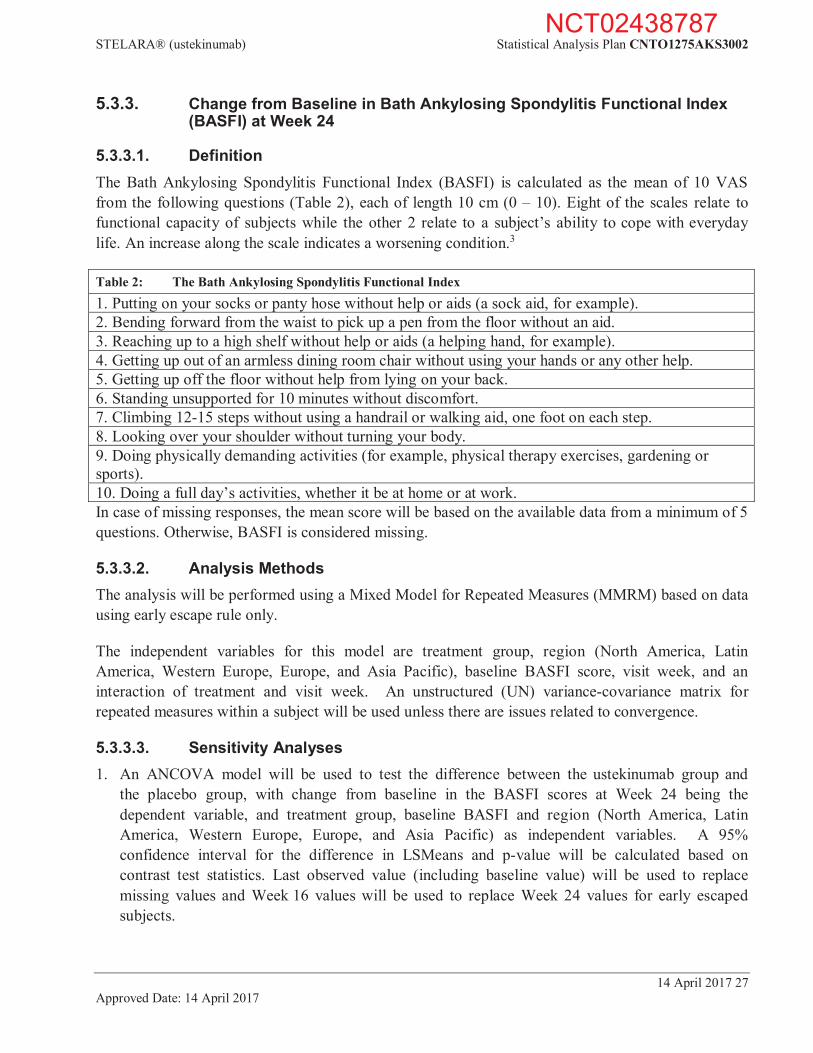
5.3.3. Change from Baseline in Bath Ankylosing Spondylitis Functional Index (BASFI) at Week 24
5.3.3.1. Definition The Bath Ankylosing Spondylitis Functional Index (BASFI) is calculated as the mean of 10 VAS from the following questions (Table 2), each of length 10 cm (0 – 10). Eight of the scales relate to functional capacity of subjects while the other 2 relate to a subject’s ability to cope with everyday life. An increase along the scale indicates a worsening condition.3
Table 2: The Bath Ankylosing Spondylitis Functional Index 1. Putting on your socks or panty hose without help or aids (a sock aid, for example). 2. Bending forward from the waist to pick up a pen from the floor without an aid. 3. Reaching up to a high shelf without help or aids (a helping hand, for example). 4. Getting up out of an armless dining room chair without using your hands or any other help.5. Getting up off the floor without help from lying on your back. 6. Standing unsupported for 10 minutes without discomfort.7. Climbing 12-15 steps without using a handrail or walking aid, one foot on each step. 8. Looking over your shoulder without turning your body.9. Doing physically demanding activities (for example, physical therapy exercises, gardening or sports). 10. Doing a full day’s activities, whether it be at home or at work.In case of missing responses, the mean score will be based on the available data from a minimum of 5 questions. Otherwise, BASFI is considered missing.
5.3.3.2. Analysis Methods The analysis will be performed using a Mixed Model for Repeated Measures (MMRM) based on data using early escape rule only.
The independent variables for this model are treatment group, region (North America, Latin America, Western Europe, Europe, and Asia Pacific), baseline BASFI score, visit week, and an interaction of treatment and visit week. An unstructured (UN) variance-covariance matrix for repeated measures within a subject will be used unless there are issues related to convergence.
5.3.3.3. Sensitivity Analyses 1. An ANCOVA model will be used to test the difference between the ustekinumab group and
the placebo group, with change from baseline in the BASFI scores at Week 24 being the dependent variable, and treatment group, baseline BASFI and region (North America, Latin America, Western Europe, Europe, and Asia Pacific) as independent variables. A 95% confidence interval for the difference in LSMeans and p-value will be calculated based on contrast test statistics. Last observed value (including baseline value) will be used to replace missing values and Week 16 values will be used to replace Week 24 values for early escaped subjects.
NCT02438787

STELARA® (ustekinumab) Statistical Analysis Plan CNTO1275AKS3002
14 April 2017 28 Approved Date: 14 April 2017
2. Tipping point analysis based on multiple imputations will be performed only if the amount of missing data is not negligible.
5.3.4. Proportion of Subjects who Achieve ASDAS (CRP) inactive disease (<1.3) at Week 24
5.3.4.1. Definition The ASAS has developed a disease activity score (DAS) for use in AS, the Ankylosing Spondylitis Disease Activity Score (ASDAS).2,10,14 For this study the following formula will be used to calculate the ASDAS score:
ASDAS (CRP) = 0.121 x Total back pain + 0.058 x Duration of morning stiffness + 0.110 x Patient global assessment + 0.073 x Peripheral pain/ swelling + 0.579 x Ln (CRP (mg/L) +1).
Where:
Total back pain is BASDAI question 2 (VAS 0-10 cm);
Duration of morning stiffness is BASDAI question 6 (VAS 0-10 cm); Patient global assessment is patient global activity (VAS 0-10 cm);
Peripheral pain/swelling is BASDAI question 3 (VAS 0-10 cm); CRP: C-reactive protein the natural log in mg/L + 1.
When the hsCRP level is <2 mg/L, a value of 2 mg/L should be used to calculate the ASDAS score.11 For non-ASDAS summaries of CRP, if the value is <LLOQ, then half of the value of LLOQ will be used for numerical calculations.
5.3.4.2. Analysis Methods A Cochran-Mantel-Haenszel (CMH) test stratified by region (North America, Latin America, Western Europe, Europe, and Asia Pacific) will be used to test the difference between the ustekinumab group and the placebo group for the proportion of subjects who achieve ASDAS (CRP) inactive disease (<1.3) at Week 24. A 95% confidence interval for the treatment difference will be calculated based on the Wald statistic.
Data handling rules
Similarly to the primary endpoint, Treatment Failure, Missing Data Imputation, and Early Escape rules will be applied.
5.3.4.3. Sensitivity Analyses ASDAS (CRP) inactive disease status at Week 24 will be determined based on the observed data at Week 24 (retrieved dropout analysis). That is, no Treatment Failure, Missing Data Imputation, or Early Escape rules will be applied.
NCT02438787

STELARA® (ustekinumab) Statistical Analysis Plan CNTO1275AKS3002
14 April 2017 29 Approved Date: 14 April 2017
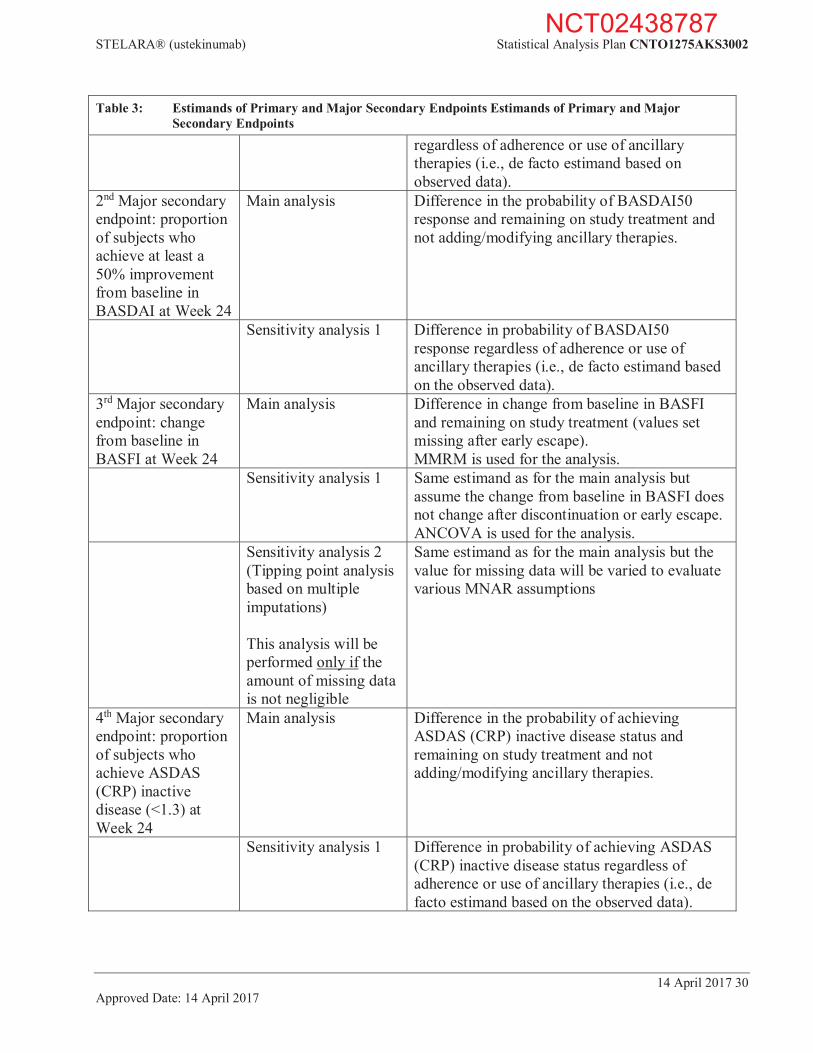
5.4. Estimands of Primary and Major Secondary Endpoints The following Table 3 outlines the targeted estimands of primary and major secondary efficacy endpoints including related sensitivity analyses.
Table 3: Estimands of Primary and Major Secondary Endpoints Estimands of Primary and Major Secondary Endpoints
Variable Analysis Estimand/change in assumption(s) Primary endpoint: proportion of ASAS 40 responders at Week 24
Primary analysis Difference in the probability of ASAS40 response and remaining on study treatment and not adding/modifying ancillary therapies.
Sensitivity analysis 1 Same estimand as for the primary analysis but consider subjects with study agent discontinuation prior to Week 24 for any reason as non-responder.
Sensitivity analysis 2 Same estimand as for the primary analysis but exclude subjects with missing data (ie, ASAS40 response cannot be determined due to missing components).
Sensitivity analysis 3 Difference in probability of ASAS40 response regardless of adherence or use of ancillary therapies (i.e., de facto estimand based on the observed data).
Sensitivity analysis 4 Same estimand as for the primary analysis but consider only the cases with non-response status and meeting treatment failure criteria as treatment failure.
Sensitivity analysis 5 Same estimand as for the primary analysis but no treatment failure rule is applied in this analysis.
Sensitivity analysis 6 (Tipping point analysis via exhaustive scenarios)
Same estimand as for the primary analysis but the response for missing data will be varied to evaluate various deviations from the assumption of non-response.
Sensitivity analysis 7 (Tipping point analysis based on multiple imputations)
Same estimand as for the primary analysis but the response for missing data will be varied to evaluate various deviations from the assumption of non-response.
1st Major secondary endpoint: proportion of subjects who achieve an ASAS 20 response at Week 24
Main analysis Difference in the probability of ASAS20 response and remaining on study treatment and not adding/modifying ancillary therapies.
Sensitivity analysis 2 Difference in probability of ASAS20 response
NCT02438787
STELARA® (ustekinumab) Statistical Analysis Plan CNTO1275AKS3002
14 April 2017 30 Approved Date: 14 April 2017
Table 3: Estimands of Primary and Major Secondary Endpoints Estimands of Primary and Major Secondary Endpoints
regardless of adherence or use of ancillary therapies (i.e., de facto estimand based on observed data).
2nd Major secondary endpoint: proportion of subjects who achieve at least a 50% improvement from baseline in BASDAI at Week 24
Main analysis Difference in the probability of BASDAI50 response and remaining on study treatment and not adding/modifying ancillary therapies.
Sensitivity analysis 1 Difference in probability of BASDAI50 response regardless of adherence or use of ancillary therapies (i.e., de facto estimand based on the observed data).
3rd Major secondary endpoint: change from baseline in BASFI at Week 24
Main analysis Difference in change from baseline in BASFI and remaining on study treatment (values set missing after early escape). MMRM is used for the analysis.
Sensitivity analysis 1 Same estimand as for the main analysis but assume the change from baseline in BASFI does not change after discontinuation or early escape. ANCOVA is used for the analysis.
Sensitivity analysis 2 (Tipping point analysis based on multiple imputations) This analysis will be performed only if the amount of missing data is not negligible
Same estimand as for the main analysis but the value for missing data will be varied to evaluate various MNAR assumptions
4th Major secondary endpoint: proportion of subjects who achieve ASDAS (CRP) inactive disease (<1.3) at Week 24
Main analysis Difference in the probability of achieving ASDAS (CRP) inactive disease status and remaining on study treatment and not adding/modifying ancillary therapies.
Sensitivity analysis 1 Difference in probability of achieving ASDAS (CRP) inactive disease status regardless of adherence or use of ancillary therapies (i.e., de facto estimand based on the observed data).
NCT02438787
STELARA® (ustekinumab) Statistical Analysis Plan CNTO1275AKS3002
14 April 2017 31 Approved Date: 14 April 2017
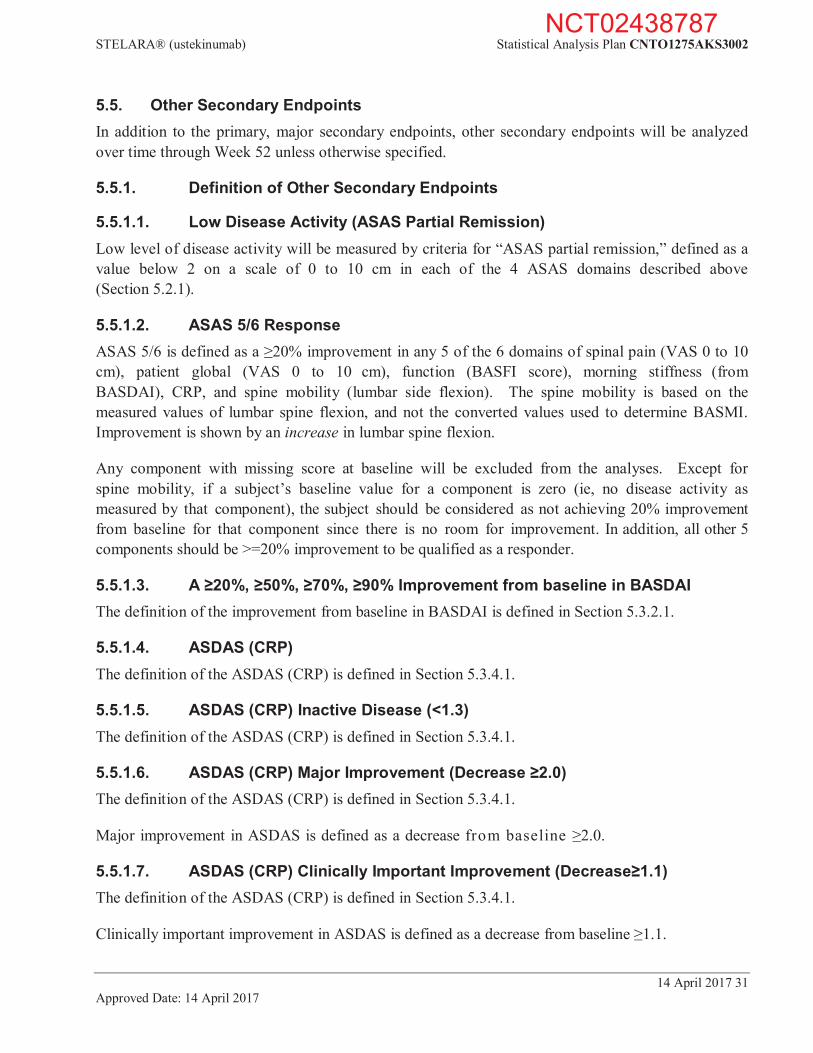
5.5. Other Secondary Endpoints In addition to the primary, major secondary endpoints, other secondary endpoints will be analyzed over time through Week 52 unless otherwise specified.
5.5.1. Definition of Other Secondary Endpoints
5.5.1.1. Low Disease Activity (ASAS Partial Remission) Low level of disease activity will be measured by criteria for “ASAS partial remission,” defined as a value below 2 on a scale of 0 to 10 cm in each of the 4 ASAS domains described above (Section 5.2.1).
5.5.1.2. ASAS 5/6 Response ASAS 5/6 is defined as a 20% improvement in any 5 of the 6 domains of spinal pain (VAS 0 to 10 cm), patient global (VAS 0 to 10 cm), function (BASFI score), morning stiffness (from BASDAI), CRP, and spine mobility (lumbar side flexion). The spine mobility is based on the measured values of lumbar spine flexion, and not the converted values used to determine BASMI. Improvement is shown by an in lumbar spine flexion.
Any component with missing score at baseline will be excluded from the analyses. Except for spine mobility, if a subject’s baseline value for a component is zero (ie, no disease activity as measured by that component), the subject should be considered as not achieving 20% improvement from baseline for that component since there is no room for improvement. In addition, all other 5 components should be >=20% improvement to be qualified as a responder.
5.5.1.3. A 20%, 50%, 70%, 90% Improvement from baseline in BASDAI The definition of the improvement from baseline in BASDAI is defined in Section 5.3.2.1.
5.5.1.4. ASDAS (CRP) The definition of the ASDAS (CRP) is defined in Section 5.3.4.1.
5.5.1.5. ASDAS (CRP) Inactive Disease (<1.3) The definition of the ASDAS (CRP) is defined in Section 5.3.4.1.
5.5.1.6. ASDAS (CRP) Major Improvement (Decrease 2.0) The definition of the ASDAS (CRP) is defined in Section 5.3.4.1.
Major improvement in ASDAS is defined as a decrease from baseline 2.0.
5.5.1.7. ASDAS (CRP) Clinically Important Improvement (Decrease 1.1) The definition of the ASDAS (CRP) is defined in Section 5.3.4.1.
Clinically important improvement in ASDAS is defined as a decrease from baseline 1.1.
NCT02438787
STELARA® (ustekinumab) Statistical Analysis Plan CNTO1275AKS3002
14 April 2017 32 Approved Date: 14 April 2017
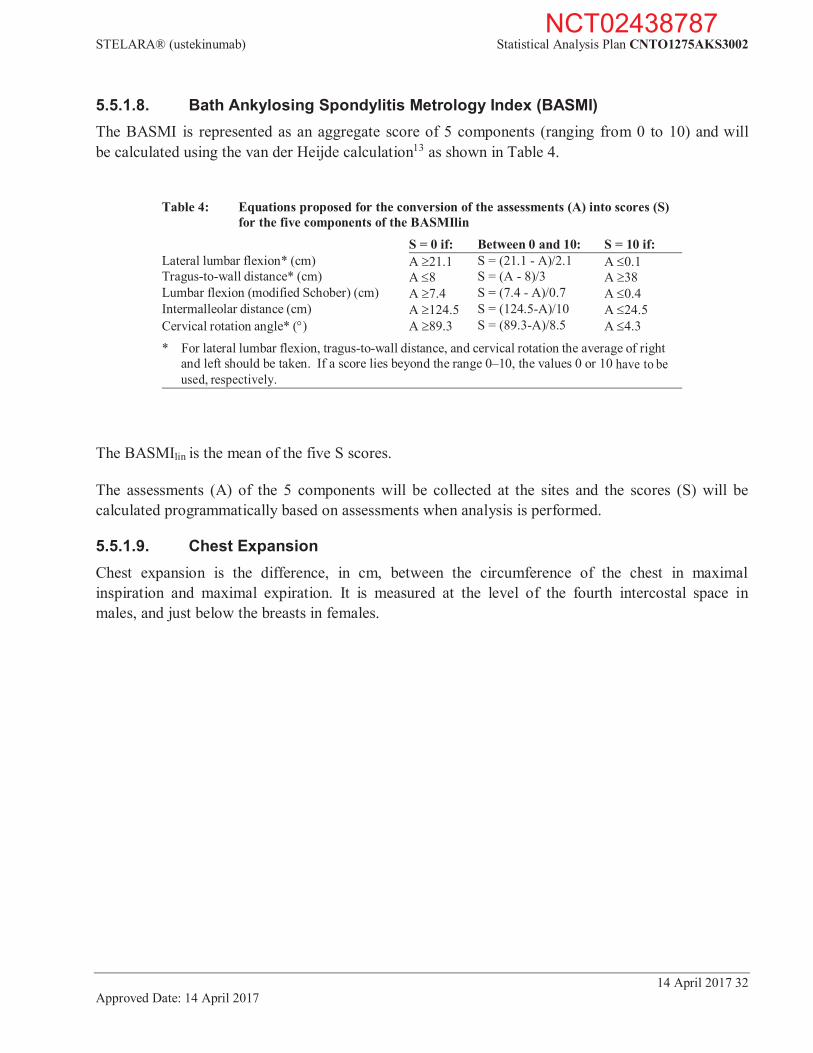
5.5.1.8. Bath Ankylosing Spondylitis Metrology Index (BASMI) The BASMI is represented as an aggregate score of 5 components (ranging from 0 to 10) and will be calculated using the van der Heijde calculation13 as shown in Table 4.
Table 4: Equations proposed for the conversion of the assessments (A) into scores (S)
for the five components of the BASMIlin S = 0 if: Between 0 and 10: S = 10 if: Lateral lumbar flexion* (cm) A 21.1 S = (21.1 - A)/2.1 A 0.1 Tragus-to-wall distance* (cm) A 8 S = (A - 8)/3 A 38 Lumbar flexion (modified Schober) (cm) A 7.4 S = (7.4 - A)/0.7 A 0.4 Intermalleolar distance (cm) A 124.5 S = (124.5-A)/10 A 24.5 Cervical rotation angle* ( ) A 89.3 S = (89.3-A)/8.5 A 4.3
* For lateral lumbar flexion, tragus-to-wall distance, and cervical rotation the average of right and left should be taken. If a score lies beyond the range 0–10, the values 0 or 10 have to be used, respectively.
The BASMIlin is the mean of the five S scores.
The assessments (A) of the 5 components will be collected at the sites and the scores (S) will be calculated programmatically based on assessments when analysis is performed.
5.5.1.9. Chest Expansion Chest expansion is the difference, in cm, between the circumference of the chest in maximal inspiration and maximal expiration. It is measured at the level of the fourth intercostal space in males, and just below the breasts in females.
NCT02438787
STELARA® (ustekinumab) Statistical Analysis Plan CNTO1275AKS3002
14 April 2017 33 Approved Date: 14 April 2017
5.5.1.10. MASES Enthesitis Scores Enthesitis will be assessed using the Maastricht Ankylosing Spondylitis Enthesitis Score (MASES) index in this study.7
The MASES index was developed to assess enthesitis in subjects with ankylosing spondylitis, and evaluates the presence or absence of pain by applying local pressure to the following entheses:
1st costochondral joint, left and right;
7th costochondral joint, left and right;
posterior superior iliac spine, left and right;
anterior superior iliac spine, left and right;
iliac crest, left and right;
5th lumbar spinous process;
proximal insertion of Achilles tendon, left and right.
Entheses are scored as either 0 (nontender) or 1 (tender). The enthesitis index is a total score of 13 evaluated sites as listed above with a range from 0 to 13.
5.5.1.11. Inflammation Inflammation is defined as average of the last 2 questions of the BASDAI concerning morning stiffness). It is one of the components of ASAS 40. One question measures overall level of morning stiffness from the time you wake up in the last 7 days on a VAS (0 to 10 cm; 0 = no stiffness, 10 = very severe stiffness). The other question measures duration of morning stiffness from the time you wake up on a VAS (0 to 10 cm; 0 = 0 hours, 10 = 2 or more hours).
5.5.1.12. Total Back Pain The total back pain is one of the components of ASAS 40. It is measured on a VAS (0 to 10 cm; 0 = no pain, 10 = most severe pain).
40% improvement in Total Back Pain
If a subject’s baseline value is zero (ie. no pain), the subject should be considered as not achieving 40% improvement from baseline since there is no room for improvement.
5.5.1.13. Night Back Pain Subjects will be asked to assess their nighttime back pain during the past week on a VAS (0 to 10 cm; 0 = no pain, 10 = most severe pain).
5.5.1.14. Patient Global Assessment The Patient’s Global Assessment of Disease Activity is one of the components of ASAS 40. It is measured on a VAS (0 to 10 cm; 0 = very well, 10 = very poor).
NCT02438787

STELARA® (ustekinumab) Statistical Analysis Plan CNTO1275AKS3002
14 April 2017 34 Approved Date: 14 April 2017
40% improvement in Patient Global Assessment If a subject’s baseline value is zero (ie. no pain), the subject should be considered as not achieving 40% improvement from baseline since there is no room for improvement.
5.5.1.15. 36-Item Short-form Health Survey The SF-36 is a health-related quality of life instrument with 36 questions. Version 2 will be used. This instrument yields an 8-scale profile of functional health and well-being scores as well as psychometrically-based physical and mental health summary measures. The 8 multi-item scales of SF-36 instrument are as follows:
limitations in physical functioning due to health problems;
limitations in usual role activities due to physical health problems;
bodily pain;
general mental health (psychological distress and well-being);
limitations in usual role activities due to personal or emotional problems;
limitations in social functioning due to physical or mental health problems;
vitality (energy and fatigue);
general health perception.
These scales are scored from 0 to 100 with higher scores indicating better health. The 2 aggregate summary scores, the Physical Component Summary (PCS) and the Mental Component Summary (MCS), are based on the 8 subscales. The PCS, MCS, and the 8 subscales are scored using a norm-based system where linear transformations are performed to transform scores to a mean of 50 and standard deviations of 10, based upon general US population norms. The concepts measured by the SF-36 are not specific to any age, disease, or treatment group, allowing comparison of relative burden of different diseases and the relative benefit of different treatments16,17. High scores indicate better health for both summary scores (PCS and MCS) and all 8 subscales.
For partially answered questionnaires, if more than 50% of the items within each scale are left unanswered, that scale score for the subject will be assigned as missing. If at least 50% of the items within each scale are answered, the missing item scores will be imputed with the average score for the subject across completed items in the same scale.
NCT02438787

STELARA® (ustekinumab) Statistical Analysis Plan CNTO1275AKS3002
14 April 2017 35 Approved Date: 14 April 2017
5.5.1.16. Medical Outcomes Study Sleep Scale (MOS-SS) The extent of sleep problems will be assessed using the Medical Outcomes Study Sleep Scale (MOS-SS).8 The MOS Sleep Scale is a generic health measure, assessing a health-related quality of life (HRQOL) concept- sleep that is relevant to everyone’s health status and well-being and known to be directly affected by disease and treatment. MOS-SS measures six dimensions of sleep, including initiation, maintenance (eg, staying asleep), quantity, adequacy, somnolence (eg, drowsiness), and respiratory impairments (eg, shortness of breath, snoring). A composite sleep problems index score can also be generated.
The scale uses predominantly Likert-type questions to evaluate sleep. Scales range from 1 (meaning “all of the time”) to 6 (“none of the time”), and require respondents to indicate how frequently during the previous 4 weeks they have experienced certain sleep-related issues.
Several of these items are reverse scored. Another Likert-type item queries sleep latency (1 = “0–15 min” and 5 = “more than 60 min”). Finally, a fill-in-the blank question asks participants to estimate the average number of hours they have slept each night in the past month – a response of 8 h or greater receives a 1, while answers below 8 h receive 0.
5.5.1.17. Ankylosing Spondylitis Quality of Life (ASQoL) Questionnaire Ankylosing spondylitis quality of life questionnaire is a self-administered patient-reported outcomes instrument.4 It consists of 18 items requesting a Yes or No response to questions related to the impact of pain on sleep, mood, motivation, ability to cope, activities of daily living, independence, relationships, and social life. A score of 1 is given to a response of ‘YES” on each item and all item scores are summed to a total score with a range of 0–18. Higher scores indicate worse health related quality of life. Subjects can complete the instrument in less than four minutes.
5.5.1.18. EuroQol 5 Dimension Questionnaire (EQ-5D) The EQ-5D is a standardized measure of health status developed by the EuroQoL Group in order to provide a simple, generic measure of health for clinical and economic appraisal.5 Applicable to a wide range of health conditions and treatments, it provides a simple descriptive profile and a single index value for health status that can be used in the clinical economic evaluation of health care. The EQ-5D descriptive system comprises the following 5 dimensions: mobility, self-care, usual activities, pain/discomfort and anxiety/depression. There are 3 response options: no problems, some problems, severe problems. The EQ VAS records the respondent’s self-rated health on a vertical, visual analog scale where the endpoints are labeled “Best imaginable health state” and “Worst imaginable health state.” The EQ VAS is used as a quantitative measure of health outcome as judged by the individual respondent. The US model will be used for analyses.
NCT02438787

STELARA® (ustekinumab) Statistical Analysis Plan CNTO1275AKS3002
14 April 2017 36 Approved Date: 14 April 2017
5.5.1.19. Functional Assessment of Chronic Illness Therapy-Fatigue Questionnaire (FACIT-Fatigue)
The Functional Assessment of Chronic Illness Therapy-Fatigue (FACIT-F) questionnaire consists of 13 questions that assess a subject’s level of fatigue and tiredness over the last 7 days. Each question is graded on a 5-point scale (0 = not at all; 1 = a little bit; 2 = somewhat; 3 = quite a bit; 4 = very much); then scored 0 to 4; accordingly, total scores can range from 0 to 52. Lower score reflects more severe fatigue.
5.5.2. Analysis Methods for Other Secondary Endpoints Unless otherwise specified, the analysis population will be the FAS defined in Section 2.3.1. The following endpoints will be summarized by treatment groups.
Summaries over time will be for all visits data collected through Week 52. Simple descriptive summary statistics, such as n, mean, SD, median, IQ range, minimum, and maximum for continuous variables, and counts and percentages for discrete variables will be used to summarize most data.
Nominal p-values will be provided at each visit through Week 24.
1. For dichotomous endpoints, Cochran-Mantel-Haenszel (CMH) test stratified by region (North America, Latin America, Western Europe, Europe, and Asia Pacific) will be used. A 95% confidence interval for the treatment difference will be calculated based on the Wald statistic.
2. For continuous endpoints, a Mixed Model for Repeated Measures (MMRM) will be used.
The independent variables for this model are treatment group, region (North America, Latin America, Western Europe, Europe, and Asia Pacific), baseline value, visit week, and an interaction of treatment and visit week. An unstructured (UN) variance-covariance matrix for repeated measures within a subject will be used unless there are issues related to convergence.
The following Table 5 outlines the efficacy endpoints, type of the analyses, and the data handling rules used through Week 24. After Week 24, no treatment failure rule and no missing data imputation rules will be applied. All early escaped subjects will be excluded in the analyses after Week 24.
NCT02438787
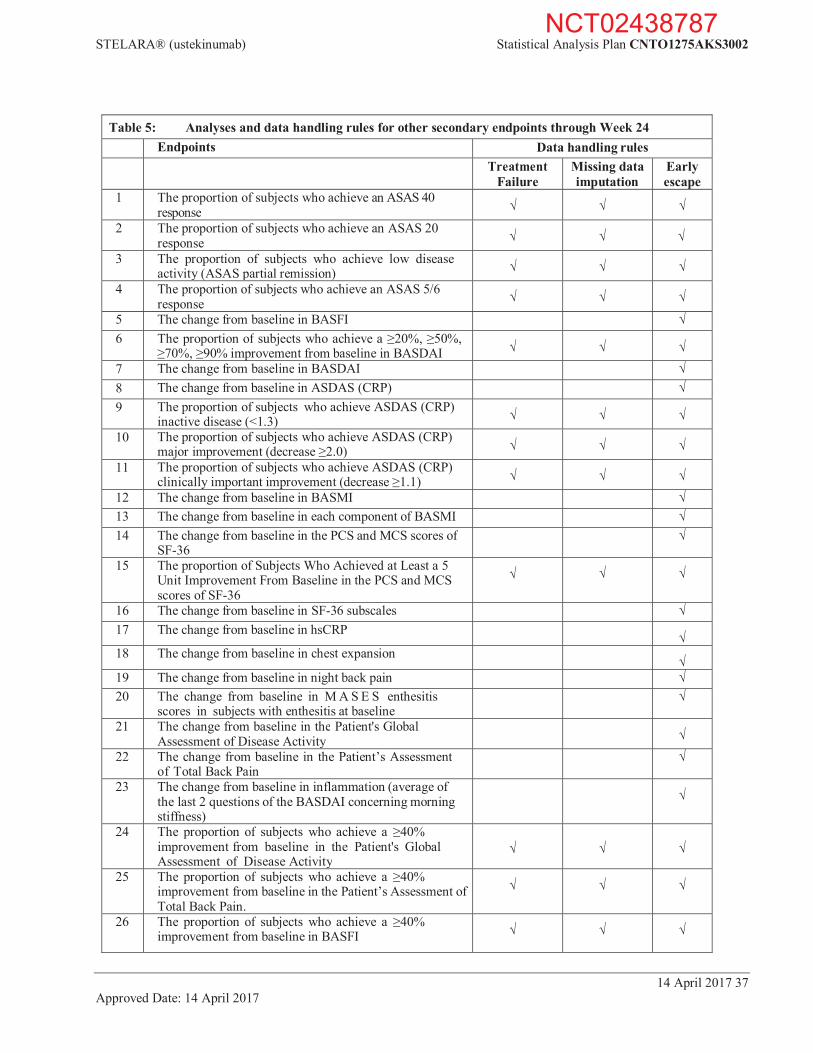
STELARA® (ustekinumab) Statistical Analysis Plan CNTO1275AKS3002
14 April 2017 37 Approved Date: 14 April 2017
Table 5: Analyses and data handling rules for other secondary endpoints through Week 24 Endpoints Data handling rules
Treatment Failure
Missing data imputation
Early escape
1 The proportion of subjects who achieve an ASAS 40 response
2 The proportion of subjects who achieve an ASAS 20 response
3 The proportion of subjects who achieve low disease activity (ASAS partial remission)
4 The proportion of subjects who achieve an ASAS 5/6 response
5 The change from baseline in BASFI 6 The proportion of subjects who achieve a 20%, 50%,
70%, 90% improvement from baseline in BASDAI
7 The change from baseline in BASDAI 8 The change from baseline in ASDAS (CRP) 9 The proportion of subjects who achieve ASDAS (CRP)
inactive disease (<1.3)
10 The proportion of subjects who achieve ASDAS (CRP) major improvement (decrease 2.0)
11 The proportion of subjects who achieve ASDAS (CRP) clinically important improvement (decrease 1.1)
12 The change from baseline in BASMI 13 The change from baseline in each component of BASMI 14 The change from baseline in the PCS and MCS scores of
SF-36
15 The proportion of Subjects Who Achieved at Least a 5 Unit Improvement From Baseline in the PCS and MCS scores of SF-36
16 The change from baseline in SF-36 subscales 17 The change from baseline in hsCRP
18 The change from baseline in chest expansion
19 The change from baseline in night back pain 20 The change from baseline in M A S E S enthesitis
scores in subjects with enthesitis at baseline
21 The change from baseline in the Patient's GlobalAssessment of Disease Activity
22 The change from baseline in the Patient’s Assessment
of Total Back Pain
23 The change from baseline in inflammation (average of the last 2 questions of the BASDAI concerning morning stiffness)
24 The proportion of subjects who achieve a 40%improvement from baseline in the Patient's Global Assessment of Disease Activity
25 The proportion of subjects who achieve a 40%improvement from baseline in the Patient’s Assessment of Total Back Pain.
26 The proportion of subjects who achieve a 40%improvement from baseline in BASFI
NCT02438787
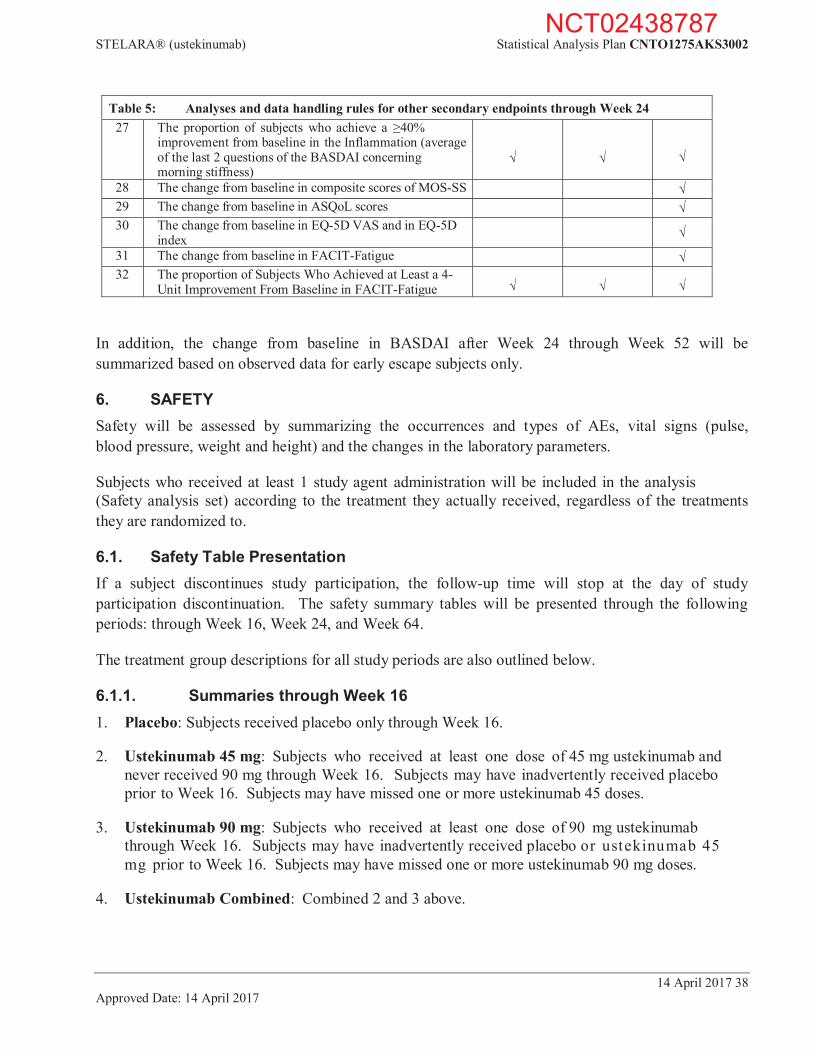
STELARA® (ustekinumab) Statistical Analysis Plan CNTO1275AKS3002
14 April 2017 38 Approved Date: 14 April 2017
Table 5: Analyses and data handling rules for other secondary endpoints through Week 24 27 The proportion of subjects who achieve a 40%
improvement from baseline in the Inflammation (average of the last 2 questions of the BASDAI concerning morning stiffness)
28 The change from baseline in composite scores of MOS-SS 29 The change from baseline in ASQoL scores 30 The change from baseline in EQ-5D VAS and in EQ-5D
index
31 The change from baseline in FACIT-Fatigue 32 The proportion of Subjects Who Achieved at Least a 4-
Unit Improvement From Baseline in FACIT-Fatigue
In addition, the change from baseline in BASDAI after Week 24 through Week 52 will be summarized based on observed data for early escape subjects only.
6. SAFETY Safety will be assessed by summarizing the occurrences and types of AEs, vital signs (pulse, blood pressure, weight and height) and the changes in the laboratory parameters.
Subjects who received at least 1 study agent administration will be included in the analysis (Safety analysis set) according to the treatment they actually received, regardless of the treatments they are randomized to.
6.1. Safety Table Presentation If a subject discontinues study participation, the follow-up time will stop at the day of study participation discontinuation. The safety summary tables will be presented through the following periods: through Week 16, Week 24, and Week 64.
The treatment group descriptions for all study periods are also outlined below.
6.1.1. Summaries through Week 16 1. Placebo: Subjects received placebo only through Week 16.
2. Ustekinumab 45 mg: Subjects who received at least one dose of 45 mg ustekinumab and never received 90 mg through Week 16. Subjects may have inadvertently received placebo prior to Week 16. Subjects may have missed one or more ustekinumab 45 doses.
3. Ustekinumab 90 mg: Subjects who received at least one dose of 90 mg ustekinumab through Week 16. Subjects may have inadvertently received placebo or ustekinumab 45 mg prior to Week 16. Subjects may have missed one or more ustekinumab 90 mg doses.
4. Ustekinumab Combined: Combined 2 and 3 above.
NCT02438787

STELARA® (ustekinumab) Statistical Analysis Plan CNTO1275AKS3002
14 April 2017 39 Approved Date: 14 April 2017
The treatment groups above are mutually exclusive for 1, 2, and 3. The safety tables will have the column headings below:
Placebo
Ustekinumab 45 mg 90 mg Combined
6.1.2. Summaries through Week 24 Based on the protocol, subjects who qualified for early escape begin to receive golimumab at Week 16. Please note after Week 16, AE rates across treatment groups are no longer based upon subjects’ initial randomized treatment assignments and/or initially assigned treatment (due to early escape and/or crossover), and the number of subjects and/or the lengths of follow-up may differ among the groups.
See the column headings below for the safety tables through Week 24:
Placebo/
Early Escape Ustekinumab 45 mg/
Early Escape Ustekinumab 90 mg/
Early Escape
Placeboa
(Placebo
Golimumab)b
45 mg Onlya
(45 mg
Golimumab)b
90 mg Onlya
(90 mg
Golimumab)b
Ustekinumab Only
Combineda
a Includes all subjects, but adverse events for subjects who early escaped at Week 16 are only counted up to Week 16. b Only includes subjects who early escaped at Week 16. Adverse events are counted from early escape onward.
6.1.3. Summaries through Week 64 Subjects who were randomized to placebo and did not qualify for early escape are re-randomized at Week 24 to receive either ustekinumab 45 mg or ustekinumab 90 mg. These summaries through Week 64 will be based on subjects who have been treated with ustekinumab and will exclude subjects who only received placebo.
See below for a sample layout.
Placebo->Ustekinumaba
Ustekinumab Onlyb Ustekinumab Combined
Placebo45 mg
Placebo90 mg
45 mg
90 mg
45 mg
90 mg
All Ustekinumab
a Placebo subjects who crossed over at Week 24. b Adverse events for subjects who early escaped at Week 16 are only counted up to Week 16. Selected safety summaries and listings will also be performed through Week 64 for subjects who early escaped to golimumab.
NCT02438787

STELARA® (ustekinumab) Statistical Analysis Plan CNTO1275AKS3002
14 April 2017 40 Approved Date: 14 April 2017
6.2. Adverse Events Treatment-emergent AEs will be summarized by system organ class and preferred term defined by MedDRA.
The following treatment-emergent AE summary tables will be provided for this study:
Any AEs
SAEs
AEs with severe intensity
AEs and SAEs that are reasonably related to study agent
AEs leading to discontinuation of study agent
Injection site reactions
Infections and infections requiring oral or parenteral anti-microbial treatment
Serious infections
In addition to the summary tables, the incidence per 100 subject-years for select events including but not limited to serious infection and malignancies will be provided, and a listing of subjects who died and listings of subjects with the following AEs will be presented: SAEs, AEs leading to discontinuation of study agent, anaphylactic reactions, serum sickness reactions, malignancy, active tuberculosis, opportunistic infections, injection site reactions, and hepatobiliary events (defined as ALT 3 × ULN and bilirubin 2 × ULN).
Injection site reactions and infection:
An injection site reaction is defined as any adverse react ion at a SC study agent inject ion site and is captured in the eCRF.
An infection is identified as any AE that was recorded as an infection by the investigator on the eCRF.
Since safety should be assessed relative to exposure, the following summaries will be presented:
Proportion of subjects receiving scheduled study agent administrations at each study agent administration visit by treatment group
Summary of cumulative ustekinumab dose by treatment group
In addition, all AE summary tables will include average weeks of follow-up and average number of administrations for each treatment group.
6.3. Clinical Laboratory Tests The laboratory parameters include but are not limited to the following:
Hematology: RBC, hemoglobin, hematocrit, neutrophils, lymphocytes, monocytes, eosinophils, platelets, and WBC count.
NCT02438787
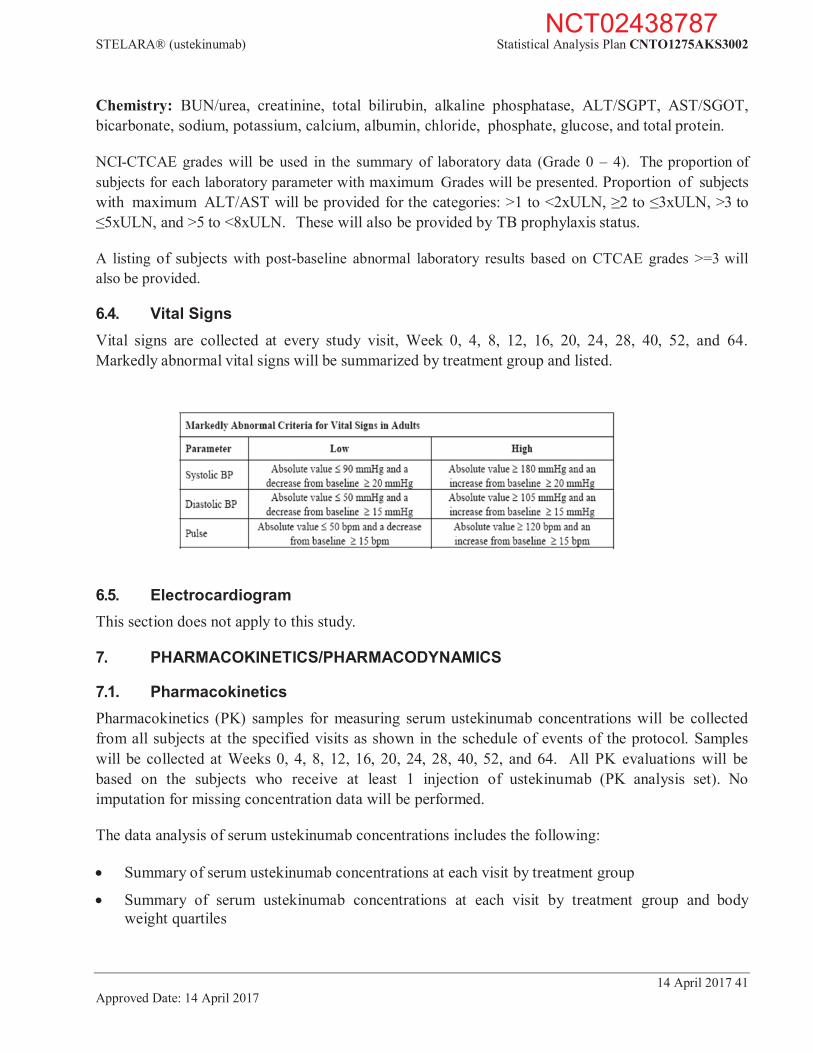
STELARA® (ustekinumab) Statistical Analysis Plan CNTO1275AKS3002
14 April 2017 41 Approved Date: 14 April 2017
Chemistry: BUN/urea, creatinine, total bilirubin, alkaline phosphatase, ALT/SGPT, AST/SGOT, bicarbonate, sodium, potassium, calcium, albumin, chloride, phosphate, glucose, and total protein.
NCI-CTCAE grades will be used in the summary of laboratory data (Grade 0 – 4). The proportion of subjects for each laboratory parameter with maximum Grades will be presented. Proportion of subjects with maximum ALT/AST will be provided for the categories: >1 to <2xULN, 2 to 3xULN, >3 to
5xULN, and >5 to <8xULN. These will also be provided by TB prophylaxis status.
A listing of subjects with post-baseline abnormal laboratory results based on CTCAE grades >=3 will also be provided.
6.4. Vital Signs Vital signs are collected at every study visit, Week 0, 4, 8, 12, 16, 20, 24, 28, 40, 52, and 64. Markedly abnormal vital signs will be summarized by treatment group and listed.
6.5. Electrocardiogram This section does not apply to this study.
7. PHARMACOKINETICS/PHARMACODYNAMICS
7.1. Pharmacokinetics Pharmacokinetics (PK) samples for measuring serum ustekinumab concentrations will be collected from all subjects at the specified visits as shown in the schedule of events of the protocol. Samples will be collected at Weeks 0, 4, 8, 12, 16, 20, 24, 28, 40, 52, and 64. All PK evaluations will be based on the subjects who receive at least 1 injection of ustekinumab (PK analysis set). No imputation for missing concentration data will be performed.
The data analysis of serum ustekinumab concentrations includes the following:
Summary of serum ustekinumab concentrations at each visit by treatment group
Summary of serum ustekinumab concentrations at each visit by treatment group and body weight quartiles
NCT02438787
STELARA® (ustekinumab) Statistical Analysis Plan CNTO1275AKS3002
14 April 2017 42 Approved Date: 14 April 2017
Summary of serum ustekinumab concentrations at each visit by treatment group and baseline MTX (Yes, No)
Summary of serum ustekinumab concentrations by CRP levels at baseline
Proportion of subjects without detectable serum ustekinumab concentration at each visit by treatment group
Median serum ustekinumab concentrations plotted over time by treatment group.
In addition, the relationship between serum ustekinumab concentrations, and antibody to ustekinumab status, safety and efficacy may be explored. Median trough serum ustekinumab concentrations will be plotted. Box plots of serum ustekinumab concentrations will be plotted by percentage subjects who achieved ASAS 20 and ASAS 40 responses.
For summary statistics of serum ustekinumab concentrations, concentration values below the lower limit of quantification will be treated as zero. Once a subject meets one of the following dosing deviation criteria, the subject’s data will be excluded from the by-visit data analyses from that point onwards.
Dosing deviation criteria:
Discontinue study agent administrations
Skipped an administration
Received an incorrect dose
Received an incorrect study agent
Received an additional dose
In addition, if a subject has an administration more than 7 days earlier or later than the scheduled dosing date, the concentration data collected between such a dosing visit and the subsequent dosing visit will be excluded from the by-visit data analyses. For the Week 24 visit, if the PK sampling time deviates more than 3 days earlier or later than the scheduled date, the PK concentration at this visit will be excluded from the by-visit data analysis. Additional exclusions for incongruous PK data to be implemented based on Janssen TV-SOP-11008v3.0.
Population PK analyses will be performed to characterize the population PK parameters based on the available ustekinumab concentration data obtained through the Week 24 visit. The population pharmacokinetic approach will also be used to identify and quantify any significant covariates such as demographic characteristics (including but not limited to body weight, ethnic origin, sex, and age) and concomitant medications that have substantial impact on the population pharmacokinetics of ustekinumab in subjects with AS. A detailed analysis plan for population PK analysis will be developed separately, and a stand-alone technical report will be written to summarize the results of the population PK analysis.
NCT02438787

STELARA® (ustekinumab) Statistical Analysis Plan CNTO1275AKS3002
14 April 2017 43 Approved Date: 14 April 2017
PK analyses presentation PK analyses will be summarized through the following time periods:
Through Week 24
Through Week 52
Through Week 64
For the analyses, a subject is included in one and only one treatment group on the basis of the treatment regimen followed. The descriptions of treatment groups for all reporting periods are as follows.
7.1.1. PK Treatment Groups Through Week 24 1. Ustekinumab 45 mg: Subjects randomized to ustekinumab 45 mg and received 45 mg
ustekinumab through Week 24.
2. Ustekinumab 90 mg: Subjects randomized to ustekinumab 90 mg and received 90 mg ustekinumab through Week 24.
7.1.2. PK Treatment Groups Through Week 52 1. Placebo Ustekinumab 45 mg: Subjects randomized to placebo and were switched over to
ustekinumab 45 mg at Week 24 and continue to receive ustekinumab 45 mg through Week 52.
2. Ustekinumab 45 mg: Subjects randomized to ustekinumab 45 mg and received 45 mg ustekinumab through Week 52.
3. Placebo Ustekinumab 90 mg: Subjects randomized to placebo and were switched over to ustekinumab 90 mg at Week 24 and continue to receive ustekinumab 90 mg through Week 52.
4. Ustekinumab 90 mg: Subjects randomized to ustekinumab 90 mg and received 90 mg ustekinumab through Week 52.
7.1.3. PK Treatment Groups Through Week 64 1. Placebo Ustekinumab 45 mg: Subjects randomized to placebo and were switched over to
ustekinumab 45 mg at Week 24 and continue to receive ustekinumab 45 mg through the end of the study.
2. Ustekinumab 45 mg: Subjects randomized to ustekinumab 45 mg and received 45 mg ustekinumab through the end of the study.
3. Placebo Ustekinumab 90 mg: Subjects randomized to placebo and were switched over to ustekinumab 90 mg at Week 24 and continue to receive ustekinumab 90 mg through the end of the study.
NCT02438787

STELARA® (ustekinumab) Statistical Analysis Plan CNTO1275AKS3002
14 April 2017 44 Approved Date: 14 April 2017
4. Ustekinumab 90 mg: Subjects randomized to ustekinumab 90 mg and received 90 mg ustekinumab through the end of the study.
7.2. Immune Response Blood samples will be collected to examine the formation of antibodies to ustekinumab at the specified visits as shown in the schedule of events of the protocol (Weeks 0, 4, 8, 12, 24, 40, 52, and 64). For subjects who discontinue study agent administrations, samples will be collected at their final safety visit, 12 weeks after the last study agent administration.
The data analysis of antibodies to ustekinumab includes the following will be provided:
The summary of subjects’ antibody status (positive, negative) by ustekinumab treatment groups
A listing of subjects who are positive for antibodies to ustekinumab.
A summary of subject’s neutralizing antibody status (positive, negative) by ustekinumab treatment groups.
For subjects who discontinue study agent administrations, a listing of their antibody status will be presented.
The relationship between antibody to ustekinumab status and efficacy and safety at major assessment time points (Week 24, 52); ASAS 20 and ASAS 40 responses by antibody to ustekinumab status and treatment group (additionally at Week 16 which is the trough concentration for ustekinumab with Week 24 ASAS 20/ASAS 40 responses); injection-site reactions by antibody to ustekinumab status and treatment group; hypersensitivity by antibody to ustekinumab status and treatment group
The relationship between antibody to ustekinumab status at Week 24 and antibody to ustekinumab status at Week 52 will be explored.
The summary of onset and duration of antibody formation
Figure of serum ustekinumab concentrations by treatment group and by antibody to ustekinumab status and summary of PK concentration by treatment group and by antibody to ustekinumab status
The descriptions of treatment groups for all reporting periods are as follows.
NCT02438787

STELARA® (ustekinumab) Statistical Analysis Plan CNTO1275AKS3002
14 April 2017 45 Approved Date: 14 April 2017
7.2.1. Immunogenicity Treatment Groups Through Week 24 1. Ustekinumab 45 mg: Subjects randomized to ustekinumab 45 mg and received 45 mg
ustekinumab through Week 24.
2. Ustekinumab 90 mg: Subjects randomized to ustekinumab 90 mg and received 90 mg ustekinumab through Week 24.
3. Total: subjects are in one of above groups 1and 2.
7.2.2. Immunogenicity Treatment Groups Through Week 52 1. Placebo Ustekinumab 45 mg: Subjects randomized to placebo and were switched over to
ustekinumab 45 mg at Week 24 and continue to receive ustekinumab 45 mg through Week 52.
2. Ustekinumab 45 mg: Subjects randomized to ustekinumab 45 mg and received 45 mg ustekinumab through Week 52.
3. Combined Ustekinumab 45 mg: Subjects are in one of above groups 1 and 2.
4. Placebo Ustekinumab 90 mg: Subjects randomized to placebo and were switched over to ustekinumab 90 mg at Week 24 and continue to receive ustekinumab 90 mg through Week 52.
5. Ustekinumab 90 mg: Subjects randomized to ustekinumab 90 mg and received 90 mg ustekinumab through Week 52.
6. Combined Ustekinumab 90 mg: Subjects are in one of above groups 4 and 5.
7. Total: Subjects are in one of above groups 1,2, 4, and 5.
7.3. Pharmacodynamics Pharmacodynamics biomarkers are collected at Weeks 0, 24, and 52. The analyses results will be provided in an independent technical report.
7.4. Pharmacokinetic/Pharmacodynamic Relationships The relationship between serum ustekinumab concentrations and pharmacodynamics markers may be explored and results will be reported in an independent technical report.
7.5. Microbiome Substudy Approximately 100 subjects will be asked to provide stool samples for a fecal microbiome substudy. The samples will be collected at baseline, Weeks 4, 24, and 52, and analyses results will be provided in an independent technical report.
NCT02438787
STELARA® (ustekinumab) Statistical Analysis Plan CNTO1275AKS3002
14 April 2017 46 Approved Date: 14 April 2017
7.6. Pharmacogenomics In addition to HLA-B27 genotyping prior to study agent administration, complete genomic testing and/or targeted sequencing will be performed to search for links of specific genes to disease or response to drug. DNA methylation testing will also be performed to evaluate epigenetics, ie, modifications in DNA characteristics other than its sequence. Only DNA research related to ustekinumab or to the pathobiology of AxSpA will be performed in consenting subjects only. The analyses results will be provided in an independent technical report.
8. HEALTH ECONOMICS
8.1. Definition
8.1.1. Work Productivity and Activity Impairment Questionnaire The Work Productivity and Activity Impairment Questionnaire - Specific Health Problem (WPAI-SHP) is a validated instrument that has been used to study the impact of various diseases on patients’ ability to work and perform daily activities. The WPAI:SpA assesses the impact of AS on work and other daily activities during the past 7 days. The WPAI:SpA consists of six questions to determine employment status, hours missed from work due to AS, hours missed from work for other reasons, hours actually worked, the degree to which AS affected work productivity while at work and the degree to which AS affected activities outside of work. Four scores are derived: percentage of absenteeism, percentage of presenteeism (reduced productivity while at work), an overall work impairment score that combines absenteeism and presenteeism and percentage of impairment in activities performed outside of work. Greater scores indicate greater impairment.
8.2. Analysis Methods Unless otherwise specified, the analysis population will be the FAS defined in Section 2.3.1. The change from baseline in 4 WPAI scores will be summarized over time by treatment groups. The 4 WPAI scores are:
1. Percent work time missed due to AS. This score is defined by [Q2/(Q2+Q4)]x100; 2. Percent Impairment while Working due to AS. This score is defined by (Q5/10)x100; 3. Percent overall Work Impairment due to AS. This score is defined by {Q2/(Q2+Q4)+[(1-(Q2/(Q2+Q4)))x(Q5/10)]}x100;
4. Percent activity impairment due to AS. This score is defined by (Q6/10)x100.
Simple descriptive summary statistics, such as n, mean, SD, median, IQ range, minimum, and maximum will be provided.
Nominal p-values will be provided at Week 16 and at Week 24.
A Mixed Model for Repeated Measures (MMRM) will be used.
NCT02438787

STELARA® (ustekinumab) Statistical Analysis Plan CNTO1275AKS3002
14 April 2017 47 Approved Date: 14 April 2017
The independent variables for this model are treatment group, region (North America, Latin America, Western Europe, Europe, and Asia Pacific), baseline score, visit week, and an interaction of treatment and visit week. An unstructured (UN) variance-covariance matrix for repeated measures within a subject will be used unless there are issues related to convergence.
Data handling rule: Subjects with no observed data at all will be excluded from the analysis. Subjects with no value at baseline are excluded from the analysis. Early escape rules will be applied on Week 24 data. After Week 24, no treatment failure rule and no missing data imputation rules will be applied. All early escaped subjects will be excluded in the analyses at Week 52.
NCT02438787

STELARA® (ustekinumab) Statistical Analysis Plan CNTO1275AKS3002
14 April 2017 48 Approved Date: 14 April 2017
REFERENCES
1. Anderson JJ, Baron G, van der Heijde D, Felson DT, Dougados M. Ankylosing spondylitis assessment group preliminary definition of short-term improvement in ankylosing spondylitis. Arthritis Rheum. 2001;44(8):1876-1886.
2. Assessment of SpondyloArthritis. Ankylosing spondylitis disease activity score. Available at: http://www.asas- group.org/research.php?id=01. Accessed on 17 April 2014.
3. Calin A, Garrett S, Whitelock H, et al. A new approach to defining functional ability in ankylosing spondylitis:the development of the Bath Ankylosing Spondylitis Functional Index. J Rheumatol. 1994;21(12):2281-2285.
4. Doward LC, Spoorenberg A, Cook SA, et.al. Development of the ASQoL: a quality of life instrument specific to ankylosing spondylitis. Ann Rheum Dis. 2003;62(1):20-26.
5. EuroQol Group. EuroQol - a new facility for the measurement of health-related quality of life. Health Policy. 1990;16:199-208.
6. Garrett S, Jenkinson T, Kennedy LG, Whitelock H, Gaisford P, Calin A. A new approach to defining disease status in ankylosing spondylitis: the Bath Ankylosing Spondylitis Disease Activity Index. J Rheumatol.1994; 21(12):2286-2291.
7. Heuft-Dorenbosch L, Spoorenberg A, van Tubergen A, et al. Assessment of enthesitis in ankylosing spondylitis. Ann Rheum Dis 2003;62:127-32.
8. Hays RD, Martin SA, Sesti AM, Spritzer KL. Psychometric properties of the Medical Outcomes Study Sleep measure. Sleep Med. 2005;6(1):41-44.
9. Landewé R, Braun J, Deodhar A, et al. Efficacy of certolizumab pegol on signs and symptoms of axial spondyloarthritis including ankylosing spondylitis: 24-week results of a double-blind randomised placebo-controlled Phase 3 study. Ann Rheum Dis. 2014;73(1):39-47.
10. Machado P, Landewé R, Lie E, et al. Ankylosing Spondylitis Disease Activity Score (ASDAS): defining cut- off values for disease activity states and improvement scores for the Assessment of SpondyloArthritis international Society. Ann Rheum Dis. 2011;70:47–53.
11. Machado P, Navarro-Compa´n V, Landewe R, van Gaalen F, Roux C, van der Heijde D. Calculating the Ankylosing Spondylitis Disease Activity Score If the Conventional C-Reactive Protein Level Is Below the Limit of Detection or If High-Sensitivity C-Reactive Protein Is Used: An Analysis in the DESIR Cohort. Arthritis Rheum. 2015;67(2):408-413.
12. Sieper J, Rudwaleit M, Baraliakos X, et al. The Assessment of SpondyloArthritis international Society (ASAS)Handbook: a guide to assess spondyloarthritis. Ann Rheum Dis. 2009;68(2):ii1-ii44.
13. van der Heijde D, Landewé R, Feldtkeller E. Proposal of a linear definition of the Bath Ankylosing Spondylitis Metrology Index (BASMI) and comparison with the 2-step and 10-step definitions. Ann Rheum Dis.2008;67:489-493.
14. van der Heijde D, Lie E, Kvien T K, et al. A highly discriminatory ASAS-endorsed disease activity score in patients with ankylosing spondylitis: For the Assessment of SpondyloArthritis international Society (ASAS). Ann Rheum Dis. 2009;68:1811–1818.
15. van der Heijde D, Sieper J, Maksymowych WP, Assessment of SpondyloArthritis international Society, et al.2010 Update of the international ASAS recommendations for the use of anti-TNF agents in patients with axial spondyloarthritis. Ann Rheum Dis. 2011;70(6):905-908
16. Ware JE, Kosinski M, Keller SD. Interpretation: Norm-Based. In: SF-36 Physical and Mental Health Summary Scales: A User’s Manual. Boston, MA: The Health Institute; 1994:8:1-8:42.
17. Ware JE Jr, Sherbourne CD. The MOS 36 item short form health survey (SF 36), I. Conceptual framework and item selection. Med Care. 1992;30(6):473 483.
18. Kim Y, Won S. Adjusted proportion difference and confidence interval in stratified randomized trials. 2013; PharmaSUG - Paper SP04
NCT02438787
Related Documents