INTERNATIONAL JOURNAL ON SMART SENSING AND INTELLIGENT SYSTEMS VOL. 6, NO. 2, APRIL 2013 711 RECOGNITION OF PSORIASIS FEATURES VIA DAUBECHIES D8 WAVELET TECHNIQUE H. Hashim 1 , S. Ramli 1 , N. Wahid 2 , M. S. Sulaiman 2 , N. Hassan 2 Faculty of Electrical Engineering 1 Universiti Teknologi MARA, 40450 Shah Alam, Selangor, Malaysia. 2 Universiti Teknologi MARA Terengganu, 23000 Dungun, Terengganu, Malaysia. Emails: [email protected] , [email protected] , [email protected] , [email protected] , Submitted: Jan. 15, 2013 Accepted: Mar. 28, 2013 Published: Apr. 10, 2013 Abstract- This paper presents a study in an efficient methodology for analysis and characterization of digital images psoriasis lesions using Daubechies D8 wavelet technique. The methodology is based on the transformation of 2D Discrete Wavelet Transform (DWT) algorithm for Daubechies D8 at first level to obtain the coefficients of the approximations and details sub-images. For classification method, statistical approach analysis is applied to identify significance difference between each groups of psoriasis in terms of mean and standard deviation parameter. Results performances are concluded by observing the error plots with 95% confidence interval and applied independent T-test. The test outcomes have shown that approximate mean and standard deviation parameter can be used to distinctively classify erythroderma from the other groups in consistent with visual observations of the

Welcome message from author
This document is posted to help you gain knowledge. Please leave a comment to let me know what you think about it! Share it to your friends and learn new things together.
Transcript
INTERNATIONAL JOURNAL ON SMART SENSING AND INTELLIGENT SYSTEMS VOL. 6, NO. 2, APRIL 2013
711
RECOGNITION OF PSORIASIS FEATURES VIA DAUBECHIES
D8 WAVELET TECHNIQUE
H. Hashim1, S. Ramli
1, N. Wahid
2, M. S. Sulaiman
2, N. Hassan
2
Faculty of Electrical Engineering
1Universiti Teknologi MARA, 40450 Shah Alam, Selangor, Malaysia.
2Universiti Teknologi MARA Terengganu, 23000 Dungun, Terengganu, Malaysia.
Emails: [email protected], [email protected],
[email protected], [email protected],
Submitted: Jan. 15, 2013 Accepted: Mar. 28, 2013 Published: Apr. 10, 2013
Abstract- This paper presents a study in an efficient methodology for analysis and characterization of
digital images psoriasis lesions using Daubechies D8 wavelet technique. The methodology is based on
the transformation of 2D Discrete Wavelet Transform (DWT) algorithm for Daubechies D8 at first level
to obtain the coefficients of the approximations and details sub-images. For classification method,
statistical approach analysis is applied to identify significance difference between each groups of
psoriasis in terms of mean and standard deviation parameter. Results performances are concluded by
observing the error plots with 95% confidence interval and applied independent T-test. The test
outcomes have shown that approximate mean and standard deviation parameter can be used to
distinctively classify erythroderma from the other groups in consistent with visual observations of the
H. Hashim, S. Ramli, N. Wahid, M. S. Sulaiman, N. Hassan, RECOGNITION OF PSIORISIS FEATURES VIA DAUBECHIES D8 WAVELET TECHNIQUE
712
error plots. Whilst, in order to discriminate guttate from the other groups, standard deviation
parameters for horizontal, vertical and diagonal can be utilized. Based on the results, plaque is
distinguishable with guttate and erythroderma by using standard deviation vertical sub-images
parameter. Results of Daubechies D8 is compared with study done previously by using Daubechies D4
and Daubechies D12 in order to observe the reliability of the results in Daubechies families. The
resultant parameters can be used to design computer-aided system in diagnosis the skin lesion of
psoriasis.
Index terms: Discrete Wavelet Transform (DWT), DWT algorithm, doubechies, t-test, psoriasis, plaque,
guttate, erythroderma
I. INTRODUCTION
Dermatologists have based the diagnosis of skin lesions on the visual assessment of pathological
skin and the evaluation of microscopic features. Therefore, the diagnosis has been highly
dependent on the observer’s experience and on his visual acuity. However, the human vision
lacks accuracy, reproducibility and quantification in gathering information from an image thus,
systems that are able to evaluate images in objective manner are obviously needed [1]. There are
many people who suffer because of many various types of skin diseases [2], [3], [4], [5] and [6].
Psoriasis is an inflammatory skin disorder with a strong genetic basis [7]. The psiorisis lesions
are distinctive. They can conveniently be distinguished from the ordinary normal skin. Psiorisis
begin as red scaling papules that coalesce to form the round to oval plaques. The diagnosis of
psoriasis is usually apparent clinically but sometimes it may resemble other skin disorders in a
typical cases, such as lichen simplex chronicus, nummular eczema, seborrheic dermatitis and
tinea corporis. The extent and duration of the disease is highly variable from patient to patient.
Acute flares or relapses of plaque psoriasis may also evolve into more severe disease, such as
pustular or erythrodermic psoriasis [8].
Psiorisis cannot be cured, nevertheless, there are treatments available to help control the disease
[9]. Dermatologist will monitor the extent of psoriasis continuously during treatment to ascertain
the treatment efficacy [10]. Recently, there is an analyzing image technique that has been
proposed for classifying the features of psoriasis. Several clinical psoriasis lesion groups [11],
were been studied for digital RGB colors features extraction. Plaque lesion was experimented
INTERNATIONAL JOURNAL ON SMART SENSING AND INTELLIGENT SYSTEMS VOL. 6, NO. 2, APRIL 2013
713
with other types of psoriasis. Quantification of data images through the normal/direct and
differential of the reflectance method was considered. The statistical tests outcomes had shown
that the component for conventional differential method could be distinctively classify plaque
from the other groups. This method produced some promising results, but only for discriminating
plaque lesion with the other groups of psoriasis.
Initial work on identification of psoriasis features by using Wavelet as the main analyzing tool
was done by Zafran [12]. Coefficient parameters of plaque were compared with guttate and
erythroderma, where they are represented in terms of error plots. The coefficient of the
approximation, detail sub-images and images of the lesions are transforms using two dimensional
(2D) Discrete Wavelete Transform (DWT) Daubechies D4 algorithm at first level. Nidhal et al
[8] developed and tested a skin diagnosis system used for diagnosis of psioriasis skin disease.
The system used to evaluate the ability of the proposed skin texture recognition algorithm to
discriminate between healthy and infected skin. Feed-forward and neural networks is used to
classify input images for psorisis infected or non psorisis infected. The neural network training
give the encouraging results in generalization face.
In [13] a multiresolution-resolution based signature subspace classifier (MSSC) for the
segmentation of color images to psiorisis images has been proposed. The fuzzy texture spectrum
and two-dimensional fuzzy color histogram are adopted to locate homogeneous regions in the
image. From the research, the proposed algorithm can effectively segment psiorisis image.
Meriem et al [14] used discrete wavelet for multifractal characterization of skin cancer in
ultrasound image.The proposed method establishes a multifractal analysis framework based on a
new multiresolution indicator, called the maximum wavelet coefficient. Guyot [15] studied the
mathematical correlation between a fractional Brownian motion and speckle patterns, in optical
imaging and used successfully the diffusion equation to characterize skin psoriasis infections.
Meanwhile, according to [16] 3D imaging method has been proposed to assess Psoriasis Area
Severity Index scaliness parameter of psoriasis lesions. The polynomial surface fitting is applied
to the lesion surface to extract the estimated waviness from the actual lesion surface. Surface
roughness is measured and the algorithm has been validated against 328 lesion models on a
medical mannequin. The result shows that the proposed algorithm giving an accuracy of 89.30%.
Since psoriasis is a chronic disease [13], it is important to track the condition of the patient to
select a proper treatment. This paper proposed to further extend the studies on wavelet as an
H. Hashim, S. Ramli, N. Wahid, M. S. Sulaiman, N. Hassan, RECOGNITION OF PSIORISIS FEATURES VIA DAUBECHIES D8 WAVELET TECHNIQUE
714
analyzing tool in recognition of psoriasis features by using Daubechies D8 wavelet technique at
level one. Coefficients parameters for psoriasis are compared with each other in terms of mean
and standard deviation. The results performances are concluded by observing the error plots with
95% confidence interval and outcomes of the independent t-test applied. Then, the resuls is
compared with study done previously by using Daubechies D4 and D12 wavelet technique.
II. BACKGROUND OF WAVELET
Wavelet analysis is a method of analyzing visual data by taking into account scale information,
allowing the exploration of texture on different scales [17]. The wavelet analysis procedure,
called as analyzing wavelet or mother wavelet is used to adopt a wavelet prototype function [18].
The wavelet transform converts the image array into a series of wavelet coefficient, each of
which represents information at a particular location within the array and for a particular spatial
scale. To span the data domain at different resolutions, the analyzing wavelet is used in a scaling
function.
2
1
1 21N
k
kk
kxcxW (1)
where W(x) is the scaling function for the mother function )(x , and kc are the wavelet
coefficients. The relationship between spatial and frequency domain is expressed with basic
functions.
lxx s/)l,s( 22 21
(2)
The variables s and l are integers that scale and dilate the mother function )x( to generate
wavelets. The scale index s indicates the wavelet's width and the location index l gives its
position. By scanning a function (or signal) with the translated and dilated wavelet functions, the
function can be decomposed in its frequency parts, represented by the coefficient, kc . The
discrete wavelet transformation can be realized as matrix operation (WT)
C = WT (B) (3)
By applying the inverse wavelet transformation, starting from a low level (coefficients in the low-
frequency band) and moving to higher levels, recursively new information is introduced at each
level and more details are added stepwise to the image. A wavelet transform of an image
INTERNATIONAL JOURNAL ON SMART SENSING AND INTELLIGENT SYSTEMS VOL. 6, NO. 2, APRIL 2013
715
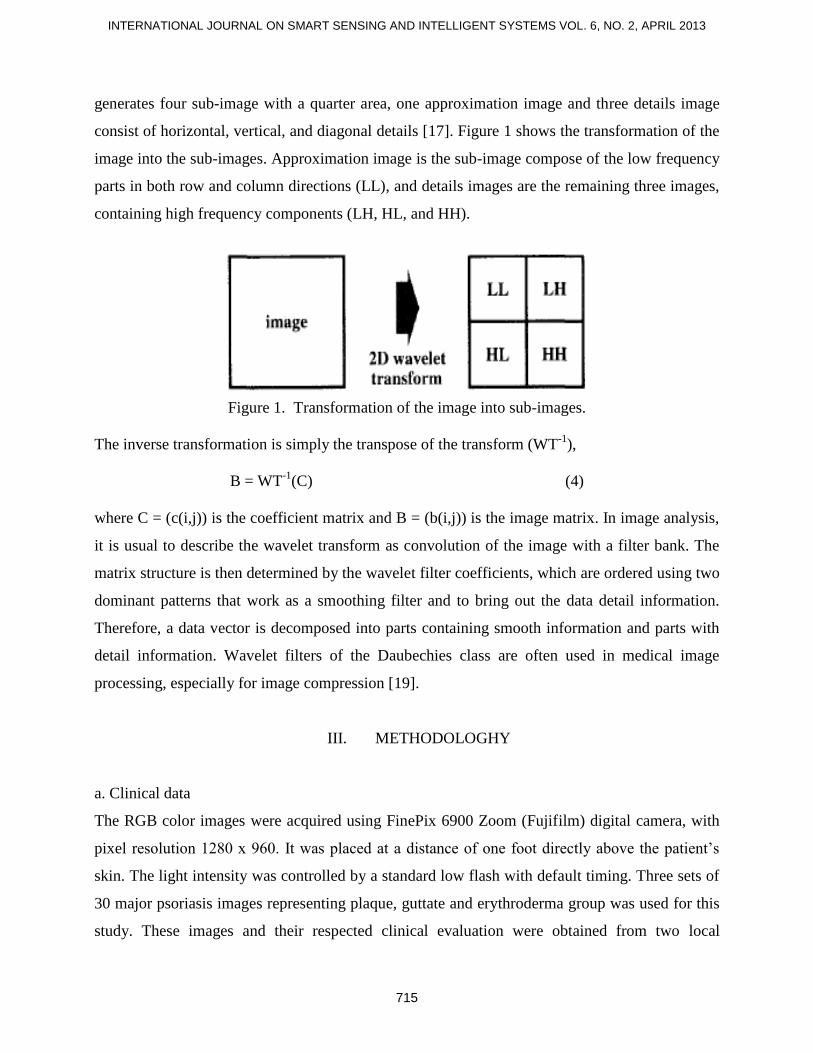
generates four sub-image with a quarter area, one approximation image and three details image
consist of horizontal, vertical, and diagonal details [17]. Figure 1 shows the transformation of the
image into the sub-images. Approximation image is the sub-image compose of the low frequency
parts in both row and column directions (LL), and details images are the remaining three images,
containing high frequency components (LH, HL, and HH).
Figure 1. Transformation of the image into sub-images.
The inverse transformation is simply the transpose of the transform (WT-1
),
B = WT-1
(C) (4)
where C = (c(i,j)) is the coefficient matrix and B = (b(i,j)) is the image matrix. In image analysis,
it is usual to describe the wavelet transform as convolution of the image with a filter bank. The
matrix structure is then determined by the wavelet filter coefficients, which are ordered using two
dominant patterns that work as a smoothing filter and to bring out the data detail information.
Therefore, a data vector is decomposed into parts containing smooth information and parts with
detail information. Wavelet filters of the Daubechies class are often used in medical image
processing, especially for image compression [19].
III. METHODOLOGHY
a. Clinical data
The RGB color images were acquired using FinePix 6900 Zoom (Fujifilm) digital camera, with
pixel resolution 1280 x 960. It was placed at a distance of one foot directly above the patient’s
skin. The light intensity was controlled by a standard low flash with default timing. Three sets of
30 major psoriasis images representing plaque, guttate and erythroderma group was used for this
study. These images and their respected clinical evaluation were obtained from two local
H. Hashim, S. Ramli, N. Wahid, M. S. Sulaiman, N. Hassan, RECOGNITION OF PSIORISIS FEATURES VIA DAUBECHIES D8 WAVELET TECHNIQUE
716
hospitals in Malaysia which are Universiti Kebangsaan Malaysia Medical Centre (HUKM) and
Melaka General Hospital (HM). Psoriasis patients involved in this work were initially identified
through their medical records or clinically diagnosed by dermatologists at the clinic.
b. Pre-processing
Initially, 30 samples of psoriasis image through a pre-processing to prepared the images for
further analysis. Once the area that includes normal skin and three samples of lesions were
recognized the area were cropped out. During the pre-processing, 30 images of psoriasis were
selected for each individual group. Then these images were crops at 6464 pixels dimension
inside the affected area of skin. After images were cropped, then it was catalogued and stored.
The cropping was done at the effected region without considering the border or edge. This is due
to the idea that the affected area will convey exact information about the psoriasis. Other
information such as hair follicle and blood vessels will be considered as a noise to the images.
c. Processing
The test has been applied based on the 3 different groups of psoriasis which are plaque, guttate
and erythroderma. From the test applied, it shows that different group of psoriasis is distinctively
different from each others with a wavelet technique. The procedures is begin by decompose the
image with Daubechies D8 (Level 1) DWT to obtain the coefficient of the approximation and
details. The details coefficient can be described as a horizontal, vertical and diagonal coefficient.
This coefficient was stored and transferred into the SPSS in-order to obtain the statistical
measurement. The statistical data used are the mean coefficients value and standard deviation
value. Thus, these means and standard deviations of the coefficient individually were plotted in
form of error plots. A T-test was applied in order to find equality between the groups of psoriasis.
The null hypothesis and the T-test used are shown below.
Null hypothesis, 0H :
0 zy (5)
Alternative hypothesis, 1H :
0 zy (6)
Sample variance:
222zyP sss (7)
INTERNATIONAL JOURNAL ON SMART SENSING AND INTELLIGENT SYSTEMS VOL. 6, NO. 2, APRIL 2013
717
Sample standard error:
zyp
nnsSE
112 (8)
Test statistic:
SE
zyt
zy (9)
Interval estimator:
SEtzy df ,2 (10)
where zy , is the sample mean
zy , is the population mean
1 zy nndf is the degrees of freedom
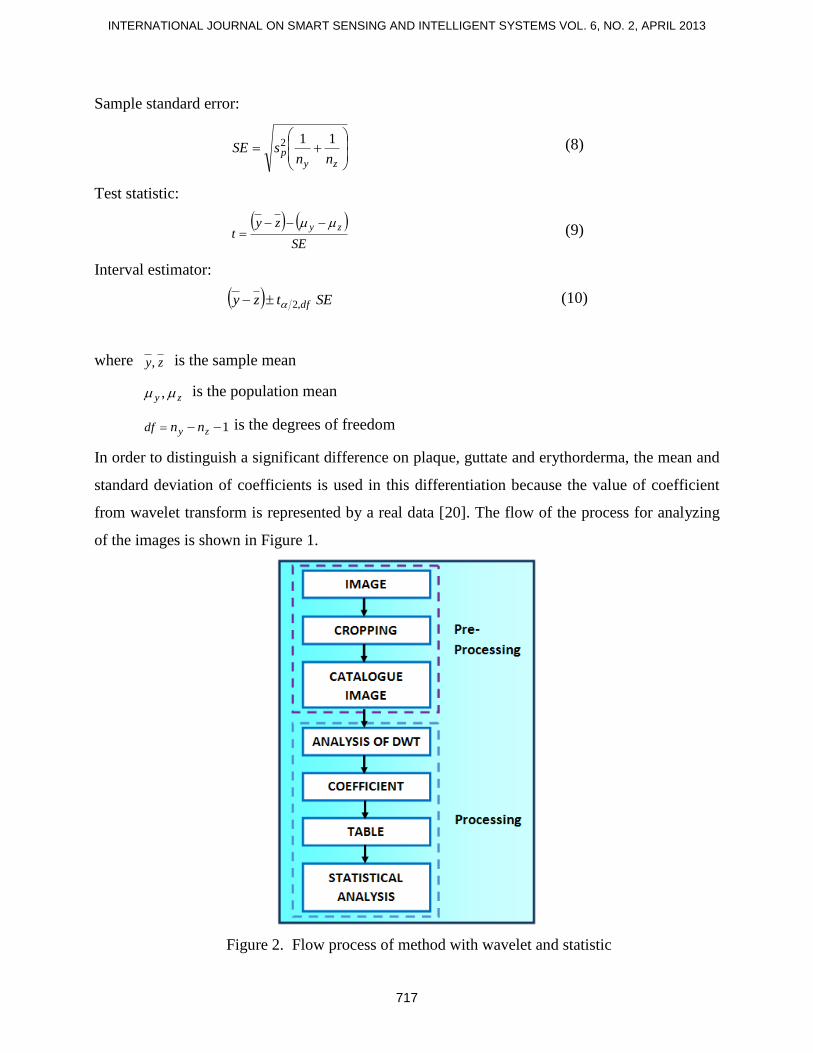
In order to distinguish a significant difference on plaque, guttate and erythorderma, the mean and
standard deviation of coefficients is used in this differentiation because the value of coefficient
from wavelet transform is represented by a real data [20]. The flow of the process for analyzing
of the images is shown in Figure 1.
Figure 2. Flow process of method with wavelet and statistic
H. Hashim, S. Ramli, N. Wahid, M. S. Sulaiman, N. Hassan, RECOGNITION OF PSIORISIS FEATURES VIA DAUBECHIES D8 WAVELET TECHNIQUE
718
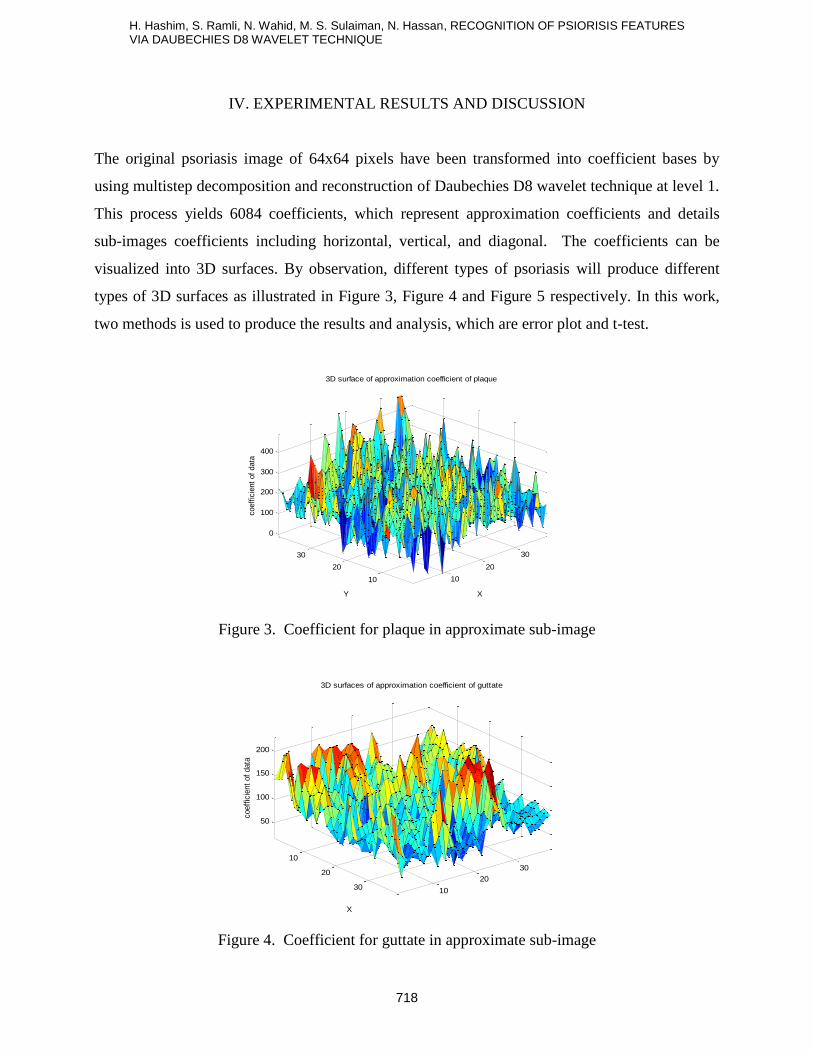
IV. EXPERIMENTAL RESULTS AND DISCUSSION
The original psoriasis image of 64x64 pixels have been transformed into coefficient bases by
using multistep decomposition and reconstruction of Daubechies D8 wavelet technique at level 1.
This process yields 6084 coefficients, which represent approximation coefficients and details
sub-images coefficients including horizontal, vertical, and diagonal. The coefficients can be
visualized into 3D surfaces. By observation, different types of psoriasis will produce different
types of 3D surfaces as illustrated in Figure 3, Figure 4 and Figure 5 respectively. In this work,
two methods is used to produce the results and analysis, which are error plot and t-test.
10
20
30
10
20
30
0
100
200
300
400
X
3D surface of approximation coefficient of plaque
Y
coeff
icie
nt
of
data
Figure 3. Coefficient for plaque in approximate sub-image
10
20
30 10
20
30
50
100
150
200
3D surfaces of approximation coefficient of guttate
X
coeff
icie
nt
of
data
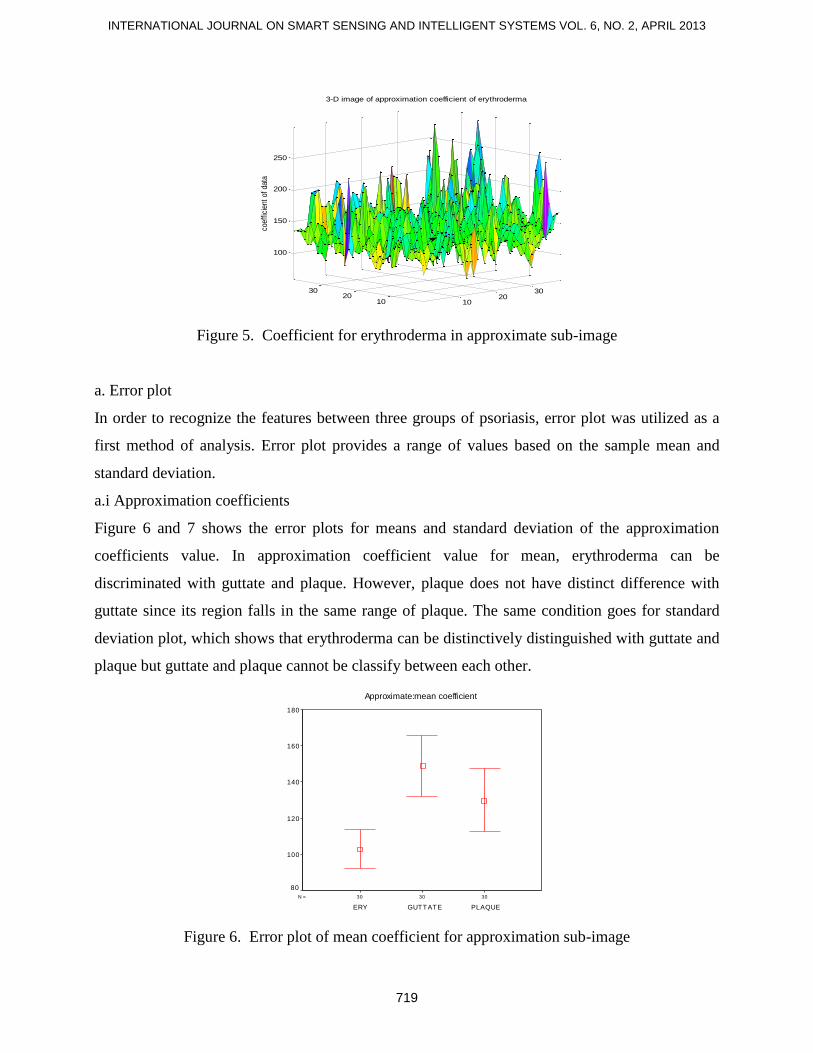
Figure 4. Coefficient for guttate in approximate sub-image
INTERNATIONAL JOURNAL ON SMART SENSING AND INTELLIGENT SYSTEMS VOL. 6, NO. 2, APRIL 2013
719
1020
30
1020
30
100
150
200
250
3-D image of approximation coefficient of erythroderma
coef
ficie
nt o
f da
ta
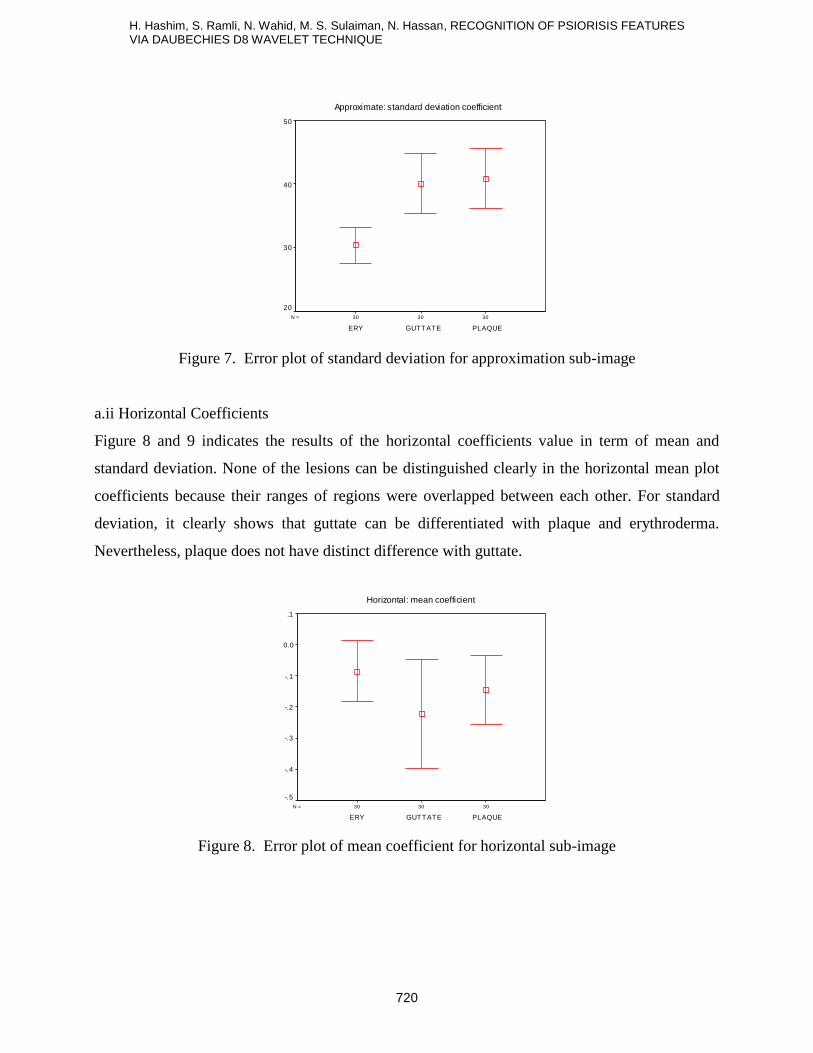
Figure 5. Coefficient for erythroderma in approximate sub-image
a. Error plot
In order to recognize the features between three groups of psoriasis, error plot was utilized as a
first method of analysis. Error plot provides a range of values based on the sample mean and
standard deviation.
a.i Approximation coefficients
Figure 6 and 7 shows the error plots for means and standard deviation of the approximation
coefficients value. In approximation coefficient value for mean, erythroderma can be
discriminated with guttate and plaque. However, plaque does not have distinct difference with
guttate since its region falls in the same range of plaque. The same condition goes for standard
deviation plot, which shows that erythroderma can be distinctively distinguished with guttate and
plaque but guttate and plaque cannot be classify between each other.
303030N =
Approximate:mean coefficient
PLAQUEGUTTATEERY
95%
CI
180
160
140
120
100
80
Figure 6. Error plot of mean coefficient for approximation sub-image
H. Hashim, S. Ramli, N. Wahid, M. S. Sulaiman, N. Hassan, RECOGNITION OF PSIORISIS FEATURES VIA DAUBECHIES D8 WAVELET TECHNIQUE
720
303030N =
Approximate: standard deviation coefficient
PLAQUEGUTTATEERY
95%
CI
50
40
30
20
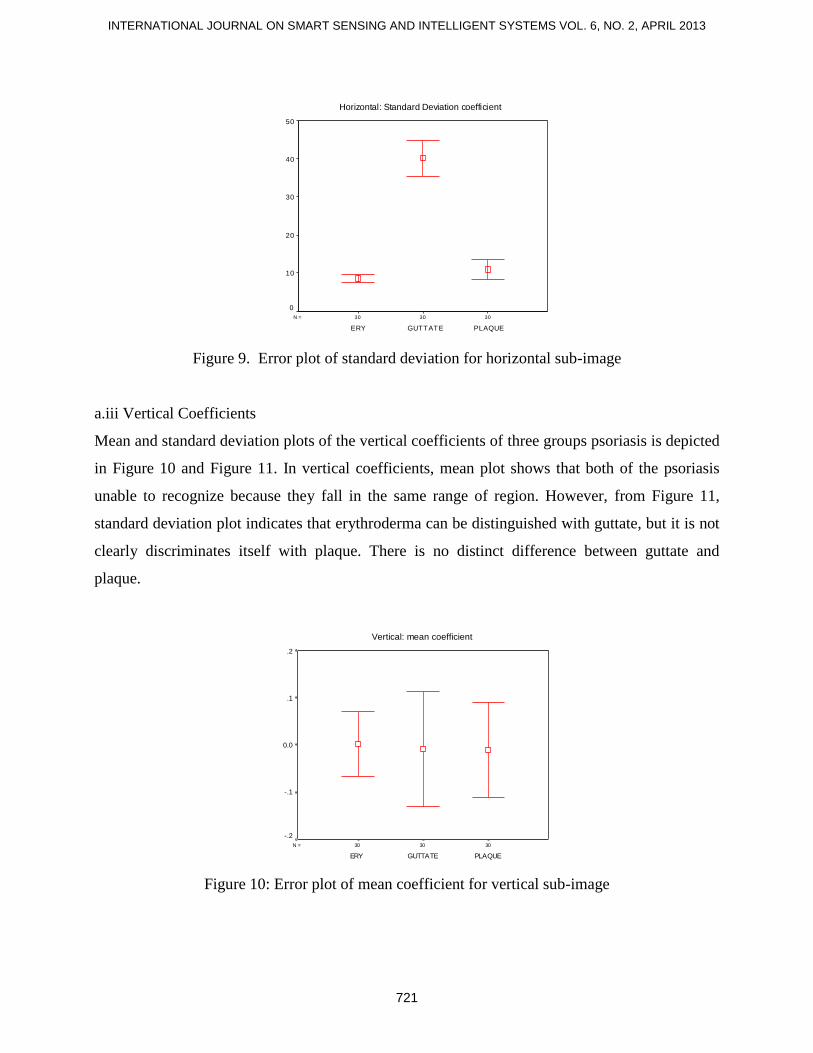
Figure 7. Error plot of standard deviation for approximation sub-image
a.ii Horizontal Coefficients
Figure 8 and 9 indicates the results of the horizontal coefficients value in term of mean and
standard deviation. None of the lesions can be distinguished clearly in the horizontal mean plot
coefficients because their ranges of regions were overlapped between each other. For standard
deviation, it clearly shows that guttate can be differentiated with plaque and erythroderma.
Nevertheless, plaque does not have distinct difference with guttate.
303030N =
Horizontal: mean coefficient
PLAQUEGUTTATEERY
95%
CI
.1
0.0
-.1
-.2
-.3
-.4
-.5
Figure 8. Error plot of mean coefficient for horizontal sub-image
INTERNATIONAL JOURNAL ON SMART SENSING AND INTELLIGENT SYSTEMS VOL. 6, NO. 2, APRIL 2013
721
303030N =
Horizontal: Standard Deviation coefficient
PLAQUEGUTTATEERY
95
% C
I
50
40
30
20
10
0
Figure 9. Error plot of standard deviation for horizontal sub-image
a.iii Vertical Coefficients
Mean and standard deviation plots of the vertical coefficients of three groups psoriasis is depicted
in Figure 10 and Figure 11. In vertical coefficients, mean plot shows that both of the psoriasis
unable to recognize because they fall in the same range of region. However, from Figure 11,
standard deviation plot indicates that erythroderma can be distinguished with guttate, but it is not
clearly discriminates itself with plaque. There is no distinct difference between guttate and
plaque.
303030N =
Vertical: mean coefficient
PLAQUEGUTTATEERY
95%
CI
.2
.1
0.0
-.1
-.2
Figure 10: Error plot of mean coefficient for vertical sub-image
H. Hashim, S. Ramli, N. Wahid, M. S. Sulaiman, N. Hassan, RECOGNITION OF PSIORISIS FEATURES VIA DAUBECHIES D8 WAVELET TECHNIQUE
722
303030N =
Vertical: standard deviation coefficient
PLAQUEGUTTATEERY
95%
CI
20
18
16
14
12
10
8
6
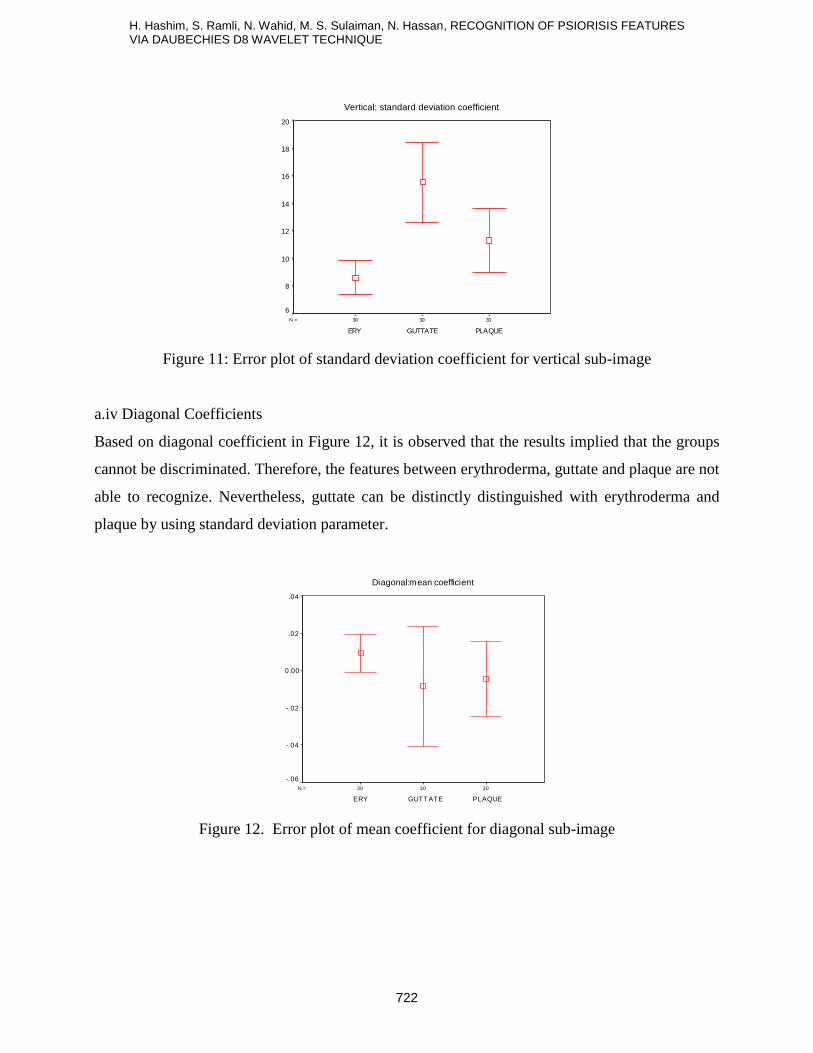
Figure 11: Error plot of standard deviation coefficient for vertical sub-image
a.iv Diagonal Coefficients
Based on diagonal coefficient in Figure 12, it is observed that the results implied that the groups
cannot be discriminated. Therefore, the features between erythroderma, guttate and plaque are not
able to recognize. Nevertheless, guttate can be distinctly distinguished with erythroderma and
plaque by using standard deviation parameter.
303030N =
Diagonal:mean coefficient
PLAQUEGUTTATEERY
95%
CI
.04
.02
0.00
-.02
-.04
-.06
Figure 12. Error plot of mean coefficient for diagonal sub-image
INTERNATIONAL JOURNAL ON SMART SENSING AND INTELLIGENT SYSTEMS VOL. 6, NO. 2, APRIL 2013
723
303030N =
Diagonal: standard deviation coefficient
PLAQUEGUTTATEERY
95%
CI
12
10
8
6
4
2
0
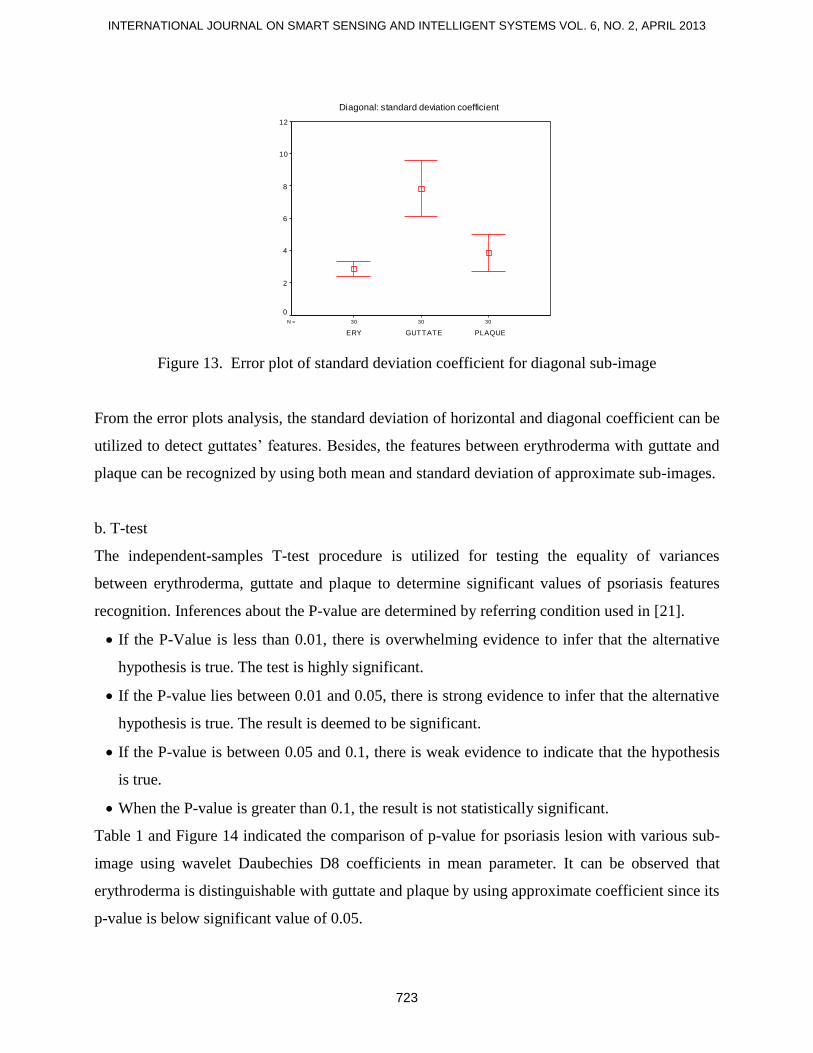
Figure 13. Error plot of standard deviation coefficient for diagonal sub-image
From the error plots analysis, the standard deviation of horizontal and diagonal coefficient can be
utilized to detect guttates’ features. Besides, the features between erythroderma with guttate and
plaque can be recognized by using both mean and standard deviation of approximate sub-images.
b. T-test
The independent-samples T-test procedure is utilized for testing the equality of variances
between erythroderma, guttate and plaque to determine significant values of psoriasis features
recognition. Inferences about the P-value are determined by referring condition used in [21].
If the P-Value is less than 0.01, there is overwhelming evidence to infer that the alternative
hypothesis is true. The test is highly significant.
If the P-value lies between 0.01 and 0.05, there is strong evidence to infer that the alternative
hypothesis is true. The result is deemed to be significant.
If the P-value is between 0.05 and 0.1, there is weak evidence to indicate that the hypothesis
is true.
When the P-value is greater than 0.1, the result is not statistically significant.
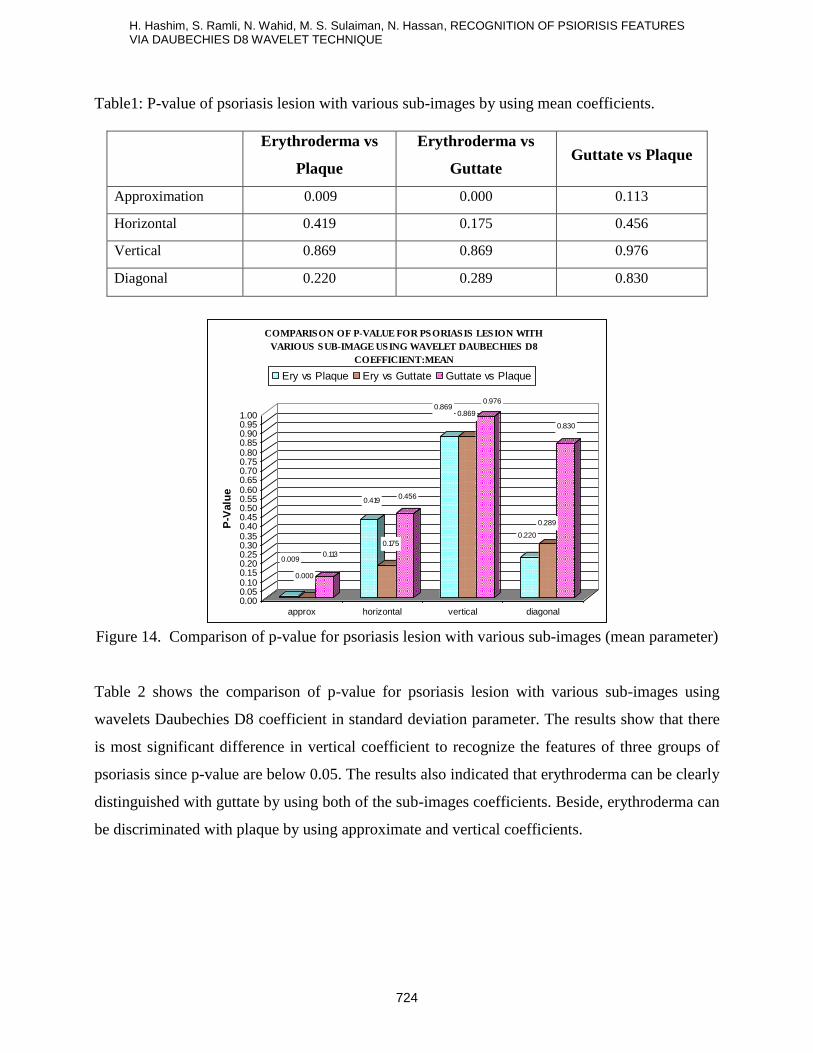
Table 1 and Figure 14 indicated the comparison of p-value for psoriasis lesion with various sub-
image using wavelet Daubechies D8 coefficients in mean parameter. It can be observed that
erythroderma is distinguishable with guttate and plaque by using approximate coefficient since its
p-value is below significant value of 0.05.
H. Hashim, S. Ramli, N. Wahid, M. S. Sulaiman, N. Hassan, RECOGNITION OF PSIORISIS FEATURES VIA DAUBECHIES D8 WAVELET TECHNIQUE
724
Table1: P-value of psoriasis lesion with various sub-images by using mean coefficients.
Erythroderma vs
Plaque
Erythroderma vs
Guttate Guttate vs Plaque
Approximation 0.009 0.000 0.113
Horizontal 0.419 0.175 0.456
Vertical 0.869 0.869 0.976
Diagonal 0.220 0.289 0.830
0.009
0.000
0.113
0.419
0.175
0.456
0.8690.869
0.976
0.220
0.289
0.830
0.000.050.100.150.200.250.300.350.400.450.500.550.600.650.700.750.800.850.900.951.00
P-V
alu
e
approx horizontal vertical diagonal
COMPARISON OF P-VALUE FOR PSORIASIS LESION WITH
VARIOUS SUB-IMAGE USING WAVELET DAUBECHIES D8
COEFFICIENT:MEAN
Ery vs Plaque Ery vs Guttate Guttate vs Plaque
Figure 14. Comparison of p-value for psoriasis lesion with various sub-images (mean parameter)
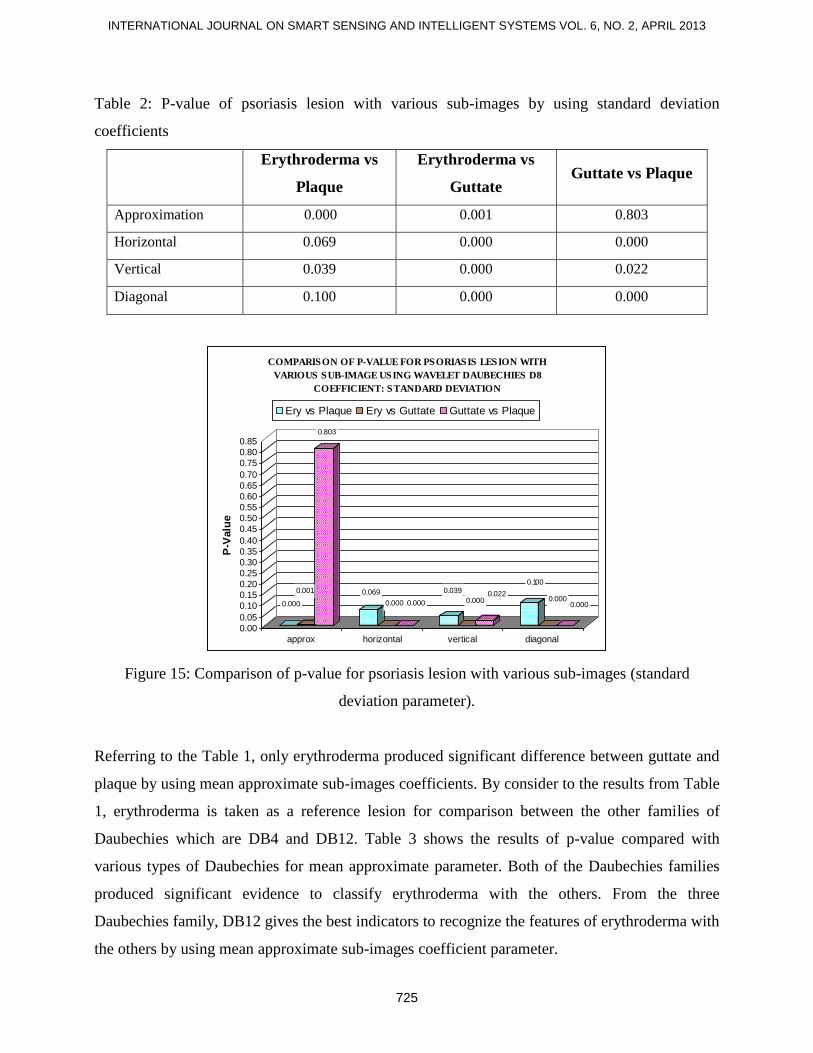
Table 2 shows the comparison of p-value for psoriasis lesion with various sub-images using
wavelets Daubechies D8 coefficient in standard deviation parameter. The results show that there
is most significant difference in vertical coefficient to recognize the features of three groups of
psoriasis since p-value are below 0.05. The results also indicated that erythroderma can be clearly
distinguished with guttate by using both of the sub-images coefficients. Beside, erythroderma can
be discriminated with plaque by using approximate and vertical coefficients.
INTERNATIONAL JOURNAL ON SMART SENSING AND INTELLIGENT SYSTEMS VOL. 6, NO. 2, APRIL 2013
725
Table 2: P-value of psoriasis lesion with various sub-images by using standard deviation
coefficients
Erythroderma vs
Plaque
Erythroderma vs
Guttate Guttate vs Plaque
Approximation 0.000 0.001 0.803
Horizontal 0.069 0.000 0.000
Vertical 0.039 0.000 0.022
Diagonal 0.100 0.000 0.000
0.000
0.001
0.803
0.069
0.000 0.000
0.039
0.0000.022
0.100
0.0000.000
0.00
0.05
0.10
0.15
0.20
0.25
0.30
0.35
0.40
0.45
0.50
0.55
0.60
0.65
0.70
0.75
0.80
0.85
P-V
alu
e
approx horizontal vertical diagonal
COMPARISON OF P-VALUE FOR PSORIASIS LESION WITH
VARIOUS SUB-IMAGE USING WAVELET DAUBECHIES D8
COEFFICIENT: STANDARD DEVIATION
Ery vs Plaque Ery vs Guttate Guttate vs Plaque
Figure 15: Comparison of p-value for psoriasis lesion with various sub-images (standard
deviation parameter).
Referring to the Table 1, only erythroderma produced significant difference between guttate and
plaque by using mean approximate sub-images coefficients. By consider to the results from Table
1, erythroderma is taken as a reference lesion for comparison between the other families of
Daubechies which are DB4 and DB12. Table 3 shows the results of p-value compared with
various types of Daubechies for mean approximate parameter. Both of the Daubechies families
produced significant evidence to classify erythroderma with the others. From the three
Daubechies family, DB12 gives the best indicators to recognize the features of erythroderma with
the others by using mean approximate sub-images coefficient parameter.
H. Hashim, S. Ramli, N. Wahid, M. S. Sulaiman, N. Hassan, RECOGNITION OF PSIORISIS FEATURES VIA DAUBECHIES D8 WAVELET TECHNIQUE
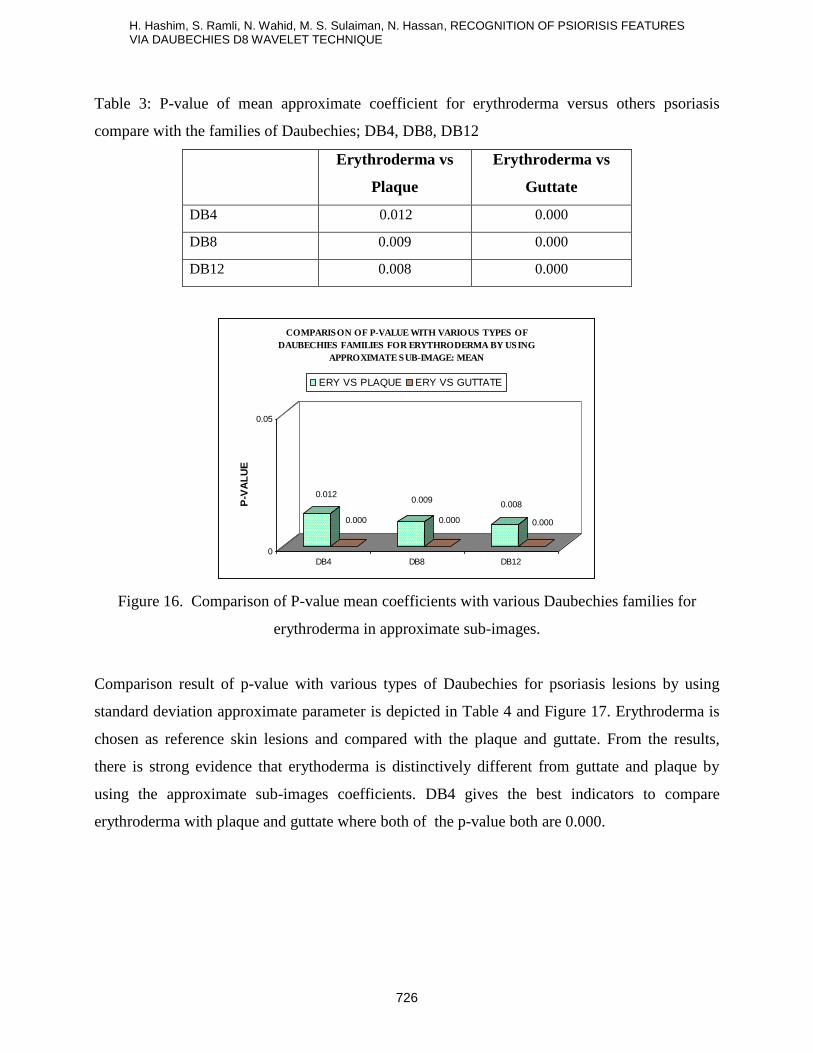
726
Table 3: P-value of mean approximate coefficient for erythroderma versus others psoriasis
compare with the families of Daubechies; DB4, DB8, DB12
Erythroderma vs
Plaque
Erythroderma vs
Guttate
DB4 0.012 0.000
DB8 0.009 0.000
DB12 0.008 0.000
0.012
0.000
0.009
0.000
0.008
0.000
0
0.05
P-V
AL
UE
DB4 DB8 DB12
COMPARISON OF P-VALUE WITH VARIOUS TYPES OF
DAUBECHIES FAMILIES FOR ERYTHRODERMA BY USING
APPROXIMATE SUB-IMAGE: MEAN
ERY VS PLAQUE ERY VS GUTTATE
Figure 16. Comparison of P-value mean coefficients with various Daubechies families for
erythroderma in approximate sub-images.
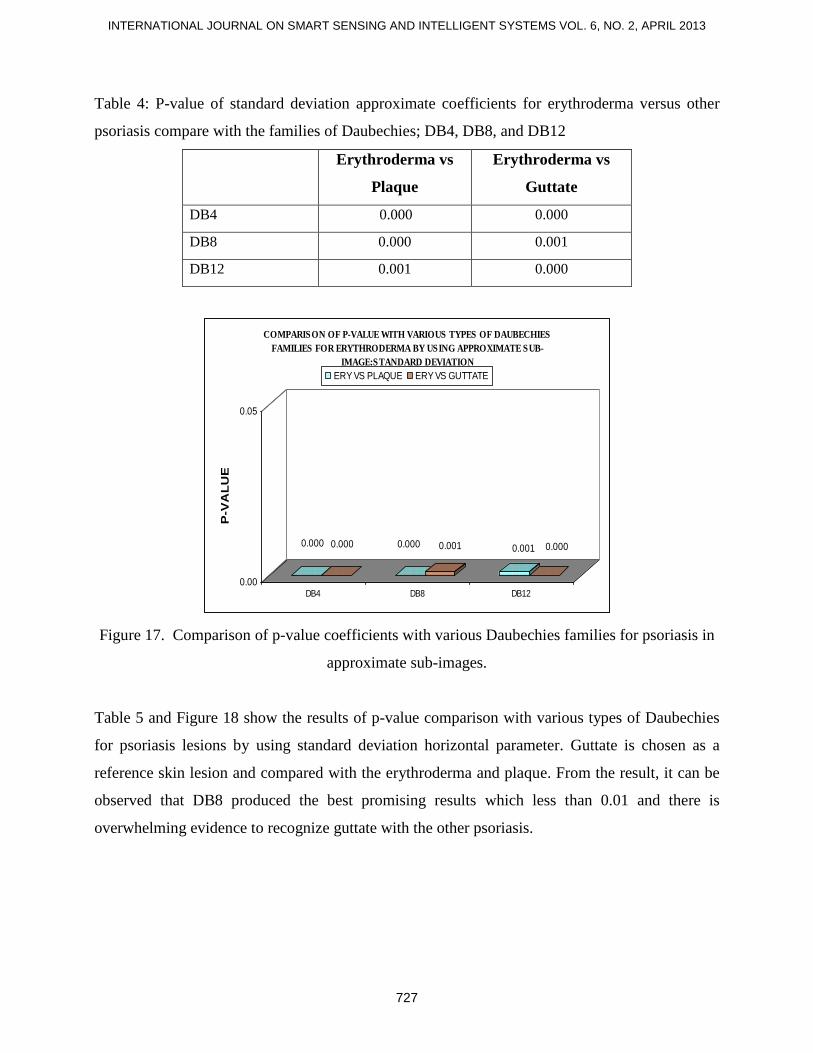
Comparison result of p-value with various types of Daubechies for psoriasis lesions by using
standard deviation approximate parameter is depicted in Table 4 and Figure 17. Erythroderma is
chosen as reference skin lesions and compared with the plaque and guttate. From the results,
there is strong evidence that erythoderma is distinctively different from guttate and plaque by
using the approximate sub-images coefficients. DB4 gives the best indicators to compare
erythroderma with plaque and guttate where both of the p-value both are 0.000.
INTERNATIONAL JOURNAL ON SMART SENSING AND INTELLIGENT SYSTEMS VOL. 6, NO. 2, APRIL 2013
727
Table 4: P-value of standard deviation approximate coefficients for erythroderma versus other
psoriasis compare with the families of Daubechies; DB4, DB8, and DB12
Erythroderma vs
Plaque
Erythroderma vs
Guttate
DB4 0.000 0.000
DB8 0.000 0.001
DB12 0.001 0.000
0.000 0.000 0.000 0.001 0.001 0.000
0.00
0.05
P-V
AL
UE
DB4 DB8 DB12
COMPARISON OF P-VALUE WITH VARIOUS TYPES OF DAUBECHIES
FAMILIES FOR ERYTHRODERMA BY USING APPROXIMATE SUB-
IMAGE:STANDARD DEVIATION
ERY VS PLAQUE ERY VS GUTTATE
Figure 17. Comparison of p-value coefficients with various Daubechies families for psoriasis in
approximate sub-images.
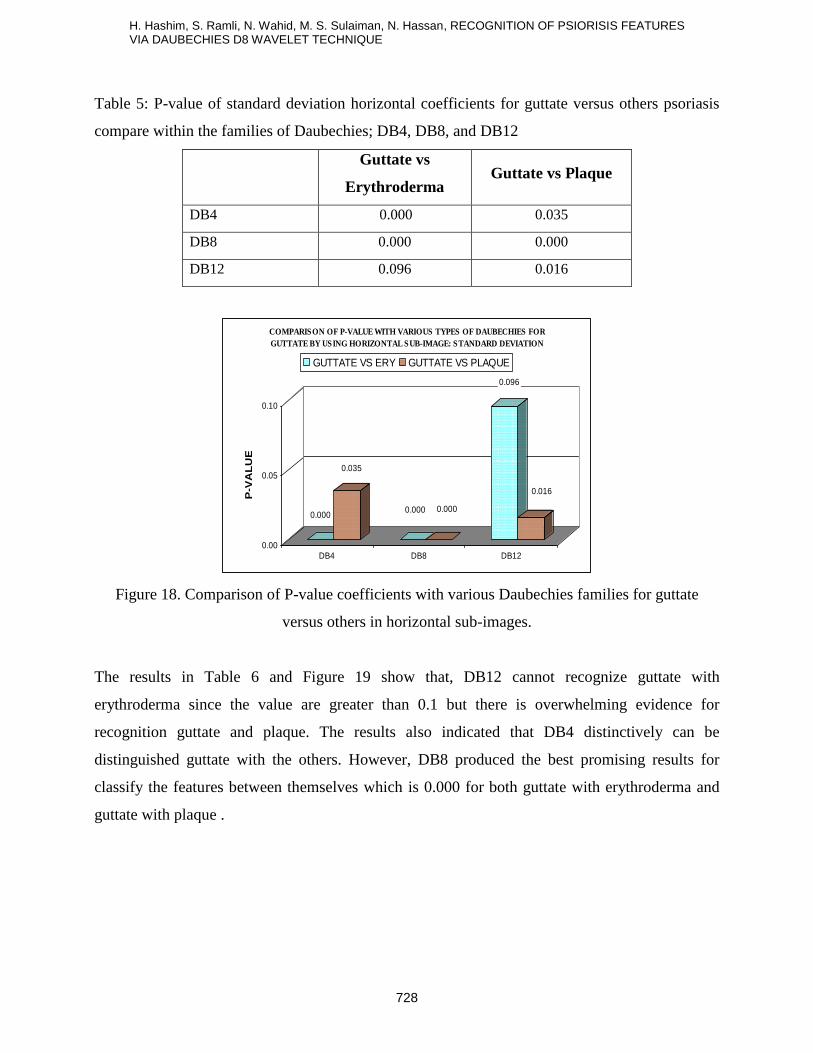
Table 5 and Figure 18 show the results of p-value comparison with various types of Daubechies
for psoriasis lesions by using standard deviation horizontal parameter. Guttate is chosen as a
reference skin lesion and compared with the erythroderma and plaque. From the result, it can be
observed that DB8 produced the best promising results which less than 0.01 and there is
overwhelming evidence to recognize guttate with the other psoriasis.
H. Hashim, S. Ramli, N. Wahid, M. S. Sulaiman, N. Hassan, RECOGNITION OF PSIORISIS FEATURES VIA DAUBECHIES D8 WAVELET TECHNIQUE
728
Table 5: P-value of standard deviation horizontal coefficients for guttate versus others psoriasis
compare within the families of Daubechies; DB4, DB8, and DB12
Guttate vs
Erythroderma Guttate vs Plaque
DB4 0.000 0.035
DB8 0.000 0.000
DB12 0.096 0.016
0.000
0.035
0.000 0.000
0.096
0.016
0.00
0.05
0.10
P-V
AL
UE
DB4 DB8 DB12
COMPARISON OF P-VALUE WITH VARIOUS TYPES OF DAUBECHIES FOR
GUTTATE BY USING HORIZONTAL SUB-IMAGE: STANDARD DEVIATION
GUTTATE VS ERY GUTTATE VS PLAQUE
Figure 18. Comparison of P-value coefficients with various Daubechies families for guttate
versus others in horizontal sub-images.
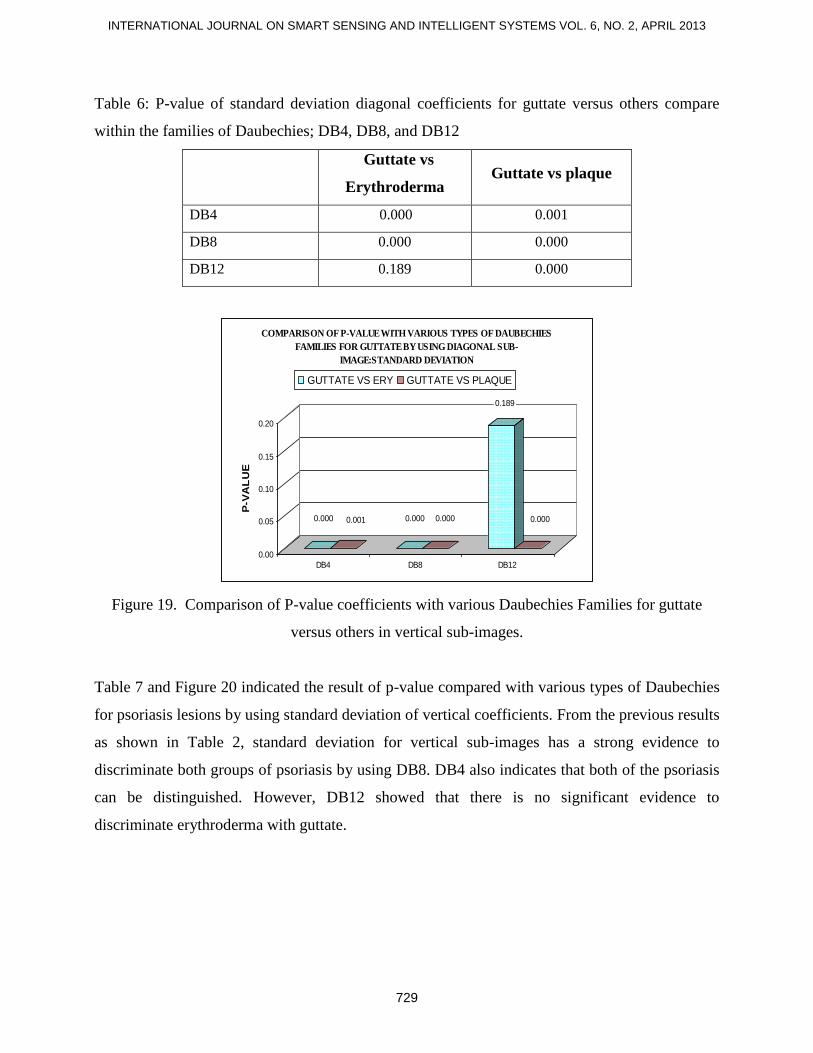
The results in Table 6 and Figure 19 show that, DB12 cannot recognize guttate with
erythroderma since the value are greater than 0.1 but there is overwhelming evidence for
recognition guttate and plaque. The results also indicated that DB4 distinctively can be
distinguished guttate with the others. However, DB8 produced the best promising results for
classify the features between themselves which is 0.000 for both guttate with erythroderma and
guttate with plaque .
INTERNATIONAL JOURNAL ON SMART SENSING AND INTELLIGENT SYSTEMS VOL. 6, NO. 2, APRIL 2013
729
Table 6: P-value of standard deviation diagonal coefficients for guttate versus others compare
within the families of Daubechies; DB4, DB8, and DB12
Guttate vs
Erythroderma Guttate vs plaque
DB4 0.000 0.001
DB8 0.000 0.000
DB12 0.189 0.000
0.000 0.001 0.000 0.000
0.189
0.000
0.00
0.05
0.10
0.15
0.20
P-V
AL
UE
DB4 DB8 DB12
COMPARISON OF P-VALUE WITH VARIOUS TYPES OF DAUBECHIES
FAMILIES FOR GUTTATE BY USING DIAGONAL SUB-
IMAGE:STANDARD DEVIATION
GUTTATE VS ERY GUTTATE VS PLAQUE
Figure 19. Comparison of P-value coefficients with various Daubechies Families for guttate
versus others in vertical sub-images.
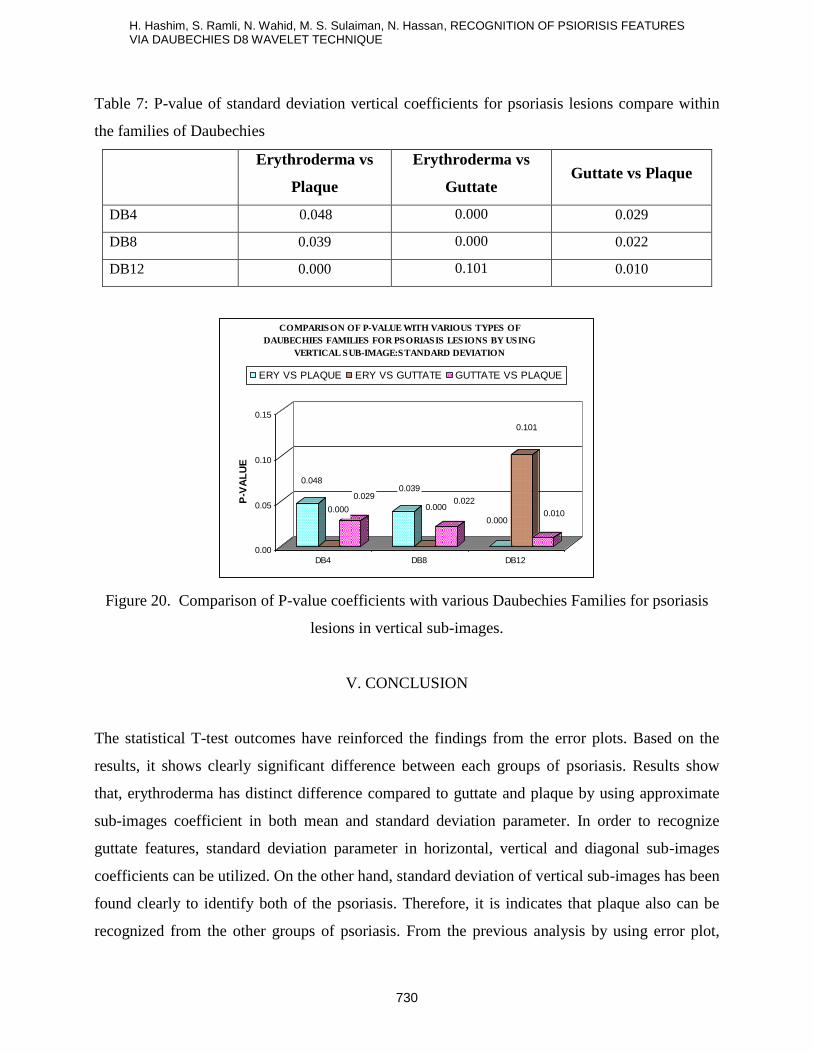
Table 7 and Figure 20 indicated the result of p-value compared with various types of Daubechies
for psoriasis lesions by using standard deviation of vertical coefficients. From the previous results
as shown in Table 2, standard deviation for vertical sub-images has a strong evidence to
discriminate both groups of psoriasis by using DB8. DB4 also indicates that both of the psoriasis
can be distinguished. However, DB12 showed that there is no significant evidence to
discriminate erythroderma with guttate.
H. Hashim, S. Ramli, N. Wahid, M. S. Sulaiman, N. Hassan, RECOGNITION OF PSIORISIS FEATURES VIA DAUBECHIES D8 WAVELET TECHNIQUE
730
Table 7: P-value of standard deviation vertical coefficients for psoriasis lesions compare within
the families of Daubechies
Erythroderma vs
Plaque
Erythroderma vs
Guttate Guttate vs Plaque
DB4 0.048 0.000 0.029
DB8 0.039 0.000 0.022
DB12 0.000 0.101 0.010
0.048
0.000
0.0290.039
0.0000.022
0.000
0.101
0.010
0.00
0.05
0.10
0.15
P-V
AL
UE
DB4 DB8 DB12
COMPARISON OF P-VALUE WITH VARIOUS TYPES OF
DAUBECHIES FAMILIES FOR PSORIASIS LESIONS BY USING
VERTICAL SUB-IMAGE:STANDARD DEVIATION
ERY VS PLAQUE ERY VS GUTTATE GUTTATE VS PLAQUE
Figure 20. Comparison of P-value coefficients with various Daubechies Families for psoriasis
lesions in vertical sub-images.
V. CONCLUSION
The statistical T-test outcomes have reinforced the findings from the error plots. Based on the
results, it shows clearly significant difference between each groups of psoriasis. Results show
that, erythroderma has distinct difference compared to guttate and plaque by using approximate
sub-images coefficient in both mean and standard deviation parameter. In order to recognize
guttate features, standard deviation parameter in horizontal, vertical and diagonal sub-images
coefficients can be utilized. On the other hand, standard deviation of vertical sub-images has been
found clearly to identify both of the psoriasis. Therefore, it is indicates that plaque also can be
recognized from the other groups of psoriasis. From the previous analysis by using error plot,
INTERNATIONAL JOURNAL ON SMART SENSING AND INTELLIGENT SYSTEMS VOL. 6, NO. 2, APRIL 2013
731
there is no significant result to distinguish plaque with the other groups of psoriasis. It proves that
t-test is an effective method to produces significant outcomes for recognition the features
between groups of psoriasis. Besides, psoriasis features are compared with the other families of
Daubechies which are DB4 and DB12. In comparison, DB8 gives the most significant evidence
in recognized psoriasis features by chosen standard deviation of vertical sub-images and produces
the best promising results in recognition of guttate from the others by using standard deviation of
horizontal and diagonal parameter. This study also attempted to analyze which parameter will be
most effective results in order to recognize the difference between psoriasis. Conclusively,
Daubechies D8 at level 1 can be used to recognize the features of the psoriasis.
REFERENCES
[1] I.G. Maglogianis, E.P. Zafiropoulos, “Characterization of Digital Medical Images Utilizing
Support Vector Machines”, BMC Medical Informatics and Decision Making, 4:4, 2004.
[2] “Evaluation of Fingerprint Recognition Technologies-Bio-Finger,” Public Final Report,
Version 1.1, Bundesamt f¨ur Sicherheit in der Informationstechnik, pp. 122, 2004.
[3] A. K. Jain, P. Flynn, and A. A. Ross, “Handbook of Biometrics”, Springer, New York, 2008.
[4] R. M. Bolle, J. H. Connell, S. Pankanti,N. K. Ratha, and A. W. Senior, “Guide to
Biometrics”, Springer, New York, 2004.
[5] W. D. James, T. G. Berger, and D. M. Elston, “Andrew’s Diseases of the Skin-Clinical
Dermatology”, Elsevier Saunders, 10th edition, 2006.
[6] T. P. Habif, “Clinical Dermatology”, Mosby, Hong Kong, 4th Edition, 2004.
[7] Giardina, E.C. Sinibaldi and G. Novelli, “The Psoriasis Genetics as a Model of Complex
Disease”, Current Drug Targets-Inflammation and Allergy, 3(2): pp129-136, 2004.
[8] Nidhal K. Al Abbadi, Nizar Saadi Dahir, Muhsin A. Al-Dhalimi and Hind Restom, “Psoriasis
Detection Using Skin Color and Texture Features”, Journal of Computer Science 6 (6): pp648-
652, 2010.
[9] T. Morrow, "Evaluating New Therapies for Psoriasis”, Managed Care, Vol. 13, pp. 34-40,
2004.
[10] D. M. Pariser, "Management of Moderate to Severe Plaque Psoriasis With Biologic
Therapy", Managed Care, Vol. 12, pp. 36-44, 2003.
H. Hashim, S. Ramli, N. Wahid, M. S. Sulaiman, N. Hassan, RECOGNITION OF PSIORISIS FEATURES VIA DAUBECHIES D8 WAVELET TECHNIQUE
732
[11]H. Hashim, M.T. Ali, and N.A. Talib, "Skin Lesions Color Analysis Based on RGB
Reflectance Indices", International Conference on New Techniques in Pharmaceutical and
Biomedical Research, Malaysia 2005.
[12] M. Zafran, H.Hashim, Robbaiyah, Yuslindawati, “Identification of Psoriasis Lesion Features
Using Daubechies D4 Wavelet Technique”, Recent Researches in Communications, Electronics,
Signal Processing and Automatic Control, 2012.
[13] J. S. Taur, G. H. Lee, C. W. Tao, C. C. Chen, and C. W. Yang, " Segmentation of Psoriasis
Vulgaris Images Using Multiresolution-Based Orthogonal Subspace Techniques", IEEE
Transaction on Systems, Man and Cybernatics - Part B: Cybernatics, Vol. 36, No. 2, 2006.
[14] Djeddi Meriem, Ouahabi Abdeldjalil, Batatia Hadj, Basarab Adrian and Kouamé Denis,
"Discrete Wavelet for Multifractal Texture Classification: Application to Medical Ulrasound
Imaging", 2010 IEEE 17th
International Conference on Imaging Processing, Hong Kong, 2010.
[15] S. Guyot, M-C. Peron and E. Deléchelle, “Spatial Speckle Characterization by Brownian
Motion Analysis,” Physical Review E, Statistical, Nonlinear, and Soft Matter Physics, Vol. 70,
Issue 4, pp.046618.1-046618.8, 2004.
[16] Ahmad Fadzil M Hani, Esa Prakasa, Hurriyatul Fitriyah, Hermawan Nugroho, Azura Mohd
Affandi and Suraiya Hani Hussein, "High Order Polynominal Surface Fitting for Measuring
Roughness of Psoriasis Lesion", Visual Informatics: Sustaining Research and Innovation, pp 341-
351, 2011.
[17] W. Marco, G. Armin, W. Christian, B. Patrick, S.Josef, “Discrimination of Benign Common
Nevi from Malignant Malonoma Lesion by Use of Features Based on Spectral Properties of the
Wavelet Transform”, Analytical and Quantitative Cytology and Historlogy, pp243-253, 2003.
[18] E.M. Fomitchev, “An Introduction to Wavelets and Wavelet Transform”, Systems and
Programming Resources Inc, Tulsa, USA, 1998.
[19] C.M. Thoms, S.M. Dunn, C.F. Nodine, H.L. Kundel, "An analysis of Perceptual Errors in
Reading Mammograms Using Quasi-local Spatial Frequency Spectra", Journal of Digit Imaging,
Vol.4, pp117-123, 2001.
[20] Kaiser, “The Fast Haar Transform Potentials", IEEE Transaction, Volume 17, Issue 2 pp34-
37, 1998.
[21] G. Keller and B. Warrack, “Statistical for Measurement and Economics”, Fifth Edition,
2001.
Related Documents