R-DMAIC-D Six Sigma Prepared by Julian Kalac, P.Eng Lean Six Sigma Master Black Belt Measure Analyze Improve Control Results Define Measu re Analyze Improve Control Results

Welcome message from author
This document is posted to help you gain knowledge. Please leave a comment to let me know what you think about it! Share it to your friends and learn new things together.
Transcript
R-DMAIC-D Six Sigma
Prepared by Julian Kalac, P.Eng
Lean Six Sigma Master Black Belt
Define
Measure
AnalyzeImprove
ControlResults
Define
Measu
re
AnalyzeImprove
ControlResults
2
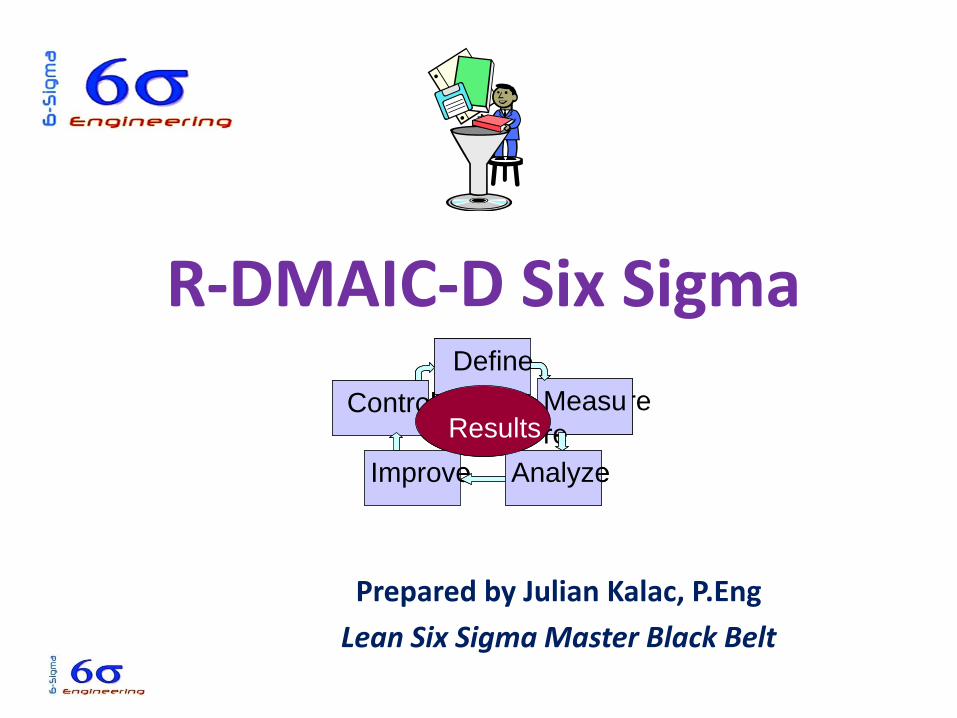
σ Use data-driven, measurement-based, statistical methods to Solve problems, improve performance
σ Focus: Surgical “inch-wide, mile-deep” investigation and resolution
σ Approach:
σSolve problems at the system and root cause level
σ Implement robust control plans for sustained improvements
What is “Six Sigma”?An Analytical Methodology that Focuses on Reducing Process Variation
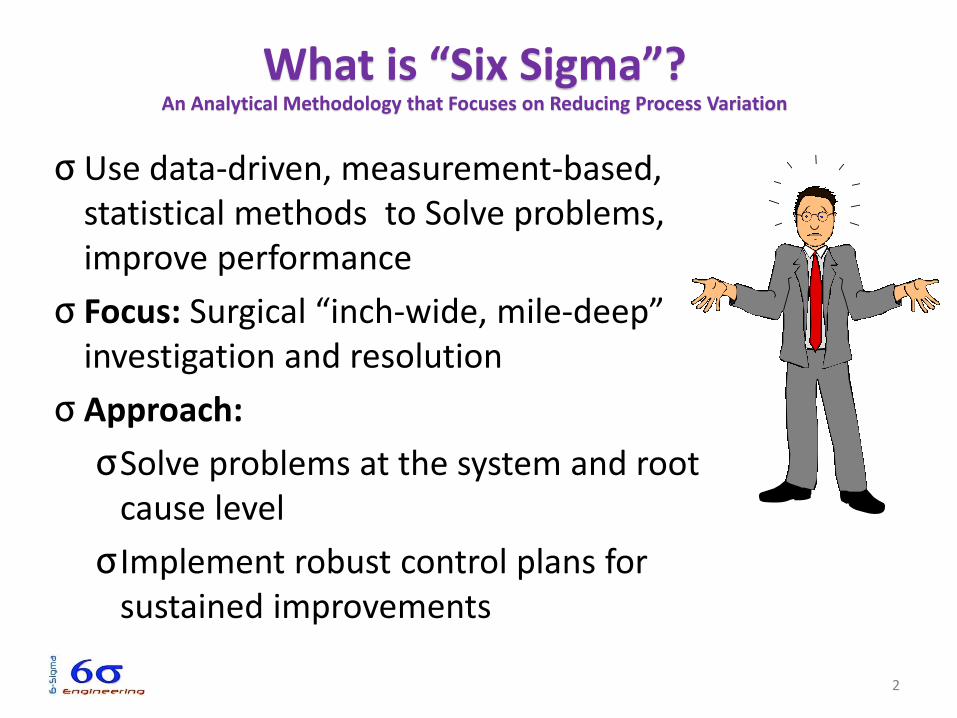
Six Sigma as a Metric
1
)( 2
n
xxi
Sigma = = Deviation( Square root of variance )
-7 -6 -5 -4 -3 -2 -1 0 1 2 3 4 5 6 7
Axis graduated in Sigma
68.27 %
95.45 %
99.73 %
99.9937 %
99.999943 %
99.9999998 %
result: 317300 ppm outside
(deviation)
45500 ppm
2700 ppm
63 ppm
0.57 ppm
0.002 ppm
between + / - 1
between + / - 2
between + / - 3
between + / - 4
between + / - 5
between + / - 6
=
4
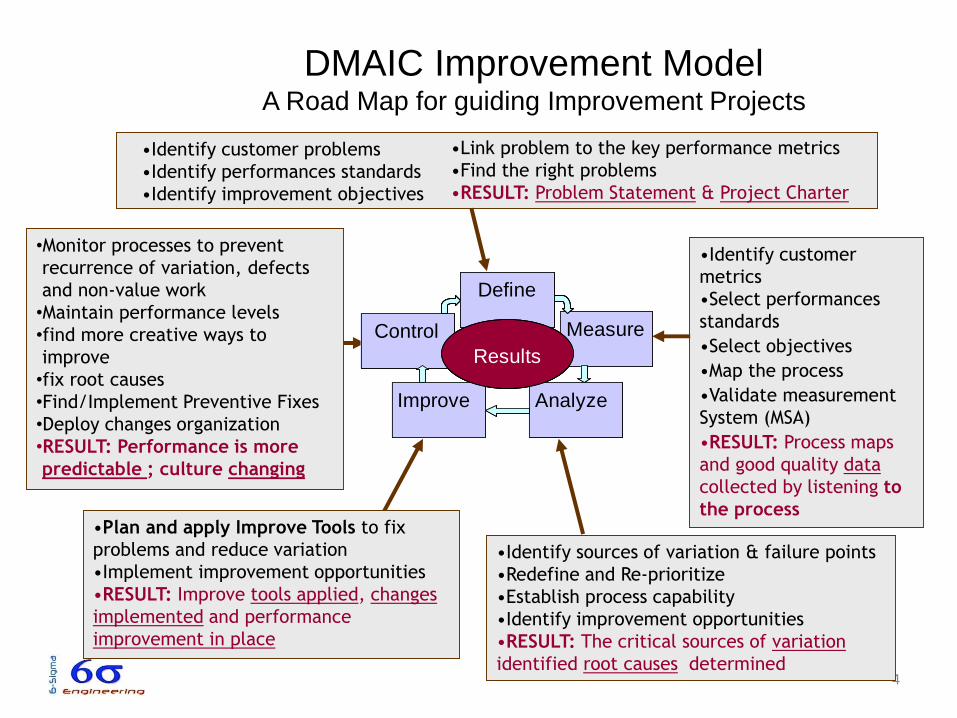
•Identify customer
metrics
•Select performances
standards
•Select objectives
•Map the process
•Validate measurement
System (MSA)
•RESULT: Process maps
and good quality data
collected by listening to
the process
•Identify sources of variation & failure points
•Redefine and Re-prioritize
•Establish process capability
•Identify improvement opportunities
•RESULT: The critical sources of variation
identified root causes determined
•Monitor processes to prevent
recurrence of variation, defects
and non-value work
•Maintain performance levels
•find more creative ways to
improve
•fix root causes
•Find/Implement Preventive Fixes
•Deploy changes organization
•RESULT: Performance is more
predictable ; culture changing
•Plan and apply Improve Tools to fix
problems and reduce variation
•Implement improvement opportunities
•RESULT: Improve tools applied, changes
implemented and performance
improvement in place
DMAIC Improvement ModelA Road Map for guiding Improvement Projects
•Identify customer problems
•Identify performances standards
•Identify improvement objectives
•Link problem to the key performance metrics
•Find the right problems
•RESULT: Problem Statement & Project Charter
Define
Measure
AnalyzeImprove
Control
Results
Define
Measure
AnalyzeImprove
Control
Results
5
Define
Measure
AnalyzeImprove
Control
Results
Define
Measure
AnalyzeImprove
Control
Results
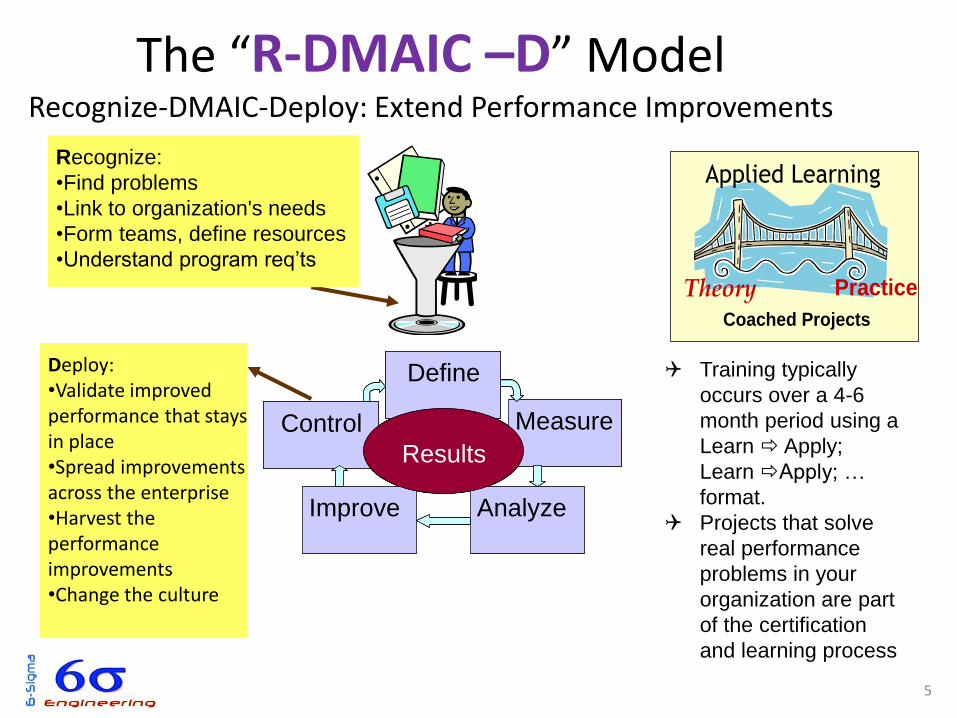
The “R-DMAIC –D” Model Recognize-DMAIC-Deploy: Extend Performance Improvements
Applied Learning
Theory Practice
Coached Projects
Training typically
occurs over a 4-6
month period using a
Learn Apply;
Learn Apply; …
format.
Projects that solve
real performance
problems in your
organization are part
of the certification
and learning process
Recognize:
•Find problems
•Link to organization's needs
•Form teams, define resources
•Understand program req’ts
Deploy:•Validate improved performance that stays in place•Spread improvements across the enterprise•Harvest the performance improvements•Change the culture
8
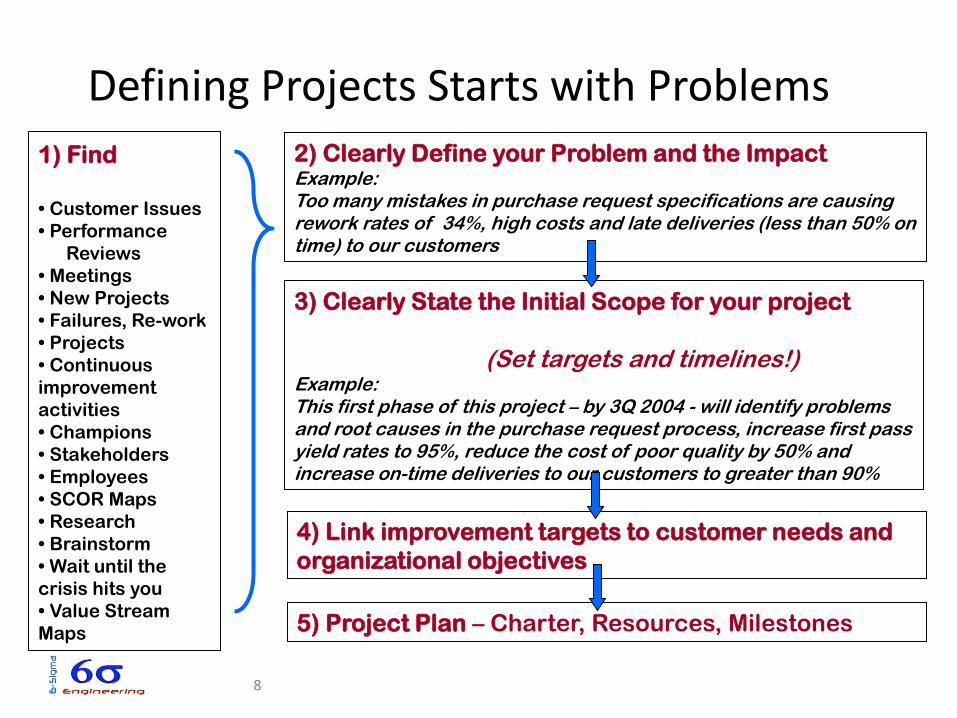
Defining Projects Starts with Problems
2) Clearly Define your Problem and the ImpactExample:Too many mistakes in purchase request specifications are causing rework rates of 34%, high costs and late deliveries (less than 50% on time) to our customers
1) Find
• Customer Issues
• Performance
Reviews
• Meetings
• New Projects
• Failures, Re-work
• Projects
• Continuous
improvement
activities
• Champions
• Stakeholders
• Employees
• SCOR Maps
• Research
• Brainstorm
• Wait until the
crisis hits you
• Value Stream
Maps
3) Clearly State the Initial Scope for your project
(Set targets and timelines!)Example:This first phase of this project – by 3Q 2004 - will identify problems and root causes in the purchase request process, increase first pass yield rates to 95%, reduce the cost of poor quality by 50% and increase on-time deliveries to our customers to greater than 90%
4) Link improvement targets to customer needs and
organizational objectives
5) Project Plan – Charter, Resources, Milestones
9
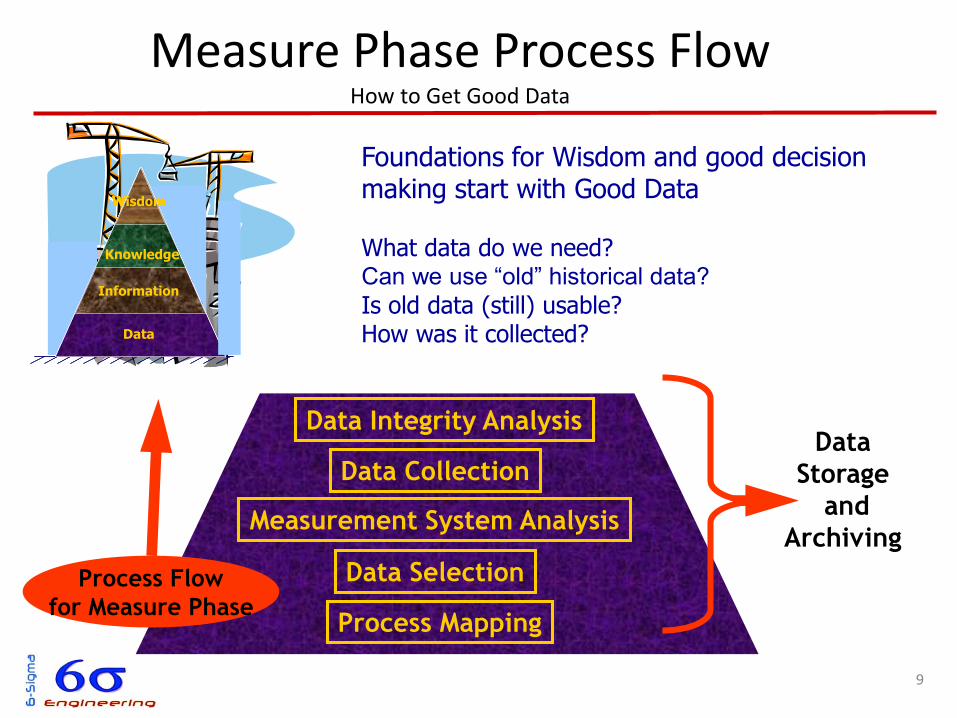
Process Flow
for Measure Phase
Data
Storage
and
Archiving
Foundations for Wisdom and good decision making start with Good Data
What data do we need?Can we use “old” historical data?
Is old data (still) usable? How was it collected?
Wisdom
Knowledge
Data
Information
Wisdom
Knowledge
Data
Information
Wisdom
Knowledge
Data
Information
Measure Phase Process FlowHow to Get Good Data
Data Selection
Data Integrity Analysis
Data Collection
Measurement System Analysis
Process Mapping
10
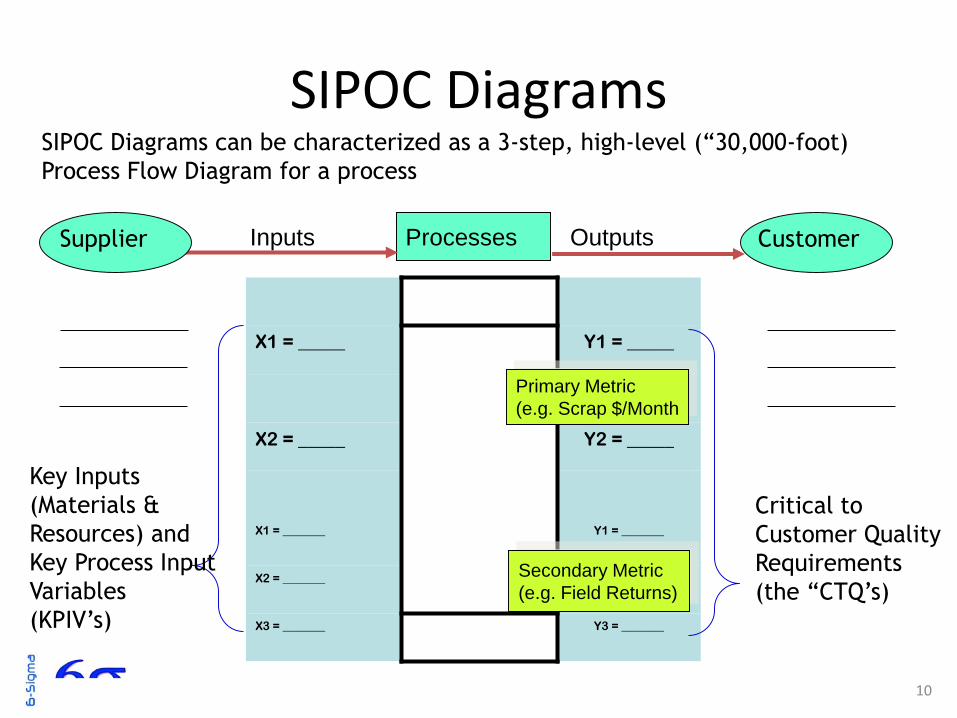
SIPOC Diagrams
X1 = _____ Y1 = _____
X2 = _____ Y2 = _____
X1 = _______ Y1 = _______
X2 = _______ Y2 = _______
X3 = _______ Y3 = _______
SIPOC Diagrams can be characterized as a 3-step, high-level (“30,000-foot)
Process Flow Diagram for a process
Critical to
Customer Quality
Requirements
(the “CTQ’s)
Key Inputs
(Materials &
Resources) and
Key Process Input
Variables
(KPIV’s)
Inputs Processes OutputsSupplier Customer
Secondary Metric
(e.g. Field Returns)
Primary Metric
(e.g. Scrap $/Month
11
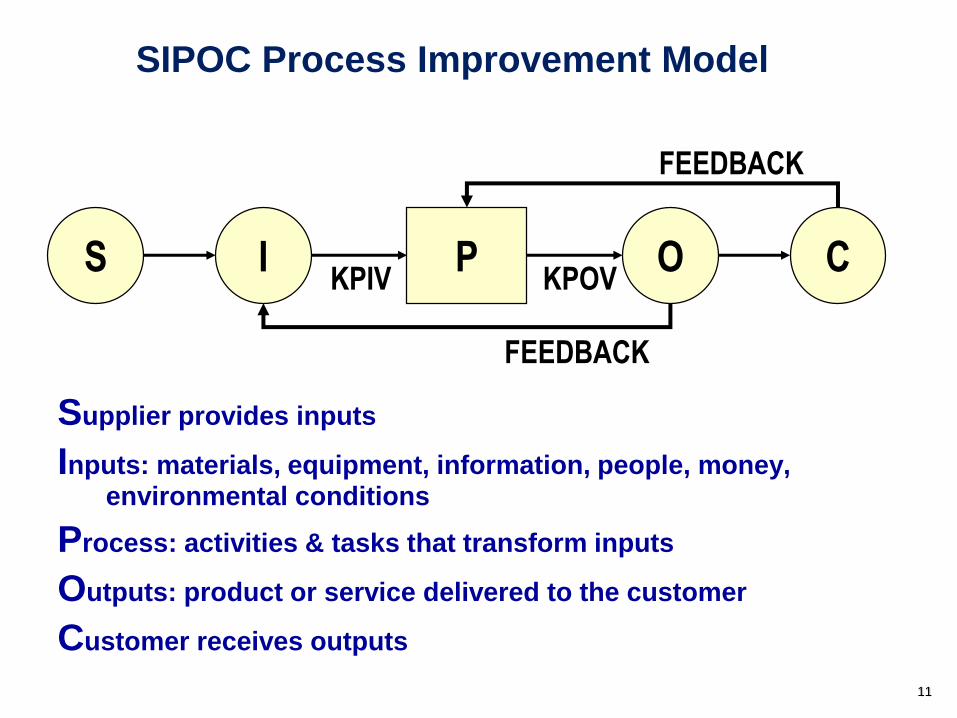
SIPOC Process Improvement Model
Supplier provides inputs
Inputs: materials, equipment, information, people, money, environmental conditions
Process: activities & tasks that transform inputs
Outputs: product or service delivered to the customer
Customer receives outputs
PI OKPIV KPOV
CS
FEEDBACK
FEEDBACK
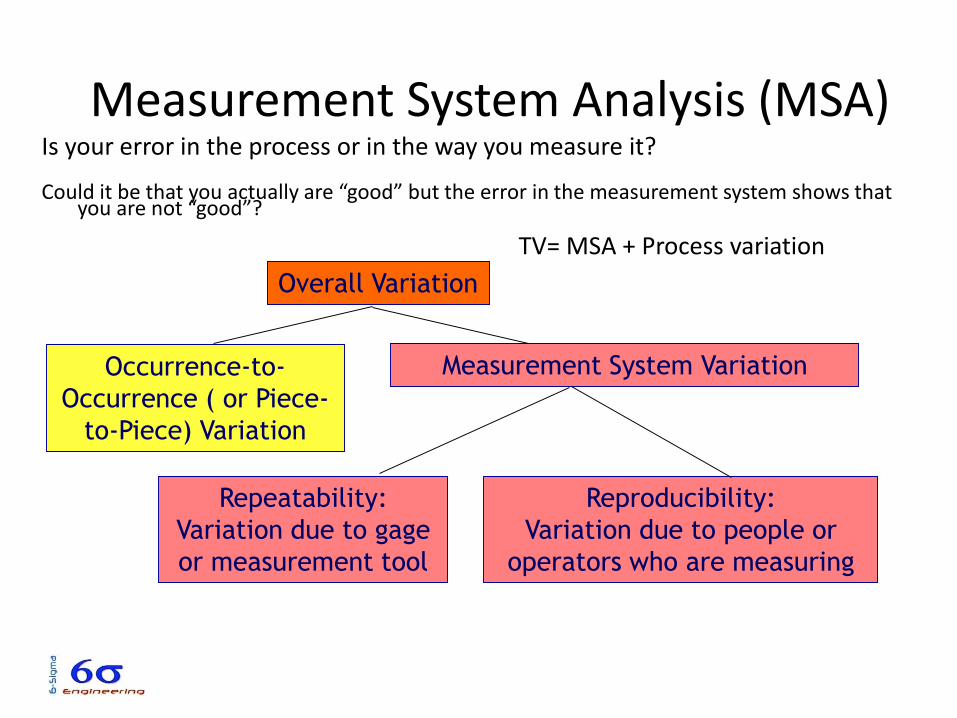
Measurement System Analysis (MSA)Is your error in the process or in the way you measure it?
Could it be that you actually are “good” but the error in the measurement system shows that you are not “good”?
Overall Variation
Occurrence-to-
Occurrence ( or Piece-
to-Piece) Variation
Measurement System Variation
Repeatability:
Variation due to gage
or measurement tool
Reproducibility:
Variation due to people or
operators who are measuring
TV= MSA + Process variation
13
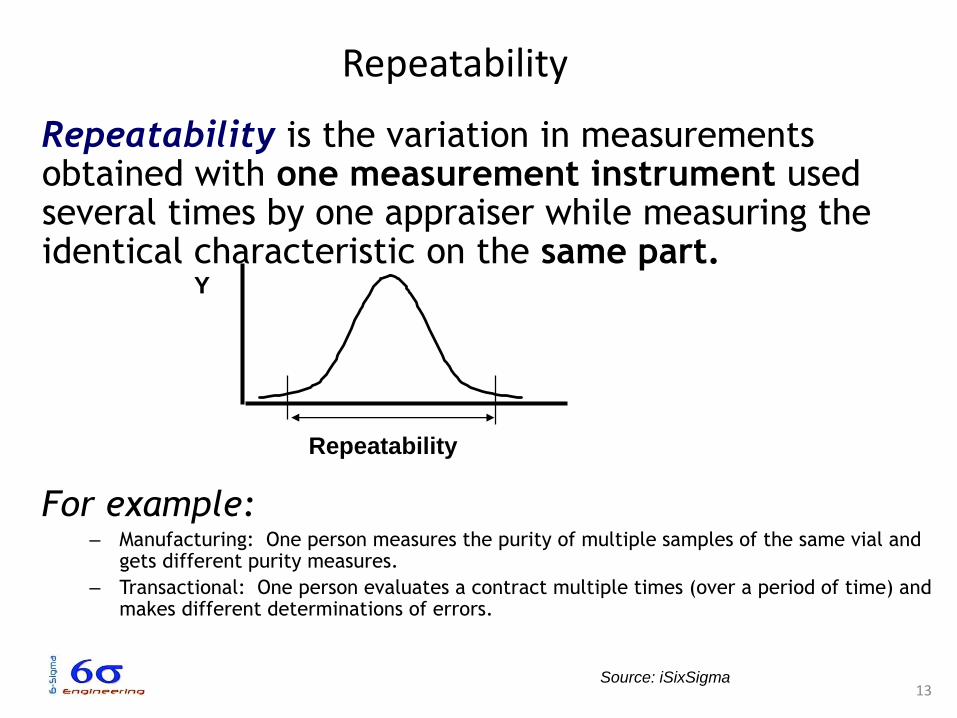
Repeatability
Repeatability is the variation in measurements obtained with one measurement instrument used several times by one appraiser while measuring the identical characteristic on the same part.
For example:– Manufacturing: One person measures the purity of multiple samples of the same vial and
gets different purity measures.
– Transactional: One person evaluates a contract multiple times (over a period of time) and makes different determinations of errors.
Repeatability
Y
Source: iSixSigma
14
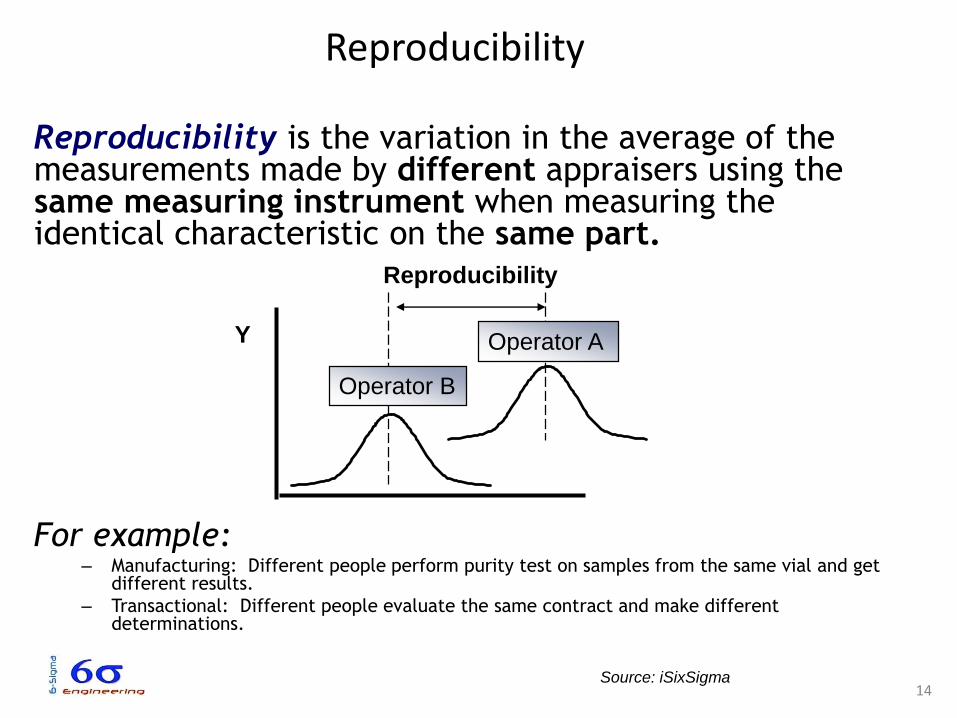
Reproducibility
Reproducibility is the variation in the average of the measurements made by different appraisers using the same measuring instrument when measuring the identical characteristic on the same part.
For example:– Manufacturing: Different people perform purity test on samples from the same vial and get
different results.
– Transactional: Different people evaluate the same contract and make different determinations.
Reproducibility
Operator A
Operator B
Y
Source: iSixSigma
15
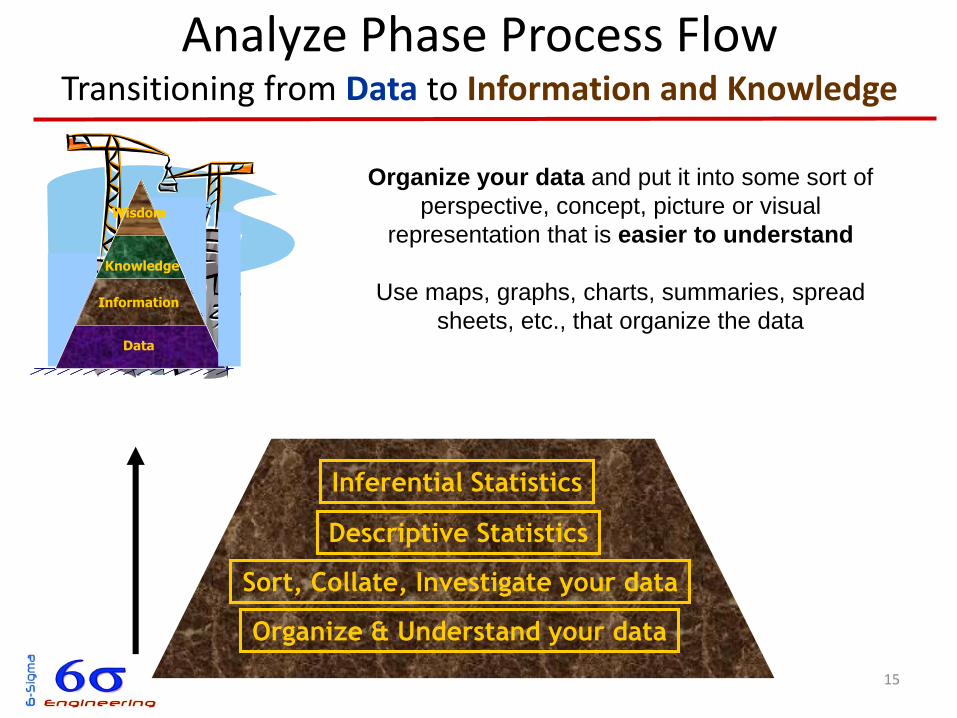
Organize & Understand your data
Inferential Statistics
Descriptive Statistics
Sort, Collate, Investigate your data
Analyze Phase Process FlowTransitioning from Data to Information and Knowledge
Organize your data and put it into some sort of
perspective, concept, picture or visual
representation that is easier to understand
Use maps, graphs, charts, summaries, spread
sheets, etc., that organize the data
Wisdom
Knowledge
Data
Information
Wisdom
Knowledge
Data
Information
Wisdom
Knowledge
Data
Information
16
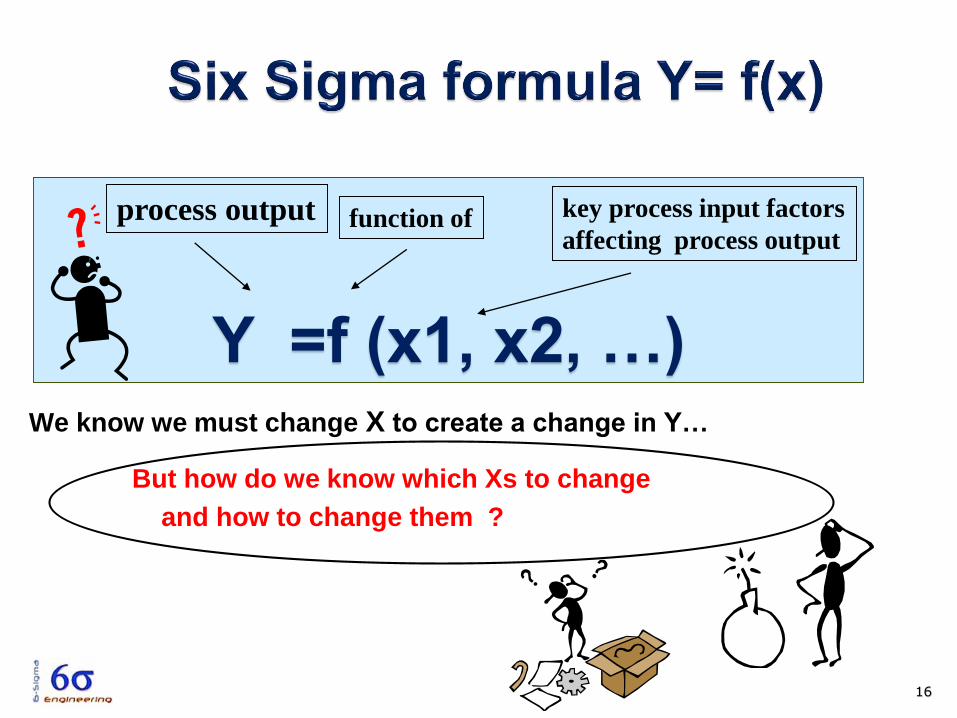
We know we must change X to create a change in Y…
But how do we know which Xs to change
and how to change them ?
Y =f (x1, x2, …)
process output key process input factors
affecting process outputfunction of
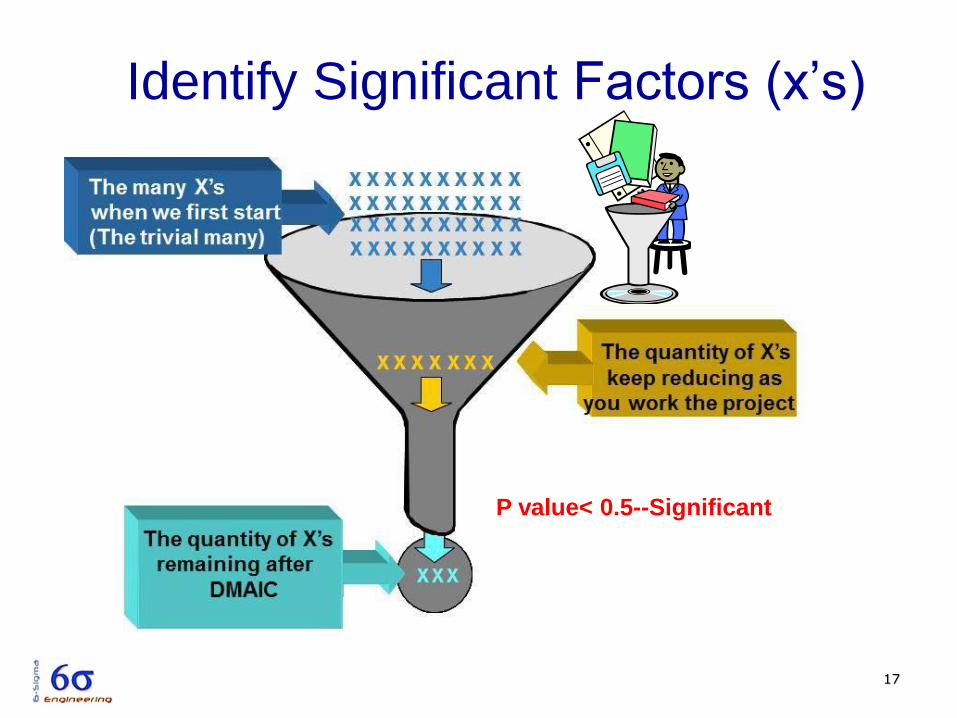
Identify Significant Factors (x’s)
17
P value< 0.5--Significant
18
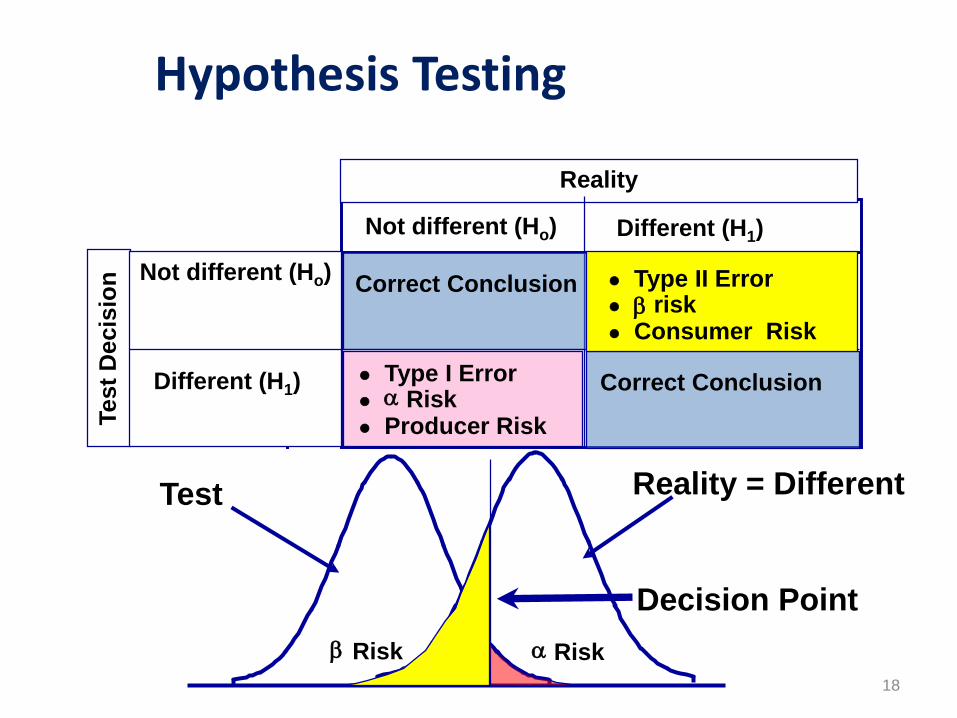
Hypothesis Testing
Not different (Ho)
Reality
Test
Decis
ion
Different (H1)
Not different (Ho)
Different (H1)
Correct Conclusion
Correct Conclusiona Risk
Type I Error Producer Risk
Type II Error b risk Consumer Risk
Test Reality = Different
Decision Point
b Risk a Risk
19
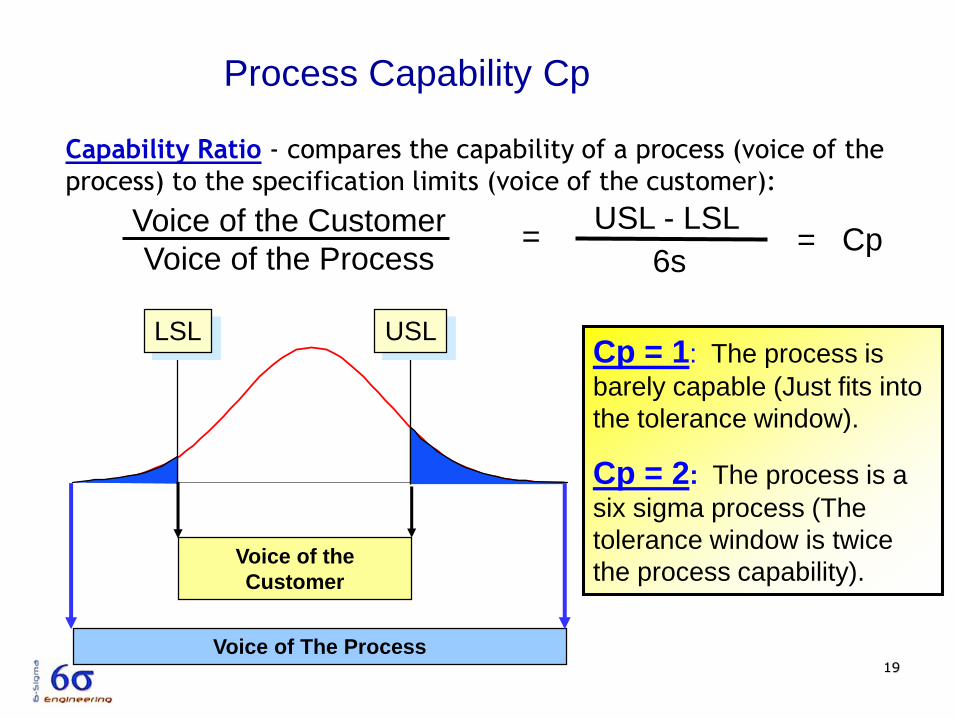
Process Capability Cp
USLLSL
Voice of the
Customer
Voice of The Process
Voice of the Customer
Voice of the Process
Capability Ratio - compares the capability of a process (voice of the
process) to the specification limits (voice of the customer):
=USL - LSL
6s= Cp
Cp = 1: The process is
barely capable (Just fits into
the tolerance window).
Cp = 2: The process is a
six sigma process (The
tolerance window is twice
the process capability).
20
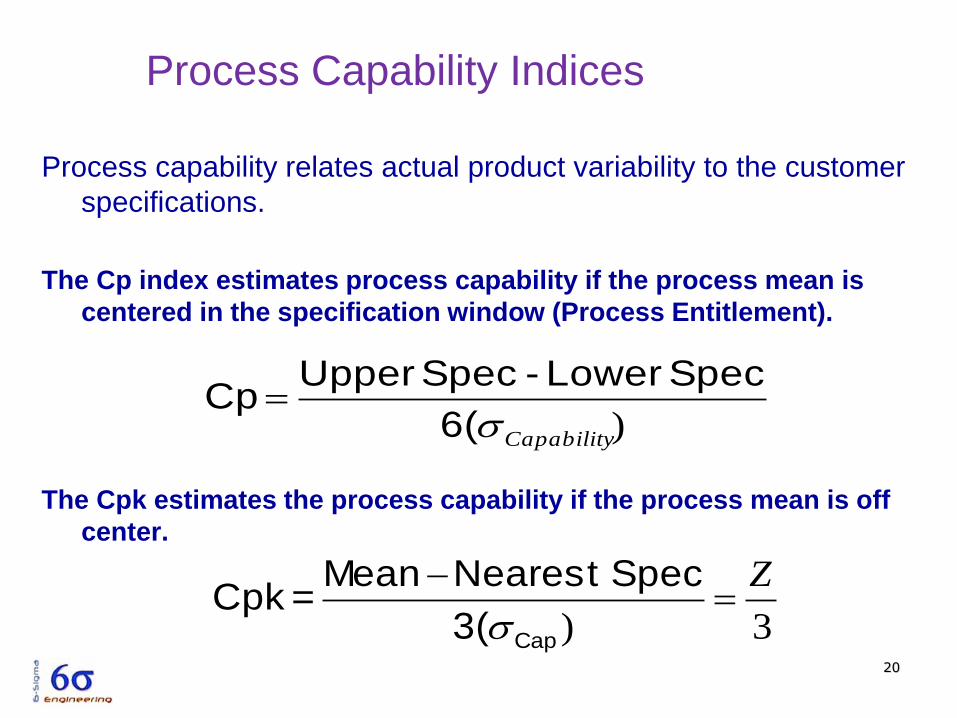
Process Capability Indices
Process capability relates actual product variability to the customer
specifications.
The Cp index estimates process capability if the process mean is
centered in the specification window (Process Entitlement).
The Cpk estimates the process capability if the process mean is off
center.
)Capability6(
Spec Lower -Spec UpperCp
3)
Z
Cap3(
Spec NearestMean=Cpk
21
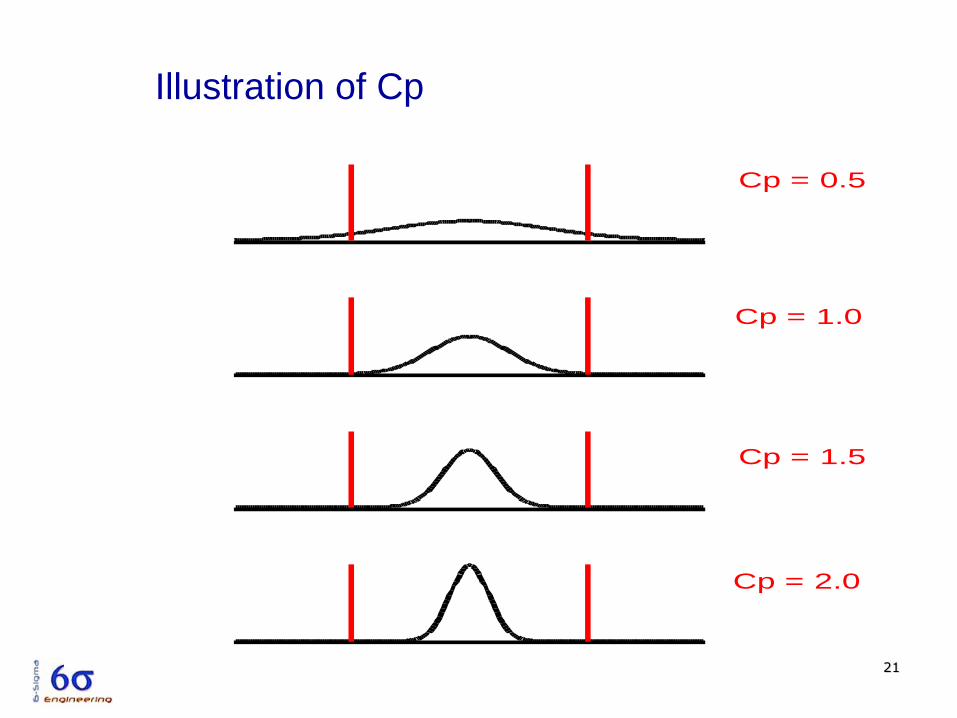
Illustration of Cp
Cp = 0.5
Cp = 1.0
Cp = 1.5
Cp = 2.0
Black Belt
Training
22
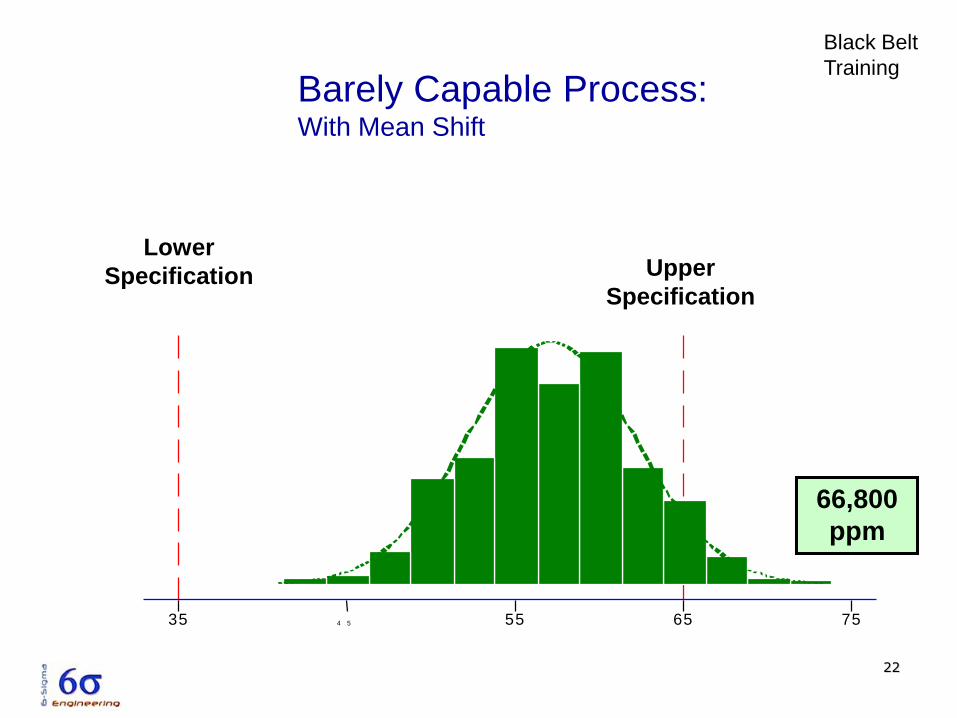
7565554 535
66,800
ppm
Barely Capable Process: With Mean Shift
Lower
Specification Upper
Specification
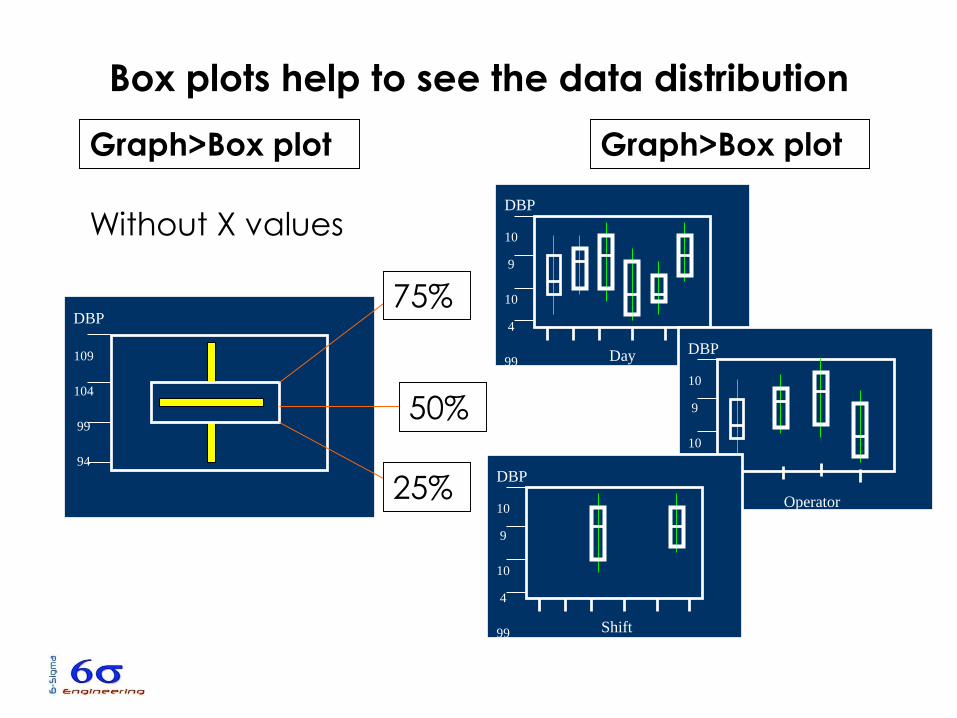
Graph>Box plot
75%
50%
25%
Graph>Box plot
Without X values
DBP
Box plots help to see the data distribution
Day
DBP
10
9
10
4
99
94
109
104
99
94
Operator
DBP
10
9
10
4
99
94
Shift
DBP
10
9
10
4
99
94
24
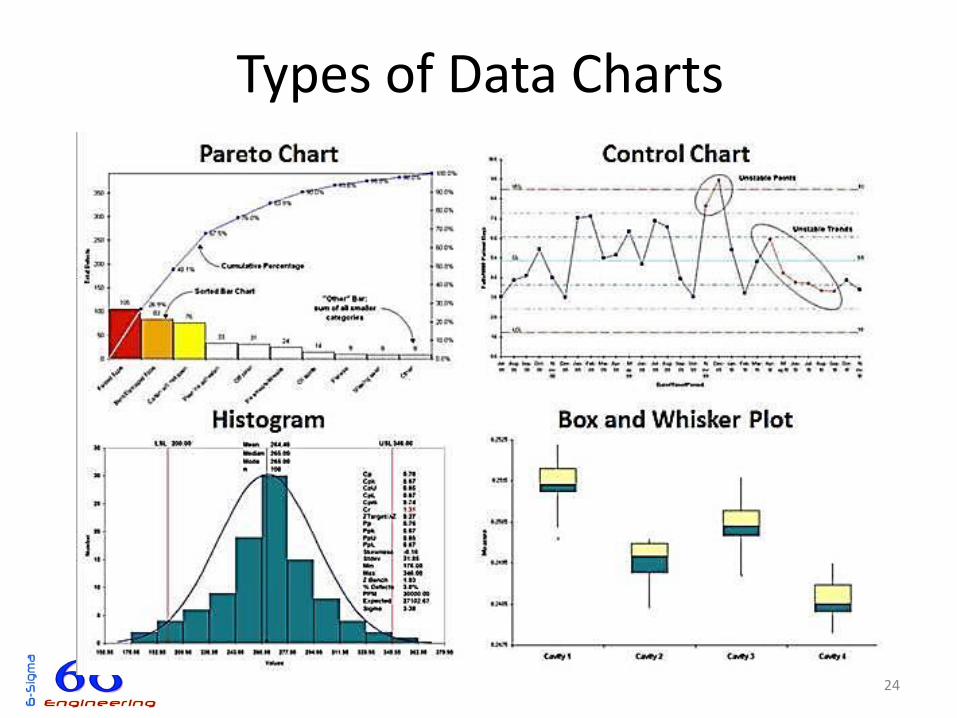
Types of Data Charts
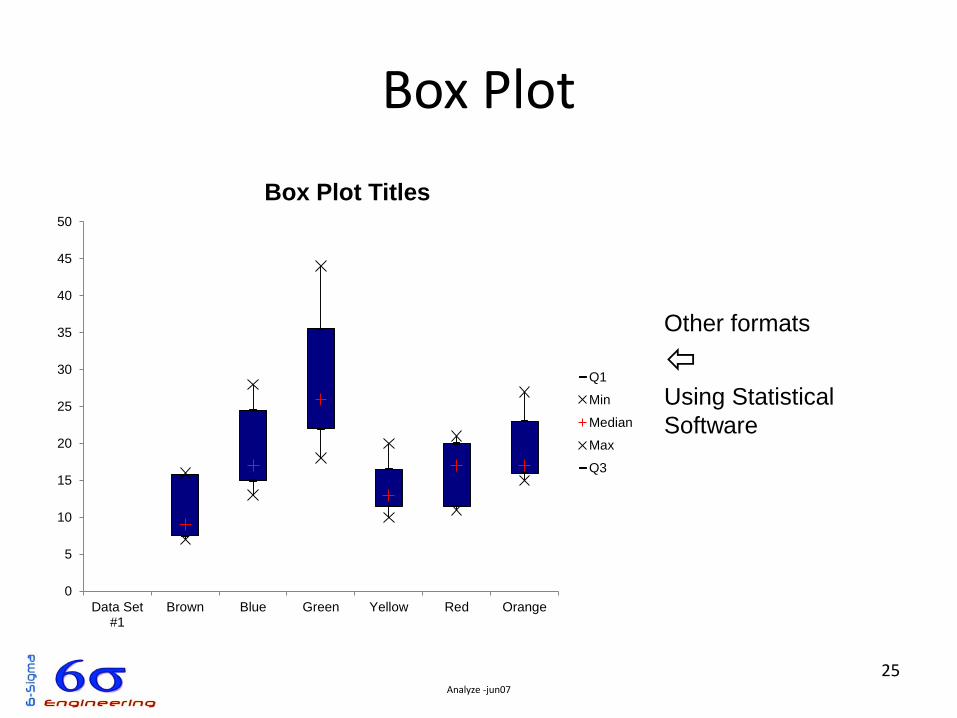
Box Plot
Analyze -jun07
25
0
5
10
15
20
25
30
35
40
45
50
Data Set#1
Brown Blue Green Yellow Red Orange
Box Plot Titles
Q1
Min
Median
Max
Q3
Other formats
Using Statistical
Software
26
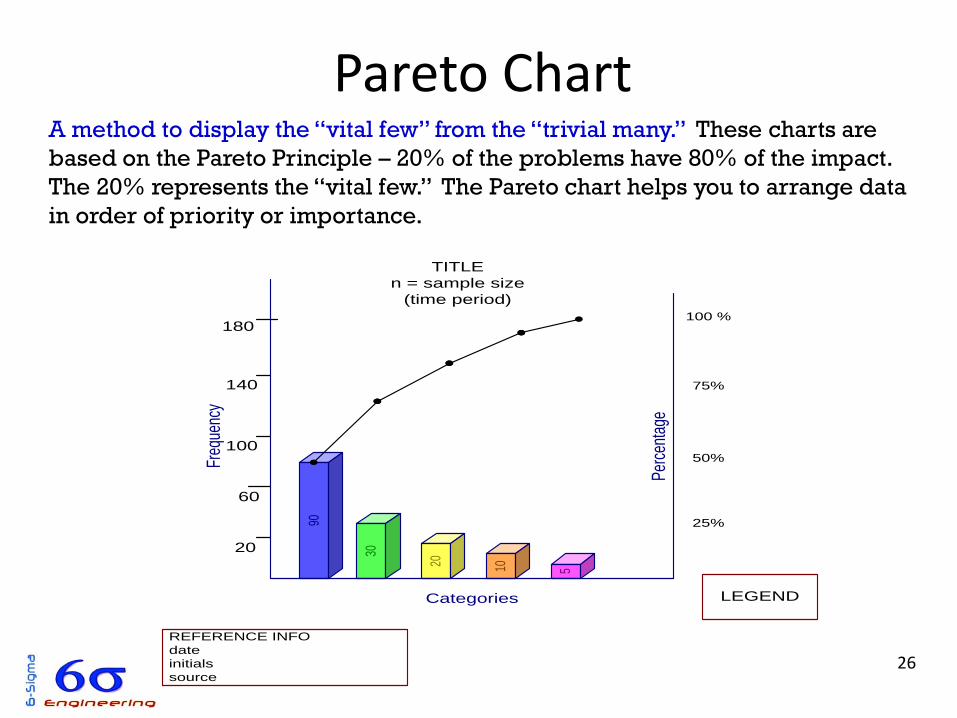
Pareto Chart A method to display the “vital few” from the “trivial many.” These charts are
based on the Pareto Principle – 20% of the problems have 80% of the impact.
The 20% represents the “vital few.” The Pareto chart helps you to arrange data
in order of priority or importance.
90
30
20 10 5
Freq
uenc
y
Categories
Per
cent
age
75%
25%
50%
20
180
140
100
60
TITLE
n = sample size
(time period)
LEGEND
REFERENCE INFO
date
initials
source
100 %
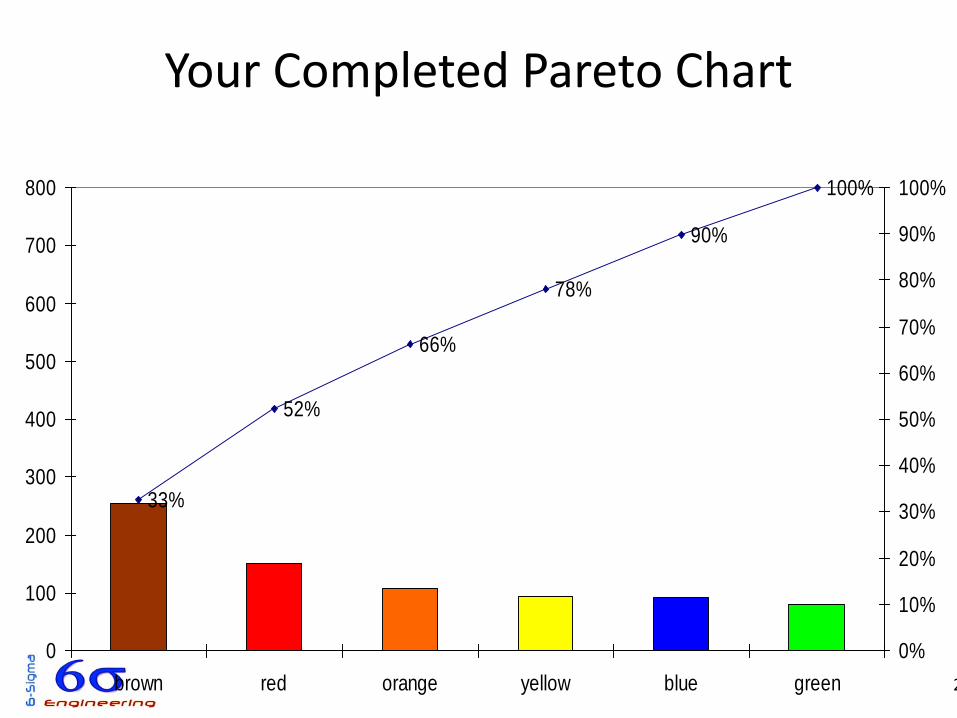
33%
52%
66%
78%
90%
100%
0
100
200
300
400
500
600
700
800
brown red orange yellow blue green
0%
10%
20%
30%
40%
50%
60%
70%
80%
90%
100%
27
Your Completed Pareto Chart
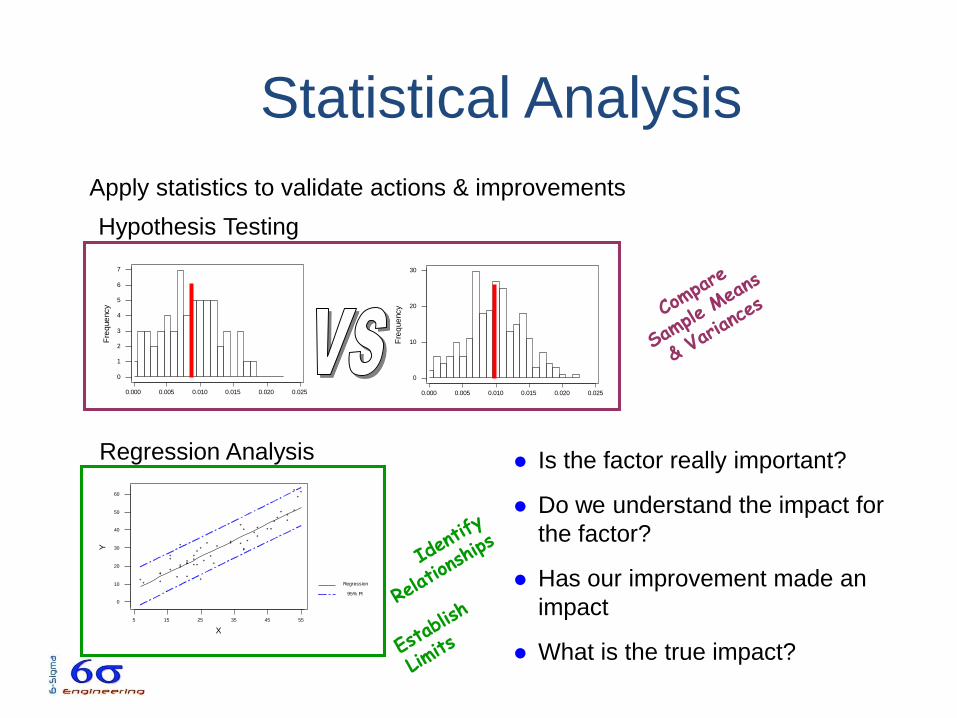
Statistical Analysis
0.0250.0200.0150.0100.0050.000
7
6
5
4
3
2
1
0
New Machine
Fre
que
ncy
0.0250.0200.0150.0100.0050.000
30
20
10
0
Machine 6 mthsF
req
ue
ncy
Is the factor really important?
Do we understand the impact for
the factor?
Has our improvement made an
impact
What is the true impact?
Hypothesis Testing
Regression Analysis
5545352515 5
60
50
40
30
20
10
0
X
Y
R-Sq = 86.0 %
Y = 2.19469 + 0.918549X
95% PI
Regression
Regression Plot
Apply statistics to validate actions & improvements
29
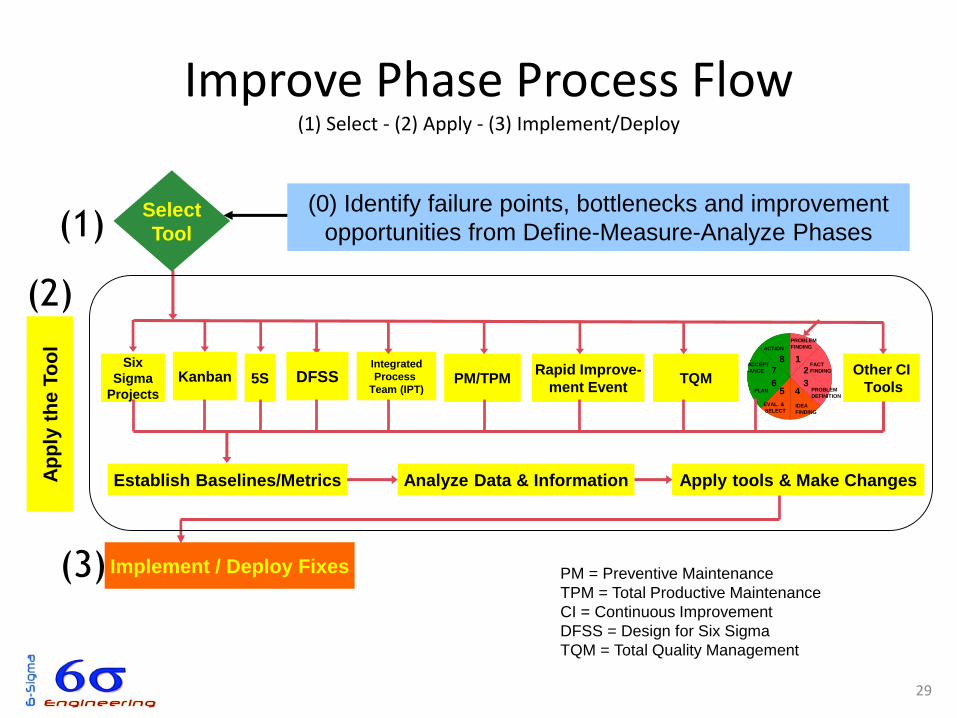
Improve Phase Process Flow(1) Select - (2) Apply - (3) Implement/Deploy
PROBLEM
FINDING
FACT
FINDING
PROBLEM
DEFINITION
IDEA
FINDING
EVAL. &
SELECT
PLAN
ACCEPT
-ANCE
ACTION
1
2
34
6
7
8
5
Select
Tool
Analyze Data & Information Apply tools & Make Changes
Six
Sigma
Projects5S PM/TPM TQM
Rapid Improve-
ment Event
Integrated
Process
Team (IPT)
Establish Baselines/Metrics
Other CI
ToolsKanban DFSS
Ap
ply
th
e T
oo
l
(1)
(2)
(3) Implement / Deploy Fixes
(0) Identify failure points, bottlenecks and improvement
opportunities from Define-Measure-Analyze Phases
PM = Preventive Maintenance
TPM = Total Productive Maintenance
CI = Continuous Improvement
DFSS = Design for Six Sigma
TQM = Total Quality Management
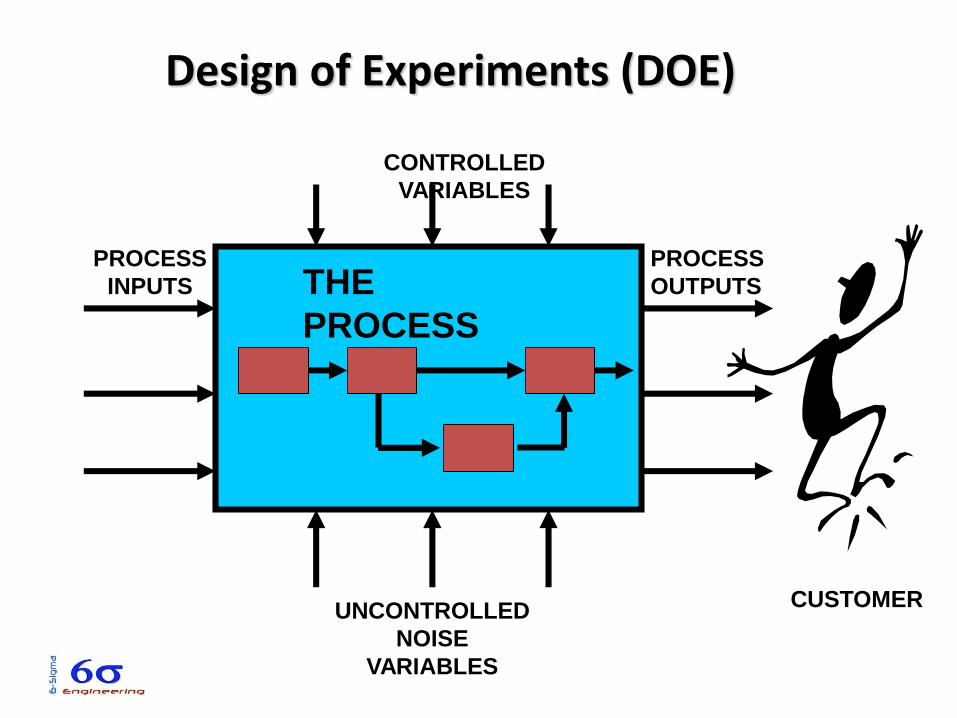
THE
PROCESS
PROCESS
OUTPUTS
CONTROLLED
VARIABLES
CUSTOMER
PROCESS
INPUTS
UNCONTROLLED
NOISE
VARIABLES
Design of Experiments (DOE)
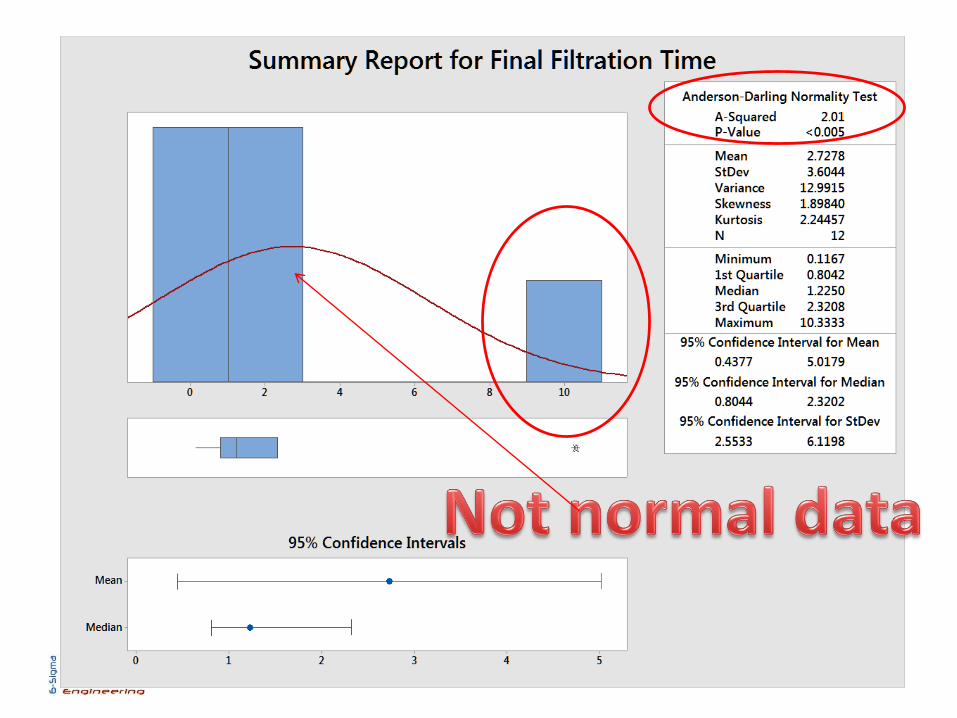
P-value= 0.045
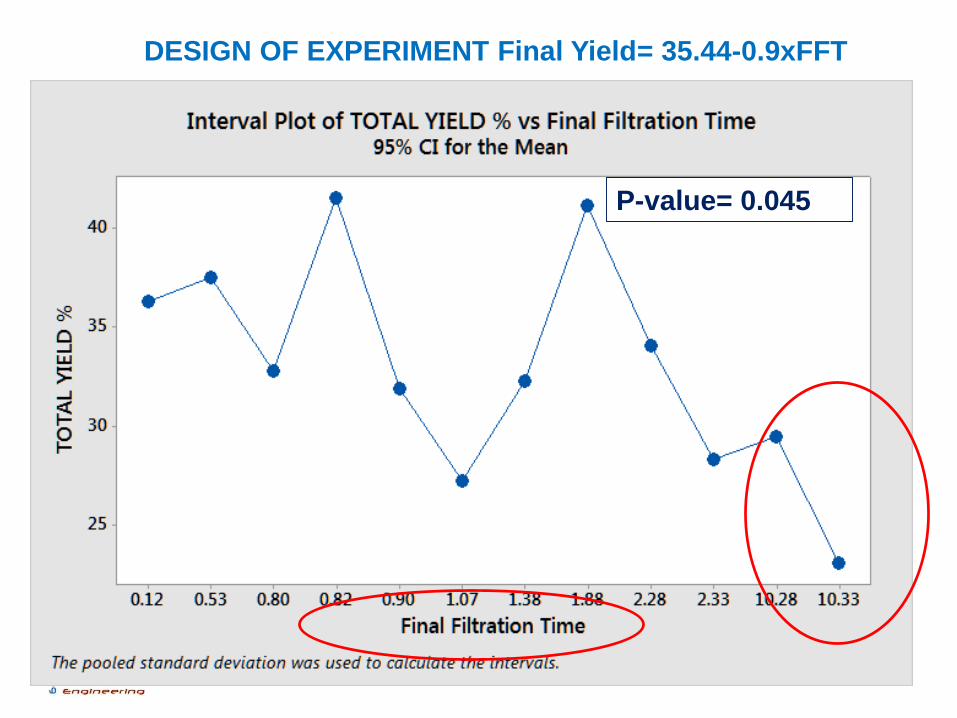
DESIGN OF EXPERIMENT Final Yield= 35.44-0.9xFFT
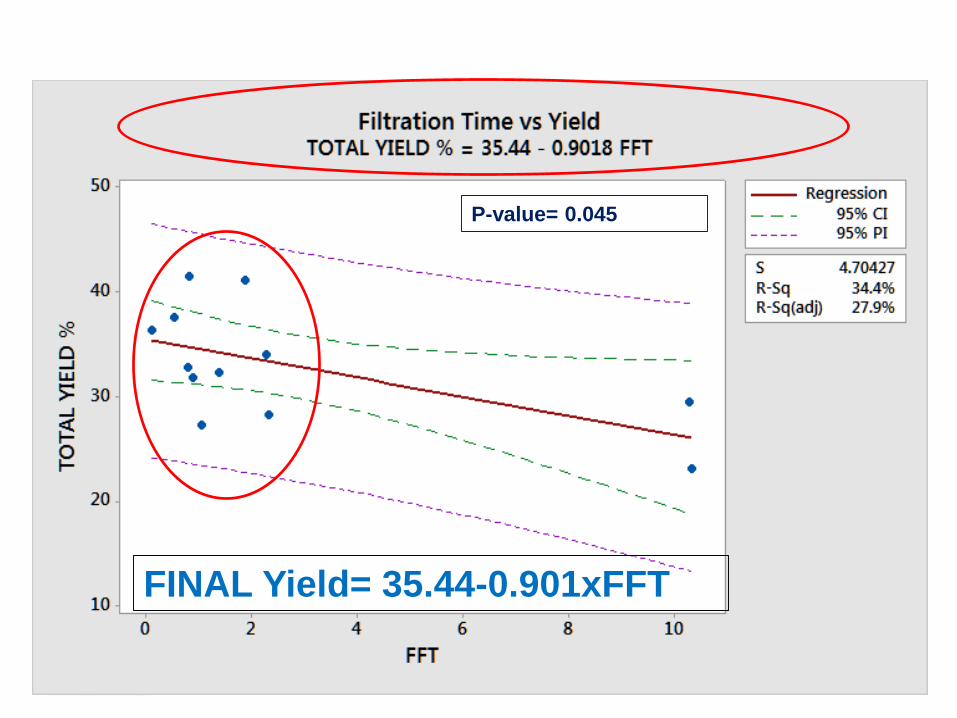
P-value= 0.045
FINAL Yield= 35.44-0.901xFFT
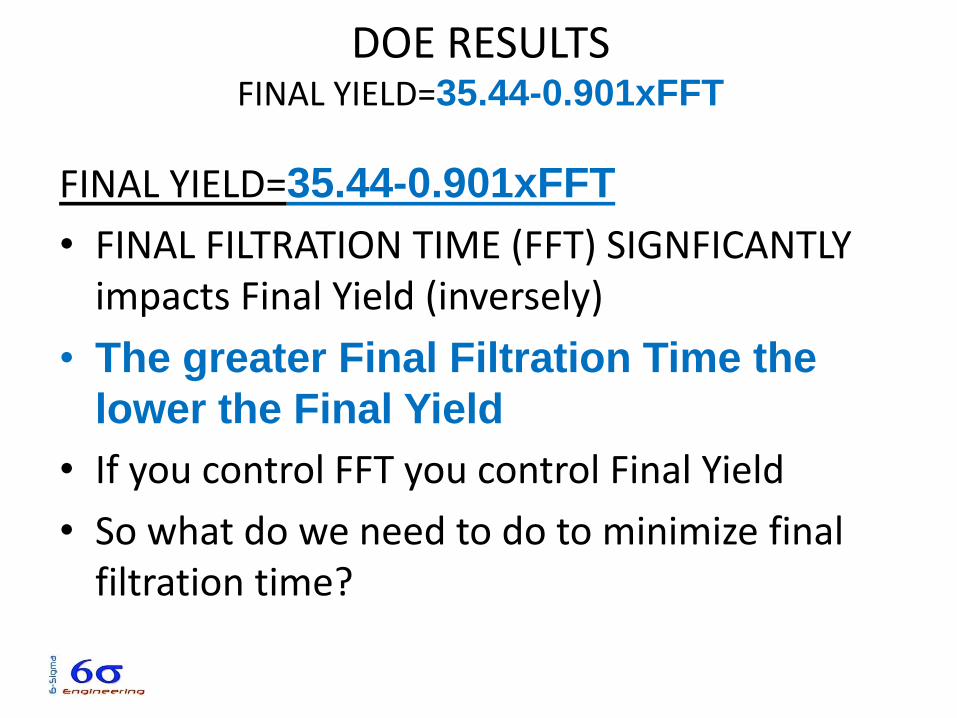
DOE RESULTS FINAL YIELD=35.44-0.901xFFT
FINAL YIELD=35.44-0.901xFFT
• FINAL FILTRATION TIME (FFT) SIGNFICANTLY impacts Final Yield (inversely)
• The greater Final Filtration Time the
lower the Final Yield
• If you control FFT you control Final Yield
• So what do we need to do to minimize final filtration time?
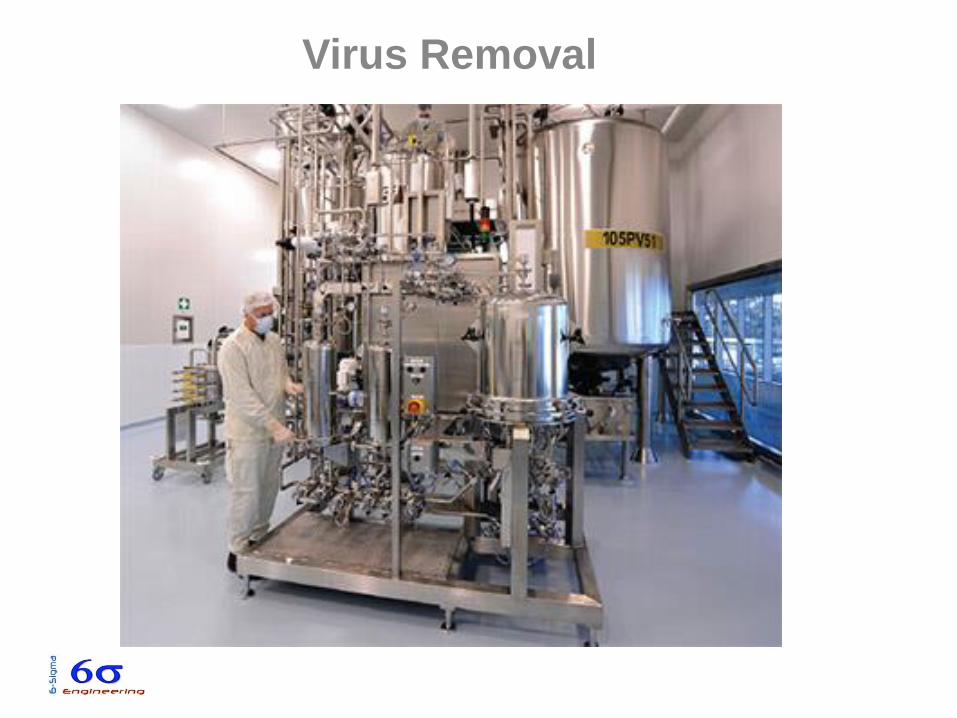
Virus Removal
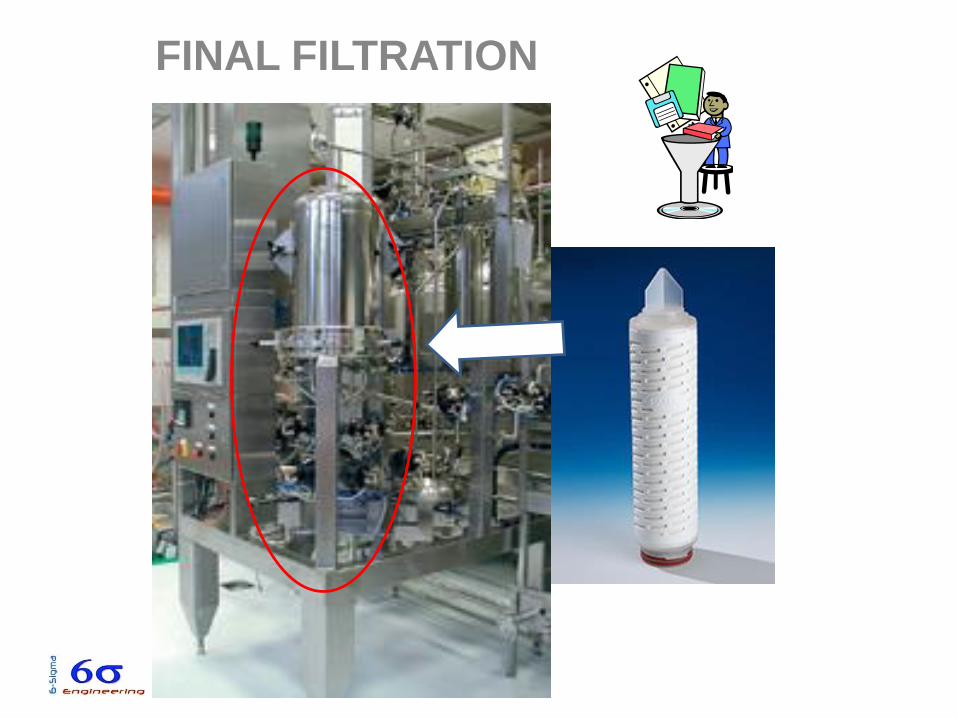
FINAL FILTRATION
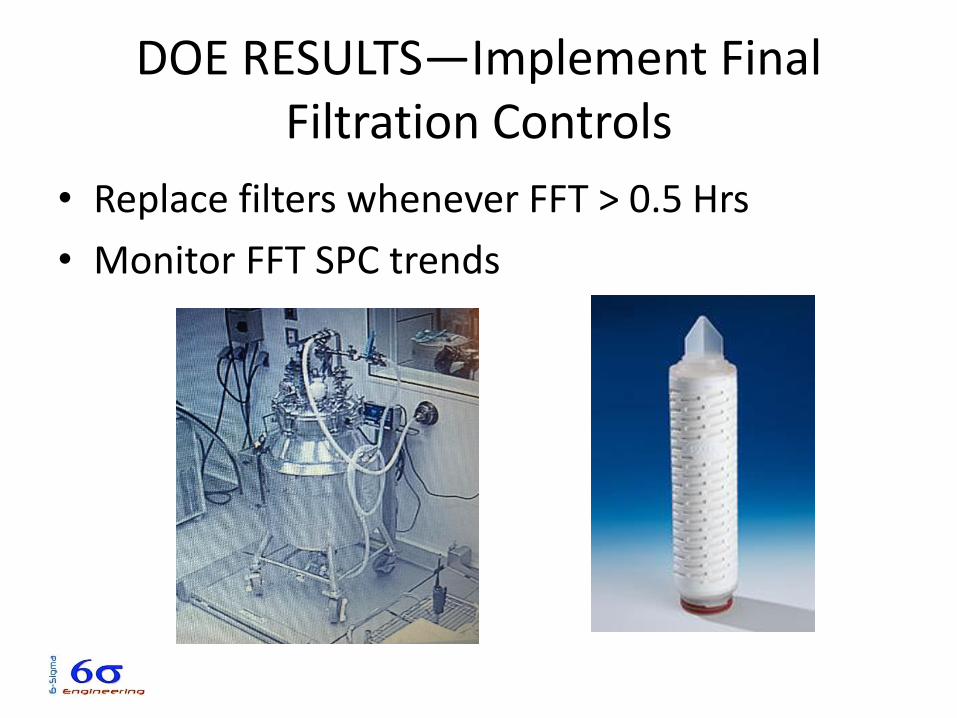
DOE RESULTS—Implement Final Filtration Controls
• Replace filters whenever FFT > 0.5 Hrs
• Monitor FFT SPC trends
Control Phase
Control Tools:
• Control Plan
• POKA YOKE
• Control Charts
• Statistical Process Control (SPC)
• Go/No-Go checks
• Preventative Maintenance (Spare Filters)
39
40
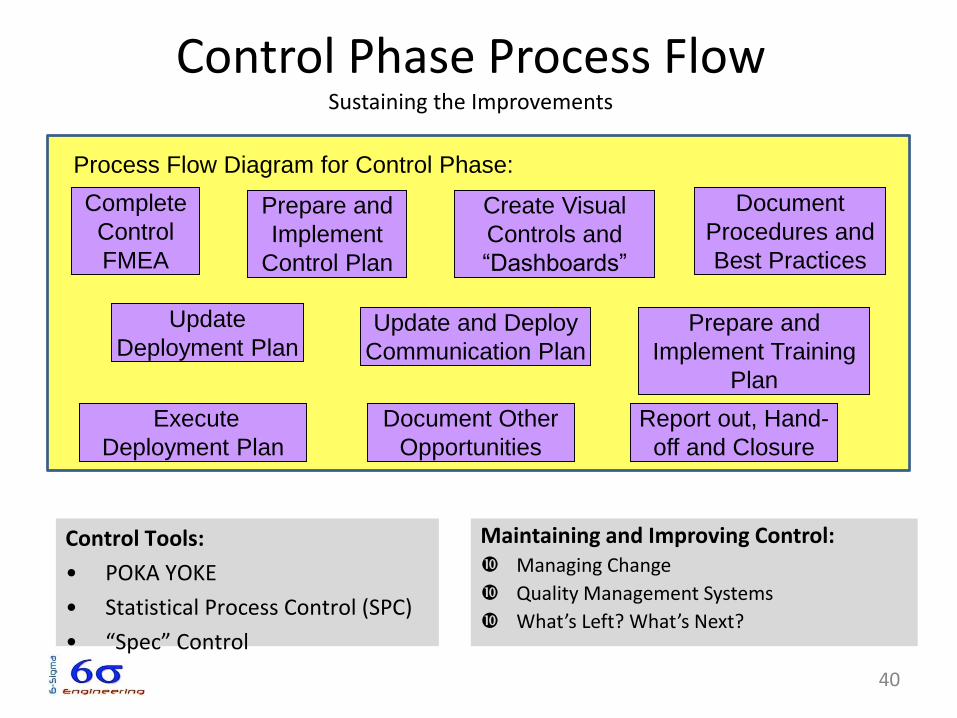
Control Phase Process FlowSustaining the Improvements
Maintaining and Improving Control: Managing Change
Quality Management Systems
What’s Left? What’s Next?
Control Tools:
• POKA YOKE
• Statistical Process Control (SPC)
• “Spec” Control
Document
Procedures and
Best Practices
Create Visual
Controls and
“Dashboards”
Update
Deployment Plan
Complete
Control
FMEA
Update and Deploy
Communication Plan
Execute
Deployment Plan
Document Other
Opportunities
Prepare and
Implement
Control Plan
Report out, Hand-
off and Closure
Prepare and
Implement Training
Plan
Process Flow Diagram for Control Phase:
41
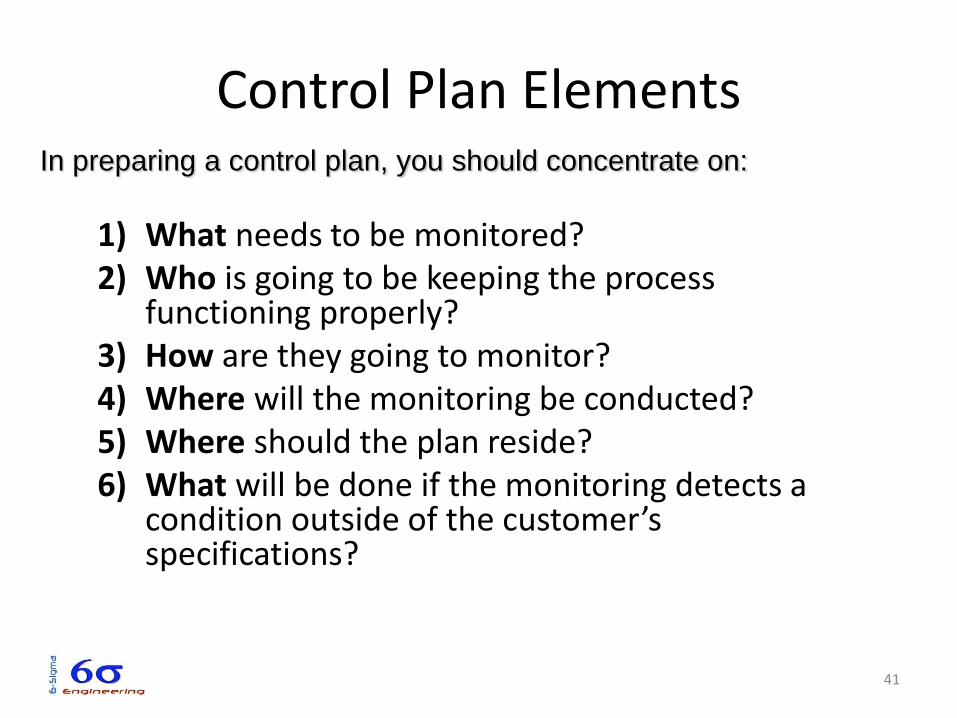
In preparing a control plan, you should concentrate on:
Control Plan Elements
1) What needs to be monitored?2) Who is going to be keeping the process
functioning properly?3) How are they going to monitor?4) Where will the monitoring be conducted?5) Where should the plan reside?6) What will be done if the monitoring detects a
condition outside of the customer’s specifications?
42
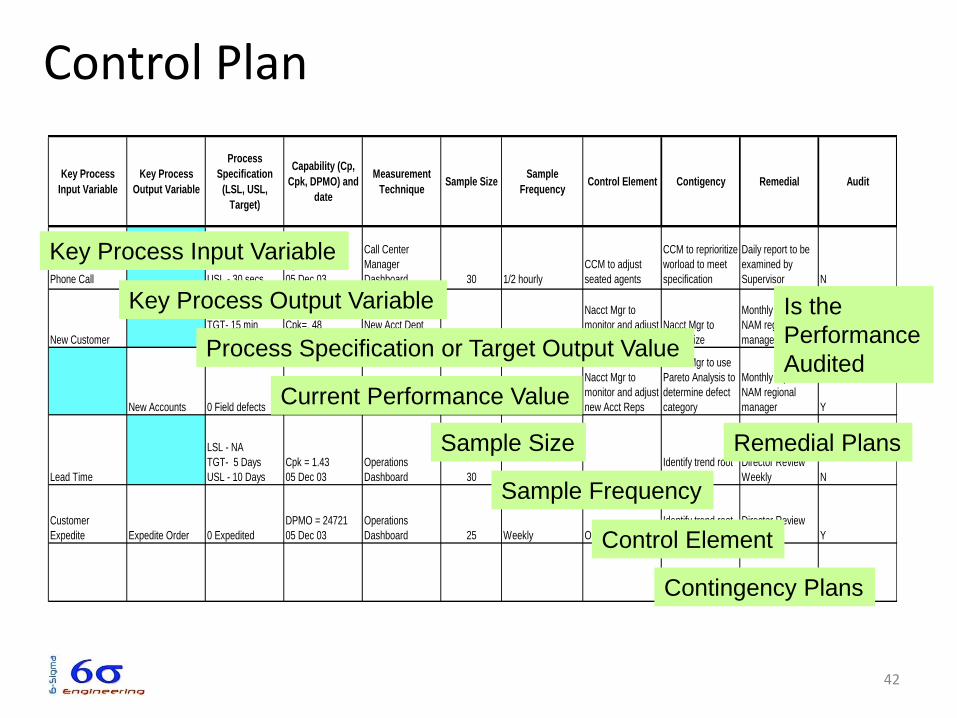
Control Plan
Key Process
Input Variable
Key Process
Output Variable
Process
Specification
(LSL, USL,
Target)
Capability (Cp,
Cpk, DPMO) and
date
Measurement
TechniqueSample Size
Sample
FrequencyControl Element Contigency Remedial Audit
Phone Call
LSL - NA
TGT- 10 sec
USL - 30 secs
Cpk=.85
05 Dec 03
Call Center
Manager
Dashboard 30 1/2 hourly
CCM to adjust
seated agents
CCM to reprioritize
worload to meet
specification
Daily report to be
examined by
Supervisor N
New Customer
LSL - NA
TGT- 15 min
USL - 30 min
Cpk=. 48
05 Dec 03
New Acct Dept
Visual Display 100 Weekly
Nacct Mgr to
monitor and adjust
new Acct Reps
Nacct Mgr to
reprioritize
Monthly report to
NAM regional
manager Y
New Accounts 0 Field defects
DPMO = 66289
05 Dec 03
New Acct Dept
Visual Display 100 Weekly
Nacct Mgr to
monitor and adjust
new Acct Reps
Nacct Mgr to use
Pareto Analysis to
determine defect
category
Monthly report to
NAM regional
manager Y
Lead Time
LSL - NA
TGT- 5 Days
USL - 10 Days
Cpk = 1.43
05 Dec 03
Operations
Dashboard 30 Daily Ops Mgr Review
Identify trend root
cause
Director Review
Weekly N
Customer
Expedite Expedite Order 0 Expedited
DPMO = 24721
05 Dec 03
Operations
Dashboard 25 Weekly Ops Mgr Review
Identify trend root
cause
Director Review
Monthly Y
Key Process Input Variable
Key Process Output Variable
Process Specification or Target Output Value
Current Performance Value
Sample Size
Sample Frequency
Control Element
Contingency Plans
Remedial Plans
Is the
Performance
Audited
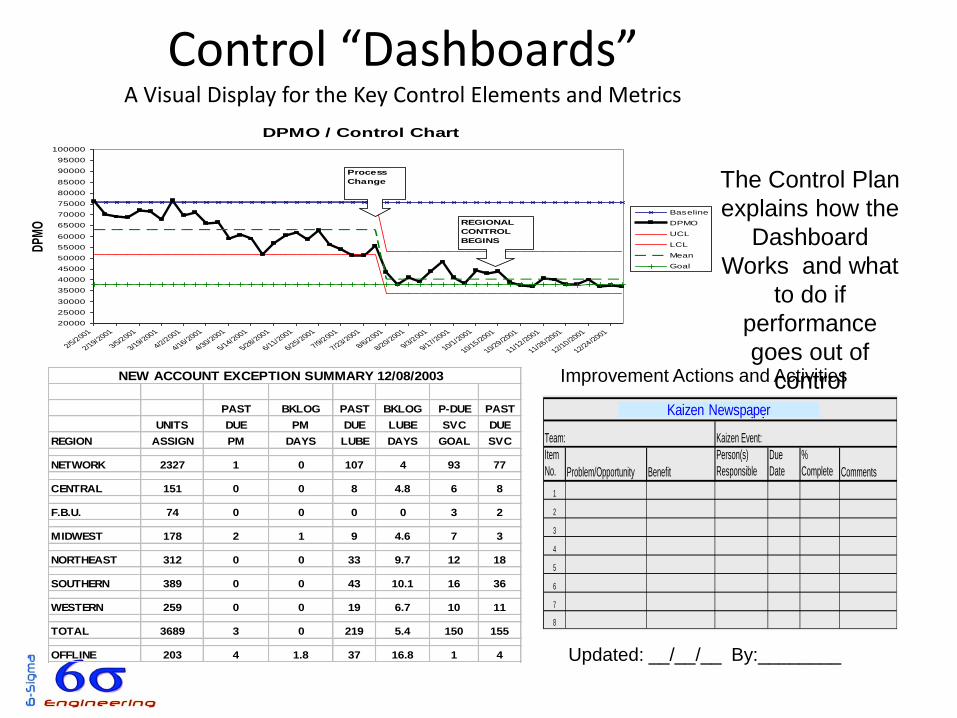
DPMO / Control Chart
20000
25000
30000
35000
40000
45000
50000
55000
60000
65000
70000
75000
80000
85000
90000
95000
100000
2/5/2001
2/19/2001
3/5/2001
3/19/2001
4/2/2001
4/16/2001
4/30/2001
5/14/2001
5/28/2001
6/11/2001
6/25/2001
7/9/2001
7/23/2001
8/6/2001
8/20/2001
9/3/2001
9/17/2001
10/1/2001
10/15/2001
10/29/2001
11/12/2001
11/26/2001
12/10/2001
12/24/2001
DPM
O
Baseline
DPMO
UCL
LCL
Mean
Goal
Process
Change
REGIONAL
CONTROL
BEGINS
PAST BKLOG PAST BKLOG P-DUE PAST
UNITS DUE PM DUE LUBE SVC DUE
REGION ASSIGN PM DAYS LUBE DAYS GOAL SVC
NETWORK 2327 1 0 107 4 93 77
CENTRAL 151 0 0 8 4.8 6 8
F.B.U. 74 0 0 0 0 3 2
MIDWEST 178 2 1 9 4.6 7 3
NORTHEAST 312 0 0 33 9.7 12 18
SOUTHERN 389 0 0 43 10.1 16 36
WESTERN 259 0 0 19 6.7 10 11
TOTAL 3689 3 0 219 5.4 150 155
OFFLINE 203 4 1.8 37 16.8 1 4
NEW ACCOUNT EXCEPTION SUMMARY 12/08/2003
Control “Dashboards”A Visual Display for the Key Control Elements and Metrics
Item
No. Problem/Opportunity Benefit
Person(s)
Responsible
Due
Date
%
Complete Comments
1
2
3
4
5
6
7
8
Kaizen Event Newspaper
Team: Kaizen Event:
Kaizen Newspaper
The Control Plan
explains how the
Dashboard
Works and what
to do if
performance
goes out of
controlImprovement Actions and Activities
Updated: __/__/__ By:________
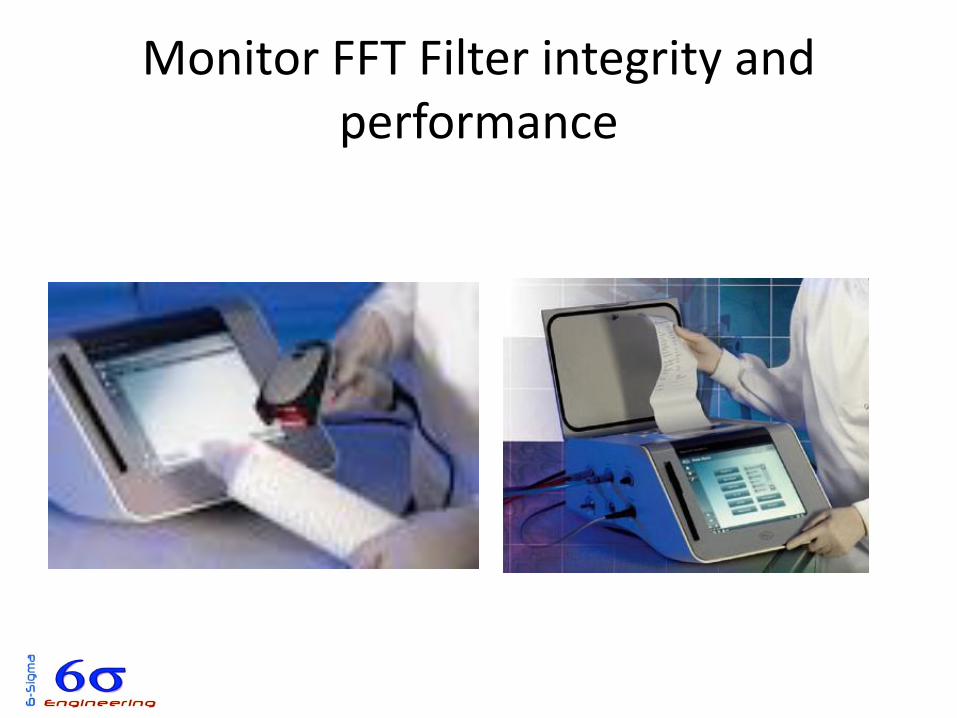
Monitor FFT Filter integrity and performance
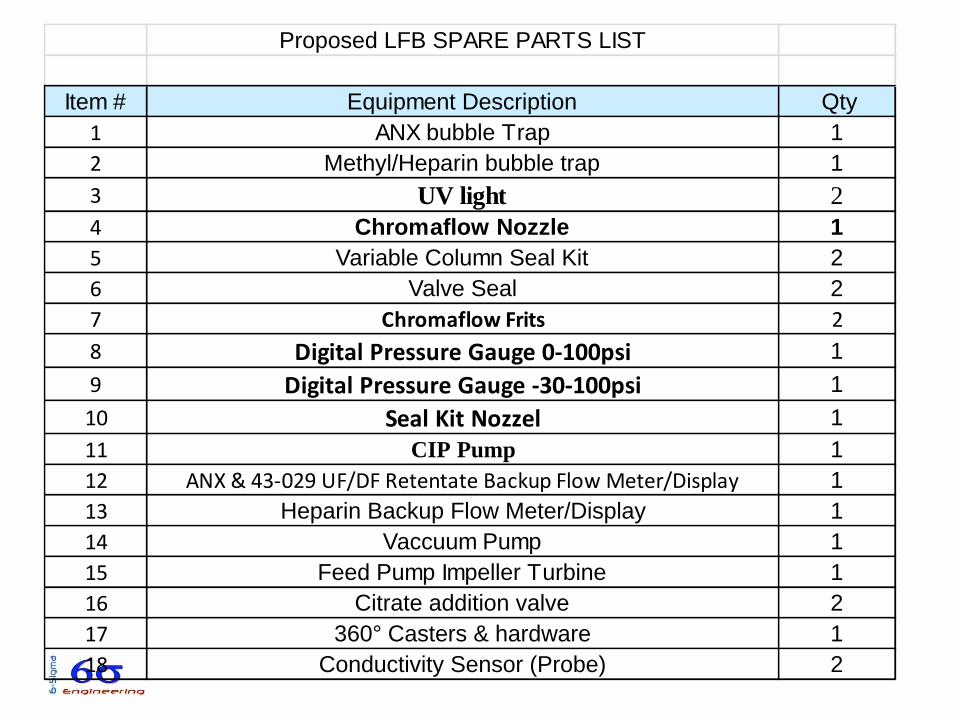
Proposed LFB SPARE PARTS LIST
Item # Equipment Description Qty
1 ANX bubble Trap 1
2 Methyl/Heparin bubble trap 1
3 UV light 2
4 Chromaflow Nozzle 1
5 Variable Column Seal Kit 2
6 Valve Seal 2
7 Chromaflow Frits 2
8 Digital Pressure Gauge 0-100psi 1
9 Digital Pressure Gauge -30-100psi 1
10 Seal Kit Nozzel 1
11 CIP Pump 1
12 ANX & 43-029 UF/DF Retentate Backup Flow Meter/Display 1
13 Heparin Backup Flow Meter/Display 1
14 Vaccuum Pump 1
15 Feed Pump Impeller Turbine 1
16 Citrate addition valve 2
17 360° Casters & hardware 1
18 Conductivity Sensor (Probe) 2
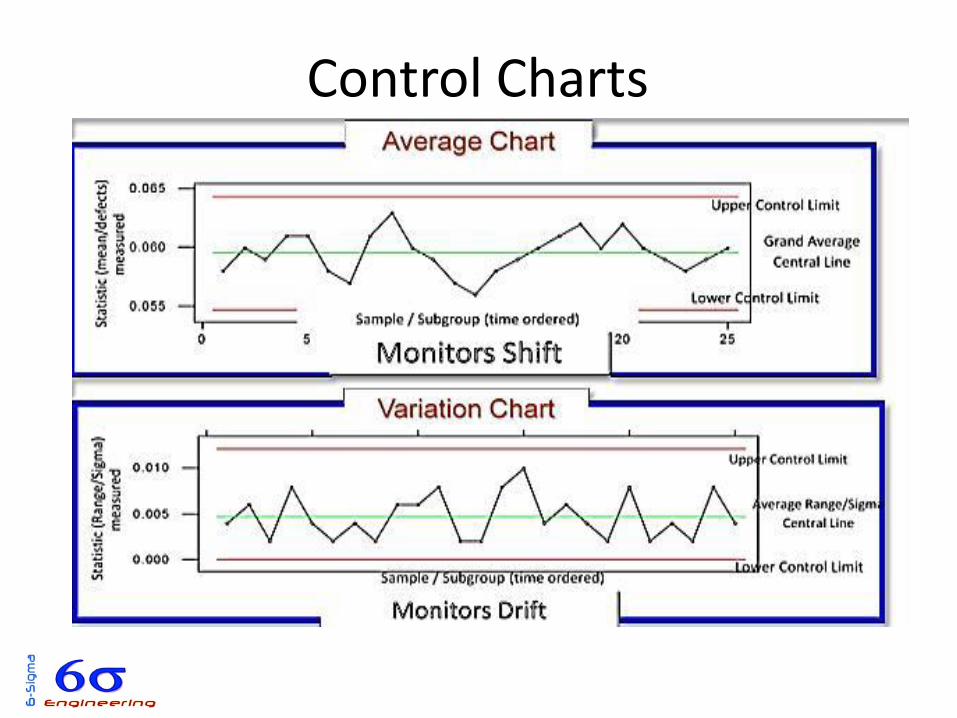
Control Charts
47
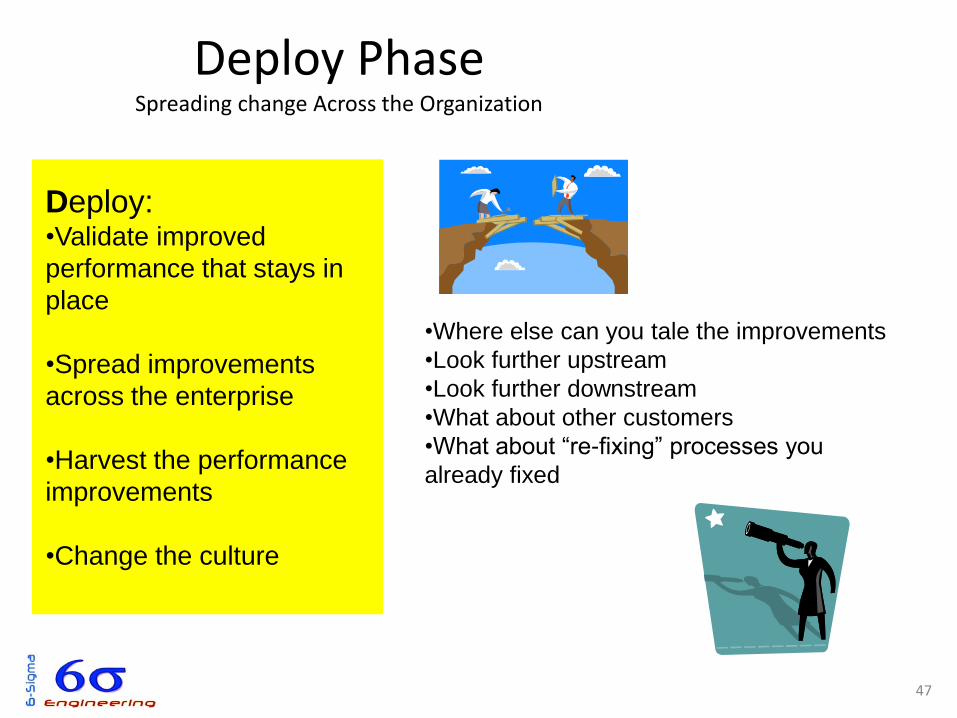
Deploy Phase Spreading change Across the Organization
Deploy:•Validate improved
performance that stays in
place
•Spread improvements
across the enterprise
•Harvest the performance
improvements
•Change the culture
•Where else can you tale the improvements
•Look further upstream
•Look further downstream
•What about other customers
•What about “re-fixing” processes you
already fixed
48
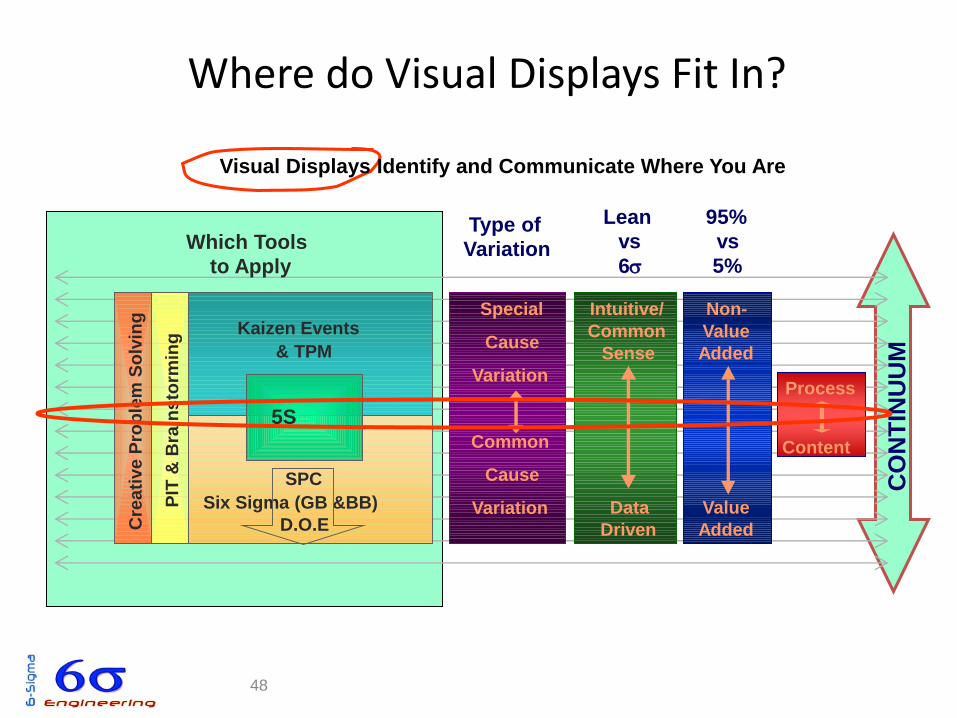
Kaizen Events
& TPM
SPC
Six Sigma (GB &BB)
D.O.E
Which Tools
to Apply
Intuitive/
Common
Sense
Data
Driven
Non-
Value
Added
Value
Added
Type of
Variation
Special
Cause
Variation
Common
Cause
Variation
Lean
vs
6
95%
vs
5%
CO
NT
INU
UM
5S
PIT
& B
rain
sto
rmin
g
Cre
ati
ve
Pro
ble
m S
olv
ing
Process
Content
Where do Visual Displays Fit In?
Visual Displays Identify and Communicate Where You Are
49
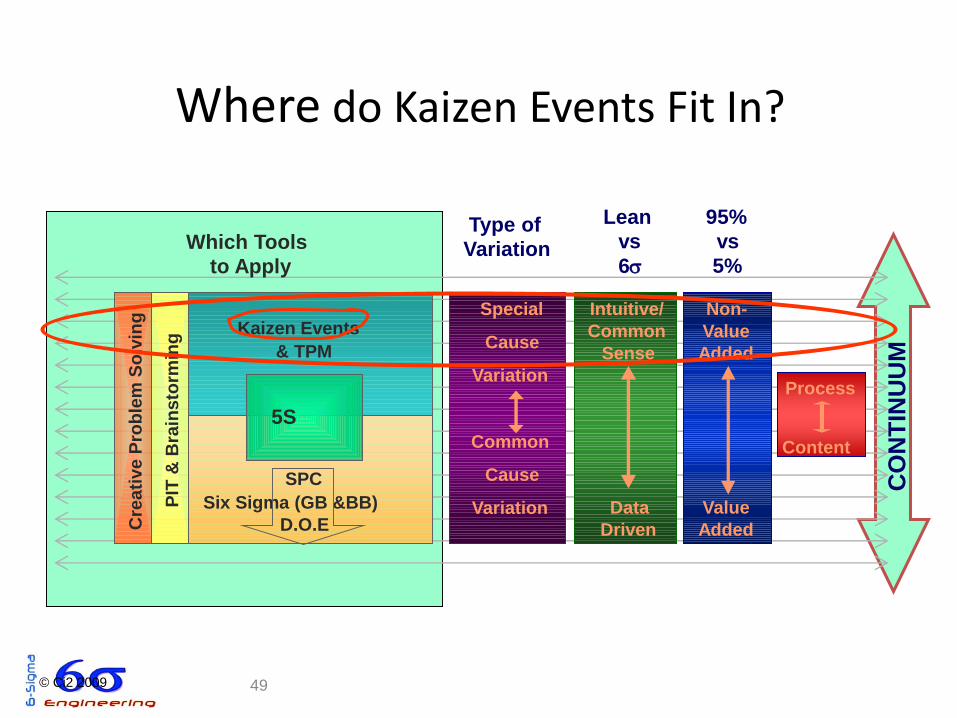
Kaizen Events
& TPM
SPC
Six Sigma (GB &BB)
D.O.E
Which Tools
to Apply
Intuitive/
Common
Sense
Data
Driven
Non-
Value
Added
Value
Added
Type of
Variation
Special
Cause
Variation
Common
Cause
Variation
Lean
vs
6
95%
vs
5%
CO
NT
INU
UM
5S
PIT
& B
rain
sto
rmin
g
Cre
ati
ve
Pro
ble
m S
olv
ing
Process
Content
Where do Kaizen Events Fit In?
© Ci2 2009
50
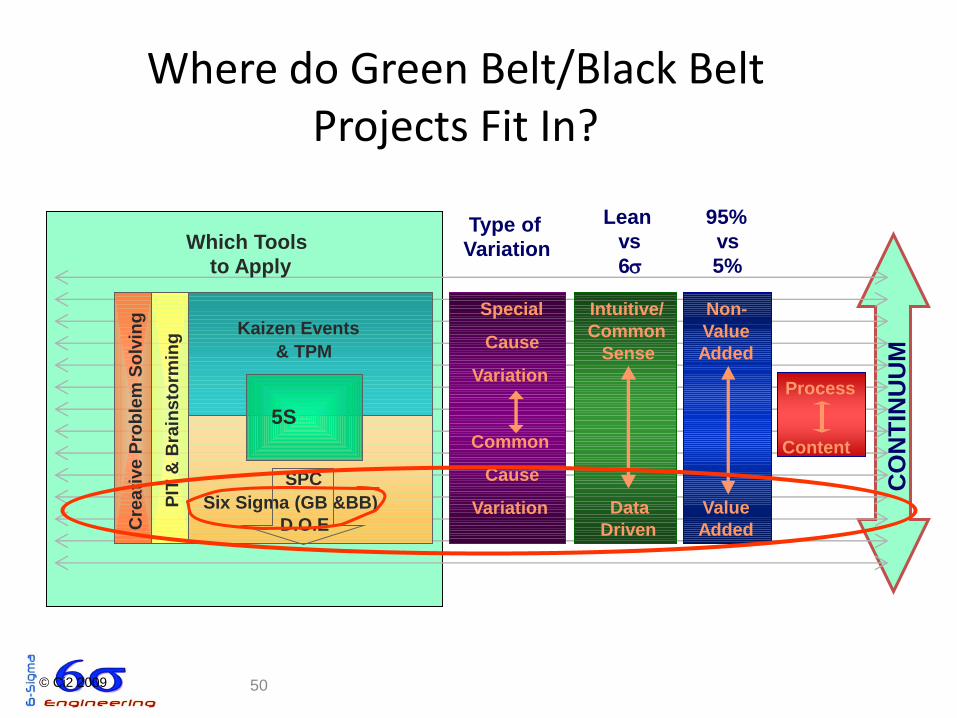
Kaizen Events
& TPM
SPC
Six Sigma (GB &BB)
D.O.E
Which Tools
to Apply
Intuitive/
Common
Sense
Data
Driven
Non-
Value
Added
Value
Added
Type of
Variation
Special
Cause
Variation
Common
Cause
Variation
Lean
vs
6
95%
vs
5%
CO
NT
INU
UM
5S
PIT
& B
rain
sto
rmin
g
Cre
ati
ve
Pro
ble
m S
olv
ing
Process
Content
Where do Green Belt/Black Belt Projects Fit In?
© Ci2 2009
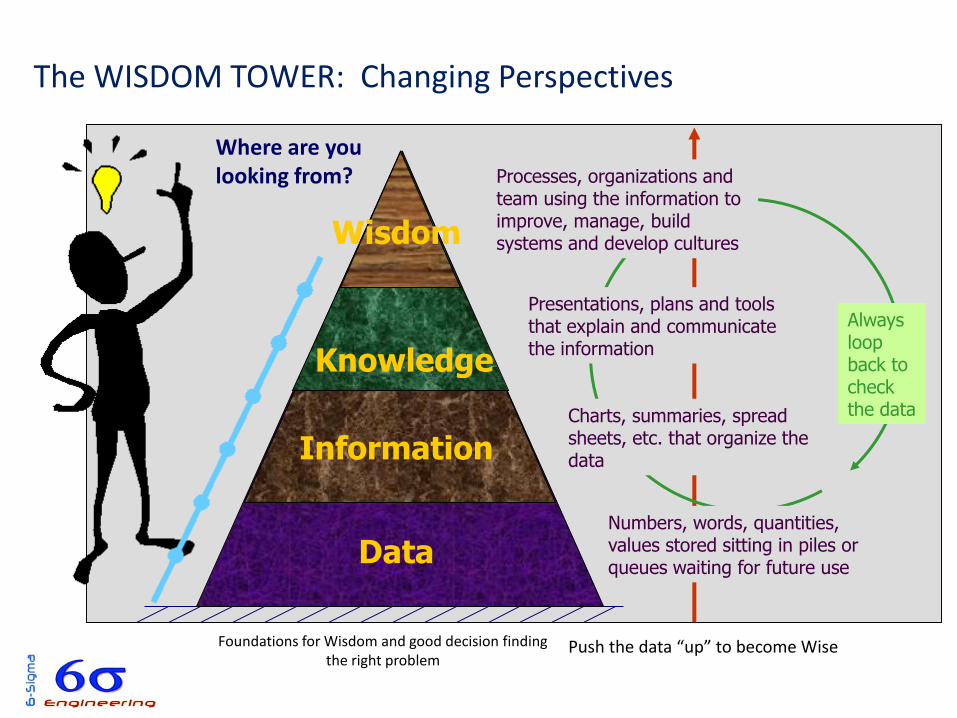
Foundations for Wisdom and good decision finding the right problem
Numbers, words, quantities, values stored sitting in piles or queues waiting for future use
Charts, summaries, spread sheets, etc. that organize the data
Presentations, plans and tools that explain and communicate the information
Processes, organizations and team using the information to improve, manage, build systems and develop cultures
Push the data “up” to become Wise
Always loop back to check the data
Wisdom
Knowledge
Data
Information
Where are you looking from?
The WISDOM TOWER: Changing Perspectives
Related Documents