Quarterly Securities Report For the three months ended June 30, 2016 (TRANSLATION) Sony Corporation

Welcome message from author
This document is posted to help you gain knowledge. Please leave a comment to let me know what you think about it! Share it to your friends and learn new things together.
Transcript

Quarterly Securities Report For the three months ended June 30, 2016
(TRANSLATION)
Sony Corporation

CONTENTS
Page Note for readers of this English translation Cautionary Statement
1 1
I Corporate Information 2 (1) Selected Consolidated Financial Data 2 (2) Business Overview 3
II State of Business 4 (1) Risk Factors 4 (2) Material Contracts 4 (3) Management’s Discussion and Analysis of Financial Condition, Results of Operations and
Status of Cash Flows 5
III Company Information 12 (1) Information on the Company’s Shares 12 (2) Directors and Corporate Executive Officers 15
IV Financial Statements 16 (1) Consolidated Financial Statements 17 (2) Other Information 40
- 1 -
Note for readers of this English translation On August 4, 2016, Sony Corporation (the “Company” or “Sony Corporation”) filed its Japanese-language Quarterly Securities Report (Shihanki Houkokusho) for the three months ended June 30, 2016 with the Director-General of the Kanto Local Finance Bureau in Japan pursuant to the Financial Instruments and Exchange Act of Japan. This document is an English translation of the Quarterly Securities Report in its entirety, except for (i) information that had been previously filed with or submitted to the U.S. Securities and Exchange Commission (the “SEC”) in a Form 20-F, Form 6-K or any other form and (ii) a description of differences between generally accepted accounting principles in the U.S. (“U.S. GAAP”) and generally accepted accounting principles in Japan (“J-GAAP”), which are required to be described in the Quarterly Securities Report under the Financial Instruments and Exchange Act of Japan if the Company prepares its financial statements in conformity with accounting principles other than J-GAAP.
Cautionary Statement Statements made in this release with respect to Sony’s current plans, estimates, strategies and beliefs and other statements of the Company and its consolidated subsidiaries (collectively “Sony”) that are not historical facts are forward-looking statements about the future performance of Sony. Forward-looking statements include, but are not limited to, those statements using words such as “believe,” “expect,” “plans,” “strategy,” “prospects,” “forecast,” “estimate,” “project,” “anticipate,” “aim,” “intend,” “seek,” “may,” “might,” “could” or “should,” and words of similar meaning in connection with a discussion of future operations, financial performance, events or conditions. From time to time, oral or written forward-looking statements may also be included in other materials released to the public. These statements are based on management’s assumptions, judgments and beliefs in light of the information currently available to it. Sony cautions investors that a number of important risks and uncertainties could cause actual results to differ materially from those discussed in the forward-looking statements, and therefore investors should not place undue reliance on them. Investors also should not rely on any obligation of Sony to update or revise any forward-looking statements, whether as a result of new information, future events or otherwise. Sony disclaims any such obligation. Risks and uncertainties that might affect Sony include, but are not limited to (i) the global economic environment in which Sony operates and the economic conditions in Sony’s markets, particularly levels of consumer spending; (ii) foreign exchange rates, particularly between the yen and the U.S. dollar, the euro and other currencies in which Sony makes significant sales and incurs production costs, or in which Sony’s assets and liabilities are denominated; (iii) Sony’s ability to continue to design and develop and win acceptance of, as well as achieve sufficient cost reductions for, its products and services, including televisions, game and network platforms, and smartphones, which are offered in highly competitive markets characterized by severe price competition and continual new product and service introductions, rapid development in technology and subjective and changing consumer preferences; (iv) Sony’s ability and timing to recoup large-scale investments required for technology development and production capacity; (v) Sony’s ability to implement successful business restructuring and transformation efforts under changing market conditions; (vi) Sony’s ability to implement successful hardware, software, and content integration strategies for all segments excluding the Financial Services segment, and to develop and implement successful sales and distribution strategies in light of the Internet and other technological developments; (vii) Sony’s continued ability to devote sufficient resources to research and development and, with respect to capital expenditures, to prioritize investments correctly (particularly in the electronics businesses); (viii) Sony’s ability to maintain product quality and customers’ satisfaction with its existing products and services; (ix) the effectiveness of Sony’s strategies and their execution, including but not limited to the success of Sony’s acquisitions, joint ventures and other strategic investments; (x) significant volatility and disruption in the global financial markets or a ratings downgrade; (xi) Sony’s ability to forecast demands, manage timely procurement and control inventories; (xii) the outcome of pending and/or future legal and/or regulatory proceedings; (xiii) shifts in customer demand for financial services such as life insurance and Sony’s ability to conduct successful asset liability management in the Financial Services segment; (xiv) the impact of changes in interest rates and unfavorable conditions or developments (including market fluctuations or volatility) in the Japanese equity markets on the revenue and operating income of the Financial Services segment; (xv) Sony’s ability to anticipate and manage cybersecurity risk, including the risk of unauthorized access to Sony’s business information, potential business disruptions or financial losses; and (xvi) risks related to catastrophic disasters or similar events. Risks and uncertainties also include the impact of any future events with material adverse impact.

- 2 -
I Corporate Information
(1) Selected Consolidated Financial Data Yen in millions, Yen per share amounts
Three months ended June 30, 2015
Three months ended June 30, 2016
Fiscal year ended March 31, 2016
Sales and operating revenue 1,808,059 1,613,199 8,105,712 Operating income 96,907 56,192 294,197 Income before income taxes 138,710 57,016 304,504 Net income attributable to Sony Corporation’s stockholders 82,441 21,166 147,791
Comprehensive income (loss) 79,005 (30,981) (44,915) Total equity 3,001,055 3,068,446 3,124,410 Total assets 16,091,366 16,381,745 16,673,390 Net income attributable to Sony Corporation’s stockholders per share of common stock, basic (yen) 70.52 16.78 119.40
Net income attributable to Sony Corporation’s stockholders per share of common stock, diluted (yen)
70.36 16.44 117.49
Ratio of stockholders’ equity to total assets (%) 14.8 14.7 14.8 Net cash provided by (used in) operating activities (154,290) 16,186 749,089 Net cash used in investing activities (172,002) (219,178) (1,030,403) Net cash provided by (used in) financing activities (7,823) (98,553) 380,122 Cash and cash equivalents at end of the period 628,087 631,074 983,612 Notes: 1. The Company’s consolidated financial statements are prepared in conformity with U.S. GAAP. 2. The Company reports equity in net income of affiliated companies as a component of operating income. 3. Consumption taxes are not included in sales and operating revenue. 4. Total equity is presented based on U.S. GAAP. 5. Ratio of stockholders’ equity to total assets is calculated by using total equity attributable to the stockholders of the
Company. 6. The Company prepares consolidated financial statements. Therefore parent-only selected financial data is not
presented.

- 3 -
(2) Business Overview
There was no significant change in the business of Sony during the three months ended June 30, 2016. Sony realigned its reportable segments effective from the first quarter of the fiscal year ending March 31, 2017. For
further information on the realignment, please refer to “IV Financial Statements – Notes to Consolidated Financial Statements – 8. Business segment information”.
As of June 30, 2016, the Company had 1,319 subsidiaries and 111 affiliated companies, of which 1,290 companies are
consolidated subsidiaries (including variable interest entities) of the Company. The Company has applied the equity accounting method for 103 affiliated companies.

- 4 -
II State of Business
(1) Risk Factors
Note for readers of this English translation:
Except for the revised risk factors below, there was no significant change from the information presented in the Risk Factors section of the Annual Report on Form 20-F filed with the Securities and Exchange Commission (the “SEC”) on June 17, 2016. The changes are indicated by underline below. Any forward-looking statements included in the descriptions below are based on management’s current judgment. URL: The Annual Report on Form 20-F filed with the SEC on June 17, 2016 https://www.sec.gov/Archives/edgar/data/313838/000119312516624169/d168822d20f.htm
Sony could incur asset impairment charges for goodwill, intangible assets or other long-lived assets. Sony has a significant amount of goodwill, intangible assets and other long-lived assets, including production facilities and equipment in its electronics businesses. A decline in financial performance, market capitalization or changes in estimates and assumptions used in the impairment analysis, which in many cases requires significant judgment, could result in impairment charges against these assets. Goodwill and indefinite lived intangible assets are tested annually for impairment during the fourth quarter of the fiscal year and between annual tests if an event occurs or circumstances change that would more likely than not reduce the fair value below the carrying amount. Such an event or change in circumstances would include unfavorable variances from or adjustments to established business plans, significant changes in forecasted results or volatility inherent to external markets and industries. The increased levels of global competition and the faster pace of technological change to which Sony is exposed can result in greater volatility of these estimates, assumptions and judgments, and increase the likelihood of impairment charges. In addition, the recoverability of the carrying value of long-lived assets held and used and long-lived assets to be disposed of is reviewed whenever events or changes in circumstances, including the types of events or changes described above with respect to goodwill and intangible assets, indicate that the carrying value of the assets or asset groups may not be recoverable. If the carrying value of the asset or asset group is considered impaired, an impairment charge is recorded for the amount by which the carrying value of the asset or asset group exceeds its fair value. For example, in the fiscal year ended March 31, 2014, Sony recorded impairment charges including a 32.1 billion yen impairment charge related to long-lived assets in the battery business in the Devices segment, a 25.6 billion yen impairment charge related to long-lived assets in the disc manufacturing business outside of Japan and the U.S. and goodwill across the entire disc manufacturing business in All Other, and a 12.8 billion yen impairment charge related to long-lived assets in the PC business in All Other. In the fiscal year ended March 31, 2015, Sony recorded a 176.0 billion yen impairment charge related to goodwill in the Mobile Communications segment. In the fiscal year ended March 31, 2016, Sony recorded impairment charges in the Devices segment related to long-lived assets in the battery business and in the camera module business of 30.6 billion yen and 59.6 billion yen, respectively. In the first quarter of the fiscal year ending March 31, 2017, Sony recorded a 20.3 billion yen impairment charge against long-lived assets in the Semiconductors segment resulting from the termination of development and manufacturing of certain high-functionality camera modules for external sale. Any such charge may adversely affect Sony’s operating results and financial condition.
(2) Material Contracts
There were no material contracts executed or determined to be executed during the three months ended June 30, 2016.
Note for readers of this English translation:
There was no significant change from the information presented in the Annual Report on Form 20-F (“Patents and Licenses” in Item 4) filed with the SEC on June 17, 2016. URL: The Annual Report on Form 20-F filed with the SEC on June 17, 2016 https://www.sec.gov/Archives/edgar/data/313838/000119312516624169/d168822d20f.htm

- 5 -
(3) Management’s Discussion and Analysis of Financial Condition, Results of Operations and Status of Cash Flows
i) Results of Operations
Note for readers of this English translation:
Except for information specifically included in this English translation, this document omits certain information set out in the Japanese-language Quarterly Securities Report for the three-month period ended June 30, 2016, since it is the same as described in a press release previously submitted to the SEC. Please refer to “Consolidated Financial Results for the First Quarter Ended June 30, 2016” submitted to the SEC on Form 6-K on July 29, 2016. URL: The press release titled “Consolidated Financial Results for the First Quarter Ended June 30, 2016” https://www.sec.gov/Archives/edgar/data/313838/000115752316006310/a51389107.htm
Foreign Exchange Fluctuations and Risk Hedging
Note for readers of this English translation:
Except for the information set forth below, there was no significant change from the information presented in the Foreign Exchange Fluctuations and Risk Hedging section of the Annual Report on Form 20-F filed with the SEC on June 17, 2016. Although foreign exchange rates have fluctuated during the three-month period ended June 30, 2016, there has been no significant change in Sony’s risk hedging policy as described in the Annual Report on Form 20-F. URL: The Annual Report on Form 20-F filed with the SEC on June 17, 2016 https://www.sec.gov/Archives/edgar/data/313838/000119312516624169/d168822d20f.htm
During the three months ended June 30, 2016, the average rates of the yen were 108.1 yen against the U.S. dollar,
which is 12.3 percent higher than the same quarter of the previous fiscal year (“year-on-year”) and 122.1 yen against the euro, which is 9.9 percent higher year-on-year.
For the three months ended June 30, 2016, sales were 1,613.2 billion yen, an decrease of 10.8 percent year-on-year,
while on a constant currency basis, sales decreased approximately 3 percent year-on-year. For references to information on a constant currency basis, see Note at the bottom of this section.
Consolidated operating income of 56.2 billion yen was recorded for the three months ended June 30, 2016, a decrease
of 40.7 billion yen year-on-year (a decrease of approximately 29.2 billion yen year-on-year on a constant currency basis). Most of the foreign exchange rate impact was attributable to the Mobile Communications (“MC”), Game & Network Services (“G&NS”), Imaging Products & Solutions (“IP&S”), Home Entertainment & Sound (“HE&S”), Semiconductors and Components segments.

- 6 -
The table below indicates the impact of changes in foreign exchange rates on sales and operating results of each of the above-mentioned six segments. For a detailed analysis of segment performance, please refer to the “Results of Operations” section above, which discusses the impact of foreign exchange rates within each segment.
(Billions of yen) Change on
constant currency
basis
Impact of changes in
foreign exchange rates
Three months ended June 30 Change in
yen 2015 2016 MC Sales 280.5 185.9 -33.7% -30% -9.3
Operating income (loss) (22.9) 0.4 +23.3 +18.9 +4.4 G&NS Sales 288.6 330.4 +14.5% +25% -29.6
Operating income 19.5 44.0 +24.6 +25.8 -1.3 IP&S Sales 164.7 122.2 -25.8% -18% -12.5
Operating income 17.7 7.5 -10.2 -4.5 -5.7 HE&S Sales 253.1 235.9 -6.8% +4% -27.3
Operating income 10.9 20.2 +9.3 +11.9 -2.6 Semiconductors
Sales 187.4 144.4 -22.9% -14% -16.2 Operating income (loss) 32.7 (43.5) -76.2 -68.0 -8.2
Components
Sales 57.1 44.1 -22.7% -14% -5.0 Operating loss (2.3) (4.7) -2.4 -1.2 -1.2
In addition, sales for the Pictures segment increased 6.9 percent year-on-year to183.3 billion yen, an approximately 20
percent increase on a constant currency (U.S. dollar) basis. In the Music segment, sales increased 8.7 percent year-on-year to 141.5 billion yen, an approximately 17 percent increase on a constant currency basis. As most of the operations in Sony’s Financial Services segment are based in Japan, Sony’s management analyzes the performance of the Financial Services segment on a yen basis only.
Note: In this section, for all segments other than Pictures and Music, the impact of foreign exchange rate fluctuations
on sales is calculated by applying the change in the yen’s quarterly weighted average exchange rate for the three months ended June 30, 2015 from the three months ended June 30, 2016 to the major transactional currencies in which the sales are denominated. The impact of foreign exchange rate fluctuations on operating income (loss) described herein is calculated by subtracting from the impact on sales the impact on cost of sales and selling, general and administrative expenses calculated by applying the same major transactional currencies calculation process to cost of sales and selling, general and administrative expenses as for the impact on sales. Additionally, the MC segment enters into its own foreign exchange hedging transactions. The impact of those transactions is included in the impact of foreign exchange rate fluctuations on operating income (loss) for that segment. Since the worldwide subsidiaries of the Pictures segment and of SME and Sony/ATV in the Music segment are aggregated on a U.S. dollar basis and are translated into yen, the impact of foreign exchange rate fluctuations is calculated by applying the change in the periodic weighted average exchange rate for the three months ended June 30, 2015 from the three months ended June 30, 2016 from U.S. dollar to yen to the U.S. dollar basis operating results. This information is not a substitute for Sony’s consolidated financial statements measured in accordance with U.S. GAAP. However, Sony believes that these disclosures provide additional useful analytical information to investors regarding the operating performance of Sony. Status of Cash Flows
Note for readers of this English translation:
Except for information specifically included in this English translation, this document omits certain information set out in the Japanese-language Quarterly Securities Report for the three-month period ended June 30, 2016, since it is the same as described in a press release previously submitted to the SEC. Please refer to “Consolidated Financial Results for the First Quarter Ended June 30, 2016” submitted to the SEC on Form 6-K on July 29, 2016.
URL: The press release titled “Consolidated Financial Results for the First Quarter Ended June 30, 2016” https://www.sec.gov/Archives/edgar/data/313838/000115752316006310/a51389107.htm
- 7 -
ii) Issues Facing Sony and Management’s Response to those Issues
Note for readers of this English translation:
Except for the revised trend information below, there was no significant change from the information presented in the Trend Information section of the Annual Report on Form 20-F filed with the SEC on June 17, 2016. The changes are indicated by underline below. Any forward-looking statements included in the descriptions below are based on management’s current judgment. URL: The Annual Report on Form 20-F filed with the SEC on June 17, 2016 https://www.sec.gov/Archives/edgar/data/313838/000119312516624169/d168822d20f.htm
Issues Facing Sony and Management’s Response to those Issues
The global economic recovery has been weakening amid increasing financial turbulence, with recovery in advanced economies remaining only modest, and prospects across emerging countries continue to be uneven and generally weaker than in the past 20 years. In advanced economies, factors such as unfavorable demographic trends and low productivity growth continue to weigh on the recovery. In emerging markets, while growth in China and most of emerging Asia is generally projected to be high, Brazil, Russia and other commodity exporters face severe macroeconomic conditions. Furthermore, shocks of a noneconomic origin, related to geopolitical conflicts, political discord, or terrorism loom over many regions, and could have a significant impact on the global economy.
The uncertain economic environment surrounding Sony is compounded by continued, intense pricing pressure from competitors, shrinking markets for certain key products and shorter product cycles, primarily in Sony’s Electronics businesses.
On February 18, 2015, Sony unveiled its mid-range plan announcing that it would position Return on Equity (“ROE”) as its most important performance indicator. With the goal of transforming into a highly profitable enterprise, Sony set targets of ROE above 10 percent and operating income above 500 billion yen for the fiscal year ending March 31, 2018, the last year of the mid-range plan.
Sony’s key strategies for business operations are as follows:
• Business management that emphasizes profitability, without necessarily pursuing volume.
• Business management that grants each business unit greater autonomy and mandates a focus on shareholder value.
• Clearly defined positioning of each business within a broader business portfolio perspective.
Based on its specific characteristics and the competitive landscape, each of the Sony Group’s businesses is classified as a “growth driver,” “stable profit generator,” or “area focusing on volatility management” in terms of its position within Sony’s overall business portfolio. Each business has been assigned a target figure for Return on Invested Capital (“ROIC”) linked with the ROE target for Sony Group as a whole, and managed with a clear emphasis on profitability.
On June 29, 2016, Sony held its Corporate Strategy Meeting for the fiscal year ending March 31, 2017 and provided an update on the progress of its mid-range corporate plan covering the fiscal year ended March 31, 2016 through the fiscal year ending March 31, 2018. Sony also presented details of initiatives it is undertaking to establish the Company’s foundations for the future beyond the fiscal year ending March 31, 2018. Highlights from this presentation are outlined below.
1. Progress of Mid-range Corporate Plan (fiscal year ended March 31, 2016 – fiscal year ending March 31, 2018)
Sony’s mid-range corporate plan from the fiscal year ended March 31, 2016 through the fiscal year ending March 31, 2018 is transitioning the Company from a period focused primarily on restructuring to a new phase with “profit generation and investment for growth” as its theme. Under this plan, Sony is aiming to realize its transformation into a highly profitable enterprise. Sony’s target of consolidated ROE of more than 10% and consolidated operating profit of more than 500 billion yen for the Sony Group in the fiscal year ending March 31, 2018, the final year of its mid-range corporate plan, remains unchanged, and the Company is continuing to manage each of its businesses with the aim of achieving its transformation into a highly profitable enterprise.
In the fiscal year ended March 31, 2016, the first year of its mid-range plan, Sony significantly improved consolidated operating income and consolidated net income attributable to stockholders compared with the previous year. In particular, the revitalization of its “SONY”-branded consumer electronics businesses contributed significantly to this improved profitability. Sony recognizes that this revitalization was a result of comprehensive measures that have steadily been carried out to enhance product competitiveness and differentiation in these businesses, as well as structural reform and cost

- 8 -
optimization measures. These businesses are expected to provide the foundations for the Company’s achievement of its financial target for the fiscal year ending March 31, 2018 of consolidated operating profit of more than 500 billion yen. At the same time, with the competitive environment in the consumer electronics industry continuing to drastically change, Sony also plans to aggressively undertake new challenges within these businesses.
Progress of Key Segments and Related Initiatives
Game and Network Services
Sony considers the Game and Network Services segment the largest growth driver of its mid-range corporate plan, and as of May 2016, PlayStation®4 has cumulatively sold through more than 40 million units to customers worldwide, continuing its rapid growth and expansion as the fastest-selling console in PlayStation® history. The platform as a whole, including network services, is receiving widespread customer acclaim, and profit growth is exceeding the expectations held when the mid-range corporate plan was initially formed.
The network services business is also continuing to grow, achieving a 50% increase in sales in the fiscal year ended March 31, 2016 as compared to the previous fiscal year. The user base is expanding, driven in particular by the PlayStation®Plus membership service, and Sony has continued to engage in investment towards further growth.
Sony’s new PlayStation®VR virtual reality system is scheduled to launch in October 2016. Sony has identified virtual reality as an area it believes offers great future potential for the Sony Group in games, as well as other areas. Virtual reality is an application in which Sony believes it can leverage its technological strengths in areas such as digital imaging, content acquisition and production, as well as its entertainment assets. The Company is accordingly engaging with virtual reality across the Sony Group, and also considering the possibility of cultivating it as a new business domain.
Pictures and Music
In the Pictures and Music segments, with the shift to digital and proliferation of streaming services, the industry itself is undergoing a major transition. The ways that customers consume content, and their individual needs, are becoming increasingly diverse. With the Sony Group’s array of creative talent, ability to create high-quality entertainment, and wealth of content, the current business environment presents major opportunities, and Sony intends to accelerate its growth into these areas.
In the Pictures segment, the growth of subscription-based video services and emergence of “binge-watching” viewing styles, has led to a significant increase in demand for high-quality television content, particularly drama. With Sony Pictures Television producing a succession of major hits, including “Breaking Bad,” “Better Call Saul,” and “The Blacklist,” Sony believes it is well-positioned to take advantage of these trends.
In the Music segment, the discovery, development and promotion of artists such as Adele, whose record-breaking hit “25” made a significant contribution to profit in the fiscal year ended March 31, 2016, will continue to form the basis of Sony’s business activities. At the same time Sony is engaging in strategic investment to strengthen its recurring revenue businesses within this segment, as demonstrated by the full acquisition of independent music distributor Orchard Media, Inc. in April 2015, and its agreement to fully acquire Sony/ATV Music Publishing LLC announced in April 2016.
Devices*
In the Devices segment, which Sony classified as a “growth driver” in its mid-range corporate plan alongside the three segments above, Sony announced a significant downward revision to its full year results forecast in the fiscal year ended March 31, 2016 due to lower than expected sales in the core image sensor business, caused in particular by slowing growth within the smartphone market. The rate of profit growth in this business is expected to continue to decline through the fiscal year ending March 31, 2018. Sony plans to take an approach to management that prioritizes speed of response to changes in the market environment, and focuses on Sony’s areas of strength.
At the same time, in terms of image sensors for mobile products, while the smartphone market itself is slowing, the shift to dual-lens cameras and the requirement for higher pixel density is expected to lead to increased demand in the future. With its technological expertise in these areas, these could be favorable market trends for Sony. By taking advantage of these shifts in the business landscape and also by continuing its existing efforts to expand sales

- 9 -
volume, Sony is aiming to revitalize the profitability of this business from the second half of the fiscal year ending March 31, 2017 and into the fiscal year ending March 31, 2018.
From a mid- to long-term perspective, Sony continues to expect significant future growth for the image sensor-business. This business accordingly continues to be positioned as a growth driver.
In terms of new image sensor applications, Sony sees potential growth in surveillance cameras, as well as in factory automation, IoT (Internet of Things) including drones, and automotive applications. While it is expected to be some time before Sony’s image sensor business for automotive applications is fully established, it is an area where Sony anticipates growth and is investing in R&D aggressively.
*Sony realigned its business segments from the first quarter of the fiscal year ending March 31, 2017 to reflect a change in the Corporate Executive Officers in charge of the segment, as well as modifications to the organizational structure of certain segments as of April 1, 2016. As a result of this realignment, Sony has separated the Devices segment into two segments, a Semiconductors segment and a Components segment. The image sensor business is included in the Semiconductors segment.
Financial Services
In the Financial Services segment, each of the life insurance, non-life insurance, banking and nursing care business have continued to steadily expand their business operations, based on the high level of trust they have gained among customers. However, the ultra-low interest rate environment in Japan is expected to present challenges in terms of generating profit in this segment for the duration of the current mid-range corporate plan, and therefore projections for this segment which were incorporated in our mid-range corporate plan have been revised.
In the core life insurance business, Sony is reevaluating its product lineup and sales strategy and executing initiatives, including comprehensive risk management measures, in order to maintain and improve profitability. Sony will target mid- to long-term growth by continuing to focus on providing high-quality and convenient services in life insurance and across all its other businesses.
2. New Initiatives Looking Towards the Future
Based on its mission of being a company that provides customers with kando, and inspires and fulfills their curiosity, Sony will continue to target growth by developing the three pillars of its business—electronics, entertainment and financial services—and creating new business opportunities in these business domains.
Sony believes its strength lies in its ability to develop products that exist at the closest point of contact with its customers and resonate with them at an emotional level, and to place them in the hands of customers around the world. In other words, Sony connects with its customers at the “last one inch” of the user experience.
Sony intends to accelerate efforts to leverage its strengths in new business areas, based on the dual principles of its mission to provide customers with kando, and the pursuit of recurring revenue business models that generate sustainable business and profit growth.
While continuing to proceed with the new business creation initiatives in which Sony is currently engaged, the Company will aim to combine its existing strengths in areas such as video and audio technologies, sensors and mechatronics, with artificial intelligence (AI), robotics, communications and other elements, and by doing so offer new proposals at the “last one inch” across all types of living spaces.
In addition to initiatives already under way, such as the drone-based enterprise solutions that have been launched by Aerosense Inc., Sony’s joint venture with ZMP Inc., and the development of a range of Xperia smart products announced earlier this year, Sony has also embarked on the development of a robot capable of forming an emotional bond with customers, and able to grow to inspire love and affection. In April 2016 Sony established a new organization in this area that is working towards a business launch. Sony will seek to propose new business models that integrate hardware and services to provide emotionally compelling experiences. In the future, Sony will explore broader business opportunities for its robotics and AI technologies, including applications such as production processes and logistics.
In order to accelerate R&D in the areas that Sony will focus on going forward, Sony intends to further strengthen its collaboration with leading external researchers and start-up companies, and create a more open ecosystem. As part of these efforts, Sony established the “Sony Innovation Fund,” a corporate venture capital fund, which launched in July 2016.

- 10 -
Having advisors and business incubators actively participate in strategically important businesses will enable Sony to support the growth of companies in which it invests, and also provide opportunities to nurture Sony’s leaders of tomorrow.
Due to the earthquake of April 14, 2016 and subsequent earthquakes in the Kumamoto region, manufacturing operations were affected at Sony Semiconductor Manufacturing Corporation’s Kumamoto Technology Center, which is the primary manufacturing site of image sensors mainly for digital cameras, security cameras and micro-display devices. As a result of Sony’s recovery effort, full utilization on a wafer input basis was reached by the end of July, 2016.
Group Environmental Mid-Term Targets “Green Management 2020”
Sony announced in June 2015 the establishment of its “Green Management 2020” group environmental mid-term targets that will take effect from fiscal 2016 (the fiscal year ending March 31, 2017) through fiscal 2020 (the fiscal year ending March 31, 2021). Based on the following three pillars, Sony plans to implement various initiatives to reduce the Sony Group’s environmental footprint:
• Formulate targets and implement initiatives that leverage the distinctive characteristics of Sony’s businesses, from Electronics to entertainment. Among these, reduce annual energy consumption by an average of 30 percent (compared to levels at the fiscal year ended March 31, 2014) in Electronics products, and in entertainment, continue to look to use its contents to raise awareness of sustainability issues and inspire environmentally conscious actions.
• Enhance efforts to reduce Sony’s environmental footprint across its entire value chain, including manufacturing partners and suppliers, by calling on them to reduce greenhouse gas (GHG) emissions and water consumption.
• Accelerate the use of renewable energy.
Sony’s long-term vision is to achieve a “zero environmental footprint” throughout all stages of its product lifecycles and business activities by 2050. The “Green Management 2020” mid-term plan has been backcasted (calculated backwards) in order to determine the necessary intermediate steps that need to be taken by fiscal 2020 (the fiscal year ending March 31, 2021) on the way to this long-term goal. Sony achieved almost all of the targets set forth in its previous plan, “Green Management 2015,” which covered the five-year period up to and including fiscal 2015 (the fiscal year ended March 31, 2016). With “Green Management 2020,” Sony plans to further accelerate its various initiatives directed towards its ultimate goal of a “zero environmental footprint.”
Sony plans to also continue to participate in the WWF’s Climate Savers Programme, which aims to achieve reductions in greenhouse gas emissions, from the fiscal year ending March 31, 2017 onwards. Climate change targets are verified by WWF and a third-party verification body for their degrees of difficulty and progress.
Further details of the group environmental mid-term targets “Green Management 2020” and actual measures undertaken by Sony are reported in Sony’s CSR report available on the following website: http://www.sony.net/SonyInfo/csr_report/. iii) Research and Development
Note for readers of this English translation:
There was no significant change from the information presented as the Research and Development in the Annual Report on Form 20-F filed with the SEC on June 17, 2016. URL: The Annual Report on Form 20-F filed with the SEC on June 17, 2016 https://www.sec.gov/Archives/edgar/data/313838/000119312516624169/d168822d20f.htm
Research and development costs for the three months ended June 30, 2016 totaled 110.2 billion yen. There were no significant changes in research and development activities for the period.

- 11 -
iv) Employees
Note for readers of this English translation:
Excluding the below, there was no significant change from the information presented in the Employees section of the Annual Report on Form 20-F filed with the SEC on June 17, 2016. URL: The Annual Report on Form 20-F filed with the SEC on June 17, 2016 https://www.sec.gov/Archives/edgar/data/313838/000119312516624169/d168822d20f.htm
As of June 30, 2016, Sony Corporation had 6,347 employees, a decrease of 4,164 employees from 10,511 employees as of March 31, 2016. The total number of employees decreased mainly due to the separation of its Semionductors business to a subsidiary. There is no significant change in the number of employees of Sony on the consolidated basis. v) Liquidity and Capital Resources
Note for readers of this English translation:
Except for the information related to the committed lines of credit below, there was no significant change from the information presented in the Annual Report on Form 20-F filed with the SEC on June 17, 2016. The changes are indicated by underline below. Any forward-looking statements included in the descriptions below are based on management’s current judgment.
URL: The Annual Report on Form 20-F filed with the SEC on June 17, 2016 https://www.sec.gov/Archives/edgar/data/313838/000119312516624169/d168822d20f.htm
Sony typically raises funds through straight bonds, CP programs and bank loans (including syndicated loans). If market disruption and volatility occur and Sony could not raise sufficient funds from these sources, Sony may also draw down funds from contractually committed lines of credit from various financial institutions. Sony has a total, translated into yen, of 505.8 billion yen in unused committed lines of credit, as of June 30, 2016. Details of those committed lines of credit are: a 300.0 billion yen committed line of credit contracted with a syndicate of Japanese banks, effective until July 2018, a 1.5 billion U.S. dollar multi-currency committed line of credit also with a syndicate of Japanese banks, effective until December 2018, and a 500 million U.S. dollar multi-currency committed line of credit contracted with a syndicate of foreign banks, effective until March 2017, in all of which Sony Corporation and Sony Global Treasury Services Plc are defined as borrowers. These contracts are aimed at securing sufficient liquidity in a quick and stable manner even in the event of turmoil within the financial and capital markets.

- 12 -
Ⅲ Company Information (1) Information on the Company’s Shares
i) Total Number of Shares 1) Total Number of Shares
Class Total number of shares authorized to be issued Common stock 3,600,000,000
Total 3,600,000,000 2) Number of Shares Issued
Class
Number of shares issued Name of Securities Exchanges where the shares are listed or
authorized Financial Instruments Firms Association where the shares are registered
Description As of the end of the first quarterly period
(June 30, 2016)
As of the filing date of the Quarterly
Securities Report (August 4, 2016)
Common stock
1,262,618,460 1,262,638,760 Tokyo Stock Exchange
New York Stock Exchange
The number of shares constituting one full unit is one
hundred (100). Total 1,262,618,460 1,262,638,760 — —
Notes: 1. The Company’s shares of common stock are listed on the First Section of the Tokyo Stock Exchange in Japan. 2. The number of shares issued as of the filing date of this Quarterly Securities Report does not include shares issued
upon the exercise of stock acquisition rights (“SARs”) during August 2016, the month in which this Quarterly Securities Report (Shihanki Houkokusho) was filed.
ii) Stock Acquisition Rights
Not applicable.
Note for readers of this English translation: The above means that there was no issuance of SARs during the three months ended June 30, 2016.
iii) Status of the Exercise of Moving Strike Convertible Bonds
Not applicable.
iv) Description of Rights Plan Not applicable.
v) Changes in the Total Number of Shares Issued and the Amount of Common Stock, etc.
Period
Change in the total number of shares issued
Balance of the total number of shares issued
Change in the amount of common stock
Balance of the amount of common stock
Change in the legal capital
surplus
Balance of the legal capital
surplus (Thousands) (Thousands) (Yen in Millions) (Yen in Millions) (Yen in Millions) (Yen in Millions)
From April 1 to June 30, 2016
125 1,262,618 134 859,002 134 1,072,695
Notes: 1. The increase is due to the exercise of SARs. 2. Upon the exercise of SARs during the period from July 1, 2016 to July 31, 2016 the total number of shares issued
increased by 20 thousand shares, and the amount of common stock and the legal capital surplus increased by 29 million yen, respectively.

- 13 -
vi) Status of Major Shareholders (As of June 30, 2016)
Name Address Number of shares held
(Thousands)
Percentage of shares held to total shares
issued (%) Citibank as Depositary Bank for Depositary Receipt Holders *1 (Local Custodian: The Bank of Tokyo-Mitsubishi UFJ, Ltd.)
New York, U.S.A. (2-7-1, Marunouchi, Chiyoda-ku, Tokyo)
104,732 8.29
JPMorgan Chase Bank 380055 *2 (Local Custodian: Mizuho Bank, Ltd.)
New York, U.S.A. (Shinagawa Intercity Tower A, 2-15-1, Konan, Minato-ku, Tokyo)
64,641 5.12
Japan Trustee Services Bank, Ltd. (Trust account) *3
1-8-11, Harumi, Chuo-ku, Tokyo 62,976 4.99
The Master Trust Bank of Japan, Ltd. (Trust account) *3
2-11-3, Hamamatsu-cho, Minato-ku, Tokyo
53,632 4.25
State Street Bank and Trust Company *2
(Local Custodian: The Hongkong and Shanghai Banking Corporation Limited)
Boston, U.S.A. (3-11-1, Nihonbashi, Chuo-ku, Tokyo)
39,441 3.12
The Bank of New York Mellon SA/NV 10 *2 (Local Custodian: The Bank of Tokyo-Mitsubishi UFJ, Ltd.)
Brussels, Belgium (2-7-1, Marunouchi, Chiyoda-ku, Tokyo)
21,921 1.74
State Street Bank and Trust Company 505223 *2
(Local Custodian: Mizuho Bank, Ltd.)
Boston, U.S.A. (Shinagawa Intercity Tower A, 2-15-1, Konan, Minato-ku, Tokyo)
18,809 1.49
State Street Bank West Client - Treaty 505234 *2
(Local Custodian: Mizuho Bank, Ltd.)
North Quincy, U.S.A. (Shinagawa Intercity Tower A, 2-15-1, Konan, Minato-ku, Tokyo)
17,600 1.39
State Street Bank and Trust Company 505225 *2
(Local Custodian: Mizuho Bank, Ltd.)
Boston, U.S.A. (Shinagawa Intercity Tower A, 2-15-1, Konan, Minato-ku, Tokyo)
15,901 1.26
Japan Trustee Services Bank, Ltd. (Trust account 6) *3
1-8-11, Harumi, Chuo-ku, Tokyo 14,475 1.15
Total 414,127 32.80 Notes: *1. Citibank as Depositary Bank for Depositary Receipt Holders is the nominee of Citibank, N.A. *2. Each shareholder provides depositary services for shares owned by institutional investors, mainly in Europe and North
America. They are also the nominees for these investors. *3. The shares held by each shareholder are held in trust for investors, including shares in securities investment trusts. 4. Sumitomo Mitsui Trust Bank, Limited sent a copy of its “Bulk Shareholding Report” (which was filed with the Kanto
Financial Bureau in Japan) to the Company as of April 4, 2014 and reported that it held shares of the Company as of March 31, 2014 as provided in the below table. As of June 30, 2016, the Company has not been able to confirm any entry of Sumitomo Mitsui Trust Bank, Limited in the register of shareholders.
Name Number of shares held (Thousands)
Percentage of shares held to total shares issued (%)
Sumitomo Mitsui Trust Bank, Limited and the 2 Joint Holders 52,312 5.04

- 14 -
5. BlackRock Japan Co., Ltd. sent a copy of its “Bulk Shareholding Report” (which was filed with the Kanto Financial Bureau in Japan) to the Company as of July 22, 2014 and reported that it held shares of the Company as of July 15, 2014 as provided in the below table. As of June 30, 2016, the Company has not been able to confirm any entry of BlackRock Japan Co., Ltd. in the register of shareholders.
Name Number of shares held (Thousands)
Percentage of shares held to total shares issued (%)
BlackRock Japan Co., Ltd. and the 8 Joint Holders 52,314 5.01
6. Capital Research and Management Company filed its “Bulk Shareholding Report” with the Kanto Financial Bureau in
Japan as of May 20, 2016 and reported that it held shares of the Company as of May 13, 2016 as provided in the below table. As of June 30, 2016, the Company has not been able to confirm any entry of Capital Research and Management Company in the register of shareholders.
Name Number of shares held (Thousands)
Percentage of shares held to total shares issued (%)
Capital Research and Management Company 86,520 6.85

- 15 -
vii) Status of Voting Rights 1) Shares Issued
(As of June 30, 2016)
Classification Number of shares of
common stock Number of voting rights
(Units) Description
Shares without voting rights — — —
Shares with restricted voting rights (Treasury stock, etc.)
— — —
Shares with restricted voting rights (Others) — — —
Shares with full voting rights (Treasury stock, etc.)
1,054,900 — —
Shares with full voting rights (Others) 1,259,374,900 12,593,749 —
Shares constituting less than one full unit 2,188,660 — Shares constituting
less than one full unit (100 shares)
Total number of shares issued 1,262,618,460 — —
Total voting rights held by all shareholders — 12,593,749 —
Note: Included in “Shares with full voting rights (Others)” under “Number of shares of common stock” are 19,500 shares of common stock held under the name of Japan Securities Depository Center, Incorporated. Also included in “Shares with full voting rights (Others)” under “Number of voting rights (Units)” are 195 units of voting rights relating to the shares of common stock with full voting rights held under the name of Japan Securities Depository Center, Incorporated.
2) Treasury Stock, Etc.
(As of June 30, 2016)
Name of shareholder Address of shareholder
Number of shares held under own
name
Number of shares held
under the names of others
Total number of shares
held
Percentage of shares held to total shares issued (%)
Sony Corporation (Treasury stock)
1-7-1, Konan, Minato-ku, Tokyo 1,054,900 — 1,054,900 0.08
Total — 1,054,900 — 1,054,900 0.08 Note: In addition to the 1,054,900 shares listed above, there are 300 shares of common stock held in the name of the
Company in the register of shareholders that the Company does not beneficially own. These shares are included in “Shares with full voting rights (Others)” in Table 1) “Shares Issued” above.
(2) Directors and Corporate Executive Officers
There was no change in directors or corporate executive officers in the period from the filing date of the
Securities Report (Yukashoken Houkokusho) for the fiscal year ended March 31, 2016 to the filing date of this Quarterly Securities Report (Shihanki Houkokusho).

- 16 -
IV Financial Statements Page
(1) Consolidated Financial Statements 17 (i) Consolidated Balance Sheets 17 (ii) Consolidated Statements of Income 19 (iii) Consolidated Statements of Comprehensive Income 20 (iv) Consolidated Statements of Cash Flows 21 (2) Other Information 39

- 17 -
(1) Consolidated Financial Statements (i) Consolidated Balance Sheets (Unaudited) Sony Corporation and Consolidated Subsidiaries Yen in millions At March 31,
2016 At June 30,
2016 ASSETS Current assets: Cash and cash equivalents 983,612 631,074 Marketable securities 946,397 897,494 Notes and accounts receivable, trade 926,375 917,215 Allowance for doubtful accounts and sales returns (72,783) (47,800) Inventories 683,146 717,930 Other receivables 206,058 234,730 Deferred income taxes 40,940 38,744 Prepaid expenses and other current assets 482,982 512,999 Total current assets 4,196,727 3,902,386 Film costs 301,228 310,317 Investments and advances: Affiliated companies 164,874 161,296 Securities investments and other 9,069,209 9,208,539 9,234,083 9,369,835
Property, plant and equipment: Land 121,707 120,204 Buildings 655,379 635,916 Machinery and equipment 1,795,991 1,773,934 Construction in progress 69,286 57,891 2,642,363 2,587,945 Less – Accumulated depreciation 1,821,545 1,803,994 820,818 783,951 Other assets: Intangibles, net 615,754 576,101 Goodwill 606,290 567,870 Deferred insurance acquisition costs 511,834 510,568 Deferred income taxes 97,639 96,533 Other 289,017 264,184 2,120,534 2,015,256 Total assets 16,673,390 16,381,745
(Continued on following page.)

- 18 -
Consolidated Balance Sheets (Unaudited) Yen in millions At March 31,
2016 At June 30,
2016 LIABILITIES Current liabilities: Short-term borrowings 149,272 111,116 Current portion of long-term debt 187,668 154,189 Notes and accounts payable, trade 550,964 609,843 Accounts payable, other and accrued expenses 1,367,115 1,194,303 Accrued income and other taxes 88,865 89,072 Deposits from customers in the banking business 1,912,673 1,900,796 Other 574,193 523,156 Total current liabilities 4,830,750 4,582,475 Long-term debt 556,605 533,718 Accrued pension and severance costs 462,384 452,981 Deferred income taxes 450,926 448,895 Future insurance policy benefits and other 4,509,215 4,601,792 Policyholders’ account in the life insurance business 2,401,320 2,388,889 Other 330,302 298,256 Total liabilities 13,541,502 13,307,006 Redeemable noncontrolling interest 7,478 6,293 Commitments and contingent liabilities EQUITY Sony Corporation’s stockholders’ equity: Common stock, no par value –
At March 31, 2016–Shares authorized: 3,600,000,000, shares issued: 1,262,493,760 858,867 At June 30, 2016–Shares authorized: 3,600,000,000, shares issued: 1,262,618,460 859,002 Additional paid-in capital 1,325,719 1,326,415 Retained earnings 936,331 957,497 Accumulated other comprehensive income – Unrealized gains on securities, net 140,736 149,765
Unrealized losses on derivative instruments, net (1,198) (1,343) Pension liability adjustment (371,739) (368,523)
Foreign currency translation adjustments (421,117) (510,364) (653,318) (730,465) Treasury stock, at cost
Common stock At March 31, 2016–1,047,745 shares (4,259) At June 30, 2016–1,054,928 shares (4,280)
2,463,340 2,408,169 Noncontrolling interests 661,070 660,277 Total equity 3,124,410 3,068,446 Total liabilities and equity 16,673,390 16,381,745
The accompanying notes are an integral part of these statements.

- 19 -
(ii) Consolidated Statements of Income (Unaudited) Sony Corporation and Consolidated Subsidiaries Yen in millions Three months ended June 30 2015 2016
Sales and operating revenue: Net sales 1,503,311 1,362,517 Financial services revenue 277,689 230,909 Other operating revenue 27,059 19,773 1,808,059 1,613,199 Costs and expenses: Cost of sales 1,134,269 1,015,623 Selling, general and administrative 378,722 338,097 Financial services expenses 232,038 181,631 Other operating (income) expense, net (33,454) 20,873 1,711,575 1,556,224 Equity in net income (loss) of affiliated companies 423 (783) Operating income 96,907 56,192 Other income: Interest and dividends 2,652 3,227 Gain on sale of securities investments, net 50,782 72 Foreign exchange gain, net - 1,615 Other 647 1,030 54,081 5,944 Other expenses: Interest 4,394 3,801 Foreign exchange loss, net 5,746 - Other 2,138 1,319 12,278 5,120 Income before income taxes 138,710 57,016
Income taxes 39,812 20,475
Net income 98,898 36,541
Less - Net income attributable to noncontrolling interests 16,457 15,375
Net income attributable to Sony Corporation’s stockholders 82,441 21,166
Yen Three months ended June 30 2015 2016
Per share data: - - Net income attributable to Sony Corporation’s stockholders – Basic 70.52 16.78 – Diluted 70.36 16.44
The accompanying notes are an integral part of these statements.

- 20 -
(iii) Consolidated Statements of Comprehensive Income (Unaudited) Sony Corporation and Consolidated Subsidiaries Yen in millions Three months ended June 30 2015 2016
Net income 98,898 36,541 Other comprehensive income, net of tax ―
Unrealized gains (losses) on securities (47,066) 20,395 Unrealized losses on derivative instruments (636) (145) Pension liability adjustment 202 3,226 Foreign currency translation adjustments 27,607 (90,998)
Total comprehensive income (loss) 79,005 (30,981) Less – Comprehensive income attributable to noncontrolling interests 13,460 25,000 Comprehensive income (loss) attributable to Sony Corporation's
stockholders 65,545 (55,981) The accompanying notes are an integral part of these statements.

- 21 -
(iv) Consolidated Statements of Cash Flows (Unaudited) Sony Corporation and Consolidated Subsidiaries
(Continued on following page.)
Yen in millions Three months ended June 30 2015 2016 Cash flows from operating activities: Net income 98,898 36,541 Adjustments to reconcile net income to net cash
provided by (used in) operating activities – Depreciation and amortization, including amortization
of deferred insurance acquisition costs 87,021 93,557 Amortization of film costs 63,356 61,229
Accrual for pension and severance costs, less payments (3,035) 3,449 Other operating (income) expense, net (33,454) 20,873 Gain on sale or devaluation of securities investments, net (50,706) (72)
(Gain) loss on revaluation of marketable securities held in the financial services business for trading purposes, net (19,088) 47,138
Loss on revaluation or impairment of securities investments held in the financial services business, net 2,069 2
Deferred income taxes 5,471 (266) Equity in net (income) loss of affiliated companies, net of dividends 798 2,533
Changes in assets and liabilities: Increase in notes and accounts receivable, trade (83,030) (80,709) Increase in inventories (103,603) (75,044) Increase in film costs (105,273) (98,223) Increase in notes and accounts payable, trade 132,276 76,274 Decrease in accrued income and other taxes (6,378) (2,776) Increase in future insurance policy benefits and other 128,265 55,216 Increase in deferred insurance acquisition costs (21,790) (20,528) Increase in marketable securities held in the financial services
(21,679) (26,702) business for trading purposes Increase in other current assets (62,015) (75,600) Decrease in other current liabilities (147,587) (62,884) Other (14,806) 62,178 Net cash provided by (used in) operating activities (154,290) 16,186

- 22 -
Consolidated Statements of Cash Flows (Unaudited)
Yen in millions Three months ended June 30
2015 2016 Cash flows from investing activities: Payments for purchases of fixed assets (77,034) (106,002) Proceeds from sales of fixed assets 2,484 1,829
Payments for investments and advances by financial services business (316,299) (205,729) Payments for investments and advances (other than financial services
business) (4,323) (2,585) Proceeds from sales or return of investments and collections of advances
by financial services business
153,984
88,144 Proceeds from sales or return of investments and collections of advances
(other than financial services business)
74,358
2,383 Proceeds from sales of businesses 17,790 - Other (22,962) 2,782
Net cash used in investing activities (172,002) (219,178) Cash flows from financing activities: Proceeds from issuance of long-term debt 9,712 1,031 Payments of long-term debt (84,767) (48,607) Increase (decrease) in short-term borrowings, net 62,111 (34,895) Increase in deposits from customers in the financial services business, net 20,392 12,406
Dividends paid (59) (12,679) Other (15,212) (15,809) Net cash used in financing activities (7,823) (98,553) Effect of exchange rate changes on cash and cash equivalents 12,789 (50,993) Net decrease in cash and cash equivalents (321,326) (352,538) Cash and cash equivalents at beginning of the fiscal year 949,413 983,612 Cash and cash equivalents at end of the period 628,087 631,074 The accompanying notes are an integral part of these statements.

- 23 -
Index to Notes to Consolidated Financial Statements
Sony Corporation and Consolidated Subsidiaries
Notes to Consolidated Financial Statements Page
1. Summary of significant accounting policies 24 2. Marketable securities and securities investments 25 3. Fair value measurements 26 4. Supplemental equity and comprehensive income information 28 5. Reconciliation of the differences between basic and diluted EPS 30 6. Kumamoto Earthquake 30 7. Commitments, contingent liabilities and other 31 8. Business segment information 33 9. Subsequent events 39

- 24 -
Notes to Consolidated Financial Statements (Unaudited) Sony Corporation and Consolidated Subsidiaries
1. Summary of significant accounting policies
The accompanying consolidated financial statements are presented in accordance with accounting principles generally accepted in the United States of America (“U.S. GAAP”), except for certain disclosures which have been omitted. Certain adjustments and reclassifications have been incorporated in the accompanying consolidated financial statements to conform with U.S. GAAP. These adjustments were not recorded in the statutory books and records as Sony Corporation and its subsidiaries in Japan maintain their records and prepare their statutory financial statements in accordance with accounting principles generally accepted in Japan while its foreign subsidiaries maintain their records and prepare their financial statements in conformity with accounting principles generally accepted in the countries of their domiciles.
(1) Recently adopted accounting pronouncements:
Amendments to the consolidation analysis -
In February 2015, the Financial Accounting Standards Board (“FASB”) issued Accounting Standards Update (“ASU”) 2015-02 that changes how companies evaluate entities for consolidation. The changes primarily relate to (i) the identification of variable interests related to fees paid to decision makers or service providers, (ii) how entities determine whether limited partnerships or similar entities are variable interest entities, (iii) how related parties and de facto agents are considered in the primary beneficiary determination, and (iv) the elimination of the presumption that a general partner controls a limited partnership. This ASU is effective for Sony as of April 1, 2016. The effect of this ASU did not have a material impact on Sony’s results of operations and financial position.
Customer’s accounting for fees paid in a cloud computing arrangement -
In April 2015, the FASB issued ASU 2015-05 for fees paid in a cloud computing arrangement. The ASU requires entities to account for a cloud computing arrangement that includes a software license element in a manner consistent with the acquisition of other software licenses. A cloud computing arrangement without a software license element is to be accounted for as a service contract. This ASU does not affect the accounting for service contracts by a customer. This ASU is effective for Sony as of April 1, 2016. The effect of this ASU did not have a material impact on Sony’s results of operations and financial position.
(2) Accounting methods used specifically for interim consolidated financial statements:
Income Taxes -
Sony estimates the annual effective tax rate (“ETR”) derived from a projected annual net income before taxes and calculates the interim period income tax provision based on the year-to-date income tax provision computed by applying the ETR to the year-to-date net income before taxes at the end of each interim period. The income tax provision based on the ETR reflects anticipated income tax credits and net operating loss carryforwards; however, it excludes the income tax provision related to significant unusual or extraordinary transactions. Such income tax provision is separately reported from the provision based on the ETR in the interim period in which it occurs.
(3) Reclassifications:
Certain reclassifications of the financial statements and accompanying footnotes for the three months ended June 30, 2015 have been made to conform to the presentation for the three months ended June 30, 2016.

- 25 -
2. Marketable securities and securities investments
Marketable securities and securities investments, primarily included in the Financial Services segment, are comprised of debt and equity securities for which the aggregate cost, gross unrealized gains and losses and fair value pertaining to available-for-sale securities and held-to-maturity securities are as follows:
Yen in millions March 31, 2016 June 30, 2016
Cost
Gross unrealized
gains
Gross unrealized
losses Fair value Cost
Gross unrealized
gains
Gross unrealized
losses Fair value Available-for-sale: Debt securities:
Japanese national government bonds
1,136,478 218,863 (6) 1,355,335
1,141,854
262,897
(7)
1,404,744
Japanese local government bonds
60,707 86 (254) 60,539
61,788
107
(326)
61,569
Japanese corporate bonds
132,739
11,472
(230)
143,981
144,239
19,284
(387)
163,136
Foreign government bonds
35,896
5,724
(160)
41,460
20,801
1,811
(254)
22,358
Foreign corporate bonds 415,994 5,738 (3,185) 418,547 381,750 3,071 (4,011) 380,810 Other 884 0 - 884 7,974 0 - 7,974
1,782,698 241,883 (3,835) 2,020,746 1,758,406 287,170 (4,985) 2,040,591
Equity securities 44,752 70,590 (21) 115,321 44,628 57,504 (820) 101,312 Held-to-maturity securities:
Japanese national government bonds *
5,353,080
2,020,621
-
7,373,701
5,366,133
2,791,611
-
8,157,744
Japanese local government bonds
4,480
522
-
5,002
4,171
565
-
4,736
Japanese corporate
bonds
61,811
17,382
-
79,193
119,049
28,504
-
147,553
Foreign government bonds
42,934
10,631
-
53,565
44,247
14,497
-
58,744
Foreign corporate bonds 198 24 - 222 198 22 - 220
5,462,503 2,049,180 - 7,511,683 5,533,798 2,835,199 - 8,368,997
Total 7,289,953 2,361,653 (3,856) 9,647,750 7,336,832 3,179,873 (5,805) 10,510,900 * As of June 30, 2016, held-to-maturity securities include 31,559 million yen of pledged Japanese national government bonds as collateral for transactions with short-term repurchase agreement.

- 26 -
3. Fair value measurements
The fair value of Sony’s assets and liabilities that are measured at fair value on a recurring basis are as follows:
Yen in millions March 31, 2016 Presentation in the consolidated balance sheets
Level 1 Level 2 Level 3 Total
Marketable securities
Securities investments
and other
Other current assets/
liabilities
Other noncurrent
assets/ liabilities
Assets:
Trading securities 501,448 297,793 - 799,241 799,241 - - - Available-for-sale securities
Debt securities Japanese national
government bonds - 1,355,335 - 1,355,335 5,084 1,350,251 - -
Japanese local government bonds
- 60,539 - 60,539 6,515 54,024 - -
Japanese corporate bonds - 140,635 3,346 143,981 5,727 138,254 - - Foreign government
bonds - 41,460 - 41,460 2,309 39,151 - -
Foreign corporate bonds - 402,694 15,853 418,547 124,680 293,867 - -
Other - - 884 884 - 884 - - Equity securities 115,200 121 - 115,321 - 115,321 - -
Other investments *1 7,179 4,027 13,463 24,669 - 24,669 - - Derivative assets *2, *3 437 17,391 - 17,828 - - 17,257 571 Total assets 624,264 2,319,995 33,546 2,977,805 943,556 2,016,421 17,257 571
Liabilities: Derivative liabilities*2,*3 668 48,467 - 49,135 - - 20,680 28,455 Total liabilities 668 48,467 - 49,135 - - 20,680 28,455

- 27 -
Yen in millions June 30, 2016 Presentation in the consolidated balance sheets
Level 1 Level 2 Level 3 Total
Marketable securities
Securities investments
and other
Other current assets/
liabilities
Other noncurrent
assets/ liabilities
Assets:
Trading securities 478,023 294,630 - 772,653 772,653 - - - - Available-for-sale securities
Debt securities Japanese national
government bonds - 1,404,744 - 1,404,744 4,477 1,400,267 - -
Japanese local government bonds
- 61,569 - 61,569 7,146 54,423 - -
Japanese corporate bonds - 159,786 3,350 163,136 6,030 157,106 - -
Foreign government bonds
- 22,358 - 22,358 2,576 19,782 - -
Foreign corporate bonds - 363,901 16,909 380,810 100,089 280,721 - -
Other - - 7,974 7,974 - 7,974 - - Equity securities 101,212 100 - 101,312 - 101,312 - -
Other investments *1 7,018 3,742 11,748 22,508 - 22,508 - - Derivative assets *2, *3 4,326 30,675 - 35,001 - - 34,210 791 Total assets 590,579 2,341,505 39,981 2,972,065 892,971 2,044,093 34,210 791
Liabilities: Derivative liabilities*2,*3 26 49,679 - 49,705 - - 21,834 27,871
Total liabilities 26 49,679 - 49,705 - - 21,834 27,871
*1 Other investments include certain hybrid financial instruments and certain private equity investments. *2 Derivative assets and liabilities are recognized and disclosed on a gross basis. *3 The potential effect of offsetting on assets and liabilities, which primarily consists of derivatives subject to master netting
agreements and/or collateral, is insignificant. Sony also has assets and liabilities that are required to be recorded at fair value on a nonrecurring basis when certain
circumstances occur. The circumstances include when long-lived assets are measured at the lesser of carrying value or fair value if such assets are held for sale or when the estimated undiscounted future cash flows are determined to be less than the carrying value of the asset or asset group. During the three months ended June 30, 2016, Sony measured fair value of long-lived assets related to the camera module business in the Semiconductors segment and recorded impairment losses of 20,303 million yen. These measurements are classified as level 3 because significant unobservable inputs, such as conditions of the assets or projections of future cash flows, the timing of such cash flows and the discount rate reflecting the risk inherent in future cash flows, were considered in the fair value measurement.

- 28 -
4. Supplemental equity and comprehensive income information
(1) Stockholders’ Equity
A reconciliation of the beginning and ending carrying amounts of Sony Corporation’s stockholders’ equity, noncontrolling interests and the total equity for the three months ended June 30, 2015 and 2016 are as follows: Yen in millions
Sony Corporation’s stockholders’ equity
Noncontrolling interests Total equity
Balance at March 31, 2015 2,317,077 611,392 2,928,469 Exercise of stock acquisition rights 1,130 - 1,130 Stock-based compensation 287 - 287 Comprehensive income:
Net income 82,441 16,457 98,898 Other comprehensive income, net of tax ―
Unrealized losses on securities (43,356) (3,710) (47,066) Unrealized losses on derivative instruments (636) - (636) Pension liability adjustment 200 2 202 Foreign currency translation adjustments 26,896 711 27,607
Total comprehensive income 65,545 13,460 79,005 Dividends declared - (9,847) (9,847) Transactions with noncontrolling interests shareholders and other 26 1,985 2,011
Balance at June 30, 2015 2,384,065 616,990 3,001,055 Yen in millions
Sony Corporation’s stockholders’ equity
Noncontrolling interests Total equity
Balance at March 31, 2016 2,463,340 661,070 3,124,410 Exercise of stock acquisition rights 268 - 268 Stock-based compensation 568 - 568 Comprehensive income:
Net income 21,166 15,375 36,541 Other comprehensive income, net of tax ―
Unrealized gains on securities 9,029 11,366 20,395 Unrealized losses on derivative instruments (145) - (145) Pension liability adjustment 3,216 10 3,226 Foreign currency translation adjustments (89,247) (1,751) (90,998)
Total comprehensive income (loss) (55,981) 25,000 (30,981) Dividends declared - (16,434) (16,434) Transactions with noncontrolling interests shareholders and other (26) (9,359) (9,385)
Balance at June 30, 2016 2,408,169 660,277 3,068,446
There was no material effect of changes in Sony Corporation’s ownership interest in its subsidiaries on Sony Corporation’s stockholders’ equity for the three months ended June 30, 2015 and 2016.
- 29 -
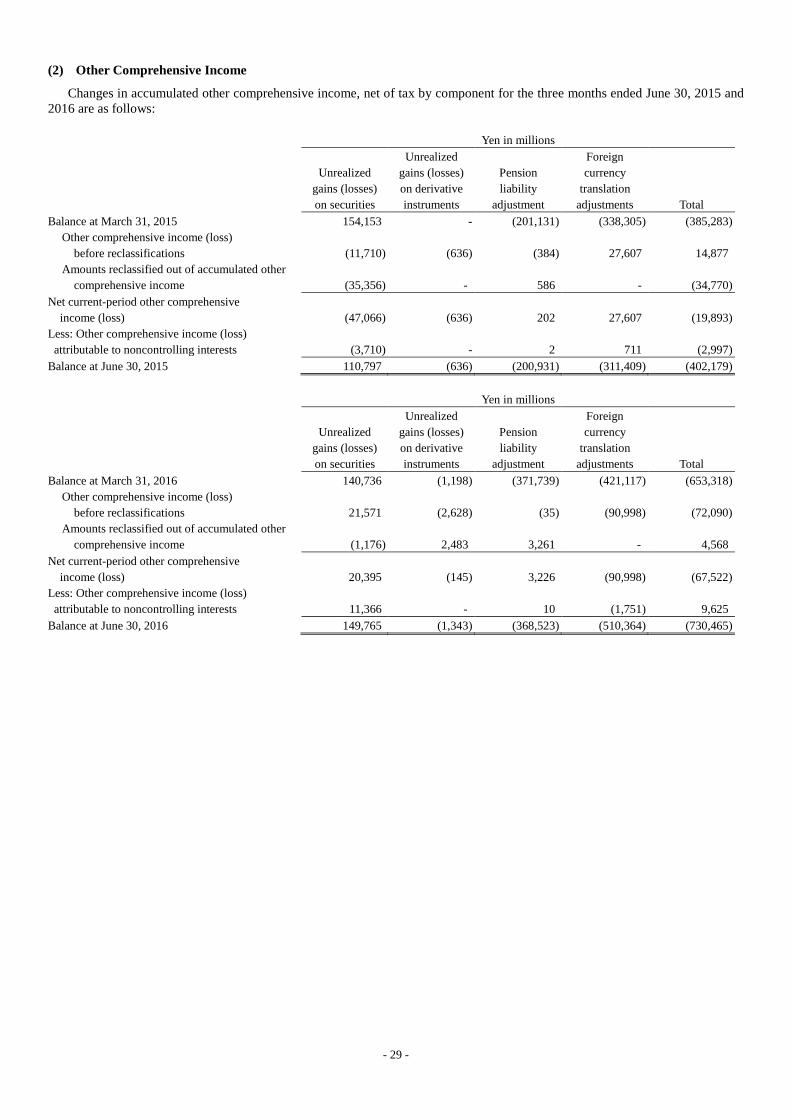
(2) Other Comprehensive Income
Changes in accumulated other comprehensive income, net of tax by component for the three months ended June 30, 2015 and 2016 are as follows: Yen in millions
Unrealized gains (losses) on securities
Unrealized gains (losses) on derivative instruments
Pension liability
adjustment
Foreign currency
translation adjustments Total
Balance at March 31, 2015 154,153 - (201,131) (338,305) (385,283) Other comprehensive income (loss)
before reclassifications (11,710) (636) (384) 27,607 14,877 Amounts reclassified out of accumulated other
comprehensive income (35,356) - 586 - (34,770) Net current-period other comprehensive
income (loss) (47,066) (636) 202 27,607 (19,893) Less: Other comprehensive income (loss) attributable to noncontrolling interests (3,710) - 2 711 (2,997) Balance at June 30, 2015 110,797 (636) (200,931) (311,409) (402,179)
Yen in millions
Unrealized gains (losses) on securities
Unrealized gains (losses) on derivative instruments
Pension liability
adjustment
Foreign currency
translation adjustments Total
Balance at March 31, 2016 140,736 (1,198) (371,739) (421,117) (653,318) Other comprehensive income (loss)
before reclassifications 21,571 (2,628) (35) (90,998) (72,090) Amounts reclassified out of accumulated other
comprehensive income (1,176) 2,483 3,261 - 4,568 Net current-period other comprehensive
income (loss) 20,395 (145) 3,226 (90,998) (67,522) Less: Other comprehensive income (loss) attributable to noncontrolling interests 11,366 - 10 (1,751) 9,625 Balance at June 30, 2016 149,765 (1,343) (368,523) (510,364) (730,465)
- 30 -
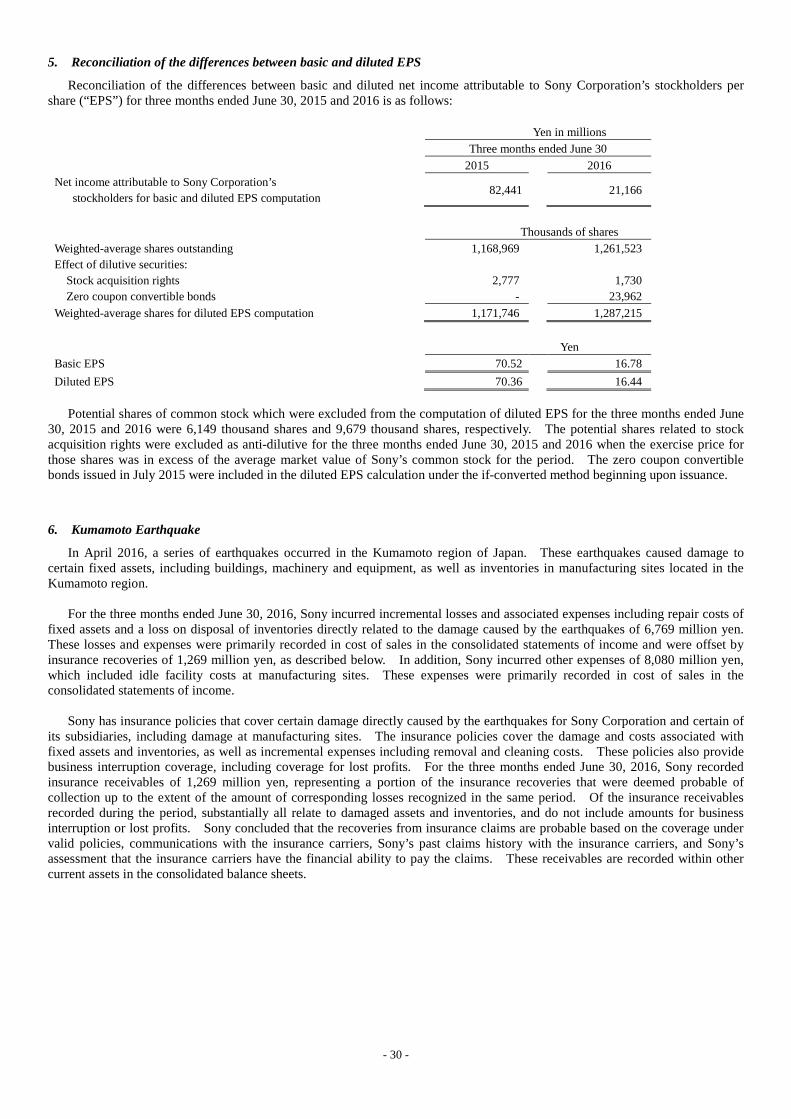
5. Reconciliation of the differences between basic and diluted EPS
Reconciliation of the differences between basic and diluted net income attributable to Sony Corporation’s stockholders per share (“EPS”) for three months ended June 30, 2015 and 2016 is as follows:
Yen in millions Three months ended June 30 2015 2016 Net income attributable to Sony Corporation’s stockholders for basic and diluted EPS computation
82,441 21,166
Thousands of shares Weighted-average shares outstanding 1,168,969 1,261,523 Effect of dilutive securities:
Stock acquisition rights 2,777 1,730 Zero coupon convertible bonds - 23,962
Weighted-average shares for diluted EPS computation 1,171,746 1,287,215
Yen Basic EPS 70.52 16.78 Diluted EPS 70.36 16.44
Potential shares of common stock which were excluded from the computation of diluted EPS for the three months ended June
30, 2015 and 2016 were 6,149 thousand shares and 9,679 thousand shares, respectively. The potential shares related to stock acquisition rights were excluded as anti-dilutive for the three months ended June 30, 2015 and 2016 when the exercise price for those shares was in excess of the average market value of Sony’s common stock for the period. The zero coupon convertible bonds issued in July 2015 were included in the diluted EPS calculation under the if-converted method beginning upon issuance.
6. Kumamoto Earthquake
In April 2016, a series of earthquakes occurred in the Kumamoto region of Japan. These earthquakes caused damage to certain fixed assets, including buildings, machinery and equipment, as well as inventories in manufacturing sites located in the Kumamoto region.
For the three months ended June 30, 2016, Sony incurred incremental losses and associated expenses including repair costs of
fixed assets and a loss on disposal of inventories directly related to the damage caused by the earthquakes of 6,769 million yen. These losses and expenses were primarily recorded in cost of sales in the consolidated statements of income and were offset by insurance recoveries of 1,269 million yen, as described below. In addition, Sony incurred other expenses of 8,080 million yen, which included idle facility costs at manufacturing sites. These expenses were primarily recorded in cost of sales in the consolidated statements of income.
Sony has insurance policies that cover certain damage directly caused by the earthquakes for Sony Corporation and certain of
its subsidiaries, including damage at manufacturing sites. The insurance policies cover the damage and costs associated with fixed assets and inventories, as well as incremental expenses including removal and cleaning costs. These policies also provide business interruption coverage, including coverage for lost profits. For the three months ended June 30, 2016, Sony recorded insurance receivables of 1,269 million yen, representing a portion of the insurance recoveries that were deemed probable of collection up to the extent of the amount of corresponding losses recognized in the same period. Of the insurance receivables recorded during the period, substantially all relate to damaged assets and inventories, and do not include amounts for business interruption or lost profits. Sony concluded that the recoveries from insurance claims are probable based on the coverage under valid policies, communications with the insurance carriers, Sony’s past claims history with the insurance carriers, and Sony’s assessment that the insurance carriers have the financial ability to pay the claims. These receivables are recorded within other current assets in the consolidated balance sheets.

- 31 -
7. Commitments, contingent liabilities and other
(1) Loan commitments
Subsidiaries in the Financial Services segment have entered into loan agreements with their customers in accordance with the condition of the contracts. As of June 30, 2016, the total unused portion of the lines of credit extended under these contracts was 30,543 million yen. The aggregate amounts of future year-by-year payments for these loan commitments cannot be determined.
(2) Purchase commitments and other
Purchase commitments and other outstanding commitments as of June 30, 2016 amounted to 400,557 million yen. The major components of these commitments are as follows:
Certain subsidiaries in the Pictures segment have entered into agreements with creative talent for the development and
production of motion pictures and television programming as well as agreements with third parties to acquire completed motion pictures, or certain rights therein, and to acquire the rights to broadcast certain live action sporting events. These agreements cover various periods mainly within three years. As of June 30, 2016, these subsidiaries were committed to make payments under such contracts of 118,861 million yen.
As discussed under the Guarantees section below, a subsidiary in the Music segment has entered into a binding Memorandum
of Understanding on March 14, 2016 and a definitive agreement on April 15, 2016 (the “Music Publishing Purchase Agreements”) with a third-party investor to obtain full ownership of Sony’s U.S.-based music publishing subsidiary, the closing of which is subject to certain conditions including regulatory approval. As of June 30, 2016, the subsidiary was committed to make payments of 745 million U.S. dollars under the Music Publishing Purchase Agreements.
Certain subsidiaries in the Music segment have entered into long-term contracts with recording artists, songwriters and
companies for the future production, distribution and/or licensing of music product. These contracts cover various periods mainly within five years. As of June 30, 2016, these subsidiaries were committed to make payments of 58,095 million yen under such long-term contracts.
A subsidiary in the Game & Network Services segment has entered into long-term contracts for programming content. These
contracts cover various periods mainly up to four years. As of June 30, 2016, this subsidiary was committed to make payments of 23,845 million yen under such long-term contracts.
Sony has entered into long-term sponsorship contracts related to advertising and promotional rights. These contracts cover
various periods mainly within three years. As of June 30, 2016, Sony has committed to make payments of 14,250 million yen under such long-term contracts.
(3) Litigation
In October 2009, Sony Corporation’s U.S. subsidiary, Sony Optiarc America Inc., received a subpoena from the U.S. Department of Justice (“DOJ”) seeking information about its optical disk drive business. Sony understands that the European Commission and certain other governmental agencies outside the United States also opened investigations of competition in the optical disk drives market. In March 2014, the DOJ notified Sony that it had closed its investigation. In October 2015, the European Commission adopted a decision in which it fined Sony Corporation, its subsidiary in Japan, Sony Optiarc Inc., and two other subsidiaries 31 million euros. In December 2015, Sony filed an appeal with the European Union’s General Court. Sony understands that the investigations by several other agencies have now ended, but one other agency continues to investigate. A number of direct and indirect purchaser lawsuits, including class actions, have been filed in certain jurisdictions, including the United States, in which the plaintiffs alleged that Sony Corporation and certain of its subsidiaries violated antitrust laws and sought recovery of damages and other remedies. Certain of these lawsuits have reached a settlement, including the class action brought by the direct purchasers in the United States, which has received court approval. In addition, a proposed settlement of the class action brought by the indirect purchasers in the United States is pending court approval. However, certain other lawsuits continue. Based on the stage of the remaining investigation and cases, it is not possible to estimate the amount of losses or range of possible losses, if any, that might ultimately result from adverse judgments, settlements or other resolution of all of these matters.
In May 2011, Sony Corporation’s U.S. subsidiary, Sony Electronics Inc., received a subpoena from the DOJ Antitrust Division
seeking information about its secondary batteries business. Sony understands that the European Commission and certain other governmental agencies outside the United States also opened investigations of competition in the secondary batteries market. The DOJ has notified Sony that it has closed its investigation, but the European Commission and one other agency continue to investigate. A number of direct and indirect purchaser lawsuits, including class actions, have been filed in certain jurisdictions, including the United States, in which the plaintiffs allege that Sony Corporation and certain of its subsidiaries violated antitrust laws and seek recovery of damages and other remedies. Although certain of these lawsuits have reached a settlement, including the class actions brought by the direct purchasers and the indirect purchasers in the United States, the proposed settlements of which are pending court approvals, other lawsuits continue. Based on the stage of the remaining investigation and cases, it is not

- 32 -
possible to estimate the amount of losses or range of possible losses, if any, that might result from adverse judgments, settlements or other resolution of all of these matters.
A Sony subsidiary outside Japan is subject to a non-Japanese customs investigation in connection with the import and export
of certain HE&S products. Sony is cooperating with the relevant government authorities. Based on the stage of this investigation and information currently available, it is not possible to estimate the amount of losses or range of possible losses, if any, that might ultimately result from adverse judgments, settlements or other resolution of this investigation.
In addition, Sony Corporation and certain of its subsidiaries are defendants or otherwise involved in other pending legal and
regulatory proceedings. However, based upon the information currently available, Sony believes that the outcome from such legal and regulatory proceedings would not have a material impact on Sony’s results of operations and financial position.
(4) Guarantees
Sony has issued guarantees that contingently require payments to guaranteed parties if certain specified events or conditions occur. The maximum potential amount of future payments under these guarantees as of June 30, 2016 amounted to 34,887 million yen. The major components of these guarantees are as follows:
Sony has agreed to repay the outstanding principal plus accrued interest up to a maximum of 257 million U.S. dollars to the
creditor of the third-party investor of Sony’s U.S.-based music publishing subsidiary should the third-party investor default on its obligation. The obligation of the third-party investor is collateralized by its 50% interest in Sony’s music publishing subsidiary. Should Sony have to make a payment under the terms of the guarantee, Sony would assume the creditor’s rights to the underlying collateral. As of June 30, 2016, the fair value of the collateral exceeded 257 million U.S. dollars. Sony entered into the Music Publishing Purchase Agreements with the third-party investor to obtain full ownership of the U.S.-based music publishing subsidiary. Under the terms of the Music Publishing Purchase Agreements, Sony will pay the third-party investor a lump sum payment of 733 million U.S. dollars upon closing plus 17 million U.S. dollars of distributions to which the subsidiary previously committed. As of June 30, 2016, Sony has paid 5 million U.S. dollars of the distributions. The closing of the transaction is subject to certain closing conditions, including regulatory approval. Upon the successful close of the transaction, the guarantee provided to the creditor of the third-party investor will be terminated.

- 33 -
8. Business segment information
The reportable segments presented below are the segments of Sony for which separate financial information is available and for which operating profit or loss amounts are evaluated regularly by the chief operating decision maker (“CODM”) in deciding how to allocate resources and in assessing performance. The CODM does not evaluate segments using discrete asset information. Sony’s CODM is its Chief Executive Officer and President.
Sony realigned its business segments from the first quarter of the fiscal year ending March 31, 2017 to reflect a change in the
Corporate Executive Officers in charge of certain segments and modifications to the organizational structure of certain segments as of April 1, 2016. As a result of this realignment, Sony has separated the Devices segment into a Semiconductors segment and a Components segment. In addition, the operations of the automotive camera business, which were included in the Imaging Products & Solutions (“IP&S”) segment, and the operations of the Imaging Device Development Division, which were included in Corporate and elimination, are now included in the Semiconductors segment. In connection with these realignments, the sales and operating revenue and operating income (loss) of each segment for the comparable period have been reclassified to conform to the current presentation.
The Mobile Communications (“MC”) segment includes the manufacture and sale of mobile phones and an Internet-related
service business. The Game & Network Services (“G&NS”) segment includes the manufacture and sales of home gaming products, network services business and production and sales of software. The IP&S segment includes the Still and Video Cameras business. The Home Entertainment & Sound (“HE&S”) segment includes Televisions, as well as, Audio and Video. The Semiconductors segment includes the image sensors and camera modules businesses. The Components segment includes the batteries and recording media businesses. The Pictures segment includes Motion Pictures, Television Productions and Media Networks. The Music segment includes Recorded Music, Music Publishing and Visual Media and Platform. The Financial Services segment primarily represents individual life insurance and non-life insurance businesses in the Japanese market and a bank business in Japan. All Other consists of various operating activities, including, the disc overseas manufacturing business. Sony’s products and services are generally unique to a single operating segment.

- 34 -
Business segments -
Segment sales and operating revenue:
Yen in millions Three months ended June 30 2015 2016 Sales and operating revenue:
Mobile Communications - Customers 279,536 184,868 Intersegment 988 1,055
Total 280,524 185,923 Game & Network Services -
Customers 265,898 310,768 Intersegment 22,691 19,611
Total 288,589 330,379 Imaging Products & Solutions -
Customers 163,514 120,365 Intersegment 1,233 1,861
Total 164,747 122,226 Home Entertainment & Sound -
Customers 252,487 234,915 Intersegment 662 1,004
Total 253,149 235,919 Semiconductors -
Customers 150,506 118,273 Intersegment 36,859 26,157
Total 187,365 144,430 Components -
Customers 49,007 37,841 Intersegment 8,079 6,295
Total 57,086 44,136 Pictures -
Customers 171,420 183,123 Intersegment 129 194
Total 171,549 183,317 Music -
Customers 126,980 138,019 Intersegment 3,211 3,495
Total 130,191 141,514 Financial Services -
Customers 277,689 230,909 Intersegment 1,697 1,810
Total 279,386 232,719 All Other -
Customers 58,710 47,431 Intersegment 18,866 13,154
Total 77,576 60,585 Corporate and elimination (82,103) (67,949)
Consolidated total 1,808,059 1,613,199 G&NS intersegment amounts primarily consist of transactions with All Other. Semiconductors intersegment amounts primarily consist of transactions with the MC segment, the G&NS segment and the
IP&S segment. All Other intersegment amounts primarily consist of transactions with the Pictures segment, the Music segment and the G&NS
segment. Corporate and elimination includes certain brand and patent royalty income.

- 35 -
Segment profit or loss:
Yen in millions Three months ended June 30 2015 2016 Operating income (loss):
Mobile Communications (22,924) 415 Game & Network Services 19,459 44,031 Imaging Products & Solutions 17,731 7,506 Home Entertainment & Sound 10,923 20,241 Semiconductors 32,724 (43,549) Components (2,298) (4,735) Pictures (11,687) (10,640) Music 31,750 15,938 Financial Services 45,972 48,547 All Other (2,097) (2,072)
Total 119,553 75,682 Corporate and elimination (22,646) (19,490)
Consolidated operating income 96,907 56,192 Other income 54,081 5,944 Other expenses (12,278) (5,120) Consolidated income before income taxes 138,710 57,016
Operating income (loss) is sales and operating revenue less costs and expenses, and includes equity in net income (loss) of
affiliated companies. Corporate and elimination includes headquarters restructuring costs, and certain other corporate expenses, including the
amortization of certain intellectual property assets such as the cross-licensing of intangible assets acquired from Ericsson at the time of the Sony Mobile Communications acquisition, which are not allocated to segments.
Pursuant to a separation of Sony’s businesses into distinct subsidiaries and a realignment of corporate functions, beginning
from the fiscal year ending March 31, 2017, a change has been made to the method of calculating the amount of corporate costs allocated to each business segment and the amount of royalties paid by each business segment for brand and patent utilization. As a result of this change, an increase in corporate income of 6,503 million yen is included in the Corporate and elimination for the fiscal year ending March 31, 2017. Conversely, an increase (decrease) in expenses totaling the same amount is included in each of the following business segments: 653 million yen in the MC segment, (28) million yen in the G&NS segment, 816 million yen in the IP&S segment, 2,897 million yen in the HE&S segment, 772 million yen in the Semiconductors segment, 323 million yen in the Components segment, 640 million yen in the Pictures segment and 430 million yen in the Music segment. There is no change to the Financial Services segment. These changes have no impact on consolidated operating income.

- 36 -
Other Significant Items:
The following table includes a breakdown of sales and operating revenue to external customers by product category for certain
segments. Sony management views each segment as a single operating segment.
Yen in millions
Three months ended June 30 Sales and operating revenue: 2015 2016 Mobile Communications 279,536
184,868
Game & Network Services
Hardware 129,465 119,165 Network 105,801 145,558 Other 30,632 46,045
Total 265,898 310,768 Imaging Products & Solutions
Still and Video Cameras 110,050 75,529 Other 53,464 44,836
Total 163,514 120,365 Home Entertainment & Sound
Televisions 168,920 166,293 Audio and Video 81,311 68,307 Other 2,256 315
Total 252,487 234,915 Semiconductors 150,506 118,273 Components 49,007 37,841 Pictures
Motion Pictures 58,175 75,322 Television Productions 50,975 44,193 Media Networks 62,270 63,608
Total 171,420 183,123 Music
Recorded Music 89,328 89,706 Music Publishing 17,844 15,651 Visual Media and Platform 19,808 32,662
Total 126,980 138,019 Financial Services 277,689 230,909 All Other 58,710 47,431 Corporate 12,312 6,687 Consolidated total 1,808,059 1,613,199

- 37 -
In the G&NS segment, Hardware includes home and portable game consoles; Network includes network services relating to game, video and music content provided by Sony Interactive Entertainment; Other includes packaged software and peripheral devices. In the IP&S segment, Still and Video Cameras includes interchangeable lens cameras, compact digital cameras, consumer video cameras and video cameras for broadcast; Other includes display products such as projectors and medical equipment. In the HE&S segment, Televisions includes LCD televisions; Audio and Video includes Blu-ray disc players and recorders, home audio, headphones and memory-based portable audio devices. The Semiconductors segment includes image sensors and camera modules. The Components segment includes batteries and recording media. In the Pictures segment, Motion Pictures includes the worldwide production, acquisition and distribution of motion pictures and direct-to-video content; Television Productions includes the production, acquisition and distribution of television programming; Media Networks includes the operation of television and digital networks worldwide. In the Music segment, Recorded Music includes the distribution of physical and digital recorded music and revenue derived from artists' live performances; Music Publishing includes the management and licensing of the words and music of songs; Visual Media and Platform includes various service offerings for music and visual products and the production and distribution of animation titles.
Yen in millions Three months ended June 30 2015 2016 Depreciation and amortization: Mobile Communications 6,196 5,151 Game & Network Services 4,640 5,529 Imaging Products & Solutions 7,098 6,085 Home Entertainment & Sound 5,581 5,153 Semiconductors 21,950 25,306 Components 2,745 880 Pictures 5,252 4,934 Music 4,181 3,687 Financial Services, including deferred insurance acquisition costs 16,521 24,363 All Other 1,444 1,425 Total 75,608 82,513 Corporate 11,413 11,044 Consolidated total 87,021 93,557
Yen in millions
i illi
Three months ended June 30, 2015
Total net restructuring
charges
Depreciation associated with
restructured assets
Total
Restructuring charges and associated depreciation: Mobile Communications 7,737 315 8,052 Game & Network Services 15 - 15 Imaging Products & Solutions 44 - 44 Home Entertainment & Sound (57) - (57) Semiconductors (30) - (30) Components - - - Pictures 49 - 49 Music 77 - 77 Financial Services - - - All Other and Corporate 1,578 403 1,981 Consolidated total 9,413 718 10,131

- 38 -
Yen in millions i illi
Three months ended June 30, 2016
Total net
restructuring charges
Depreciation
associated with restructured assets
Total
Restructuring charges and associated depreciation: Mobile Communications 322 - 322 Game & Network Services 110 - 110 Imaging Products & Solutions 7 - 7 Home Entertainment & Sound 12 - 12 Semiconductors 3 - 3 Components - - - Pictures 835 - 835 Music 110 - 110 Financial Services - - - All Other and Corporate 346 - 346 Consolidated total 1,745 - 1,745
Depreciation associated with restructured assets as used in the context of the disclosures regarding restructuring activities refers to the increase in depreciation expense caused by revising the useful life and the salvage value of depreciable fixed assets under an approved restructuring plan. Any impairment of the assets is recognized immediately in the period it is identified.
Geographic Information -
Sales and operating revenue attributed to countries and areas based on location of external customers are as follows:
Yen in millions Three months ended June 30 Sales and operating revenue: 2015 2016 Japan 561,581 511,411 United States 352,393 353,614 Europe 367,705 345,517 China 130,701 109,073 Asia-Pacific 238,947 191,670 Other Areas 156,732 101,914 Total 1,808,059 1,613,199
Major countries and areas in each geographic segment excluding Japan, United States and China are as follows: (1) Europe: United Kingdom, France, Germany, Russia, Spain and Sweden (2) Asia-Pacific: India, South Korea and Oceania (3) Other Areas: The Middle East/Africa, Brazil, Mexico and Canada There are no individually material countries with respect to sales and operating revenue included in Europe, Asia-Pacific and
Other Areas. Transfers between reportable business segments or geographic areas are made at amounts which Sony’s management believes
approximate arms-length transactions. There were no sales and operating revenue with any single major external customer for the three months ended June 30, 2015
and 2016.

- 39 -
9. Subsequent events
On July 28, 2016, Sony and Murata Manufacturing Co., Ltd. (“Murata”) announced that they have entered into a non-binding memorandum of understanding that confirms their intent to negotiate the transfer of the Sony Group’s battery business to the Murata Group (the “Transfer”). Sony and Murata will aim to execute binding definitive agreements, following further due diligence and negotiation of the detailed terms and conditions of the Transfer. There is a possibility that Sony will record a loss related to such Transfer if it signs binding definitive agreements with Murata, depending on the content of such agreements.

- 40 -
(2) Other Information
(1) Dividends declared
A year-end dividend for Sony Corporation’s common stock was approved at the Board of Directors meeting held on April 28, 2016 as below:
1. Total amount of year-end cash dividends:
12,614 million yen 2. Amount of year-end cash dividends per share:
10.00 yen 3. Payment date:
May 31, 2016 Year-end cash dividends for the fiscal year ended March 31, 2016 have been incorporated in the consolidated financial statements for the fiscal year ended March 31, 2016.
Note: Year-end cash dividends were distributed to the shareholders recorded or registered as the holders or pledgees of shares in Sony Corporation’s register of shareholders at the end of March 31, 2016.
(2) Litigation
In October 2009, Sony Corporation’s U.S. subsidiary, Sony Optiarc America Inc., received a subpoena from the U.S. Department of Justice (“DOJ”) seeking information about its optical disk drive business. Sony understands that the European Commission and certain other governmental agencies outside the United States also opened investigations of competition in the optical disk drives market. In March 2014, the DOJ notified Sony that it had closed its investigation. In October 2015, the European Commission adopted a decision in which it fined Sony Corporation, its subsidiary in Japan, Sony Optiarc Inc., and two other subsidiaries 31 million euros. In December 2015, Sony filed an appeal with the European Union’s General Court. Sony understands that the investigations by several other agencies have now ended, but one other agency continues to investigate. A number of direct and indirect purchaser lawsuits, including class actions, have been filed in certain jurisdictions, including the United States, in which the plaintiffs alleged that Sony Corporation and certain of its subsidiaries violated antitrust laws and sought recovery of damages and other remedies. Certain of these lawsuits have reached a settlement, including the class action brought by the direct purchasers in the United States, which has received court approval. In addition, a proposed settlement of the class action brought by the indirect purchasers in the United States is pending court approval. However, certain other lawsuits continue. Based on the stage of the remaining investigation and cases, it is not possible to estimate the amount of losses or range of possible losses, if any, that might ultimately result from adverse judgments, settlements or other resolution of all of these matters.
In May 2011, Sony Corporation’s U.S. subsidiary, Sony Electronics Inc., received a subpoena from the DOJ Antitrust Division
seeking information about its secondary batteries business. Sony understands that the European Commission and certain other governmental agencies outside the United States also opened investigations of competition in the secondary batteries market. The DOJ has notified Sony that it has closed its investigation, but the European Commission and one other agency continue to investigate. A number of direct and indirect purchaser lawsuits, including class actions, have been filed in certain jurisdictions, including the United States, in which the plaintiffs allege that Sony Corporation and certain of its subsidiaries violated antitrust laws and seek recovery of damages and other remedies. Although certain of these lawsuits have reached a settlement, including the class actions brought by the direct purchasers and the indirect purchasers in the United States, the proposed settlements of which are pending court approvals, other lawsuits continue. Based on the stage of the remaining investigations and cases, it is not possible to estimate the amount of losses or range of possible losses, if any, that might result from adverse judgments, settlements or other resolution of all of these matters.
A Sony subsidiary outside Japan is subject to a non-Japanese customs investigation in connection with the import and export
of certain HE&S products. Sony is cooperating with the relevant government authorities. Based on the stage of this investigation and information currently available, it is not possible to estimate the amount of losses or range of possible losses, if any, that might ultimately result from adverse judgments, settlements or other resolution of this investigation.
In addition, Sony Corporation and certain of its subsidiaries are defendants or otherwise involved in other pending legal and regulatory proceedings. However, based upon the information currently available, Sony believes that the outcome from such legal and regulatory proceedings would not have a material impact on Sony’s results of operations and financial position.
Related Documents


![Quarterly Securities Report...1 [Cover] [Document Filed] Quarterly Securities Report (“Shihanki Hokokusho”) [Applicable Law] Article 24-4-7, Paragraph 1 of the Financial Instruments](https://static.cupdf.com/doc/110x72/5f9c37c2f2766b0bbf4ff3c8/quarterly-securities-report-1-cover-document-filed-quarterly-securities.jpg)