CASE STUDY Quantitative risk management in gas injection project: a case study from Oman oil and gas industry Mohammad Miftaur Rahman Khan Khadem 1 • Sujan Piya 1 • Ahm Shamsuzzoha 1 Received: 3 November 2016 / Accepted: 15 September 2017 / Published online: 22 September 2017 Ó The Author(s) 2017. This article is an open access publication Abstract The purpose of this research was to study the recognition, application and quantification of the risks associated in managing projects. In this research, the management of risks in an oil and gas project is studied and implemented within a case company in Oman. In this study, at first, the qualitative data related to risks in the project were identified through field visits and extensive interviews. These data were then translated into numerical values based on the expert’s opinion. Further, the numer- ical data were used as an input to Monte Carlo simulation. RiskyProject Professional TM software was used to simulate the system based on the identified risks. The simulation result predicted a delay of about 2 years as a worse case with no chance of meeting the project’s on stream date. Also, it has predicted 8% chance of exceeding the total estimated budget. The result of numerical analysis from the proposed model is validated by comparing it with the result of qualitative analysis, which was obtained through dis- cussion with various project managers of company. Keywords Risk analysis Á Quantitative analysis Á Project management Á Monte Carlo simulation Introduction Risk can be defined depending on application domain (Wang et al. 2004). For example, in case of business domain risk is defined as the probability of successful outcomes. On the other hand, in project domain it is defined as the suc- cessful completion of a project within the predefined timeframe and cost (Ward and Chapman 2003; Perminova et al. 2008). According to Project Management Institute (PMI 1996), risk is defined as ‘‘an uncertain event or con- dition that, if it occurs, has a positive (opportunity) or negative (threat) impact on project objectives’’. Since pro- jects are subjected to uncertainties either due to external or internal factors, risk management is needed to reduce the probability of occurrence and/or the negative impact of risky events (Fan et al. 2008). In terms of uncertainties, risks are categorized from low, medium, and high, depending on the overall impact of risks. Tah and Carr (2001) described risks based on a hierarchical risk breakdown structure, where generic risks and remedial actions can be stored in catalogues. From a quantitative point of view, risk is treated using countermeasures to reduce either the likelihood or consequence of a risk or defer the risk to some third party (e.g. insurance). In order to implement a countermeasure of risk there must be a balance against associated cost and the expected utility of implementing the measure (Aggarwal and Ganeshan 2007; Vose 2008). There might also be a possibility that countermeasures of risks can expose addi- tional risks or retail residual risk that need to be considered as well (Trkman and McCormack 2009). This process should improve risk sensitivity and awareness. Risk management in an industrial establishment is a systematic process that is executed according to manufac- turer’s own policies and best practices. The process has a major role in understanding the cause–effect relations & Mohammad Miftaur Rahman Khan Khadem [email protected] 1 Department of Mechanical and Industrial Engineering, Sultan Qaboos University, Al Khod, PO Box 33, 123 Muscat, Sultanate of Oman 123 J Ind Eng Int (2018) 14:637–654 https://doi.org/10.1007/s40092-017-0237-3

Welcome message from author
This document is posted to help you gain knowledge. Please leave a comment to let me know what you think about it! Share it to your friends and learn new things together.
Transcript
CASE STUDY
Quantitative risk management in gas injection project: a casestudy from Oman oil and gas industry
Mohammad Miftaur Rahman Khan Khadem1• Sujan Piya1 • Ahm Shamsuzzoha1
Received: 3 November 2016 / Accepted: 15 September 2017 / Published online: 22 September 2017
� The Author(s) 2017. This article is an open access publication
Abstract The purpose of this research was to study the
recognition, application and quantification of the risks
associated in managing projects. In this research, the
management of risks in an oil and gas project is studied and
implemented within a case company in Oman. In this
study, at first, the qualitative data related to risks in the
project were identified through field visits and extensive
interviews. These data were then translated into numerical
values based on the expert’s opinion. Further, the numer-
ical data were used as an input to Monte Carlo simulation.
RiskyProject ProfessionalTM software was used to simulate
the system based on the identified risks. The simulation
result predicted a delay of about 2 years as a worse case
with no chance of meeting the project’s on stream date.
Also, it has predicted 8% chance of exceeding the total
estimated budget. The result of numerical analysis from the
proposed model is validated by comparing it with the result
of qualitative analysis, which was obtained through dis-
cussion with various project managers of company.
Keywords Risk analysis � Quantitative analysis � Projectmanagement � Monte Carlo simulation
Introduction
Risk can be defined depending on application domain
(Wang et al. 2004). For example, in case of business domain
risk is defined as the probability of successful outcomes. On
the other hand, in project domain it is defined as the suc-
cessful completion of a project within the predefined
timeframe and cost (Ward and Chapman 2003; Perminova
et al. 2008). According to Project Management Institute
(PMI 1996), risk is defined as ‘‘an uncertain event or con-
dition that, if it occurs, has a positive (opportunity) or
negative (threat) impact on project objectives’’. Since pro-
jects are subjected to uncertainties either due to external or
internal factors, risk management is needed to reduce the
probability of occurrence and/or the negative impact of
risky events (Fan et al. 2008). In terms of uncertainties, risks
are categorized from low, medium, and high, depending on
the overall impact of risks. Tah and Carr (2001) described
risks based on a hierarchical risk breakdown structure,
where generic risks and remedial actions can be stored in
catalogues. From a quantitative point of view, risk is treated
using countermeasures to reduce either the likelihood or
consequence of a risk or defer the risk to some third party
(e.g. insurance). In order to implement a countermeasure of
risk there must be a balance against associated cost and the
expected utility of implementing the measure (Aggarwal
and Ganeshan 2007; Vose 2008). There might also be a
possibility that countermeasures of risks can expose addi-
tional risks or retail residual risk that need to be considered
as well (Trkman and McCormack 2009). This process
should improve risk sensitivity and awareness.
Risk management in an industrial establishment is a
systematic process that is executed according to manufac-
turer’s own policies and best practices. The process has a
major role in understanding the cause–effect relations
& Mohammad Miftaur Rahman Khan Khadem
1 Department of Mechanical and Industrial Engineering, Sultan
Qaboos University, Al Khod, PO Box 33, 123 Muscat,
Sultanate of Oman
123
J Ind Eng Int (2018) 14:637–654
https://doi.org/10.1007/s40092-017-0237-3
between risks and their accompanied operations (Miller
1990; Narasimhan and Talluri 2009; Balasubramanian
et al. 2011). It can be both pro-active, where probability of
occurrence is lowered by some managerial procedures, and
reactive that reacts immediately by the management pro-
cedures aiming to minimize negative impact after the risk
has occurred. The occurrence of a risk usually changes over
time due to which monitoring activity of risk needs to be
realized (Raz and Michael 2001; Patterson and Neailey
2002). The management of risk includes the total process
of identifying, controlling and minimizing the impact of
uneven or uncertain events. According to Westney (2001),
basically, risk management process involves four different
phases such as Risk identification, Risk assessment, Risk
analysis and Risk mitigation. In the risk identification
phase, the risks that may affect the project objectives are
identified and their characteristics are determined. The
impact of the identified risks is determined during the risk
assessment phase. In the risk analysis phase, risk is ana-
lyzed by estimating the likelihood of the event occurring
and the consequence of the event if it occurs. The last
phase is risk mitigation phase and it starts by reviewing the
results of the risk analysis to determine the highest priority
risks for mitigation. However, most of the researchers on
risk management have focused on risk identification and
analysis phase (Kirkire et al. 2015).
Out of the four different phases as discussed above, risk
analysis phase is of prime importance. The objective of risk
analysis phase is to prioritize the identified risks and to
provide data to assist in the evaluation and treatment of
risks. In risk analysis process, there is a need of systematic
use of available information to determine how often
specified events may occur and the magnitude of their
consequences (Ramos and Veiga 2011; Smith 2009). This
process can be both qualitative, semi-qualitative, quanti-
tative or combination of any three. Qualitative risk analysis
generally involves assessing a situation by instinct. On the
other hand, quantitative risk analysis attempts to assign
numeric values of risks, either by using empirical data or
by quantifying qualitative assessments (Palisade 2016).
Risk analysis method that is based on systems and proba-
bility are generally designed for cases in which sufficient
failure statistics are unavailable (Selvik and Aven 2011;
Mahmood et al. 2011).
This research is motivated by the fact that currently the
common methods applied in organizations to analyze risks
are mostly deterministic or qualitative, which are overly
simplified, or inconsistent in application and assumption.
Such inconsistency makes them unreliable or impractical.
It is a universal fact that there is no project without
uncertain events. Under uncertainty, we are confronted
with the lack of data and information such that determin-
istic approach cannot truly calculate the risk involved
(Khalaj et al. 2013). Also, it has been observed that many
organizations refrain from applying quantitative risk anal-
ysis method due to the lack of knowledge of using it and
the benefits such an analysis can add to their projects.
Moreover, it has been observed that in many projects,
project schedule and cost estimation are treated as separate,
isolated system. Therefore, there is a need for compre-
hensive and reliable stochastic quantitative risk analysis
method that can be applied in projects to analyze risks and
manage them. Applying such method will enable project
managers in the real world to make decisions in a more
effective and efficient way. Therefore, this research study
identified three research questions that are answered during
the execution of this research.
• Research question 1: What risk factors impact project
the most and why?
• Research question 2: How the risks and uncertainty can
be quantified and managed in project planning?
• Research question 3: How simulation model can help in
quantifying and managing risk in a project
environment?
The remaining portion of the paper is structured as
follows: ‘‘Literature review’’ reviews the research that has
been carried out in this area in the past. ‘‘Research
methodology’’ discusses the methodology that has been
followed in the execution of this research work. ‘‘Risk
management: perspective from quantitative risk analysis’’
discusses the risk management from the perspective of
quantitative risk analysis. ‘‘A case study’’ is dedicated to
the case study. ‘‘Managerial implications’’ highlights the
managerial insights drawn from the research. The paper
concludes with future research directions in ‘‘Conclusions
and recommendations’’.
Literature review
The success and failure of project mostly depends on the
perceptions of its stakeholders (Bourne and Walker 2008).
Project manager needs to manage both the expectations and
perceptions of its stakeholders within the capacities and
capabilities. Success in project is an ambiguous, inclusive
and multidimensional concept and its performance is
measured to a specific context (Ika et al. 2010). Due to
globalized project environment, there are increasing con-
cerns to managing associated risks in order to fulfill project
objectives (Artto et al. 2008). There still lacks addressing
of risks arising from organizations involved in project
networks (Chapman and Ward 2002, 2003; Ward and
Chapman 2003).
In project management context, risk is organized at the
highest level of management, with a global vision (Suslick
638 J Ind Eng Int (2018) 14:637–654
123
and Schiozer 2004; Aven and Vinnem 2005). It is often
scaled as positive (business opportunities) or negative
(operational hazards or threats) and can be external risks
(customers’ demands, market competition, suppliers, gov-
ernment actions, environmental protections, etc.) and
internal risks (products, resources, processes, new tech-
nology, etc.). Different approaches are often considered by
the manufacturers to mitigate probable risk such as iden-
tification, scaling, ranking and prioritization. These miti-
gation plans are stored in the knowledge base that is made
available for future use (Miller and Waller 2003).
With respect to project-based risk management perspec-
tive, it is important to quantifying associated risks in terms of
their detrimental effects on projects performances. This
quantification allows defining the possibility of deviation in
the results from the expected goals. It also helps managers to
estimate quantitatively the potential risk level of a project
before necessary resources are allocated. In order to quantify
the risk, it is necessary to collect assessment information to
build a risk estimationmodel for project-based business. The
manager has to make significant effort to align risk with the
organizational strategic decision in order to steer the project.
At the same time, risks that are confronted during the course
of the project can be managed most expeditiously with clear
top management commitment. In order to have successful
risk management effort in projects, upper management must
communicate to the affected project units, motivate move-
ment and step in to resolve differences that caused risks.
It is critical to manage the multifaceted risks in any
kinds of projects in order not only to be secured but also to
make profit. Several risk management frameworks in pro-
jects are available. Miller (1992) presented a framework for
categorizing the uncertainties as are faced by the compa-
nies and highlights risk management responses from both
financial and strategic point of views. Zhang et al. (2010)
proposed an information risk management framework for
better understanding within the business domain of cloud
computing. This framework supports identifying a threat in
cloud computing environment and to identifying vulnera-
bility. Wang et al. (2010) proposed a new risk management
framework that aligns project risk management with
respect to research and development and performance
measurement perspectives. A balanced scorecard method is
used to identify the risks and performance measures within
R&D based organizations. Various risk management
frameworks and their outcomes can be summarized as in
Table 1 below.
From the literature review, it is noticed that extensive
works have been done to managing risk in project business;
however, little researches are done on quantifying risks
associated in managing projects. From this literature
review, it is also revealed that quantification of risk factors
is not widely used due to lack of knowledge and
requirement of extensive effort. This research gap is
explored within the scope of this research, wherein iden-
tification, analysis, quantification and management of
identified risks in oil and gas industry project are high-
lighted through Monte Carlo simulation and RiskyProject
ProfessionalTM software.
Research methodology
According to Pinsonneault and Kraemer (1993), survey
method is appropriate if the research has to answer the
questions about what and how. Therefore, in this research,
we use a survey method as a research instrument. Extensive
field visits to oil and gas companies have been carried out
to collect information’s that are pertinent to the scope of
this research. However, before the field visits, extensive
literature reviews were carried out to understand risk
management procedure. It covers review of literatures on
risks management in general, as well as, risk management
in a specific industries ranging from construction project to
IT industry. During the field visit, one-to-one interviews
with the participants as well as group discussions were
carried out to understand the system or project under
consideration and the risks associated with it. Here, it
should be noted that the risks are either related to the
deadline or to the cost which constitutes two major con-
cerns related to any project. The field visit has been carried
out in an oil and gas industry that exists in Oman and the
participants in the survey vary from project managers and
other engineers working in the project. Table 2 below
shows the number of participants and their designation.
Survey helps to identify the associated risks and the
extent to which it will impact the project. The qualitative
information obtained through survey was further translated
into quantitative data based on expert’s opinion. For the
purpose, a number of brainstorming sessions with the
experts were conducted. Monte Carlo simulation is used in
this research as a quantitative risks analysis technique.
These quantitative data, in the form of probability, were fed
as an input to Monte Carlo simulation to simulate the
system. RiskyProject ProfessionalTM software was used as
a platform for the simulation and to get the output for the
system analysis.
Risk management: perspective from quantitativerisk analysis
The traditional approach in risk analysis was to break down
the problem or the risk into smaller simplified components
and analyze them in relative isolation. However, this
approach does n’t effectively represent the real life
J Ind Eng Int (2018) 14:637–654 639
123
interactions (Lewis et al. 2004). Komlosi (2001) briefly
described the development of risk analysis techniques in oil
and gas industry. These methods were started to be very
basic and simple like the 1/3 rule. Later, deterministic
approaches and various indices like profitability index and
internal rate of return were introduced to the decision
making process. However, there was a need for a technique
that will look into uncertainties. At the beginning the
models were developed by increasing or decreasing a key
parameter by a certain percentage and see the impact on the
outcome. Unfortunately, such an approach usually fails to
effectively model realistic scenario. This warrants the need
for a stochastic method to manage various input parameters
as probability variables. According to Kirchsteiger (1999)
probabilistic approach has many advantages over the
deterministic approach.
A number of tools have been used to run stochastic risk
analysis such as Bayesian theory, Monte Carlo analysis,
fuzzy set theory and four moments methods (Jouandou
2009). Monte Carlo simulation is considered as one of the
most recommended quantitative risk analysis techniques
for analyzing cost and schedule risks (Lewis 2010).
Monte Carlo simulation
Monte Carlo simulation performs risk analysis by building
models of possible results by substituting a range of val-
ues—a probability distribution—for any factor that has
inherent uncertainty. It then calculates results over and
over, each time using a different set of random values from
the probability functions. Depending upon the number of
uncertainties and the ranges specified for them, a Monte
Carlo simulation could involve thousands or tens of thou-
sands of recalculations before it produces distributions of
possible outcome values (Chou 2011).
Table 1 Various risk management frameworks with their contributions
Serial
no.
Contributing
author(s)
Framework type Fundamental contributions
1. Jaafari (2001) Risk analysis to strategy-
based project management
It is mentioned that risks evaluation should be based not only on delivering
projects but also on crafting, developing and operating
2. Trkman and
McCormack
(2009)
Supply chain risk
management
It indicated that supply chain risk can be mitigated based on suppliers
characteristics, performances and the business environment
3. Pettit et al. (2010) Supply chain resilience This research suggested that supply chain resilience can be assessed with respect
to vulnerabilities and capabilities of firms
4. Giannkis and Louis
(2011)
Multi-agent based supply
chain risk management
It proposed a multi-agent based decision support system for managing
disruptions and risks in manufacturing supply chain
5. Bosch-Rekveldt
et al. (2011)
Characterizing project
complexity
It is recommended that complexity of projects can be managed through assessing
the front-end complexity of engineering projects
6. Alhawari et al.
(2012)
Knowledge-based risk
management
It contributed by providing a method for employing knowledge-based risk
management to keep organizations competitive within business environment
7. Marcelino-Sadaba
et al. (2014)
Methodology for project risk
management
A risk management method is outlined based on project risk management
including simple tools, templates and risk checklists
8. Yildiz et al. (2014) Knowledge-based risk
mapping
A knowledge-based risk mapping tool is presented for systematically assessing
risks in global construction projects
9. Aqlan and Lam
(2015)
Fuzzy-based supply chain
risk assessment
It presented a framework to identify risks based on experts knowledge, historical
data and supply chain structure
10 Javani and
Rwelamila (2016)
Risk management in IT
projects
This research emphasized on managing risk as a knowledge base and developing
a formal and systematic approach to mitigate risks
11. Giannakis and
Papadopoulos
(2016)
Risk management for supply
chain sustainability
This research highlights an operational perspective of supply chain sustainability
through considering a risk management process in an integrated way
Table 2 Participants in the interview and group discussion
Serial no. Designation Number
1 Project managers 2
2 Planning engineer 1
3 Rotating equipment engineer 1
4 Process engineer 2
5 Mechanical engineer 1
6 Safety engineer 2
7 Pipeline engineer 1
8 Operation engineer 1
640 J Ind Eng Int (2018) 14:637–654
123
The use of Monte Carlo simulation provides number of
advantages over the use of deterministic analysis and the
other probabilistic tools such asthe following:
• The outcomes specify which event could happen and its
probability of occurrence.
• Easy to represent the data in graphical form.
• Easy to run sensitivity analysis and determine which
variable has the significant impact on the outcome.
• Allows modeling the dependency between input
variables.
• Predicts the degree of project success.
Therefore, Monte Carlo simulation has been selected as
a tool to perform risk analysis on project cost and schedule
in this research through a case study.
Project cost risk analysis
In cost risk analysis, the likelihood of cost deviation
against estimates is determined. Some of the reasons for
deviation are as follows:
• The estimate is unrealistic and low.
• A management decision to reduce bid price.
• Uncontrolled increase in scope of work.
• Unforeseen technical difficulties and schedule delays.
The cost risk analysis is done by using cost estimation
model, which starts with breaking down cost items into a
manageable level, usually in break down structure. Prob-
ability distribution is then estimated for each cost item to
accommodate uncertainty. Finally, the distributions are
combined to determine the probability distribution for the
total cost.
Project schedule risk analysis
In schedule risk analysis, the likelihood of missing the
deadline against estimates is determined. The risks in
project schedule can be due to the following reasons:
• Project is complex and involves many different parties
(contractors, suppliers and so on).
• Inadequate knowledge of the work to be performed
resulting in optimistic schedule.
• Lack of adequate float or management reserve.
• Uncontrolled increase in scope of work.
Similar to the cost estimate model, the probability dis-
tribution for each schedule item is determined. The output
of the model is a cumulative distribution that estimates the
expected duration of the project and the likelihood of
exceeding certain schedule length.
A case study
Background
As a source of non-renewable energy, oil and gas are
considered as extremely valuable resources for many
countries whose economy rely mainly on petroleum (Es-
maeili et al. 2015). The selected case study is for a gas
injection project carried out by an oil and gas company in
one of the oil fields in the Sultanate of Oman. Basically,
production rate of oil from oil well will be at its peak in the
beginning of the production cycle. However, slowly the
production rate will start diminishing. At that instance, to
enhance oil recovery from oil and natural gas wells, sec-
ondary production methods were employed. Gas injection
is one of those methods and is widely used in oil and gas
industry.
The project’s nature is risky as it involves processing
very toxic fluids at high pressure. In addition of being
toxic, the gas is highly corrosive. This toxicity and corro-
siveness is due to the high concentrations of H2S and CO2.
In addition to the highly risky nature of the processed fluid,
the proposed facilities are to be constructed in brown field,
i.e. to be installed within the existing facility adding
complexity to the construction activity. The scope of the
gas injection project includes installing the following units:
• Gas dehydration unit through the use of Tri-Ethylene
Glycol (TEG). The unit will dehydrate injection gas to
reduce the water content and hence minimize the use of
corrosion resistance alloys (CRA) as material of
construction.
• High-pressure injection compressor to boost the dehy-
drated gas pressure to the required injection pressure set
by the reservoir engineers.
• High-pressure transport system consisting of high-
pressure pipeline transferring injected gas from the
compressor discharge to the injection wellhead.
• Gas injection wells.
• Piping modification within the existing facility.
• Providing the required utilities.
Risk analysis model
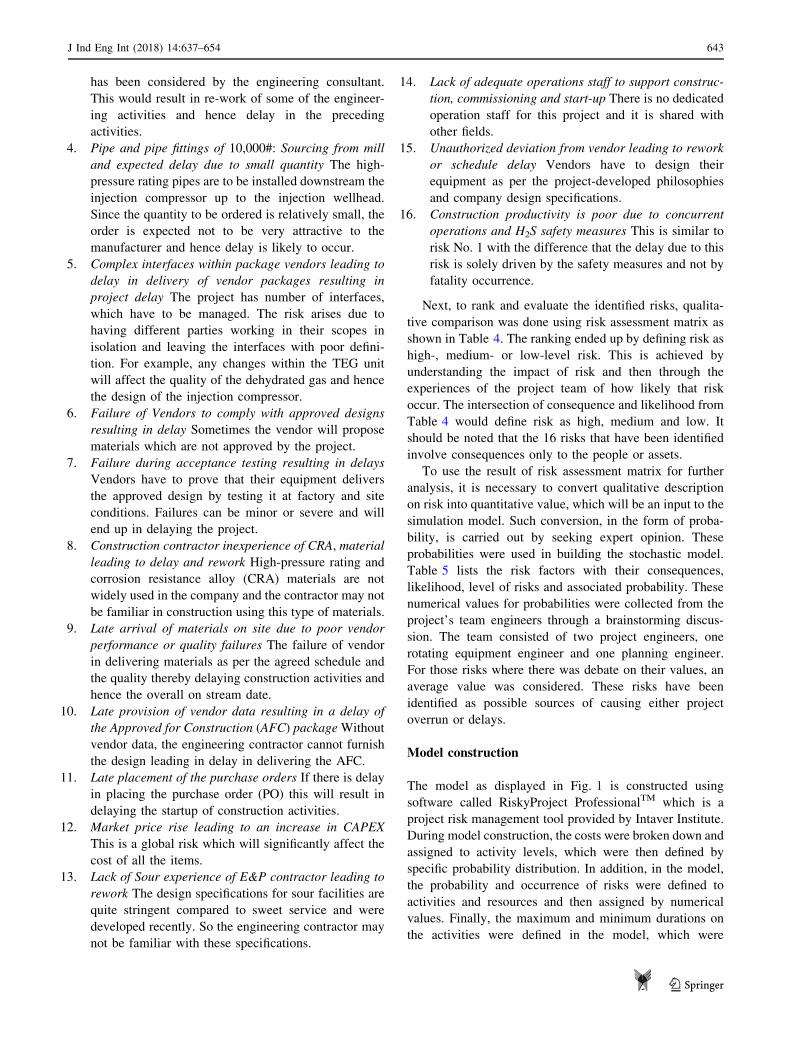
Figure 1 presents the flow chart of the process followed in
this study in an attempt to manage risk within the project.
From Fig. 1, it is seen that the process flow chart consists
of four components, namely company input, model con-
struction, running simulation and then results. Details of
the flow chart are explained below.
J Ind Eng Int (2018) 14:637–654 641
123
Company input
Cost estimate
The project cost estimate was developed by the company
cost-engineering department based on the company data-
base. The project’s cost estimate includes base cost, con-
tingency cost, cost to cushion the effect of future market
condition and escalation. Table 3 summarizes the main
items in the cost estimate:
Project schedule
The project team’s planning engineer with the input from
the project engineer has prepared the project’s schedule. At
this stage of the project, level 4 schedule has been pre-
pared. However, for the objective of this study, level 3 has
been used as level 4 is very detailed and covers over 1700
activity.
Risk register
Basically, risk register consists of brief description about
the risks associated with the project, its likelihood and
impact on the project. Risk register may be qualitative or it
may be quantitative. Qualitative risk register is the one
where the likelihood of occurrence of risk are estimated by
ranking them as ‘‘high’’ to ‘‘low’’. On the other hand, if the
likelihood of occurrence is put in the form of probabilistic
number then it is known as quantitative risk register. In this
research both qualitative as well as quantitative analysis
has been carried out. Risk register starts with the identifi-
cation of risk.
Risk identification
The risks involved in the project under consideration were
identified through field visit, interview with the workers
and consultation with site engineers. Also, project team
was requested to brainstorm all the potential risk factors.
Following 16 factors were identified as the risks involved
in this project that leads to cost overrun or delay in the
schedule or both of them.
1. Working adjacent to existing live plant leading to
exposure to high H2S gas The high H2S content in the
processed gas adds complexity to the construction
activities, as it requires limiting the capacity of the
construction crew, trained crew with safety procedures
and longer shutdown durations. In addition to the
delay, fatality may occur due to H2S exposure.
2. Lack of installation and commissioning spares leads to
delay in start-up In many instances, ordering spares
parts is overlooked or due to transport/storage, they are
lost resulting in delays.
3. Footprint specified in the plot plan is not met by the
package Vendors resulting in delay in Engineering
Sometimes there is a mismatch between footprint area
specified by the equipment vendor and between what
Company Input ResultsRunning
SimulationModel
Construction
Level threeschedule
Cost estimate
• Breaking cost• Assigning cost items to
activities• Defining probability
distribution for each cost item
RunningMonte Carlo simulation
usingRiskyProject
Analyzingresults
Risk register(Qualitative)
• Assigning numerical valuesfor probability of occuranceand impact for the risksimpacting cost\schedule
• Assigning risks to activitiesand resources
• Defining max\min duration for each activity
• Defining probabilitydistribution for each activity
Fig. 1 Process flowchart
Table 3 Project’s cost estimation
Item description Cost, million USD
Bases estimate 99.7
Future market condition 3.70
Contingency 13.37
Escalation 4.25
Total 121.02
642 J Ind Eng Int (2018) 14:637–654
123
has been considered by the engineering consultant.
This would result in re-work of some of the engineer-
ing activities and hence delay in the preceding
activities.
4. Pipe and pipe fittings of 10,000#: Sourcing from mill
and expected delay due to small quantity The high-
pressure rating pipes are to be installed downstream the
injection compressor up to the injection wellhead.
Since the quantity to be ordered is relatively small, the
order is expected not to be very attractive to the
manufacturer and hence delay is likely to occur.
5. Complex interfaces within package vendors leading to
delay in delivery of vendor packages resulting in
project delay The project has number of interfaces,
which have to be managed. The risk arises due to
having different parties working in their scopes in
isolation and leaving the interfaces with poor defini-
tion. For example, any changes within the TEG unit
will affect the quality of the dehydrated gas and hence
the design of the injection compressor.
6. Failure of Vendors to comply with approved designs
resulting in delay Sometimes the vendor will propose
materials which are not approved by the project.
7. Failure during acceptance testing resulting in delays
Vendors have to prove that their equipment delivers
the approved design by testing it at factory and site
conditions. Failures can be minor or severe and will
end up in delaying the project.
8. Construction contractor inexperience of CRA, material
leading to delay and rework High-pressure rating and
corrosion resistance alloy (CRA) materials are not
widely used in the company and the contractor may not
be familiar in construction using this type of materials.
9. Late arrival of materials on site due to poor vendor
performance or quality failures The failure of vendor
in delivering materials as per the agreed schedule and
the quality thereby delaying construction activities and
hence the overall on stream date.
10. Late provision of vendor data resulting in a delay of
the Approved for Construction (AFC) packageWithout
vendor data, the engineering contractor cannot furnish
the design leading in delay in delivering the AFC.
11. Late placement of the purchase orders If there is delay
in placing the purchase order (PO) this will result in
delaying the startup of construction activities.
12. Market price rise leading to an increase in CAPEX
This is a global risk which will significantly affect the
cost of all the items.
13. Lack of Sour experience of E&P contractor leading to
rework The design specifications for sour facilities are
quite stringent compared to sweet service and were
developed recently. So the engineering contractor may
not be familiar with these specifications.
14. Lack of adequate operations staff to support construc-
tion, commissioning and start-up There is no dedicated
operation staff for this project and it is shared with
other fields.
15. Unauthorized deviation from vendor leading to rework
or schedule delay Vendors have to design their
equipment as per the project-developed philosophies
and company design specifications.
16. Construction productivity is poor due to concurrent
operations and H2S safety measures This is similar to
risk No. 1 with the difference that the delay due to this
risk is solely driven by the safety measures and not by
fatality occurrence.
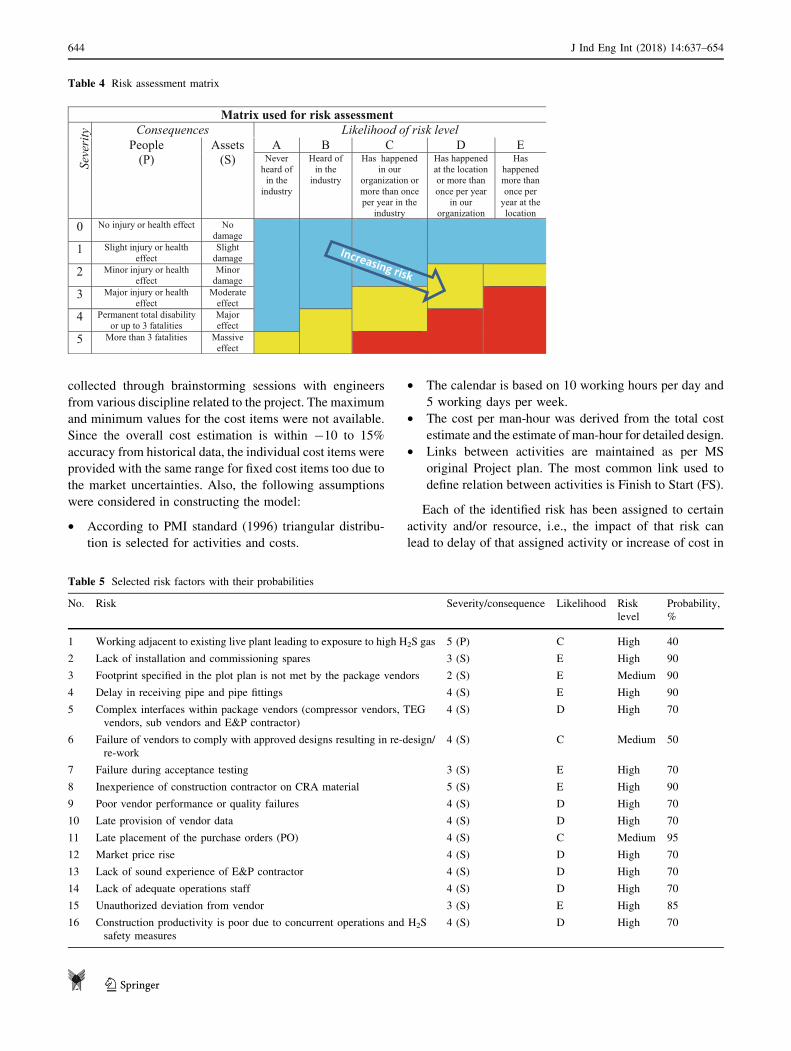
Next, to rank and evaluate the identified risks, qualita-
tive comparison was done using risk assessment matrix as
shown in Table 4. The ranking ended up by defining risk as
high-, medium- or low-level risk. This is achieved by
understanding the impact of risk and then through the
experiences of the project team of how likely that risk
occur. The intersection of consequence and likelihood from
Table 4 would define risk as high, medium and low. It
should be noted that the 16 risks that have been identified
involve consequences only to the people or assets.
To use the result of risk assessment matrix for further
analysis, it is necessary to convert qualitative description
on risk into quantitative value, which will be an input to the
simulation model. Such conversion, in the form of proba-
bility, is carried out by seeking expert opinion. These
probabilities were used in building the stochastic model.
Table 5 lists the risk factors with their consequences,
likelihood, level of risks and associated probability. These
numerical values for probabilities were collected from the
project’s team engineers through a brainstorming discus-
sion. The team consisted of two project engineers, one
rotating equipment engineer and one planning engineer.
For those risks where there was debate on their values, an
average value was considered. These risks have been
identified as possible sources of causing either project
overrun or delays.
Model construction
The model as displayed in Fig. 1 is constructed using
software called RiskyProject ProfessionalTM which is a
project risk management tool provided by Intaver Institute.
During model construction, the costs were broken down and
assigned to activity levels, which were then defined by
specific probability distribution. In addition, in the model,
the probability and occurrence of risks were defined to
activities and resources and then assigned by numerical
values. Finally, the maximum and minimum durations on
the activities were defined in the model, which were
J Ind Eng Int (2018) 14:637–654 643
123
collected through brainstorming sessions with engineers
from various discipline related to the project. The maximum
and minimum values for the cost items were not available.
Since the overall cost estimation is within -10 to 15%
accuracy from historical data, the individual cost items were
provided with the same range for fixed cost items too due to
the market uncertainties. Also, the following assumptions
were considered in constructing the model:
• According to PMI standard (1996) triangular distribu-
tion is selected for activities and costs.
• The calendar is based on 10 working hours per day and
5 working days per week.
• The cost per man-hour was derived from the total cost
estimate and the estimate of man-hour for detailed design.
• Links between activities are maintained as per MS
original Project plan. The most common link used to
define relation between activities is Finish to Start (FS).
Each of the identified risk has been assigned to certain
activity and/or resource, i.e., the impact of that risk can
lead to delay of that assigned activity or increase of cost in
Table 4 Risk assessment matrix
Matrix used for risk assessment
Seve
rity Consequences Likelihood of risk level
People(P)
Assets (S)
A B C D ENever
heard of in the
industry
Heard of in the
industry
Has happened in our
organization or more than once per year in the
industry
Has happened at the location or more than once per year
in our organization
Has happened more than once per
year at the location
0 No injury or health effect No damage
1 Slight injury or health effect
Slight damage
2 Minor injury or health effect
Minor damage
3 Major injury or health effect
Moderate effect
4 Permanent total disability or up to 3 fatalities
Major effect
5 More than 3 fatalities Massive effect
Table 5 Selected risk factors with their probabilities
No. Risk Severity/consequence Likelihood Risk
level
Probability,
%
1 Working adjacent to existing live plant leading to exposure to high H2S gas 5 (P) C High 40
2 Lack of installation and commissioning spares 3 (S) E High 90
3 Footprint specified in the plot plan is not met by the package vendors 2 (S) E Medium 90
4 Delay in receiving pipe and pipe fittings 4 (S) E High 90
5 Complex interfaces within package vendors (compressor vendors, TEG
vendors, sub vendors and E&P contractor)
4 (S) D High 70
6 Failure of vendors to comply with approved designs resulting in re-design/
re-work
4 (S) C Medium 50
7 Failure during acceptance testing 3 (S) E High 70
8 Inexperience of construction contractor on CRA material 5 (S) E High 90
9 Poor vendor performance or quality failures 4 (S) D High 70
10 Late provision of vendor data 4 (S) D High 70
11 Late placement of the purchase orders (PO) 4 (S) C Medium 95
12 Market price rise 4 (S) D High 70
13 Lack of sound experience of E&P contractor 4 (S) D High 70
14 Lack of adequate operations staff 4 (S) D High 70
15 Unauthorized deviation from vendor 3 (S) E High 85
16 Construction productivity is poor due to concurrent operations and H2S
safety measures
4 (S) D High 70
644 J Ind Eng Int (2018) 14:637–654
123
the assigned resource or influence both. While entering the
data in the risk register, the following assumptions have
been considered:
• The impact/probability of the same risk factor is not
necessarily the same for activity and resource.
• For a risk factor linked to a number of activities,
probability has been broken down to the various
activities as advised by the software support.
• No correlations between risks have been considered.
• Correlations between risks and schedule/cost have been
considered by linking the risk impact to activities and
cost items.
Running simulation
Model validation
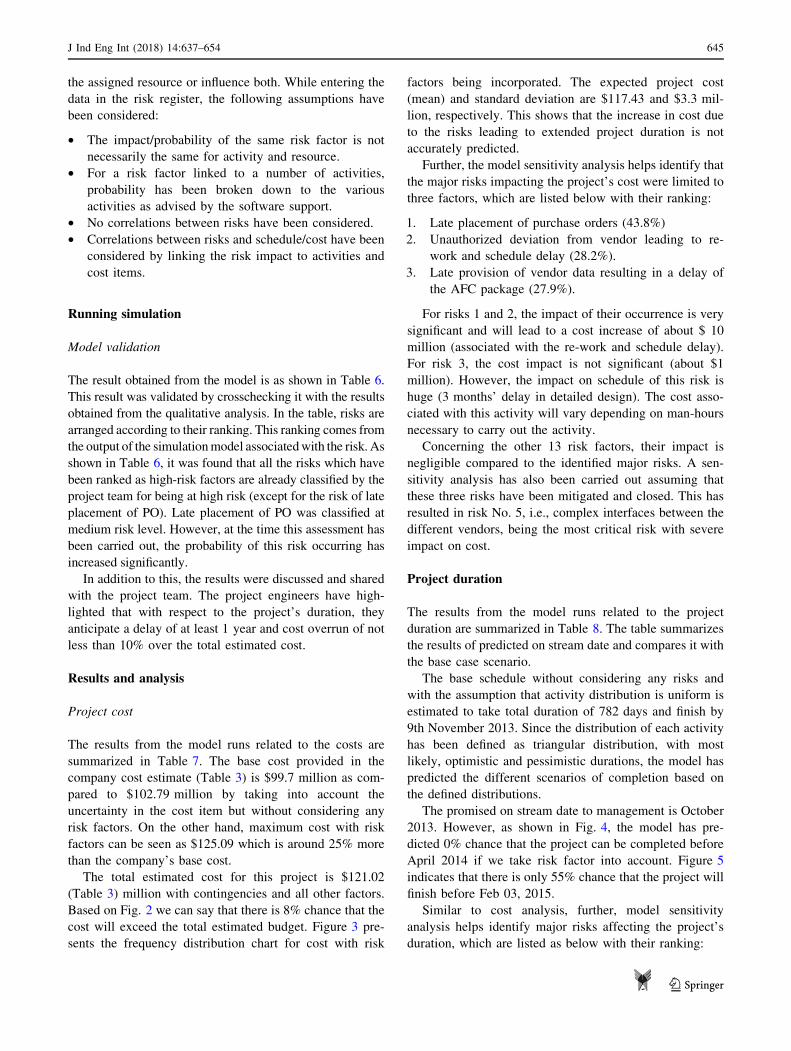
The result obtained from the model is as shown in Table 6.
This result was validated by crosschecking it with the results
obtained from the qualitative analysis. In the table, risks are
arranged according to their ranking. This ranking comes from
the output of the simulationmodel associatedwith the risk. As
shown in Table 6, it was found that all the risks which have
been ranked as high-risk factors are already classified by the
project team for being at high risk (except for the risk of late
placement of PO). Late placement of PO was classified at
medium risk level. However, at the time this assessment has
been carried out, the probability of this risk occurring has
increased significantly.
In addition to this, the results were discussed and shared
with the project team. The project engineers have high-
lighted that with respect to the project’s duration, they
anticipate a delay of at least 1 year and cost overrun of not
less than 10% over the total estimated cost.
Results and analysis
Project cost
The results from the model runs related to the costs are
summarized in Table 7. The base cost provided in the
company cost estimate (Table 3) is $99.7 million as com-
pared to $102.79 million by taking into account the
uncertainty in the cost item but without considering any
risk factors. On the other hand, maximum cost with risk
factors can be seen as $125.09 which is around 25% more
than the company’s base cost.
The total estimated cost for this project is $121.02
(Table 3) million with contingencies and all other factors.
Based on Fig. 2 we can say that there is 8% chance that the
cost will exceed the total estimated budget. Figure 3 pre-
sents the frequency distribution chart for cost with risk
factors being incorporated. The expected project cost
(mean) and standard deviation are $117.43 and $3.3 mil-
lion, respectively. This shows that the increase in cost due
to the risks leading to extended project duration is not
accurately predicted.
Further, the model sensitivity analysis helps identify that
the major risks impacting the project’s cost were limited to
three factors, which are listed below with their ranking:
1. Late placement of purchase orders (43.8%)
2. Unauthorized deviation from vendor leading to re-
work and schedule delay (28.2%).
3. Late provision of vendor data resulting in a delay of
the AFC package (27.9%).
For risks 1 and 2, the impact of their occurrence is very
significant and will lead to a cost increase of about $ 10
million (associated with the re-work and schedule delay).
For risk 3, the cost impact is not significant (about $1
million). However, the impact on schedule of this risk is
huge (3 months’ delay in detailed design). The cost asso-
ciated with this activity will vary depending on man-hours
necessary to carry out the activity.
Concerning the other 13 risk factors, their impact is
negligible compared to the identified major risks. A sen-
sitivity analysis has also been carried out assuming that
these three risks have been mitigated and closed. This has
resulted in risk No. 5, i.e., complex interfaces between the
different vendors, being the most critical risk with severe
impact on cost.
Project duration
The results from the model runs related to the project
duration are summarized in Table 8. The table summarizes
the results of predicted on stream date and compares it with
the base case scenario.
The base schedule without considering any risks and
with the assumption that activity distribution is uniform is
estimated to take total duration of 782 days and finish by
9th November 2013. Since the distribution of each activity
has been defined as triangular distribution, with most
likely, optimistic and pessimistic durations, the model has
predicted the different scenarios of completion based on
the defined distributions.
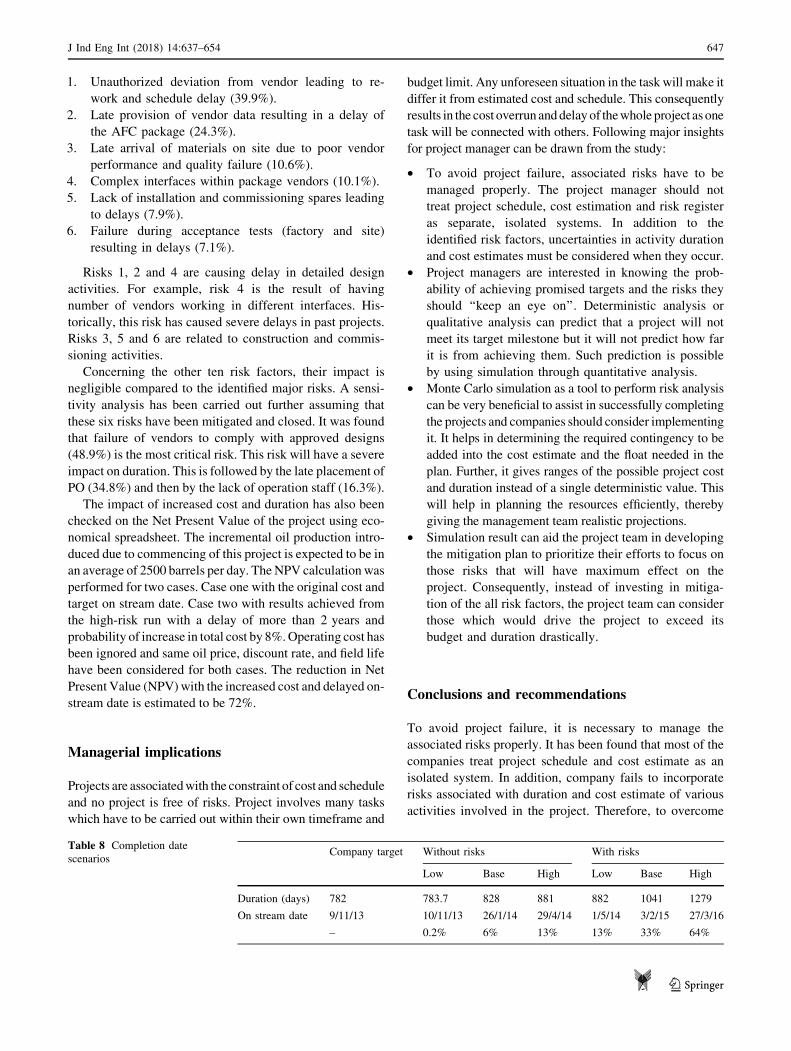
The promised on stream date to management is October
2013. However, as shown in Fig. 4, the model has pre-
dicted 0% chance that the project can be completed before
April 2014 if we take risk factor into account. Figure 5
indicates that there is only 55% chance that the project will
finish before Feb 03, 2015.
Similar to cost analysis, further, model sensitivity
analysis helps identify major risks affecting the project’s
duration, which are listed as below with their ranking:
J Ind Eng Int (2018) 14:637–654 645
123
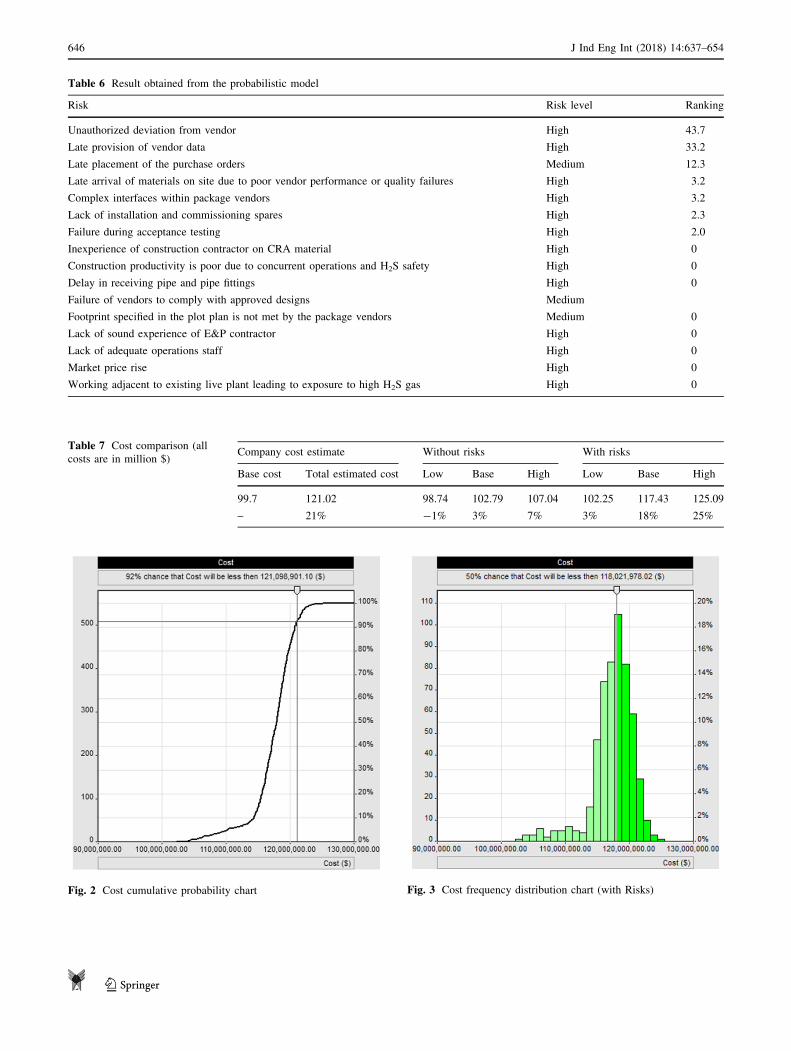
Table 6 Result obtained from the probabilistic model
Risk Risk level Ranking
Unauthorized deviation from vendor High 43.7
Late provision of vendor data High 33.2
Late placement of the purchase orders Medium 12.3
Late arrival of materials on site due to poor vendor performance or quality failures High 3.2
Complex interfaces within package vendors High 3.2
Lack of installation and commissioning spares High 2.3
Failure during acceptance testing High 2.0
Inexperience of construction contractor on CRA material High 0
Construction productivity is poor due to concurrent operations and H2S safety High 0
Delay in receiving pipe and pipe fittings High 0
Failure of vendors to comply with approved designs Medium
Footprint specified in the plot plan is not met by the package vendors Medium 0
Lack of sound experience of E&P contractor High 0
Lack of adequate operations staff High 0
Market price rise High 0
Working adjacent to existing live plant leading to exposure to high H2S gas High 0
Table 7 Cost comparison (all
costs are in million $)Company cost estimate Without risks With risks
Base cost Total estimated cost Low Base High Low Base High
99.7 121.02 98.74 102.79 107.04 102.25 117.43 125.09
– 21% -1% 3% 7% 3% 18% 25%
Fig. 2 Cost cumulative probability chart Fig. 3 Cost frequency distribution chart (with Risks)
646 J Ind Eng Int (2018) 14:637–654
123
1. Unauthorized deviation from vendor leading to re-
work and schedule delay (39.9%).
2. Late provision of vendor data resulting in a delay of
the AFC package (24.3%).
3. Late arrival of materials on site due to poor vendor
performance and quality failure (10.6%).
4. Complex interfaces within package vendors (10.1%).
5. Lack of installation and commissioning spares leading
to delays (7.9%).
6. Failure during acceptance tests (factory and site)
resulting in delays (7.1%).
Risks 1, 2 and 4 are causing delay in detailed design
activities. For example, risk 4 is the result of having
number of vendors working in different interfaces. His-
torically, this risk has caused severe delays in past projects.
Risks 3, 5 and 6 are related to construction and commis-
sioning activities.
Concerning the other ten risk factors, their impact is
negligible compared to the identified major risks. A sensi-
tivity analysis has been carried out further assuming that
these six risks have been mitigated and closed. It was found
that failure of vendors to comply with approved designs
(48.9%) is the most critical risk. This risk will have a severe
impact on duration. This is followed by the late placement of
PO (34.8%) and then by the lack of operation staff (16.3%).
The impact of increased cost and duration has also been
checked on the Net Present Value of the project using eco-
nomical spreadsheet. The incremental oil production intro-
duced due to commencing of this project is expected to be in
an average of 2500 barrels per day. TheNPV calculation was
performed for two cases. Case one with the original cost and
target on stream date. Case two with results achieved from
the high-risk run with a delay of more than 2 years and
probability of increase in total cost by 8%.Operating cost has
been ignored and same oil price, discount rate, and field life
have been considered for both cases. The reduction in Net
Present Value (NPV)with the increased cost and delayed on-
stream date is estimated to be 72%.
Managerial implications
Projects are associatedwith the constraint of cost and schedule
and no project is free of risks. Project involves many tasks
which have to be carried out within their own timeframe and
budget limit. Any unforeseen situation in the task will make it
differ it from estimated cost and schedule. This consequently
results in the cost overrun anddelayof thewhole project as one
task will be connected with others. Following major insights
for project manager can be drawn from the study:
• To avoid project failure, associated risks have to be
managed properly. The project manager should not
treat project schedule, cost estimation and risk register
as separate, isolated systems. In addition to the
identified risk factors, uncertainties in activity duration
and cost estimates must be considered when they occur.
• Project managers are interested in knowing the prob-
ability of achieving promised targets and the risks they
should ‘‘keep an eye on’’. Deterministic analysis or
qualitative analysis can predict that a project will not
meet its target milestone but it will not predict how far
it is from achieving them. Such prediction is possible
by using simulation through quantitative analysis.
• Monte Carlo simulation as a tool to perform risk analysis
can be very beneficial to assist in successfully completing
the projects and companies should consider implementing
it. It helps in determining the required contingency to be
added into the cost estimate and the float needed in the
plan. Further, it gives ranges of the possible project cost
and duration instead of a single deterministic value. This
will help in planning the resources efficiently, thereby
giving the management team realistic projections.
• Simulation result can aid the project team in developing
the mitigation plan to prioritize their efforts to focus on
those risks that will have maximum effect on the
project. Consequently, instead of investing in mitiga-
tion of the all risk factors, the project team can consider
those which would drive the project to exceed its
budget and duration drastically.
Conclusions and recommendations
To avoid project failure, it is necessary to manage the
associated risks properly. It has been found that most of the
companies treat project schedule and cost estimate as an
isolated system. In addition, company fails to incorporate
risks associated with duration and cost estimate of various
activities involved in the project. Therefore, to overcome
Table 8 Completion date
scenariosCompany target Without risks With risks
Low Base High Low Base High
Duration (days) 782 783.7 828 881 882 1041 1279
On stream date 9/11/13 10/11/13 26/1/14 29/4/14 1/5/14 3/2/15 27/3/16
– 0.2% 6% 13% 13% 33% 64%
J Ind Eng Int (2018) 14:637–654 647
123
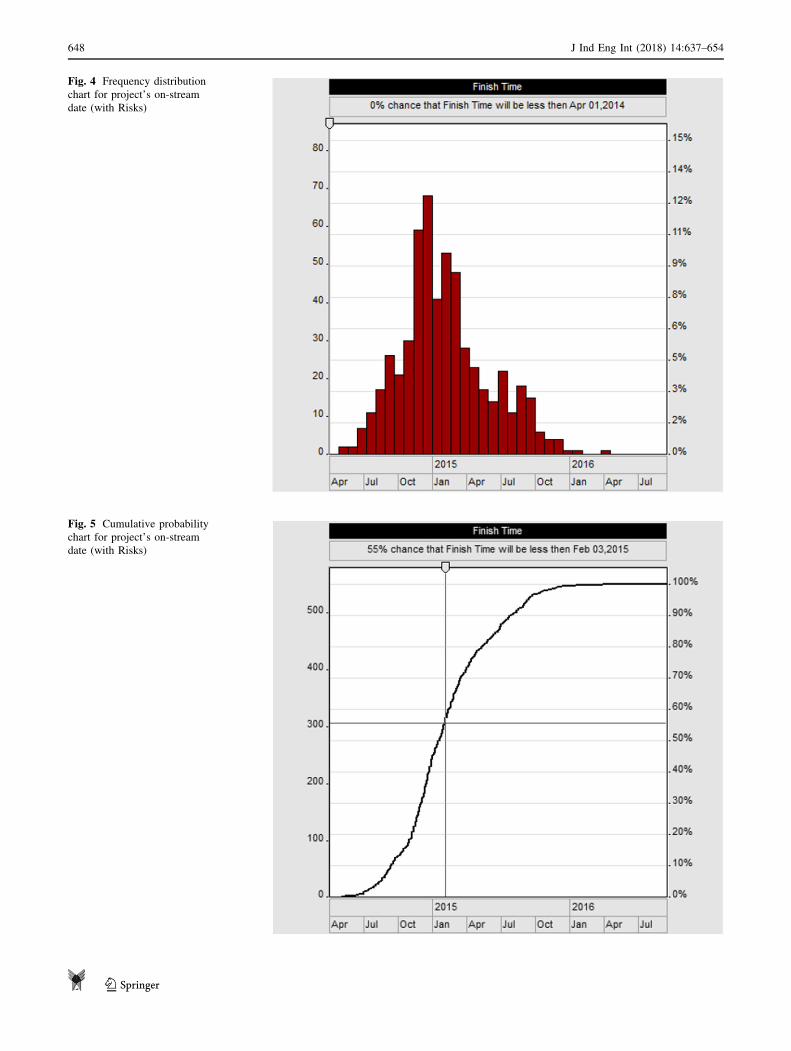
Fig. 4 Frequency distribution
chart for project’s on-stream
date (with Risks)
Fig. 5 Cumulative probability
chart for project’s on-stream
date (with Risks)
648 J Ind Eng Int (2018) 14:637–654
123
these issues, in this paper we study the management of
risks in an oil and gas project being implemented by a
company in Oman. The paper proposed the use of
stochastic model by integrating schedule and cost estimate
to perform risk analysis in such project.
In the paper, Monte Carlo simulation is used as a tool to
conduct numerical analysis using RiskyProject Profes-
sionalTM software. The simulation result predicted a delay
of about 2 years as a worse case with no chance of meeting
the project’s on stream date. Also, it has predicted 8%
chance of exceeding the total estimated budget. The result
of numerical analysis from the proposed model is validated
by comparing it with the result of qualitative analysis,
which was obtained through discussion with various pro-
ject managers of company.
Along with predicting delay in project schedule and
inaccuracy in cost estimation, the developed model can
also be used to predict most critical risks that would impact
on the project. Such information can aid the project team in
re-developing mitigation plan to prioritize their efforts on
those risks that got highest impact on project’s objectives.
At present, the research has considered only projects on
stream date and cost estimate as issues in an effort on
mitigating the risk. However, apart from these issues,
safety and performance are of critical issues in oil and gas
industry. Therefore, research can be extended to incorpo-
rate these issues in the project objectives.
Open Access This article is distributed under the terms of the
Creative Commons Attribution 4.0 International License (http://crea
tivecommons.org/licenses/by/4.0/), which permits unrestricted use,
distribution, and reproduction in any medium, provided you give
appropriate credit to the original author(s) and the source, provide a
link to the Creative Commons license, and indicate if changes were
made.
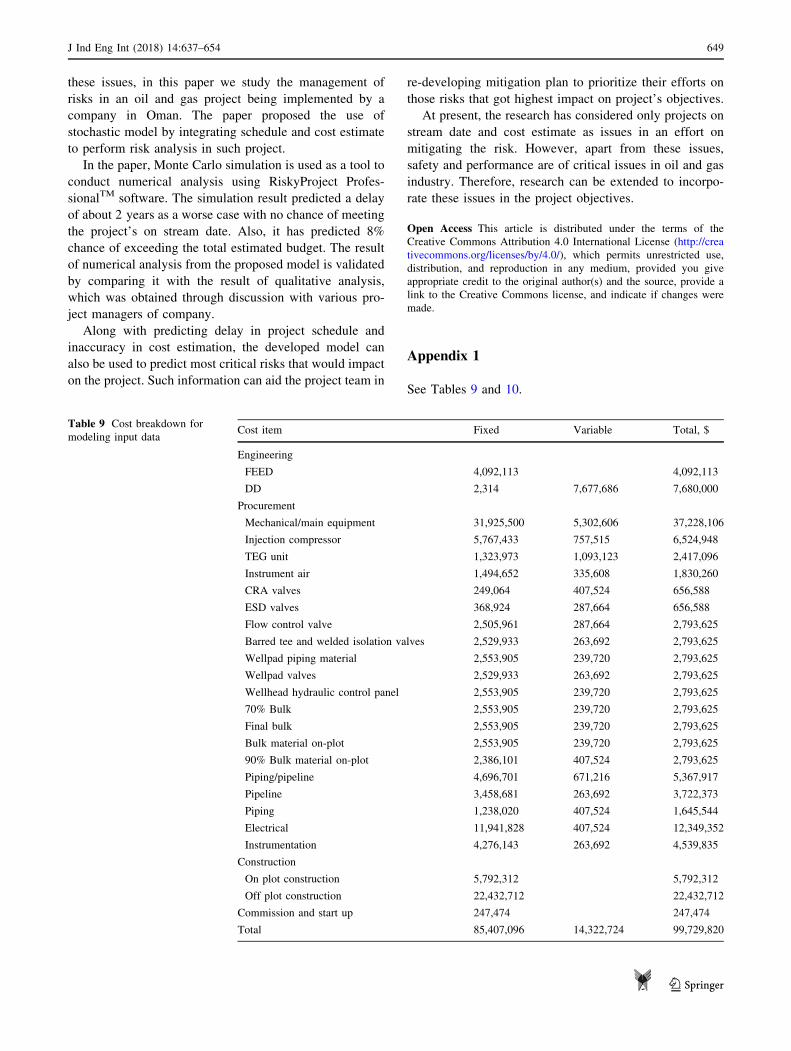
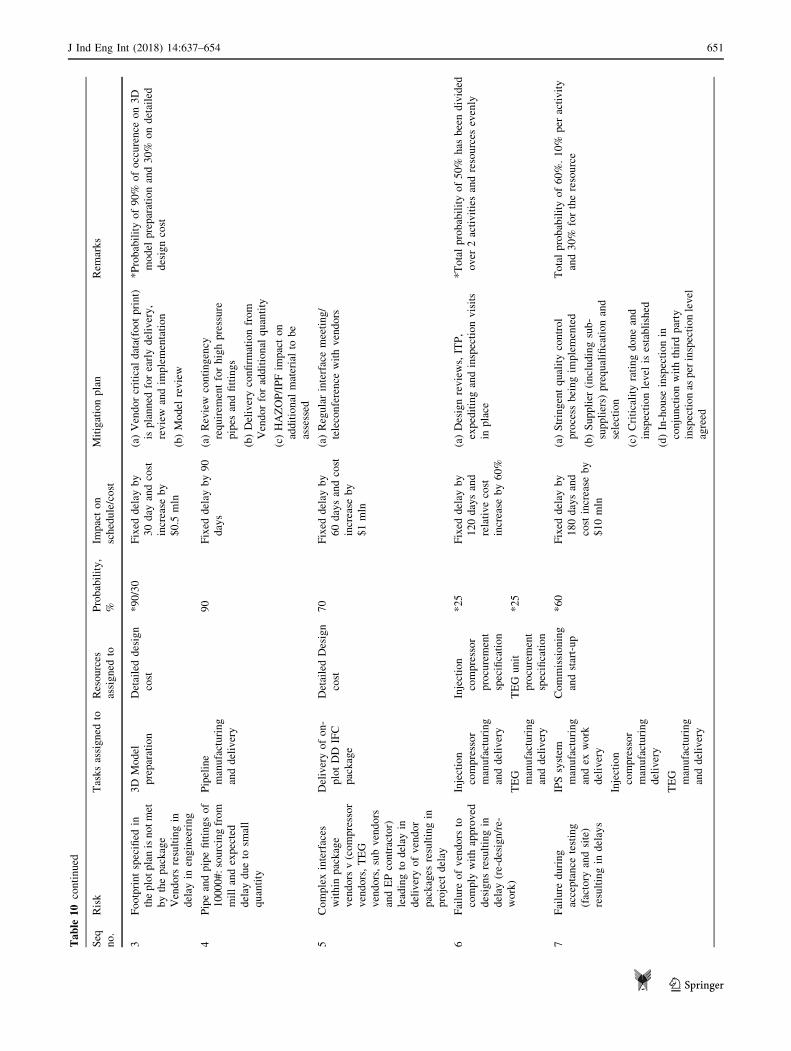
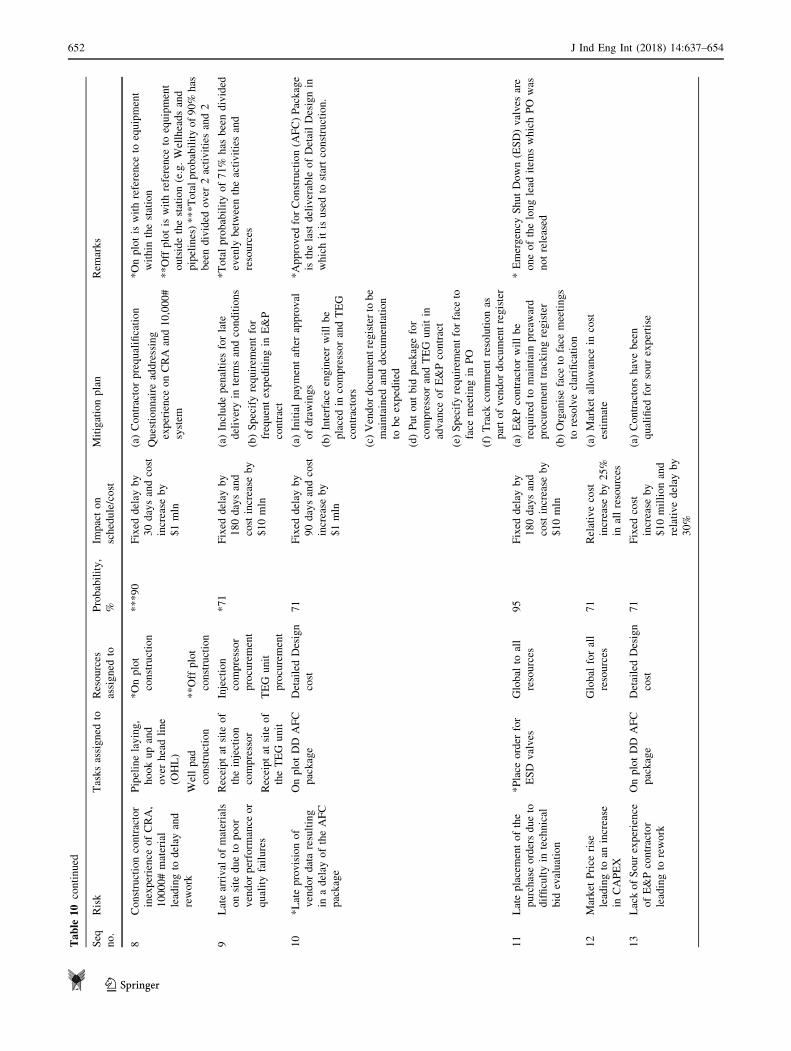
Appendix 1
See Tables 9 and 10.
Table 9 Cost breakdown for
modeling input dataCost item Fixed Variable Total, $
Engineering
FEED 4,092,113 4,092,113
DD 2,314 7,677,686 7,680,000
Procurement
Mechanical/main equipment 31,925,500 5,302,606 37,228,106
Injection compressor 5,767,433 757,515 6,524,948
TEG unit 1,323,973 1,093,123 2,417,096
Instrument air 1,494,652 335,608 1,830,260
CRA valves 249,064 407,524 656,588
ESD valves 368,924 287,664 656,588
Flow control valve 2,505,961 287,664 2,793,625
Barred tee and welded isolation valves 2,529,933 263,692 2,793,625
Wellpad piping material 2,553,905 239,720 2,793,625
Wellpad valves 2,529,933 263,692 2,793,625
Wellhead hydraulic control panel 2,553,905 239,720 2,793,625
70% Bulk 2,553,905 239,720 2,793,625
Final bulk 2,553,905 239,720 2,793,625
Bulk material on-plot 2,553,905 239,720 2,793,625
90% Bulk material on-plot 2,386,101 407,524 2,793,625
Piping/pipeline 4,696,701 671,216 5,367,917
Pipeline 3,458,681 263,692 3,722,373
Piping 1,238,020 407,524 1,645,544
Electrical 11,941,828 407,524 12,349,352
Instrumentation 4,276,143 263,692 4,539,835
Construction
On plot construction 5,792,312 5,792,312
Off plot construction 22,432,712 22,432,712
Commission and start up 247,474 247,474
Total 85,407,096 14,322,724 99,729,820
J Ind Eng Int (2018) 14:637–654 649
123
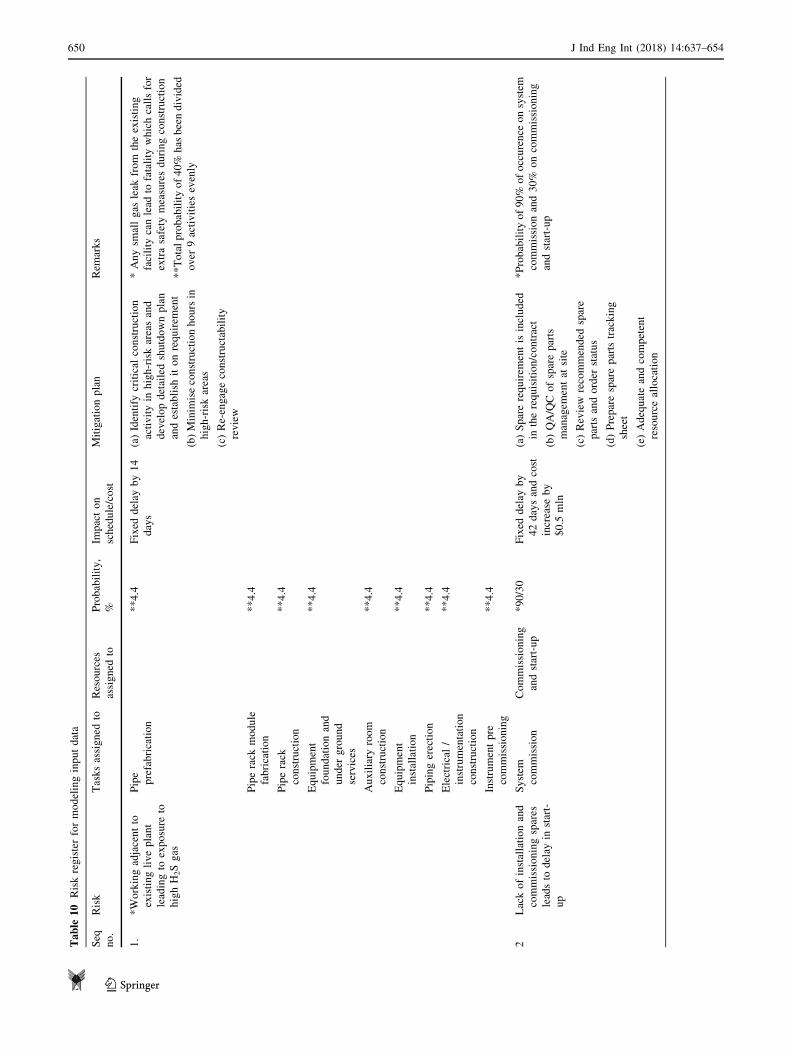
Table
10
Riskregisterformodelinginputdata
Seq
no.
Risk
Tasksassigned
toResources
assigned
to
Probability,
%
Impacton
schedule/cost
Mitigationplan
Rem
arks
1.
*Workingadjacentto
existingliveplant
leadingto
exposure
to
highH2Sgas
Pipe
prefabrication
**4.4
Fixed
delay
by14
days
(a)Identify
critical
construction
activityin
high-riskareasand
developdetailedshutdownplan
andestablish
itonrequirem
ent
(b)Minim
iseconstructionhoursin
high-riskareas
(c)Re-engageconstructability
review
*Anysm
allgas
leak
from
theexisting
facility
canlead
tofatality
whichcallsfor
extrasafety
measuresduringconstruction
**Totalprobabilityof40%
has
beendivided
over
9activitiesevenly
Piperack
module
fabrication
**4.4
Piperack
construction
**4.4
Equipment
foundationand
under
ground
services
**4.4
Auxiliary
room
construction
**4.4
Equipment
installation
**4.4
Pipingerection
**4.4
Electrical/
instrumentation
construction
**4.4
Instrumentpre
commissioning
**4.4
2Lackofinstallationand
commissioningspares
leadsto
delay
instart-
up
System
commission
Commissioning
andstart-up
*90/30
Fixed
delay
by
42daysandcost
increase
by
$0.5
mln
(a)Sparerequirem
entis
included
intherequisition/contract
(b)QA/QCofspareparts
managem
entat
site
(c)Review
recommended
spare
parts
andorder
status
(d)Preparesparepartstracking
sheet
(e)Adequateandcompetent
resourceallocation
*Probabilityof90%
ofoccurence
onsystem
commissionand30%
oncommissioning
andstart-up
650 J Ind Eng Int (2018) 14:637–654
123
Table
10continued
Seq
no.
Risk
Tasksassigned
toResources
assigned
to
Probability,
%
Impacton
schedule/cost
Mitigationplan
Rem
arks
3Footprintspecified
in
theplotplanisnotmet
bythepackage
Vendors
resultingin
delay
inengineering
3D
Model
preparation
Detaileddesign
cost
*90/30
Fixed
delay
by
30day
andcost
increase
by
$0.5
mln
(a)Vendorcritical
data(footprint)
isplanned
forearlydelivery,
review
andim
plementation
(b)Model
review
*Probabilityof90%
ofoccurence
on3D
model
preparationand30%
ondetailed
designcost
4Pipeandpipefittingsof
10000#:sourcingfrom
millandexpected
delay
dueto
small
quantity
Pipeline
manufacturing
anddelivery
90
Fixed
delay
by90
days
(a)Review
contingency
requirem
entforhighpressure
pipes
andfittings
(b)Deliveryconfirm
ationfrom
Vendorforadditional
quantity
(c)HAZOP/IPFim
pacton
additional
materialto
be
assessed
5Complexinterfaces
within
package
vendors
v(compressor
vendors,TEG
vendors,subvendors
andEPcontractor)
leadingto
delay
in
deliveryofvendor
packages
resultingin
project
delay
Deliveryofon-
plotDD
IFC
package
DetailedDesign
cost
70
Fixed
delay
by
60daysandcost
increase
by
$1mln
(a)Regularinterfacemeeting/
teleconference
withvendors
6Failure
ofvendors
to
comply
withapproved
designsresultingin
delay
(re-design/re-
work)
Injection
compressor
manufacturing
anddelivery
Injection
compressor
procurement
specification
*25
Fixed
delay
by
120daysand
relativecost
increase
by60%
(a)Designreviews,ITP,
expeditingandinspectionvisits
inplace
*Totalprobabilityof50%
has
beendivided
over
2activitiesandresources
evenly
TEG
manufacturing
anddelivery
TEG
unit
procurement
specification
*25
7Failure
during
acceptance
testing
(factory
andsite)
resultingin
delays
IPSsystem
manufacturing
andex
work
delivery
Commissioning
andstart-up
*60
Fixed
delay
by
180daysand
cost
increase
by
$10mln
(a)Stringentqualitycontrol
process
beingim
plemented
(b)Supplier
(includingsub-
suppliers)
prequalificationand
selection
(c)Criticality
ratingdoneand
inspectionlevel
isestablished
(d)In-house
inspectionin
conjunctionwiththirdparty
inspectionas
per
inspectionlevel
agreed
Totalprobabilityof60%.10%
per
activity
and30%
fortheresource
Injection
compressor
manufacturing
delivery
TEG
manufacturing
anddelivery
J Ind Eng Int (2018) 14:637–654 651
123
Table
10continued
Seq
no.
Risk
Tasksassigned
toResources
assigned
to
Probability,
%
Impacton
schedule/cost
Mitigationplan
Rem
arks
8Constructioncontractor
inexperience
ofCRA,
10000#material
leadingto
delay
and
rework
Pipelinelaying,
hookupand
over
headline
(OHL)
*Onplot
construction
***90
Fixed
delay
by
30daysandcost
increase
by
$1mln
(a)Contractorprequalification
Questionnaire
addressing
experience
onCRA
and10,000#
system
*Onplotiswithreference
toequipment
within
thestation
**Off
plotis
withreference
toequipment
outsidethestation(e.g.Wellheadsand
pipelines)***Totalprobabilityof90%
has
beendivided
over
2activitiesand2
Wellpad
construction
**Off
plot
construction
9Latearrival
ofmaterials
onsite
dueto
poor
vendorperform
ance
or
qualityfailures
Receiptat
site
of
theinjection
compressor
Injection
compressor
procurement
*71
Fixed
delay
by
180daysand
cost
increase
by
$10mln
(a)Includepenalties
forlate
deliveryin
term
sandconditions
(b)Specifyrequirem
entfor
frequentexpeditingin
E&P
contract
*Totalprobabilityof71%
has
beendivided
evenly
betweentheactivitiesand
resources
Receiptat
site
of
theTEG
unit
TEG
unit
procurement
10
*Lateprovisionof
vendordataresulting
inadelay
oftheAFC
package
OnplotDD
AFC
package
DetailedDesign
cost
71
Fixed
delay
by
90daysandcost
increase
by
$1mln
(a)Initialpaymentafterapproval
ofdrawings
(b)Interfaceengineerwillbe
placedin
compressorandTEG
contractors
(c)Vendordocumentregisterto
be
maintained
anddocumentation
tobeexpedited
(d)Putoutbid
packagefor
compressorandTEG
unitin
advance
ofE&Pcontract
(e)Specifyrequirem
entforface
to
face
meetingin
PO
(f)Track
commentresolutionas
partofvendordocumentregister
*Approved
forConstruction(A
FC)Package
isthelast
deliverable
ofDetailDesignin
whichitisusedto
startconstruction.
11
Lateplacementofthe
purchaseordersdueto
difficultyin
technical
bid
evaluation
*Place
order
for
ESD
valves
Global
toall
resources
95
Fixed
delay
by
180daysand
cost
increase
by
$10mln
(a)E&Pcontractorwillbe
required
tomaintain
preaw
ard
procurementtrackingregister
(b)Organiseface
toface
meetings
toresolveclarification
*Emergency
ShutDown(ESD)valves
are
oneofthelonglead
item
swhichPO
was
notreleased
12
Market
Price
rise
leadingto
anincrease
inCAPEX
Global
forall
resources
71
Relativecost
increase
by25%
inallresources
(a)Market
allowance
incost
estimate
13
LackofSourexperience
ofE&Pcontractor
leadingto
rework
OnplotDD
AFC
package
DetailedDesign
cost
71
Fixed
cost
increase
by
$10millionand
relativedelay
by
30%
(a)Contractors
havebeen
qualified
forsourexpertise
652 J Ind Eng Int (2018) 14:637–654
123
References
Aggarwal P, Ganeshan R (2007) Using risk-management tools on
B2Bs: an exploratory investigation. Int J Prod Econ
108(1–2):2–7
Alhawari S, Karadsheh L, Talet AN, Mansour E (2012) Knowledge-
based risk management framework for information technology
project. Int J Inf Manag 32(1):50–65
Aqlan F, Lam SS (2015) A fuzzy-based integrated framework for
supply chain risk assessment. Int J Prod Econ 161:455–470
Artto K, Eloranta K, Kujala J (2008) Subcontractors’ business
relationships as risk sources in project networks. Int J Manag
Proj Bus 1(1):88–105
Aven T, Vinnem JE (2005) On the use of risk acceptance criteria in
the offshore oil and gas industry. Reliab Eng Syst Saf
90(1):15–24
Balasubramanian V, Narendran TT, Sai Praveen V (2011) RBG risk
scale: an integrated tool for ergonomic risk assessments. Int J Ind
Syst Eng 8(1):104–116
Bosch-Rekveldt M, Jongkind Y, Mooi H, Bakker H, Verbraeck A
(2011) Grasping project complexity in large engineering
projects: the TOE (technical, organizational and environment)
framework. Int J Proj Manag 29(6):728–739
Bourne L, Walker DHT (2008) Project relationship management and
the Stakeholder Circle. Int J Manag Proj Bus 1(1):125–130
Chapman CB, Ward S (2002) Managing project risk and uncertainty:
a constructively simple approach to decision making. Wiley,
New York
Chapman CB, Ward S (2003) Project risk management: processes,
techniques and insights, 2nd edn. Wiley, New York
Chou J (2011) Cost simulation in an item based project involving
construction engineering and management. Int J Proj Manag
29(6):706–717
Esmaeili M, Bahrini A, Shayanrad S (2015) Using game theory
approach to interpret stable policies for Iran’s oil and gas
common resources conflicts with Iraq and Qatar. J Ind Eng Int
11(4):543–554
Fan M, Lin N, Sheu C (2008) Choosing a project risk-handling
strategy: an analytical model. Int J Prod Econ 112(2):700–713
Giannakis M, Papadopoulos T (2016) Supply chain sustainability: a
risk management approach. Int J Prod Econ 171(4):455–470
Giannkis M, Louis M (2011) A multi-agent based framework for
supply chain risk management. J Purch Suppl Manag
17(1):23–31
Ika LA, Diallo A, Thuillier D (2010) Project management in the
international development industry: the project coordinator’s
perspective. Int J Manag Proj Bus 3(1):61–93
Jaafari A (2001) Managing risks, uncertainties and opportunities on
projects: time for a fundamental shift. Int J Proj Manag
19(2):89–101
Javani B, Rwelamila PMD (2016) Risk management in IT projects–a
case of the South African public sector. Int J Manag Proj Bus
9(2):389–413
Jouandou R (2009) Dealing with uncertainty: selecting a risk analysis
tool on the basis of project characteristics and phases. Master
thesis, University of Colorado, viewed 24 May 2016, ProQuest,
http://ezproxy.squ.edu.om:2062/docview/847553742
Khalaj M, Khalaj F, Khalaj A (2013) A novel risk-based analysis for
the production system under epistemic uncertainty. J Ind Eng Int
9(1):1–10
Kirchsteiger C (1999) On the use of probabilistic and deterministic
methods in risk analysis. J Loss Prev Process Ind 12(5):399–419
Kirkire MS, Rane SB, Jadhav JR (2015) Risk management in medical
product development process using traditional FMEA and fuzzy
linguistic approach: a case study. J Ind Eng Int 11(4):595–611
Table
10continued
Seq
no.
Risk
Tasksassigned
toResources
assigned
to
Probability,
%
Impacton
schedule/cost
Mitigationplan
Rem
arks
14
Lackofadequate
operationsstaffto
supportconstruction,
commissioningand
start-up
Mobilization
*71
20daysdelay
in
mobilizationand
14daysin
system
commissioning
(a)Appointapermitcoordinator
tobebased
inconstructioncamp
(b)Discuss
resourcerequirem
ents
withOSON
andOSGO
*Totalprobabilityof71%;30%
for
mobilizationand41%
forsystem
commissioning
System
commissioning
15
Unauthoriseddeviation
from
vendorleadingto
rework
orschedule
delay
OnplotDD
AFC
package
DetailedDesign
cost
*85
Fixed
delay
by
90daysand
Fixed
cost
increase
by
$10million
(a)Engineeringteam
willreview
documents
(b)Designwillbeaudited
(c)Ensure
contractorhas
adequate
changecontrol
*Totalprobabilityof85%;30%
forthe
activityand55%
fortheresource
16
Construction
productivityispoor
dueto
concurrent
operationsandH2S
safety
measures
Auxiliary
room
construction
Onplot
construction
*71
Relativedelay
by
30%
andfixed
cost
increase
by
$5million
(a)*Evaluatestrategiesfor
reducingSIM
OPS(i.e.modular
piperack)andreview
shutdown
requirem
ents
*Totalprobabilityof71%;41%
forthe
activityand30%
fortheresource
J Ind Eng Int (2018) 14:637–654 653
123
Komlosi Z (2001) Application: Monte Carlo simulation in risk
evaluation of E&P projects. In: SPE Hydrocarbon Economics
and Evaluation Symposium, Dallas, Texas, 2–3 April
Lewis TL (2010) Quantitative approach to technical performance
measurement and technical risk analysis utilizing Bayesian
methods and Monte Carlo simulation. (Doctoral dissertation, The
George Washington University)
Lewis D, Guerrero V, Saeed S, Marcon MF, Hyden R (2004) The
relationship between petroleum economics and risk analysis: a
new integrated approach for project management. In: SPE/IADC
Underbalanced Technology Conference and Exhibition. Society
of Petroleum Engineers
Mahmood WHW, Rahman MNA, Deros BM, Mazli H (2011)
Maintenance management system for upstream operations in oil
and gas industry: a case study. Int J Ind Syst Eng 9(3):317–329
Marcelino-Sadaba S, Perez-Ezcurdia A, Lazcano AME, Villanueva P
(2014) Project risk management methodology for small firms. Int
J Proj Manag 32(2):327–340
Miller KD (1990) Strategic risk and corporate performance: an analysis
of alternative risk measures. Acad Manag J 33(4):756–779
Miller KD (1992) A framework for integrated risk management in
international business. J Int Bus Stud 23(2):311–331
Miller KD, Waller HG (2003) Scenarios, real options and integrated
risk management. Long Range Plan 36(1):93–107
Narasimhan R, Talluri S (2009) Perspectives on risk management in
supply chains. J Oper Manag 27(2):114–118
Palisade (2016) Available on http://www.palisade.com/risk/risk_
analysis.asp. Accessed on 24th May 2016
Patterson F, Neailey K (2002) A risk register database system to aid
the management of project risk. Int J Proj Manag 20(5):365–374
Perminova O, Gustafsson M, Wikstrom K (2008) Defining uncer-
tainty in projects—a new perspective. Int J Proj Manag
26(1):73–79
Pettit TJ, Fiksel J, Croxton KL (2010) Ensuring supply chain
resilience: development of a conceptual framework. J Bus Logist
31(1):1–21
Pinsonneault A, Kraemer K (1993) Survey research methodology in
management information systems: an assessment. J Manag Inf
Syst 10(2):75–105
PMI Standards Committee and PMI Standards Committee (1996) A
guide to the project management body of knowledge. Project
Management Institute
Ramos SB, Veiga H (2011) Risk factors in oil and gas industry
returns: international evidens. Energy Econ 33(3):525–542
Raz T, Michael E (2001) Use and benefits of tools for project risk
management. Int J Proj Manag 19(1):9–17
Selvik JT, Aven T (2011) A framework for reliability and risk
centered maintenance. Reliab Eng Syst Saf 96(2):324–331
Smith K (2009) Environmental hazards: assessing risk and reducing
disaster, 5th edn. Routledge Publisher, Oxon
Suslick SB, Schiozer DJ (2004) Risk analysis applied to petroleum
exploration and production: an overview. J Petrol Sci Eng
44(1–2):1–9
Tah JHM, Carr V (2001) Towards a framework for project risk
knowledge management in the construction supply chain. Adv
Eng Softw 32(10–11):835–846
Trkman P, McCormack K (2009) Supply chain risk in turbulent
environments—a conceptual model for managing supply chain
network risk. Int J Prod Econ 119(2):247–258
Vose D (2008) Risk analysis: a quantitative guide. Wiley, Westy
Sussex
Wang SQ, Dulaimi MF, Aguria MY (2004) Risk management
framework for construction projects in developing countries.
Constr Manag Econ 22:237–252
Wang J, Lin W, Huang Y-H (2010) A performance-oriented risk
management framework for innovative R&D projects. Techno-
vation 30(11–12):601–611
Ward S, Chapman C (2003) Transforming project risk management
into project uncertainty management. Int J Proj Manag
21(2):97–105
Westney R (2001) Managing the cost & schedule risk of offshore
development projects. In: Paper presented at the 2001 Offshore
Technology Conference, Houston, Texas, 30 April-3 May
Yildiz AE, Dikmen I, Birgonul MT, Ercoskun K, Alten S (2014) A
knowledge-based risk mapping tool for cost estimation of
international construction projects. Autom Constr 43:144–155
Zhang X, Wuwong N, Li H, Zhang X (2010) Information security risk
management framework for the cloud computing environments.
In: IEEE 10th International Conference on Computer and
Information Technology June 29–July 1, Bradford, UK,
pp. 1328–1334
654 J Ind Eng Int (2018) 14:637–654
123
Related Documents