Quantifying evaporation and its decadal change for Lake Nam Co, central Tibetan Plateau Lazhu 1,2 , Kun Yang 1,3 , Junbo Wang 1,3 , Yanbin Lei 1,3 , Yingying Chen 1,3 , Liping Zhu 1,3 , Baohong Ding 1 , and Jun Qin 1 1 Key Laboratory of Tibetan Environment Changes and Land Surface Processes, Institute of Tibetan Plateau Research, Chinese Academy of Sciences, Beijing, China, 2 University of Chinese Academy of Sciences, Beijing, China, 3 CAS Center for Excellence in Tibetan Plateau Earth Sciences, Beijing, China Abstract Most lakes in the interior Tibetan Plateau have expanded rapidly since the late 1990s. Because of a lack of observations, lake water balances and their changes are far from well understood. Evaporation is a component of the lake water balance, and this study quanti fies its magnitude, decadal change, and its contribution to the water balance changes in Lake Nam Co, one of the largest lakes on the Tibetan Plateau (with an area of approximately 2000 km 2 and a mean depth of approximately 40 m). The lake temperature and the evaporation are simulated by the Flake model. The simulation results are validated against observed lake temperature profile from 2013 and Moderate Resolution Imaging Spectroradiometer lake surface temperature data from 2000 to 2014. The simulated latent heat flux and sensible heat flux are validated against Bowen ratio-derived estimates for 2013. Based on the validated simulation results, the long-term mean annual evaporation is approximately 832 ± 69 mm, and this value is much less than the potential evaporation estimated using the Penman-Monteith equation. The annual evaporation from 1980 to 2014 displays a complex decadal oscillation, mainly due to the changes in energy-related terms (air temperature and radiation). The mean lake evaporation since the late 1990s is greater than previous periods; thus, this change in evaporation has suppressed the recent expansion of Nam Co. 1. Introduction The Tibetan Plateau (TP) has more than 1000 inland lakes with an area greater than 1 km 2 , and the total area of TP lakes represents more than 50% of the inland water area in China [Ma et al., 2011]. Compared to the land surface, lake surfaces play a unique role in determining local and regional climate through various properties, e.g., low albedo, high heat capacity, and small roughness length [Lofgren, 1997; Long et al., 2007; Dutra et al., 2010]. Therefore, lake-air interactions have been taken into account in land surface models for high-resolution weather/climate modeling [e.g., Dutra et al., 2010; Wen et al., 2015]. A recent study [Li et al., 2009] has demon- strated the importance of lake evaporation in the formation of downwind snowfall in the central TP. Lake evaporation is a key component of the lake water balance, but it has not been measured on the TP until very recently. To understand lake water balance changes, many studies have used the potential evaporation cal- culated via the Penman-Monteith equation [Rosenberry et al., 2007; Wu et al., 2014]. Zhu et al. [2010] used pan evaporation as a reference value of lake evaporation of Nam Co and estimated the amount of annual lake eva- poration to be over 1400 mm. For Lake Yamdrok Yumco, Yu et al. [2011] simulated annual evaporation using a single-layer heat budget model and obtained annual evaporation of more than 1100 mm, which is comparable to the observed value from a large pan evaporator (20 m 2 ). Wu et al. [2014] also calculated the evaporation of Nam Co with the Penman-Monteith equation, but the heat storage in the water body was not considered. However, the simulated lake evaporation by a lake model is less than 700 mm for Nam Co [Haginoya et al., 2009]. Very recently, Wang [2015] used an eddy-covariance technique to measure the lake evaporation of Nam Co and found that the accumulative value is less than 400 mm during June to November. This value is much less than the potential evaporation during the same period. Wang et al. [2015] also used the eddy- covariance technique to measure the lake evaporation for a small and shallow lake near Nam Co, and the mea- sured evaporation exhibited a different seasonal variation from the one for Nam Co measured by Wang [2015]. However, the evaporation between late autumn and early winter was not measured in either study, despite the fact that large amounts of energy stored in deep lakes may be released through latent heat and sensible heat during this period [Haginoya et al ., 2009]. Clearly, current estimates of lake evaporation on the TP vary consider- ably. However, full-year observations for lake evaporation are not available, due to the harsh environment con- ditions on the TP, and there is an urgent need to better quantify lake evaporation for the TP region. LAZHU ET AL. LAKE EVAPORATION AND ITS CHANGE 7578 PUBLICATION S Journal of Geophysical Research: Atmospheres RESEARCH ARTICLE 10.1002/2015JD024523 Key Points: • Evaporation of Nam Co is simulated by Flake model with good accuracy • Simulated evaporation is much less than Penman-equation-derived one for the deep lake • The evaporation change played a role in suppressing the recent expansion of Nam Co Correspondence to: K. Yang, [email protected] Citation: Lazhu, K. Yang, J. Wang, Y. Lei, Y. Chen, L. Zhu, B. Ding, and J. Qin (2016), Quantifying evaporation and its decadal change for Lake Nam Co, central Tibetan Plateau, J. Geophys. Res. Atmos., 121, 7578–7591, doi:10.1002/ 2015JD024523. Received 18 NOV 2015 Accepted 17 JUN 2016 Accepted article online 20 JUN 2016 Published online 4 JUL 2016 ©2016. American Geophysical Union. All Rights Reserved.

Welcome message from author
This document is posted to help you gain knowledge. Please leave a comment to let me know what you think about it! Share it to your friends and learn new things together.
Transcript
Quantifying evaporation and its decadal changefor Lake Nam Co, central Tibetan PlateauLazhu1,2, Kun Yang1,3, Junbo Wang1,3, Yanbin Lei1,3, Yingying Chen1,3, Liping Zhu1,3,Baohong Ding1, and Jun Qin1
1Key Laboratory of Tibetan Environment Changes and Land Surface Processes, Institute of Tibetan Plateau Research,Chinese Academy of Sciences, Beijing, China, 2University of Chinese Academy of Sciences, Beijing, China, 3CAS Center forExcellence in Tibetan Plateau Earth Sciences, Beijing, China
Abstract Most lakes in the interior Tibetan Plateau have expanded rapidly since the late 1990s. Because of a lackof observations, lake water balances and their changes are far fromwell understood. Evaporation is a component ofthe lake water balance, and this study quantifies its magnitude, decadal change, and its contribution to the waterbalance changes in Lake Nam Co, one of the largest lakes on the Tibetan Plateau (with an area of approximately2000km2 and a mean depth of approximately 40m). The lake temperature and the evaporation are simulated bythe Flake model. The simulation results are validated against observed lake temperature profile from 2013 andModerate Resolution Imaging Spectroradiometer lake surface temperature data from 2000 to 2014. The simulatedlatent heat flux and sensible heat flux are validated against Bowen ratio-derived estimates for 2013. Based on thevalidated simulation results, the long-termmean annual evaporation is approximately 832±69mm, and this valueis much less than the potential evaporation estimated using the Penman-Monteith equation. The annualevaporation from 1980 to 2014 displays a complex decadal oscillation, mainly due to the changes in energy-relatedterms (air temperature and radiation). The mean lake evaporation since the late 1990s is greater than previousperiods; thus, this change in evaporation has suppressed the recent expansion of Nam Co.
1. Introduction
The Tibetan Plateau (TP) has more than 1000 inland lakes with an area greater than 1 km2, and the total area ofTP lakes represents more than 50% of the inland water area in China [Ma et al., 2011]. Compared to the landsurface, lake surfaces play a unique role in determining local and regional climate through various properties,e.g., low albedo, high heat capacity, and small roughness length [Lofgren, 1997; Long et al., 2007; Dutra et al.,2010]. Therefore, lake-air interactions have been taken into account in land surface models for high-resolutionweather/climate modeling [e.g., Dutra et al., 2010; Wen et al., 2015]. A recent study [Li et al., 2009] has demon-strated the importance of lake evaporation in the formation of downwind snowfall in the central TP.
Lake evaporation is a key component of the lake water balance, but it has not been measured on the TP untilvery recently. To understand lakewater balance changes,many studies have used the potential evaporation cal-culated via the Penman-Monteith equation [Rosenberry et al., 2007; Wu et al., 2014]. Zhu et al. [2010] used panevaporation as a reference value of lake evaporation of Nam Co and estimated the amount of annual lake eva-poration to be over 1400mm. For Lake Yamdrok Yumco, Yu et al. [2011] simulated annual evaporation using asingle-layer heat budget model and obtained annual evaporation of more than 1100mm, which is comparableto the observed value from a large pan evaporator (20m2).Wu et al. [2014] also calculated the evaporation ofNam Co with the Penman-Monteith equation, but the heat storage in the water body was not considered.However, the simulated lake evaporation by a lake model is less than 700mm for Nam Co [Haginoya et al.,2009]. Very recently, Wang [2015] used an eddy-covariance technique to measure the lake evaporation ofNam Co and found that the accumulative value is less than 400mm during June to November. This value ismuch less than the potential evaporation during the same period. Wang et al. [2015] also used the eddy-covariance technique to measure the lake evaporation for a small and shallow lake near Nam Co, and the mea-sured evaporation exhibited a different seasonal variation from the one for Nam Comeasured byWang [2015].However, the evaporation between late autumn and early winter was not measured in either study, despite thefact that large amounts of energy stored in deep lakes may be released through latent heat and sensible heatduring this period [Haginoya et al., 2009]. Clearly, current estimates of lake evaporation on the TP vary consider-ably. However, full-year observations for lake evaporation are not available, due to the harsh environment con-ditions on the TP, and there is an urgent need to better quantify lake evaporation for the TP region.
LAZHU ET AL. LAKE EVAPORATION AND ITS CHANGE 7578
PUBLICATIONSJournal of Geophysical Research: Atmospheres
RESEARCH ARTICLE10.1002/2015JD024523
Key Points:• Evaporation of Nam Co is simulated byFlake model with good accuracy
• Simulated evaporation is much lessthan Penman-equation-derived onefor the deep lake
• The evaporation change played a rolein suppressing the recent expansionof Nam Co
Correspondence to:K. Yang,[email protected]
Citation:Lazhu, K. Yang, J. Wang, Y. Lei, Y. Chen,L. Zhu, B. Ding, and J. Qin (2016),Quantifying evaporation and its decadalchange for Lake Nam Co, centralTibetan Plateau, J. Geophys. Res. Atmos.,121, 7578–7591, doi:10.1002/2015JD024523.
Received 18 NOV 2015Accepted 17 JUN 2016Accepted article online 20 JUN 2016Published online 4 JUL 2016
©2016. American Geophysical Union.All Rights Reserved.
In the last three decades, the climate of the TP has changed rapidly. The changes are characterized by warmingair temperatures, weaker wind, less solar radiation, and increasing precipitation in the central TP and decreasingprecipitation in the Himalayan region [Yang et al., 2014]. In addition, the potential evaporation has decreaseddue to the weaker wind, whereas land evaporation has increased due to the warmer temperatures [Zhanget al., 2007; Yang et al., 2011]. The water balance changes in the TP lakes are generally correlated with precipita-tion changes, but glacial meltingmay contribute to some lakes [Lei et al., 2014; Song et al., 2014]. Specifically, Leiet al. [2013] showed that lakes in the central TP coherently expanded from 1976 to 2010 and that the expansionhas accelerated since the late 1990s. Their estimation indicated that the increase in precipitation generallyplayed a dominant role in the lake expansion. Lei et al. [2014] extended the study area to individual climatezones on the TP and found that the lake area changes had a good relationshipwith the cumulative precipitationchanges for most of the investigated lakes and did not significantly depend on the ratio of glacier area to lakearea, indicating a minor role of glacier melting in the expansion/shrinkage of most TP lakes. However, Zhu et al.[2010] noted that the precipitation increase only accounted for 47% of the water balance change in Lake NamCo and accelerating glacial melting may contribute to the remaining portion. These results are still underdebate, even though Nam Co is one of the three largest TP lakes and has relatively abundant hydrometeorolo-gical observations. Formost TP lakes, the water balance and its changes are far fromwell understood due to thelack of observations. In the previously mentioned studies, the lake evaporation estimates are converted frompan evaporation experiments or approximated with potential evaporation, but their uncertainties are rarely stu-died. The quantification of lake evaporation changes for the TP region is also a focus of this study.
In this study, our goal is to quantify lake evaporation and clarify its possible contributions to the water balancechange in Nam Co on the central TP. The lake evaporation was simulated with the Flake model developed byMironov [2008]. The model was driven by a long-term forcing data set developed at the Institute of TibetanPlateau Research, Chinese Academy of Sciences (ITPCAS). The simulated results were evaluated against observedlake water temperature profile, Moderate Resolution Imaging Spectroradiometer (MODIS) lake surface tempera-ture (LST) data, and Bowen ratio-derived evaporation data. Then, the annual mean evaporation and its uncertain-ties were investigated. Finally, decadal changes in evaporation and their role in the lake expansionwere analyzed.
2. Study Area and Data2.1. Study Area
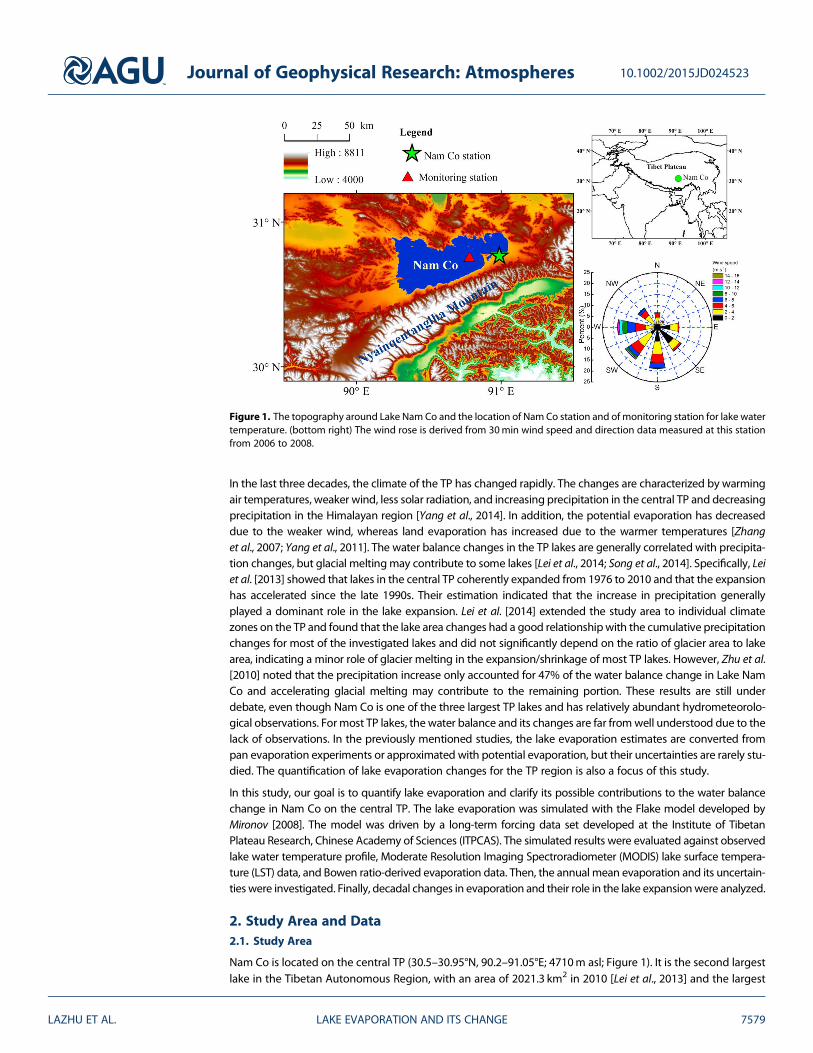
Nam Co is located on the central TP (30.5–30.95°N, 90.2–91.05°E; 4710m asl; Figure 1). It is the second largestlake in the Tibetan Autonomous Region, with an area of 2021.3 km2 in 2010 [Lei et al., 2013] and the largest
Figure 1. The topography around Lake Nam Co and the location of Nam Co station and of monitoring station for lake watertemperature. (bottom right) The wind rose is derived from 30min wind speed and direction data measured at this stationfrom 2006 to 2008.
Journal of Geophysical Research: Atmospheres 10.1002/2015JD024523
LAZHU ET AL. LAKE EVAPORATION AND ITS CHANGE 7579
depth of more than 95m [Wanget al., 2009]. The multiyear meanvolume of the lake water is842.36× 108 m3 [B. Zhang et al.,2011], and the mean depth of NamCo is approximately 40m. The lakesurface level increased by 4.8mfrom 1976 to 2010 [Lei et al., 2013],and the changes have acceleratedsince the late 1990s. The precipita-tion mainly occurs from May toOctober and amounts to more than400mm at Nam Co station(Figure 1) [Zhou et al., 2013]. Theglacier coverage in the lake basin
was approximately 196 km2 in 1971 and 174 km2 in 2000 [Zhu et al., 2010]. Three main rivers (the NiyaquRiver, Qugaqie River, and Angqu River) supply water to the lake. Belonging to the warm monomictic lake typein thermal structure, Lake Nam Co is stably stratified in the summer and freely circulates in the winter.
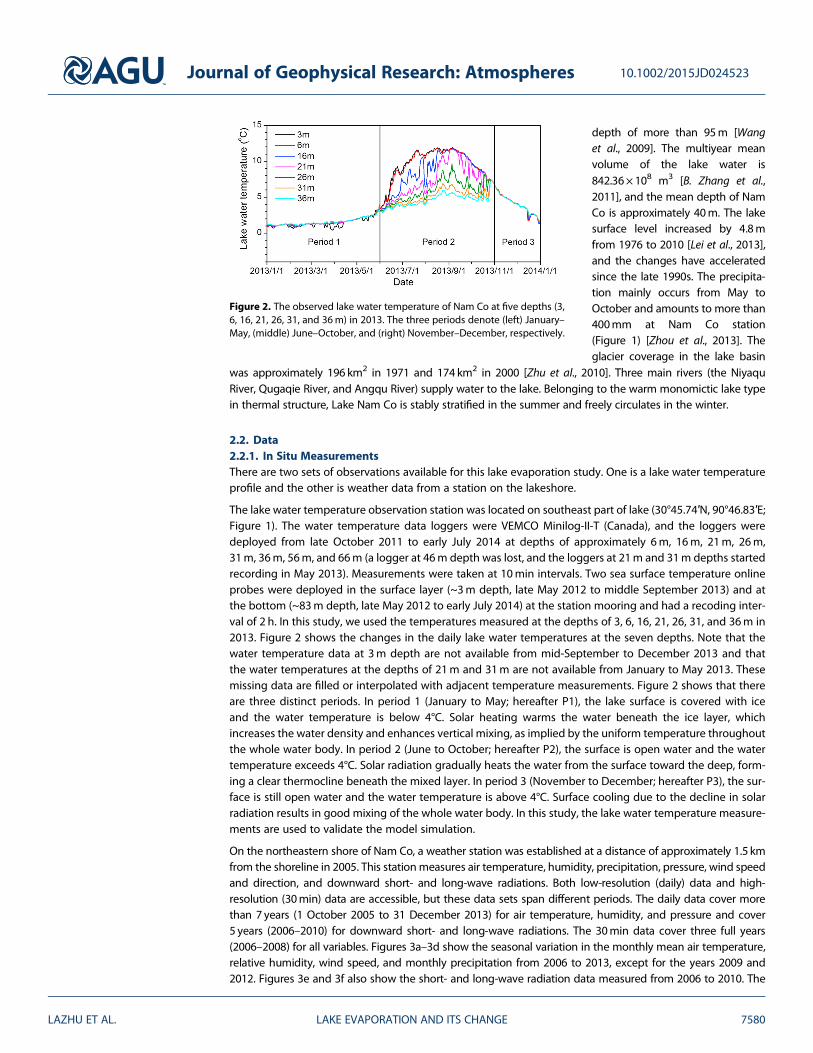
2.2. Data2.2.1. In Situ MeasurementsThere are two sets of observations available for this lake evaporation study. One is a lake water temperatureprofile and the other is weather data from a station on the lakeshore.
The lake water temperature observation station was located on southeast part of lake (30°45.74′N, 90°46.83′E;Figure 1). The water temperature data loggers were VEMCO Minilog-II-T (Canada), and the loggers weredeployed from late October 2011 to early July 2014 at depths of approximately 6m, 16m, 21m, 26m,31m, 36m, 56m, and 66m (a logger at 46m depth was lost, and the loggers at 21m and 31m depths startedrecording in May 2013). Measurements were taken at 10min intervals. Two sea surface temperature onlineprobes were deployed in the surface layer (~3m depth, late May 2012 to middle September 2013) and atthe bottom (~83m depth, late May 2012 to early July 2014) at the station mooring and had a recoding inter-val of 2 h. In this study, we used the temperatures measured at the depths of 3, 6, 16, 21, 26, 31, and 36m in2013. Figure 2 shows the changes in the daily lake water temperatures at the seven depths. Note that thewater temperature data at 3m depth are not available from mid-September to December 2013 and thatthe water temperatures at the depths of 21m and 31m are not available from January to May 2013. Thesemissing data are filled or interpolated with adjacent temperature measurements. Figure 2 shows that thereare three distinct periods. In period 1 (January to May; hereafter P1), the lake surface is covered with iceand the water temperature is below 4°C. Solar heating warms the water beneath the ice layer, whichincreases the water density and enhances vertical mixing, as implied by the uniform temperature throughoutthe whole water body. In period 2 (June to October; hereafter P2), the surface is open water and the watertemperature exceeds 4°C. Solar radiation gradually heats the water from the surface toward the deep, form-ing a clear thermocline beneath the mixed layer. In period 3 (November to December; hereafter P3), the sur-face is still open water and the water temperature is above 4°C. Surface cooling due to the decline in solarradiation results in good mixing of the whole water body. In this study, the lake water temperature measure-ments are used to validate the model simulation.
On the northeastern shore of Nam Co, a weather station was established at a distance of approximately 1.5 kmfrom the shoreline in 2005. This stationmeasures air temperature, humidity, precipitation, pressure, wind speedand direction, and downward short- and long-wave radiations. Both low-resolution (daily) data and high-resolution (30min) data are accessible, but these data sets span different periods. The daily data cover morethan 7 years (1 October 2005 to 31 December 2013) for air temperature, humidity, and pressure and cover5 years (2006–2010) for downward short- and long-wave radiations. The 30min data cover three full years(2006–2008) for all variables. Figures 3a–3d show the seasonal variation in the monthly mean air temperature,relative humidity, wind speed, and monthly precipitation from 2006 to 2013, except for the years 2009 and2012. Figures 3e and 3f also show the short- and long-wave radiation data measured from 2006 to 2010. The
Figure 2. The observed lake water temperature of Nam Co at five depths (3,6, 16, 21, 26, 31, and 36m) in 2013. The three periods denote (left) January–May, (middle) June–October, and (right) November–December, respectively.
Journal of Geophysical Research: Atmospheres 10.1002/2015JD024523
LAZHU ET AL. LAKE EVAPORATION AND ITS CHANGE 7580
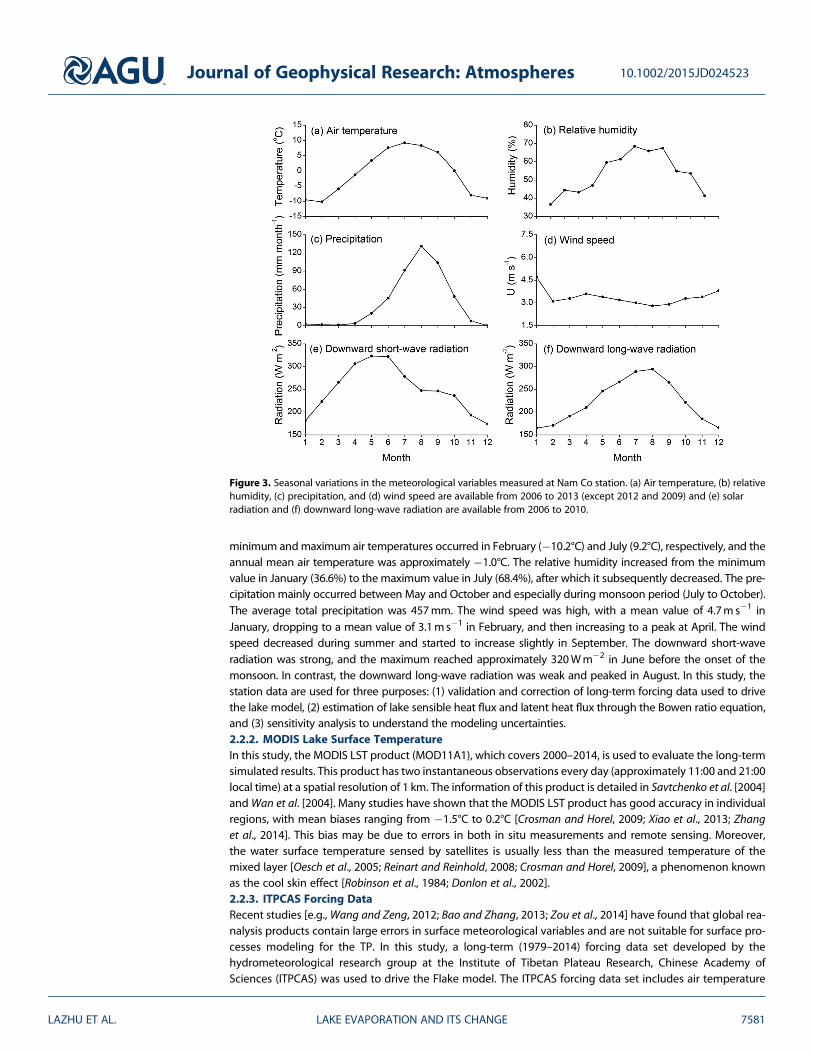
minimum andmaximum air temperatures occurred in February (�10.2°C) and July (9.2°C), respectively, and theannual mean air temperature was approximately �1.0°C. The relative humidity increased from the minimumvalue in January (36.6%) to the maximum value in July (68.4%), after which it subsequently decreased. The pre-cipitation mainly occurred between May and October and especially during monsoon period (July to October).The average total precipitation was 457mm. The wind speed was high, with a mean value of 4.7m s�1 inJanuary, dropping to a mean value of 3.1ms�1 in February, and then increasing to a peak at April. The windspeed decreased during summer and started to increase slightly in September. The downward short-waveradiation was strong, and the maximum reached approximately 320Wm�2 in June before the onset of themonsoon. In contrast, the downward long-wave radiation was weak and peaked in August. In this study, thestation data are used for three purposes: (1) validation and correction of long-term forcing data used to drivethe lake model, (2) estimation of lake sensible heat flux and latent heat flux through the Bowen ratio equation,and (3) sensitivity analysis to understand the modeling uncertainties.2.2.2. MODIS Lake Surface TemperatureIn this study, the MODIS LST product (MOD11A1), which covers 2000–2014, is used to evaluate the long-termsimulated results. This product has two instantaneous observations every day (approximately 11:00 and 21:00local time) at a spatial resolution of 1 km. The information of this product is detailed in Savtchenko et al. [2004]andWan et al. [2004]. Many studies have shown that the MODIS LST product has good accuracy in individualregions, with mean biases ranging from �1.5°C to 0.2°C [Crosman and Horel, 2009; Xiao et al., 2013; Zhanget al., 2014]. This bias may be due to errors in both in situ measurements and remote sensing. Moreover,the water surface temperature sensed by satellites is usually less than the measured temperature of themixed layer [Oesch et al., 2005; Reinart and Reinhold, 2008; Crosman and Horel, 2009], a phenomenon knownas the cool skin effect [Robinson et al., 1984; Donlon et al., 2002].2.2.3. ITPCAS Forcing DataRecent studies [e.g.,Wang and Zeng, 2012; Bao and Zhang, 2013; Zou et al., 2014] have found that global rea-nalysis products contain large errors in surface meteorological variables and are not suitable for surface pro-cesses modeling for the TP. In this study, a long-term (1979–2014) forcing data set developed by thehydrometeorological research group at the Institute of Tibetan Plateau Research, Chinese Academy ofSciences (ITPCAS) was used to drive the Flake model. The ITPCAS forcing data set includes air temperature
Figure 3. Seasonal variations in the meteorological variables measured at Nam Co station. (a) Air temperature, (b) relativehumidity, (c) precipitation, and (d) wind speed are available from 2006 to 2013 (except 2012 and 2009) and (e) solarradiation and (f) downward long-wave radiation are available from 2006 to 2010.
Journal of Geophysical Research: Atmospheres 10.1002/2015JD024523
LAZHU ET AL. LAKE EVAPORATION AND ITS CHANGE 7581
and specific humidity at 2m height above the ground, wind speed at 10m height, surface pressure, precipi-tation, and downward short- and long-wave radiations at a spatial resolution of 0.1° and a temporal resolu-tion of 3 h [Chen et al., 2011; He and Yang, 2011]. The data are available on the Third Pole EnvironmentDatabase (http://en.tpedatabase.cn/portal/). This data set has been recognized to be the best of the currentlyavailable reanalysis products and has been used in tens of land-surface and hydrological modeling studies inChina [e.g., Chen et al., 2011; Guo and Wang, 2013; Liu and Xie, 2013]. The ITPCAS data set was developedbased on land station data, which was not able to characterize the lake wind parameter. In general, the windover large lakes is stronger than that over land. Therefore, we made a correction to the ITPCAS wind speeddata for the lake process modeling.
The basis of the correction is the data measured at Nam Co station, which is located on the northeasternshore (Figure 1). The station provides continuous data on wind speed and wind direction at a resolution of30min from 1 January 2006 to 31 December 2008. First, we selected the data that represent the lake breeze(from 0 to 50° and 230 to 360°). Then, a linear regression between the in situ data and the ITPCAS forcing dataat a daily scale was established for each season. The linear relationships between the two data sets are sig-nificant (p< 0.01) except in summer. Therefore, we made linear corrections for three seasons, and a simplecorrection was applied using the mean bias for summer.
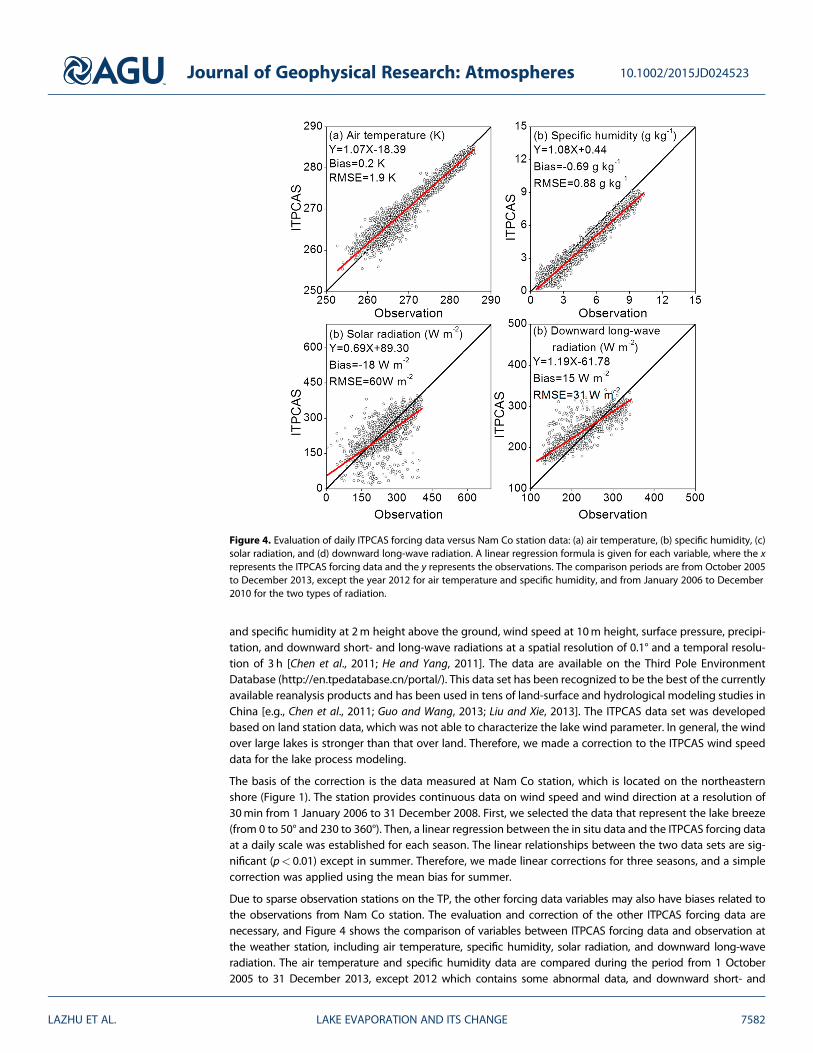
Due to sparse observation stations on the TP, the other forcing data variables may also have biases related tothe observations from Nam Co station. The evaluation and correction of the other ITPCAS forcing data arenecessary, and Figure 4 shows the comparison of variables between ITPCAS forcing data and observation atthe weather station, including air temperature, specific humidity, solar radiation, and downward long-waveradiation. The air temperature and specific humidity data are compared during the period from 1 October2005 to 31 December 2013, except 2012 which contains some abnormal data, and downward short- and
Figure 4. Evaluation of daily ITPCAS forcing data versus Nam Co station data: (a) air temperature, (b) specific humidity, (c)solar radiation, and (d) downward long-wave radiation. A linear regression formula is given for each variable, where the xrepresents the ITPCAS forcing data and the y represents the observations. The comparison periods are from October 2005to December 2013, except the year 2012 for air temperature and specific humidity, and from January 2006 to December2010 for the two types of radiation.
Journal of Geophysical Research: Atmospheres 10.1002/2015JD024523
LAZHU ET AL. LAKE EVAPORATION AND ITS CHANGE 7582
long-wave radiations are evaluated during the period from 1 January 2006 to 31 December 2010. The air tem-perature has a slight difference between the ITPCAS forcing data and the station data, with a mean bias of 0.2Kand a root-mean-square error (RMSE) of 1.9 K, as shown in Figure 4a. The specific humidity in the ITPCAS forcingdata is less than the station data, with a mean bias of 0.69 g kg�1 and a RMSE of 0.88 g kg�1. The mean bias inthe ITPCAS short-wave radiation is �18Wm�2, and the mean bias in the downward long-wave radiation is15Wm�2. The total bias in the short-wave radiation and the long-wave radiation is small because the cloudcover used in ITPCAS long-wave radiation estimation is derived from the short-wave radiation. These variablesare corrected according to the comparison in Figure 4. Specifically, the air temperature, specific humidity, andlong-wave radiation variables in the ITPCAS data were corrected with the linear relationships shown in Figure 4(note that x represents the ITPCAS data and y represents the station data in the linear regression formulas). Theshort-wave radiation is corrected by simply multiplying the ratio of the mean observation and themean ITPCASdata. The impact of the corrections on the lake evaporation simulation is evaluated in section 5.2.
3. Method
A so-called Flakemodel is used to simulate the lake evaporation. The Flakemodel developed byMironov [2008] isa freshwater model. It simulates lake water temperature profiles and surface heat fluxes. The Flake model dividesthe lake water into two layers, i.e., an upper mixed layer in which the water temperature is nearly uniform verti-cally and a thermocline layer in which the temperature profile is parameterized using the concept of self-similarity. In addition, a lake-ice layer, snow layer, and lake sediment layer are considered, and the concept ofthe self-similarity is applied to these layers, too. The change in themixed layer depth is described with an entrain-ment equation for convective conditions and a relaxation-type equation for stable conditions. The Flakemodel issuggested to be applicable for lakes with depths of less than 60m because of its simple stratification. A merit ofthis model is that it has a small number of lake parameters thatmust be specified, namely, the lake depth and theoptical characteristics of the lake. Thus, it is relatively easy to specify the model parameters for its application.
The computation of the Flake model is efficient, due to its relatively simple construction with only two layers. Interms of accuracy, previous studies have indicated that its simulated lake surface temperature correlated well
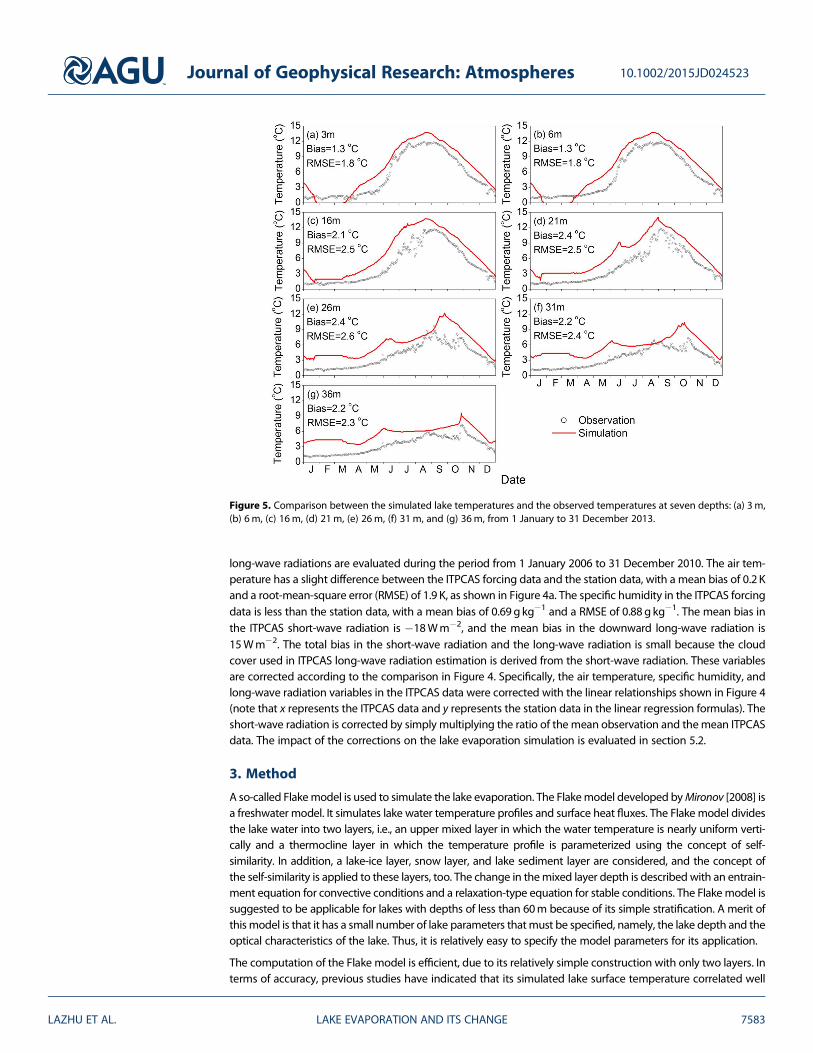
Figure 5. Comparison between the simulated lake temperatures and the observed temperatures at seven depths: (a) 3m,(b) 6m, (c) 16m, (d) 21m, (e) 26m, (f) 31m, and (g) 36m, from 1 January to 31 December 2013.
Journal of Geophysical Research: Atmospheres 10.1002/2015JD024523
LAZHU ET AL. LAKE EVAPORATION AND ITS CHANGE 7583
with MODIS data or in situ observations, whereas its sensible heat flux and latent heat flux had small positivebiases in many cases [e.g., Perroud et al., 2009; Kheyrollah Pour et al., 2012; Stepanenko et al., 2010, 2014].
The Flake model is commonly used in high-latitude regions. In this study, we applied it to Nam Co on thehigh-elevation TP and evaluated its ability to simulate lake water temperatures and surface turbulent heatfluxes. In themodel, the lake depth was set to be themean depth of the lake (i.e., 40m). Themodel simulationstarted in August 1979, and the initial water temperatures were set to 280 K for the upper 5m deep mixedlayer and 277.15 K for the lake bottom. These values are close to the observations that were made in otheryears. The forcing data in 1979 were used to drive the Flake model for 10 iterations for model spin-up, andthen the model was integrated from 1980 to 2014. The integration time step was 30min.
4. Evaluation of the Simulated Results4.1. Evaluation of the Simulated Lake Water Temperature
First, the observed daily lake water temperatures at depths of 3, 6, 16, 21, 26, 31, and 36m in 2013 are used tovalidate the modeling results for Nam Co, as shown in Figure 5. The model can simulate the seasonal varia-tions in water temperature at all measuring depths, but the simulated temperatures are generally higher thanthe observed ones. The simulated temperatures at 3m and 6m depths are higher in the open-water periodand lower in the ice-covered period than the observations, with a mean bias of 1.3°C and an RMSE value of1.8°C at the two depths. The simulated temperatures at the other depths are higher than the observed onesduring the whole year, with RMSE values of approximately 2.5°C.
One possible reason for the warm biases in the simulation is that the lake depth used in the Flake model is 40m,whereas the actual water depth at the observation point is greater than 80m. In addition, the model cannotsimulate the observed high-frequency variability of the water temperature at the thermocline (Figures 5c–5e).We speculate that the water mixing in the deep and large lake is three dimensional, due to complex underwaterbathymetry and inflows from surrounding rivers; thus, a one-dimensional model, such as the Flakemodel, cannotsimulate all these features. Another weakness is that the Flake model cannot accurately simulate water tempera-ture profiles in the ice-covered period. Figure 2 shows that the observed profiles are nearly uniform during theice-covered period (February to April), but the simulated profiles differ from the observed ones, with water tem-peratures close to 0°C at 3m and 6m depths and close to 4°C at 26m, 31m, and 36m depths. Similar simulationbiases in the temperature profile were also found for another deep lake by Stepanenko et al. [2010].
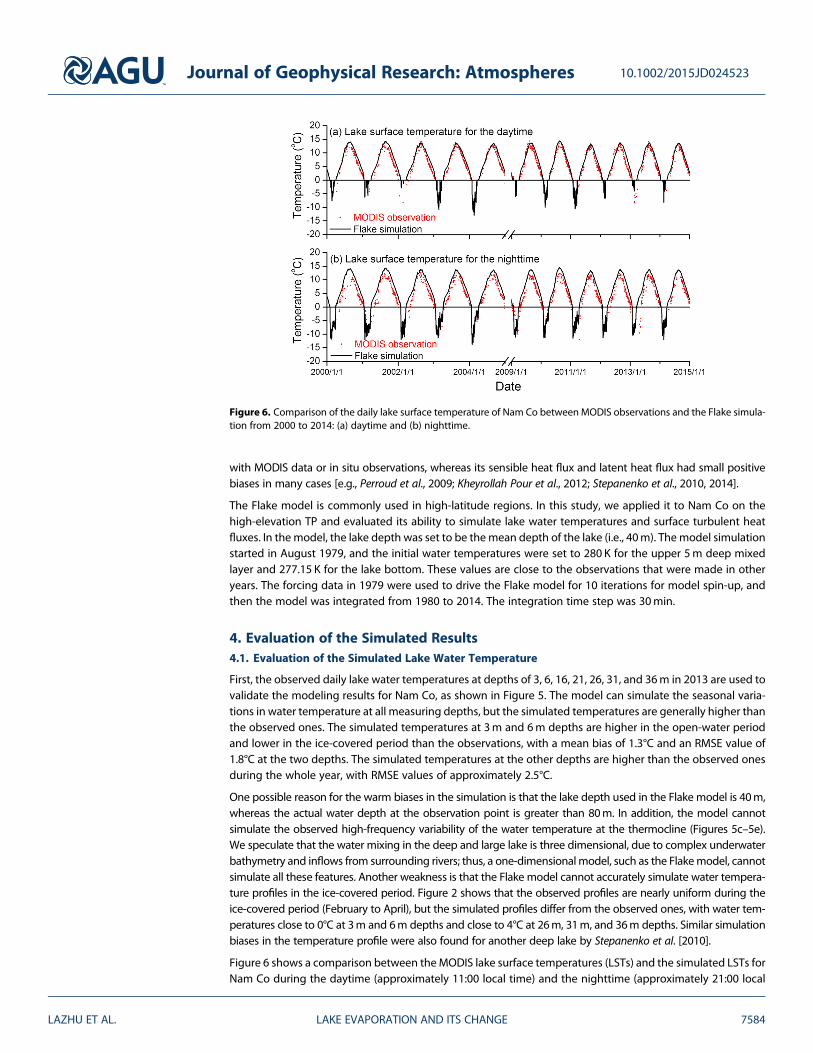
Figure 6 shows a comparison between theMODIS lake surface temperatures (LSTs) and the simulated LSTs forNam Co during the daytime (approximately 11:00 local time) and the nighttime (approximately 21:00 local
Figure 6. Comparison of the daily lake surface temperature of Nam Co betweenMODIS observations and the Flake simula-tion from 2000 to 2014: (a) daytime and (b) nighttime.
Journal of Geophysical Research: Atmospheres 10.1002/2015JD024523
LAZHU ET AL. LAKE EVAPORATION AND ITS CHANGE 7584
time) from 2000 to 2014. The MODIS data are mainly available during the open-water period (May–December). During the ice-covered period (January–April), few MODIS data are available, perhaps due towrong discrimination of clouds from lake ice/snow. During the open-water period, the simulated LSTs areconsistent with MODIS observations for the daytime, except for some years (e.g., 2001) with mean biasand RMSE values of 1.3°C and 1.7°C, respectively. The simulation errors for the nighttime are larger, with amean bias of 2.2°C and an RMSE of 2.7°C.
Regarding the ice formation and its duration, Qu et al. [2012] indicated that the observed freezeup date wasusually in February and that the observed free-of-ice date was in early May. In Figure 6, the process of simu-lated lake surface temperature change is synchronous with that of MODIS observation, which minimizes theuncertainties of evaporation caused by inaccurate ice formation and its duration.
In summary, the evaluation of in situ and MODIS observations indicates that the model can roughly producethe observed seasonal variations, but the simulated lake temperatures are higher than the observed ones,with a mean bias of 1.3°C for the mixed layer and 2.1–2.4°C for deeper layers.
4.2. Evaluation of Simulated Latent and Sensible Heat Fluxes
The heat fluxes simulated by the Flake model cannot be validated directly, due to the lack of observations. Inthis study, we used the lake surface energy balance equation combined with the observation-derived Bowenratio to obtain the sensible heat flux and latent heat flux in 2013, which were used in the validation as refer-ence values (hereafter “reference”). The lake surface energy balance is as follows:
Rnet � G ¼ lEþ H; (1)
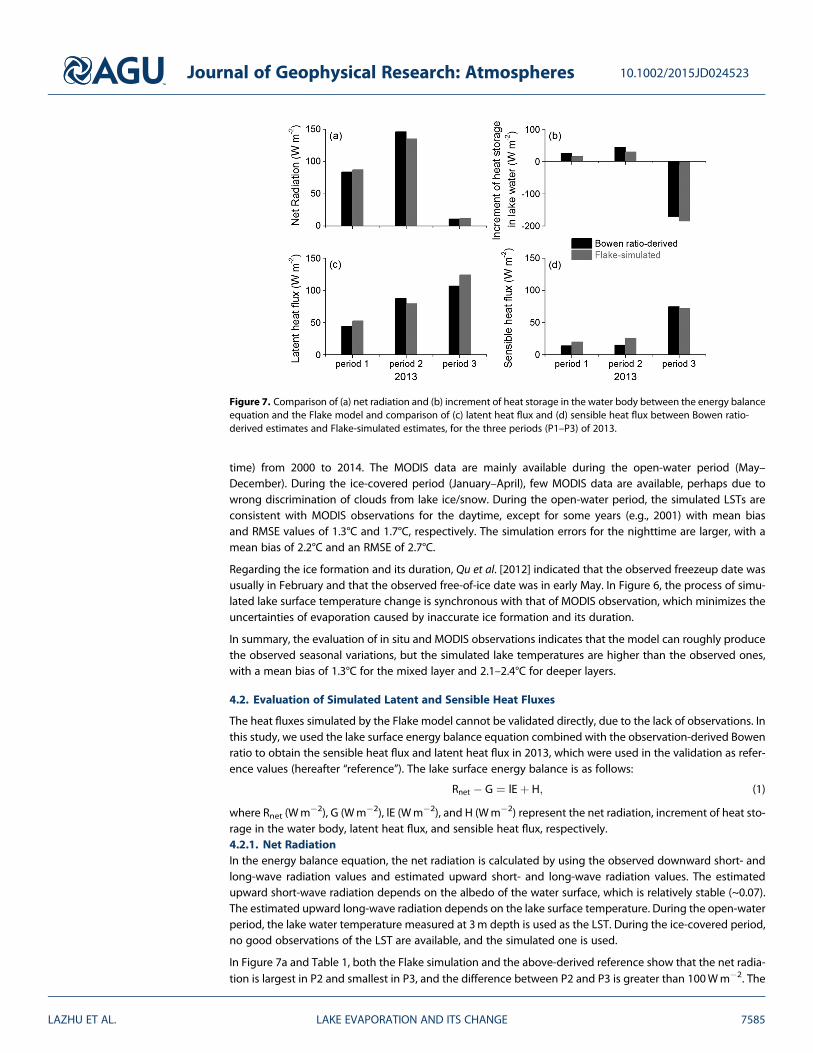
where Rnet (Wm�2), G (Wm�2), lE (Wm�2), and H (Wm�2) represent the net radiation, increment of heat sto-rage in the water body, latent heat flux, and sensible heat flux, respectively.4.2.1. Net RadiationIn the energy balance equation, the net radiation is calculated by using the observed downward short- andlong-wave radiation values and estimated upward short- and long-wave radiation values. The estimatedupward short-wave radiation depends on the albedo of the water surface, which is relatively stable (~0.07).The estimated upward long-wave radiation depends on the lake surface temperature. During the open-waterperiod, the lake water temperature measured at 3m depth is used as the LST. During the ice-covered period,no good observations of the LST are available, and the simulated one is used.
In Figure 7a and Table 1, both the Flake simulation and the above-derived reference show that the net radia-tion is largest in P2 and smallest in P3, and the difference between P2 and P3 is greater than 100Wm�2. The
Figure 7. Comparison of (a) net radiation and (b) increment of heat storage in the water body between the energy balanceequation and the Flake model and comparison of (c) latent heat flux and (d) sensible heat flux between Bowen ratio-derived estimates and Flake-simulated estimates, for the three periods (P1–P3) of 2013.
Journal of Geophysical Research: Atmospheres 10.1002/2015JD024523
LAZHU ET AL. LAKE EVAPORATION AND ITS CHANGE 7585
simulated net radiation value is close to the reference in P3, but the former is less than the latter by 10Wm�2
in P2, due to the higher LST in the simulation.4.2.2. Heat StorageThe increment of heat storage in the water body is calculated using the water temperature profile observedin 2013 via the following formula:
G ¼ ρ�C� dθdt
dz; (2)
where ρ (kgm�3) is the density of water, C (J kg�1 °C�1) is the specific heat of water, θ (°C) is the lake watertemperature at depth z (m), and t (s) is time.
Figure 7b and Table 1 show the increment of heat storage in the water body, which is derived from theobserved temperature profile data and the simulated one in the three periods of 2013. The increment of heatstorage (G) in the water body has a different temporal pattern of change compared with the net radiation.Both the observation and the simulation indicate that the G values are positive during the first two periods,indicating that the water surface is absorbing energy. During P3, both the observation and the simulationindicate that this term has a large negative value, indicating that a huge amount of energy is being releasedfrom the water surface. The simulation estimates more energy absorption in P1 and P2 and less energyrelease in P3 than the reference value, and their difference is approximately 10Wm�2.4.2.3. Sensible and Latent Heat FluxesThe Bowen ratio is defined as the ratio of sensible heat flux and latent heat flux, and the Bowen ratio equationis as follows [Rosenberry et al., 2007]:
R ¼ HlE
¼ CpPεL
To � Taeo � ea
(3)
where Cp= 1004 J kg� 1 K� 1, L = 2.56 × 10⁶ J kg� 1, ε = 0.622, P(Pa) is the air pressure, T(°C) is the lakesurface temperature, Ta(°C) is the air temperature over the lake surface, eo (Pa) is the saturation vapor pressureat the lake surface temperature, and ea(Pa) is the air vapor pressure over the lake surface.
The reference of the latent and sensible heat flux is calculated by combining equations 1–3. In this study, theair temperatures and vapor pressures measured at Nam Co station, which is approximately 1.5 km from theshoreline, are used. The air temperature and humidity values at the station are nearly identical to those mea-sured at another station in the lake (not shown), and the station in the lake contains only several months data;therefore, it is reasonable to use the measurements at Nam Co station to estimate the lake heat fluxes.
Figures 7c and 7d show the comparison of latent and sensible heat fluxes between the Bowen ratio-derivedestimates and Flake-simulated estimates for three periods in 2013. Both the derived and simulated latentheat fluxes increase from P1 to P3, and their values during P3 are 107Wm�2 and 124Wm�2, respectively(Table 1). Similarly, both the derived and the simulated sensible heat fluxes increase from P1 to P3, but theyhave a smaller magnitude (74Wm�2 and 72Wm�2 during P3, respectively). The simulated fluxes differslightly from the Bowen ratio-derived fluxes, but their annual mean fluxes are similar (72.6Wm�2 and75.8Wm�2 for latent heat flux, respectively; 24.4Wm�2 and 31.0Wm�2 for sensible heat flux, respectively).
Table 1. The Lake Surface Energy Budget Comparison Between the Observation-Derived Reference Data and the FlakeSimulation for the Three Periods and Annual Mean in 2013a
Rnet (Wm�2) G (Wm�2) lE (Wm�2) H (Wm�2)
Reference data Period 1 83.9 25.9 44.1 13.9Period 2 147 44.4 87.2 14.9Period 3 10.7 170.3 106.6 74.4Annual 97.9 0.9 72.6 24.4
Flake simulation Period 1 87.6 15.2 52.6 19.8Period 2 135.2 30.2 79.4 25.6Period 3 11.7 �184.7 124.2 72.2Annual 94.9 �11.9 75.8 31.0
aRnet is the net radiation, G is the increment of heat storage in the water body, lE is the latent heat flux, and H is thesensible heat flux.
Journal of Geophysical Research: Atmospheres 10.1002/2015JD024523
LAZHU ET AL. LAKE EVAPORATION AND ITS CHANGE 7586
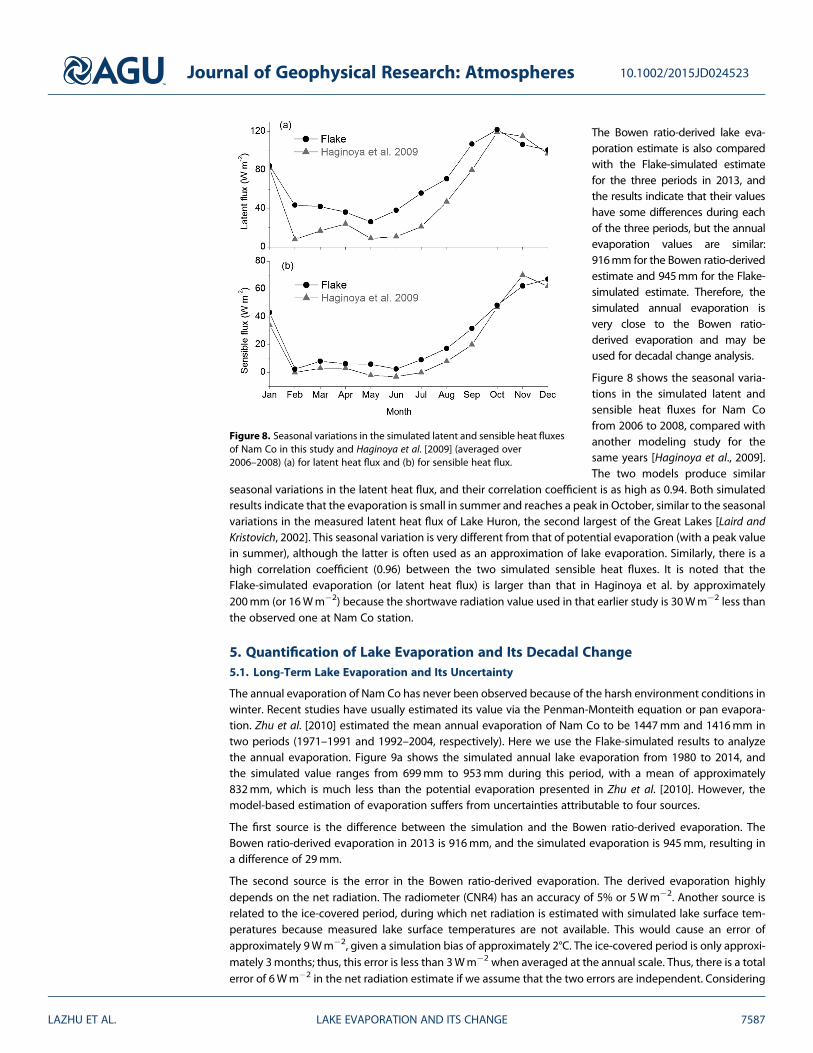
The Bowen ratio-derived lake eva-poration estimate is also comparedwith the Flake-simulated estimatefor the three periods in 2013, andthe results indicate that their valueshave some differences during eachof the three periods, but the annualevaporation values are similar:916mm for the Bowen ratio-derivedestimate and 945mm for the Flake-simulated estimate. Therefore, thesimulated annual evaporation isvery close to the Bowen ratio-derived evaporation and may beused for decadal change analysis.
Figure 8 shows the seasonal varia-tions in the simulated latent andsensible heat fluxes for Nam Cofrom 2006 to 2008, compared withanother modeling study for thesame years [Haginoya et al., 2009].The two models produce similar
seasonal variations in the latent heat flux, and their correlation coefficient is as high as 0.94. Both simulatedresults indicate that the evaporation is small in summer and reaches a peak in October, similar to the seasonalvariations in the measured latent heat flux of Lake Huron, the second largest of the Great Lakes [Laird andKristovich, 2002]. This seasonal variation is very different from that of potential evaporation (with a peak valuein summer), although the latter is often used as an approximation of lake evaporation. Similarly, there is ahigh correlation coefficient (0.96) between the two simulated sensible heat fluxes. It is noted that theFlake-simulated evaporation (or latent heat flux) is larger than that in Haginoya et al. by approximately200mm (or 16Wm�2) because the shortwave radiation value used in that earlier study is 30Wm�2 less thanthe observed one at Nam Co station.
5. Quantification of Lake Evaporation and Its Decadal Change5.1. Long-Term Lake Evaporation and Its Uncertainty
The annual evaporation of Nam Co has never been observed because of the harsh environment conditions inwinter. Recent studies have usually estimated its value via the Penman-Monteith equation or pan evapora-tion. Zhu et al. [2010] estimated the mean annual evaporation of Nam Co to be 1447mm and 1416mm intwo periods (1971–1991 and 1992–2004, respectively). Here we use the Flake-simulated results to analyzethe annual evaporation. Figure 9a shows the simulated annual lake evaporation from 1980 to 2014, andthe simulated value ranges from 699mm to 953mm during this period, with a mean of approximately832mm, which is much less than the potential evaporation presented in Zhu et al. [2010]. However, themodel-based estimation of evaporation suffers from uncertainties attributable to four sources.
The first source is the difference between the simulation and the Bowen ratio-derived evaporation. TheBowen ratio-derived evaporation in 2013 is 916mm, and the simulated evaporation is 945mm, resulting ina difference of 29mm.
The second source is the error in the Bowen ratio-derived evaporation. The derived evaporation highlydepends on the net radiation. The radiometer (CNR4) has an accuracy of 5% or 5Wm�2. Another source isrelated to the ice-covered period, during which net radiation is estimated with simulated lake surface tem-peratures because measured lake surface temperatures are not available. This would cause an error ofapproximately 9Wm�2, given a simulation bias of approximately 2°C. The ice-covered period is only approxi-mately 3months; thus, this error is less than 3Wm�2 when averaged at the annual scale. Thus, there is a totalerror of 6Wm�2 in the net radiation estimate if we assume that the two errors are independent. Considering
Figure 8. Seasonal variations in the simulated latent and sensible heat fluxesof Nam Co in this study and Haginoya et al. [2009] (averaged over2006–2008) (a) for latent heat flux and (b) for sensible heat flux.
Journal of Geophysical Research: Atmospheres 10.1002/2015JD024523
LAZHU ET AL. LAKE EVAPORATION AND ITS CHANGE 7587
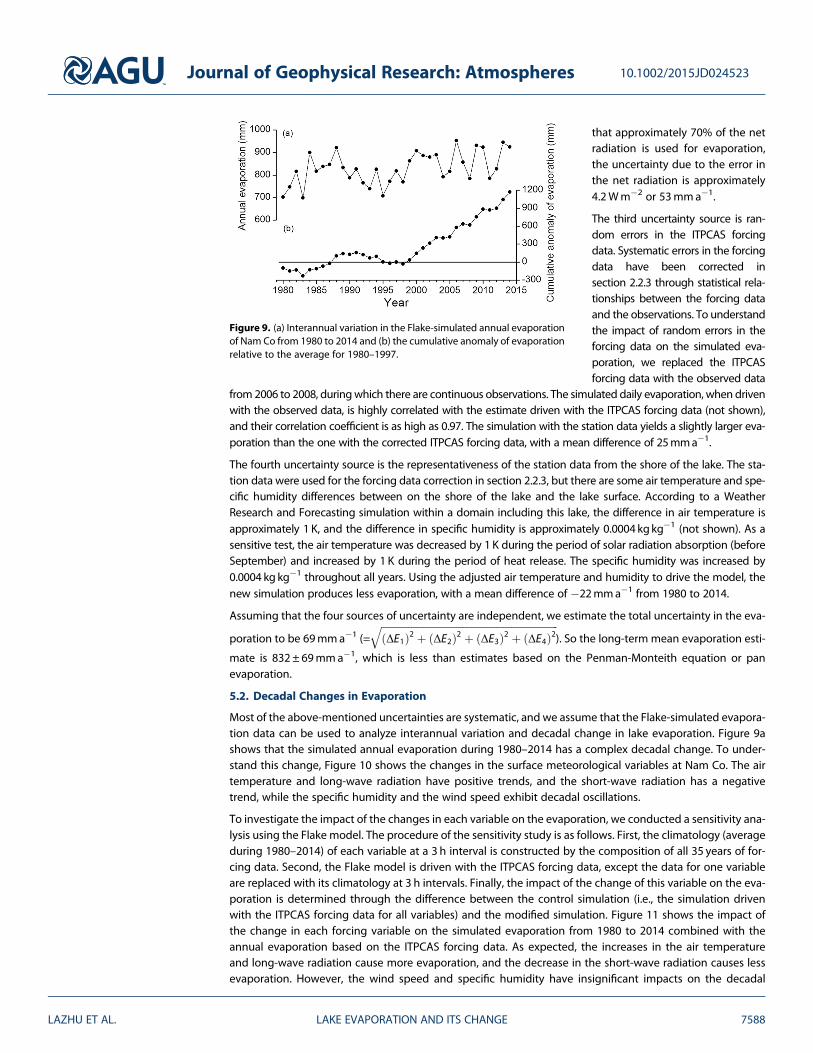
that approximately 70% of the netradiation is used for evaporation,the uncertainty due to the error inthe net radiation is approximately4.2Wm�2 or 53mma�1.
The third uncertainty source is ran-dom errors in the ITPCAS forcingdata. Systematic errors in the forcingdata have been corrected insection 2.2.3 through statistical rela-tionships between the forcing dataand the observations. To understandthe impact of random errors in theforcing data on the simulated eva-poration, we replaced the ITPCASforcing data with the observed data
from 2006 to 2008, duringwhich there are continuous observations. The simulated daily evaporation, when drivenwith the observed data, is highly correlated with the estimate driven with the ITPCAS forcing data (not shown),and their correlation coefficient is as high as 0.97. The simulation with the station data yields a slightly larger eva-poration than the one with the corrected ITPCAS forcing data, with a mean difference of 25mma�1.
The fourth uncertainty source is the representativeness of the station data from the shore of the lake. The sta-tion data were used for the forcing data correction in section 2.2.3, but there are some air temperature and spe-cific humidity differences between on the shore of the lake and the lake surface. According to a WeatherResearch and Forecasting simulation within a domain including this lake, the difference in air temperature isapproximately 1 K, and the difference in specific humidity is approximately 0.0004 kgkg�1 (not shown). As asensitive test, the air temperature was decreased by 1 K during the period of solar radiation absorption (beforeSeptember) and increased by 1 K during the period of heat release. The specific humidity was increased by0.0004 kg kg�1 throughout all years. Using the adjusted air temperature and humidity to drive the model, thenew simulation produces less evaporation, with a mean difference of �22mma�1 from 1980 to 2014.
Assuming that the four sources of uncertainty are independent, we estimate the total uncertainty in the eva-
poration to be 69mma�1 (=ffiffiffiffiffiffiffiffiffiffiffiffiffiffiffiffiffiffiffiffiffiffiffiffiffiffiffiffiffiffiffiffiffiffiffiffiffiffiffiffiffiffiffiffiffiffiffiffiffiffiffiffiffiffiffiffiffiffiffiffiffiffiffiffiffiffiffiffiffiffiffiΔE1ð Þ2 þ ΔE2ð Þ2 þ ΔE3ð Þ2 þ ΔE4ð Þ2
q). So the long-term mean evaporation esti-
mate is 832 ± 69mma�1, which is less than estimates based on the Penman-Monteith equation or panevaporation.
5.2. Decadal Changes in Evaporation
Most of the above-mentioned uncertainties are systematic, and we assume that the Flake-simulated evapora-tion data can be used to analyze interannual variation and decadal change in lake evaporation. Figure 9ashows that the simulated annual evaporation during 1980–2014 has a complex decadal change. To under-stand this change, Figure 10 shows the changes in the surface meteorological variables at Nam Co. The airtemperature and long-wave radiation have positive trends, and the short-wave radiation has a negativetrend, while the specific humidity and the wind speed exhibit decadal oscillations.
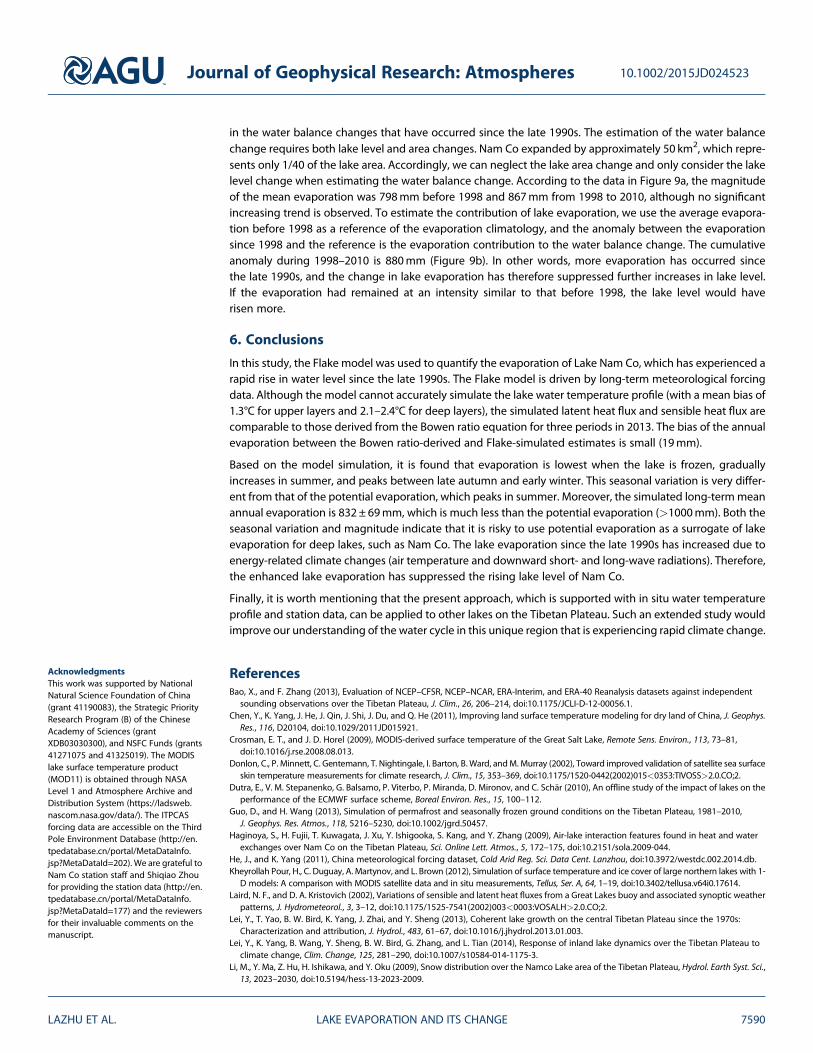
To investigate the impact of the changes in each variable on the evaporation, we conducted a sensitivity ana-lysis using the Flake model. The procedure of the sensitivity study is as follows. First, the climatology (averageduring 1980–2014) of each variable at a 3 h interval is constructed by the composition of all 35 years of for-cing data. Second, the Flake model is driven with the ITPCAS forcing data, except the data for one variableare replaced with its climatology at 3 h intervals. Finally, the impact of the change of this variable on the eva-poration is determined through the difference between the control simulation (i.e., the simulation drivenwith the ITPCAS forcing data for all variables) and the modified simulation. Figure 11 shows the impact ofthe change in each forcing variable on the simulated evaporation from 1980 to 2014 combined with theannual evaporation based on the ITPCAS forcing data. As expected, the increases in the air temperatureand long-wave radiation cause more evaporation, and the decrease in the short-wave radiation causes lessevaporation. However, the wind speed and specific humidity have insignificant impacts on the decadal
Figure 9. (a) Interannual variation in the Flake-simulated annual evaporationof Nam Co from 1980 to 2014 and (b) the cumulative anomaly of evaporationrelative to the average for 1980–1997.
Journal of Geophysical Research: Atmospheres 10.1002/2015JD024523
LAZHU ET AL. LAKE EVAPORATION AND ITS CHANGE 7588
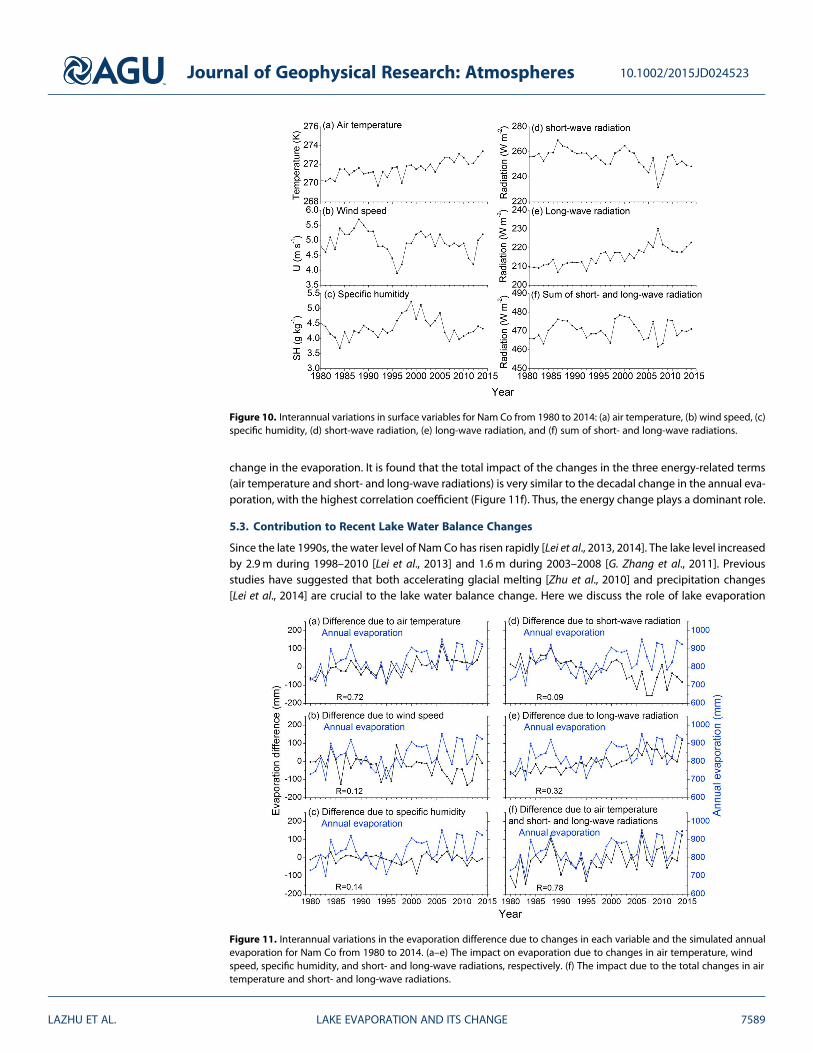
change in the evaporation. It is found that the total impact of the changes in the three energy-related terms(air temperature and short- and long-wave radiations) is very similar to the decadal change in the annual eva-poration, with the highest correlation coefficient (Figure 11f). Thus, the energy change plays a dominant role.
5.3. Contribution to Recent Lake Water Balance Changes
Since the late 1990s, the water level of Nam Co has risen rapidly [Lei et al., 2013, 2014]. The lake level increasedby 2.9m during 1998–2010 [Lei et al., 2013] and 1.6m during 2003–2008 [G. Zhang et al., 2011]. Previousstudies have suggested that both accelerating glacial melting [Zhu et al., 2010] and precipitation changes[Lei et al., 2014] are crucial to the lake water balance change. Here we discuss the role of lake evaporation
Figure 10. Interannual variations in surface variables for Nam Co from 1980 to 2014: (a) air temperature, (b) wind speed, (c)specific humidity, (d) short-wave radiation, (e) long-wave radiation, and (f) sum of short- and long-wave radiations.
Figure 11. Interannual variations in the evaporation difference due to changes in each variable and the simulated annualevaporation for Nam Co from 1980 to 2014. (a–e) The impact on evaporation due to changes in air temperature, windspeed, specific humidity, and short- and long-wave radiations, respectively. (f) The impact due to the total changes in airtemperature and short- and long-wave radiations.
Journal of Geophysical Research: Atmospheres 10.1002/2015JD024523
LAZHU ET AL. LAKE EVAPORATION AND ITS CHANGE 7589
in the water balance changes that have occurred since the late 1990s. The estimation of the water balancechange requires both lake level and area changes. Nam Co expanded by approximately 50 km2, which repre-sents only 1/40 of the lake area. Accordingly, we can neglect the lake area change and only consider the lakelevel change when estimating the water balance change. According to the data in Figure 9a, the magnitudeof the mean evaporation was 798mm before 1998 and 867mm from 1998 to 2010, although no significantincreasing trend is observed. To estimate the contribution of lake evaporation, we use the average evapora-tion before 1998 as a reference of the evaporation climatology, and the anomaly between the evaporationsince 1998 and the reference is the evaporation contribution to the water balance change. The cumulativeanomaly during 1998–2010 is 880mm (Figure 9b). In other words, more evaporation has occurred sincethe late 1990s, and the change in lake evaporation has therefore suppressed further increases in lake level.If the evaporation had remained at an intensity similar to that before 1998, the lake level would haverisen more.
6. Conclusions
In this study, the Flake model was used to quantify the evaporation of Lake Nam Co, which has experienced arapid rise in water level since the late 1990s. The Flake model is driven by long-term meteorological forcingdata. Although the model cannot accurately simulate the lake water temperature profile (with a mean bias of1.3°C for upper layers and 2.1–2.4°C for deep layers), the simulated latent heat flux and sensible heat flux arecomparable to those derived from the Bowen ratio equation for three periods in 2013. The bias of the annualevaporation between the Bowen ratio-derived and Flake-simulated estimates is small (19mm).
Based on the model simulation, it is found that evaporation is lowest when the lake is frozen, graduallyincreases in summer, and peaks between late autumn and early winter. This seasonal variation is very differ-ent from that of the potential evaporation, which peaks in summer. Moreover, the simulated long-termmeanannual evaporation is 832 ± 69mm, which is much less than the potential evaporation (>1000mm). Both theseasonal variation and magnitude indicate that it is risky to use potential evaporation as a surrogate of lakeevaporation for deep lakes, such as Nam Co. The lake evaporation since the late 1990s has increased due toenergy-related climate changes (air temperature and downward short- and long-wave radiations). Therefore,the enhanced lake evaporation has suppressed the rising lake level of Nam Co.
Finally, it is worth mentioning that the present approach, which is supported with in situ water temperatureprofile and station data, can be applied to other lakes on the Tibetan Plateau. Such an extended study wouldimprove our understanding of the water cycle in this unique region that is experiencing rapid climate change.
ReferencesBao, X., and F. Zhang (2013), Evaluation of NCEP–CFSR, NCEP–NCAR, ERA-Interim, and ERA-40 Reanalysis datasets against independent
sounding observations over the Tibetan Plateau, J. Clim., 26, 206–214, doi:10.1175/JCLI-D-12-00056.1.Chen, Y., K. Yang, J. He, J. Qin, J. Shi, J. Du, and Q. He (2011), Improving land surface temperature modeling for dry land of China, J. Geophys.
Res., 116, D20104, doi:10.1029/2011JD015921.Crosman, E. T., and J. D. Horel (2009), MODIS-derived surface temperature of the Great Salt Lake, Remote Sens. Environ., 113, 73–81,
doi:10.1016/j.rse.2008.08.013.Donlon, C., P. Minnett, C. Gentemann, T. Nightingale, I. Barton, B. Ward, andM. Murray (2002), Toward improved validation of satellite sea surface
skin temperature measurements for climate research, J. Clim., 15, 353–369, doi:10.1175/1520-0442(2002)015<0353:TIVOSS>2.0.CO;2.Dutra, E., V. M. Stepanenko, G. Balsamo, P. Viterbo, P. Miranda, D. Mironov, and C. Schär (2010), An offline study of the impact of lakes on the
performance of the ECMWF surface scheme, Boreal Environ. Res., 15, 100–112.Guo, D., and H. Wang (2013), Simulation of permafrost and seasonally frozen ground conditions on the Tibetan Plateau, 1981–2010,
J. Geophys. Res. Atmos., 118, 5216–5230, doi:10.1002/jgrd.50457.Haginoya, S., H. Fujii, T. Kuwagata, J. Xu, Y. Ishigooka, S. Kang, and Y. Zhang (2009), Air-lake interaction features found in heat and water
exchanges over Nam Co on the Tibetan Plateau, Sci. Online Lett. Atmos., 5, 172–175, doi:10.2151/sola.2009-044.He, J., and K. Yang (2011), China meteorological forcing dataset, Cold Arid Reg. Sci. Data Cent. Lanzhou, doi:10.3972/westdc.002.2014.db.Kheyrollah Pour, H., C. Duguay, A. Martynov, and L. Brown (2012), Simulation of surface temperature and ice cover of large northern lakes with 1-
D models: A comparison with MODIS satellite data and in situ measurements, Tellus, Ser. A, 64, 1–19, doi:10.3402/tellusa.v64i0.17614.Laird, N. F., and D. A. Kristovich (2002), Variations of sensible and latent heat fluxes from a Great Lakes buoy and associated synoptic weather
patterns, J. Hydrometeorol., 3, 3–12, doi:10.1175/1525-7541(2002)003<0003:VOSALH>2.0.CO;2.Lei, Y., T. Yao, B. W. Bird, K. Yang, J. Zhai, and Y. Sheng (2013), Coherent lake growth on the central Tibetan Plateau since the 1970s:
Characterization and attribution, J. Hydrol., 483, 61–67, doi:10.1016/j.jhydrol.2013.01.003.Lei, Y., K. Yang, B. Wang, Y. Sheng, B. W. Bird, G. Zhang, and L. Tian (2014), Response of inland lake dynamics over the Tibetan Plateau to
climate change, Clim. Change, 125, 281–290, doi:10.1007/s10584-014-1175-3.Li, M., Y. Ma, Z. Hu, H. Ishikawa, and Y. Oku (2009), Snow distribution over the Namco Lake area of the Tibetan Plateau, Hydrol. Earth Syst. Sci.,
13, 2023–2030, doi:10.5194/hess-13-2023-2009.
Journal of Geophysical Research: Atmospheres 10.1002/2015JD024523
LAZHU ET AL. LAKE EVAPORATION AND ITS CHANGE 7590
AcknowledgmentsThis work was supported by NationalNatural Science Foundation of China(grant 41190083), the Strategic PriorityResearch Program (B) of the ChineseAcademy of Sciences (grantXDB03030300), and NSFC Funds (grants41271075 and 41325019). The MODISlake surface temperature product(MOD11) is obtained through NASALevel 1 and Atmosphere Archive andDistribution System (https://ladsweb.nascom.nasa.gov/data/). The ITPCASforcing data are accessible on the ThirdPole Environment Database (http://en.tpedatabase.cn/portal/MetaDataInfo.jsp?MetaDataId=202). We are grateful toNam Co station staff and Shiqiao Zhoufor providing the station data (http://en.tpedatabase.cn/portal/MetaDataInfo.jsp?MetaDataId=177) and the reviewersfor their invaluable comments on themanuscript.
Liu, J. G., and Z. H. Xie (2013), Improving simulation of soil moisture in China using a multiple meteorological forcing ensemble approach,Hydrol. Earth Syst. Sci., 17, 3355–3369, doi:10.5194/hess-17-3355-2013.
Lofgren, B. M. (1997), Simulated effects of idealized Laurentian Great Lakes on regional and large-scale climate, J. Clim., 10, 2847–2858,doi:10.1175/1520-0442(1997)010<2847:SEOILG>2.0.CO;2.
Long, Z., W. Perrie, J. Gyakum, D. Caya, and R. Laprise (2007), Northern lake impacts on local seasonal climate, J. Hydrometeorol., 8, 881–896,doi:10.1175/JHM591.1.
Ma, R., et al. (2011), China’s lakes at present: Number, area and spatial distribution, Sci. Chin. Earth Sci., 54, 283–289, doi:10.1007/s11430-010-4052-6.
Mironov, D. (2008), Parameterization of lakes in numerical weather prediction. Description of a lake model COSMO Tech. Rep. No.11.Deutscher Wetterdienst Offenbach am Main, Germany.
Oesch, D. C., J. M. Jaquet, A. Hauser, and S. Wunderle (2005), Lake surface water temperature retrieval using advanced very high resolutionradiometer and Moderate Resolution Imaging Spectroradiometer data: Validation and feasibility study, J. Geophys. Res., 110, C12014,doi:10.1029/2004JC002857.
Perroud, M., S. Goyette, A. Martynov, M. Beniston, and O. Annevillec (2009), Simulation of multiannual thermal profiles in deep Lake Geneva:A comparison of one-dimensional lake models, Limnol. Oceanogr., 54, 1574–1594, doi:10.4319/lo.2009.54.5.1574.
Qu, B., S. Kang, F. Chen, Y. Zhang, and G. Zhang (2012), Lake ice and its effect factors in the Nam Co Basin, Tibetan Plateau [in Chinese], Adv.Clim. Change Res., 8(5), 327–333, doi:10.3969/j.issn.1673-1719.2012.05.003.
Reinart, A., and M. Reinhold (2008), Mapping surface temperature in large lakes with MODIS data, Remote Sens. Environ., 112, 603–611,doi:10.1016/j.rse.2007.05.015.
Robinson, I., N. Wells, and H. Charnock (1984), The sea surface thermal boundary layer and its relevance to the measurement of sea surfacetemperature by airborne and spaceborne radiometers, Int. J. Remote Sens., 5, 19–45, doi:10.1080/01431168408948787.
Rosenberry, D. O., T. C. Winter, D. C. Buso, and G. E. Likens (2007), Comparison of 15 evaporation methods applied to a small mountain lake inthe northeastern USA, J. Hydrol., 340, 149–166, doi:10.1016/j.jhydrol.2007.03.018.
Savtchenko, A., D. Ouzounov, S. Ahmad, J. Acker, G. Leptoukh, J. Koziana, and D. Nickless (2004), Terra and Aqua MODIS products availablefrom NASA GES DAAC, Adv. Space Res., 34, 710–714, doi:10.1016/j.asr.2004.03.012.
Song, C., B. Huang, K. Richards, L. Ke, and V. H. Phan (2014), Accelerated lake expansion on the Tibetan Plateau in the 2000s: Induced byglacial melting or other processes?, Water Resour. Res., 50, 3170–3186, doi:10.1002/2013WR014724.
Stepanenko, V. M., S. Goyette, A. Martynov, M. Perroud, X. Fang, and D. Mironov (2010), First steps of a Lake Model Intercomparison Project:LakeMIP, Boreal Environ. Res., 15, 191–202.
Stepanenko, V. M., K. D. Jöhnk, E. Machulskaya, M. Perroud, Z. Subin, A. Nordbo, I. Mammarella, and D. Mironov (2014), Simulation of surfaceenergy fluxes and stratification of a small boreal lake by a set of one-dimensional models, Tellus, Ser. A, 66, doi:10.3402/tellusa.v66.21389.
Wan, Z., Y. Zhang, Q. Zhang, and Z. L. Li (2004), Quality assessment and validation of the MODIS global land surface temperature, Int. J.Remote Sens., 25, 261–274, doi:10.1080/0143116031000116417.
Wang, A., and X. Zeng (2012), Evaluation of multireanalysis products with in situ observations over the Tibetan Plateau, J. Geophys. Res., 117,D05102, doi:10.1029/2011JD016553.
Wang, B., Y. Ma, X. Chen, W. Ma, Z. Su, and M. Menenti (2015), Observation and simulation of lake-air heat and water transfer processes in ahigh-altitude shallow lake on the Tibetan Plateau, J. Geophys. Res. Atmos., 120, 12,327–12,344, doi:10.1002/2015JD023863.
Wang, J., L. Zhu, G. Daut, J. Ju, X. Lin, Y. Wang, and X. Zhen (2009), Investigation of bathymetry and water quality of Lake Nam Co, the largestlake on the central Tibetan Plateau, China, Limnology, 10, 149–158, doi:10.1007/s10201-009-0266-8.
Wang, Z. (2015), Evaporation measurements of Nam Co, central Tibetan Plateau using eddy covariance method MS thesis, Inst. of TibetanPlateau Res., Chin. Acad. Sci., Beijing, China.
Wen, L., N. Nagabhatla, L. Zhao, Z. Li, and S. Chen (2015), Impacts of salinity parameterizations on temperature simulation over and in ahypersaline lake, Chin. J. Oceanol. Limnol., 33, 790–801, doi:10.1007/s00343-015-4153-3.
Wu, Y., H. Zheng, B. Zhang, D. Chen, and L. Lei (2014), Long-term changes of lake level and water budget in the Nam Co Basin, central TibetanPlateau, J. Hydrometeorol., 15, 1312–1322, doi:10.1175/JHM-D-13-093.1.
Xiao, F., F. Ling, Y. Du, Q. Feng, Y. Yan, and H. Chen (2013), Evaluation of spatial-temporal dynamics in surface water temperature of QinghaiLake from 2001 to 2010 by using MODIS data, J. Arid Land, 5, 452–464, doi:10.1007/s40333-013-0188-5.
Yang, K., B. Ye, D. Zhou, B. Wu, T. Foken, J. Qin, and Z. Zhou (2011), Response of hydrological cycle to recent climate changes in the TibetanPlateau, Clim. Change, 109, 517–534, doi:10.1007/s10584-011-0099-4.
Yang, K., H. Wu, J. Qin, C. Lin, W. Tang, and Y. Chen (2014), Recent climate changes over the Tibetan Plateau and their impacts on energy andwater cycle: A review, Global Planet. Change, 112, 79–91, doi:10.1016/j.gloplacha.2013.12.001.
Yu, S., J. Liu, J. Xu, and H. Wang (2011), Evaporation and energy balance estimates over a large inland lake in the Tibet-Himalaya, Environ.Earth Sci., 64, 1169–1176, doi:10.1007/s12665-011-0933-z.
Zhang, B., Y. Wu, L. Zhu, J. Wang, J. Li, and D. Chen (2011), Estimation and trend detection of water storage at Nam Co, central TibetanPlateau, J. Hydrol., 405, 161–170, doi:10.1016/j.jhydrol.2011.05.018.
Zhang, G., H. Xie, S. Kang, D. Yi, and S. F. Ackley (2011), Monitoring lake level changes on the Tibetan Plateau using ICESat altimetry data(2003–2009), Remote Sens. Environ., 115, 1733–1742, doi:10.1016/j.rse.2011.03.005.
Zhang, G., T. Yao, H. Xie, J. Qin, Q. Ye, Y. Dai, and R. Guo (2014), Estimating surface temperature changes of lakes in the Tibetan Plateau usingMODIS LST data, J. Geophys. Res. Atmos., 119, 8552–8567, doi:10.1002/2014JD021615.
Zhang, Y., C. Liu, Y. Tang, and Y. Yang (2007), Trends in pan evaporation and reference and actual evapotranspiration across the TibetanPlateau, J. Geophys. Res., 112, D12110, doi:10.1029/2006JD008161.
Zhou, S., S. Kang, F. Chen, and D. R. Joswiak (2013), Water balance observations reveal significant subsurface water seepage from Lake NamCo, south-central Tibetan Plateau, J. Hydrol., 491, 89–99, doi:10.1016/j.jhydrol.2013.03.030.
Zhu, L., M. Xie, and Y. Wu (2010), Quantitative analysis of lake area variations and the influence factors from 1971 to 2004 in the Nam Co Basinof the Tibetan Plateau, Chin. Sci. Bull., 55, 1294–1303, doi:10.1007/s11434-010-0015-8.
Zou, H., J. Zhu, L. Zhou, P. Li, and S. Ma (2014), Validation and application of reanalysis temperature data over the Tibetan Plateau, J. Meteorol.Res., 28, 139–149, doi:10.1007/s13351-014-3027-5.
Journal of Geophysical Research: Atmospheres 10.1002/2015JD024523
LAZHU ET AL. LAKE EVAPORATION AND ITS CHANGE 7591
Related Documents