™ Trademark Q4 and Full Year 2014 Earnings Summary March 5, 2015

Q4 2014 earning release deck final
Jul 16, 2015
Welcome message from author
This document is posted to help you gain knowledge. Please leave a comment to let me know what you think about it! Share it to your friends and learn new things together.
Transcript

™ Trademark
Q4 and Full Year 2014 Earnings Summary
March 5, 2015
Introductions & Disclosure Rules
2
Disclosure Rules The forward looking statements contained in this presentation involve risks and uncertainties that may
affect the Company's operations, markets, products, services, prices and other factors. These risks and uncertainties include, but are not limited to, economic, competitive, legal, governmental and technological factors. Accordingly, there is no assurance that the Company's expectations expressed in such forward looking statements will be realized. The Company assumes no obligation to provide revisions to any forward looking statements in this presentation should circumstances change.
This presentation contains financial measures that are not in accordance with generally accepted accounting principles in the US (“GAAP”) including Adjusted EBITDA, Adjusted EBITDA excluding inventory revaluation, Adjusted Net Income (loss), Adjusted Net Income (loss) excluding inventory revaluation, Adjusted EPS, and Adjusted EPS excluding inventory revaluation. We believe these measures provide relevant and meaningful information to investors and lenders about the ongoing operating results of the Company. Such measures when referenced herein should not be viewed as an alternative to GAAP measures of performance. We have provided a reconciliation of these measures in the Appendix section of this presentation.
Introductions Chris Pappas, President & CEO John Feenan, Executive Vice President & CFO David Stasse, Vice President, Treasury & Investor Relations

Agenda
3
Business Overview
Financial Review
Forward Focus
Q&A
Trinseo Business Overview
4
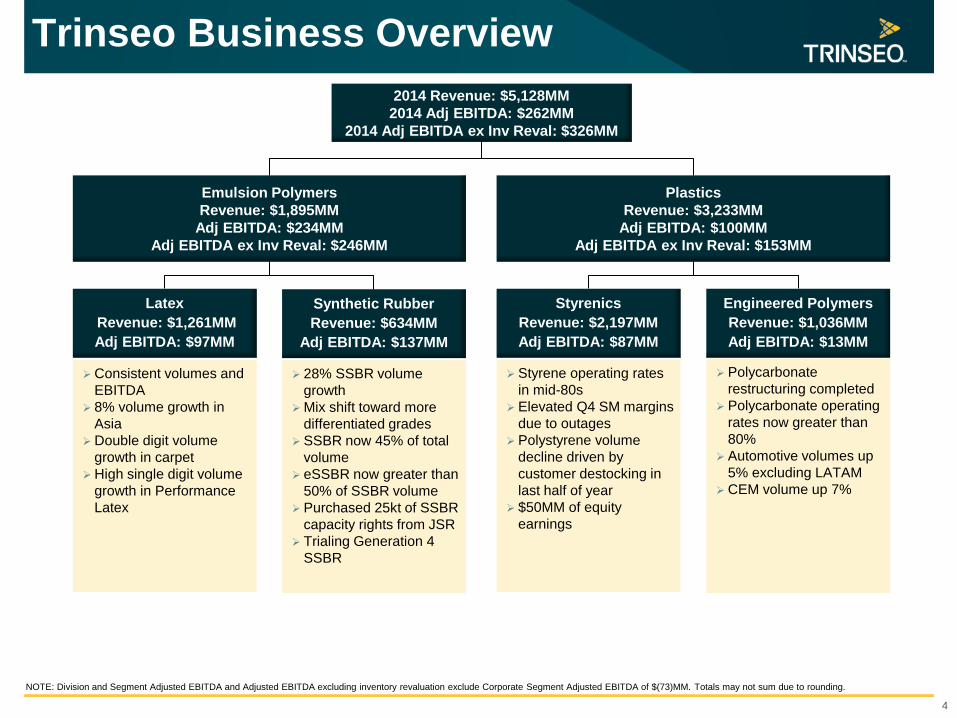
Engineered Polymers Revenue: $1,036MM Adj EBITDA: $13MM
Styrenics Revenue: $2,197MM Adj EBITDA: $87MM
Emulsion Polymers Revenue: $1,895MM
Adj EBITDA: $234MM Adj EBITDA ex Inv Reval: $246MM
Plastics Revenue: $3,233MM
Adj EBITDA: $100MM Adj EBITDA ex Inv Reval: $153MM
Synthetic Rubber Revenue: $634MM
Adj EBITDA: $137MM
2014 Revenue: $5,128MM 2014 Adj EBITDA: $262MM
2014 Adj EBITDA ex Inv Reval: $326MM
Latex Revenue: $1,261MM Adj EBITDA: $97MM
NOTE: Division and Segment Adjusted EBITDA and Adjusted EBITDA excluding inventory revaluation exclude Corporate Segment Adjusted EBITDA of $(73)MM. Totals may not sum due to rounding.
Consistent volumes and EBITDA
8% volume growth in Asia
Double digit volume growth in carpet
High single digit volume growth in Performance Latex
28% SSBR volume growth
Mix shift toward more differentiated grades
SSBR now 45% of total volume
eSSBR now greater than 50% of SSBR volume
Purchased 25kt of SSBR capacity rights from JSR
Trialing Generation 4 SSBR
Styrene operating rates in mid-80s
Elevated Q4 SM margins due to outages
Polystyrene volume decline driven by customer destocking in last half of year
$50MM of equity earnings
Polycarbonate restructuring completed
Polycarbonate operating rates now greater than 80%
Automotive volumes up 5% excluding LATAM
CEM volume up 7%
Trinseo Business Overview – Q4
5
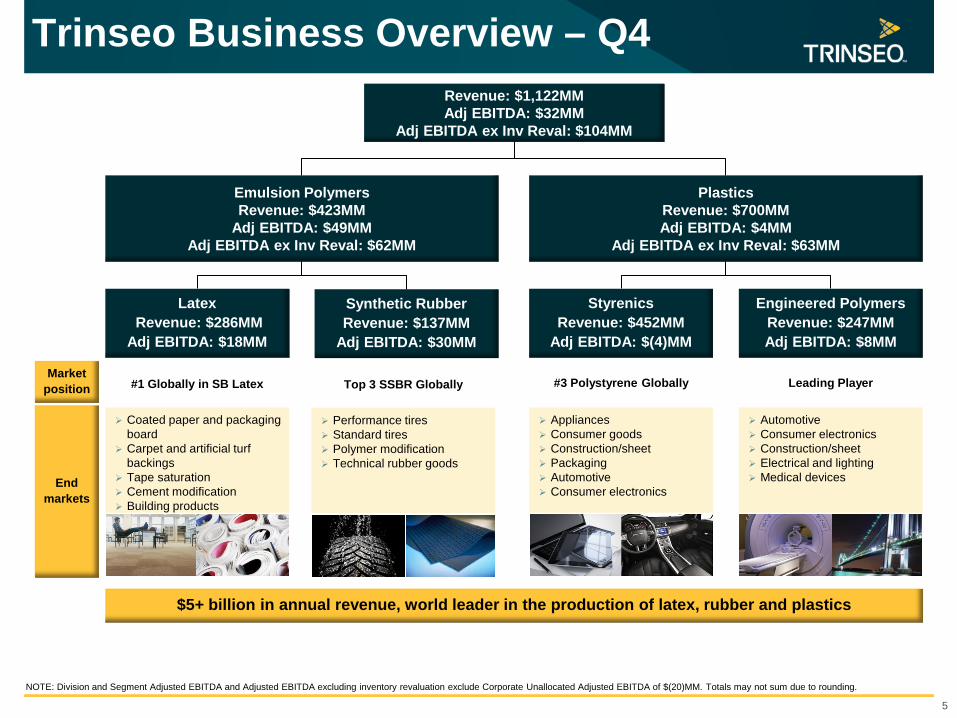
Engineered Polymers Revenue: $247MM Adj EBITDA: $8MM
Styrenics Revenue: $452MM
Adj EBITDA: $(4)MM
Emulsion Polymers Revenue: $423MM
Adj EBITDA: $49MM Adj EBITDA ex Inv Reval: $62MM
Plastics Revenue: $700MM Adj EBITDA: $4MM
Adj EBITDA ex Inv Reval: $63MM
#3 Polystyrene Globally Leading Player
Synthetic Rubber Revenue: $137MM
Adj EBITDA: $30MM
Top 3 SSBR Globally
Revenue: $1,122MM Adj EBITDA: $32MM
Adj EBITDA ex Inv Reval: $104MM
Latex Revenue: $286MM
Adj EBITDA: $18MM
#1 Globally in SB Latex
End markets
Market position
Performance tires Standard tires Polymer modification Technical rubber goods
Coated paper and packaging board
Carpet and artificial turf backings
Tape saturation Cement modification Building products
$5+ billion in annual revenue, world leader in the production of latex, rubber and plastics
Appliances Consumer goods Construction/sheet Packaging Automotive Consumer electronics
Automotive Consumer electronics Construction/sheet Electrical and lighting Medical devices
NOTE: Division and Segment Adjusted EBITDA and Adjusted EBITDA excluding inventory revaluation exclude Corporate Unallocated Adjusted EBITDA of $(20)MM. Totals may not sum due to rounding.
Key Styrene Raw Material Trends
6
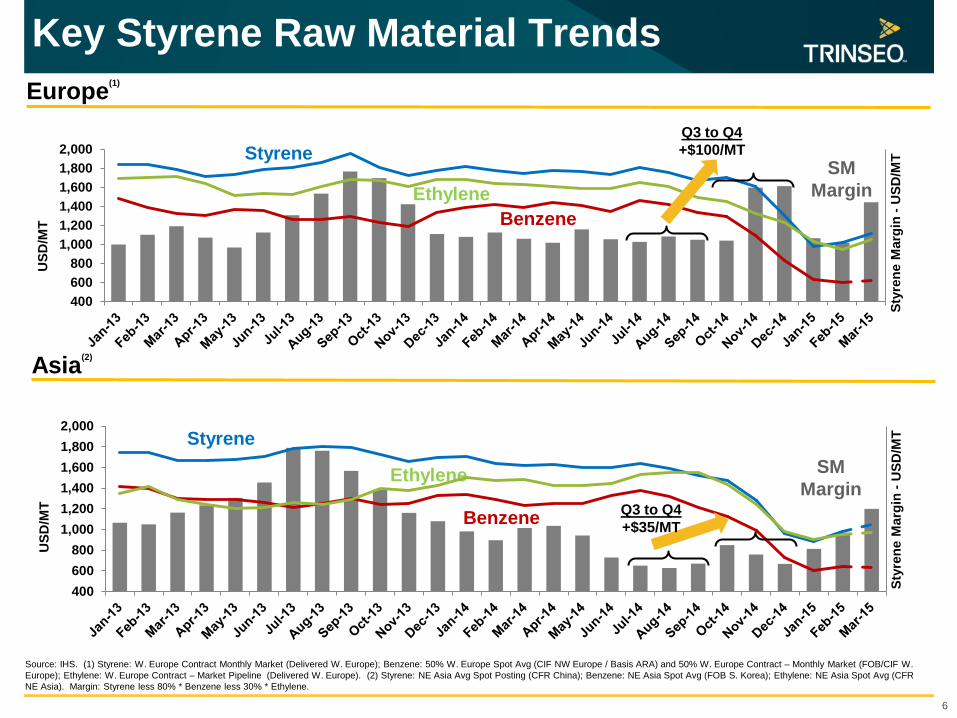
Europe(1)
Source: IHS. (1) Styrene: W. Europe Contract Monthly Market (Delivered W. Europe); Benzene: 50% W. Europe Spot Avg (CIF NW Europe / Basis ARA) and 50% W. Europe Contract – Monthly Market (FOB/CIF W. Europe); Ethylene: W. Europe Contract – Market Pipeline (Delivered W. Europe). (2) Styrene: NE Asia Avg Spot Posting (CFR China); Benzene: NE Asia Spot Avg (FOB S. Korea); Ethylene: NE Asia Spot Avg (CFR NE Asia). Margin: Styrene less 80% * Benzene less 30% * Ethylene.
Asia(2)
Styrene
Ethylene Benzene
Styrene
Ethylene
Benzene
SM Margin
400600800
1,0001,2001,4001,6001,8002,000
Styr
ene
Mar
gin
- USD
/MT
USD
/MT
400600800
1,0001,2001,4001,6001,8002,000
Styr
ene
Mar
gin
- USD
/MT
USD
/MT
SM Margin
Q3 to Q4 +$100/MT
Q3 to Q4 +$35/MT
600
700
800
900
1,000
12/1
12/2
12/3
12/4
12/5
12/6
12/7
12/8
12/9
12/1
012
/11
12/1
212
/13
12/1
412
/15
12/1
612
/17
12/1
812
/19
12/2
012
/21
12/2
212
/23
12/2
412
/25
12/2
612
/27
12/2
812
/29
12/3
012
/31
USD
/MT
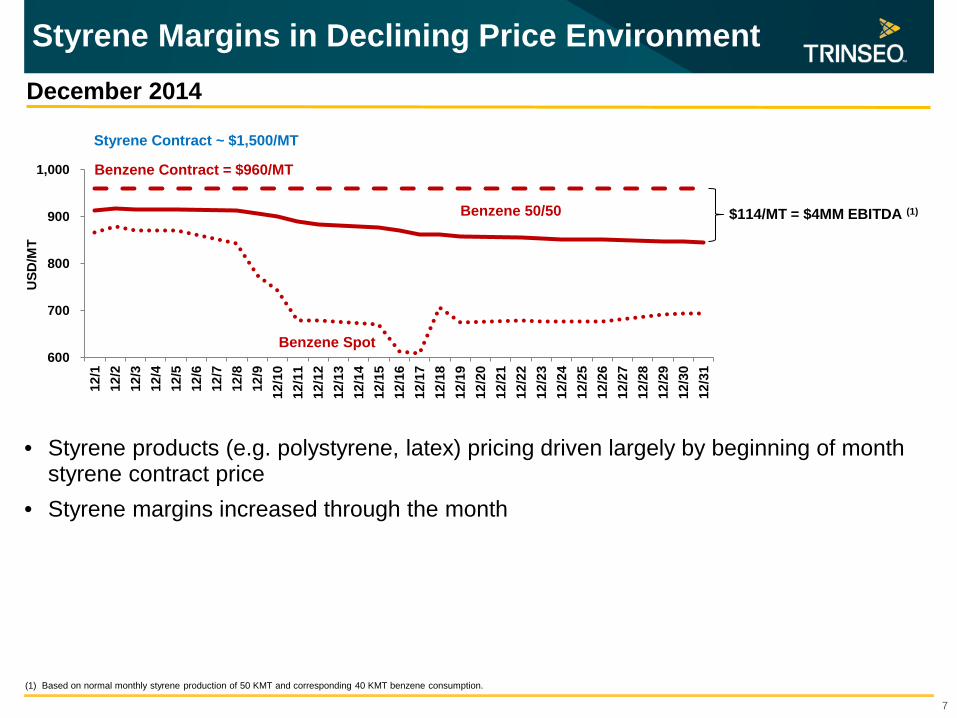
Benzene Contract = $960/MT
Styrene Margins in Declining Price Environment
7
Styrene Contract ~ $1,500/MT
Benzene Spot
Benzene 50/50
• Styrene products (e.g. polystyrene, latex) pricing driven largely by beginning of month styrene contract price
• Styrene margins increased through the month
$114/MT = $4MM EBITDA (1)
(1) Based on normal monthly styrene production of 50 KMT and corresponding 40 KMT benzene consumption.
December 2014

™ Trademark
Financial Review
John Feenan EVP & CFO
Inventory Revaluation
9
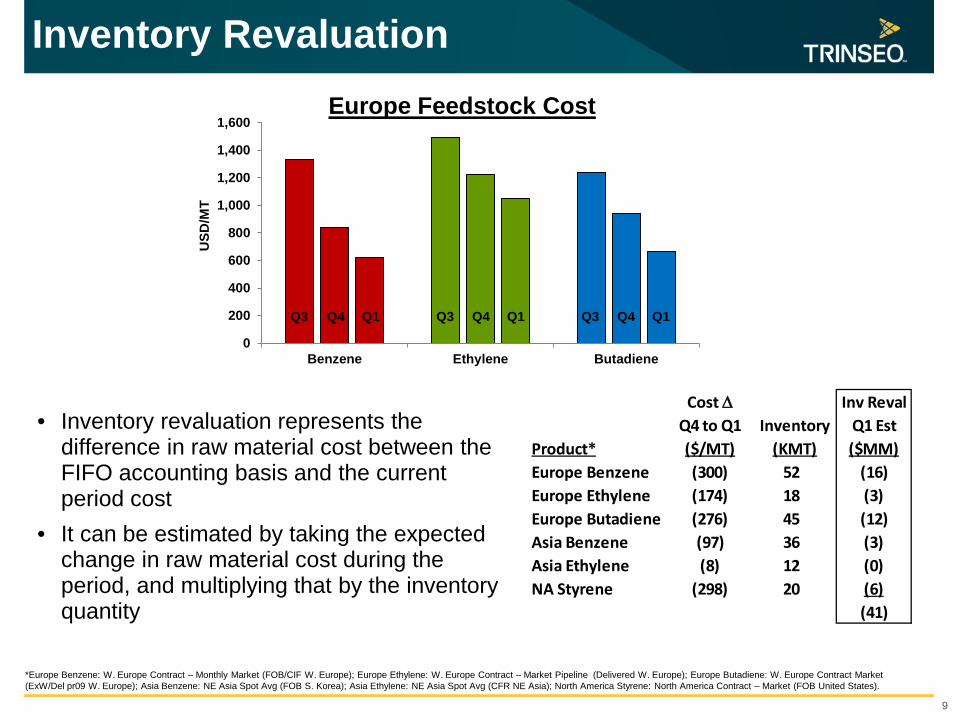
• Inventory revaluation represents the difference in raw material cost between the FIFO accounting basis and the current period cost
• It can be estimated by taking the expected change in raw material cost during the period, and multiplying that by the inventory quantity
*Europe Benzene: W. Europe Contract – Monthly Market (FOB/CIF W. Europe); Europe Ethylene: W. Europe Contract – Market Pipeline (Delivered W. Europe); Europe Butadiene: W. Europe Contract Market (ExW/Del pr09 W. Europe); Asia Benzene: NE Asia Spot Avg (FOB S. Korea); Asia Ethylene: NE Asia Spot Avg (CFR NE Asia); North America Styrene: North America Contract – Market (FOB United States).
0
200
400
600
800
1,000
1,200
1,400
1,600
Benzene Ethylene Butadiene
USD
/MT
Europe Feedstock Cost
Q3 Q4 Q1 Q3 Q4 Q1 Q3 Q4 Q1
Cost ∆ Inv RevalQ4 to Q1 Inventory Q1 Est
Product* ($/MT) (KMT) ($MM)Europe Benzene (300) 52 (16)Europe Ethylene (174) 18 (3)Europe Butadiene (276) 45 (12)Asia Benzene (97) 36 (3)Asia Ethylene (8) 12 (0)NA Styrene (298) 20 (6)
(41)
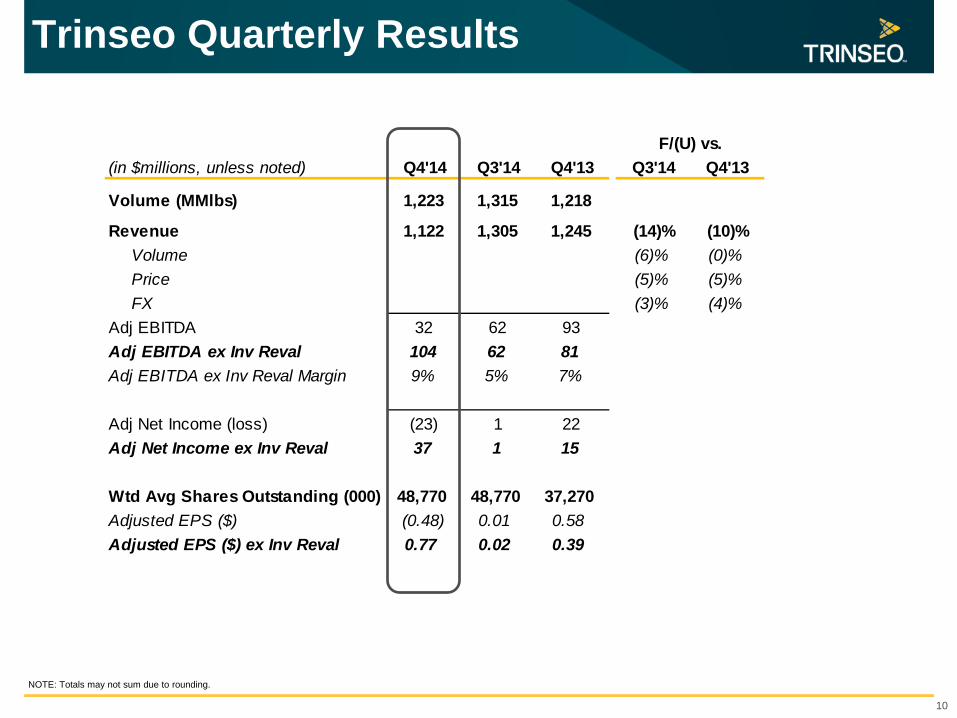
F/(U) vs.(in $millions, unless noted) Q4'14 Q3'14 Q4'13 Q3'14 Q4'13
Volume (MMlbs) 1,223 1,315 1,218
Revenue 1,122 1,305 1,245 (14)% (10)%Volume (6)% (0)%Price (5)% (5)%FX (3)% (4)%
Adj EBITDA 32 62 93Adj EBITDA ex Inv Reval 104 62 81Adj EBITDA ex Inv Reval Margin 9% 5% 7%
Adj Net Income (loss) (23) 1 22Adj Net Income ex Inv Reval 37 1 15
Wtd Avg Shares Outstanding (000) 48,770 48,770 37,270Adjusted EPS ($) (0.48) 0.01 0.58Adjusted EPS ($) ex Inv Reval 0.77 0.02 0.39
Trinseo Quarterly Results
10
NOTE: Totals may not sum due to rounding.
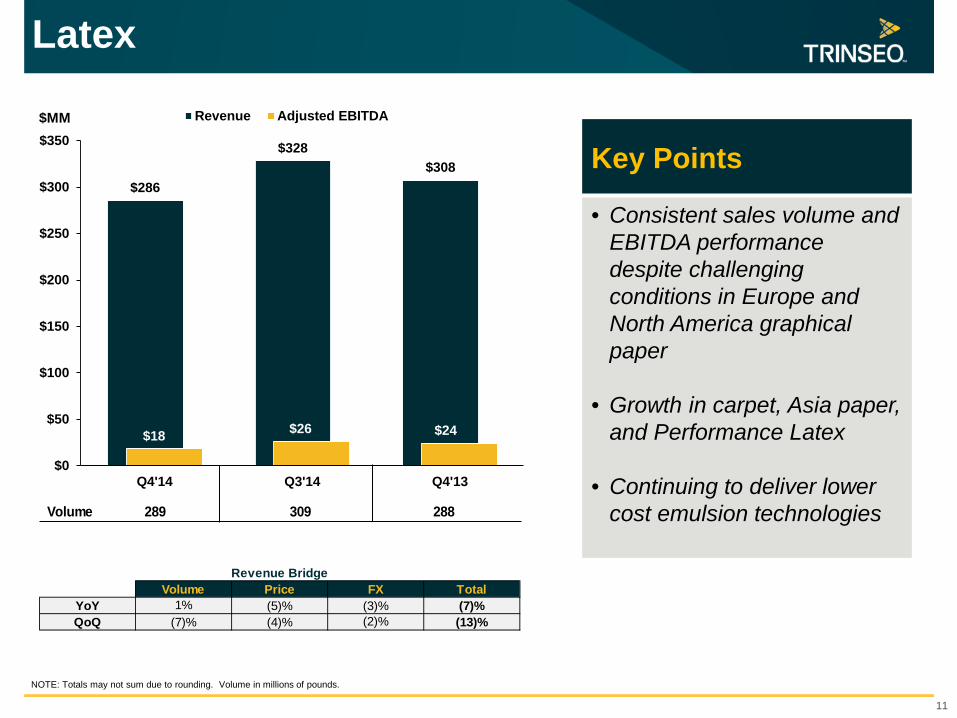
$286
$328$308
$18 $26 $24
$0
$50
$100
$150
$200
$250
$300
$350
Q4'14 Q3'14 Q4'13
Revenue Adjusted EBITDA
Latex
11
$MM
NOTE: Totals may not sum due to rounding. Volume in millions of pounds.
Key Points
• Consistent sales volume and EBITDA performance despite challenging conditions in Europe and North America graphical paper
• Growth in carpet, Asia paper, and Performance Latex
• Continuing to deliver lower cost emulsion technologies
Volume 289 309 288
Revenue Bridge Volume Price FX Total
YoY 1% (5)% (3)% (7)%QoQ (7)% (4)% (2)% (13)%
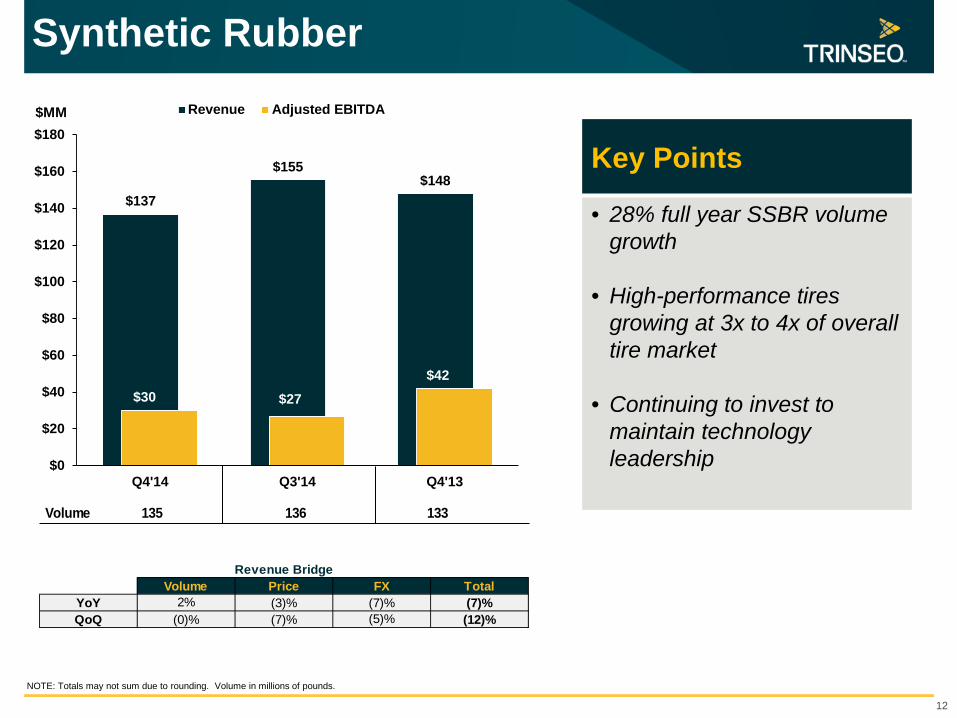
$137
$155$148
$30 $27$42
$0
$20
$40
$60
$80
$100
$120
$140
$160
$180
Q4'14 Q3'14 Q4'13
Revenue Adjusted EBITDA
Synthetic Rubber
12
$MM
NOTE: Totals may not sum due to rounding. Volume in millions of pounds.
Key Points
• 28% full year SSBR volume growth
• High-performance tires growing at 3x to 4x of overall tire market
• Continuing to invest to maintain technology leadership
Revenue BridgeVolume Price FX Total
YoY 2% (3)% (7)% (7)%QoQ (0)% (7)% (5)% (12)%
Volume 135 136 133
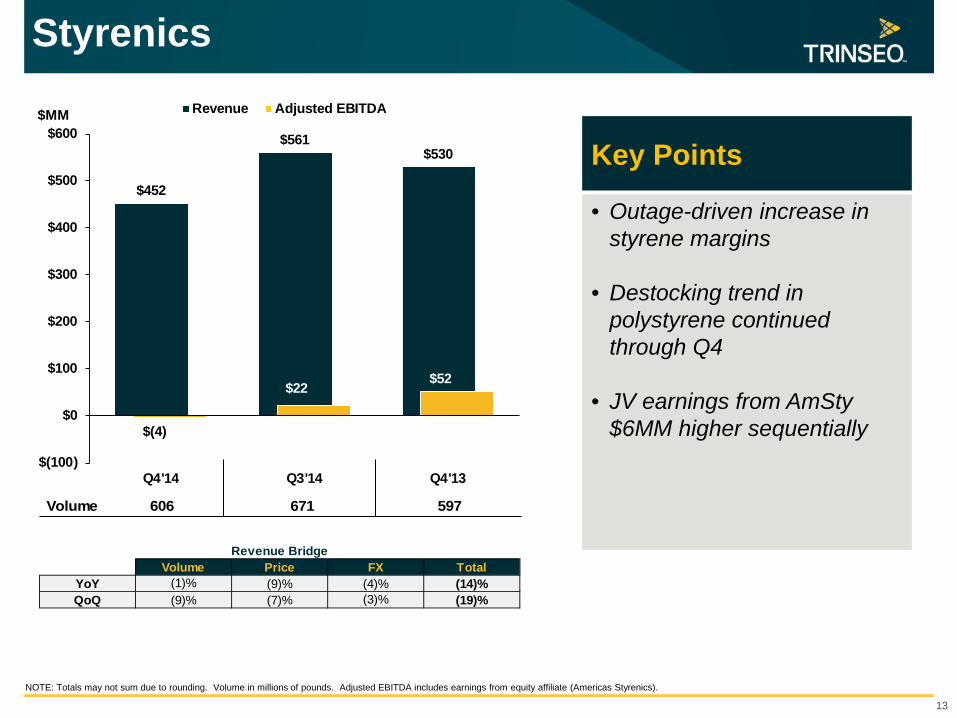
$452
$561$530
$(4)
$22 $52
$(100)
$0
$100
$200
$300
$400
$500
$600
Q4'14 Q3'14 Q4'13
Revenue Adjusted EBITDA
Styrenics
13
$MM
NOTE: Totals may not sum due to rounding. Volume in millions of pounds. Adjusted EBITDA includes earnings from equity affiliate (Americas Styrenics).
Key Points
• Outage-driven increase in styrene margins
• Destocking trend in polystyrene continued through Q4
• JV earnings from AmSty $6MM higher sequentially
Revenue Bridge Volume Price FX Total
YoY (1)% (9)% (4)% (14)%QoQ (9)% (7)% (3)% (19)%
Volume 606 671 597
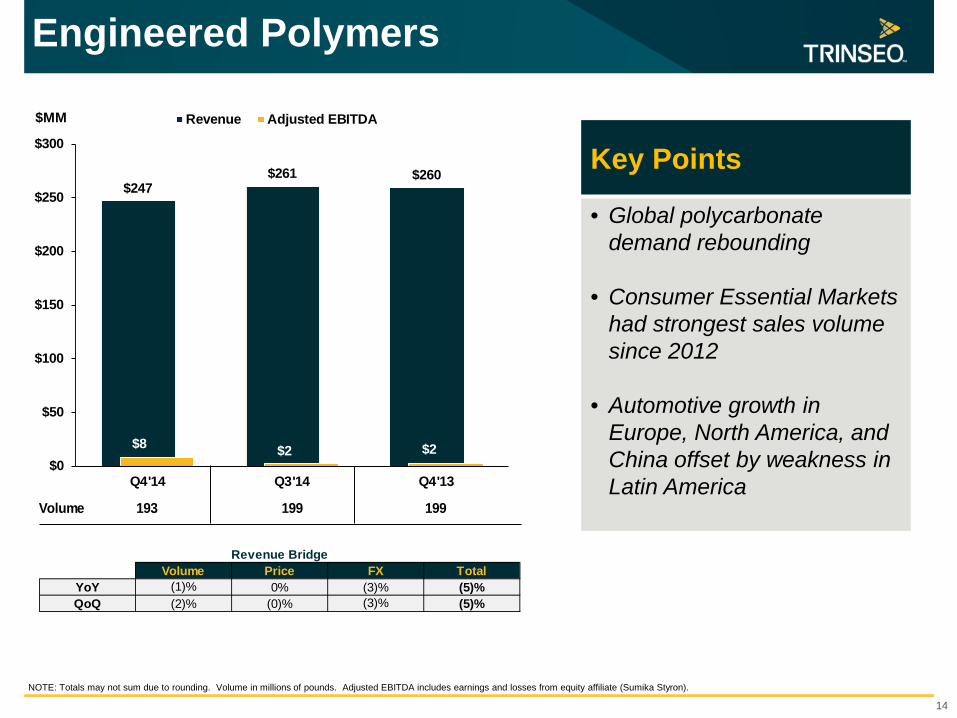
$247$261 $260
$8 $2 $2$0
$50
$100
$150
$200
$250
$300
Q4'14 Q3'14 Q4'13
Revenue Adjusted EBITDA
Engineered Polymers
14
$MM
NOTE: Totals may not sum due to rounding. Volume in millions of pounds. Adjusted EBITDA includes earnings and losses from equity affiliate (Sumika Styron).
Key Points
• Global polycarbonate demand rebounding
• Consumer Essential Markets had strongest sales volume since 2012
• Automotive growth in Europe, North America, and China offset by weakness in Latin America
Revenue BridgeVolume Price FX Total
YoY (1)% 0% (3)% (5)%QoQ (2)% (0)% (3)% (5)%
Volume 193 199 199
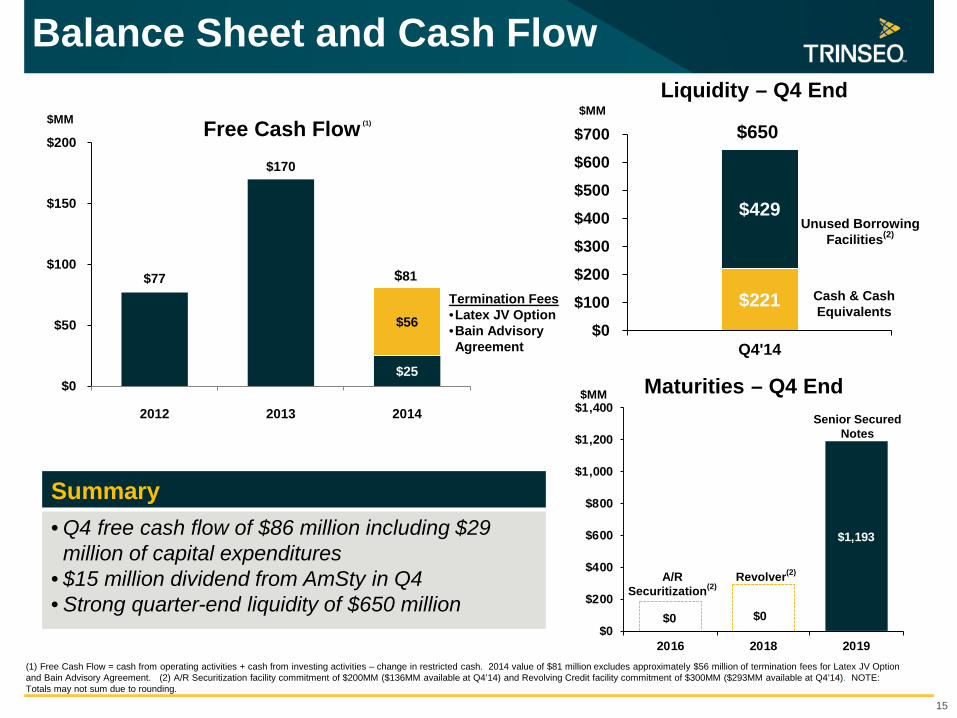
$221
$429
$650
$0
$100
$200
$300
$400
$500
$600
$700
Q4'14
$0 $0
$1,193
$0
$200
$400
$600
$800
$1,000
$1,200
$1,400
2016 2018 2019
Balance Sheet and Cash Flow
15
Liquidity – Q4 End
Maturities – Q4 End
A/R Securitization(2)
Revolver(2)
Senior Secured Notes
(1) Free Cash Flow = cash from operating activities + cash from investing activities – change in restricted cash. 2014 value of $81 million excludes approximately $56 million of termination fees for Latex JV Option and Bain Advisory Agreement. (2) A/R Securitization facility commitment of $200MM ($136MM available at Q4’14) and Revolving Credit facility commitment of $300MM ($293MM available at Q4’14). NOTE: Totals may not sum due to rounding.
Summary • Q4 free cash flow of $86 million including $29
million of capital expenditures • $15 million dividend from AmSty in Q4 • Strong quarter-end liquidity of $650 million
$MM
Unused Borrowing Facilities(2)
Cash & Cash Equivalents
$MM
$MM Free Cash Flow (1)
$(61)
$77
$170
$25
$56
$0
$50
$100
$150
$200
2012 2013 2014
$81 Termination Fees •Latex JV Option •Bain Advisory Agreement

™ Trademark
2015 Focus
Chris Pappas President & CEO
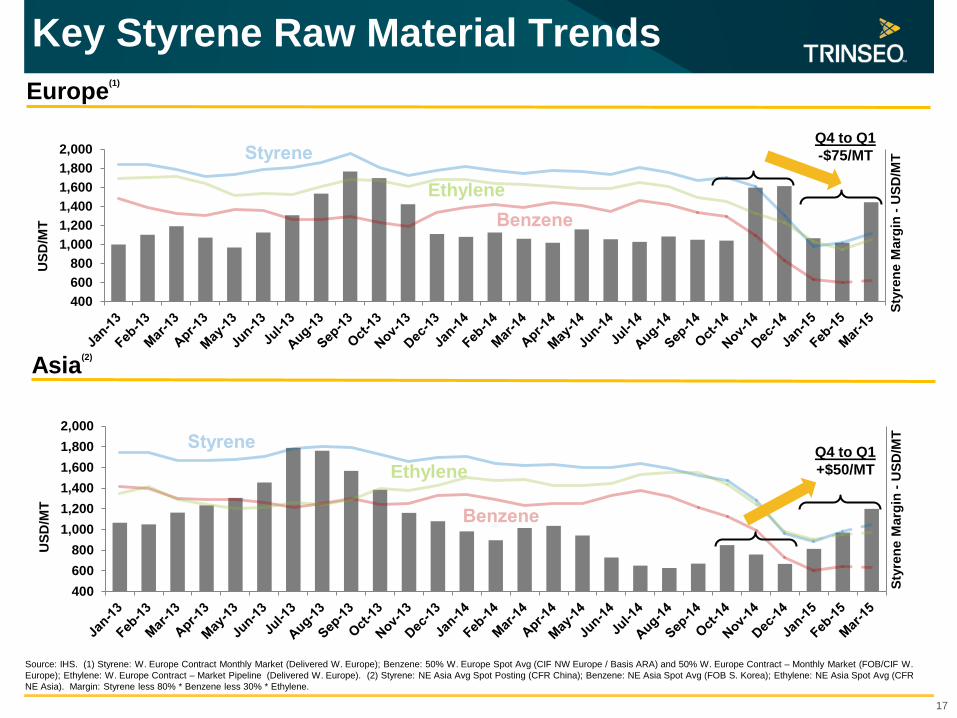
Key Styrene Raw Material Trends
17
Europe(1)
Source: IHS. (1) Styrene: W. Europe Contract Monthly Market (Delivered W. Europe); Benzene: 50% W. Europe Spot Avg (CIF NW Europe / Basis ARA) and 50% W. Europe Contract – Monthly Market (FOB/CIF W. Europe); Ethylene: W. Europe Contract – Market Pipeline (Delivered W. Europe). (2) Styrene: NE Asia Avg Spot Posting (CFR China); Benzene: NE Asia Spot Avg (FOB S. Korea); Ethylene: NE Asia Spot Avg (CFR NE Asia). Margin: Styrene less 80% * Benzene less 30% * Ethylene.
Asia(2)
400600800
1,0001,2001,4001,6001,8002,000
Styr
ene
Mar
gin
- USD
/MT
USD
/MT
400600800
1,0001,2001,4001,6001,8002,000
Styr
ene
Mar
gin
- USD
/MT
USD
/MT
Q4 to Q1 -$75/MT
Q4 to Q1 +$50/MT
Ethylene
Ethylene
400
800
1,200
1,600
2,000
2,400
USD
/MT
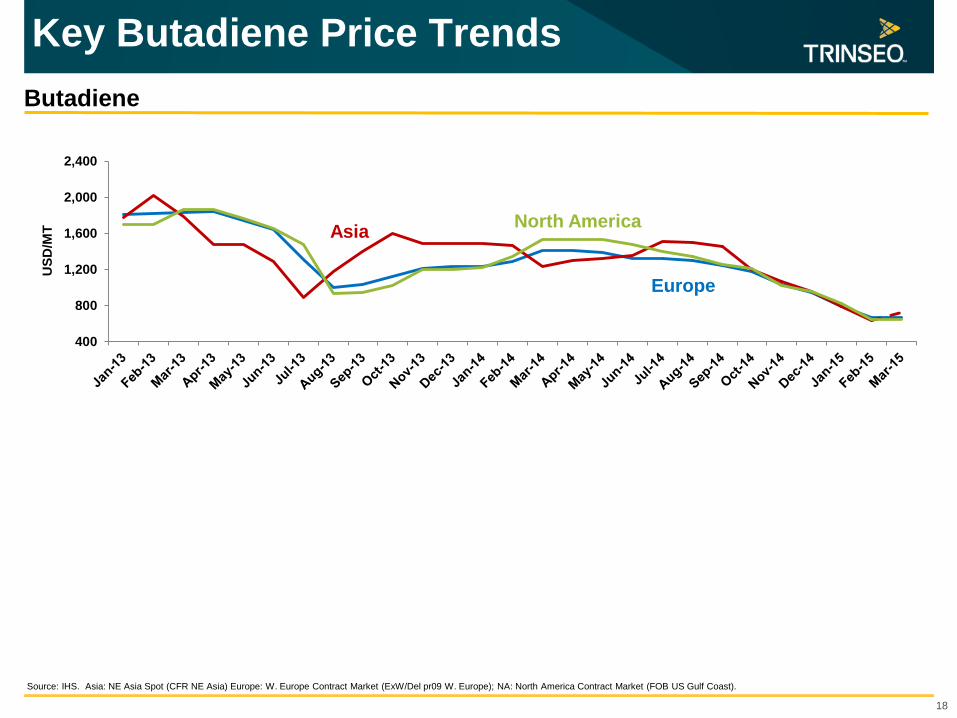
Key Butadiene Price Trends
18
Butadiene
Source: IHS. Asia: NE Asia Spot (CFR NE Asia) Europe: W. Europe Contract Market (ExW/Del pr09 W. Europe); NA: North America Contract Market (FOB US Gulf Coast).
Europe
Asia North America
19
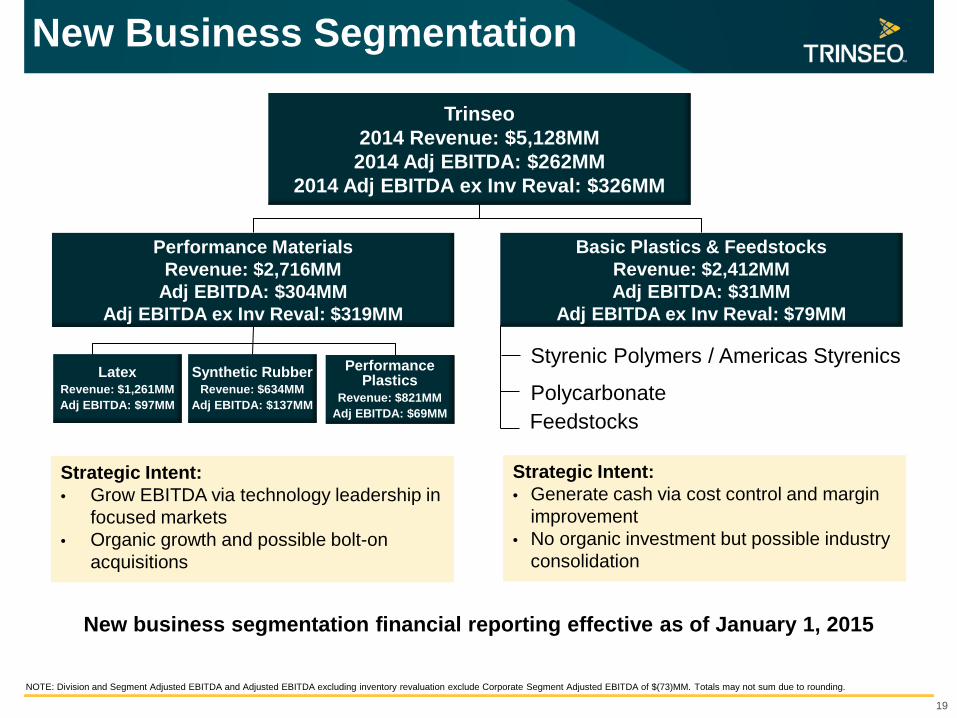
New Business Segmentation
Performance Materials Revenue: $2,716MM
Adj EBITDA: $304MM Adj EBITDA ex Inv Reval: $319MM
Basic Plastics & Feedstocks Revenue: $2,412MM Adj EBITDA: $31MM
Adj EBITDA ex Inv Reval: $79MM
Latex Revenue: $1,261MM Adj EBITDA: $97MM
New business segmentation financial reporting effective as of January 1, 2015
Strategic Intent: • Grow EBITDA via technology leadership in
focused markets • Organic growth and possible bolt-on
acquisitions
Strategic Intent: • Generate cash via cost control and margin
improvement • No organic investment but possible industry
consolidation
Styrenic Polymers / Americas Styrenics
Polycarbonate Feedstocks
Synthetic Rubber Revenue: $634MM
Adj EBITDA: $137MM
Performance Plastics
Revenue: $821MM Adj EBITDA: $69MM
Trinseo 2014 Revenue: $5,128MM
2014 Adj EBITDA: $262MM 2014 Adj EBITDA ex Inv Reval: $326MM
NOTE: Division and Segment Adjusted EBITDA and Adjusted EBITDA excluding inventory revaluation exclude Corporate Segment Adjusted EBITDA of $(73)MM. Totals may not sum due to rounding.
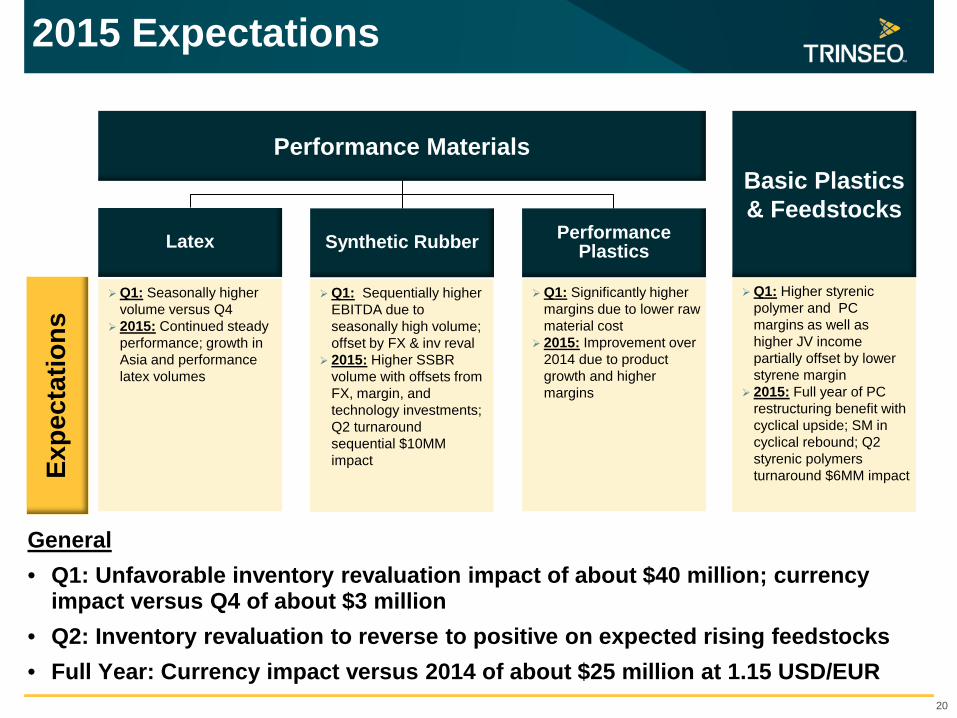
2015 Expectations
20
Performance Materials Basic Plastics & Feedstocks
Synthetic Rubber Latex
Q1: Seasonally higher volume versus Q4
2015: Continued steady performance; growth in Asia and performance latex volumes
Q1: Sequentially higher EBITDA due to seasonally high volume; offset by FX & inv reval
2015: Higher SSBR volume with offsets from FX, margin, and technology investments; Q2 turnaround sequential $10MM impact
Q1: Significantly higher margins due to lower raw material cost
2015: Improvement over 2014 due to product growth and higher margins
Q1: Higher styrenic polymer and PC margins as well as higher JV income partially offset by lower styrene margin
2015: Full year of PC restructuring benefit with cyclical upside; SM in cyclical rebound; Q2 styrenic polymers turnaround $6MM impact Ex
pect
atio
ns
Performance Plastics
General • Q1: Unfavorable inventory revaluation impact of about $40 million; currency
impact versus Q4 of about $3 million • Q2: Inventory revaluation to reverse to positive on expected rising feedstocks • Full Year: Currency impact versus 2014 of about $25 million at 1.15 USD/EUR

™ Trademark
Q&A

™ Trademark
Appendix
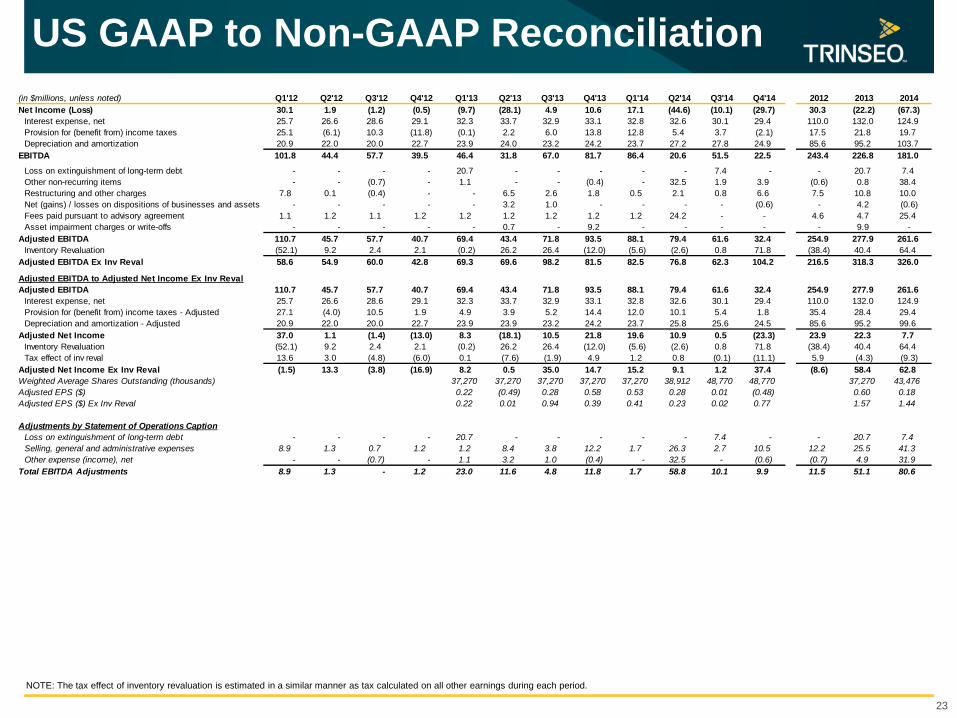
US GAAP to Non-GAAP Reconciliation
23
NOTE: The tax effect of inventory revaluation is estimated in a similar manner as tax calculated on all other earnings during each period.
(in $millions, unless noted) Q1'12 Q2'12 Q3'12 Q4'12 Q1'13 Q2'13 Q3'13 Q4'13 Q1'14 Q2'14 Q3'14 Q4'14 2012 2013 2014Net Income (Loss) 30.1 1.9 (1.2) (0.5) (9.7) (28.1) 4.9 10.6 17.1 (44.6) (10.1) (29.7) 30.3 (22.2) (67.3)
Interest expense, net 25.7 26.6 28.6 29.1 32.3 33.7 32.9 33.1 32.8 32.6 30.1 29.4 110.0 132.0 124.9Provision for (benefit from) income taxes 25.1 (6.1) 10.3 (11.8) (0.1) 2.2 6.0 13.8 12.8 5.4 3.7 (2.1) 17.5 21.8 19.7Depreciation and amortization 20.9 22.0 20.0 22.7 23.9 24.0 23.2 24.2 23.7 27.2 27.8 24.9 85.6 95.2 103.7
EBITDA 101.8 44.4 57.7 39.5 46.4 31.8 67.0 81.7 86.4 20.6 51.5 22.5 243.4 226.8 181.0
Loss on extinguishment of long-term debt - - - - 20.7 - - - - - 7.4 - - 20.7 7.4Other non-recurring items - - (0.7) - 1.1 - - (0.4) - 32.5 1.9 3.9 (0.6) 0.8 38.4Restructuring and other charges 7.8 0.1 (0.4) - - 6.5 2.6 1.8 0.5 2.1 0.8 6.6 7.5 10.8 10.0Net (gains) / losses on dispositions of businesses and assets - - - - - 3.2 1.0 - - - - (0.6) - 4.2 (0.6)Fees paid pursuant to advisory agreement 1.1 1.2 1.1 1.2 1.2 1.2 1.2 1.2 1.2 24.2 - - 4.6 4.7 25.4Asset impairment charges or write-offs - - - - - 0.7 - 9.2 - - - - - 9.9 -
Adjusted EBITDA 110.7 45.7 57.7 40.7 69.4 43.4 71.8 93.5 88.1 79.4 61.6 32.4 254.9 277.9 261.6Inventory Revaluation (52.1) 9.2 2.4 2.1 (0.2) 26.2 26.4 (12.0) (5.6) (2.6) 0.8 71.8 (38.4) 40.4 64.4
Adjusted EBITDA Ex Inv Reval 58.6 54.9 60.0 42.8 69.3 69.6 98.2 81.5 82.5 76.8 62.3 104.2 216.5 318.3 326.0
Adjusted EBITDA to Adjusted Net Income Ex Inv RevalAdjusted EBITDA 110.7 45.7 57.7 40.7 69.4 43.4 71.8 93.5 88.1 79.4 61.6 32.4 254.9 277.9 261.6
Interest expense, net 25.7 26.6 28.6 29.1 32.3 33.7 32.9 33.1 32.8 32.6 30.1 29.4 110.0 132.0 124.9Provision for (benefit from) income taxes - Adjusted 27.1 (4.0) 10.5 1.9 4.9 3.9 5.2 14.4 12.0 10.1 5.4 1.8 35.4 28.4 29.4Depreciation and amortization - Adjusted 20.9 22.0 20.0 22.7 23.9 23.9 23.2 24.2 23.7 25.8 25.6 24.5 85.6 95.2 99.6
Adjusted Net Income 37.0 1.1 (1.4) (13.0) 8.3 (18.1) 10.5 21.8 19.6 10.9 0.5 (23.3) 23.9 22.3 7.7Inventory Revaluation (52.1) 9.2 2.4 2.1 (0.2) 26.2 26.4 (12.0) (5.6) (2.6) 0.8 71.8 (38.4) 40.4 64.4Tax effect of inv reval 13.6 3.0 (4.8) (6.0) 0.1 (7.6) (1.9) 4.9 1.2 0.8 (0.1) (11.1) 5.9 (4.3) (9.3)
Adjusted Net Income Ex Inv Reval (1.5) 13.3 (3.8) (16.9) 8.2 0.5 35.0 14.7 15.2 9.1 1.2 37.4 (8.6) 58.4 62.8Weighted Average Shares Outstanding (thousands) 37,270 37,270 37,270 37,270 37,270 38,912 48,770 48,770 37,270 43,476Adjusted EPS ($) 0.22 (0.49) 0.28 0.58 0.53 0.28 0.01 (0.48) 0.60 0.18Adjusted EPS ($) Ex Inv Reval 0.22 0.01 0.94 0.39 0.41 0.23 0.02 0.77 1.57 1.44
Adjustments by Statement of Operations CaptionLoss on extinguishment of long-term debt - - - - 20.7 - - - - - 7.4 - - 20.7 7.4Selling, general and administrative expenses 8.9 1.3 0.7 1.2 1.2 8.4 3.8 12.2 1.7 26.3 2.7 10.5 12.2 25.5 41.3Other expense (income), net - - (0.7) - 1.1 3.2 1.0 (0.4) - 32.5 - (0.6) (0.7) 4.9 31.9
Total EBITDA Adjustments 8.9 1.3 - 1.2 23.0 11.6 4.8 11.8 1.7 58.8 10.1 9.9 11.5 51.1 80.6
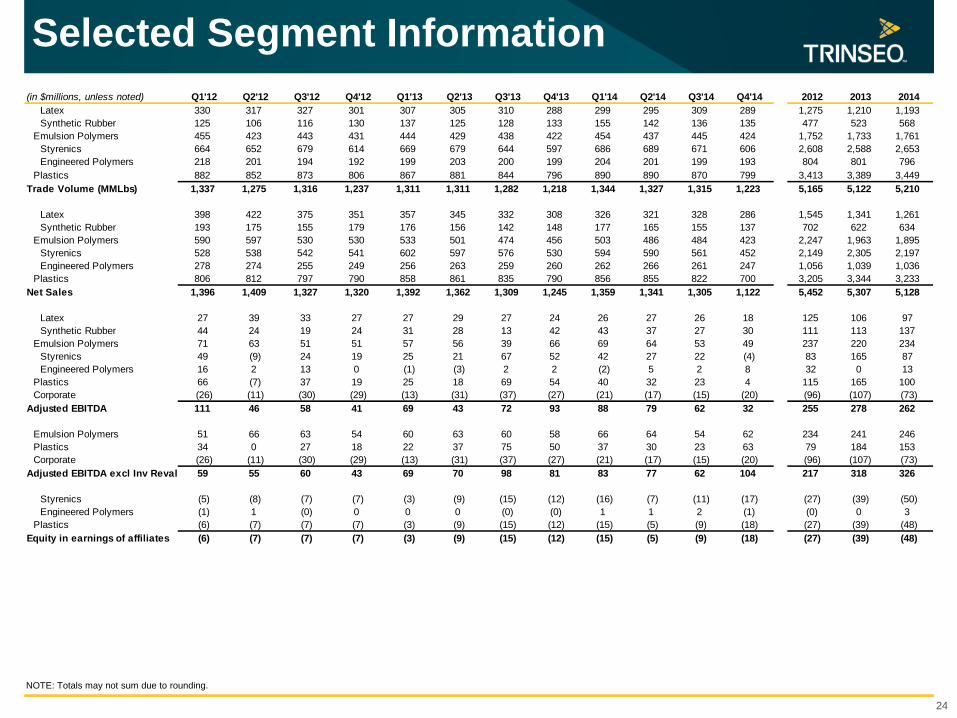
Selected Segment Information
24
NOTE: Totals may not sum due to rounding.
(in $millions, unless noted) Q1'12 Q2'12 Q3'12 Q4'12 Q1'13 Q2'13 Q3'13 Q4'13 Q1'14 Q2'14 Q3'14 Q4'14 2012 2013 2014Latex 330 317 327 301 307 305 310 288 299 295 309 289 1,275 1,210 1,193Synthetic Rubber 125 106 116 130 137 125 128 133 155 142 136 135 477 523 568
Emulsion Polymers 455 423 443 431 444 429 438 422 454 437 445 424 1,752 1,733 1,761Styrenics 664 652 679 614 669 679 644 597 686 689 671 606 2,608 2,588 2,653Engineered Polymers 218 201 194 192 199 203 200 199 204 201 199 193 804 801 796
Plastics 882 852 873 806 867 881 844 796 890 890 870 799 3,413 3,389 3,449Trade Volume (MMLbs) 1,337 1,275 1,316 1,237 1,311 1,311 1,282 1,218 1,344 1,327 1,315 1,223 5,165 5,122 5,210
Latex 398 422 375 351 357 345 332 308 326 321 328 286 1,545 1,341 1,261Synthetic Rubber 193 175 155 179 176 156 142 148 177 165 155 137 702 622 634
Emulsion Polymers 590 597 530 530 533 501 474 456 503 486 484 423 2,247 1,963 1,895Styrenics 528 538 542 541 602 597 576 530 594 590 561 452 2,149 2,305 2,197Engineered Polymers 278 274 255 249 256 263 259 260 262 266 261 247 1,056 1,039 1,036
Plastics 806 812 797 790 858 861 835 790 856 855 822 700 3,205 3,344 3,233Net Sales 1,396 1,409 1,327 1,320 1,392 1,362 1,309 1,245 1,359 1,341 1,305 1,122 5,452 5,307 5,128
Latex 27 39 33 27 27 29 27 24 26 27 26 18 125 106 97Synthetic Rubber 44 24 19 24 31 28 13 42 43 37 27 30 111 113 137
Emulsion Polymers 71 63 51 51 57 56 39 66 69 64 53 49 237 220 234Styrenics 49 (9) 24 19 25 21 67 52 42 27 22 (4) 83 165 87Engineered Polymers 16 2 13 0 (1) (3) 2 2 (2) 5 2 8 32 0 13
Plastics 66 (7) 37 19 25 18 69 54 40 32 23 4 115 165 100Corporate (26) (11) (30) (29) (13) (31) (37) (27) (21) (17) (15) (20) (96) (107) (73)
Adjusted EBITDA 111 46 58 41 69 43 72 93 88 79 62 32 255 278 262
Emulsion Polymers 51 66 63 54 60 63 60 58 66 64 54 62 234 241 246Plastics 34 0 27 18 22 37 75 50 37 30 23 63 79 184 153Corporate (26) (11) (30) (29) (13) (31) (37) (27) (21) (17) (15) (20) (96) (107) (73)
Adjusted EBITDA excl Inv Reval 59 55 60 43 69 70 98 81 83 77 62 104 217 318 326
Styrenics (5) (8) (7) (7) (3) (9) (15) (12) (16) (7) (11) (17) (27) (39) (50)Engineered Polymers (1) 1 (0) 0 0 0 (0) (0) 1 1 2 (1) (0) 0 3
Plastics (6) (7) (7) (7) (3) (9) (15) (12) (15) (5) (9) (18) (27) (39) (48)Equity in earnings of affiliates (6) (7) (7) (7) (3) (9) (15) (12) (15) (5) (9) (18) (27) (39) (48)
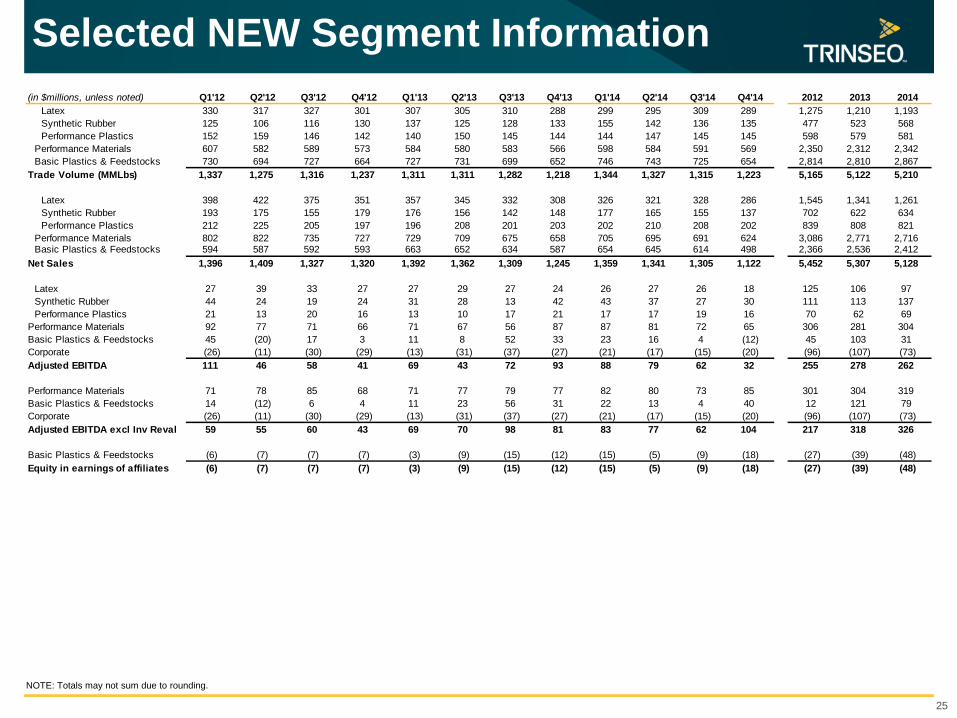
Selected NEW Segment Information
25
NOTE: Totals may not sum due to rounding.
(in $millions, unless noted) Q1'12 Q2'12 Q3'12 Q4'12 Q1'13 Q2'13 Q3'13 Q4'13 Q1'14 Q2'14 Q3'14 Q4'14 2012 2013 2014Latex 330 317 327 301 307 305 310 288 299 295 309 289 1,275 1,210 1,193Synthetic Rubber 125 106 116 130 137 125 128 133 155 142 136 135 477 523 568Performance Plastics 152 159 146 142 140 150 145 144 144 147 145 145 598 579 581
Performance Materials 607 582 589 573 584 580 583 566 598 584 591 569 2,350 2,312 2,342Basic Plastics & Feedstocks 730 694 727 664 727 731 699 652 746 743 725 654 2,814 2,810 2,867
Trade Volume (MMLbs) 1,337 1,275 1,316 1,237 1,311 1,311 1,282 1,218 1,344 1,327 1,315 1,223 5,165 5,122 5,210
Latex 398 422 375 351 357 345 332 308 326 321 328 286 1,545 1,341 1,261Synthetic Rubber 193 175 155 179 176 156 142 148 177 165 155 137 702 622 634Performance Plastics 212 225 205 197 196 208 201 203 202 210 208 202 839 808 821
Performance Materials 802 822 735 727 729 709 675 658 705 695 691 624 3,086 2,771 2,716Basic Plastics & Feedstocks 594 587 592 593 663 652 634 587 654 645 614 498 2,366 2,536 2,412
Net Sales 1,396 1,409 1,327 1,320 1,392 1,362 1,309 1,245 1,359 1,341 1,305 1,122 5,452 5,307 5,128
Latex 27 39 33 27 27 29 27 24 26 27 26 18 125 106 97Synthetic Rubber 44 24 19 24 31 28 13 42 43 37 27 30 111 113 137Performance Plastics 21 13 20 16 13 10 17 21 17 17 19 16 70 62 69
Performance Materials 92 77 71 66 71 67 56 87 87 81 72 65 306 281 304Basic Plastics & Feedstocks 45 (20) 17 3 11 8 52 33 23 16 4 (12) 45 103 31Corporate (26) (11) (30) (29) (13) (31) (37) (27) (21) (17) (15) (20) (96) (107) (73)Adjusted EBITDA 111 46 58 41 69 43 72 93 88 79 62 32 255 278 262
Performance Materials 71 78 85 68 71 77 79 77 82 80 73 85 301 304 319Basic Plastics & Feedstocks 14 (12) 6 4 11 23 56 31 22 13 4 40 12 121 79Corporate (26) (11) (30) (29) (13) (31) (37) (27) (21) (17) (15) (20) (96) (107) (73)Adjusted EBITDA excl Inv Reval 59 55 60 43 69 70 98 81 83 77 62 104 217 318 326
Basic Plastics & Feedstocks (6) (7) (7) (7) (3) (9) (15) (12) (15) (5) (9) (18) (27) (39) (48)Equity in earnings of affiliates (6) (7) (7) (7) (3) (9) (15) (12) (15) (5) (9) (18) (27) (39) (48)
Related Documents


![Q4 and full year FY 2016 Earning Presentation [Company Update]](https://static.cupdf.com/doc/110x72/577c7de81a28abe054a00e9b/q4-and-full-year-fy-2016-earning-presentation-company-update.jpg)