Innophos Holdings, Inc. | March 2019 Q1 2019 Earnings Call April 30, 2019 9:00am ET

Welcome message from author
This document is posted to help you gain knowledge. Please leave a comment to let me know what you think about it! Share it to your friends and learn new things together.
Transcript

Innophos Holdings, Inc. | March 2019
Q1 2019 Earnings Call
April 30, 2019
9:00am ET
Innophos Holdings, Inc. | March 2019 Innophos Holdings, Inc. | Earnings Conference Call First-Quarter 2019 | April 30, 2019
Forward-Looking Statements
• This presentation contains or may contain forward-looking statements within the meaning of Section 27a of the Securities Act of 1933, as amended, and Section 21E of the Securities Exchange Act of 1934, as amended. The company intends these forward-looking statements to be covered by the safe harbor provisions for such statements.
• Statements made in this presentation that relate to our future performance or future financial results or other future events (which may be identified by such terms as “expect”, “estimate”, “anticipate”, “assume”, “believe”, “plan”, “intend’, “may”, “will”, “should”, “outlook”, “guidance”, “target”, “opportunity”, “potential” or similar terms and variations or the negative thereof) are forward-looking statements, including the Company’s expectations regarding the business environment and the Company’s overall guidance regarding future performance and growth. These statements are based on our current beliefs and expectations and are subject to significant risks and uncertainties. Actual results may materially differ from the expectations expressed in or implied by these forward-looking statements.
• Factors that could cause the Company’s actual results to differ materially include, but are not limited to: (1) global macroeconomic conditions and trends; (2) the behavior of financial markets, including fluctuations in foreign currencies, interest rates and turmoil in capital markets; (3) changes in regulatory controls regarding tariffs, duties, taxes and income tax rates; (4) the Company’s ability to implement and refine its Vision 2022 strategic roadmap; (5) the Company’s ability to successfully identify and complete acquisitions in line with its Vision 2022 strategic roadmap and effectively operate and integrate acquired businesses to realize the anticipated benefits of those acquisitions; (6) the Company’s ability to realize expected cost savings and efficiencies from its performance improvement and other optimization initiatives; (7) the Company’s ability to effectively compete in its markets, and to successfully develop new and competitive products that appeal to its customers; (8) changes in consumer preferences and demand for the Company’s products or a decline in consumer confidence and spending; (9) the Company’s ability to benefit from its investments in assets and human capital and the ability to complete projects successfully and on budget; (10) economic, regulatory and political risks associated with the Company’s international operations, most notably Mexico and China; (11) volatility and increases in the price of raw materials, energy and transportation, and fluctuations in the quality and availability of raw materials and process aids; (12) the impact of a disruption in the Company’s supply chain or its relationship with its suppliers; (13) the Company’s ability to comply with, and the costs associated with compliance with, U.S. and foreign environmental protection laws and (14) the Company’s ability to meet quality and regulatory standards in different jurisdictions in which it has operations or conducts business.
• We caution you to consider the important risks and other factors as set forth in the forward-looking statements section and in Item 1A Risk Factors in our most recent Annual Report on Form 10-K, as amended by subsequent reports on Forms 10-Q and 8-K.
• We do not undertake to update the forward-looking statements to reflect the impact of circumstances or events that may arise after the date of the forward-looking statements.
Regulation G: Adjusted Results
• The information presented herein regarding certain unaudited adjusted results does not conform to generally accepted accounting principles in the U.S. (U.S. GAAP). Innophos has included this non-GAAP information to assist in understanding the operating performance of the company and its reporting segments. Please see reconciliations to the most directly comparable financial measure prescribed by U.S. GAAP in the appendix.
2
Totals in this presentation may not foot due to rounding.
Innophos Holdings, Inc. | March 2019 Innophos Holdings, Inc. | Earnings Conference Call First-Quarter 2019 | April 30, 2019
Agenda
1. Executive Overview
2. Financial Review
3. Outlook
4. Q&A
3
Kim Ann Mink, Ph.D. Chairman, President and Chief Executive Officer
Mark Feuerbach Interim Chief Financial Officer
Innophos Holdings, Inc. | March 2019 Innophos Holdings, Inc. | Earnings Conference Call First-Quarter 2019 | April 30, 2019
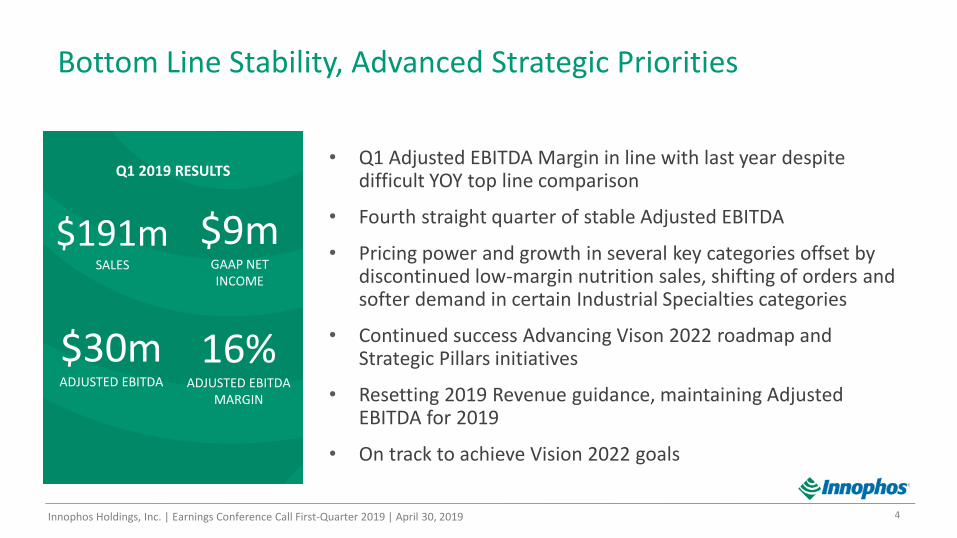
Bottom Line Stability, Advanced Strategic Priorities
• Q1 Adjusted EBITDA Margin in line with last year despite difficult YOY top line comparison
• Fourth straight quarter of stable Adjusted EBITDA
• Pricing power and growth in several key categories offset by discontinued low-margin nutrition sales, shifting of orders and softer demand in certain Industrial Specialties categories
• Continued success Advancing Vison 2022 roadmap and Strategic Pillars initiatives
• Resetting 2019 Revenue guidance, maintaining Adjusted EBITDA for 2019
• On track to achieve Vision 2022 goals
4
$191m SALES
$9m GAAP NET INCOME
$30m ADJUSTED EBITDA
16% ADJUSTED EBITDA
MARGIN
Q1 2019 RESULTS
Innophos Holdings, Inc. | March 2019 Innophos Holdings, Inc. | Earnings Conference Call First-Quarter 2019 | April 30, 2019
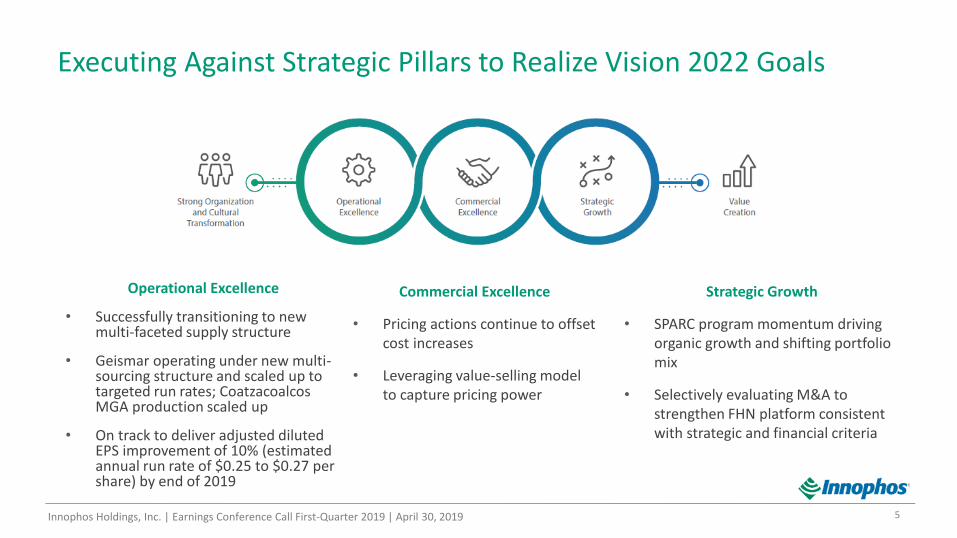
Executing Against Strategic Pillars to Realize Vision 2022 Goals
Operational Excellence
• Successfully transitioning to new multi-faceted supply structure
• Geismar operating under new multi-sourcing structure and scaled up to targeted run rates; Coatzacoalcos MGA production scaled up
• On track to deliver adjusted diluted EPS improvement of 10% (estimated annual run rate of $0.25 to $0.27 per share) by end of 2019
5
Commercial Excellence
• Pricing actions continue to offset cost increases
• Leveraging value-selling model to capture pricing power
Strategic Growth
• SPARC program momentum driving organic growth and shifting portfolio mix
• Selectively evaluating M&A to strengthen FHN platform consistent with strategic and financial criteria
Innophos Holdings, Inc. | March 2019 Innophos Holdings, Inc. | Earnings Conference Call First-Quarter 2019 | April 30, 2019
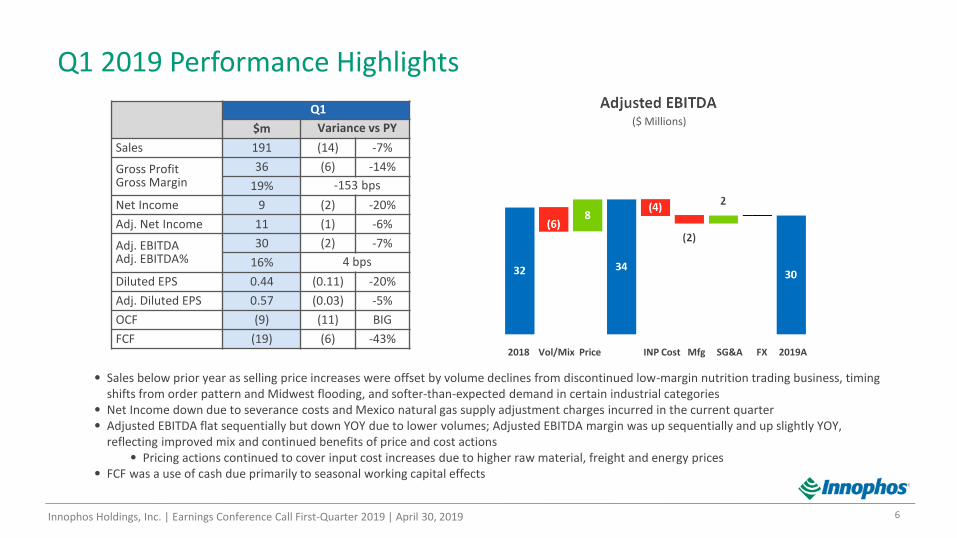
Q1 2019 Performance Highlights
6
• Sales below prior year as selling price increases were offset by volume declines from discontinued low-margin nutrition trading business, timing shifts from order pattern and Midwest flooding, and softer-than-expected demand in certain industrial categories
• Net Income down due to severance costs and Mexico natural gas supply adjustment charges incurred in the current quarter • Adjusted EBITDA flat sequentially but down YOY due to lower volumes; Adjusted EBITDA margin was up sequentially and up slightly YOY,
reflecting improved mix and continued benefits of price and cost actions • Pricing actions continued to cover input cost increases due to higher raw material, freight and energy prices
• FCF was a use of cash due primarily to seasonal working capital effects
2018 Vol/Mix Price INP Cost Mfg SG&A FX 2019A
Q1
$m Variance vs PY
Sales 191 (14) -7%
Gross Profit Gross Margin
36 (6) -14%
19% -153 bps
Net Income 9 (2) -20%
Adj. Net Income 11 (1) -6%
Adj. EBITDA Adj. EBITDA%
30 (2) -7%
16% 4 bps
Diluted EPS 0.44 (0.11) -20%
Adj. Diluted EPS 0.57 (0.03) -5%
OCF (9) (11) BIG
FCF (19) (6) -43%
($ Millions)
Innophos Holdings, Inc. | March 2019 Innophos Holdings, Inc. | Earnings Conference Call First-Quarter 2019 | April 30, 2019
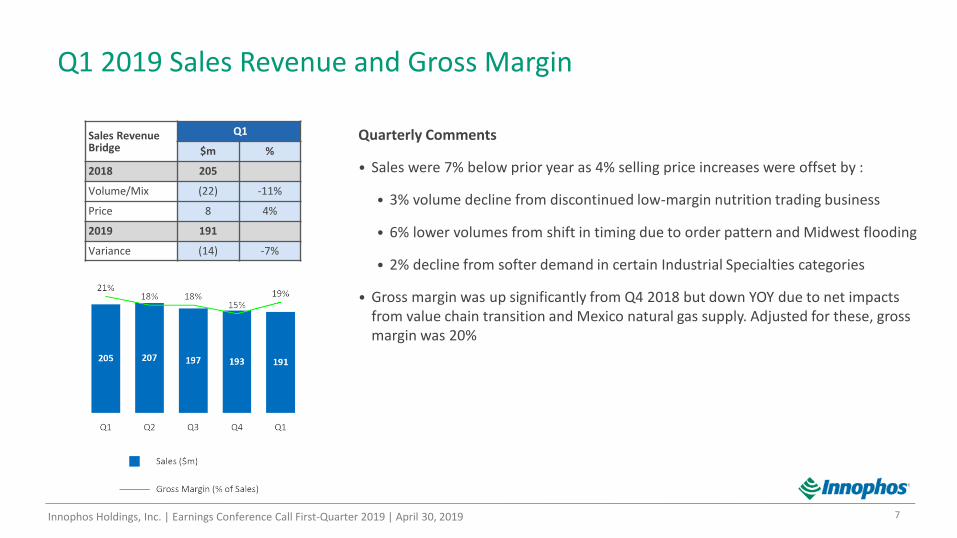
Q1 2019 Sales Revenue and Gross Margin
Quarterly Comments
• Sales were 7% below prior year as 4% selling price increases were offset by :
• 3% volume decline from discontinued low-margin nutrition trading business
• 6% lower volumes from shift in timing due to order pattern and Midwest flooding
• 2% decline from softer demand in certain Industrial Specialties categories
• Gross margin was up significantly from Q4 2018 but down YOY due to net impacts from value chain transition and Mexico natural gas supply. Adjusted for these, gross margin was 20%
7
Sales Revenue Bridge
Q1
$m %
2018 205
Volume/Mix (22) -11%
Price 8 4%
2019 191
Variance (14) -7%
Innophos Holdings, Inc. | March 2019 Innophos Holdings, Inc. | Earnings Conference Call First-Quarter 2019 | April 30, 2019
Q1 2019 Earnings
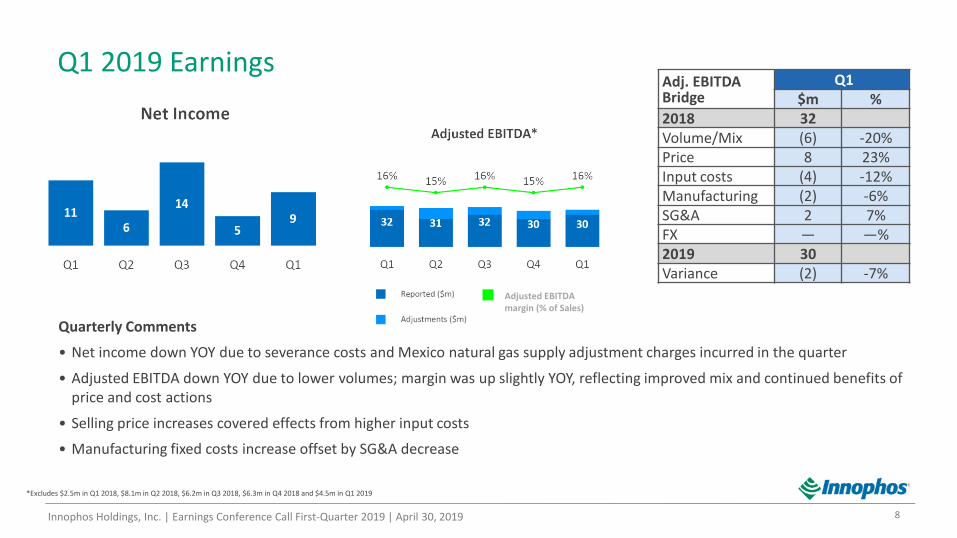
Quarterly Comments
• Net income down YOY due to severance costs and Mexico natural gas supply adjustment charges incurred in the quarter
• Adjusted EBITDA down YOY due to lower volumes; margin was up slightly YOY, reflecting improved mix and continued benefits of price and cost actions
• Selling price increases covered effects from higher input costs
• Manufacturing fixed costs increase offset by SG&A decrease
8
*Excludes $2.5m in Q1 2018, $8.1m in Q2 2018, $6.2m in Q3 2018, $6.3m in Q4 2018 and $4.5m in Q1 2019
Adjusted EBITDA margin (% of Sales)
Adj. EBITDA Bridge
Q1 $m %
2018 32 Volume/Mix (6) -20% Price 8 23% Input costs (4) -12% Manufacturing (2) -6% SG&A 2 7% FX — —% 2019 30 Variance (2) -7%
Innophos Holdings, Inc. | March 2019 Innophos Holdings, Inc. | Earnings Conference Call First-Quarter 2019 | April 30, 2019
Q1 2019 Performance by Segment
9
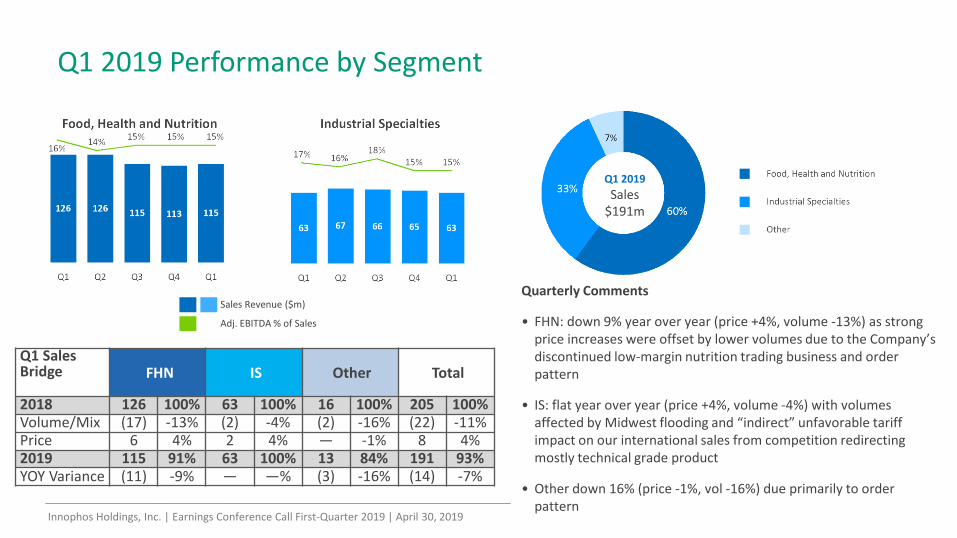
Q1 2019
Sales $191m
Sales Revenue ($m)
Adj. EBITDA % of Sales
Quarterly Comments
• FHN: down 9% year over year (price +4%, volume -13%) as strong price increases were offset by lower volumes due to the Company’s discontinued low-margin nutrition trading business and order pattern
• IS: flat year over year (price +4%, volume -4%) with volumes affected by Midwest flooding and “indirect” unfavorable tariff impact on our international sales from competition redirecting mostly technical grade product
• Other down 16% (price -1%, vol -16%) due primarily to order pattern
Q1 Sales Bridge
FHN IS Other Total
2018 126 100% 63 100% 16 100% 205 100% Volume/Mix (17) -13% (2) -4% (2) -16% (22) -11% Price 6 4% 2 4% — -1% 8 4% 2019 115 91% 63 100% 13 84% 191 93% YOY Variance (11) -9% — —% (3) -16% (14) -7%
Innophos Holdings, Inc. | March 2019 Innophos Holdings, Inc. | Earnings Conference Call First-Quarter 2019 | April 30, 2019
Q1 2019 Other Items
10
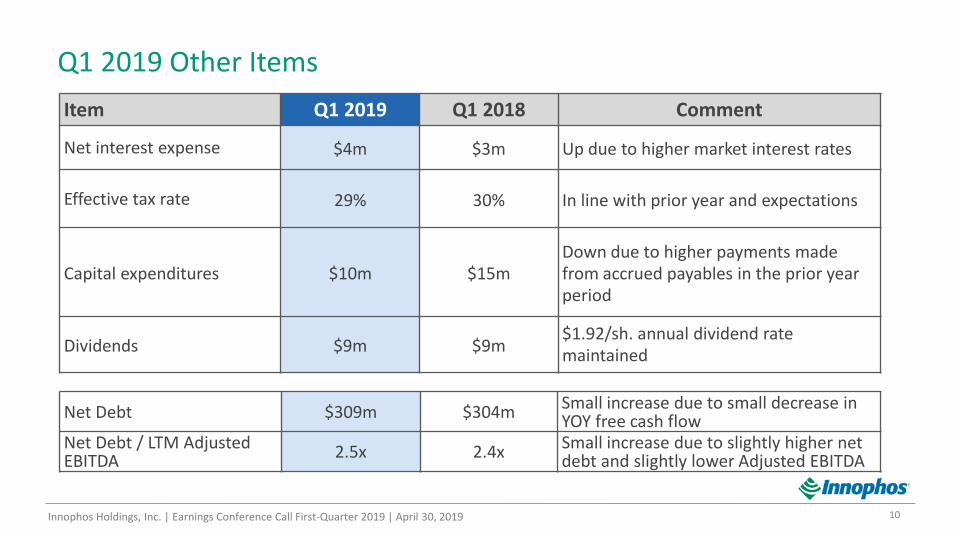
Item Q1 2019 Q1 2018 Comment
Net interest expense $4m $3m Up due to higher market interest rates
Effective tax rate 29% 30% In line with prior year and expectations
Capital expenditures $10m $15m Down due to higher payments made from accrued payables in the prior year period
Dividends $9m $9m $1.92/sh. annual dividend rate maintained
Net Debt $309m $304m Small increase due to small decrease in YOY free cash flow
Net Debt / LTM Adjusted EBITDA 2.5x 2.4x Small increase due to slightly higher net
debt and slightly lower Adjusted EBITDA
Innophos Holdings, Inc. | March 2019 Innophos Holdings, Inc. | Earnings Conference Call First-Quarter 2019 | April 30, 2019
Q1 2019 Earnings Per Share
11
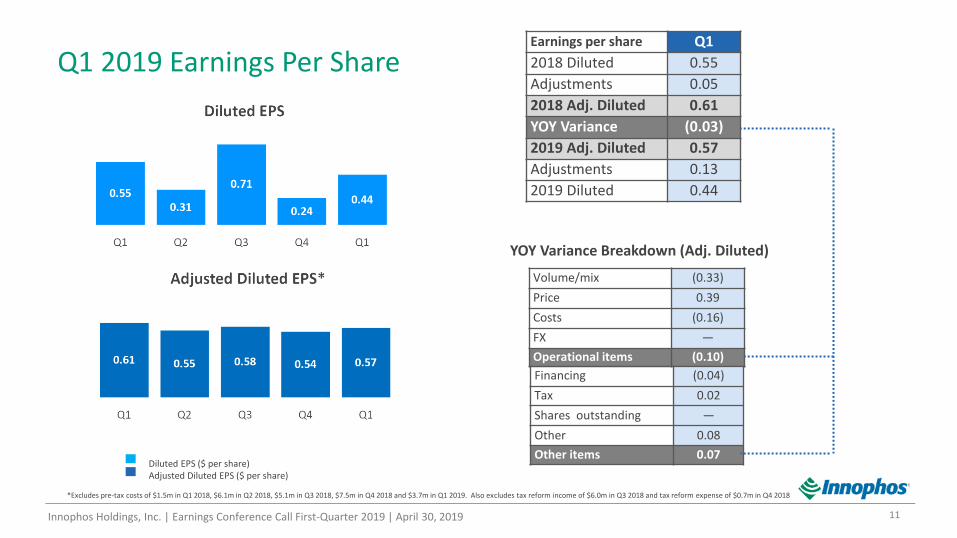
Diluted EPS ($ per share) Adjusted Diluted EPS ($ per share)
*Excludes pre-tax costs of $1.5m in Q1 2018, $6.1m in Q2 2018, $5.1m in Q3 2018, $7.5m in Q4 2018 and $3.7m in Q1 2019. Also excludes tax reform income of $6.0m in Q3 2018 and tax reform expense of $0.7m in Q4 2018
Volume/mix (0.33)
Price 0.39
Costs (0.16)
FX —
Operational items (0.10)
Financing (0.04)
Tax 0.02
Shares outstanding —
Other 0.08
Other items 0.07
Earnings per share Q1
2018 Diluted 0.55
Adjustments 0.05
2018 Adj. Diluted 0.61
YOY Variance (0.03)
2019 Adj. Diluted 0.57
Adjustments 0.13
2019 Diluted 0.44
YOY Variance Breakdown (Adj. Diluted)
Innophos Holdings, Inc. | March 2019 Innophos Holdings, Inc. | Earnings Conference Call First-Quarter 2019 | April 30, 2019
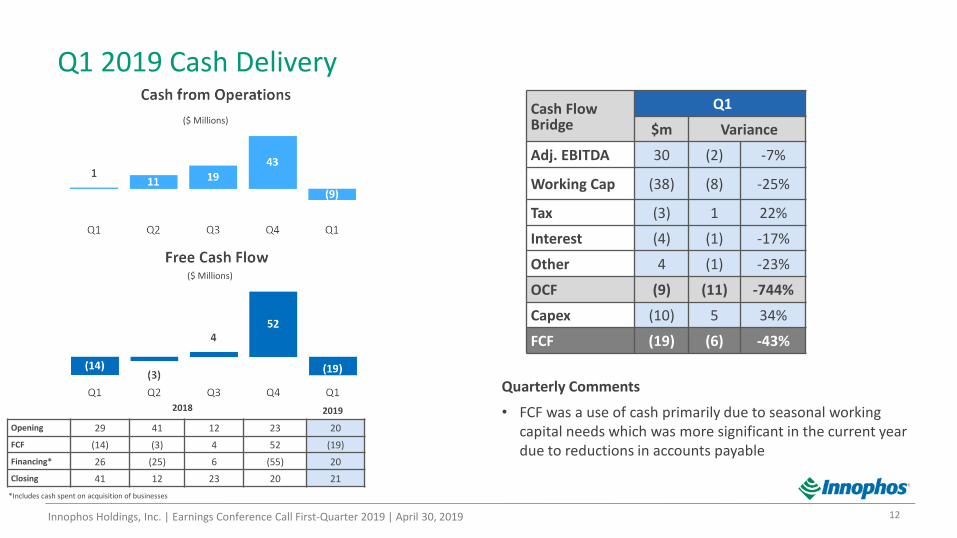
Q1 2019 Cash Delivery
12
2018 2019
($ Millions)
($ Millions)
Quarterly Comments
• FCF was a use of cash primarily due to seasonal working capital needs which was more significant in the current year due to reductions in accounts payable
Opening 29 41 12 23 20
FCF (14) (3) 4 52 (19)
Financing* 26 (25) 6 (55) 20
Closing 41 12 23 20 21
*Includes cash spent on acquisition of businesses
Cash Flow Bridge
Q1
$m Variance
Adj. EBITDA 30 (2) -7%
Working Cap (38) (8) -25%
Tax (3) 1 22%
Interest (4) (1) -17%
Other 4 (1) -23%
OCF (9) (11) -744%
Capex (10) 5 34%
FCF (19) (6) -43%
Innophos Holdings, Inc. | March 2019 Innophos Holdings, Inc. | Earnings Conference Call First-Quarter 2019 | April 30, 2019
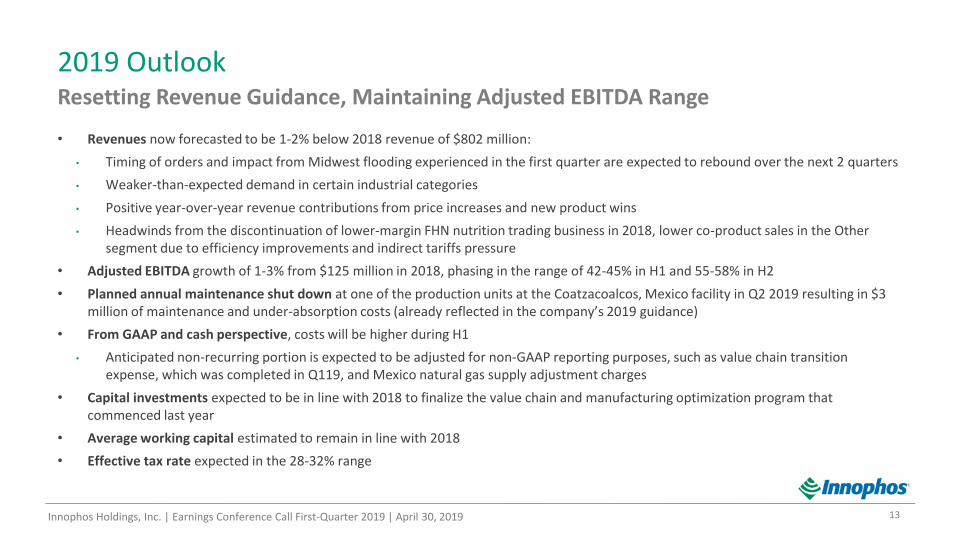
2019 Outlook
• Revenues now forecasted to be 1-2% below 2018 revenue of $802 million:
• Timing of orders and impact from Midwest flooding experienced in the first quarter are expected to rebound over the next 2 quarters
• Weaker-than-expected demand in certain industrial categories
• Positive year-over-year revenue contributions from price increases and new product wins
• Headwinds from the discontinuation of lower-margin FHN nutrition trading business in 2018, lower co-product sales in the Other segment due to efficiency improvements and indirect tariffs pressure
• Adjusted EBITDA growth of 1-3% from $125 million in 2018, phasing in the range of 42-45% in H1 and 55-58% in H2
• Planned annual maintenance shut down at one of the production units at the Coatzacoalcos, Mexico facility in Q2 2019 resulting in $3 million of maintenance and under-absorption costs (already reflected in the company’s 2019 guidance)
• From GAAP and cash perspective, costs will be higher during H1
• Anticipated non-recurring portion is expected to be adjusted for non-GAAP reporting purposes, such as value chain transition expense, which was completed in Q119, and Mexico natural gas supply adjustment charges
• Capital investments expected to be in line with 2018 to finalize the value chain and manufacturing optimization program that commenced last year
• Average working capital estimated to remain in line with 2018
• Effective tax rate expected in the 28-32% range
13
Resetting Revenue Guidance, Maintaining Adjusted EBITDA Range
Innophos Holdings, Inc. | March 2019 Innophos Holdings, Inc. | Earnings Conference Call First-Quarter 2019 | April 30, 2019
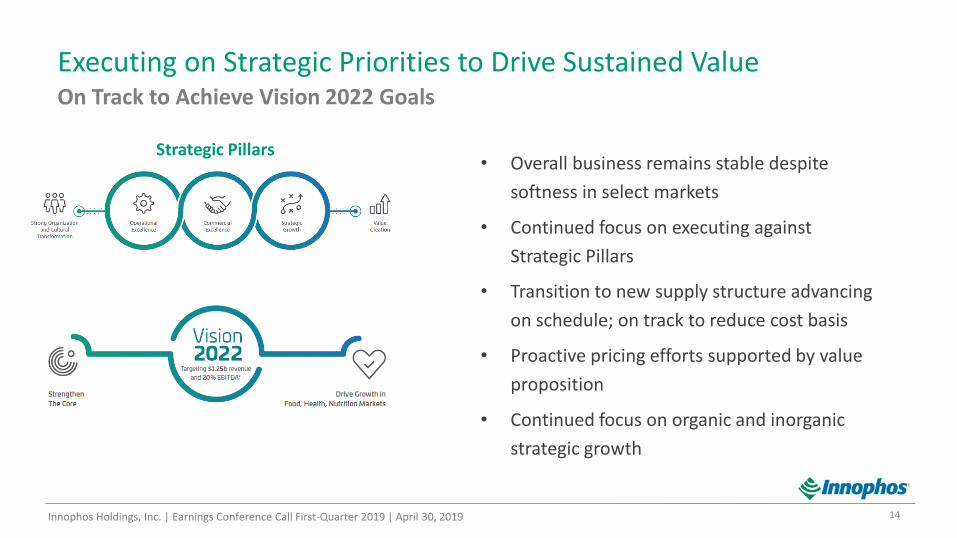
Executing on Strategic Priorities to Drive Sustained Value
• Overall business remains stable despite
softness in select markets
• Continued focus on executing against
Strategic Pillars
• Transition to new supply structure advancing
on schedule; on track to reduce cost basis
• Proactive pricing efforts supported by value
proposition
• Continued focus on organic and inorganic
strategic growth
14
On Track to Achieve Vision 2022 Goals
Strategic Pillars

Innophos Holdings, Inc. | March 2019
Q1 2019 Earnings Call
Q&A
Innophos Holdings, Inc. | March 2019 Innophos Holdings, Inc. | Earnings Conference Call First-Quarter 2019 | April 30, 2019
Non-GAAP Reconciliations
Long Term Targets Innophos is not able to provide a reconciliation of its expectation for adjusted earnings to 2019 GAAP net income given the dynamic nature of the strategic value chain repositioning program expenses and potential Mexico energy charges that may be incurred. In addition, Innophos is not able to provide a reconciliation of its 2022 expectation for adjusted EBITDA margin to GAAP net income due to the number of variables in the projected EBITDA margin for 2022. As a result we are currently unable to quantify accurately certain amounts that would be required to be included in GAAP net income for 2019 or 2022 or the individual adjustments for such reconciliation. In addition, we believe such reconciliation would imply a degree of precision that would be confusing or misleading to investors. Additional Information Free cash flow is a supplemental financial measure that is not required by, or presented in accordance with, US GAAP. The Company believes free cash flow is helpful in analyzing the cash flow generating capability of the business and as a performance measure for purposes of presentation in this investor presentation. The Company defines free cash flow as net cash provided from operating activities plus cash used for capital expenditures plus cash received from sale leaseback transactions. EBITDA, adjusted EBITDA, adjusted net income and adjusted diluted EPS are supplemental financial measures that are not required by, or presented in accordance with, US GAAP. The Company believes EBITDA and adjusted EBITDA are helpful in analyzing the cash flow generating capability of the business and as performance measures for purposes of presentation in this investor presentation. Net Working Capital and Operating Working Capital are supplemental financial measures that are not required by, or presented in accordance with, US GAAP. The Company believes net working capital and operating working capital are helpful in analyzing the effects on the cash flow generating capability of the business and as a performance measure for purposes of presentation in this investor presentation. The Company defines net working capital as total current assets less cash and cash equivalents less total current liabilities plus current portion of capital leases, and defines operating working capital as net working capital less taxes less interest.
16
Innophos Holdings, Inc. | March 2019 Innophos Holdings, Inc. | Earnings Conference Call First-Quarter 2019 | April 30, 2019
Non-GAAP Reconciliations
17
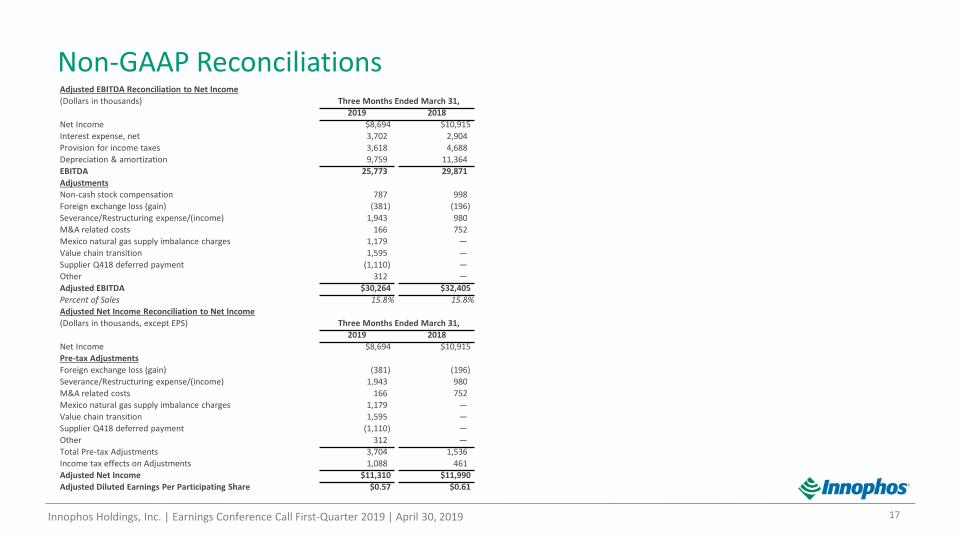
Adjusted EBITDA Reconciliation to Net Income
(Dollars in thousands) Three Months Ended March 31,
2019 2018
Net Income $8,694 $10,915
Interest expense, net 3,702 2,904
Provision for income taxes 3,618 4,688
Depreciation & amortization 9,759 11,364
EBITDA 25,773 29,871
Adjustments
Non-cash stock compensation 787 998
Foreign exchange loss (gain) (381 ) (196 )
Severance/Restructuring expense/(income) 1,943 980
M&A related costs 166 752
Mexico natural gas supply imbalance charges 1,179 —
Value chain transition 1,595 —
Supplier Q418 deferred payment (1,110 ) —
Other 312 —
Adjusted EBITDA $30,264 $32,405
Percent of Sales 15.8 % 15.8 %
Adjusted Net Income Reconciliation to Net Income
(Dollars in thousands, except EPS) Three Months Ended March 31,
2019 2018
Net Income $8,694 $10,915
Pre-tax Adjustments
Foreign exchange loss (gain) (381 ) (196 )
Severance/Restructuring expense/(income) 1,943 980
M&A related costs 166 752
Mexico natural gas supply imbalance charges 1,179 —
Value chain transition 1,595 —
Supplier Q418 deferred payment (1,110 ) —
Other 312 —
Total Pre-tax Adjustments 3,704 1,536
Income tax effects on Adjustments 1,088 461
Adjusted Net Income $11,310 $11,990
Adjusted Diluted Earnings Per Participating Share $0.57 $0.61
Innophos Holdings, Inc. | March 2019 Innophos Holdings, Inc. | Earnings Conference Call First-Quarter 2019 | April 30, 2019
Non-GAAP Reconciliations
18
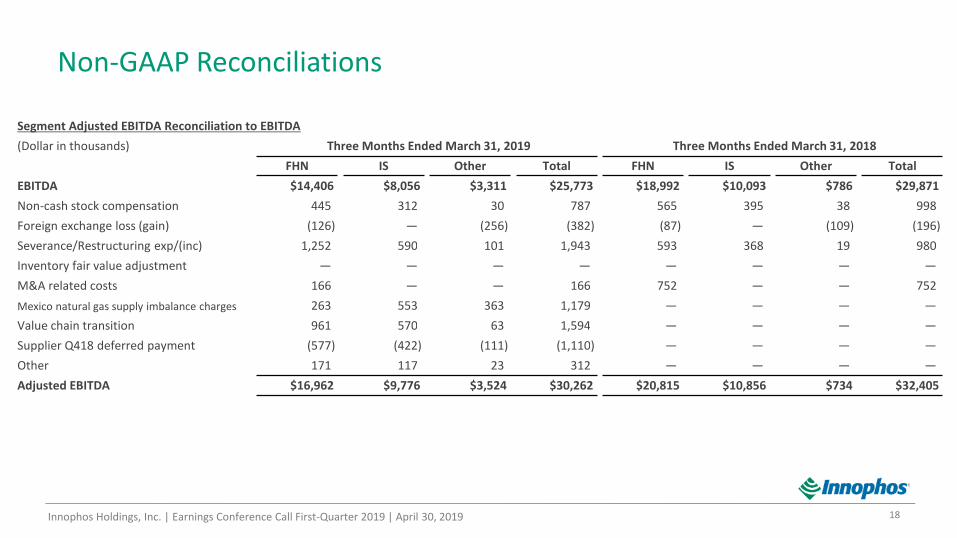
Segment Adjusted EBITDA Reconciliation to EBITDA
(Dollar in thousands) Three Months Ended March 31, 2019 Three Months Ended March 31, 2018
FHN IS Other Total FHN IS Other Total
EBITDA $14,406 $8,056 $3,311 $25,773 $18,992 $10,093 $786 $29,871
Non-cash stock compensation 445 312 30 787 565 395 38 998
Foreign exchange loss (gain) (126 ) — (256 ) (382 ) (87 ) — (109 ) (196 )
Severance/Restructuring exp/(inc) 1,252 590 101 1,943 593 368 19 980
Inventory fair value adjustment — — — — — — — —
M&A related costs 166 — — 166 752 — — 752
Mexico natural gas supply imbalance charges 263 553 363 1,179 — — — —
Value chain transition 961 570 63 1,594 — — — —
Supplier Q418 deferred payment (577 ) (422 ) (111 ) (1,110 ) — — — —
Other 171 117 23 312 — — — —
Adjusted EBITDA $16,962 $9,776 $3,524 $30,262 $20,815 $10,856 $734 $32,405
Innophos Holdings, Inc. | March 2019 Innophos Holdings, Inc. | Earnings Conference Call First-Quarter 2019 | April 30, 2019
Non-GAAP Reconciliations
19
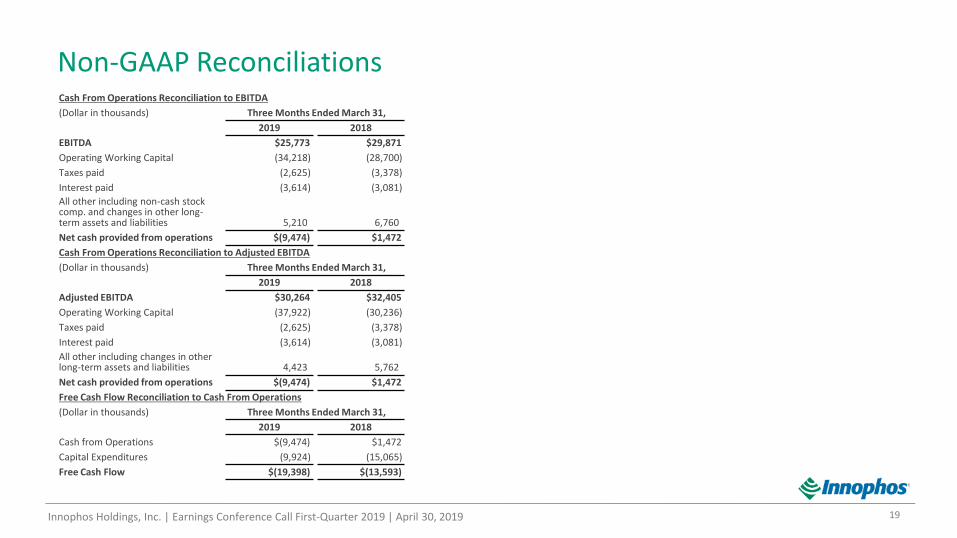
Cash From Operations Reconciliation to EBITDA
(Dollar in thousands) Three Months Ended March 31,
2019 2018
EBITDA $25,773 $29,871
Operating Working Capital (34,218 ) (28,700 )
Taxes paid (2,625 ) (3,378 )
Interest paid (3,614 ) (3,081 )
All other including non-cash stock comp. and changes in other long-term assets and liabilities 5,210 6,760
Net cash provided from operations $(9,474) $1,472
Cash From Operations Reconciliation to Adjusted EBITDA
(Dollar in thousands) Three Months Ended March 31,
2019 2018
Adjusted EBITDA $30,264 $32,405
Operating Working Capital (37,922 ) (30,236 )
Taxes paid (2,625 ) (3,378 )
Interest paid (3,614 ) (3,081 )
All other including changes in other long-term assets and liabilities 4,423 5,762
Net cash provided from operations $(9,474) $1,472
Free Cash Flow Reconciliation to Cash From Operations
(Dollar in thousands) Three Months Ended March 31,
2019 2018
Cash from Operations $(9,474) $1,472
Capital Expenditures (9,924 ) (15,065 )
Free Cash Flow $(19,398) $(13,593)

Innophos Holdings, Inc. | March 2019
ABOUT THE COMPANY Innophos (NASDAQ: IPHS) is a leading international producer of specialty ingredient solutions that deliver far-reaching, versatile benefits for the food, health, nutrition and industrial markets. We leverage our expertise in the science and technology of blending and formulating phosphate, mineral, enzyme and botanical-based ingredients to help our customers offer products that are tasty, healthy, nutritious and economical. Headquartered in Cranbury, New Jersey, Innophos has manufacturing operations across the United States, in Canada, Mexico and China. For more information please visit www.innophos.com
CONTACT Investors: Mark Feuerbach, 609-366-1204 or [email protected] Media: Ryan Flaim, Sharon Merrill Associates, 617-542-5300 or [email protected]
Related Documents