First Quarter 2016 Earnings Presentation April 26, 2016

Welcome message from author
This document is posted to help you gain knowledge. Please leave a comment to let me know what you think about it! Share it to your friends and learn new things together.
Transcript

First Quarter 2016
Earnings Presentation
April 26, 2016
Safe Harbor Statement
Statements contained in this presentation that reflect our views about our future performance and constitute
“forward-looking statements” under the Private Securities Litigation Reform Act of 1995. Forward-looking
statements can be identified by words such as “believe,” “anticipate,” “appear,” “may,” “will,” “should,” “intend,”
“plan,” “estimate,” “expect,” “assume,” “seek,” “forecast,” and similar references to future periods. Our views
about future performance involve risks and uncertainties that are difficult to predict and, accordingly, our
actual results may differ materially from the results discussed in our forward-looking statements. We caution
you against relying on any of these forward-looking statements.
Our future performance may be affected by the levels of home improvement activity and new home
construction, our ability to maintain our strong brands and to develop and introduce new and improved
products, our ability to maintain our competitive position in our industries, our reliance on key customers, our
ability to achieve the anticipated benefits of our strategic initiatives, our ability to sustain the performance of
our cabinetry businesses, the cost and availability of raw materials, our dependence on third party suppliers,
and risks associated with international operations and global strategies. These and other factors are
discussed in detail in Item 1A, “Risk Factors” in our most recent Annual Report on Form 10-K, as well as in
our Quarterly Reports on Form 10-Q and in other filings we make with the Securities and Exchange
Commission. The forward-looking statements in this presentation speak only as of the date of this
presentation. Factors or events that could cause our actual results to differ may emerge from time to time,
and it is not possible for us to predict all of them. Unless required by law, we undertake no obligation to
update publicly any forward-looking statements as a result of new information, future events or otherwise.
2
Masco Q1 2016 Results
Topic
• Summary of Results Keith Allman
• Financial/Operations Review John Sznewajs
• Q&A
3
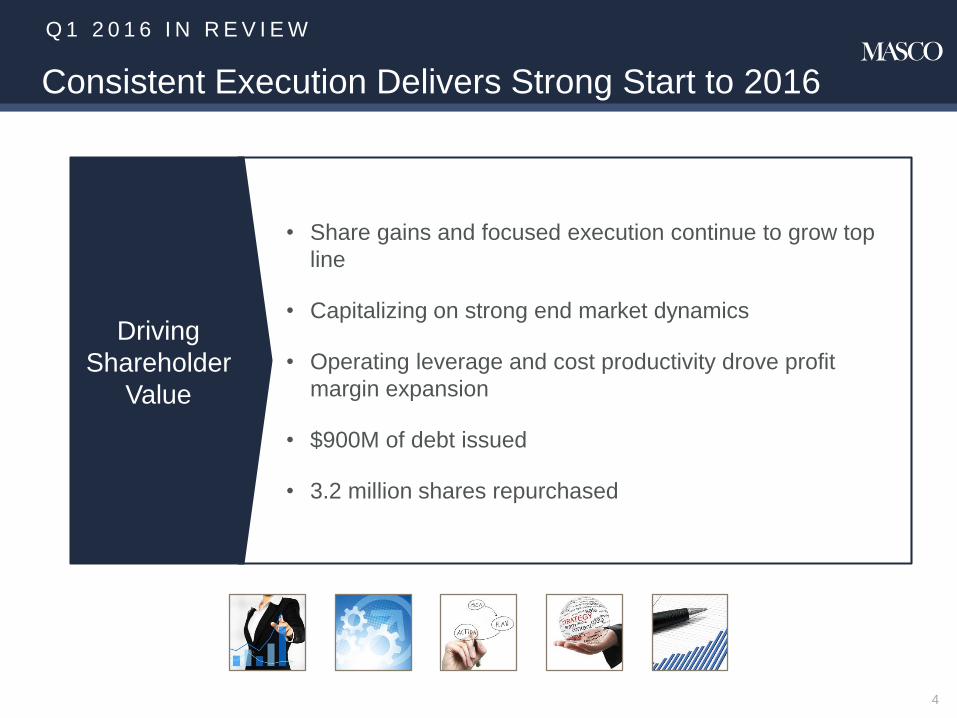
Consistent Execution Delivers Strong Start to 2016
• Share gains and focused execution continue to grow top
line
• Capitalizing on strong end market dynamics
• Operating leverage and cost productivity drove profit
margin expansion
• $900M of debt issued
• 3.2 million shares repurchased
4
Driving
Shareholder
Value
Q 1 2 0 1 6 I N R E V I E W
Masco Q1 2016 Results
Topic
• Summary of Results Keith Allman
• Financial/Operations Review John Sznewajs
• Q&A
5
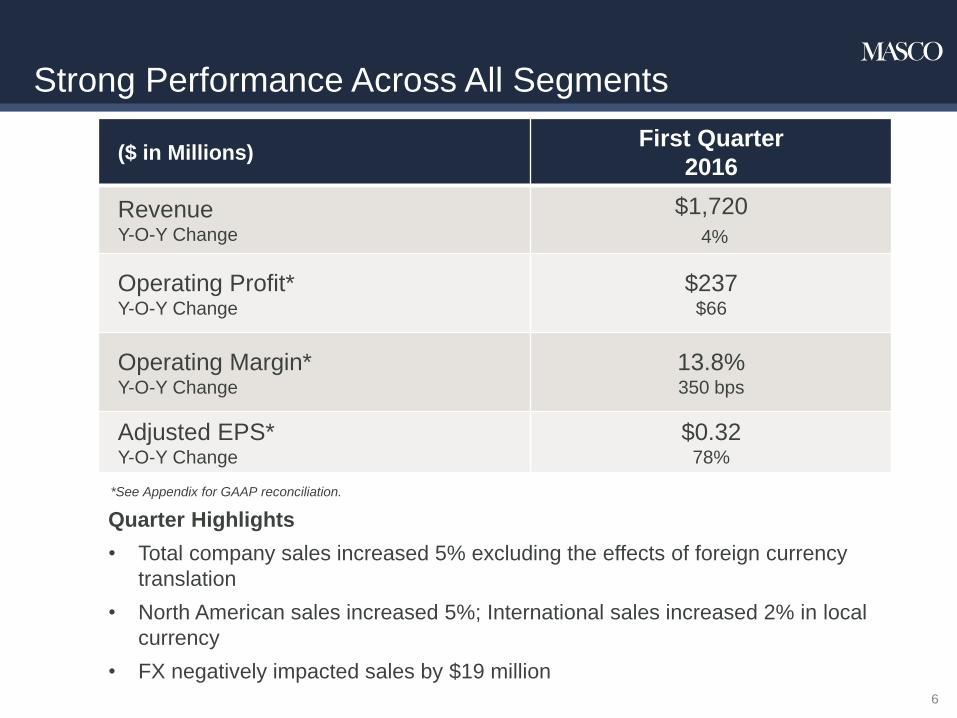
Strong Performance Across All Segments
6
*See Appendix for GAAP reconciliation.
Quarter Highlights
• Total company sales increased 5% excluding the effects of foreign currency
translation
• North American sales increased 5%; International sales increased 2% in local
currency
• FX negatively impacted sales by $19 million
($ in Millions)First Quarter
2016
Revenue Y-O-Y Change
$1,720
4%
Operating Profit* Y-O-Y Change
$237$66
Operating Margin* Y-O-Y Change
13.8%350 bps
Adjusted EPS*Y-O-Y Change
$0.3278%
P L U M B I N G P R O D U C T S
7
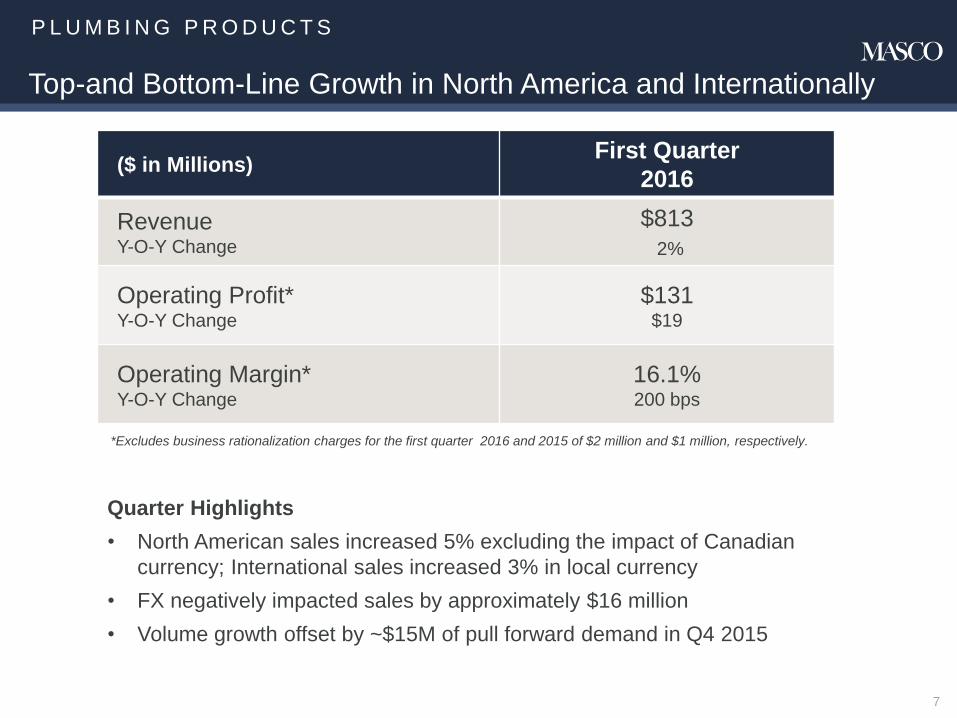
Top-and Bottom-Line Growth in North America and Internationally
Quarter Highlights
• North American sales increased 5% excluding the impact of Canadian
currency; International sales increased 3% in local currency
• FX negatively impacted sales by approximately $16 million
• Volume growth offset by ~$15M of pull forward demand in Q4 2015
($ in Millions)First Quarter
2016
Revenue Y-O-Y Change
$813
2%
Operating Profit* Y-O-Y Change
$131$19
Operating Margin* Y-O-Y Change
16.1%200 bps
*Excludes business rationalization charges for the first quarter 2016 and 2015 of $2 million and $1 million, respectively.
D E C O R AT I V E A R C H I T E C T U R A L P R O D U C T S
8
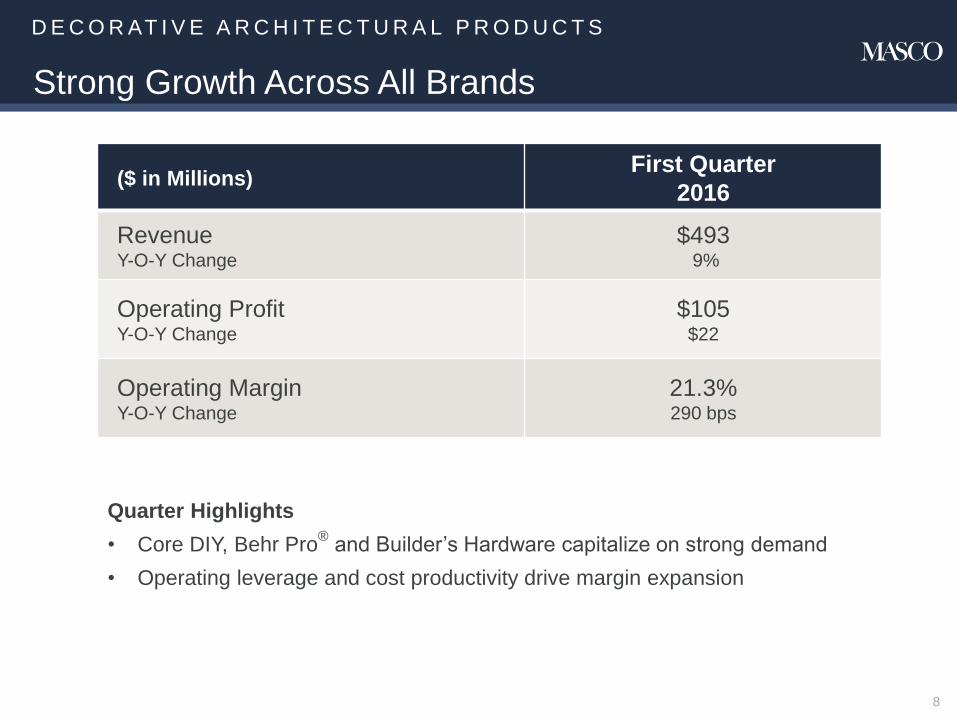
Strong Growth Across All Brands
Quarter Highlights
• Core DIY, Behr Pro®
and Builder’s Hardware capitalize on strong demand
• Operating leverage and cost productivity drive margin expansion
($ in Millions)First Quarter
2016
Revenue Y-O-Y Change
$4939%
Operating Profit Y-O-Y Change
$105$22
Operating Margin Y-O-Y Change
21.3%290 bps
C A B I N E T R Y P R O D U C T S
9
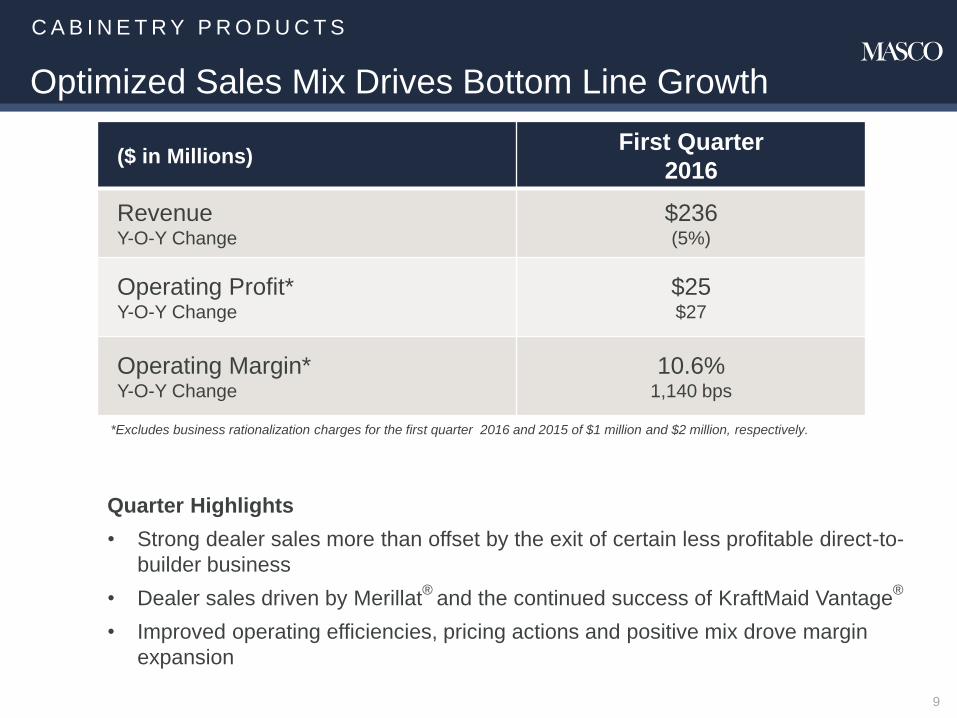
Optimized Sales Mix Drives Bottom Line Growth
Quarter Highlights
• Strong dealer sales more than offset by the exit of certain less profitable direct-to-
builder business
• Dealer sales driven by Merillat®
and the continued success of KraftMaid Vantage®
• Improved operating efficiencies, pricing actions and positive mix drove margin
expansion
($ in Millions)First Quarter
2016
Revenue Y-O-Y Change
$236(5%)
Operating Profit* Y-O-Y Change
$25$27
Operating Margin* Y-O-Y Change
10.6%1,140 bps
*Excludes business rationalization charges for the first quarter 2016 and 2015 of $1 million and $2 million, respectively.
W I N D O W S A N D O T H E R S P E C I A LT Y P R O D U C T S
10
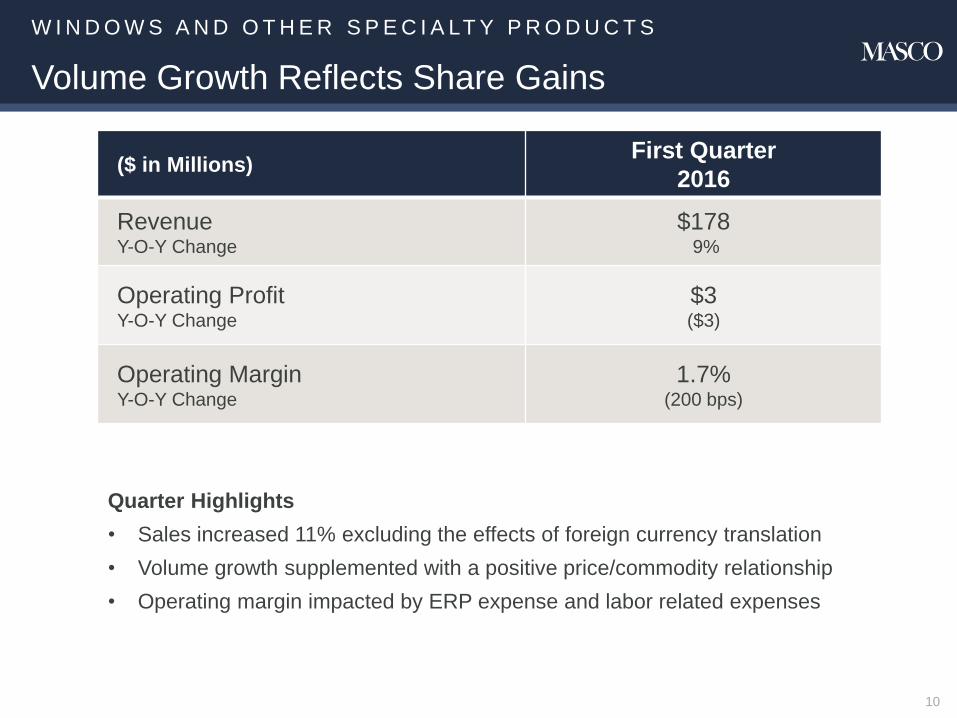
Volume Growth Reflects Share Gains
Quarter Highlights
• Sales increased 11% excluding the effects of foreign currency translation
• Volume growth supplemented with a positive price/commodity relationship
• Operating margin impacted by ERP expense and labor related expenses
($ in Millions)First Quarter
2016
Revenue Y-O-Y Change
$1789%
Operating ProfitY-O-Y Change
$3($3)
Operating MarginY-O-Y Change
1.7%(200 bps)
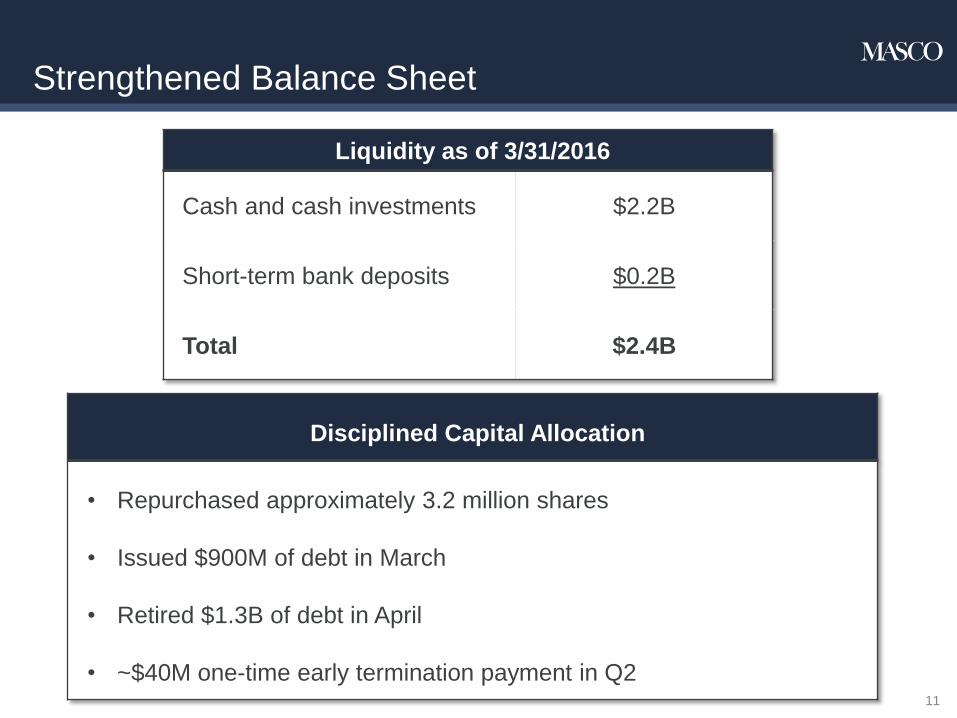
Strengthened Balance Sheet
Liquidity as of 3/31/2016
Cash and cash investments $2.2B
Short-term bank deposits $0.2B
Total $2.4B
11
Disciplined Capital Allocation
• Repurchased approximately 3.2 million shares
• Issued $900M of debt in March
• Retired $1.3B of debt in April
• ~$40M one-time early termination payment in Q2
Masco Q1 2016 Results
Topic
• Summary of Results Keith Allman
• Financial/Operations Review John Sznewajs
• Q&A
12

Q&A
Appendix
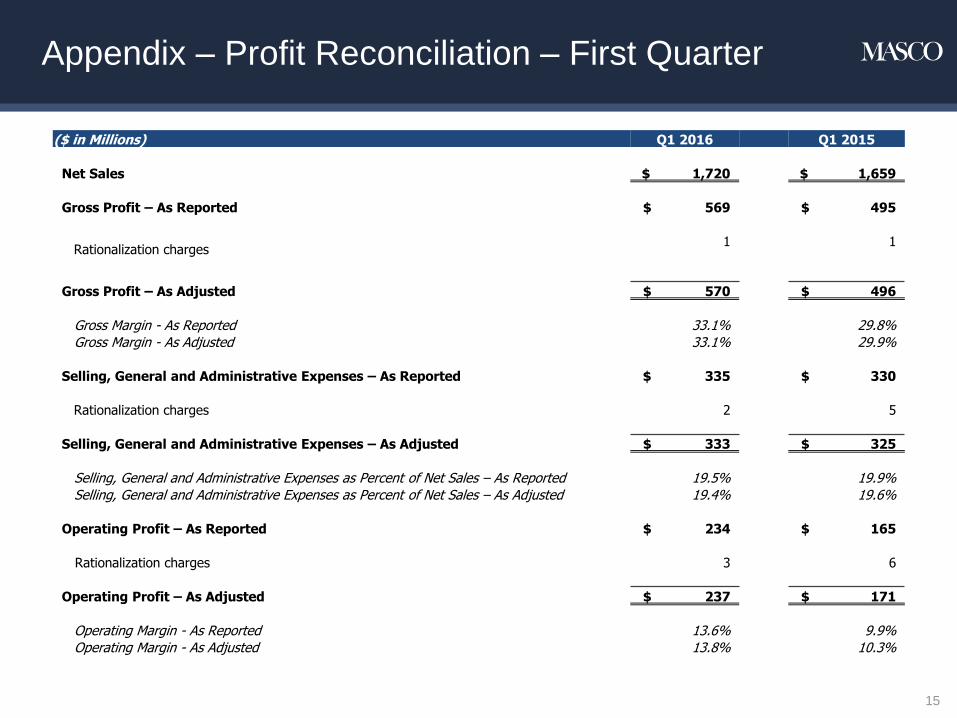
Appendix – Profit Reconciliation – First Quarter
15
($ in Millions) Q1 2016 Q1 2015
Net Sales $ 1,720 $ 1,659
Gross Profit – As Reported $ 569 $ 495
Rationalization charges 1 1
Gross Profit – As Adjusted $ 570 $ 496
Gross Margin - As Reported 33.1% 29.8%Gross Margin - As Adjusted 33.1% 29.9%
Selling, General and Administrative Expenses – As Reported $ 335 $ 330
Rationalization charges 2 5
Selling, General and Administrative Expenses – As Adjusted $ 333 $ 325
Selling, General and Administrative Expenses as Percent of Net Sales – As Reported 19.5% 19.9%
Selling, General and Administrative Expenses as Percent of Net Sales – As Adjusted 19.4% 19.6%
Operating Profit – As Reported $ 234 $ 165
Rationalization charges 3 6
Operating Profit – As Adjusted $ 237 $ 171
Operating Margin - As Reported 13.6% 9.9%Operating Margin - As Adjusted 13.8% 10.3%
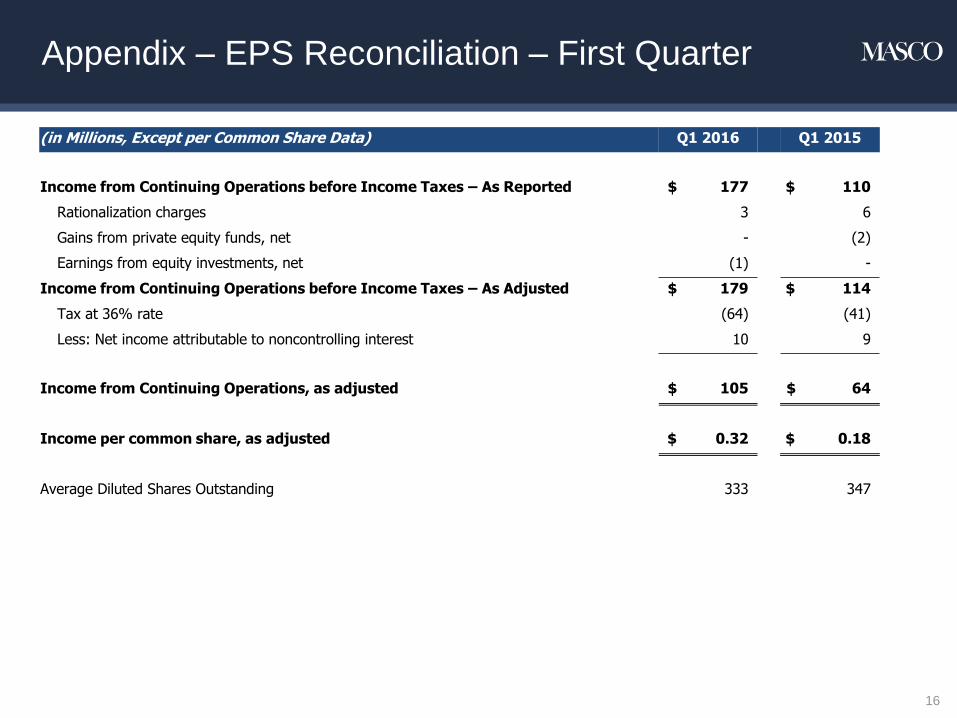
Appendix – EPS Reconciliation – First Quarter
16
(in Millions, Except per Common Share Data) Q1 2016 Q1 2015
Income from Continuing Operations before Income Taxes – As Reported $ 177 $ 110
Rationalization charges 3 6
Gains from private equity funds, net - (2)
Earnings from equity investments, net (1) -
Income from Continuing Operations before Income Taxes – As Adjusted $ 179 $ 114
Tax at 36% rate (64) (41)
Less: Net income attributable to noncontrolling interest 10 9
Income from Continuing Operations, as adjusted $ 105 $ 64
Income per common share, as adjusted $ 0.32 $ 0.18
Average Diluted Shares Outstanding 333 347
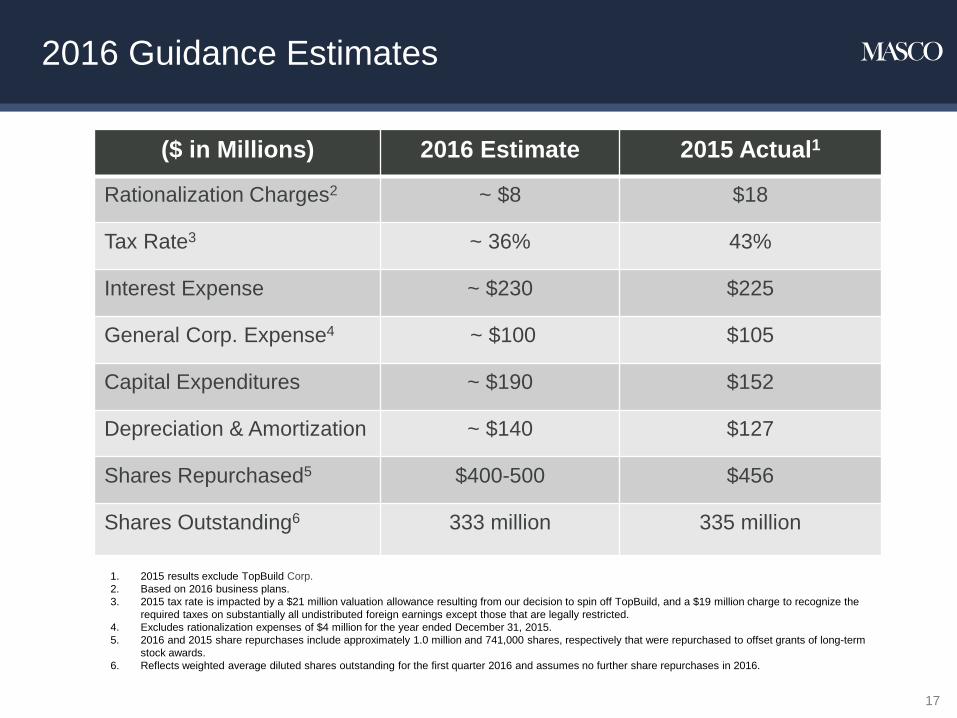
($ in Millions) 2016 Estimate 2015 Actual1
Rationalization Charges2 ~ $8 $18
Tax Rate3 ~ 36% 43%
Interest Expense ~ $230 $225
General Corp. Expense4 ~ $100 $105
Capital Expenditures ~ $190 $152
Depreciation & Amortization ~ $140 $127
Shares Repurchased5 $400-500 $456
Shares Outstanding6 333 million 335 million
1. 2015 results exclude TopBuild Corp.
2. Based on 2016 business plans.
3. 2015 tax rate is impacted by a $21 million valuation allowance resulting from our decision to spin off TopBuild, and a $19 million charge to recognize the
required taxes on substantially all undistributed foreign earnings except those that are legally restricted.
4. Excludes rationalization expenses of $4 million for the year ended December 31, 2015.
5. 2016 and 2015 share repurchases include approximately 1.0 million and 741,000 shares, respectively that were repurchased to offset grants of long-term
stock awards.
6. Reflects weighted average diluted shares outstanding for the first quarter 2016 and assumes no further share repurchases in 2016.
17
2016 Guidance Estimates
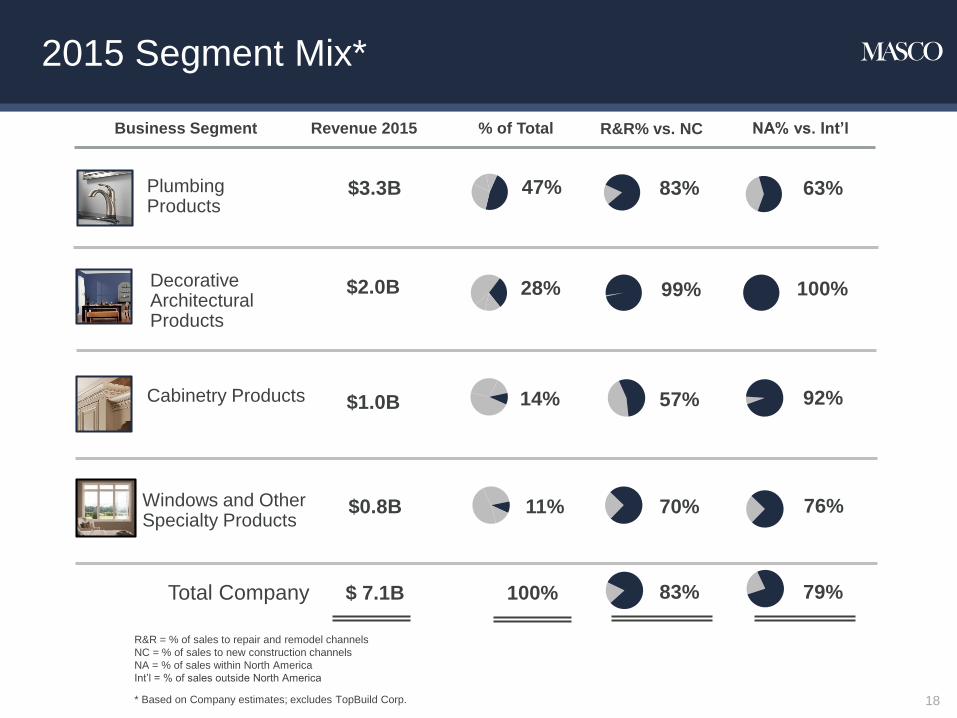
2015 Segment Mix*
R&R = % of sales to repair and remodel channels
NC = % of sales to new construction channels
NA = % of sales within North America
Int’l = % of sales outside North America
* Based on Company estimates; excludes TopBuild Corp.
Business Segment
PlumbingProducts
DecorativeArchitecturalProducts
$3.3B
$2.0B
Revenue 2015 % of Total
47%
28%
$ 7.1B 100%Total Company
Windows and Other Specialty Products
$0.8B 11%
R&R% vs. NC NA% vs. Int’l
83% 63%
99% 100%
70% 76%
83% 79%
Cabinetry Products $1.0B 14% 57% 92%
18
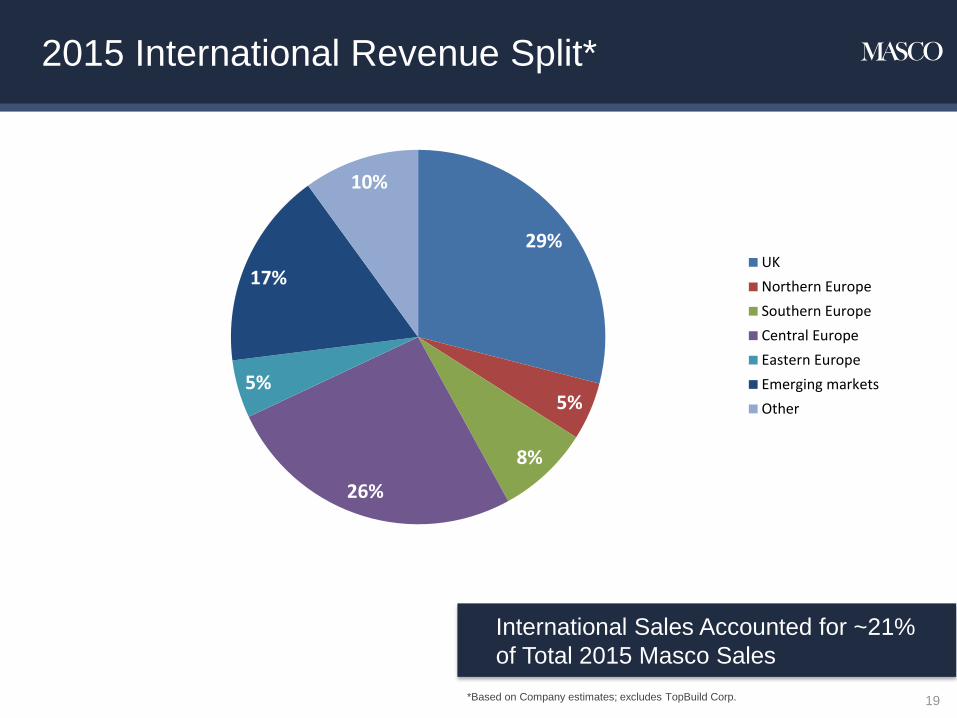
2015 International Revenue Split*
*Based on Company estimates; excludes TopBuild Corp.
International Sales Accounted for ~21%
of Total 2015 Masco Sales
29%
5%
8%
26%
5%
17%
10%
UK
Northern Europe
Southern Europe
Central Europe
Eastern Europe
Emerging markets
Other
19
Related Documents