Putting a Price Tag on the Common Core: How Much Will Smart I mplementation C ost? By Patrick Murphy and Elliot Regenstein with Keith McNamara Foreword by Chester E. Finn, Jr. and Amber M. Winkler May 2012

Welcome message from author
This document is posted to help you gain knowledge. Please leave a comment to let me know what you think about it! Share it to your friends and learn new things together.
Transcript
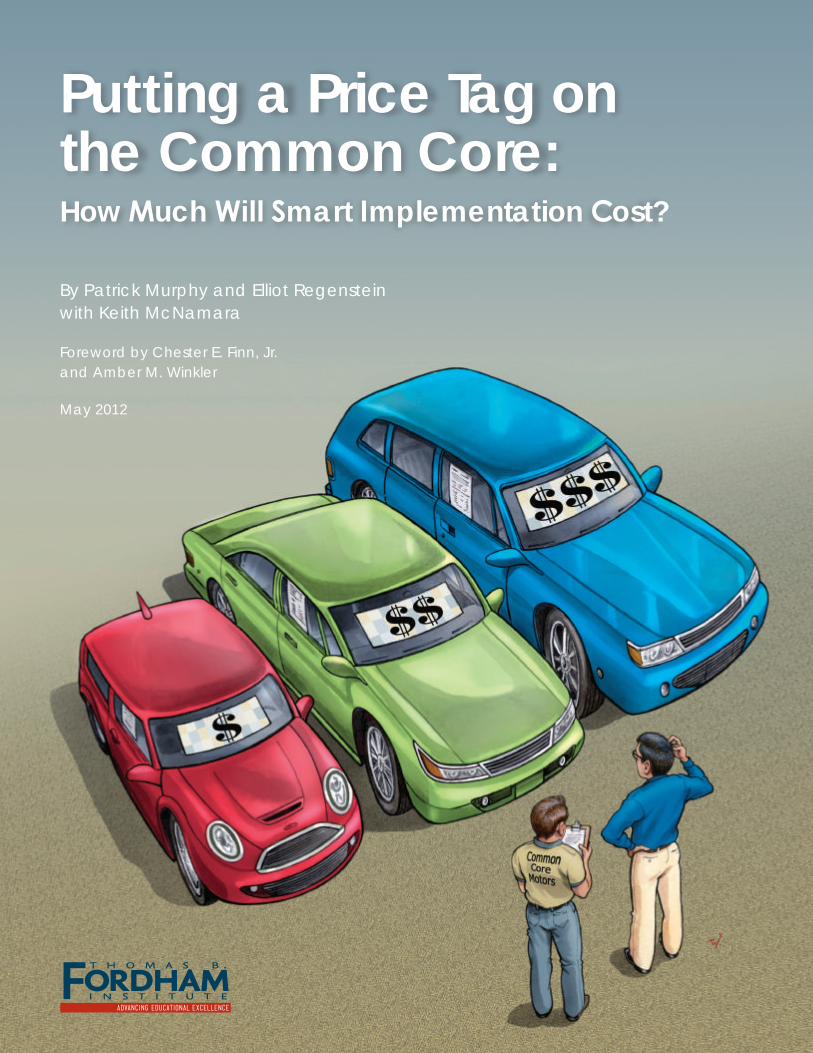
Putting a Price Tag on the Common Core: How Much Will Smart Implementation Cost?
By Patrick Murphy and Elliot Regensteinwith Keith McNamara
Foreword by Chester E. Finn, Jr. and Amber M. Winkler
May 2012
The Thomas B. Fordham Institute is the nation’s leader
in advancing educational excellence for every child
through quality research, analysis, and commentary, as
well as on-the-ground action and advocacy in Ohio. It is
affiliated with the Thomas B. Fordham Foundation, and
this publication is a joint project of the Foundation and
the Institute. For further information, please visit our
website at www.edexcellence.net or write to the Institute
at 1016 16th St. NW, 8th Floor, Washington, D.C. 20036.
The Institute is neither connected with nor sponsored
by Fordham University.
ContentsExecutive Summary .................................................................................................................................... 2
Foreword ....................................................................................................................................................... 7
Introduction ...............................................................................................................................................13 Organization .................................................................................................................................14
Part I: Bounding the Discussion ..............................................................................................................15 A Focus on Transitional Costs ....................................................................................................15 Allocating Costs: State and Local ...............................................................................................16
Part II: Estimating the Costs of Implementation ..................................................................................18 Primary Cost Drivers ...................................................................................................................19 Modeling the Gross Costs ...........................................................................................................24 Determining the Net Costs .........................................................................................................28
Part III: Thinking Differently about Common Core Implementation ...............................................37 Instructional Materials ................................................................................................................37 Assessments ..................................................................................................................................38 Professional Development ..........................................................................................................39 …But Don’t Stop There ................................................................................................................40
Conclusion .................................................................................................................................................41
Appendix A: Technology in Common Core Implementation.............................................................42
Appendix B: District Budget Estimates ..................................................................................................44
Appendix C: Data Sources .......................................................................................................................46
Appendix D: States’ Common Core Resources .....................................................................................48
About the Authors .....................................................................................................................................51
Endnotes .....................................................................................................................................................52
Page 2
Executive SummaryThe Common Core State Standards (CCSS) for English language arts and mathematics represent a sea change in standards-based reform and have now been adopted in forty-five states and the District of Columbia.1 Smart implementation of the Common Core is the next—and greatest—challenge for these states, because without it these robust standards will have little impact on instruction and learning. Although most states have now set forth implementation plans—some more thoughtful than others—these tomes seldom address the crucial matter of cost. This is always a consideration, but never more so than when state and local budgets are tight.
This paper assists states in evaluating the financial implications of transitioning to the CCSS. It addresses three key questions:
What are the short-term costs of moving to the Common Core? That is, what is the initial expense of implementing the new standards and providing the necessary instructional materials, assessment tools, and professional development?
To what extent do costs vary based on the approaches that states take to implement the standards?
How much of what states currently spend on standards implementation could be repurposed for Common Core implementation?
To examine these questions, we craft three hypothetical approaches to implementing the Common Core standards during the transitional phase, which we expect to span one to three years prior to full implementation in 2014–15. These approaches are:
Business as Usual. This “traditional” approach to implementation is defined here as buying hard-copy textbooks, administering annual student assessments on paper, and delivering in-person professional development to all teachers. It is not a cheap approach, though the price tags associated with it are quite familiar.
Bare Bones. This is the lowest-cost alternative, employing open-source materials, annual computer-administered assessments, and online professional development via webinars and modules.
Balanced Implementation. This is a blend of approaches, some of which may be more effective than others while also reducing costs. It uses a mix of instructional materials (e.g., teacher self-published texts and/or district-produced materials), both interim and summative assessments, and a hybrid system of professional development (e.g., train-the-trainers).
1
2
3
| Executive Summary
Page 3
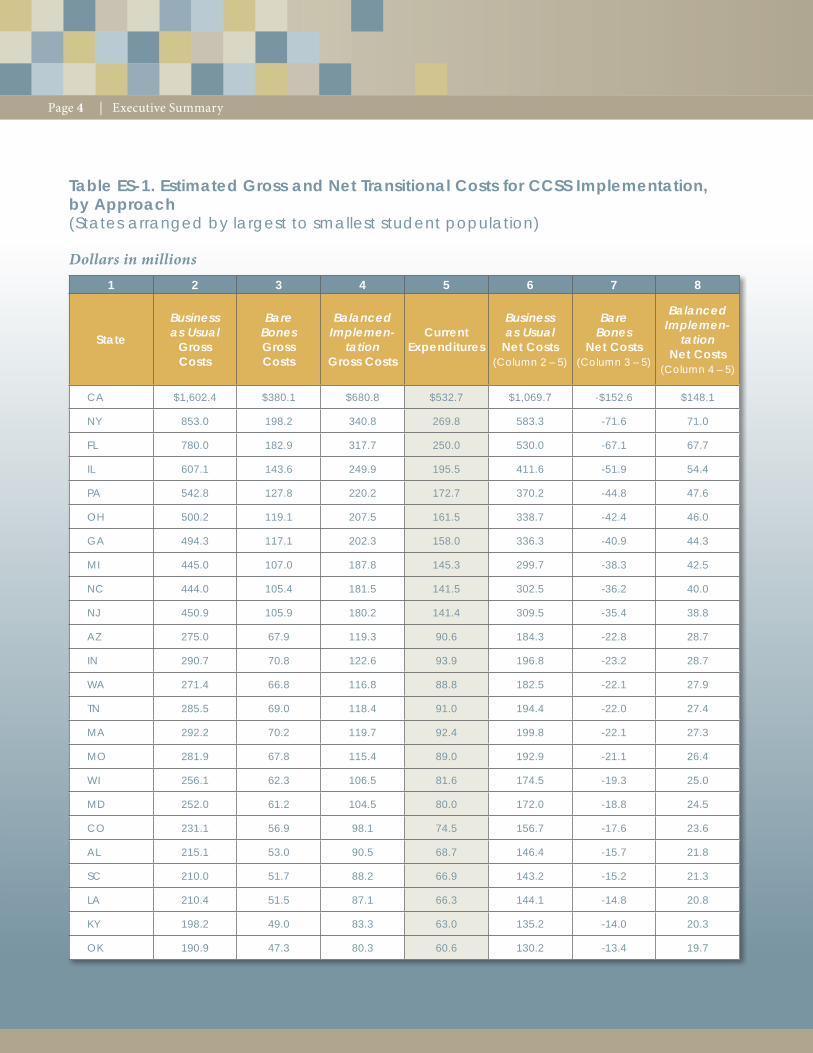
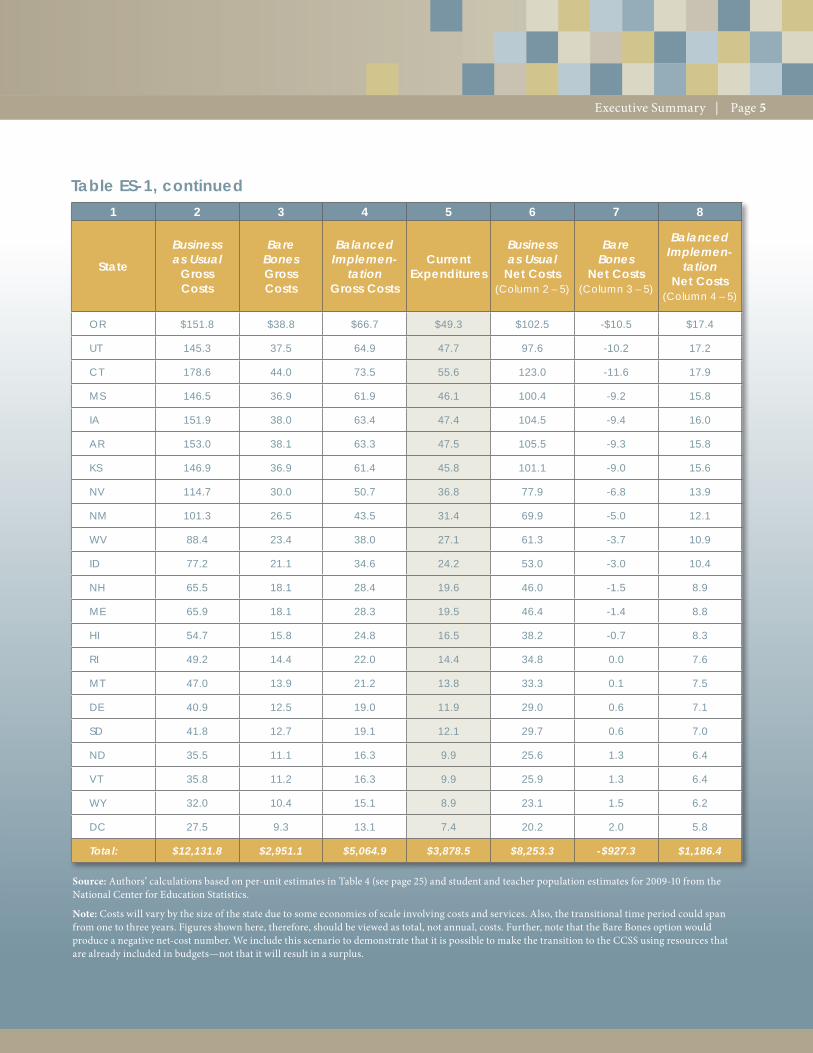
Table ES-1, specifically columns 2, 3, and 4, provides state-level estimates for the gross costs of implementing the CCSS using each of the three approaches (see pages 4-5).
Not surprisingly, cost projections vary with the approaches that states use to implement the Common Core. Balanced Implementation costs less than half as much as the more traditional Business as Usual. The gross transitional costs for California, for instance, range from $1.6 billion under the Business as Usual approach to $380 million under Bare Bones. For much-smaller Vermont, there could be a difference of up to $24.6 million depending on the approach chosen.
Cumulative national estimates range from $12.1 billion for Business as Usual to $3.0 and $5.1 billion respectively for the Bare Bones and Balanced Implementation models. The most significant source of cost reduction comes from shifting away from hard-copy textbooks and using more online resources to deliver professional development. Note that the Balanced Implementation approach also models increased expenditures for assessment, because states may deem the inclusion of interim tests to be a worthy additional investment. (And they probably are!)
Viewed on a per-pupil basis, these costs range from $249 to $396 for Business as Usual.2 Under Balanced Implementation, they range from $109 to $189. Nationally, per-pupil expenditures were $10,499 in 2009.3 In other words, under the most conservative option, these transitional costs would represent about 3 percent of annual K–12 education spending. But if states pursue strategies that take advantage of technology—and in some instances are more cost effective—the gross costs could fall to around 1.5 percent of what is spent per student in most states every year. Relatively speaking, that is a drop in the bucket. And because in most states the transitional period is likely to span several years, the annual cost would be lower still.
Yet these estimates represent the total cost of implementing the Common Core, not the net new cost to states. Indeed, discussing these figures as 1 to 3 percent of annual spending overlooks the fact that states already spend sizable sums on instructional materials, assessment, and professional development. So how much existing funding can be repurposed as states move to the Common Core?
Look again at Table ES-1. Column 5 uses conservative assumptions delineated in the paper to estimate current expenditures for instructional materials, assessment, and professional development. The final three columns (6, 7, and 8) subtract current expenditures from the gross costs to produce net estimates for each implementation model.
Executive Summary |
Page 4Page 4
1 2 3 4 5 6 7 8
State
Business as Usual
Gross Costs
Bare BonesGross Costs
Balanced Implemen-
tationGross Costs
Current Expenditures
Business as Usual
Net Costs(Column 2 – 5)
Bare Bones
Net Costs(Column 3 – 5)
Balanced Implemen-
tationNet Costs
(Column 4 – 5)
CA $1,602.4 $380.1 $680.8 $532.7 $1,069.7 -$152.6 $148.1
NY 853.0 198.2 340.8 269.8 583.3 -71.6 71.0
FL 780.0 182.9 317.7 250.0 530.0 -67.1 67.7
IL 607.1 143.6 249.9 195.5 411.6 -51.9 54.4
PA 542.8 127.8 220.2 172.7 370.2 -44.8 47.6
OH 500.2 119.1 207.5 161.5 338.7 -42.4 46.0
GA 494.3 117.1 202.3 158.0 336.3 -40.9 44.3
MI 445.0 107.0 187.8 145.3 299.7 -38.3 42.5
NC 444.0 105.4 181.5 141.5 302.5 -36.2 40.0
NJ 450.9 105.9 180.2 141.4 309.5 -35.4 38.8
AZ 275.0 67.9 119.3 90.6 184.3 -22.8 28.7
IN 290.7 70.8 122.6 93.9 196.8 -23.2 28.7
WA 271.4 66.8 116.8 88.8 182.5 -22.1 27.9
TN 285.5 69.0 118.4 91.0 194.4 -22.0 27.4
MA 292.2 70.2 119.7 92.4 199.8 -22.1 27.3
MO 281.9 67.8 115.4 89.0 192.9 -21.1 26.4
WI 256.1 62.3 106.5 81.6 174.5 -19.3 25.0
MD 252.0 61.2 104.5 80.0 172.0 -18.8 24.5
CO 231.1 56.9 98.1 74.5 156.7 -17.6 23.6
AL 215.1 53.0 90.5 68.7 146.4 -15.7 21.8
SC 210.0 51.7 88.2 66.9 143.2 -15.2 21.3
LA 210.4 51.5 87.1 66.3 144.1 -14.8 20.8
KY 198.2 49.0 83.3 63.0 135.2 -14.0 20.3
OK 190.9 47.3 80.3 60.6 130.2 -13.4 19.7
Table ES-1. Estimated Gross and Net Transitional Costs for CCSS Implementation, by Approach (States arranged by largest to smallest student population)
Dollars in millions
| Executive Summary
Page 5Page 5
Table ES-1, continued
1 2 3 4 5 6 7 8
State
Business as Usual
Gross Costs
Bare BonesGross Costs
Balanced Implemen-
tationGross Costs
Current Expenditures
Business as Usual
Net Costs(Column 2 – 5)
Bare Bones
Net Costs(Column 3 – 5)
Balanced Implemen-
tationNet Costs
(Column 4 – 5)
OR $151.8 $38.8 $66.7 $49.3 $102.5 -$10.5 $17.4
UT 145.3 37.5 64.9 47.7 97.6 -10.2 17.2
CT 178.6 44.0 73.5 55.6 123.0 -11.6 17.9
MS 146.5 36.9 61.9 46.1 100.4 -9.2 15.8
IA 151.9 38.0 63.4 47.4 104.5 -9.4 16.0
AR 153.0 38.1 63.3 47.5 105.5 -9.3 15.8
KS 146.9 36.9 61.4 45.8 101.1 -9.0 15.6
NV 114.7 30.0 50.7 36.8 77.9 -6.8 13.9
NM 101.3 26.5 43.5 31.4 69.9 -5.0 12.1
WV 88.4 23.4 38.0 27.1 61.3 -3.7 10.9
ID 77.2 21.1 34.6 24.2 53.0 -3.0 10.4
NH 65.5 18.1 28.4 19.6 46.0 -1.5 8.9
ME 65.9 18.1 28.3 19.5 46.4 -1.4 8.8
HI 54.7 15.8 24.8 16.5 38.2 -0.7 8.3
RI 49.2 14.4 22.0 14.4 34.8 0.0 7.6
MT 47.0 13.9 21.2 13.8 33.3 0.1 7.5
DE 40.9 12.5 19.0 11.9 29.0 0.6 7.1
SD 41.8 12.7 19.1 12.1 29.7 0.6 7.0
ND 35.5 11.1 16.3 9.9 25.6 1.3 6.4
VT 35.8 11.2 16.3 9.9 25.9 1.3 6.4
WY 32.0 10.4 15.1 8.9 23.1 1.5 6.2
DC 27.5 9.3 13.1 7.4 20.2 2.0 5.8
Total: $12,131.8 $2,951.1 $5,064.9 $3,878.5 $8,253.3 -$927.3 $1,186.4
Source: Authors’ calculations based on per-unit estimates in Table 4 (see page 25) and student and teacher population estimates for 2009-10 from the National Center for Education Statistics.
Note: Costs will vary by the size of the state due to some economies of scale involving costs and services. Also, the transitional time period could span from one to three years. Figures shown here, therefore, should be viewed as total, not annual, costs. Further, note that the Bare Bones option would produce a negative net-cost number. We include this scenario to demonstrate that it is possible to make the transition to the CCSS using resources that are already included in budgets—not that it will result in a surplus.
Executive Summary |
Page 6
As is evident from the table, current expenditures may cover a significant share of the transitional costs, regardless of the approach a state employs. Under Business as Usual, current expenditures represent about one-third of the gross transitional costs. For instance, we estimate that New York currently spends roughly $270 million each year on instructional materials, assessment, and professional development, which would mean that the net cost of a traditional approach to implementation would be roughly $583 million. A more “balanced” approach would cost the Empire State roughly $71 million.
We estimate that CCSS states as a group currently spend about $3.9 billion on instructional materials, assessment, and professional development. Under the less expensive Balanced Implementation approach, current outlays could cover as mush as three-fourths of the gross transitional costs. Nationally, this equates to a net cost of $1.2 billion. By using the Bare Bones approach, it is possible for a state to cover most of its transitional costs via existing expenditures (and nationally, to come out in the black). Yet we do not recommend this route for all states, since some of them are not currently funding materials for development, assessment, and professional development at levels that support efficacious transition to the Common Core. Still, it’s hard to fathom why any state or district would not seek to repurpose much of its current budget for standards implementation at least relative to math and English language arts.
The latter part of the paper discusses how the Common Core may also afford states an opportunity to rethink not only implementation of standards but also their approaches to education delivery as a whole. These opportunities include making the most of multi-state collaborations that take advantage of the “common-ness” of the CCSS; capitalizing on and learning from the rise of innovative school delivery models such as charter networks and virtual schools; and implementing new instructional tools that help teachers teach the new standards.
The bottom line is that successful CCSS implementation does not have to be wildly expensive—and could also support changes that have a permanent and positive impact on the quality and effectiveness of teaching and learning.
| Executive Summary
Page 7
ForewordBy Chester E. Finn, Jr. and Amber M. Winkler
Forty-five. That’s the number of states (plus the District of Columbia) that have adopted the Common Core State Standards (CCSS) for both English language arts and mathematics.4 An impressive feat, no doubt, but as supporters of the Common Core standards, we’ve said it before: Adoption was the easy part. Implementation is where things get real—and really challenging.
Some states are busily attending to their implementation checklists while others amble at a turtle’s pace. But generally lost amid the discussions of curriculum maps, computer-administered assessments, how to get teachers up to snuff, and so on, are fundamental questions: How much will all this cost? And are there innovative ways to contain costs—including the thoughtful use of technology—that could make implementation more affordable and perhaps more productive, if not necessarily easier?
Those are the key questions this timely report addresses. It is timely because the cost issue has become something of a political hot potato. Having lost the adoption battle, Common Core opponents are now waging a budget battle, determined to paint the CCSS as a crazily costly mandate imposed upon the states. Though we loathe scare tactics, we do agree that states and districts had better go in with eyes wide open. After all, if they are to approach implementation seriously, they must have a solid estimate of its price tag.
Opponents would have us believe that those costs are all new. But that’s false. Most states have been implementing their own academic standards (be they good, bad, or mediocre) for fifteen years or more. This leads to our third question: How much of what states are currently spending on standards implementation could be repurposed for Common Core implementation?
To answer these queries, we tapped a terrific team. Patrick Murphy, professor in the Department of Politics at the University of San Francisco, headed up the financial analysis, and Elliot Regenstein, a partner at EducationCounsel LLC, spearheaded the implementation discussion. Keith McNamara, independent contractor and former Teach For America alumnus, offered up stellar research assistance.
Foreword |

Page 8 | Foreword
Our analysts provide various disclaimers within these pages that “bound” their findings and estimates. We’ll mention just two here. First, estimates are limited to the transitional costs of implementing the Common Core. In other words, those initial or one-time expenses that are required to make the shift to the new standards (and not the long-term costs of helping every student achieve college and career readiness). Second, the analysis targets three key expenses—instructional materials, student assessments, and professional development—because these are primary cost drivers in implementing standards. Other items, such as infrastructure costs to administer online assessments, are not included.
Within these parameters, Messrs. Murphy and Regenstein craft three hypothetical approaches to implementing the Common Core standards during the transitional phase. They are:
• Business as Usual. This “traditional” approach to implementation means buying hard-copy textbooks, administering paper student assessments annually, and delivering in-person professional development to all teachers.
• Bare Bones. This is the lowest-cost alternative, employing open-source materials, annual computer-administered assessments, and online professional development via webinars and modules.
• Balanced Implementation. This is a mix of approaches, some of which may be more effective than others while also reducing costs. It uses a blend of instructional materials (e.g., teacher self-published texts and/or district-produced materials), both interim and summative assessments, and a hybrid system of professional development (e.g., train-the-trainers).
Of course, we know that costs will vary by size of state because there will be some economies of scale for costs and services. So the analysts calculated costs at the state level and then cumulated them nationally. What did they find?
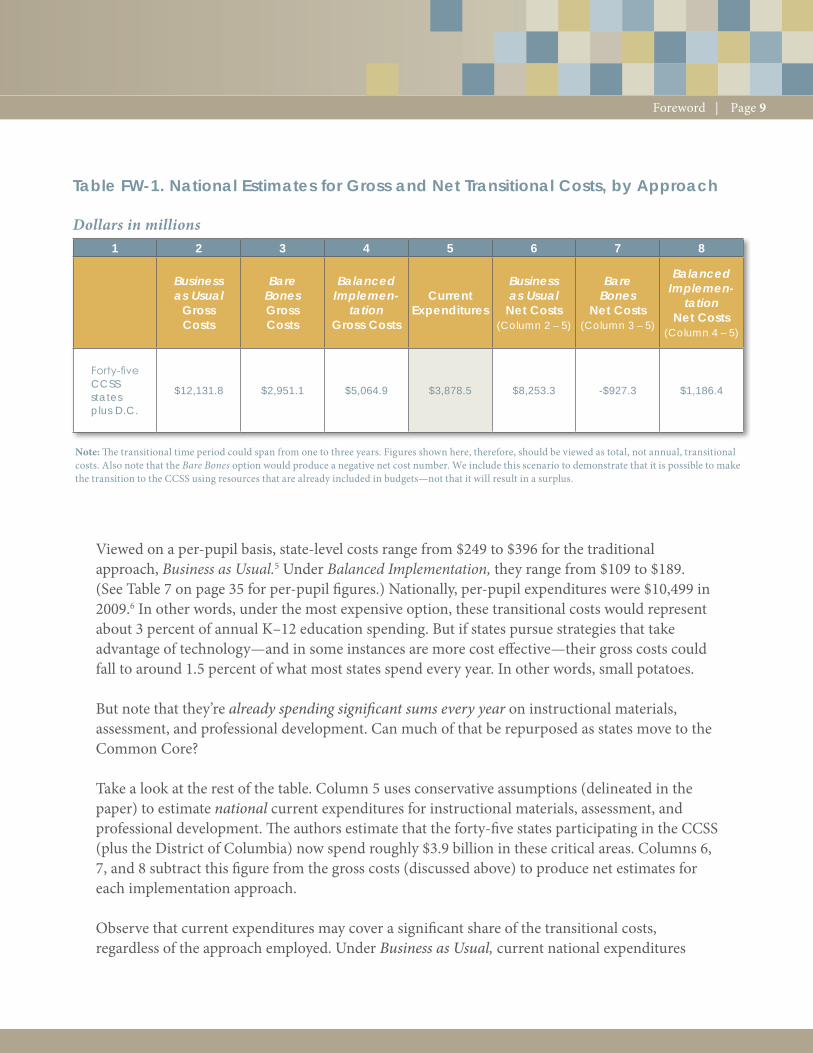
As expected, cost projections vary widely, depending on the approach chosen. Columns 2, 3, and 4 in Table FW-1 present, at the national level, estimated gross costs for transition to the CCSS. (See Executive Summary and/or the main report for state results.) As shown, Business as Usual costs roughly $12.1 billion, Bare Bones roughly $3.0 billion, and Balanced Implementation roughly $5.1 billion. In other words, the last of these costs less than half as much as the more traditional approach. (That adds up to a national difference of roughly $7 billion.) The most significant source of cost reduction comes from shifting away from hard-copy textbooks and increasing the use of online resources to deliver professional development. The Balanced Implementation approach also models increased expenditures for assessment, because states may legitimately deem the inclusion of interim tests to be a worthy additional investment.
Page 9Foreword |
Viewed on a per-pupil basis, state-level costs range from $249 to $396 for the traditional approach, Business as Usual.5 Under Balanced Implementation, they range from $109 to $189. (See Table 7 on page 35 for per-pupil figures.) Nationally, per-pupil expenditures were $10,499 in 2009.6 In other words, under the most expensive option, these transitional costs would represent about 3 percent of annual K–12 education spending. But if states pursue strategies that take advantage of technology—and in some instances are more cost effective—their gross costs could fall to around 1.5 percent of what most states spend every year. In other words, small potatoes.
But note that they’re already spending significant sums every year on instructional materials, assessment, and professional development. Can much of that be repurposed as states move to the Common Core?
Take a look at the rest of the table. Column 5 uses conservative assumptions (delineated in the paper) to estimate national current expenditures for instructional materials, assessment, and professional development. The authors estimate that the forty-five states participating in the CCSS (plus the District of Columbia) now spend roughly $3.9 billion in these critical areas. Columns 6, 7, and 8 subtract this figure from the gross costs (discussed above) to produce net estimates for each implementation approach.
Observe that current expenditures may cover a significant share of the transitional costs, regardless of the approach employed. Under Business as Usual, current national expenditures
1 2 3 4 5 6 7 8
Business as Usual
Gross Costs
Bare BonesGross Costs
Balanced Implemen-
tationGross Costs
Current Expenditures
Business as Usual
Net Costs(Column 2 – 5)
Bare Bones
Net Costs(Column 3 – 5)
Balanced Implemen-
tationNet Costs
(Column 4 – 5)
Forty-five CCSS states plus D.C.
$12,131.8 $2,951.1 $5,064.9 $3,878.5 $8,253.3 -$927.3 $1,186.4
Table FW-1. National Estimates for Gross and Net Transitional Costs, by Approach
Dollars in millions
Note: The transitional time period could span from one to three years. Figures shown here, therefore, should be viewed as total, not annual, transitional costs. Also note that the Bare Bones option would produce a negative net cost number. We include this scenario to demonstrate that it is possible to make the transition to the CCSS using resources that are already included in budgets—not that it will result in a surplus.
Page 10
represent about one-third of the gross transitional costs, equating to a net cost of about $8.3 billion. Under the less expensive Balanced Implementation approach, current outlays could be three-fourths of the gross transitional costs. Nationally, this equates to a net cost of $1.2 billion. By using the lowest cost alternative, Bare Bones, it is possible that CCSS states would cover their transitional costs via existing expenditures and even come out in the black.
No, we do not recommend the Bare Bones route for all states. Tackling implementation more cost-effectively—and innovating in ways sketched in the report—should enable states to reduce expenses, but we cannot assume that existing funding streams will cover the entire tab. Some states and districts are not currently funding materials development, assessment, and professional development at levels that support efficacious transition to the Common Core. In such cases, new spending will be needed.
Still, it’s hard to fathom why any state or district would not seek to repurpose as much as possible of its current budget for materials, assessment, and professional development, at least relative to math and English language arts.
What do we take from these findings? Two lessons.
First, high-quality implementation need not break the bank.
Common Core critics and opponents love to depict the standards as a pricey new mandate with little potential impact on student achievement. In February, for example, the Boston-based Pioneer Institute released its intentionally provocative National Cost of Aligning States and Localities to the Common Core Standards. That paper estimated that, over the next seven years, CCSS implementation costs would total roughly $16 billion across participating states. No, that number isn’t totally nuts; it’s not far from our Business as Usual national estimate if you also throw in a ballpark figure for technology infrastructure (which Pioneer did)—and if you limit yourself to gross costs, not netting out any current outlays for these kinds of things.
But that $16 billion assumes 1990s-style implementation. For instance, Pioneer calculated a one-time professional development cost of $5.26 billion across all states—a third of their total implementation estimate. But, as Fordham’s own Kathleen Porter-Magee has pointed out, this figure assumes that states will do what they have always done, meaning they will not “rethink professional development delivery or imagine savings in this area.”7 Further, it assumes that every teacher receives “exactly the same level of training at the same cost to the state” (again, as in our Business as Usual model). Not surprisingly, Pioneer concluded that “[i]mplementation of the Common Core standards is likely to represent substantial additional expense for most states.”
| Foreword
Page 11
Based on assumptions like those, yes. But to pretend that there’s one best way to implement the Common Core—which does not consider technological or scale efficiencies and does not net out current expenditures—is more a political ploy than a serious public debate about CCSS costs, which Pioneer says it encourages.
Second, the Common Core offers states and districts the opportunity to rethink standards implementation, even education delivery writ large.
The potential of the CCSS lies not only in its alignment to assessments and professional development, but also in its impact on the quality and effectiveness of teaching and learning. Properly implemented, more rigorous standards mean more rigorous teaching and the application of better tools and materials to do it. Multi-state collaborations are now taking advantage of the “common-ness” of CCSS via shared assessments, instructional materials, and online professional development. Creation of new and better instructional tools by multiple vendors is helping more teachers teach the new standards. And the rise of innovative school-delivery models, such as charter networks and virtual schools, means that lessons gleaned from them can benefit more teachers—all of whom are teaching the same standards.
If embedded in a larger vision of transformation, the impact of the CCSS rises exponentially. For example, states and districts should also be rethinking their personnel-management policies so that they can extend the reach of their most qualified teachers; redeploying staff to address the most pressing needs; offering incentives for effective teachers to take on more students; reorganizing the school day and year to maximize learning time and learning opportunities; creating multiple viable pathways to graduation; and allowing parents and children the freedom to “customize” their education in ways that transcend the geographical boundaries that now limit them. Further, such transformations have real cost-savings potential. A recent analysis by the Parthenon Group, for instance, found that the average overall per-pupil costs of blended learning are significantly lower than for brick-and-mortar schools.8
Bottom LineLet’s not kid ourselves. Of course it is going to be a challenge to implement the Common Core standards well. School leaders will be charged with advancing new teaching and learning paradigms, teachers with conveying more demanding material, and students with learning tougher content and skills.
And yes, it could be costly if states go about this implementation process in the traditional way—and also fail to redeploy existing budgetary resources for this purpose. Worse, it might not be all that effective if nothing else about their education systems changes.
Foreword |
Page 12
Enemies and critics of the Common Core want you to believe the worst: that besides being hard, it will be very pricey and likely ineffective.
But this report says otherwise. Implementation can be modestly priced and likely more effective if states are astute enough to (a) implement differently, (b) redeploy resources that they’re already spending, and (c) take advantage of this rare opportunity to revamp their education delivery systems, too.
That’s what they OUGHT to do. And what they can do, so long as they don’t cripple themselves by lack of imagination and daring.
Who’s first?
AcknowledgmentsMany people and organizations helped make this report possible. Our thanks go to the Bill & Melinda Gates Foundation for its support of Fordham’s standards and accountability work, and also to our sister organization, the Thomas B. Fordham Foundation.
Special thanks to lead analyst Patrick Murphy. Dr. Murphy came highly recommended to us by our colleagues at the Center for Reinventing Public Education (CRPE) and we now know why. Similar appreciation goes to Elliot Regenstein, who exceeded our expectations. Messrs. Murphy and Regenstein persisted through multiple drafts and worked hard to accommodate feedback promptly and with good humor. We are grateful.
We’re thankful, too, for the excellent research assistance provided by Keith McNamara. Keith read through many grueling state documents relative to CCSS implementation and Race to the Top and helped with interviews and other data collection. Several others also lent a hand: At EducationCounsel, Terri Taylor provided substantial research assistance (including conducting numerous interviews), and Robin Gelinas, Reginal Leichty, Scott Palmer, Amy Starzynski, and Margery Yeager contributed helpful comments on multiple drafts; Margaret Reed Millar at the Council of Chief State School Officers facilitated our access to state leaders at a Council convening; and Marguerite Roza, senior scholar at CPRE, provided input on the early study design.
Finally, kudos to the Fordham team. Kathleen Porter-Magee, senior director of our High Quality Standards Program, provided spot-on feedback at multiple junctures, as did Executive Vice President Michael Petrilli and President Chester E. Finn, Jr. Janie Scull oversaw production; Tyson Eberhardt and Joe Portnoy managed dissemination. Roger Williams served as copyeditor, Bill Buttaggi as layout designer, and Samuel Whitehead as cover illustrator.
| Foreword
Page 13
IntroductionSince the Common Core State Standards (CCSS) for mathematics and English language arts (ELA) were unveiled in 2010, forty-five states and the District of Columbia have adopted them.9 Further, thirty-seven states have applied for federal waivers (eleven of which had been approved as of mid-April 2012) that require them to implement new college- and career-readiness standards and assessments. (These need not be the Common Core, though most will be.10) Yet the gap between adoption and implementation is wide, and much work must be done to prepare districts, schools, and teachers for the 2014–15 academic year—when much-anticipated new assessments will be used to gauge student mastery of the new standards.
The CCSS are intended not only to raise the level of rigor in instruction but also to focus anew on the knowledge and skills that all students must master to succeed in college and/or career. These changes will likely require that curriculum, instruction, and assessment, as we now know them, undergo significant transformation. The Common Core also offers the possibility of new economies of scale, with promising products, services, and practices now part of a more-uniform national market. In this context, state and district implementation choices made in the next two years will likely determine whether or not the CCSS will have a significant impact on student achievement. Adoptions sans serious implementation won’t change anything.
This paper is designed to help states approach CCSS implementation by framing various options and their associated costs. We examine three cost drivers that will significantly impact those costs: developing new instructional materials; administering, scoring, and reporting results of new assessments; and providing professional development to teachers and other staff.
Because our focus is on the transition to the Common Core, we exclude the costs of remediation needed to bring all students on track to graduate from high school ready for college or career. These costs are likely to include tutoring, extended learning time, special interventions, and school turnarounds—activities that may well prove pricey. But they are also among the core responsibilities of our education system, and thus should not be thought of as transitional costs of the Common Core. (See Part I for additional cost exclusions.)
We lay out three typical approaches to standards implementation—termed Business as Usual, Bare Bones, and Balanced Implementation—and, examining the three key cost drivers noted above, we estimate the price range of each nationally and by state. Then we illustrate how those “gross” cost estimates can be reduced by factoring in what states already spend on standards implementation (yielding a “net” cost).
Introduction |
Page 14
Differences in Cost Analyses of the Common CoreThis analysis is in some ways similar to one released
in February 2012 by the Pioneer Institute.11 That
study, like ours, focused on instructional materials,
assessment, and professional development.
And both studies excluded the costs of remedial
instruction that may be necessary to help students
meet the demands of the Common Core
standards, as well as possible investments in new
teacher preparation and certification. But our
report differs in four significant ways:
Pioneer attempted to estimate both transitional
costs (incurred in years “zero” and “one”) and
implementation costs for six subsequent years.
Our estimate is limited to transitional costs.
Pioneer’s analysis relies largely on
implementation strategies that have been
used in the past. While we include a Business
as Usual scenario, we also cost out alternative
approaches.
The Pioneer figures include an estimate for the
cost of building technical infrastructure.
Perhaps most important, we attempt to
calculate how much is currently being spent
by states and districts on these activities to
arrive at a net-cost estimate.
If one compares our estimates in the Business as
Usual scenario with those of the Pioneer report,
they are quite similar. It is when we explore
alternative implementation scenarios, particularly
when we account for a portion of current funds
being spent on these activities, that our estimates
fall significantly lower.
States and districts face many choices with regard to implementation, and there is scant information on how those choices affect their budgets. Part of the issue is of course cost, but the more important part is value: How can states and districts transition efficiently to the CCSS while also taking full advantage of technology, economies of scale, and other opportunities? That’s the critical question posed in this report.
Organization In Part I, we describe the key cost drivers used in our analyses and explain how we “bound” our estimates. In Part II, we examine three approaches to standards implementation and their tradeoffs, analyze their gross costs, and then calculate net costs based on estimates of current spending.
Part III explores ways to think about CCSS implementation that extend beyond the three approaches laid out in Part II. We discuss, for example, how states and districts can take advantage of the “common-ness” of the CCSS as well as new instructional tools and delivery models. Though we are unable to provide “hard” cost estimates for these advantages, we urge states to consider them, as they have the potential to make the transition both more effective and less expensive.
| Introduction
1
2
3
4
Page 15
Part I. Bounding the DiscussionA Focus on Transitional CostsOur estimate of the transitional costs of the CCSS employs two conventions to simplify the analysis. We take these steps because education-budget timetables and decisions are not uniform across the fifty states. First, our analysis conceives of the costs borne by states and districts as occurring within a single “year” as they transition to the Common Core.12 Of course, it is likely that these costs will be spread over one to three years prior to full implementation in 2014–15. But we express them as annual expenditures for simplicity’s sake as we have no way of predicting whether and how the spread will take place.
Second, we calculate total transitional costs by state, but do not break out the relative portions funded by the state or its local districts. States vary widely in terms of the share of state general fund dollars that are devoted to education relative to local resources—and they vary even more with regard to spending for specific activities (e.g., some states pay for new textbooks out of the general fund; in other states, districts budget for books). Our estimates, therefore, are reported at the state level, but we expect that the actual dollars spent will represent some combination of state and local funds.
By transitional costs, we mean those initial or one-time expenses that are required to make the shift to the new standards. For instance, our estimate for gross transitional costs includes one year of administering a new testing regime. But in calculating the total net costs, we subtract current assessment expenditures in an effort to capture the impact during the transitional period. Beyond the transition, we anticipate that any costs will become part of the state’s regular, ongoing operating expenditures. For example, we would include the initial purchase cost of new math textbooks and instructional materials if they are needed to align with the CCSS. Purchase of materials in subsequent years to keep texts up to date would not be considered part of the transition.
Part I. Bounding the Discussion |
Page 16
As previously noted, we focus on three key expenses:
• Instructional materials (e.g., textbooks, teacher guides, digital content) that are needed to help teachers to teach and students to learn the new material;
• Student assessments (including the administration, scoring and reporting of results, but not test development), which should help teachers understand how well their students are learning the standards, as well as serve various summative purposes such as accountability for students and schools;13 and
• Professional development to help teachers understand what is expected of them (as well as of their students).
There are a number of costs that we specifically did not include in our estimates, most of which were unrelated to the three areas above. See What We Left Out on Purpose.
Allocating Costs: State and LocalAs indicated, our estimates are total costs, and we have not broken them out according to which portions will be borne by states versus districts.14 Each state has developed its own division of labor and allocation of resources.15 Such variability makes it difficult to draw a line between amounts financed by the state versus its districts; hence, our cost estimates span both levels (as well as intermediate agencies that may be involved, such as Ohio’s Education Service Centers).
Of course, whatever a state’s existing balance of responsibility, CCSS implementation can provide an opportunity for rethinking such allocations. Districts are clearly fearful that states will try to implement the Common Core through “unfunded mandates”16—an anxiety that is warranted if states do not ensure that districts have the capacity to do the work well. We suspect that, in many states, the balance of responsibility for curriculum and materials, assessments, and professional development is based on a combination of history and inertia—not on a thoughtful analysis of competence and capacity. The Common Core provides an opportunity to revisit some of these allocations with fresh eyes, and we hope the approaches described in this paper will help states do that. Moreover, the transitional period could serve as an opportunity to leverage philanthropic funds for this purpose.
| Part I. Bounding the Discussion
Page 17
What We Left Out on PurposeThe following items were not included in our estimates:
Part I. Bounding the Discussion |
The costs associated with remedial services needed to bring all students on track to graduate from high school college- and career-ready (e.g., tutoring, extended learning time, special interventions, and school turnarounds). The cost of such efforts varies widely across
states and within districts but is a basic
responsibility of our education system, not a
transitional cost. The Common Core may well
expose a need for more aggressive strategies
to improve student outcomes, and while that
subject is worthy of greater study, we do not
address it here.
Innovations in personnel management and staffing practices to help schools deliver high-quality content more efficiently. (We do,
however, offer examples of such innovations
in Part III on page 37.) Innovation of this kind
could have a significant impact on professional
development costs but, given the range of
possibilities, and the fact that districts should
consider them regardless of their Common Core
status, we omit their costs here.17
Development of assessment tools by the two assessment consortia (which have been funded separately by federal grants). We do
examine assessment costs that states and
districts will incur during the transitional period
that are separate and apart from costs borne
by the consortia, but the consortia’s federally
funded work to develop interim and summative
assessments will not constitute an incremental
cost to states or districts.
The costs of upgrading schools of education to train teachers and leaders who are prepared to help students meet the demands of the more rigorous standards. The implementation
of the CCSS is an excellent opportunity to
rethink teacher preparation and certification
requirements, but the financial impact of doing
so is not considered here—and would certainly
occur beyond our transitional time period.
Any costs associated with realigning expectations or quality in either early learning or higher education. Although early and higher
education are critical bridges to and from the
Common Core, our paper focuses solely on the
years of education covered by the CCSS, i.e.,
Kindergarten through twelfth grade.
The infrastructure costs of online assessments. These include both the hardware for students to
take the tests (e.g., desktop, laptop, or tablet
computers) as well as internet bandwidth.
(Other studies have included these costs; see
Differences in Cost Analyses of the Common
Core on page 14.) For many policy makers,
the decision to adopt computer-administered
tests will be influenced by a state’s or district’s
technology capacity, and these vary greatly.
For instance, many states already use computer-
administered tests or require them.18 (Though
these costs are not included in our estimates,
see Appendix A for further discussion.)
1
2
3
4
5
6
Page 18 | Part II. Estimating the Costs of Implementation
Part II. Estimating the Costs of ImplementationIn this section, we explain three approaches to implementation and the different costs associated with them. The three approaches are as follows:
• Business as Usual. This is the “traditional” approach to standards implementation: buying hard-copy textbooks, administering annual paper assessments to students, and delivering in-person professional development to all teachers.
• Bare Bones. This is the lowest-cost alternative. It utilizes online open-source materials, computer-administered assessments, and online professional development via webinars and modules.
• Balanced Implementation. This is a mix of approaches, some of which may be at least as effective as their Business as Usual counterparts and also reduce costs. It utilizes a blend of instructional materials (e.g., teacher self-published texts and/or district-produced materials), both interim and summative assessments, and a hybrid system of professional development (e.g., a train-the-trainers approach).
These options are by no means definitive or exhaustive. They do, however, illustrate how moving beyond traditional approaches can open the door to cost savings and improved efficacy.
Before we explain the cost drivers, one key caveat must be mentioned: If the Common Core achieves the goals set for it by the states and others that created it, it will likely require, among other areas, entirely new types of learning tools, performance assessments unlike any heretofore used at scale, and embedded, ongoing professional development that leads to continuous improvement in teachers’ and schools’ capacity to deliver instruction effectively to all their pupils. Yet our estimates below are necessarily limited to the costs that states have incurred for kindred activities in the past. In conducting their own reviews, states should use these estimates as starting points, but understand that realizing the full potential of the CCSS limits the relevance of past experience.
Page 19Part II. Estimating the Costs of Implementation |
Primary Cost DriversInstructional Materials The evolution of instructional materials is rapid and ongoing.19 Some of that change is technological, as electronic devices replace traditional paper textbooks. But some is driven by the expanding marketplace of content providers—no longer limited to the monopoly of traditional large publishers. Thus the widespread adoption of the Common Core has the potential to alter the market for instructional materials significantly. Vendors may no longer focus disproportionately on a few large states,20 and niche providers can emerge as the market for their products broadens and new economies of scale become possible.
Table 1 (see page 20) reflects these opportunities. It provides cost estimates for our three approaches and some of the trade-offs associated with each. Note that we assume that new materials will be needed to support CCSS implementation. But as discussed below, that assumption may be invalid or only partially valid in states that already have strong standards. Similarly, states may be situated differently relative to their ability to move toward more technology-based options. States lacking technology infrastructure, for example, will first have to upgrade their connectivity (see Appendix A for more information).
As shown, per-student costs vary widely. The Business as Usual approach costs nearly seven times the Bare Bones model, while the Balanced Implementation approach costs roughly twice as much as Bare Bones.
Page 20 | Part II. Estimating the Costs of Implementation
Alternative DescriptionPer-Student Cost
EstimateTrade-Offs
A. Business as Usual: Hard-copy textbooks only
Funds would be used to purchase new math and English language arts hard-copy textbooks for each student.
$135 per student.21 Pros: Traditional textbooks provide maximum consistency relative to content. They are also durable.
Cons: Because their content is largely determined by publishers, textbooks offer the least flexibility to states, districts, and teachers. Updates are difficult and costly.
B. Bare Bones: All online or device-supported materials—including free, open educational resources
States, districts, or schools adopt open instructional materials that have been developed by the state, districts, nonprofits, or low-cost vendors and made available at low or no cost.
$20 per student.22 Pros: Potential to maximize flexibility, adaption, and control of content at the state, district, school, or even classroom level. Updating could be frequent. Promotes content development by teachers and students.23 Meta-tagging promotes discovery of high-quality content aligned to the standards.
Cons: Lacks centralized control over content and quality. Assumes access to technology for all students and their teachers (or teachers must print materials for students). Assumes a ready supply of materials, or some capacity for creation or modification at the state or local level.
C. Balanced Implementation: “Blended” materials
Instructional materials are produced by the state, districts, nonprofits, or low-cost vendors.24 (Students can access materials on demand in either electronic or hard-copy formats.)
$35 to $45 per student.25 Pros: Periodic updating should be possible and less costly than traditional options. Easier to modify and flexible with potential to tailor the material to the individual student or class.
Cons: Online access assumes technology is available to significant numbers of students. Also assumed is a ready supply of materials, or some capacity for creation or modification at the state or local level.
Table 1. Alternatives for New Instructional Materials
Page 21Part II. Estimating the Costs of Implementation |
Alternative DescriptionPer-Student Cost
EstimateTrade-Offs
A. Business as Usual: Annual paper assessments
Once a year, usually in spring, states administer a summative test on paper.
$20 per student.29 Pros: Little training needed for teachers to be able to administer the assessment. Classroom activities interrupted only once a year.
Cons: Lack of interim testing makes it more difficult to identify students who are falling behind or to provide formative feedback to teachers. (Or, puts the burden of creating interim assessments on districts, schools, or teachers.) Reporting of test results is often very slow.
B. Bare Bones: Annual computer-administered assessments
Once a year, states/districts administer a computer-based test.
$20 per student.30 Pros: Less training needed for teachers to administer. Classroom activities interrupted only once a year.
Cons: Requires training for teachers and proper technology infrastructure. Lack of interim testing makes it more difficult to identify students who are falling behind or to provide teachers and schools with formative data and opportunities for mid-course corrections.
C. Balanced Implementation: Summative and interim/benchmark computer assessments
Schools offer up to three interim assessments during the course of the school year and a final summative test at year’s end using computer adaptive technology.31
$45 per student.32 Pros: Quick reporting of results. Interim testing yields formative data and helps identify students who are falling behind.
Cons: Requires teacher training and substantial technology infrastructure.
Table 2. Alternatives for New Assessments
AssessmentsStates are now required by federal law to offer summative annual assessments in certain grades, and many are also considering implementing aligned interim assessments. Further, the two federally funded consortia, the SMARTER Balanced Assessment Consortium (SBAC) and the Partnership for Assessment of Readiness for College and Careers (PARCC), are developing computer-administered tests that will presumably reduce the expense and time needed to provide results to teachers and students.26 Computer-administered assessments are unlikely to cost significantly more per unit than paper and pencil tests—and arguably could end up costing less.27 Both consortia are also developing interim or unit tests to focus instruction. (See Part III for more information.)
The alternatives presented in Table 2 reflect these developments.28
Page 22
In this case, the per-student expense of the Business as Usual and Bare Bones approaches are the same, while Balanced Implementation—with its addition of interim tests—is more than twice as expensive.
Professional DevelopmentA key initial consideration for states in implementing the Common Core is how much professional development will be needed and how much of that will be statewide, targeted to particular kinds of teachers (by grade or subject area), and/or individualized. Most states and districts already have what amounts to a default combination of these formats, but often that mix has simply arisen without purposeful consideration of the optimal balance.33 Professional development does not—indeed, should not—mean the same training for all teachers;34 it should be customized and targeted, with technology helping states to offer that customization. For instance, a state could choose to combine in-person sessions with some forms of online delivery.
In developing targeted professional development, states will likely find that the Common Core standards demand increased rigor and that teachers will therefore require additional preparation.35 Further, professional development costs will be affected by choices that states make relative to instructional materials and assessments; the bigger the changes in those areas, the more likely that professional development will be needed.36
In addition, as for so many other features of American education policy, some state agencies provide extensive support and direction to districts regarding professional development while others are accustomed to handling professional development locally through regional entities or train-the-trainers models.37
Table 3 (see page 23) illustrates some of these options, including flexible delivery methods.38 The table reflects just three of a host of different options available for the delivery of professional development. The options vary in terms of the delivery method, program intensity, and number of participating teachers—which also obviously impact costs.
| Part II. Estimating the Costs of Implementation
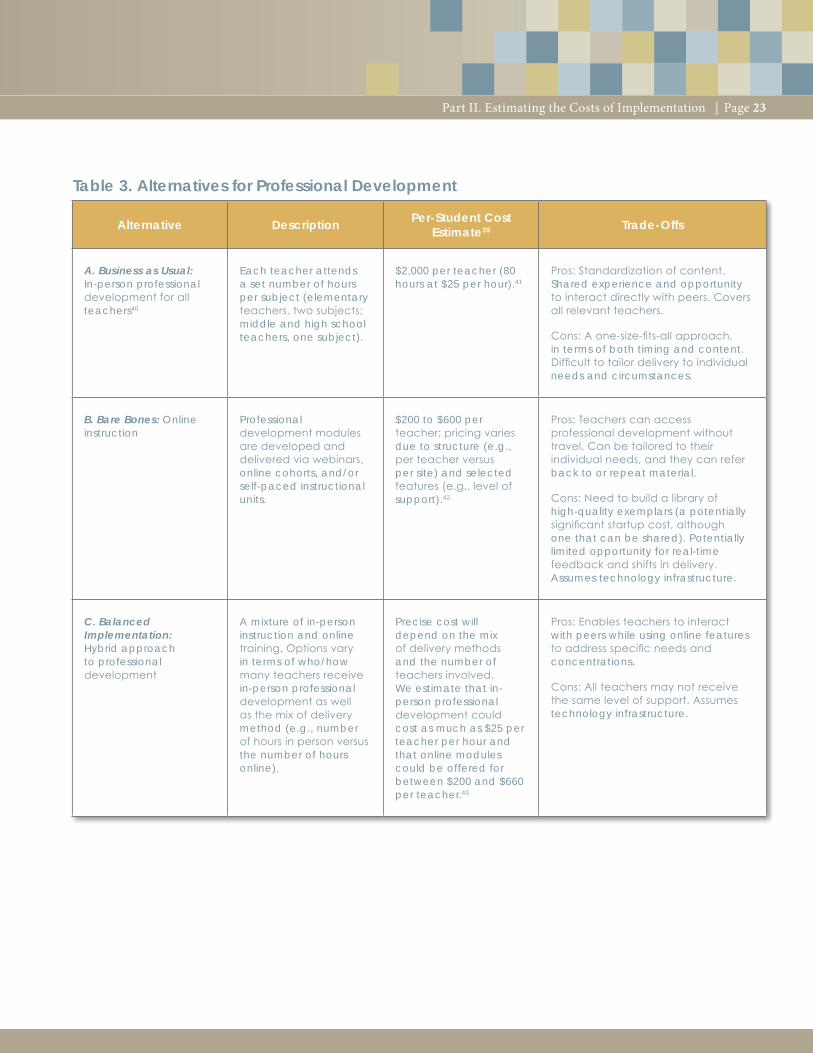
Page 23Part II. Estimating the Costs of Implementation |
Alternative DescriptionPer-Student Cost
Estimate39 Trade-Offs
A. Business as Usual: In-person professional development for all teachers40
Each teacher attends a set number of hours per subject (elementary teachers, two subjects; middle and high school teachers, one subject).
$2,000 per teacher (80 hours at $25 per hour).41
Pros: Standardization of content. Shared experience and opportunity to interact directly with peers. Covers all relevant teachers.
Cons: A one-size-fits-all approach, in terms of both timing and content. Difficult to tailor delivery to individual needs and circumstances.
B. Bare Bones: Online instruction
Professional development modules are developed and delivered via webinars, online cohorts, and/or self-paced instructional units.
$200 to $600 per teacher; pricing varies due to structure (e.g., per teacher versus per site) and selected features (e.g., level of support).42
Pros: Teachers can access professional development without travel. Can be tailored to their individual needs, and they can refer back to or repeat material.
Cons: Need to build a library of high-quality exemplars (a potentially significant startup cost, although one that can be shared). Potentially limited opportunity for real-time feedback and shifts in delivery. Assumes technology infrastructure.
C. Balanced Implementation: Hybrid approach to professional development
A mixture of in-person instruction and online training. Options vary in terms of who/how many teachers receive in-person professional development as well as the mix of delivery method (e.g., number of hours in person versus the number of hours online).
Precise cost will depend on the mix of delivery methods and the number of teachers involved. We estimate that in-person professional development could cost as much as $25 per teacher per hour and that online modules could be offered for between $200 and $660 per teacher.43
Pros: Enables teachers to interact with peers while using online features to address specific needs and concentrations.
Cons: All teachers may not receive the same level of support. Assumes technology infrastructure.
Table 3. Alternatives for Professional Development
Page 24 | Part II. Estimating the Costs of Implementation
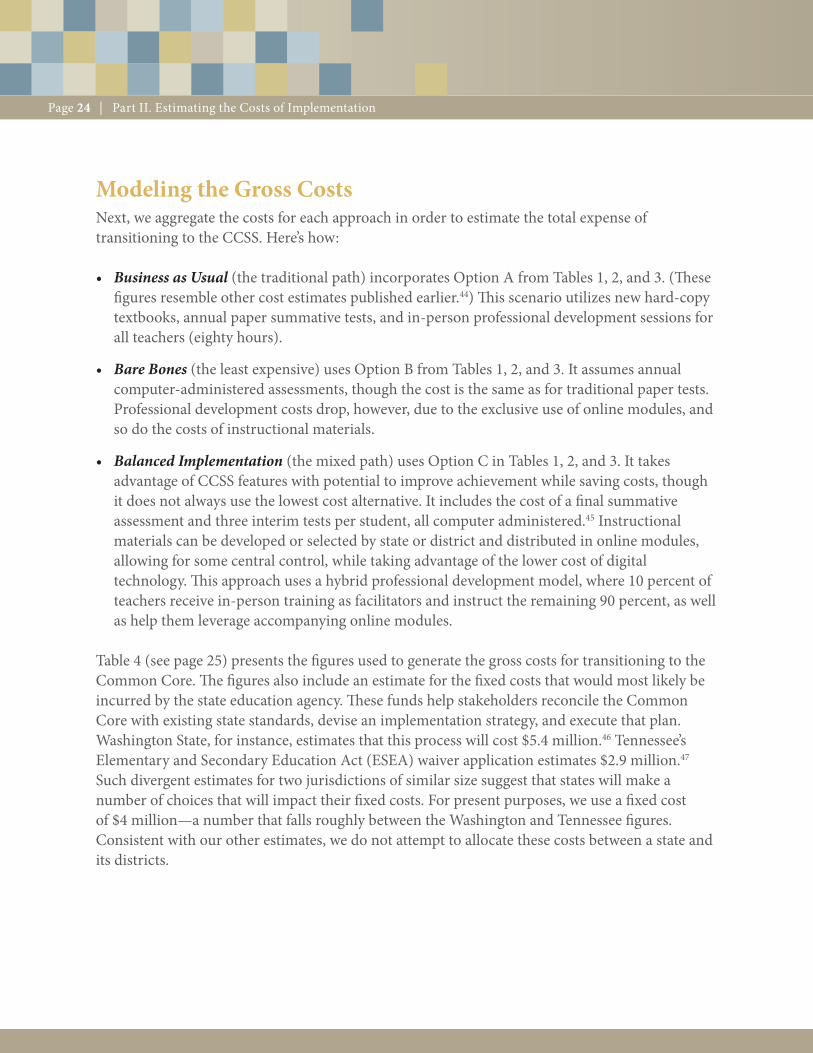
Modeling the Gross Costs Next, we aggregate the costs for each approach in order to estimate the total expense of transitioning to the CCSS. Here’s how:
• Business as Usual (the traditional path) incorporates Option A from Tables 1, 2, and 3. (These figures resemble other cost estimates published earlier.44) This scenario utilizes new hard-copy textbooks, annual paper summative tests, and in-person professional development sessions for all teachers (eighty hours).
• Bare Bones (the least expensive) uses Option B from Tables 1, 2, and 3. It assumes annual computer-administered assessments, though the cost is the same as for traditional paper tests. Professional development costs drop, however, due to the exclusive use of online modules, and so do the costs of instructional materials.
• Balanced Implementation (the mixed path) uses Option C in Tables 1, 2, and 3. It takes advantage of CCSS features with potential to improve achievement while saving costs, though it does not always use the lowest cost alternative. It includes the cost of a final summative assessment and three interim tests per student, all computer administered.45 Instructional materials can be developed or selected by state or district and distributed in online modules, allowing for some central control, while taking advantage of the lower cost of digital technology. This approach uses a hybrid professional development model, where 10 percent of teachers receive in-person training as facilitators and instruct the remaining 90 percent, as well as help them leverage accompanying online modules.
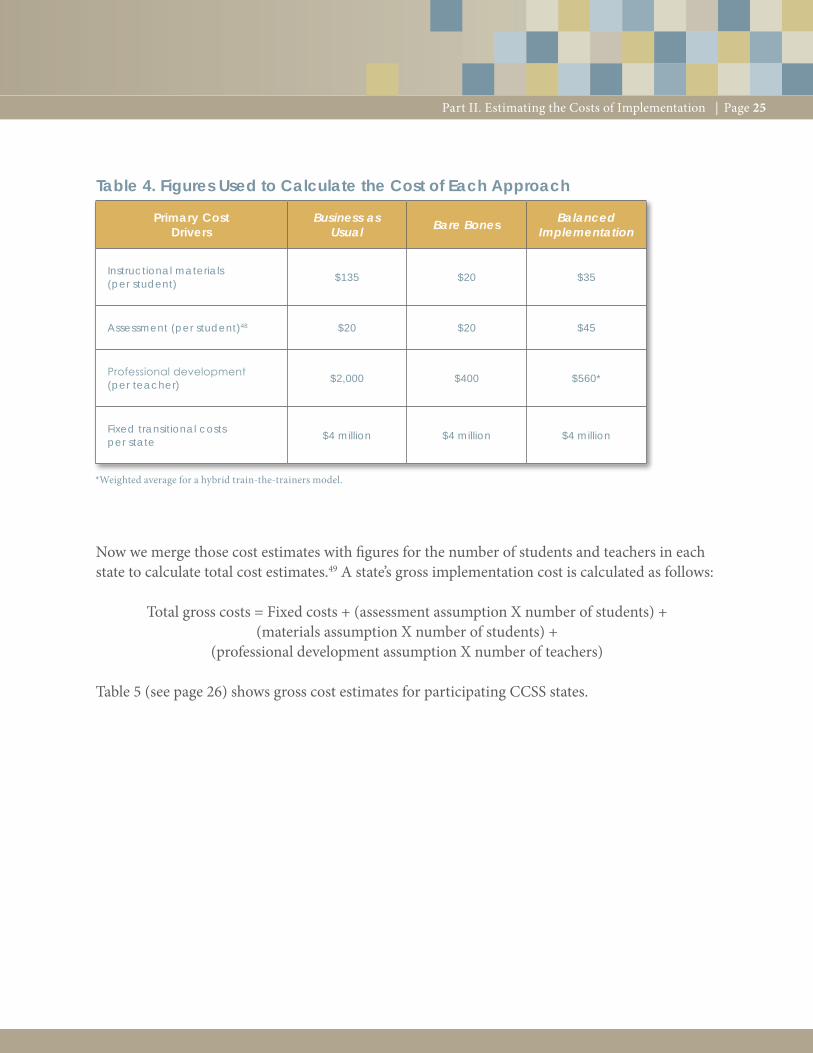
Table 4 (see page 25) presents the figures used to generate the gross costs for transitioning to the Common Core. The figures also include an estimate for the fixed costs that would most likely be incurred by the state education agency. These funds help stakeholders reconcile the Common Core with existing state standards, devise an implementation strategy, and execute that plan. Washington State, for instance, estimates that this process will cost $5.4 million.46 Tennessee’s Elementary and Secondary Education Act (ESEA) waiver application estimates $2.9 million.47 Such divergent estimates for two jurisdictions of similar size suggest that states will make a number of choices that will impact their fixed costs. For present purposes, we use a fixed cost of $4 million—a number that falls roughly between the Washington and Tennessee figures. Consistent with our other estimates, we do not attempt to allocate these costs between a state and its districts.
Page 25
*Weighted average for a hybrid train-the-trainers model.
Part II. Estimating the Costs of Implementation |
Now we merge those cost estimates with figures for the number of students and teachers in each state to calculate total cost estimates.49 A state’s gross implementation cost is calculated as follows:
Total gross costs = Fixed costs + (assessment assumption X number of students) + (materials assumption X number of students) +
(professional development assumption X number of teachers)
Table 5 (see page 26) shows gross cost estimates for participating CCSS states.
Primary Cost Drivers
Business as Usual Bare Bones
Balanced Implementation
Instructional materials (per student)
$135 $20 $35
Assessment (per student)48 $20 $20 $45
Professional development (per teacher)
$2,000 $400 $560*
Fixed transitional costs per state
$4 million $4 million $4 million
Table 4. Figures Used to Calculate the Cost of Each Approach
Page 26
Table 5. Estimated Gross Transitional Costs for CCSS Implementation, by Approach (States arranged by largest to smallest student population)
Dollars in millions
StateBusiness as Usual
Gross CostsBare BonesGross Costs
Balanced Implementation
Gross Costs
CA $1,602.4 $380.1 $680.8
NY 853.0 198.2 340.8
FL 780.0 182.9 317.7
IL 607.1 143.6 249.9
PA 542.8 127.8 220.2
OH 500.2 119.1 207.5
GA 494.3 117.1 202.3
MI 445.0 107.0 187.8
NC 444.0 105.4 181.5
NJ 450.9 105.9 180.2
AZ 275.0 67.9 119.3
IN 290.7 70.8 122.6
WA 271.4 66.8 116.8
TN 285.5 69.0 118.4
MA 292.2 70.2 119.7
MO 281.9 67.8 115.4
WI 256.1 62.3 106.5
MD 252.0 61.2 104.5
CO 231.1 56.9 98.1
AL 215.1 53.0 90.5
SC 210.0 51.7 88.2
LA 210.4 51.5 87.1
KY 198.2 49.0 83.3
OK 190.9 47.3 80.3
| Part II. Estimating the Costs of Implementation
Page 27
StateBusiness as Usual
Gross CostsBare BonesGross Costs
Balanced Implementation
Gross Costs
OR $151.8 $38.8 $66.7
UT 145.3 37.5 64.9
CT 178.6 44.0 73.5
MS 146.5 36.9 61.9
IA 151.9 38.0 63.4
AR 153.0 38.1 63.3
KS 146.9 36.9 61.4
NV 114.7 30.0 50.7
NM 101.3 26.5 43.5
WV 88.4 23.4 38.0
ID 77.2 21.1 34.6
NH 65.5 18.1 28.4
ME 65.9 18.1 28.3
HI 54.7 15.8 24.8
RI 49.2 14.4 22.0
MT 47.0 13.9 21.2
DE 40.9 12.5 19.0
SD 41.8 12.7 19.1
ND 35.5 11.1 16.3
VT 35.8 11.2 16.3
WY 32.0 10.4 15.1
DC 27.5 9.3 13.1
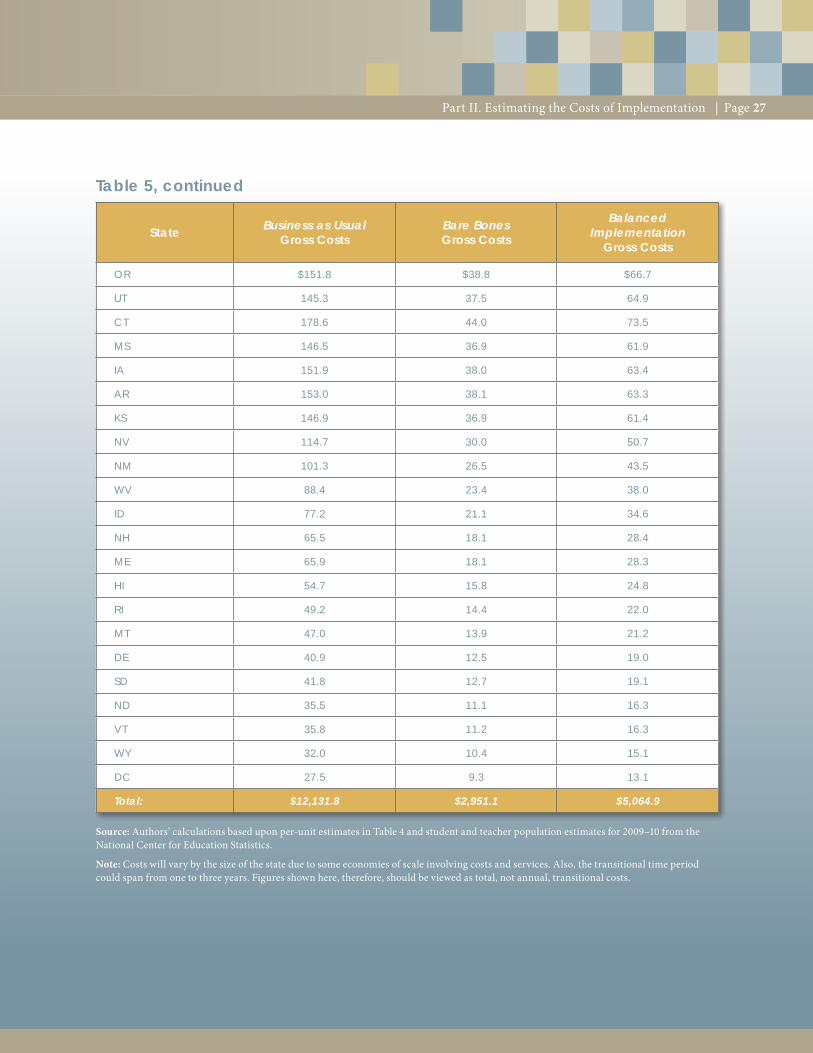
Total: $12,131.8 $2,951.1 $5,064.9
Table 5, continued
Source: Authors’ calculations based upon per-unit estimates in Table 4 and student and teacher population estimates for 2009–10 from the National Center for Education Statistics.
Note: Costs will vary by the size of the state due to some economies of scale involving costs and services. Also, the transitional time period could span from one to three years. Figures shown here, therefore, should be viewed as total, not annual, transitional costs.
Part II. Estimating the Costs of Implementation |
Page 28 | Part II. Estimating the Costs of Implementation
As Table 5 suggests, there is real potential to contain costs via the choice of implementation strategies. Balanced Implementation, for instance, costs less than half as much as a more traditional approach. The most significant source of cost savings results from jettisoning hard-copy textbooks and using online resources to deliver professional development.50 Note that this approach also yields increased expenditures for assessment, because we expect some states to view interim tests as an additional worthy investment.
One way to understand these costs better is to examine them on a per-pupil basis (see Table 7 on page 35). Here the costs shown in Table 5 translate to $249 to $396 per student for Business as Usual and $109 to $189 under Balanced Implementation.51
Nationally, per-pupil expenditures were $10,499 in 2009.52 In other words, under the most conservative option, these transitional costs would represent about 3 percent of annual K–12 education spending. But if states pursue strategies that take advantage of technology—and in some instances are more cost effective—the gross costs could fall to around 1.5 percent of what most states spend per-student. Again, it is important to note that we compare the transitional costs to annual figures for the purpose of putting them into perspective. We expect that the actual expenditures will span from one to three years.
Determining the Net Costs of Implementation The estimates above represent the total cost of implementing the Common Core, but not necessarily the net new cost to states. Discussing these figures as 1 to 3 percent of annual spending overlooks the fact that states already spend sizable sums on instructional materials, assessment, and professional development (see Politics and CCSS Cost Estimates). If these funds are leveraged appropriately, the net new cost to states shrinks further.
To calculate the net cost of transitioning to the CCSS, we glean data from various sources, as explained below. Then we use those data to derive estimates of what states and districts are already spending on the three cost drivers. In other words, how much funding can be repurposed as states move to the Common Core?
Page 29Part II. Estimating the Costs of Implementation |
Instructional MaterialsThe National Center for Education Statistics (NCES) collects expenditures on textbook acquisition for forty-two states. In 2008–09, the most recent school year for which data are available, states reported spending for this purpose that ranged from a low of $4 per student (Texas) to a high of $126 per student (Pennsylvania). The average was about $62, a little less than half of what it would cost to purchase new hard-copy textbooks for students under the Business as Usual scenario described in Table 1—but higher than the estimate used for the Balanced Implementation scenario described in that table.
These figures are, however, limited to those states with dedicated funding streams for textbook purchasing. (Moreover, in some states, as noted above, existing materials may already be relatively well aligned to the Common Core.)
Because budgeting for textbooks is a local decision in some states, we also reviewed the operating budgets for a sample of medium and large school districts. Estimates for their expenditures on instructional materials varied from a low of $43 to over $250 per student. These figures served as a crosscheck, suggesting that the NCES numbers are not totally out of line. (See Appendix B for district budget data.)
Our research unearthed two dramatically
disparate views about leveraging existing
funding for CCSS implementation. One treats
implementation as a massive new exercise that
does not repurpose any funds currently being
spent in or by the state. This approach seems
intended not so much to inform the discussion
as to project an image of the Common Core
as a monstrous and costly mandate imposed
upon the state. This is, essentially, a scare tactic.
The opposite view treats transitioning to the
Common Core as just another policy directive
that can be easily absorbed by existing
budgets and infrastructures. Because states
already provide some funding for instructional
materials, assessment, and professional
development, the thinking goes, those funds
must be sufficient for CCSS implementation.
The first approach inevitably overstates the
cost impact of implementation. After all, some
existing funding streams can and should be
used to implement the Common Core. But the
second approach almost certainly understates
the fiscal challenge. Tackling implementation
more cost effectively—and innovating in ways
we discuss in Part III—should enable states to
reduce expenses, but we cannot assume that
existing funding streams will cover the entire
tab. Some states and districts are not currently
funding materials development, assessment,
and professional development at levels that
support efficacious transition to the Common
Core, and in those cases, new spending will
be needed.
Politics and CCSS Cost Estimates
Page 30 | Part II. Estimating the Costs of Implementation
AssessmentThankfully, fairly precise estimates exist for assessment expenditures. Florida estimates that its standards-based assessment, the Florida Comprehensive Assessment Test, cost $12.26 per scored test in 2010–11. Between 2000 and 2008, that state reported that its tests cost between $11.79 and $19.44 per student.53 In 2008–09, Texas reported spending $37 million—just under $8 per student—on testing materials.54 A 2002 study by Stanford economist Carolyn Hoxby presented assessment costs for twenty-two states. These ranged widely, from $1.79 per student in South Carolina to $34.02 per student in Delaware. The average cost for the twenty-two states was $14.23 per student.55 SBAC surveyed thirty-one states and reported costs that ranged from $7 to $110 per student; the average was $31.56 All of these estimates include the cost of the test itself, as well as administration and scoring, but not test development (save Texas, which only included the cost of materials).
These data underscore the fact that states are already spending money on assessment, most of which will be repurposed and applied to the new CCSS summative assessment. In other words, states will replace one end-of-year test with another end-of-year test. What will cause costs to increase is if states opt to include additional interim tests to gauge student progress and help focus instruction.
Professional DevelopmentDistressingly few sources of reliable information exist regarding outlays for professional development. These are the best available:
• In 2003, Karen Hawley Miles and her colleagues analyzed professional development spending in five urban school districts. On average, they found that districts spend $4,380 per teacher, or 3.6 percent of their operating budgets, on professional development.57
• Using a similar methodology, Education Resource Strategies examined professional development expenditures in the Philadelphia school district for the 2007–08 school year. The authors of the report estimated that the district spent about $6,000 per teacher, or 2.8 percent of its total operating budget, on professional development. Analysts noted that this figure was low relative to other districts they had examined, notably Cincinnati (which spent 4.6 percent of its operating budget for this purpose), Atlanta (5.0 percent), and Rochester (5.5 percent).58
• The Massachusetts Department of Elementary and Secondary Education reported that its school districts spent $209 million in 2007 on professional development activities. This figure translates into more than $2,500 per teacher and represents 1.8 percent of K–12 spending in Massachusetts that year.59
Page 31Part II. Estimating the Costs of Implementation |
The NCES finance surveys also ask how much districts spend on “staff improvement,”60 but it is hard to know how respondents interpret this question. Not all states support such a categorical program. Moreover, the question only refers to state resources and is not intended to include any funds from local or federal grant dollars (e.g., Title II). It is, therefore, a qualified indicator. Still, using a selection of 4,200 districts in twenty-three states—those that represent the mid-range of staff improvement spending—the average reported state funding is just under $2,500 per teacher.61
Estimating Net Transitional CostsFrom these data sources, we constructed assumptions relative to what state and districts are currently spending per year on assessment, professional development, and the purchase of instructional materials. For the purposes of calculating the net costs of transitioning to the CCSS, we estimate that states and districts currently spend $40 per student for instructional materials; $20 per student for assessments; and $500 per teacher for professional development.
These are conservative assumptions, particularly with regard to instructional materials and professional development. Our estimate for the former is well below the average of $62 per student spent on textbooks as reported by states to the U.S. Census Bureau. Likewise, using a figure of $500 per teacher for professional development expenses represents only a fraction of the dollars reported by other analysts and in surveys. (We use a lower-end estimate, in part, to acknowledge that professional development addresses more than simply math and ELA curricula. Teachers receive professional development for other subjects as well as for issues such as classroom management, communicating with parents, etc.62) Further, although assessment costs vary greatly, a lower-range estimate of $20 per student is not out of line, especially because it rightly excludes funds allocated to the assessment consortia for development of the new tests.
Because we estimate conservatively, our estimates represent a floor or minimum by which to calculate the repurposed funds available for transition to the CCSS. If a state believes that its current expenditures are higher than these figures, its net costs of transitioning to the CCSS would be that much lower.
Table 6 (see page 32) presents estimates by state for the net costs of CCSS transition. Columns 2, 3, and 4 repeat the gross estimates for each of our implementation approaches. Column 5 uses the assumptions above to estimate current expenditures on instructional materials, assessment, and professional development. The final three columns (6, 7, and 8) subtract current expenditures from the gross costs to produce net estimates for each implementation approach.
Page 32
1 2 3 4 5 6 7 8
State
Business as Usual
Gross Costs
Bare BonesGross Costs
Balanced Implemen-
tationGross Costs
Current Expenditures
Business as Usual
Net Costs(Column 2 – 5)
Bare Bones
Net Costs(Column 3 – 5)
Balanced Implemen-
tationNet Costs
(Column 4 – 5)
CA $1,602.4 $380.1 $680.8 $532.7 $1,069.7 -$152.6 $148.1
NY 853.0 198.2 340.8 269.8 583.3 -71.6 71.0
FL 780.0 182.9 317.7 250.0 530.0 -67.1 67.7
IL 607.1 143.6 249.9 195.5 411.6 -51.9 54.4
PA 542.8 127.8 220.2 172.7 370.2 -44.8 47.6
OH 500.2 119.1 207.5 161.5 338.7 -42.4 46.0
GA 494.3 117.1 202.3 158.0 336.3 -40.9 44.3
MI 445.0 107.0 187.8 145.3 299.7 -38.3 42.5
NC 444.0 105.4 181.5 141.5 302.5 -36.2 40.0
NJ 450.9 105.9 180.2 141.4 309.5 -35.4 38.8
AZ 275.0 67.9 119.3 90.6 184.3 -22.8 28.7
IN 290.7 70.8 122.6 93.9 196.8 -23.2 28.7
WA 271.4 66.8 116.8 88.8 182.5 -22.1 27.9
TN 285.5 69.0 118.4 91.0 194.4 -22.0 27.4
MA 292.2 70.2 119.7 92.4 199.8 -22.1 27.3
MO 281.9 67.8 115.4 89.0 192.9 -21.1 26.4
WI 256.1 62.3 106.5 81.6 174.5 -19.3 25.0
MD 252.0 61.2 104.5 80.0 172.0 -18.8 24.5
CO 231.1 56.9 98.1 74.5 156.7 -17.6 23.6
AL 215.1 53.0 90.5 68.7 146.4 -15.7 21.8
SC 210.0 51.7 88.2 66.9 143.2 -15.2 21.3
LA 210.4 51.5 87.1 66.3 144.1 -14.8 20.8
KY 198.2 49.0 83.3 63.0 135.2 -14.0 20.3
OK 190.9 47.3 80.3 60.6 130.2 -13.4 19.7
Table 6. Estimated Gross and Net Transitional Costs for CCSS Implementation, by Approach (States arranged by largest to smallest student population)
Dollars in millions
| Part II. Estimating the Costs of Implementation
Page 33
1 2 3 4 5 6 7 8
State
Business as Usual
Gross Costs
Bare BonesGross Costs
Balanced Implemen-
tationGross Costs
Current Expenditures
Business as Usual
Net Costs(Column 2 – 5)
Bare Bones
Net Costs(Column 3 – 5)
Balanced Implemen-
tationNet Costs
(Column 4 – 5)
OR $151.8 $38.8 $66.7 $49.3 $102.5 -$10.5 $17.4
UT 145.3 37.5 64.9 47.7 97.6 -10.2 17.2
CT 178.6 44.0 73.5 55.6 123.0 -11.6 17.9
MS 146.5 36.9 61.9 46.1 100.4 -9.2 15.8
IA 151.9 38.0 63.4 47.4 104.5 -9.4 16.0
AR 153.0 38.1 63.3 47.5 105.5 -9.3 15.8
KS 146.9 36.9 61.4 45.8 101.1 -9.0 15.6
NV 114.7 30.0 50.7 36.8 77.9 -6.8 13.9
NM 101.3 26.5 43.5 31.4 69.9 -5.0 12.1
WV 88.4 23.4 38.0 27.1 61.3 -3.7 10.9
ID 77.2 21.1 34.6 24.2 53.0 -3.0 10.4
NH 65.5 18.1 28.4 19.6 46.0 -1.5 8.9
ME 65.9 18.1 28.3 19.5 46.4 -1.4 8.8
HI 54.7 15.8 24.8 16.5 38.2 -0.7 8.3
RI 49.2 14.4 22.0 14.4 34.8 0.0 7.6
MT 47.0 13.9 21.2 13.8 33.3 0.1 7.5
DE 40.9 12.5 19.0 11.9 29.0 0.6 7.1
SD 41.8 12.7 19.1 12.1 29.7 0.6 7.0
ND 35.5 11.1 16.3 9.9 25.6 1.3 6.4
VT 35.8 11.2 16.3 9.9 25.9 1.3 6.4
WY 32.0 10.4 15.1 8.9 23.1 1.5 6.2
DC 27.5 9.3 13.1 7.4 20.2 2.0 5.8
Total: $12,131.8 $2,951.1 $5,064.9 $3,878.5 $8,253.3 -$927.3 $1,186.4
Note: The transitional time period could span from one to three years. Figures shown here, therefore, should be viewed as total, not annual, transitional costs. Also note that the Bare Bones option would produce a negative net-cost number. We include this scenario to demonstrate that it is possible to make the transition to the CCSS using resources that are already included in budgets—not that it will result in a surplus.
Part II. Estimating the Costs of Implementation |
Table 6, continued
Page 34
Table 6 shows that current expenditures may cover a significant share of the transitional costs, regardless of the approach chosen. Under Business as Usual, current expenditures represent about one-third of the gross transitional costs. Under Balanced Implementation, current outlays equal three-fourths of the gross transitional costs. By using the lowest cost alternative, Bare Bones, it is possible for a state to cover most of its transitional costs via existing expenditures.
Table 7 (see page 35) presents these same data (for both gross and net transitional costs) in dollars per student.
If Florida, for example, were to choose an approach similar to Business as Usual, its gross transitional cost to the CCSS would be about $780 million. We calculate, conservatively, that Florida and its districts are already spending about $250 million on professional development, assessment, and instructional materials. The net new cost of transitioning would be roughly $530 million ($780 million – $250 million = $530 million) or about $201 per student. If, however, Florida were to implement the CCSS along the lines of the Balanced Implementation approach, its gross cost of transitioning would be $318 million and its net spending about $68 million, or $26 per student. Finally, if the state chose to implement the standards via Bare Bones—which we are not encouraging—we would expect that its current expenditures would more than cover the expense; in fact it would amount to roughly $67 million less than what we estimate that they are now spending (or $25 less per student).
Let us say again that transitioning to the Common Core is not likely to be funded in full from currently budgeted resources. Yet it is hard to fathom why a state or district would not seek to repurpose much of its current budget for professional development and instructional materials, at least those pertaining to math and English language arts.
| Part II. Estimating the Costs of Implementation
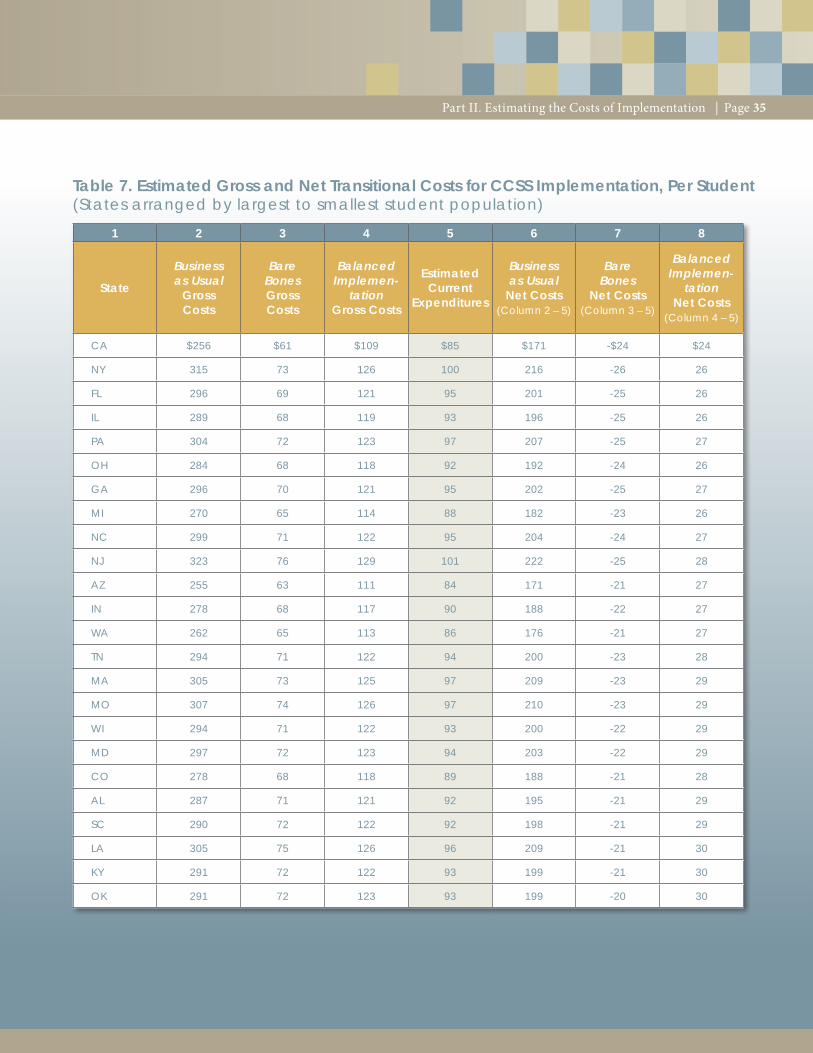
Page 35
1 2 3 4 5 6 7 8
State
Business as Usual
Gross Costs
Bare BonesGross Costs
Balanced Implemen-
tationGross Costs
Estimated Current
Expenditures
Business as Usual
Net Costs(Column 2 – 5)
Bare Bones
Net Costs(Column 3 – 5)
Balanced Implemen-
tationNet Costs
(Column 4 – 5)
CA $256 $61 $109 $85 $171 -$24 $24
NY 315 73 126 100 216 -26 26
FL 296 69 121 95 201 -25 26
IL 289 68 119 93 196 -25 26
PA 304 72 123 97 207 -25 27
OH 284 68 118 92 192 -24 26
GA 296 70 121 95 202 -25 27
MI 270 65 114 88 182 -23 26
NC 299 71 122 95 204 -24 27
NJ 323 76 129 101 222 -25 28
AZ 255 63 111 84 171 -21 27
IN 278 68 117 90 188 -22 27
WA 262 65 113 86 176 -21 27
TN 294 71 122 94 200 -23 28
MA 305 73 125 97 209 -23 29
MO 307 74 126 97 210 -23 29
WI 294 71 122 93 200 -22 29
MD 297 72 123 94 203 -22 29
CO 278 68 118 89 188 -21 28
AL 287 71 121 92 195 -21 29
SC 290 72 122 92 198 -21 29
LA 305 75 126 96 209 -21 30
KY 291 72 122 93 199 -21 30
OK 291 72 123 93 199 -20 30
Table 7. Estimated Gross and Net Transitional Costs for CCSS Implementation, Per Student(States arranged by largest to smallest student population)
Part II. Estimating the Costs of Implementation |
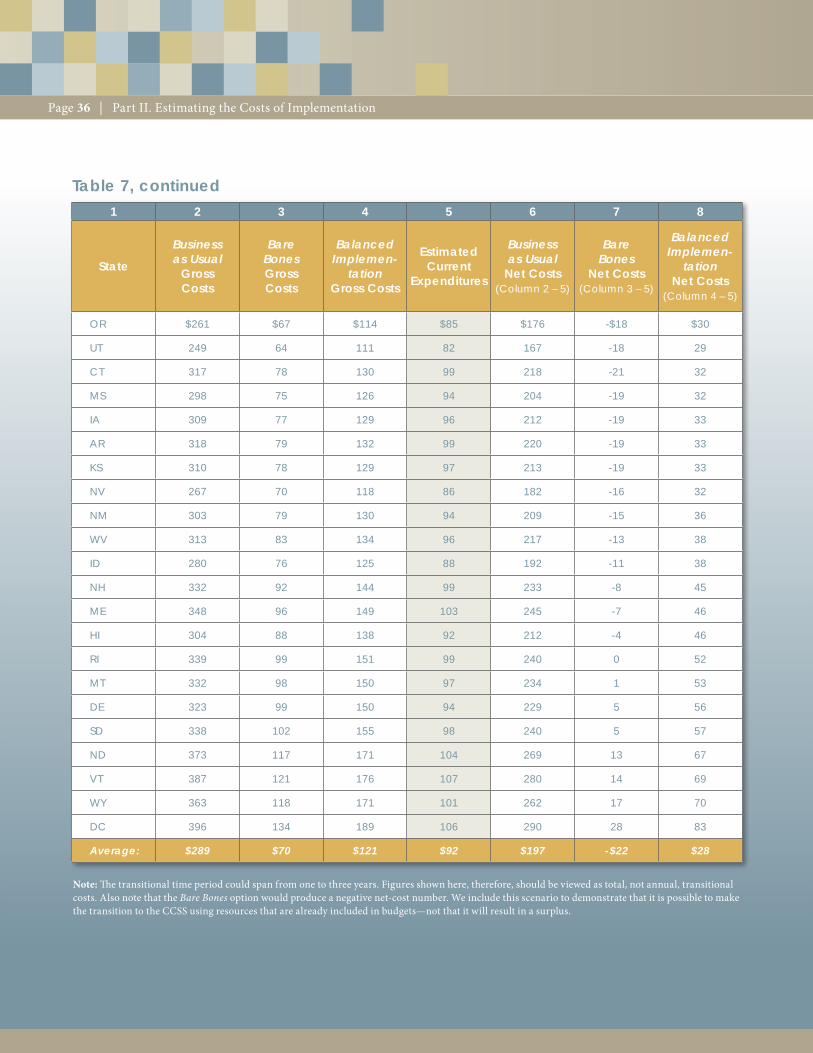
Page 36 | Part II. Estimating the Costs of Implementation
1 2 3 4 5 6 7 8
State
Business as Usual
Gross Costs
Bare BonesGross Costs
Balanced Implemen-
tationGross Costs
Estimated Current
Expenditures
Business as Usual
Net Costs(Column 2 – 5)
Bare Bones
Net Costs(Column 3 – 5)
Balanced Implemen-
tationNet Costs
(Column 4 – 5)
OR $261 $67 $114 $85 $176 -$18 $30
UT 249 64 111 82 167 -18 29
CT 317 78 130 99 218 -21 32
MS 298 75 126 94 204 -19 32
IA 309 77 129 96 212 -19 33
AR 318 79 132 99 220 -19 33
KS 310 78 129 97 213 -19 33
NV 267 70 118 86 182 -16 32
NM 303 79 130 94 209 -15 36
WV 313 83 134 96 217 -13 38
ID 280 76 125 88 192 -11 38
NH 332 92 144 99 233 -8 45
ME 348 96 149 103 245 -7 46
HI 304 88 138 92 212 -4 46
RI 339 99 151 99 240 0 52
MT 332 98 150 97 234 1 53
DE 323 99 150 94 229 5 56
SD 338 102 155 98 240 5 57
ND 373 117 171 104 269 13 67
VT 387 121 176 107 280 14 69
WY 363 118 171 101 262 17 70
DC 396 134 189 106 290 28 83
Average: $289 $70 $121 $92 $197 -$22 $28
Table 7, continued
Note: The transitional time period could span from one to three years. Figures shown here, therefore, should be viewed as total, not annual, transitional costs. Also note that the Bare Bones option would produce a negative net-cost number. We include this scenario to demonstrate that it is possible to make the transition to the CCSS using resources that are already included in budgets—not that it will result in a surplus.
Page 37Part III. Thinking Differently about Common Core Implementation |
Part III. Thinking Differently about Common Core Implementation Our estimates in Part II can and do apply to a state implementing content standards of its own design. But because the Common Core is national, it offers—and states can take advantage of—unique opportunities to approach standards implementation differently. Here are three such opportunities:
• “Common” standards make cross-state collaboration possible in ways previously not feasible. Such collaboration can both improve implementation and save money as states and districts achieve greater economies of scale.
• Second, the rapid pace of technological improvements in recent years is yielding instructional tools that many current teachers—even those in their first few years of teaching—could not have imagined when they were in school. Some of these tools can facilitate effective Common Core implementation.
• Third, the rise of innovative education-delivery models, including high-quality charter networks and virtual schools, offer alternatives that states and districts may want to adopt more broadly. These sectors have grown significantly in the last decade—for example, the number of students enrolled in charter schools more than tripled between the 2000–01 and 2008–09 school years63—and the lessons learned from them are likely more consequential than they were even a decade ago.
Below, we tie these opportunities to our three cost drivers. Though we were unable to undertake rigorous cost analyses, there is reason to believe that such opportunities can help jurisdictions save money while boosting effectiveness—and we encourage states and districts to cost them out in their own contexts.
Instructional MaterialsDevelopment of instructional materials is an area where cross-state collaboration should be able to reduce each state’s price tag while increasing quality. Such sharing across states and districts reduces the amount of time that individual educators put into creating materials and increases the supply of available expertise. We can already see examples of cross-state platforms for sharing curriculum and materials, such as the three-state arrangement involving Massachusetts, New
Page 38 | Part III. Thinking Differently about Common Core Implementation
York, and Rhode Island.64 Similar platforms could be developed elsewhere, or across larger groups of states. For instance, the for-profit vendor BetterLesson provides a forum for educators to share curricula via a core platform available for free and a premium service available by subscription.65 States can offer exemplars and models that districts (and vendors) may use to develop materials.66
Advances in technology are also affecting materials production. For example, in January 2012, Apple announced an iBooks initiative that will include materials from traditional textbook publishers while also providing a platform for others to self-publish textbooks.67 Whatever comes of that initiative, it is clear that the market for instructional materials is changing rapidly.68 Online materials produced by vendors may be another option for states.69 And it is likely that advances in technology will support the move toward deeper student inquiry that the CCSS promote.70
Evaluating the quality of instructional materials also takes on greater importance with the arrival of the CCSS. Identifying first-rate products and services—and screening out the junk—calls for new levels of quality control. And many developers and vendors are bound to arrive on the doorsteps of state and district agencies. In response, some of those have already created lists of approved vendors or otherwise identified materials they consider to be of high quality. Nor does this review process have to be done by individual states. For example, online sharing of resources, judgments, and experiences is starting to occur through “crowd-sourcing” via Amazon- or Yelp-like rating systems, where uploaded resources are evaluated by users. Quality rubrics and tools are also emerging. For example, Achieve, Inc. recently developed instruments for measuring the quality of open educational resources (OER) that are already being used by at least one major OER repository.71
AssessmentsThough the federal No Child Left Behind Act required states to institute some form of standardized testing, most had been already engaged in assessment activities for years, if not decades. Widespread adoption of the Common Core, however, will open new opportunities on the assessment front as most states find themselves monitoring student achievement in relation to the same goals and benchmarks. From a cost perspective, the CCSS also afford states the opportunity to work together to develop assessment materials and procedures, taking advantage of economies of scale. The federal government has encouraged this collaboration by means of the two assessment consortia, SBAC and PARCC.72
The evolution of assessment practices in general—and efforts driven by the two consortia in particular—have increased the testing options available to states. Multi-state early and mid-year assessments, end-of-course tests, and formative tools aligned to the CCSS are in the works. More frequent low- or no-stakes assessments are also possible as diagnostic indicators; states could feasibly address the cost of scoring and analyzing these data by developing shared platforms.
Page 39Part III. Thinking Differently about Common Core Implementation |
In addition, the SBAC is developing computer adaptive tests (CATs) that provide students with increasingly challenging questions based on ability level. Proponents say that CATs typically take less time to administer, because fewer questions are needed to determine a student’s achievement level.73 And because the tests are administered via computer, scoring and reporting are faster. On the other hand, CATs require larger item banks than paper-and-pencil tests, adding to their up-front cost.
In many states, assessment innovations also place new demands on existing technology infrastructures, particularly given the pressing deadline of 2014–15, when the new CCSS assessments are to come online.74 As previously indicated, the quality of technology infrastructure differs widely across the states and will clearly impact a state’s ability to make the most of advances in this area (see Appendix A).75
Professional DevelopmentCommon standards also provide a chance to strengthen cross-state professional development. Though vendors, publishers, and others could previously provide professional development in more than one state, doing so with the same rigorous standards across multiple states is a new opportunity. Common Core 360 is one entrant taking advantage of it. Produced by the School Improvement Network,76 the tool provides on-demand video training (real teachers in classrooms teaching the CCSS) for educators implementing the Common Core. It presents a vision to teachers of why the CCSS are needed and what the CCSS offer as a transformative vehicle.77
The CCSS also present an opportunity for high-quality charter schools, some of which are part of networks that serve multiple states. Charter networks can now design professional development modules that serve more states effectively and facilitate higher-quality conversations among teachers, because they share similar content and instructional goals.78 Of course, while charter networks may have built-in infrastructure to facilitate common professional development, there is no reason that other networks of like-minded schools (or districts) could not develop the same.
In addition, online instruction may be an effective tool for providing customized professional development for individual educators. Tailored approaches can greatly improve the efficiency and relevance of professional development options by filling particular gaps in knowledge. Online instruction can also save costs and headaches associated with in-person, onsite delivery (including the expense of paying for substitutes, missed instructional time, time-consuming breaks, etc.).
Increasingly, teacher training incorporates video that provides content to teachers or demonstrates teaching techniques. For example, Doug Lemov’s Teach Like a Champion offers video exemplars of high-quality instruction. Technology also allows teachers to videotape
Page 40 | Part III. Thinking Differently about Common Core Implementation
themselves and receive feedback from experts not physically present in the classroom—a valuable service that could become more widespread now that teachers will be covering the same standards. Even if these approaches do not meet all of a teacher’s professional-development needs, they can likely meet some of them more cost-effectively than traditional methods.
…But Don’t Stop ThereThe Common Core standards must gain traction beyond the traditional areas—instructional materials, assessment, and professional development—that are laid out in these pages. They should be embedded in a larger vision of transformation that takes advantage of other educational innovations. For example, states and districts should be rethinking their personnel-management policies so that they can extend the reach of their most qualified teachers. Other promising reforms include redeploying staff to address the most pressing needs; offering incentives for effective teachers to take on more students; reorganizing the school day and year to maximize learning time and learning opportunities; creating multiple, viable pathways to graduation; and allowing parents and their children the freedom to “customize” their education in ways that transcend the geographical boundaries that now limit them.79
We should reach beyond simply using better tools within an existing instructional approach and devise new teaching paradigms supported by those tools. The charter-school operator Rocketship Education, for instance, uses computers for skills reinforcement while its teachers focus on higher-order learning and provide targeted help to students. While such methods are not silver bullets, they are promising in terms of both instructional delivery and cost.
Others, of course, have grappled with these topics in greater depth80; we mention them only to illustrate how the CCSS can and should be integrated into a more comprehensive design for rethinking education.
Page 41Conclusion |
ConclusionStates are making the transition to the Common Core on a thin dime, but that’s no reason to give short shrift to implementation. Indeed, the combination of a new era in academic standards and a time of tightening budgets gives states and districts an unprecedented opportunity to rethink current implementation practices. We urge such rethinking and hope this report assists readers in undertaking it.
In the end, transitioning to the Common Core will not be simple or trouble free. But it need not be unnecessarily complicated and grueling. It can be done right, without cost becoming an insurmountable obstacle. Indeed, states and districts—if they are courageous, persistent, and creative enough—can use the Common Core as the foundation for a significantly improved education system. The question is, will they?
Page 42 | Appendix A: Technology in Common Core Implementation
Appendix A: Technology in Common Core ImplementationIf schools are to take advantage of cost-saving innovation, a technology infrastructure must first exist.81 Several options presented in this paper depend on a level of technological infrastructure that many states do not yet possess. This appendix covers the latest efforts to assess and cost out states’ technology needs—separate from the CCSS transitional costs discussed previously.
Expenses associated with building technology infrastructure are not included in prior implementation estimates for two reasons. First, it is nearly impossible to calculate the cost of upgrading to a particular level of technology capacity because the starting point varies from state to state, from district to district within a state, and even among schools within a district. Second, investing in technology infrastructure provides advantages beyond those associated with CCSS transition and implementation. Indeed, maintaining optimal levels of technology is now an accepted ongoing expense in education.
In April 2012, the two assessment consortia, SBAC and PARCC, issued guidelines for the minimum technology requirements to help guide purchasing.82 According to the consortia, the key considerations relative to capacity are hardware, software, and bandwidth:
• Schools must have enough end-use devices and servers onsite to provide access to course materials or administer online assessments.
• Software considerations affect both the type of devices used and compatibility with the content.
• Bandwidth determines the volume of information that can move in and out of the school. Having more students online at the same time requires more bandwidth, as do applications that are graphics intensive.
Hardware and bandwidth are the most significant cost drivers in a technology upgrade. Multiple devices are capable of meeting the needs of various applications, including tablet computers, laptops, and desktops. Prices range widely. Suitable laptop computers run from $600 to $1,500 per unit. The popular Apple iPad costs $500, though some recent tablet models have lowered the price point to less than $300.83 Such technology changes at an astonishing speed, with more
Page 43Appendix A: Technology in Common Core Implementation |
capable machines introduced at lower prices on a regular basis.84 (That said, the constant churn also creates ongoing costs as owners feel impelled to trade in and trade up.)
In terms of bandwidth, requirements hinge on the number of users and density of the applications. The Kansas Department of Education, for example, reports that a T1 connection is sufficient for simultaneous test administration involving at least sixty-four users. Multiple T1, cable, or high-speed DSL connections would, of course, multiply that capacity. Idaho’s education department encourages schools to consider the installation of a local cache server (LCS), which would reduce bandwidth requirements dramatically, enabling up to 1,500 simultaneous users.85 Multiple T1s are normally priced between $350 and $1,200 per month, depending upon the location and provider.86 A LCS would cost several hundreds of dollars at the front end, plus the costs of maintaining it.
It’s important to note that total costs are shaped not just by the price of raw technology but also by policy choices. For example, mandating a relatively short window in which schools must administer tests will put considerable strain on their technology capacities. However, allowing schools a longer block of time may mean that some students take tests significantly later than others, which raises serious questions of fairness relative to accountability and teacher evaluation, as well as test-security issues.
Technology costs are constantly changing and depend to some degree on economies of scale. A recent report produced an estimate of $2.8 billion in one-time, up-front costs to build what the researchers deemed as necessary infrastructure during the transitional period to the Common Core.87 That figure assumed that schools were starting from scratch in terms of providing the platforms and connectivity required for computer-administered testing. Given the number of states already engaged in online testing, we suspect that some of the pieces are already in place.88 At the same time, the figure did not include school bandwidth costs—which, for some states, would increase the price.
In the end, while a state may use the CCSS as the impetus to incur these new costs, the benefits of upgrading a state’s K–12 technology capacity extend far beyond those associated with transitioning to the Common Core.
Page 44 | Appendix B: District Budget Estimates
Appendix B: District Budget Estimates In Modeling the Gross Costs (see page 24), we eyeballed individual district budgets (gleaned from their websites) to gauge current expenditures on two cost drivers (instructional materials and professional development).89 Table B-1 presents spending estimates for instructional materials from various school districts.
District Number of StudentsExpenditures on Instructional
Materials Per Student
Albuquerque 96,572 $43 – $86
Atlanta 48,909 $89 – $184
Boston 55,371 $65 – $122
Charlotte-Mecklenburg 136,969 $43 – $252
Chicago 407,157 $177 – $220
Cleveland 48,392 $58 – $115
Jefferson County, KY 98,808 $42 – $99
Table B-1. Estimated District Expenditures on Instructional Materials, 2011
District Number of TeachersProfessional Development Expenditures Per Teacher
Albuquerque 6,529 $525
Atlanta 3,759 $ 478 – $718
Boston 4,170 $24 – $48
Charlotte-Mecklenburg 8,949 $968
Chicago 24,760 N/A
Cleveland 3,554 $62 – $140
Jefferson County, KY 6,409 $181 – $447
Table B-2. Estimated District Expenditures on Professional Development, 2011
Page 45Appendix B: District Budget Estimates |
The same exercise for the same districts was conducted for professional development outlays.90 Figures are presented in Table B-2. The range is even greater than that for instructional materials.
The considerable range within both estimates calls into question the usefulness of such an approach. Consequently, we used these figures to inform, not determine, our own estimates.
Page 46 | Appendix C: Data Sources
Appendix C: Data Sources Because few states have developed and made public detailed CCSS implementation plans, and none has developed (or, at least, made public) budgets to accompany those plans, collecting information on implementation presents a significant challenge. Consequently, our research utilizes an eclectic collection of data sources. These include states’ Race to the Top applications from the first and second rounds in 2011;91 School Improvement Grant plans; ESEA waiver applications from the first set of eleven states;92 and data gleaned from state and district budget documents from 2009 through 2011 and from state department websites. Though many of these documents include information on state plans for implementing college–and career-ready standards, few offer cost estimates.
We attempted to address this omission by contacting current and former officials in multiple states via email and phone during January and February 2012. Respondents included state superintendents, deputy superintendents, and officials in charge of curriculum or professional development. Inquiring about states’ CCSS transitional plans relative to curricular materials and professional development, we asked the following questions:
Does [the state education agency] recommend certain specific curricular materials or vendors, and if so, where would districts and schools locate these resources?
How does curriculum adoption work in [the state]? Are curricula adopted at the state, district, or individual school level? Do they need approval from [the state education agency]? Where, if at all, do districts and schools in [the state] look to find CCSS aligned curriculum?
How is professional development delivered in [the state]? Is it run mostly through [the state education agency], or is it administered solely at the district and/or school level? What options are under consideration to ensure that teachers are ready to teach the new ELA and math standards?
The following states responded: California, Florida, Georgia, Idaho, Indiana, Louisiana, Mississippi, North Carolina, Vermont, and West Virginia.
In addition, to learn more about Common Core delivery, we interviewed representatives from Common Core 360, New Tech Network, and Rocketship Schools. We also researched the relevant activities of several organizations including Apple, Achievement First, Better Lesson, iCivics, K12 Inc., and Khan Academy.
1
2
3
Page 47Appendix C: Data Sources |
We convened a session with state officials who participated in a Common Core implementation conference in December 2011 in San Diego. We discussed the costs of implementation and opportunities for innovation. In addition, we spoke to a number of vendors, policy experts, education entrepreneurs, and assessment specialists about opportunities for innovative practices relative to CCSS implementation.
Finally, we used survey data from the federal National Center for Education Statistics to produce total cost figures and current estimates on spending. Numbers of teachers and students (2009–10) were downloaded using the NCES Build-a-Table tool.93 The same tool was used to estimate state textbook expenditures and state categorical funds reported by districts for professional development; however, the most recent year for those data was 2008–09.
Page 48 | Appendix D: States’ Common Core Resources
Appendix D: States’ Common Core Resources State Plans for CCSS Transition/ImplementationColorado Department of Education, Transition Action Planning Guide: Moving to Colorado’s New Standards (Denver, CO: Colorado Department of Education, draft as of January 30, 2012), http://www.cde.state.co.us/otl/standardsimplementationsummit.htm.
Connecticut State Department of Education, Common Core State Standards District Implementation Guide, http://www.sde.ct.gov/sde/lib/sde/flash/ccsstimeline.swf.
Delaware Department of Education, Delaware’s Transition from Adoption to Implementation: Phase-by-Phase roll out of the Common Core State Standards (CCSS) for Teaching and Learning (Dover, DE: Delaware Department of Education, July 6, 2011), http://www.doe.k12.de.us/infosuites/staff/ci/comstandards.shtml.
Florida Department of Education Bureau of Curriculum and Instruction, Florida’s Common Core State Standards Implementation Plan for Professional Development (Tallahassee, FL: Florida Department of Education, September 2011), www.fldoe.org/bii/pdf/fccssippd.pdf.
Kentucky Department of Education, College and Career Readiness Delivery Plan (Frankfort, KY: Kentucky Department of Education, October 2011), http://www.kde.state.ky.us/KDE/Instructional+Resources/College+Career+Readiness+for+All/.
Louisiana Department of Education, Louisiana’s Implementation of Common Core State Standards: General Awareness Webinar (Baton Rouge, LA: Louisiana Department of Education), http://www.doe.state.la.us/topics/common_core_training.html.
Mississippi Department of Education, Common Core Implementation Update Presentation (Jackson, MS: Mississippi Department of Education, November 8, 2011), http://www.mde.k12.ms.us/ACAD/ID/Curriculum/ccss.htm
New York State Department of Education, Common Core Implementation Timeline (Albany, NY: New York State Department of Education, March 2012), http://engageny.org/resource/common-core-implementation-timeline/.
Page 49Appendix D: States’ Common Core Resources |
Ohio Department of Education, Ohio’s Transition Schedule (Columbus, OH: Ohio Department of Education, December 2011), http://www.ode.state.oh.us/GD/Templates/Pages/ODE/ODEPrimary.aspx?Page=2&TopicID=1695&TopicRelationID=1696.
Utah State Office of Education, New State Core Standards in Reading/Language Arts and in Mathematics Implementation Schedule (Salt Lake City, UT: Utah State Office of Education, November 16, 2010), http://www.schools.utah.gov/core/.
Vermont Department of Education, Common Core State Standards Implementation Plan and Information (Montpelier, VT: Vermont Department of Education, 2010), http://education.vermont.gov/new/html/pgm_curriculum.html
Wisconsin Department of Public Instruction, Wisconsin Mathematics/ELA Common Core Standards Implementation Plan for Collaborative Partners (Madison, WI: Wisconsin Department of Public Instruction, November 1, 2010), http://dpi.state.wi.us/standards/stds.html.
Documents on Curriculum/Professional Development Alabama Department of Education, Alabama Course of Study: English Language Arts (Montgomery, AL: Alabama Department of Education, 2010), and Alabama Course of Study: Mathematics (Montgomery, AL: Alabama Department of Education, 2010), http://www.alsde.edu/home/General/alccs.aspx.
California Department of Education, A Look at Kindergarten Through Grade Six in California Public Schools: Transitioning to the Common Core State Standards in English Language Arts and Mathematics (Sacramento, CA: California Department of Education, 2011), http://www.cde.ca.gov/ci/cc/.
Colorado Department of Education, curriculum supports, standards crosswalks, and planning tools, http://www.cde.state.co.us/cdeassess/UAS/Presentation_and_Resources.html.
Connecticut State Department of Education, ELA and math crosswalk documents, model units of study for ELA and math, and pacing guides, http://www.sde.ct.gov/sde/cwp/view.asp?a=2618&q=322592.
Delaware Department of Education, multiple resources including standards crosswalks, learning-progression guides, and publisher’s criteria, http://www.doe.k12.de.us/infosuites/staff/ci/content_areas/ela.shtml and http://www.doe.k12.de.us/infosuites/staff/ci/content_areas/math.shtml.
Page 50 | Appendix D: States’ Common Core Resources
Georgia Department of Education, resources for teachers and administrators, including curricular maps, grade-specific PBS training videos, and online presentations, https://www.georgiastandards.org/Pages/Default.aspx.
Hawaii State Department of Education, standards crosswalks, curriculum frameworks and model units, and assessments for specific standards, http://wetserver.net/hcpsv3_staging/cc/common-core.jsp.
Maryland State Department of Education, detailed grade-by-grade CCSS aligned curricular frameworks and assessment resources, http://mdk12.org/instruction/commoncore/index.html.
Massachusetts Department of Elementary and Secondary Education, standards crosswalks, model curricular frameworks, and external resources links, http://www.doe.mass.edu/candi/commoncore/.
Ohio Department of Education, model curricula, standards crosswalks, and various instructional webinar presentations, http://www.education.ohio.gov/GD/Templates/Pages/ODE/ODEDetail.aspx?Page=3&TopicRelationID=1699&Content=123270 and http://www.education.ohio.gov/GD/Templates/Pages/ODE/ODEDetail.aspx?page=3&TopicRelationID=1704&ContentID=83475&Content=123191.
Utah State Office of Education, alignment documents by grade, standards crosswalks, and recommended instructional materials links, http://www.schools.utah.gov/core/.
Vermont Department of Education, Common Core wiki with various pedagogical guides, curricular models, and regional training resources, http://education.vermont.gov/new/html/pgm_curriculum.html.
Wisconsin Department of Public Instruction, standards crosswalks and comparisons with prior standards, videos, and links to external CCSS resources, http://dpi.state.wi.us/standards/stds.html.
West Virginia Department of Education, standards crosswalks, model unit plans, and videos on model classrooms and specific teaching strategies, http://wvde.state.wv.us/teach21/.
Page 51About the Authors |
About the AuthorsPatrick Murphy is a professor in the Department of Politics at the University of San Francisco. His research focuses on public management, finance, and public policy issues. He has also published on K–12 education, higher education, and drug policy. Murphy’s current research examines how state education agencies allocate their resources. He serves as senior research consultant for the Center on Reinventing Public Education and as an adjunct fellow at the Public Policy Institute of California. He also has worked for the RAND Corporation and the U.S. Office of Management and Budget. Murphy received his Ph.D. from the University of Wisconsin and a M.P.A. from the University of Texas.
Elliot Regenstein is a Chicago-based partner of EducationCounsel LLC who focuses on providing legal, policy, strategic planning, and advocacy services to governments, foundations, and nonprofit organizations. From 2004 to 2006, he served in the Illinois governor’s office as director of education reform. He earned his J.D. from the University of Michigan Law School and a B.A. in history from Columbia University.
Keith McNamara is an independent contractor in education policy research whose previous experience includes several years in litigation management and technology publishing. He is a former elementary ESL teacher in the District of Columbia with Teach for America. Prior to that, McNamara served in the U.S. Marine Corps. He earned his B.A. from the University of Connecticut and two M.S. degrees from American University and Harvard University.
Page 52 | Endnotes
1. Minnesota adopted the CCSS for English language arts only, and thus is not included in this tally.
2. The estimates reflect a small benefit from economies of scale, because the $4 million in estimated fixed costs would be spread across a larger population. Larger states or districts could realize lower marginal costs than those assumed here.
3. U.S. Bureau of the Census, Public Education Financing, 2009 (Washington, D.C.: U.S. Department of Commerce, May 2011).
4. Minnesota adopted the CCSS for English language arts only, and thus is not included in this tally.
5. The estimates reflect a small benefit from economies of scale, because the $4 million in estimated fixed costs would be spread across a larger population. Larger states or districts could realize lower marginal costs than those assumed here.
6. U.S. Bureau of the Census, Public Education Financing, 2009 (Washington, D.C.: U.S. Department of Commerce, May 2011).
7. Kathleen Porter-Magee, “Getting Common Core implementation right: the $16 billion question,” Common Core Watch, February 24, 2012, http://www.edexcellence.net/commentary/education-gadfly-daily/common-core-watch/2012/getting-common-core-implementation-right-the-16-billion-question.html.
8. Tamara Butler Battaglino, Matt Haldeman, and Eleanor Laurans, “The Costs of Online Learning,” in Education Reform for the Digital Era, eds. Chester E. Finn, Jr. and Daniela R. Fairchild (Washington, D.C.: Thomas B. Fordham Institute, April 2012).
9. Minnesota adopted the CCSS for English language arts only, and thus is not counted in this tally.
10. In September 2011, the U.S. Department of Education established a waiver-request process by which states could bypass some of the more onerous and objectionable aspects of the No Child Left Behind legislation. In exchange, states had to agree to implement a number of reforms relative to college- and career-ready standards, aligned assessments, differentiated-accountability systems, and teacher- and principal-evaluation systems, among other areas. As of April 2012, eleven state waiver plans had been approved, and twenty-six more states had requested waivers. One of the requesting states, Virginia, has not adopted the Common Core. See the U.S. Department of Education’s webpage on “ESEA Flexibility Requests and Related Documents” at http://www.ed.gov/esea/flexibility/requests.
11. Pioneer Institute and American Principles Project, National Cost of Aligning States and Localities to the Common Core Standards (Boston, MA: Pioneer Institute and American Principles Project, February 2012).
12. Ideally, we would have prepared this report by analyzing fully developed state implementation plans and related budget estimates side-by-side so that we could use those estimates to inform our thinking about the best and most cost-effective way to implement the Common Core. But while many states now have some version of an implementation plan, related budget estimates are hard to come by. For plans, see Preparing for Change: A National Perspective on Common Core State Standards Implementation Planning (Seattle, WA, and Bethesda, MD: Education First and the EPE Research Center, January 2012). Our estimates are therefore based on previous state
Endnotes
Page 53Endnotes |
procurement efforts and interviews with state officials. (See Appendices B and C for more about our methods.) We hope that, in the months ahead, states will in fact develop cost estimates for Common Core implementation that detail their comprehensive approaches, with real dollar figures (or at least good estimates) attached to key activities. And we hope that this paper will be helpful in developing those estimates.
13. We include the first year of assessment costs, even though states already spend money on testing. Our intent is to capture new, or net, spending during the start-up period of the Common Core. Later in the analysis, we estimate the net cost by subtracting from the gross an estimate of current assessment expenditures. This approach is consistent with our treatment of professional development and materials, where we calculate the gross new costs, then estimate them net of current spending.
14. We also do not distinguish the source of revenue (e.g., federal, state general fund, local property taxes, etc.) that may account for the expenditures.
15. The most recent data from the National Center for Education Statistics show that in eleven states, more than 60 percent of the revenue for education comes from the state, while in ten states, the percentage is under 40. In the remaining states, the balance was closer to 50/50. A state’s state/local balance of funding responsibility for discrete tasks like materials, assessment, and professional development may differ from the state’s overall state/local balance of funding responsibility. See Institute of Education Sciences, Digest of Education Statistics 2010 (Washington, D.C.: National Center for Education Statistics, May 2011), table 181.
16. According to the Center on Education Policy, in 2011, 76 percent of districts in states adopting the Common Core viewed adequate funding as a major challenge to implementation. Perhaps unsurprisingly, this was the single most significant challenge identified in the district survey. Nancy Kober and Diane Stark Rentner, Common Core State Standards: Progress and Challenges in School Districts’ Implementation (Washington, D.C.: Center on Education Policy, September 2011).
17. A related structural change—also promising but outside our scope—is moving away from minimum class-size and seat-time requirements. See Karen Hawley Miles, Karen Baroody, and Elliot Regenstein, Restructuring Resources for High-Performing Schools: A Primer for State Policymakers (Watertown, MA: Education Resource Strategies, June 2011).
18. Douglas Levin, Geoffrey Fletcher, and Yen Chau, Technology Requirements for Large-scale Computer-based and Online Assessments: Current Status and Issues (Glen Burnie, MD: State Education Technology Directors Association, June 2011).
19. It is also likely to be poorly understood due to a lack of system-wide information about what materials are actually being used. Matthew J. Chingos and Grover J. Whitehurst, Choosing Blindly: Instructional Materials, Teacher Effectiveness, and the Common Core (Washington, D.C.: Brookings Institution, April 2012).
20. In fact, one of our interviewees, a former administrator for the California Department of Education, observed that his state may have lost its “most favored nation” status with textbook publishers.
21. This figure is based upon the last time California adopted textbooks across the board for new standards. See Brian Edwards, California and the “Common Core”: Will There Be a New Debate about K–12 Standards? (Mountain View, CA: EdSource, June 2010). Other estimates vary. For instance, Washington State estimated the cost of its last instructional materials acquisition, in 2007-08, as $122 per student. See Jessica Vavrus, The Common Core State Standards for English Language Arts and Mathematics: Analysis and Recommendations (Olympia, WA: Office of the State Superintendent of Public Instruction, January 2011), 29. Finally, the Kentucky Research Commission calculated that the state spent $76 per high school student on textbooks in FY2007.
Page 54 | Endnotes
That figure, however, was an annual expenditure and not intended to represent a complete replacement of instructional materials. See Lisa Cave, Mike Clark, and Christopher T. Hall, The Costs of College and High School Textbooks in Kentucky (Frankfurt, KY: Kentucky Research Commission, August 2008).
22. The estimate includes only the cost of printing materials for the student. The $20 estimate used here would account for the printing of 500 pages of materials at $0.04 per page. Not every student may elect to have materials printed out in hard copy, however. The content would be developed by a nonprofit organization and made available to schools at little or no cost. See, for example, content developed by CK-12 Foundation (www.ck12.org) or Connexions (www.cnx.org).
23. For more about the advantages of open educational resources for states, See Reg Leichty, “State Implementation of Common College & Career Ready Standards Present a Tipping Point for OER,” Getting Smart Blog, April 25, 2012, http://gettingsmart.com/news/oer-update-common-collegecareer-ready-standards-drive-innovation/.
24. Shifting away from traditional hard-copy textbooks is becoming a reality in some states. For instance, the Utah State Office of Education recently announced its Open Textbook initiative and hopes to have online textbooks as an option for schools and districts by fall of 2012. The plan is for the state to develop electronic books aligned to the CCSS in secondary language arts, math, and science. Utah estimates that the new materials will cost about $5 per book. See the Utah Open Textbook Project at http://utahopentextbooks.org/.
25. This figure is based on the notion of self-publishing texts and making them available online and/or in printed-out hard copies. The estimate includes the cost of content development and printing ($15 to $25 per student for the former and $20 to print 500 pages at $0.04 per page). A state, district, or school could contract with an individual or institution to produce content—or purchase it from another state, district, or school. For example, the CK-12 Foundation (www.ck12.org) provides templates for do-it-yourself textbooks. Marginal costs for content development, of course, would decrease with the number of users. Most current major vendors offer some version of e-textbooks. To date, they are quoting prices that are about 85 percent of the cost of the hard-copy version.
26. Computer-administered tests may or may not be computer adaptive; that is, they may or may not adapt to students’ ability levels. While both SBAC and PARCC are developing computer-administered assessments, the former is also developing computer adaptive testing.
27. For example, Washington State estimates that participation in the SBAC will significantly reduce the cost of assessment from $43 to $19–$25 per student. See Vavrus, Common Core State Standards, 29. Incidentally, the Stanford Center for Opportunity Policy in Education also estimated the relative cost difference of administering traditional summative assessments (i.e., paper multiple-choice tests) versus “high-quality” assessments, which incorporate open-ended items. Analysts estimated that traditional exams cost $19.83 per student, while high-quality assessments cost $55.67 (including the cost of human scorers); however, the latter figure drops to $40.66 when states join a consortium of at least twenty states and benefit from economies of scale. See Barry Topol, John Olson, and Edward Roeber, The Cost of New Higher Quality Assessments: A Comprehensive Analysis of the Potential Costs for Future State Assessments (Stanford, CA: Stanford Center for Opportunity Policy in Education, April 2010).
28. As explained in Bounding the Discussion (page 15), we have excluded from these assumptions the cost of technology infrastructure to administer assessments online. See Appendix A for further discussion.
29. This figure is based upon reports of existing state expenditures for assessment. See our discussion of current assessment expenditures (page 21) and endnote 27 for explanation and sources.
Page 55Endnotes |
30. The SBAC estimates that its assessments will cost $19.81 and $7.50 per pupil for summative and interim tests, respectively. See SBAC’s frequently asked questions webpage at http://www.smarterbalanced.org/resources-events/faqs/.
31. The number three is illustrative. Obviously a state may decide to offer more or fewer interim assessments. Or a state may leave the decision up to individual districts. More assessment means more information, but also more time spent on testing and higher cost.
32. Based on SBAC estimates for three interim tests ($7.50) and one summative assessment ($19.81). See endnote 30.
33. According to Shields and Miles, districts typically fail to map out and measure their existing investment in professional development, which should serve as the foundation for all future planning efforts. Regis Anne Shields and Karen Hawley Miles, “Strategic Professional Development Review,” in A Grand Bargain for Education Reform: New Rewards and Supports for New Accountability, eds. Theodore Hershberg and Claire Robertson-Kraft (Cambridge, MA: Harvard Education Press, 2009).
34. Stephanie Hirsh, executive director of Learning Forward, recently and aptly remarked, “The dramatic shift in teaching prompted by the common core will require practical, intensive, and ongoing professional learning—not one-off ‘spray and pray’ training that exposes everyone to the same material and hopes that some of it sticks.” Stephanie Hirsh, “Common Core Work Must Include Teacher Development,” Education Week, February 1, 2012.
35. For instance, Tennessee, in its ESEA waiver application, identified the need to improve its math teaching capacity significantly. See the Department of Education’s webpage on ESEA flexibility requests at http://www.ed.gov/esea/flexibility/requests.
36. Another emerging state trend is new teacher-evaluation systems that are based in part on student outcomes and meant to help drive professional development opportunities. These systems may be helpful in ensuring that professional development is meaningful for teachers, but they are so far untested. As states roll out and pilot new evaluation systems, they should better understand how results can inform professional development design.
37. West Virginia, Utah, Delaware, Florida, and other states are utilizing a train-the-trainers approach. Typically, about 10 percent of the state’s teachers participates in intensive CCSS professional development. In turn, those teachers support the remainder of the teaching force in the transition with the help of less expensive online modules. The West Virginia academies have the added benefit of requiring participants to produce instructional modules in specific subject areas; those modules are peer reviewed and vetted, and if they pass muster, are posted on the state education agency’s website for broad dissemination.
38. A recent survey indicated that the most commonly planned modes of professional development in states’ Common Core implementation plans are conferences and workshops, online modules, and webinars—followed by teacher networks, statewide or regional academies, and regional education service centers. Education First and the EPE Research Center, Preparing for Change.
39. These estimates do not account for the variation among districts in how professional development is expensed. In some districts, teachers are expected to participate in professional development as part of their contracts. Other districts treat Common Core professional development as a new expenditure, meaning that both a teacher’s time and the costs of substitute teachers while that teacher is participating must be covered.
40. Note that the trend in recent years has been to move away from the strict use of in-person professional development for all teachers, but we still describe that as Business as Usual due to its traditional prevalence. Our Bare Bones scenario also focuses on on-line modules that provide limited interactive support.
Page 56 | Endnotes
41. This figure is based on an estimate rendered by the California State Superintendent of Public Instruction. (See that official’s memo to the State Board of Education, “Item 5 – Elementary and Secondary Education Act: Principles and Requirements for a Waiver of Selected Provisions of the No Child Left Behind Act of 2001 to Implement a Specific Statewide Accountability System for All California Local Educational Agencies in Advance of Elementary and Secondary Education Act Reauthorization,” November 3, 2011.) It is not entirely clear why eighty hours is considered an optimum duration for professional development, nor the marginal benefit an additional hour would bring. However, the total amount is not out of line with other estimates. For example, EdSource estimated $2,500 per teacher for professional development in California, and the state of Washington estimated a total professional development cost of $140 million, or $2,450 per teacher for professional development relative to the Common Core. Some states also have minimum professional development requirements—for example, Arkansas requires sixty hours (See the Arkansas Department of Education’s Rules Governing Professional Development [Section 4.01] at http://arkansased.org/about/pdf/current/ADE%20207%20Professional%20Development%20Rules%20-%20April%202012.pdf). Thus, states with specific requirements should adjust this estimate accordingly.
42. Figures are based on the pricing structure of the School Improvement Network, assuming twenty teachers per site and a price of $3,500 to $12,000 per site fee. See the Network’s webpage on cost efficiency at http://www.schoolimprovement.com/pd360/on-demand/cost-efficiency/. Additionally, the state of Alabama delivers online professional development for approximately $2 per hour. Tom Dreilinger (State Project Director, e-Learning for Educators-Alabama) in discussion with author Patrick Murphy, February 2012. Adopting a conservative estimate of $5 per hour would still yield a ballpark figure of $400 for eighty hours of professional development.
43. For the sake of consistency, we use the assumptions from the other two scenarios, though the mix can vary. For example, estimating the costs of a train-the-trainers approach would mean that 10 percent of teachers would be trained for eighty hours at a total cost of $2,000 per teacher. The cost of training the remainder is assumed to be similar to that associated with online professional development, or about $400 per teacher. The weighted average cost for the total teaching force would be $560 per teacher under this set of assumptions.
44. See, for example, Pioneer Institute and American Principles Project, National Cost of Aligning States; and Edwards, California and the “Common Core.”
45. Interim tests give teachers the opportunity to address student weaknesses immediately rather than wait for the results of summative assessments in the spring.
46. Vavrus, Common Core State Standards.
47. See Tennessee’s final approved waiver request on the U.S. Department of Education’s webpage, “ESEA Flexibility Requests and Related Documents,” at http://www.ed.gov/esea/flexibility/requests.
48. These estimates use a per-student calculation for assessment costs, even though not all grades will have the same number of assessments administered. For example, Kindergarten, first grade, and second grade do not have required summative assessments. Thus, this method may overstate the actual costs of assessments. For the purposes of consistency, however, we use the same calculation for each scenario, thereby enabling comparisons. Individual states should develop more precise estimates based on their actual or planned assessment systems.
49. Student and teacher population estimates for 2009-10 were drawn from the National Center for Education Statistics.
50. Our estimates assume that a complete overhaul of instructional materials is needed to align them to the Common Core (e.g., 100 percent of the math and ELA materials will be replaced), but the validity of that
Page 57Endnotes |
assumption varies from state to state. In some, existing standards are of the same quality as the Common Core. See Sheila Byrd Carmichael, Gabrielle Martino, Kathleen Porter-Magee, and W. Stephen Wilson, The State of State Standards—and the Common Core—in 2010 (Washington, D.C.: Thomas B. Fordham Institute, July 2010). The authors found that, for most states, the CCSS represent a significant upgrade, but that in roughly a dozen states, previous standards were of similar (or even superior) quality in math, ELA, or both. Though having standards of the same quality is not equivalent to having the same content, in some states the previous content was in fact similar to the CCSS—and in those states the cost of new materials may be substantially lower than quoted here.
51. The estimates reflect a small benefit from economies of scale, because the $4 million in estimated fixed costs would be spread across a larger population. Larger states or districts could realize lower marginal costs than those assumed here.
52. U.S. Bureau of the Census, Public Education Financing, 2009 (Washington, D.C.: U.S. Department of Commerce, May 2011).
53. See the Florida Department of Education’s webpage on “Frequently Asked Questions about Assessment and School Performance” at http://www.fldoe.org/faq/default.asp?Dept=179&ID=977#Q977.
54. See the Financial Allocation Study for Texas’s webpage on “Public Education Spending in Texas” at http://fastexas.org/study/exec/spending.php.
55. Caroline M. Hoxby, The Cost of Accountability (Cambridge, MA: National Bureau of Economic Research, March 2002).
56. See the appendices of SBAC’s Race to the Top application, submitted to the U.S. Department of Education in June 2010, at http://www.smarterbalanced.org/wordpress/wp-content/uploads/2011/12/SBAC_Appendices.pdf.
57. This estimate includes the cost of contracted professional-development days for teachers. See Karen Hawley Miles et al., “Inside the Black Box of School District Spending on Professional Development: Lessons from Comparing Five Districts,” Journal of Education Finance 30, no. 1 (2004): 1-26.
58. Regis Shields, Nicole Y. Ireland, Greg Rawson, and Maria McCarthy, Strategic Professional Development Review of the School District of Philadelphia, School Year 2007-08 (Watertown, MA: Education Resource Strategies, 2008).
59. Massachusetts Department of Elementary and Secondary Education, Report to the Legislature, “Professional Development Expenditures, Fiscal Year 2007,” November 2008.
60. U.S. Bureau of the Census, Annual Survey of Local Government Finances 2009 (Washington, D.C.: U.S. Department of Commerce, 2011).
61. Data from the federal finance surveys are collected systematically from more than 15,500 districts in all fifty states. Of these districts, more than 5,000 in twenty-five states report receiving “staff improvement” dollars. The figures for dollars per teacher, however, range wildly—from about one dollar to tens of thousands of dollars per teacher. To reduce this distortion, we limited our analysis to 80 percent of the districts in the middle of the sample, eliminating the 10 percent at the two extremes. The resulting sample includes more than 4,200 districts from twenty-three states. The average state dollars spent per teacher for staff improvement was $2,440. The median was $1,423. (Using all 5,268 districts and not eliminating the extremes produced an average of more than $5,000 per teacher.) The weighted average for this group was $2,044 per teacher for staff improvement, and that was the figure we ultimately used.
Page 58 | Endnotes
62. In addition, if the Common Core is to create transformational change, the intensity of the professional development may need to be substantial, leading us to use a lower estimate to avoid underestimating the net cost.
63. Institute of Education Sciences, Digest of Education Statistics 2010, table 100.
64. Massachusetts notes this collaboration in its ESEA waiver request: “Massachusetts is also collaborating with Rhode Island and New York to expand the pool of high quality curriculum and assessment materials by including products from all three states; this expanded collection will also include units related to the arts.” See Massachusetts’s ESEA waiver application on the Department of Education’s webpage, “ESEA Flexibility Requests and Related Documents,” at http://www.ed.gov/esea/flexibility/requests.
65. See BetterLesson’s website at http://betterlesson.com/; and Rip Empson, “BetterLesson Grabs $1.6 Million to Let Educators Find and Share the Best Lesson Plans,” Tech Crunch, September 28, 2011, http://techcrunch.com/2011/09/28/betterlesson-grabs-1-6-million-to-let-educators-find-and-share-the-best-lesson-plans/.
66. A few organizations are working to develop materials: Student Achievement Partners is building various materials and tools to foster CCSS implementation (General Electric, “Common Core State Standards Receives Largest Corporate Investment to Date With GE Foundation $18 Million Commitment,” news release, February 1, 2012, http://www.businesswire.com/portal/site/ge/index.jsp?ndmViewId=news_view&ndmConfigId=1004554&newsId=20120201005296&newsLang=en&vnsId=681); the Pearson Foundation is developing a digital curriculum for the Common Core (Pearson Foundation, “Pearson Foundation Partners with Bill and Melinda Gates Foundation to Create Digital Learning Programs,” news release, April 27, 2011, http://www.pearsonfoundation.org/pr/20110427-pf-partners-with-gates-foundation-to-create-digital-learning-programs.html); and Common Core, a nonprofit organization that supports liberal arts education, has developed a series of curriculum “maps” (See Common Core’s webpage on their Curriculum Mapping Project at http://commoncore.org/maps/).
67. Adam Clark Estes, “The Economics of iPublishing,” AtlanticWire, January 20, 2012, http://www.theatlanticwire.com/technology/2012/01/economics-apples-ipublishing/47647/. See also Apple’s webpage on iBooks textbooks at http://www.apple.com/education/ibooks-textbooks/.
68. How this market emerges may also be affected by the Department of Justice, which has sued Apple and five major publishers for alleged antitrust violations related to pricing practices. Ylan Q. Mui and Hayley Tsukayama, “Justice Department sues Apple, publishers over e-book prices,” Washington Post, April 11, 2012, http://www.washingtonpost.com/business/economy/justice-department-files-suit-against-apple-publishers-report-says/2012/04/11/gIQAzyXSAT_story.html.
69. Both McGraw Hill and Pearson have announced their intention to produce electronic versions of standard texts. These books can be downloaded to students’ computers or accessed via the web. According to the vendors, the costs for electronic texts would run 15 percent less than traditional books. It is worth noting that other vendors (e.g., Amazon) may offer download-only versions that could be accessed via electronic readers, though prices have not yet been disclosed. Also, Apple pledged a maximum price of $14.99 for texts that would be developed and made available for download on its iPad tablet computer.
70. See, for example, Megan Garber, “A Brief History of Textbooks, or, Why Apple’s ‘New Textbook Experience’ is Actually Revolutionary,” The Atlantic, January 19, 2012, http://www.theatlantic.com/technology/archive/2012/01/a-brief-history-of-textbooks-or-why-apples-new-textbook-experience-is-actually-revolutionary/251662/.
71. See Achieve’s webpage on OER rubrics at http://www.achieve.org/oer-rubrics.
Page 59Endnotes |
72. As noted, our analysis does not include the cost of developing assessment materials, because that work is led by PARCC and SBAC. The U.S. Department of Education awarded the consortia $330 million over four years ($160 million to SBAC and $170 million to PARCC).
73. See SBAC’s webpage on computer adaptive testing at http://www.smarterbalanced.org/smarter-balanced-assessments/computer-adaptive-testing/.
74. The State Educational Technology Directors Association is assessing state capacity to implement the computer-based adaptive assessments being developed by SBAC and PARCC. They, in turn, are developing a technology readiness tool to assess district- and school-level capacity. See Bill Tucker, “The Country’s Most Ambitious Digital Learning Project,” Huffington Post, February 6, 2012, http://www.huffingtonpost.com/bill-tucker/digital-learning_b_1243219.html.
75. Some states have already made meaningful advances in implementing computer-based assessments. For example, Oregon, which requires all students to take tests online, introduced online testing in 2001. Other states began requiring portions of their state assessments to be completed on computers several years ago, including Florida (first introduced in 2006), Indiana (2006), Idaho (2005), and Kansas (2004). Several states also have been offering online assessment to their schools as a voluntary option. For a complete list, see the results of a survey conducted of state education technology directors in Levin, Fletcher, and Chau, Technology Requirements.
76. See the School Improvement Network’s webpage on Common Core 360 at http://www.schoolimprovement.com/products/common-core-360/.
77. Curtis Linton (vice president, School Improvement Network), in discussion with the authors, February 2012.
78. Megan Pacheco (director of coaching, New Tech Network), in discussion with the authors, February 2012.
79. Such reforms can also be cost effective. See, for instance, Michael J. Petrilli and Marguerite Roza, Stretching the School Dollar: A Brief for State Policymakers (Washington, D.C.: Thomas B. Fordham Institute, January 2011); and Michael J. Petrilli, How Districts Can Stretch the School Dollar (Washington, D.C.: Thomas B. Fordham Institute, April 2012).
80. See, for example, Bryan C. Hassel and Emily Ayscue Hassel, “Teachers in the Age of Digital Instruction,” in Education Reform for the Digital Era, eds. Chester E. Finn, Jr. and Daniela R. Fairchild (Washington, D.C.: Thomas B. Fordham Institute, April 2012); and Frederick M. Hess and Bruno V. Manno, eds., Customized Schooling: Beyond Whole-School Reform (Cambridge, MA: Harvard Education Press, February 2011).
81. See, for instance, Tamara Butler Battaglino, Matt Haldeman, and Eleanor Laurans, “The Costs of Online Learning,” in Education Reform for the Digital Era, eds. Chester E. Finn, Jr. and Daniela R. Fairchild (Washington, D.C.: Thomas B. Fordham Institute, April 2012).
82. See PARCC’s webpage on technology at http://www.parcconline.org/technology.
83. See, for example, the HP TouchPad Snapdragon 9.7-inch 1GB/16GB LED Tablet Computer, which, as of April 2012, lists at several online vendors at a manufacturer-suggested retail price of $299.
84. To put the pace of this change into perspective, on April 9, 2010—eight days after the first Apple iPads were put on the market—the U.S. Department of Education invited applications for the Race to the Top Assessment grants that would eventually fund PARCC and SBAC. The consortia have now started to field test some of their assessments with a complete rollout planned for 2014. Meanwhile, Apple is already on its third generation of the iPad.
Page 60 | Endnotes
85. Levin, Fletcher, and Chau, Technology Requirements, 26-28.
86. The price estimate was drawn from BridgeOne Broadband Locators, a business-to-business service provider based in Austin, Texas, that serves as a clearinghouse on broadband providers. See BridgeOne’s website at www.broadbandlocators.com.
87. Pioneer Institute and American Principles Project, National Cost of Aligning States, 2.
88. North Carolina is one such state. Beginning as early as 1985, the nonprofit Microelectronics Center of North Carolina (MCNC) provided advance communications between the state’s public institutions of higher education. That early effort eventually evolved into the North Carolina Research and Education Network (NCREN), which partnered with private providers such as AT&T, CenturyLink, and Time Warner Cable to install the connections. From 2009 to 2011, NCREN worked to bring broadband to all 115 of the state’s K-12 school districts. The total cost of wiring the districts was supported by two U.S. Department of Commerce Broadband Technology Opportunity Programs grants (totaling approximately $146 million), which underwrote the construction of the network’s “backbone.” Microelectronics Center of North Carolina, MCNC Strategic Plan – January 2011 (Research Triangle Park, NC: MCNC, January 2011), https://www.mcnc.org/sites/default/files/MCNC-Strategic-Plan-2011-01.pdf.
89. Albuquerque Public Schools, Draft Annual Budget, 2011-2012 Executive Summary for Fiscal Year July 1, 2011 to June 30, 2012 (Albuquerque, NM: Albuquerque Public Schools, 2011), http://www.aps.edu/finance/budget-planning-and-analysis; Atlanta Public Schools, FY 2012 General Fund Budget & Special Revenue Budget (Atlanta, GA: Atlanta Public Schools, 2011), http://www.atlanta.k12.ga.us/page/70; Boston Public Schools, FY 2012 Budget Documents (Boston, MA: Boston Public Schools, February 2011), http://www.bostonpublicschools.org/view/fy-2012-budget; Charlotte Mecklenburg Board of Education, 2011-2012 Adopted Budget (Charlotte, NC: Charlotte Mecklenburg Schools, 2011), http://www.cms.k12.nc.us/cmsdepartments/Finance/Pages/Budget.aspx; Chicago Public Schools, Chicago Public Schools Final Budget 2011-2012 (Chicago, IL: Chicago Public Schools, 2011), http://www.cps.edu/About_CPS/Financial_information/Pages/FYBudget2012.aspx; Cleveland Municipal School District, FY 2012 Annual Budget General Funds (Cleveland, OH: Cleveland Municipal School District, 2011), http://www.cmsdnet.net/en/Departments/FinanceDepartment.aspx; Jefferson County Public Schools, Working Budget 2011-2012 (Louisville, KY: Jefferson County Public Schools, September 2011), http://www.jefferson.k12.ky.us/Departments/FinancialServices/FinancialPlanManag.html.
90. Ibid.
91. All state Race to the Top applications can be found on the Department of Education’s website at http://www2.ed.gov/programs/racetothetop/index.html.
92. All state applications for ESEA waivers can be found on the Department of Education’s ESEA flexibility website at http://www.ed.gov/esea/flexibility/requests.
93. The NCES Build-a-Table tool can be found at http://nces.ed.gov/ccd/bat/.
Related Documents