Welcome message from author
This document is posted to help you gain knowledge. Please leave a comment to let me know what you think about it! Share it to your friends and learn new things together.
Transcript

This report was principally prepared by:
Project LeaderLaura Bloodgood
Office of IndustriesJeffrey Clark, Nicholas Corrado, Keith Diener, Vincent Honnold, Joseph Kowalski,Katherine Linton, Brendan Lynch, Deborah McNay, Erick Oh, and Laura Polly
With special assistance fromSharon Greenfield, Monica Reed, and Wanda Tolson

i
AbstractNet foreign direct investment (FDI) flows into India reached $15.7 billion in India’s2006–07 fiscal year, more than triple the $4.7 billion recorded during 2005–06, with thelargest share of FDI flows from Mauritius, followed by the United States and the UnitedKingdom. This study examines FDI in India, in the context of the Indian economic andregulatory environment. We present FDI trends in India, by country and by industry, usingofficial government data from India, the United States, and international organizations. Tosupplement the official data, the study also discusses specific investment activities ofmultinational companies in India, representing a wide range of countries and industries. Toillustrate the driving forces behind these trends, the study also discusses the investmentclimate in India, Indian government incentives to foreign investors, particularly SpecialEconomic Zones, the Indian regulatory environment as it affects investment, and the effectof India’s global, regional, and bilateral trade agreements on investment from the UnitedStates and other countries. Finally, the study presents two case studies. The first examinesglobal FDI in India’s automobile industry. The second analyzes the effects of India’s 2005Patent Law on FDI in the pharmaceutical industry.

iii
CONTENTSPage
Abstract . . . . . . . . . . . . . . . . . . . . . . . . . . . . . . . . . . . . . . . . . . . . . . . . . . . . . . . . . . . . . . .i
Executive Summary . . . . . . . . . . . . . . . . . . . . . . . . . . . . . . . . . . . . . . . . . . . . . . .ix
Chapter 1. Introduction . . . . . . . . . . . . . . . . . . . . . . . . . . . . . . . . . . . . . . . . .1-1
Purpose and scope . . . . . . . . . . . . . . . . . . . . . . . . . . . . . . . . . . . . . . . . . . . . . . . . . . . . . . . 1-1Overview of FDI in India . . . . . . . . . . . . . . . . . . . . . . . . . . . . . . . . . . . . . . . . . . . . . . . . . 1-2Data . . . . . . . . . . . . . . . . . . . . . . . . . . . . . . . . . . . . . . . . . . . . . . . . . . . . . . . . . . . . . . . . . . 1-4
Chapter 2. FDI in India . . . . . . . . . . . . . . . . . . . . . . . . . . . . . . . . . . . . . . . .2-1
Overview of FDI flows . . . . . . . . . . . . . . . . . . . . . . . . . . . . . . . . . . . . . . . . . . . . . . . . . . . 2-1Mergers and acquisitions . . . . . . . . . . . . . . . . . . . . . . . . . . . . . . . . . . . . . . . . . . . . . . 2-3Greenfield FDI in India . . . . . . . . . . . . . . . . . . . . . . . . . . . . . . . . . . . . . . . . . . . . . . . 2-6
Distribution of FDI within India . . . . . . . . . . . . . . . . . . . . . . . . . . . . . . . . . . . . . . . . . . . . 2-6FDI flows to India by source country . . . . . . . . . . . . . . . . . . . . . . . . . . . . . . . . . . . . . . . . 2-11
Mauritius . . . . . . . . . . . . . . . . . . . . . . . . . . . . . . . . . . . . . . . . . . . . . . . . . . . . . . . . . . . 2-13United States . . . . . . . . . . . . . . . . . . . . . . . . . . . . . . . . . . . . . . . . . . . . . . . . . . . . . . . . 2-14European Union . . . . . . . . . . . . . . . . . . . . . . . . . . . . . . . . . . . . . . . . . . . . . . . . . . . . . 2-18Japan . . . . . . . . . . . . . . . . . . . . . . . . . . . . . . . . . . . . . . . . . . . . . . . . . . . . . . . . . . . . . . 2-19United Arab Emirates (U.A.E.) . . . . . . . . . . . . . . . . . . . . . . . . . . . . . . . . . . . . . . . . . 2-21
FDI flows to India by industry . . . . . . . . . . . . . . . . . . . . . . . . . . . . . . . . . . . . . . . . . . . . . 2-22
Chapter 3. India’s FDI Environment . . . . . . . . . . . . . . . . . . . . . . . . 3-1Introduction . . . . . . . . . . . . . . . . . . . . . . . . . . . . . . . . . . . . . . . . . . . . . . . . . . . . . . . . . . . . 3-1Economy . . . . . . . . . . . . . . . . . . . . . . . . . . . . . . . . . . . . . . . . . . . . . . . . . . . . . . . . . . . . . . 3-2
Strong economic growth . . . . . . . . . . . . . . . . . . . . . . . . . . . . . . . . . . . . . . . . . . . . . . . 3-2Poverty . . . . . . . . . . . . . . . . . . . . . . . . . . . . . . . . . . . . . . . . . . . . . . . . . . . . . . . . . . . . 3-3
Labor issues . . . . . . . . . . . . . . . . . . . . . . . . . . . . . . . . . . . . . . . . . . . . . . . . . . . . . . . . . . . . 3-4Low wages . . . . . . . . . . . . . . . . . . . . . . . . . . . . . . . . . . . . . . . . . . . . . . . . . . . . . . . . . 3-4Rigidity in the labor market . . . . . . . . . . . . . . . . . . . . . . . . . . . . . . . . . . . . . . . . . . . . 3-5Rising salaries and high turnover in some industries . . . . . . . . . . . . . . . . . . . . . . . . . 3-5
Infrastructure . . . . . . . . . . . . . . . . . . . . . . . . . . . . . . . . . . . . . . . . . . . . . . . . . . . . . . . . . . . 3-6Antiquated infrastructure . . . . . . . . . . . . . . . . . . . . . . . . . . . . . . . . . . . . . . . . . . . . . . 3-6Increased opportunities for private sector participation in infrastructure projects . . . 3-7
Education . . . . . . . . . . . . . . . . . . . . . . . . . . . . . . . . . . . . . . . . . . . . . . . . . . . . . . . . . . . . . 3-8Educated work force . . . . . . . . . . . . . . . . . . . . . . . . . . . . . . . . . . . . . . . . . . . . . . . . . . 3-8
iv
CONTENTS–Continued
Page
Chapter 3. India’s FDI Environment–ContinuedWeaknesses in the educational system . . . . . . . . . . . . . . . . . . . . . . . . . . . . . . . . . . . . 3-9
Access to capital . . . . . . . . . . . . . . . . . . . . . . . . . . . . . . . . . . . . . . . . . . . . . . . . . . . . . . . . 3-10Bureaucracy and corruption . . . . . . . . . . . . . . . . . . . . . . . . . . . . . . . . . . . . . . . . . . . . . . . 3-12
Chapter 4. Special Economic Zones . . . . . . . . . . . . . . . . . . . . . . . . . 4-1Introduction . . . . . . . . . . . . . . . . . . . . . . . . . . . . . . . . . . . . . . . . . . . . . . . . . . . . . . . . . . . . 4-1Incentives to invest in SEZs . . . . . . . . . . . . . . . . . . . . . . . . . . . . . . . . . . . . . . . . . . . . . . . 4-1Establishment and licensing of SEZs . . . . . . . . . . . . . . . . . . . . . . . . . . . . . . . . . . . . . . . . 4-3Other FDI incentives . . . . . . . . . . . . . . . . . . . . . . . . . . . . . . . . . . . . . . . . . . . . . . . . . . . . . 4-7
Chapter 5. FDI Regulation and Dispute Settlement . . . . 5-1FDI procedures . . . . . . . . . . . . . . . . . . . . . . . . . . . . . . . . . . . . . . . . . . . . . . . . . . . . . . . . . 5-1FDI regulation . . . . . . . . . . . . . . . . . . . . . . . . . . . . . . . . . . . . . . . . . . . . . . . . . . . . . . . . . . 5-2Labor regulation . . . . . . . . . . . . . . . . . . . . . . . . . . . . . . . . . . . . . . . . . . . . . . . . . . . . . . . . 5-3Intellectual property rights regulation . . . . . . . . . . . . . . . . . . . . . . . . . . . . . . . . . . . . . . . . 5-5
Trademark protection . . . . . . . . . . . . . . . . . . . . . . . . . . . . . . . . . . . . . . . . . . . . . . . . . 5-5Copyright protection . . . . . . . . . . . . . . . . . . . . . . . . . . . . . . . . . . . . . . . . . . . . . . . . . . 5-6Patent protection . . . . . . . . . . . . . . . . . . . . . . . . . . . . . . . . . . . . . . . . . . . . . . . . . . . . . 5-6
Other regulatory issues . . . . . . . . . . . . . . . . . . . . . . . . . . . . . . . . . . . . . . . . . . . . . . . . . . . 5-7Implications of recent FDI policy changes . . . . . . . . . . . . . . . . . . . . . . . . . . . . . . . . . . . . 5-8
Semiconductors . . . . . . . . . . . . . . . . . . . . . . . . . . . . . . . . . . . . . . . . . . . . . . . . . . . . . 5-8Telecommunications . . . . . . . . . . . . . . . . . . . . . . . . . . . . . . . . . . . . . . . . . . . . . . . . . . 5-8Retailing . . . . . . . . . . . . . . . . . . . . . . . . . . . . . . . . . . . . . . . . . . . . . . . . . . . . . . . . . . . 5-9
Litigation and alternative dispute resolution . . . . . . . . . . . . . . . . . . . . . . . . . . . . . . . . . . . 5-9Litigation in India . . . . . . . . . . . . . . . . . . . . . . . . . . . . . . . . . . . . . . . . . . . . . . . . . . . . 5-9Alternative dispute resolution in India . . . . . . . . . . . . . . . . . . . . . . . . . . . . . . . . . . . . 5-11ADR in action: The Enron dispute and the Dubhol power plant . . . . . . . . . . . . . . . . 5-13
Chapter 6. India’s Investment-Related InternationalAgreements . . . . . . . . . . . . . . . . . . . . . . . . . . . . . . . . . . . . . . . . . . . . . . . . . . . . . 6-1World Trade Organization . . . . . . . . . . . . . . . . . . . . . . . . . . . . . . . . . . . . . . . . . . . . . . . . 6-1
Agreement on trade related investment measures . . . . . . . . . . . . . . . . . . . . . . . . . . . 6-1General agreement on trade in services . . . . . . . . . . . . . . . . . . . . . . . . . . . . . . . . . . . 6-2
South Asia Free Trade Agreement . . . . . . . . . . . . . . . . . . . . . . . . . . . . . . . . . . . . . . . . . . 6-4Bilateral investment treaties . . . . . . . . . . . . . . . . . . . . . . . . . . . . . . . . . . . . . . . . . . . . . . . 6-5Double tax avoidance agreements and CECA . . . . . . . . . . . . . . . . . . . . . . . . . . . . . . . . . 6-5Other agreements . . . . . . . . . . . . . . . . . . . . . . . . . . . . . . . . . . . . . . . . . . . . . . . . . . . . . . . 6-7
v
CONTENTS–ContinuedPage
Chapter 7. Automotive Investment in India . . . . . . . . . . . . . 7-1Introduction . . . . . . . . . . . . . . . . . . . . . . . . . . . . . . . . . . . . . . . . . . . . . . . . . . . . . . . . . . 7-1Background on the domestic Indian automotive industry . . . . . . . . . . . . . . . . . . . . . . . 7-1India as an automotive FDI destination . . . . . . . . . . . . . . . . . . . . . . . . . . . . . . . . . . . . . 7-4
The Indian domestic market . . . . . . . . . . . . . . . . . . . . . . . . . . . . . . . . . . . . . . . . . . 7-4Indian government policies affecting automotive FDI . . . . . . . . . . . . . . . . . . . . . . 7-6
Auto policy of 2002 . . . . . . . . . . . . . . . . . . . . . . . . . . . . . . . . . . . . . . . . . . . . . 7-6Automotive mission plan 2006–2016 . . . . . . . . . . . . . . . . . . . . . . . . . . . . . . . 7-7
Foreign investment in the Indian auto industry . . . . . . . . . . . . . . . . . . . . . . . . . . . . . . . 7-9U.S.-based passenger vehicle investment . . . . . . . . . . . . . . . . . . . . . . . . . . . . . . . . 7-10European-based passenger vehicle investment . . . . . . . . . . . . . . . . . . . . . . . . . . . . 7-11Asia-Pacific-based passenger vehicle investment . . . . . . . . . . . . . . . . . . . . . . . . . 7-12Component industry . . . . . . . . . . . . . . . . . . . . . . . . . . . . . . . . . . . . . . . . . . . . . . . . 7-13
Conclusion . . . . . . . . . . . . . . . . . . . . . . . . . . . . . . . . . . . . . . . . . . . . . . . . . . . . . . . . . . 7-16
Chapter 8. Case Study 2: Pharmaceutical FDIin India . . . . . . . . . . . . . . . . . . . . . . . . . . . . . . . . . . . . . . . . . . . . . . . . . . . . . . . . . 8-1The evolution of India’s patent laws . . . . . . . . . . . . . . . . . . . . . . . . . . . . . . . . . . . . . . . 8-1
The Patent laws under British rule (1856–1947) . . . . . . . . . . . . . . . . . . . . . . . . . . 8-1The Post-Independence patent laws (1947–1995) . . . . . . . . . . . . . . . . . . . . . . . . . 8-2The post-TRIPS patent laws (1995–present) . . . . . . . . . . . . . . . . . . . . . . . . . . . . . 8-2Ongoing patent law controversies . . . . . . . . . . . . . . . . . . . . . . . . . . . . . . . . . . . . . 8-3
The evolution of the pharmaceutical industry in India . . . . . . . . . . . . . . . . . . . . . . . . . 8-6The domestic pharmaceutical industry . . . . . . . . . . . . . . . . . . . . . . . . . . . . . . . . . . 8-6Foreign direct investment in the drug and pharmaceutical sector . . . . . . . . . . . . . 8-7
Greenfield projects . . . . . . . . . . . . . . . . . . . . . . . . . . . . . . . . . . . . . . . . . . . . . . 8-10Strategic alliances in R&D . . . . . . . . . . . . . . . . . . . . . . . . . . . . . . . . . . . . 8-11Strategic alliances in manufacturing . . . . . . . . . . . . . . . . . . . . . . . . . . . . . 8-13
Pharmaceutical M&A . . . . . . . . . . . . . . . . . . . . . . . . . . . . . . . . . . . . . . . . . . . . 8-14Conclusion . . . . . . . . . . . . . . . . . . . . . . . . . . . . . . . . . . . . . . . . . . . . . . . . . . . . . . . . . . 8-16
Bibliography . . . . . . . . . . . . . . . . . . . . . . . . . . . . . . . . . . . . . . . . . . . . . . . . . . . . . . . Biblio-1
AppendicesA. Sector-specific guidelines for FDI in India . . . . . . . . . . . . . . . . . . . . . . . . . . . . . . . . . A-1B. Web site addresses of State and Unin Territory (UT) Governments and their
investment promotion agencies in India . . . . . . . . . . . . . . . . . . . . . . . . . . . . . . . . . . . B-1C. Bilateral international agreements that affect investment in India . . . . . . . . . . . . . . . C-1
vi
CONTENTS–ContinuedPage
Boxes3-1. Foreign investors attracted by strong Indian economy . . . . . . . . . . . . . . . . . . . . . . . . 3-33-2. Hindustan Lever Ltd. succeeds in the Indian market . . . . . . . . . . . . . . . . . . . . . . . . . 3-43-3. Large U.S. firms tap educated Indian work force . . . . . . . . . . . . . . . . . . . . . . . . . . . . 3-95-1. Forms of ADR: Mediation, Arbitration, and Concilation . . . . . . . . . . . . . . . . . . . . . . 5-127-1. Key recommended interventions in the AMP . . . . . . . . . . . . . . . . . . . . . . . . . . . . . . . 7-88-1. The Novartis challenge to India’s patent law . . . . . . . . . . . . . . . . . . . . . . . . . . . . . . . 8-5
Tables2-1. Top 10 acquisitions in India, by value, 2002–06 . . . . . . . . . . . . . . . . . . . . . . . . . . . . 2-52-2. Largest 15 greenfield FDI projects in India in 2006 . . . . . . . . . . . . . . . . . . . . . . . . . . 2-72-3. FDI equity inflows, January 2000–December 2006, by region . . . . . . . . . . . . . . . . . 2-92-4. Top country investors in India, 2006 . . . . . . . . . . . . . . . . . . . . . . . . . . . . . . . . . . . . . 2-112-5. India, M&A deals by acquiror country and industry of the target company,
2000–06 . . . . . . . . . . . . . . . . . . . . . . . . . . . . . . . . . . . . . . . . . . . . . . . . . . . . . . . . 2-122-6. Selected data for U.S. majority-owned affiliates in India, 2004 . . . . . . . . . . . . . . . . . 2-172-7. India, FDI by sector, selected years . . . . . . . . . . . . . . . . . . . . . . . . . . . . . . . . . . . . . . 2-223-1. Inward FDI flows for selected countries, 2002–05 . . . . . . . . . . . . . . . . . . . . . . . . . . . 3-24-1. India: Types of special economic zones . . . . . . . . . . . . . . . . . . . . . . . . . . . . . . . . . . . 4-55-1. Selected Indian labor laws . . . . . . . . . . . . . . . . . . . . . . . . . . . . . . . . . . . . . . . . . . . . . 5-46-1. India, GATS schedule of commitments: covered investment service sectors . . . . . . . 6-37-1. Indian passenger vehicle production, in units, FY 2001–02 through FY2005–06 . . . 7-27-2. Indian automotive parts production: FY2001–02 through FY2005–06 . . . . . . . . . . . 7-37-3. Indian passenger vehicle exports, in units, FY2001–02 through FY2005–06 . . . . . . 7-37-4. Indian exports of automotive parts: FY2001–02 through FY2005–06 . . . . . . . . . . . . 7-47-5. Indian passenger vehicle sales, in units, FY2001–02 through FY2005–06 . . . . . . . . 7-47-6. U.S. automakers with assembly operations in India . . . . . . . . . . . . . . . . . . . . . . . . . . 7-117-7. EU automakers with assembly operations in India . . . . . . . . . . . . . . . . . . . . . . . . . . . 7-127-8. Asia-Pacific automakers with assembly operations in India . . . . . . . . . . . . . . . . . . . . 7-147-9. Examples of global automotive parts suppliers manufacturing in India . . . . . . . . . . . 7-158-1. Greenfield FDI in the pharmaceutical and health biotechnology sectors by source
region and activity, 2002–06 . . . . . . . . . . . . . . . . . . . . . . . . . . . . . . . . . . . . . . . . 8-118-2. Select contract manufacturing deals in pharmaceuticals in India . . . . . . . . . . . . . . . . 8-13
Figures2-1. FDI inflows to India, 1990–2006 . . . . . . . . . . . . . . . . . . . . . . . . . . . . . . . . . . . . . . . . 2-22-2. FDI inflows to developing countries, 2005 . . . . . . . . . . . . . . . . . . . . . . . . . . . . . . . . . 2-22-3. M&A in India, by number of projects and value, 2000–06 . . . . . . . . . . . . . . . . . . . . 2-42-4. Map of India . . . . . . . . . . . . . . . . . . . . . . . . . . . . . . . . . . . . . . . . . . . . . . . . . . . . . . . . 2-8
vii
CONTENTS–ContinuedPage
Figures—Continued2-5. M&A in India, number of deals with known value, 2000–06 . . . . . . . . . . . . . . . . . . 2-122-6. Total reported greenfield FDI by selected countries, 2002–06 . . . . . . . . . . . . . . . . . . 2-132-7. Share of top investing countries, FDI equity flows . . . . . . . . . . . . . . . . . . . . . . . . . . 2-142-8. U.S. reported greenfield FDI projects in India, by cluster, 2002–06 . . . . . . . . . . . . . 2-162-9. Employment, MOFAs, India, 2000–04 . . . . . . . . . . . . . . . . . . . . . . . . . . . . . . . . . . . . 2-172-10. MOFA Assets, 2004 . . . . . . . . . . . . . . . . . . . . . . . . . . . . . . . . . . . . . . . . . . . . . . . . . . 2-182-11. EU share of FDI stock in India, 1991–2006 . . . . . . . . . . . . . . . . . . . . . . . . . . . . . . . . 2-192-12. FDI inflows, selected countries, 2000–06 . . . . . . . . . . . . . . . . . . . . . . . . . . . . . . . . . . 2-202-13. Cluster shares of total projects, annually, 2002–06 . . . . . . . . . . . . . . . . . . . . . . . . . . 2-242-14. Cluster shares of reported greenfield FDI in India, 2002 and 2006 . . . . . . . . . . . . . . 2-254-1. Application process for firms establishing a business unit within SEZ . . . . . . . . . . . 4-57-1. Indian car and light truck production, 2005 . . . . . . . . . . . . . . . . . . . . . . . . . . . . . . . . 7-27-2. Indian car and light truck market share, by company, 2005 . . . . . . . . . . . . . . . . . . . . 7-58-1. India’s top ten pharmaceutical firms by operating revenue, 2005 . . . . . . . . . . . . . . . 8-88-2. India’s FDI inflows, drugs and pharmaceuticals, 1994–2006 . . . . . . . . . . . . . . . . . . . 8-98-3. Drugs and pharmaceutical FDI by country, 2002–06 . . . . . . . . . . . . . . . . . . . . . . . . . 8-98-4. Greenfield FDI in India’s pharmaceutical industry by year, 2002–06 . . . . . . . . . . . . 8-108-5. Pharmaceutical M&A activity, 2002–06 . . . . . . . . . . . . . . . . . . . . . . . . . . . . . . . . . . 8-15

ix
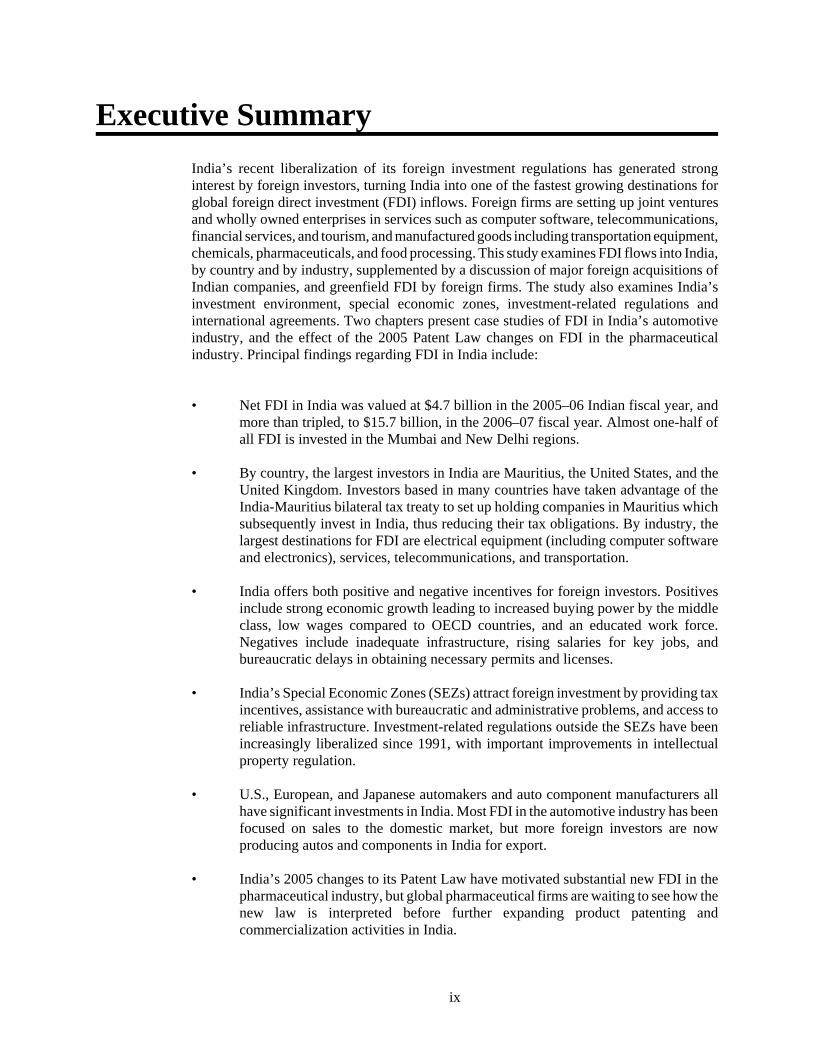
Executive SummaryIndia’s recent liberalization of its foreign investment regulations has generated stronginterest by foreign investors, turning India into one of the fastest growing destinations forglobal foreign direct investment (FDI) inflows. Foreign firms are setting up joint venturesand wholly owned enterprises in services such as computer software, telecommunications,financial services, and tourism, and manufactured goods including transportation equipment,chemicals, pharmaceuticals, and food processing. This study examines FDI flows into India,by country and by industry, supplemented by a discussion of major foreign acquisitions ofIndian companies, and greenfield FDI by foreign firms. The study also examines India’sinvestment environment, special economic zones, investment-related regulations andinternational agreements. Two chapters present case studies of FDI in India’s automotiveindustry, and the effect of the 2005 Patent Law changes on FDI in the pharmaceuticalindustry. Principal findings regarding FDI in India include:
• Net FDI in India was valued at $4.7 billion in the 2005–06 Indian fiscal year, and
more than tripled, to $15.7 billion, in the 2006–07 fiscal year. Almost one-half ofall FDI is invested in the Mumbai and New Delhi regions.
• By country, the largest investors in India are Mauritius, the United States, and theUnited Kingdom. Investors based in many countries have taken advantage of theIndia-Mauritius bilateral tax treaty to set up holding companies in Mauritius whichsubsequently invest in India, thus reducing their tax obligations. By industry, thelargest destinations for FDI are electrical equipment (including computer softwareand electronics), services, telecommunications, and transportation.
• India offers both positive and negative incentives for foreign investors. Positivesinclude strong economic growth leading to increased buying power by the middleclass, low wages compared to OECD countries, and an educated work force.Negatives include inadequate infrastructure, rising salaries for key jobs, andbureaucratic delays in obtaining necessary permits and licenses.
• India’s Special Economic Zones (SEZs) attract foreign investment by providing taxincentives, assistance with bureaucratic and administrative problems, and access toreliable infrastructure. Investment-related regulations outside the SEZs have beenincreasingly liberalized since 1991, with important improvements in intellectualproperty regulation.
• U.S., European, and Japanese automakers and auto component manufacturers allhave significant investments in India. Most FDI in the automotive industry has beenfocused on sales to the domestic market, but more foreign investors are nowproducing autos and components in India for export.
• India’s 2005 changes to its Patent Law have motivated substantial new FDI in thepharmaceutical industry, but global pharmaceutical firms are waiting to see how thenew law is interpreted before further expanding product patenting andcommercialization activities in India.

1 Most official Indian statistics are presented on a fiscal year basis. India’s fiscal year runs from April 1st
through March 31st. According to the standard IMF definitions, FDI is defined as investment equal to orgreater than a 10 percent equity share in a single firm. By contrast, portfolio investment (the remaining$12.5 billion) is defined as acquisition of an equity stake of less than 10 percent. FDI data represent inflowsnet of outflows. 2 Government of India, Ministry of Commerce & Industry, Economic Survey 2006–2007, 127–28; andFinancial Times, “FDI in India Expected to Double.” 3 Government of India, Ministry of Commerce & Industry, “Fact Sheet on Foreign Direct Investment.”
1-1
CHAPTER 1IntroductionPurpose and Scope
India is the second largest country in the world, with a population of over 1 billion people.As a developing country, India’s economy is characterized by wage rates that aresignificantly lower than those in most developed countries. These two traits combine to makeIndia a natural destination for foreign direct investment (FDI). Until recently, however, Indiahas attracted only a small share of global FDI, primarily due to government restrictions onforeign involvement in the economy. But beginning in 1991 and accelerating rapidly since2000, India has liberalized its investment regulations and actively encouraged new foreigninvestment, a sharp reversal from decades of discouraging economic integration with theglobal economy.
Global investors have responded with enthusiasm. Total net foreign investment inflows were$17.2 billion in 2005–06, of which net FDI was valued at $4.7 billion in 2005–06.1 Net FDIinflows for the 2006–07 fiscal year weremore than tripled to $15.7 billion.2 India receivedcumulative net FDI inflows of $48.2 billion between August 1991 and December 2006.3
The remainder of this chapter gives an overview of FDI activity in India, particularly in theservice sector (the largest target for FDI in India to date), and discusses the data used in thestudy. The study then closely examines trends related to FDI in India, including the principalcountry sources and industry destinations of this capital, and the regional destinations of FDIwithin the country. We also look at major multinational corporations invested in India today,and the role of U.S. investors. The study goes on to examine India’s economic climate forFDI, its regulatory environment, the incentives available to foreign investors through SpecialEconomic Zones (SEZs), and the effect of India’s international economic agreements oninbound FDI trends. We present two case studies of industries that hold special interest forforeign investors. The first examines FDI in India’s passenger vehicle and componentsindustry, illustrating global investors’ active involvement in India’s manufacturing sector.The second analyzes the effects of India’s 2005 Patent Law on FDI in the Indianpharmaceuticals industry.
4 Under the treaty, foreign investors are able to invest in holding companies in Mauritius which then sellshares in India, but pay taxes in Mauritius. Since Mauritius has no capital gains tax, the companies have nocapital gains tax obligations. EIU, “Country Report India.” (See chapter 6). 5 Government of India, Ministry of Commerce & Industry, “Fact Sheet on Foreign Direct Investment fromAugust 1991 to December 2006.” 6 FDI approvals data measure the intentions of foreign firms to invest in India. However, many firmsnever actually proceed with investment projects that have received approval, so approvals data do notindicate actual FDI trends. 7 The sectors are defined by India’s Ministry of Commerce & Industry, and do not match U.S.Government statistical classifications. Government of India, Ministry of Commerce & Industry, Departmentof Commerce, Annual Report 2005–2006, 88. 8 U.S. Department of State, “Congress Passes U.S.-India Civilian Nuclear Cooperation Bill”; and U.S.Department of State, “President Bush Signs U.S.-India Civil Nuclear Agreement.” 9 Gutierrez and Sampson, Remarks at the 5th Summit.
1-2
Overview of FDI Activity in India
Country Sources of FDI
Foreign investors have begun to take a more active role in the Indian economy in recentyears. By country, the largest direct investor in India is Mauritius, largely because of theIndia-Mauritius double-taxation treaty.4 Firms based in Mauritius invested $16.0 billion inIndia between 1991 and 2006, equal to 39 percent of total FDI inflows. The second largestinvestor in India is the United States, with total capital flows of $5.6 billion during the1991–2006 period, followed by the United Kingdom, the Netherlands, and Japan.5 Between1991 and 2005, the United States ranked first in terms of total FDI approvals, whichamounted to $67.8 billion (24 percent of total FDI approvals).6 The largest shares of U.S.investment are directed to the fuels, telecommunications, electrical equipment, foodprocessing, and services sectors.7
The warming of the political and economic relationship between the United States and Indiais likely to further encourage U.S. investment there. An important example of the closerrelationship is the U.S.-India Civil Nuclear Cooperation Initiative, passed into U.S. law inDecember 2006.8 The United States has also reduced the use of export controls on exportsto India. As of February 2007, only 1 percent of U.S. exports to India required a license,down from 24 percent in 1999 and 90 percent in previous years. In recognition of theimproved relationship, the U.S. Department of Commerce is in the process of establishingits new “Trusted Customer” program, set to begin in 2007 with India as the first partnercountry. The program is expected to encourage repeat exports of U.S. goods to India.9 Thiswill promote additional FDI by U.S. firms in India, as the Trusted Customer program willmake it easier for U.S.-based multinational corporations (MNCs) to ship goods to theiraffiliates in India for manufacturing or additional processing.
FDI in India’s Service Sector
The service sector has been the primary destination of FDI in India since 1991. As identifiedby India’s Ministry of Commerce & Industry, the service sector accounted for 17 percent oftotal FDI inflows to India between August 1991 and December 2006. Another 17 percent ofFDI inflows is invested in the telecommunications and transportation industries, which
10 An additional 17 percent of FDI is invested in electrical equipment, including computer software andelectronics. It is not clear whether some offshore services FDI is included in the electrical equipment sector.Government of India, Ministry of Commerce & Industry, “Fact Sheet on Foreign Direct Investment.” 11 Offshoring refers to the process whereby a company based in one country outsources certain functionsto an affiliate or domestic company in another country. BPO includes information technology-enabledservices such as insurance claims processing, and other types of back office processing. 12 McKinsey & Co., McKinsey Global Institute, New Horizons, 499. 13 See, e.g., PriceWaterhouseCoopers, “Offshoring in the Financial Services Industry.” 14 McKinsey & Co., McKinsey Global Institute, New Horizons, 501. 15 Barnes, Remarks at the 5th Summit; and Bonasia,“Indian Outsourcers Scramble to Meet Need.” 16 Bonasia,“Indian Outsourcers Scramble to Meet Need.” 17 Government of India, Ministry of Commerce & Industry, “Fact Sheet on Foreign Direct Investment.” 18 Bureau van Dijk, Zephyr Mergers and Acquisitions database.
1-3
generally involve both equipment and services.10 From the mid-1990s, India has been animportant destination for investment in offshoring services such as software, call centers, andother business process outsourcing (BPO).11 According to one recent estimate, India’sinformation technology (IT) offshoring market will be valued in excess of $200 billion by2008, with more than one-fourth of the world IT offshoring market centered in India.Revenue from offshore services is predicted to equal 7 percent of India’s GDP by 2008, andaccount for one-third of foreign exchange flows into the country.12 This flow of capital relieson India’s well-educated, English-speaking, and relatively low-paid workers.13 India hasoffered substantial incentives to attract FDI in IT and BPO-related services offshoring, upto an estimated $6,000 per full-time equivalent worker (FTE) in the IT services area, and$2,000 per FTE in the BPO area.14
According to some reports, however, increasing competition is making it more difficult forIndian firms to attract and keep BPO employees with the necessary skills, leading toincreasing wages. IBM, for example, increased its Indian staff by 36 percent in 2006, to53,000 workers, and has plans to invest a further $6 billion in India over the next 3 years,for an expected total of 120,000 employees in the country by 2008.15 Hiring difficulties areamong the factors that have encouraged some India-based BPO firms to engage in outboundFDI by establishing facilities outside of India. Infosys Technologies, for instance, reportedlyhas plans to employ 6,000 workers in China, and Satyam Computer Services has 500 peoplebased in China, with more to come, along with 2,500 workers each in Malaysia, Egypt, andSaudi Arabia.16
Most Indian industries have been fully opened to FDI, with foreigners permitted to own upto 100 percent of equity in Indian companies. However, India continues to limit FDI in anumber of industries by enforcing overall caps on total foreign-owned equity shares, withthe caps changing as India’s liberalization process continues. Permitted equity limits forforeign investors vary for different industries. The level of FDI activity following eachchange in regulations testifies to foreign investors’ interest in the Indian market, particularlyin key service sectors. Equity limits for foreign investment in most types oftelecommunications companies were raised from 49 percent to 74 percent in November2005, resulting in a wave of new FDI primarily focused on India’s cellulartelecommunications industry. Cumulative FDI inflows in telecommunications from August1991 to December 2006 were $3.9 billion, and annual inflows jumped from $588 million in2004–05 to $3.0 billion in 2005–06.17 The value of reported mergers and acquisitions(M&A) in telecommunications rose from $105 million in 2003 to $1.2 billion in 2004,$4.1 billion in 2006, and $11.4 billion in just the first 3 months of 2007, primarily on thestrength of Vodafone Group’s $11.1 billion acquisition of Hutchison Essar Telecom, whichwas approved in April 2007.18
19 Press Trust of India, “Morgan Stanley, Citigroup, Actis Pick Up 6 pc Stake in NSE.” 20 Government of India, Ministry of Commerce & Industry, Economic Survey 2006–2007, 154; and EIU,“Country Commerce India - Main report: November 20, 2006.” 21 Business Monitor Food & Drink Insight, “Bharti Confirms Wal-Mart Plans.” 22 Major international insurance firms investing in the Indian market include Chubb, New York Life, AIG,Metlife (all based in the United States); Old Mutual, Standard Life, and Royal & Sun Alliance (UnitedKingdom); ING (Netherlands); Allianz (Germany); Tokio General and Mitsui Sumitomo (Japan); and AMP(Australia). Indian Insurance Regulatory and Development Authority Web site. 23 The list includes ICICI Prudential Life, AMP Sanmar Life, Metlife India, IFFCO-Tokio General,Cholmandalam General, and Tata AIG Life. Bureau van Dijk, Zephyr Mergers and Acquisitions database. 24 Most countries, including the United States, report FDI data on a calendar year basis. India reports FDIdata on a fiscal year basis, with the fiscal year beginning April 1st.
1-4
India’s stock exchanges have also been recently opened to foreign investment, with a26 percent foreign equity cap, limited to 5 percent for any single foreign investor. Foreigninvestors reached the 26 percent cap in the National Stock Exchange of India in March 2007.As of the same date, the Singapore Exchange and Deutsche Borse each controlled 5 percentof the Bombay Stock Exchange.19
Other industries which maintain significant barriers to FDI include the insurance sector andnewspaper publishing, where foreign equity is limited to 26 percent, and the retail sector,where foreign firms are permitted to invest up to 51 percent equity, but only in single-branddistribution outlets.20 Foreign investors have also expressed interest in investing in thesesectors, as India’s government debates whether to lift the limits. In the retail sector, Wal-Mart announced a joint venture with India-based Bharti in November 2006, under whichBharti would invest $2.5 billion in a new chain of retail stores that would be 100 percentowned by the Indian firm. Wal-Mart would provide logistics and wholesale supply servicesthrough a 50:50 joint venture with Bharti. The deal is widely seen as a way for Wal-Mart toenter the growing Indian retail market despite the FDI restrictions.21
In the insurance industry, foreign investment was first permitted in 2000, with the lifting ofthe Indian state-owned insurance company’s monopoly, allowing competition from bothdomestic and foreign-owned private firms. During the 2000–01 fiscal year, 16 privatelyowned firms entered the Indian market, most as 26 percent joint ventures between globallycompetitive foreign insurers and Indian firms.22 Amid expectations that the governmentwould raise the foreign equity limit to 49 percent, at least six insurance joint venturesconcluded agreements that would allow the foreign partner to raise its share to that level oncegovernment regulations have changed, but as of April 2007, the equity limit for foreigninsurance investors remains at 26 percent.23
DataThe data for this study were drawn from a variety of sources. Data for FDI stocks and flowsinto India come primarily from official Indian government sources, and reflect actual FDIfrom cross-border equity flows, where available. These data are supplemented by U.S. datawhere additional detail on U.S.-India FDI flows is required. Official data are compiled ona balance of payments (BOP) basis, and reflects the amount of capital that crosses bordersduring a given calendar or fiscal year.24 These data are the most comprehensive available,but they specifically exclude details on individual company transactions to safeguard theconfidentiality of the reporting companies. Unless otherwise specified, data are presentedfor the 5 year time period from 2002 through 2006.

25 The databases are Zephyr, a mergers and acquisitions (M&A) database published by Bureau van Dijk,and LocoMonitor, a greenfield FDI database published by OCO Consulting Ltd.
1-5
To supplement the official equity flows data, the study uses information from separatecommercial databases reflecting M&A and greenfield FDI,25 and occasionally uses Indiangovernment data on FDI approvals. These data lend additional insight into the industry andcountry sources of FDI into India. The databases are compiled from press reports. Thus,while they cover the majority of M&A or greenfield FDI transactions, it is not possible tobe sure that data on all transactions have been included, or that transactions have not beenincluded more than once. In particular, many reported transactions do not include data forthe value of the transaction. In addition, data compiled from the databases are not directlycomparable to the official FDI data. Reported transaction values in the databases do notaccount for how much of the capital is transferred in a given calendar year or fiscal year, orfor noncash transactions such as equity swaps that may not appear in official BOP statistics.For these reasons, data compiled from these databases should be considered illustrative,rather than comprehensive. Similarly, FDI approvals are only an indicator of companies’intentions. Many approved projects are never realized, or are significantly modified betweenapproval and implementation.
Information is also drawn from publicly available reports from international financialinstitutions, country governments, commercial sources, press reports, and interviews withindustry representatives.

1 The Statesman (India), “India attracts $15b FDI During 2006–07. 2 UNCTAD, World Investment Report 2006. UNCTAD data are based on official Indian governmentstatistics, but are adjusted to provide calendar year totals and prepared according to international practices,which makes the data comparable to international FDI statistics. The majority of data in this chapter is takenfrom Government of India statistical publications, which report on a fiscal year basis, and are not preparedaccording to international practices (see fn. 4). India’s fiscal year runs from April 1 to March 31. 3 Government of India, Ministry of Commerce & Industry, Department of Industrial Policy andPromotion. Fact sheet on Foreign Direct Investment. 4 Includes new equity capital flows only. According to international standards, FDI flows include newequity capital flows, reinvested earnings, and intra-company loans. Most Indian FDI statistics reflect equitycapital flows only. According to Kamal Nath, India’s Minister of Commerce and Industry, FDI inflowsincluding reinvested earnings totaled $18 billion during the 2006–07 fiscal year. The Statesman (India),“India attracts $15b FDI During 2006–07.” 5 Government of India, Fact Sheet on Foreign Direct Investment (FDI) from August 1991 to March 2007. 6 UNCTAD, “Foreign Direct Investment Rose by 34% in 2006.”
2-1
CHAPTER 2FDI in IndiaOverview of FDI Flows
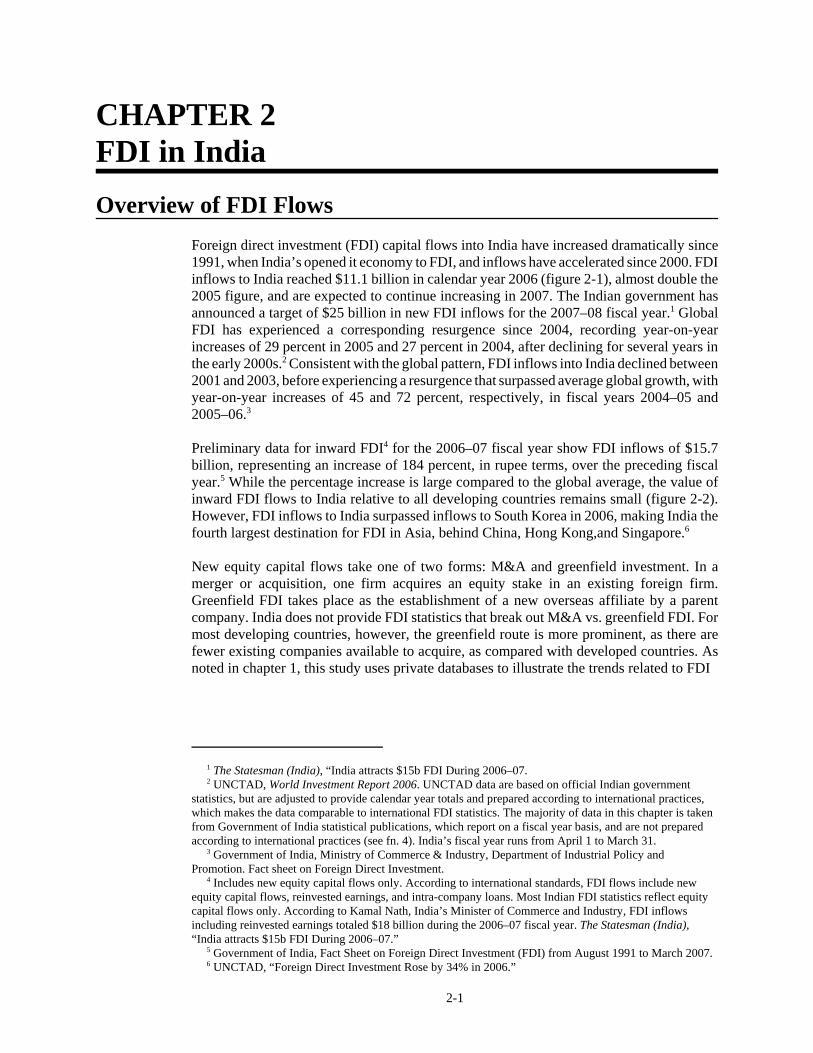
Foreign direct investment (FDI) capital flows into India have increased dramatically since1991, when India’s opened it economy to FDI, and inflows have accelerated since 2000. FDIinflows to India reached $11.1 billion in calendar year 2006 (figure 2-1), almost double the2005 figure, and are expected to continue increasing in 2007. The Indian government hasannounced a target of $25 billion in new FDI inflows for the 2007–08 fiscal year.1 GlobalFDI has experienced a corresponding resurgence since 2004, recording year-on-yearincreases of 29 percent in 2005 and 27 percent in 2004, after declining for several years inthe early 2000s.2 Consistent with the global pattern, FDI inflows into India declined between2001 and 2003, before experiencing a resurgence that surpassed average global growth, withyear-on-year increases of 45 and 72 percent, respectively, in fiscal years 2004–05 and2005–06.3
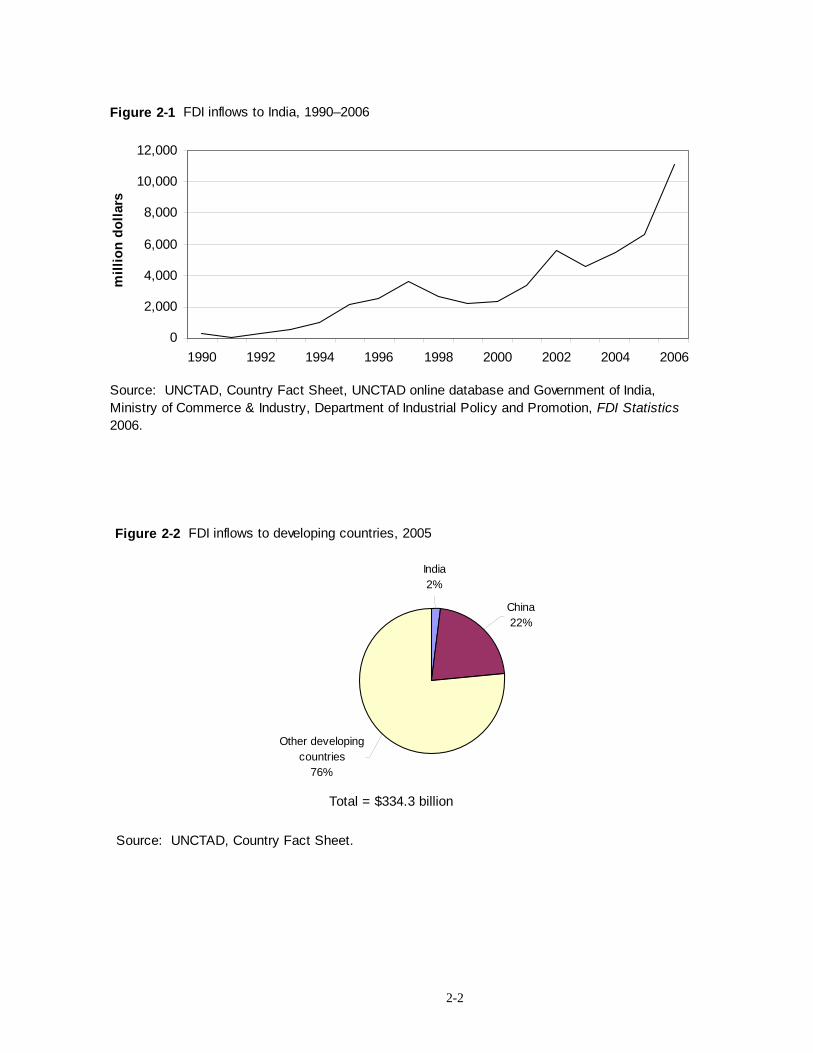
Preliminary data for inward FDI4 for the 2006–07 fiscal year show FDI inflows of $15.7billion, representing an increase of 184 percent, in rupee terms, over the preceding fiscalyear.5 While the percentage increase is large compared to the global average, the value ofinward FDI flows to India relative to all developing countries remains small (figure 2-2).However, FDI inflows to India surpassed inflows to South Korea in 2006, making India thefourth largest destination for FDI in Asia, behind China, Hong Kong,and Singapore.6
New equity capital flows take one of two forms: M&A and greenfield investment. In amerger or acquisition, one firm acquires an equity stake in an existing foreign firm.Greenfield FDI takes place as the establishment of a new overseas affiliate by a parentcompany. India does not provide FDI statistics that break out M&A vs. greenfield FDI. Formost developing countries, however, the greenfield route is more prominent, as there arefewer existing companies available to acquire, as compared with developed countries. Asnoted in chapter 1, this study uses private databases to illustrate the trends related to FDI
2-2
0
2,000
4,000
6,000
8,000
10,000
12,000
1990 1992 1994 1996 1998 2000 2002 2004 2006
mill
ion
dolla
rsFigure 2-1 FDI inflows to India, 1990–2006
Source: UNCTAD, Country Fact Sheet, UNCTAD online database and Government of India, Ministry of Commerce & Industry, Department of Industrial Policy and Promotion, FDI Statistics 2006.
China22%
India2%
Other developing countries
76%
Figure 2-2 FDI inflows to developing countries, 2005
Source: UNCTAD, Country Fact Sheet.
Total = $334.3 billion
7 OCO Consulting Ltd., LocoMonitor FDI database; and Bureau van Dijk, Zephyr Mergers andAquisitions database. 8 Excludes deals that have been announced but not completed, or deals that are awaiting regulatoryapproval as of March 2007. 9 Approximately one-half of transactions do not have reported values.
2-3
through both routes, but data obtained from those databases is not consistent with officialFDI inflows data. In fact, the figures reported for total investment through greenfield FDIand M&A investment are considerably larger than the values for total FDI inflows reportedby the government of India for FDI through the two routes combined. For greenfield FDI,OCO Consulting reports a total of $55.5 billion invested in India in 2006, while Bureau vanDijk reports M&A transactions of $2.8 billion.7 Together, these are far above India’s totalreported FDI inflows of $11.1 billion.
There are several possible reasons for the disparities in these data. First, the greenfieldprojects listed are approved or announced by companies, but some of them are neverrealized. Second, many greenfield and M&A projects take more than one year to complete.Official FDI statistics include only the actual amount of capital invested in each year, ratherthan the project total. Finally, many of the projects listed in the commercial databases are notfully funded by the overseas investor. For joint ventures between Indian and foreign firms,for example, the databases list the entire value of the project, even if a share of the capitalcomes from an Indian entity and would thus not be included as FDI inflows. The official FDIfigures contain only the amount of capital invested from abroad, while the greenfield andM&A data include the total value of the project.
Mergers and Acquisitions
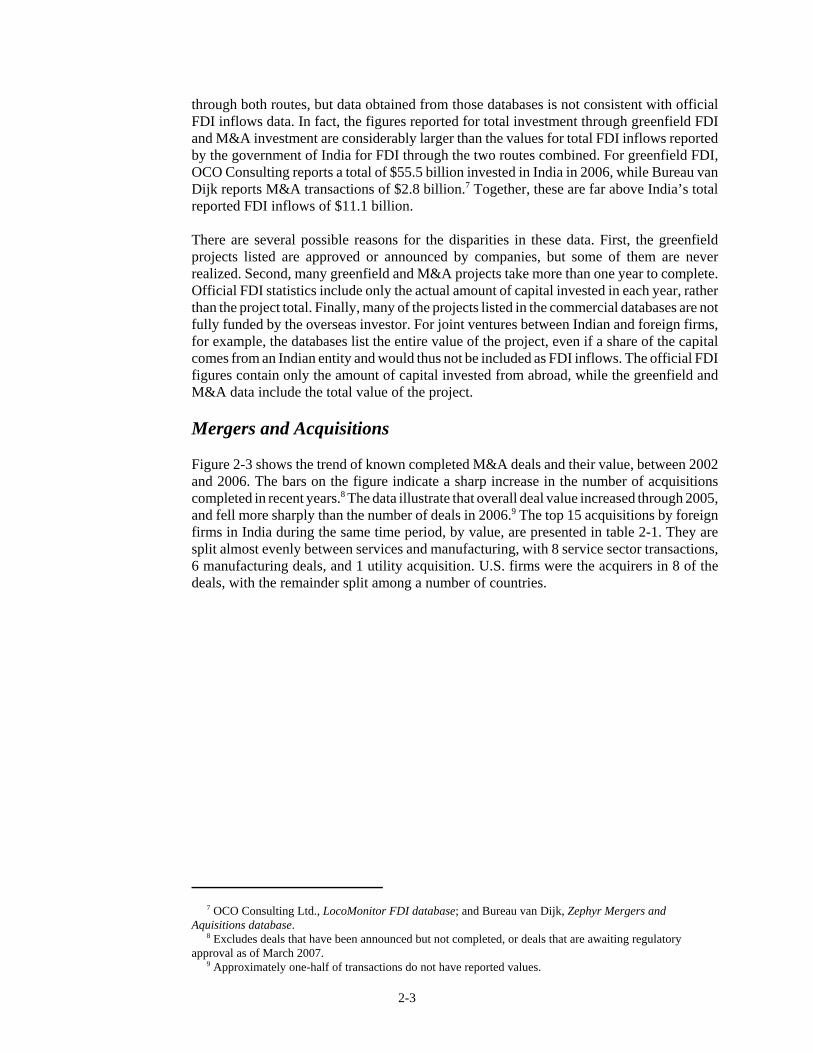
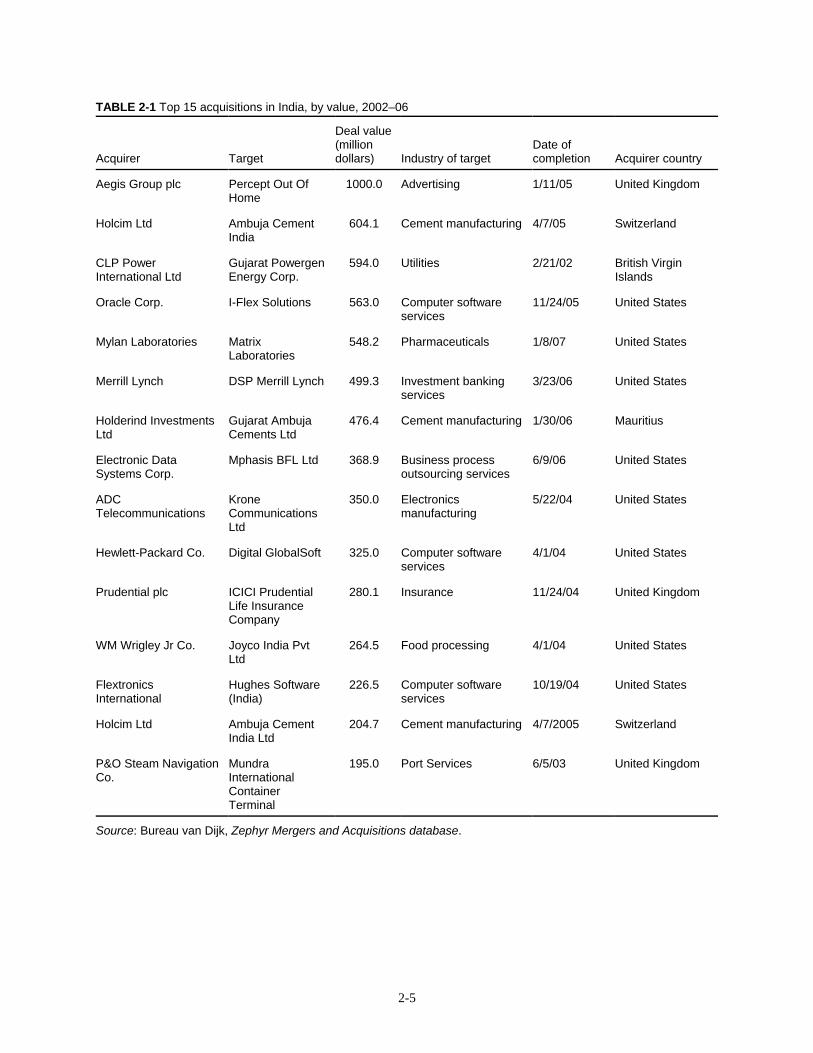
Figure 2-3 shows the trend of known completed M&A deals and their value, between 2002and 2006. The bars on the figure indicate a sharp increase in the number of acquisitionscompleted in recent years.8 The data illustrate that overall deal value increased through 2005,and fell more sharply than the number of deals in 2006.9 The top 15 acquisitions by foreignfirms in India during the same time period, by value, are presented in table 2-1. They aresplit almost evenly between services and manufacturing, with 8 service sector transactions,6 manufacturing deals, and 1 utility acquisition. U.S. firms were the acquirers in 8 of thedeals, with the remainder split among a number of countries.

2-4
0
20
40
60
80
100
120
140
2002 2003 2004 2005 2006
Num
ber o
f dea
ls
0
1,000
2,000
3,000
4,000
5,000
6,000
Mill
ion
dolla
rs
No. deals Total value
Figure 2-3 M&A in India, by number of projects and value, 2000–06
Source: Bureau van Dijk, Zephyr Mergers and Acquistions database .
2-5
TABLE 2-1 Top 15 acquisitions in India, by value, 2002–06
Acquirer Target
Deal value(milliondollars) Industry of target
Date ofcompletion Acquirer country
Aegis Group plc Percept Out OfHome
1000.0 Advertising 1/11/05 United Kingdom
Holcim Ltd Ambuja CementIndia
604.1 Cement manufacturing 4/7/05 Switzerland
CLP PowerInternational Ltd
Gujarat PowergenEnergy Corp.
594.0 Utilities 2/21/02 British VirginIslands
Oracle Corp. I-Flex Solutions 563.0 Computer softwareservices
11/24/05 United States
Mylan Laboratories MatrixLaboratories
548.2 Pharmaceuticals 1/8/07 United States
Merrill Lynch DSP Merrill Lynch 499.3 Investment bankingservices
3/23/06 United States
Holderind InvestmentsLtd
Gujarat AmbujaCements Ltd
476.4 Cement manufacturing 1/30/06 Mauritius
Electronic DataSystems Corp.
Mphasis BFL Ltd 368.9 Business processoutsourcing services
6/9/06 United States
ADCTelecommunications
KroneCommunicationsLtd
350.0 Electronicsmanufacturing
5/22/04 United States
Hewlett-Packard Co. Digital GlobalSoft 325.0 Computer softwareservices
4/1/04 United States
Prudential plc ICICI PrudentialLife InsuranceCompany
280.1 Insurance 11/24/04 United Kingdom
WM Wrigley Jr Co. Joyco India PvtLtd
264.5 Food processing 4/1/04 United States
FlextronicsInternational
Hughes Software(India)
226.5 Computer softwareservices
10/19/04 United States
Holcim Ltd Ambuja CementIndia Ltd
204.7 Cement manufacturing 4/7/2005 Switzerland
P&O Steam NavigationCo.
MundraInternationalContainerTerminal
195.0 Port Services 6/5/03 United Kingdom
Source: Bureau van Dijk, Zephyr Mergers and Acquisitions database.
10 OCO Consulting Ltd., LocoMonitor FDI database. 11 Industry designations for greenfield FDI data are determined by OCO Consulting, and do notnecessarily reflect the industry classifications used either by the U.S. or the Indian governments. Heavyindustry includes energy, manufacturing of machinery and industrial goods, metals, and mining. 12 Includes hotels, restaurants, and real estate. 13 Includes business machines and equipment, consumer electronics, electronic components, andsemiconductors. 14 LocoMonitor data by country do not match official Indian government statistics, which show almost 40percent of incoming FDI originating in Mauritius. Government of India, Ministry of Commerce & Industry,Department of Industrial Policy & Promotion, Foreign Direct Investment Statistics. Although the funding formany FDI projects may come through offshore holding companies in Mauritius in order to maximize taxbenefits, an analysis based on the investing company’s home office is likely more revealing. 15 OCO Consulting Ltd., LocoMonitor FDI database. 16 India is divided into 28 states, six union territories (UTs) and 1 national capital territory. States havetheir own government, whereas UTs are administered by the central government. However, Puducherry, aUT, has its own elected government. The National Capital Territory of Delhi is a special region that has itsown elected government and retains a status that is a hybrid between a state and a union territory.
2-6
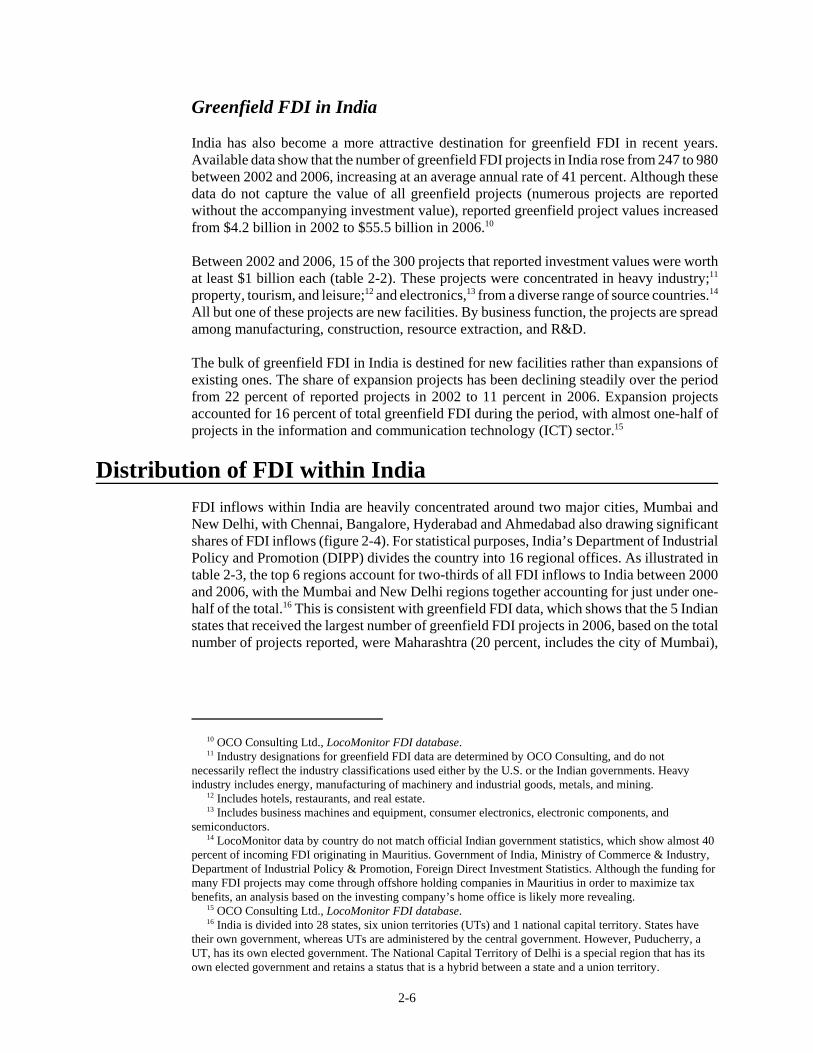
Greenfield FDI in India
India has also become a more attractive destination for greenfield FDI in recent years.Available data show that the number of greenfield FDI projects in India rose from 247 to 980between 2002 and 2006, increasing at an average annual rate of 41 percent. Although thesedata do not capture the value of all greenfield projects (numerous projects are reportedwithout the accompanying investment value), reported greenfield project values increasedfrom $4.2 billion in 2002 to $55.5 billion in 2006.10
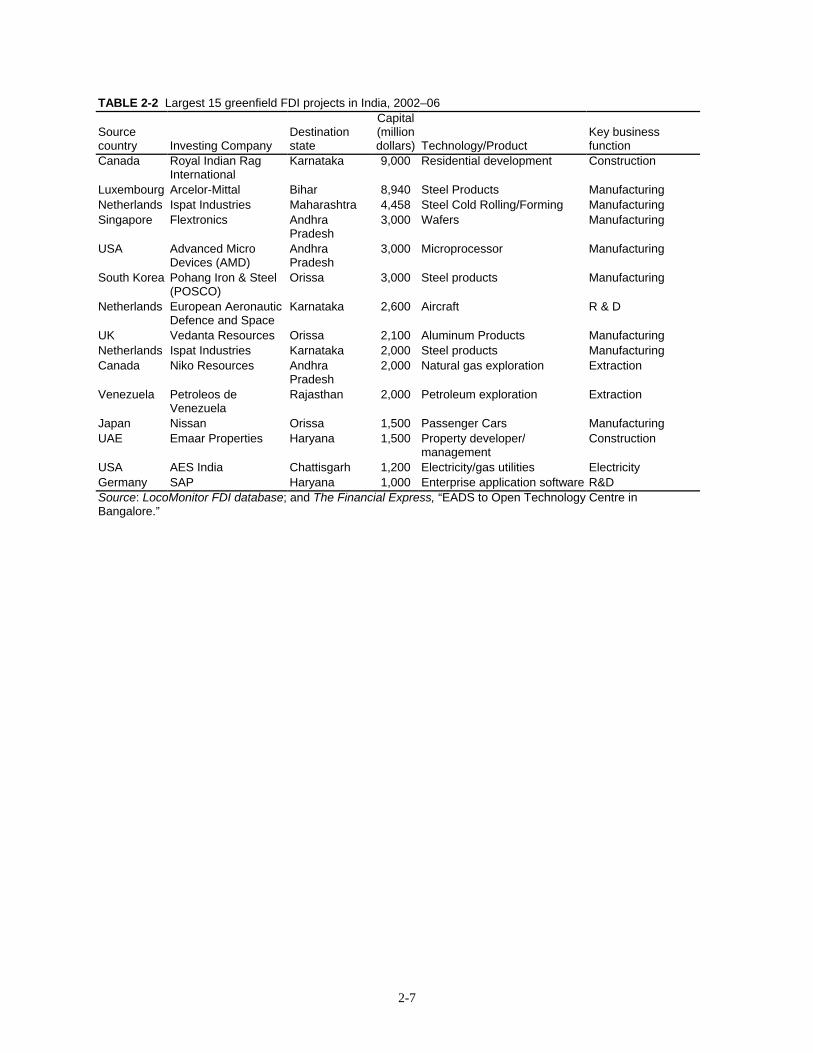
Between 2002 and 2006, 15 of the 300 projects that reported investment values were worthat least $1 billion each (table 2-2). These projects were concentrated in heavy industry;11
property, tourism, and leisure;12 and electronics,13 from a diverse range of source countries.14
All but one of these projects are new facilities. By business function, the projects are spreadamong manufacturing, construction, resource extraction, and R&D.
The bulk of greenfield FDI in India is destined for new facilities rather than expansions ofexisting ones. The share of expansion projects has been declining steadily over the periodfrom 22 percent of reported projects in 2002 to 11 percent in 2006. Expansion projectsaccounted for 16 percent of total greenfield FDI during the period, with almost one-half ofprojects in the information and communication technology (ICT) sector.15
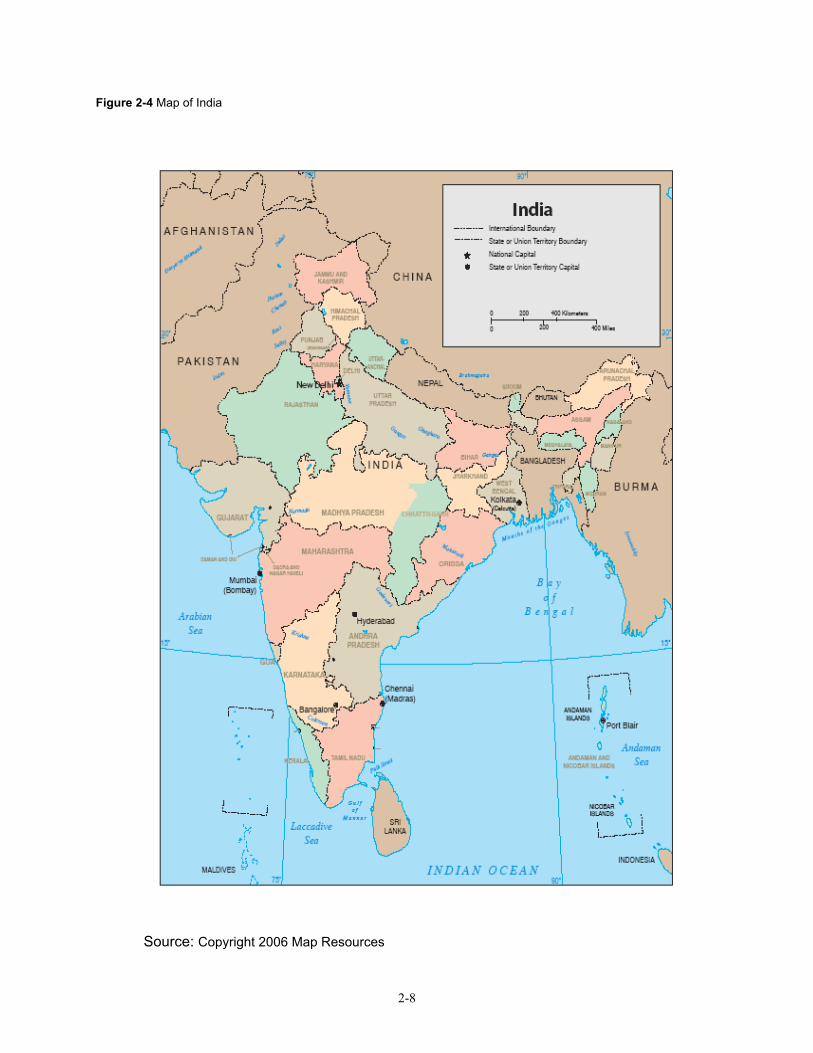
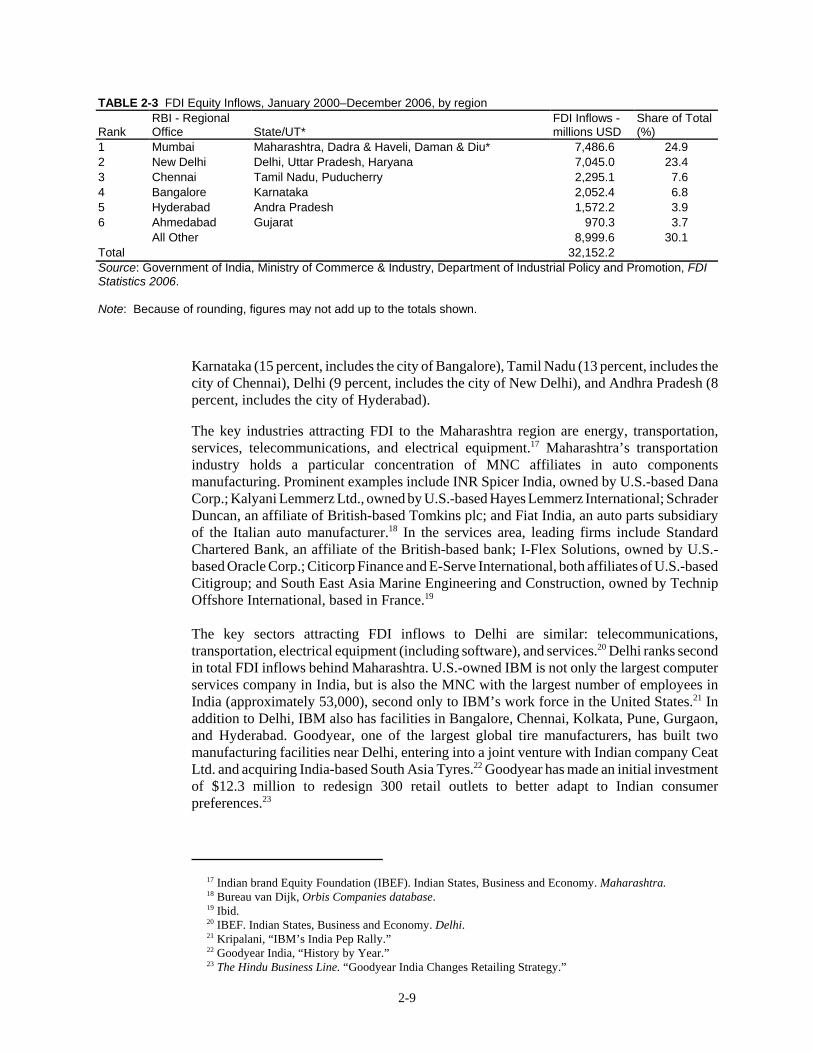
Distribution of FDI within IndiaFDI inflows within India are heavily concentrated around two major cities, Mumbai andNew Delhi, with Chennai, Bangalore, Hyderabad and Ahmedabad also drawing significantshares of FDI inflows (figure 2-4). For statistical purposes, India’s Department of IndustrialPolicy and Promotion (DIPP) divides the country into 16 regional offices. As illustrated intable 2-3, the top 6 regions account for two-thirds of all FDI inflows to India between 2000and 2006, with the Mumbai and New Delhi regions together accounting for just under one-half of the total.16 This is consistent with greenfield FDI data, which shows that the 5 Indianstates that received the largest number of greenfield FDI projects in 2006, based on the totalnumber of projects reported, were Maharashtra (20 percent, includes the city of Mumbai),
2-7
TABLE 2-2 Largest 15 greenfield FDI projects in India, 2002–06
Sourcecountry Investing Company
Destinationstate
Capital(milliondollars) Technology/Product
Key businessfunction
Canada Royal Indian RagInternational
Karnataka 9,000 Residential development Construction
Luxembourg Arcelor-Mittal Bihar 8,940 Steel Products ManufacturingNetherlands Ispat Industries Maharashtra 4,458 Steel Cold Rolling/Forming ManufacturingSingapore Flextronics Andhra
Pradesh3,000 Wafers Manufacturing
USA Advanced MicroDevices (AMD)
AndhraPradesh
3,000 Microprocessor Manufacturing
South Korea Pohang Iron & Steel(POSCO)
Orissa 3,000 Steel products Manufacturing
Netherlands European AeronauticDefence and Space
Karnataka 2,600 Aircraft R & D
UK Vedanta Resources Orissa 2,100 Aluminum Products ManufacturingNetherlands Ispat Industries Karnataka 2,000 Steel products ManufacturingCanada Niko Resources Andhra
Pradesh2,000 Natural gas exploration Extraction
Venezuela Petroleos deVenezuela
Rajasthan 2,000 Petroleum exploration Extraction
Japan Nissan Orissa 1,500 Passenger Cars ManufacturingUAE Emaar Properties Haryana 1,500 Property developer/
managementConstruction
USA AES India Chattisgarh 1,200 Electricity/gas utilities ElectricityGermany SAP Haryana 1,000 Enterprise application software R&DSource: LocoMonitor FDI database; and The Financial Express, “EADS to Open Technology Centre inBangalore.”
2-8
Figure 2-4 Map of India
Source: Copyright 2006 Map Resources
17 Indian brand Equity Foundation (IBEF). Indian States, Business and Economy. Maharashtra. 18 Bureau van Dijk, Orbis Companies database. 19 Ibid. 20 IBEF. Indian States, Business and Economy. Delhi. 21 Kripalani, “IBM’s India Pep Rally.” 22 Goodyear India, “History by Year.” 23 The Hindu Business Line. “Goodyear India Changes Retailing Strategy.”
2-9
TABLE 2-3 FDI Equity Inflows, January 2000–December 2006, by region
RankRBI - RegionalOffice State/UT*
FDI Inflows -millions USD
Share of Total(%)
1 Mumbai Maharashtra, Dadra & Haveli, Daman & Diu* 7,486.6 24.92 New Delhi Delhi, Uttar Pradesh, Haryana 7,045.0 23.43 Chennai Tamil Nadu, Puducherry 2,295.1 7.64 Bangalore Karnataka 2,052.4 6.85 Hyderabad Andra Pradesh 1,572.2 3.96 Ahmedabad Gujarat 970.3 3.7
All Other 8,999.6 30.1Total 32,152.2Source: Government of India, Ministry of Commerce & Industry, Department of Industrial Policy and Promotion, FDIStatistics 2006.
Note: Because of rounding, figures may not add up to the totals shown.
Karnataka (15 percent, includes the city of Bangalore), Tamil Nadu (13 percent, includes thecity of Chennai), Delhi (9 percent, includes the city of New Delhi), and Andhra Pradesh (8percent, includes the city of Hyderabad).
The key industries attracting FDI to the Maharashtra region are energy, transportation,services, telecommunications, and electrical equipment.17 Maharashtra’s transportationindustry holds a particular concentration of MNC affiliates in auto componentsmanufacturing. Prominent examples include INR Spicer India, owned by U.S.-based DanaCorp.; Kalyani Lemmerz Ltd., owned by U.S.-based Hayes Lemmerz International; SchraderDuncan, an affiliate of British-based Tomkins plc; and Fiat India, an auto parts subsidiaryof the Italian auto manufacturer.18 In the services area, leading firms include StandardChartered Bank, an affiliate of the British-based bank; I-Flex Solutions, owned by U.S.-based Oracle Corp.; Citicorp Finance and E-Serve International, both affiliates of U.S.-basedCitigroup; and South East Asia Marine Engineering and Construction, owned by TechnipOffshore International, based in France.19
The key sectors attracting FDI inflows to Delhi are similar: telecommunications,transportation, electrical equipment (including software), and services.20 Delhi ranks secondin total FDI inflows behind Maharashtra. U.S.-owned IBM is not only the largest computerservices company in India, but is also the MNC with the largest number of employees inIndia (approximately 53,000), second only to IBM’s work force in the United States.21 Inaddition to Delhi, IBM also has facilities in Bangalore, Chennai, Kolkata, Pune, Gurgaon,and Hyderabad. Goodyear, one of the largest global tire manufacturers, has built twomanufacturing facilities near Delhi, entering into a joint venture with Indian company CeatLtd. and acquiring India-based South Asia Tyres.22 Goodyear has made an initial investmentof $12.3 million to redesign 300 retail outlets to better adapt to Indian consumerpreferences.23
24 IBEF. Indian States, Business and Economy. Uttar Pradesh. 25 Ibid., Haryana. 26 See chapter 7 for a discussion of FDI in the passenger cars and automotive components industry. 27 IBEF. Indian States, Economy and Business. Tamil Nadu. 28 OCO Consulting Ltd., LocoMonitor FDI database; and Agence France-Presse English Wire, “India'sSteel Production Set to Triple by 2015 As Demand Booms.” 29 Press Trust of India, “Orissa to Pursue POSCO Project with 'Humane' Face”; and Press Trust of India,“VP Writes to PM on POSCO Issue. 30 OCO Consulting Ltd., LocoMonitor FDI database. 31 Representative of Arcelor-Mittal, telephone interview by Commission staff, April 20, 2007.
2-10
The states of Uttar Pradesh and Haryana are also contained in the New Delhi region, asidentified by India’s statistical agencies. The geographic proximity of both states to NewDelhi helps them to attract FDI. Due to its abundance of natural resources, Uttar Pradeshattracts FDI in chemicals, pharmaceuticals, and mining and minerals.24 Haryana attracts FDIin the electrical equipment, transportation, and food processing sectors.25 Japan-based HondaMotor Co. has a large presence throughout India, including Honda’s joint venture with HeroCycles, which has grown into the world’s largest motorcycle company since its inception in1984. The company’s presence in Haryana includes an R&D center that supports twomanufacturing facilities which together produce over 3 million motorcycles annually. U.S-based Dow Corning and U.K.-based GlaxoSmithKline have invested in the state’s chemicaland pharmaceutical industries, respectively.
Automotive and auto components are the largest sectors attracting FDI into Tamil Nadu.Ford, Hyundai, and Mitsubushi all have multi-million dollar investments in Tamil Nadu. Thestate capital, Chennai, is sometimes called the “Detroit of India.”26 Other sectors attractingFDI include port infrastructure, ICT, and electronics.27 The bulk of projects in AndhraPradesh, which includes the city of Hyderabad, are associated with software and, to a lesserextent, hardware for computers and telecommunications. The same is true of projects inKarnataka, where Bangalore is located; Karnataka also has a large number of projects in theautomotive sector (34).
India’s more rural areas have attracted a smaller number of high-value projects. Largegreenfield FDI projects in Orissa include bauxite mining and associated aluminum smeltingoperations as well as steel and automotive facilities. Pohang Iron and Steel Co.’s (POSCO -Korea) planned steel mill in Orissa is expected to be the largest FDI project in India, and willultimately involve $12 billion in total FDI on 4000 acres, with an annual steel makingcapacity of 12 million tons by 2020.28 As of May 2007, however, the POSCO project wasgenerating intense local opposition by farmers worried about the loss of thier land, and itsfuture was uncertain. Luxembourg-based Arcelor-Mittal, the world’s largest steel maker, hasalso signed a memorandum of understanding with the Orissa state goverment to build an $8.7billion steel mill, but faces similar opposition to its plans.29 Other companies investing ingreenfield metals production and auto projects in Orissa include Russian Aluminum,Vedanta Resources (United Kingdom), Dubai Aluminum, and Nissan (Japan).30 The state ofOrissa accounted for 15 and 30 percent, respectively, of the total value of greenfield FDIreported in 2004 and 2005. As of April 2007, Arcelor-Mittal was also considering investingin a second large steel mill in India, in the state of Jharkhand.31
2-11
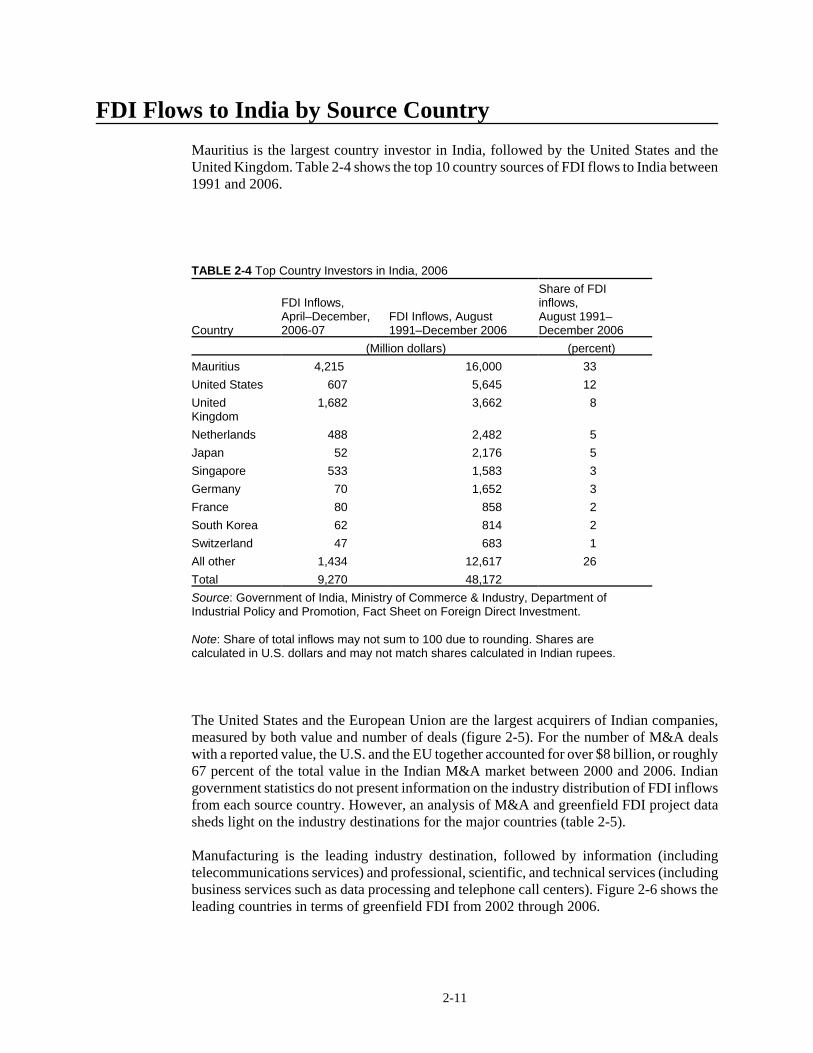
FDI Flows to India by Source CountryMauritius is the largest country investor in India, followed by the United States and theUnited Kingdom. Table 2-4 shows the top 10 country sources of FDI flows to India between1991 and 2006.
TABLE 2-4 Top Country Investors in India, 2006
Country
FDI Inflows, April–December,2006-07
FDI Inflows, August1991–December 2006
Share of FDIinflows, August 1991–December 2006
(Million dollars) (percent)Mauritius 4,215 16,000 33United States 607 5,645 12UnitedKingdom
1,682 3,662 8
Netherlands 488 2,482 5Japan 52 2,176 5Singapore 533 1,583 3Germany 70 1,652 3France 80 858 2South Korea 62 814 2Switzerland 47 683 1All other 1,434 12,617 26Total 9,270 48,172Source: Government of India, Ministry of Commerce & Industry, Department ofIndustrial Policy and Promotion, Fact Sheet on Foreign Direct Investment.
Note: Share of total inflows may not sum to 100 due to rounding. Shares arecalculated in U.S. dollars and may not match shares calculated in Indian rupees.
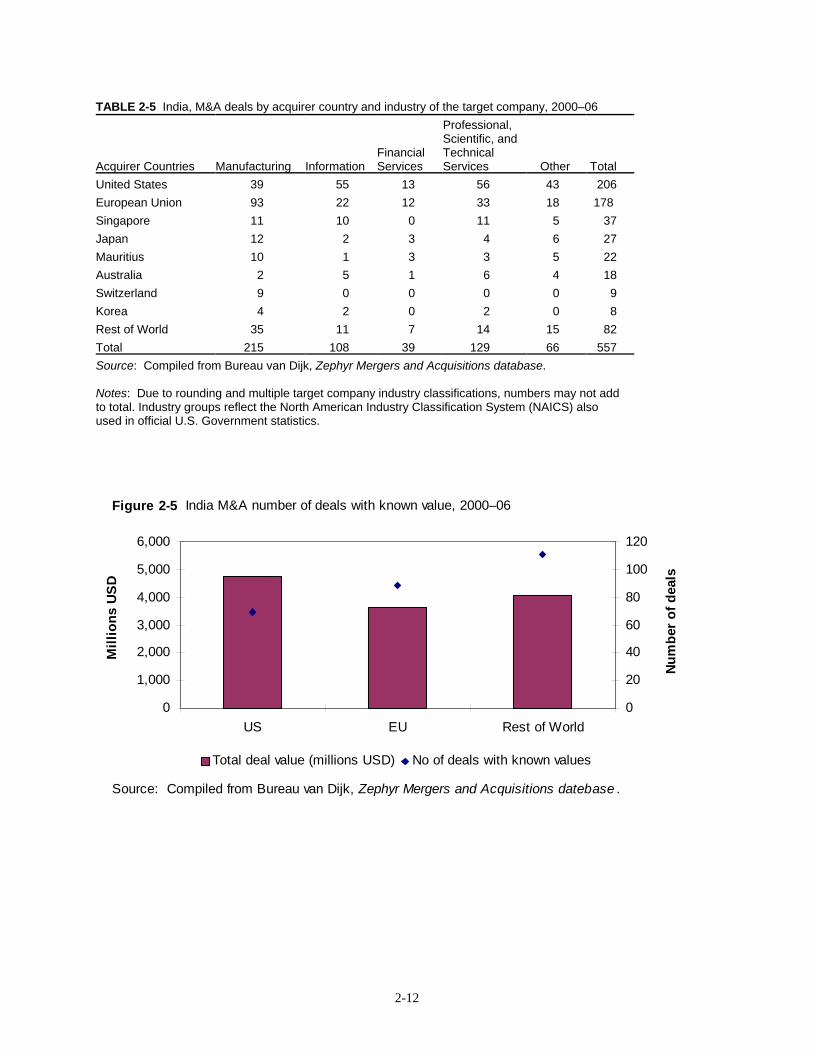
The United States and the European Union are the largest acquirers of Indian companies,measured by both value and number of deals (figure 2-5). For the number of M&A dealswith a reported value, the U.S. and the EU together accounted for over $8 billion, or roughly67 percent of the total value in the Indian M&A market between 2000 and 2006. Indiangovernment statistics do not present information on the industry distribution of FDI inflowsfrom each source country. However, an analysis of M&A and greenfield FDI project datasheds light on the industry destinations for the major countries (table 2-5).
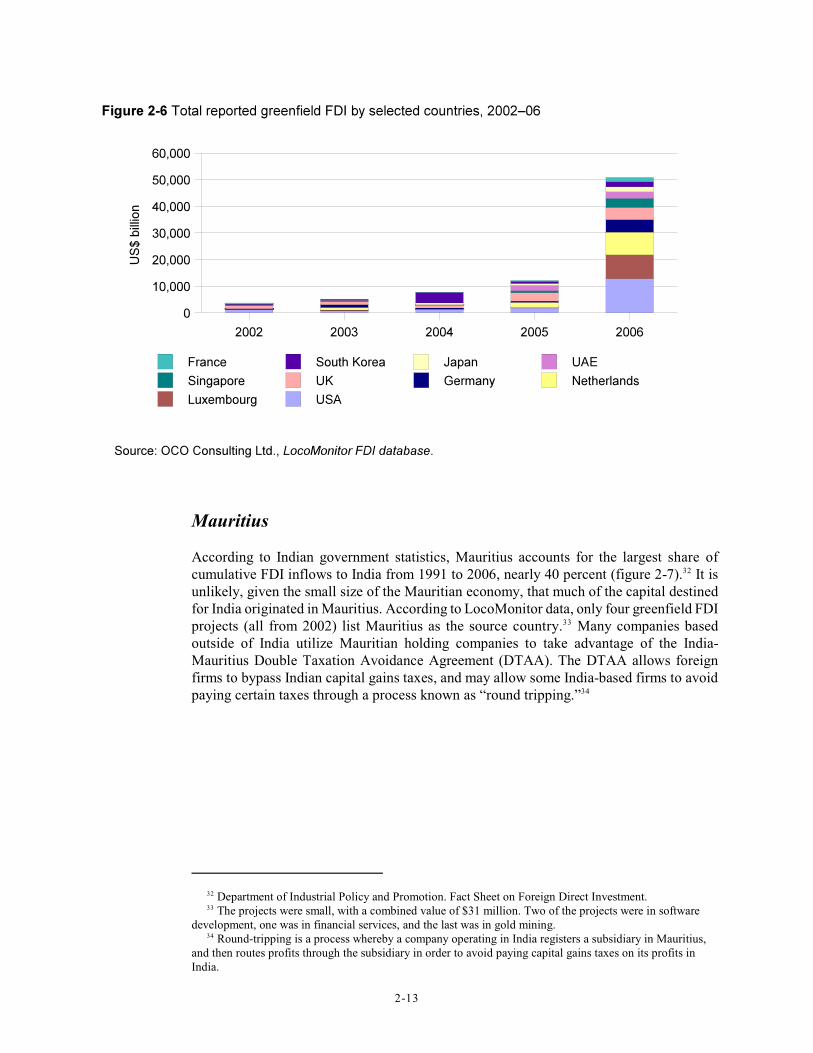
Manufacturing is the leading industry destination, followed by information (includingtelecommunications services) and professional, scientific, and technical services (includingbusiness services such as data processing and telephone call centers). Figure 2-6 shows theleading countries in terms of greenfield FDI from 2002 through 2006.
2-12
TABLE 2-5 India, M&A deals by acquirer country and industry of the target company, 2000–06
Acquirer Countries Manufacturing InformationFinancialServices
Professional,Scientific, andTechnicalServices Other Total
United States 39 55 13 56 43 206European Union 93 22 12 33 18 178 Singapore 11 10 0 11 5 37Japan 12 2 3 4 6 27Mauritius 10 1 3 3 5 22Australia 2 5 1 6 4 18Switzerland 9 0 0 0 0 9Korea 4 2 0 2 0 8Rest of World 35 11 7 14 15 82Total 215 108 39 129 66 557Source: Compiled from Bureau van Dijk, Zephyr Mergers and Acquisitions database.
Notes: Due to rounding and multiple target company industry classifications, numbers may not addto total. Industry groups reflect the North American Industry Classification System (NAICS) alsoused in official U.S. Government statistics.
0
1,000
2,000
3,000
4,000
5,000
6,000
US EU Rest of World
Mill
ions
USD
0
20
40
60
80
100
120
Num
ber o
f dea
ls
Total deal value (millions USD) No of deals with known values
Figure 2-5 India M&A number of deals with known value, 2000–06
Source: Compiled from Bureau van Dijk, Zephyr Mergers and Acquisitions datebase .
Department of Industrial Policy and Promotion. Fact Sheet on Foreign Direct Investment.32
The projects were small, with a combined value of $31 million. Two of the projects were in software33
development, one was in financial services, and the last was in gold mining. Round-tripping is a process whereby a company operating in India registers a subsidiary in Mauritius,34
and then routes profits through the subsidiary in order to avoid paying capital gains taxes on its profits inIndia.
2-13
Mauritius
According to Indian government statistics, Mauritius accounts for the largest share ofcumulative FDI inflows to India from 1991 to 2006, nearly 40 percent (figure 2-7). It is32
unlikely, given the small size of the Mauritian economy, that much of the capital destinedfor India originated in Mauritius. According to LocoMonitor data, only four greenfield FDIprojects (all from 2002) list Mauritius as the source country. Many companies based33
outside of India utilize Mauritian holding companies to take advantage of the India-Mauritius Double Taxation Avoidance Agreement (DTAA). The DTAA allows foreignfirms to bypass Indian capital gains taxes, and may allow some India-based firms to avoidpaying certain taxes through a process known as “round tripping.”34
35 Sikarwar, “Mauritius Overhauls DTAA Agreement.” 36 FDI inflows are allocated to the countries which have direct transactions with India, not to the ultimatesource of the capital. For a corporation based in the Netherlands with a holding company in Mauritius, forexample, the direct transaction takes place between Mauritius and India, even though the capital mayultimately have originated in the Netherlands. 37 Fuel includes power and oil refineries; telecommunications includes radio paging, cellular mobile andbasic telephone services; electrical equipment includes computer software and electronics; services includesfinancial and non-financial services. Embassy of India. “U.S. Investments in India.”
2-14
The extent of round tripping by Indian companies through Mauritius is unknown. However,the Indian government is concerned enough about this problem to have asked thegovernment of Mauritius to set up a joint monitoring mechanism to study these investmentflows.35 The potential loss of tax revenue is of particular concern to the Indian government.The existence of the treaty makes it difficult to clearly understand the pattern of FDI flows,36
and likely leads to reduced tax revenues collected by the Indian government. Chapter 5presents a more complete discussion of the DTAA.
United States
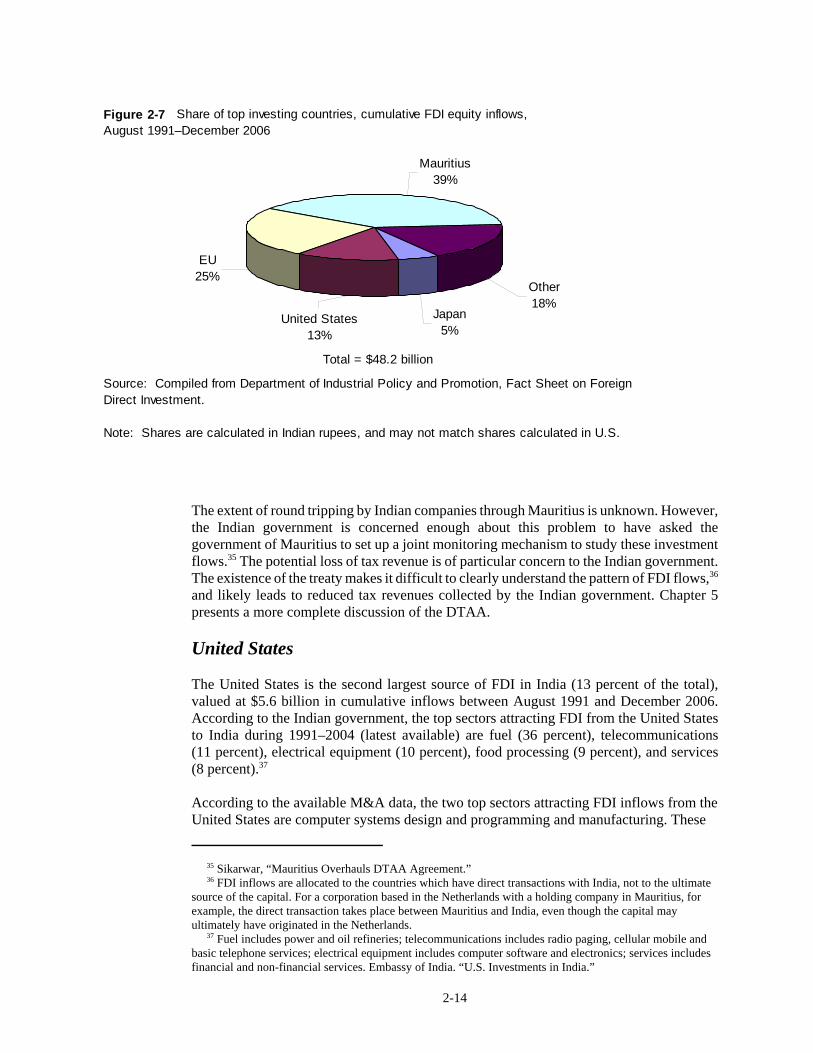
The United States is the second largest source of FDI in India (13 percent of the total),valued at $5.6 billion in cumulative inflows between August 1991 and December 2006.According to the Indian government, the top sectors attracting FDI from the United Statesto India during 1991–2004 (latest available) are fuel (36 percent), telecommunications(11 percent), electrical equipment (10 percent), food processing (9 percent), and services(8 percent).37
According to the available M&A data, the two top sectors attracting FDI inflows from theUnited States are computer systems design and programming and manufacturing. These
EU25%
Mauritius39%
Other18%
Japan5%
United States13%
Figure 2-7 Share of top investing countries, cumulative FDI equity inflows, August 1991–December 2006
Source: Compiled from Department of Industrial Policy and Promotion, Fact Sheet on Foreign Direct Investment.
Note: Shares are calculated in Indian rupees, and may not match shares calculated in U.S.
Total = $48.2 billion
38 Bureau van Dijk, Zephyr Mergers &Acquisitions database. 39 iTWire, “Google Likely to Set Up $1 Billion Datacenter in India.” 40 OCO Consulting Ltd., LocoMonitor FDI database. 41 Intel, “Intel Outlines $1 Billion Multi-Year Investment Plans.”
2-15
data roughly correspond to the overall FDI sectoral breakdown with the exception of fuel(including power generation and oil refineries). Given India’s general lack of existingpower infrastructure, operations involved with power generation and oil refineries may bebetter suited to greenfield investments. U.S. companies that are actively pursuing or haverecently completed M&A deals in the Indian telecommunications, electrical equipment,and service sectors include Oracle, Intel, IBM, HP, and Electronic Data Systems (EDS).Ford, Parker-Hannifin, Sara Lee, SC Johnson, and Caterpillar have been activelyinvesting in the manufacturing sector.38
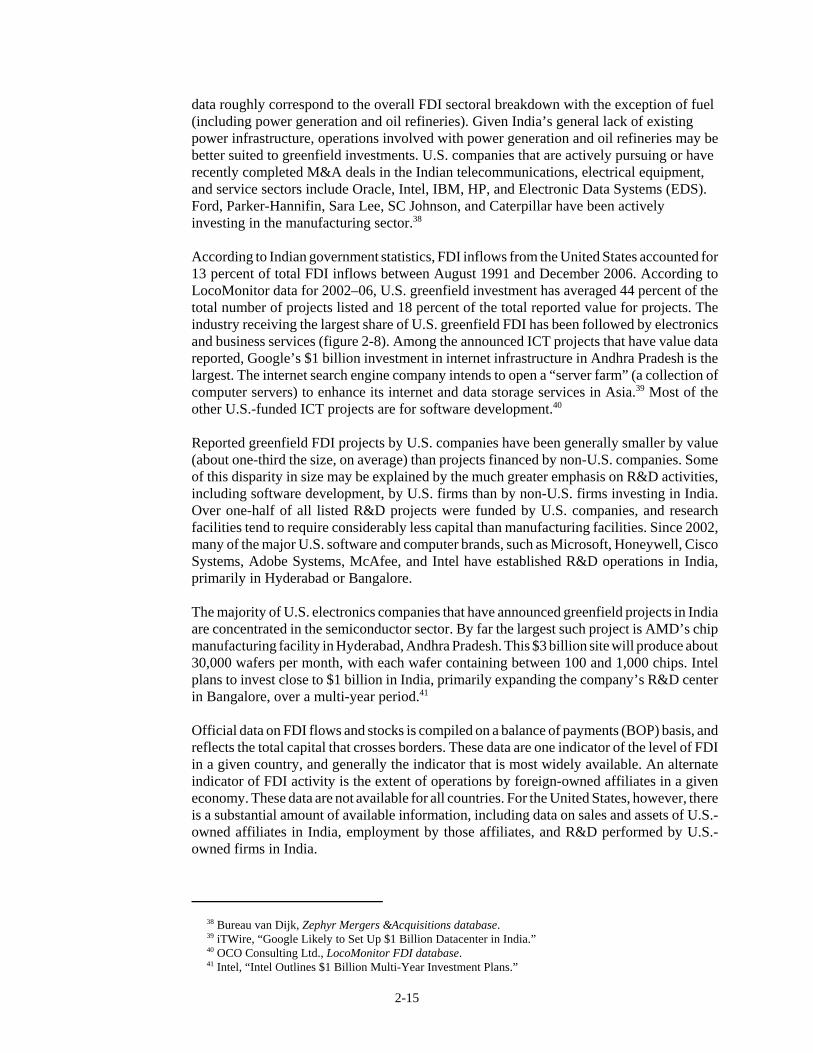
According to Indian government statistics, FDI inflows from the United States accounted for13 percent of total FDI inflows between August 1991 and December 2006. According toLocoMonitor data for 2002–06, U.S. greenfield investment has averaged 44 percent of thetotal number of projects listed and 18 percent of the total reported value for projects. Theindustry receiving the largest share of U.S. greenfield FDI has been followed by electronicsand business services (figure 2-8). Among the announced ICT projects that have value datareported, Google’s $1 billion investment in internet infrastructure in Andhra Pradesh is thelargest. The internet search engine company intends to open a “server farm” (a collection ofcomputer servers) to enhance its internet and data storage services in Asia.39 Most of theother U.S.-funded ICT projects are for software development.40
Reported greenfield FDI projects by U.S. companies have been generally smaller by value(about one-third the size, on average) than projects financed by non-U.S. companies. Someof this disparity in size may be explained by the much greater emphasis on R&D activities,including software development, by U.S. firms than by non-U.S. firms investing in India.Over one-half of all listed R&D projects were funded by U.S. companies, and researchfacilities tend to require considerably less capital than manufacturing facilities. Since 2002,many of the major U.S. software and computer brands, such as Microsoft, Honeywell, CiscoSystems, Adobe Systems, McAfee, and Intel have established R&D operations in India,primarily in Hyderabad or Bangalore.
The majority of U.S. electronics companies that have announced greenfield projects in Indiaare concentrated in the semiconductor sector. By far the largest such project is AMD’s chipmanufacturing facility in Hyderabad, Andhra Pradesh. This $3 billion site will produce about30,000 wafers per month, with each wafer containing between 100 and 1,000 chips. Intelplans to invest close to $1 billion in India, primarily expanding the company’s R&D centerin Bangalore, over a multi-year period.41
Official data on FDI flows and stocks is compiled on a balance of payments (BOP) basis, andreflects the total capital that crosses borders. These data are one indicator of the level of FDIin a given country, and generally the indicator that is most widely available. An alternateindicator of FDI activity is the extent of operations by foreign-owned affiliates in a giveneconomy. These data are not available for all countries. For the United States, however, thereis a substantial amount of available information, including data on sales and assets of U.S.-owned affiliates in India, employment by those affiliates, and R&D performed by U.S.-owned firms in India.

According to U.S. government statistical standards, consistent with IMF standards, an affiliate is any42
firm with an equity share of 10-percent or more. The U.S. Department of Commerce compiles statistics onboth U.S.-owned affiliates and majority-owned affiliates (MOFAs), with greater detail available for MOFAs.USDOC, BEA. International Economic Accounts, “Operation of Multinational Companies.”
2-16
assets of U.S.-owned affiliates in India, employment by those affiliates, and R&D performedby U.S.-owned firms in India.
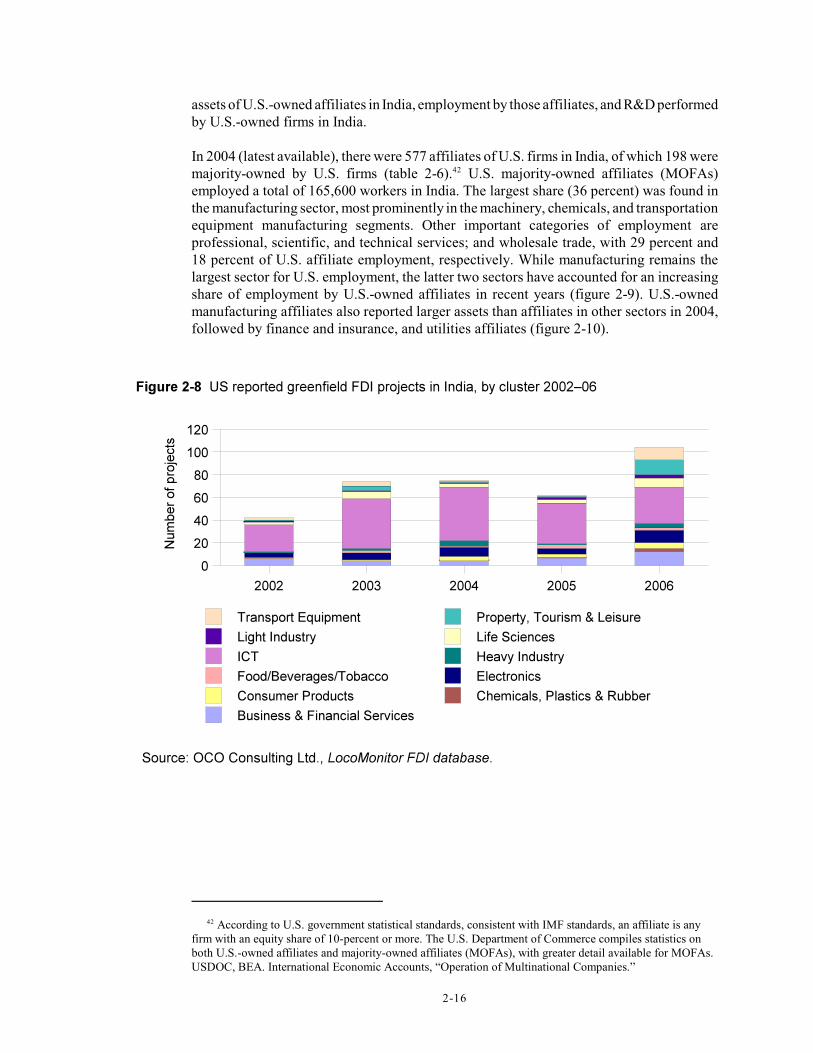
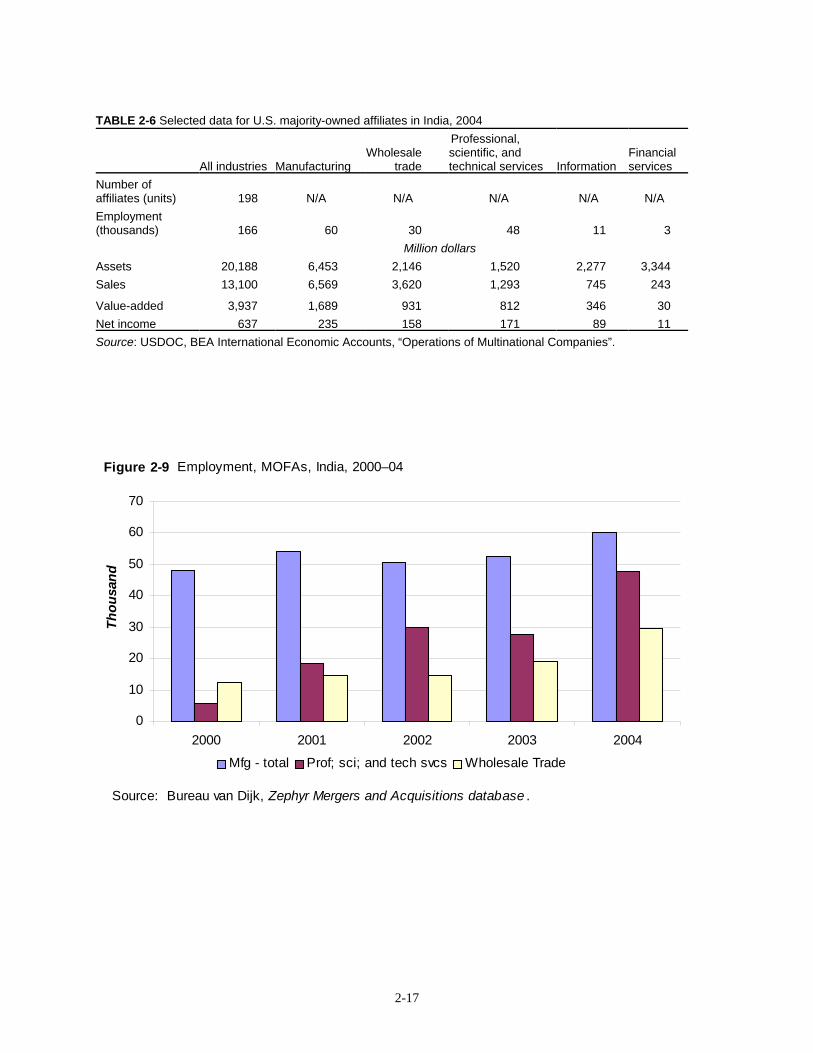
In 2004 (latest available), there were 577 affiliates of U.S. firms in India, of which 198 weremajority-owned by U.S. firms (table 2-6). U.S. majority-owned affiliates (MOFAs)42
employed a total of 165,600 workers in India. The largest share (36 percent) was found inthe manufacturing sector, most prominently in the machinery, chemicals, and transportationequipment manufacturing segments. Other important categories of employment areprofessional, scientific, and technical services; and wholesale trade, with 29 percent and18 percent of U.S. affiliate employment, respectively. While manufacturing remains thelargest sector for U.S. employment, the latter two sectors have accounted for an increasingshare of employment by U.S.-owned affiliates in recent years (figure 2-9). U.S.-ownedmanufacturing affiliates also reported larger assets than affiliates in other sectors in 2004,followed by finance and insurance, and utilities affiliates (figure 2-10).
According to U.S. government statistical standards, consistent with IMF standards, an affiliate is any42
firm with an equity share of 10-percent or more. The U.S. Department of Commerce compiles statistics onboth U.S.-owned affiliates and majority-owned affiliates (MOFAs), with greater detail available for MOFAs.USDOC, BEA. International Economic Accounts, “Operation of Multinational Companies.”
2-16
assets of U.S.-owned affiliates in India, employment by those affiliates, and R&D performedby U.S.-owned firms in India.
In 2004 (latest available), there were 577 affiliates of U.S. firms in India, of which 198 weremajority-owned by U.S. firms (table 2-6). U.S. majority-owned affiliates (MOFAs)42
employed a total of 165,600 workers in India. The largest share (36 percent) was found inthe manufacturing sector, most prominently in the machinery, chemicals, and transportationequipment manufacturing segments. Other important categories of employment areprofessional, scientific, and technical services; and wholesale trade, with 29 percent and18 percent of U.S. affiliate employment, respectively. While manufacturing remains thelargest sector for U.S. employment, the latter two sectors have accounted for an increasingshare of employment by U.S.-owned affiliates in recent years (figure 2-9). U.S.-ownedmanufacturing affiliates also reported larger assets than affiliates in other sectors in 2004,followed by finance and insurance, and utilities affiliates (figure 2-10).
2-17
TABLE 2-6 Selected data for U.S. majority-owned affiliates in India, 2004
All industries ManufacturingWholesale
trade
Professional,scientific, andtechnical services Information
Financialservices
Number ofaffiliates (units) 198 N/A N/A N/A N/A N/AEmployment(thousands) 166 60 30 48 11 3
Million dollarsAssets 20,188 6,453 2,146 1,520 2,277 3,344Sales 13,100 6,569 3,620 1,293 745 243
Value-added 3,937 1,689 931 812 346 30Net income 637 235 158 171 89 11Source: USDOC, BEA International Economic Accounts, “Operations of Multinational Companies”.
0
10
20
30
40
50
60
70
2000 2001 2002 2003 2004
Thou
sand
Mfg - total Prof; sci; and tech svcs Wholesale Trade
Source: Bureau van Dijk, Zephyr Mergers and Acquisitions database .
Figure 2-9 Employment, MOFAs, India, 2000–04
43 The U.S. Department of Commerce does not provide a breakdown of the information category, butthere is a significant amount of U.S. FDI in India’s telecommunications industry. The information categoryalso includes publishing, motion picture and sound recording, broadcasting, and data processing services. 44 The R&D figure for professional, scientific, and technical services was suppressed to avoid disclosingindividual company information. 45 EC. “Bilateral Trade Relations - India.”
2-18
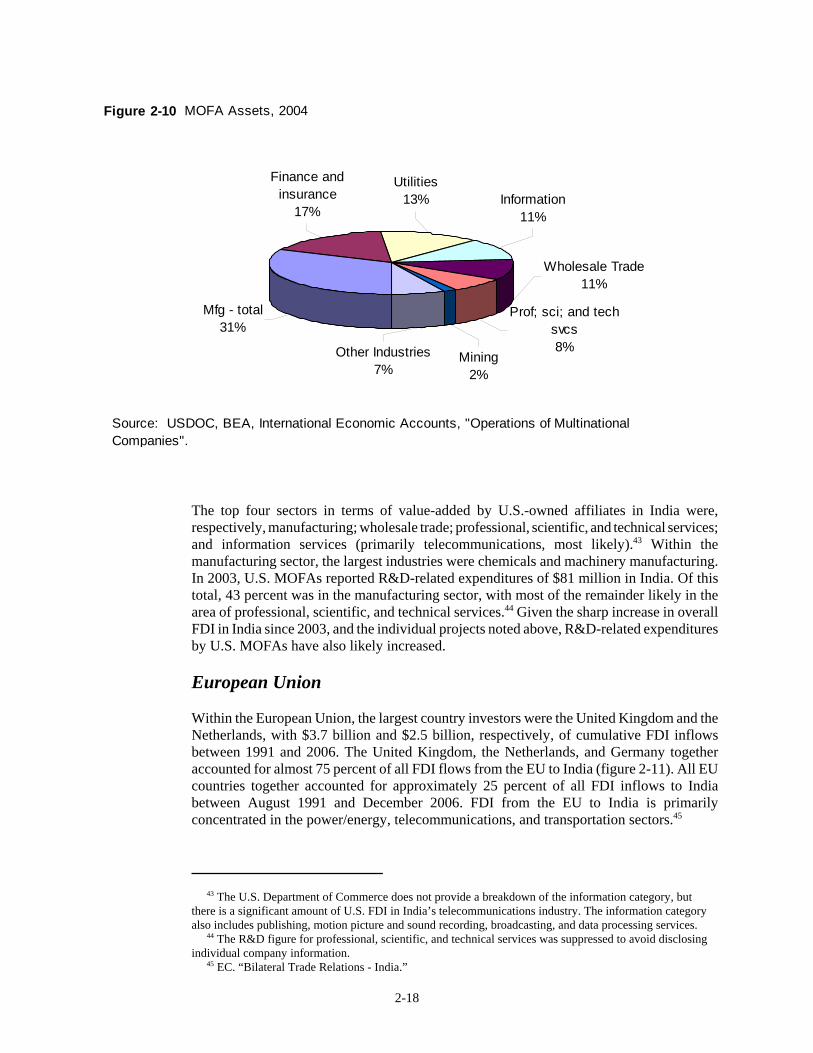
The top four sectors in terms of value-added by U.S.-owned affiliates in India were,respectively, manufacturing; wholesale trade; professional, scientific, and technical services;and information services (primarily telecommunications, most likely).43 Within themanufacturing sector, the largest industries were chemicals and machinery manufacturing.In 2003, U.S. MOFAs reported R&D-related expenditures of $81 million in India. Of thistotal, 43 percent was in the manufacturing sector, with most of the remainder likely in thearea of professional, scientific, and technical services.44 Given the sharp increase in overallFDI in India since 2003, and the individual projects noted above, R&D-related expendituresby U.S. MOFAs have also likely increased.
European Union
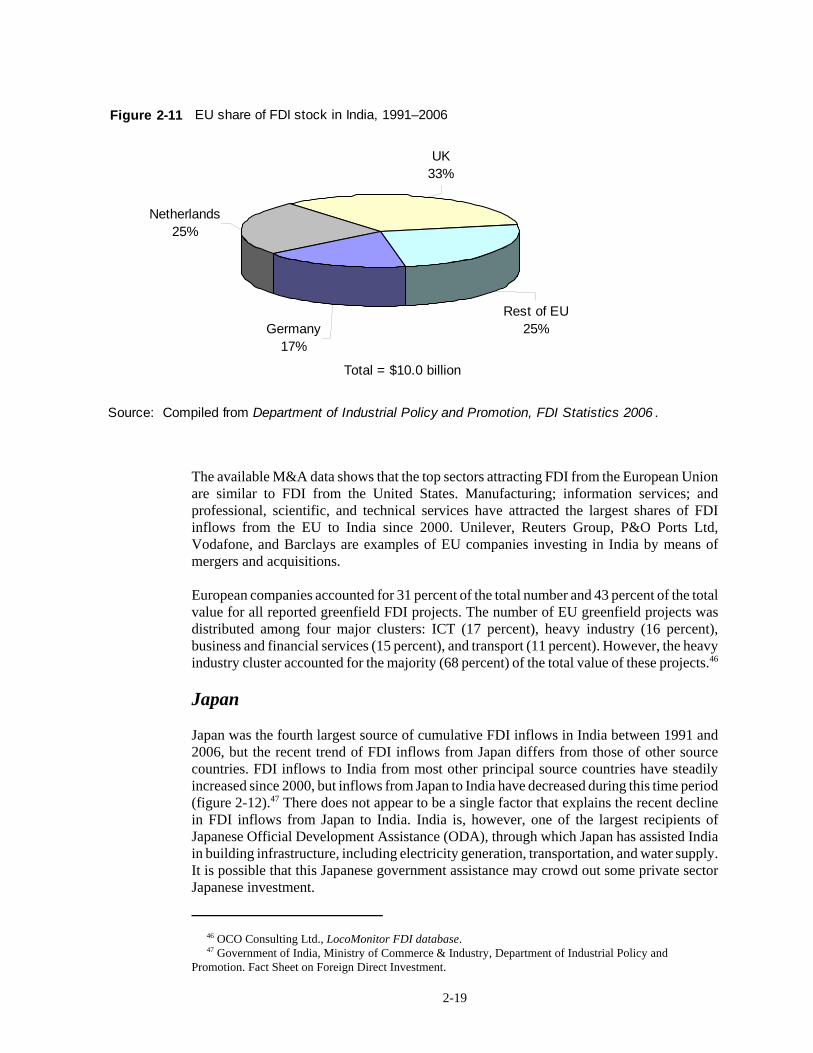
Within the European Union, the largest country investors were the United Kingdom and theNetherlands, with $3.7 billion and $2.5 billion, respectively, of cumulative FDI inflowsbetween 1991 and 2006. The United Kingdom, the Netherlands, and Germany togetheraccounted for almost 75 percent of all FDI flows from the EU to India (figure 2-11). All EUcountries together accounted for approximately 25 percent of all FDI inflows to Indiabetween August 1991 and December 2006. FDI from the EU to India is primarilyconcentrated in the power/energy, telecommunications, and transportation sectors.45
Other Industries7%
Mining 2%
Utilities13%
Finance and insurance
17%
Mfg - total31%
Information11%
Wholesale Trade 11%
Prof; sci; and tech svcs8%
Figure 2-10 MOFA Assets, 2004
Source: USDOC, BEA, International Economic Accounts, "Operations of Multinational Companies".
46 OCO Consulting Ltd., LocoMonitor FDI database. 47 Government of India, Ministry of Commerce & Industry, Department of Industrial Policy andPromotion. Fact Sheet on Foreign Direct Investment.
2-19
The available M&A data shows that the top sectors attracting FDI from the European Unionare similar to FDI from the United States. Manufacturing; information services; andprofessional, scientific, and technical services have attracted the largest shares of FDIinflows from the EU to India since 2000. Unilever, Reuters Group, P&O Ports Ltd,Vodafone, and Barclays are examples of EU companies investing in India by means ofmergers and acquisitions.
European companies accounted for 31 percent of the total number and 43 percent of the totalvalue for all reported greenfield FDI projects. The number of EU greenfield projects wasdistributed among four major clusters: ICT (17 percent), heavy industry (16 percent),business and financial services (15 percent), and transport (11 percent). However, the heavyindustry cluster accounted for the majority (68 percent) of the total value of these projects.46
Japan
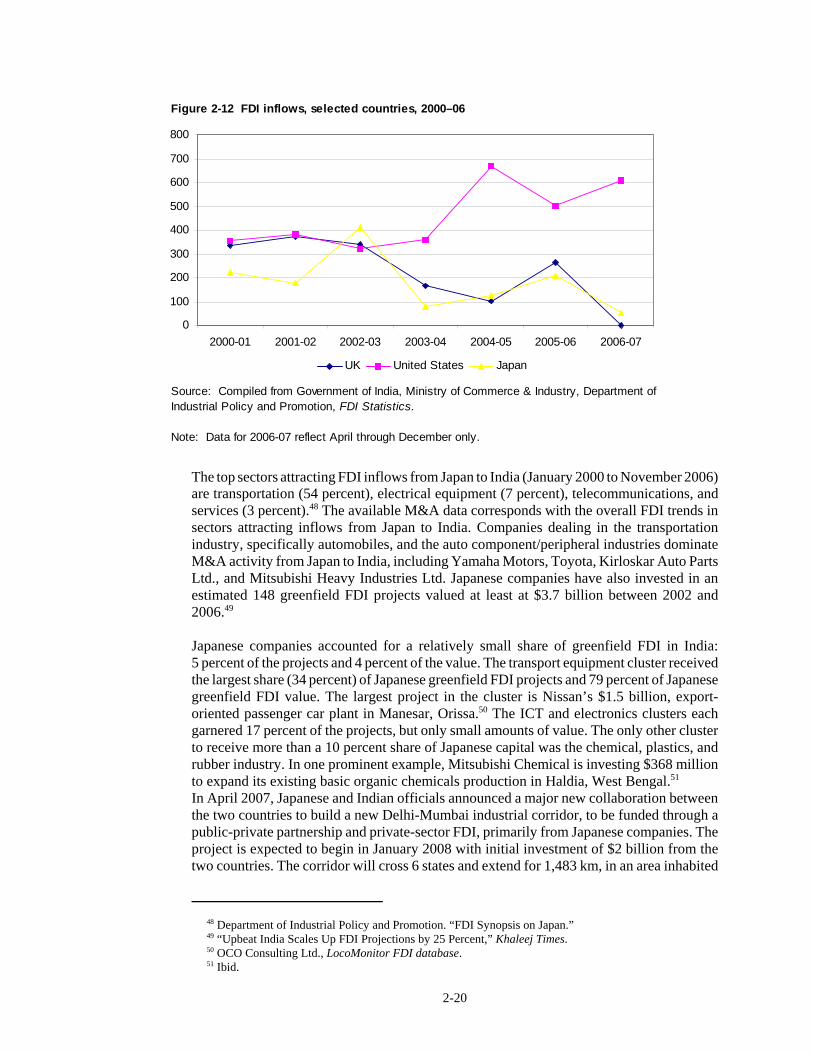
Japan was the fourth largest source of cumulative FDI inflows in India between 1991 and2006, but the recent trend of FDI inflows from Japan differs from those of other sourcecountries. FDI inflows to India from most other principal source countries have steadilyincreased since 2000, but inflows from Japan to India have decreased during this time period(figure 2-12).47 There does not appear to be a single factor that explains the recent declinein FDI inflows from Japan to India. India is, however, one of the largest recipients ofJapanese Official Development Assistance (ODA), through which Japan has assisted Indiain building infrastructure, including electricity generation, transportation, and water supply.It is possible that this Japanese government assistance may crowd out some private sectorJapanese investment.
UK33%
Netherlands25%
Germany17%
Rest of EU25%
Figure 2-11 EU share of FDI stock in India, 1991–2006
Source: Compiled from Department of Industrial Policy and Promotion, FDI Statistics 2006 .
Total = $10.0 billion
48 Department of Industrial Policy and Promotion. “FDI Synopsis on Japan.” 49 “Upbeat India Scales Up FDI Projections by 25 Percent,” Khaleej Times. 50 OCO Consulting Ltd., LocoMonitor FDI database. 51 Ibid.
2-20
The top sectors attracting FDI inflows from Japan to India (January 2000 to November 2006)are transportation (54 percent), electrical equipment (7 percent), telecommunications, andservices (3 percent).48 The available M&A data corresponds with the overall FDI trends insectors attracting inflows from Japan to India. Companies dealing in the transportationindustry, specifically automobiles, and the auto component/peripheral industries dominateM&A activity from Japan to India, including Yamaha Motors, Toyota, Kirloskar Auto PartsLtd., and Mitsubishi Heavy Industries Ltd. Japanese companies have also invested in anestimated 148 greenfield FDI projects valued at least at $3.7 billion between 2002 and2006.49
Japanese companies accounted for a relatively small share of greenfield FDI in India:5 percent of the projects and 4 percent of the value. The transport equipment cluster receivedthe largest share (34 percent) of Japanese greenfield FDI projects and 79 percent of Japanesegreenfield FDI value. The largest project in the cluster is Nissan’s $1.5 billion, export-oriented passenger car plant in Manesar, Orissa.50 The ICT and electronics clusters eachgarnered 17 percent of the projects, but only small amounts of value. The only other clusterto receive more than a 10 percent share of Japanese capital was the chemical, plastics, andrubber industry. In one prominent example, Mitsubishi Chemical is investing $368 millionto expand its existing basic organic chemicals production in Haldia, West Bengal.51 In April 2007, Japanese and Indian officials announced a major new collaboration betweenthe two countries to build a new Delhi-Mumbai industrial corridor, to be funded through apublic-private partnership and private-sector FDI, primarily from Japanese companies. Theproject is expected to begin in January 2008 with initial investment of $2 billion from thetwo countries. The corridor will cross 6 states and extend for 1,483 km, in an area inhabited
0
100
200
300
400
500
600
700
800
2000-01 2001-02 2002-03 2003-04 2004-05 2005-06 2006-07
UK United States Japan
Figure 2-12 FDI inflows, selected countries, 2000–06
Source: Compiled from Government of India, Ministry of Commerce & Industry, Department of Industrial Policy and Promotion, FDI Statistics.
Note: Data for 2006-07 reflect April through December only.
52 BusinessStandard.com, “Industrial Corridor to Get $50 Billion Investment”; Indian Express, “Work onDelhi-Mumbai Corridor from January”; and Gulf News.com, “Japan to Help India Build $50 Billion IndustryCorridor.” 53 Jha, “UAE, India to Expand Ties.” 54 Khaleej Times, “Upbeat India Scales Up FDI Projections by 25 Percent.” 55 OCO Consulting Ltd., LocoMonitor FDI database. 56 Khaleej Times, “DP World’s India Foray Runs into Murkier Waters.” 57 Ibid., “Gulf Arab Investors Target Asia as US Ties Wane.”
2-21
by 180 million people. At completion in 2015, the corridor is expected to include total FDIof $45–50 billion. A large share of that total is destined for infrastructure, including a 4,000MW power plant, 3 ports, and 6 airports, along with additional connections to existing ports.Private investment is expected to fund 10-12 new industrial zones, upgrade 5–6 existingairports, and set up 10 logistics parks. The Indian government expects that by 2020, theindustrial corridor will contribute to employment growth of 15 percent in the region,28 percent growth in industrial output, and 38 percent growth in exports.52
United Arab Emirates (UAE)
The UAE ranked fourteenth in FDI stock in India in 2006, but the two countries are in theprocess of signing several economic and political cooperation agreements which will likelylead to increased UAE investment in India. The March 2007 visit to India by officials fromDubai has already produced commitments for cross border investments of over $30 billionover the next two years.53
Sectors attracting interest from the UAE include ports, infrastructure, and hotel construction.One notable recent agreement involves a 50:50 joint venture between Dubai-based Nakheeland Indian real estate developer DLF. The company plans to develop 40,000 acres forhousing with an initial investment of $10 billion. Greenfield FDI projects in India fromUAE-based investors are valued at more than $2 billion in each of the last two years, manyof which are aimed at infrastructure and real estate development.54
The three clusters with the largest number of UAE-funded greenfield FDI projects during2002–06 are light industry; property, tourism, and leisure; and logistics. The light industryprojects, concentrated in textiles and building materials, are typically less capital intensive.Conversely, heavy industry had only one UAE-funded greenfield FDI project, but it wasvalued at $1.1 billion: Dubai Aluminum is setting up a mine, refinery, and smelter inOrissa.55 Dubai Ports World has been the most active UAE investor in India’s logisticscluster, with plans to establish container port operations in numerous Indian ports. Theextensive network is, in fact, leading to questions about whether the company is gaining toolarge a share of the market with its control of 50 percent of India’s container shippingtraffic.56
UAE investors claim that one reason for their increased interest in India is related to the U.S.response to the September 11, 2001 terrorist attacks on the United States. The U.S. marketis perceived to be less welcoming to foreign ownership, particularly from the Gulf states, soinvestors are looking for other markets to absorb their investment dollars.57
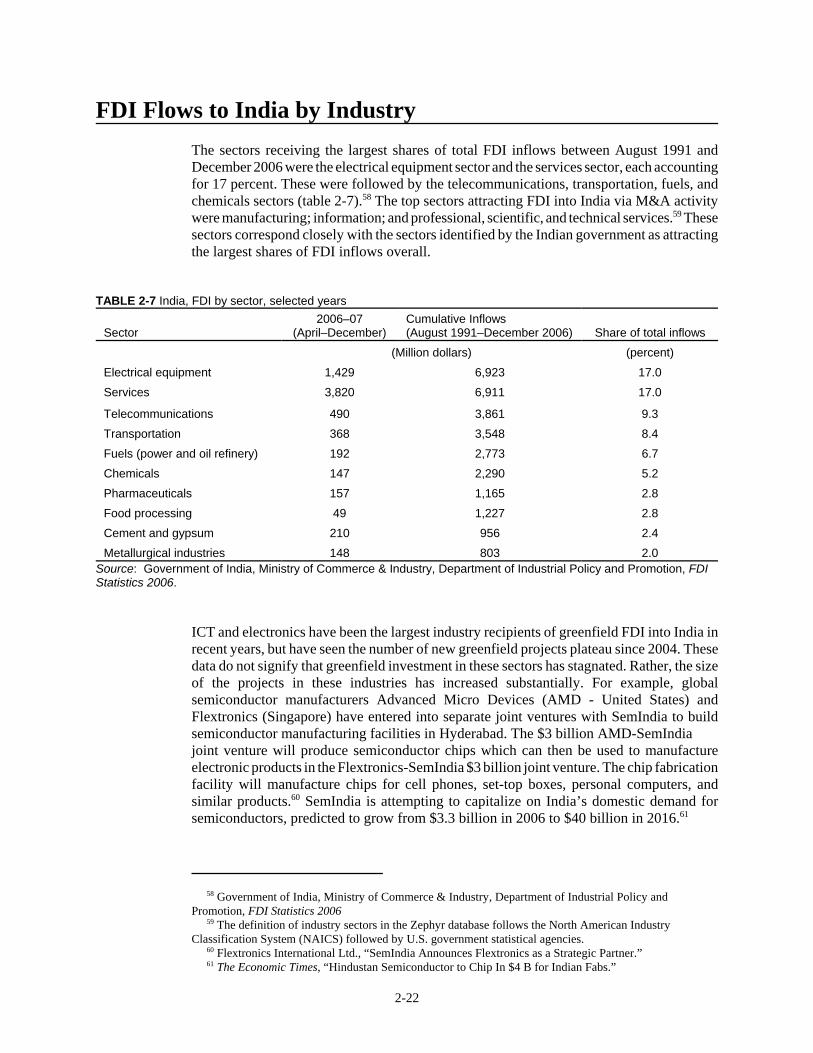
58 Government of India, Ministry of Commerce & Industry, Department of Industrial Policy andPromotion, FDI Statistics 2006 59 The definition of industry sectors in the Zephyr database follows the North American IndustryClassification System (NAICS) followed by U.S. government statistical agencies. 60 Flextronics International Ltd., “SemIndia Announces Flextronics as a Strategic Partner.” 61 The Economic Times, “Hindustan Semiconductor to Chip In $4 B for Indian Fabs.”
2-22
FDI Flows to India by IndustryThe sectors receiving the largest shares of total FDI inflows between August 1991 andDecember 2006 were the electrical equipment sector and the services sector, each accountingfor 17 percent. These were followed by the telecommunications, transportation, fuels, andchemicals sectors (table 2-7).58 The top sectors attracting FDI into India via M&A activitywere manufacturing; information; and professional, scientific, and technical services.59 Thesesectors correspond closely with the sectors identified by the Indian government as attractingthe largest shares of FDI inflows overall.
TABLE 2-7 India, FDI by sector, selected years
Sector2006–07
(April–December)Cumulative Inflows (August 1991–December 2006) Share of total inflows
(Million dollars) (percent)Electrical equipment 1,429 6,923 17.0Services 3,820 6,911 17.0
Telecommunications 490 3,861 9.3Transportation 368 3,548 8.4Fuels (power and oil refinery) 192 2,773 6.7Chemicals 147 2,290 5.2Pharmaceuticals 157 1,165 2.8Food processing 49 1,227 2.8Cement and gypsum 210 956 2.4Metallurgical industries 148 803 2.0
Source: Government of India, Ministry of Commerce & Industry, Department of Industrial Policy and Promotion, FDIStatistics 2006.
ICT and electronics have been the largest industry recipients of greenfield FDI into India inrecent years, but have seen the number of new greenfield projects plateau since 2004. Thesedata do not signify that greenfield investment in these sectors has stagnated. Rather, the sizeof the projects in these industries has increased substantially. For example, globalsemiconductor manufacturers Advanced Micro Devices (AMD - United States) andFlextronics (Singapore) have entered into separate joint ventures with SemIndia to buildsemiconductor manufacturing facilities in Hyderabad. The $3 billion AMD-SemIndiajoint venture will produce semiconductor chips which can then be used to manufactureelectronic products in the Flextronics-SemIndia $3 billion joint venture. The chip fabricationfacility will manufacture chips for cell phones, set-top boxes, personal computers, andsimilar products.60 SemIndia is attempting to capitalize on India’s domestic demand forsemiconductors, predicted to grow from $3.3 billion in 2006 to $40 billion in 2016.61
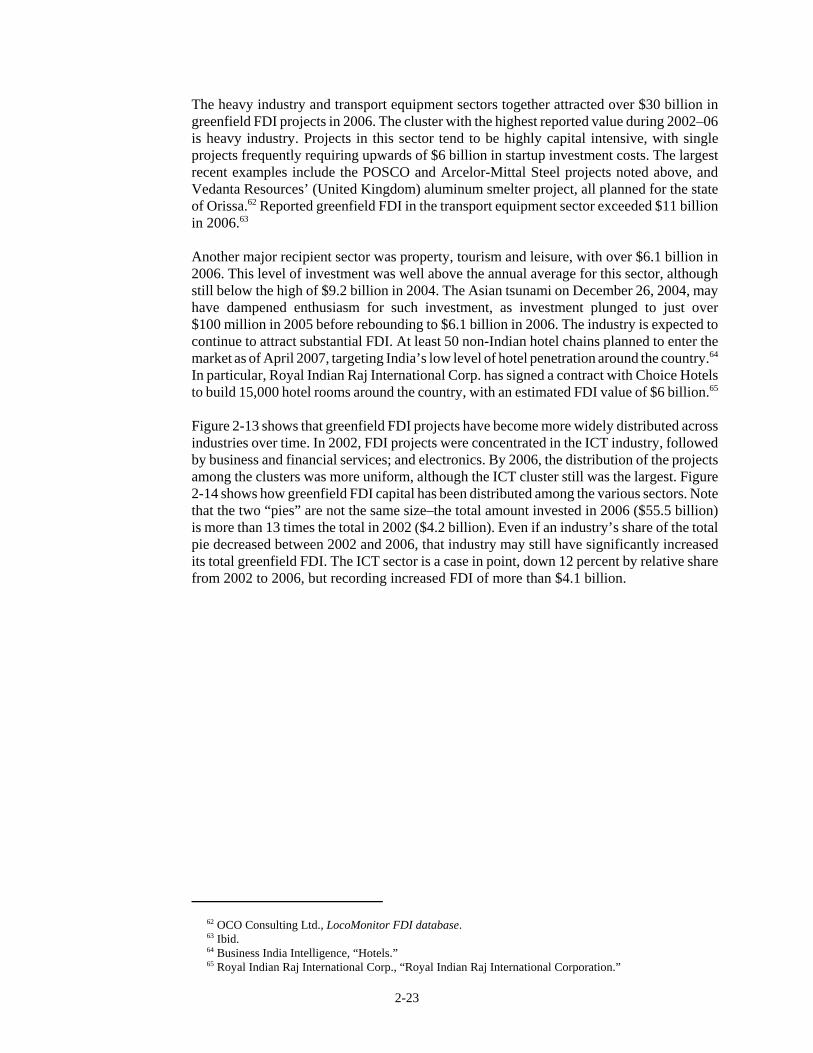
62 OCO Consulting Ltd., LocoMonitor FDI database. 63 Ibid. 64 Business India Intelligence, “Hotels.” 65 Royal Indian Raj International Corp., “Royal Indian Raj International Corporation.”
2-23
The heavy industry and transport equipment sectors together attracted over $30 billion ingreenfield FDI projects in 2006. The cluster with the highest reported value during 2002–06is heavy industry. Projects in this sector tend to be highly capital intensive, with singleprojects frequently requiring upwards of $6 billion in startup investment costs. The largestrecent examples include the POSCO and Arcelor-Mittal Steel projects noted above, andVedanta Resources’ (United Kingdom) aluminum smelter project, all planned for the stateof Orissa.62 Reported greenfield FDI in the transport equipment sector exceeded $11 billionin 2006.63
Another major recipient sector was property, tourism and leisure, with over $6.1 billion in2006. This level of investment was well above the annual average for this sector, althoughstill below the high of $9.2 billion in 2004. The Asian tsunami on December 26, 2004, mayhave dampened enthusiasm for such investment, as investment plunged to just over$100 million in 2005 before rebounding to $6.1 billion in 2006. The industry is expected tocontinue to attract substantial FDI. At least 50 non-Indian hotel chains planned to enter themarket as of April 2007, targeting India’s low level of hotel penetration around the country.64
In particular, Royal Indian Raj International Corp. has signed a contract with Choice Hotelsto build 15,000 hotel rooms around the country, with an estimated FDI value of $6 billion.65
Figure 2-13 shows that greenfield FDI projects have become more widely distributed acrossindustries over time. In 2002, FDI projects were concentrated in the ICT industry, followedby business and financial services; and electronics. By 2006, the distribution of the projectsamong the clusters was more uniform, although the ICT cluster still was the largest. Figure2-14 shows how greenfield FDI capital has been distributed among the various sectors. Notethat the two “pies” are not the same size–the total amount invested in 2006 ($55.5 billion)is more than 13 times the total in 2002 ($4.2 billion). Even if an industry’s share of the totalpie decreased between 2002 and 2006, that industry may still have significantly increasedits total greenfield FDI. The ICT sector is a case in point, down 12 percent by relative sharefrom 2002 to 2006, but recording increased FDI of more than $4.1 billion.
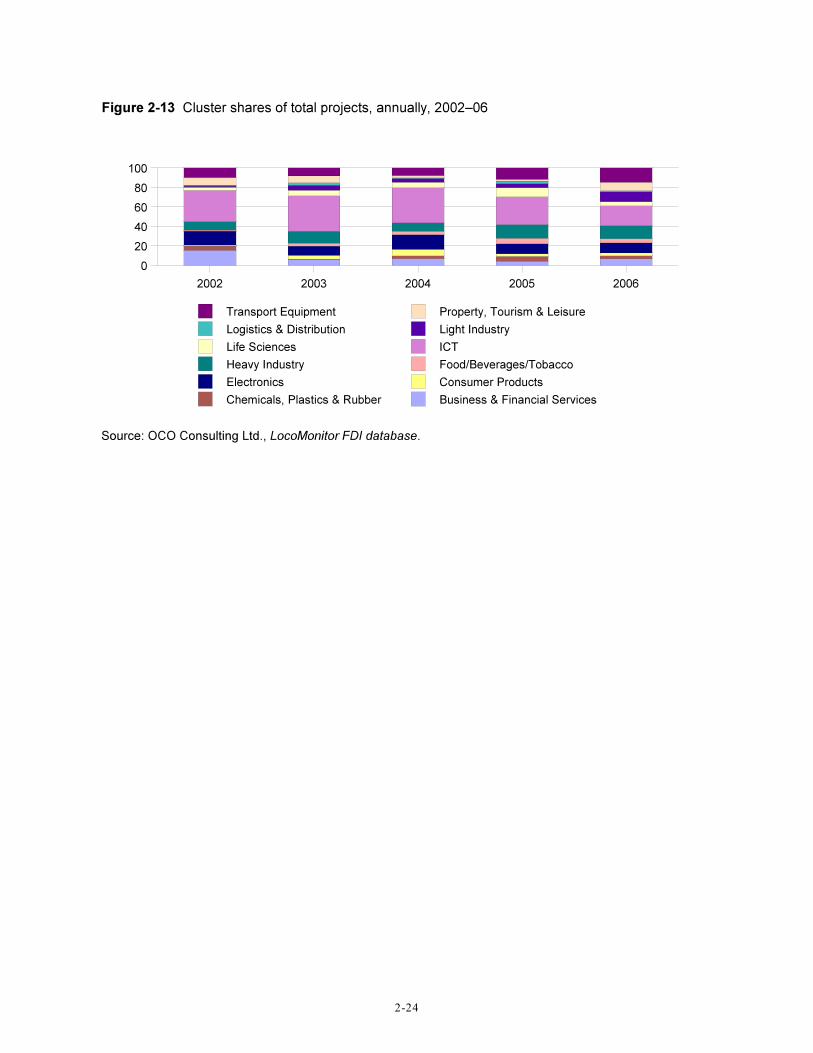
2-24
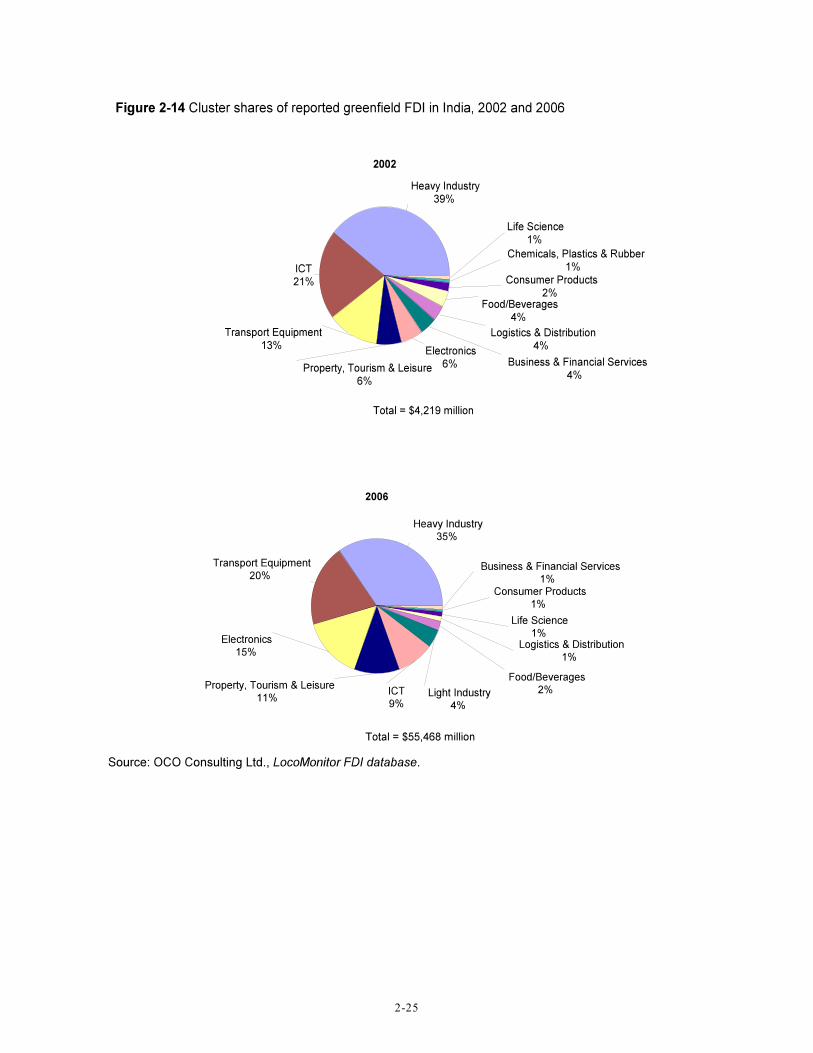
2-25

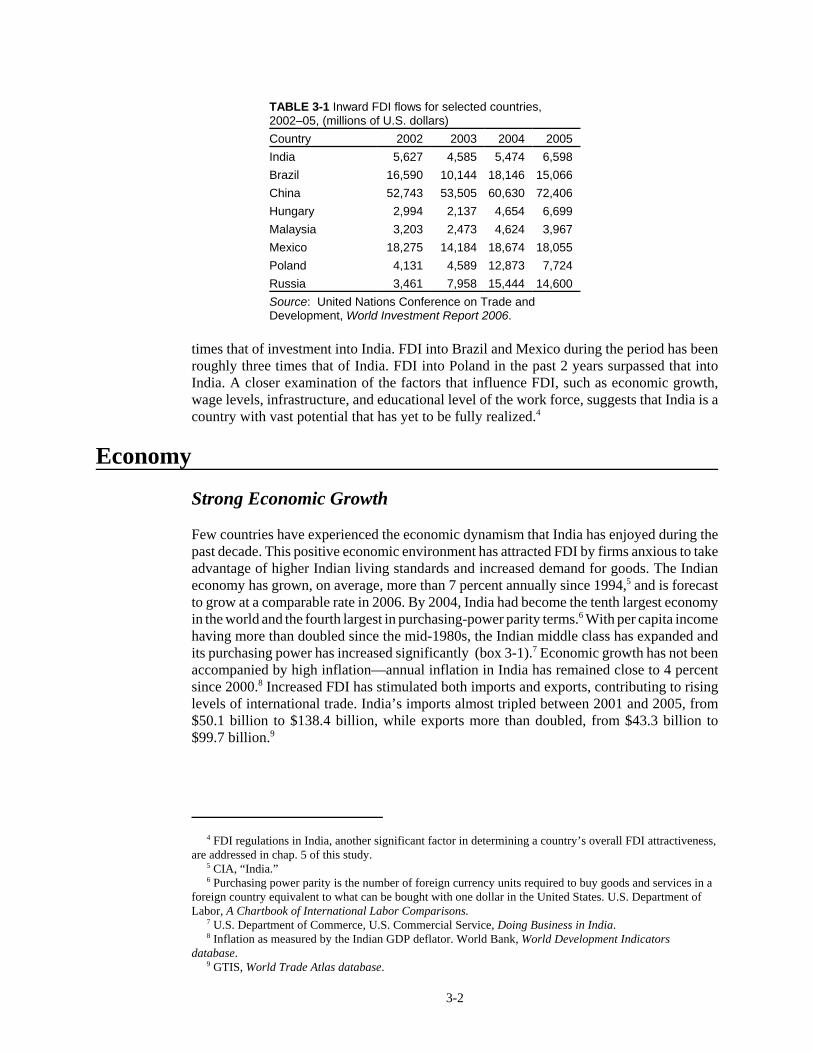
4 FDI regulations in India, another significant factor in determining a country’s overall FDI attractiveness,are addressed in chap. 5 of this study. 5 CIA, “India.” 6 Purchasing power parity is the number of foreign currency units required to buy goods and services in aforeign country equivalent to what can be bought with one dollar in the United States. U.S. Department ofLabor, A Chartbook of International Labor Comparisons. 7 U.S. Department of Commerce, U.S. Commercial Service, Doing Business in India. 8 Inflation as measured by the Indian GDP deflator. World Bank, World Development Indicatorsdatabase. 9 GTIS, World Trade Atlas database.
3-2
TABLE 3-1 Inward FDI flows for selected countries,2002–05, (millions of U.S. dollars)Country 2002 2003 2004 2005India 5,627 4,585 5,474 6,598Brazil 16,590 10,144 18,146 15,066China 52,743 53,505 60,630 72,406Hungary 2,994 2,137 4,654 6,699Malaysia 3,203 2,473 4,624 3,967Mexico 18,275 14,184 18,674 18,055Poland 4,131 4,589 12,873 7,724Russia 3,461 7,958 15,444 14,600Source: United Nations Conference on Trade andDevelopment, World Investment Report 2006.
times that of investment into India. FDI into Brazil and Mexico during the period has beenroughly three times that of India. FDI into Poland in the past 2 years surpassed that intoIndia. A closer examination of the factors that influence FDI, such as economic growth,wage levels, infrastructure, and educational level of the work force, suggests that India is acountry with vast potential that has yet to be fully realized.4
Economy
Strong Economic Growth
Few countries have experienced the economic dynamism that India has enjoyed during thepast decade. This positive economic environment has attracted FDI by firms anxious to takeadvantage of higher Indian living standards and increased demand for goods. The Indianeconomy has grown, on average, more than 7 percent annually since 1994,5 and is forecastto grow at a comparable rate in 2006. By 2004, India had become the tenth largest economyin the world and the fourth largest in purchasing-power parity terms.6 With per capita incomehaving more than doubled since the mid-1980s, the Indian middle class has expanded andits purchasing power has increased significantly (box 3-1).7 Economic growth has not beenaccompanied by high inflation—annual inflation in India has remained close to 4 percentsince 2000.8 Increased FDI has stimulated both imports and exports, contributing to risinglevels of international trade. India’s imports almost tripled between 2001 and 2005, from$50.1 billion to $138.4 billion, while exports more than doubled, from $43.3 billion to$99.7 billion.9
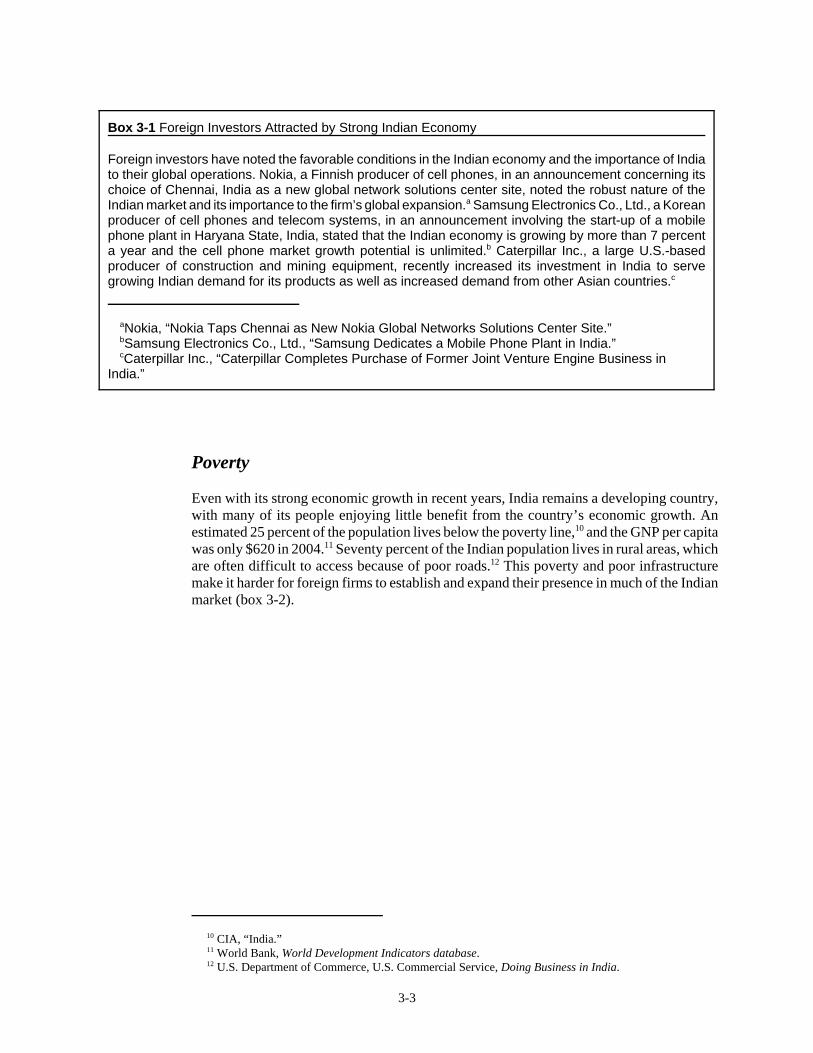
10 CIA, “India.” 11 World Bank, World Development Indicators database. 12 U.S. Department of Commerce, U.S. Commercial Service, Doing Business in India.
3-3
Poverty
Even with its strong economic growth in recent years, India remains a developing country,with many of its people enjoying little benefit from the country’s economic growth. Anestimated 25 percent of the population lives below the poverty line,10 and the GNP per capitawas only $620 in 2004.11 Seventy percent of the Indian population lives in rural areas, whichare often difficult to access because of poor roads.12 This poverty and poor infrastructuremake it harder for foreign firms to establish and expand their presence in much of the Indianmarket (box 3-2).
Box 3-1 Foreign Investors Attracted by Strong Indian Economy
Foreign investors have noted the favorable conditions in the Indian economy and the importance of Indiato their global operations. Nokia, a Finnish producer of cell phones, in an announcement concerning itschoice of Chennai, India as a new global network solutions center site, noted the robust nature of theIndian market and its importance to the firm’s global expansion.a Samsung Electronics Co., Ltd., a Koreanproducer of cell phones and telecom systems, in an announcement involving the start-up of a mobilephone plant in Haryana State, India, stated that the Indian economy is growing by more than 7 percenta year and the cell phone market growth potential is unlimited.b Caterpillar Inc., a large U.S.-basedproducer of construction and mining equipment, recently increased its investment in India to servegrowing Indian demand for its products as well as increased demand from other Asian countries.c
aNokia, “Nokia Taps Chennai as New Nokia Global Networks Solutions Center Site.”bSamsung Electronics Co., Ltd., “Samsung Dedicates a Mobile Phone Plant in India.” cCaterpillar Inc., “Caterpillar Completes Purchase of Former Joint Venture Engine Business in
India.”
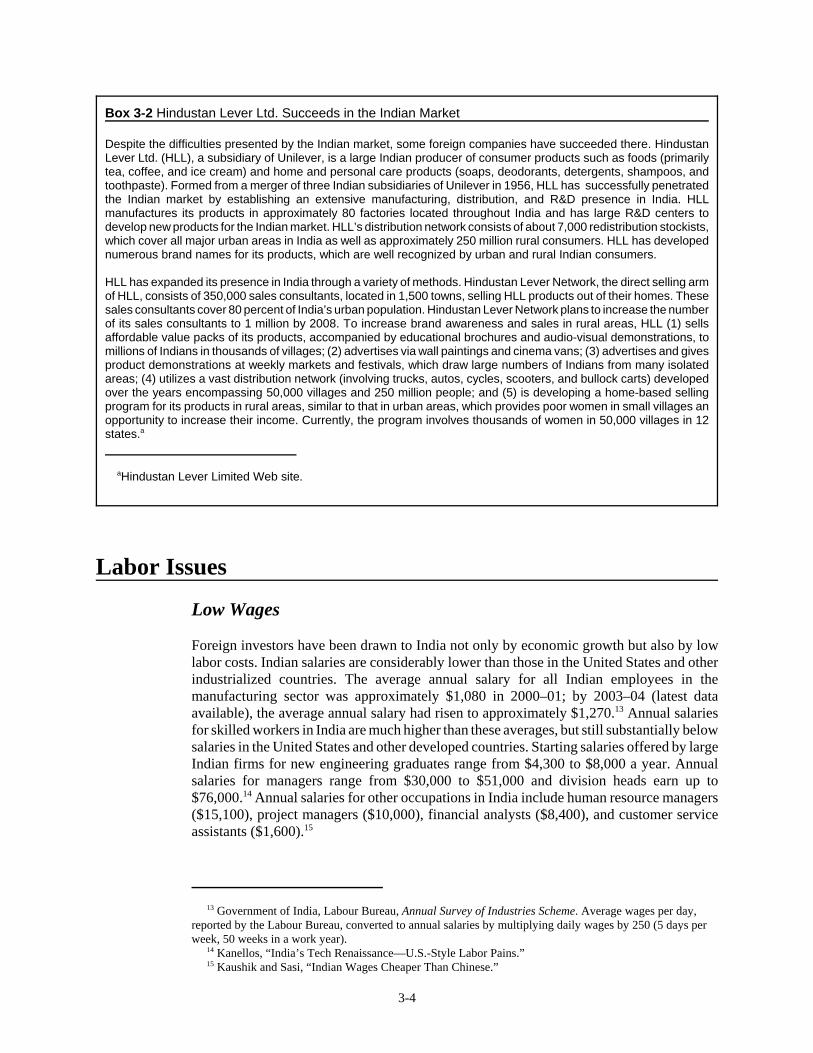
13 Government of India, Labour Bureau, Annual Survey of Industries Scheme. Average wages per day,reported by the Labour Bureau, converted to annual salaries by multiplying daily wages by 250 (5 days perweek, 50 weeks in a work year). 14 Kanellos, “India’s Tech Renaissance—U.S.-Style Labor Pains.” 15 Kaushik and Sasi, “Indian Wages Cheaper Than Chinese.”
3-4
Labor Issues
Low Wages
Foreign investors have been drawn to India not only by economic growth but also by lowlabor costs. Indian salaries are considerably lower than those in the United States and otherindustrialized countries. The average annual salary for all Indian employees in themanufacturing sector was approximately $1,080 in 2000–01; by 2003–04 (latest dataavailable), the average annual salary had risen to approximately $1,270.13 Annual salariesfor skilled workers in India are much higher than these averages, but still substantially belowsalaries in the United States and other developed countries. Starting salaries offered by largeIndian firms for new engineering graduates range from $4,300 to $8,000 a year. Annualsalaries for managers range from $30,000 to $51,000 and division heads earn up to$76,000.14 Annual salaries for other occupations in India include human resource managers($15,100), project managers ($10,000), financial analysts ($8,400), and customer serviceassistants ($1,600).15
Box 3-2 Hindustan Lever Ltd. Succeeds in the Indian Market
Despite the difficulties presented by the Indian market, some foreign companies have succeeded there. HindustanLever Ltd. (HLL), a subsidiary of Unilever, is a large Indian producer of consumer products such as foods (primarilytea, coffee, and ice cream) and home and personal care products (soaps, deodorants, detergents, shampoos, andtoothpaste). Formed from a merger of three Indian subsidiaries of Unilever in 1956, HLL has successfully penetratedthe Indian market by establishing an extensive manufacturing, distribution, and R&D presence in India. HLLmanufactures its products in approximately 80 factories located throughout India and has large R&D centers todevelop new products for the Indian market. HLL’s distribution network consists of about 7,000 redistribution stockists,which cover all major urban areas in India as well as approximately 250 million rural consumers. HLL has developednumerous brand names for its products, which are well recognized by urban and rural Indian consumers.
HLL has expanded its presence in India through a variety of methods. Hindustan Lever Network, the direct selling armof HLL, consists of 350,000 sales consultants, located in 1,500 towns, selling HLL products out of their homes. Thesesales consultants cover 80 percent of India’s urban population. Hindustan Lever Network plans to increase the numberof its sales consultants to 1 million by 2008. To increase brand awareness and sales in rural areas, HLL (1) sellsaffordable value packs of its products, accompanied by educational brochures and audio-visual demonstrations, tomillions of Indians in thousands of villages; (2) advertises via wall paintings and cinema vans; (3) advertises and givesproduct demonstrations at weekly markets and festivals, which draw large numbers of Indians from many isolatedareas; (4) utilizes a vast distribution network (involving trucks, autos, cycles, scooters, and bullock carts) developedover the years encompassing 50,000 villages and 250 million people; and (5) is developing a home-based sellingprogram for its products in rural areas, similar to that in urban areas, which provides poor women in small villages anopportunity to increase their income. Currently, the program involves thousands of women in 50,000 villages in 12states.a
aHindustan Lever Limited Web site.
16 World Bank, World Development Indicators database. 17 The formal sector consists of establishments using electric power and employing 10 or more workers,and establishments not using electric power and employing 20 or more workers. This sector accounts forabout 40 percent of Indian output. Two-thirds of the employees in the formal sector work in the publicsector. Asian Development Bank, “Key Indicators 2005: Labor Markets in Asia,” 46. 18 In a recent survey, 17 percent of Indian managers stated that labor regulations were a major businessconstraint. World Bank, World Development Indicators database. 19 Asian Development Bank, “Key Indicators 2005: Labor Markets in Asia,” 46–51; and Basu, “WhyIndia’s Labour Laws Are a Problem.” 20 Wakhlu, Remarks. 21 Kanellos, “India’s Tech Renaissance—U.S.-Style Labor Pains.”
3-5
Rigidity in the Labor Market
India’s labor market is immense. The labor force totaled 427 million in 2004, an increase of31 million since 2000, with women accounting for 28 percent of the labor force.16 Theorganized, or formal, sector of the work force, however, accounts for less than 10 percentof the total.17 Despite India’s strong economic growth in recent years, the increase inemployment in the organized sector of the economy has not kept pace with the growth of thelabor force. This has generated national concern that the benefits of India’s economicdevelopment have not been spread widely enough.
The inability of the Indian economy to generate sufficient jobs in the organized sector is due,at least in part, to cumbersome and bureaucratic labor policies at the federal and statelevels.18 Both the Indian federal and state governments have the authority to make andenforce labor laws. There are numerous federal and state laws covering labor issues, leadingto administrative overlap and excessive bureaucracy. Federal and state labor agencies alsogenerally focus their enforcement activities on the organized sector, even though this sectoraccounts for only a small percentage of the total Indian work force.
One of the biggest difficulties for employers in India is their inability to lay off workers. TheIndustrial Disputes Act of 1947 and subsequent amendments govern the layoffs of workersand the closure of plants. Firms with 100 or more employees must obtain approval from thegovernment to shut down plants and lay off workers. Approval is typically difficult to obtain,although firms on occasion are able to reduce the number of employees by offering voluntaryseverance and retirement packages. Nonetheless, in the past few years, as the Indianeconomy has experienced greater trade liberalization, the Indian federal and stategovernments appear to have reduced their enforcement of the Industrial Disputes Act withrespect to layoffs and plant closures, apparently in an attempt to increase the flexibility andcompetitiveness of Indian firms.19 For example, one leading Indian executive has noted hisfirm’s ability to lay off workers as long as proper procedures are followed.20
Rising Salaries and High Turnover in Some Industries
Strong demand for skilled workers in India has led to rising salaries and high turnover. Toexpand their operations in India, large multinational computer firms, automotive firms, andelectronics firms have offered to double or triple the salaries of workers employed by Indianfirms and have aggressively recruited graduates from top Indian universities and technicalschools.21 Scientists and engineers in Indian government research laboratories have left topursue opportunities and higher salaries in the private sector. Indian companies have alsoexperienced rapid turnover as their skilled workers leave and go to work for other employers.In the software services industry, one of the cornerstones of FDI in India, turnover recently
22 Kanellos, “India’s Tech Renaissance—U.S.-Style Labor Pains.” 23 Kaushik and Sasi, “Indian Wages Cheaper Than Chinese.” 24 Indo-Asian News Service, “India Woos Foreign Equity in Infrastructure.” 25 Power generation in India is principally a central government and state government function, althoughprivate energy producers play an increasingly important role. 26 U.S. Department of Commerce, U.S. Commercial Service, Doing Business in India. 27 World Bank, “Enterprise Surveys, What Businesses Say.” 28 World Bank, World Development Indicators database. 29 World Bank, “India, Inclusive Growth and Service Delivery.” 30 World Bank, “India Transport Sector.”
3-6
has been between 15 and 30 percent annually.22 Nevertheless, a recent survey of salaries ofskilled workers in 42 occupations in India and China found that salaries in India remainbelow those in China. The salary differentials tended to be greater in those occupationspaying higher salaries.23
Infrastructure
Antiquated Infrastructure
The poor condition of India’s infrastructure reduces both enthusiam for FDI on the part offoreign investors and India’s overall economic growth. Insufficient power, rudimentaryroads, antiquated ports, and an overburdened rail system make it difficult for many firms toproduce and deliver goods and services in a timely and efficient fashion. India’s national andstate governments have achieved some success in expanding and modernizing infrastructurebut a significantly higher level of investment will be necessary to maintain an infrastructurecommensurate with the size of the Indian economy. The Indian government estimates thatthe infrastructure sector will need approximately $320 billion in investment during the next5 years.24
India’s capacity to produce electricity has fallen behind demand in recent years,25 andelectricity demand currently exceeds supply by 30 percent, causing frequent shortages andblackouts.26 Numerous surveys of companies in India attest to the difficulties and added coststo production caused by an unreliable power sector. In one survey of Indian firms,respondents noted that it took 68 days to obtain an electrical connection and indicated thatelectrical outages caused production downtime equivalent to 8 percent of their annual sales.27
In another survey of Indian firms, 29 percent of the managers ranked electricity as a majorbusiness constraint.28 In a survey of private investors in India, respondents indicated that theaverage business in India experiences a power outage almost every other day. In response,most businesses have purchased generators to supply emergency electrical power.29
India’s transport system has also lagged behind the country’s rapid growth. Most Indianroads are narrow, congested, and poorly maintained. Only 41 percent of them are paved, andof these, only 34 percent are 2-lane roads and 1 percent are 4-lane roads. Forty percent of therural population does not have access to all-weather roads and thus is isolated during periodsof bad weather, particularly the monsoon season. Urban areas suffer from severe congestion,with rapid growth in automobile ownership compounding the problem of inadequate roads.Insufficient funds for road maintenance leads to further deterioration of the roads.30
31 Ibid. 32 World Bank, “India, Inclusive Growth and Service Delivery.” 33 World Bank, “India Transport Sector.”
3-7
The capacity of the railway system, particularly in the highly-traveled urban areas, has alsolagged the growth in demand for its services. Indian seaports have experienced dramaticincreases in container cargo but have not expanded cargo handling capacity commensurately.A similar situation has occurred at Indian airports, particularly at the major internationalairports, where annual growth in air traffic of more than 15 percent in recent years has ledto congestion and delays.31
Insufficient infrastructure may continue to plague the Indian economy in the years ahead.It has been estimated that India needs to invest at least 8 percent of its gross domesticproduct annually (approximately $62 billion) in infrastructure to maintain its high rate ofeconomic growth. Actual investment in infrastructure, though, probably has been only3–4 percent of gross domestic product during the past decade. In addition, infrastructureprojects are frequently plagued by long delays and large cost overruns. Projects are oftenstarted but not completed, or completed and not sufficiently maintained in the ensuing years.As infrastructure lags the economy, the effects are felt throughout the country, particularlyin the manufacturing sector, where flexibility in production, low costs, and speed to marketare particularly hampered by clogged roads and ports and power outages.32
Increased Opportunities for Private Sector Participation inInfrastructure Projects
To help alleviate the strains on the infrastructure, large government projects have beeninitiated, including (1) a National Highway Development Program to modernize roadsconnecting India’s four largest cities, Delhi, Mumbai, Chennai, and Kolkata (the GoldenQuadrilateral); (2) a rural roads program to better integrate rural areas into India’stransportation network; (3) a National Railway Development Program to expand railcapacity between major cities and provide better connectivity to Indian seaports; (4) aNational Maritime Development Program to expand freight handling capacity in India’slarge seaports; and (5) a program to increase capacity at the New Delhi and Mumbai airports,which handle about 50 percent of the country’s air traffic.33 Indian federal and stategovernments have also allowed more private sector participation in infrastructure projects,which has provided opportunities for foreign firms to benefit from Indian economic activity.
Traditionally, Indian federal and state governments have financed and built mostinfrastructure projects in India. In recent years, however, the Indian government has turnedto the private sector, both domestic and foreign, for funding, expertise, and faster completionof projects in management, design, and construction. To attract FDI in the construction,maintenance, and operation of roads, the government has provided a number of incentivesto private firms, including (1) government financing of project feasibility studies, landpurchases, movement of utilities, and clearing of the land; (2) government approval of up to100 percent foreign investment in a project; (3) government subsidies of up to 40 percent ofthe cost; (4) 100 percent tax exemption for 10 years out of 20 years after the start of theproject; and (5) duty-free importation of road construction equipment. Private firms canrecoup their investment in these road projects by charging tolls or by receiving an annualannuity from the government. Numerous foreign engineering and construction firms (andprivate Indian firms) have taken advantage of these road project opportunities. To date, 34
34 Government of India, Ministry of Shippping, Road Transport and Highways, Department of RoadTransport and Highways, “Opportunities for Private Sector Participation,” and “Status of BOT ProjectsAwarded.” 35 Government of Goa Web site. 36 U.S. Department of Commerce, U.S. Commercial Service, India: Architecture/Construction/Engineering Services. 37 Government of India, Ministry of Civil Aviation, “Policy on Airport Infrastructure.” 38 U.S. Department of Commerce, U.S. Commercial Service, India: Electric Power Equipment. 39 Colleges generally fall under the purview of state governments; universities/institutes generally fallunder the purview of the central government. 40 Government of India, Ministry of Human Resource Development. 41 Altbach, “Higher Education in India.”
3-8
road projects have been completed by private firms, and another 34 projects are ongoing.34
Indian state governments have also invited foreign engineering and construction firms toparticipate in road projects, patterning such private sector involvement after that of thenational government.35
Opportunities for FDI in other areas of Indian infrastructure, including seaports and airports,have also increased. The Indian Ministry of Surface Transport, which operates India’sseaports, would like to attract private investment of $1.9 billion to increase port capacity.India’s Ministry of Civil Aviation, which operates India’s airports, would like to attract$164 million in private sector investment to expand airport capacity.36 Investment in airportsis accorded favorable tax treatment—profits are exempt from taxation for the first 5 yearsafter the start of the project; for the next 5 years, 30 percent of profits are exempt fromtaxation.37 With respect to the power sector, the government of India is working with Indianstate governments to reform their utilities by moving away from direct operational control,reducing subsidies, pushing for greater financial viability, and allowing greater private sectorinvolvement in power distribution.38
Education
Educated Work Force
India’s educational system is vast, educates millions, and turns out thousands of well-trainedand skilled workers. India has an extensive system of schools, including primary and upperprimary schools, high schools, colleges for general education, colleges for professionaleducation (engineering, technology, medical, and teacher education), anduniversities/institutes.39 In 2003–04, there were approximately 9,400 colleges for generaleducation, 2,750 colleges for professional education, and 300 universities/institutes.40 Indiahas the third largest number of students in higher education in the world, trailing only theUnited States and China. English is the primary language of instruction in these schools,which means that most educated Indian workers speak at least some English.41 In India, thereare more than 200,000 engineering graduates annually, more than 300,000 post graduatesfrom non-engineering colleges, 2.1 million other graduates, and about 9,000 PhDs.
Many foreign investors have established R&D centers in India and have made it an importantlocation for software development. Indeed, 20 percent of the Fortune 500 companies have
42 Government of India, Ministry of Commerce & Industry, Department of Industrial Policy andPromotion, Secretariat for Industrial Assistance, “Destination India.”
3-9
R&D facilities in India, drawn in large part by this vast pool of scientific and technicalexpertise (box 3-3).42
Weaknesses in the Educational System
For all the strengths of the Indian educational system, it is also plagued by a number ofproblems. Only 60 percent of the adult population is literate, so a large portion of thepopulation lacks the skills increasingly necessary to prosper in the Indian economy. Thepercentage of young Indians in higher education (10 percent) is much less than that ofindustrialized countries (more than 50 percent) and of China (15 percent). India has manycolleges and universities, but only a few are world class in terms of research and quality ofteacher instruction. For the most part, funding for classrooms, libraries, laboratories, andinformation technology in Indian colleges and universities is inadequate. There are severefaculty shortages, teacher morale is low, bureaucracy hampers teacher accountability, anddecision making is often influenced by politics. In addition, many Indian technologygraduates pursue graduate study abroad and generally do not return to India. The majorityof those who travel abroad for undergraduate study do not return to India after graduation.All of these deficiencies raise real questions as to the ability of the Indian educational system
Box 3-3 Large U.S. Firms Tap Educated Indian Work Force
Three major U.S. companies are among the many to set up R&D facilities in India. Motorola, a U.S. provider of mobiletelecommunications devices, has rapidly expanded its presence in India in recent years to take advantage of Indianengineers and software writers. In 1991, Motorola established its first R&D center in India. The firm now has six R&Dcenters engaged in research involving telecom switching technologies, embedded computing, converged networks,autonomic networking, and enterprise applications. India has also become a major source for software developmentand software solutions for Motorola, including much of the software used in Motorola cell phones sold worldwide. Thefirm’s investment in technology and R&D in India increased from $50 million in 2002 to $85 million in 2005. Investmentis projected to grow by 10-15 percent each year into the future. Employing over 2,800 Indian engineers, Motorolaconsiders India to be an important hub for R&D and software development, as well as a center for designing andmanufacturing products for regional markets.a
Microsoft has also turned to India for its technical expertise. Begun in 1998 with 20 employees, the Microsoft IndiaDevelopment Center has expanded to more than 900 employees and become the second largest MicrosoftDevelopment Center outside of corporate headquarters in Richmond, Washington. The Center works on softwaredevelopment for more than 35 products.b Attracted by India’s engineering knowledge and skills, General Electric opened the John F. Welch Technology Centrein Bangalore, India, in September 2000. This center, along with GE’s three other R&D facilities in Schenectady, NewYork, Munich, Germany, and Shanghai, China, comprises GE’s Global Research team, which conducts R&D andengineering activities for all GE businesses. The center in Bangalore conducts R&D in a number of areas, includingmechanical engineering, electronic and electrical system technology, ceramics and metallurgy, chemical engineering,and polymer science and synthetic materials.c
aMotorola.bMicrosoft.cGeneral Electric.
43 Altbach, “Higher Education in India”; and Kapur, Remarks. 44 World Bank, “India, Inclusive Growth and Service Delivery.” 45 U.S. Department of Commerce, U.S. Commercial Service, Doing Business in India. 46 Ibid. 47 Chakrabarti, The Financial Sector in India Emerging Issues, 176; Deutsche Bank Web site; HSBC Website; and Iloveindia Web site. 48 Government of India, Ministry of Commerce & Industry, Department of Industrial Policy andPromotion, Secretariat for Industrial Assistance, “Destination India”; U.S. Department of Commerce, U.S.Commercial Service, Doing Business in India; Bombay Stock Exchange Web site; and National StockExchange Web site.
3-10
to continue to turn out sufficient numbers of well-trained graduates to enable India tomaintain its competitiveness in the global economy.43
Access to CapitalThe Indian financial sector has experienced significant reforms in recent years. Governmentcontrol and regulation have been reduced, interest rates have been allowed to fluctuate withthe market, restrictions on capital inflows have been loosened, and private firms have beenencouraged to participate.44 Although the Indian government is still the dominant actor in thefinancial sector, foreign firms in India can access capital through bank loans, equity markets,and international financial institutions.
India has a large banking system comprised of state-owned banks, private (Indian-owned)banks, and foreign-owned banks. The state-owned banks account for more than 70 percentof all deposits and loans. The respective percentages for private and foreign banks are17 percent and 13 percent. The presence of foreign banks and private (Indian-owned) bankshas led to increased competition in the banking sector. By providing better customer servicethrough more bank branches, ATM machines, electronic and telephone banking, and longerhours, these banks have taken market share from the state-owned banks and forced them tobecome more responsive to customer needs. Some of the state-owned banks haverestructured and government ownership has been reduced.45
State-owned banks and private (Indian-owned) banks concentrate on lending to the rural andagricultural sectors of the Indian economy and to Indian-owned companies.46 Several dozenlarge foreign banks have established operations in India in recent years, including Citibank,HSBC, Deutsche Bank, Mizuho Financial Group, Abu Dhabi Commercial Bank Ltd., andAmerican Express Bank Ltd. Among other activities, the foreign banks typically offer a fullrange of banking services, including loans, to the Indian operations of foreign firms.47
India has 23 stock exchanges with approximately 9,000 listed companies. Only two of thesestock exchanges, however, the National Stock Exchange and the Bombay Stock Exchange,are true national exchanges, and they account for virtually all of the stock trading that occursin the country. Foreign firms doing substantial business in India can raise equity capital inthe Indian capital markets through the issuance of Indian Depository Receipts. A number offoreign firms are listed on the National Stock Exchange and/or the Bombay Stock Exchange,including Gillette Ind., Glaxosmith, Nestle Ltd., Novartis Ind., Siemens Ltd., and SKF India.Unlike the active equity markets, the Indian debt market is small, with very little trading ofnotes and bonds, effectively precluding debt instruments as a way to raise capital.48 The lending activities of non-Indian government agencies and international financialinstitutions provide another source of capital for foreign firms in the Indian market. The U.S.
49 OPIC, Annual Reports for 2004, 2005, and 2006. 50 Asian Development Bank Web site. 51 As part of India’s National Highway Development Program, 29 road projects are currently being fundedby the ADB. Nineteen of these projects involve Indian and foreign firms, eight projects involve only foreignfirms, and two projects involve only Indian firms. Foreign firms include firms from South Korea, China,Denmark, Switzerland, Malaysia, and the United States. Government of India, Ministry of Shipping, RoadTransport and Highways, Department of Road Transport and Highways, “Externally Aided Projects.” 52 World Bank Web site. 53 As part of India’s National Highway Development Program, 27 road projects are currently being fundedby the World Bank. Seventeen of these projects involve Indian and foreign firms, one project involves onlyforeign firms, and nine projects involve only Indian firms. Foreign firms from France, the United Kingdom,Malaysia, Russia, Singapore, Canada and Thailand are represented. Government of India, Department ofRoad Transport and Highways, “Externally Aided Projects.”
3-11
Overseas Private Investment Corporation (OPIC) assists U.S. companies investing indeveloping countries by providing loans, guarantees, and political risk insurance. OPICchooses projects that can strengthen a country’s economy and enhance its long-termeconomic growth. In the past several years, OPIC has been involved in three projects inIndia. In 2004, it provided $360,000 in political risk insurance for modular homemanufacturing; in 2005, OPIC provided $4.8 million in financing to expand a foodmanufacturing plant in India; and in 2006, OPIC provided $2.8 million in financing for thepurchase of equipment and for marketing and distribution activities.49
The Asian Development Bank (ADB) assists developing countries by providing loans,technical assistance, grants, guarantees, and equity investments. In a typical year, the ADBlends about $6 billion to countries in the Asia-Pacific region and gives $180 million intechnical assistance. India is one of the largest recipients of ADB assistance. In 2005, theADB approved more than $1 billion in loans for India, $106 million in grants and technicalassistance, and $21 million in equity investments and guarantees. ADB assistance for Indiahas been concentrated in infrastructure, with loans and technical assistance for projectsinvolving water supply, sanitation, waste management, roads, agriculture and naturalresources, energy, and finance.50 Such assistance from the ADB has generated opportunitiesfor foreign investment by private firms. For example, many of the road projects involvedboth foreign and Indian engineering and construction firms.51
Two of the World Bank’s agencies, the International Bank for Reconstruction andDevelopment (IBRD) and the International Development Association (IDA), assist economicdevelopment in developing countries by providing low interest loans, interest free loans, andgrants for projects involving infrastructure, education, health, energy, and other relatedpurposes. India is the largest recipient of assistance from the World Bank. A sizeable partof this assistance involves the transport sector in India. The World Bank has made a numberof loans totaling nearly $5 billion to expand the capacity of the rail system, assist in theconstruction and maintenance of national and state highways and rural roads, and to improvethe system of public transportation in Mumbai.52 These loans have provided opportunitiesfor investment; foreign engineering and construction firms are participating in many of theroad projects.53
The International Finance Corporation (IFC), another World Bank agency, promoteseconomic growth in developing countries by assisting private companies through loans,equity investments, guarantees, and technical and financial advice. The IFC has been activein India since 1956. India is the third largest recipient of IFC assistance; as of July 2006, theIFC’s current assistance totaled $1.3 billion. IFC activities in India are focused on helpingmanufacturing firms improve their international competitiveness, increasing private sector
54 IFC financial support was provided to a United Kingdom oil and gas company to expand its productioncapacity in India, a U.S. engineering and environmental consulting firm to construct small hydroelectricgeneration facilities in India, and a Chinese carbon black producer to upgrade and expand the capacity of itscarbon black plant in India. International Finance Corporation Web site. 55 U.S. Department of Commerce, U.S. Commercial Service, India: Architecture/Construction/Engineering Services. 56 U.S. Department of Commerce, U.S. Commercial Service, Doing Business in India. 57 Reuters, “World Bank Halts India Health Funds on Fraud Claim.” 58 Inadequate supply of infrastructure and restrictive labor regulations were the first and third mostproblematic factors, respectively, for doing business in India, as reported by the survey respondents. Forpurposes of the survey, respondents were asked to choose the five most problematic factors for doingbusiness in India from a list of 14 factors. Some of the other factors included tax regulations, tax rates, crimeand theft, government instability/coups, inadequately educated workforce, and policy instability. This surveyof business executives, assessing the business climate in 125 countries, is conducted annually by the WorldEconomic Forum. Lopez-Claros, et al., The Global Competitiveness Report, 140, 242.
3-12
involvement in infrastructure development, and supporting private firms in the areas offinancial services, information technology, and oil and gas exploration and production.Although IFC’s assistance in many instances has been directed toward Indian companies,foreign firms with operations in India have also benefitted from IFC financial aid.54
Bureaucracy and CorruptionExcessive bureaucracy and corruption discourage FDI by distorting the efficient allocationof resources, increasing the cost of doing business, and breeding mistrust of governmentofficials. Although India has taken steps in recent years to open up more sectors of itseconomy to FDI and to streamline the investment process, FDI into the country remainshindered by government bureaucracy and corruption. Foreign businesses report instanceswhere investment decisions and approval by Indian government ministries drag on forlengthy periods of time for no apparent reason.55 The Indian government procurement systemfor certain areas of business has been plagued by instances of corruption; a number ofgovernment officials have been convicted under Indian anti-corruption laws in the pastseveral years.56 Recently, the World bank suspended funding for some health care projectsin India due to allegations of fraud and corruption in the procurement of medicines.57
In a survey of business executives, respondents indicated that inefficient governmentbureaucracy and corruption were the second and fourth most problematic factors,respectively, for doing business in India.58 See chapter 5 for a discussion of bureaucraticconcerns related to the Indian court system.
1 Government of India, Ministry of Commerce & Industry, “SEZs Future Vehicle of Economic Activity.” 2 Government of India, Ministry of Commerce & Industry, “Special Economic Zones in India—About.” 3 Confederation of Indian Industry, Northern Region, “Special Economic Zones—Engines for Growth,” 4.
4-1
CHAPTER 4 Special Economic Zones
IntroductionIndia, like many countries, offers incentives to attract foreign investors, many of which areconcentrated into special economic zones (SEZs). These zones allow the Indian governmentto package a number of incentives in a simplified manner and in a centralized location. SEZsoffer privileged trading terms and other inducements to foreign investment. As of November2006, 41 SEZs were operational in India, and approvals for more than 237 had been granted.1SEZs are growing in number, size, and production output and as a result are becoming morevital to the success of the Indian economy. Indian exports from SEZs increased by 114percent between the 2000 and 2004 fiscal years and are expected to grow at an even fasterrate in coming years. Exports from SEZs were valued at $5.1 billion for the 2005 fiscal yearand are projected to reach $15 billion in the 2007 fiscal year, a 195 percent increase.2Electronics (half of which is software development) and gems and jewelry made up morethan 75 percent of the exports from SEZs during 2002 (latest available data). Totalinvestment in India’s SEZs increased by almost 75 percent between 1998 and 2003, with theproportion of foreign investment rising 7 percent, to 25 percent of total.3
Incentives to Invest in SEZsSEZs provide three types of incentives for enterprises to locate their business operations inIndia. First, the SEZs provide tax, tariff, and financial incentives, by defining SEZs as freetrade enclaves. Second, the zones improve on the general bureaucratic and administrativesituation that many businesses face when establishing in India. Third, SEZs provide reliableinfrastructure that is not always available elsewhere in India. All of these incentives areapplied equally to both Indian and foreign firms.
Tax and financial incentives for potential investors include substantial income tax deductionsfor the first 10 years of operations. For the first five years after operations begin, firms payno income tax at all. For the next two years they receive a tax reduction of 50 percent.During years 8-10, the firm can debit up to 50 percent of its profits from the previous yearto a “Special Economic Zone Re-investment Allowance Reserve Account.” This value canthen be used within three years of when the account was established for future reinvestmentsin the business, such as machinery and plant improvements. Outside
4 Fraser, et al. European Policy Centre, “EU-India Relations .” 5 Government of India, Ministry of Commerce & Industry, “Special Economic Zones in India—Facilitiesand Incentives.” 6 The Foreign Investment Promotion Board oversees cases which are approved outside this “automaticroute,” a process which takes approximately 6 weeks. 7 Government of India, Ministry of Commerce & Industry, “Special Economic Zones in India—Facilitiesand Incentives.” 8 Confederation of Indian Industry, Northern Region, “Special Economic Zones—Engines for Growth,” 1. 9 U.S. India 2006 CEO Forum, “U.S. India Strategic Economic Partnership.” 10 By comparison, China reportedly spends $260 billion on infrastructure annually. Bindra, “India BattlesInfrastructure Woes.” 11 World Bank, “Enterprise Surveys, India 2006.”
4-2
of the SEZs, India's average tariff rates are still among the highest in the world.4 This makesIndia a much less attractive destination for export-oriented firms that depend on importedinputs. However, tariff incentives exempt firms in SEZs from all customs duties on importedgoods, so long as they are re-exported, which creates a beneficial environment for exportoriented firms who need inexpensive and easy access to manufacturing inputs. Otherfinancial incentives include the reimbursement of duties paid on furnace oil and exemptionsfrom state and central sales taxes paid on domestic purchases. SEZ units can also borrow upto $500 million per year through recognized banking channels without maturity restrictions.Profits are allowed to be freely repatriated.5
SEZs allow investors to avoid many bureaucratic and administrative barriers as well. First,the limits on foreign equity ownership that apply to certain sectors in India are eliminatedin SEZs. Second, all investments in SEZs are administered through the automatic route,which empowers the Reserve Bank of India (RBI) to automatically approve the investmentwithin a period of two weeks.6 Third, firms operating in SEZs do not need a license to importgoods. Unlike in India’s previous generation of Export Processing Zones (EPZs), customsinspections are kept to a minimum in order to eliminate delays in product availability. Thesefactors provide incentives for investment by improving manufacturer’s ability to accessproduction inputs. Other administrative barriers have been eliminated as well. In general,separate documentation is no longer required for customs and the administration of theExport-Import Policy. Firms in SEZs also have an exemption from industrial licensingrequirements that is normally only provided to small scale industries and sectors.7 Theclarification of these administrative procedures makes the investment process much simplerin SEZs compared to other areas of India.8
One of the most important incentives that SEZs provide is reliable infrastructure. The US-India CEO Forum, composed of 20 chief executives representing a broad spectrum ofindustrial sectors from both countries, has identified India’s poor infrastructure as a key areaof needed economic cooperation and a major impediment to new U.S. investment. TheForum recognized that “India’s infrastructure needs exceed its domestic funding capacity”and one of its recommendations was to continue setting up large scale SEZs that compriseworld-class infrastructure with integrated real estate, power, and transportation facilities.9Outside of the SEZs, with a population of just over 1 billion, India spends just $35 billiona year on infrastructure,10 and investors frequently encounter difficulties related toinfrastructure.11
Adequate infrastructure is a prerequisite for an area to be approved as an SEZ. All of India’sSEZs have uninterrupted water and power supplies, guaranteed by state governments; poweris distributed through sub-stations that are dedicated to distributing power only to a specificSEZ. Additional infrastructure facilities include developed plots, built-up space, and
12 World Bank, “India Transport Sector.” 13 This information was acquired from the various Web sites of operational SEZs. These sites include http://www.sez2.com, http://www.leandlasez.com, http://www.csez.com, http://www.surssez.com, andhttp://www.nap2.com. 14 Government of India, Ministry of Commerce & Industry, “Special Economic Zones in India—HomePage.” 15 Government of India, Ministry of Commerce & Industry, “Special Economic Zones—About.” 16 Ibid. 17 A single window facility is a streamlined system that allows all applications to be directed to one singlepoint for review. 18 Industries Commissionerate, Government of Gujarat, New Initiatives, Special Economic Zones.
4-3
telecommunication lines, as well as supportive services, such as in-house customs facilities,post offices, banks, canteens, courier services, travel agents, medical services, shopping,food services, and worker housing. Most importantly, however, the SEZs provide reliableaccess to trade opportunities through well integrated transportation facilities. The majorityof the zones are within 25 km of a major metropolitan area that provide ports and airports,and other transportation services essential to international merchandise trade. Even thoughports and airport facilities are often not available within or directly adjacent to the zone, eachSEZ provides access to these facilities through both railways and highways. Many Indianhighways are narrow and congested, with poor surface quality and the rail system also facessevere capacity constraints with very high rail freight costs.12 By contrast, most SEZs havenewly built, high quality rail and highway systems that reduce congestion and transportationcosts.13 See chapter 3 for additional information on India’s infrastructure concerns outsideof the SEZs.
Establishment and Licensing of SEZsIn India, an SEZ is a specifically delineated, duty-free enclave that is deemed to be foreignterritory for the purposes of trade operations, including tariff treatments.14 Goods transitinginto the SEZ areas from the rest of India are considered Indian exports. Goods coming fromthe SEZ areas into the Indian economy are treated as Indian imports. The laws, regulations,and incentives that apply to these zones are separate from those that apply to the rest of thecountry.15
In March 2000, India’s new Special Economic Zone Policy modified the country’s existingpolicy on EPZs to establish SEZs that would provide an environment to facilitate theproduction of goods intended for export. SEZs can be set up by the public sector, by privatefirms, or as joint cooperative efforts between the two sectors.16
The change to SEZs was meant to solve several problems with the existing EPZ policy. Onesignificant issue was the lack of a single window application facility,17 both within the zoneand at the national level. Without such a “single window,” establishing both EPZs and theindividual firm units within them, required a firm to acquire individual clearances fromseveral separate departments within the government and the EPZ administrative body.Within the EPZ, separate departments were in charge of approving and allocating landallotments, water and power supplies, and building and environmental clearances. Theestablishment process has been greatly simplified in the current SEZs. In addition, conditionsfor approval have been relaxed, customs rules have been simplified, and additional oversightresponsibilities have been given directly to the Development Commissioners Office in orderto maintain consistency.18
19 Government of India, “SEZ Rules 2006, Chapter 2, Procedure for Establishment of Special EconomicZone.” 20 Government of India, Ministry of Commerce & Industry, “Special Economic Zones in India—About.” 21 Government of India, Ministry of Commerce & Industry, Department of Commerce, Annual Report2005–2006, 59. 22 Government of India, Ministry of Commerce & Industry, ‘Special Economic Zones in India—How toApply.”
4-4
In the SEZ Act of 2005, the Indian government clarified and simplified the procedures forestablishing an SEZ. The Act established specific minimum size requirements for differenttypes of SEZs. There are exceptions to some regulations in order to promote certainindustries or in regions of the country that are considered to be land restricted (table 4-1).Other criteria for approval reinforce that the units within the SEZ must abide by local lawsand regulations as well as develop necessary infrastructure. For example, SEZs must abideby local laws in regard to area planning, sewage disposal, pollution control, as well as allother industrial and labor laws. Also, at least 35 percent of the land area must be used for thecore manufacturing processes, and directly associated storage and distribution facilities. Theremaining land area can be used for non-core production facilities such as hospitals, housingdevelopments, shopping, and other commercial development.19
The approval process for the development of a new SEZ is shared by the federal and stategovernments. Proposals for establishing an SEZ are first routed through the concerned stategovernment, which has 45 days from the date of receipt to render a decision. The stateforwards the application, along with its recommendation, to the Board of Approval, part ofIndia’s federal Department of Commerce.20
An individual firm’s proposal to set up a new business unit within an SEZ must be approvedby the Approval Committee for each Zone (figure 4-1). The Committee consists of theDevelopment Commissioner, the Customs Authorities, and representatives of the relevantstate government. The Development Commissioner is the de facto chairman of the ApprovalCommittee and head of the SEZ. All clearances for importer-exporter code number, changein the name of the company or implementing agency, land allotments, and developmentplans are given through a single window facility by the Development Commissioner,generally within 15 days.21 If approved, firms receive a letter of permission from theCommissioner, which specifies the items of manufacture or service activity, annual capacity,projected annual exports for the first years in dollar terms, net foreign exchange earnings,and any limitations regarding the sale of finished goods and their by-products in thedomestic tariff area.22
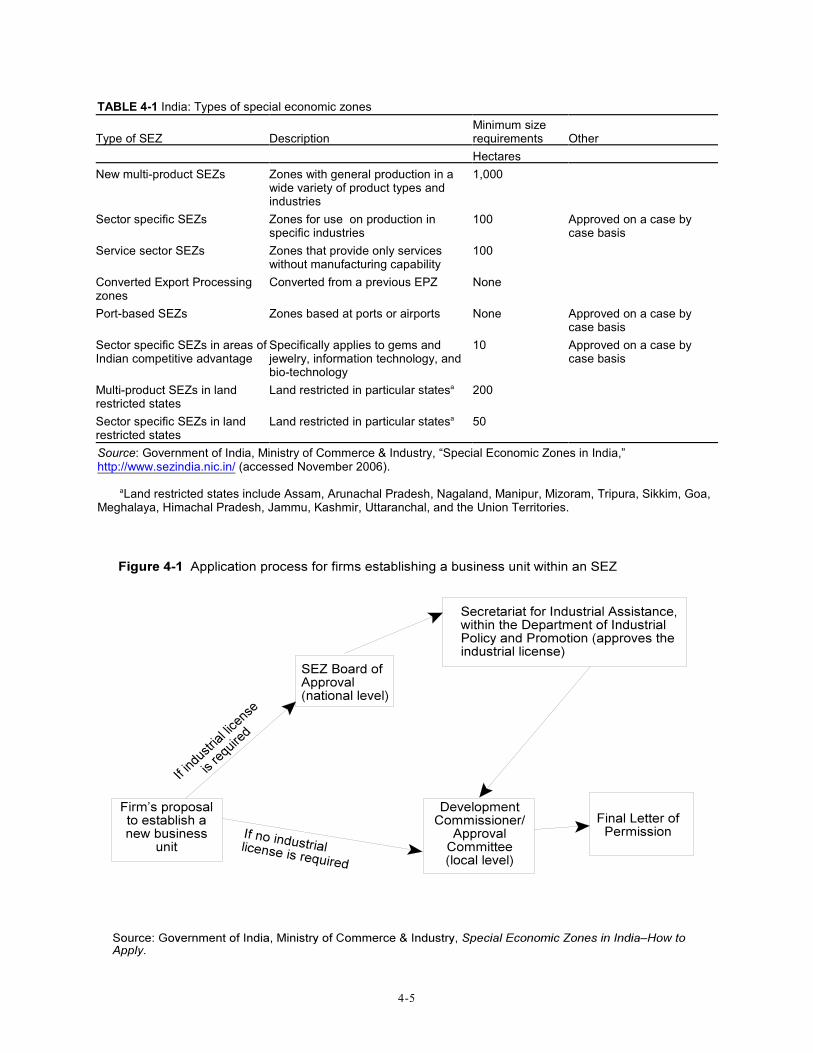
4-5
TABLE 4-1 India: Types of special economic zones
Type of SEZ DescriptionMinimum sizerequirements Other
Hectares
New multi-product SEZs Zones with general production in awide variety of product types andindustries
1,000
Sector specific SEZs Zones for use on production inspecific industries
100 Approved on a case bycase basis
Service sector SEZs Zones that provide only serviceswithout manufacturing capability
100
Converted Export Processingzones
Converted from a previous EPZ None
Port-based SEZs Zones based at ports or airports None Approved on a case bycase basis
Sector specific SEZs in areas ofIndian competitive advantage
Specifically applies to gems andjewelry, information technology, andbio-technology
10 Approved on a case bycase basis
Multi-product SEZs in landrestricted states
Land restricted in particular states 200 a
Sector specific SEZs in landrestricted states
Land restricted in particular states 50 a
Source: Government of India, Ministry of Commerce & Industry, “Special Economic Zones in India,”http://www.sezindia.nic.in/ (accessed November 2006).
Land restricted states include Assam, Arunachal Pradesh, Nagaland, Manipur, Mizoram, Tripura, Sikkim, Goa,a
Meghalaya, Himachal Pradesh, Jammu, Kashmir, Uttaranchal, and the Union Territories.
23 Embassy of India, “FDI Policy and Procedure.” Industries which require an industrial license includealcoholic drinks; cigarettes and tobacco products; electronic aerospace and defense equipment; explosives;hazardous chemicals such as hydrocyanic acid, phosgene, isocynates and di-isocynates of hydrocarbons andtheir derivatives. 24 Government of India, Ministry of Commerce & Industry, “Special Economic Zones in India—How toApply.” 25 Government of India, Ministry of Commerce & Industry, “Special Economic Zones in India—Criteriafor Automatic Approval.” 26 EIU, India Country Commerce Main Report. 27 Ibid.
4-6
An industrial license is required for business unit proposals involving industries retainedunder compulsory licensing, manufacturing of items reserved for small scale sectors, andsituations in which the proposed location is restricted.23 These proposals are first consideredat the national level by the SEZ Board of Approval, and then by the Secretariat for IndustrialAssistance at the Department of Industrial Policy and Promotion, who grants the actuallicense. If the SEZ approval and the industrial license are granted, then the application isforwarded to the local Development Commissioner, who can then issue a letter ofpermission. The SEZ Act also specifies that the units must be net foreign exchange earners,but that they will not be subject to any predetermined minimum export performancerequirements.24
While the Indian government continues to restrict FDI in industries that are consideredsensitive outside of SEZs, such as agriculture and retailing, 100 percent investment isallowed through the automatic route for all activities in Special Economic Zones (SEZs),except for the manufacturing of weapons and defense equipment, hazardous chemicals,narcotics, alcohol, and tobacco products.25
Other FDI IncentivesIndia provides investment incentives outside of SEZs as well. These are generally designedto channel FDI to specific industries, promote development of economically impoverishedregions, and encourage exports. The lack of reliable infrastructure outside of the SEZs is asignificant factor preventing India from reaching its full growth potential. With this in mind,the Indian government has begun to remove restrictions on foreign investors ininfrastructure. Beginning in March 2005, the government has allowed 100 percent FDI ininfrastructure and construction development projects, as well as townships and housingprojects, subject to minimum capitalization requirements.26
In addition to liberalizing ownership equity caps, there are a number of tax incentives forforeign firms to invest in infrastructure, including 10-year tax holidays that can be usedanytime during the first 20 years of operation for enterprises that build, maintain, or operateinfrastructure facilities. Other incentives include exemptions from income tax on interest andfrom long-term capital gains tax on infrastructure investments, and the ability to deduct 50percent of profits for five years for setting up and operating large, specific types ofinfrastructure.27
Additional FDI incentives in India include accelerated depreciation and permitting taxdeductions for R&D expenses. The specifics vary slightly depending on the region and

28 Ibid.
4-7
industry. The FDI approval process has also been shortened and simplified through theimplementation of the automatic route for approval in more and more industries. Theseincentives, along with the continued liberalization of caps on foreign firms’ ownership equityin most industries, have contributed to the recent steep increases of FDI in India.28

1 Prior to 1991, all FDI proposals were approved on a case-by-case basis with a 40 percent total foreignequity participation cap. IMF, India: Selected Issues, 21. 2 Industrial licenses are regulated under the Industries (Development and Regulation) Act of 1951, and areused to regulate the scale, technology, and location of certain investment projects that may presentenvironmental, safety, or strategic concerns to the government of India. Government of India, Ministry ofCommerce & Industry, Department of Industrial Policy and Promotion, Investing In India: Foreign DirectInvestment Policy & Procedures, 8. Industrial licenses are granted by the Secretariat for Industrial Assistance(SIA) within the Department of Industrial Policy and Promotion, Ministry of Commerce & Industry.Decisions are usually rendered within 4 to 6 weeks of filing. Government of India, Ministry of Commerce &Industry, Department of Industrial Policy and Promotion, Investing In India: Foreign Direct InvestmentPolicy & Procedures, 8. 3 Ibid., 34. 4 The FIPB is part of India’s Ministry of Finance. 5 Investments below Rs 10 million (approximately $234,000) in plant and machinery. 6 Government of India, Ministry of Commerce & Industry, Department of Industrial Policy andPromotion, Investing In India: Foreign Direct Investment Policy & Procedures, 1–6. 7 EIU, India: Country Commerce 2006, 22. 8 Foreign firms may establish as an incorporated or unincorporated entity, an incorporated company, aliaison or representative office, a project or branch office, or a “stand alone” branch office in a specialeconomic zone. Government of India, Ministry of Commerce & Industry, Department of Industrial Policyand Promotion, Investing In India: Foreign Direct Investment Policy & Procedures, 14–15.
5-1
CHAPTER 5FDI Regulation and Dispute SettlementFDI Procedures
Foreign investment policy in India has been significantly liberalized since comprehensivemacroeconomic reforms began in July 1991.1 As of April 2007, 100 percent foreign equityis permitted in most sectors via automatic approval, with a handful of sectors subject toindustrial licensing restrictions,2 and only a few industries are entirely closed to foreignparticipation due to political or national security sensitivities (appendix A).3 This chapter willreview India’s regulatory environment for FDI, including the approval process for newinvestments; regulation related to labor and intellectual property concerns; and legalalternatives for dispute settlement.
Foreign investment in India is approved through two routes: automatic and case-by-casegovernment approval. Under the automatic route, foreign investment in an Indian entity doesnot require prior government approval. To qualify for the automatic route, companiesinvesting in approved industries must notify the Reserve Bank of India (RBI) within 30 daysof receipt of funds and issuance of shares to the foreign investor. In other cases, governmentapproval by the Foreign Investment Promotion Board (FIPB) is required.4 These casesinclude sectors that require industrial licenses, foreign investments exceeding 24 percent ofequity in small-scale industries,5 foreign investments where the foreign interest has anexisting venture in the same field in India, and all proposals falling outside thepredetermined sectoral caps or in sectors where FDI is usually not permitted, but authorizedin certain cases at the discretion of the Indian government.6 Foreign investments in existingcompanies and foreign technology collaboration agreements are also subject to case-by-caseapproval requirements.7 There appear to be few or no limitations on forms of establishment.8
9 EIU, India: Country Commerce 2006, 21. 10 Planning Commission, Government of India, Foreign Investment, India, 32–33. 11 Government of India, Ministry of Commerce & Industry, Department of Industrial Policy andPromotion, Investing In India: Foreign Direct Investment Policy & Procedures, 21. 12 Government of India, Planning Commission, Foreign Investment, India, 71. 13 Sahoo, “Foreign Direct Investment in South Asia,” 10. 14 World Bank, The Investment Climate in Brazil, India, and South Africa, 23–24. 15 Bhati, Foreign Direct Investment, 91. 16 U.S. Department of Commerce, U.S. Commercial Service, Doing Business in India, 113. 17 Due to the unregulated discretionary power of state and local regulators, corruption has been identifiedas an additional obstacle to FDI in India. World Bank, Sustaining India’s Services Revolution, 30. 18 U.S. Department of Commerce, U.S. Commercial Service, Doing Business in India, 113.
5-2
In addition to approving particular investment proposals, the FIPB is also the primary contactfor large multinational companies planning extensive investment projects.9 The Departmentof Industrial Policy and Promotion (DIPP), under the Ministry of Industry and Commerce,is responsible for all other foreign investment activity in India.10 Within DIPP, the Secretariatfor Industrial Assistance (SIA) provides a one-stop shop (or “single window facility”) forentrepreneurial assistance, investor facilitation, project setup and monitoring, and applicationprocessing.11 Further, the Foreign Investment Implementation Authority (FIIA), which ischaired by the SIA, provides proactive investor services for projects that have alreadyreceived central government approval.12 The FIIA helps investors obtain state-levelclearances, assists with any operational problems, and liaises between various governmentagencies on behalf of investors to speed approval of FDI inflows.13 Chapter 3 discusses theapproval process for FDI in India’s special economic zones (SEZs).
FDI RegulationAlthough Indian business regulation principally falls under the jurisdiction of federal law,state governments are empowered to design and regulate their own FDI policies.14
Consequently, the regulatory burden on foreign investors tends to be higher at the state levelwhere application and approval procedures can vary widely across states. Moreover, FDIprojects already approved at the central government level tend to bottleneck as they proceedsince nearly 70 percent of the approvals and applications needed for eventual FDIimplementation are obtained from state governments.15 State-level impediments to FDI canbe severe, to the point that companies have been known to abandon FDI projects mid-waythrough implementation due to issues such as onerous zoning, land-use, and environmentalregulations.16 In addition to difficult compliance procedures, such as the example mentioned,regulatory burden can take other forms in India. These can include long delays in gettingnew connections from public sector utilities, frequent visits by government inspectors, andthe payment of bribes to avoid bureaucratic red tape.17 As a result, the federal governmenthas made efforts to establish independent regulators in sectors such as telecommunications,securities, and insurance in order to streamline supervision below the federal level.18 Sinceit is impossible to comprehensively address all of the state FDI regulations here, appendixB provides website links to the investment promotion agencies for each of India’s states andterritories.
19 Sahoo, “Foreign Direct Investment in South Asia,” 11. 20 IBRD/World Bank, Doing Business in South Asia 2007, 31. 21 EIU, India: Country Commerce 2006, 81. 22 Ibid. 23 World Bank, The Investment Climate in Brazil, India, and South Africa, 19. 24 IBRD/World Bank, Doing Business in South Asia 2007, 31. 25 World Bank/IFC, India: Investment Climate and Manufacturing Industry, 28–29. 26 Deloitte, China and India: The Reality Beyond the Hype, 5.
5-3
Labor RegulationAs described in chapter 4, the state of the labor market and related regulations are also animportant factors for foreign investors to evaluate when making an FDI commitment. Similarto FDI policy, labor regulations are enacted at both the central and state government levels.19
As of 2006, India maintains 47 national laws and 157 state regulations that directly orindirectly address labor markets (table 5-1).20 India has a number of labor laws addressingissues such as the resolution of industrial disputes, the regulation of working conditions,labor compensation, insurance, child labor, and equal pay. Generally viewed as moreprotective of workers’ rights, Indian laws such as the Minimum Wages Act, the Payment ofWages Act, and the Employees Provident Fund and Miscellaneous Provisions Act guaranteeemployee salaries regardless of whether companies are profitable, allow central or stategovernments to set worker wages in any type of business establishment, prohibit anyunauthorized wage deductions or reductions, and ensure retirement savings and benefits forall permanent company employees.21
Many of these labor laws are viewed as overlapping, potentially inconsistent, andcumbersome.22 In particular, the Industrial Disputes Act (IDA) requires companies with morethan 100 employees to secure state government permission to dismiss workers. Suchpermission can be difficult to obtain, but application of the IDA tends to vary across states.23
According to recent research, Indian states with more restrictive labor laws tended to havefewer factories, with estimates suggesting that almost 3 million formal manufacturing jobswere lost due to the general application of IDA provisions.24 Furthermore, businesses thathire contract workers to fill production gaps are subject to the Contract Labor Act, whichgives state governments the right to abolish contract labor at any time, in any industry, infavor of permanent workers.25 In states where contract labor is more restricted, keepingemployment below the 100 employee threshold is the only way companies can maintainflexibility in the allocation of manpower. Consequently, Indian labor laws tend to reinforceexit barriers for investors and dampen overall FDI in labor-intensive industries.26
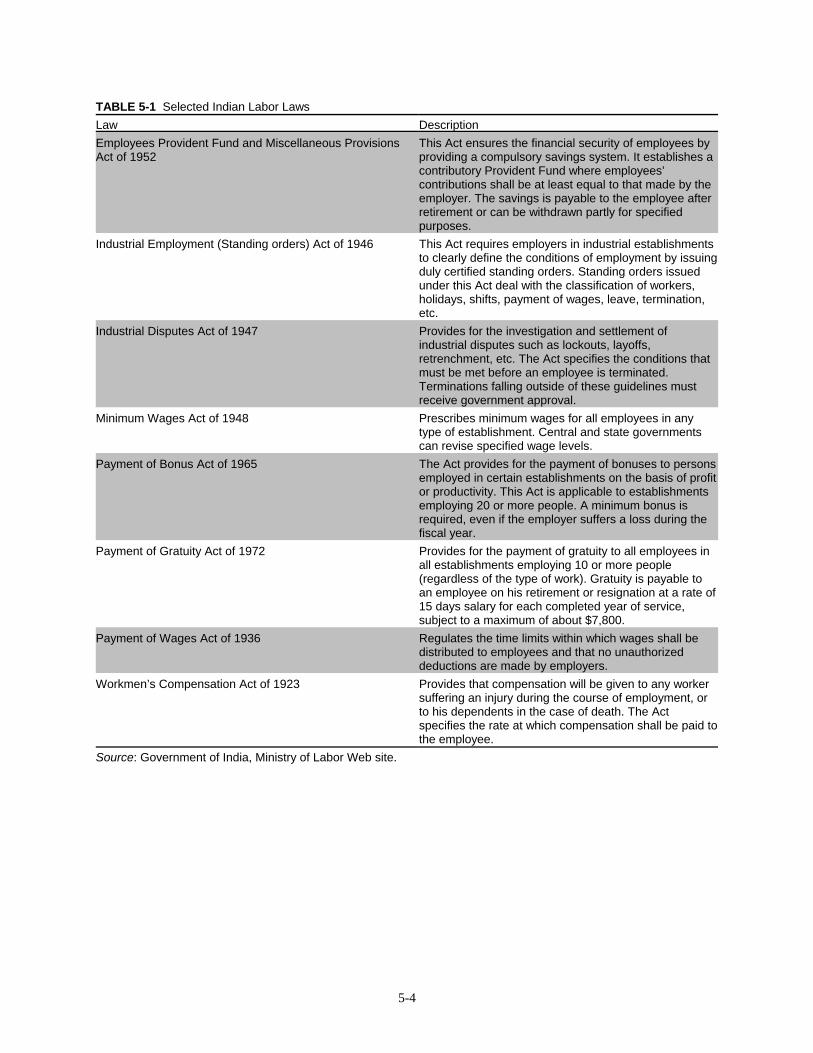
5-4
TABLE 5-1 Selected Indian Labor LawsLaw DescriptionEmployees Provident Fund and Miscellaneous ProvisionsAct of 1952
This Act ensures the financial security of employees byproviding a compulsory savings system. It establishes acontributory Provident Fund where employees’contributions shall be at least equal to that made by theemployer. The savings is payable to the employee afterretirement or can be withdrawn partly for specifiedpurposes.
Industrial Employment (Standing orders) Act of 1946 This Act requires employers in industrial establishmentsto clearly define the conditions of employment by issuingduly certified standing orders. Standing orders issuedunder this Act deal with the classification of workers,holidays, shifts, payment of wages, leave, termination,etc.
Industrial Disputes Act of 1947 Provides for the investigation and settlement ofindustrial disputes such as lockouts, layoffs,retrenchment, etc. The Act specifies the conditions thatmust be met before an employee is terminated.Terminations falling outside of these guidelines mustreceive government approval.
Minimum Wages Act of 1948 Prescribes minimum wages for all employees in anytype of establishment. Central and state governmentscan revise specified wage levels.
Payment of Bonus Act of 1965 The Act provides for the payment of bonuses to personsemployed in certain establishments on the basis of profitor productivity. This Act is applicable to establishmentsemploying 20 or more people. A minimum bonus isrequired, even if the employer suffers a loss during thefiscal year.
Payment of Gratuity Act of 1972 Provides for the payment of gratuity to all employees inall establishments employing 10 or more people(regardless of the type of work). Gratuity is payable toan employee on his retirement or resignation at a rate of15 days salary for each completed year of service,subject to a maximum of about $7,800.
Payment of Wages Act of 1936 Regulates the time limits within which wages shall bedistributed to employees and that no unauthorizeddeductions are made by employers.
Workmen’s Compensation Act of 1923 Provides that compensation will be given to any workersuffering an injury during the course of employment, orto his dependents in the case of death. The Actspecifies the rate at which compensation shall be paid tothe employee.
Source: Government of India, Ministry of Labor Web site.
27 USTR, 2007 Special 301 Report, 26; and U.S. Department of Commerce, U.S. Commercial Service,India Country Commercial Guide. 28 U.S. Department of Commerce, U.S. Commercial Service, India Country Commercial Guide. 29 EIU, Country Commerce 2006, 45. 30 ICC, Global Survey on Counterfeiting and Piracy, 10. 31 PhRMA, PhRMA Survey of Pharmaceutical Counterfeiting Laws and Remedies, 8. 32 Ibid., 8–9, 64–65. 33 Seizure data has inherent limitations; for example, due to resource limitations, the percentage of importsthat is inspected is reportedly small. Seizure data thus may not fully and accurately reflect the extent orproduct and country of origin structure of trade in counterfeits. OECD, Counterfeiting and Piracy:Measurement Issues, 9.
5-5
Intellectual Property Rights RegulationImportant improvements have been made in India’s intellectual property rights (IPR) regimein recent years. India has substantially revised its laws to bring them into compliance withthe requirements of the WTO’s Agreement on Trade-Related Aspects of Intellectual PropertyRights (TRIPS), which requires protections for various forms of intellectual property.However, according to the United States Trade Representative (USTR) and U.S. Departmentof Commerce (DOC), substantial concerns remain because of inadequate IPR protection andenforcement.27 India’s legal framework, and particular enforcement issues, in thepredominant intellectual property areas of trademarks, copyrights, and patents are describedbelow. The laws governing the protection of pharmaceutical products are explored in greaterdetail in the case study in chapter 8.
Trademark Protection
The legal framework of India’s trademark laws is generally considered consistent withinternational standards.28 India revised its law with passage of the Trademarks Act of 1999,which came into effect in 2003, to comply with the requirements of TRIPS. The Actbroadens the definition of a trademark and simplifies the procedural requirements forregistration. It also provides civil and criminal remedies for trademark infringement.29
The actual level of protection afforded trademarks under the law is more problematic.According to a survey of business executives conducted by the International Chamber ofCommerce, India is ranked as having the third worst IPR protection environment, followingChina and Russia, because of its disproportionate share of counterfeiting and piracy.30 In thearea of pharmaceuticals, the Pharmaceutical Research and Manufacturers of America(PhRMA) reports that while civil remedies for counterfeiting are generally available, thevolume of litigation is substantial and judicial delays hinder the process of obtaining relief.31
Although criminal remedies for counterfeiting hold the promise of a speedier resolution anda greater deterrent power, inadequate resources and low rates of conviction hamper theiravailability. Better results may be available in cases involving pharmaceutical counterfeiterswhom criminal courts are more likely to convict because of health and safety risks.32
India exports a large amount of counterfeit products, although the situation may beimproving.33 In 2005, U.S. Customs and Border Protection reported that it seized counterfeitgoods valued at about $2 billion from India. India was the fourth largest source of allcounterfeits in the United States (behind China, Hong Kong, and the United Arab Emirates).Despite being fourth overall, India was the number one source of counterfeit pharmaceuticals

34 USCBP, FY 2005 Top IPR Commodities Seized. Similarly, India was the source of 75 percent of allcounterfeit medicines seized by European authorities in 2005. EC, EU 25 Breakdown of Number of CasesRegistered. 35 U.S. government official, e-mail communication to Commission staff, February 21, 2007. 36 IIPA, 2003 Special 301 Report: India, 122. 37 USTR, 2007 Special 301 Report, 26. WIPO is a specialized agency of the United Nations responsiblefor promoting the development and harmonization of international IP laws. 38 USTR, 2007 National Trade Estimate Report, “India.” 39 USTR, 2007 Special 301 Report, 26. 40 IIPA, 2007 Special 301 Report, 54. 41 A product patent grants patent rights—that is the exclusive right to control production anddistribution—relating to the product. A process patent grants exclusive rights with respect only to a particularmeans or process used to make the product. 42 A compulsory license is one issued by the government that allows the use of a patented inventionwithout consent of the owner, upon payment of a royalty.
5-6
in 2005, accounting for 61 percent of pharmaceutical seizures from all sources.34 Morepositively, seizures of counterfeits from India were down in 2006; India fell to the eighthlargest source of counterfeit products and pharmaceutical seizures in particular weresubstantially lower.35
Copyright Protection
At the time India’s amended Copyright Act went into effect in 1995, it was considered “oneof the most modern copyright laws in any country,” particularly because of its rigorouscriminal enforcement provisions.36 Today, the challenges of copyright protection in thedigital environment reportedly require India to update its laws, for example, by joining andimplementing the two World Intellectual Property Organization (WIPO) Internet Treaties.37
Both treaties seek to ensure that traditional means for copyright protection apply to digitalworks and those transmitted on the Internet. The government of India recently released draftamendments to implement the provisions of the internet treaties; however, USTR has opinedthat the draft amendments are deficient.38
Problems with enforcement of the copyright laws are significant. According to theInternational Intellectual Property Alliance (IIPA), a coalition representing the U.S.copyright based industries, the principal challenge in India is “to make the criminal systemwork despite corruption, inefficient court procedures, lack of training, massively long delays,and few convictions.” Piracy—the unauthorized distribution and use of copyrightedmaterials—remains a substantial problem for both U.S. and Indian producers. Piracy ofsoftware, film, popular fiction works, and television cable signals has been labeled“rampant.”39 Pirated movies and other content are available in the informal markets of majorcities long before their domestic release in theaters. According to the IIPA, music file sharingand the online infringement of business and entertainment software, as well as deficienciesin the enforcement environment, substantially burden both foreign and local investors incopyright-based industries.40
Patent Protection
India inherited its patent laws from the British and, until 1970, provided product and processprotection for all inventions.41 In 1970, India introduced the Patents Act which prohibitedpatents on products useful as medicines or foods, shortened the term of chemical processpatents, and expanded the availability of compulsory licensing of patented inventions.42
Effective January 1, 2005, India was required, pursuant to its WTO TRIPS commitments,
43 USPTO, “U.S. and India Sign Historic Memorandum of Understanding.” 44 PhRMA, PhRMA Special 301 Submission: India, 135. 45 Government of India, Ministry of Commerce & Industry, “2006 Year of Record FDI Inflows.” 46 IBRD/World Bank, Doing Business in South Asia 2007, 36. 47 Ibid., 36. 48 U.S. Department of Commerce, U.S. Commercial Service, Doing Business in India, 111. 49 EIU, India: Country Commerce 2006, 28.
5-7
to provide product protection for pharmaceuticals and agricultural chemicals. It did sothrough an interim measure adopted in December 2004 and a new patent law enacted inApril 2005. This new law, including its impact on pharmaceutical FDI, is discussed in detailin the case study in chapter 8.
India and the United States entered into a Memorandum of Understanding (MOU) inDecember 2006. The purpose of the MOU is to further cooperation in the IPR field and tobetter promote innovation. The MOU provides for the training of patent personnel and thesharing of procedures and best practices.43 It responds to the concern of U.S. industry, andparticularly pharmaceutical firms, that Indian patent examiners are not trained or experiencedin the review of pharmaceutical products and other complex technologies, and that there isa substantial backlog of patent applications awaiting review.44 Moreover, the government ofIndia reports that 25,000 new patent applications were filed in 2006; the amount of work andresources that will be required to handle these applications is substantial.45 Patentinfringement cases, like those involving trademarks and copyrights, are subject to lengthyjudicial proceedings and delays. Industries that rely on IPR protections are severelyhampered by the practical difficulties of enforcing these rights.
Other Regulatory IssuesClosing down a business in India involves a cumbersome regulatory process that posesexpensive exit costs. Depending on the state, it takes an average of 10 years to completebankruptcy procedures in India, with variations between 8 and 20 years. This compares toan average of about 4 years in South Asia, 2 years in East Asia, and 1 year in OECDcountries.46 Liquidations in India are governed by the Companies Act, which assigns officialliquidators (OLs) to carry out the bankruptcy proceedings. Industry surveys report that OLstend to follow cumbersome procedures and cause undue delays. Moreover, when a case isfinally ready to be heard, courts and tribunals are often already overburdened with largecaseloads, creating even longer delays47
Some regulatory impediments have been eliminated. Performance requirements, such aslocal sourcing, no longer exist in most sectors and requirements to hire Indian nationals havelargely been eliminated.48 FDI in the retail housing sector is restricted in most cases, but non-residents of Indian origin and foreign companies are permitted to acquire or hold real estatein India, except for farmland, farmhouses, and plantations.49

50 David, “India Sets Semi Subsidy Policy.” 51 Ibid. 52 Incentives are similar to semiconductor loan rules, except that the minimum investment threshold is$220 million. BusinessStandard.com, “Semiconductor Policy Notified.” 53 As of April 2007, no official updates on Intel’s investment plans in India have been released. Intelcurrently operates a product development center in Bangalore. David, “India Sets Semi Subsidy Policy.” 54 AMD is noted to be the most interested in taking an actual investment stake. Singapore-basedFlextronics operates a regional manufacturing operation in Bangalore and is currently building an 8 millionsquare foot industrial park in Chennai. Singh, “Analysts Skeptical of Chip Fab in India.” 55 The government of India will allow carriers to share cable-landing station infrastructure. As of February2007, VSNL/Tata owned the majority of Tippu, “India’s Coming Bandwidth Boom.” 56 In 2006, AT&T became the first foreign telecom operator to take advantage of India’s FDI revision in2005, which allows up to 74 percent foreign equity ownership (up from 49 percent) in Indian telecom firms.AT&T has been in partnership with Tata group-owned VSNL since 2000. VSNL, an Indian telecomcompany, provides international voice services and is a VoIP provider. Tippu, “India’s Coming BandwidthBoom”; and VoIP Now, “VoIP in India.”
5-8
Implications of Recent FDI Policy Changes
Semiconductors
In February 2007, the government of India announced the establishment of the SpecialIncentive Package Scheme, which focuses on attracting greater investment in semiconductormanufacturing and other high technology industries in India. Broadly, the package providessubsidies in the form of tax breaks and interest-free loans to foreign companies interested ininvesting in Indian semiconductor plants with a minimum investment of $550 million. Loansare available for up to 20 percent of capital expenditures for projects in SEZs and up to 25percent elsewhere.50 This policy, which will extend through 2010, is expected to generatebetween $6 billion and $9 billion in new investments over the next three years.51 The SpecialIncentive Package Scheme also covers LCD and plasma screens, storage devices, solar cells,photovoltaics, and nanotechnology products.52 Following the announcement, Indiangovernment officials were planning to reopen negotiations with Intel, which established achip plant in Vietnam while waiting for India to formulate its long-delayed nationalsemiconductor policy.53 As noted in chapter 2, SemIndia, an Indian company setting up a $3-billion chip fabrication plant in Hyderabad, has received informal commitments from globalsemiconductor producers such as AMD, SanDisk, Flextronics, and Broadcom since theannouncement.54 However, as of April 2007, further details on these proposed ventures havenot been disclosed.
Telecommunications
In late 2006, the Indian government announced plans to lower the price of bandwidth by upto 25 percent and allow for its resale to new operators, giving foreign firms greater accessto the largely private-sector telecommunications infrastructure.55 As a result, internationalfirms such as BT and Cable & Wireless, which are both based in the United Kingdom, arereportedly interested in entering the Indian telecom market to provide broader advancednetworking services, such as network integration and security. Additionally, currentoperators in India, such as AT&T,56 which competes with Indian telecom companies in bothdomestic and international long distance services, believe that these changes will alsoimprove overall service quality and reliability since end-to-end control of transmissionsystems are now possible. Moreover, broadband internet service, which has grown over600 percent since 2005 to 1.5 million Indian subscribers, is seen as the primary driver of the
57 Tippu, “India’s Coming Bandwidth Boom.” 58 Ibid.; and VoIP Now, “VoIP in India.” 59 Gupta, “India Gears Up For Retail,” 28. 60 These products are seen not to affect small domestic traders or the rural economy. Maddox, “FromSingle Brand to Open Season.” 61 Ganesh is owned by Mohan Murjani, a non-resident Indian. Bellman, “As Economy Grows, India Goesfor Designer Goods.” 62 Ibid. 63 The joint-venture agreement was approved by the Indian government in January 2007. Economist.com,“Indian Retailing: Getting Cheaper and Better.” 64 Grocer, “Bharti to Invest $2.5 Billion in Chain.” 65 Gupta, “India Gears Up For Retail,” 28. 66 Ibid., 29.
5-9
bandwidth market in India.57 Expansion in services such as Internet telephony (VoIP), whichreached 1 billion minutes in India during the first quarter of 2006, reflecting six-fold growthfrom 160 million minutes in 2005,58 will also likely provide greater investment opportunitiesin the Indian telecom sector as bandwidth prices continue to fall.
Retailing
Due to lingering political and social sensitivities within the retail sector, foreign investorsin India’s retailing industry remain limited to single-brand retail outlets. With a total of12 million retailers in India (97 percent of which are small mom-and-pop style businesses),there is strong opposition to foreign involvement.59 However, the Indian government isactively considering whether to allow greater foreign investments in specific products,namely, sporting goods, stationery, construction materials, and electronics.60 As of March2007, foreign investors were allowed to control a maximum of 51 percent equity in Indianretail ventures that sell products under a single international brand. In 2004, Arvind Brands,the second largest domestic apparel company in India, created a joint venture with TommyHilfiger licensor, Ganesh,61 to establish Hilfiger-branded clothing and apparel storesthroughout India.62 In November 2006, Bharti Enterprises and Wal-Mart announced a joint-venture agreement where Wal-Mart would provide its goods wholesale to the Indian retailerand provide logistics and distribution services to the joint venture.63 Specifically, Bharti, amajor Indian telecom operator, is planning to invest $2.5 billion to create a nationalsupermarket chain creating 10 million square feet of retail space and employ 60,000 peopleby 2015.64 Industry sources estimate that retail sales in India will grow from $300 billion in2006 to an estimated $427 billion by 2010 and $637 billion by 2015.65 Overall, industryreports suggest that the biggest challenge for international retailers entering India will notbe overcoming FDI restrictions, but rather, how quickly they will be able to adapt to localconsumer buying habits and to the logistics infrastructure.66
Litigation and Alternative Dispute Resolution
Litigation in India
The Indian court system is severely backlogged and suffering from infrastructuraldifficulties. The Law Commission of India, a branch of India’s Ministry of Law & Justice,reported that over 2 million cases in 13,000 district courts were pending in 2004. The Indiancourt system as a whole has an estimated backlog of 25 million cases which would take
67 Law Commission of India, On Revision of Court Fees Structure (189th Report); Human Rights Features,Legal Reform and Investment Prospects in India; Economic and Social Council, Commission on HumanRights, Civil and Political Rights, Including the Questions of the Judiciary, Administration of Justice,Impunity. The Indian court system includes the Indian District Courts, Appellate Courts, and the SupremeCourt as well as local or specialized courts. 68 Human Rights Features, Legal Reform and Investment Prospects in India; and Economic and SocialCouncil, Civil and Political Rights, Including the Questions of the Judiciary, Administration of Justice,Impunity. 69 Economic and Social Council, Civil and Political Rights, Including the Questions of the Judiciary,Administration of Justice, Impunity. 70 Ibid.. 71 Government of India, Ministry of Law and Justice, “Civil Procedure Code As Amended Enforced as ofToday.” 72 Ibid. 73 Government of India, Ministry of Law and Justice, “Landmark Legal Reforms in the Social Sector.” 74 Abdullah, Inaugural Address. 75 Venkatesan, “Trial and Execution.” 76 Rs. 25,000 equals $614.33 at the exchange rate of 40.7 rupees/dollar on May 21, 2007. Venkatesan,“Trial and Execution.” 77 Ibid.
5-10
approximately 324 years to clear if the court system proceeds at its present rate.67 Civil andcriminal cases are reported to take between 10 and 20 years to be determined by a court.68
Such long delays lead to further problems once the case finally reaches the court. Witnessesfrequently lose recollection when they are called to give testimony so long after witnessingan event.69 Similarly, evidence often becomes tainted or disappears over the many yearsprior to trial.70 Such problems often lead to the adjournment of cases and further delays oncethe case finally reaches the court.
In an effort to address the longstanding problems with India’s court system, the Indiannational government issued a series of amendments to its Code of Civil Procedure. The twomost pertinent amendments are the Code of Civil Procedure Amendment Act of 1999 (1999Amendment) and the Code of Civil Procedure Amendment Act of 2002 (2002 Amendment).Both the 1999 Amendment and the 2002 Amendment came into force on July 1, 2002.71
The 1999 Amendment was designed to lessen the number of cases reaching the Indian courtsby making Alternative Dispute Resolution (ADR) compulsory for certain civil disputes inIndia, and to lessen the time a judicial proceeding takes by limiting the allowable number ofadjournments in a each litigation.72 Moreover, the 1999 Amendment prevents further appealfor certain cases to lessen the burden on the court system.73 The 1999 Amendment requirescertain civil cases to attempt a resolution through ADR, and only if a case is not resolvablethrough ADR will it be allowed to proceed to the Indian courts for litigation.74
Similarly, the 2002 Amendment’s objective is to shorten the length of judicial proceedingsby placing limitations on a number of procedures, changing other procedures, and limitingcertain appeals. The 2002 Amendment allows the service of summons by means of e-mail,fax, or private courier.75 It also specifies that there shall be no second appeal from any decree“when the subject-matter of the original suit is for the recovery of an amount not exceedingRs. 25,000.”76 Additionally, the 2002 Amendment specifies a series of strict time limitationsfor the submission of the commission report to the Court, the pronouncement of thejudgment, and provides that the judge has the discretion to put time limitations on oralarguments.77 Despite these efforts to expedite judicial proceedings, many foreign investorschoose to resolve disputes arising in India through ADR mechanisms.
78 The potential arbitration stipulations are commonly referred to as “arbitration agreements” or“arbitration clauses.” 79 Human Rights Features, Legal Reform and Investment Prospects in India. 80 IACA Part I, Chapter I(1)(f). 81 Particularly: the requirements and validity of the arbitration agreement, the composition of the arbitraltribunal; the jurisdiction of arbitral tribunals; the conduct of arbitral proceedings; the making of arbitralawards and termination of proceedings; recourse against arbitral awards; finality and enforcement of arbitralawards; and appeals. IACA Chapters II-X. 82 These three conventions are: (1)The New York Convention of 1958 on the Recognition andEnforcement of Foreign Arbitral Awards (New York Convention); (2)The Geneva Convention on theExecution of Foreign Arbitral Awards of 1927 (Geneva Convention); and (3)The Geneva Protocol onArbitration Clauses of 1923 (Geneva Protocol). India is not presently signatory to any bilateral conventionsregarding arbitration. 83 Law Commission of India Web site.
5-11
Alternative Dispute Resolution (ADR) in India
Foreign investors frequently choose to enter arbitration agreements when engaging inbusiness in India, to avoid the problems of the judicial system. The terms of a potentialarbitration are generally stipulated in a contract78 by investors before any legal problemsarise, although parties may also agree to arbitrate after a legal dispute occurs. Investors oftencontractually stipulate that arbitration will take place outside of India, opting instead for themore established arbitration venues of the United States or United Kingdom. In one recentexample, a dispute between two private airline companies was brought to arbitration inLondon, rather than in New Delhi or Mumbai.79
The Indian government actively promotes alternative dispute resolution (ADR) mechanismsas an alternative to litigation. The Indian Arbitration and Conciliation Act of 1996 (IACA)creates a coherent system of arbitration of both domestic and international disputes. TheIACA applies to both domestic arbitration between Indian parties and internationalarbitration, defined as arbitration occurring when one party is a non-resident of India,incorporated outside India, a foreign government, or a company whose central managementis controlled outside of India.80 The Act governs all major aspects of internationalcommercial arbitration taking place in India.81 The IACA also statutorily incorporated theNew York Convention, the Geneva Convention, and the Geneva Protocol into the domesticlaws of India, which gives investors recourse under both domestic and international law forviolations of these conventions.82
Furthermore, in 2003, the Indian government set forth proposals to incorporate mediationand conciliation, two additional forms of ADR, more integrally into its legal regime(box 5-1).83
Additionally, India is a party to three international, multilateral treaties pertaining toarbitration. All three purport to recognize and/or enforce the arbitral awards of othercountries signatory to each Convention. The conventions make it easier to enforce, andillegal not to enforce, arbitral awards issued in India within other nations that are parties tothe conventions, as long as the requirements of the conventions are met.
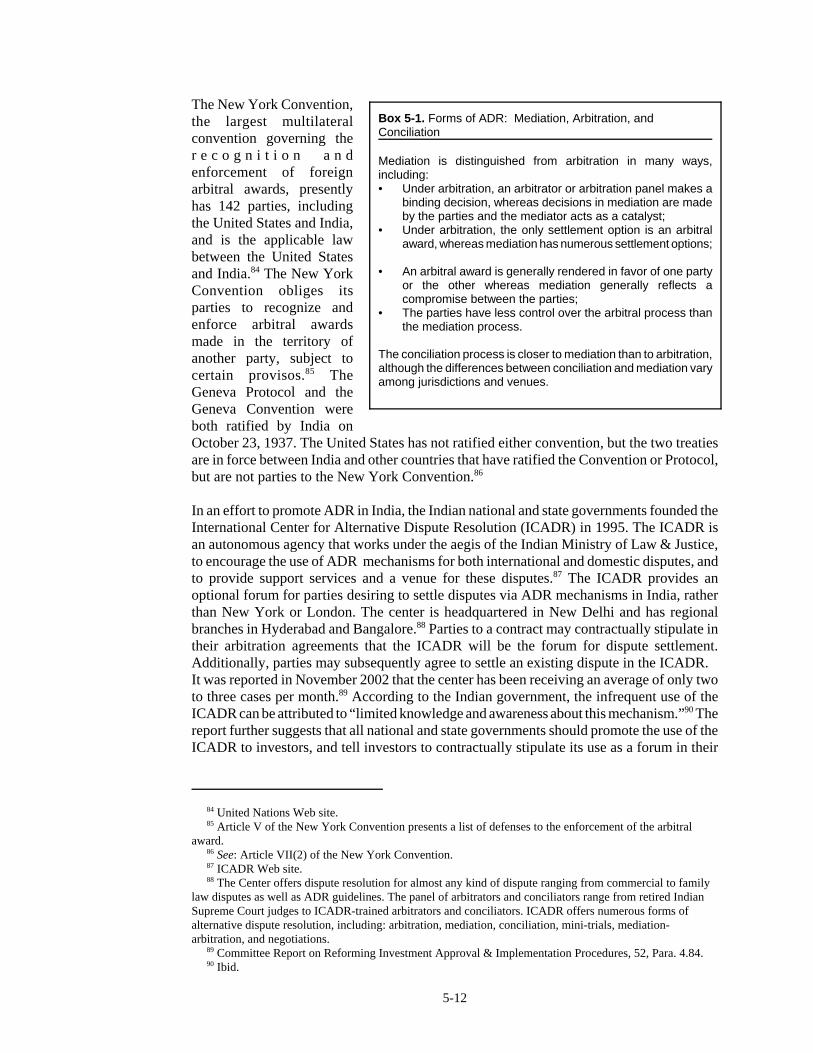
84 United Nations Web site. 85 Article V of the New York Convention presents a list of defenses to the enforcement of the arbitralaward. 86 See: Article VII(2) of the New York Convention. 87 ICADR Web site. 88 The Center offers dispute resolution for almost any kind of dispute ranging from commercial to familylaw disputes as well as ADR guidelines. The panel of arbitrators and conciliators range from retired IndianSupreme Court judges to ICADR-trained arbitrators and conciliators. ICADR offers numerous forms ofalternative dispute resolution, including: arbitration, mediation, conciliation, mini-trials, mediation-arbitration, and negotiations. 89 Committee Report on Reforming Investment Approval & Implementation Procedures, 52, Para. 4.84. 90 Ibid.
5-12
The New York Convention,the largest multilateralconvention governing ther e c o g n i t i o n a n denforcement of foreignarbitral awards, presentlyhas 142 parties, includingthe United States and India,and is the applicable lawbetween the United Statesand India.84 The New YorkConvention obliges itsparties to recognize andenforce arbitral awardsmade in the territory ofanother party, subject tocertain provisos.85 TheGeneva Protocol and theGeneva Convention wereboth ratified by India onOctober 23, 1937. The United States has not ratified either convention, but the two treatiesare in force between India and other countries that have ratified the Convention or Protocol,but are not parties to the New York Convention.86
In an effort to promote ADR in India, the Indian national and state governments founded theInternational Center for Alternative Dispute Resolution (ICADR) in 1995. The ICADR isan autonomous agency that works under the aegis of the Indian Ministry of Law & Justice,to encourage the use of ADR mechanisms for both international and domestic disputes, andto provide support services and a venue for these disputes.87 The ICADR provides anoptional forum for parties desiring to settle disputes via ADR mechanisms in India, ratherthan New York or London. The center is headquartered in New Delhi and has regionalbranches in Hyderabad and Bangalore.88 Parties to a contract may contractually stipulate intheir arbitration agreements that the ICADR will be the forum for dispute settlement.Additionally, parties may subsequently agree to settle an existing dispute in the ICADR. It was reported in November 2002 that the center has been receiving an average of only twoto three cases per month.89 According to the Indian government, the infrequent use of theICADR can be attributed to “limited knowledge and awareness about this mechanism.”90 Thereport further suggests that all national and state governments should promote the use of theICADR to investors, and tell investors to contractually stipulate its use as a forum in their
Box 5-1. Forms of ADR: Mediation, Arbitration, andConciliation
Mediation is distinguished from arbitration in many ways,including: • Under arbitration, an arbitrator or arbitration panel makes a
binding decision, whereas decisions in mediation are madeby the parties and the mediator acts as a catalyst;
• Under arbitration, the only settlement option is an arbitralaward, whereas mediation has numerous settlement options;
• An arbitral award is generally rendered in favor of one partyor the other whereas mediation generally reflects acompromise between the parties;
• The parties have less control over the arbitral process thanthe mediation process.
The conciliation process is closer to mediation than to arbitration,although the differences between conciliation and mediation varyamong jurisdictions and venues.
91 Ibid. 92 Anderson, “Legal and Practical Protection of U.S. Foreign Investment,” 136. 93 Ibid. 94 Prasad, and Balan, “Strategies for U.S. Companies to Mitigate Legal Risks,” 14–16. 95 Kantor, “Arbitration Award May Alter Dabhol Debate,” 1; and Anderson, “Legal and PracticalProtection of U.S. Foreign Investment,” 136. 96 Kantor, “Arbitration Award May Alter Dabhol Debate,” 1. 97 Ibid. 98 Ibid., 2. 99 Ibid., 1.
5-13
arbitration agreements.91 The ICADR, the Indian government suggests, offers a forum withinwhich investors can settle their disputes in an expeditious manner.
ADR in Action: The Enron Dispute and the Dabhol Power Plant
The Dabhol dispute is the largest, most complicated investment dispute in recent Indianhistory, and has affected subsequent FDI dispute settlement procedures. The Dabhol projectbegan as a joint venture to build a 2,200 megawatt power plant in the western Indian stateof Maharashtra.92 Enron was the majority investor with a 65 percent equity share in theDabhol power project; General Electric (GE) and Bechtel Enterprise Holdings, Inc. (Bechtel)each maintained 10 percent equity; and the Maharashtra State Electricity Board (MESB) heldthe remaining equity share of 15 percent.93 The $3 billion Dabhol power plant had nearlycompleted construction when the government of Maharashtra stopped paying its agreedamount under the power purchase agreement with U.S. investors, allegedly because the costof power produced by the plant was too high.94 Following these events, numerous lawsuitswere initiated between the investors and the Indian government, and at least six internationalarbitral proceedings were initiated relating to the Dabhol breakdown.95
The Indian government placed anti-arbitration injunctions on Dabhol-related arbitrationproceedings which were subject to jurisdiction in India, thus delaying arbitrationindefinitely.96 Nonetheless, GE and Bechtel were awarded $57.1 million from the U.S.Overseas Private Investment Corporation (OPIC) via arbitration, that side-stepped the Indianinjunctions because none of the parties to this arbitral proceeding were subject to Indianjurisdiction.97 Bechtel and GE brought the proceedings against OPIC in order to recoverclaims under a political risk insurance policy that was taken out to cover the Dabhol project.The OPIC-GE/Bechtel proceeding illustrates how arbitration can aid in the expedientresolution of disputes arising in India.
India and the United States entered into an Investment Incentive Agreement in 1997 in orderto encourage OPIC to support U. S. investment in India, and to encourage investors to useOPIC when investing in India.98 Under this agreement, if the national government of Indiais found in breach of its obligations under the agreement, it will be obliged to pay the insurer(OPIC) the amount OPIC has to pay the insured (in this case, GE and Bechtel). The$57.1 million award to GE and Bechtel in the present case, creates an obligation for theIndian government to pay OPIC that sum, free from the interference caused by the injunctionon arbitrations issued by the Indian courts.99
The MESB was found in violation of a multitude of its obligations under the power purchaseagreement in the OPIC arbitration. These obligations were counter-guaranteed by the Indiangovernment, making the Indian national government responsible for reimbursement to GE
100 Ibid. 101 Ibid.., 2. 102 American Arbitration Association, International Centre for Dispute Resolution, “Bechtel EnterprisesInternational (Bermuda) Ltd.”
5-14
and Bechtel.100 The MESB was found responsible, in this arbitral proceeding, for over tenbreaches of its obligations, including its failure to pay under the power purchase agreementsand the rescission (denunciation) of the power purchase agreement.101 The arbitral tribunal,chaired by a former U.S. federal judge, determined that because of the breaches by theMESB, OPIC must pay GE and Bechtel the $57.1 million under the political risk insurancepolicies that were issued by OPIC to the two companies in 1995.102 Thus, GE and Bechtelrecovered their costs from OPIC under their political risk insurance policy because MESBhad breached its obligations under the power purchase agreement. The government of Indiais obliged under the Investment Incentive Agreement to reimburse OPIC for the moneyawarded to GE and Bechtel.
The OPIC-GE/Bechtel proceeding is one example of how arbitration agreements with a non-Indian venue can allow damaged parties to recover their losses from disputes arising in Indiain an expeditious manner. Recovery was granted to GE and Bechtel, even in face of aproceeding that would have been delayed indefinitely if it were brought in the Indian courtsystem.
1 SAFTA members are Bangladesh, Bhutan, India, Maldives, Nepal, Pakistan, and Sri Lanka. EIU, India:Country Commerce 2006, 51. 2 BITs are bilateral agreements aimed at protecting and promoting foreign investment through legally-binding rights and obligations. OECD, Directorate for Financial and Enterprise Affairs, InvestmentCommittee,“Salient Features of India’s Investment Agreements,” 3. 3 Tax treaties serve to prevent the double taxation of income earned in one country by a resident ofanother country. India Mart, Taxation - Tax Treaties. 4 The most favored nation principle requires that no member country give preferential trade treatment toone WTO member or non-member without giving the same preferential trade treatment to all WTOmembers. The market access principle requires member countries to open their markets to other memberswithin the limits of the agreement. The national treatment principle requires that no member country givepreferential trade treatment to domestic-made products that it does not give to like products from othermember countries. 5 Van den Bossche, The Law and Policy of the World Trade Organization, 106. The special status of“developing country” is primarily a matter of self-declaration, that is, a member will declare itself adeveloping country in order to gain the special treatment afforded developing countries within the WTO.
6-1
CHAPTER 6India’s Investment-Related InternationalAgreements
India is a founding member of both the General Agreement on Tariffs and Trade (GATT)and the World Trade Organization (WTO). India also is a signatory to the South Asia FreeTrade Agreement (SAFTA), which promotes mutual trade, economic cooperation, andgreater investment-related activities among its members.1 India has entered into 57 bilateralinvestment treaties2 (BITs) but does not have a BIT with the United states. India alsomaintains Double Tax Avoidance Agreements3 (tax treaties) with 70 countries, includingmajor trading and FDI partners China, Germany, Japan, Mauritius, the United Kingdom, andthe United States (appendix C).
World Trade OrganizationIndia’s membership in the WTO benefits foreign investors primarily through twoagreements: the Agreement on Trade Related Investment Measures (TRIMs), and theGeneral Agreement on Trade in Services (GATS). In addition, WTO membership imposesthe general obligations of most favored nation (MFN) treatment, market access (MA), andnational treatment (NT) with regard to trade policy.4 These also affect foreign investment,as India’s obligations under these principles may affect investors’ evaluation of India’sinvestment environment. WTO rules allow certain exemptions from these principles for thebenefit of developing country members, which make up approximately 75 percent of allWTO members, including India.5 India’s status as a developing country provides it withflexibility as to its obligations under both the TRIMs and the GATS.
Agreement on Trade Related Investment Measures
The TRIMs Agreement is the WTO agreement that most directly addresses investment,although only certain trade-related investment measures are covered by the agreement. It

6 TRIMS Agreement, Articles 1–2. 7 Measures that requires certain levels of local procurement by an entity. See: Annex to TRIMSAgreement. 8 Measures that restrict the value or volume of imports a foreign investor can use to produce goods forexport. See: Annex to TRIMs Agreement. 9 WTO, Indonesia—Certain Measures Affecting the Automobile Industry, 337–42. 10 Local content...requirements in the production of News Print... Rifampicin and Penicillin-G, and[d]ividend balancing requirements in the case of investment in 22 categories [of] consumer goods.” U.S.Department of Commerce, The Agreement on Trade Related Investment Measures. 11 U.S. Department of Commerce, The Agreement on Trade Related Investment Measures. 12 TRIMS Article 4. 13 GATS Article 1(2)(a-d). 14 Ibid. The other modes are cross-border supply of services, consumption abroad, and the presence ofnatural persons. For additional information, see WTO, “Understanding the WTO, Services: Rules for Growthand Investment.”
6-2
prohibits quantitative restrictions (quotas) and violations of the NT principle for investmentmeasures related to trade in goods.6 Moreover, the TRIMs includes an illustrative list ofTRIMs that violate the NT principle and the prohibition on quantitative restrictions,including local content requirements7 and trade balancing requirements.8 In one significantWTO case, Indonesia-Autos, a dispute settlement panel defined such prohibited “trade-related investment measures” to include all measures posited on the TRIMs illustrative list,and thus these measures are open to action in the WTO.9 If a measure is found to be inviolation of the NT principle or the prohibition on quantitative restrictions, then the measurewill have to be withdrawn by the nonconforming state.
The TRIMs agreement requires members to eliminate all non-conforming TRIMs, andcontingent on the member’s status within the WTO, the members were given variableamounts of time to eliminate all TRIMs. Developed country members were given two years,developing country members were given five years, and least developed countries weregiven seven years. Soon after the entry into force of the TRIMs Agreement, India notifiedthe Committee of its three inconsistent TRIMs.10 India, as a developing country member, wasgiven the five year transition period for these TRIMs,which ended on December 31, 1999.None of these non-conforming TRIMs are presently in force in India.11 The TRIMsAgreement allows developing countries to temporarily deviate from their national treatmentobligations and the prohibition on quantitative restrictions in accord with certain exceptions,but to date, India has not pursued that option.12
General Agreement on Trade in Services
The GATS is the second area of the WTO agreements to directly address investment. TheGATS, which applies to all WTO members, outlines four modes through which membercountries can trade services.13 The third mode of trade in services applies to investment, andis defined as “the supply of a service. . . by a service supplier of one Member throughcommercial presence in the territory of any other Member.”14 This “commercial presence”mode brings foreign investment into the scope of the GATS.
The GATS is a “positive list” agreement. WTO members are only bound to MA and NTprovisions for the service sectors that they choose to include in each country’s Schedule ofCommitments. Each WTO member develops a list of service sectors to be included in itscommitments. For each sector, the schedule lists the sectors for which it has agreed to acceptWTO obligations, and the limits to its MA and NT commitments for each sector. Table 6-1
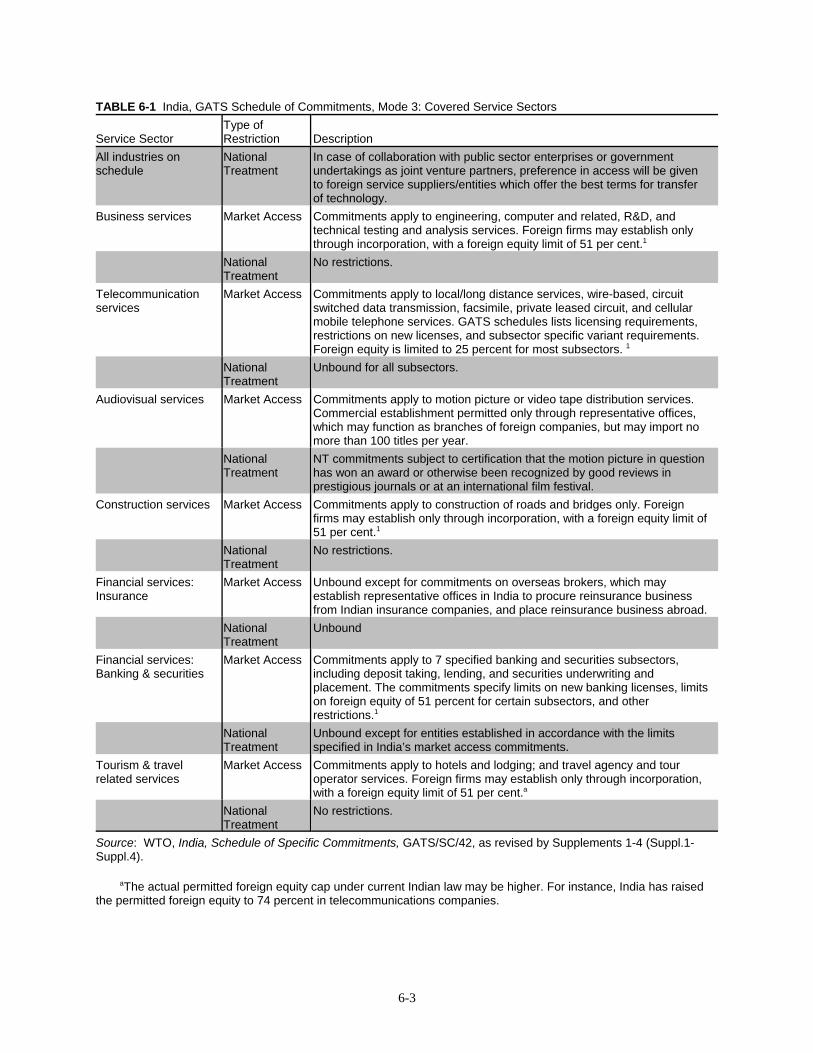
6-3
TABLE 6-1 India, GATS Schedule of Commitments, Mode 3: Covered Service Sectors
Service SectorType ofRestriction Description
All industries onschedule
NationalTreatment
In case of collaboration with public sector enterprises or governmentundertakings as joint venture partners, preference in access will be givento foreign service suppliers/entities which offer the best terms for transferof technology.
Business services Market Access Commitments apply to engineering, computer and related, R&D, andtechnical testing and analysis services. Foreign firms may establish onlythrough incorporation, with a foreign equity limit of 51 per cent.1
NationalTreatment
No restrictions.
Telecommunicationservices
Market Access Commitments apply to local/long distance services, wire-based, circuitswitched data transmission, facsimile, private leased circuit, and cellularmobile telephone services. GATS schedules lists licensing requirements,restrictions on new licenses, and subsector specific variant requirements. Foreign equity is limited to 25 percent for most subsectors. 1
NationalTreatment
Unbound for all subsectors.
Audiovisual services Market Access Commitments apply to motion picture or video tape distribution services.Commercial establishment permitted only through representative offices,which may function as branches of foreign companies, but may import nomore than 100 titles per year.
NationalTreatment
NT commitments subject to certification that the motion picture in questionhas won an award or otherwise been recognized by good reviews inprestigious journals or at an international film festival.
Construction services Market Access Commitments apply to construction of roads and bridges only. Foreignfirms may establish only through incorporation, with a foreign equity limit of51 per cent.1
NationalTreatment
No restrictions.
Financial services:Insurance
Market Access Unbound except for commitments on overseas brokers, which mayestablish representative offices in India to procure reinsurance businessfrom Indian insurance companies, and place reinsurance business abroad.
NationalTreatment
Unbound
Financial services:Banking & securities
Market Access Commitments apply to 7 specified banking and securities subsectors,including deposit taking, lending, and securities underwriting andplacement. The commitments specify limits on new banking licenses, limitson foreign equity of 51 percent for certain subsectors, and otherrestrictions.1
NationalTreatment
Unbound except for entities established in accordance with the limitsspecified in India’s market access commitments.
Tourism & travelrelated services
Market Access Commitments apply to hotels and lodging; and travel agency and touroperator services. Foreign firms may establish only through incorporation,with a foreign equity limit of 51 per cent.a
NationalTreatment
No restrictions.
Source: WTO, India, Schedule of Specific Commitments, GATS/SC/42, as revised by Supplements 1-4 (Suppl.1-Suppl.4).
aThe actual permitted foreign equity cap under current Indian law may be higher. For instance, India has raisedthe permitted foreign equity to 74 percent in telecommunications companies.
15 India’s Schedule of GATS Commitments (as revised by Supplements 1-4). 16 Ibid. 17 Sri Lanka will have until 2013 to reduce its tariffs to zero. 18 South Asian Association for Regional Cooperation, Agreement on South Asian Free Trade Area. 19 Ibid. 20 Dikshit, “Ban on FDI from Bangladesh May Go.”
6-4
outlines India’s commercial presence (Mode 3) commitments included in its GATSSchedule.15
As a positive list system, the GATS is quite transparent regarding each member’scommitments. For each sector that is included in India’s Schedule of Commitments, the MAand NT limits are the maximum restrictions. So, for example, in business services, the onlyrestriction listed on India’s Schedule is that foreign firms can supply such services onlythrough incorporation in India, with a maximum foreign equity limit of 51 percent. TheIndian government is not then permitted to impose additional regulations limiting foreigninvestors in business services. By contrast, actual practice in India, as defined by local lawsand regulations, may be less restrictive than those outlined in India’s GATS Schedule. In thebusiness services example above, the Indian government is free to remove the 51 percentequity cap on foreign investment. For industries identified as “unbound” in its Schedule, andfor sectors not mentioned at all, India has not agreed to any limits to its potential restrictionson foreign investors, so India can and likely does restrict trade and investment of theseservices through its domestic laws and regulations.
India has scheduled the greatest number of commitments in the areas of communicationservices and financial services, so investors in these industries are provided the most openinvestment environment. India has also scheduled commitments in business services,construction and related engineering services, and tourism and travel related services.16
South Asia Free Trade AgreementSAFTA, which entered into effect in January 2006, is South Asia’s most prominent tradeagreement. SAFTA requires the developing countries in South Asia (India, Pakistan, and SriLanka) to reduce their duties to 20 percent in the first phase of a two year period ending in2007. In the final five year phase ending in 2012, the 20 percent duty will be reduced to zeroin a series of annual cuts.17 The least developed nations in South Asia (Nepal, Bhutan,Bangladesh and Maldives) have an additional three years to reduce tariffs to zero.18 Acomplete elimination of tariffs is estimated to boost intra-regional trade by about 10 percentover its 2006 level. Although SAFTA does not have specific investment-related provisions,India has supported the agreement’s general cooperative measures for “expandinginvestment and production opportunities. . .” among the contracting states and views it as aneffective mechanism for future regional investment cooperation.19 However, since FDIrestrictions from Bangladesh and Pakistan into India remain in effect, much of the residualinvestment benefits gained from greater regional trade liberalization will likely go toSAFTA’s least developed members.20
21 These bilateral agreements are estimated to cover 65 percent ($4.5 billion) of India’s inward FDI and40 percent ($2 billion) of its outward FDI in 2005. OECD, “Salient Features of India’s InvestmentAgreements.” 3. 22 OECD, Directorate for Financial and Enterprise Affairs, Investment Committee, “Salient Features ofIndia’s Investment Agreements,” 4. 23 Ibid., 6. 24 Ibid., 8. 25 Ibid., 8. 26 Ibid., 10. 27 Fenwick & West LLP, Structuring Venture Capital and Other Investments in India, 2. 28 Ibid., 3.
6-5
Bilateral Investment TreatiesIn recent years, India has concluded BITs with both developed and developing nations.21 Themajority of India’s BITs (30 of 57) involve developing countries from Asia (16), the MiddleEast (9), Africa (4), and Latin America (1). Generally, India’s BITs focus on the protectionsof investments relating to expropriation (nationalization of investments), transfers of incomeor capital, and international arbitration and dispute settlement for both state-to-state andinvestor-to-state cases.22 India’s BITs also cover areas such as non-discrimination intreatment, the entry of personnel and foreign-controlled enterprises, and exceptions dealingwith issues of national security or disease and pest prevention. The agreements have astandard duration of 10 years with their investment guarantees valid 15 years aftertermination.23
There is considerable uniformity in the broad principles underlying India’s BIT. However,some specific differences arise when comparing agreements between developed anddeveloping nations, differences which likely reflect India’s relative negotiating position. Forexample, India’s BITs with Ghana, Indonesia, Oman, and Thailand only apply to investorswhich are “nationals or a company of a contracting party.”24 However, India’s agreementswith Australia and other developed countries additionally include indirect or portfolioinvestments by third-party institutional investors. Further, under the India-Ghana BIT, claimsor disputes taken or completed before the entry into force of the agreement will not becovered by the BIT’s obligations. This clause contradicts the general rule that investmentclaims are protected equally, regardless of when the BIT takes effect.25 With regard to theentry and temporary residence of personnel, India’s BITs with Australia and France areparticularly notable for two reasons. First, they permit investors to employ key technical andmanagerial personnel regardless of citizenship, and second, they promote “sympathetic”consideration to the requests for temporary entry and work in connection with the otherparty’s investments.26
Double Tax Avoidance Agreements and CECAAnother policy tool India employs to promote FDI is the use of double tax avoidanceagreements. Typically, these tax treaties provide relief from double taxation of income byproviding exemptions and sometimes credits for taxes paid in one of the partner countries.27
The laws of the two contracting states govern the taxation of income in their respectivestates. When an entity has income arising from both India and the partner country, the entitywill be taxed under the tax laws of the country of residence.28
29 EIU, Business India Intelligence, 3. 30 Fenwick & West LLP, Structuring Venture Capital and Other Investments in India, 3. 31 To qualify, an offshore company must (1) have two local directors approved by the Mauritian OffshoreBusiness Activities Act Authority, (2) have a bank account in Mauritius, and (3) comply with Mauritiancorporate formalities. The full benefits of the treaty would apply even if the Mauritian entity is establishedprimarily for investment into India. Fenwick & West LLP, Structuring Venture Capital and OtherInvestments in India, 3. 32 Mauritian subsidiaries are usually not deemed to have “permanent establishment” in India as long as thesubsidiary does not exercise decision making authority over certain activities. These activities can includemaking investment decisions, concluding contracts, or securing goods orders on behalf of the parent.Fenwick & West LLP, Structuring Venture Capital and Other Investments in India, 2–3. 33 Ibid. 34 Government of India, Ministry of Commerce & Industry, “Fact Sheet on Foreign Direct Investment.” 35 Government of India, Ministry of Finance, various press releases of Department of Industrial Policy andPromotion. 36 Thomas, “Singapore, New Tax Haven for Offshore Investors.” 37 Ibid. 38 Government of India, Ministry of Commerce & Industry, Department of Commerce, CECA BetweenIndia and Singapore.
6-6
Mauritius, India’s largest source of FDI in recent years, is the most prominent beneficiaryof India’s bilateral tax treaties. Due to the local tax benefits it provides and its close historicand cultural ties—68 percent of Mauritius’ population is of Indian descent—Mauritius hasbeen a primary destination for entities interested in entering the Indian market.29 Specifically,companies planning to invest in India often first establish a holding company in Mauritius,which offers zero-tax status to overseas corporate bodies (OCBs).30 An OCB in Mauritiusthen must obtain a tax residency certificate31 to qualify for the tax treaty between Mauritiusand India.
To avoid misuse of the treaty by Indian-based companies seeking to avoid paying taxes athome, the management of the Mauritian holding company must not be from India, and thecompany must not have a “permanent establishment” in India. In most cases, companiesavoid “permanent establishment” status by establishing a subsidiary in India with limitedcorporate powers.32 However, controversy over the India-Mauritius tax treaty has grown inIndia, as there are no strict legal definitions for the terms “management from Mauritius” or“permanent establishment.”33 Despite these legal uncertainties, FDI from Mauritius reached$2.6 billion during 2005–06.34 In 2006, FDI approvals from Mauritius into India includedEssar Communications (telecom) for $56 million in equity, ILM Trichy Ltd. (infrastructure)for $23 million, and Pacifica Infrastructure (construction) for $15 million.35
Notably, in June 2005, India and Singapore signed a Comprehensive Economic CooperationAgreement (CECA), which integrated investment provisions, a broad package of tradeliberalization, and a tax treaty similar to the one between India and Mauritius.36 For India,this agreement was seen as the most ambitious and comprehensive economic agreement everconcluded with a foreign country.37 CECA is India’s first attempt to integrate “BIT-like”investment disciplines in a preferential trade agreement, focusing on new investmentfacilitation provisions for the movement of natural persons, e-commerce, education, andmedia.38 Further, although the CECA with Singapore adopts tax concessions similar to thoseof the India-Mauritius tax treaty, the requirements for Singapore tax residency are muchmore rigorous compared to those for Mauritius. Specifically, Singapore companies mustsatisfy predetermined expenditure requirements and show that they have sustainable and
39 Annual expenditures on operations in Singapore must be at least $132,000 in the 24 monthsimmediately prior to when the tax gains are realized. Fenwick & West LLP, Structuring Venture Capital andOther Investments in India, 4. 40 Swire, “Singapore and Mauritius Vie To Supply India's FDI.” 41 Basu, “India, Singapore Ink Pact.” 42 Ibid.
6-7
continuous business operations within Singapore.39 Nonetheless, Singapore is eager toovertake Mauritius as the primary investment route into India.40 According to industrylobbying groups in India, Singapore’s cumulative investment in India, which was about$3 billion in 2005, is expected to increase to $5 billion by 2010 and to $10 billion by 2015.41
In addition, since it already acts as a major hub for investment in the region, Singapore isseen to be able to provide investors with a larger basket of financial services compared toMauritius.42 However, it is not yet known whether increased FDI from Singapore willcorrespond with decreased FDI from Mauritius.
Other AgreementsSimilar to SAFTA, the majority of India’s bilateral and multilateral trade agreements do notcontain detailed clauses regarding investment. However, it is likely that investmentopportunities between parties will grow as trade becomes more liberalized. Appendix Bprovides a comprehensive list of India’s partners in trade and investment agreements.

1 The largest sector in terms of FDI—"electrical equipments"—totaled $6.9 billion and accounted for14 percent of the total. Government of India, Ministry of Commerce & Industry, Department of IndustrialPolicy and Promotion, “Fact Sheet on Foreign Direct Investment.” 2 Licensing refers to the requirement that importers and/or exporters obtain government approval prior toimporting or exporting. As of 1993, motor vehicle importers and exporters no longer needed governmentapproval. 3 The Indian fiscal year runs April 1–March 31. 4 McKenzie, “2007 Global Outlook.”
7-1
CHAPTER 7Case Study 1: Automotive Investmentin IndiaIntroduction
Since the industry opened up to foreign direct investment (FDI) in 1996 and the governmentlifted all equity caps for foreign automotive investors in 2002, India has attracted asignificant amount of FDI in the auto sector. Out of 42 separate industry sectors in India, the“transportation industry,” which includes but is not limited to passenger vehicles andcomponents, was the fourth largest recipient of FDI from August 1991 through December2006. With a few exceptions, most FDI has been focused on sales to the local market, butrecently, many automotive firms are investing in establishing production bases for export.FDI inflows in the sector totaled $3.5 billion, accounting for 7 percent of total FDI inflowsfrom August 1991 through December 2006.1 This case study will describe the factorscontributing to the influx of FDI to the Indian automotive sector, including domestic marketconditions and Indian government policies specific to the sector; and examine FDI bypassenger vehicle manufacturers in the most recent 5 year period—2002 through 2006.
Background on the Domestic Indian Automotive IndustryWhile rapid growth and extensive FDI in the Indian automotive industry are fairly recentphenomena, the industry itself has a long history. Indigenous automakers Hindustan MotorsLtd., Mahindra & Mahindra Ltd., and Tata Motors Ltd. were all founded in the 1940s, withrelative newcomer Maruti Udyog Ltd. founded in 1981. Overall economic liberalization,which began in 1991, led to the delicensing2 of the passenger car sector in 1993; however,quantitative restrictions on vehicle imports remained. Many foreign-owned firms establishedIndian joint-venture subsidiaries in the 1990s. In 2001, quantitative import restrictions wereremoved and in 2002, 100 percent foreign ownership was permitted.
In the last 5 years, production of passenger cars more than doubled to over 1 million cars inFY 2005–06 (table 7-1).3 Production of utility vehicles also nearly doubled, while multi-purpose vehicle (MPV) production increased only slightly. The compound annual growthrate (CAGR) over the 5 year period for total passenger vehicles is 18.2 percent, andPriceWaterhouseCoopers predicts that, in 2006–07, India’s growth will only be surpassedby China and Slovakia.4
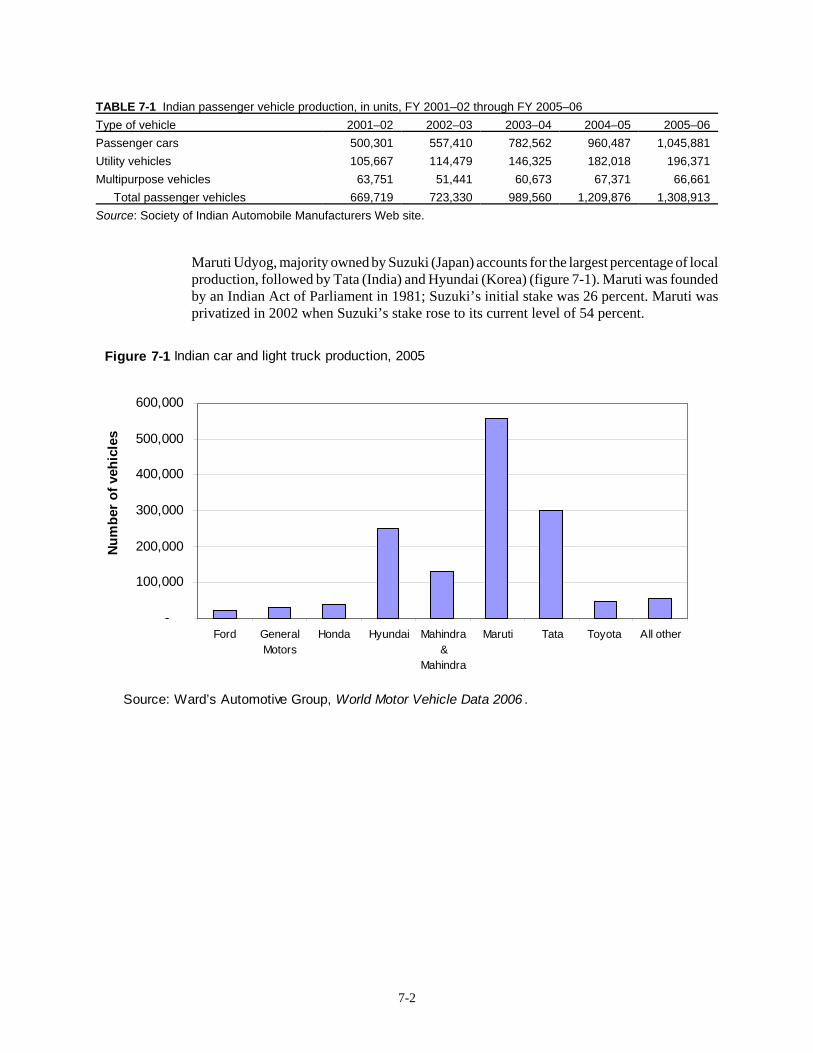
7-2
TABLE 7-1 Indian passenger vehicle production, in units, FY 2001–02 through FY 2005–06Type of vehicle 2001–02 2002–03 2003–04 2004–05 2005–06Passenger cars 500,301 557,410 782,562 960,487 1,045,881Utility vehicles 105,667 114,479 146,325 182,018 196,371Multipurpose vehicles 63,751 51,441 60,673 67,371 66,661
Total passenger vehicles 669,719 723,330 989,560 1,209,876 1,308,913Source: Society of Indian Automobile Manufacturers Web site.
Maruti Udyog, majority owned by Suzuki (Japan) accounts for the largest percentage of localproduction, followed by Tata (India) and Hyundai (Korea) (figure 7-1). Maruti was foundedby an Indian Act of Parliament in 1981; Suzuki’s initial stake was 26 percent. Maruti wasprivatized in 2002 when Suzuki’s stake rose to its current level of 54 percent.
-
100,000
200,000
300,000
400,000
500,000
600,000
Ford GeneralMotors
Honda Hyundai Mahindra&
Mahindra
Maruti Tata Toyota All other
Num
ber
of v
ehic
les
Figure 7-1 Indian car and light truck production, 2005
Source: Ward’s Automotive Group, World Motor Vehicle Data 2006 .
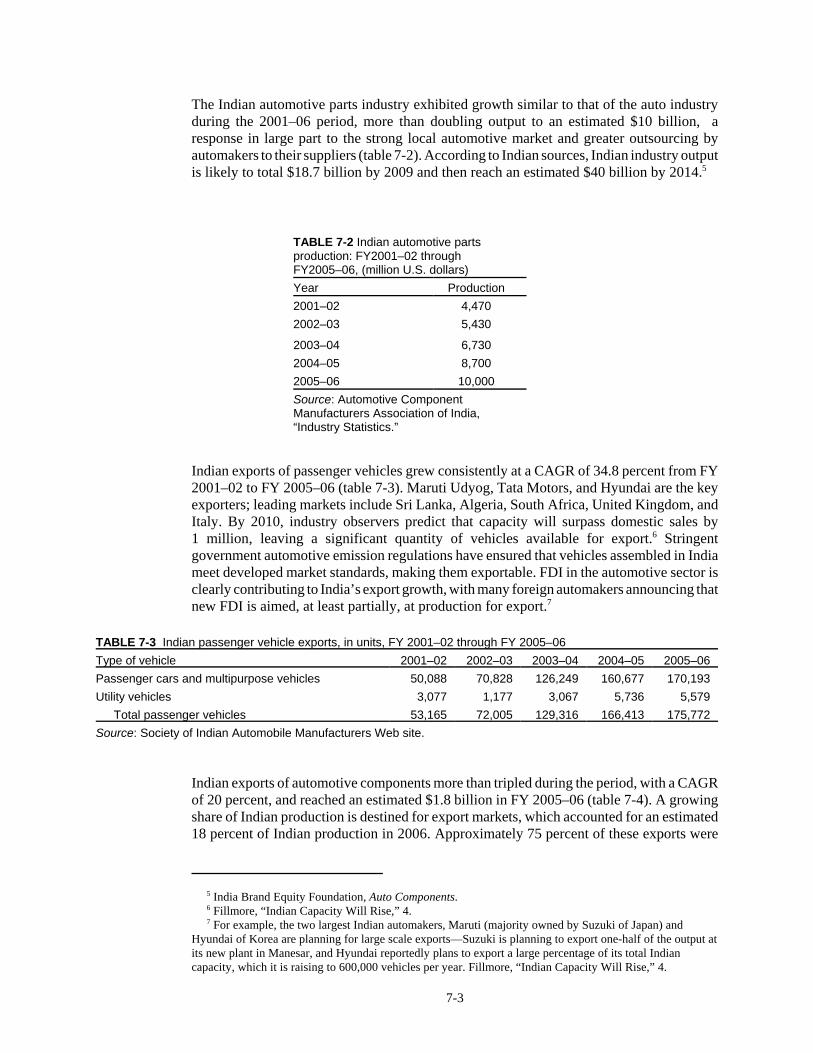
5 India Brand Equity Foundation, Auto Components. 6 Fillmore, “Indian Capacity Will Rise,” 4. 7 For example, the two largest Indian automakers, Maruti (majority owned by Suzuki of Japan) andHyundai of Korea are planning for large scale exports—Suzuki is planning to export one-half of the output atits new plant in Manesar, and Hyundai reportedly plans to export a large percentage of its total Indiancapacity, which it is raising to 600,000 vehicles per year. Fillmore, “Indian Capacity Will Rise,” 4.
7-3
The Indian automotive parts industry exhibited growth similar to that of the auto industryduring the 2001–06 period, more than doubling output to an estimated $10 billion, aresponse in large part to the strong local automotive market and greater outsourcing byautomakers to their suppliers (table 7-2). According to Indian sources, Indian industry outputis likely to total $18.7 billion by 2009 and then reach an estimated $40 billion by 2014.5
TABLE 7-2 Indian automotive partsproduction: FY2001–02 throughFY2005–06, (million U.S. dollars)Year Production2001–02 4,4702002–03 5,430
2003–04 6,7302004–05 8,7002005–06 10,000Source: Automotive ComponentManufacturers Association of India,“Industry Statistics.”
Indian exports of passenger vehicles grew consistently at a CAGR of 34.8 percent from FY2001–02 to FY 2005–06 (table 7-3). Maruti Udyog, Tata Motors, and Hyundai are the keyexporters; leading markets include Sri Lanka, Algeria, South Africa, United Kingdom, andItaly. By 2010, industry observers predict that capacity will surpass domestic sales by1 million, leaving a significant quantity of vehicles available for export.6 Stringentgovernment automotive emission regulations have ensured that vehicles assembled in Indiameet developed market standards, making them exportable. FDI in the automotive sector isclearly contributing to India’s export growth, with many foreign automakers announcing thatnew FDI is aimed, at least partially, at production for export.7
TABLE 7-3 Indian passenger vehicle exports, in units, FY 2001–02 through FY 2005–06Type of vehicle 2001–02 2002–03 2003–04 2004–05 2005–06Passenger cars and multipurpose vehicles 50,088 70,828 126,249 160,677 170,193Utility vehicles 3,077 1,177 3,067 5,736 5,579
Total passenger vehicles 53,165 72,005 129,316 166,413 175,772Source: Society of Indian Automobile Manufacturers Web site.
Indian exports of automotive components more than tripled during the period, with a CAGRof 20 percent, and reached an estimated $1.8 billion in FY 2005–06 (table 7-4). A growingshare of Indian production is destined for export markets, which accounted for an estimated18 percent of Indian production in 2006. Approximately 75 percent of these exports were
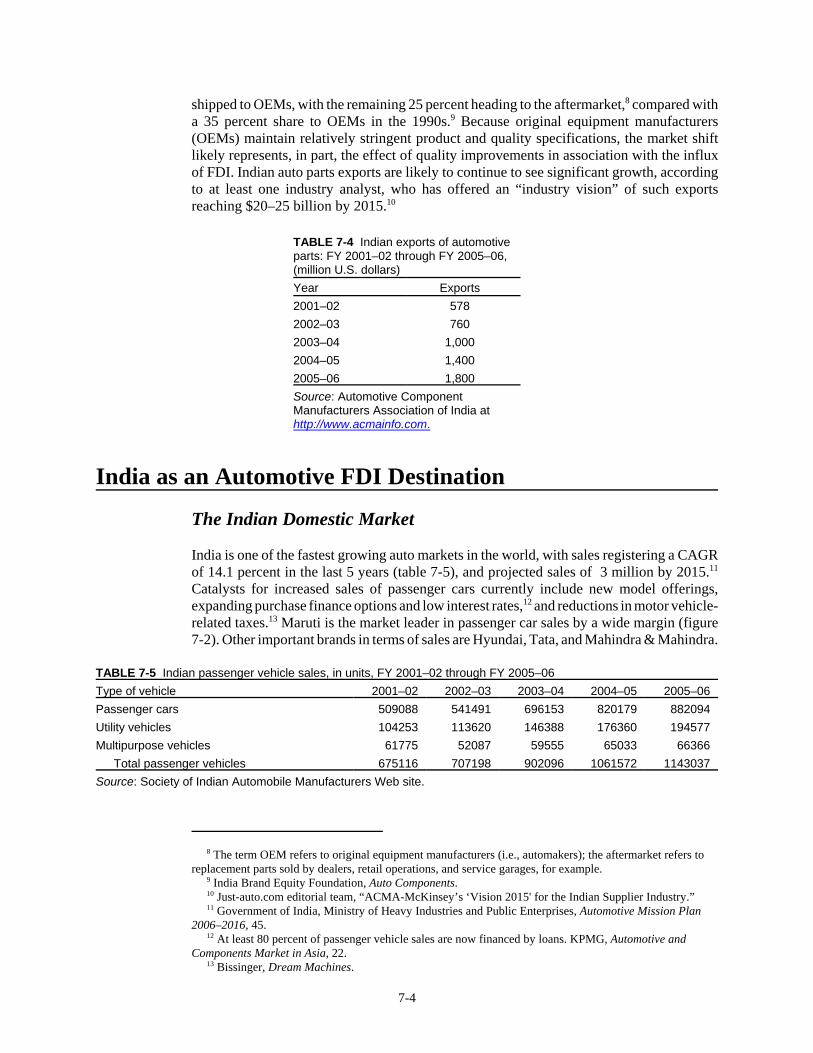
8 The term OEM refers to original equipment manufacturers (i.e., automakers); the aftermarket refers toreplacement parts sold by dealers, retail operations, and service garages, for example. 9 India Brand Equity Foundation, Auto Components. 10 Just-auto.com editorial team, “ACMA-McKinsey’s ‘Vision 2015' for the Indian Supplier Industry.” 11 Government of India, Ministry of Heavy Industries and Public Enterprises, Automotive Mission Plan2006–2016, 45. 12 At least 80 percent of passenger vehicle sales are now financed by loans. KPMG, Automotive andComponents Market in Asia, 22. 13 Bissinger, Dream Machines.
7-4
shipped to OEMs, with the remaining 25 percent heading to the aftermarket,8 compared witha 35 percent share to OEMs in the 1990s.9 Because original equipment manufacturers(OEMs) maintain relatively stringent product and quality specifications, the market shiftlikely represents, in part, the effect of quality improvements in association with the influxof FDI. Indian auto parts exports are likely to continue to see significant growth, accordingto at least one industry analyst, who has offered an “industry vision” of such exportsreaching $20–25 billion by 2015.10
TABLE 7-4 Indian exports of automotiveparts: FY 2001–02 through FY 2005–06,(million U.S. dollars)Year Exports2001–02 5782002–03 7602003–04 1,0002004–05 1,4002005–06 1,800Source: Automotive ComponentManufacturers Association of India athttp://www.acmainfo.com.
India as an Automotive FDI Destination
The Indian Domestic Market
India is one of the fastest growing auto markets in the world, with sales registering a CAGRof 14.1 percent in the last 5 years (table 7-5), and projected sales of 3 million by 2015.11
Catalysts for increased sales of passenger cars currently include new model offerings,expanding purchase finance options and low interest rates,12 and reductions in motor vehicle-related taxes.13 Maruti is the market leader in passenger car sales by a wide margin (figure7-2). Other important brands in terms of sales are Hyundai, Tata, and Mahindra & Mahindra.
TABLE 7-5 Indian passenger vehicle sales, in units, FY 2001–02 through FY 2005–06Type of vehicle 2001–02 2002–03 2003–04 2004–05 2005–06Passenger cars 509088 541491 696153 820179 882094Utility vehicles 104253 113620 146388 176360 194577Multipurpose vehicles 61775 52087 59555 65033 66366
Total passenger vehicles 675116 707198 902096 1061572 1143037Source: Society of Indian Automobile Manufacturers Web site.
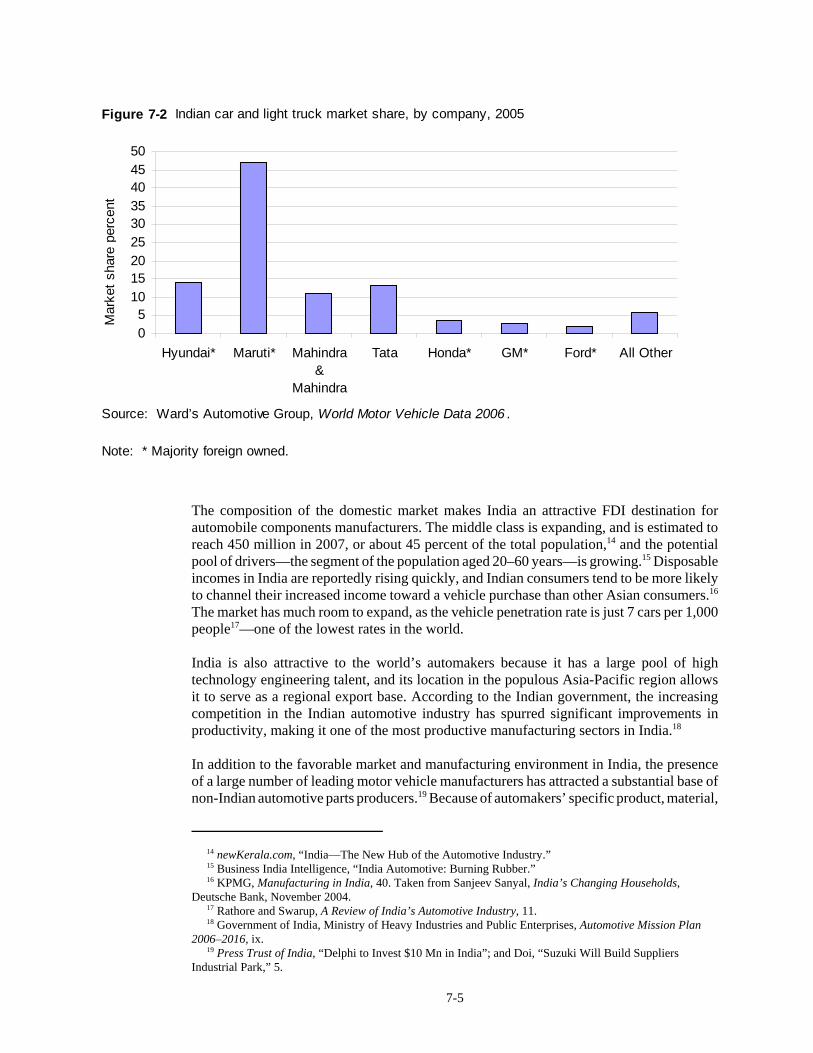
14 newKerala.com, “India—The New Hub of the Automotive Industry.” 15 Business India Intelligence, “India Automotive: Burning Rubber.” 16 KPMG, Manufacturing in India, 40. Taken from Sanjeev Sanyal, India’s Changing Households,Deutsche Bank, November 2004. 17 Rathore and Swarup, A Review of India’s Automotive Industry, 11. 18 Government of India, Ministry of Heavy Industries and Public Enterprises, Automotive Mission Plan2006–2016, ix. 19 Press Trust of India, “Delphi to Invest $10 Mn in India”; and Doi, “Suzuki Will Build SuppliersIndustrial Park,” 5.
7-5
The composition of the domestic market makes India an attractive FDI destination forautomobile components manufacturers. The middle class is expanding, and is estimated toreach 450 million in 2007, or about 45 percent of the total population,14 and the potentialpool of drivers—the segment of the population aged 20–60 years—is growing.15 Disposableincomes in India are reportedly rising quickly, and Indian consumers tend to be more likelyto channel their increased income toward a vehicle purchase than other Asian consumers.16
The market has much room to expand, as the vehicle penetration rate is just 7 cars per 1,000people17—one of the lowest rates in the world.
India is also attractive to the world’s automakers because it has a large pool of hightechnology engineering talent, and its location in the populous Asia-Pacific region allowsit to serve as a regional export base. According to the Indian government, the increasingcompetition in the Indian automotive industry has spurred significant improvements inproductivity, making it one of the most productive manufacturing sectors in India.18
In addition to the favorable market and manufacturing environment in India, the presenceof a large number of leading motor vehicle manufacturers has attracted a substantial base ofnon-Indian automotive parts producers.19 Because of automakers’ specific product, material,
05
101520253035404550
Hyundai* Maruti* Mahindra&
Mahindra
Tata Honda* GM* Ford* All Other
Mar
ket s
hare
per
cent
Figure 7-2 Indian car and light truck market share, by company, 2005
Source: Ward’s Automotive Group, World Motor Vehicle Data 2006 .
Note: * Majority foreign owned.
20 Government of India, Ministry of Heavy Industries and Public Enterprises, Department of HeavyIndustry, Auto Policy. 21 SIAM, “Auto Policy of Government of India.” 22 Government of India, Ministry of Heavy Industries and Public Enterprises, Department of HeavyIndustry, Auto Policy, art. 8.1. 23 A CKD is a complete kit needed to assemble a vehicle. It is common practice among automakers to sellknocked down kits to their foreign affiliates; the automaker is typically able to avoid high import taxes, gainmarket access, and/or receive tax preferences for providing local employment, and the assemblers indeveloping markets to gain expertise. 24 Bissinger, Dream Machines.
7-6
and quality requirements, they generally purchase components from established producerswith the necessary certifications, reputation, and experience. Moreover, automakers preferto source components locally to benefit from just-in-time delivery and supplier support. Tomeet these objectives, automakers often encourage their suppliers to invest in greenfieldoperations or form joint ventures with local manufacturers, particularly when entering newmarkets with limited or developing component industries. The size of the local vehicleassembly industry also offers sufficient production volumes to warrant the level ofinvestment necessary to support component manufacturing operations in India.
Indian Government Policies Affecting Auto FDI
As noted above, since the 1990s, Indian government policies have been aimed at promotinga globally competitive auto sector, and FDI is a critical component of this plan. In the past5 years, the government of India has taken a number of steps toward expanding the domesticautomotive industry and promoting it as a globally competitive player. These policies aresummarized below.
Automotive Policy of 2002
The primary goal of this policy was “to establish a globally competitive automotive industryin India and to double its contribution to the economy by 2010.”20 Key objectives outlinedin the 2002 policy included modernizing the domestic industry; fostering domestic design,research, and development; developing alternate propulsion technologies; and establishingdomestic environmental and safety standards on par with international standards.21 In animportant change, the 2002 policy permitted 100 percent foreign ownership of automotiveand automotive parts manufacturing firms without minimum investment criteria. The policyalso addressed import tariffs, with a stated objective of “facilitat(ing) development ofmanufacturing capabilities as opposed to mere assembly without giving undue protection;ensur(ing) balanced transition to open trade, promot(ing) increased competition in the marketand enlarg(ing) purchase options to the Indian customer.”22 Import duties on components andcompletely knocked down (CKD) kits23 were reduced to 30 percent in 2003 and to 15percent in 2005.24 Coupled with a reduction in local content requirements, these changesencouraged FDI by making it more economical to assemble vehicles in India. The 2002automotive policy also provided for incentives for R&D and tax concessions.
25 Government of India, Ministry of Heavy Industries and Public Enterprises, Automotive Mission Plan2006–2016, xiii. 26 Ibid., 13. 27 Ibid., 26. 28 Ibid., 10. 29 Ibid., 25. 30 Ibid., 26.
7-7
Automotive Mission Plan 2006–2016
Recognizing that “the concept of attaining competitiveness on the basis of cheap andabundant labour, favourable exchange rates, low interest rates and concessional dutystructure is becoming inadequate and therefore, not sustainable,”25 the Indian governmentintroduced the Automotive Mission Plan (AMP) in September 2006, and finalized in March2007. The policy states that industry investment in R&D is needed to “increase innovativebreakthroughs for vehicle design as well as in manufacturing technology” and that the Indiangovernment has a role to play in attracting this investment.26 The vision statement of theAMP is:
To emerge as the destination of choice in the world for design and manufacture ofautomobiles and auto components with output reaching a level of $145 billionaccounting for more than 10% of the GDP and providing additional employmentto 25 million people by 2016.27
These goals are expected to be addressed via large investments from both industry and thegovernment; according to the AMP, output targets “would require incremental investmentof $35–40 billion. . . by 2016.”28 If successful, India would emerge, in 2016, as the world’sseventh largest passenger car producer, compared to its current rank of eleventh.29
The AMP envisions that the role of the Indian government would entail facilitatinginfrastructure creation, promoting the country’s capabilities, creating a favorable andpredictable business environment, attracting investment, and promoting R&D. Under thisscenario, the role of industry would include designing and manufacturing world-classvehicles, improving cost competitiveness and labor and capital productivity, achievingeconomies of scale and R&D capabilities, and showcasing India’s products in potentialmarkets.30 Specific portions of the AMP are summarized in box 7-1 below.
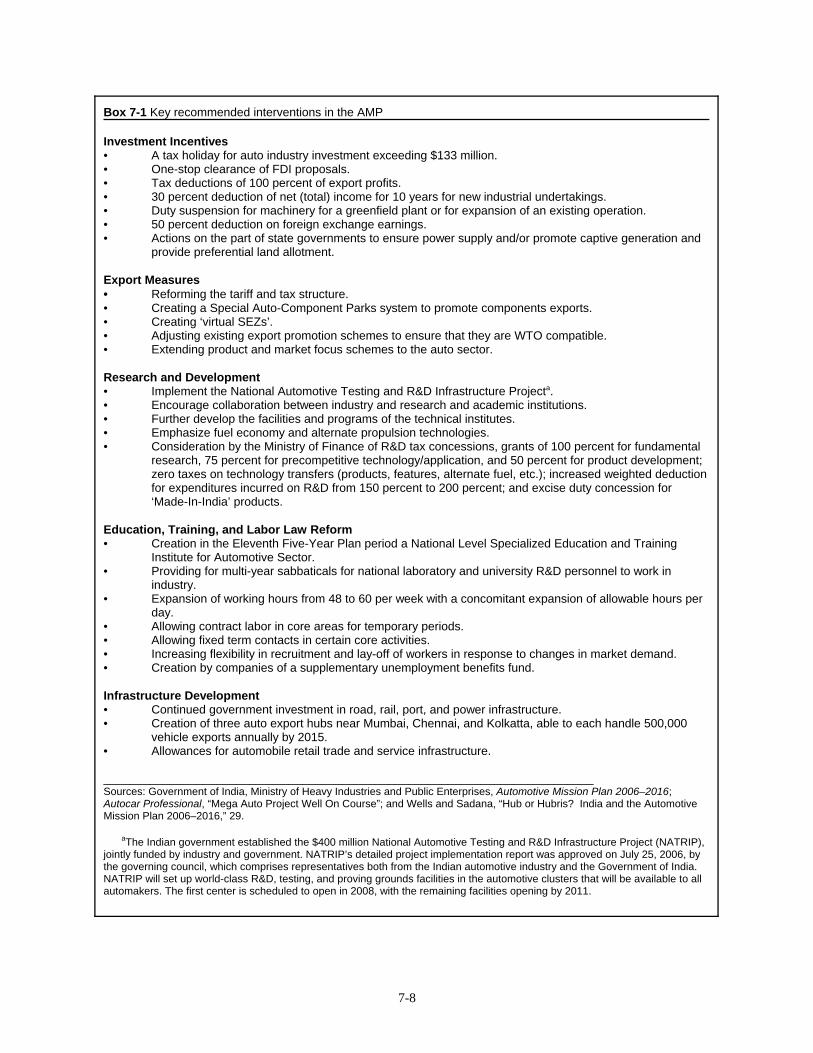
7-8
Box 7-1 Key recommended interventions in the AMP
Investment Incentives• A tax holiday for auto industry investment exceeding $133 million.• One-stop clearance of FDI proposals.• Tax deductions of 100 percent of export profits.• 30 percent deduction of net (total) income for 10 years for new industrial undertakings.• Duty suspension for machinery for a greenfield plant or for expansion of an existing operation.• 50 percent deduction on foreign exchange earnings.• Actions on the part of state governments to ensure power supply and/or promote captive generation and
provide preferential land allotment.
Export Measures• Reforming the tariff and tax structure.• Creating a Special Auto-Component Parks system to promote components exports.• Creating ‘virtual SEZs’.• Adjusting existing export promotion schemes to ensure that they are WTO compatible.• Extending product and market focus schemes to the auto sector.
Research and Development• Implement the National Automotive Testing and R&D Infrastructure Projecta.• Encourage collaboration between industry and research and academic institutions.• Further develop the facilities and programs of the technical institutes.• Emphasize fuel economy and alternate propulsion technologies.• Consideration by the Ministry of Finance of R&D tax concessions, grants of 100 percent for fundamental
research, 75 percent for precompetitive technology/application, and 50 percent for product development;zero taxes on technology transfers (products, features, alternate fuel, etc.); increased weighted deductionfor expenditures incurred on R&D from 150 percent to 200 percent; and excise duty concession for‘Made-In-India’ products.
Education, Training, and Labor Law Reform• Creation in the Eleventh Five-Year Plan period a National Level Specialized Education and Training
Institute for Automotive Sector.• Providing for multi-year sabbaticals for national laboratory and university R&D personnel to work in
industry.• Expansion of working hours from 48 to 60 per week with a concomitant expansion of allowable hours per
day.• Allowing contract labor in core areas for temporary periods.• Allowing fixed term contacts in certain core activities.• Increasing flexibility in recruitment and lay-off of workers in response to changes in market demand.• Creation by companies of a supplementary unemployment benefits fund.
Infrastructure Development• Continued government investment in road, rail, port, and power infrastructure.• Creation of three auto export hubs near Mumbai, Chennai, and Kolkatta, able to each handle 500,000
vehicle exports annually by 2015.• Allowances for automobile retail trade and service infrastructure.
__________________________________________________________________________Sources: Government of India, Ministry of Heavy Industries and Public Enterprises, Automotive Mission Plan 2006–2016;Autocar Professional, “Mega Auto Project Well On Course”; and Wells and Sadana, “Hub or Hubris? India and the AutomotiveMission Plan 2006–2016,” 29.
aThe Indian government established the $400 million National Automotive Testing and R&D Infrastructure Project (NATRIP),jointly funded by industry and government. NATRIP’s detailed project implementation report was approved on July 25, 2006, bythe governing council, which comprises representatives both from the Indian automotive industry and the Government of India.NATRIP will set up world-class R&D, testing, and proving grounds facilities in the automotive clusters that will be available to allautomakers. The first center is scheduled to open in 2008, with the remaining facilities opening by 2011.
31 KPMG, Automotive and Components Market in Asia, 23. 32 Fillmore, “Short of Engineers at Home,” 7. 33 Mahindra World City Web site. 34 Adityapur Industrial Area Development Authority Web site. 35 Asian Pacific Bulletin, “Can India Revitalize its Special Economic Zones to Rival Those in China?”;Johnson, “India Lifts Freeze on Enterprise Zones”; and Srinivasan, “China, India and the World Economy.” 36 KPMG, Manufacturing in India, 3. 37 U.S. India Business Council official, interview by Commission staff, January 4, 2007. 38 KPMG, Manufacturing in India, 35. 39 Ibid.
7-9
Foreign Investment in the Indian Auto IndustryAutomaker FDI decisions are primarily driven by market factors, including proximity tomarkets, market size, cost of production, and favorable infrastructure. For example,automakers tend to assemble vehicles in or near their major markets, or may choose to investin a foreign market because of that country’s tariff structure or to improve access to localmarkets. Foreign automakers direct their investment toward manufacturing plants, and alsoseek to expand their dealer networks and their network certified repair shops. Investmentscan also go into R&D facilities, training centers, and purchase financing operations. Becauseof India’s improving technical capabilities and low costs, global automakers are increasinglyoutsourcing R&D, design, and engineering to their Indian partners or subsidiaries.31 Forexample, Suzuki has been increasingly outsourcing more R&D and design work for itsglobal operations to its Indian subsidiary, Maruti, and scaling back on such operations inJapan. Since its inception in 2000, Maruti’s R&D staff grew to 250 employees in 2006.32
Several special economic zones (SEZs) are targeted specifically at the automotive industry,such as the Mahindra World City Auto Ancillary SEZ, which advertises its proximity to Fordand Visteon as one of the many reasons that automotive suppliers would choose to set upoperations there,33 and Adityapur Industrial Area Development Authority, which boastscompetencies in sheet metal pressed fabricated components and subassemblies; light andheavy fabrication; castings, forgings and machining; and polymer components.34 Despite thefinancial incentives offered by Indian SEZs, these zones have been less successful inattracting foreign and domestic investment than other economic zones, such as thoseoperating in China. The Indian zones reportedly lack sufficient size to achieve economiesof scale, have been subject to restrictive labor laws, and lack efficient infrastructure tofacilitate communication and shipment of goods.35
As discussed in chapter 3, foreign investors in India face issues related to infrastructure andcorruption in India, but these are not enough to dissuade investors. Power, road, rail, and portinfrastructure all pose challenges for the automotive industry, raising the cost of productionand lowering efficiencies. Some automotive industry observers consider the unreliable powersupply to be the most significant infrastructure constraint. One source reports that, “onaverage, a company can expect nearly 17 significant power outages per month, against oneper month in Malaysia and fewer than 5 in China. At the same time, costs are higher.”36
Many companies reportedly maintain their own private power supplies to compensate for thenational shortcomings;37 one study on the Indian manufacturing sector asserts that over 60percent of companies rely on private power generation.38 The transportation infrastructureis also inadequate. An industry official states that India’s weak infrastructure is “the biggestchallenge for industry,” noting that political disagreements between India’s state and federalgovernments exacerbate the problems.39
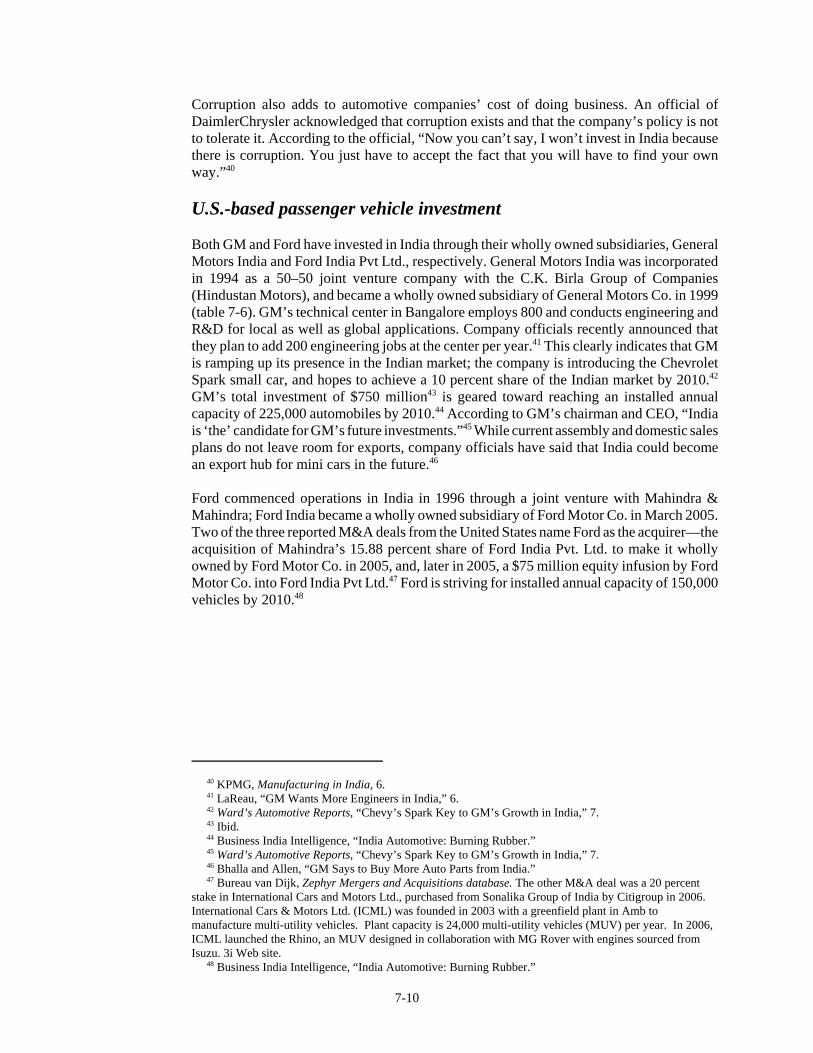
40 KPMG, Manufacturing in India, 6. 41 LaReau, “GM Wants More Engineers in India,” 6. 42 Ward’s Automotive Reports, “Chevy’s Spark Key to GM’s Growth in India,” 7. 43 Ibid. 44 Business India Intelligence, “India Automotive: Burning Rubber.” 45 Ward’s Automotive Reports, “Chevy’s Spark Key to GM’s Growth in India,” 7. 46 Bhalla and Allen, “GM Says to Buy More Auto Parts from India.” 47 Bureau van Dijk, Zephyr Mergers and Acquisitions database. The other M&A deal was a 20 percentstake in International Cars and Motors Ltd., purchased from Sonalika Group of India by Citigroup in 2006. International Cars & Motors Ltd. (ICML) was founded in 2003 with a greenfield plant in Amb tomanufacture multi-utility vehicles. Plant capacity is 24,000 multi-utility vehicles (MUV) per year. In 2006,ICML launched the Rhino, an MUV designed in collaboration with MG Rover with engines sourced fromIsuzu. 3i Web site. 48 Business India Intelligence, “India Automotive: Burning Rubber.”
7-10
Corruption also adds to automotive companies’ cost of doing business. An official ofDaimlerChrysler acknowledged that corruption exists and that the company’s policy is notto tolerate it. According to the official, “Now you can’t say, I won’t invest in India becausethere is corruption. You just have to accept the fact that you will have to find your ownway.”40
U.S.-based passenger vehicle investment
Both GM and Ford have invested in India through their wholly owned subsidiaries, GeneralMotors India and Ford India Pvt Ltd., respectively. General Motors India was incorporatedin 1994 as a 50–50 joint venture company with the C.K. Birla Group of Companies(Hindustan Motors), and became a wholly owned subsidiary of General Motors Co. in 1999(table 7-6). GM’s technical center in Bangalore employs 800 and conducts engineering andR&D for local as well as global applications. Company officials recently announced thatthey plan to add 200 engineering jobs at the center per year.41 This clearly indicates that GMis ramping up its presence in the Indian market; the company is introducing the ChevroletSpark small car, and hopes to achieve a 10 percent share of the Indian market by 2010.42
GM’s total investment of $750 million43 is geared toward reaching an installed annualcapacity of 225,000 automobiles by 2010.44 According to GM’s chairman and CEO, “Indiais ‘the’ candidate for GM’s future investments.”45 While current assembly and domestic salesplans do not leave room for exports, company officials have said that India could becomean export hub for mini cars in the future.46
Ford commenced operations in India in 1996 through a joint venture with Mahindra &Mahindra; Ford India became a wholly owned subsidiary of Ford Motor Co. in March 2005.Two of the three reported M&A deals from the United States name Ford as the acquirer—theacquisition of Mahindra’s 15.88 percent share of Ford India Pvt. Ltd. to make it whollyowned by Ford Motor Co. in 2005, and, later in 2005, a $75 million equity infusion by FordMotor Co. into Ford India Pvt Ltd.47 Ford is striving for installed annual capacity of 150,000vehicles by 2010.48
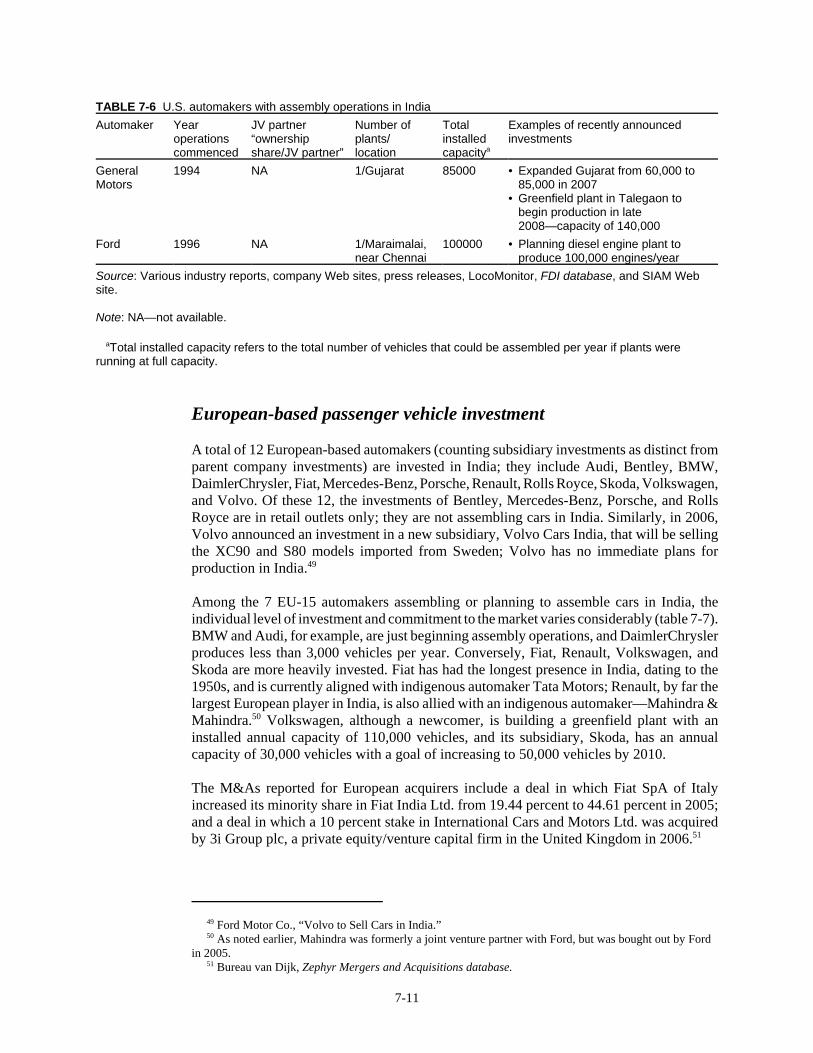
49 Ford Motor Co., “Volvo to Sell Cars in India.” 50 As noted earlier, Mahindra was formerly a joint venture partner with Ford, but was bought out by Fordin 2005. 51 Bureau van Dijk, Zephyr Mergers and Acquisitions database.
7-11
TABLE 7-6 U.S. automakers with assembly operations in India Automaker Year
operationscommenced
JV partner“ownershipshare/JV partner”
Number ofplants/location
Totalinstalledcapacitya
Examples of recently announcedinvestments
GeneralMotors
1994 NA 1/Gujarat 85000 • Expanded Gujarat from 60,000 to85,000 in 2007
• Greenfield plant in Talegaon tobegin production in late2008—capacity of 140,000
Ford 1996 NA 1/Maraimalai,near Chennai
100000 • Planning diesel engine plant toproduce 100,000 engines/year
Source: Various industry reports, company Web sites, press releases, LocoMonitor, FDI database, and SIAM Website.
Note: NA—not available.
aTotal installed capacity refers to the total number of vehicles that could be assembled per year if plants wererunning at full capacity.
European-based passenger vehicle investment
A total of 12 European-based automakers (counting subsidiary investments as distinct fromparent company investments) are invested in India; they include Audi, Bentley, BMW,DaimlerChrysler, Fiat, Mercedes-Benz, Porsche, Renault, Rolls Royce, Skoda, Volkswagen,and Volvo. Of these 12, the investments of Bentley, Mercedes-Benz, Porsche, and RollsRoyce are in retail outlets only; they are not assembling cars in India. Similarly, in 2006,Volvo announced an investment in a new subsidiary, Volvo Cars India, that will be sellingthe XC90 and S80 models imported from Sweden; Volvo has no immediate plans forproduction in India.49
Among the 7 EU-15 automakers assembling or planning to assemble cars in India, theindividual level of investment and commitment to the market varies considerably (table 7-7).BMW and Audi, for example, are just beginning assembly operations, and DaimlerChryslerproduces less than 3,000 vehicles per year. Conversely, Fiat, Renault, Volkswagen, andSkoda are more heavily invested. Fiat has had the longest presence in India, dating to the1950s, and is currently aligned with indigenous automaker Tata Motors; Renault, by far thelargest European player in India, is also allied with an indigenous automaker—Mahindra &Mahindra.50 Volkswagen, although a newcomer, is building a greenfield plant with aninstalled annual capacity of 110,000 vehicles, and its subsidiary, Skoda, has an annualcapacity of 30,000 vehicles with a goal of increasing to 50,000 vehicles by 2010.
The M&As reported for European acquirers include a deal in which Fiat SpA of Italyincreased its minority share in Fiat India Ltd. from 19.44 percent to 44.61 percent in 2005;and a deal in which a 10 percent stake in International Cars and Motors Ltd. was acquiredby 3i Group plc, a private equity/venture capital firm in the United Kingdom in 2006.51
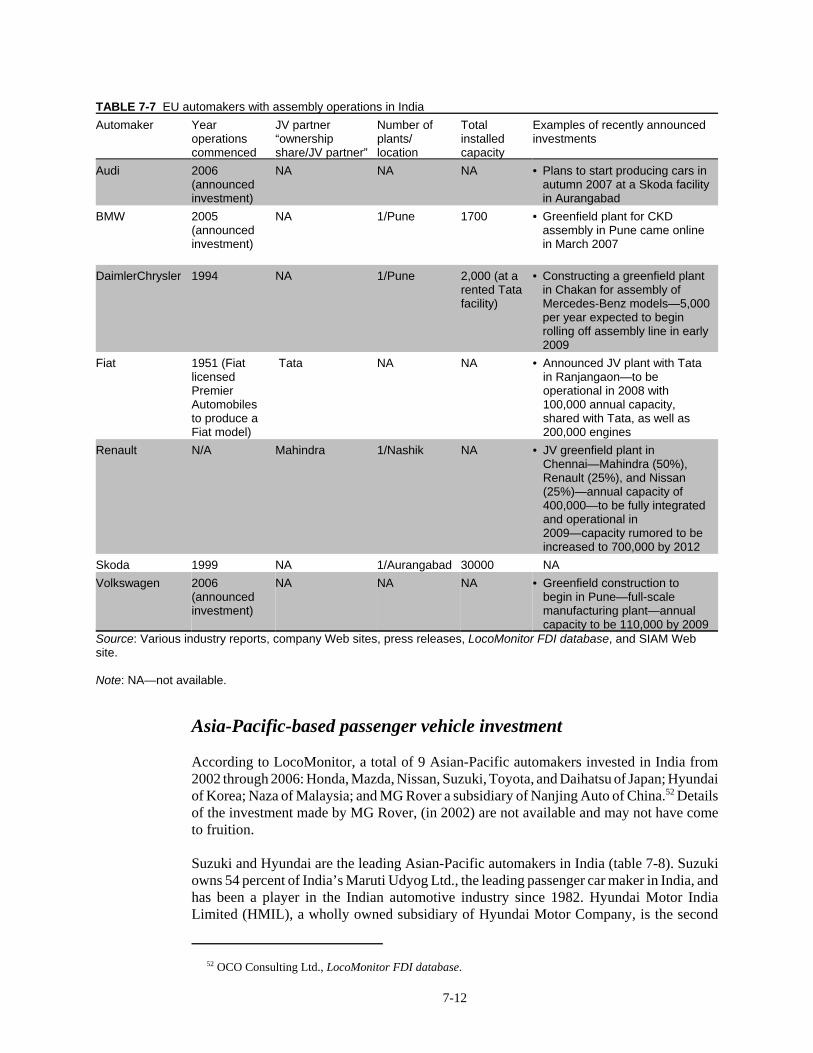
52 OCO Consulting Ltd., LocoMonitor FDI database.
7-12
TABLE 7-7 EU automakers with assembly operations in IndiaAutomaker Year
operationscommenced
JV partner “ownershipshare/JV partner”
Number ofplants/location
Totalinstalledcapacity
Examples of recently announcedinvestments
Audi 2006(announcedinvestment)
NA NA NA • Plans to start producing cars inautumn 2007 at a Skoda facilityin Aurangabad
BMW 2005(announcedinvestment)
NA 1/Pune 1700 • Greenfield plant for CKDassembly in Pune came onlinein March 2007
DaimlerChrysler 1994 NA 1/Pune 2,000 (at arented Tatafacility)
• Constructing a greenfield plantin Chakan for assembly ofMercedes-Benz models—5,000per year expected to beginrolling off assembly line in early2009
Fiat 1951 (FiatlicensedPremierAutomobilesto produce aFiat model)
Tata NA NA • Announced JV plant with Tatain Ranjangaon—to beoperational in 2008 with100,000 annual capacity,shared with Tata, as well as200,000 engines
Renault N/A Mahindra 1/Nashik NA • JV greenfield plant inChennai—Mahindra (50%),Renault (25%), and Nissan(25%)—annual capacity of400,000—to be fully integratedand operational in2009—capacity rumored to beincreased to 700,000 by 2012
Skoda 1999 NA 1/Aurangabad 30000 NAVolkswagen 2006
(announcedinvestment)
NA NA NA • Greenfield construction tobegin in Pune—full-scalemanufacturing plant—annualcapacity to be 110,000 by 2009
Source: Various industry reports, company Web sites, press releases, LocoMonitor FDI database, and SIAM Website.
Note: NA—not available.
Asia-Pacific-based passenger vehicle investment
According to LocoMonitor, a total of 9 Asian-Pacific automakers invested in India from2002 through 2006: Honda, Mazda, Nissan, Suzuki, Toyota, and Daihatsu of Japan; Hyundaiof Korea; Naza of Malaysia; and MG Rover a subsidiary of Nanjing Auto of China.52 Detailsof the investment made by MG Rover, (in 2002) are not available and may not have cometo fruition.
Suzuki and Hyundai are the leading Asian-Pacific automakers in India (table 7-8). Suzukiowns 54 percent of India’s Maruti Udyog Ltd., the leading passenger car maker in India, andhas been a player in the Indian automotive industry since 1982. Hyundai Motor IndiaLimited (HMIL), a wholly owned subsidiary of Hyundai Motor Company, is the second
53 Just-auto.com editorial team, “Hyundai Has Ambitious Plans.” 54 Automotive Component Manufacturers Association of India, “Industry Statistics.” 55 OCO Consulting Ltd., LocoMonitor FDI database. 56 Information for mergers and acquisitions compiled from Bureau van Dijk, Zephyr Mergers andAcquisitions database. 57 Of the 44 acquisitions reported in the Zephyr database, the values of 11 deals were not available.
7-13
largest carmaker in India and accounts for 60 percent of all cars exported from India.53
Honda, Toyota, and Hyundai entered the industry in the mid to late 1990s, and Nissan andNaza are the most recent Asian-Pacific automakers to begin Indian operations.
Component industry
From FY 2001–02 through FY 2005–06, total investment in the Indian automotivecomponents industry nearly doubled to an estimated $4.4 billion.54 Of known foreign directinvestment, roughly one-half of such projects were in higher technology items such as enginecomponents, drive trains, and electronic systems. Most of the FDI represented new projectsrather than expansions of existing operations, and focused on manufacturing rather thanR&D and other automotive-related activities. As would be expected because of their leadingpositions in the global automotive industry, U.S., German, and Japanese firms were theprincipal sources of foreign investment in the Indian components industry.55
Additionally, foreign firms increased their total investment in Indian automotive partsproducers by a minimum of $600 million from 2002 through YTD 200756 with 44 announcedor completed acquisitions.57 U.S. firms led in total number of deals for single countries, with10 reported acquisitions, and Japanese firms were involved in 8 deals. Europe as a wholetook part in 17 acquisitions, with the United Kingdom and Germany accounting for 5 and4 acquisitions, respectively. The largest deal for which value was reported was the $128million acquisition of the majority stake of Ashok Leyland by the Hinduja Group, a London-based multinational with interests in manufacturing, banking, and trade, completed in August2006.
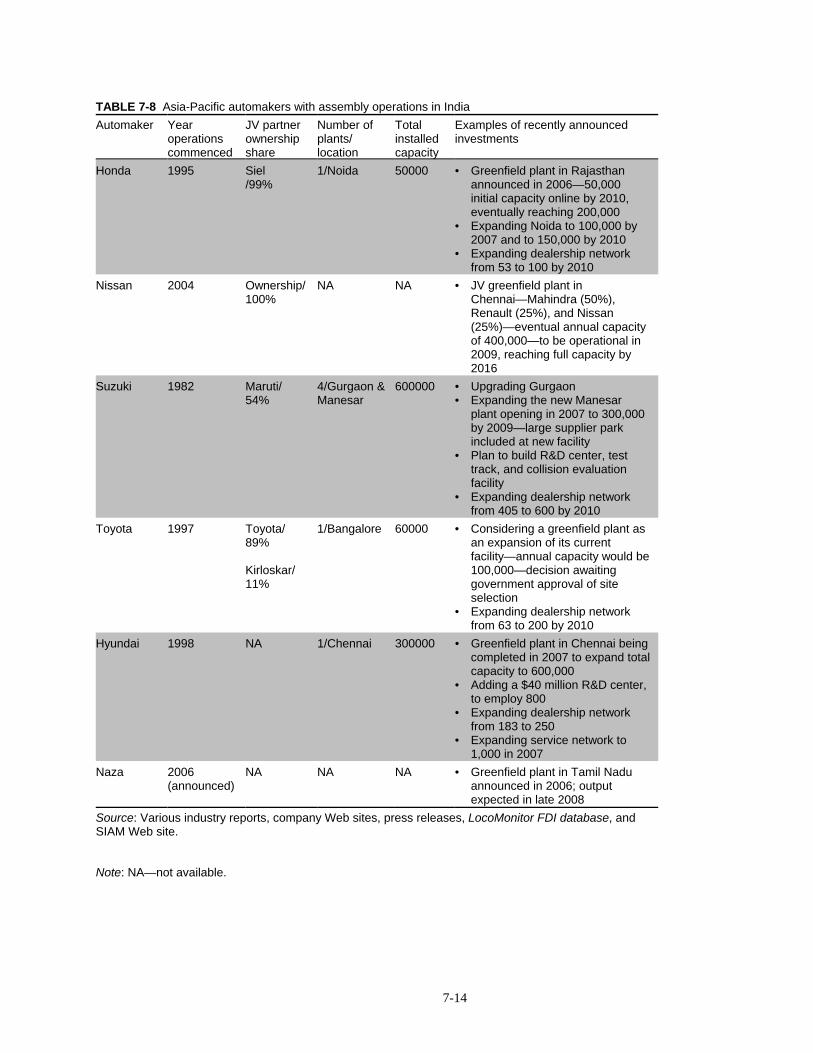
7-14
TABLE 7-8 Asia-Pacific automakers with assembly operations in IndiaAutomaker Year
operationscommenced
JV partnerownershipshare
Number ofplants/location
Totalinstalledcapacity
Examples of recently announcedinvestments
Honda 1995 Siel/99%
1/Noida 50000 • Greenfield plant in Rajasthanannounced in 2006—50,000initial capacity online by 2010,eventually reaching 200,000
• Expanding Noida to 100,000 by2007 and to 150,000 by 2010
• Expanding dealership networkfrom 53 to 100 by 2010
Nissan 2004 Ownership/100%
NA NA • JV greenfield plant inChennai—Mahindra (50%),Renault (25%), and Nissan(25%)—eventual annual capacityof 400,000—to be operational in2009, reaching full capacity by2016
Suzuki 1982 Maruti/54%
4/Gurgaon &Manesar
600000 • Upgrading Gurgaon• Expanding the new Manesar
plant opening in 2007 to 300,000by 2009—large supplier parkincluded at new facility
• Plan to build R&D center, testtrack, and collision evaluationfacility
• Expanding dealership networkfrom 405 to 600 by 2010
Toyota 1997 Toyota/89%
Kirloskar/11%
1/Bangalore 60000 • Considering a greenfield plant asan expansion of its currentfacility—annual capacity would be100,000—decision awaitinggovernment approval of siteselection
• Expanding dealership networkfrom 63 to 200 by 2010
Hyundai 1998 NA 1/Chennai 300000 • Greenfield plant in Chennai beingcompleted in 2007 to expand totalcapacity to 600,000
• Adding a $40 million R&D center,to employ 800
• Expanding dealership networkfrom 183 to 250
• Expanding service network to1,000 in 2007
Naza 2006(announced)
NA NA NA • Greenfield plant in Tamil Naduannounced in 2006; outputexpected in late 2008
Source: Various industry reports, company Web sites, press releases, LocoMonitor FDI database, andSIAM Web site.
Note: NA—not available.
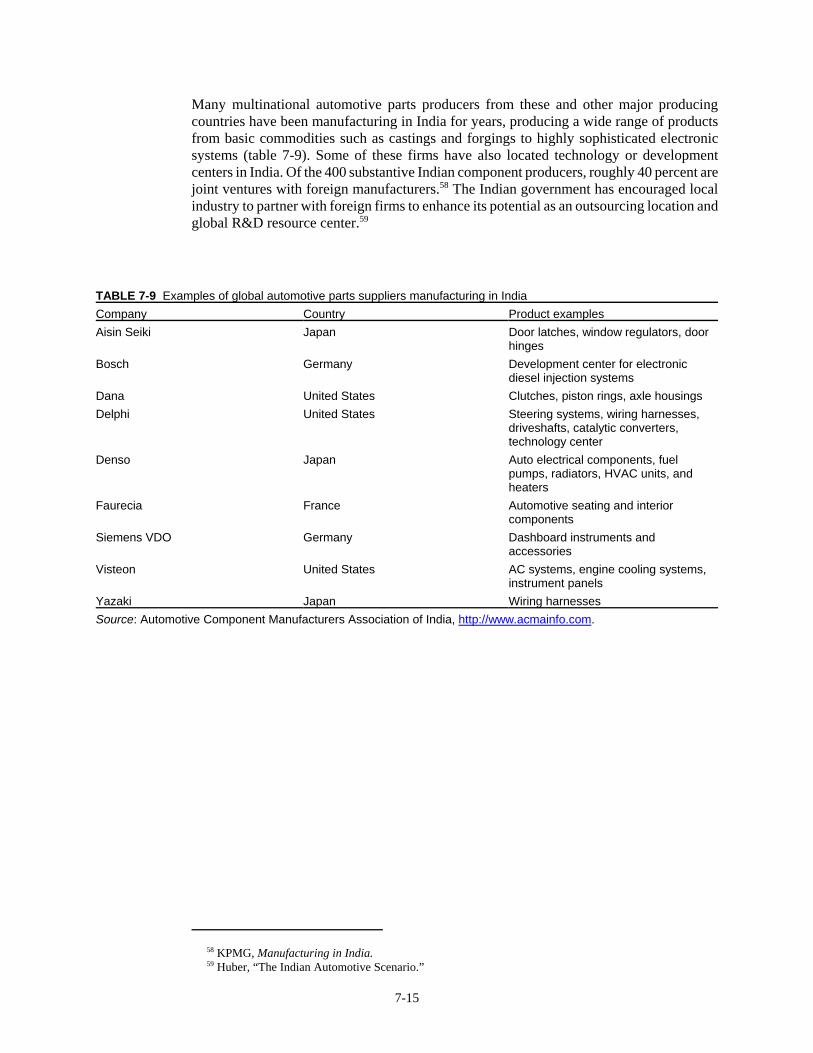
58 KPMG, Manufacturing in India. 59 Huber, “The Indian Automotive Scenario.”
7-15
Many multinational automotive parts producers from these and other major producingcountries have been manufacturing in India for years, producing a wide range of productsfrom basic commodities such as castings and forgings to highly sophisticated electronicsystems (table 7-9). Some of these firms have also located technology or developmentcenters in India. Of the 400 substantive Indian component producers, roughly 40 percent arejoint ventures with foreign manufacturers.58 The Indian government has encouraged localindustry to partner with foreign firms to enhance its potential as an outsourcing location andglobal R&D resource center.59
TABLE 7-9 Examples of global automotive parts suppliers manufacturing in IndiaCompany Country Product examplesAisin Seiki Japan Door latches, window regulators, door
hingesBosch Germany Development center for electronic
diesel injection systemsDana United States Clutches, piston rings, axle housingsDelphi United States Steering systems, wiring harnesses,
driveshafts, catalytic converters,technology center
Denso Japan Auto electrical components, fuelpumps, radiators, HVAC units, andheaters
Faurecia France Automotive seating and interiorcomponents
Siemens VDO Germany Dashboard instruments andaccessories
Visteon United States AC systems, engine cooling systems,instrument panels
Yazaki Japan Wiring harnessesSource: Automotive Component Manufacturers Association of India, http://www.acmainfo.com.
60 Wells, “Hub or Hubris? Prospects for the AMP to 2016.” 61 Wells and Sadana, “Hub or Hubris? India and the Automotive Mission Plan 2006–16,” 29. 62 Government of India, Ministry of Steel, National Steel Policy 2005. 63 Wells and Sadana, “Hub or Hubris? India and the Automotive Mission Plan 2006–16,” 29. 64 Ramachandran, “A Grand Plan for Indian Automobiles.”
7-16
Conclusion
The key to continued FDI in India’s auto sector rests with continued expansion of thedomestic market, which seems ensured, and the further development of India as anautomotive export hub. “Much will depend upon individual corporate strategies, particularlyin terms of manufacturing locations in relation to market served.”60 Moreover, because ofextensive forward and backward linkages, the viability of the AMP and the accomplishmentof its goals are reliant on related industries and domestic developments.61 The slow progresson improvements to the transportation infrastructure and the uncertain availability of inputssuch as steel may make it difficult for India to meet its AMP targets. Like the auto industry,the steel industry also has a national plan specifying production and other targets.62 However,meeting these targets depends on expansion of the railway network in order to move iron ore,coking coal, and finished steel around the country. The supply of fuel for individualmotorists is also problematic in India.63 Some automakers also note that frequently changinggovernment policies have a negative impact on their investment decisions.64
8-1
CHAPTER 8Case Study 2: Pharmaceutical FDI in India
This case study traces the impact of India’s changing patent laws on FDI in thepharmaceutical sector. India’s patent laws have evolved from a model protective ofpharmaceutical patents during the colonial period (1856–1947), to a legal regime intendedto foster the establishment and growth of a domestic industry by excluding pharmaceuticalsfrom patent protection (1972–2005), and finally to the present law (2005), whichreestablishes patent protection for pharmaceutical products to comply with the requirementsof the international intellectual property system.
The evolution of the patent law appears to have had a substantial impact on domestic andforeign pharmaceutical investment. Foreign firms dominated the market during the colonialperiod. When there was no pharmaceutical product patent protection in India, domestic firmsflourished by reverse engineering patented products to make generic pharmaceuticals, andthe market share of multinational pharmaceutical firms declined. While it is still too earlyto definitively identify the impact of the 2005 change to the patent law, it appears to bemotivating increased foreign investment in India’s pharmaceutical sector. In anticipation ofthe new law, pharmaceutical FDI increased sharply in 2004, declined in 2005 and thenrebounded in 2006. The decline in 2005 may be attributable to substantial uncertainty as tohow India will implement and interpret its new patent law.
Over the last five years (2002-06), FDI and strategic alliances between foreign and domesticfirms in the areas of clinical trials, data management services, new drug discovery, and themanufacturing of pharmaceuticals and ingredients all have been on the increase. Thevaluable intellectual property connected to these activities is protected through operationalsecurity procedures, contractual protections and due diligence to ensure trustworthy partners.Multinational firms conduct R&D and manufacturing in India because of cost savings, theskilled labor force and the country’s disease profile, among other reasons. These firms have,however, waited to see how the patent law will be interpreted and enforced before expandingtheir product patenting and commercialization activities in India.
India is charting a new intellectual property path, attempting to foster access to medicine andthe growth of the domestic pharmaceutical industry while also phasing in compliance withthe requirements of the international intellectual property system. The ultimate impact ofIndia’s calibrated approach on the quantity and quality of FDI in the pharmaceutical sectorremains to be seen.
The Evolution of India's Patent Laws
The Patent Laws Under British Rule (1856-1947)
India enacted its first patent law in 1856 while the country was under British rule, a periodthat lasted until India's independence in 1947. While the patent laws were amendedthroughout the colonial period, they consistently provided for the patenting ofpharmaceutical products. Most patents granted during this period went to foreigners. At the
1 Mueller, “The Tiger Awakens,” 16–20. 2 Ibid., 22–25. 3 India Patents Act, 1970, § 83. 4 Chaudhuri, The WTO and India's Pharmaceuticals Industry, 37–38. 5 TRIPS Article 65.4. 6 TRIPS, Arts. 70.8(a) and 70.9. 7 WTO, “India—Patent Protection for Pharmaceutical and Agricultural Chemical Products.”
8-2
time of independence, India’s pharmaceutical sector was dominated by multinationalcompanies with only limited participation by domestic firms.1
The Post-Independence Patent Laws (1947-1995)
With independence in 1947, the Indian Government began preparing a new patent law, witha goal of fostering the development of an indigenous pharmaceutical industry. In 1972, afterrepeated expert reports and deliberations in Parliament, the India Patents Act of 1970 cameinto force.2
The 1970 Act imposed substantial limits on patent rights; these limits were intended toencourage indigenous inventions and secure their production in India on a commercial scale.3First, and most importantly, pharmaceutical products could not be patented. Second, firmswere permitted to patent only a single process for making a pharmaceutical; a firm could notblock competitors by patenting all possible processes for making a particular drug. Third,the term for pharmaceutical process patents shortened to 5 years from the grant of the patentor 7 years from application filing, whichever was less, compared to 14 years fromapplication filing for all other inventions. And fourth, the Act imposed very broad“compulsory licensing” provisions for pharmaceutical manufacturing process patents.Within 3 years of the grant, the patents were deemed “licenses of right,” meaning thatanyone could use the process if they paid a royalty.4 In sum, pharmaceutical products hadno protection, and pharmaceutical processes were protected only for 3 years if a royalty waspaid and for 5 years if no royalty was paid.
The Post-TRIPS Patent Laws (1995-Present)
In January of 1995, India became a founding member of the World Trade Organization(WTO) and agreed to the requirements of TRIPS, the WTO intellectual property agreementBecause India was a developing country that did not provide for pharmaceutical productpatenting when TRIPS came into force, it obtained a 10 year transition period, until January2005, to put in place pharmaceutical patent protections.5 During this transition period, Indiawas required to provide a means for applications to be filed and assigned a filing date, a“mailbox” facility. TRIPS also required that “exclusive marketing rights”—the sole right tosell the invention for a specified time—be provided for certain mailbox applications filedduring the transition period.6 India complied with these requirements through the Patents Actof 1999, after a WTO complaint was filed and resolved against India.7
In 2002, India amended its patent law to provide the TRIPS-mandated 20 year patent termfor all inventions, to be applied to pharmaceutical patents at the conclusion of the transitionperiod. The amendments also include new compulsory license provisions. These provisionspermit a compulsory license application 3 years after a patent is granted if the “reasonablerequirements of the public” regarding the invention have not been satisfied, the invention isnot available at a reasonably affordable price, or the invention is not being “worked” or
8 India Patents Act, § 84 (2005). Domestic “working” requirements are controversial; the United Stateschallenged at the WTO such a requirement in Brazil’s patent law, however, the dispute was terminated basedon Brazil’s agreement to provide advance notice where it intended to issue a compulsory license based on thefact that the patent needed to be domestically worked. USTR, “Brazil.” 9 India Patents Act, §§ 92, 92A (2005). 10 Mueller, “The Tiger Awakens,” 107–09. 11 U.S. India Business Council, Recommendations of the Breakout Session on Biotechnology/LifeSciences/Medical Devices Breakout Session, “Issues Raised by Indian Industry” and Indian industry official,interview by Commission staff, March 28, 2007. 12 DiMasi, Hansen, and Grabowski, “The Price of Innovation: New Estimates of Drug DevelopmentCosts,” 151. 13 See generally, Thomas, Proprietary Rights in Pharmaceutical Innovation, CRS-17–19.
8-3
produced in India.8 The law also provides for immediate compulsory licensing in cases ofa governmental notification of a public health crisis or public non-commercial use, or wherethe product will be exported to countries with insufficient manufacturing capacity to addresspublic health problems.9 The compulsory license provisions of India’s law are, by far, thebroadest of all the world’s patent systems.10 As such, they raise substantial concerns amongmultinational pharmaceutical companies; to date, however, no compulsory licenses havebeen sought or issued under the new law.
The critical step in India’s implementation of its TRIPS commitments came in January 2005with the end of the transition period and the required amendment of its law to provide patentprotection for pharmaceutical products. According to Indian industry representatives, Indianow is taking a “calibrated approach” to intellectual property protection that seeks to takeinto account concerns for public health and access to medicine as well as the interests of thedomestic industry.11 Notwithstanding this focus on domestic issues, India now has in placean IP regime that addresses the requirements of the international IP system.
Ongoing Patent Law Controversies
Despite the substantial patent law changes since India’s entry into the WTO, there are stillgaps and provisions that raise objections from multinational pharmaceutical companies. Firstand foremost, multinationals seek a law to protect the clinical trial and other data used toobtain marketing approval of pharmaceuticals that utilize new chemical entities. Clinical trialdata is extremely expensive to amass. The fully capitalized cost to develop a new drug hasbeen estimated at an average of $847 million, with a substantial portion of these costsattributable to the conduct of clinical trials.12 Conducting clinical trials in India cansignificantly reduce these costs.
TRIPS requires the protection of such data against “unfair commercial use.” However,because TRIPS does not define the critical terms included in this requirement, theobligation’s precise nature arguably is unclear. The United States, the European Union, andmany multinational pharmaceutical firms interpret TRIPS Article 39.3 to require “dataexclusivity,” meaning that data submitted to a marketing authority cannot be used by anothercompany or person for a particular period (ranging from 5 years in the United States to upto 10 years in European Union countries). Others assert that developing countries canflexibly interpret TRIPS to protect test data only against misappropriation or othercircumstances in which it is unfairly obtained.13 Data protection measures have been underconsideration in India for years, with no resolution to date.
14 PhRMA, PhRMA, Special 301 Submission: India, 71–72. 15 KPMG International, The Indian Pharmaceutical Industry: Collaboration for Growth, 18. 16 India Patents Act, § 3(d). 17 Mueller, “The Tiger Awakens,” 72. 18 In other countries, this type of evaluation of medical data is typically done by health care regulatory andreimbursement officials, not by patent examiners. 19 The Group has requested the opportunity to review and resubmit an amended report. Nair, “India:Mashelkar Committee Withdraws Its Report.”
8-4
Moreover, a substantial backlog of unexamined patents, a lack of patent examinerexperience, lengthy pre-grant opposition proceedings, and limited resources raise the concernthat the patent law changes have not yet yielded meaningful patent protection.14 Under thesecircumstances, the need for data protection—to provide certainty that there will be somereturn on the investment necessary to support new drug discoveries—may be consideredparticularly acute. According to Pfizer India, the lack of data protection is part of the reasonthat “people are talking about India but investing in China.”15
Another controversial aspect of India’s Patent Act is the exclusion from patentability forderivatives of known substances, unless it can be shown that they are significantly moreefficacious than the original substance.16 This exclusion was meant to preclude“evergreening”—the practice of extending the terms of patents through related patents onmodified forms of the same drug, new drug delivery systems or new uses.17 The types ofefficacy data needed to show that a derivative is patentable, the ability of patent examinersto evaluate medical efficacy data, and the standards governing the patent examiner’s dataevaluation are all unclear.18 The Government of India charged a Technical Expert Groupwith determining whether this exclusion from patentability was TRIPS compatible. TheExpert Group issued its opinion in December 2006, concluding that it was not, but they laterwithdrew the report due to “technical inaccuracies.”19 The multinational pharmaceutical firmNovartis is in the midst of a high profile challenge to the provision’s legality (box 8-1).
20 The Business World (India), “We Are Not Doing This Out of Spite.” 21 Shared Expertise Forums, “Survey: Pharmaceutical Companies Cautious of Investments in EmergingChina and India Markets.”
8-5
The perceived inadequacies in India’s patent law described above, as well as the Novartisexperience, appear to have impacted multinational pharmaceutical companies’ evaluationof the investment environment in India. Novartis has stated in the press that it constructedits new research institute in Singapore rather than India because of its concerns about patentprotection. Also, Novartis announced the creation of a Shanghai research institute becauseof its perception that, unlike India, China has a system in place to improve intellectualproperty protection. Moreover, Novartis has asserted that because of intellectual propertyinsecurity, its R&D collaborations in India are limited to supportive work rather than thedevelopment of new medicines.20 More generally, according to a survey conducted by Ernst& Young and the Economist, more than 62 percent of multinational pharmaceuticalcompanies surveyed in India consider threats to intellectual property a business risk, and 63percent believe that their companies risked losing intellectual property rights when tryingto integrate with local suppliers and third party service providers.21 The final chapter on theactual level of patent protection that India will accord pharmaceuticals has not yet beenwritten.
Box 8-1 The Novartis Challenge to India’s Patent Law
Novartis is challenging in the Indian courts the refusal of the patent office to grant a patent for its cancerdrug, Glivec. The patent office found that Glivec was not patentable under Section 3(d) of the Patents Act,which requires that a new form of a known compound demonstrate improved efficacy, and also found thatthe drug did not satisfy the requirements for novelty and an inventive step. The Novartis case challengesthe constitutional validity of the patent law and its TRIPS compatability. The dispute is pending in theMadras High Court which, in April of 2007, referred part of the case to a newly constituted IntellectualProperty Appellate Board.
Novartis asserts that this is not a case of “evergreening.” Although Glivec is patented around the world, thepre-2005 bar on product patents precluded Novartis from obtaining a patent in India. Novartis further allegesthat it has demonstrated that the new version of the drug is more effective than a previous version, contraryto the findings of the patent office. NGOs and health advocates object to the Novartis challenge on thegrounds that it undermines access to medicines and India’s ability to place limits on the patenting ofessential drugs.
Ironically, although Section 3(d) was intended to limit “evergreening” by multinational companies, it alsolimits the ability of domestic firms to obtain patents for incremental innovations. Domestic firms are in theearly stages of investing the large amounts of money and scientific expertise necessary to discover newdrugs. For example, the Indian firm Ranbaxy has reported that its patent applications in 2004 focusedprimarily on process discoveries for generics. In 2007, its patent filings focused on new drug deliverysystems and other incremental innovations. Ranbaxy anticipates it will not be in a position to seek patentsfor new drug discoveries until 2012.
By limiting the availability of patents in cases of incremental innovation, Section 3(d) may have the oppositeeffect of that India intended. It may concentrate valuable pharmaceutical product patents in the hands ofmultinational companies because they have access to the resources and expertise needed for the mostcomplex and costly inventions, at the expense of domestic firms undertaking incremental innovations.
Sources: Novartis, “Questions and Answers”; and Technical Expert Group on Patent Law Issues, “Reportof the Technical Expert Group on Patent Law Issues.”
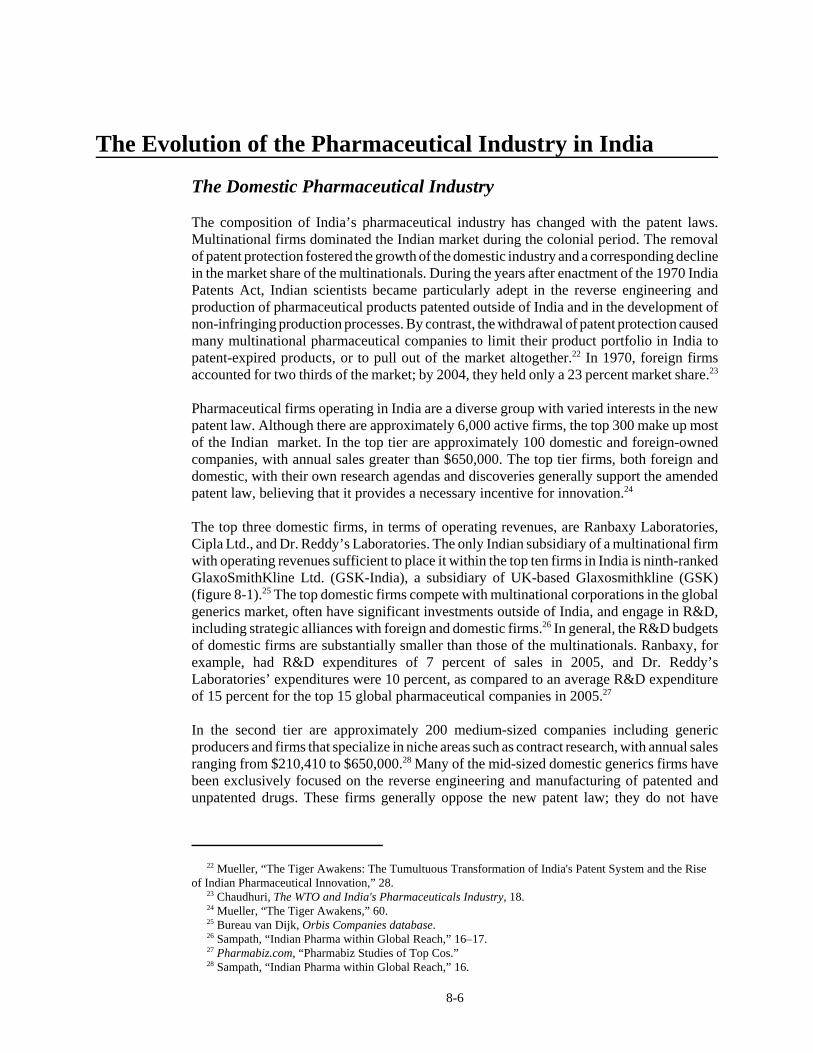
22 Mueller, “The Tiger Awakens: The Tumultuous Transformation of India's Patent System and the Riseof Indian Pharmaceutical Innovation,” 28. 23 Chaudhuri, The WTO and India's Pharmaceuticals Industry, 18. 24 Mueller, “The Tiger Awakens,” 60. 25 Bureau van Dijk, Orbis Companies database. 26 Sampath, “Indian Pharma within Global Reach,” 16–17. 27 Pharmabiz.com, “Pharmabiz Studies of Top Cos.” 28 Sampath, “Indian Pharma within Global Reach,” 16.
8-6
The Evolution of the Pharmaceutical Industry in India
The Domestic Pharmaceutical Industry
The composition of India’s pharmaceutical industry has changed with the patent laws.Multinational firms dominated the Indian market during the colonial period. The removalof patent protection fostered the growth of the domestic industry and a corresponding declinein the market share of the multinationals. During the years after enactment of the 1970 IndiaPatents Act, Indian scientists became particularly adept in the reverse engineering andproduction of pharmaceutical products patented outside of India and in the development ofnon-infringing production processes. By contrast, the withdrawal of patent protection causedmany multinational pharmaceutical companies to limit their product portfolio in India topatent-expired products, or to pull out of the market altogether.22 In 1970, foreign firmsaccounted for two thirds of the market; by 2004, they held only a 23 percent market share.23
Pharmaceutical firms operating in India are a diverse group with varied interests in the newpatent law. Although there are approximately 6,000 active firms, the top 300 make up mostof the Indian market. In the top tier are approximately 100 domestic and foreign-ownedcompanies, with annual sales greater than $650,000. The top tier firms, both foreign anddomestic, with their own research agendas and discoveries generally support the amendedpatent law, believing that it provides a necessary incentive for innovation.24
The top three domestic firms, in terms of operating revenues, are Ranbaxy Laboratories,Cipla Ltd., and Dr. Reddy’s Laboratories. The only Indian subsidiary of a multinational firmwith operating revenues sufficient to place it within the top ten firms in India is ninth-rankedGlaxoSmithKline Ltd. (GSK-India), a subsidiary of UK-based Glaxosmithkline (GSK)(figure 8-1).25 The top domestic firms compete with multinational corporations in the globalgenerics market, often have significant investments outside of India, and engage in R&D,including strategic alliances with foreign and domestic firms.26 In general, the R&D budgetsof domestic firms are substantially smaller than those of the multinationals. Ranbaxy, forexample, had R&D expenditures of 7 percent of sales in 2005, and Dr. Reddy’sLaboratories’ expenditures were 10 percent, as compared to an average R&D expenditureof 15 percent for the top 15 global pharmaceutical companies in 2005.27
In the second tier are approximately 200 medium-sized companies including genericproducers and firms that specialize in niche areas such as contract research, with annual salesranging from $210,410 to $650,000.28 Many of the mid-sized domestic generics firms havebeen exclusively focused on the reverse engineering and manufacturing of patented andunpatented drugs. These firms generally oppose the new patent law; they do not have
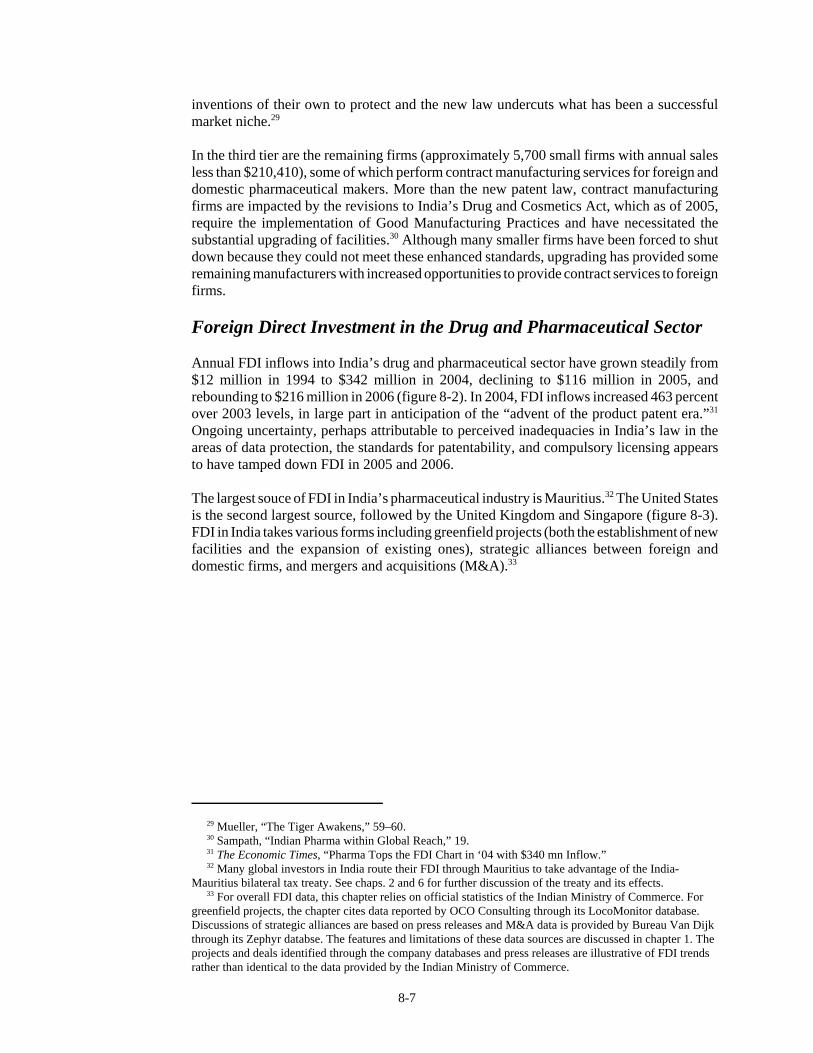
29 Mueller, “The Tiger Awakens,” 59–60. 30 Sampath, “Indian Pharma within Global Reach,” 19. 31 The Economic Times, “Pharma Tops the FDI Chart in ‘04 with $340 mn Inflow.” 32 Many global investors in India route their FDI through Mauritius to take advantage of the India-Mauritius bilateral tax treaty. See chaps. 2 and 6 for further discussion of the treaty and its effects. 33 For overall FDI data, this chapter relies on official statistics of the Indian Ministry of Commerce. Forgreenfield projects, the chapter cites data reported by OCO Consulting through its LocoMonitor database.Discussions of strategic alliances are based on press releases and M&A data is provided by Bureau Van Dijkthrough its Zephyr databse. The features and limitations of these data sources are discussed in chapter 1. Theprojects and deals identified through the company databases and press releases are illustrative of FDI trendsrather than identical to the data provided by the Indian Ministry of Commerce.
8-7
inventions of their own to protect and the new law undercuts what has been a successfulmarket niche.29
In the third tier are the remaining firms (approximately 5,700 small firms with annual salesless than $210,410), some of which perform contract manufacturing services for foreign anddomestic pharmaceutical makers. More than the new patent law, contract manufacturingfirms are impacted by the revisions to India’s Drug and Cosmetics Act, which as of 2005,require the implementation of Good Manufacturing Practices and have necessitated thesubstantial upgrading of facilities.30 Although many smaller firms have been forced to shutdown because they could not meet these enhanced standards, upgrading has provided someremaining manufacturers with increased opportunities to provide contract services to foreignfirms.
Foreign Direct Investment in the Drug and Pharmaceutical Sector
Annual FDI inflows into India’s drug and pharmaceutical sector have grown steadily from$12 million in 1994 to $342 million in 2004, declining to $116 million in 2005, andrebounding to $216 million in 2006 (figure 8-2). In 2004, FDI inflows increased 463 percentover 2003 levels, in large part in anticipation of the “advent of the product patent era.”31
Ongoing uncertainty, perhaps attributable to perceived inadequacies in India’s law in theareas of data protection, the standards for patentability, and compulsory licensing appearsto have tamped down FDI in 2005 and 2006.
The largest souce of FDI in India’s pharmaceutical industry is Mauritius.32 The United Statesis the second largest source, followed by the United Kingdom and Singapore (figure 8-3).FDI in India takes various forms including greenfield projects (both the establishment of newfacilities and the expansion of existing ones), strategic alliances between foreign anddomestic firms, and mergers and acquisitions (M&A).33
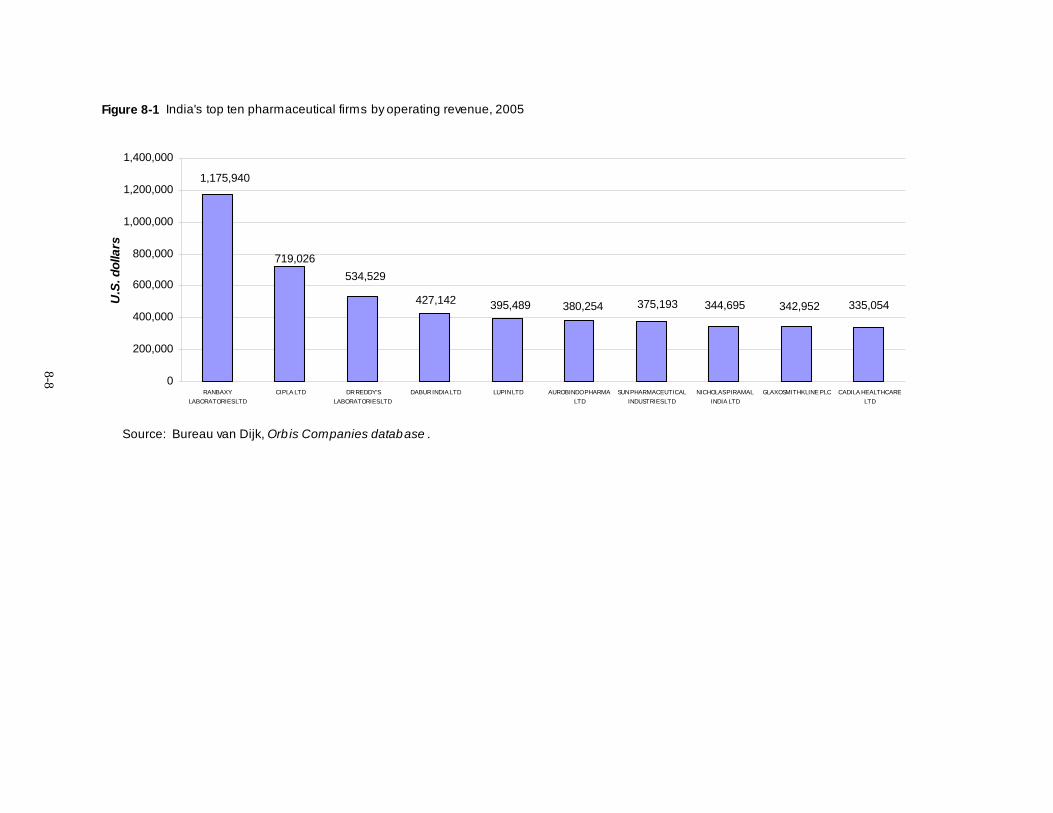
8-8
Figure 8-1 India's top ten pharmaceutical firms by operating revenue, 2005
719,026
1,175,940
534,529
427,142 395,489 380,254 375,193 344,695 342,952 335,054
0
200,000
400,000
600,000
800,000
1,000,000
1,200,000
1,400,000
RANBAXYLABORATORIES LTD
CIPLA LTD DR REDDY'SLABORATORIES LTD
DABUR INDIA LTD LUPIN LTD AUROBINDO PHARMALTD
SUN PHARMACEUTICALINDUSTRIES LTD
NICHOLAS PIRAMALINDIA LTD
GLAXOSMITHKLINE PLC CADILA HEALTHCARELTD
U.S
. dol
lars
Source: Bureau van Dijk, Orbis Companies database .
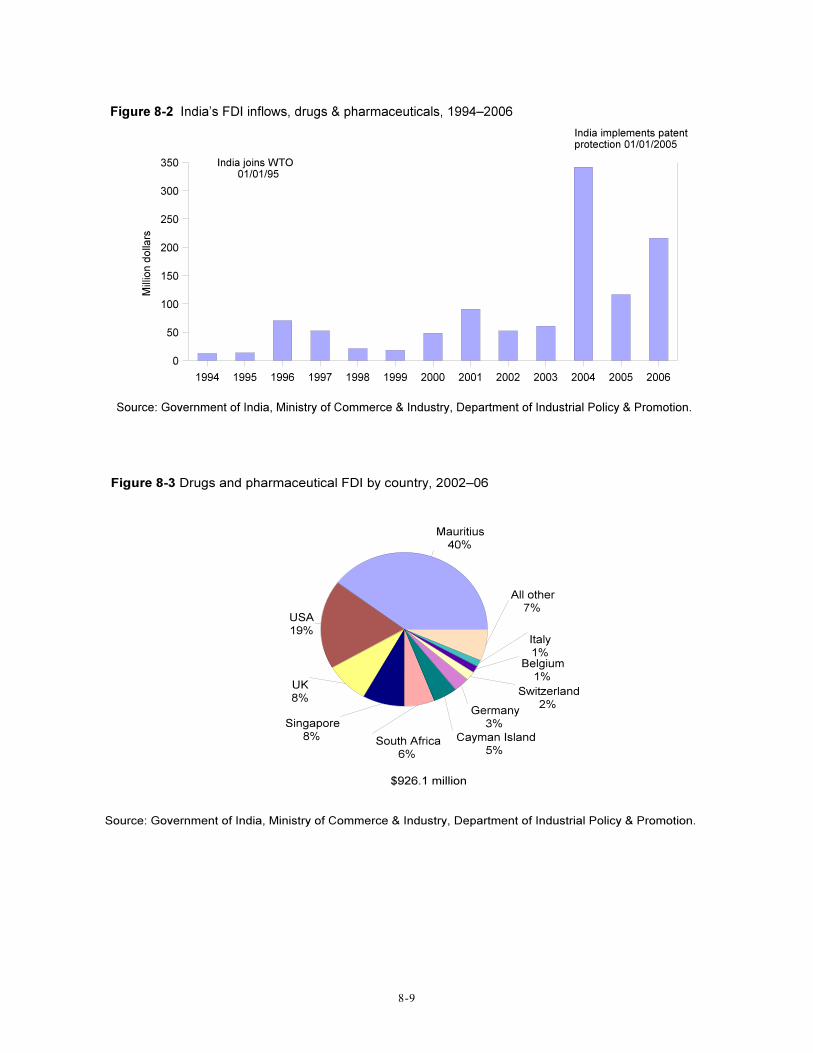
8-9
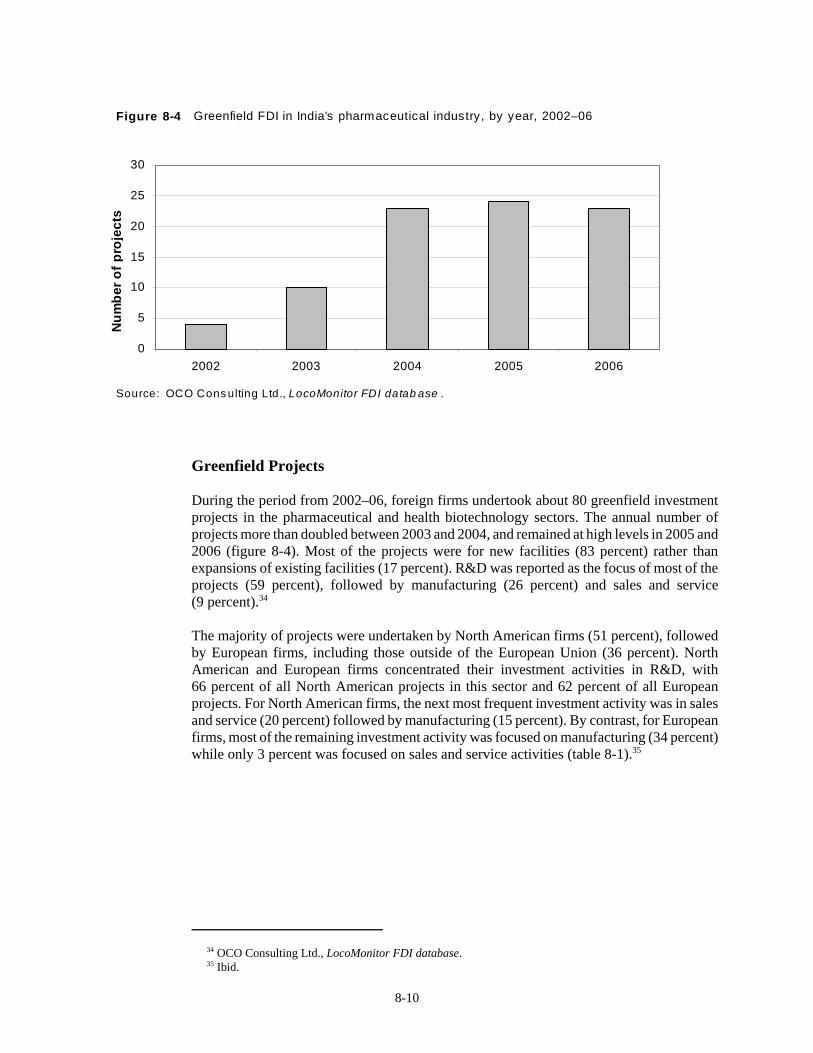
34 OCO Consulting Ltd., LocoMonitor FDI database. 35 Ibid.
8-10
Greenfield Projects
During the period from 2002–06, foreign firms undertook about 80 greenfield investmentprojects in the pharmaceutical and health biotechnology sectors. The annual number ofprojects more than doubled between 2003 and 2004, and remained at high levels in 2005 and2006 (figure 8-4). Most of the projects were for new facilities (83 percent) rather thanexpansions of existing facilities (17 percent). R&D was reported as the focus of most of theprojects (59 percent), followed by manufacturing (26 percent) and sales and service(9 percent).34
The majority of projects were undertaken by North American firms (51 percent), followedby European firms, including those outside of the European Union (36 percent). NorthAmerican and European firms concentrated their investment activities in R&D, with66 percent of all North American projects in this sector and 62 percent of all Europeanprojects. For North American firms, the next most frequent investment activity was in salesand service (20 percent) followed by manufacturing (15 percent). By contrast, for Europeanfirms, most of the remaining investment activity was focused on manufacturing (34 percent)while only 3 percent was focused on sales and service activities (table 8-1).35
0
5
10
15
20
25
30
2002 2003 2004 2005 2006
Num
ber o
f pro
ject
sFigure 8-4 Greenfield FDI in India's pharmaceutical industry, by year, 2002–06
Source: OCO Cons ulting Ltd., LocoMonitor FDI datab ase .
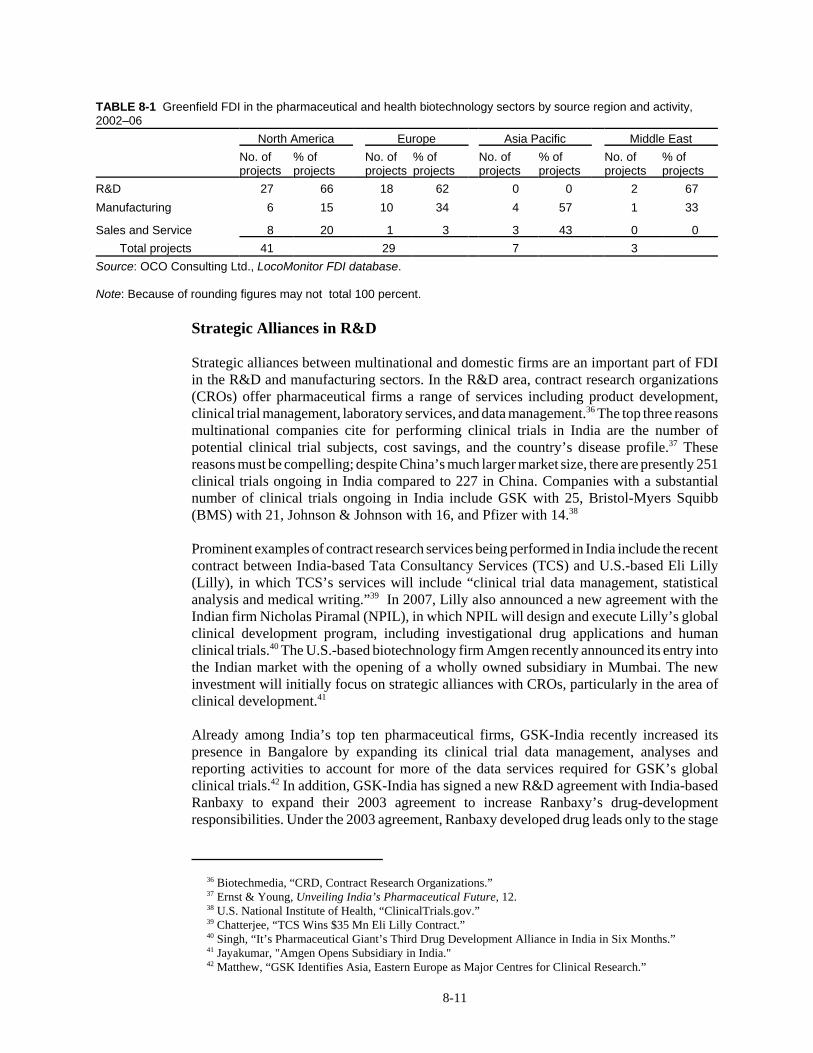
36 Biotechmedia, “CRD, Contract Research Organizations.” 37 Ernst & Young, Unveiling India’s Pharmaceutical Future, 12. 38 U.S. National Institute of Health, “ClinicalTrials.gov.” 39 Chatterjee, “TCS Wins $35 Mn Eli Lilly Contract.” 40 Singh, “It’s Pharmaceutical Giant’s Third Drug Development Alliance in India in Six Months.” 41 Jayakumar, "Amgen Opens Subsidiary in India." 42 Matthew, “GSK Identifies Asia, Eastern Europe as Major Centres for Clinical Research.”
8-11
TABLE 8-1 Greenfield FDI in the pharmaceutical and health biotechnology sectors by source region and activity,2002–06
North America Europe Asia Pacific Middle EastNo. ofprojects
% ofprojects
No. ofprojects
% ofprojects
No. ofprojects
% ofprojects
No. ofprojects
% ofprojects
R&D 27 66 18 62 0 0 2 67Manufacturing 6 15 10 34 4 57 1 33
Sales and Service 8 20 1 3 3 43 0 0Total projects 41 29 7 3
Source: OCO Consulting Ltd., LocoMonitor FDI database.
Note: Because of rounding figures may not total 100 percent.
Strategic Alliances in R&D
Strategic alliances between multinational and domestic firms are an important part of FDIin the R&D and manufacturing sectors. In the R&D area, contract research organizations(CROs) offer pharmaceutical firms a range of services including product development,clinical trial management, laboratory services, and data management.36 The top three reasonsmultinational companies cite for performing clinical trials in India are the number ofpotential clinical trial subjects, cost savings, and the country’s disease profile.37 Thesereasons must be compelling; despite China’s much larger market size, there are presently 251clinical trials ongoing in India compared to 227 in China. Companies with a substantialnumber of clinical trials ongoing in India include GSK with 25, Bristol-Myers Squibb(BMS) with 21, Johnson & Johnson with 16, and Pfizer with 14.38
Prominent examples of contract research services being performed in India include the recentcontract between India-based Tata Consultancy Services (TCS) and U.S.-based Eli Lilly(Lilly), in which TCS’s services will include “clinical trial data management, statisticalanalysis and medical writing.”39 In 2007, Lilly also announced a new agreement with theIndian firm Nicholas Piramal (NPIL), in which NPIL will design and execute Lilly’s globalclinical development program, including investigational drug applications and humanclinical trials.40 The U.S.-based biotechnology firm Amgen recently announced its entry intothe Indian market with the opening of a wholly owned subsidiary in Mumbai. The newinvestment will initially focus on strategic alliances with CROs, particularly in the area ofclinical development.41
Already among India’s top ten pharmaceutical firms, GSK-India recently increased itspresence in Bangalore by expanding its clinical trial data management, analyses andreporting activities to account for more of the data services required for GSK’s globalclinical trials.42 In addition, GSK-India has signed a new R&D agreement with India-basedRanbaxy to expand their 2003 agreement to increase Ranbaxy’s drug-developmentresponsibilities. Under the 2003 agreement, Ranbaxy developed drug leads only to the stage

43 Ranbaxy Laboratories Ltd., “Ranbaxy Signs New R&D Agreement with GSK.” 44 The Hindu Business Line, “GVK Biosciences to Provide Research Services for Wyeth Pharma.” 45 Biocon, “Biocon Conducts Ground Breaking Ceremony.” 46 Boston Consulting Group, Harnessing the Power of India, 5; and Kumar, “How to Protect Data inOutsourcing Deals.” 47 Industry official, interview by Commission staff, Washington, DC, April 24, 2007.
8-12
of candidate selection. Under the expanded agreement, Ranbaxy will “advance the leadsbeyond candidate selection to completion of clinical proof of concept.”43
Similarly, Wyeth USA and India-based GVK Biosciences entered into a five year agreementunder which GVK will set up an R&D center in Hyderabad and hire 150 scientists in 2007to work on Wyeth’s drug discovery projects. According to Wyeth, the driving factors behindits decision to partner for contract research services were the growing skill base in Asia,India's 2005 revision of its patent laws, and the high quality of science at GVK.44 Mostrecently, in March 2007, U.S.-based BMS and Indian biotechnology firm Biocon brokeground on a new research facility planned to house 400 scientists working on early drugdevelopment for BMS in India.45
These new and increasingly sophisticated R&D projects may be surprising given the reportedinadequacies in India’s patent law described above, and the fact that India does not have adata protection law. However, different IP protection mechanisms are relevant to the R&Dprojects described here than to projects which involve product patenting andcommercialization. R&D projects depend on the relationship between the parties, pre-contract due diligence, strong contractual protections, operational security practices, anddocumented compliance with international standards such as ISO 27001, which addressesinformation security management systems, to ensure the confidentiality of proprietary data.India’s Contract Act and Information Technology Act may also provide statutory bases forthe protection of sensitive R&D data and proprietary information; to date, these statutes havebeen used to protect sensitive information shared in the course of BPO projects.46
By contrast, the data protection law sought by multinational firms would govern thecommercialization of a product and the submission of clinical trial data to drug regulatoryauthorities in India. Clinical trial data developed in R&D projects may or may not besubmitted to Indian regulatory authorities. If the data supports global trials, it likely will besubmitted in regulated markets, such as those of the United States and the European Union,where there are data protection laws. Thus, the lack of a data protection law in India may notbe of critical importance to a company’s decision to conduct preliminary R&D there.
This said, this case study reports numerous instances in which multinational pharmaceuticalfirms have stressed the importance of a strong IP protection environment to their investmentdecisions. Multinational firms remain wary of investing in countries where the fruits of theirinvestment will be used to foster low cost competitors.47 The IP landscape in India prior to2005 gave rise to substantial uncertainty about whether Indian courts would protect sensitiveinformation developed in pharmaceutical R&D projects. Under the 1970 Patents Actpharmaceutical products were not entitled to patent protection, thus there would be littlemotivation for a court to protect the R& D used to develop these products under existingcontract laws—one could even envision a public policy-based challenge to a contract thatattempted to do so. Now that the law does provide patent protection for pharmaceuticalproducts, contract law protections for pharmaceutical R&D also may be more available.
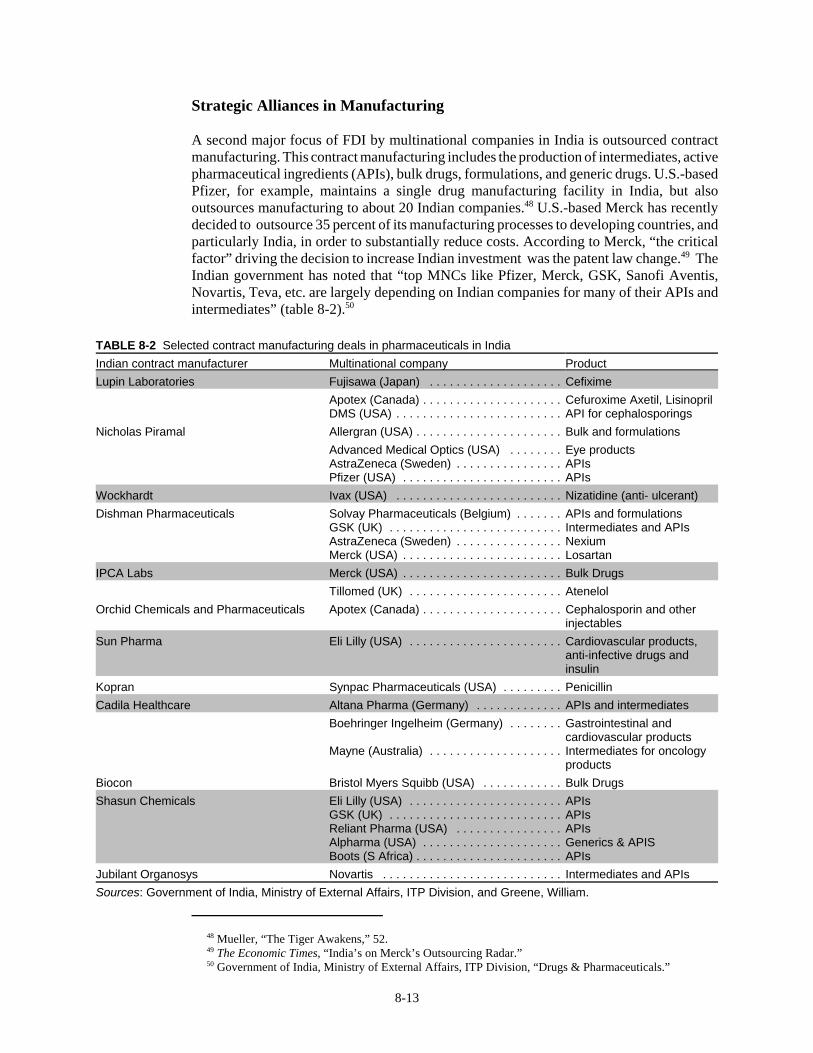
48 Mueller, “The Tiger Awakens,” 52. 49 The Economic Times, “India’s on Merck’s Outsourcing Radar.” 50 Government of India, Ministry of External Affairs, ITP Division, “Drugs & Pharmaceuticals.”
8-13
Strategic Alliances in Manufacturing
A second major focus of FDI by multinational companies in India is outsourced contractmanufacturing. This contract manufacturing includes the production of intermediates, activepharmaceutical ingredients (APIs), bulk drugs, formulations, and generic drugs. U.S.-basedPfizer, for example, maintains a single drug manufacturing facility in India, but alsooutsources manufacturing to about 20 Indian companies.48 U.S.-based Merck has recentlydecided to outsource 35 percent of its manufacturing processes to developing countries, andparticularly India, in order to substantially reduce costs. According to Merck, “the criticalfactor” driving the decision to increase Indian investment was the patent law change.49 TheIndian government has noted that “top MNCs like Pfizer, Merck, GSK, Sanofi Aventis,Novartis, Teva, etc. are largely depending on Indian companies for many of their APIs andintermediates” (table 8-2).50
TABLE 8-2 Selected contract manufacturing deals in pharmaceuticals in IndiaIndian contract manufacturer Multinational company ProductLupin Laboratories Fujisawa (Japan) . . . . . . . . . . . . . . . . . . . . Cefixime
Apotex (Canada) . . . . . . . . . . . . . . . . . . . . .DMS (USA) . . . . . . . . . . . . . . . . . . . . . . . . .
Cefuroxime Axetil, Lisinopril API for cephalosporings
Nicholas Piramal Allergran (USA) . . . . . . . . . . . . . . . . . . . . . . Bulk and formulationsAdvanced Medical Optics (USA) . . . . . . . .AstraZeneca (Sweden) . . . . . . . . . . . . . . . .Pfizer (USA) . . . . . . . . . . . . . . . . . . . . . . . .
Eye productsAPIsAPIs
Wockhardt Ivax (USA) . . . . . . . . . . . . . . . . . . . . . . . . . Nizatidine (anti- ulcerant) Dishman Pharmaceuticals Solvay Pharmaceuticals (Belgium) . . . . . . .
GSK (UK) . . . . . . . . . . . . . . . . . . . . . . . . . .AstraZeneca (Sweden) . . . . . . . . . . . . . . . .Merck (USA) . . . . . . . . . . . . . . . . . . . . . . . .
APIs and formulations Intermediates and APIsNexiumLosartan
IPCA Labs Merck (USA) . . . . . . . . . . . . . . . . . . . . . . . . Bulk DrugsTillomed (UK) . . . . . . . . . . . . . . . . . . . . . . . Atenelol
Orchid Chemicals and Pharmaceuticals Apotex (Canada) . . . . . . . . . . . . . . . . . . . . . Cephalosporin and otherinjectables
Sun Pharma Eli Lilly (USA) . . . . . . . . . . . . . . . . . . . . . . . Cardiovascular products,anti-infective drugs andinsulin
Kopran Synpac Pharmaceuticals (USA) . . . . . . . . . PenicillinCadila Healthcare Altana Pharma (Germany) . . . . . . . . . . . . . APIs and intermediates
Boehringer Ingelheim (Germany) . . . . . . . .
Mayne (Australia) . . . . . . . . . . . . . . . . . . . .
Gastrointestinal andcardiovascular productsIntermediates for oncologyproducts
Biocon Bristol Myers Squibb (USA) . . . . . . . . . . . . Bulk DrugsShasun Chemicals Eli Lilly (USA) . . . . . . . . . . . . . . . . . . . . . . .
GSK (UK) . . . . . . . . . . . . . . . . . . . . . . . . . .Reliant Pharma (USA) . . . . . . . . . . . . . . . .Alpharma (USA) . . . . . . . . . . . . . . . . . . . . .Boots (S Africa) . . . . . . . . . . . . . . . . . . . . . .
APIsAPIsAPIsGenerics & APISAPIs
Jubilant Organosys Novartis . . . . . . . . . . . . . . . . . . . . . . . . . . . Intermediates and APIsSources: Government of India, Ministry of External Affairs, ITP Division, and Greene, William.
51 Ernst & Young. Unveiling India’s Pharmaceutical Future, 10. 52 IBEF, Pharmaceuticals, 13. 53 Kumar,“ How to Protect Data in Outsourcing Deals.” 54 Although not addressed in this case study, Indian firms have been extremely active in the last severalyears in acquiring companies in Europe and the United States, particularly in the generics sector. See Greene,The Emergence of India’s Pharmaceutical Industry and Implications for the U.S. Generic Drug Market,8–10. 55 Roumeliotis, “Mylan in India’s Biggest Pharmaceutical Takeover.” 56 Bureau van Dijk, Zephyr Mergers and Acquisitions database. 57 Ibid.
8-14
One reason for India’s strength in the area of contract manufacturing compared to otheremerging markets is the large number of manufacturing facilities that the U.S. Food andDrug Administration (FDA) has certified.51 FDA certification allows pharmaceuticalproducts to be imported into the United States. Outside of the United States, India has thelargest number of FDA- approved manufacturing facilities, numbering 75 in 2006.52 Anotherreason for the strength of contract manufacturing is the large number of scientists andengineers with unique skills in the areas of process chemistry and biochemistry.
As with contract R&D, contract manufacturing permits the segmentation and protection ofproduction processes so that valuable intellectual property is not lost. For example, differentvariants of a molecule may be tested in different locations, fire walls may be set up betweenproduction functions, and the contract relationship may begin with commodity styleproduction services and evolve only upon the establishment of trust. Indian expertise in BPOalso has resulted in a demonstrated competence in security practices and contractualprovisions such as non-disclosure agreements, as well as comfort with global standards thatcover security domains.53 The gaps identified by multinationals in India’s IP regime do notappear to substantially affect collaborations in the manufacturing of pharmaceuticals. In fact,the success of manufacturing relationships for the production of pharmaceuticals has beenthe precursor to increasingly complex and sophisticated R&D and manufacturingcollaborations.
Pharmaceutical M&A
Cross-border M&A deals in India’s pharmaceutical sector have been on the upswing since2003 (figure 8-5). European companies have been the most active acquirers with 61 percentof all deals, followed by North American firms with 26 percent.54
The most significant deal in terms of scale and value has been the January 2007 acquisitionby Mylan, one of the largest generic drug providers in the United States, of a majority stakein Indian-based Matrix, the world’s second largest API manufacturer, in a $548 million deal.According to Mylan, the merger was needed to expand its manufacturing platform, obtaina presence in key markets, and tap into local technical expertise in the production of genericbiologics.55 U.S.-based Watson Pharmaceuticals similarly expanded its operations in Indiaby acquiring two Indian companies. In 2005, it acquired a finished dosages manufacturingplant from Dr. Reddy’s. Then, in 2006, it acquired Sekhsaria Chemicals, a company focusedon process R&D and contract manufacturing services. Watson Pharmaceuticals reported thatthe two acquisitions would improve efficiencies and cost management and enhance thecompany’s competitive position.56 In 2003, U.S.-based Healthscribe reported that it wouldbuy out its Indian joint venture partner in a $10.3 million deal. The Indian affiliate wouldcontinue to provide BPO services to the healthcare sector.57
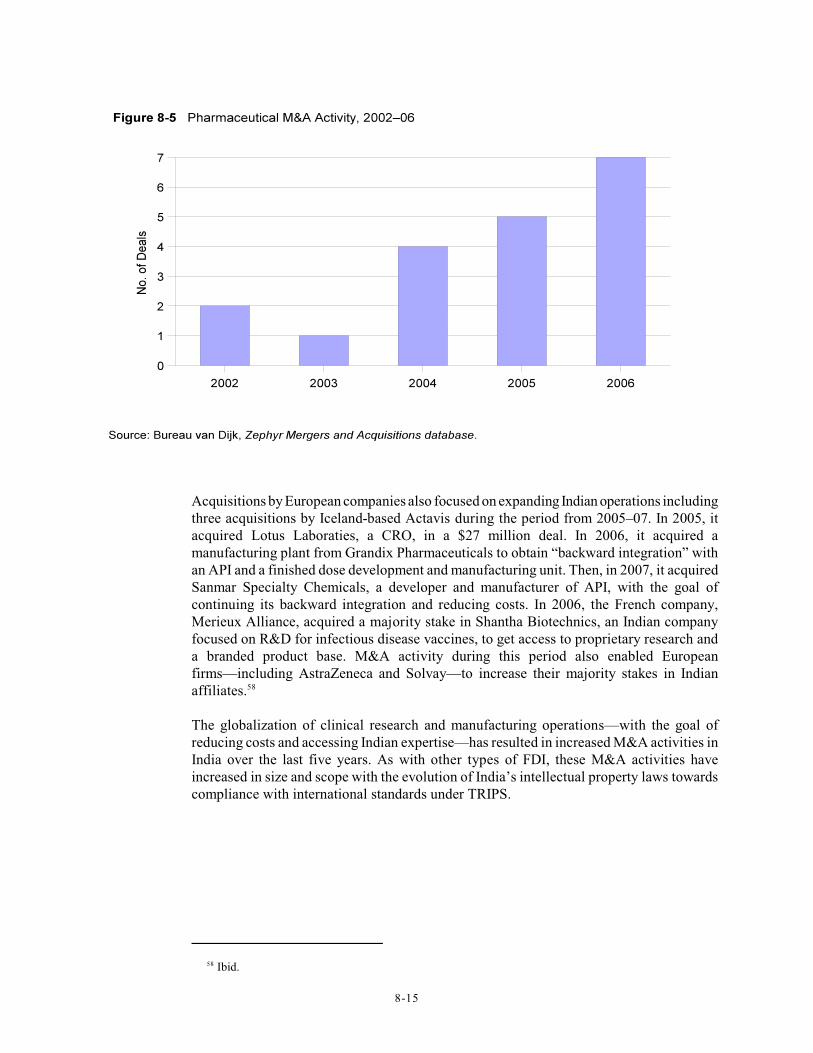
Ibid.58
8-15
Acquisitions by European companies also focused on expanding Indian operations includingthree acquisitions by Iceland-based Actavis during the period from 2005–07. In 2005, itacquired Lotus Laboraties, a CRO, in a $27 million deal. In 2006, it acquired amanufacturing plant from Grandix Pharmaceuticals to obtain “backward integration” withan API and a finished dose development and manufacturing unit. Then, in 2007, it acquiredSanmar Specialty Chemicals, a developer and manufacturer of API, with the goal ofcontinuing its backward integration and reducing costs. In 2006, the French company,Merieux Alliance, acquired a majority stake in Shantha Biotechnics, an Indian companyfocused on R&D for infectious disease vaccines, to get access to proprietary research anda branded product base. M&A activity during this period also enabled Europeanfirms—including AstraZeneca and Solvay—to increase their majority stakes in Indianaffiliates. 58
The globalization of clinical research and manufacturing operations—with the goal ofreducing costs and accessing Indian expertise—has resulted in increased M&A activities inIndia over the last five years. As with other types of FDI, these M&A activities haveincreased in size and scope with the evolution of India’s intellectual property laws towardscompliance with international standards under TRIPS.
8-16
ConclusionIndia has charted its own path over the last 35 years, attempting to foster the growth of adomestic pharmaceutical industry and access to medicine while, more recently, alsoaddressing the requirements of the international intellectual property regime. Multinationalpharmaceutical firms have responded to India’s movement towards TRIPS compliance byincreasing the quantity and quality of FDI in the areas of R&D and manufacturing.Multinational firms have adopted a more cautious attitude toward investment in the patentingand commercialization of pharmaceutical products in India, waiting to see how Indian courtsand patent offices interpret the new laws, and until India enacts data exclusivity legislation.The ultimate success of India’s “calibrated approach” to fostering the domestic industry andaccess to medicine while also addressing international intellectual property requirementsremains to be seen.
Biblio-1
Bibliography3i Web site. http://www.3i.com/portfolio/companies/international-cars-motor.html
(accessed March 30, 2007).
Abdullah, Omer. Inaugural address to the 35th Annual General Meeting of The Indian Council ofArbitration.
Adityapur Industrial Area Development Authority Web site, http://www.aiadaonline.com/facts.php(accessed June 8, 2007).
Altbach, Philip G. “Higher Education in India.” The Hindu, April 12, 2005.
American Arbitration Association. International Centre for Dispute Resolution. “Bechtel EnterprisesInternational (Bermuda) Ltd.; Ben Dabhol Holdings, Ltd.; and Capital India Power Mauritius I,claimants against Overseas Private Investment Corp., Respondent. AAA Case No. 50, T195 0050902,September 3, 2005, http://www.opic.gov/insurance/claims/awards/documents/2294171_1.pdf (accessedJune 8, 2007).
Anderson, W. Geoffrey. “Legal and Practical Protection of U.S. Foreign Investment.” 18 TransnationalLawyer 133 (2004).
Asian Development Bank Web site. http://www.adb.org (accessed January 11, 2007).
_________. “Key Indicators 2005: Labor Markets in Asia: Promoting Full, Productive, andDecent Employment,” 2005.
Asia Pacific Bulletin. “Can India Revitalize its Special Economic Zones to Rival those in China?” Asia Pacific Foundation of Canada, February 1, 2006.http://www.asiapacificbusiness.ca/apbn/pdfs/bulletin244.pdf (accessed June 8, 2007).
AstraZeneca. “AstraZeneca Inaugurates State-of-the-Art Global Process R&D lab in Bangalore(March 21),” 2007.http://www.astrazeneca.com/pressrelease/5315.aspx (accessed April 16, 2007).
A.T. Kearney, Inc. “FDI Confidence Index.” Global Business Policy Council, 2005. Volume 8.
Autocar Professional. “Mega Auto Project Well On Course,” August 15, 2006.http://www.natrip.in/newscontent.aspx?newsid=N:34 (accessed January 19, 2007).
Automotive Component Manufacturers Association of India. “Industry Statistics.”http://www.acmainfo.com.
Barnes, David. Remarks at the 5th Summit of the U.S.-India High Technology Cooperation Group,Washington, DC, February 22, 2007.
Basu, Indrajit. “India, Singapore Ink Pact.” Asia Times Online, July 2, 2005. http://www.atimes.com/(accessed January 12, 2007).
Biblio-2
Basu, Kaushik. “Why India’s Labour Laws Are a Problem.” BBC News, May 18, 2006.http://news.bbc.co.uk/2hi/south_Asia/4984256.stm (accessed December 6, 2006).
Bellman, Eric. “As Economy Grows, India Goes for Designer Goods.” Wall Street Journal Online,March 27, 2007. http://www.wsj.com/ (accessed April 2, 2007).
Bhalla, Nita, and Jonathan Allen. “GM Says to Buy More Auto parts from India.” Reuters India,April 17, 2007. http://in.today.reuters.com (accessed April 18, 2997).
Bhati, Usha. Foreign Direct Investment: Contemporary Issues. New Delhi, India: Deep & DeepPublications, 2006.
Bilaterals.org. “India and Mauritius Close to Economic Treaty,” February 13, 2007.http://www.bilaterals.org (accessed March 16, 2007).
_________. “Saudi, Kuwait want India to give ‘S’pore Treatment’,” August 16, 2005.http://www.bilaterals.org (accessed January 12, 2007).
Bindra, Satinder. “India Battles Infrastructure Woes.” CNN, October 25, 2005. http://edition.cnn.com/2005/WORLD/asiapcf/09/21/india.eye.infrastructure/index.html (accessedJanuary 16, 2007).
Biocon. “Biocon Conducts Ground Breaking Ceremony of New Research Facility at Biocon Park(March 21).” Bangalore, 2007. http://www.biocon.com/biocon_press_releases_details.asp?Fileid=252(accessed May 8, 2007).
Biotechmedia. “CRO, Contract Research Organization.” http://www.biotechmedia.com/definitions-c.html CR), (accessed April 13, 2007).
Bissinger, Maria. Dream Machines: Emerging Markets Beckon the World’s Carmakers. Standard &Poor’s, March 8, 2006.
Bombay Stock Exchange Web site. http://www.bseindia.com (accessed January 30, 2007).
Bonasia, J. “Indian Outsourcers Scramble to Meet Need for More Staff.” Investor’s Business Daily,March 2, 2007. http://www.investors.com/ (accessed March 6, 2007).
Boston Consulting Group. Harnessing the Power of India, May 2006.http://www.bcg.com/publications/files/Rising_to_the_Productivity_Challenge_in_Biopharma_RD_May06.pdf(accessed April 16, 2007).
Bureau van Dijk. Orbis Companies database. https://orbis.dvdep.com/ (accessedvarious dates).
_________. Zephyr Mergers and Acquisitions database. https://zephyr.bvdep.com/ (accessedvarious dates).
Business India Intelligence. “India Automotive: Burning Rubber.” The Economist Intelligence Unit,December 10, 2006.
Biblio-3
_________. “Hotels,” April 17, 2007. http://dialog.newsedge.com (accessed April 23, 2007).
Business Monitor Food & Drink Insight. “Bharti Confirms Wal-Mart Plans,” February 21, 2007.http://dialog.newsedge.com/ (accessed February 21, 2007).
Business World, The (India). “We Are Not Doing This Out of Spite,” February 16, 2007.http://www.drugwonks.com/2007/02/ (accessed March 25, 2007).
BusinessStandard.com. “Industrial Corridor to Get $50 Billion Investment,” April 15, 2007. http://dialog.newsedge.com (accessed April 19, 2007).
_________. “Semiconductor Policy Notified,” March 23, 2007. http://www.business-standard.com/ (accessed March 2, 2007).
Caterpillar Inc. “Caterpillar Completes Purchase of Former Joint Venture Engine Business in India(November 16, 2006).” Mathagondapalli, India, 2006. http://cat.com/cda/components/fullArticleNoNav?ids=387571&languageID=7 (accessed June 4, 2007).
Central Intelligence Agency (CIA). “India.” The World Factbook, 2006.http://www.cia.gov/cia/publications/factbook/geos/in.html (accessed November 22, 2006).
Chakrabarti, Rajesh. The Financial Sector in India Emerging Issues. New Delhi, India: OxfordUniversity Press, 2006.
Chaudhuri, Sudip. The WTO and India's Pharmaceuticals Industry: Patent Protection, TRIPS, andDeveloping Countries. Oxford: Oxford University Press, 2005.
Chatterjee, Moumita. “TCS Wins $35 Mn Eli Lilly Contract.” The Economic Times,November 13, 2006.
Confederation of Indian Industry. Northern Region. “Special Economic Zones—Engines for Growth,” May 2006. http://www.ciionline.org/Northern/regionalfocus/836/images/sez.pdf (accessedNovember 2, 2006).
David, Ruth. “India Sets Semi Subsidy Policy.” Forbes.com, March 22, 2007. http://www.forbes.com/(accessed March 2, 2007).
Data, P.T. Jyothi. “More Global Buys by Pharma Cos Likely.” Hindu Business Line (Internet Edition),July 22, 2005.
Deccan Gold Mines, Ltd. Company press releases http://www.deccangoldmines.com/media33.htm(accessed May 14, 2007).
Deloitte. China and India: The Reality Beyond the Hype. Deloitte, 2006.
Deutsche Bank Web site. http://www.db.com (accessed March 5, 2007).
Biblio-4
Dikshit, Sandeep. “Ban on FDI from Bangladesh May Go.” The Hindu Times, April 4, 2007.http://www.thehindu.com/ (accessed April 12, 2007).
DiMasi J.A., R.W. Hansen, and H.G. Grabowski, “The Price of Innovation: New Estimates of DrugDevelopment Costs.” Journal of Health Economics 2003, 22(2):151–85.
Doi, Ayako. “Suzuki Will Build Suppliers Industrial Park Next Door to its New Indian Swift Plant.” TheJapan Automotive Digest, June 12, 2006.
Economic Times, The. “Hindustan Semiconductor to Chip In $4 B for Indian Fabs,” March 29, 2007. http://economictimes.indiatimes.com/articleshow/1825640.cms (accessed April 4, 2007).
_________. “Pharma Tops the FDI Chart in ‘04 With $340 Mn Inflow,” April 18, 2005. http://ibef.org(accessed March 5, 2007).
_________. “Patent Pat: Pharma MNCs Prefer Tiger to Dragon,” February 13, 2005. http://ibef.org(accessed March 5, 2007).
_________. “India’s on Merck’s Outsourcing Radar,” June 23, 2006.http://economictimes.indiatimes.com/News/CompaniesA-Z/M_Companies_/Merck_Pharma/Indias_on_Mercks_outsourcing_radar/articleshow/1672701.cms (accessed March 20, 2007).
Economist.com. “Indian Retailing: Getting Cheaper and Better,” February 1, 2007.http://www.economist.com/ (accessed February 1, 2007).
Economist Intelligence Unit (EIU). Business India Intelligence, November 8, 2006.
_________. “Country Report India—Main report: December 4, 2006.” http://www.eiu.com/ (accessedvarious dates).
EIU, India: Country Commerce 2006, 22.
Embassy of India. “FDI Policy and Procedure.” http://www.indianembassy.org/newsite//Doing_business_In_India/FDI_Policy_Procedures.asp#6 (accessed
February 13, 2007)
_________. “U.S. Investments in India.”http://www.indianembassy.org/newsite//Doing_business_In_India/ (accessed various dates).
Ernst & Young. Unveiling India’s Pharmaceutical Future, 2005.http://www.ey.com/global/download.nsf/International/Industry_Pharmaceuticals_Unveiling_India_Pharma_Future/$file/NM_Pharma_Report_Unveiling_India_Future.pdf (accessed February 1, 2007).
European Commission (EC). “Bilateral Trade Relations - India.”http://ec.europa.eu/trade/issues/bilateral/countries/India/index_en.htm (accessed March 7, 2007).
_________. EU 2005 Breakdown of Number of Cases Registered. Brussels: EC, 2006.http://ec.europa.eu/taxation_customs/resources/documents/customs/customs_controls/counterfeit_piracy/statistics/counterf_comm_2005_en.pdf (accessed February 5, 2007).
Biblio-5
Fenwick & West LLP. Structuring Venture Capital and Other Investments in India, 2006.
Fillmore, Ken. “Indian Capacity Will Rise to 3 Million a Year by 2010, Says Nikkei.” The JapanAutomotive Digest, December 11, 2006.
_________. “Short of Engineers at Home, Suzuki Will Shift More Design Chores to Maruti.” TheJapan Automotive Digest, January 22, 2007.
Financial Express, The. “EADS to Open Technology Centre in Bangalore.” April 4, 2007.http://www.financialexpress.com/fe_full_story.php?content_id=160135 (accessed May 3, 2007).
Financial Times, The. “FDI in India Expected to Double,” December 28, 2006. http://www.ft.com/(accessed January 18, 2007).
Flextronics International Ltd. “SemIndia Announces Flextronics as a Strategic Partner (April 4).”New Delhi, 2006. http://www.flextronics.com/en/portals/0/press%20releases/20060404SJA.pdf (accessedApril 2, 2007).
Ford Motor Co. “Volvo to Sell Cars in India (July 5).” Dearborn, 2006. http://media.ford.com/newsroom/feature_display.cfm?release=23361.
Fraser, Cameron, Axel Berkotsky, Maya Bhandari, Diane Halley. European Policy Centre “EU-IndiaRelations (including EU-India Journalists’ Conference report, 30–31 May”) EPC issue paper no. 35,June 2005.
Frontline. Volume 19 - Issue 14, July 6–19, 2002.http://www.hinduonnet.com/fline/fl1914/19141020.htm (accessed April 9, 2007).
General Electric Web site. http://www.ge.com/in (accessed December 6, 2006).
Geneva Convention on the Execution of Foreign Arbitral Awards of 1927.
Geneva Protocol on Arbitration Clauses of 1923.
Global Trade Information Service, Inc. (GTIS). World Trade Atlas database.
Government of Goa Web site. http://www.edc-goa.com (accessed January 12, 2007).
Government of India. “Committee Report on Reforming Investment Approval & ImplementationProcedures.” http://dipp.nic.in/implrepo/implrepo2.pdf (accessed March 30, 2007).
_________. Indian Arbitration and Conciliation Act of 1996 (IACA).
_________. “SEZ Rules 2006, Chapter 2, Procedure for Establishment of Special EconomicZone.” www.seznews.com/acts-and-rules/sez-rules-2006/procedure-for-establishment-of-sez.htm.
_________. Labour Bureau. Annual Survey of Industries Scheme.
http://labourbureau.nic.in/asitab%20new%20sep06.htm (accessed October 27, 2006).
Biblio-6
_________. Ministry of Civil Aviation. “Policy on Airport Infrastructure.”http://civilaviation.nic.in/moca/airppol.htm (accessed March 21, 2007).
_________. Ministry of Commerce & Industry. “2006 Year of Record FDI Inflows.”http://pib.nic.in/release/release.asp?relid=23630 (accessed April 17, 2007).
_________. Ministry of Commerce & Industry. Economic Survey 2006–2007.http://indiabudget.nic.in/es2006-07/esmain.htm (accessed April 17, 2007).
_________. Ministry of Commerce & Industry. “Fact Sheet on Foreign Direct Investment from August1991 to December 2006.” http://dipp.gov.in/fdi_statistics/india_fdi_dec_2006.pdf (accessedApril 7, 2007).
_________. Ministry of Commerce & Industry. “SEZs Future Vehicle of Economic Activity, Says KamalNath (November 16).” New Delhi, 2006. http://commerce.nic.in/Nov06_release.htm#h13, (accessedDecember 5, 2006)
_________. Ministry of Commerce & Industry. “Special Economic Zones in India—About.” http://www.sezindia.nic.in/HTMLS/about.htm (accessed April 2, 2007).
_________. Ministry of Commerce & Industry. “Special Economic Zones in India—Facilitiesand Incentives.” http://www.sezindia.nic.in/HTMLS/set-sez.htm (accessed November 16, 2006).
_________. Ministry of Commerce & Industry. “Special Economic Zones in India—Home Page.”http://sezindia.nic.in/ (accessed November 14, 2006).
_________. Ministry of Commerce & Industry. “Special Economic Zones in India—How toApply.” http://www.sezindia.nic.in/howapply_enterprise.asp. (accessed November 28, 2006).
_________. Ministry of Commerce & Industry. Department of Commerce. Annual Report 2005–2006.http://commerce.nic.in/annual2005-06/englishhtml/cover.htm (accessed April 17, 2007).
_________. Ministry of Commerce & Industry. Department of Commerce. CECA Between India andSingapore. http://commerce.nic.in/ (accessed various dates).
_________. Ministry of Commerce & Industry. Department of Industrial Policy and Promotion. Investingin India: Foreign Direct Investment Policy & Procedures, 2006.
_________. Ministry of Commerce & Industry. Department of Industrial Policy and Promotion. http://dipp.nic.in/fdi_statistics/india_fdi_index.htm)
_________. Ministry of Commerce & Industry. Department of Industrial Policy and Promotion.Secretariat for Industrial Assistance. “Destination India.” Issue No. 2, 2004.
_________. Ministry of External Affairs. ITP Division. “Drugs & Pharmaceuticals.”http://www.indiainbusiness.nic.in/industry-infrastructure/industrial-sectors/drug-pharma.htm (accessedApril 16, 2007).
Biblio-7
_________. Ministry of Finance. Income Tax Department Web site.http://incometaxindia.gov.in/ (accessed various dates).
_________. Ministry of Heavy Industries and Public Enterprises. Automotive Mission Plan2006–2016: A Mission for Development of Indian Automotive Industry. http://www.siam.in/Upload/AMP.pdf.
_________. Ministry of Heavy Industries and Public Enterprises. Department of Heavy Industry. AutoPolicy, March 2002. http://www.dhi.nic.in/autopolicy.htm.
_________. Ministry of Human Resource Development. Sourced from Reserve Bank of India. Handbookof Statistics on Indian Economy, September 18, 2006. http://www.rbi.org.in (accessedJanuary 18, 2007).
_________. Ministry of Labor Web site. http://labour.nic.in/act/welcome.html (accessedvarious dates).
_________. Ministry of Law and Justice. “Civil Procedure Code As Amended Enforced as ofToday (July 1).” New Delhi, 2002.http://pib.nic.in/archieve/lreleng/lyr2002/rjul2002/01072002/r010720022.html (accessedApril 9, 2007).
_________. Ministry of Law and Justice. “Landmark Legal Reforms in the Social Sector, (October 7).”New Delhi, 2002. http://pic.nic.in/arcieve/lreleng/1yr2002/roct2002/07102002/r071020021.html(accessed April 9, 2007).
_________. Ministry of Shipping, Road Transport and Highways. Department of Road and Transport andHighways. “Externally Aided Projects.” http://north.nic.in/externalproj.htm (accessedJanuary 12, 2007).
_________. Ministry of Shipping, Road Transport and Highways. Department of Road and Transport andHighways. “Opportunities for Private Sector Participation.” http://morth.nic.in/pub_pvt_participation.htm(accessed January 12, 2007).
_________. Ministry of Shipping, Road Transport and Highways. Department of Road and Transport andHighways. “Status of BOT Projects Awarded.” http://morth.nic.in/BOT_Proj_NHAI.htm (accessedJanuary 12, 2007).
_________. Ministry of Steel, National Steel Policy 2005. http://www.steel.nic.in/nspolicy2005.pdf(accessed June 29, 2007).
_________. Planning Commission. Foreign Investment, India, August 2002.
Grace, Cheri. “The Effect of Changing Intellectual Property on Pharmaceutical Industry Prospects inIndia and China,” June 2004. http://www.dfid.gov.uk/pubs/files/indiachinadomproduce.pdf (accessedMarch 19, 2007).
Biblio-8
Greene, William. The Emergence of India’s Pharmaceutical Industry and Implications for the U.S.Generic Drug Market, USITC Publication 2007-05-A. Washington, DC: USITC, 2007.http://www.usitc.gov/ind_econ_ana/research_work_papers/documents/EC200705A.pdf (accessedMay 7, 2007).
Grocer. “Bharti to Invest $2.5 Billion in Chain,” February 24, 2007. http://dialog.newsedge.com/(accessed April 12, 2007).
GulfNews.com. “Japan to Help India Build $50 Billion Industry Corridor,” April 15, 2007.http://archive.gulfnews.com/articles (accessed April 17, 2007).
Gupta, Ritesh. “India Gears Up For Retail.” Chain Store Age, February 2007.
Gutierrez, Carlos, Secretary of the U.S. Department of Commerce, and David Sampson, DeputySecretary of the U.S. Commerce Department, Remarks at the 5th Summit of the U.S.-India HighTechnology Cooperation Group, Washington, DC, February 22, 2007.
HSBC Web site. http://www.hsbc.com (accessed March 5, 2007).
The Hindu. “New Hunt for the Yellow Metal.” December 15, 2003. http://www.hindu.com/biz/2003/12/15/stories/2003121500241600.htm (accessed May 14, 2007).
Hindu Business Line. “GVK Biosciences to Provide Research Services for Wyeth Pharma,”January 14, 2006. http://www.thehindubusinessline.com/2006/01/14/stories/2006011403320200.htm.
Hindustan Lever Limited Web site. http://www.hll.com (accessed October 5, 2006).
Huber, Hans-Michael. “The Indian Automotive Scenario: Past – Stable, Present – Bright, Future –Promising!” http://www.fadaweb.com/indian_auto_scenario.htm
Human Rights Features, Legal Reform and Investment Prospects in India, HRF/154/06,November 30, 2006.
Iloveindia Web site. http://www.iloveindia.com/finance/bank.html (accessed March 5, 2007).
India Brand Equity Foundation. Auto Components. http://www.ibef.org/industry/autocomponents.aspx.
_________. Pharmaceuticals, July 2006. http://www.ibef.org/download/Pharma_sectoral.pdf (accessedMarch 19, 2007).
India Mart. Taxation - Tax Treaties. 2007. http://www.finance.indiamart.com/taxation/taxtreaties.html(accessed January 12, 2007).
Indian Express. “Work on Delhi-Mumbai Corridor from January,” April 14, 2007.http://dialog.newsedge.com (accessed April 19, 2007).
Indian Insurance Regulatory and Development Authority Web site, http://www.irdaindia.org/hist.htm(accessed April 5, 2007).
Biblio-9
Indo-Asian News Service. “India Woos Foreign Equity in Infrastructure,” February 23, 2007.http://www.hindustantimes.com/news (accessed May 31, 2007).
Industries Commission rate, Government of Gujarst, New Initiatives Special Economic Zones,http//www.icgujarst.gov.in/new-initiatives/SEZ-intro.htm.
Intel. “Intel Outlines $1 Billion Multi-year Investment Plans, Highlights India’s Importance(December 5).” City of release, 2005.http://www.intel.com/pressroom/archive/releases/20051205corp_b.htm (accessed May 8, 2007).
International Bank for Reconstruction and Development (IBRD)/World Bank. Doing Business in SouthAsia 2007. Washington, DC: The World Bank, 2007.
International Center for Alternative Dispute Resolution (ICADR) Web site.http://www.icadr.org/aboutus/about.html (accessed March 23, 2007).
International Chamber of Commerce (ICC). Global Survey on Counterfeiting and Piracy. London: ICC,2007. http://www.iccwbo.org/bascap (accessed February 27, 2007).
International Finance Corporation Web site. http://www.ifc.org (accessed January 11, 2007).
International Intellectual Property Alliance (IIPA). 2003 Special 301 Report: India. Washington, DC:IIPA, 2003. http://www.iipa.com/rbc/2003/2003SPEC301INDIA.pdf (accessed February 5, 2007).
_________. 2007 Special 301 Report: India. Washington, DC: IIPA, 2007. http://www.iipa.com/rbc/2007/2007SPEC301INDIA.pdf (accessed February 14, 2007).
International Monetary Fund (IMF). India: Selected Issues, March 2005.
Islamic Republic News Agency. “India Attractive Destination for PGCC Investments,”February 12, 2007. http://www2.irna.ir/en/ (accessed February 14, 2007).
iTWire. “Google Likely to Set Up $1 Billion Datacenter in India,” August 11, 2006.
Jacob, Jayanth. “India to Advance Zero-Tariff SAFTA Date.” The Indian Express, April 1, 2007.http://www.indianexpress.com/ (accessed April 12, 2007).
Jayakumar, P.B. “Amgen Opens Subsidiary in India,” March 30, 2007. http://www.business-standard.com/general/pintpage.php?autono=279348 (accessed April 10, 2007).
Jha, “UAE, India to Expand Ties.”
Johnson, Jo. “India Lifts Freeze on Enterprise Zones.” Financial Times, April 6, 2007. http://www.ft.com/cms/s/c45ad352-e408-11db-bf06-000b5df10621,-i-rssPage=ff3cbaf6-3024-11da-ba9f-00000e2511c8.html (accessed June 8, 2007).
Just-auto.com editorial team. “Hyundai Has Ambitious Plans,” August 25, 2006. http://www.just-auto.com/article.aspx?id=88826&lk=s.
Biblio-10
Just-auto.com editorial team. “ACMA-McKinsey’s Vision 2015 for the Indian Supplier Industry: HowAchievable Is It?” http://www.just-auto.com/article.aspx?id=86273&lk=s (accessed March 14, 2007).
Kanellos, Michael. “India’s Tech Renaissance—U.S.-Style Labor Pains from Mumbai to Bangalore.” CNET News.com, June 28, 2005. http://news.com.com/Indias+renaissance+U.S.-style+labor+pains(accessed December 6, 2006).
Kantor, Mark. “Arbitration Award May Alter Dabhol Debate.” 1 Transnational Dispute Management 2(May 2004).
Kapur, Devesh. Center for Advanced Study of India. University of Pennsylvania. Remarks at aconference at the Woodrow Wilson International Center for Scholars, Washington, DC,April 13, 2007.
Kaushik, Neha, and Anil Sasi. “Indian Wages Cheaper Than Chinese.” Hindu Business Line,November 15, 2005. http://www.thehindubusinessline.com (accessed November 7, 2006).
Khaleej Times. “DP World’s India Foray Runs Into Murkier Waters,” March 30, 2006.http://www.khaleejtimes.com (accessed May 17, 2007.
_________. “Gulf Arab Investors Target Asia as US Ties Wane,” March 28, 2007. http://www.khaleeitimes.com (accessed May 17, 2007.
_________. “Upbeat India Scales Up FDI Projections by 25 Percent,” March 28, 2007.http://www.MENAFN.com (accessed April 2, 2007).
KPMG. Automotive and Components Market in Asia. KPMG International, 2005.
_________. Manufacturing in India: Opportunities, Challenges, and Myths. KPMG International, 2005. http://www.kpmg.ca/en/industries/cib/industrial/documents/ManufacturingInIndia.pdf.
_________. The Indian Pharmaceutical Industry: Collaboration for Growth. KPMG International, 2006.http://www.kpmg.de/library/pdf/060618_KPMG_IndiaPharma_en.pdf (accessed April 16, 2007).
Kumar, Sushil. “How to Protect Data in Outsourcing Deals.” Supplement - India IP Focus 2007 4th
edition, March 2007. http://www.managingip.com/?Page=16&ISS=23507 (accessed April 16, 2007).
LaReau, Jamie. “GM Want More Engineers in India.” Automotive News, April 30, 2007.
Law Commission of India, On Revision of Court Fees Structure (189th Report), February 2004.
Law Commission of India Web site. http://lawcommissionofindia.nic.in/adr_conf/adr_index.htm(assessed March 23, 2007).
Lopez-Claros, Augosto, Michael E. Porter, Xavier Sala-i-Martin, and Klaus Schwab. The GlobalCompetitiveness Report 2006–2007. New York, NY: Palgrave Macmillan, 2006.
Mahindra World City Web site. http://www.mahindraworldcity.com/chennai/ (accessed June 8, 2007).
Maddox, Jeff. “From Single Brand to Open Season.” FinancialTimes.com, February 20, 2007.http://www.ft.com/ (accessed February 27, 2007).
Biblio-11
Matthew, Joe. “GSK Identifies Asia, Eastern Europe as Major Centres for Clinical Research,”September 25, 2006. http:www.gsk-india.com/News/GSK_news.asp (accessed April 7, 2007).
McKenzie, Michael. “2007 Global Outlook.” PwC Automotive Institute Analyst Note, January 18, 2007.
McKinsey & Co., McKinsey Global Institute. New Horizons: Multinational Company Investment inDeveloping Economies. San Francisco: McKinsey & Co., 2003.
Microsoft Web site. http://www.microsoft.com/India (accessed September 26, 2006).
Motorola Web site. http://www.motorola.com (accessed September 21, 2006).
Mueller, Janice M. “The Tiger Awakens: The Tumultuous Transformation of India's Patent System andthe Rise of Indian Pharmaceutical Innovation.” 68 U. Pitt. L. Rev. (forthcoming 2007),http://ssrn.com/abstract=923538 (accessed March 15, 2007).
Nair, M.S. “India: Mashelkar Committee Withdraws Its Report.” Lex Orbis Intellectual PropertyPractice, March 1, 2007. http://www.mondaq.com/article.asp?articleid=46480&lastestnews=1(accessed March 7, 2007).
National Stock Exchange Web site. http://www.nseindia.com (accessed March 5, 2007).
newKerala.com. “India—The New Hub of the Automotive Industry,” October 6, 2006. http://www.newkerala.com/news4.php?action=fullnews&id=32376.
New York Convention of 1958 on the Recognition and Enforcement of Foreign Arbitral Awards.
Novartis. “Questions and Answers.” http://www.novartis.com/downloads/about-novartis/india-glivec-patent-case-faq.pdf (accessed May 2, 2007).
Nokia. “Nokia Taps Chennai as New Nokia Global Networks Solutions Center Site, (December 16).”Chennai, 2005. http://www.nokia.com/link?cid=Editorial 4326 (accessed September 20, 2006).
OCO Consulting Ltd. LocoMonitor FDI database. http://www.locomonitor.com/ (accessed variousdates).
OECD. Counterfeiting and Piracy: Measurement Issues. Geneva: OECD, 2005.http://www.oecd.org/dataoecd/42/44/35651123.pdf (accessed April 17, 2007).
OECD. Directorate for Financial and Enterprise Affairs, Investment Committee. “Salient Features ofIndia’s Investment Agreements.” DAF/INV/WD(2006)3, March 23, 2006.
Overseas Private Investment Corporation (OPIC). Annual Reports for 2004, 2005, and 2006.Washington, DC: OPIC, 2004, 2005, and 2006.
Patent Office, India. Manual of Patent Practice and Procedure. Mumbai: India Patent Office, 2005.http://www.patentoffice.nic.in/ipr/patent/manual-2052005.pdf (accessed March 3, 2007).
Pharmabiz.com. “Pharmabiz Studies of Top Cos.” April 17, 2006. http://www.pharmabiz.com (accessedMarch 7, 2007).

Biblio-12
Pharmaceutical Research and Manufacturers of America (PhRMA). PhRMA Special 301 Submission:India. Washington, DC: PhRMA, 2007.
PhRMA. PhRMA Survey of Pharmaceutical Counterfeiting Laws and Remedies: China, India, Russia,Brazil and Mexico. Washington, DC: PhRMA, 2006.
Prasad, Ashish S., and Violeta I. Balan. “Strategies for U.S. Companies to Mitigate Legal Risks fromDoing Business in India.” 1587 PLI/Corp 9 (2007).
Press Trust of India. “Delphi to Invest $10 Mn in India, Double Halfshaft Production,” April 12, 2006. http://www.newsedge.com.
_________. “Morgan Stanley, Citigroup, Actis Pick Up 6 pc Stake in NSE,” March 9, 2007.http://dialognewsedge.com (accessed March 12, 2007).
_________. “Orissa to Pursue POSCO Project with ‘Humane’ Face: Naveen,” April 18, 2007.http://dialognewsedge.com (April 19, 2007).
_________. “VP Writes to PM on POSCO Issue: Demands Intervention,” April 18, 2007.http://dialognewsedge.com (April 19, 2007).
PriceWaterhouseCoopers. “Offshoring in the Financial Services Industry: Risks & Rewards.”PriceWaterhouseCoopers Global Financial Services Briefing Programme, September 2005.
Ramachandran, Sudha. “A Grand Plan for Indian Automobiles.” Asia Times Online, February 1, 2007. http://www.atimes.com/atimes/South_Asia/IB01Df01.html.
Ranbaxy Laboratories Ltd. “Ranbaxy Signs New R&D Agreement with GSK,” February, 2007.http://www.ranbaxy.com/newsroom/pressrelease_det.asp?sno=322 (accessed March 19, 2007).
Rathore, Deepesh, and Tilak Swarup. A Review of India’s Automotive Industry. Bromsgrove, UK: AroqLimited, June 2006.
Reuters. “World bank Halts India Health Funds on Fraud Claim.” April 4, 2006.
Roumeliotis, Gregory. “Mylan in India’s Biggest Pharmaceutical Takeover as it Enters the Matrix.” In-Pharma Technologist.com, August 30, 2006.http://www.in-pharmatechnologist.com/news/ng.asp?id=70188-mylan-matrix-novartis-teva-india (accessedApril 7, 2007).
“Royal Indian Raj International Corporation Pens Estimated $4 Billion Deal with Choice Hotels for atLeast 12,000 Budget Hotel Rooms Throughout India, Vancouver, Bristish Columbia and New Delhi,India (April 12).” ________, 2007. http://dialog.newsedge.com (accessed _____, 2007).
Sahoo, Pravakar. “Foreign Direct Investment in South Asia: Policy Trends, Impact and Determinants.”ADB Institute Discussion Paper No. 58, November 2006.
Sampath, P. “Indian Pharma within Global Reach.” In J. Chataway, D. Kale and D. Ried, The IndianPharmaceutical Industry Before and After Trips, Special Issue of the Journal of Technology Analysisand Strategic Management. September 2007. http://www.merit.unu.edu/publications/wppdf/2006/wp2006-031.pdf (accessed February 14, 2007).
Biblio-13
Samsung Electronics Co., Ltd. “Samsung Dedicates a Mobile Phone Plant in India (April 3).” Seoul,2006. http://www.samsung.com/in/products/gsm/news (accessed September 28, 2006).
SemIndia. “Empowering India: The Semiconductor Way.” http://www.semindia.in/ (accessedApril 2, 2007).
Shared Expertise Forums. “Survey: Pharmaceutical Companies Cautious of Investments in EmergingChina and India Markets,” December 2, 2005. http://www.sharedservicesbpo.com/file/2998/survey-pharmaceutical-companies-cautious-of-investments-in-emerging-china-and-india-markets.html (accessed April 12, 2007).
Sikarwar, Deepshikhas. “Mauritius Overhauls DTAA Agreement.” Economic Times, February 27, 2007.http://dialog.newsedge.com (May 2, 2007).
Singh, Harsimran. “Analysts Skeptical of Chip Fab in India.” IndiaTimes.com, February 6, 2007.http://infotech.indiatimes.com/ (accessed March 12, 2007).
Singh, Seema. “It’s Pharmaceutical Giant’s Third Drug Development Alliance in India in Six Months.”Red Herring, January 12, 2007.http://www.redherring.com/Article.aspx?a=20712&hed=Lilly+Signs+India%E2%80%99s+Piramal(accessed April 7, 2007).
Society of Indian Automobile Manufacturers (SIAM). “Auto Policy of Government of India.”http://www.siamindia.com/scripts/PrintView.aspx (accessed January 17, 2007).
Society of Indian Automobile Manufacturers Web site. http://www.siamindia.com (accessed variousdates).
South Asian Association for Regional Cooperation. Agreement on South Asian Free Trade Area.http://www.saarc-sec.org/ (accessed April 2, 2007).
Srinivasan, T.N. “China, India and the World Economy.” Working Paper No. 28. Stanford Center forInternational Development, July 2006. http://scid.stanford.edu/pdf/SCID286.pdf (accessedJune 8, 2007).
Statesman, The (India). “India Attracts $15b FDI During 2006–07,” April 14, 2007.http://dialog.newsedge.com (accessed April 17, 2007).
Swire, Mary. “Singapore and Mauritius Vie To Supply India's FDI.” LawAndTax-News.com,October 25, 2005. http://www.tax-news.com/ (accessed various dates).
Technical Expert Group on Patent Law Issues. “Report of the Technical Expert Group on Patent LawIssues.” December 2006. http://www.patentmatics.org/pub2007/pub2c.pdf (accessed May 2, 2007).
Biblio-14
Thomas, Dorothy. “Singapore, New Tax Haven for Offshore Investors.” The Hindu Times,January 8, 2005. http://www.thehindu.com/ (accessed January 12, 2007).
Thomas, John. Proprietary Rights in Pharmaceutical Innovation: Issues at the Intersection of Patentsand Marketing Exclusivities. CRS Report for Congress RL33288. Washington, DC: CongressionalResearch Service, 2006.
Thomson Scientific, “I.P. Overload?—Thomson Scientific 2007 Patent Focus Report.” Knowledge Link,January 2007. http://scentific.thomson.com/newsletter (accessed March 5, 2007).
Tippu, Sufia. “India’s Coming Bandwidth Boom.” BusinessWeek.com, February 7, 2007.http://www.businessweek.com/ (accessed March 9, 2007).
UNCTAD. “Foreign Direct Investment Rose by 34% in 2006 (January 9).” Geneva, 2007.http://www.unctad.org/templates/webflyer.asp?docid=7993&intItemID=1634&lang=1, (accessedJune 11, 2007).
UNCTAD. “UNCTAD Proposes Ways to Limit Excessive Incentives Competition to Attract ForeignDirect Investment, (March 28).” Geneva, 1996.http://www.unctad.org/Templates/webflyer.asp?docid=3391&intItemID=2298&lang=1, (accessedFebruary 15, 2007).
UNCTAD, World Investment Report 2006. (United Nations, Geneva and New York, 2006).
United Nations Web site.http://untreaty.un.org/ENGLISH/bible/englishinternetbible/partI/chapterXXII/treaty1.asp (accessedMarch 23, 2007).
United Nations. Economic and Social Council. Commission on Human Rights. Civil and Political Rights.Including the Questions of the Judiciary, Administration of Justice, Impunity. Written StatementSubmitted by the Asian Legal Resource Centre (ALRC), E/CN.4/2005/NGO/107, February 15, 2007.
U.S. Customs and Border Protection (USCBP). FY 2005 Top IPR Commodities Seized. Los Angeles:USCBP, 2005.http://www.cbp.gov/linkhandler/cgov/import/commercial_enforcement/ipr/seizure/trading/fy05_midyear_stats.ctt/fy05_ipr_midyear.pdf (accessed February 5, 2007).
_________. FY 2006 Top IPR Commodities Seized. Los Angeles: USCBP, 2006.http://www.cbp.gov/linkhandler/cgov/import/commercial_enforcement/ipr/seizure/trading/fy06_midyear_stats.ctt/fy06_ipr_midyear.pdf (accessed February 5, 2007).
U.S. Department of Commerce (USDOC). The Agreement on Trade Related Investment Measures. http://commerce.nic.in/wtotrims.htm (accessed March 23, 2007).
_________. Bureau of Economic Analysis (BEA). International Economic Accounts. “Operations ofMultinational Companies.” http://www.bea.gov/international/index.htm#omc (accessed varous dates).
Biblio-15
_________. U.S. Commercial Service. India: Architecture/Construction/Engineering Services,June 2006.
_________. U.S. Commercial Service. India Country Commercial Guide. Washington, DC: U.S.Department of Commerce, 2006. http://www.buyusa.gov/india/en/88.html (accessed March 15, 2007).
_________. U.S. Commercial Service. Doing Business in India: A Country Commercial Guide for U.S.Companies 2006.
_________. U.S. Commercial Service. India: Electric Power Equipment, August 2006.
U.S. Department of Labor. A Chartbook of International Labor Comparisons: The Americas, Asia- Pacific, Europe, January 2007.
U.S. Department of State. “Congress Passes U.S.-India Civilian Nuclear Cooperation Bill (December 9).”Washington, DC, 2006. http://usinfo.state.gov/ (accessed April 5, 2007).
_________. “President Bush Signs U.S.-India Civil Nuclear Agreement (December 18).”Washington, DC, 2006. http://usinto.state.gov/ (accessed April 5, 2007).
U.S. India 2006 CEO Forum. “U.S. India Strategic Economic Partnership,” March 2006.http://planningcommission.nic.in/reports/genrep/USIndia.pdf (accessed on January 18, 2007)
U.S. India Business Council. Recommendations of the Breakout Session on Biotechnology/LifeSciences/Medical Devices Breakout Session, February 2007.http://www.usibc.com/documents/Feb%20Life%20Sciences.pdf (accessed March 25, 2007).
U.S. National Institutes of Health. “ClinicalTrials.gov.” http://www.clinicaltrials.gov (accessedMay 1, 2007).
U.S. Patent and Trademark Office (USTPO). “U.S. and India Sign Historic Memorandum ofUnderstanding on Bilateral Cooperation on Intellectual Property (December 20).” Washington, DC,2006. http://www.uspto.gov/web/offices/com/speeches/06-72.htm (accessed February 14, 2007).
United States Trade Representative (USTR). 2006 Special 301 Report. Washington, DC: USTR, 2006.http://www.ustr.gov (accessed February 2, 2007).
_________. “Brazil.” 2006 National Trade Estimate Report on Foreign Trade Barriers. Washington,DC: USTR, 2006. http://www.ustr.gov/Document_Library/Reports_Publications/2006/2006_NTE_Report/Section_Index.html?ht=(accessed March 7, 2007).
_________. “India.” 2007 National Trade Estimate Report. Washington, DC: USTR, 2007.http://www.ustr.gov/assets/Document_Library/Reports_Publications/2007/2007_NTE_Report/asset_upload_file452_10951.pdf (accessed April 17, 2007).
_________. 2007 Special 301 Report, 26.
Biblio-16
Van den Bossche, Peter. The Law and Policy of the World Trade Organization: Text, Cases andMaterials. United Kingdom: Cambridge University Press, 2006.
Venkatesan, V. “Trial and Execution.” Frontline. Volume 19-Issue 14, July 6–19, 2002.http://www.hinduonnet.com/fline/fl1914/19141020.htm (accessed April 9, 2007).
VoIP Now. “VoIP in India,” October 12, 2005. http://www.voipnow.org/ (accessed April 9, 2007).
Wakhlu, Bharat. Tata, Inc. Remarks at a conference at the Woodrow Wilson International Center forScholars, Washington, DC, April 13, 2007.
Ward’s Automotive Group. World Motor Vehicle Data 2006. Southfield, MI: Ward’s Automotive Group,2006.
Ward’s Automotive Reports. “Chevy’s Spark Key to GM’s Growth in India,” April 30, 2007.
Wells, Dr. Peter and Shanivi Sadana. “Hub or Hubris? India and the Automotive Mission Plan2006–2016.” World Commercial Vehicles, November 2006.
Wells, Dr. Peter. “Hub or Hubris? Prospects for the AMP to 2016.” Automotive WorldDecember 21, 2006. http://www.automotiveworld.com/wcv/print.asp?contentid=57070 (accessedJanuary 17, 2007).
World Bank Web site. http://www.worldbank.org (accessed October 30, 2006 andJanuary 18, 2007).
World Bank. “Doing Business Report 2007.” http://www.worldbank.org (accessed October 30, 2006).
__________. “Do the Benefits of Special Economic Zones Outweigh Their Costs?” Archives discussionmoderated by James Crittle and Gokhan Akinci, July 2004.http://rru.worldbank.org/Discussions/Topics/Topic40.aspx (accessed November 14, 2006).
__________. “Enterprise Surveys, India 2006.” http://www.enterprisesurveys.org/ExploreEconomies/Default.aspx?economyid=89&year=2006, (accessedFebruary 20,2007).
__________. “Enterprise Surveys, What Businesses Say.”http://www.enterprisesurveys.org/exploreeconomies (accessed January 4, 2007).
__________. “India, Inclusive Growth and Service Delivery: Building on India’s Success.” Report No.34580-IN, May 29, 2006.
__________. “India Transport Sector.”http://web.worldbank.org/WBSITE/EXTERNAL/COUNTRIES/SOUTHASIAEXT/EXTSARREGTOPTRANSPORT/0,,contentMDK:20703625~menuPK:868822~pagePK:34004173~piPK:34003707~theSitePK:579598,00.html (accessed various dates).
__________. Sustaining India’s Services Revolution, 2004. http://web.worldbank.org/ (accessedMarch 9, 2007).
Biblio-17
__________. The Investment Climate in Brazil, India, and South Africa: A Contribution to the IBSADebate, September 2006.
__________. World Development Indicators database.http://ddp-ext.worldbank.org/ext/DDPQQ/report.do?method=showReport (accessed various dates).
World Bank/International Finance Corporation (IFC). India: Investment Climate and ManufacturingIndustry, November 2004.
WTO. “India—Patent Protection for Pharmaceutical and Agricultural Chemical Products.”WT/DSSO/AB/R, January 16, 1998.
__________. “Indonesia—Certain Measures Affecting the Automobile Industry.” Report of the Panel,WT/DS54/R, WT/DS55/R; WT/DS59/R; WT/DS56/R, July 2, 1998 (98-2505)
__________. “Understanding the WTO, Services: Rules for Growth and Investment.”http://www.wto.org/english/thewto_e/whatis_e/tif_e/agrm6_e.htm (accessed various dates).

APPENDIX ASector-specific Guidelines for FDI in India

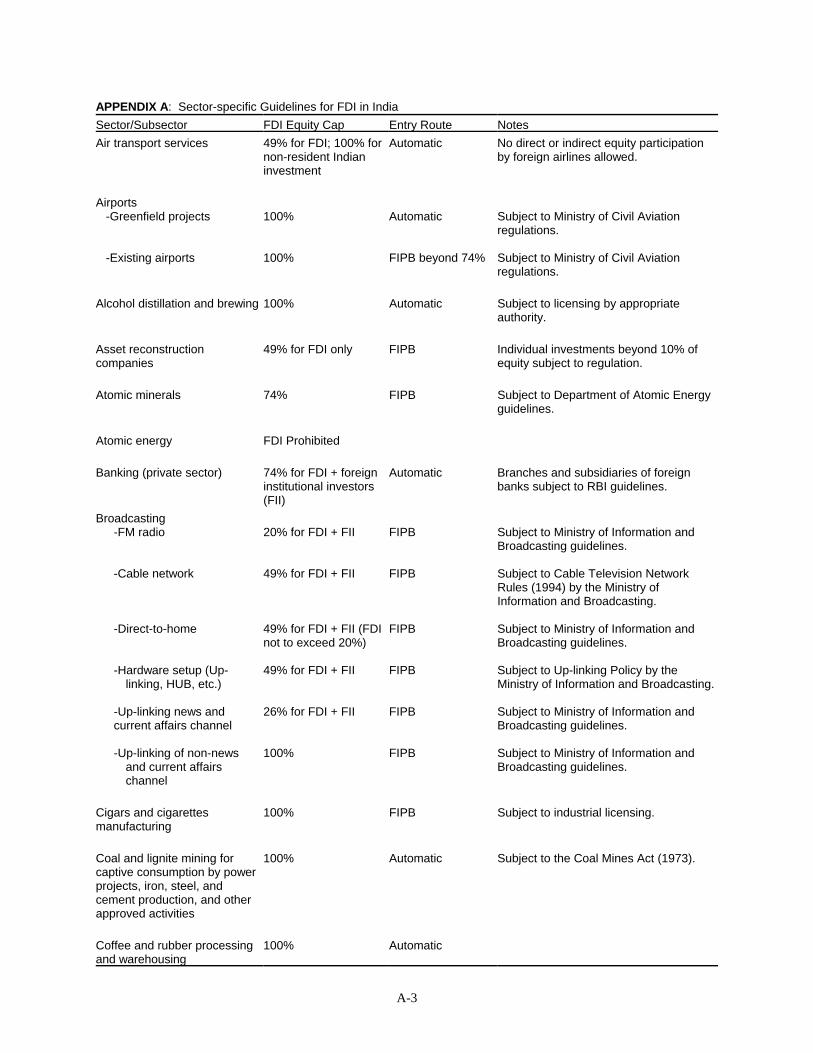
A-3
APPENDIX A: Sector-specific Guidelines for FDI in IndiaSector/Subsector FDI Equity Cap Entry Route NotesAir transport services 49% for FDI; 100% for
non-resident Indianinvestment
Automatic No direct or indirect equity participationby foreign airlines allowed.
Airports -Greenfield projects
-Existing airports
100%
100%
Automatic
FIPB beyond 74%
Subject to Ministry of Civil Aviationregulations.
Subject to Ministry of Civil Aviationregulations.
Alcohol distillation and brewing 100% Automatic Subject to licensing by appropriateauthority.
Asset reconstructioncompanies
49% for FDI only FIPB Individual investments beyond 10% ofequity subject to regulation.
Atomic minerals 74% FIPB Subject to Department of Atomic Energyguidelines.
Atomic energy FDI Prohibited
Banking (private sector) 74% for FDI + foreigninstitutional investors(FII)
Automatic Branches and subsidiaries of foreignbanks subject to RBI guidelines.
Broadcasting-FM radio
-Cable network
-Direct-to-home
-Hardware setup (Up-linking, HUB, etc.)
-Up-linking news and current affairs channel
-Up-linking of non-news and current affairs channel
20% for FDI + FII
49% for FDI + FII
49% for FDI + FII (FDInot to exceed 20%)
49% for FDI + FII
26% for FDI + FII
100%
FIPB
FIPB
FIPB
FIPB
FIPB
FIPB
Subject to Ministry of Information andBroadcasting guidelines.
Subject to Cable Television NetworkRules (1994) by the Ministry ofInformation and Broadcasting.
Subject to Ministry of Information andBroadcasting guidelines.
Subject to Up-linking Policy by theMinistry of Information and Broadcasting.
Subject to Ministry of Information andBroadcasting guidelines.
Subject to Ministry of Information andBroadcasting guidelines.
Cigars and cigarettesmanufacturing
100% FIPB Subject to industrial licensing.
Coal and lignite mining forcaptive consumption by powerprojects, iron, steel, andcement production, and otherapproved activities
100% Automatic Subject to the Coal Mines Act (1973).
Coffee and rubber processingand warehousing
100% Automatic
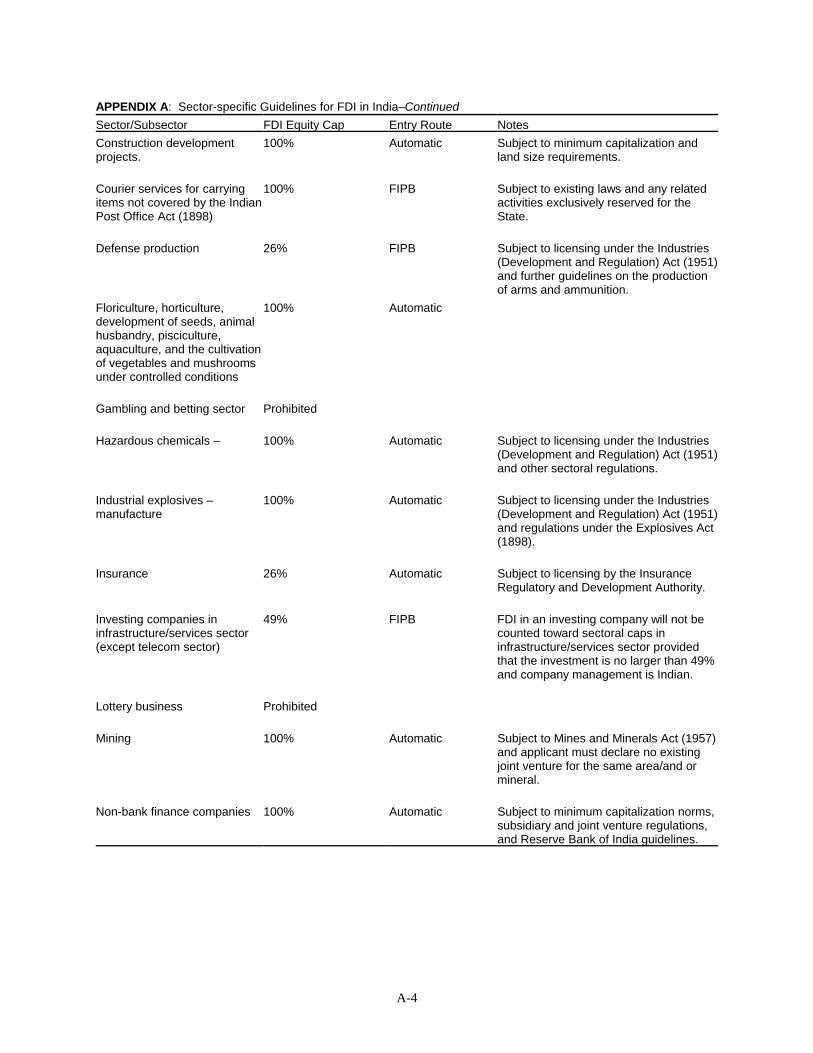
A-4
APPENDIX A: Sector-specific Guidelines for FDI in India–ContinuedSector/Subsector FDI Equity Cap Entry Route NotesConstruction developmentprojects.
100% Automatic Subject to minimum capitalization andland size requirements.
Courier services for carrying items not covered by the IndianPost Office Act (1898)
100% FIPB Subject to existing laws and any relatedactivities exclusively reserved for theState.
Defense production 26% FIPB Subject to licensing under the Industries(Development and Regulation) Act (1951)and further guidelines on the productionof arms and ammunition.
Floriculture, horticulture,development of seeds, animalhusbandry, pisciculture,aquaculture, and the cultivationof vegetables and mushroomsunder controlled conditions
100% Automatic
Gambling and betting sector Prohibited
Hazardous chemicals – 100% Automatic Subject to licensing under the Industries(Development and Regulation) Act (1951)and other sectoral regulations.
Industrial explosives –manufacture
100% Automatic Subject to licensing under the Industries(Development and Regulation) Act (1951)and regulations under the Explosives Act(1898).
Insurance 26% Automatic Subject to licensing by the InsuranceRegulatory and Development Authority.
Investing companies ininfrastructure/services sector(except telecom sector)
49% FIPB FDI in an investing company will not becounted toward sectoral caps ininfrastructure/services sector providedthat the investment is no larger than 49%and company management is Indian.
Lottery business Prohibited
Mining 100% Automatic Subject to Mines and Minerals Act (1957)and applicant must declare no existingjoint venture for the same area/and ormineral.
Non-bank finance companies 100% Automatic Subject to minimum capitalization norms,subsidiary and joint venture regulations,and Reserve Bank of India guidelines.
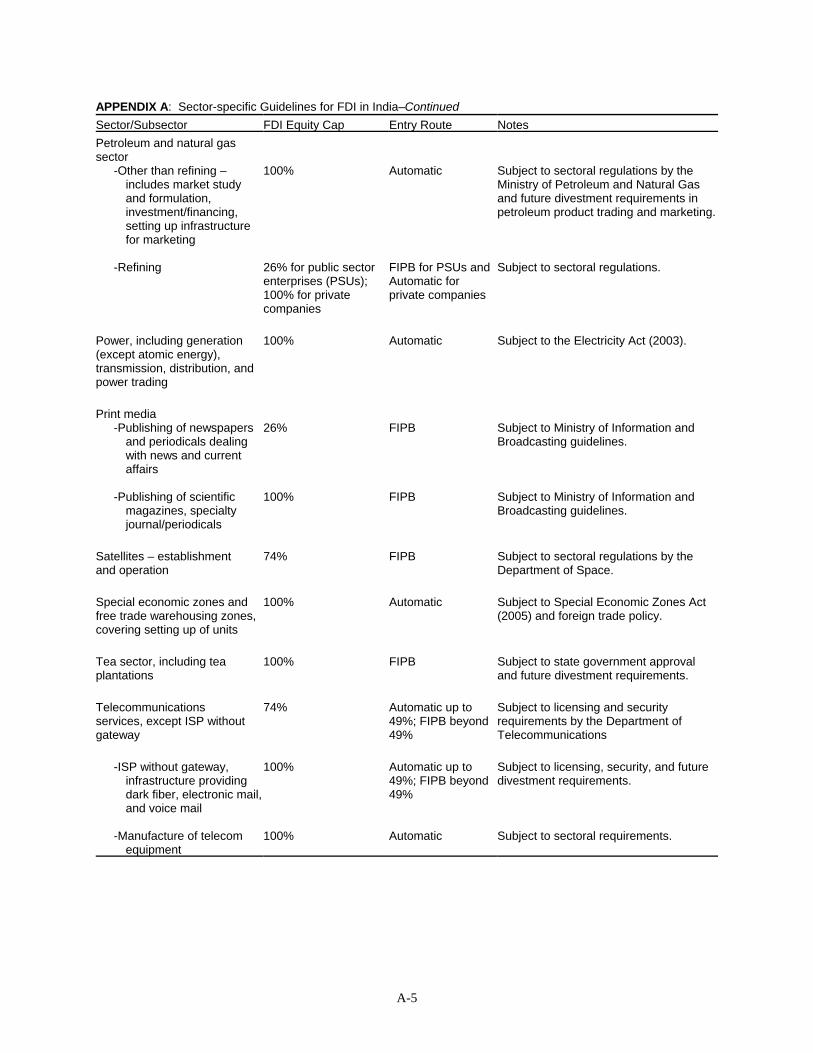
APPENDIX A: Sector-specific Guidelines for FDI in India–ContinuedSector/Subsector FDI Equity Cap Entry Route Notes
A-5
Petroleum and natural gassector
-Other than refining – includes market study and formulation, investment/financing, setting up infrastructure for marketing
-Refining
100%
26% for public sectorenterprises (PSUs);100% for privatecompanies
Automatic
FIPB for PSUs andAutomatic forprivate companies
Subject to sectoral regulations by theMinistry of Petroleum and Natural Gasand future divestment requirements inpetroleum product trading and marketing.
Subject to sectoral regulations.
Power, including generation(except atomic energy),transmission, distribution, andpower trading
100% Automatic Subject to the Electricity Act (2003).
Print media-Publishing of newspapers
and periodicals dealing with news and current affairs
-Publishing of scientific magazines, specialty journal/periodicals
26%
100%
FIPB
FIPB
Subject to Ministry of Information andBroadcasting guidelines.
Subject to Ministry of Information andBroadcasting guidelines.
Satellites – establishment and operation
74% FIPB Subject to sectoral regulations by theDepartment of Space.
Special economic zones andfree trade warehousing zones,covering setting up of units
100% Automatic Subject to Special Economic Zones Act(2005) and foreign trade policy.
Tea sector, including teaplantations
100% FIPB Subject to state government approvaland future divestment requirements.
Telecommunications services, except ISP withoutgateway
74% Automatic up to49%; FIPB beyond49%
Subject to licensing and securityrequirements by the Department ofTelecommunications
-ISP without gateway, infrastructure providing dark fiber, electronic mail,and voice mail
-Manufacture of telecom equipment
100%
100%
Automatic up to49%; FIPB beyond49%
Automatic
Subject to licensing, security, and futuredivestment requirements.
Subject to sectoral requirements.
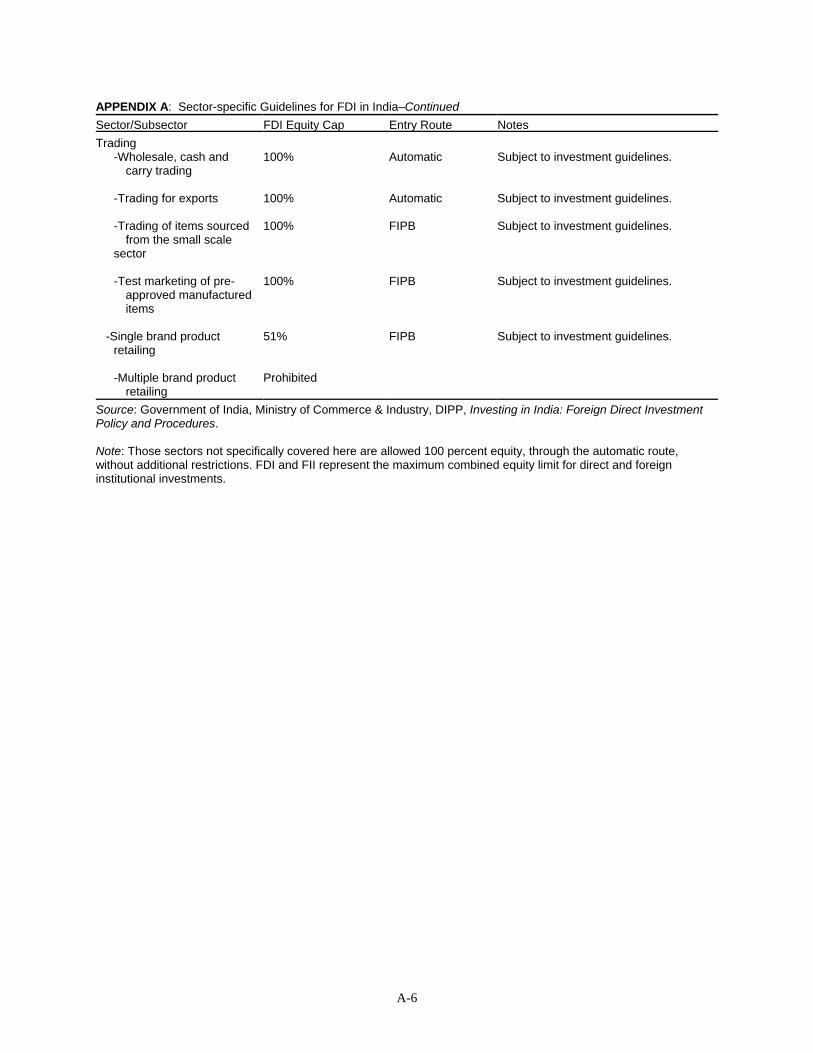
APPENDIX A: Sector-specific Guidelines for FDI in India–ContinuedSector/Subsector FDI Equity Cap Entry Route Notes
A-6
Trading-Wholesale, cash and
carry trading
-Trading for exports
-Trading of items sourced from the small scale
sector
-Test marketing of pre-approved manufactured items
-Single brand product retailing
-Multiple brand product retailing
100%
100%
100%
100%
51%
Prohibited
Automatic
Automatic
FIPB
FIPB
FIPB
Subject to investment guidelines.
Subject to investment guidelines.
Subject to investment guidelines.
Subject to investment guidelines.
Subject to investment guidelines.
Source: Government of India, Ministry of Commerce & Industry, DIPP, Investing in India: Foreign Direct InvestmentPolicy and Procedures.
Note: Those sectors not specifically covered here are allowed 100 percent equity, through the automatic route,without additional restrictions. FDI and FII represent the maximum combined equity limit for direct and foreigninstitutional investments.
APPENDIX BWeb site Addresses of State and UnionTerritory (UT) Governments and theirInvestment Promotion Agencies in India

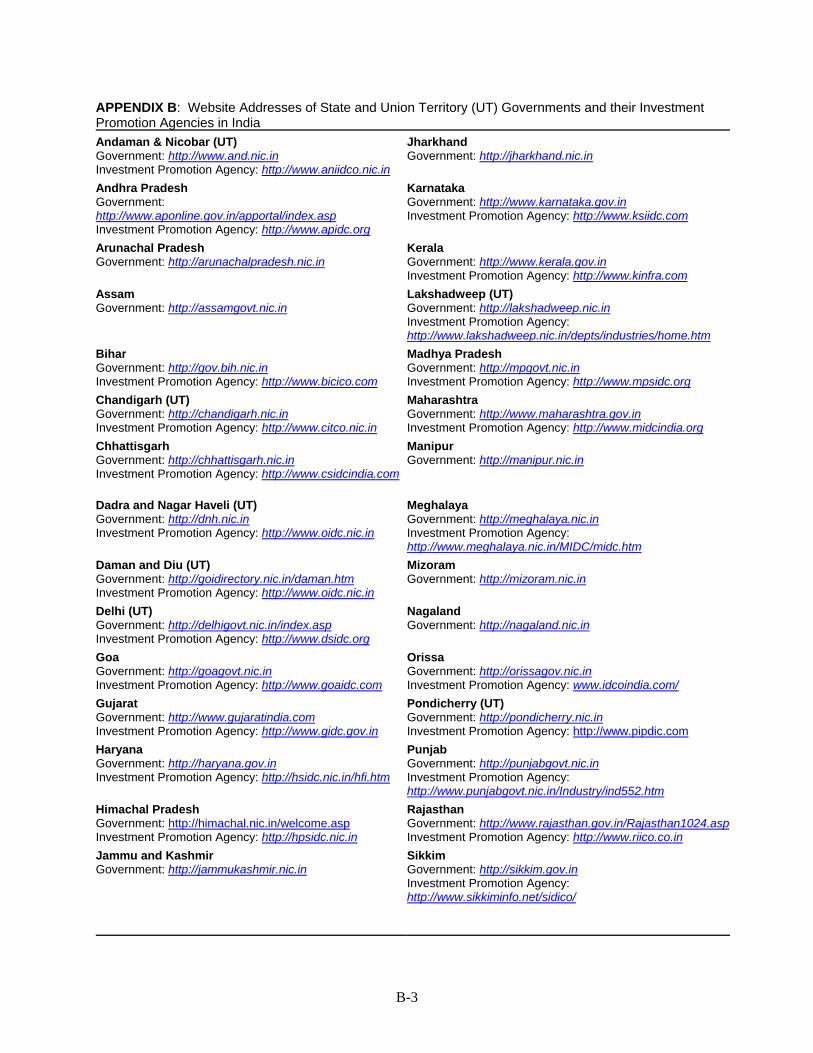
B-3
APPENDIX B: Website Addresses of State and Union Territory (UT) Governments and their InvestmentPromotion Agencies in IndiaAndaman & Nicobar (UT) Government: http://www.and.nic.inInvestment Promotion Agency: http://www.aniidco.nic.in
JharkhandGovernment: http://jharkhand.nic.in
Andhra PradeshGovernment:http://www.aponline.gov.in/apportal/index.aspInvestment Promotion Agency: http://www.apidc.org
KarnatakaGovernment: http://www.karnataka.gov.inInvestment Promotion Agency: http://www.ksiidc.com
Arunachal PradeshGovernment: http://arunachalpradesh.nic.in
KeralaGovernment: http://www.kerala.gov.inInvestment Promotion Agency: http://www.kinfra.com
Assam Government: http://assamgovt.nic.in
Lakshadweep (UT)Government: http://lakshadweep.nic.inInvestment Promotion Agency:http://www.lakshadweep.nic.in/depts/industries/home.htm
BiharGovernment: http://gov.bih.nic.inInvestment Promotion Agency: http://www.bicico.com
Madhya PradeshGovernment: http://mpgovt.nic.inInvestment Promotion Agency: http://www.mpsidc.org
Chandigarh (UT)Government: http://chandigarh.nic.inInvestment Promotion Agency: http://www.citco.nic.in
MaharashtraGovernment: http://www.maharashtra.gov.inInvestment Promotion Agency: http://www.midcindia.org
ChhattisgarhGovernment: http://chhattisgarh.nic.inInvestment Promotion Agency: http://www.csidcindia.com
ManipurGovernment: http://manipur.nic.in
Dadra and Nagar Haveli (UT)Government: http://dnh.nic.inInvestment Promotion Agency: http://www.oidc.nic.in
MeghalayaGovernment: http://meghalaya.nic.inInvestment Promotion Agency:http://www.meghalaya.nic.in/MIDC/midc.htm
Daman and Diu (UT)Government: http://goidirectory.nic.in/daman.htmInvestment Promotion Agency: http://www.oidc.nic.in
MizoramGovernment: http://mizoram.nic.in
Delhi (UT)Government: http://delhigovt.nic.in/index.aspInvestment Promotion Agency: http://www.dsidc.org
NagalandGovernment: http://nagaland.nic.in
GoaGovernment: http://goagovt.nic.inInvestment Promotion Agency: http://www.goaidc.com
OrissaGovernment: http://orissagov.nic.inInvestment Promotion Agency: www.idcoindia.com/
GujaratGovernment: http://www.gujaratindia.comInvestment Promotion Agency: http://www.gidc.gov.in
Pondicherry (UT)Government: http://pondicherry.nic.inInvestment Promotion Agency: http://www.pipdic.com
HaryanaGovernment: http://haryana.gov.inInvestment Promotion Agency: http://hsidc.nic.in/hfi.htm
PunjabGovernment: http://punjabgovt.nic.inInvestment Promotion Agency:http://www.punjabgovt.nic.in/Industry/ind552.htm
Himachal PradeshGovernment: http://himachal.nic.in/welcome.asp Investment Promotion Agency: http://hpsidc.nic.in
RajasthanGovernment: http://www.rajasthan.gov.in/Rajasthan1024.aspInvestment Promotion Agency: http://www.riico.co.in
Jammu and KashmirGovernment: http://jammukashmir.nic.in
SikkimGovernment: http://sikkim.gov.inInvestment Promotion Agency:http://www.sikkiminfo.net/sidico/
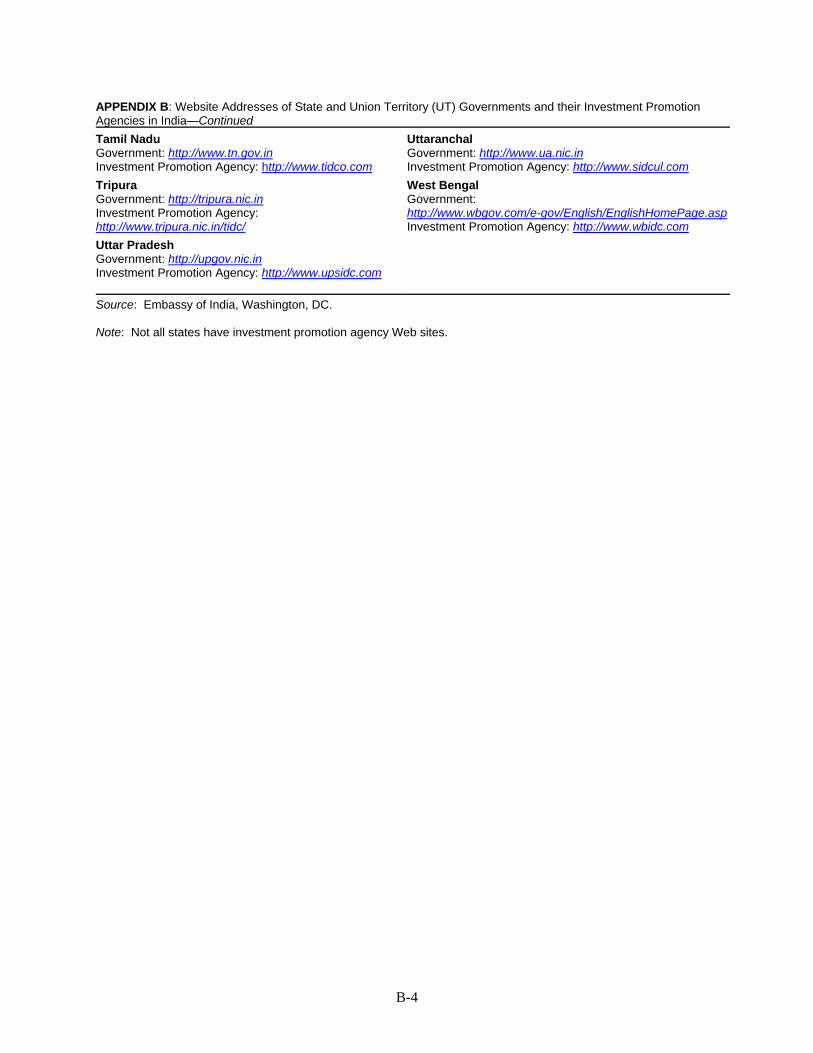
B-4
APPENDIX B: Website Addresses of State and Union Territory (UT) Governments and their Investment PromotionAgencies in India—ContinuedTamil NaduGovernment: http://www.tn.gov.inInvestment Promotion Agency: http://www.tidco.com
UttaranchalGovernment: http://www.ua.nic.inInvestment Promotion Agency: http://www.sidcul.com
TripuraGovernment: http://tripura.nic.inInvestment Promotion Agency:http://www.tripura.nic.in/tidc/
West BengalGovernment:http://www.wbgov.com/e-gov/English/EnglishHomePage.aspInvestment Promotion Agency: http://www.wbidc.com
Uttar PradeshGovernment: http://upgov.nic.inInvestment Promotion Agency: http://www.upsidc.com
Source: Embassy of India, Washington, DC.
Note: Not all states have investment promotion agency Web sites.
APPENDIX CBilateral International Agreements ThatAffect Investment in India

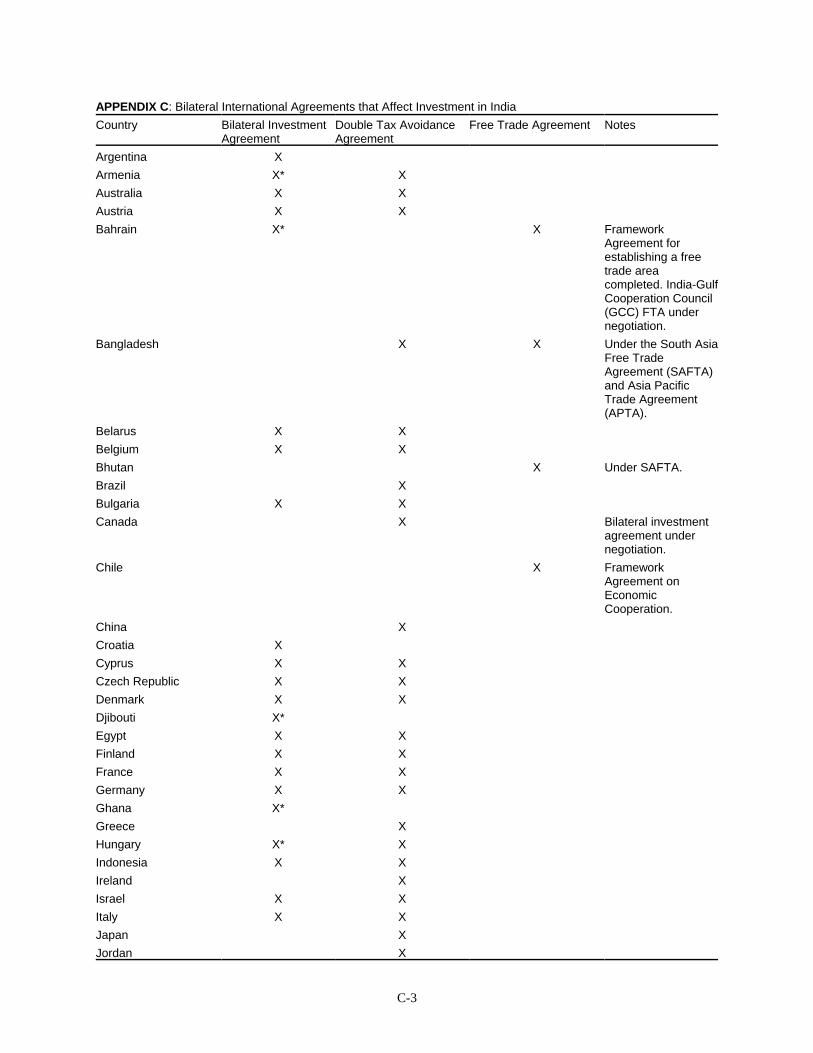
C-3
APPENDIX C: Bilateral International Agreements that Affect Investment in IndiaCountry Bilateral Investment
AgreementDouble Tax AvoidanceAgreement
Free Trade Agreement Notes
Argentina XArmenia X* XAustralia X XAustria X XBahrain X* X Framework
Agreement forestablishing a freetrade areacompleted. India-GulfCooperation Council(GCC) FTA undernegotiation.
Bangladesh X X Under the South AsiaFree TradeAgreement (SAFTA)and Asia PacificTrade Agreement(APTA).
Belarus X XBelgium X XBhutan X Under SAFTA.Brazil XBulgaria X XCanada X Bilateral investment
agreement undernegotiation.
Chile X FrameworkAgreement onEconomicCooperation.
China XCroatia XCyprus X XCzech Republic X XDenmark X XDjibouti X*Egypt X XFinland X XFrance X XGermany X XGhana X*Greece XHungary X* XIndonesia X XIreland XIsrael X XItaly X XJapan XJordan X
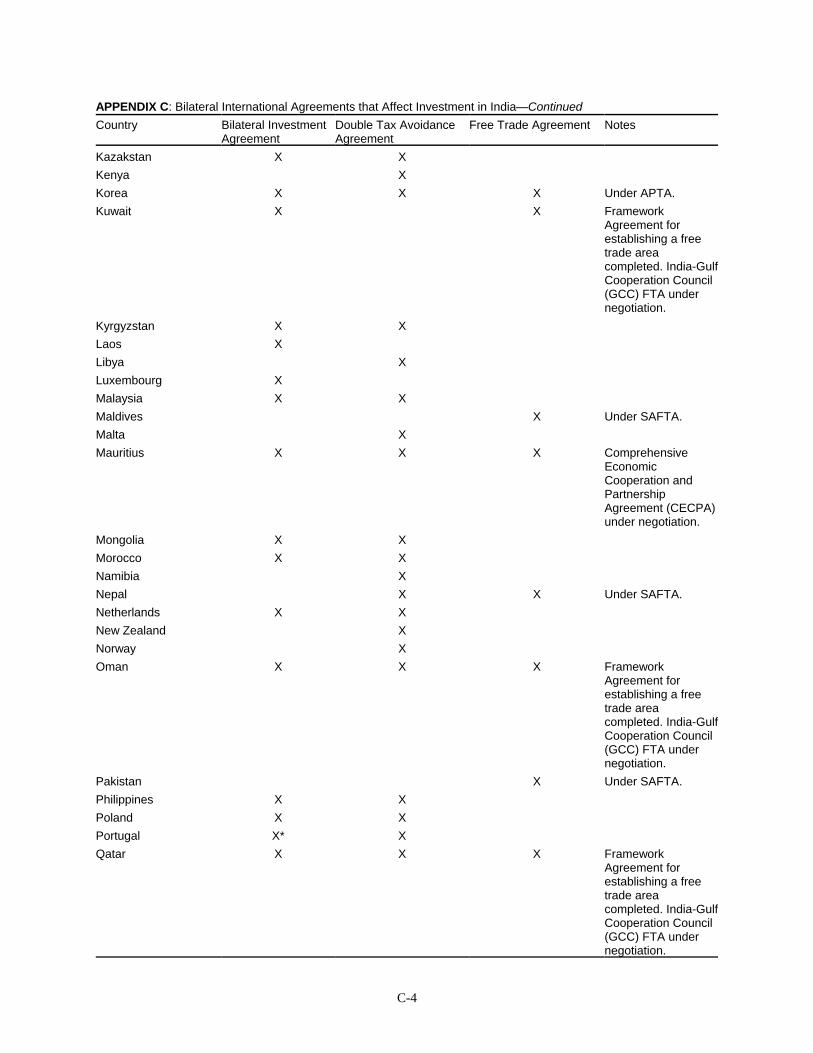
C-4
APPENDIX C: Bilateral International Agreements that Affect Investment in India—ContinuedCountry Bilateral Investment
AgreementDouble Tax AvoidanceAgreement
Free Trade Agreement Notes
Kazakstan X XKenya XKorea X X X Under APTA.Kuwait X X Framework
Agreement forestablishing a freetrade areacompleted. India-GulfCooperation Council(GCC) FTA undernegotiation.
Kyrgyzstan X XLaos XLibya XLuxembourg XMalaysia X XMaldives X Under SAFTA.Malta XMauritius X X X Comprehensive
EconomicCooperation andPartnershipAgreement (CECPA)under negotiation.
Mongolia X XMorocco X XNamibia XNepal X X Under SAFTA.Netherlands X XNew Zealand XNorway XOman X X X Framework
Agreement forestablishing a freetrade areacompleted. India-GulfCooperation Council(GCC) FTA undernegotiation.
Pakistan X Under SAFTA.Philippines X XPoland X XPortugal X* XQatar X X X Framework
Agreement forestablishing a freetrade areacompleted. India-GulfCooperation Council(GCC) FTA undernegotiation.
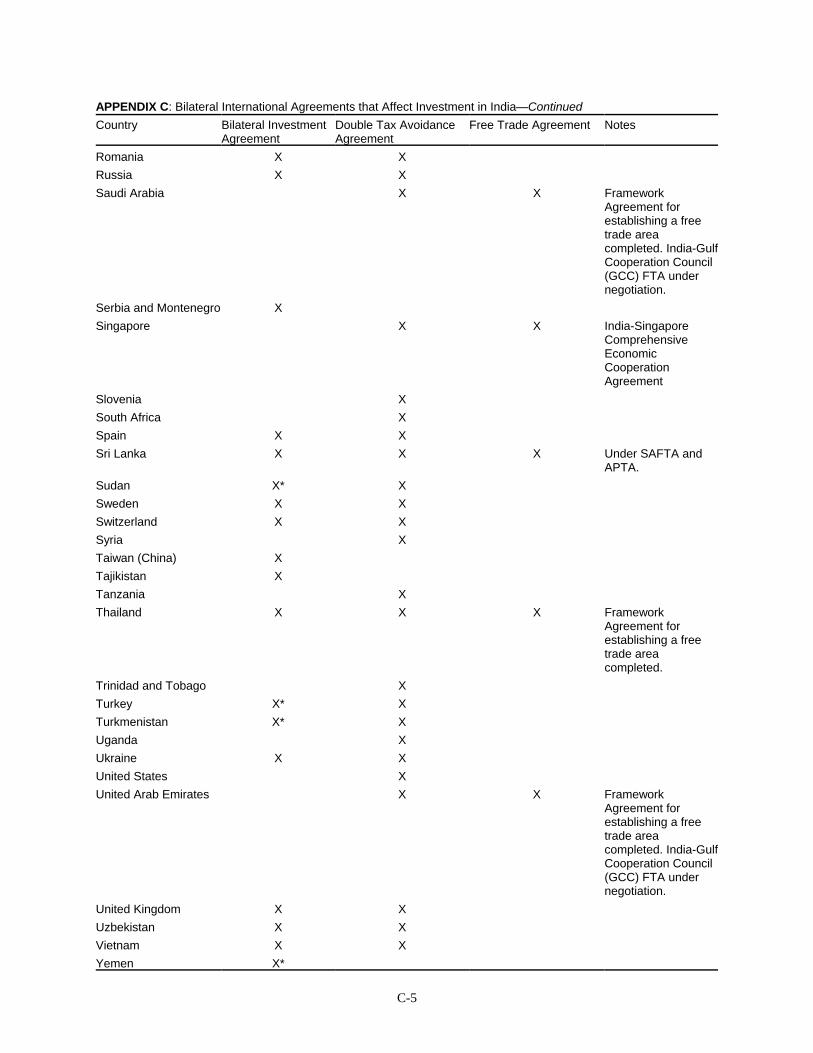
APPENDIX C: Bilateral International Agreements that Affect Investment in India—ContinuedCountry Bilateral Investment
AgreementDouble Tax AvoidanceAgreement
Free Trade Agreement Notes
C-5
Romania X XRussia X XSaudi Arabia X X Framework
Agreement forestablishing a freetrade areacompleted. India-GulfCooperation Council(GCC) FTA undernegotiation.
Serbia and Montenegro XSingapore X X India-Singapore
ComprehensiveEconomicCooperationAgreement
Slovenia XSouth Africa XSpain X XSri Lanka X X X Under SAFTA and
APTA.Sudan X* XSweden X XSwitzerland X XSyria XTaiwan (China) XTajikistan XTanzania XThailand X X X Framework
Agreement forestablishing a freetrade areacompleted.
Trinidad and Tobago XTurkey X* XTurkmenistan X* XUganda XUkraine X XUnited States XUnited Arab Emirates X X Framework
Agreement forestablishing a freetrade areacompleted. India-GulfCooperation Council(GCC) FTA undernegotiation.
United Kingdom X XUzbekistan X XVietnam X XYemen X*

APPENDIX C: Bilateral International Agreements that Affect Investment in India—ContinuedCountry Bilateral Investment
AgreementDouble Tax AvoidanceAgreement
Free Trade Agreement Notes
C-6
Zambia XZimbabwe X*Sources: Government of India, Ministry of Finance, Economic Survey 2006–2007; Government of India, Income TaxDepartment; and OECD, Directorate fore Financial and Enterprise Affairs, Investment Committee, “Salient Featuresof India’s Investment Agreements.”
Notes: (*) As of June 2006, agreement has not entered into force.
India is also in framework/free trade agreement negotiations with ASEAN (Association of South East Asian Nations),BIMSTEC (Bangladesh, Bhutan, Myanmar, Nepal, Sri Lanka, and Thailand), MERCOSUR (Argentina, Brazil,Paraguay, and Uruguay), and SAARC/SAPTA (Bangladesh, Bhutan, Maldives, Nepal, Pakistan, and Sri Lanka).
Related Documents